the Creative Commons Attribution 4.0 License.
the Creative Commons Attribution 4.0 License.
 | 20 Mar 2025
Population exposure to outdoor NO2, black carbon, and ultrafine and fine particles over Paris with multi-scale modelling down to the street scale
Soo-Jin Park
Lya Lugon
Oscar Jacquot
Youngseob Kim
Alexia Baudic
Barbara D'Anna
Ludovico Di Antonio
Claudia Di Biagio
Fabrice Dugay
Olivier Favez
Véronique Ghersi
Aline Gratien
Julien Kammer
Jean-Eudes Petit
Olivier Sanchez
Myrto Valari
Jérémy Vigneron
This study focuses on mapping the concentrations of pollutants of interest to health (NO2, black carbon (BC), PM2.5, and particle number concentration (PNC)) down to the street scale to represent the population exposure to outdoor concentrations at residences. Simulations are performed over the area of Greater Paris with the WRF-CHIMERE/MUNICH/SSH-aerosol chain, using either the top-down inventory EMEP or the bottom-up inventory Airparif, with correction of the traffic flow. The concentrations of the pollutants are higher in streets than in the regional-scale urban background, due to the strong influence of road traffic emissions locally. Model-to-observation comparisons were performed at urban background and traffic stations and evaluated using two performance criteria from the literature. For BC, harmonized equivalent BC (eBC) concentrations were estimated from concomitant measurements of eBC and elemental carbon. Using the bottom-up inventory with corrected road traffic flow, the strictest criteria are met for NO2, eBC, PM2.5, and PNC. Using the EMEP top-down inventory, the strictest criteria are also met for NO2, eBC, and PM2.5, but errors tend to be larger than with the bottom-up inventory for NO2, eBC, and PNC. Using the top-down inventory, the concentrations tend to be lower along the streets than those simulated using the bottom-up inventory, especially for NO2 concentrations, resulting in fewer urban heterogeneities. The impact of the size distribution of non-exhaust emissions was analysed at both regional and local scales, and it is higher in heavy-traffic streets. To assess exposure, a French database detailing the number of inhabitants in each building was used. The population-weighted concentration (PWC) was calculated by weighting populations by the outdoor concentrations to which they are exposed at the precise location of their home. An exposure scaling factor (ESF) was determined for each pollutant to estimate the ratio needed to correct urban background concentrations in order to assess exposure. The average ESF in Paris and the Paris ring road is higher than 1 for NO2, eBC, PM2.5, and PNC because the concentrations simulated at the local scale in streets are higher than those modelled at the regional scale. It indicates that the Parisian population exposure is underestimated using regional-scale concentrations. Although this underestimation is low for PM2.5, with an ESF of 1.04, it is very high for NO2 (1.26), eBC (between 1.22 and 1.24), and PNC (1.12). This shows that urban heterogeneities are important to be considered in order to represent the population exposure to NO2, eBC, and PNC but less so for PM2.5.
- Article
(4213 KB) - Full-text XML
-
Supplement
(1769 KB) - BibTeX
- EndNote


In metropolises, characterized by densely populated and extensively developed areas, air pollution remains a major concern due to the presence of numerous emission sources, such as traffic, energy consumption, solvents, and industrial activities. Traffic emissions receive particular attention because of their influence on local concentrations, with the impact of both exhaust and non-exhaust emissions (Fu et al., 2020; Jereb et al., 2021; Holnicki et al., 2021; Sarica et al., 2023). Environmental regulations aim to reduce key air pollutant concentrations, such as NO2, O3, and fine particulate matter (PM2.5). Although most of the health impacts are attributed to particles (Southerland et al., 2022), the health effects associated with different particle compounds and different particle size can vary considerably (Park et al., 2018; WHO, 2021; Haddad et al., 2024). In particular, black carbon (BC) and ultrafine particles (UFPs; defined by particles with diameter lower than 0.1 µm) are considered “priority” emerging pollutants (WHO, 2021; Goobie et al., 2024) that need to be better characterized, as stated in the recent European air-quality directive 2024/2881/CE. Long-term exposure to ultrafine particles is associated with increased mortality (Li et al., 2023b; Schwarz et al., 2023), while BC has been linked to adverse health effects, especially in urban areas (Lequy et al., 2021; Bouma et al., 2023; Kamińska et al., 2023). Whereas fine particles are best characterized by their mass concentrations (PM2.5), the mass of UFPs is low compared to that of fine particles. Hence, UFPs are best characterized by their particle number concentrations (PNCs) (Kwon et al., 2020; Trechera et al., 2023), contributing to about 80 %–90 % of the PNC over urban areas (Dall'Osto et al., 2013; Abbou et al., 2024).
Although modelling is often used to assess the effect of emissions and policies to improve air quality in cities (Mao et al., 2005; Yuan et al., 2014; Kuklinska et al., 2015; Selmi et al., 2016; Andre et al., 2020; Lugon et al., 2022), assessments on BC and UFP concentrations are not frequently evaluated because they are not regulated, nor measured routinely in cities, and difficult to model. Difficulties in modelling BC are partly linked to differences between elemental carbon and black carbon (Savadkoohi et al., 2023), contributing to large model–measurement discrepancies (Lugon et al., 2021b). However, recommendations for assessing BC concentrations were recently provided by Savadkoohi et al. (2024). The PNCs are even more difficult to model because of the lack of emission inventories and the rapid transformations of the ultrafine particles involved (Kukkonen et al., 2016). The difficulties in modelling BC and PNC might also partly be linked to the strong influence of traffic emissions on their concentrations (Andre et al., 2020; Jia et al., 2021; Lugon et al., 2022; Li et al., 2023a; Trechera et al., 2023). Traffic emissions are highly spatially and temporally variable in cities, and their variability is not easily reproduced in emission inventories. Those are usually built using either top-down or bottom-up approaches (Guevara et al., 2016). Bottom-up approaches use detailed spatial and temporal information for each activity sector, e.g. the number of vehicles for traffic emissions, while top-down approaches use information defined at larger scales (regional or national), which are spatialized using specific data, such as population data. Significant discrepancies may exist between emission inventories using these two approaches (Guevara et al., 2016; Lopez-Aparicio et al., 2017), especially for traffic emissions (Lopez-Aparicio et al., 2017) and non-exhaust emissions from tyre, brake, and road wear (Piscitello et al., 2021; Tomar et al., 2022). Emission inventories for UFPs only exist for top-down inventories (Kulmala et al., 2011; Zhong et al., 2023). Sartelet et al. (2022) recently provided a methodology to estimate UFP emissions from any emission inventories of PM, making it possible to use either bottom-up or top-down emission inventories.
Population exposure to outdoor concentrations at residences is commonly used as a proxy for exposure in epidemiological studies (Hoek et al., 2024), or it is used as an input when estimating multi-environment exposure (Karl et al., 2019; Valari et al., 2020; Elessa Etuman et al., 2024). In epidemiological studies, exposure to outdoor concentrations at residences is often estimated using land-use regression (LUR) models (Ma et al., 2024), which are usually based on linear regressions using land-use predictor variables and data from fixed monitoring stations and passive sampling. Regional-scale models (chemical transport models with a spatial resolution often coarser than a few squared kilometres) are sometimes used (Ostro et al., 2015; Adélaïde et al., 2021), leading to simulated fine PM concentrations much lower than those simulated using LUR models (Lequy et al., 2022). Their use is limited because they are not able to represent the urban heterogeneities, e.g. gradients between street and background concentrations.
Multi-scale models, i.e. a combination of regional- and local-scale models (Kwak et al., 2015; Lee and Kwak, 2020; Park et al., 2021; Lugon et al., 2022; Lin et al., 2023; Wang et al., 2023b; Strömberg et al., 2023), do represent urban heterogeneities, but they are often not able to represent the PM composition and the UFPs, and their application is limited to a city district. To represent an entire city, chemical-transport models are often coupled with a simple representation of local dispersion (Hood et al., 2018; Karl et al., 2019; Lugon et al., 2022; Maison et al., 2024b) or with subgrid statistical approaches (Valari and Menut, 2010; Squarcioni et al., 2025). However, only a few studies model BC concentrations (Lugon et al., 2021b) and PNCs (Zhong et al., 2023; Ketzel et al., 2021) down to the street scale. To model PNC, the main difficulty lies in the evaluation of atmospheric transformations (Kukkonen et al., 2016; Strömberg et al., 2023), and there is to our knowledge no multi-scale model currently available to represent PNC over a whole city from the urban background down to the street scale taking aerosol dynamics into account. To simulate gas and particle concentrations over cities from the regional down to the local scale taking chemistry and aerosol dynamics into account, the chemical module SSH-aerosol (Sartelet et al., 2020) has been coupled with air-quality models at the street and regional scales: the street-network model, Model of Urban Network Intersecting Canyons and Highways (MUNICH) (Kim et al., 2018, 2022), and the regional-scale models Polair3D (Lugon et al., 2021a, 2022; Sarica et al., 2023; Sartelet et al., 2024) and CHIMERE (Maison et al., 2024b; Squarcioni et al., 2025). The coupled multi-scale systems represent concentrations from the regional down to the street scales, consistently taking all emission sources and secondary particle formation at all scales into account (Lugon et al., 2022; Sartelet et al., 2024). Although extensive comparisons to observations were performed at regional and local scales for NO2, PM2.5, and PM10 (Sartelet et al., 2018; Lugon et al., 2022; Kim et al., 2022; Sarica et al., 2023), urban multi-scale modelling evaluation of BC and PNC at both regional and local scales is still missing.
This study aims to define a methodology for simulating multi-pollutant concentrations, including BC and PNC, down to the street scale over Paris, and to estimate the influence of spatial heterogeneities on the population exposure to outdoor concentrations at residences. Using detailed population data per building, an indicator is presented to assess how much regional modelling underestimates population exposure for different pollutants. It varies depending on the pollutants and in particular on their urban variability. Section 2 describes the model and simulation setup, including the particle number (PN) emissions (Sect. 2.2.1), as well as the relative contributions of non-traffic, exhaust, non-exhaust, and other traffic emissions (Sect. 2.2.2). Section 2.2.3 details the setup for a sensitivity simulation related to the size distribution of non-exhaust emissions. The model is evaluated at background and traffic stations in Sect. 3, and the influence of the emission inventory and the size distribution of non-exhaust emissions is assessed. In Sect. 4, using detailed population data at building level, a scaling exposure factor is determined to estimate outdoor population exposure for the city of Paris using modelled regional-scale concentrations.
The different abbreviations used throughout this paper are summarized in Appendix A.
2.1 Model description and simulation setup
Simulations are performed with WRF-CHIMERE/MUNICH/SSH-aerosol from 01:00 UTC on 1 June 2022 to 23:00 UTC on 31 July 2022, corresponding to a period with specific PNC and BC measurements performed over Paris, as detailed in Sect. 2.4. The setting is the same as in Maison et al. (2024b), and it is summarized here.
The CHIMERE chemistry-transport model (v2020r1) (Menut et al., 2021) is applied over Greater Paris (Île-de-France) to compute atmospheric concentrations of gas-phase and aerosol species considering transport (advection and mixing), deposition, emissions, chemistry, and aerosol dynamics. The chemical scheme used is MELCHIOR2 modified to represent the formation of organic condensables as described in SSH-aerosol v1.3 (Sartelet et al., 2020), which is used for aerosol dynamics (coagulation and condensation/evaporation). The SSH-aerosol model integrates three modules: SCRAM (Size-Composition Resolved Aerosol Model), which addresses the dynamic evolution of aerosols; SOAP (Secondary Organic Aerosol Processor) for gas–particle partitioning of organic compounds; and H2O (Hydrophobic/Hydrophilic Organics) for the formation of condensable organic compounds. The particle size distribution is discretized in 10 sections of diameters between 0.01 and 10 µm (Appendix A). The CHIMERE model is coupled with the Weather and Research Forecasting (WRF) meteorological model (Powers et al., 2017), which was used to compute the meteorological fields needed in the simulation. Here, no feedback interactions are considered between concentrations and meteorological fields, with a one-way-coupling approach.
For a description of the urban background concentrations over Paris, a fine spatial resolution of 1 km2 is used over Greater Paris (IDF1 domain, Fig. 1). Boundary conditions are obtained by simulating three nested domains: the intermediate domain covers the north-west of France with a horizontal resolution of 3 km × 3 km (IDF3 domain), and the outermost domain covers France and western Europe with a horizontal resolution of 9 km × 9 km (FRA9 domain, Fig. 1). CAMS (Copernicus Atmosphere Monitoring Service) reanalysis (Inness et al., 2019) is used for boundary conditions of this outermost domain. The model setup is the same as in Maison et al. (2024a).
In WRF, the vertical discretization is based on 33 levels ranging from 0 to 20 km of altitude. The single-layer urban canopy model (UCM) (Kusaka et al., 2001) is used in the domains IDF3 and IDF1 in order to improve the representation of meteorological fields in urban areas, using the CORINE Land Cover database (available at https://doi.org/10.2909/71c95a07-e296-44fc-b22b-415f42acfdf0, EEA Geospatial Data Catalogue, 2019), which classes the urban areas into three sub-categories (commercial areas, high-intensity residential, and low-intensity residential areas). More details about the WRF simulation setup are available in Maison et al. (2024a).
In CHIMERE, the vertical discretization is based on 15 isobaric vertical levels, from 998 to 500 hPa, resulting in average layer heights ranging from 17 m near the ground to 1050 m at high altitudes. The land-use database GlobCover (Arino et al., 2007), with 300 m spatial resolution, is used to compute pollutant deposition and biogenic emissions, which are estimated following MEGANv2.1 (Guenther et al., 2012).
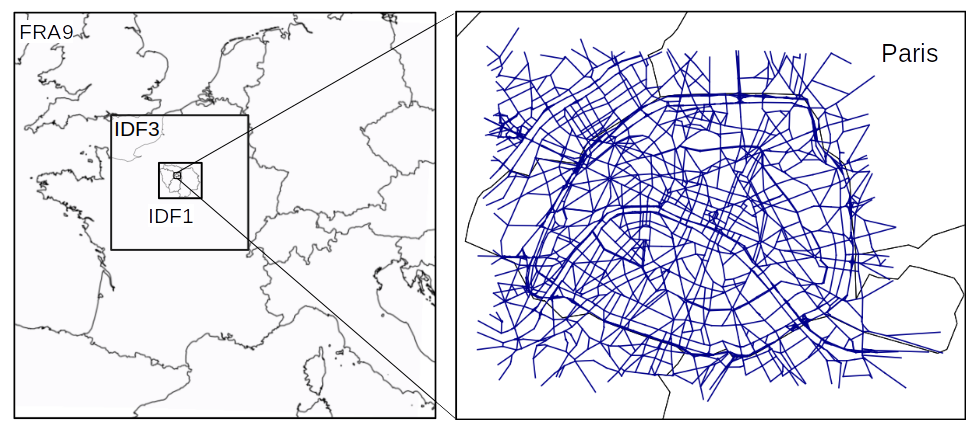
Figure 1Domains for the regional- and local-scale simulations. The blue lines in the right panel represent the street segments used in the local-scale simulation.
The WRF-CHIMERE/SSH-aerosol model is one-way-coupled to the street-network model MUNICH (Kim et al., 2022). SSH-aerosol is used both in CHIMERE and MUNICH, in order to represent consistently chemical and aerosol species at all scales. In MUNICH, dry and wet deposition is considered through the parameterizations detailed in Kim et al. (2022). The street network contains the 4655 main streets of Paris (Fig. 1). Traffic emissions are diluted in each street volume, which depends on street height, length, and width. Gas and particle compounds are advected from one street to another, depending on the wind direction, and the vertical transfer of pollutants between the urban background and streets depends on atmospheric stability, which is determined depending on the Monin–Obukhov length (LMO), planetary boundary layer (PBL) height, and the standard deviations of wind velocity.
MUNICH v2.2 is employed with an updated calculation of the LMO to better represent the vertical transfer of pollutants between the streets and the background. In previous studies (Kim et al., 2022; Lugon et al., 2022; Sarica et al., 2023), the LMO was parameterized following Musson-Genon et al. (1992), derived from evaporation and sensible heat fluxes at the surface. Using this parameterization, for all street segments during the period of simulation, 93.8 % of atmospheric conditions are unstable, 6.2 % are stable, and nearly 0 % are neutral. Instead, this study uses the LMO parameterization of Soulhac et al. (2011), which calculates the sensible heat flux by deriving it from net radiation, latent heat flux, and diffusive heat flux toward the ground. As a result, there are less frequent unstable but more neutral conditions: 68.8 % of the conditions are unstable, 7.6 % are stable, and 23.6 % are neutral. Using both parameterizations, stable and neutral conditions appear predominantly during nighttime. However, using the parameterization of Soulhac et al. (2011) leads to much better comparisons to concentration measurements than the parameterization of Musson-Genon et al. (1992), indicating that stable and neutral conditions may not be represented well during summer in cities with the parameterization of Musson-Genon et al. (1992).
For aerosol dynamics, coagulation and condensation of sulfuric acid and low-volatility organic compounds are resolved simultaneously and dynamically for all particle sizes. The Kelvin effect is taken into account when simulating condensation/evaporation of semi-volatile compounds, as described in Zhu et al. (2016). As condensation/evaporation is resolved using a Lagrangian approach, the section diameters may evolve, and the Euler coupled algorithm is used to redistribute the particle mass and number concentrations into the sections of fixed size classes (Sartelet et al., 2020). Because the first diameter is relatively high (10 nm), if the diameter of the particles of the first section goes below 10 nm, then the mass of those particles is allocated to the first section.
Using a one-way-coupling approach, the regional-scale and local-scale simulations are performed sequentially. For the regional scale, the 2-month simulation using WRF-CHIMERE models requires approximately 11 520 processor hours (192 processors over 60 h). The local-scale simulations are less expensive, and the 2-month simulation with the MUNICH model requires around 7680 processor hours (64 processors over 120 h) to simulate the street concentrations in the Parisian street network composed of 4655 streets.
2.2 Anthropogenic emissions
In the regional-scale modelling with CHIMERE, the top-down 2020 anthropogenic emission inventory of EMEP (European Monitoring and Evaluation Programme) of spatial resolution 0.1° × 0.1° is used for the larger-scale simulations over western Europe (FRA9 domain) and the north-west of France (IDF3 domain). Over Greater Paris, two different simulations are performed: one with the EMEP inventory, labelled as “EMEP” in the following, and one with the bottom-up inventory of Airparif, the air-quality monitoring network for the area of Greater Paris, labelled as “REF” in the following. The spatial resolution of the Airparif inventory is 1 km × 1 km, except for traffic emissions with a finer resolution down to the street level. Note that in the REF simulation, even though the Airparif bottom-up inventory is used over Greater Paris, the EMEP inventory is used for the cells outside the area of Greater Paris area that are not covered by the Airparif inventory, i.e. exclusively on the edge of the area of Greater Paris. In the street-network model MUNICH, only the Airparif inventory is used because there is no downscaling available for EMEP emissions down to streets.
The bottom-up inventory corresponds to the 2019 Airparif inventory for all activity sectors except for traffic, which is specific to the summer 2022. It is calculated using the traffic emissions model HEAVEN (https://www.airparif.asso.fr/heaven-emissions-du-trafic-en-temps-reel, last access: 17 March 2025). The strength of this system is to use a traffic model that is corrected from traffic count data in near-real time. Non-traffic and traffic emissions are detailed in Appendix B (Sect. B1 and B2, respectively). For consistency between traffic emissions in the streets and at the urban scale, street-scale traffic emissions are aggregated and assigned to the corresponding grids in the CHIMERE model (Fig. 2a and c). The emissions of NO2 and BC are higher along the main roads and motorways. In Paris, emissions are higher on the Paris ring road than in the city centre. Section 2.2.1 details the algorithm to represent PN emissions, and Sect. 2.2.3 details the size distribution of non-exhaust emissions and the sensitivity simulation on its representation (labelled as “SEN”).
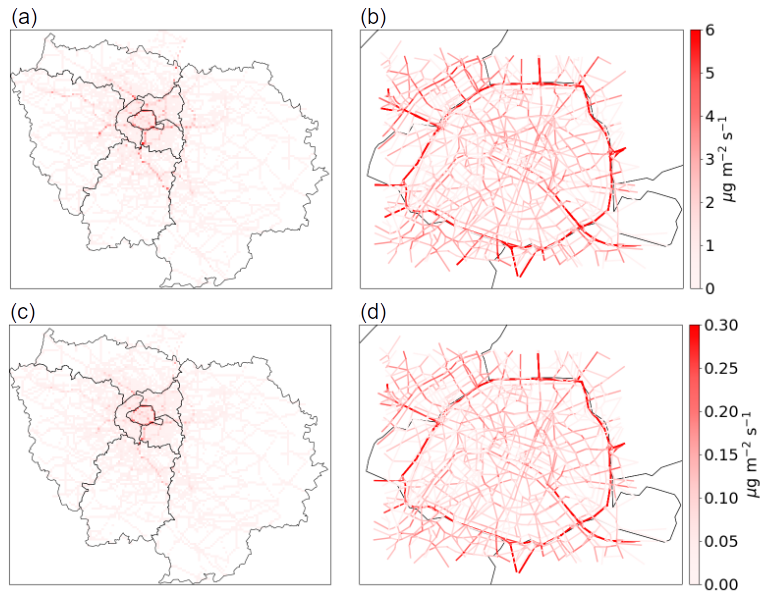
Figure 2Regional (a, c) and street (b, d) traffic emissions of NO2 (a, b) and BC (c, d) averaged from June to July 2022.
2.2.1 PN emissions
The emission inventories provide estimations of particle matter in different sizes for the different activity sectors. Here, the non-traffic emission inventory provides emission data for PM2.5 and PM10, while the traffic emission inventory provides emission data for PM2.5, PM10, and PM1. The particle emissions are distributed in the modelled particle size sections following Sartelet et al. (2022). Emissions of particles in the range PM0.1–PM1 and PM0.01–PM0.1 are estimated using the PM1 PM2.5 and PM0.1 PM1 ratios given in Sartelet et al. (2022) (Table A1) for each activity sector.
Emissions in each of the size ranges PM0.01–PM0.1, PM0.1–PM1, and PM1–PM2.5 are distributed among the model size sections within that range using the following formula:
where M is the mass concentration to be distributed, and i is the size section of bound diameters di−1-di included in the size range of bound diameters d0-dn. This formula, which is set out in Appendix A, allows the conservation of both mass and number during the discretization. The detailed factors obtained with this formula for each size section are presented in Table A1.
2.2.2 Emission sources of NOx, BC, PM, and PNC
The distribution between traffic (exhaust vehicular road, non-exhaust vehicular road, non-road/other traffic) and non-traffic emissions for NOx, BC, PM, and PNC over Greater Paris is shown in Fig. 3 and over Paris in Fig. C2. Non-traffic emissions refer to all emissions excluding traffic emissions (exhaust vehicular road emissions, non-exhaust vehicular road emissions, non-road/other traffic emissions). Exhaust emissions are produced from the combustion processes associated with road traffic emissions, while non-exhaust emissions include road traffic emissions resulting from road wear, tyre wear, and brake wear. Other traffic emissions encompass emissions from ships and aircraft. Over Greater Paris, the majority of NOx emissions originated from road traffic sources (65.8 %). Amongst non-road traffic sources, shipping, railways, and aviation contribute to a significant proportion (24.9 %) of NOx emissions. PM2.5 emissions are mostly from non-traffic sources (over 69 % of PM emissions), while road traffic only contributes to about 30.5 % of emissions. Note that non-exhaust emissions represent a larger percentage of PM2.5 than exhaust emissions (22.2 % vs. 8.3 %). Concerning BC emissions, the influence of road traffic is larger than that of PM2.5 emissions (about 46.1 % of BC emissions), with a larger contribution of exhaust than non-exhaust emissions (32.5 % vs. 13.6 %). Concerning PN emissions, non-traffic sources constitute almost half of the emissions (52.3 %), with a contribution of road traffic of about 17.2 % and a strong contribution of non-road traffic sources (24.5 %).
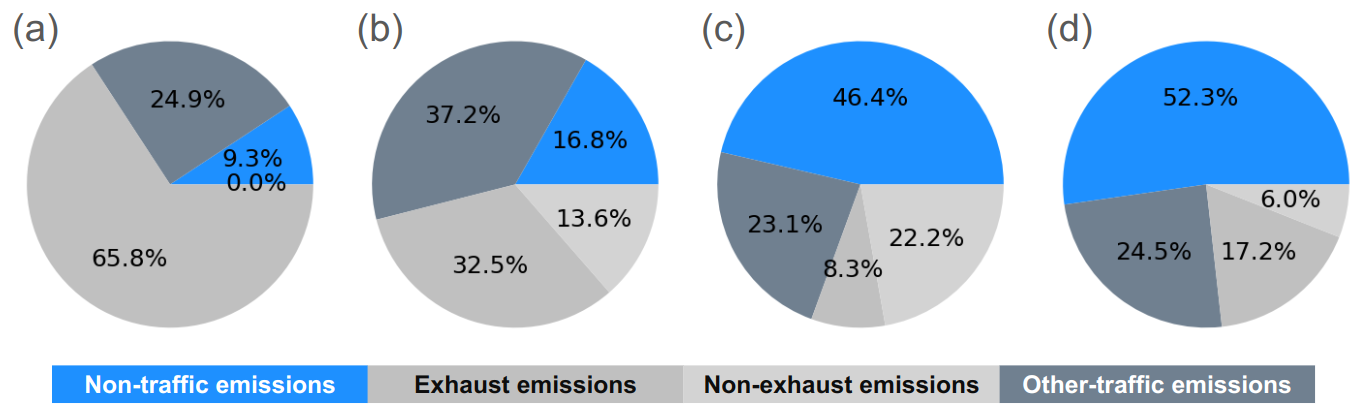
Figure 3Distribution between vehicular road traffic (exhaust and non-exhaust), non-road/other traffic, and non-traffic emissions for NOx (a), BC (b), PM2.5 (c), and PNC (d) in Greater Paris.
2.2.3 Sensitivity to non-exhaust emissions size distribution
Non-exhaust traffic emissions, such as tyre wear, brake, and road wear, have large uncertainties (Lugon et al., 2021b), and their contribution to particle emissions is also large. Section 2.2.2 shows that non-exhaust emissions (22.2 %) contribute more to traffic PM emissions than exhaust emissions (8.3 %). In the emission inventory, the non-exhaust emissions of particles are provided for PM10. Emissions of PM2.5 and PM1 are estimated using a PM1 PM2.5 ratio and a PM2.5 PM10 ratio. A sensitivity simulation “SEN” is set up to evaluate the impact of the choices made in this size distribution of non-exhaust emissions. In the reference simulation, the PM1 PM2.5 ratio and PM2.5 PM10 ratio for non-exhaust emissions are obtained from EMEP guidelines for the different types of vehicles (Leonidas Ntziachristos et al., 2023a). In the SEN scenario, the PM2.5 PM10 ratios are modified to be those of the NORTRIP model (Denby et al., 2013). The size distribution employed in REF and SEN simulations is detailed in Table 1.
Table 1PM2.5 PM10 ratios of particles emitted from non-exhaust traffic sources in the REF and SEN simulations.
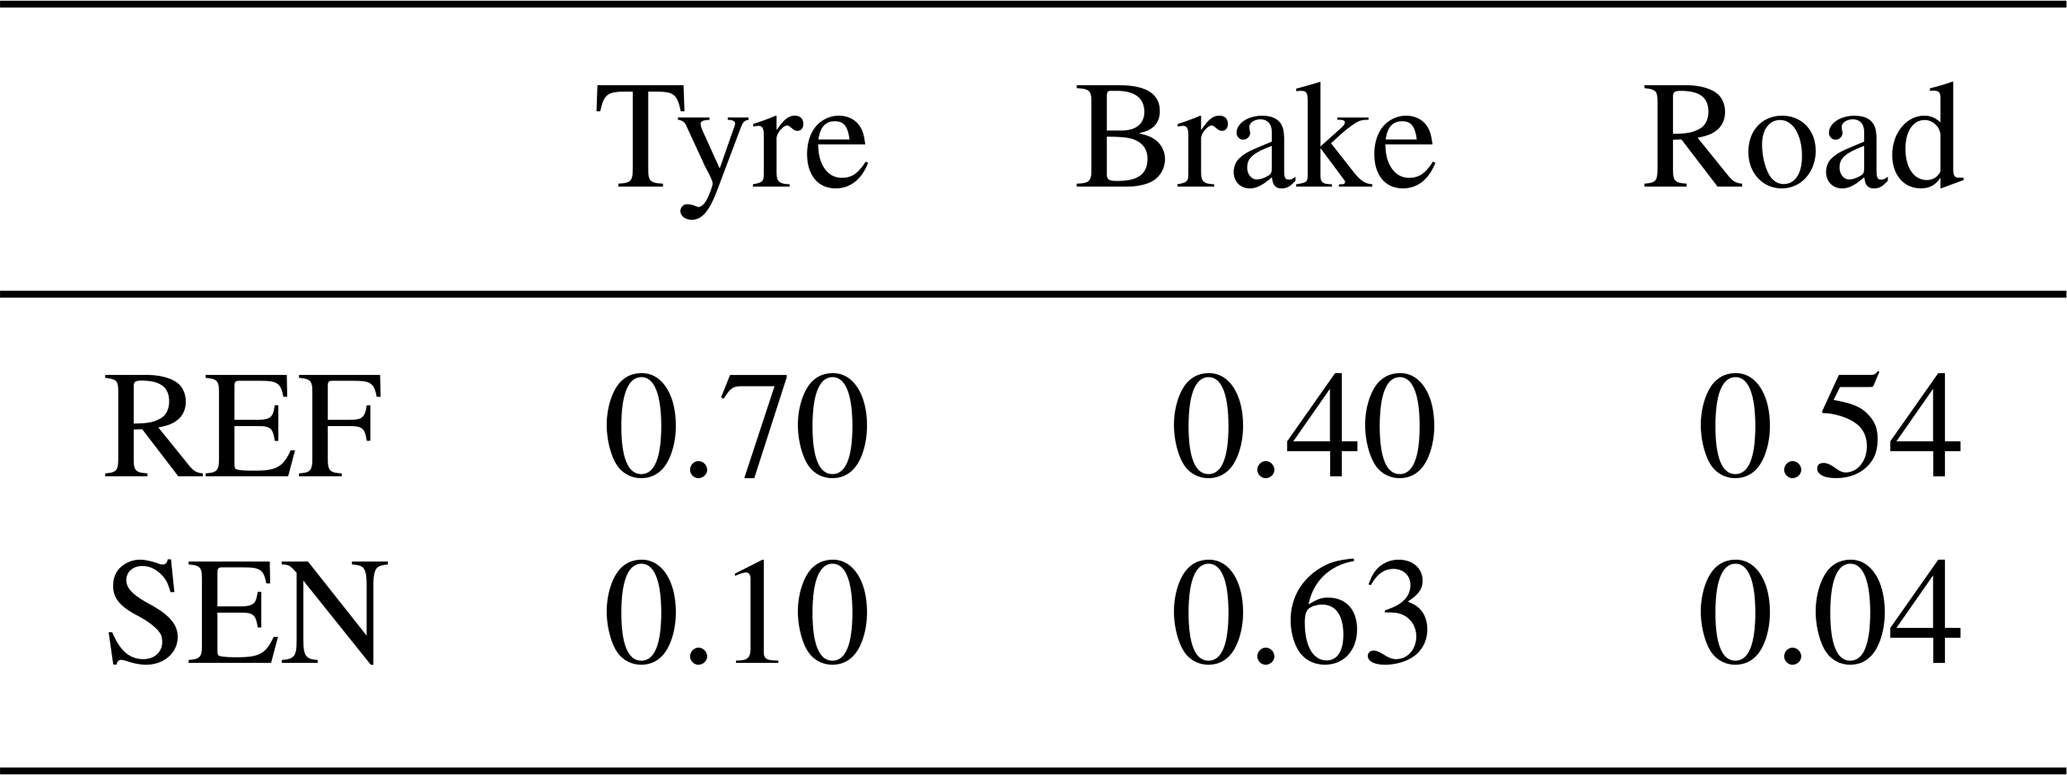
Non-exhaust emissions are almost equally distributed between PM2.5 and PM10 in the REF simulation (PM2.5 PM10=0.53), while the proportion of non-exhaust emissions in PM2.5 is lower in the SEN simulation (PM2.5 PM10=0.28). As the NORTRIP model has no PM1 PM2.5 ratio for non-exhaust emissions, no modifications are made in the PM1 PM2.5 ratios in the SEN simulation. The proportion of PM1 is low in both REF and SEN (PM1 PM10≃0.07).
2.3 Calculation of population exposure
The population exposure to outdoor concentrations may be calculated using regional-scale modelling, potentially underestimating the exposure. To estimate how well the population exposure is represented using regional-scale modelling for the different pollutants, the population-weighted concentration (PWC) and exposure scaling factor (ESF) are calculated for Paris using the multi-scale concentrations and the population data from the MAJIC database (Létinois, 2014). The MAJIC spatialization method provides a very detailed description of the population on a local scale. More specifically, it uses data on residential premises from the MAJIC property database issued by the French Public Finance Department (DGFiP). These data are cross-referenced with IGN spatial databases (BD PARCELLAIRE, https://geoservices.ign.fr/bdparcellaire, last access: 17 March 2025, and BD TOPO, https://geoservices.ign.fr/documentation/donnees/vecteur/bdtopo, last access: 17 March 2025) and population statistics from the National Institute of Statistics and Economic Studies (INSEE) to estimate the number of inhabitants in each building.
To locate the buildings in the street network, streets are considered rectangles of four known extremity coordinates, and buildings are located in the street segments by comparing their mean coordinates with those of streets. Because of uncertainty about street widths, buildings within a perimeter on each side of the street are integrated into the street segment (Fig. C3).
Among the 109 152 buildings of Paris, 66.9 % are integrated into street segments. This corresponds to 44.4 % of the population living near main streets and the remaining 55.6 % residing away from main streets.
PWC is calculated by weighting populations based on the concentrations to which they are exposed at the precise location of their home. People living in a building on the main street are assigned to that street concentration. People living in buildings away from busy streets are assigned to urban background concentrations.
with
where I and J are the grid points of the regional-scale model, and Cst and Cbg are the street and urban background concentrations, respectively. POPbuilding,s is the population living in the street segment. is the population living near main streets in the grid cell I, J, and POPbg is the population not living near main streets that is assumed to be exposed to urban background concentrations.
2.4 Measurements
The simulated concentrations are compared to measurements at background and traffic stations (Fig. C4). Concerning the measurements operated by Airparif, NO2 and PM2.5 are routinely monitored at 21 and 8 stations, respectively. BC was monitored at 4 stations using a dual-spot aethalometer (MAGE Sci. model AE33 M8060, using the optical wavelengths 880 nm for eBC analysis) with a PM2.5 size cut-off, and PNC was monitored using a mobility particle size spectrometer (MPSS) for particles of diameters between 5 and 385 nm at two stations: Châtelet-les-Halles (PA01H), which is an urban background station located in the centre of Paris, and BP-EST, which is next to the very busy ring road of Paris. At the PA01H station, elemental carbon (EC) was also measured using filter measurements. It is analysed according to a thermo-optical method (instrument: Lab OC-EC Carbon Aerosol Analyzer, Sunset), which meets the EUSAAR2 protocol. The concomitant EC and eBC measurements allow the determination of the harmonization factor suggested by Savadkoohi et al. (2024).
Air-quality models represent the mass concentrations of elemental carbon (EC). They may differ from BC concentrations (Savadkoohi et al., 2023) that are inferred from optical measurements using aethalometers (Drinovec et al., 2015). Equivalent BC (eBC) is then defined as the mass concentration of BC as indirectly determined by light absorption techniques (Savadkoohi et al., 2024). A harmonization of BC measurements is needed to allow for direct comparisons between measured eBC and modelled EC concentrations (Savadkoohi et al., 2024). The harmonization factor was calculated as the ratio of eBC and EC. Between 9 and 22 June 2022, at the PA01H station where both EC and eBC data are available, the daily harmonization factor ranges from 1.34 to 2.26, with an average equal to 1.79 (Fig. C5). This average harmonization factor is used to correct the eBC measured concentrations at all stations and all times. Note that the average harmonization factor (1.79) is similar to the harmonization factor of 1.76 proposed by Savadkoohi et al. (2023).
Comparisons are also performed at the SIRTA site (Site Instrumental de Recherche par Télédétection Atmosphérique), an atmospheric observatory located 20 km south-west of Paris, which is integrated into the ACTRIS European Research Infrastructure Consortium (https://www.actris.eu, last access: 17 March 2025) (Haeffelin et al., 2005). In summer 2022, two other monitoring stations were operated inside Paris: the Paris Rive Gauche (PRG) urban background station and the Hôtel de Ville (HdV) traffic station. The PRG site, located on the seventh floor of the Lamark B building of Université Paris Cité (30 m above ground layer), in the south-east side of the city, was set up as part of the ACROSS (Atmospheric ChemistRy Of the Suburban foreSt) campaign (Cantrell and Michoud, 2022). Air was taken from a common certified PM1 sampling head located on the roof of the building at about 30 m above the ground. A copper tube of 7 mm inner diameter and 10 m length connected the PM1 head to a four-way stainless steel flow splitter (TSI) located in the measuring room that dispatched the airflow to different instruments. The Paris HdV station was set up as part of the sTREEt (Impact of sTress on uRban trEEs and on city air quality) project (Maison et al., 2024a). It overlooks the quays of the Seine, which is a major road traffic artery. The eBC was monitored with an AE33 at all stations (MAGE Sci. model AE33 M8060, using the optical wavelengths 880 nm), with a PM2.5 size cut-off at SIRTA and HdV and with a PM1 size cut-off at PRG. The PNC was monitored with a scanning mobility particle sizer (SMPS) for particles of diameters between 9 and 836 nm at SIRTA and between 23 nm and 1 µm at PRG. A nano-SMPS, measuring in the range 8–64 nm, was used at PRG to supplement measurements for diameters between 8 and 23 nm. Note that for comparison between simulated and measured concentrations, only particles of diameters larger than 10 nm are considered. The PNC measurements at PRG and SIRTA were performed for shorter periods than the Airparif measurements at PA01: from 17 June to 11 July at PRG and from 15 June to 17 July at SIRTA.
Model-to-observation comparisons are performed over urban background stations to evaluate the regional-scale concentrations simulated with CHIMERE and over traffic stations to evaluate the street-scale concentrations simulated with MUNICH. Model performances are evaluated based on statistical indicators, including the fractional bias (FB), geometric mean bias (MG), normalized mean square error (NMSE), geometric variance (VG), normalized absolute difference (NAD), and the fraction of predictions within a factor of 2 of observations (FAC2), as described in Appendix D. Following Hanna and Chang (2012) and Herring and Huq (2018), two different acceptable criteria are considered: (i) a strict performance criterion, with , , NMSE<3, VG<1.6, NAD<0.3, and FAC2>0.5, and (ii) a less strict performance criterion, acceptable for urban areas, with , NMSE<6, NAD<0.5, and FAC2>0.3. For evaluating PNC, many studies (Olin et al., 2022; Patoulias and Pandis, 2022; Sartelet et al., 2022) rather used the NMB, which is the normalized mean bias, and NME, the normalized mean error.
3.1 Background concentrations
The average statistical indicators obtained in each CHIMERE simulation (REF, SEN, and EMEP simulations) are presented in Table 2. The most strict criteria are also met for all pollutants in the simulations using the bottom-up emission inventory (REF and SEN simulations). In the EMEP simulation, concentrations tend to be overestimated for all pollutants, and the NO2, eBC, PM2.5, and PNC concentrations are higher than those in the REF and SEN simulations (Fig. C6) due to relatively high emissions compared to bottom-up traffic emissions. For NO2, eBC, PM2.5, and PNC, the emission ratios of EMEP to bottom-up emissions are 1.2, 1.72, 1.12, and 1.53 in Greater Paris, respectively.
As the sensitivity simulation differs from the reference one by the size distribution of non-exhaust emissions between PM2.5 and PM10, the differences between the REF and SEN simulations are negligible for all pollutants. They are also very low for PM2.5, suggesting that the choice of the EMEP or NORTRIP size distribution of non-exhaust traffic emissions has a low influence at the regional scale. The differences are the highest for eBC, as the speciation of non-exhaust emissions differs for PM2.5 and PM10 (see Table B1).
Table 2Statistical indicators for NO2, eBC, PM2.5, and PNC simulated at the background stations in the REF, SEN, and EMEP simulations. The average simulated and observed concentrations are in µg m−3 for NO2, eBC, PM2.5 and in cm−3 for PNC. The bold value does not respect the most strict performance criteria.
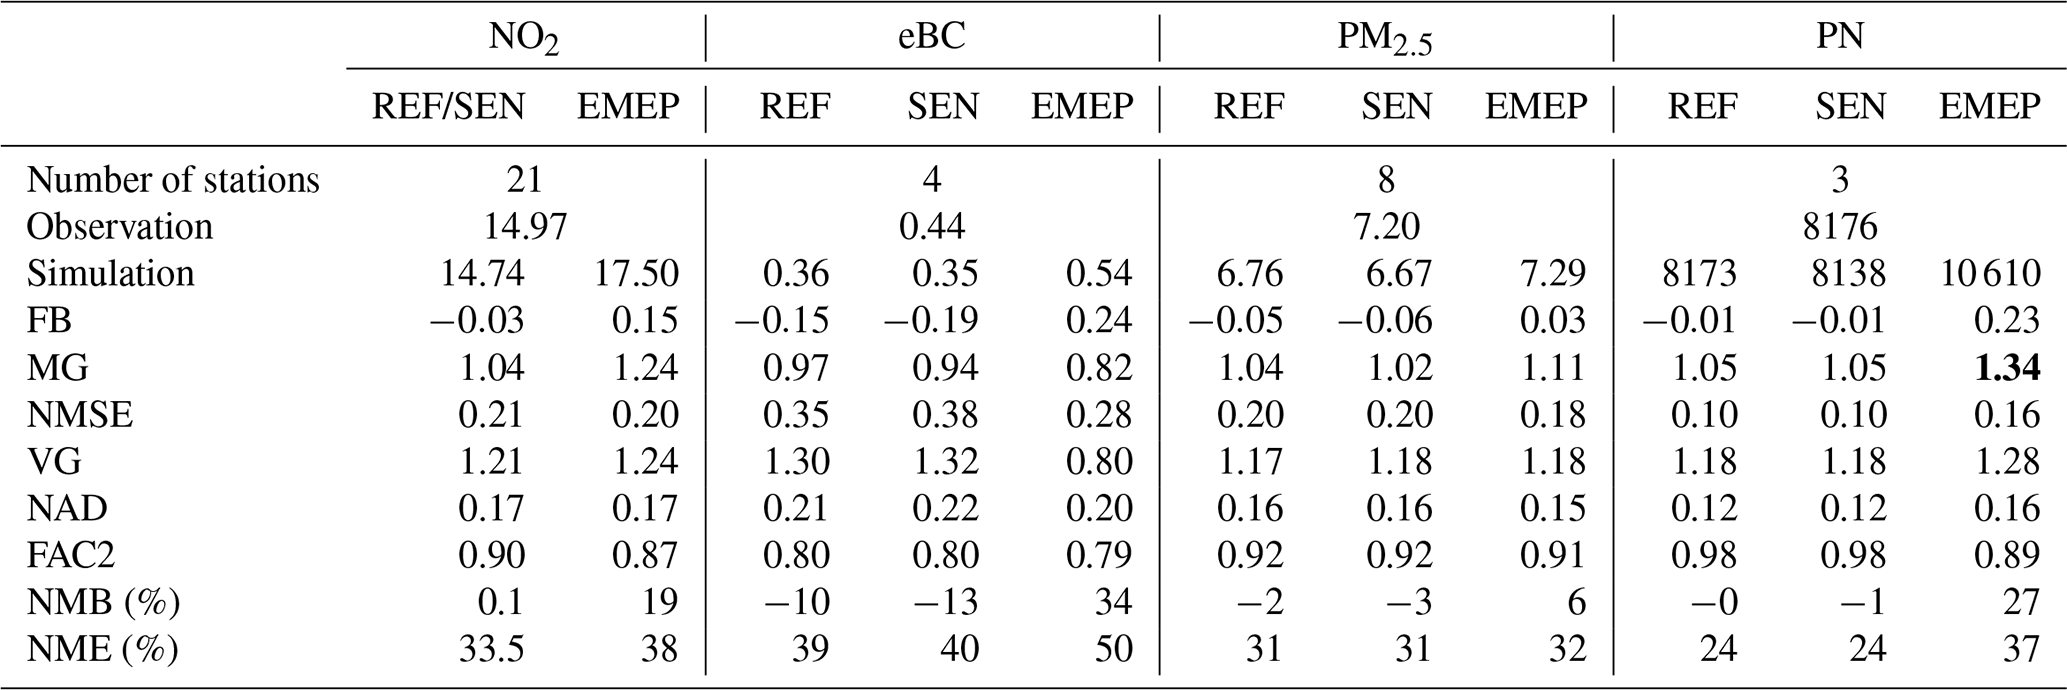
The simulation performance regarding PNC is also evaluated based on NMB and NME, following Olin et al. (2022), Patoulias and Pandis (2022), and Sartelet et al. (2022). The concentrations simulated with the bottom-up inventory presented a very low bias NMB (between −0.3 % for REF and −0.7 % for SEN) and low NME (24 %). Using the EMEP top-down inventory, the NMB and NME are higher (27 % and 37 %, respectively). These values are low compared to studies in the literature. For example, for particles of diameters larger than 0.01 µm, NME values range between 36 % and 79 % (Sartelet et al., 2022), 63 % (Patoulias and Pandis, 2022), and 94 % (Olin et al., 2022), and Ketzel et al. (2021) reported an NMB of 151 %.
Figure 4 shows the model-to-observation comparison of PNC for different size sections. All simulations reproduced the size distribution of PNC well, although the concentrations are overestimated in the first size section, between 10 and 20 nm. This overestimation may be partly due to the redistribution algorithm, where the mass of particles whose diameter becomes lower than 10 nm during the simulation is assigned to the first size section, as detailed in Sect. 2.1.
The better performance of REF and SEN simulations compared to EMEP is more visible in dense-urban areas, probably because the share of traffic is more important than in less dense areas, and traffic emissions are better represented thanks to their correction based on vehicle counting loops (see Sect. 2.1). Figure 5 shows the daily time series for the NO2, eBC, PM2.5, and PNC in the city centre (PA01H station), measured and simulated with the three CHIMERE simulations. Especially for eBC, the temporal evolution of pollutants is better represented with the REF and SEN simulations than the EMEP one, enhancing the importance of a precise traffic emission inventory. Large concentration peaks of PM2.5 and eBC are observed at all stations on 19 July. They could be explained by forest fires in the south-west of France (Menut et al., 2023).
Apart from this peak, in both the REF and SEN simulations, the daily variations of NO2, eBC, PM2.5, and PNC are simulated well. As observed for the statistical indicators, the effect of changing the size distribution of non-exhaust emissions (SEN simulation) on eBC, PM2.5, and PNC at urban background stations is small, and using the EMEP emission inventory leads to an overestimation of concentrations.
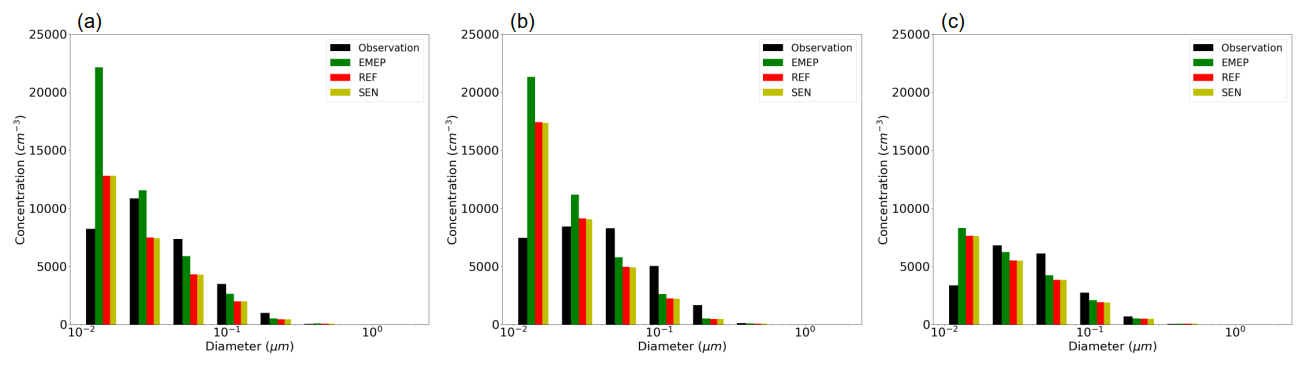
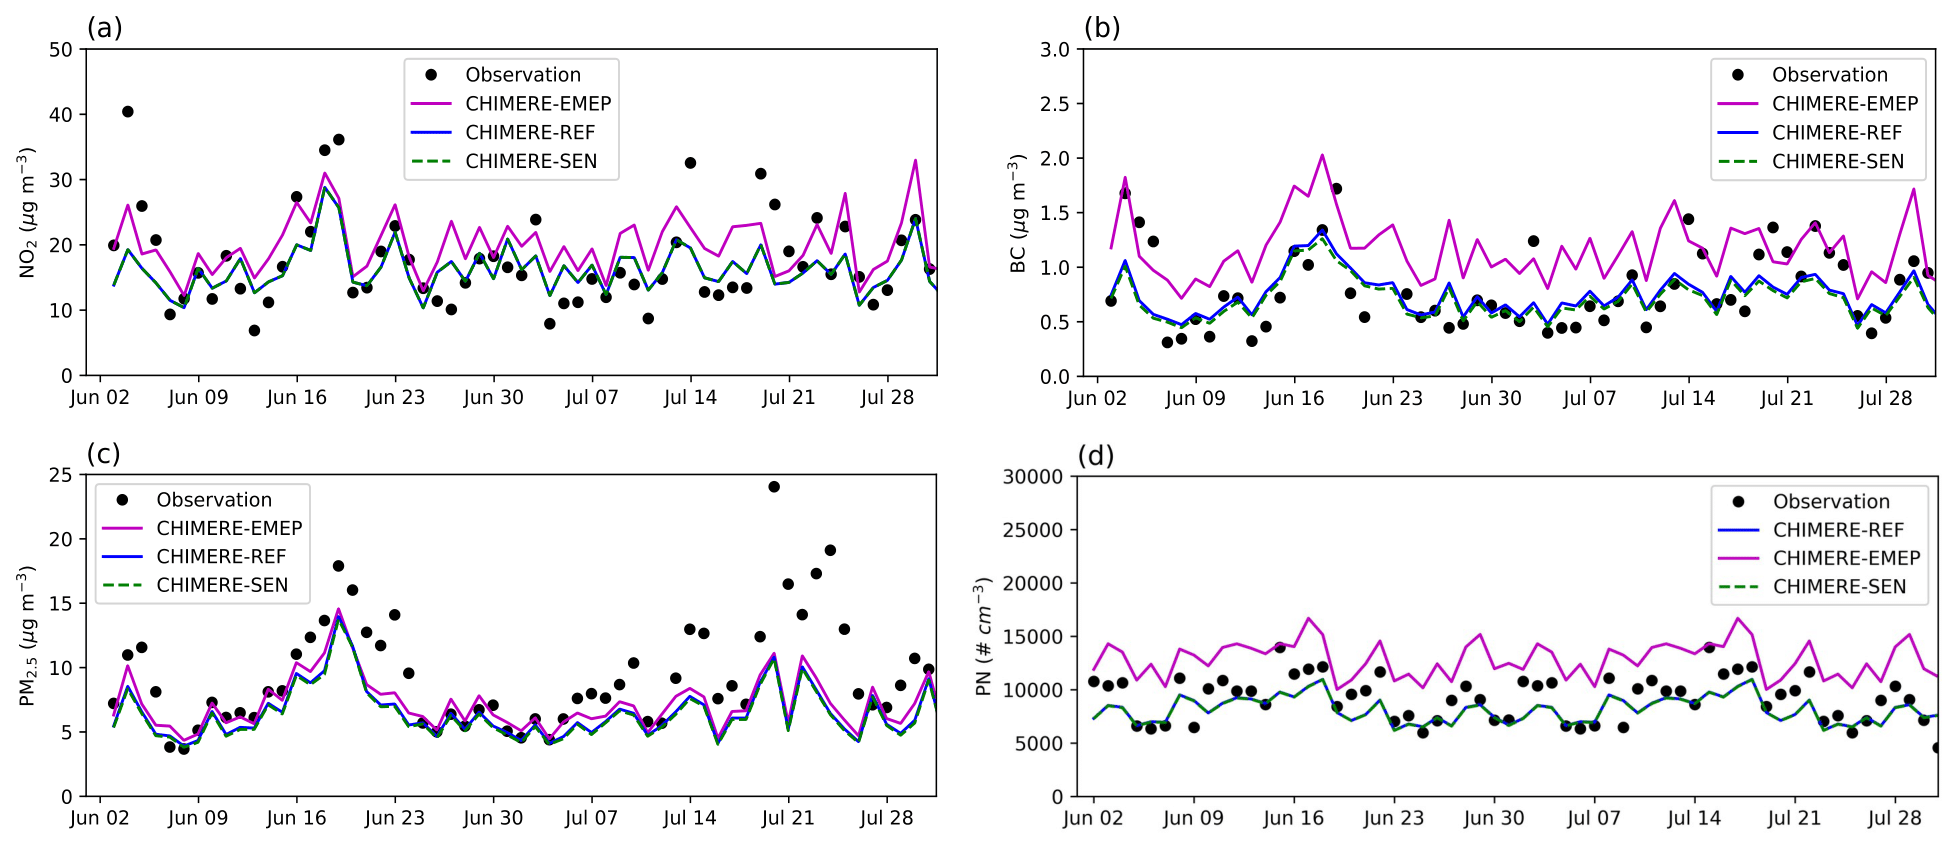
Figure 5Time series for measured and simulated (a) NO2, (b) eBC, (c) PM2.5, and (d) PNC at PA01H station.
3.2 Street concentrations
Table 3 summarizes the statistical indicators for NO2, eBC, and PM2.5 concentrations at the traffic stations. The strict performance criteria are met for all pollutants: NO2, eBC, and PM2.5 concentrations, for both the REF and SEN simulations.
Figure 6 shows the daily temporal variations of the concentrations of NO2, eBC, and PM2.5 at two different traffic stations: HAUSS, representing a street in the city centre, and BP_EST, representing a heavy-traffic road. As expected, the concentrations are largely underestimated by the regional-scale concentrations simulated with CHIMERE. The daily variations of the street concentrations simulated by MUNICH are strongly influenced by those of CHIMERE. For example, the peak of concentrations around 19 July is also present at the street scale but underestimated by the model. In the SEN simulations, eBC and PM2.5 concentrations are lower than in the REF simulation due to the reduction of the non-exhaust emissions of small-size sections (0.01 to 2.5 µm). The largest difference is observed at the heavy-traffic station BP_EST (Fig. 6f). Large peaks of eBC concentrations are observed at the BP_EST station. There is greater variability in the measured eBC concentrations compared to those of NO2 at the BP_EST station. This could be due to strong variations in the traffic BC emission factors or to temporal variations in the EC BC ratio, which is assumed to be constant.
For PNC, due to the lack of PNC measurement at traffic stations in 2022, for indicative purposes, the concentrations simulated in summer 2022 are compared with the concentrations observed in summer 2021 at two traffic sites (BP_EST and HAUSS), as documented in the Airparif report (AIRPARIF, 2022). The measurement campaign operated by Airparif took place from 14 June to 19 September 2021 (AIRPARIF, 2022). At the PA01H station, the average PNC for particles of diameters between 10 and 400 nm is very close to the average measured in 2022 (about 9300 cm−3 in both 2021 and 2022). At the two traffic stations (HAUSS and BP_EST), the average PNCs measured in the summer 2021 were 17 000 and 21 300 cm−3, respectively, for particles of diameters between 10 and 400 nm. The PNCs in the REF (SEN) simulation are 14 500 (14 400) cm−3 at HAUSS and 30 650 (29 800) cm−3 at BP_EST, suggesting a bias of 15 % at HAUSS and 40 % at BP_EST. The wider bias at BP_EST is certainly due to the 10 nm cut-off diameter for the particles. At HAUSS, most of the particle number concentrations are between 10 and 400 nm, which represents 94 % of particles between 5 and 400 nm. However, at BP_EST, many particles are observed between 5 and 10 nm because of the higher importance of vehicle emissions. The number concentration between 10 and 400 nm represent 86 % of the particles between 5 and 400 nm. Although only particles with diameters greater than 10 nm are modelled here, a proportion of particles with smaller diameters is represented, since particles with diameters less than 10 nm are assigned to the first size section (10–20 nm) in the numerical algorithm used here. Although there is a difference in the periods of measurement and simulation with general conditions (traffic emissions, meteorological parameters) that could have been different, the simulated PNCs are roughly consistent with the measured ones, and the concentrations in the streets and at the traffic sites are much higher than those in the urban background.
Table 3Statistical indicators for NO2, eBC, and PM2.5 concentrations simulated at the traffic stations in the REF and SEN simulations. The average simulated and observed concentrations are in µg m−3 for NO2, eBC, and PM2.5. All values respect the strict performance criteria.
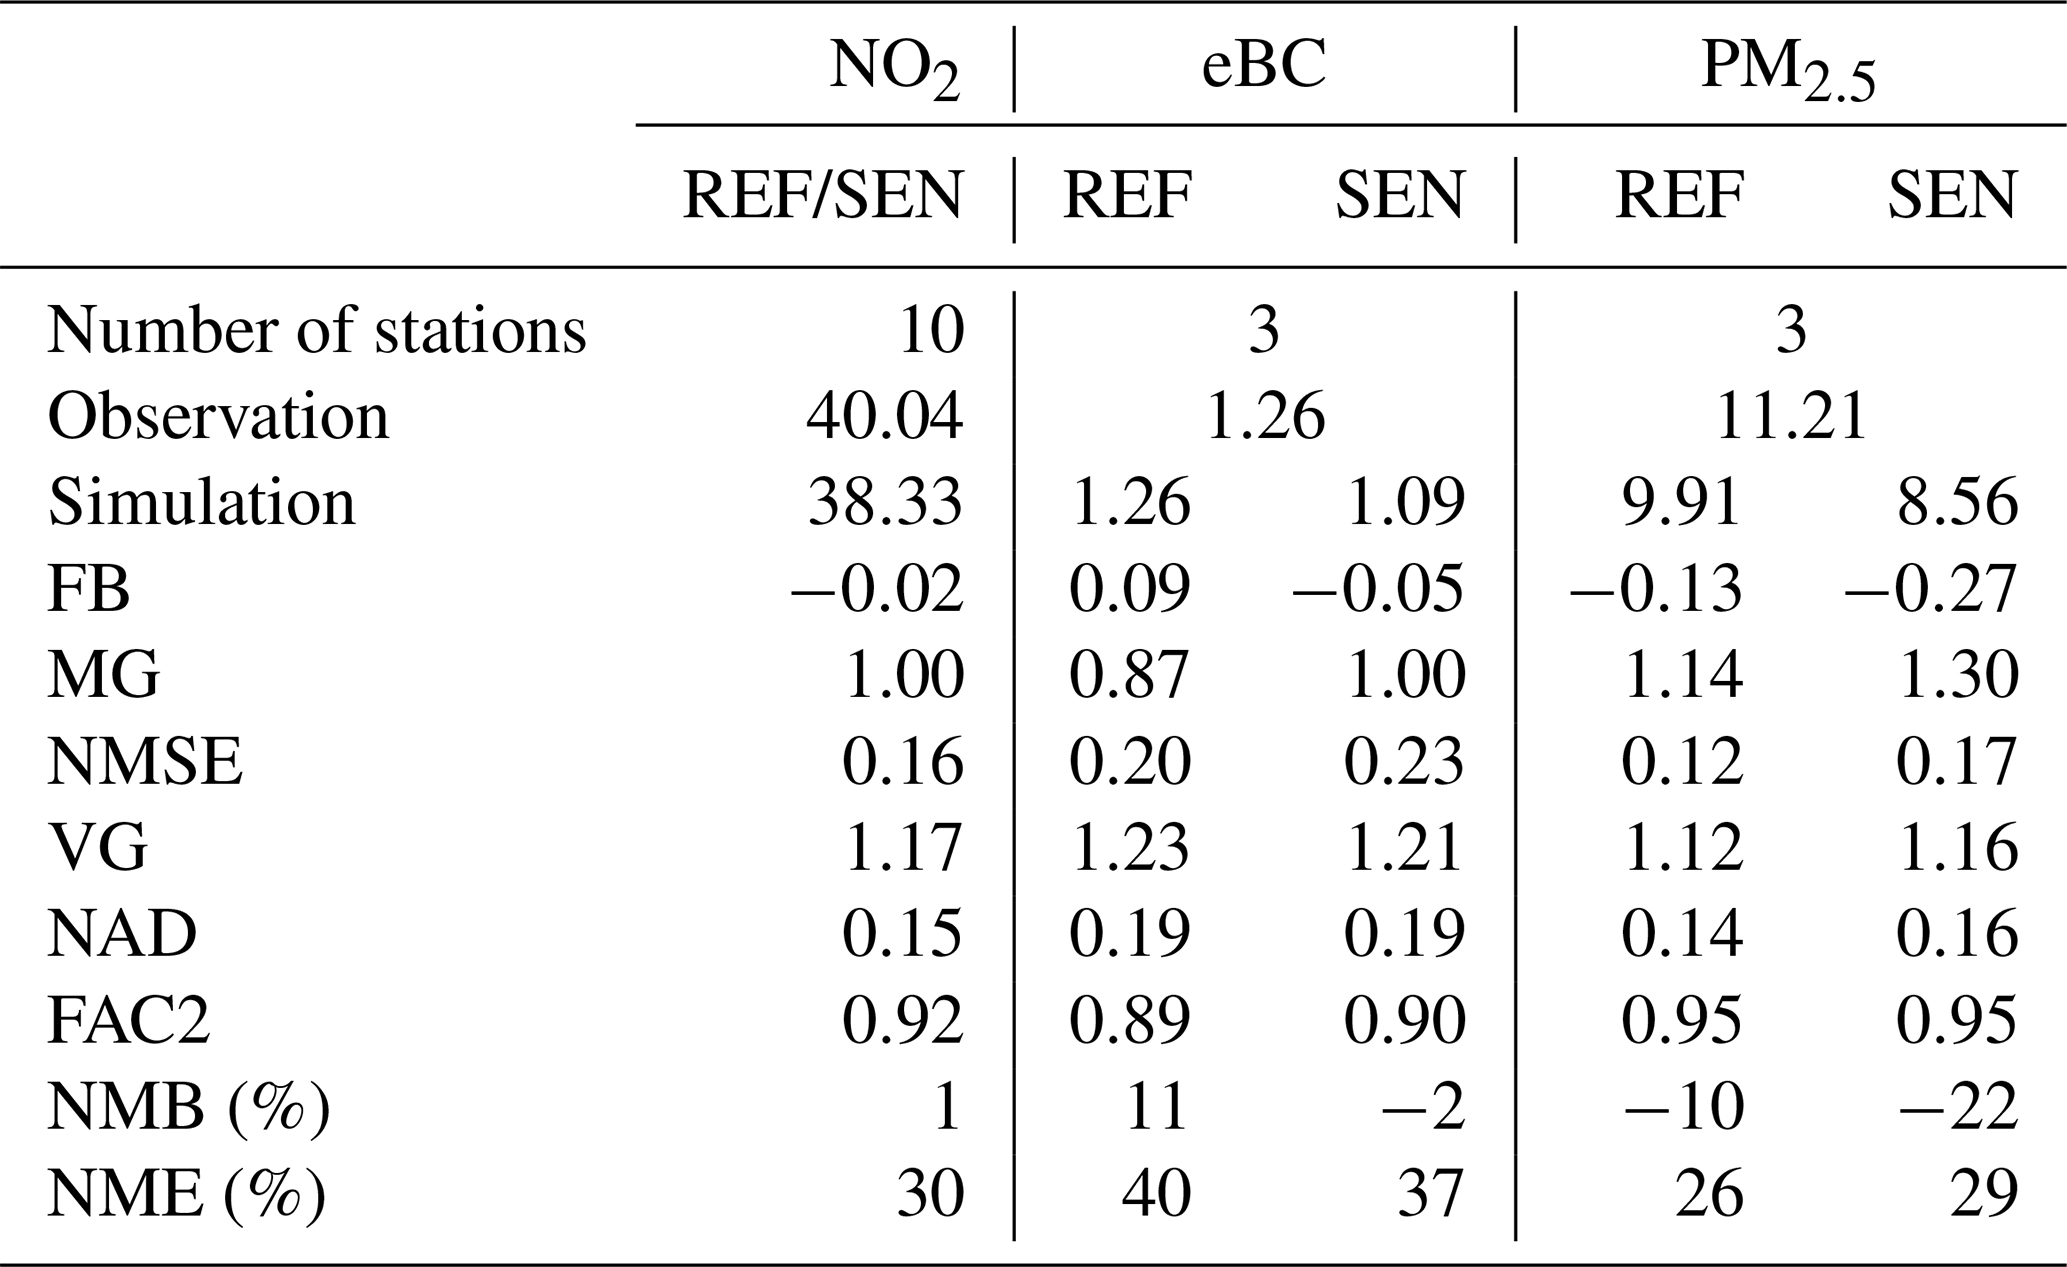
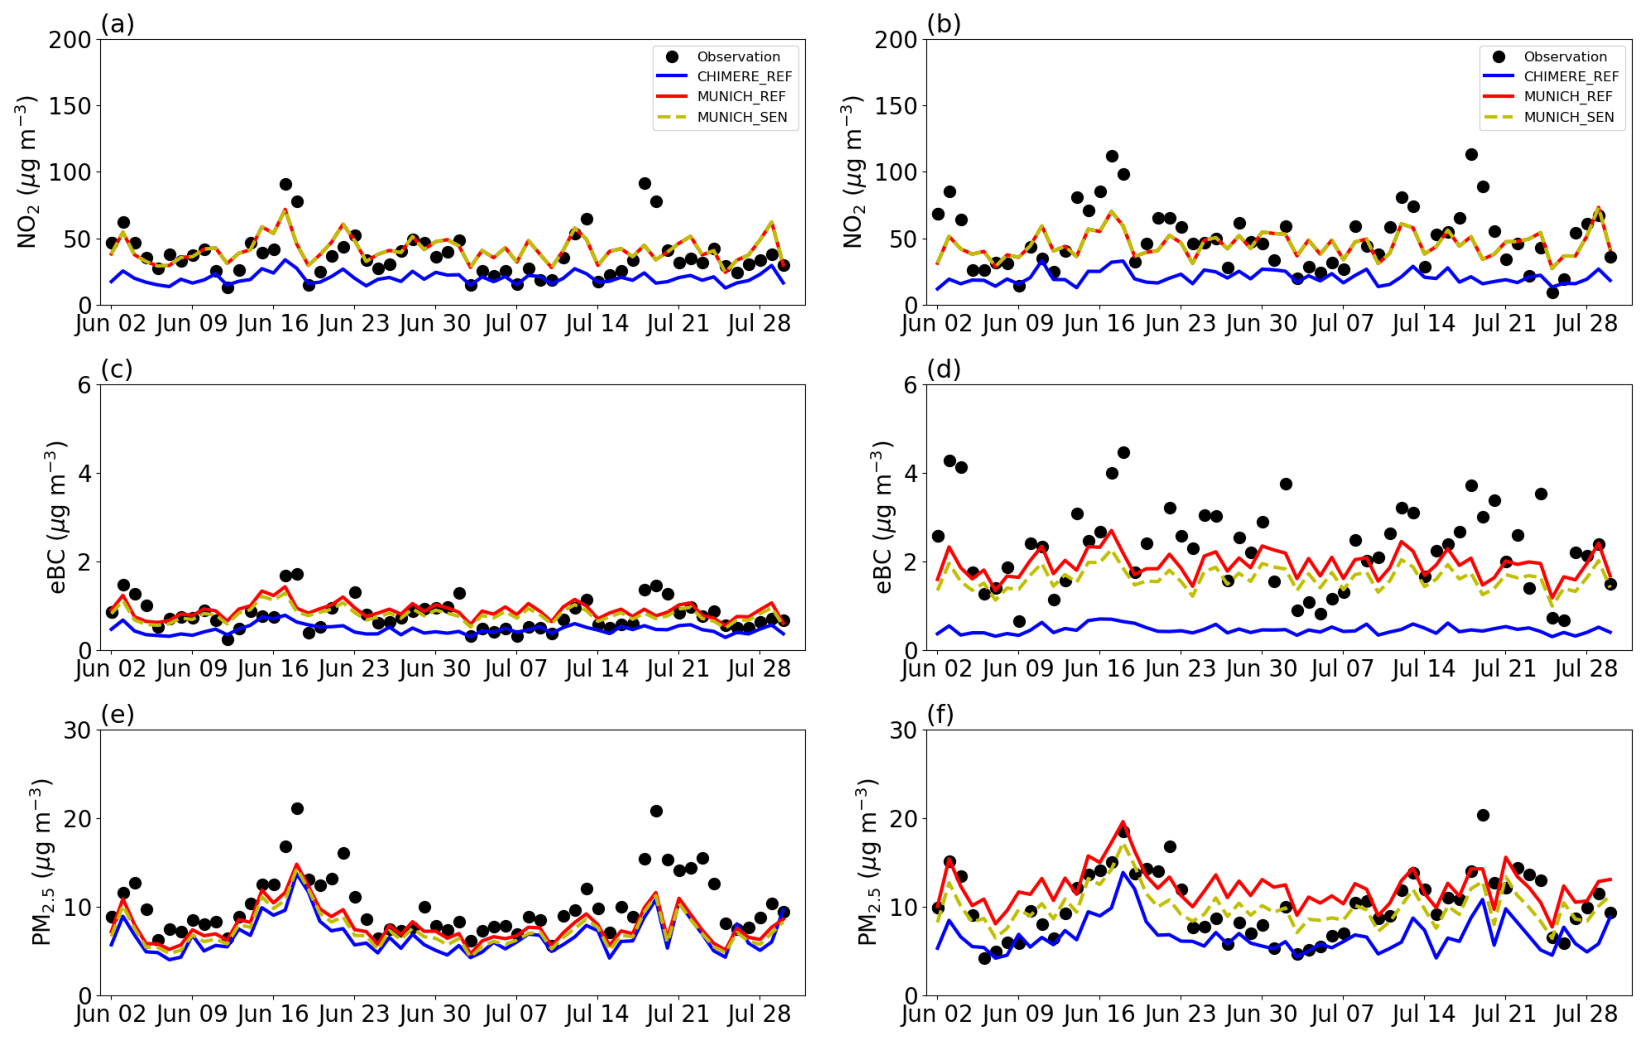
Figure 6Time series of measured and simulated NO2 (a, b), eBC (c, d), and PM2.5 (e, f) concentrations at the HAUSS (a, c, e) and BP_EST (b, d, f) stations.
3.3 Impact of the emission inventory over Greater Paris
The impacts of the emission inventory are investigated over Greater Paris. In the EMEP simulation, the NO2 concentrations are lower by about 15 % along the roads and airport than those in the REF simulation, due to higher traffic emissions using the bottom-up inventory than the EMEP one (Fig. C6). In contrast, NO2 concentrations in areas excluding roads are higher, by about 16 %, in the EMEP simulation. The concentrations of NO2, eBC, PM2.5, and PNC in the EMEP simulation are 12 %, 50 %, 7 %, and 38 % lower, respectively, for Paris compared to those in the REF simulation. The differences in the spatial distributions of eBC and PM2.5 concentrations are similar to those of NO2 concentrations, but the spatial differences are less pronounced than for NO2. In the eastern region of Greater Paris and the extreme north-west part of the region, PNCs are lower using EMEP than the bottom-up inventory, owing to lower emissions compared to other areas within the region.
Figure 7 shows the average NO2, eBC, PM2.5, and PNC in the REF simulation over Greater Paris with a zoomed-in view of Paris down to the street scale. The concentrations are the highest over the centre of Paris and in the main streets of Paris. The spatial gradients of concentrations are stronger for NO2, eBC, and PNC than for PM2.5. PM2.5 concentrations are highest over Paris, but high concentrations are also observed at different locations, such as over large woods, due to the formation of secondary organic aerosols. As the lifetime of PM2.5 is about a week (Seigneur, 2019), concentrations are relatively homogeneous and high all over Greater Paris. For NO2, eBC, and PNC, the concentrations are much higher in the main streets than in the urban background than in the suburban and rural areas. The concentrations' spatial gradients may strongly influence the estimation of the population exposure, as detailed in the next section.
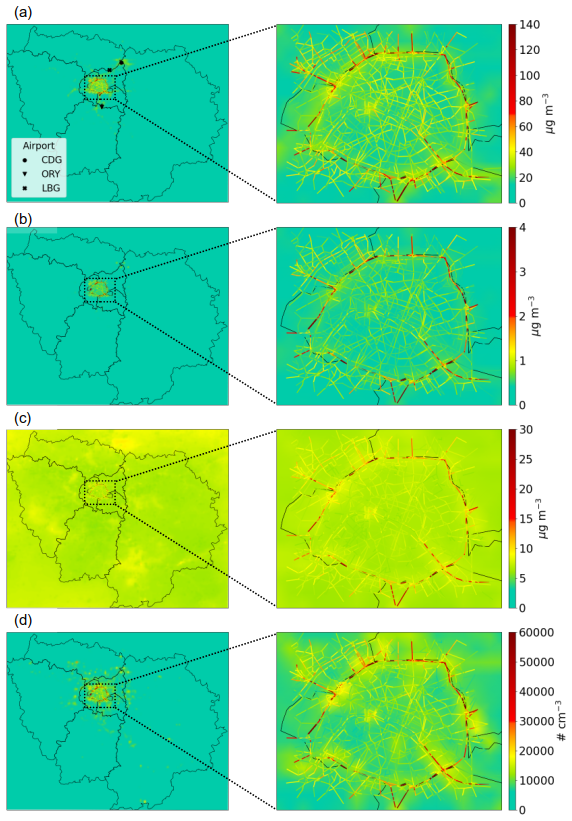
Figure 7Concentration distribution of the average (a) NO2, (b) eBC, (c) PM2.5, and (d) PNC over the period in the REF simulation.
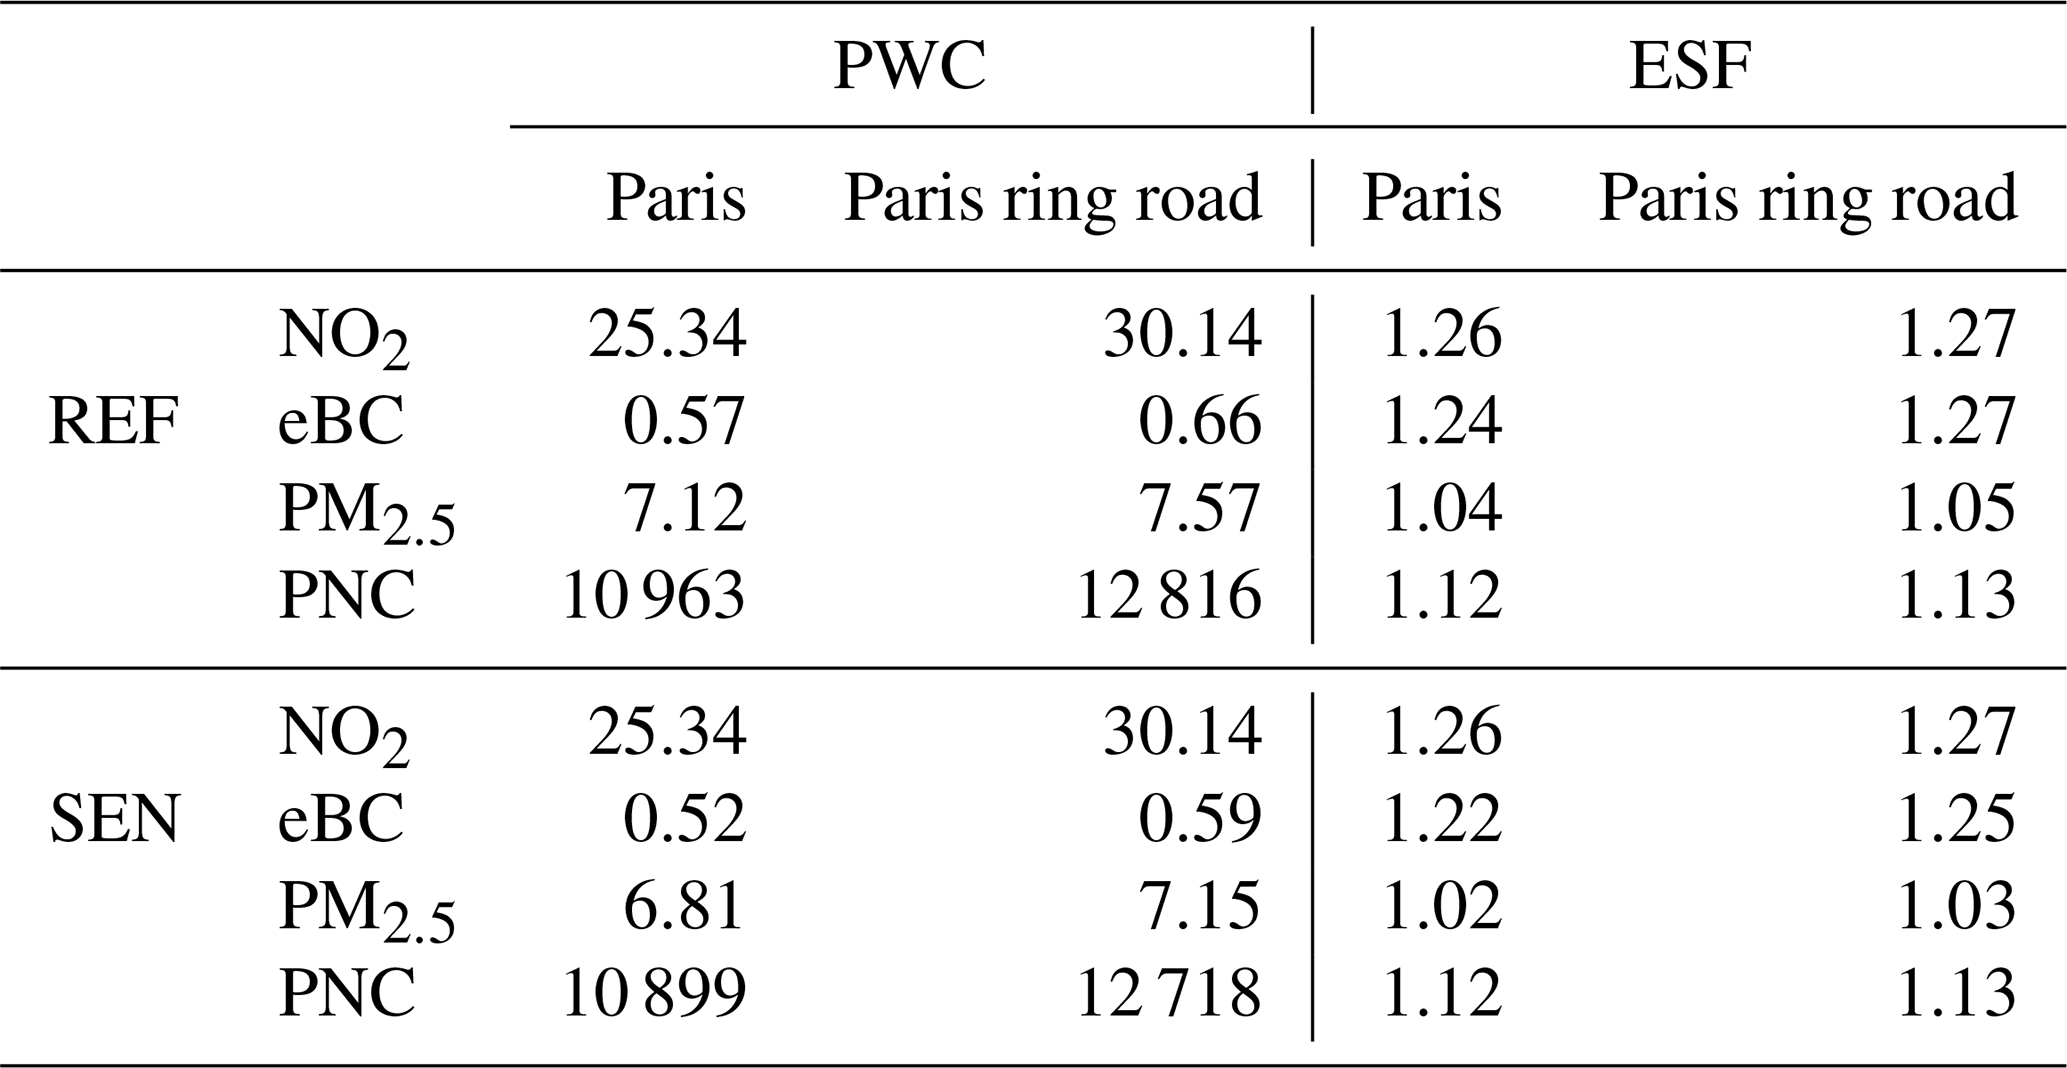
As population exposure may be underestimated using regional-scale modelling, the population-weighted concentration (PWC) and exposure scaling factor (ESF) are calculated for Paris using the multi-scale concentrations and the population data per building. The spatial distributions of PWC for NO2, eBC, PM2.5, and PNC are similar to their concentrations (Fig. 8); i.e. they have larger values in grid cells with main traffic roads. The average PWCs in Paris for NO2, eBC, PM2.5, and PNC are 25.3 µg m−3, 0.6 µg m−3, 7.1 µg m−3, and 10 963 cm−3 in the REF simulation, respectively (Table 4). The PWC for eBC, PM2.5, and PNC in the SEN simulation is lower than in the REF simulation. Elevated PWCs for NO2, eBC, PM2.5, and PNC are observed in heavy-traffic regions in both simulations.
The ESF is defined as the ratio of PWC to the regional-scale concentrations simulated by CHIMERE. The ESF is higher than 1 for all pollutants in most areas of Paris (Fig. 9). The average ESF over Paris is the highest for NO2, followed by eBC, PNC, and finally PM2.5 (Table 4). For PM2.5, the ESF is close to 1 in Paris (1.04 in the REF simulation and 1.02 in the SEN simulation) because of the low differences between regional- and local-scale concentrations (Fig. 7c). This suggests that the global Parisian population exposure is reasonably well modelled for PM2.5 using regional-scale modelling with 1 km2 resolution.
For NO2 and eBC, the ESF is about 1.25 in Paris, indicating that outdoor population exposure is underestimated by as much as 25 % in Paris urban areas when considering only regional-scale concentrations. For PNC, the ESF is slightly lower (1.12) in Paris. In heavy-traffic areas, such as in cells that include the very busy Paris ring road, the ESF varies from 1.27 for NO2 and 1.27 for eBC. The ESF is 1.05 for PM2.5 along the ring road, indicating that the population exposure is not well represented by regional-scale concentrations for people living next to very busy streets.
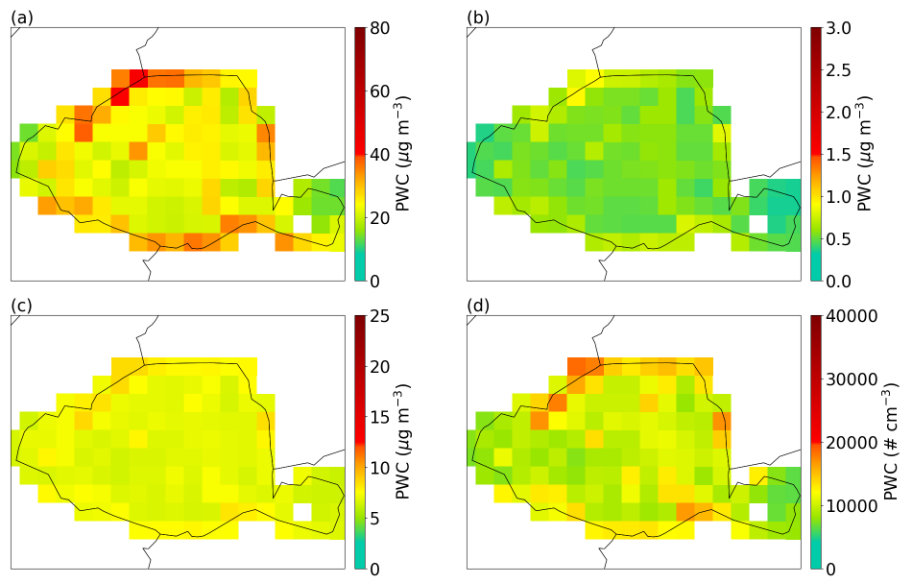
Figure 8PWC of (a) NO2, (b) eBC, (c) PM2.5, and (b) PNC in the REF simulation.
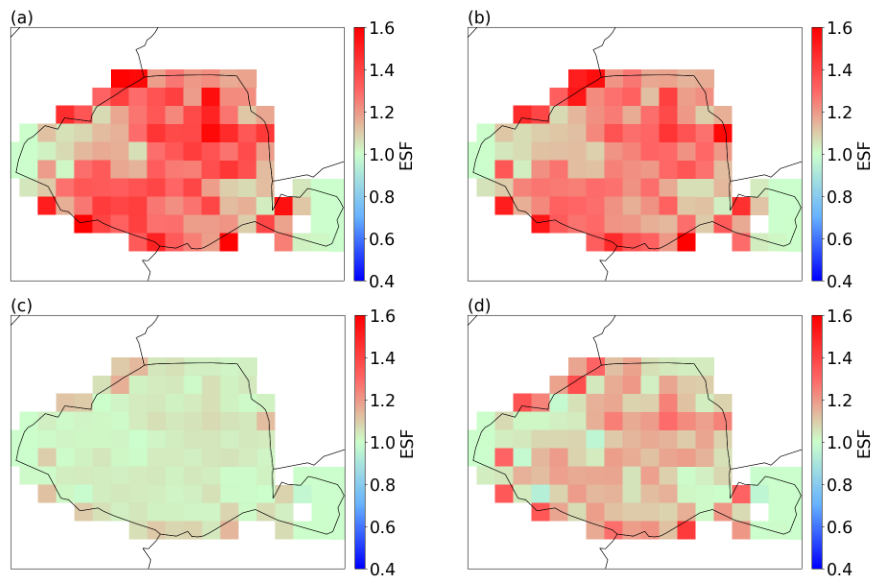
Figure 9The ESF of (a) NO2, (b) eBC, (c) PM2.5, and (b) PNC in the REF simulation.
Table 4Average PWC and ESF for NO2, eBC, PM2.5, and PNC over the period of simulation in Paris and the Paris ring road. PWC is in µg m−3 for NO2, BC, and PM2.5 and in cm−3 for PNC.
This study focuses on modelling pollutants of interest to health (NO2, BC, PM2.5, and PNC) and with high concentrations in urban areas, so as to represent the population's exposure to outdoor concentrations as accurately as possible. To do so, a multi-scale simulation is performed over Greater Paris and down to the street scale over Paris during the summer of 2022 using WRF-CHIMERE/MUNICH/SSH-aerosol. The regional-scale simulation provides a comprehensive representation of urban background concentrations but lacks the ability to estimate fine-scale concentrations. Conversely, the street-level simulation adopts a higher spatial resolution and provides more accurate concentration estimates, which are critical for assessing population exposure. The additional computational resources required for street-scale simulation are balanced by the improved accuracy in representing spatial variability, which is essential for effective urban air-quality management.
In the regional-scale modelling over Greater Paris, the use of two emission inventories was compared: the top-down inventory EMEP and the bottom-up inventory Airparif, with correction of the traffic flow using counting loops. The concentrations were evaluated compared to measurements using strict and less strict criteria from the literature. For regional-scale urban background concentrations, strict criteria are met for NO2, PM2.5, eBC, and PNC, although the statistics are better for NO2, eBC, and PNC using the bottom-up inventory than the top-down one. At the street scale, only the bottom-up inventory is used as it provides traffic emissions per street segments. By comparisons to observations at background and traffic station, the strict criteria are met for NO2, PM2.5, and eBC. As observed, the number of particles is higher on busy streets than in the urban background by a factor of between 1.8 and 3.
The concentrations of NO2, eBC, PM2.5, and PNC in Greater Paris are high in streets, particularly along the Paris ring road. Using the top-down inventory, the concentrations tend to be lower in streets than those simulated using the bottom-up inventory, especially for NO2 concentrations, resulting in fewer urban heterogeneities. Two estimations of the size distribution of non-exhaust emissions were compared. The impact on eBC and PM2.5 is relatively low at the regional scale, by at most a few percent. However, it is higher in heavy-traffic streets, leading to an average impact on the concentrations of eBC, PM2.5, and PNC by 9.5 %, 6.6 %, and 0.7 %, respectively.
Population exposure to outdoor concentrations is estimated for Paris by cross-referencing the MAJIC database, which gives the number of inhabitants in each building, with the multi-scale simulations. An exposure scaling factor (ESF) is then calculated to estimate the error made by using the 1 km2 resolved regional-scale concentrations to approximate outdoor concentrations. The ESF is the highest for eBC, followed by NO2, PNC, and finally PM2.5. The average ESF in Paris is higher than 1 for all pollutants, which indicates that the Parisian population exposure is underestimated using regional-scale concentrations. Although this underestimation is low for PM2.5, with an ESF of 1.04, it is very high for NO2 (1.26), eBC (1.24 in REF and 1.22 in SEN), and PNC (1.12). This shows that urban heterogeneities are important to be considered in order to realistically estimate the population exposure to NO2, eBC, and PNC.
Multi-scale simulations using bottom-up traffic emissions provide innovative and detailed spatially resolved air-quality information in urban areas. In particular, the ESF may be used to refine the evaluation of population exposure in urban areas employing regional-scale models. The methodologies and findings could be adapted to other major cities, with detailed street-scale emission inventory and street characteristics. This could be done, for example, by the continuation of the modelling with the MUNICH model in several cities (Sarica et al., 2023; Wang et al., 2023a; Cevolani et al., 2024). Further investigation is also needed to assess the concentrations and population exposure scaling factors for different seasons.
A1 List of abbreviations
| BC | Black carbon |
| eBC | Equivalent black carbon |
| PNC | Particle number concentration |
| LUR | Land-use regression |
| UFP | Ultrafine particle |
| REF | Reference simulation |
| SEN | Sensitivity simulation |
| PWC | Population-weighted concentration |
| ESF | Exposure scaling factor |
A2 Partitioning into two sections by conserving both mass and number
Let M and N be the mass and number concentration of particles contained in a section spanning the diameters d− to d+. We assume that M and N are related by
with the geometric mean diameter of the section boundaries.
The section defined by boundaries d− and d+ is partitioned into two new sections. For that purpose, we define a new diameter dm such that . The first section spans d− to dm with mass and number concentrations M1 and N1, while the second section spans dm to d+ with mass and number concentrations M2 and N2.
Assuming both mass and number conservation implies
Furthermore, we enforce a relation similar to Eq. (A1) for each section:
Since we have introduced five new variables (dm, M1, M2, N1, N2) and four new equations, we should be able to express mass and number concentrations in the partitions as a function of previous variables and dm.
Therefore,
and similarly
A3 Partitioning into n sections
We wish to upsample our initial section into n sections, defined by the boundaries such that for all . A more general relation for partitioning into n sections can be deduced by noticing that any subsection can be obtained by recursively performing at most two partitions of the whole diameter range.
Table A1Ratios employed in PM emissions to split the particle classes into different size sections. For each size section, dmin and dmax are the minimum and maximum bound diameters, respectively.

For the trivial case of the lowest and highest diameter sections, we only need one partitioning operation to deduce their concentrations:
For inner sections such that , two successive partitioning operations are necessary. Indeed, by splitting the full diameter range on the lowest diameter of our section of interest and successively splitting the new section on the highest diameter of our section of interest, we have managed to create a section with the boundaries we wished to enforce. The section composition can therefore be inferred.
Furthermore, one can easily check that Eq. (A15) also holds for i=1 and i=n.
A4 Partitioning into the 10 sections used here
With the size sections employed in this study and the methodology defined above, the ratios obtained to split emissions in each size section are indicated in Table A1.
B1 Non-traffic emissions
Anthropogenic emissions are provided for 10 different Standard Nomenclature for Air Pollution (SNAP) categories (Tagaris et al., 2015) for NOx, volatile organic compounds (VOCs), CO, SO2, CH4, PM2.5, and PM10. NOx is speciated as 90 % NO and 10 % NO2 for all non-traffic categories (Sartelet et al., 2012; Menut et al., 2021; Lugon et al., 2021a). The speciation of coarse and fine PM emissions follows the CAMS setup (Kuenen et al., 2022), and VOCs are speciated following Passant (2002). The emissions of condensables, i.e. the sum of intermediate-volatility, semi-volatile, and low-volatility organic compounds (IVOCs, SVOCs, and LVOCs, respectively), are estimated by multiplying primary organic matter emitted in each SNAP by 2.5 (Couvidat et al., 2012; Sartelet et al., 2018). Condensable emissions are then divided into volatility classes (32 % in IVOCs, 43 % in SVOCs, and 25 % in LVOCs).
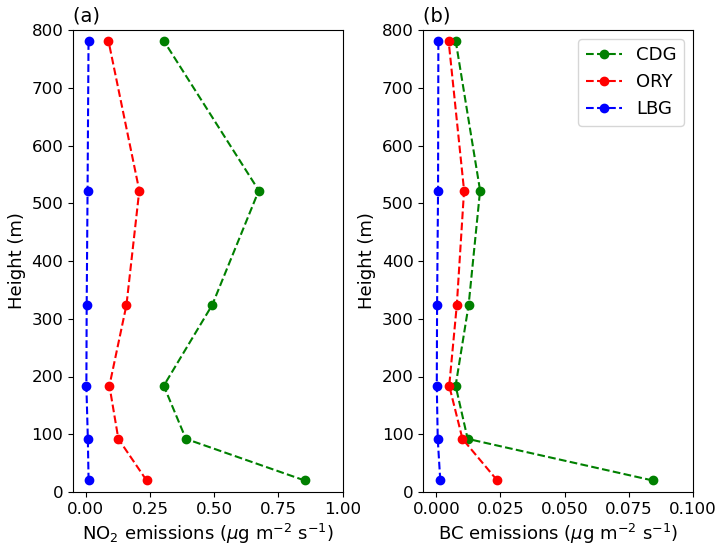
The vertical distribution of non-traffic emissions follows Bieser et al. (2011). In the Airparif inventory, a specific analysis was applied to determine the vertical profiles of plane emissions of NOx, PM, CO, SO2, and VOCs for the three airports (Charles-de-Gaulle (CDG), Paris-Orly (ORY), and Paris–Le Bourget (LBG)) located in Île-de-France (Fig. B1). The dataset used for this analysis was obtained from detailed information on flight trajectories for each airport. Specifically, the flight paths were represented as clouds of points in three dimensions (x, y, z), where the altitude (z) was rounded to the nearest 25 m. The emissions from each airport and pollutant were then summed up to determine the altitudes at which they were produced, and this information was used to create vertical profiles of emissions. These vertical profiles are used to distribute vertically the emissions on the CHIMERE vertical levels. Figure B1 shows the vertical NO2 and BC emissions profiles at the three airports. Note that the average NO2 (0.37 ) and BC (0.04 ) emissions at the lowest height near the airports are much lower than vehicle emissions of NO2 (1.65 ) and BC (0.08 ) averaged over Greater Paris.
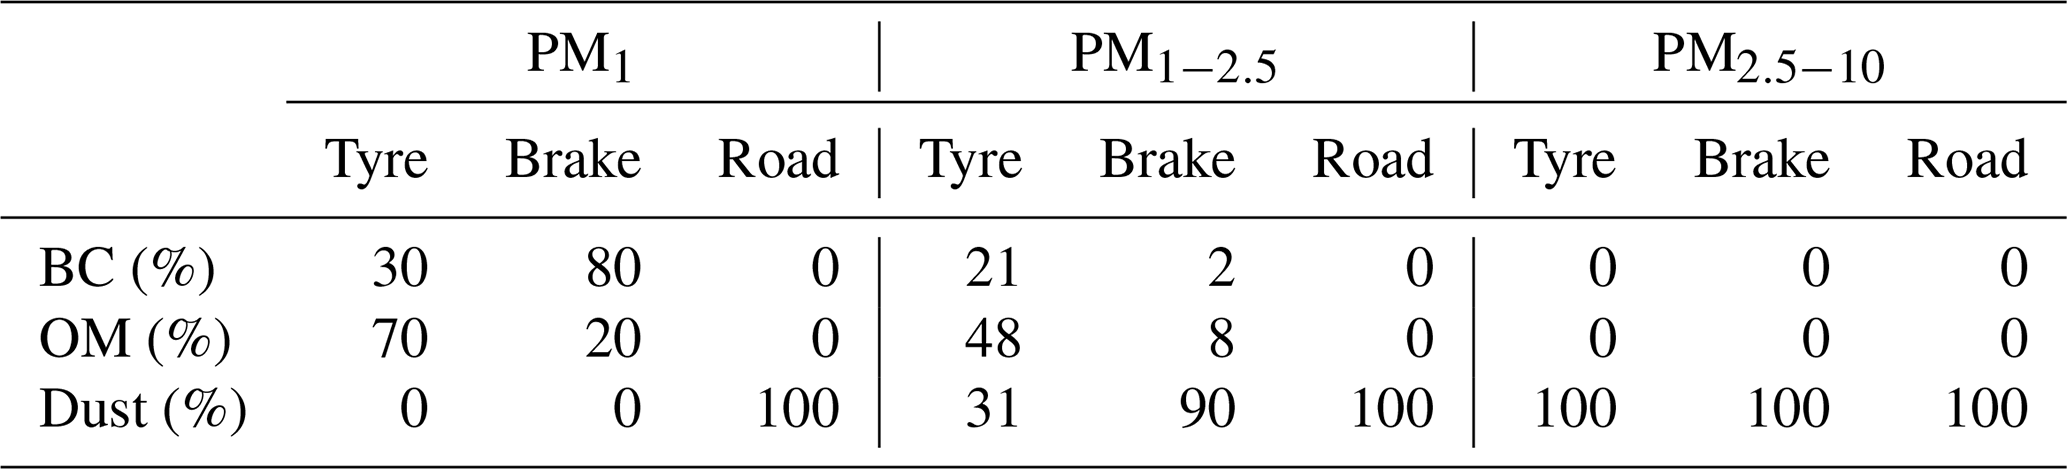
Table B1Chemical composition of particles emitted from traffic non-exhaust sources (Leonidas Ntziachristos et al., 2023a).
B2 Traffic emissions
The road traffic emissions data were calculated by Airparif using the HEAVEN system, originally developed in 2001 as part of the European project of the same name in partnership with the road traffic management departments of the city of Paris and the Direction Régionale de l'Equipement d'Ile-de-France. Since then, this system has been regularly updated on all its components: emission factors, vehicle fleets, traffic model, real-time counting, network, etc., in order to have the most recent information on vehicle emissions in the Paris region.
The traffic emissions are calculated hourly for each street and road segment for June and July 2022 over Île-de-France. The traffic emissions inventory was categorized based on emission types (combustion, tyre wear, road wear, brake wear, and evaporation), fuel types (electric, petrol, diesel, liquefied petroleum gas, and compressed natural gas), vehicle types, and Crit’Air classification. In France, the Crit'Air sticker classifies vehicles according to the fine particles and levels of nitrogen oxide that they emit. The vehicle types include passenger vehicles (VPs), utility vehicles (VUs), heavy vehicles (PLs), trailers (TCs), and two-wheeled vehicles (2Rs). The Crit'Air classification depends on the fuel type and the age of the vehicle, as determined from the European emission standards (Euro Norm), which are estimated from the information on fuel type and Crit'Air classification. Information about the different categories is used to speciate the emissions of the inventory.
The NOx emissions on each road are speciated into NO, NO2, and HONO, depending on the Euro Norm of the vehicles and using speciation from the EMEP guidelines (Leonidas Ntziachristos et al., 2023b). The average speciation into NO, NO2, and HONO for traffic exhaust emission is 88.5 %, 10.6 %, and 0.9 %, respectively. The traffic emissions of NO2 and BC are illustrated in Fig. C1. As expected, emissions are higher during rush hour. Also, NO2 and BC emissions at the BP_EST station, which is next to a heavy-traffic road, are higher than at the HAUSS station (city centre). In the city centre, NO2 emissions are clearly higher during weekdays than at the weekend.
The traffic PM emitted from combustion are assumed to be of diameters lower than 1 µm (PM1) and to be composed of organic matter (OM) and black carbon (BC). The OM BC ratios differ according to the vehicle fuel and follow the values proposed in Kostenidou et al. (2021): PM2.5 emissions are speciated as 75 % of BC and 25 % of OM for diesel and 25 % of BC and 75 % of OM for petrol and LPG. The traffic PM emitted from non-exhaust sources is speciated in OM, BC, and inert particles as described in the EMEP/EEA air pollutant emission inventory guidebook. The speciation of non-methane VOCs follows Theloke and Friedrich (2007), which defines different speciation for petrol- and diesel-powered vehicles. For traffic emissions, the emitted OM is assumed to correspond to LVOCs. IVOCs and SVOCs are speciated based on ratios of non-methane hydrocarbon emissions, which vary according to the vehicle fuel (Sarica et al., 2023).
The PM emitted from non-exhaust sources (tyre, brake, and road wear) is classified as fine (PM1, PM1−2.5) and coarse (PM2.5−10) particles. The particles are speciated according to the EMEP guideline (Leonidas Ntziachristos et al., 2023a), as detailed in Table B1.
Specifically for the simulations using the EMEP emission inventory, as no detailed information is available regarding exhaust and non-exhaust emissions, as well as vehicle categories, the CAMS traffic speciation is employed for PM, and NOx emissions are assumed to be 90 % of NO and 10 % of NO2. Also, the total IVOCs, SVOCs, and LVOCs are estimated by multiplying primary organic matter emitted from traffic by 2.5 (Couvidat et al., 2012; Sartelet et al., 2018). For traffic emissions, this total is split between 51 % of IVOCs, 14 % of SVOCs, and 35 % of LVOCs.
Although street-scale emissions are directly used as input of the street-network model MUNICH, emissions over Greater Paris are gridded; they are used as input of the CHIMERE model to simulate urban background concentrations.
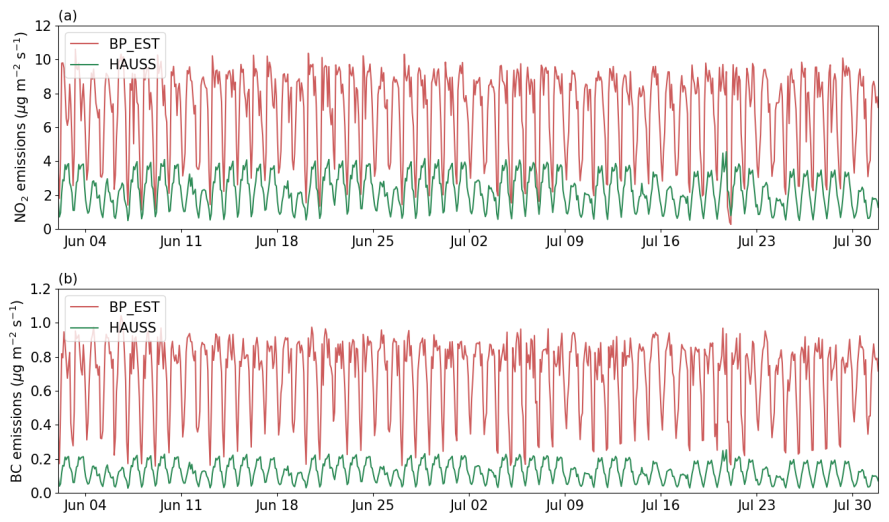
Figure C1Time series for (a) NO2 and (b) BC emissions at the HAUSS (city centre) and BP_EST (heavy-traffic) stations.
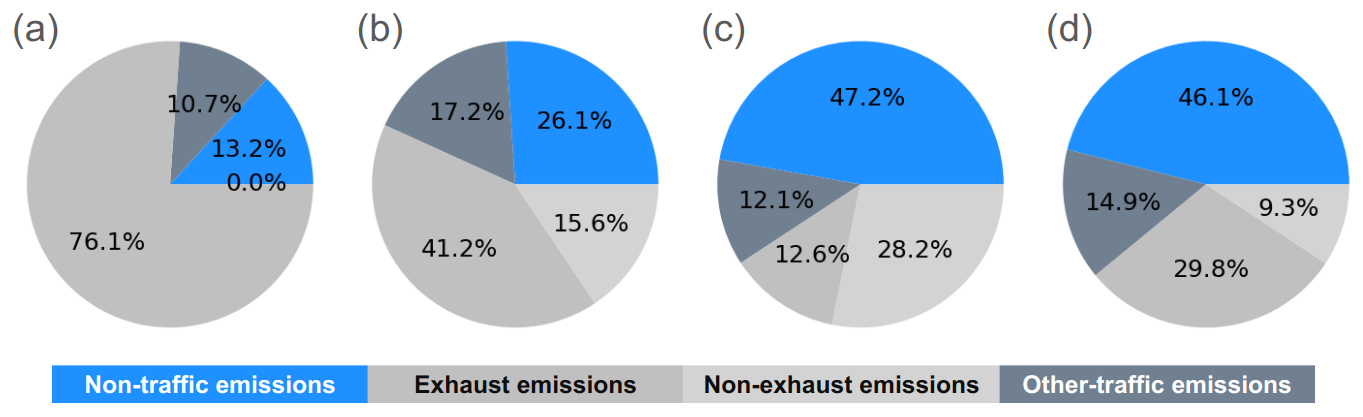
Figure C2Distribution between vehicular traffic (exhaust and non-exhaust), other traffic, and non-traffic emissions for NOx (a), BC (b), PM2.5 (c), and PNC (d) in Paris.
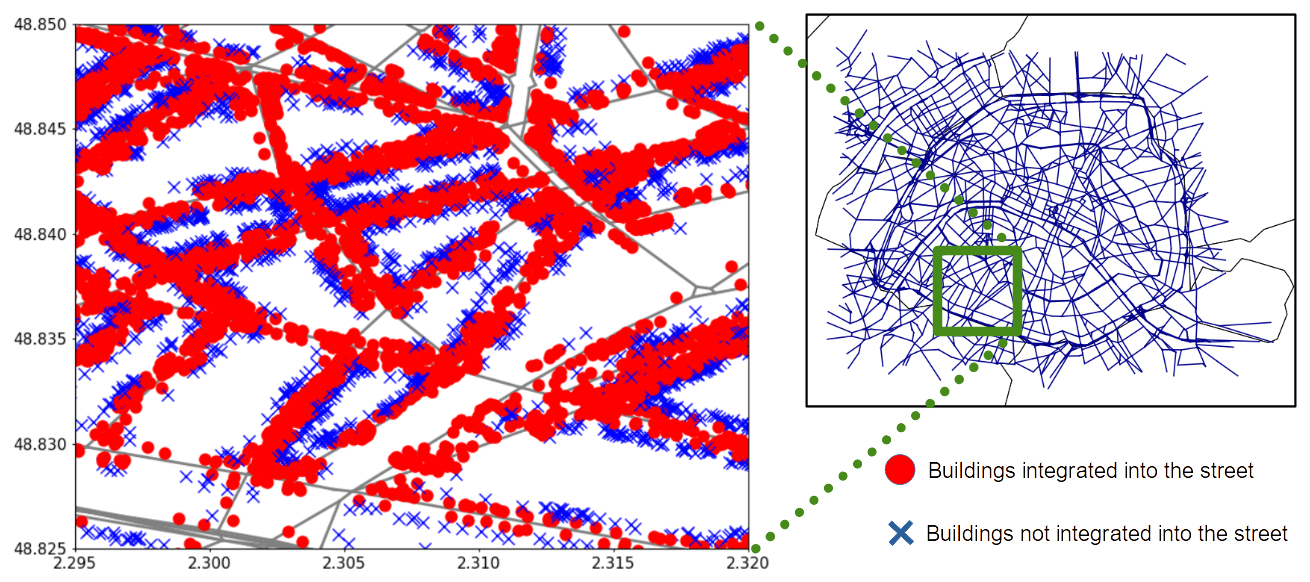
Figure C3The distribution of buildings according to their integration into the street. The red circles indicate buildings integrated into the street, while the blue crosses indicate buildings that are not integrated into the street.
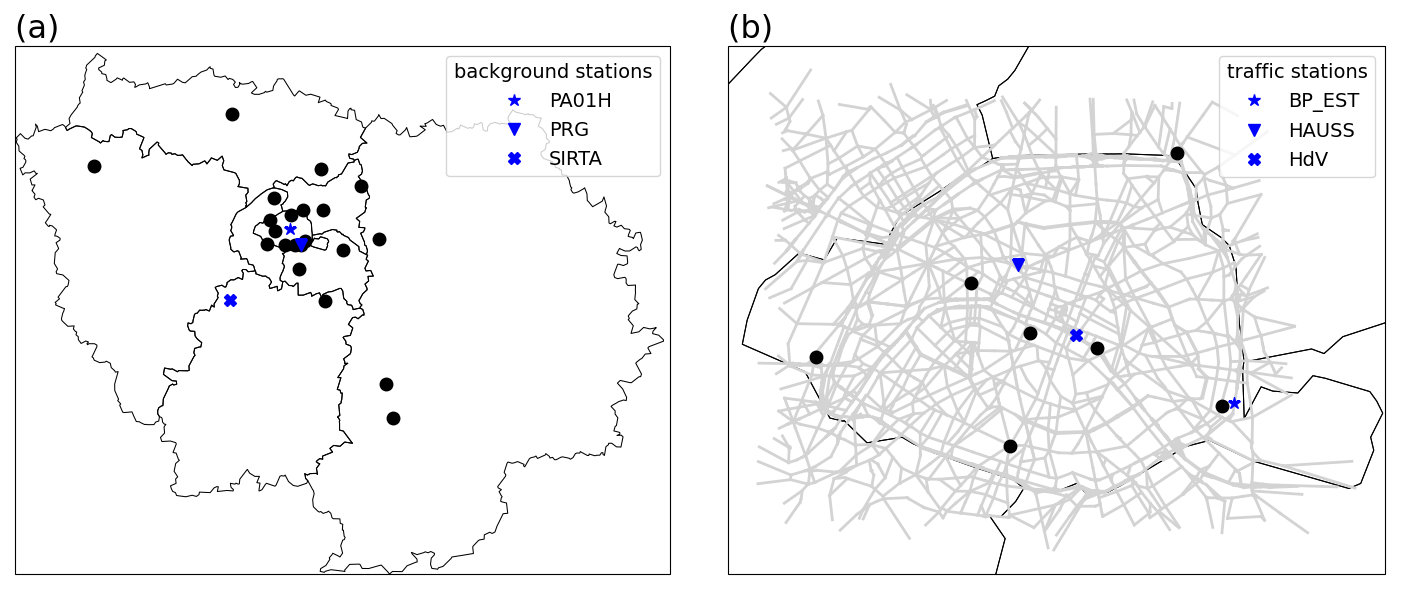
Figure C4(a) Urban background and (b) traffic stations. Black dots represent the other Airparif stations used in this study.
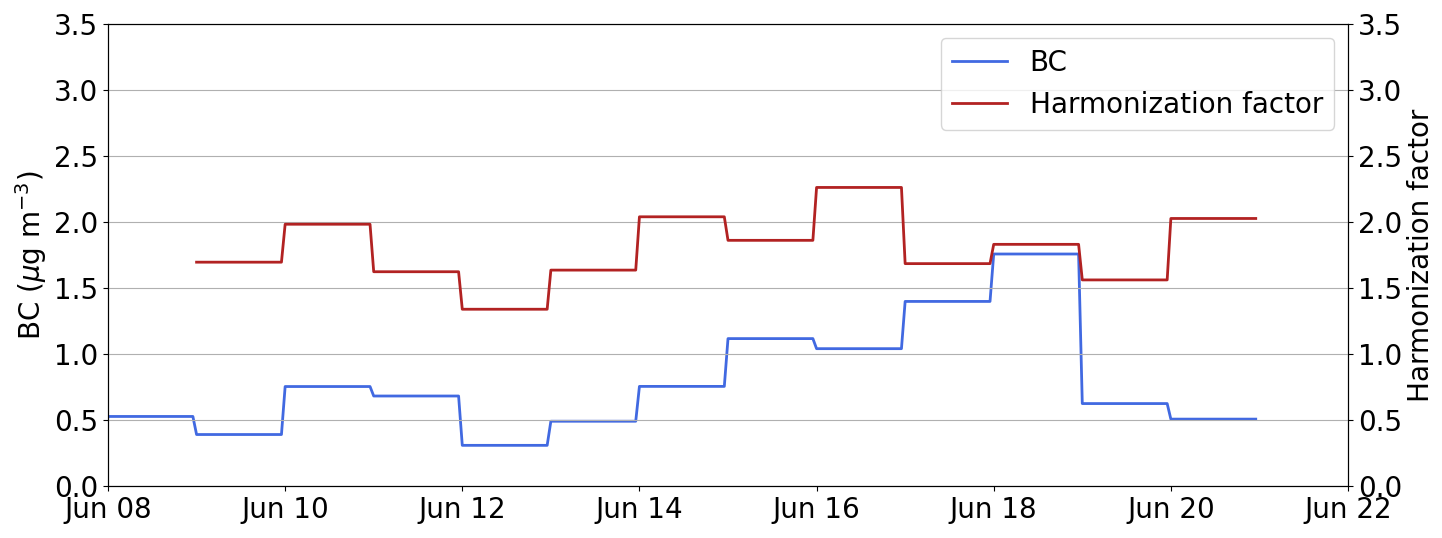
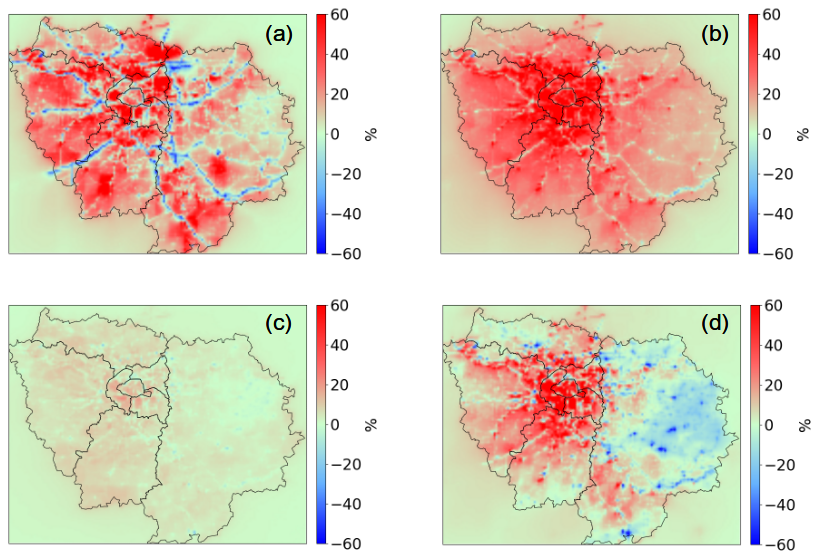
Figure C6Relative differences (%) in (a) NO2, (b) eBC, (b) PM2.5, and (d) PNC between the EMEP and REF simulations.
D1 Definitions
where O and S represent the observed and simulated concentrations, respectively.
The CHIMERE/MUNICH/SSH-aerosol chain used here is available online at https://doi.org/10.5281/zenodo.12639507 (Park et al., 2024).
Hourly NO2 and PM2.5 concentrations measured at the Airparif stations are available on the Airparif's Open Data Portal (AIRPARIF, 2025a, https://data-airparif-asso.opendata.arcgis.com/datasets/0da367910c13407288d75b5e2e93d11f/explore, last access: 17 March 2025; AIRPARIF, 2025b, https://data-airparif-asso.opendata.arcgis.com/datasets/7b7c1bcd091c417b827a5a4224bac04d/explore, last access: 17 March 2025). The regional emissions inventory, as well as hourly BC and PNC data for Paris Châtelet Les Halles, BP-EST, and HAUSS stations, is available on request. NO2 and BC hourly measurements at the HdV station are available on request. SMPS measurements at SIRTA during the ACROSS campaign can be found on the ACROSS data portal (https://across.aeris-data.fr/catalogue/?uuid=c0816808-e435-49ba-b256-b62e8157bab9; Dehsmukh, 2025). The SMPS data obtained at PRG by the SMPS are available from https://doi.org/10.25326/658 (Kammer et al., 2024) on the AERIS database.
The eBC data obtained at PRG by the AE33 are available at https://doi.org/10.25326/575 (Di Antonio et al., 2023) on the AERIS database (https://across.aeris-data.fr/catalogue/, last access: 17 March 2025).
The supplement related to this article is available online at https://doi.org/10.5194/acp-25-3363-2025-supplement.
SJP and LL prepared the input data for the CHIMERE/MUNICH model, LL and MV were responsible for the CHIMERE setup, and LL performed the CHIMERE simulations. SJP performed the MUNICH simulations. SJP, LL, and KS performed the formal analysis. JV, FD, and OS provided the regional and traffic emission inventory. OJ determined the formula to discretize the emission size distribution. SJP and YK were responsible for computing the population exposure. SJP and LL conducted the visualization. The experimental data were provided by AB and VG for the Airparif sites; by AG, CDB, LDA, BD'A, and JK for the PRG site; by JEP for SIRTA; and by JEP and OF for the HdV site. KS was responsible for the conceptualization, funding acquisition, and supervision. KS, SJP, and LL wrote the original draft, and all authors reviewed it.
The contact author has declared that none of the authors has any competing interests.
Publisher's note: Copernicus Publications remains neutral with regard to jurisdictional claims made in the text, published maps, institutional affiliations, or any other geographical representation in this paper. While Copernicus Publications makes every effort to include appropriate place names, the final responsibility lies with the authors.
This article is part of the special issue “Air quality research at street level – Part II (ACP/GMD inter-journal SI)”. It is not associated with a conference.
The authors would like to thank Laurent Letinois from INERIS (France) for providing the MAJIC database. The authors would like to thank Alice Maison for discussions on the computation of the Monin–Obukhov length; Matthieu Riva, Rulan Verma, and Sebastien Perrier from IRCELYON for nano-SMPS measurements at the PRG site; and Shravan Deshmukh and Laurent Poulain for SMPS measurements at the SIRTA site. We thank Vincent Michoud, Christopher Cantrell, and Jean-François Doussin for the ACROSS project conception and for the coordination of the experimental campaign. Contributions by Servanne Chevaillier, Cecile Gaimoz, Franck Maisonneuve, Mathieu Cazaunau, and Antonin Bergé to the experimental deployment at the PRG site are also acknowledged.
This project has received funding from the European Union's Horizon 2020 Research and Innovation programme (grant no. 101036245 (RI-URBANS)) and from the French Research project ENZU (Evolution of the Number of Particles in Urban areas) under the AQACIA/Ademe programme. BC measurements at the traffic station HdV benefited from the French state aid managed by the ANR under the “Investissements d'avenir” programme (grant no. ANR-11-IDEX-0004-17-EURE-0006), with support from IPSL/Composair. The measurements at the PRG site have been supported by the ACROSS project. The ACROSS project has received funding from the French National Research Agency (ANR) under the investment programme integrated into France 2030 (grant no. ANR-17-MPGA-0002), and it has been supported by the French national programme LEFE (Les Enveloppes Fluides et l'Environnement) of the CNRS/INSU (Centre National de la Recherche Scientifique/Institut National des Sciences de L'Univers). This project was provided with computer and storage resources by GENCI at TGCC courtesy of grant no. A0150114641 on the supercomputer Joliot-Curie's ROME partition.
This paper was edited by Chul Han Song and reviewed by two anonymous referees.
Abbou, G., Ghersi, V., Gaie-Levrel, F., Kauffmann, A., Reynaud, M., Debert, C., Quénel, P., and Baudic, A.: Ultrafine Particles Monitoring in Paris: From Total Number Concentrations to Size Distributions Measurements, Aer. Air. Qual. Res., 24, 240093, https://doi.org/10.4209/aaqr.240093, 2024. a
Adélaïde, L., Medina, S., Wagner, V., de Crouy-Chanel, P., Real, E., Colette, A., Couvidat, F., Bessagnet, B., Alter, M., Durou, A., Host, S., Hulin, M., Corso, M., and Pascal, M.: Covid-19 lockdown in spring 2020 in France provided unexpected opportunity to assess health impacts of falls in air pollution, Front. Sustain. Cities, 3, 643821, https://doi.org/10.3389/frsc.2021.643821, 2021. a
AIRPARIF: Campagne de mesure francilienne sur les particules ultrafines (PUF): Situation de proximité au traffic router été 2021, AIRPARIF reports, https://www.airparif.fr/sites/default/files/document_publication/Rapport_PUF_Trafic_ete_2021.pdf (last access: 17 March 2025), 2022. a, b
AIRPARIF: Données NO2 pour l'année 2022, AIRPARIF [data set], https://data-airparif-asso.opendata.arcgis.com/datasets/0da367910c13407288d75b5e2e93d11f/explore, last access: 17 March 2025a. a
AIRPARIF: Données PM25 pour l'année 2022, https://data-airparif-asso.opendata.arcgis.com/datasets/7b7c1bcd091c417b827a5a4224bac04d/explore, AIRPARIF [data set], last access: 17 March 2025b. a
Andre, M., Sartelet, K., Moukhtar, S., Andre, J., and Redaelli, M.: Diesel, petrol or electric vehicles: What choices to improve urban air quality in the Ile-de-France region? A simulation platform and case study, Atmos. Environ., 241, 117752, https://doi.org/10.1016/j.atmosenv.2020.117752, 2020. a, b
Arino, O., Gross, D., Ranera, F., Leroy, M., Bicheron, P., Brockman, C., Defourny, P., Vancutsem, C., Achard, F., Durieux, L., Plummer, S., and Weber, J.-L.: GlobCover: ESA service for global land cover from MERIS, in: 2007 IEEE International Geoscience and Remote Sensing Symposium, 23–28 July 2007, Piscataway (United States of America), 2412–2415, IEEE, 2007. a
Bieser, J., Aulinger, A., Matthias, V., Quante, M., and Van Der Gon, H. D.: Vertical emission profiles for Europe based on plume rise calculations, Environ. Pollut., 159, 2935–2946, 2011. a
Bouma, F., Janssen, N. A., Wesseling, J., van Ratingen, S., Strak, M., Kerckhoffs, J., Gehring, U., Hendricx, W., de Hoogh, K., Vermeulen, R., and Hoek, G.: Long-term exposure to ultrafine particles and natural and cause-specific mortality, Environ. Int., 175, 107960, https://doi.org/10.1016/j.envint.2023.107960, 2023. a
Cantrell, C. and Michoud, V.: An experiment to study atmospheric oxidation chemistry and physics of mixed Anthropogenic–Biogenic air masses in the Greater Paris area, B. Am. Meteorol. Soc., 103, 599–603, https://doi.org/10.1175/BAMS-D-21-0115.1, 2022. a
Cevolani, K. T., Lugon, L., Goulart, E. V., and Santos, J. M.: Influence of distinct mobility scenarios on NO2, PM2.5 and PM10 street-level concentrations. A case study in a Brazilian urban neighborhood, Atmos. Pollut. Res., 15, 102126, https://doi.org/10.1016/j.apr.2024.102126, 2024. a
Couvidat, F., Debry, É., Sartelet, K., and Seigneur, C.: A hydrophilic/hydrophobic organic (H2O) aerosol model: Development, evaluation and sensitivity analysis, J. Geophys. Res.-Atmos., 117, 1R, https://doi.org/10.1029/2011JD017214, 2012. a, b
Dall'Osto, M., Querol, X., Alastuey, A., O'Dowd, C., Harrison, R. M., Wenger, J., and Gómez-Moreno, F. J.: On the spatial distribution and evolution of ultrafine particles in Barcelona, Atmos. Chem. Phys., 13, 741–759, https://doi.org/10.5194/acp-13-741-2013, 2013. a
Dehsmukh, S.: ACROSS_LSCE_SIRTA_MPSS_L2, ACROSS [data set], https://across.aeris-data.fr/catalogue/?uuid=c0816808-e435-49ba-b256-b62e8157bab9, last access: 17 March 2025. a
Denby, B., Sundvor, I., Johansson, C., Pirjola, L., Ketzel, M., Norman, M., Kupiainen, K., Gustafsson, M., Blomqvist, G., and Omstedt, G.: A coupled road dust and surface moisture model to predict non-exhaust road traffic induced particle emissions (NORTRIP). Part 1: Road dust loading and suspension modelling, Atmos. Environ., 77, 283–300, https://doi.org/10.1016/j.atmosenv.2013.04.069, 2013. a
Di Antonio, L., Di Biagio, C., and Gratien, A.: ACROSS_LISA_PRG_AETH-eBC_PM1_1-Min_L2, Aeris [data set], https://doi.org/10.25326/575, 2023. a
Drinovec, L., Močnik, G., Zotter, P., Prévôt, A. S. H., Ruckstuhl, C., Coz, E., Rupakheti, M., Sciare, J., Müller, T., Wiedensohler, A., and Hansen, A. D. A.: The “dual-spot” Aethalometer: an improved measurement of aerosol black carbon with real-time loading compensation, Atmos. Meas. Tech., 8, 1965–1979, https://doi.org/10.5194/amt-8-1965-2015, 2015. a
EEA Geospatial Data Catalogue: CORINE Land Cover 2018 (vector), Europe, 6-yearly – version 2020_20u1, May 2020, EEA [data set], https://doi.org/10.2909/71c95a07-e296-44fc-b22b-415f42acfdf0, 2019. a
Elessa Etuman, A., Coll, I., Viguié, V., Coulombel, N., and Gallez, C.: Exploring urban planning as a lever for emission and exposure control: Analysis of master plan actions over greater Paris, Atmos. Environ.-X, 22, 100250, https://doi.org/10.1016/j.aeaoa.2024.100250, 2024. a
Fu, X., Xiang, S., Liu, J., Yu, J., Mauzerall, D., and Tao, S.: High-resolution simulation of local traffic-related NOx dispersion and distribution in a complex urban terrain, Environ. Pollut, 263, 114390, https://doi.org/10.1016/j.envpol.2020.114390, 2020. a
Goobie, G., Saha, P., Carlsten, C., Gibson, K., Johannson, K., Kass, D., Ryerson, C., Zhang, Y., Robinson, A., Presto, A., and Nouraie, S.: Ambient ultrafine particulate matter and clinical outcomes in fibrotic interstitial lung disease, Am. J. Respir. Crit. Care Med., 209, 1082–1090, https://doi.org/10.1164/rccm.202307-1275OC, 2024. a
Guenther, A. B., Jiang, X., Heald, C. L., Sakulyanontvittaya, T., Duhl, T., Emmons, L. K., and Wang, X.: The Model of Emissions of Gases and Aerosols from Nature version 2.1 (MEGAN2.1): an extended and updated framework for modeling biogenic emissions, Geosci. Model Dev., 5, 1471–1492, https://doi.org/10.5194/gmd-5-1471-2012, 2012. a
Guevara, M., Lopez-Aparicio, S., Cuvelier, C., Tarrason, L., Clappier, A., and Thunis, P.: A benchmarking tool to screen and compare bottom-up and top-down atmospheric emission inventories, Air. Qual. Atmos. Health, 10, 627–642, https://doi.org/10.1007/s11869-016-0456-6, 2016. a, b
El Haddad, I., Vienneau, D., Daellenbach, K. R., Modini, R., Slowik, J. G., Upadhyay, A., Vasilakos, P. N., Bell, D., de Hoogh, K., and Prevot, A. S. H.: Opinion: How will advances in aerosol science inform our understanding of the health impacts of outdoor particulate pollution?, Atmos. Chem. Phys., 24, 11981–12011, https://doi.org/10.5194/acp-24-11981-2024, 2024. a
Haeffelin, M., Barthès, L., Bock, O., Boitel, C., Bony, S., Bouniol, D., Chepfer, H., Chiriaco, M., Cuesta, J., Delanoë, J., Drobinski, P., Dufresne, J.-L., Flamant, C., Grall, M., Hodzic, A., Hourdin, F., Lapouge, F., Lemaître, Y., Mathieu, A., Morille, Y., Naud, C., Noël, V., O'Hirok, W., Pelon, J., Pietras, C., Protat, A., Romand, B., Scialom, G., and Vautard, R.: SIRTA, a ground-based atmospheric observatory for cloud and aerosol research, Ann. Geophys., 23, 253–275, https://doi.org/10.5194/angeo-23-253-2005, 2005. a
Hanna, S. R. and Chang, J. C.: Acceptance criteria for urban dispersion model evaluation, Meteorol. Atmos. Phys., 116, 133–146, https://doi.org/10.1007/s00703-011-0177-1, 2012. a
Herring, S. and Huq, P.: A review of methodology for evaluating the performance of atmospheric transport and dispersion models and suggested protocol for providing more informative results, Fluids, 3, 20, https://doi.org/10.3390/fluids3010020, 2018. a
Hoek, G., Vienneau, D., and Hoogh, K.: Does residential address-based exposure assessment for outdoor air pollution lead to bias in epidemiological studies?, Environ. Health, 23, 75, https://doi.org/10.1186/s12940-024-01111-0, 2024. a
Holnicki, P., Nahorski, Z., and Kaluszko, A.: Impact of vehicle fleet modernization on the traffic-originated air pollution in an urban area – a case study, Atmosphere, 12, 1581, https://doi.org/10.3390/atmos12121581, 2021. a
Hood, C., MacKenzie, I., Stocker, J., Johnson, K., Carruthers, D., Vieno, M., and Doherty, R.: Air quality simulations for London using a coupled regional-to-local modelling system, Atmos. Chem. Phys., 18, 11221–11245, https://doi.org/10.5194/acp-18-11221-2018, 2018. a
Inness, A., Ades, M., Agustí-Panareda, A., Barré, J., Benedictow, A., Blechschmidt, A.-M., Dominguez, J. J., Engelen, R., Eskes, H., Flemming, J., Huijnen, V., Jones, L., Kipling, Z., Massart, S., Parrington, M., Peuch, V.-H., Razinger, M., Remy, S., Schulz, M., and Suttie, M.: The CAMS reanalysis of atmospheric composition, Atmos. Chem. Phys., 19, 3515–3556, https://doi.org/10.5194/acp-19-3515-2019, 2019. a
Jereb, B., Gajšek, B., Šipek, G., Kovše, Š., and Obrecht, M.: Traffic density-related black carbon distribution: Impact of wind in a Basin town, Int. J. Env. Res. Pub. Health, 18, 6490, https://doi.org/10.3390/ijerph18126490, 2021. a
Jia, H., Pan, J., Huo, J., Fu, Q., Duan, Y., Lin, Y., Hu, X., and Cheng, J.: Atmospheric black carbon in urban and traffic areas in Shanghai: Temporal variations, source characteristics, and population exposure, Environ. Pollut, 289, 117868, https://doi.org/10.1016/j.envpol.2021.117868, 2021. a
Kamińska, J., Turek, T., Van Popple, M., Peters, J., Hofman, J., and Kazak, J.: Whether cycling around the city is in fact healthy in the light of air quality – Results of black carbon, J. Environ. Manage., 337, 117694, https://doi.org/10.1016/j.jenvman.2023.117694, 2023. a
Kammer, J., SHAHIN, M., D'Anna, B., and Temime-Roussel, B.: ACROSS_LCE_PRG_SMPS_5 min_L2, Aeris [data set], https://doi.org/10.25326/658, 2024. a
Karl, M., Walker, S.-E., Solberg, S., and Ramacher, M. O. P.: The Eulerian urban dispersion model EPISODE – Part 2: Extensions to the source dispersion and photochemistry for EPISODE–CityChem v1.2 and its application to the city of Hamburg, Geosci. Model Dev., 12, 3357–3399, https://doi.org/10.5194/gmd-12-3357-2019, 2019. a, b
Ketzel, M., Frohn, L., Christensen, J. H., Brandt, J., Massling, A., Andersen, C., Im, U., Jensen, S. S., Khan, J., Nielsen, O.-K., Plejdrup, M. S., Manders, A., Denier van der Gon, H., Kumar, P., and Raaschou-Nielsen, O.: Modelling ultrafine particle number concentrations at address resolution in Denmark from 1979 to 2018 – Part 2: Local and street scale modelling and evaluation, Atmos. Environ., 264, 118633, https://doi.org/10.1016/j.atmosenv.2021.118633, 2021. a, b
Kim, Y., Wu, Y., Seigneur, C., and Roustan, Y.: Multi-scale modeling of urban air pollution: development and application of a Street-in-Grid model (v1.0) by coupling MUNICH (v1.0) and Polair3D (v1.8.1), Geosci. Model Dev., 11, 611–629, https://doi.org/10.5194/gmd-11-611-2018, 2018. a
Kim, Y., Lugon, L., Maison, A., Sarica, T., Roustan, Y., Valari, M., Zhang, Y., André, M., and Sartelet, K.: MUNICH v2.0: a street-network model coupled with SSH-aerosol (v1.2) for multi-pollutant modelling, Geosci. Model Dev., 15, 7371–7396, https://doi.org/10.5194/gmd-15-7371-2022, 2022. a, b, c, d, e
Kostenidou, E., Martinez-Valiente, A., R'Mili, B., Marques, B., Temime-Roussel, B., Durand, A., André, M., Liu, Y., Louis, C., Vansevenant, B., Ferry, D., Laffon, C., Parent, P., and D'Anna, B.: Technical note: Emission factors, chemical composition, and morphology of particles emitted from Euro 5 diesel and gasoline light-duty vehicles during transient cycles, Atmos. Chem. Phys., 21, 4779–4796, https://doi.org/10.5194/acp-21-4779-2021, 2021. a
Kuenen, J., Dellaert, S., Visschedijk, A., Jalkanen, J.-P., Super, I., and Denier van der Gon, H.: CAMS-REG-v4: a state-of-the-art high-resolution European emission inventory for air quality modelling, Earth Syst. Sci. Data, 14, 491–515, https://doi.org/10.5194/essd-14-491-2022, 2022. a
Kukkonen, J., Karl, M., Keuken, M. P., Denier van der Gon, H. A. C., Denby, B. R., Singh, V., Douros, J., Manders, A., Samaras, Z., Moussiopoulos, N., Jonkers, S., Aarnio, M., Karppinen, A., Kangas, L., Lützenkirchen, S., Petäjä, T., Vouitsis, I., and Sokhi, R. S.: Modelling the dispersion of particle numbers in five European cities, Geosci. Model Dev., 9, 451–478, https://doi.org/10.5194/gmd-9-451-2016, 2016. a, b
Kuklinska, K., Wolska, L., and Namiesnik, J.: Air quality policy in the U.S. and the EU and – a review, Atmos. Poll. Res., 6, 129–137, https://doi.org/10.5094/APR.2015.015, 2015. a
Kulmala, M., Asmi, A., Lappalainen, H. K., Baltensperger, U., Brenguier, J.-L., Facchini, M. C., Hansson, H.-C., Hov, Ø., O'Dowd, C. D., Pöschl, U., Wiedensohler, A., Boers, R., Boucher, O., de Leeuw, G., Denier van der Gon, H. A. C., Feichter, J., Krejci, R., Laj, P., Lihavainen, H., Lohmann, U., McFiggans, G., Mentel, T., Pilinis, C., Riipinen, I., Schulz, M., Stohl, A., Swietlicki, E., Vignati, E., Alves, C., Amann, M., Ammann, M., Arabas, S., Artaxo, P., Baars, H., Beddows, D. C. S., Bergström, R., Beukes, J. P., Bilde, M., Burkhart, J. F., Canonaco, F., Clegg, S. L., Coe, H., Crumeyrolle, S., D'Anna, B., Decesari, S., Gilardoni, S., Fischer, M., Fjaeraa, A. M., Fountoukis, C., George, C., Gomes, L., Halloran, P., Hamburger, T., Harrison, R. M., Herrmann, H., Hoffmann, T., Hoose, C., Hu, M., Hyvärinen, A., Hõrrak, U., Iinuma, Y., Iversen, T., Josipovic, M., Kanakidou, M., Kiendler-Scharr, A., Kirkevåg, A., Kiss, G., Klimont, Z., Kolmonen, P., Komppula, M., Kristjánsson, J.-E., Laakso, L., Laaksonen, A., Labonnote, L., Lanz, V. A., Lehtinen, K. E. J., Rizzo, L. V., Makkonen, R., Manninen, H. E., McMeeking, G., Merikanto, J., Minikin, A., Mirme, S., Morgan, W. T., Nemitz, E., O'Donnell, D., Panwar, T. S., Pawlowska, H., Petzold, A., Pienaar, J. J., Pio, C., Plass-Duelmer, C., Prévôt, A. S. H., Pryor, S., Reddington, C. L., Roberts, G., Rosenfeld, D., Schwarz, J., Seland, Ø., Sellegri, K., Shen, X. J., Shiraiwa, M., Siebert, H., Sierau, B., Simpson, D., Sun, J. Y., Topping, D., Tunved, P., Vaattovaara, P., Vakkari, V., Veefkind, J. P., Visschedijk, A., Vuollekoski, H., Vuolo, R., Wehner, B., Wildt, J., Woodward, S., Worsnop, D. R., van Zadelhoff, G.-J., Zardini, A. A., Zhang, K., van Zyl, P. G., Kerminen, V.-M., S Carslaw, K., and Pandis, S. N.: General overview: European Integrated project on Aerosol Cloud Climate and Air Quality interactions (EUCAARI) – integrating aerosol research from nano to global scales, Atmos. Chem. Phys., 11, 13061–13143, https://doi.org/10.5194/acp-11-13061-2011, 2011. a
Kusaka, H., Kondo, H., Kikegawa, Y., and Kimura, F.: A simple single-layer urban canopy model for atmospheric models: Comparison with multi-layer and slab models, Bound.-Lay. Meteorol., 101, 329–358, 2001. a
Kwak, K.-H., Baik, J.-J., Ryu, Y.-H., and Lee, S.-H.: Urban air quality simulation in a high-rise building area using a CFD model coupled with mesoscale meteorological and chemistry-transport models, Atmos. Environ., 100, 167–177, https://doi.org/10.1016/j.atmosenv.2014.10.059, 2015. a
Kwon, H., Ryu, M., and Carlsten, C.: Ultrafine particles: unique physicochemical properties relevant to health and disease, Exp. Mol. Med., 52, 318–328, https://doi.org/10.1038/s12276-020-0405-1, 2020. a
Lee, S.-H. and Kwak, K.-H.: Assessing 3-D spatial extent of near-road air pollution around a signalized intersection using drone monitoring and WRF-CFD modeling, Int. J. Env. Res. Pub. Health, 17, 6915, https://doi.org/10.3390/ijerph17186915, 2020. a
Ntziachristos, L., Boulter, P., and Karageorgiou, T: 1.A.3.b.vi Road transport: Automobile tyre and brake wear 1.A.3.b.vii Road transport: Automobile road abrasion, in: European Environment Agency (EEA): EMEP/EEA air pollutant emission inventory guidebook, EMEP/EEA, https://www.eea.europa.eu/en/analysis/publications/emep-eea-guidebook-2023/part-b-sectoral-guidance-chapters/1-energy/1-a-combustion/1-a-3-b-vi/@@download/file (last access: 17 March 2025), 2023a. a, b, c
Ntziachristos, L., Samaras, Z., Kouridis, C., Samaras, C., Hassel, D., Mellios, G., McCrae, I., Hickman, J., Zierock, K., Keller, M., Rexeis, M., Andre, M., Winther, M., Gorissen, N., Boulter, P., Katsis, P., Joumard, R., Rijkeboer, R., Geivanidis, S., Hausberger, S., Karageorgiou, T., and Lekaki, D.: 1.A.3.b.i, 1.A.3.b.ii, 1.A.3.b.iii, 1.A.3.b.ivPassenger cars, light commercial trucks, heavy-duty vehicles including buses and motor cycles, in: European Environment Agency (EEA): EMEP/EEA air pollutant emission inventory guidebook, EMEP/EEA, https://www.eea.europa.eu/en/analysis/publications/emep-eea-guidebook-2023/part-b-sectoral-guidance-chapters/1-energy/1-a-combustion/1-a-3-b-i/@@download/file (last access: 17 March 2025), 2023b. a
Lequy, E., Siemiatycki, J., Hoogh, K., Vienneau, D., Dupuy, J., Garès, V., Hertel, O., Christensen, J., Zhivin, S., Goldberg, M., Zins, M., , and Jacquemin, B.: Contribution of long-term exposure to outdoor black carbon to the carcinogenicity of air pollution: Evidence regarding risk of cancer in the Gazel Cohort, Environ. Health Perspect., 129, 037005, https://doi.org/10.1289/EHP8719, 2021. a
Lequy, E., Zare Sakhvidi, M. J., Vienneau, D., de Hoogh, K., Chen, J., Dupuy, J.-F., Garès, V., Burte, E., Bouaziz, O., Le Tertre, A., Wagner, V., Hertel, O., Christensen, J. H., Zhivin, S., Siemiatycki, J., Goldberg, M., Zins, M., and Jacquemin, B.: Influence of exposure assessment methods on associations between long-term exposure to outdoor fine particulate matter and risk of cancer in the French cohort Gazel, Sci. Total Environ., 820, 153098, https://doi.org/10.1016/j.scitotenv.2022.153098, 2022. a
Létinois, L.: Methodologie de repartition spatiale de la population, Rapport LCSQA, http://www.lcsqa.org/rapport/2014/ineris/methodologie-repartition-spatiale-population (last access: 17 March 2025), 2014. a
Li, F., Luo, B., Zhai, M., Liu, L., Zhao, G., Xu, H., Deng, T., Deng, X., Tan, H., Kuang, Y., and Zhao, J.: Black carbon content of traffic emissions significantly impacts black carbon mass size distributions and mixing states, Atmos. Chem. Phys., 23, 6545–6558, https://doi.org/10.5194/acp-23-6545-2023, 2023a. a
Li, G., Lu, P., Deng, S., Gao, J., Lu, Z., and Li, Q.: Spatial variability and health assessment of particle number concentration at different exposure locations near urban traffic arterial: A case study in Xi'an, China, Atmos. Environ., 314, 120086, https://doi.org/10.1016/j.atmosenv.2023.120086, 2023b. a
Lin, C., Wang, Y., Ooka, R., Flageul, C., Kim, Y., Kikumoto, H., Wang, Z., and Sartelet, K.: Modeling of street-scale pollutant dispersion by coupled simulation of chemical reaction, aerosol dynamics, and CFD, Atmos. Chem. Phys., 23, 1421–1436, https://doi.org/10.5194/acp-23-1421-2023, 2023. a
Lopez-Aparicio, S., Guevara, M., Thunis, P., and Cuvelier, K.: Assessment of discrepancies between bottom-up and regional emission inventories in Norwegian urban areas, Atmos. Environ., 154, 285–296, https://doi.org/10.1016/j.atmosenv.2017.02.004, 2017. a, b
Lugon, L., Sartelet, K., Kim, Y., Vigneron, J., and Chrétien, O.: Simulation of primary and secondary particles in the streets of Paris using MUNICH, Faraday Discuss., 226, 432–456, https://doi.org/10.1039/D0FD00092B, 2021a. a, b
Lugon, L., Vigneron, J., Debert, C., Chrétien, O., and Sartelet, K.: Black carbon modeling in urban areas: investigating the influence of resuspension and non-exhaust emissions in streets using the Street-in-Grid model for inert particles (SinG-inert), Geosci. Model Dev., 14, 7001–7019, https://doi.org/10.5194/gmd-14-7001-2021, 2021b. a, b, c
Lugon, L., Kim, Y., Vigneron, J., Chrétien, O., André, M., André, J., Moukhtar, S., Redaelli, M., and Sartelet, K.: Effect of vehicle fleet composition and mobility on outdoor population exposure: A street resolution analysis in Paris, Atmos. Pollut. Res., 13, 101365, https://doi.org/10.1016/j.apr.2022.101365, 2022. a, b, c, d, e, f, g, h
Ma, X., Zou, B., Deng, J., Gao, J., Longley, I., Xiao, S., Guo, B., Wu, Y., Xu, T., Xu, X., Yang, X., Wang, X., Tan, Z., Wang, Y., Morawska, L., and Salmond, J.: A comprehensive review of the development of land use regression approaches for modeling spatiotemporal variations of ambient air pollution: A perspective from 2011 to 2023, Environ. Int., 183, 108430, https://doi.org/10.1016/j.envint.2024.108430, 2024. a
Maison, A., Lugon, L., Park, S.-J., Baudic, A., Cantrell, C., Couvidat, F., D'Anna, B., Di Biagio, C., Gratien, A., Gros, V., Kalalian, C., Kammer, J., Michoud, V., Petit, J.-E., Shahin, M., Simon, L., Valari, M., Vigneron, J., Tuzet, A., and Sartelet, K.: Significant impact of urban tree biogenic emissions on air quality estimated by a bottom-up inventory and chemistry transport modeling, Atmos. Chem. Phys., 24, 6011–6046, https://doi.org/10.5194/acp-24-6011-2024, 2024a. a, b, c
Maison, A., Lugon, L., Park, S.-J., Boissard, C., Faucheux, A., Gros, V., Kalalian, C., Kim, Y., Leymarie, J., Petit, J.-E., Roustan, Y., Sanchez, O., Squarcioni, A., Valari, M., Viatte, C., Vigneron, J., Tuzet, A., and Sartelet, K.: Contrasting effects of urban trees on air quality: From the aerodynamic effects in streets to impacts of biogenic emissions in cities, Sci. Total Environ., 946, 174116, https://doi.org/10.1016/j.scitotenv.2024.174116, 2024b. a, b, c
Mao, X., Guo, X., Chang, Y., and Peng, Y.: Improving air quality in large cities by substituting natural gas for coal in China: changing idea and incentive policy implications, Energy Policy, 33, 307–318, https://doi.org/10.1016/j.enpol.2003.08.002, 2005. a
Menut, L., Bessagnet, B., Briant, R., Cholakian, A., Couvidat, F., Mailler, S., Pennel, R., Siour, G., Tuccella, P., Turquety, S., and Valari, M.: The CHIMERE v2020r1 online chemistry-transport model, Geosci. Model Dev., 14, 6781–6811, https://doi.org/10.5194/gmd-14-6781-2021, 2021. a, b
Menut, L., Cholakian, A., Siour, G., Lapere, R., Pennel, R., Mailler, S., and Bessagnet, B.: Impact of Landes forest fires on air quality in France during the 2022 summer, Atmos. Chem. Phys., 23, 7281–7296, https://doi.org/10.5194/acp-23-7281-2023, 2023. a
Musson-Genon, L., Gauthier. S., and Bruth, E.: A simple method to determine evaporation, duct height in the sea surface boundary layer, Radio Sci., 27, 635–644, https://doi.org/10.1029/92RS00926, 1992. a, b, c
Olin, M., Patoulias, D., Kuuluvainen, H., Niemi, J. V., Rönkkö, T., Pandis, S. N., Riipinen, I., and Dal Maso, M.: Contribution of traffic-originated nanoparticle emissions to regional and local aerosol levels, Atmos. Chem. Phys., 22, 1131–1148, https://doi.org/10.5194/acp-22-1131-2022, 2022. a, b, c
Ostro, B., Hu, J., Goldberg, D., Reynolds, P., Hertz, A., Bernstein, L., and Kleeman, M.: Associations of mortality with long-term exposures to fine and ultrafine particles, species and sources: results from the California Teachers Study Cohort, Environ. Health Perspect., 123, 549–556, https://doi.org/10.1289/ehp.1408565, 2015. a
Park, M., Joo, H., Lee, K., Jang, M., Kim, S., Kim, I., Borlaza, L., Lim, H., Shin, H., Chung, K., Choi, Y.-H., Park, S., Bae, M.-S., Lee, J., Song, H., and Park, K.: Differential toxicities of fine particulate matters from various sources, Sci. Rep., 8, 17007, https://doi.org/10.1038/s41598-018-35398-0, 2018. a
Park, S.-J., Kang, G., Choi, W., Kim, D.-Y., Kim, J.-S., and Kim, J.-J.: Effects of fences and green zones on the air flow and PM2.5 concentration around a school in a building-congested district, Appl. Sci., 11, 9216, https://doi.org/10.3390/app11199216, 2021. a
Park, S.-J., Lugon, L., Jacquot, O., Kim, Y., Baudic, A., D'Anna, B., Di Antonio, L., Di Biagio, C., Dugay, F., Favez, O., Ghersi, V., Gratien, A., Kammer, J., Petit, J.-E., Sanchez, O., Valari, M., Vigneron, J., and Sartelet, K.: Population exposure to NO2, black carbon, particle mass and number concentrations over Paris with multi-scale modelling down to the street scale, Zenodo [code], https://doi.org/10.5281/zenodo.12639507, 2024. a
Passant, N.: Speciation of UK emissions of non-methane volatile organic compounds, AEA Technology, AEA report AEAT/R/ENV/0545, https://uk-air.defra.gov.uk/assets/documents/reports/empire/AEAT_ENV_0545_final_v2.pdf (last access: 17 March 2025), 2002. a
Patoulias, D. and Pandis, S. N.: Simulation of the effects of low-volatility organic compounds on aerosol number concentrations in Europe, Atmos. Chem. Phys., 22, 1689–1706, https://doi.org/10.5194/acp-22-1689-2022, 2022. a, b, c
Piscitello, A., Bianco, C., Casasso, A., and Sethi, R.: Non-exhaust traffic emissions: Sources, characterization, and mitigation measures, Sci. Total Environ., 766, 144440, https://doi.org/10.1016/j.scitotenv.2020.144440, 2021. a
Powers, J. G., Klemp, J. B., Skamarock, W. C., Davis, C. A., Dudhia, J., Gill, D. O., Coen, J. L., Gochis, D. J., Ahmadov, R., Peckham, S. E., Grell GA, Michalakes, J., Trahan, S., Benjamin, S. G., Alexander, C. R., Dimego, G. J., Wang, W., Schwartz, C. S., Romine, G. S., Liu, Z., Snyder, C., Chen, F., Barlage, M. J., Yu, W., and Duda, M. G.: The Weather Research and Forecasting model: Overview, system efforts, and future directions, B. Am. Meteorol. Soc., 98, 1717–1737, https://doi.org/10.1175/bams-d-15-00308.1, 2017. a
Sarica, T., Sartelet, K., Roustan, Y., Kim, Y., Lugon, L., Marques, B., D'Anna, B., Chaillou, C., and Larrieu, C.: Sensitivity of pollutant concentrations in urban streets to asphalt and traffic-related emissions, Environ. Pollut, 332, 121955, https://doi.org/10.1016/j.envpol.2023.121955, 2023. a, b, c, d, e, f
Sartelet, K., Couvidat, F., Seigneur, C., and Roustan, Y.: Impact of biogenic emissions on air quality over Europe and North America, Atmos. Environ., 53, 131–141, https://doi.org/10.1016/j.atmosenv.2011.10.046, 2012. a
Sartelet, K., Zhu, S., Moukhtar, S., André, M., André, J., Gros, V., Favez, O., Brasseur, A., and Redaelli, M.: Emission of intermediate, semi and low volatile organic compounds from traffic and their impact on secondary organic aerosol concentrations over Greater Paris, Atmos. Environ., 180, 126–137, 2018. a, b, c
Sartelet, K., Couvidat, F., Wang, Z., Flageul, C., and Kim, Y.: SSH-Aerosol v1.1: A modular box model to simulate the evolution of primary and secondary aerosols, Atmosphere, 11, 525, https://doi.org/10.3390/atmos11050525, 2020. a, b, c
Sartelet, K., Kim, Y., Couvidat, F., Merkel, M., Petäjä, T., Sciare, J., and Wiedensohler, A.: Influence of emission size distribution and nucleation on number concentrations over Greater Paris, Atmos. Chem. Phys., 22, 8579–8596, https://doi.org/10.5194/acp-22-8579-2022, 2022. a, b, c, d, e, f
Sartelet, K., Wang, Z., Lannuque, V., Iyer, S., Couvidat, F., and Sarica, T.: Modelling molecular composition of SOA from toluene photo-oxidation at urban and street scales, Environ. Sci.-Atmos., 4, 839–847, https://doi.org/10.1039/D4EA00049H, 2024. a, b
Savadkoohi, M., Pandolfi, M., Reche, C., Niemi, J., Mooibroek, D., Titos, G., Green, D., Tremper, A., Hueglin, C., Liakakou, E., Mihalopoulos, N., Stavroulas, I., Artiñano, B., Coz, E., Alados-Arboledas, L., Beddows, D., Riffault, V., Brito, J., Bastian, S., Baudic, A., Colombi, C., Costabile, F., Chazeau, B., Marchand, N., Gómez-Amo, J., Estellés, V., Matos, V., Gaag, E., Gille, G., Luoma, K., Manninen, H., Norman, M., Silvergren, S., Petit, J., Putaud, J., Rattigan, O., Timonen, H., Tuch, T., Merkel, M., Weinhold, K., Vratolis, S., Vasilescu, J., Favez, O., Harrison, R., Laj, P., Wiedensohler, A., Hopke, P., Petäjä, T., Alastuey, A., and Querol, X.: The variability of mass concentrations and source apportionment analysis of equivalent black carbon across urban Europe, Environ. Int., 178, 108081, https://doi.org/10.1016/j.envint.2023.108081, 2023. a, b, c
Savadkoohi, M., Pandolfi, M., Favez, O., Putaud, J.-P., Eleftheriadis, K., Fiebig, M., Hopke, P., Laj, P., Wiedensohler, A., Alados-Arboledas, L., Bastian, S., Chazeau, B., María, Á., Colombi, C., Costabile, F., Green, D., Hueglin, C., Liakakou, E., Luoma, K., Listrani, S., Mihalopoulos, E., Marchand, E., Močnik, G., Niemi, J., Ondráček, J., Petit, J.-E., Rattigan, O., Reche, C., Timonen, H., Titos, G., Tremper, A., Vratolis, S., Vodička, P., Funes, E., Zíková, N., Harrison, R., Petäjä, T., Alastuey, A., and Querol, X.: Recommendations for reporting equivalent black carbon (eBC) mass concentrations based on long-term pan-European in-situ observations, Environ. Int., 185, 108553, https://doi.org/10.1016/j.envint.2024.108553, 2024. a, b, c, d
Schwarz, M., Schneider, A., Cyrys, J., Bastian, S., Breitner, S., and Peters, A.: Impact of Ambient Ultrafine Particles on Cause-Specific Mortality in Three German Cities, Am. J. Resp. Crit. Care, 207, 1334–1344, https://doi.org/10.1164/rccm.202209-1837OC, 2023. a
Seigneur, C.: Air pollution: Concepts, theory, and applications, Cambridge University Press, ISBN-10 1108481639, 2019. a
Selmi, W., Weber, C., Rivière, E., Blond, N., Mehdi, L., and Nowak, D.: Air pollution removal by trees in public green spaces in Strasbourg city, France, Urban For. Urban Green, 17, 192–201, https://doi.org/10.1016/j.ufug.2016.04.010, 2016. a
Soulhac, L., Salizzoni, P., Cierco, F., and Perkins, R.: The model SIRANE for atmospheric urban pollutant dispersion; part I, presentation of the model, Atmos. Environ., 45, 7379–7395, https://doi.org/10.1016/j.atmosenv.2011.07.008, 2011. a, b
Southerland, V., Brauer, M., Mohegh, A., Hammer, M., van Donkelaar, A., Martin, R., Apte, J., and Anenberg, S.: Global urban temporal trends in fine particulate matter (PM25) and attributable health burdens: estimates from global datasets, Lancet Planet Health, 6, 139–146, https://doi.org/10.1016/S2542-5196(21)00350-8, 2022. a
Squarcioni, A., Roustan, Y., Valari, M., Kim, Y., Sartelet, K., Lugon, L., Dugay, F., and Voitot, R.: To what extent is the description of streets important in estimating local air quality: a case study over Paris, Atmos. Chem. Phys., 25, 93–117, https://doi.org/10.5194/acp-25-93-2025, 2025. a, b
Strömberg, J., Li, X., Kurppa, M., Kuuluvainen, H., Pirjola, L., and Järvi, L.: Effect of radiation interaction and aerosol processes on ventilation and aerosol concentrations in a real urban neighbourhood in Helsinki, Atmos. Chem. Phys., 23, 9347–9364, https://doi.org/10.5194/acp-23-9347-2023, 2023. a, b
Tagaris, E., Sotiropoulou, R., Gounaris, N., Andronopoulos, S., and Vlachogiannis, D.: Effect of the Standard Nomenclature for Air Pollution (SNAP) categories on air quality over Europe, Atmosphere, 6, 1119–1128, https://doi.org/10.3390/atmos6081119, 2015. a
Theloke, J. and Friedrich, R.: Compilation of a database on the composition of anthropogenic VOC emissions for atmospheric modeling in Europe, Atmos. Environ., 41, 4148–4160, 2007. a
Tomar, G., Nagpure, A., Kumar, V., and Jain, Y.: High resolution vehicular exhaust and non-exhaust emission analysis of urban-rural district of India, Sci. Total Environ., 805, 150255, https://doi.org/10.1016/j.scitotenv.2021.150255, 2022. a
Trechera, P., Garcia-Marlès, M., Liu, X., Reche, C., Pérez, N., Savadkoohi, M., Beddows, D., Salma, I., Vörösmarty, M., Casans, A., Casquero-Vera, J. A., Hueglin, C., Marchand, N., Chazeau, B., Gille, G., Kalkavouras, P., Mihalopoulos, N., Ondracek, J., Zikova, N., Niemi, J. V., Manninen, H. E., Green, D. C., Tremper, A. H., Norman, M., Vratolis, S., Eleftheriadis, K., Gomez-Moreno, F. J., Alonso-Blanco, E., Gerwig, H., Wiedensohler, A., Weinhold, K., Merkel, M., Bastian, S., Petit, J.-E., Favez, O., Crumeyrolle, S., Ferlay, N., Martins Dos Santos, S., Putaud, J.-P., Timonen, H., Lampilahti, J., Asbach, C., Wolf, C., Kaminski, H., Altug, H., Hoffmann, B., Rich, D. Q., Pandolfi, M., Harrison, R. M., Hopke, P. K., Petäjä, T., Alastuey, A., and Querol, X.: Phenomenology of ultrafine particle concentrations and size distribution across urban Europe, Environ. Int., 172, 107744, https://doi.org/10.1016/j.envint.2023.107744, 2023. a, b
Valari, M. and Menut, L.: Transferring the heterogeneity of surface emissions to variability in pollutant concentrations over urban areas through a chemistry-transport model, Atmos. Environ., 44, 3229–3238, https://doi.org/10.1016/j.atmosenv.2010.06.001, 2010. a
Valari, M., Markakis, K., Powaga, E., Collignan, B., and Perrussel, O.: EXPLUME v1.0: a model for personal exposure to ambient O3 and PM2.5, Geosci. Model Dev., 13, 1075–1094, https://doi.org/10.5194/gmd-13-1075-2020, 2020. a
Wang, T., Liu, H., Li, J., Wang, S., Kim, Y., Sun, Y., Yang, W., Du, H., Wang, Z., and Wang, Z.: A two-way coupled regional urban–street network air quality model system for Beijing, China, Geosci. Model Dev., 16, 5585–5599, https://doi.org/10.5194/gmd-16-5585-2023, 2023a. a
Wang, Y., Ma, Y.-F., Muñoz-Esparza, D., Dai, J., Li, C. W. Y., Lichtig, P., Tsang, R. C.-W., Liu, C.-H., Wang, T., and Brasseur, G. P.: Coupled mesoscale–microscale modeling of air quality in a polluted city using WRF-LES-Chem, Atmos. Chem. Phys., 23, 5905–5927, https://doi.org/10.5194/acp-23-5905-2023, 2023b. a
WHO: WHO global air quality guidelines: particulate matter (PM2.5 and PM10), ozone, nitrogen dioxide, sulfur dioxide and carbon monoxide., WHO reports, https://iris.who.int/bitstream/handle/10665/345329/9789240034228-eng.pdf (last access: 17 March 2025), 2021. a, b
Yuan, C., Ng, E., and Norford, L.: Improving air quality in high-density cities by understanding the relationship between air pollutant dispersion and urban morphologies, Build. Environ., 71, 245–258, https://doi.org/10.1016/j.buildenv.2013.10.008, 2014. a
Zhong, J., Harrison, R. M., James Bloss, W., Visschedijk, A., and Denier van der Gon, H.: Modelling the dispersion of particle number concentrations in the West Midlands, UK using the ADMS-Urban model, Environ. Int., 181, 108273, https://doi.org/10.1016/j.envint.2023.108273, 2023. a, b
Zhu, S., Sartelet, K. N., Healy, R. M., and Wenger, J. C.: Simulation of particle diversity and mixing state over Greater Paris: a model-measurement inter-comparison, Faraday Discuss., 189, 547–566, https://doi.org/10.1039/C5FD00175G, 2016. a
- Abstract
- Introduction
- Material and methods
- Evaluation of model performances
- Population exposure
- Conclusion
- Appendix A: Size discretization of emissions
- Appendix B: Speciation and calculation of emissions
- Appendix C: Additional figures
- Appendix D: Statistical parameters
- Code and data availability
- Author contributions
- Competing interests
- Disclaimer
- Special issue statement
- Acknowledgements
- Financial support
- Review statement
- References
- Supplement