the Creative Commons Attribution 4.0 License.
the Creative Commons Attribution 4.0 License.
 | 17 Mar 2025
Characterization of fog microphysics and their relationships with visibility at a mountain site in China
Xiaojing Shen
Junying Sun
Yangmei Zhang
Qianli Ma
Lujie Han
Honghui Xu
Xinyao Hu
Jiayuan Lu
Shuo Liu
Aoyuan Yu
Linlin Liang
Qian Gao
Hong Wang
Huizheng Che
Xiaoye Zhang
Enhancing the understanding of fog microphysical processes is essential for reducing uncertainty in fog forecasts, particularly in predicting fog visibility and duration. To investigate the complex interactions between aerosols and fog microphysics and their impacts on visibility degradation, simultaneous measurements of aerosol and fog microphysical characteristics were conducted from April to May 2023 at a mountain site (1483 m a.s.l.) in the Yangtze River Delta (YRD) region, China. In this study, eight fog events were investigated during the campaign, revealing significantly higher fog droplet number concentrations (Nd) compared to those observed in clean areas. A strong correlation was found between pre-fog aerosol number concentration (Na) and the peak Nd of each fog event, indicating the substantial influence of pre-existing aerosol levels on fog microphysics. Water vapor supersaturation ratio (SS) within fogs was estimated to 0.07 % ± 0.02 %, slightly higher than previous estimates in urban and suburban areas. The broadening of the droplet size distribution (DSD) at formation, development, and mature stages was dominantly driven by activation, condensation, and collision–coalescence mechanisms, respectively. This evolution process often led DSD to a shift from a unimodal to a trimodal distribution, with peaks around 6, 12, and 23 µm. For fog events occurring under high Na background, a notable decrease in temperature during the mature stage promoted a secondary activation-dominated process, resulting in the formation of numerous small fog droplets and a reduction in the large droplet size. The evolution of DSD can significantly influence visibility (VIS) in fogs. Detailed comparison of several visibility calculation methods suggests that estimating visibility based on the extinction of fog droplets only led to considerable overprediction when 100 m m. The results highlight the necessity of incorporating both fog droplets and aerosol extinction in fog visibility forecasts, particularly in anthropogenically polluted regions.
- Article
(4056 KB) - Full-text XML
-
Supplement
(1533 KB) - BibTeX
- EndNote


Fog, consisting of suspended liquid droplets or ice crystals near the ground, has substantial impacts on transportation, aviation, and daily activities due to its capability to drastically reduce visibility to less than 1 km (Koračin et al., 2014; Niu et al., 2010a; Gultepe et al., 2015). The formation and types of fog are influenced by various atmospheric conditions and processes. For instance, continental fog commonly forms by radiative cooling of the surface (known as radiation fog) or through the lowering of pre-existing stratus clouds to ground level (Tardif and Rasmussen, 2007). Once the fog forms, its life cycle is influenced by a combination of radiation, turbulence, thermodynamic, and cloud microphysical processes (Mazoyer et al., 2017). These processes interact in complex manners that are not yet fully understood. Advancing the understanding of fog microphysical processes is essential for improving fog forecasts (Boutle et al., 2015; Martinet et al., 2020), particularly in predicting the timing of fog formation and dissipation (van der Velde et al., 2010; Boutle et al., 2018).
The interactions between aerosol particles and fog droplets are complicated (Fan et al., 2016). Fog processes can scavenge large amounts of aerosols, altering their chemical composition, size distribution, and mixing state (Schroder et al., 2015; Roth et al., 2016; Qian et al., 2023). Conversely, aerosol particles can serve as cloud condensation nuclei (CCN) in supersaturated water vapor environments (Twomey, 1959), playing an important role in the evolution of fog. The concentration, size distribution, and chemical composition of aerosols can significantly influence fog microphysical characteristics and optical properties (Dusek et al., 2006; Zhao and Garrett, 2015; Zhang et al., 2024). For example, in regions with intense anthropogenic activities, the abundance of CCN can lead to the formation of numerous but smaller fog droplets (Li et al., 2017; Twomey, 1977) and prolong fog atmospheric lifetime (Yan et al., 2020; Jia et al., 2019). This can enhance the light scattering, thereby reducing visibility more effectively than that in cleaner environments with fewer but larger droplets. Additionally, the activation capacity of aerosol particles is mainly determined by their size distribution and chemical composition (Andreae and Rosenfeld, 2008; Gysel et al., 2007). Particles with high activation capacity can lower the critical activation supersaturation threshold needed for droplet formation (Ervens et al., 2005; Zhang et al., 2012; Wang et al., 2024). Therefore, the influence of aerosols on fog microphysics varies across regions with different aerosol backgrounds.
Given that visibility degradation is the most significant hazard during fog events, accurately estimating visibility is crucial for fog prediction. Numerous previous studies have focused on the relationship between fog microphysical parameters and visibility. Eldridge (1961) identified a strong negative correlation between fog visibility (VIS) and liquid water content (LWC) based on fog observations (Eldridge, 1961). In addition to LWC, Meyer et al. (1980) suggested that there is a significant negative correlation between fog VIS and droplet number concentration (Nd). Kunkel (1984) suggested that LWC could serve as the single parameter for visibility parameterization for fog, based on observation data of 11 fog cases. To improve fog visibility predictions, a dual-parameter scheme (LWC ⋅Nd), relating both LWC and Nd to VIS, was proposed and optimized by Gultepe et al. (2006). This dual-parameter scheme demonstrated higher forecast accuracy compared to the LWC-only scheme (Zhang et al., 2014). Furthermore, Song et al. (2019) suggested that VIS is not only related to LWC ⋅Nd but also to the effective diameter (Deff) of droplet size spectrum. They incorporated Deff into the dual-parameter scheme based on fog observations in the mountainous regions of the Korean Peninsula. However, the fitting parameters in these parameterization schemes are influenced by the characteristics of fog droplet size distribution (DSD), and their values vary significantly in different regions and environments (Kunkel, 1984; Gultepe and Milbrandt, 2007; Zhang et al., 2014). Such variability of these parameters emphasizes the strong regional dependence of the applicability of these two parameterization schemes. Additionally, Zhang et al. (2014) examined these parameterization methods using in situ measurement data from four fog cases in a region of intense anthropogenic emissions, and they found that these parameterizations were unsuitable for light fog events. This is caused by only the extinction caused by fog droplets being taken into account in these fog visibility parameterization schemes. The extinction contribution from hygroscopic growth of unactivated aerosol particles under water vapor supersaturation conditions may not be ignored (Elias et al., 2009; Hammer et al., 2014). However, few studies have utilized simultaneous microphysical observations of fog droplets and aerosols to evaluate their contributions to visibility during fog evolution.
To improve the understanding of the interactions between aerosols and fog microphysics and their impacts on visibility degradation in polluted regions, simultaneous measurements of number size distributions of aerosol particles and fog droplets were conducted at a mountain site in the megacity cluster of the Yangtze River Delta (YRD) region, China. In this study, eight fog events are discussed in detail to illustrate the potential impacts of different aerosol concentration background on fog microphysical characteristics. Details on the observation site, instrumentation, sampling inlet system for fog interstitial particles and fog residual particles, and the supersaturation (SS) estimation methods are described in the “Measurement and methodology” section. In the “Results and discussions” section, we first present general observations during this campaign in Sect. 3.1 and discuss the relationship between pre-fog aerosols and fog droplets in Sect. 3.2. Then, the variations in SS values derived by aerosol and fog measurements are presented in Sect. 3.3. The temporal evolution of fog DSD for two typical fog events is characterized and discussed in Sect. 3.4. Finally, the contributions of aerosols and droplets to visibility during different stages of fog evolution are presented in Sect. 3.5. The summaries are provided in the “Conclusions and implications” section.
2.1 Observation site
Simultaneous measurements of aerosol particle number size distribution (PNSD), CCN number concentration, and fog microphysical parameters (Nd, LWC, Deff) were conducted during 11 April to 8 May 2023 at the summit of Mt. Daming in Hangzhou, China. The mountain site (30.03° N, 119.00° E; 1483 m a.s.l.) is located in the southwest Hangzhou area at a distance of ∼ 120 km from downtown Hangzhou (Fig. S1 in the Supplement), belonging to the YRD region. The surroundings of this site have no distinct anthropogenic emissions apart from a few villages at the base of the mountain. Due to the unique geography, the site frequently experiences various cloud/fog events, such as orographic cloud, radiation fog, and stratus-lowering fog.
2.2 Instrumentation and methods
2.2.1 Sampling inlet system
To simultaneously measure the physicochemical properties of fog interstitial particles and fog residual particles, an automatic three-way switching inlet system was developed, incorporating a PM2.5 cyclone and a ground-based counterflow virtual impactor (GCVI) (model 1205, Brechtel Manufacturing Inc., USA) (Fig. S2). This system utilized two electromagnetic ball valves installed downstream of the PM2.5 cyclone and GCVI pathway, respectively, and was controlled by custom LabView (National Instruments, Austin, USA) software. The inlet system was installed on the roof, approximately 5 m above the ground. The aerosol measurements were performed downstream of this inlet system, including PNSD, CCN concentration at different water vapor saturation (SS), and aerosol chemical composition. The three-way valve switching is controlled automatically based on fog and fog-free conditions. Fog conditions were detected using visibility and relative humidity (RH) sensors integrated into the GCVI system, with thresholds set at 1000 m for visibility and 95 % for RH. Under fog-free conditions, ambient air was sampled through the PM2.5 inlet and dried by an automatic regenerating absorption aerosol dryer, ensuring the RH in the sample flow remained below 30 % (Tuch et al., 2009). Under fog conditions, the sampling system alternated between the PM2.5 cyclone and GCVI pathways every 30 min. During fog events, particles collected through the PM2.5 cyclone pathway represent fog interstitial particles, while particles sampled and dried via the GCVI pathway represent fog droplet residual particles.
The GCVI system uses a compact wind tunnel placed upstream of the CVI inlet (model 1204) to accelerate cloud/fog droplets into the CVI inlet tip. Droplets smaller than the cut size of the CVI inlet are rejected from the tip by the counterflow. Droplets larger than the cut size but smaller than the maximum size limit pass through the tip and are dried into small residue particles. For a given counterflow, airspeed within the wind tunnel, temperature, and pressure, the cut size of droplet that penetrates into the inlet is fixed. In this study, the GCVI inlet sampled droplets with aerodynamic diameters larger than 7.8 µm by setting the airspeed and counterflow to 90 m s−1 and 4 L min−1, respectively. The droplets were then dried using an evaporation chamber (airflow temperature at 40°) in the GCVI. Details of the GCVI system can be found in other studies (Shingler et al., 2012; Bi et al., 2016; Karlsson et al., 2021). It is worth noting that the GCVI tends to yield a higher number concentration of cloud particles compared to the actual ambient cloud particle concentration, which should be corrected using an enrichment factor (EF). The EF was calculated based on the GCVI sampling flow settings, airspeed, and its geometry configuration, as recommended by Shingler et al. (2012). In this work, an EF of 5.9 was derived for an airspeed of 90 m s−1. Therefore, the concentration measured downstream of the GCVI pathway has been corrected by an EF of 5.9.
2.2.2 Fog microphysical parameters
A fog monitor (model FM-100, DMT Inc., USA) was applied in situ for measuring real-time droplet size distribution (DSD) within the size range of 2–50 µm. The inlet of FM-100 sampled air approximately 2.5 m above the ground. Droplets are sorted into the 20 predefined size bins with a measuring time resolution of 1 s. The values of fog microphysical parameters (Nd, LWC, and Deff) were calculated from fog DSD according to the equations addressed by Spiegel et al. (2012):
where Ni is the droplet number concentration in the ith bin, Di denotes the diameter in the ith bin, and ρw=1 g cm−3 represents for the density of pure water.
2.2.3 Aerosol measurements
The dry PNSDs were measured by a twin scanning mobility particle sizer (TSMPS; TROPOS, Germany), consisting of a differential mobility analyzer (DMA) and a condensation particle counter (CPC; model 3772, TSI Inc., USA). The TSMPS system measured the PNSD within the range 10–850 nm in mobility diameter with an X-ray neutralizer. Each scan was set to 5 min for every loop with a total sample flow rate of 2.5 L min−1.
The CCN number concentration (NCCN) was measured at various SS levels using a cloud condensation nuclei counter (model CCN-100, DMT Inc., USA). In this study, the CCN counter was sequentially set to four supersaturation (SS) values, 0.1 %, 0.2 %, 0.4 %, and 0.7 %, each for a duration of 5 min. The four SS set points were sequentially scanned from low to high and then back from high to low to avoid a large change in SS in the CCNc column. Due to the cloud chamber inside the CCN counter requiring time to stabilize the temperature after each change in SS, data measured in the first minute of each SS were excluded. The ratio of sample flow and sheath flow was set at 1:10, with a flow rate of 0.45 and 4.5 L min−1, respectively. The SS calibration of CCNc-100 was performed with ammonium sulfate particles before and after the campaign.
Aerosol chemical components were measured by a high-resolution time-of-flight aerosol mass spectrometer (HR-ToF-AMS; Aerodyne Inc., USA) (Canagaratna et al., 2007; DeCarlo et al., 2006), including nitrate, sulfate, chloride, ammonium, and organics. Black carbon (BC) mass concentrations were obtained using a single particle soot photometer (SP2; DMT Inc., USA) (Schwarz et al., 2006; Liu et al., 2020a). The aerosol chemical compositions in this study were used to derive their hygroscopic parameter (κ) following the method by Liu et al. (2023). The κ value for each pure chemical species is provided in Table S1 in the Supplement. Detailed analysis of chemical properties of cloud interstitial particles and droplet residual particles will be presented in a subsequent study.
2.2.4 Fog event selection criteria
The definition of fog event in this study requires the following conditions to be met simultaneously: visibility less than 1000 m, relative humidity greater than 95 %, and fog droplet number concentration greater than 10 cm−3 (Lu et al., 2013; Deng et al., 2009; World Meteorological Organization, 2017). Intervals between fog events need to include at least 3 consecutive hours of a fog-free period. In order to avoid precipitation interference in fog measurements, those processes in which fog appeared after precipitation were eliminated from the later analysis. Therefore, there were eight available fog events in total that were selected to analyze in following text. The detailed description for the eight fog events is summarized in Table 1.
Table 1The median values of measured fog microphysical parameters for each fog event during the campaign.
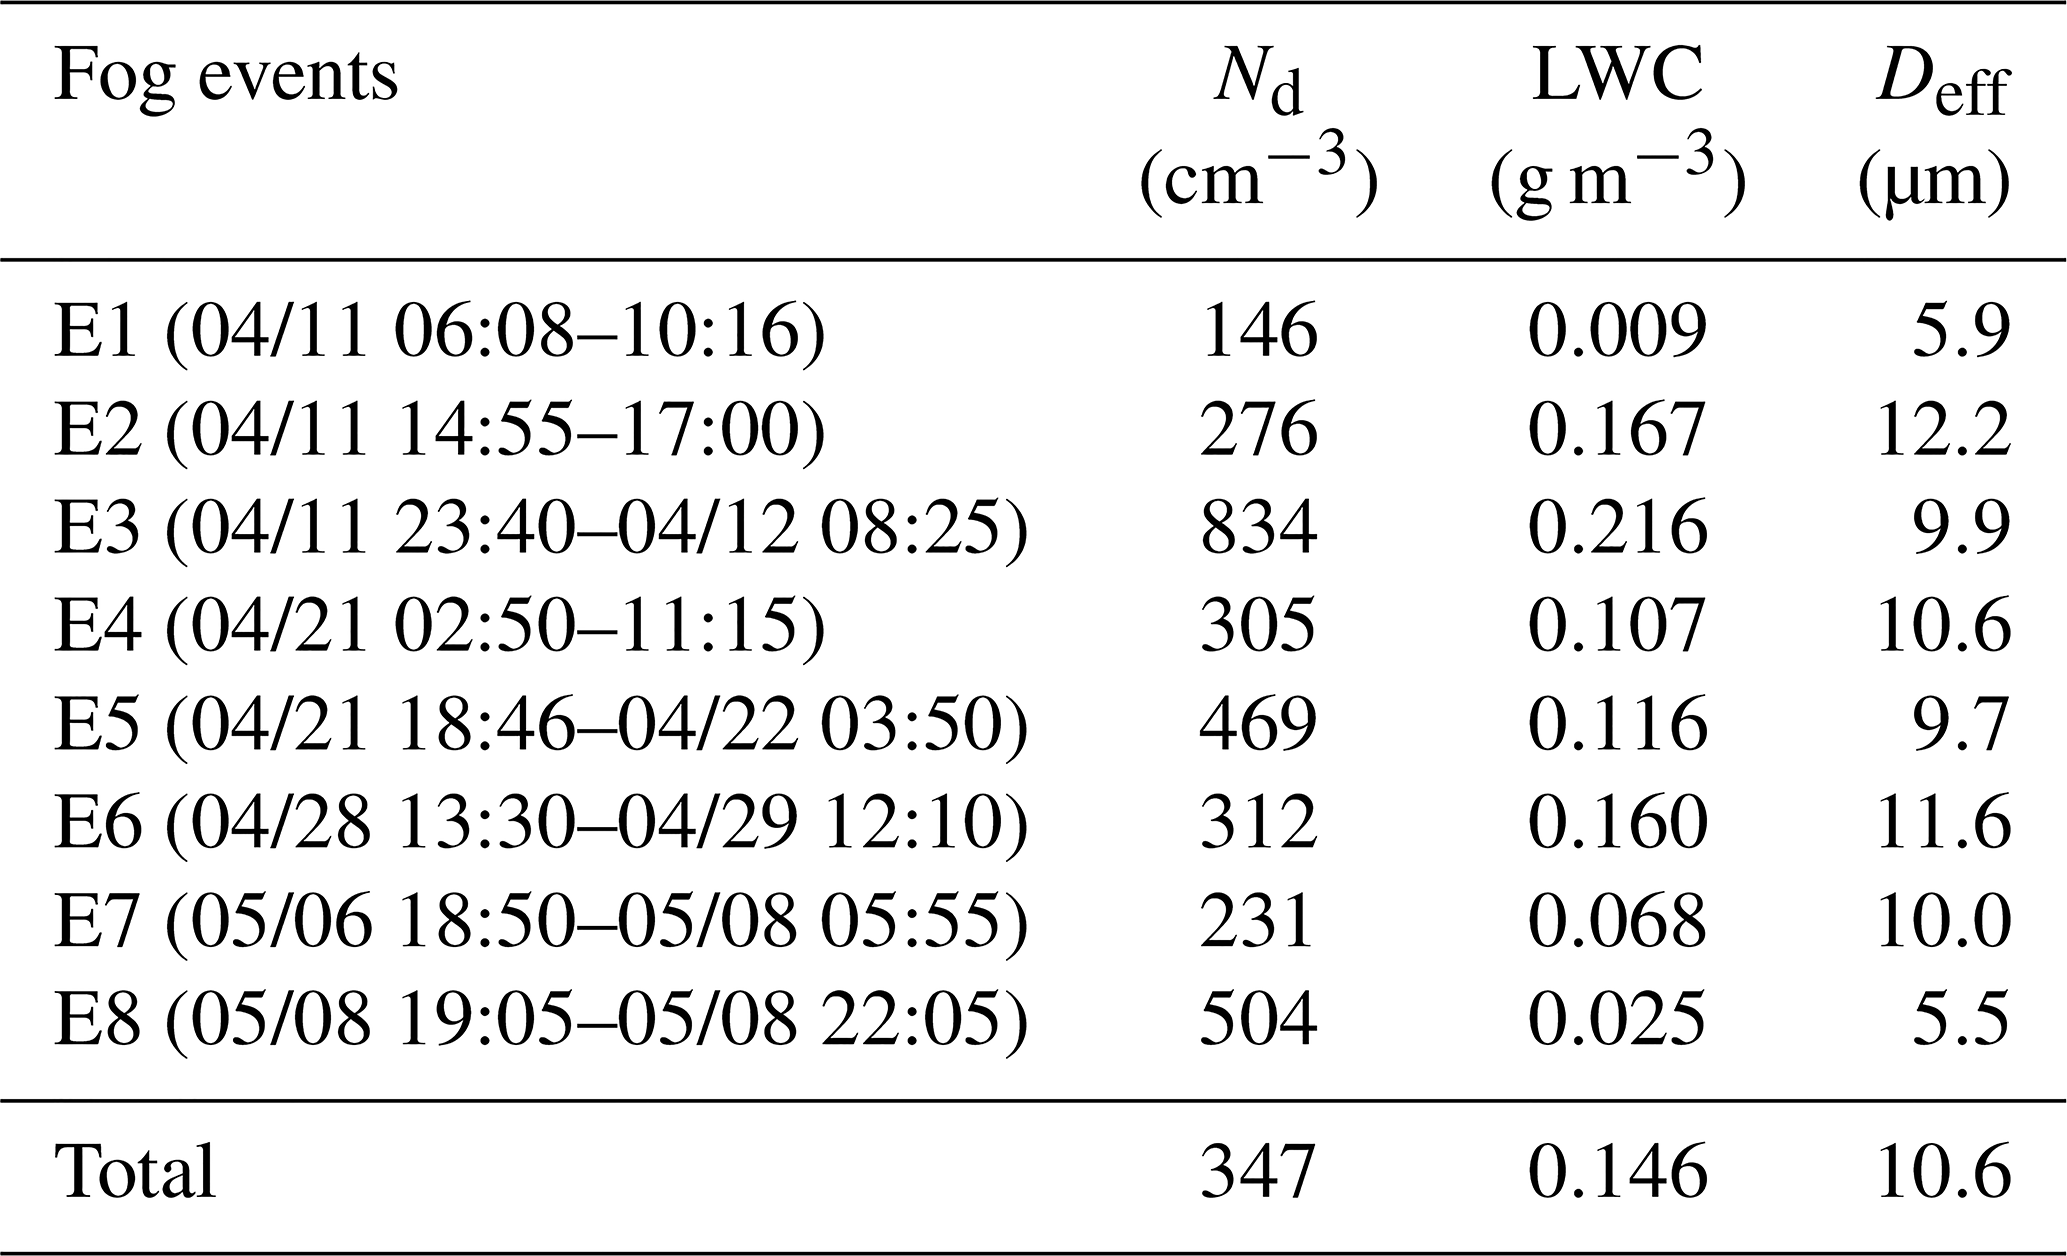
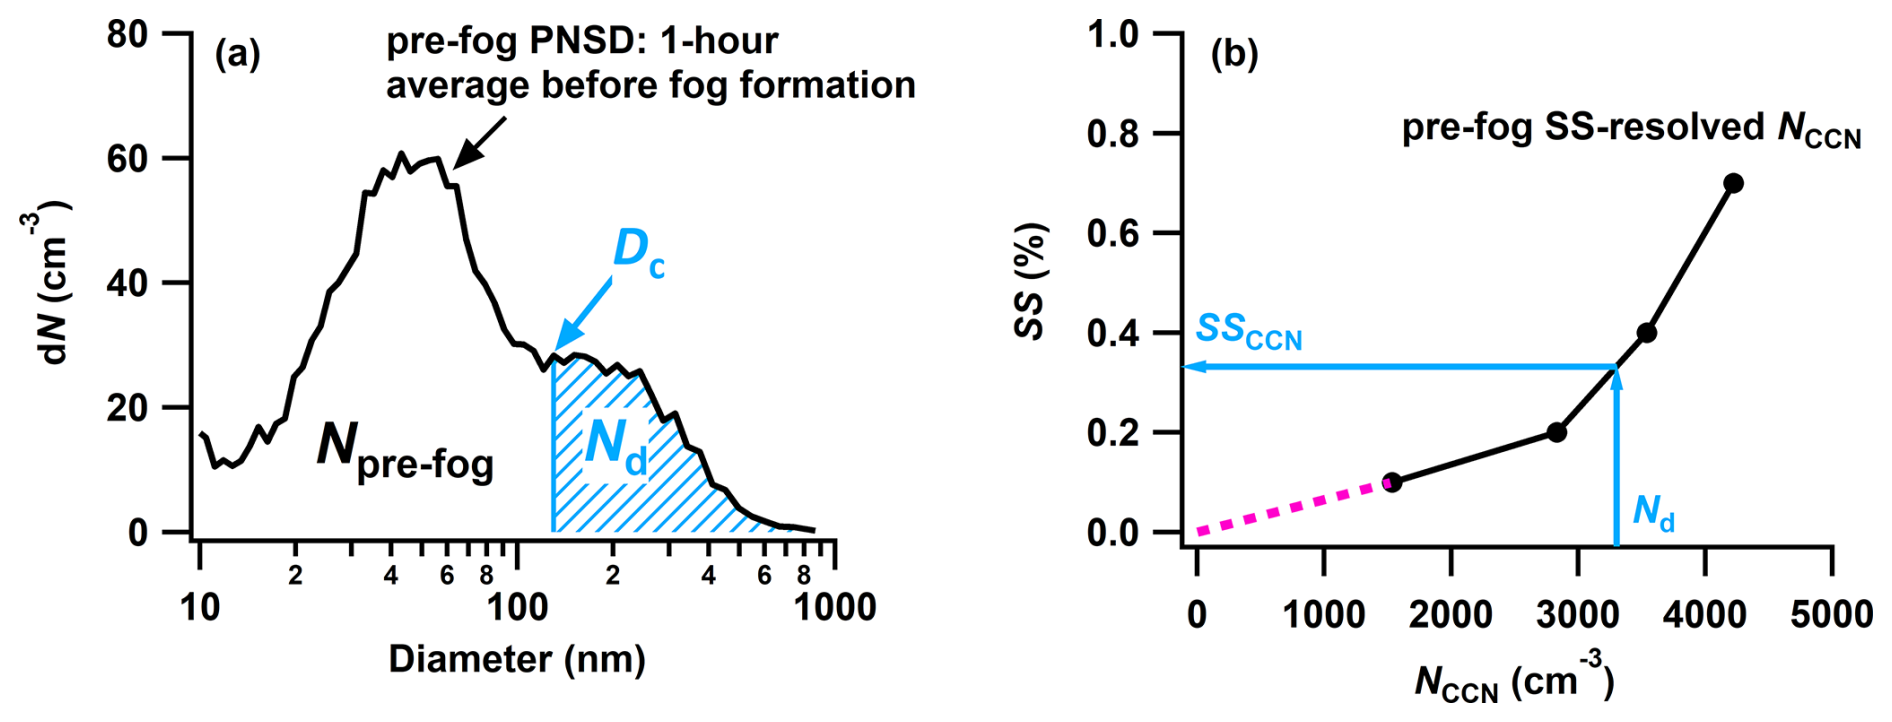
Figure 1Schematics of two methods for deriving water vapor supersaturation (SS) in fog. (a) SSPNSD is derived from the averaged pre-fog particle number size distribution (PNSD) and Nd. The blue shaded area represents the integrated Na from the upper end of the pre-fog PNSD to smaller sizes. The critical activation diameter (Dc) is defined as the diameter where the integrated Na equals Nd. (b) SSCCN is derived from the pre-fog SS-resolved NCCN measurements and Nd. The dashed magenta line represents linear interpolation from NCCN measurements at two lower SS set points.
2.2.5 Method to estimate the SS in fog
The SS in fogs, as one of the most important environmental parameters in response to fog evolution, cannot be directly measured. Aerosol particles will be activated when their critical activation SS is lower than the maximum SS value of ambient air. In return, cloud/fog droplets can be formed by those particles whose diameters exceed the critical activation diameter (Dc), corresponding to that critical activation SS. In order to illustrate the influences of SS evolution on droplet size distribution, we used two approaches to derive SS (Fig. 1). In the first approach, the averaged pre-fog PNSD represented the aerosol background before activation occurrence. The Dc here was determined as the particle size at which the Nd equaled the integrated aerosol concentration of the pre-fog PNSD from the upper limit down to Dc (Fig. 1a). Then, the corresponding SS (SSPNSD) was calculated using the κ-Köhler equation (Petters and Kreidenweis, 2008) with an averaged κ of pre-fog aerosols. In the second approach, the Nd in the fog can be considered to be consistent with the activated CCN number concentration (NCCN). The SS (SSCCN) was determined as the Nd is equivalent to NCCN using piecewise linear interpolation of the pre-fog SS-resolved NCCN measurements (Fig. 1b). Due to the lowest SS set point in this study being 0.1 %, SS values less than 0.1 % were estimated from extrapolation of the linear extension line (dashed magenta line in Fig. 1b).
2.2.6 Visibility measurement and calculation
The extinction coefficient of aerosol particles and fog droplets can be calculated from their number size distribution, respectively, according to following equation:
where bext is the extinction coefficient, and Qext is the extinction cross section calculated by the droplet (or aerosol particle) diameter (Di) and wavelength of light (880 nm, consistent with the visibility meter) using Mie theory. The refractive indices of pure composition relevant to the Mie calculations are provided in Table S1. Then, the extinction coefficient is converted to VIS using an equation given by Koschmieder (1924) as
where ε is the brightness contrast threshold. The visibility was also simultaneously measured by a forward scattering visibility meter (model DNQ1, Huayun Inc., China) at 880 nm, with the range of 0.01–35 km. To make the VIScal comparable with the measured VIS, the ε value here is set to 0.05, which is in accordance with the method of visibility meter.
2.2.7 Parameterization schemes of fog visibility
Previous studies have explored the relationship between fog microphysical parameters (i.e., LWC, Nd, and Deff) and visibility (Gultepe et al., 2006; Song et al., 2019; Kunkel, 1984). A commonly used approach for estimating fog visibility was proposed by Kunkel (1984) as follows:
This parameterization scheme is based only on LWC and is therefore widely applied in numerical models. However, the parameter of Nd can also significantly influence fog visibility. On this basis, the parameterization was developed by Gultepe et al. (2006), utilizing both LWC and Nd:
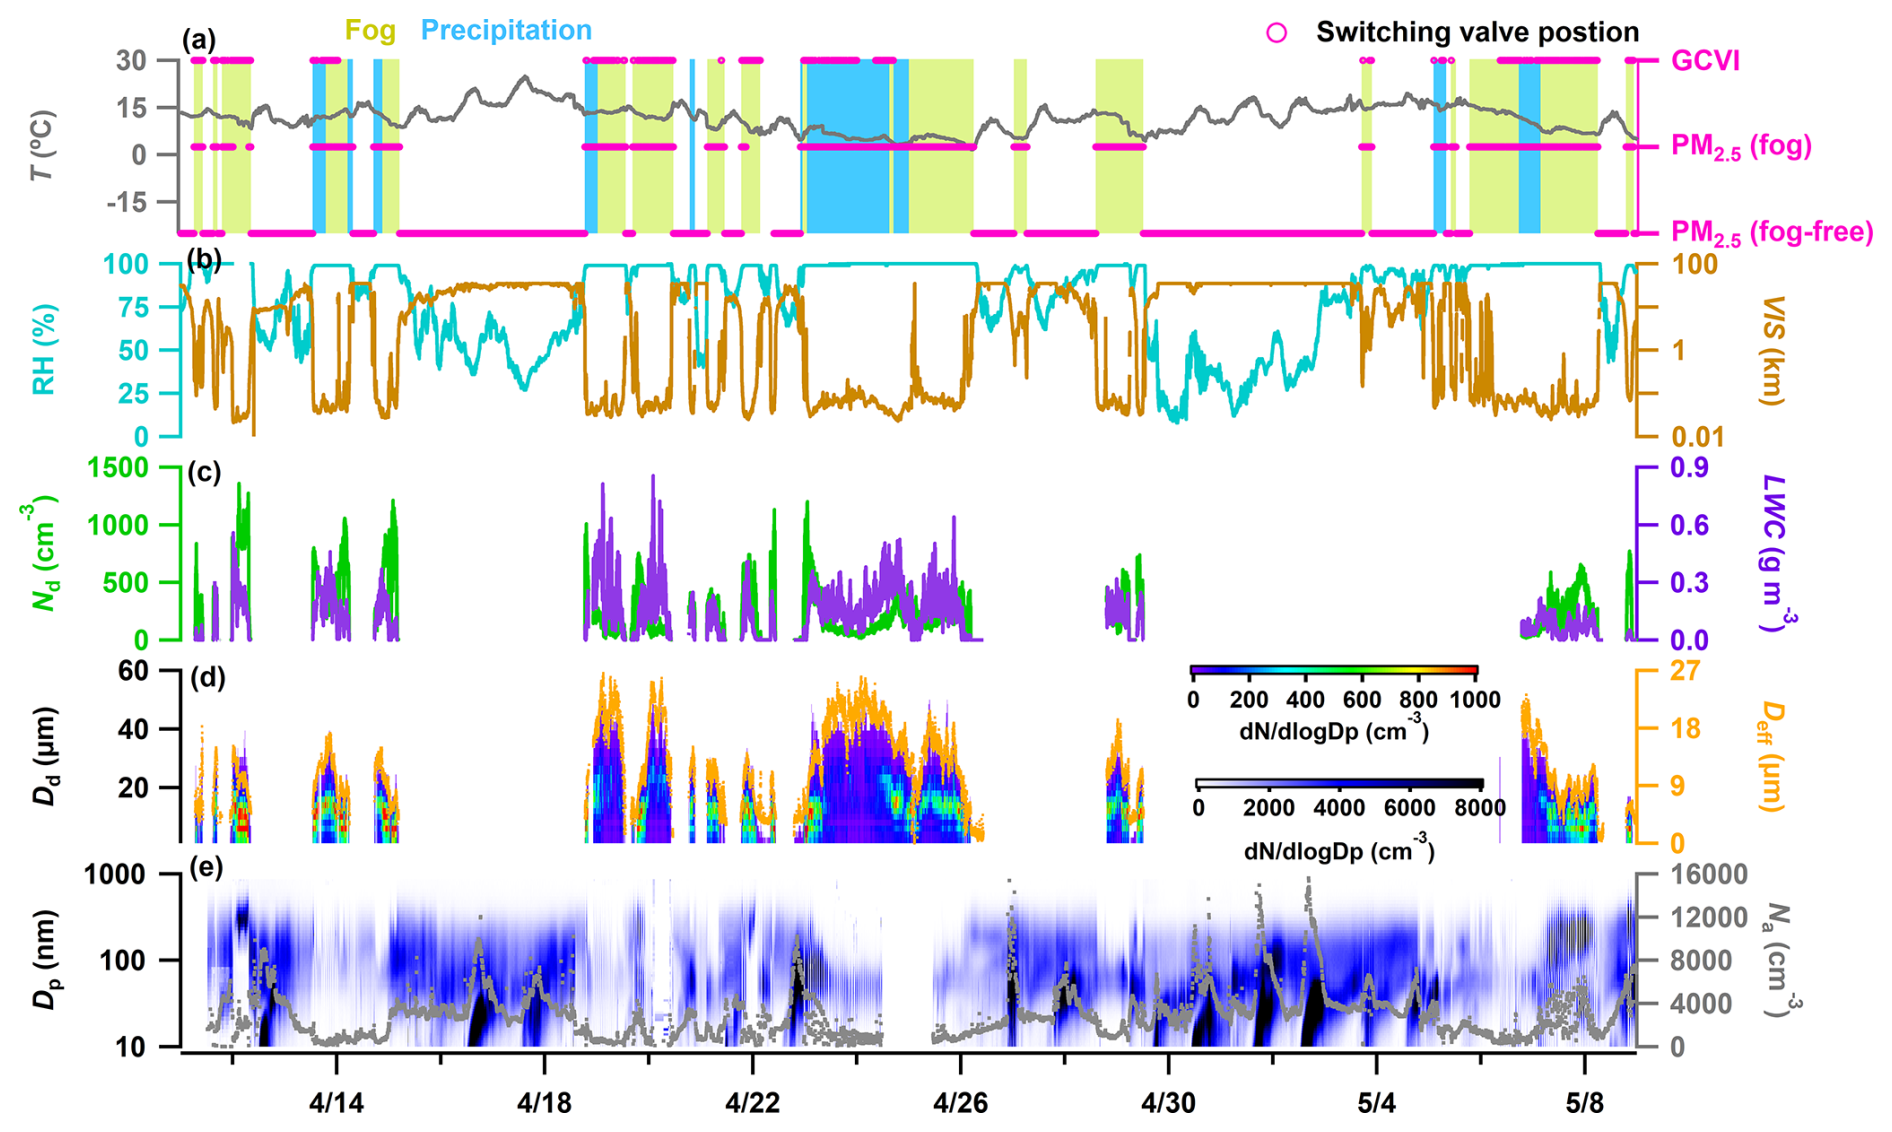
Figure 2Time series of (a) temperature (T), weather conditions and valve position of the switching inlet system, (b) relative humidity (RH) and visibility (VIS), (c) fog droplet number concentration (Nd) and liquid water content (LWC), (d) fog droplet size distribution and effective diameter (Deff), and (e) number size distribution and number concentration (Na) of dry aerosol particles, during this campaign. The Dd and Dp in panels (d) and (e) denote the diameters of fog droplets and aerosol particles, respectively.
3.1 Overview of the observation
Figure 2 shows the temporal variations in meteorological parameters, cloud microphysical parameters, and aerosol size distribution measured in the field observation from 11 April to 8 May, during which the eight available fog events are observed. The temperature was above 0°C during the entire observation period, indicating all of the observed fogs were warm fog processes. The wind speed and direction are shown by a polar plot in Fig. S3. The prevailing wind direction throughout the study period was westerly, with strong winds (exceeding 8 m s−1) primarily originating from the west and southwest. In contrast, during foggy periods, the prevailing wind direction shifted to the northeast, with the main wind speed ranging from 4 to 8 m s−1. The visibility variations at this site exhibited distinct characteristics, with values predominantly concentrated in high and low ranges (Fig. 2b), without the gradual increase or decrease typically observed in urban areas (Qiang et al., 2015; Wang et al., 2015). Moreover, when RH <75 %, the visibility remained above 10 km, whereas it declined below 1 km when RH >95 %. This indicated that low-visibility events at the site were predominantly driven by fog processes during the observation period.
Large ranges of fog microphysical parameters were observed during the campaign. The median values of Nd, LWC, and Deff of the eight fog events varied over the ranges of 146–834 cm−3, 0.009–0.216 g m−3, and 5.5–12.2 µm, respectively (Table 1). The concentration levels of fog droplets varied by orders of magnitude in different environments, ranging from tens in marine and remote background environments (Duplessis et al., 2021; Gultepe et al., 2009) to hundreds in anthropogenically polluted environments (Li et al., 2020; Shen et al., 2018). The variations in Nd and LWC showed a consistent trend during fog formation and dissipation stages. However, after fog formation, the trends of the two variables may diverge (Fig. 2c), which is closely related to the variations in Deff (Fig. 2d). The relationship between Nd and LWC during the eight available fog events is presented in Fig. S4 to further illustrate their correlation. There appears to be no obvious correlation between the overall Nd and LWC. However, when binning Nd and LWC according to Deff values, a notable high linear correlation showed up. This result indicates that using a single parameter to describe cloud microphysical properties may introduce significant uncertainty, which will be further discussed in detail in Sect. 3.5. For a given range of LWC values, Nd generally decreases as Deff increases. This negative correlation between them is ubiquitous in fog, as the presence of more droplets competes for available water vapor, thereby inhibiting their growth (Li et al., 2017).
Although there were few anthropogenic sources near the site, the observed aerosol concentrations varied dramatically. As shown in Fig. 2e, the Na ranged from 230 to 15 620 cm−3, with a median of 2750 cm−3. Episodes with Na exceeding 8000 cm−3 were typically associated with a pronounced increase in aerosol number concentration within the size range of 100–100 nm (Fig. 2e), which were likely driven by new particle formation (Shen et al., 2022). In the subsequent discussion, the pre-fog aerosol concentrations below and above this median were defined as low and high number concentrations of aerosol backgrounds, respectively.
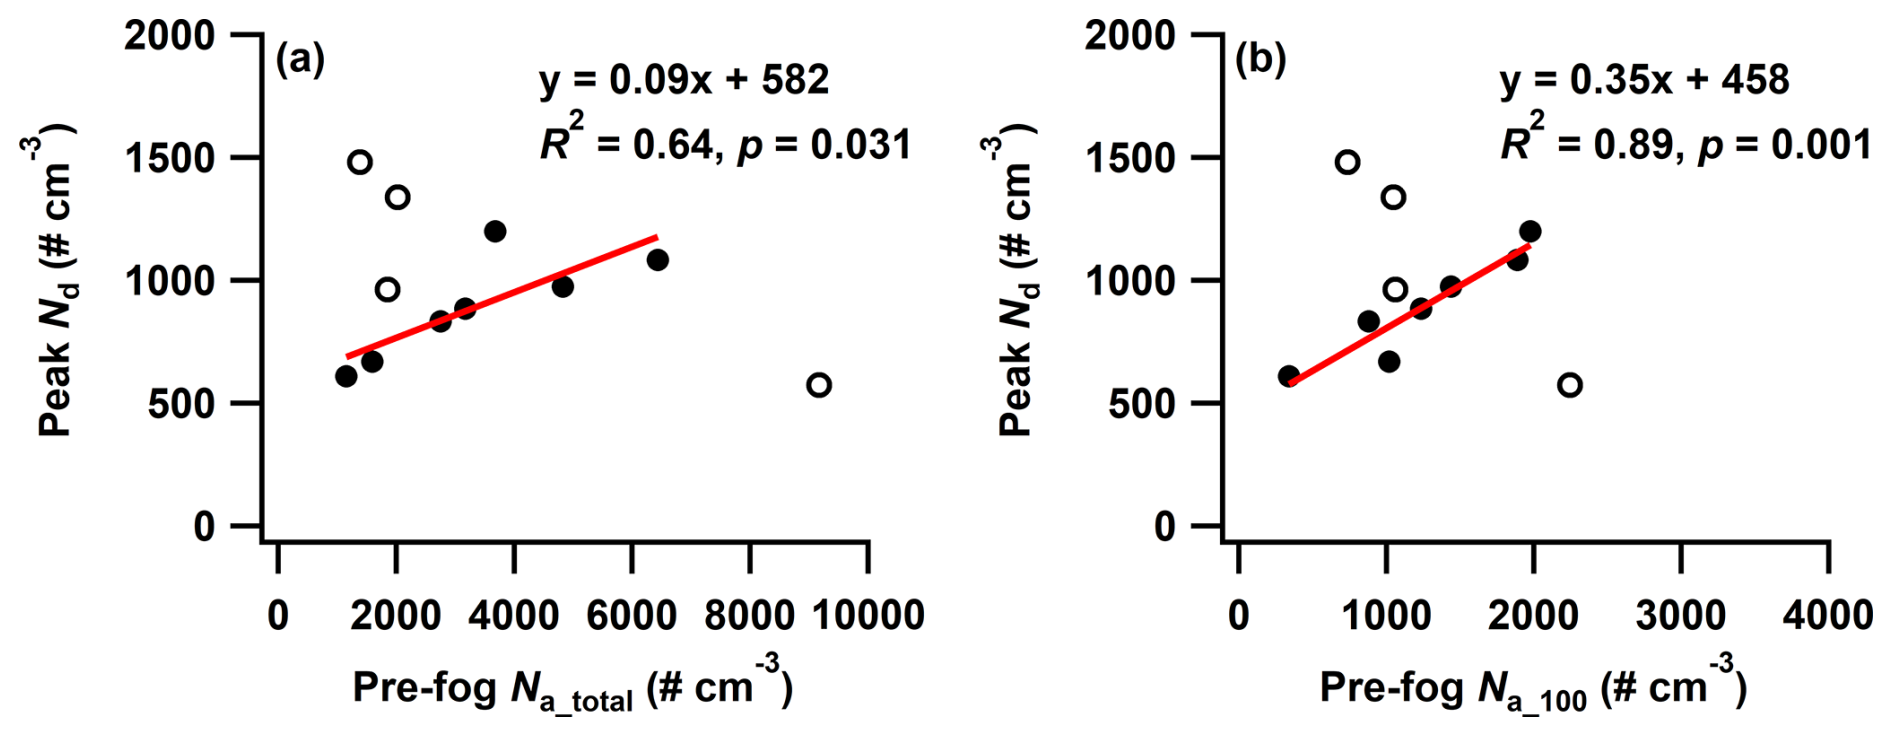
Figure 3Peak Nd value for each fog event versus averaged pre-fog Na in the last hour before the event, measured by TSMPS within the ranges of (a) total measured sizes (10–850 nm) and (b) sizes larger than 100 nm. Hollow circles represent fog events occurring after precipitation, which are excluded from the correlation analysis.
3.2 Relationship between pre-fog aerosols and fog droplets
Previous studies suggested the maximum Nd during the cloud/fog formation period not only was dependent on the SS reached by the air mass (Mazoyer et al., 2019; Pruppacher and Klett, 2010) but also had a high correlation between the pre-fog or cloud base aerosol number concentrations (Na) (Duplessis et al., 2021; Hegg et al., 2012). Pre-fog Na here was defined as the average of the last hour before fog formation. As shown in Fig. 3a, the pre-fog Na_total (integrated concentration from PNSD measured by TSMPS) had a high correlation with the peak Nd for these fog events, indicating the peak Nd was significantly influenced by pre-fog aerosol. Although there is a temporal difference between the observation of pre-fog aerosols and the subsequent fog process at a fixed site, the measured pre-fog aerosol particles may not fully represent the particles that actually activated into fog droplets. However, due to the high altitude of this mountain site, it is located above the top of the boundary layer for most of the day (Sun et al., 2018). The aerosol physicochemical properties at this altitude are relatively homogeneous and regionally representative, resulting in a good correlation between the pre-fog aerosol and the peak Nd. Conversely, the good correlation between them also indicated that the observations at this site were representative of a relatively large spatial scale. This provides a rational basis for estimating water vapor supersaturation using the pre-fog aerosol size distribution in Sect. 3.3. For the fog events that occurred after precipitation (hollow cycles in Fig. 3), the pre-fog Na and the peak Nd did not follow this linear relationship. This further supports that such processes should be removed from analysis of aerosol effects on fog microphysics.
The linear fitting slopes in Fig. 3, primarily depending on aerosol chemical composition and size distribution, can be used to associated with activation ratio of bulk aerosol. The slope value of 0.09 in this study is significantly higher than the 0.014 observed by Duplessis et al. (2021) on the eastern coast of Canada, indicating stronger bulk activity observed at this mountain site. The difference in the slope can be attributed to both different aerosol properties and SS conditions in the studies. The comparison of SS in various observation environments will be discussed in Sect. 3.3. In addition, the concentrations of particle diameter larger than 100 nm (Na_100) or 70 nm (Na_70) had a much stronger correlation with the peak Nd than the peak total pre-fog Na (Figs. S5 and 3b). Previous studies have reported that the peak SS estimated in fogs is typically low (0.03 %–0.05 %) (Mazoyer et al., 2019; Shen et al., 2018), indicating that particles with a size smaller than 70 nm should not be activated in foggy conditions. The result suggests that a proper selection of particle size range is crucial for estimating the peak Nd using pre-fog Na.
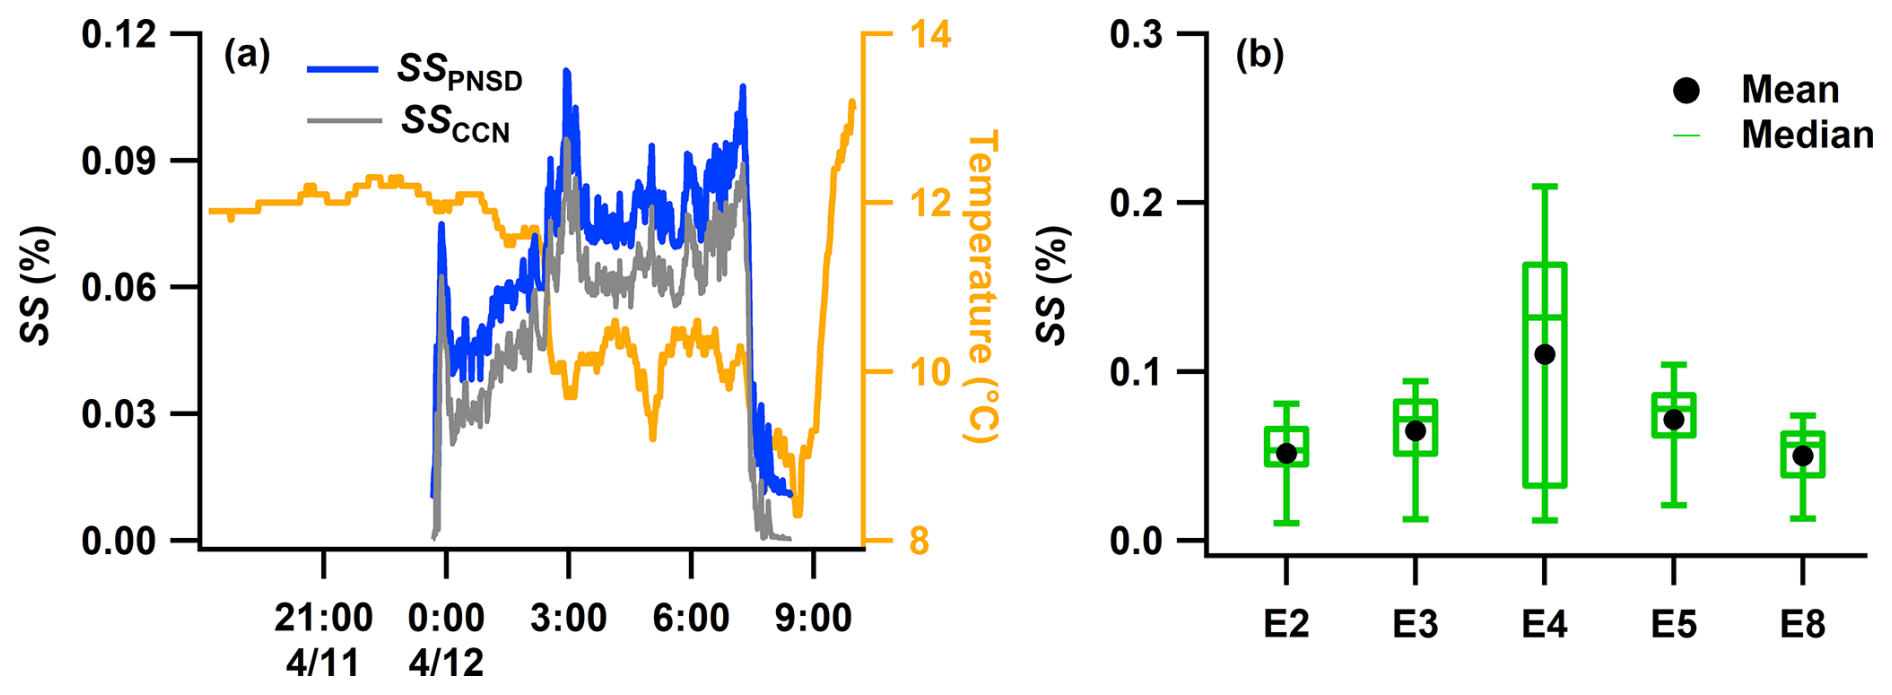
Figure 4Estimated water vapor supersaturation (SS) in fogs. (a) Temporal variations in SSPNSD, SSCCN, and temperature during a typical fog event (E3). (b) Statistics of SS for the five available fog events.
3.3 Estimating water vapor supersaturation in fog
The time series of SSPNSD and SSCCN derived from above two approaches (mentioned in Sect. 2.2.5) during a typical fog event (E3) are shown in Fig. 4a. Although their temporal variations exhibit a high consistence, the mean value of SSPNSD is approximately 30 % higher than SSCCN. Because most SSCCN values are lower than the lowest SS set point (0.1 %), substantial uncertainties were introduced by linear extrapolation when deriving SSCCN. Therefore, the variations in SSPNSD were considered to be closer to the actual situation and were used in subsequent discussions with a brief symbol of SS. Note that the SS estimation here only considered adiabatic processes such as activation and condensation and ignored non-adiabatic processes such as collision–coalescence (Wang et al., 2021). If the reduction of Nd caused by the collision–coalescence process is considered, the actual effective SS should be greater than the calculated value.
After fog formation, the SS had a strong negative correlation (, p<0.001) with ambient temperature (Figs. 4a and S6), indicating that the decrease in temperature played a critical role in supplying sufficient SS for particles activation. Due to incomplete observation data of PNSD or DSD for several fog events during this campaign, here, only five events with complete data of the entire process were available for the SS statistics (Fig. 4b). The median SS values for each fog event varied in the range of 0.05 %–0.13 %, and the 95th quantile values were generally less than 0.1 % except for E4. During the whole observation period, the SS varied between 0.01 % and 0.25 %, with an average of (0.07 ± 0.02) %. This is slightly higher than the fog SS reported in urban (max. 0.05 %, Shen et al., 2018), suburban (median 0.043 %, Mazoyer et al., 2019), and coastal (average 0.037 %, Duplessis et al., 2021) environments but significantly lower than that derived from aircraft measurements of clouds (0.10 %–0.50 %, Gong et al., 2023). The estimated SS in various observation environments seems to be positively correlated with altitude. This can be partly attributed to the lower aerosol number concentration and temperature at high altitudes (Liu et al., 2020b), which reduce excess water vapor consumption in clouds or fog, as well as the equilibrium water vapor pressure (Baccarini et al., 2020; Shen et al., 2018), thereby promoting supersaturation.
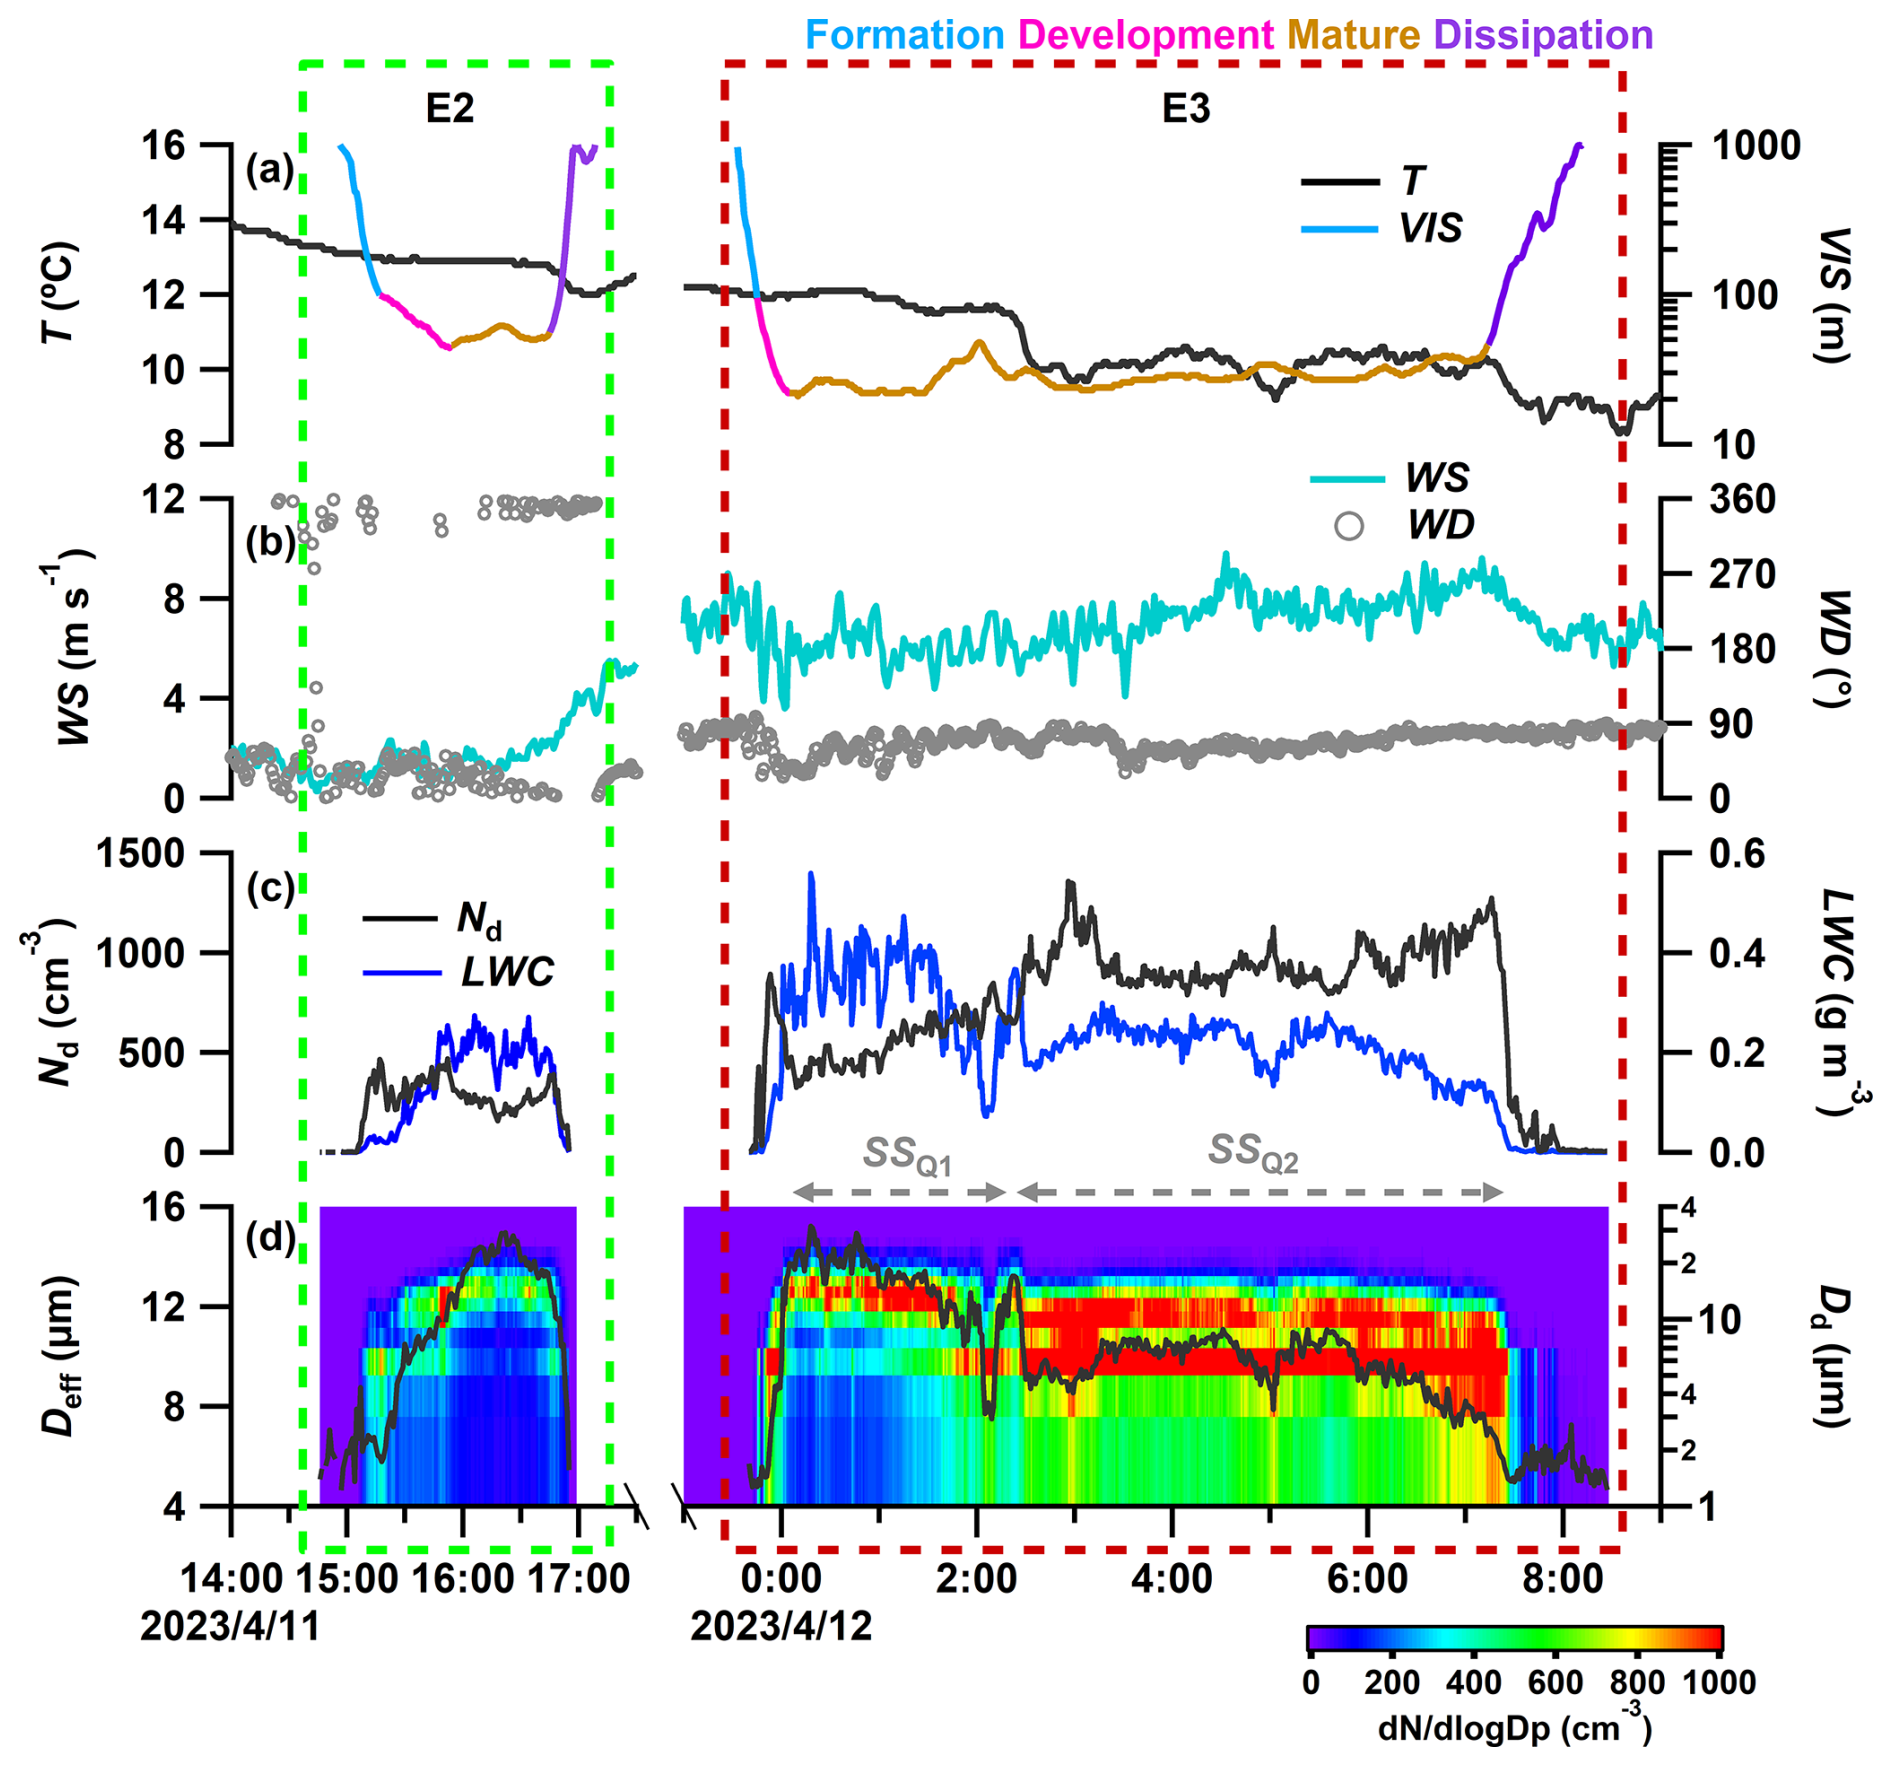
Figure 5Temporal evolution of meteorological parameters and fog microphysical characteristics for two typical fog events, including (a) temperature (T) and visibility (VIS), (b) wind speed (WS) and wind direction (WD), (c) fog droplet number concentration (Nd) and liquid water content (LWC), and (d) fog droplet size distribution and effective diameter (Deff). E2 represents fog occurring under a low pre-fog Na background, while E3 represents fog occurring under a high pre-fog Na background. The colored lines separate each fog event into four stages based on the evolution of visibility.
3.4 Temporal evolution of fog DSD
To explore the temporal evolution of fog, it is common to divide the process into various stages based on changes in visibility (Mazoyer et al., 2022; Niu et al., 2010b; Pilie et al., 1975). Upon this, each fog event in this study was divided into four stages, determined by the changes in visibility computed using a 15 min running average (refer to the color–time divisions in Fig. 5a). In the formation stage (blue line), there was a pronounced decline in visibility from 1000 to 100 m within 20 min for all cases. In the development stage (magenta line), the visibility continued to decrease but at a significantly slower rate until it reached its minimum value. During the mature stage (brown line), the visibility underwent a slight increase or remains stable. Finally, during the dissipation stage (purple line), the visibility increased rapidly to 1000 m. As we know, in situ observations at a fixed site face significant challenges in continuously measuring the evolution of aerosols and fog droplets within a specific air mass. Here, we assume that at a certain height within the fog, the aerosols and fog droplets exhibit similar microphysical characteristics and undergo synchronous variations. Therefore, during a fog process, measurements at different time points at this site can, to some extent, reflect the evolution of the microphysical characteristics of aerosols and cloud droplets at that height.
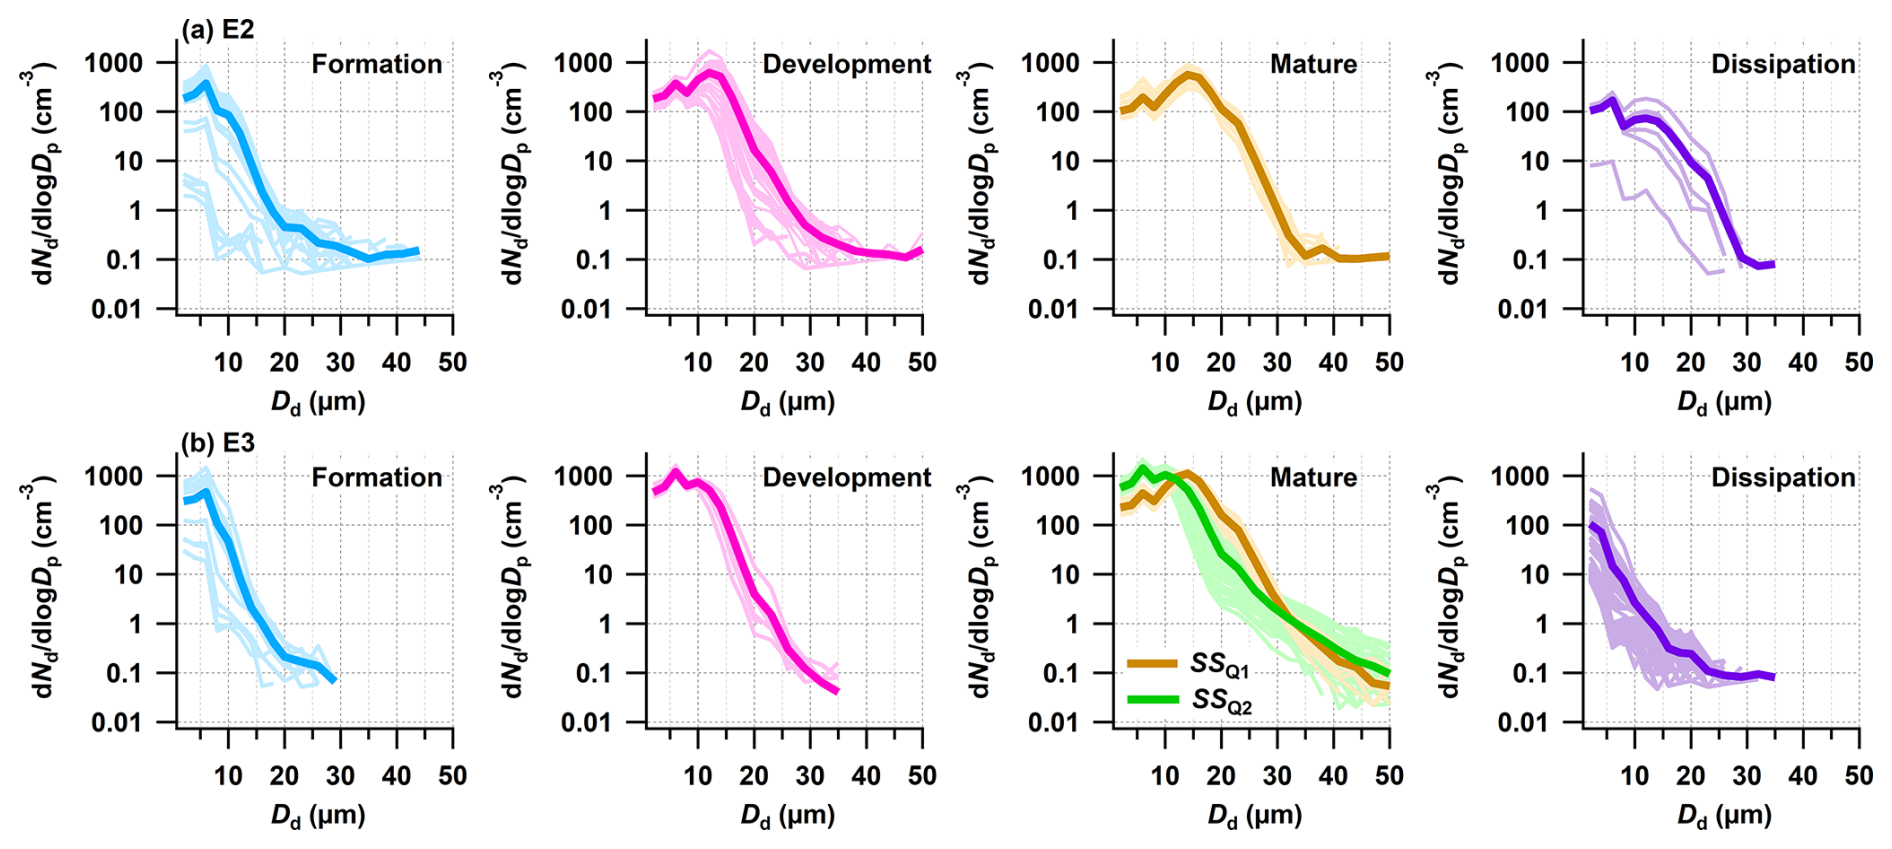
Figure 6Evolution of fog droplet size distribution (DSD) at various stages during (a) E2 and (b) E3, respectively. Thin lines in each stage represent 1 min averaged DSDs, while the thick line is their average. The SSQ1 and SSQ2 in panel (b3) represent the first and second quasi-stationary supersaturation states, respectively. Dd denotes the diameters of fog droplets.
As is shown in Fig. 5, two typical fog events, characterized by low and high pre-fog aerosol concentration conditions, were selected and analyzed in terms of the evolution of their microphysical characteristics. The averaged fog DSD during various stages is shown in Figs. 6 and S7. Similar information for the other three fog events is presented in Figs. S8 and S9. Under low aerosol concentration background (E2), as the supersaturation ratio increases in the formation stage, Nd rapidly reached a peak within a short period, while both LWC and Deff exhibited slow growth (Fig. 5c). This indicated that the fog droplets in this stage were primarily formed through aerosol particle activation processes, which yielded small droplets with diameters less than 6 µm (Fig. 6a). During the development stage, the Nd continued to increase due to persistent activation of aerosol particles, along with both LWC and Deff gradually increasing to their maximum values. Another peak in the fog DSD emerges around 12 µm in this stage (Fig. 6a), indicating that the condensation process began to dominate the broadening of the DSD. In the subsequent mature stage, Nd experienced a significant decrease due to a substantial reduction in small droplets and then maintained a relatively stable value. This indicated that the excess water vapor, defined as the difference of the ambient water vapor pressure and the equilibrium value, was produced and consumed in approximate balance, thus reaching a quasi-stationary supersaturation state. Compared to the development stage, Deff notably increased at this stage, with the main peak of the DSD shifting from 12 to 15 µm and an additional considerable peak appearing at 23 µm (Fig. 6a). These changes in fog microphysical characteristics suggest the occurrence of a collision–coalescence process, leading to further broadening of the DSD towards larger sizes. After triggering the collision–coalescence mechanism, apart from small fog droplets, certain un-activated aerosol particles were scavenged by the uptake of larger fog droplets. This can be supported by variations in the activation ratio (AR) of cloud residual particles. Here, the AR was defined as the CCN number concentration measured by the CCNc relative to the total particle concentration (10–850 nm). If fog residual particles enter droplets though an activation process, these particles should also be activated in the CCNc column, where different SS conditions can be set. Therefore, the concentrations measured by CCNc and TSMPS downstream of the GCVI inlet should be consistent; i.e., the AR should be approximate 1, especially for high SS set points. Figure 7 shows the variation in AR with Deff at SS =0.2 %, while the results for other SS set points are provided in Fig. S10. As shown, the AR measured downstream of the GCVI airflow was close to 1 when the Deff was smaller than 12 µm. However, when the collision–coalescence process occurred, indicated by Deff exceeding 12 µm (Fig. 5d), the AR of fog residual particles notably decreased. The reduced AR of fog residual particles was caused by the uptake of particles less prone to activation into droplets, implying the removal efficiency for these particles significantly enhanced in this stage. Besides that, both SS and LWC fluctuate around a stable value in the mature stage (Fig. 5c), indicating that evaporation and condensation of water vapor were in a quasi-equilibrium state. In the dissipation stage, Nd and LWC decline rapidly to zero, with a gradual disappearance of droplets in the DSD from large to small sizes (Fig. 6a).
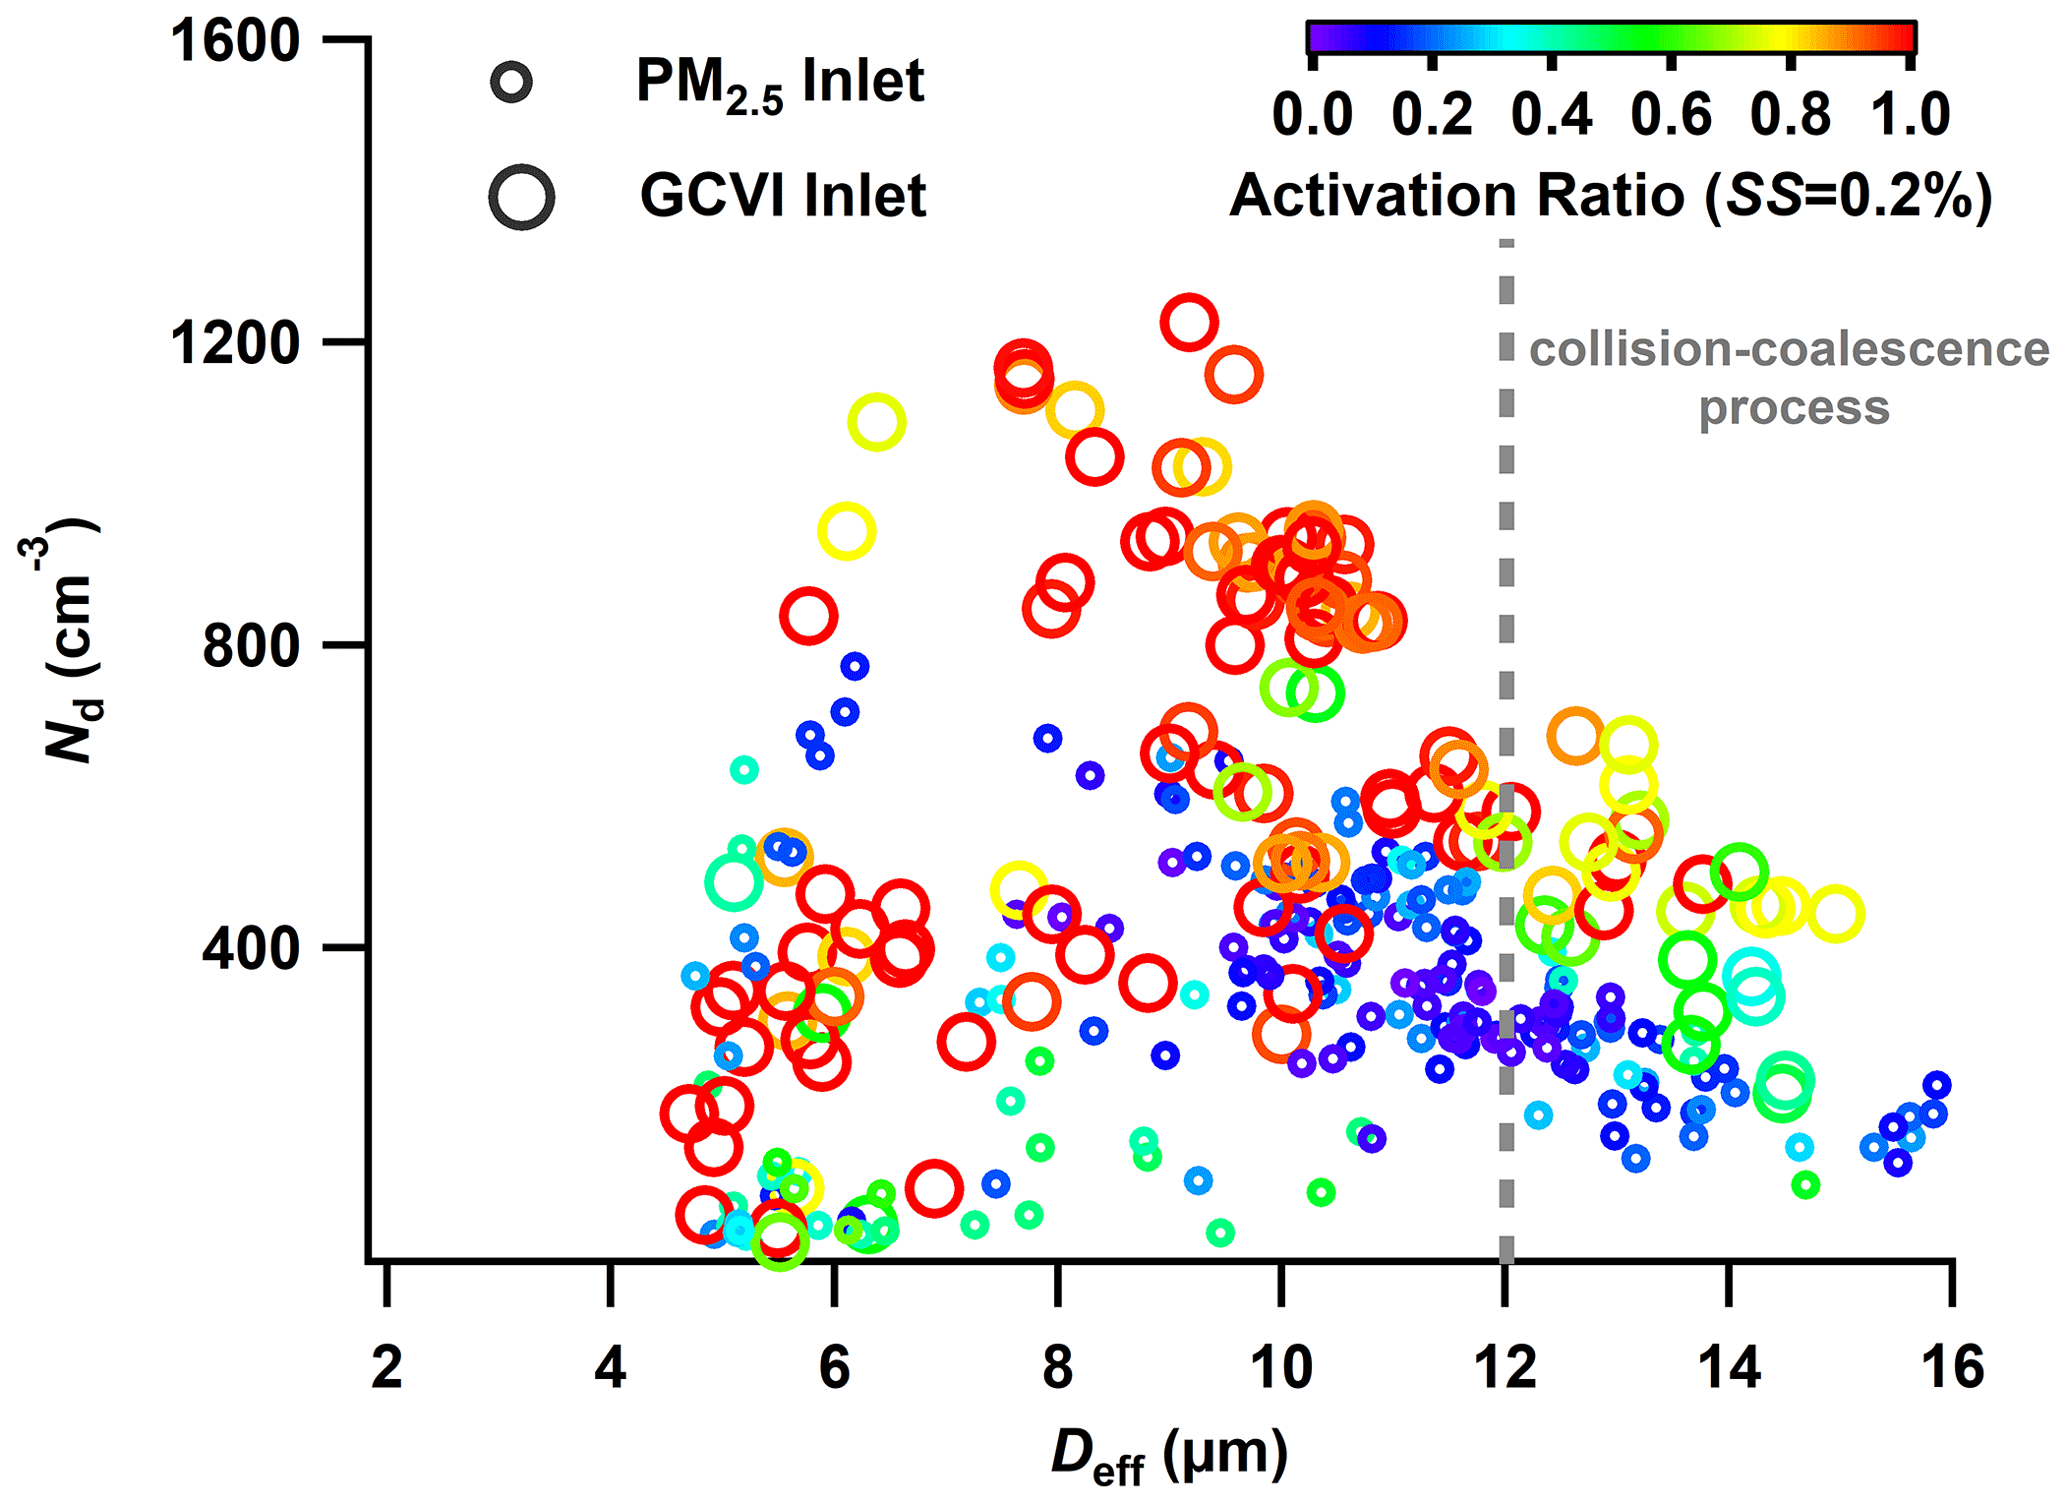
Figure 7Differences in CCN activity between fog residual particles (GCVI inlet) and fog interstitial particles (PM2.5 inlet) and their variations with fog microphysical parameters. The dashed gray line indicates significant collision–coalescence processes occurring when Deff exceeds 12 µm.
Under high aerosol concentration background (E3, in Fig. 5), the evolution of fog microphysical characteristics during the formation and development stages was generally consistent with those in E2. However, after reaching and maintaining a quasi-stationary supersaturation state (SSQ1) in the early mature stage, a notable decrease in temperature occurred (Fig. 5a) without obvious changes in wind direction and speed (Fig. 5b). This decrease caused an increase in both excess water vapor pressure and supersaturation, as the temperature-dependent equilibrium vapor pressure dropped faster than the ambient partial vapor pressure. Consequently, a new quasi-stationary supersaturation state (SSQ2) was established, exhibiting distinct fog microphysical characteristics (Fig. 6b). Compared to SSQ1, the Nd substantially increased in the SSQ2 stage, while the LWC and Deff notably decreased (Fig. 5c). The enhanced SS facilitated the further activation of smaller particles that were un-activated during the SSQ1 stage, resulting in a secondary activation-dominated process during E3 (Figs. 5d and 6b). During this secondary activation process, a greater number of small droplets formed and competed for the limited water vapor, which led to a decrease in the Deff (Fig. 6b).
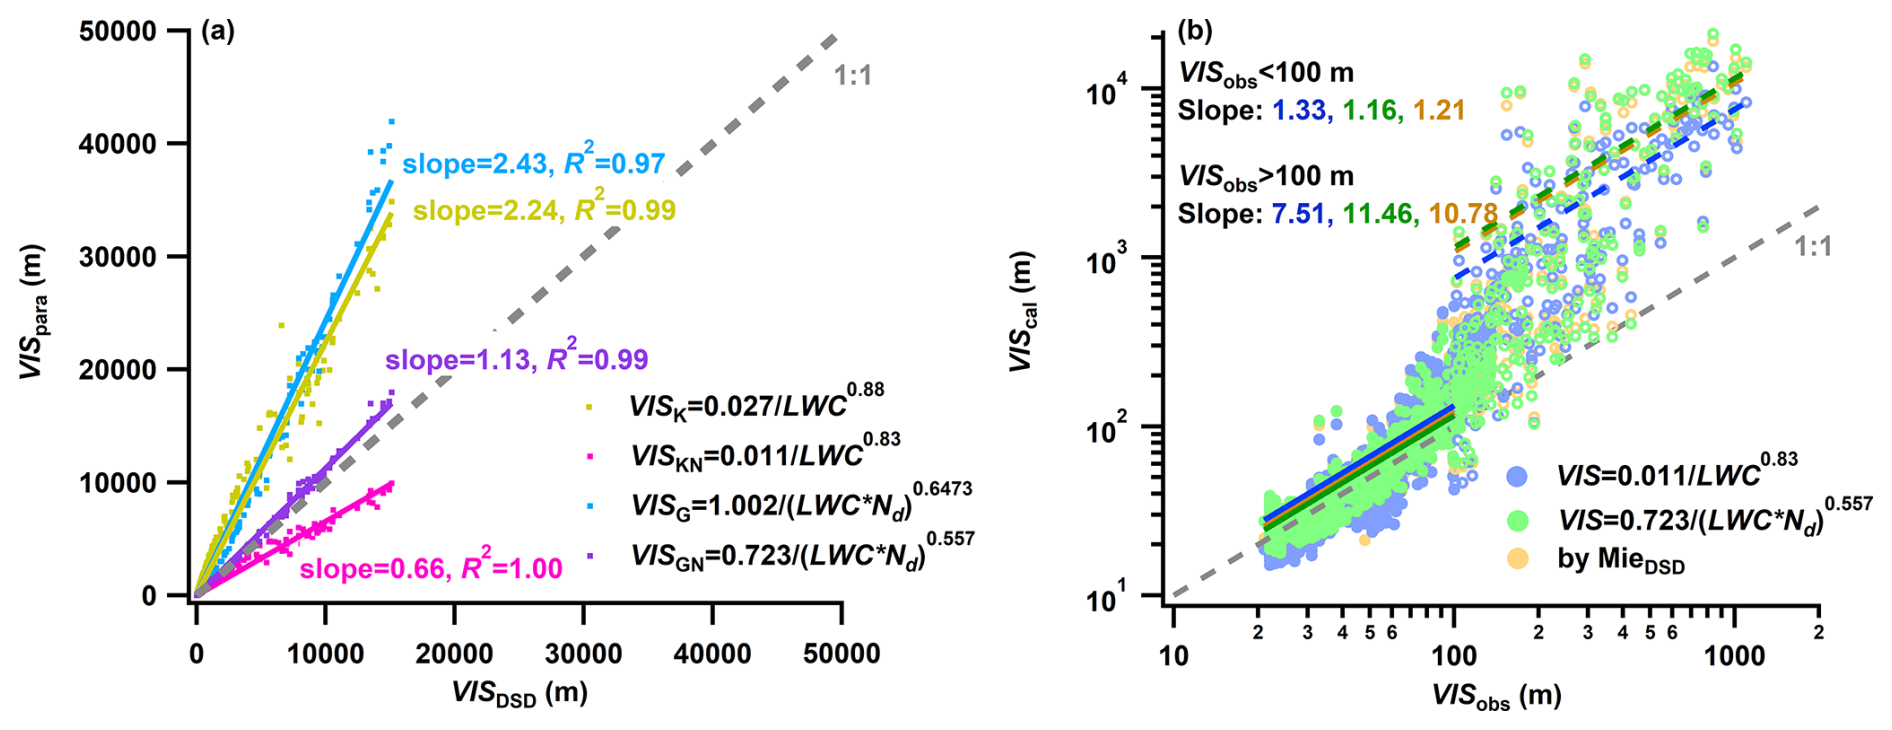
Figure 8Estimation of fog visibility using different calculation methods. (a) Comparison of various visibility parameterization schemes with that derived from droplet size distribution (VISDSD). (b) Relationship between calculated visibility (VIScal) and observed visibility (VISobs). Solid lines represent linear fits of different calculation methods with VISobs≤100 m, while dashed lines represent fits for 100 m m.
3.5 Links between fog microphysical parameters and visibility
3.5.1 Comparison of different fog visibility estimation methods
Given that visibility degradation is the primary hazard during fog events, establishing an appropriate visibility parameterization scheme in fog is crucial for improving the accuracy of fog visibility forecasts. Compared to the parameterization schemes of fog visibility, Mie theory incorporates a specific extinction algorithm based on physical processes. Therefore, the fog visibility derived from fog DSD and Mie theory (VISDSD) is expected to better reflect actual conditions, which can serve as a reference for fog visibility parameterization. In this study, we re-established the parameters a, b, c, and d in Eqs. (6)–(7) using our measured data. The reconstructed visibility calculations were denoted as VISKN for the LWC-only parameterization and VISGN for the LWC ⋅Nd parameterization. Figure 8a presents a comparison of the calculated visibility based on different parameterization schemes with VISDSD. Compared to VISK and VISG, the deviations of VISKN and VISGN from VISDSD are significantly reduced, especially for VISGN, which has a linear fitting slope of 1.1. This indicates that the dual-parameter scheme of LWC ⋅Nd can better describes visibility degradation contributed by fog droplets. The visibility degradation contributed by fog droplets is determined by fog droplet size distribution. Meanwhile, the fog microphysical parameters of Nd, LWC, and Deff are derived from the measurement of fog droplet size distribution (Eqs. 1–3). When both LWC and Nd values are given, the information of Deff can also be determined (Fig. S4). Compared to the LWC-only parameterization, the LWC ⋅Nd parameterization can better characterize the fog droplet size distribution and therefore is expected to be more accurate in fog visibility forecasts.
To further evaluate the applicability of the VIS calculation methods mentioned above, we compared these calculated results with the visibility measured by a visibility meter (Fig. 8b). The LWC and VIS exhibited an exponential relationship, with an inflection point appearing at ∼ 100 m (Fig. S11). Accordingly, the relevant data were analyzed by dividing them into two intervals: VISobs≤100 m and 100 m m. The results showed that the visibility calculation methods used in Fig. 8b tended to be slightly overestimated to different degrees, with the linear fit slopes being 1.33 for VISKN, 1.16 for VISGN, and 1.21 for VISDSD. The dual-parameter method of LWC ⋅Nd yielded a smaller deviation than that of the LWC-only method. However, when 100 m m, the VIS calculated from the three methods was substantially higher than VISobs, with no obvious correlations between them. This large difference was induced by the visibility data used for the development of visibility parameterizations relying on Mie calculations rather than observed results from a visibility sensor. Additionally, the parameterization schemes in those studies were derived from observations in relatively clean areas, where visibility degradation is predominantly caused by fog droplets. However, these schemes would induce large uncertainties in visibility calculations in polluted areas, such as the North China Plain (Zhang et al., 2014), where aerosol concentration and extinction contribution can be much higher, especially in light fogs.
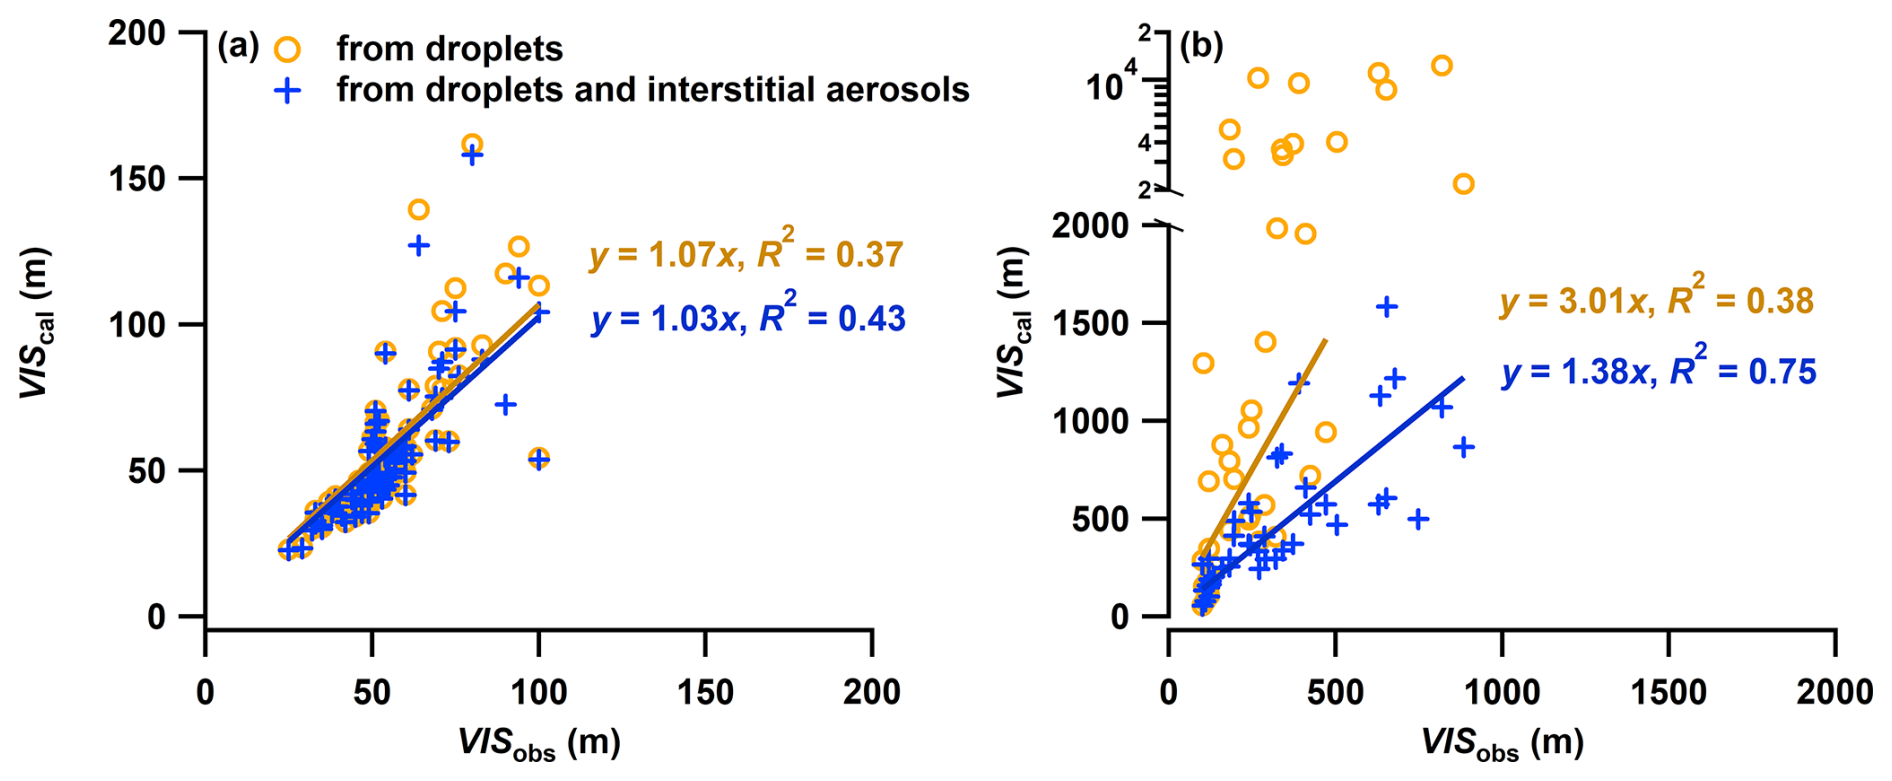
Figure 9Estimating visibility based on only fog droplets and both fog droplets and interstitial particles, respectively. (a) VISobs≤100 m and (b) 100 m m. Note that values of VIScal larger than 2000 m have been excluded from the linear fit due to their substantial deviation.
3.5.2 Aerosol effects on estimating fog visibility
To quantitatively estimate the aerosol contribution on visibility degradation in fog, the dry PNSD of cloud/fog interstitial particles was used to calculate their extinction. Due to the lack of aerosol particle hygroscopic growth factor of aerosol particles under supersaturated conditions, a rough estimation method was proposed to convert dry PNSD to ambient PNSD. This method was based on the continuity of the PNSD and assumed that the maximum dry particle size of fog interstitial particles, after hygroscopic growth under supersaturated conditions, corresponded to the cut size of the sampling inlet (PM2.5 cyclone). It also assumed that the hygroscopic growth factor was constant across different particle sizes. Based on these assumptions, the hygroscopic growth factor of particles under supersaturated conditions can be obtained (Fig. S12). Then the ambient aerosol contribution on visibility can be calculated based on Mie theory.
Figure 9 shows the comparison of visibility estimation based on only fog droplets and both fog droplets and interstitial particles, respectively. When VISobs≤100 m, the high concentration and large size of the fog droplets dominate the visibility degradation. In this situation, the extinction effect of aerosols can be neglected. However, when 100 m m, estimating visibility based on only fog droplet extinction led to substantial deviations, whereas considering both fog droplet and aerosol extinction significantly reduced the discrepancy between calculated and observed VIS. The comparison highlights the importance of considering both fog droplet and aerosol extinction in visibility forecasting during light fog conditions, particularly in polluted regions affected by anthropogenic emissions.
To explore interactions between aerosols and fog microphysics and their impacts on visibility degradation, this study conducted simultaneous measurements of aerosol and fog microphysical characteristics in spring 2023 at the summit of Mt. Daming (1483 m), located in the YRD region, China. During this campaign, eight fog events were observed. The median values of Nd, LWC, and Deff for the eight fog events varied within the ranges of 146–834 cm−3, 0.009–0.216 g m−3, and 5.5–12.2 µm, respectively. A strong correlation was found between pre-fog Na and the peak Nd of each fog event, implying the potential influence of pre-existing aerosol levels on fog microphysics. Two approaches for deriving SS within fogs were proposed, based on measurements of PNSD and SS-resolved CCN concentration, respectively. The averaged SS for these fogs was estimated to 0.07 % ± 0.02 %, slightly higher than previous estimates in urban, suburban, and coastal environments but significantly lower than that derived from aircraft measurements. During the course of fog, temperature reduction played a critical role in supplying sufficient SS for particles activation.
Each fog event was divided into formation, development, mature, and dissipation stages according to visibility variations. Various mechanisms dominated the broadening of DSD at different stages, leading to a shift from a unimodal to a trimodal DSD, with peaks observed around 6, 12, and 23 µm. The formation of trimodal DSD was driven by a collision–coalescence mechanism during the mature stage of fog, characterized by the Deff exceeding 12 µm. Meanwhile, analysis of the activity of cloud residual particles suggests that apart from small fog droplets, certain un-activated aerosol particles were scavenged by the uptake of larger fog droplets in this stage. For fog events occurring under a high Na background, a notable decrease in temperature during the mature stage promoted a secondary activation-dominated process, resulting in the formation of numerous small fog droplets and reduction in the large droplet size.
The visibility parameterization schemes based on fog microphysical parameters are widely used to estimate fog visibility. The fitting parameters of different VIS parameterization schemes were re-established based on our measuring data. The comparison results indicate that the dual-parameter scheme of LWC ⋅Nd can better describes visibility degradation contributed by fog droplets. However, estimation of fog visibility based on only fog droplet extinction led to substantial deviations when 100 m m. The deviations were notably reduced by incorporating the extinction caused by fog interstitial particles. These findings emphasize the necessity of incorporating both fog droplet and aerosol extinction in fog visibility forecasts, particularly in regions impacted by anthropogenic pollution.
All data in this paper are available from the authors upon request (liuq@cma.gov.com).
The supplement related to this article is available online at https://doi.org/10.5194/acp-25-3253-2025-supplement.
Conceptualization: QL and JS. Investigation: QL, XS, JS, YZ, BQ, QM, LH, HX, XH, JL, SL, and AY. Funding acquisition: QL, XS, and HC. Resources: QL, JS, XS, YZ, and XZ. Writing (original draft preparation): QL. All co-authors discussed the results and commented on the manuscript.
The contact author has declared that none of the authors has any competing interests.
Publisher's note: Copernicus Publications remains neutral with regard to jurisdictional claims made in the text, published maps, institutional affiliations, or any other geographical representation in this paper. While Copernicus Publications makes every effort to include appropriate place names, the final responsibility lies with the authors.
The authors would like to thank the dedicated staff members at the observation site for their efforts. Moreover, we thank the two anonymous reviewers for the helpful comments and discussions.
This research has been supported by the National Natural Science Foundation of China (grant nos. 42275121, 42030608, 42475121, 42275098), the China Meteorological Administration (CXFZ2024J039), and the Chinese Academy of Meteorological Sciences (grant nos. 2023Z012, 2024Z006, 2022KJ002).
This paper was edited by Guangjie Zheng and reviewed by two anonymous referees.
Andreae, M. and Rosenfeld, D.: Aerosol-cloud-precipitation interactions. Part 1. The nature and sources of cloud-active aerosols, Earth-Sci. Rev., 89, 13–41, https://doi.org/10.1016/j.earscirev.2008.03.001, 2008.
Baccarini, A., Karlsson, L., Dommen, J., Duplessis, P., Vüllers, J., Brooks, I. M., Saiz-Lopez, A., Salter, M., Tjernström, M., Baltensperger, U., Zieger, P., and Schmale, J.: Frequent new particle formation over the high Arctic pack ice by enhanced iodine emissions, Nat. Commun., 11, 4924, https://doi.org/10.1038/s41467-020-18551-0, 2020.
Bi, X., Lin, Q., Peng, L., Zhang, G., Wang, X., Brechtel, F. J., Chen, D., Li, M., Peng, P. A., Sheng, G., and Zhou, Z.: In situ detection of the chemistry of individual fog droplet residues in the Pearl River Delta region, China, J. Geophys. Res.-Atmos., 121, 9105–9116, https://doi.org/10.1002/2016JD024886, 2016.
Boutle, I., Finnenkoetter, A., Lock, A., and Wells, O.: The London Model: Forecasting fog at 333 m resolution, Q. J. Roy. Meteor. Soc., 142, 360–371, https://doi.org/10.1002/qj.2656, 2015.
Boutle, I., Price, J., Kudzotsa, I., Kokkola, H., and Romakkaniemi, S.: Aerosol–fog interaction and the transition to well-mixed radiation fog, Atmos. Chem. Phys., 18, 7827–7840, https://doi.org/10.5194/acp-18-7827-2018, 2018.
Canagaratna, M. R., Jayne, J. T., Jimenez, J. L., Allan, J. D., Alfarra, M. R., Zhang, Q., Onasch, T. B., Drewnick, F., Coe, H., Middlebrook, A., Delia, A., Williams, L. R., Trimborn, A. M., Northway, M. J., DeCarlo, P. F., Kolb, C. E., Davidovits, P., and Worsnop, D. R.: Chemical and microphysical characterization of ambient aerosols with the aerodyne aerosol mass spectrometer, Mass Spectrom. Rev., 26, 185–222, https://doi.org/10.1002/mas.20115, 2007.
DeCarlo, P. F., Kimmel, J. R., Trimborn, A., Northway, M. J., Jayne, J. T., Aiken, A. C., Gonin, M., Fuhrer, K., Horvath, T., Docherty, K. S., Worsnop, D. R., and Jimenez, J. L.: Field-Deployable, High-Resolution, Time-of-Flight Aerosol Mass Spectrometer, Anal. Chem., 78, 8281–8289, https://doi.org/10.1021/ac061249n, 2006.
Deng, Z., Zhao, C., Zhang, Q., Huang, M., and Ma, X.: Statistical analysis of microphysical properties and the parameterization of effective radius of warm clouds in Beijing area, Atmos. Res., 93, 888–896, https://doi.org/10.1016/j.atmosres.2009.04.011, 2009.
Duplessis, P., Bhatia, S., Hartery, S., Wheeler, M. J., and Chang, R. Y. W.: Microphysics of aerosol, fog and droplet residuals on the Canadian Atlantic coast, Atmos. Res., 264, 105859, https://doi.org/10.1016/j.atmosres.2021.105859, 2021.
Dusek, U., Frank, G. P., Hildebrandt, L., Curtius, J., Schneider, J., Walter, S., Chand, D., Drewnick, F., Hings, S., Jung, D., Borrmann, S., and Andreae, M. O.: Size Matters More Than Chemistry for Cloud-Nucleating Ability of Aerosol Particles, Science, 312, 1375–1378, https://doi.org/10.1126/science.1125261, 2006.
Eldridge, R. G.: A few fog drop-size distributions, J. Atmos. Sci., 18, 671–676, https://doi.org/10.1175/1520-0469(1961)018<0671:AFFDSD>2.0.CO;2, 1961.
Elias, T., Haeffelin, M., Drobinski, P., Gomes, L., Rangognio, J., Bergot, T., Chazette, P., Raut, J.-C., and Colomb, M.: Particulate contribution to extinction of visible radiation: Pollution, haze, and fog, Atmos. Res., 92, 443–454, https://doi.org/10.1016/j.atmosres.2009.01.006, 2009.
Ervens, B., Feingold, G., and Kreidenweis, S. M.: Influence of water-soluble organic carbon on cloud drop number concentration, J. Geophys. Res.-Atmos., 110, https://doi.org/10.1029/2004JD005634, 2005.
Fan, J., Wang, Y., Rosenfeld, D., and Liu, X.: Review of Aerosol–Cloud Interactions: Mechanisms, Significance, and Challenges, J. Atmos. Sci., 73, 4221–4252, https://doi.org/10.1175/jas-d-16-0037.1, 2016.
Gong, X., Wang, Y., Xie, H., Zhang, J., Lu, Z., Wood, R., Stratmann, F., Wex, H., Liu, X., and Wang, J.: Maximum Supersaturation in the Marine Boundary Layer Clouds Over the North Atlantic, AGU Advances, 4, e2022AV000855, https://doi.org/10.1029/2022AV000855, 2023.
Gultepe, I. and Milbrandt, J. A.: Microphysical Observations and Mesoscale Model Simulation of a Warm Fog Case during FRAM Project, Pure Appl. Geophys., 164, 1161–1178, https://doi.org/10.1007/s00024-007-0212-9, 2007.
Gultepe, I., Müller, M. D., and Boybeyi, Z.: A New Visibility Parameterization for Warm-Fog Applications in Numerical Weather Prediction Models, J. Appl. Meteorol. Clim., 45, 1469–1480, https://doi.org/10.1175/JAM2423.1, 2006.
Gultepe, I., Pearson, G., Milbrandt, J. A., Hansen, B., Platnick, S., Taylor, P., Gordon, M., Oakley, J. P., and Cober, S. G.: The Fog Remote Sensing and Modeling Field Project, B. Am. Meteor. Soc., 90, 341–360, https://doi.org/10.1175/2008BAMS2354.1, 2009.
Gultepe, I., Zhou, B., Milbrandt, J., Bott, A., Li, Y., Heymsfield, A. J., Ferrier, B., Ware, R., Pavolonis, M., Kuhn, T., Gurka, J., Liu, P., and Cermak, J.: A review on ice fog measurements and modeling, Atmos. Res., 151, 2–19, https://doi.org/10.1016/j.atmosres.2014.04.014, 2015.
Gysel, M., Crosier, J., Topping, D. O., Whitehead, J. D., Bower, K. N., Cubison, M. J., Williams, P. I., Flynn, M. J., McFiggans, G. B., and Coe, H.: Closure study between chemical composition and hygroscopic growth of aerosol particles during TORCH2, Atmos. Chem. Phys., 7, 6131–6144, https://doi.org/10.5194/acp-7-6131-2007, 2007.
Hammer, E., Gysel, M., Roberts, G. C., Elias, T., Hofer, J., Hoyle, C. R., Bukowiecki, N., Dupont, J.-C., Burnet, F., Baltensperger, U., and Weingartner, E.: Size-dependent particle activation properties in fog during the ParisFog 2012/13 field campaign, Atmos. Chem. Phys., 14, 10517–10533, https://doi.org/10.5194/acp-14-10517-2014, 2014.
Hegg, D. A., Covert, D. S., Jonsson, H. H., and Woods, R. K.: A simple relationship between cloud drop number concentration and precursor aerosol concentration for the regions of Earth's large marine stratocumulus decks, Atmos. Chem. Phys., 12, 1229–1238, https://doi.org/10.5194/acp-12-1229-2012, 2012.
Jia, X., Quan, J., Zheng, Z., Liu, X., Liu, Q., He, H., and Liu, Y.: Impacts of Anthropogenic Aerosols on Fog in North China Plain, J. Geophys. Res.-Atmos., 124, 252–265, https://doi.org/10.1029/2018JD029437, 2019.
Karlsson, L., Krejci, R., Koike, M., Ebell, K., and Zieger, P.: A long-term study of cloud residuals from low-level Arctic clouds, Atmos. Chem. Phys., 21, 8933–8959, https://doi.org/10.5194/acp-21-8933-2021, 2021.
Koračin, D., Dorman, C. E., Lewis, J. M., Hudson, J. G., Wilcox, E. M., and Torregrosa, A.: Marine fog: A review, Atmos. Res., 143, 142–175, https://doi.org/10.1016/j.atmosres.2013.12.012, 2014.
Koschmieder, H.: Theorie der horizontalen Sichtweite, Beitrage zur Physik der freien Atmosphare, 12, 33–53, 1924.
Kunkel, B. A.: Parameterization of Droplet Terminal Velocity and Extinction Coefficient in Fog Models, J. Appl. Meteorol., 23, 34–41, https://doi.org/10.1175/1520-0450(1984)023<0034:PODTVA>2.0.CO;2, 1984.
Li, J., Zhu, C., Chen, H., Zhao, D., Xue, L., Wang, X., Li, H., Liu, P., Liu, J., Zhang, C., Mu, Y., Zhang, W., Zhang, L., Herrmann, H., Li, K., Liu, M., and Chen, J.: The evolution of cloud and aerosol microphysics at the summit of Mt. Tai, China, Atmos. Chem. Phys., 20, 13735–13751, https://doi.org/10.5194/acp-20-13735-2020, 2020.
Li, S., Joseph, E., Min, Q., and Yin, B.: Multi-year ground-based observations of aerosol-cloud interactions in the Mid-Atlantic of the United States, J. Quant. Spectrosc. Ra., 188, 192–199, https://doi.org/10.1016/j.jqsrt.2016.02.004, 2017.
Liu, D., Hu, K., Zhao, D., Ding, S., Wu, Y., Zhou, C., Yu, C., Tian, P., Liu, Q., Bi, K., Wu, Y., Hu, B., Ji, D., Kong, S., Ouyang, B., He, H., Huang, M., and Ding, D.: Efficient Vertical Transport of Black Carbon in the Planetary Boundary Layer, Geophys. Res. Lett., 47, e2020GL088858, https://doi.org/10.1029/2020gl088858, 2020a.
Liu, Q., Liu, D., Gao, Q., Tian, P., Wang, F., Zhao, D., Bi, K., Wu, Y., Ding, S., Hu, K., Zhang, J., Ding, D., and Zhao, C.: Vertical characteristics of aerosol hygroscopicity and impacts on optical properties over the North China Plain during winter, Atmos. Chem. Phys., 20, 3931–3944, https://doi.org/10.5194/acp-20-3931-2020, 2020b.
Liu, Q., Shen, X., Li, L., Sun, J., Liu, Z., Zhu, W., Zhong, J., Zhang, Y., Hu, X., Liu, S., Che, H., and Zhang, X.: Impacts of Aerosol Chemical Composition on Cloud Condensation Nuclei (CCN) Activity during Wintertime in Beijing, China, Remote Sens., 15, 4119, https://doi.org/10.3390/rs15174119, 2023.
Lu, C., Niu, S., Liu, Y., and Vogelmann, A. M.: Empirical relationship between entrainment rate and microphysics in cumulus clouds, Geophys. Res. Lett., 40, 2333–2338, https://doi.org/10.1002/grl.50445, 2013.
Martinet, P., Cimini, D., Burnet, F., Ménétrier, B., Michel, Y., and Unger, V.: Improvement of numerical weather prediction model analysis during fog conditions through the assimilation of ground-based microwave radiometer observations: a 1D-Var study, Atmos. Meas. Tech., 13, 6593–6611, https://doi.org/10.5194/amt-13-6593-2020, 2020.
Mazoyer, M., Lac, C., Thouron, O., Bergot, T., Masson, V., and Musson-Genon, L.: Large eddy simulation of radiation fog: impact of dynamics on the fog life cycle, Atmos. Chem. Phys., 17, 13017–13035, https://doi.org/10.5194/acp-17-13017-2017, 2017.
Mazoyer, M., Burnet, F., Denjean, C., Roberts, G. C., Haeffelin, M., Dupont, J.-C., and Elias, T.: Experimental study of the aerosol impact on fog microphysics, Atmos. Chem. Phys., 19, 4323–4344, https://doi.org/10.5194/acp-19-4323-2019, 2019.
Mazoyer, M., Burnet, F., and Denjean, C.: Experimental study on the evolution of droplet size distribution during the fog life cycle, Atmos. Chem. Phys., 22, 11305–11321, https://doi.org/10.5194/acp-22-11305-2022, 2022.
Meyer, M. B., Jiusto, J. E., and Lala, G. G.: Measurements of Visual Range and Radiation-Fog (Haze) Microphysics, J. Atmos. Sci., 37, 622–629, https://doi.org/10.1175/1520-0469(1980)037<0622:MOVRAR>2.0.CO;2, 1980.
Niu, S., Lu, C., Yu, H., Zhao, L., and Lü, J.: Fog research in China: An overview, Adv. Atmos. Sci., 27, 639–662, https://doi.org/10.1007/s00376-009-8174-8, 2010a.
Niu, S., Lu, C., Liu, Y., Zhao, L., Lü, J., and Yang, J.: Analysis of the microphysical structure of heavy fog using a droplet spectrometer: A case study, Adv. Atmos. Sci., 27, 1259–1275, https://doi.org/10.1007/s00376-010-8192-6, 2010b.
Petters, M. D. and Kreidenweis, S. M.: A single parameter representation of hygroscopic growth and cloud condensation nucleus activity – Part 2: Including solubility, Atmos. Chem. Phys., 8, 6273–6279, https://doi.org/10.5194/acp-8-6273-2008, 2008.
Pilie, R. J., Mack, E. J., Kocmond, W. C., Rogers, C. W. C., and Eadie, W.: The Life Cycle of Valley Fog. Part I: Micrometeorological Characteristics, J. Appl. Meteorol., 14, 347–363, 1975.
Pruppacher, H. R. and Klett, J. D.: Microstructure of Atmospheric Clouds and Precipitation, in: Microphysics of Clouds and Precipitation, Springer Netherlands, Dordrecht, 10–73, https://doi.org/10.1007/978-0-306-48100-0_2, 2010.
Qian, J., Liu, D., Yan, S., Cheng, M., Liao, R., Niu, S., Yan, W., Zha, S., Wang, L., and Chen, X.: Fog scavenging of particulate matters in air pollution events: Observation and simulation in the Yangtze River Delta, China, Sci. Total Environ., 876, 162728, https://doi.org/10.1016/j.scitotenv.2023.162728, 2023.
Qiang, Z., Jiannong, Q., Xuexi, T., Xia, L., Quan, L., Yang, G., and Delong, Z.: Effects of meteorology and secondary particle formation on visibility during heavy haze events in Beijing, China, Sci. Total Environ., 502, 578–584, 2015.
Roth, A., Schneider, J., Klimach, T., Mertes, S., van Pinxteren, D., Herrmann, H., and Borrmann, S.: Aerosol properties, source identification, and cloud processing in orographic clouds measured by single particle mass spectrometry on a central European mountain site during HCCT-2010, Atmos. Chem. Phys., 16, 505–524, https://doi.org/10.5194/acp-16-505-2016, 2016.
Schroder, J. C., Hanna, S. J., Modini, R. L., Corrigan, A. L., Kreidenwies, S. M., Macdonald, A. M., Noone, K. J., Russell, L. M., Leaitch, W. R., and Bertram, A. K.: Size-resolved observations of refractory black carbon particles in cloud droplets at a marine boundary layer site, Atmos. Chem. Phys., 15, 1367–1383, https://doi.org/10.5194/acp-15-1367-2015, 2015.
Schwarz, J. P., Gao, R. S., Fahey, D. W., Thomson, D. S., Watts, L. A., Wilson, J. C., Reeves, J. M., Darbeheshti, M., Baumgardner, D. G., Kok, G. L., Chung, S. H., Schulz, M., Hendricks, J., Lauer, A., Kärcher, B., Slowik, J. G., Rosenlof, K. H., Thompson, T. L., Langford, A. O., Loewenstein, M., and Aikin, K. C.: Single-particle measurements of midlatitude black carbon and light-scattering aerosols from the boundary layer to the lower stratosphere, J. Geophys. Res., 111, D16207, https://doi.org/10.1029/2006jd007076, 2006.
Shen, C., Zhao, C., Ma, N., Tao, J., Zhao, G., Yu, Y., and Kuang, Y.: Method to Estimate Water Vapor Supersaturation in the Ambient Activation Process Using Aerosol and Droplet Measurement Data, J. Geophys. Res.-Atmos., 123, 10606–10619, https://doi.org/10.1029/2018JD028315, 2018.
Shen, X., Sun, J., Ma, Q., Zhang, Y., Zhong, J., Yue, Y., Xia, C., Hu, X., Zhang, S., and Zhang, X.: Long-term trend of new particle formation events in the Yangtze River Delta, China and its influencing factors: 7-year dataset analysis, Sci. Total Environ., 807, 150783, https://doi.org/10.1016/j.scitotenv.2021.150783, 2022.
Shingler, T., Dey, S., Sorooshian, A., Brechtel, F. J., Wang, Z., Metcalf, A., Coggon, M., Mülmenstädt, J., Russell, L. M., Jonsson, H. H., and Seinfeld, J. H.: Characterisation and airborne deployment of a new counterflow virtual impactor inlet, Atmos. Meas. Tech., 5, 1259–1269, https://doi.org/10.5194/amt-5-1259-2012, 2012.
Song, J. I., Yum, S. S., Gultepe, I., Chang, K.-H., and Kim, B.-G.: Development of a new visibility parameterization based on the measurement of fog microphysics at a mountain site in Korea, Atmos. Res., 229, 115–126, https://doi.org/10.1016/j.atmosres.2019.06.011, 2019.
Spiegel, J. K., Zieger, P., Bukowiecki, N., Hammer, E., Weingartner, E., and Eugster, W.: Evaluating the capabilities and uncertainties of droplet measurements for the fog droplet spectrometer (FM-100), Atmos. Meas. Tech., 5, 2237–2260, https://doi.org/10.5194/amt-5-2237-2012, 2012.
Sun, T., Che, H., Qi, B., Wang, Y., Dong, Y., Xia, X., Wang, H., Gui, K., Zheng, Y., Zhao, H., Ma, Q., Du, R., and Zhang, X.: Aerosol optical characteristics and their vertical distributions under enhanced haze pollution events: effect of the regional transport of different aerosol types over eastern China, Atmos. Chem. Phys., 18, 2949–2971, https://doi.org/10.5194/acp-18-2949-2018, 2018.
Tardif, R. and Rasmussen, R. M.: Event-Based Climatology and Typology of Fog in the New York City Region, J. Appl. Meteorol. Clim., 46, 1141–1168, https://doi.org/10.1175/JAM2516.1, 2007.
Tuch, T. M., Haudek, A., Müller, T., Nowak, A., Wex, H., and Wiedensohler, A.: Design and performance of an automatic regenerating adsorption aerosol dryer for continuous operation at monitoring sites, Atmos. Meas. Tech., 2, 417–422, https://doi.org/10.5194/amt-2-417-2009, 2009.
Twomey, S.: The nuclei of natural cloud formation part II: The supersaturation in natural clouds and the variation of cloud droplet concentration, Geofisica Pura e Applicata, 43, 243–249, https://doi.org/10.1007/BF01993560, 1959.
Twomey, S.: The Influence of Pollution on the Shortwave Albedo of Clouds, J. Atmos. Sci., 34, 1149–1152, https://doi.org/10.1175/1520-0469(1977)034<1149:TIOPOT>2.0.CO;2, 1977.
van der Velde, I. R., Steeneveld, G. J., Wichers Schreur, B. G. J., and Holtslag, A. A. M.: Modeling and Forecasting the Onset and Duration of Severe Radiation Fog under Frost Conditions, Mon. Weather Rev., 138, 4237–4253, https://doi.org/10.1175/2010MWR3427.1, 2010.
Wang, Y., Niu, S., Lu, C., Lv, J., Zhang, J., Zhang, H., Zhang, S., Shao, N., Sun, W., Jin, Y., and Song, Q.: Observational study of the physical and chemical characteristics of the winter radiation fog in the tropical rainforest in Xishuangbanna, China, Sci. China Ser. D, 64, 1982–1995, https://doi.org/10.1007/s11430-020-9766-4, 2021.
Wang, Y. H., Liu, Z. R., Zhang, J. K., Hu, B., Ji, D. S., Yu, Y. C., and Wang, Y. S.: Aerosol physicochemical properties and implications for visibility during an intense haze episode during winter in Beijing, Atmos. Chem. Phys., 15, 3205–3215, https://doi.org/10.5194/acp-15-3205-2015, 2015.
Wang, Y., Li, J., Fang, F., Zhang, P., He, J., Pöhlker, M. L., Henning, S., Tang, C., Jia, H., Wang, Y., Jian, B., Shi, J., and Huang, J.: In-situ observations reveal weak hygroscopicity in the Southern Tibetan Plateau: implications for aerosol activation and indirect effects, npj Clim. Atmos. Sci., 7, 77, https://doi.org/10.1038/s41612-024-00629-x, 2024.
World Meteorological Organization: International Cloud Atlas – Manual on the Observation of Clouds and Other Meteors, WMO-No. 407, https://cloudatlas.wmo.int/fog-compared-with-mist.html (last access: 21 June 2024), 2017.
Yan, S., Zhu, B., Huang, Y., Zhu, J., Kang, H., Lu, C., and Zhu, T.: To what extents do urbanization and air pollution affect fog?, Atmos. Chem. Phys., 20, 5559–5572, https://doi.org/10.5194/acp-20-5559-2020, 2020.
Zhang, J., Xue, H., Deng, Z., Ma, N., Zhao, C., and Zhang, Q.: A comparison of the parameterization schemes of fog visibility using the in-situ measurements in the North China Plain, Atmos. Environ., 92, 44–50, https://doi.org/10.1016/j.atmosenv.2014.03.068, 2014.
Zhang, Q., Meng, J., Quan, J., Gao, Y., Zhao, D., Chen, P., and He, H.: Impact of aerosol composition on cloud condensation nuclei activity, Atmos. Chem. Phys., 12, 3783–3790, https://doi.org/10.5194/acp-12-3783-2012, 2012.
Zhang, X., Li, L., Che, H., Dubovik, O., Derimian, Y., Holben, B., Gupta, P., Eck, T. F., Lind, E. S., Toledano, C., Xia, X., Zheng, Y., Gui, K., and Zhang, X.: Aerosol Components Derived from Global AERONET Measurements by GRASP: A New Value-Added Aerosol Component Global Dataset and Its Application, B. Am. Meteor. Soc., 105, E1822–E1848, https://doi.org/10.1175/BAMS-D-23-0260.1, 2024.
Zhao, C. and Garrett, T. J.: Effects of Arctic haze on surface cloud radiative forcing, Geophys. Res. Lett., 42, 557–564, https://doi.org/10.1002/2014GL062015, 2015.