the Creative Commons Attribution 4.0 License.
the Creative Commons Attribution 4.0 License.
 | 17 Mar 2025
Air quality trends and regimes in South Korea inferred from 2015–2023 surface and satellite observations
Daniel J. Jacob
Drew C. Pendergrass
Ruijun Dang
Nadia K. Colombi
Heesung Chong
Seoyoung Lee
Su Keun Kuk
Jhoon Kim
Air pollutant emissions in South Korea have been changing rapidly over the past decade. Here we analyze the resulting 2015–2023 trends in air quality and regimes using surface (AirKorea), aircraft (KORUS-AQ), and satellite (low Earth orbit, geostationary) measurements. Surface concentrations of primary pollutants have decreased at rates (CO: −2.6 ± 0.7 % a−1, SO2: −6.4 ± 0.8 % a−1, NO2: −4.4 ± 0.8 % a−1) consistent with the national Clean Air Policy Support System (CAPSS) emissions inventory and satellite observations. CAPSS indicates no trend in volatile organic compound (VOC) emissions, consistent with satellite observations of formaldehyde (HCHO) and glyoxal (CHOCHO), but surface aromatic concentrations show a 5.0 ± 3.9 % a−1 decrease. Peak season (May–June) maximum 8 h daily average (MDA8) surface ozone (O3) exceeds the 60 ppbv standard everywhere at AirKorea sites, with an increase of 0.8 ± 0.9 ppbv a−1 in the 90th percentile averaged across all sites indicating VOC-limited conditions for O3 production. However, satellite ratios indicate a shift from VOC- to NOx-limited as NOx emissions decrease. Most AirKorea sites are in the Seoul Metropolitan Area (SMA), where vestiges of VOC-limited conditions persist; we find no O3 increases over the rest of South Korea. Fine particulate matter (PM2.5) has been decreasing at 5.0 ± 1.6 % a−1, but the nitrate (NO) component has not. Satellite ratios show that PM2.5 NO formation was NH3-sensitive before 2019 but is now becoming NOx-sensitive as NOx emissions decrease. Our results indicate that further NOx emission decreases will reap benefits for both O3 and PM2.5 NO as their production is now dominantly NOx-sensitive.
- Article
(2611 KB) - Full-text XML
-
Supplement
(442 KB) - BibTeX
- EndNote


South Korea experienced rapid development over the past 30 years with an annual average gross domestic product (GDP) growth rate of 5 % (Song and Lee, 2020). This has resulted in high emissions of carbon monoxide (CO), sulfur dioxide (SO2), nitrogen oxides (NOx ≡ NO + NO2), non-methane volatile organic compounds (NMVOCs), and particulate matter (PM) (Kim and Lee, 2018). Subsequent atmospheric chemistry of these precursors produces surface ozone (O3) and additional fine PM2.5 (less than 2.5 µm diameter), which are the main pollutants of concern for air quality. About 30 000 premature deaths per year are presently attributed to air pollution in South Korea (Oak et al., 2023; Choi et al., 2024). National air quality standards were tightened in 2018 for O3 (60 ppbv maximum 8 h daily average or MDA8) and for PM2.5 (15 µg m−3 for annual, 35 µg m−3 for 24 h). None of the sites in the nationwide AirKorea governmental surface network meet the O3 standard as of 2022, and only 4 % meet the 24 h PM2.5 standard, despite governmental efforts to decrease emissions.
The need to decrease emissions responsible for air pollution has been recognized since the 1980s, prompting early control policies to regulate solid fuel use and outdoor combustion and promoting clean fuels. This effectively reduced SO2, CO, and directly emitted (primary) PM (Kim and Lee, 2018). More recent efforts by the Korean Ministry of Environment (MOE) have targeted NOx emissions. However, O3 pollution has been getting worse at a rate of 1.0–1.5 ppbv a−1 over 2000–2021 (S.-W. Kim et al., 2023). PM2.5 has decreased, though unevenly (Jeong et al., 2022; H. M. Lee et al., 2024; Pendergrass et al., 2022, 2025), with an increasing contribution from secondary components produced chemically in the atmosphere, including secondary organic aerosol (SOA) and particulate nitrate (NO) (H. M. Lee et al., 2024).
Synoptic meteorology and transport from China also contribute to seasonal and long-term variations of pollutants over South Korea (Park et al., 2021; Lee and Park, 2022; Jeong et al., 2024). Photochemical O3 production is largest during the summer, but the summer monsoon brings clean marine air masses onto the Korean Peninsula, resulting in lower O3 levels in July–August compared to May–June (Wie and Moon, 2018; Lee and Park, 2022). May–June has additional contributions to O3 from wildfires, stratospheric intrusions, and transport from China (Lee and Park, 2022). PM2.5 is highest during the colder months (October–March), due to shallow mixing depths and stagnant conditions over the Korean Peninsula (Jeong et al., 2024), but here again transport from China makes an important contribution (Park et al., 2021). PM2.5 pollution in China has decreased considerably over the past decade in response to emission controls (Zhai et al., 2019), and this has decreased its influence on South Korea (Bae et al., 2021). In contrast, O3 pollution in China has gotten worse (K. Li et al., 2021).
Photochemical O3 production takes place by oxidation of VOCs and CO in the presence of NOx, and production can be either NOx- or VOC-limited depending on the concentrations of these precursors. Formation of PM2.5 NO, which is a major component of wintertime secondary PM2.5 in South Korea and is mainly present as ammonium nitrate, can be either NOx- or ammonia (NH3)-sensitive, again depending on the concentrations of these precursors. These dependences define chemical regimes that are important to identify for emission control strategies. O3 sensitivity to NOx versus VOCs can be diagnosed using formaldehyde (HCHO)-to-NO2 ratios measured from satellites, where HCHO and NO2 are proxies for VOCs and NOx emissions (Martin et al., 2004; Duncan et al., 2010). Similarly, PM2.5 NO sensitivity to NOx versus NH3 can be diagnosed using NH3-to-NO2 ratios measured from satellites (Dang et al., 2023, 2024).
Satellites indeed offer a growing resource for monitoring air pollutants, trends, and regimes over South Korea. These are mostly low Earth orbit (LEO) instruments that observe at specific times of the day, including the Measurements Of Pollution In The Troposphere (MOPITT) (Edwards et al., 2004) and the TROPOspheric Monitoring Instrument (TROPOMI) (Veefkind et al., 2012) for CO; the Ozone Monitoring Instrument (OMI) (Levelt et al., 2006) and TROPOMI for SO2, NO2, HCHO, and glyoxal (CHOCHO); and the Infrared Atmospheric Sounding Interferometer (IASI) (Van Damme et al., 2014) for NH3. Additional geostationary instruments over East Asia with continuous hourly observations include the Geostationary Ocean Color Imager (GOCI) and GOCI-II for aerosol optical depth (AOD) (Choi et al., 2018; S. Lee et al., 2023). The Geostationary Environment Monitoring Spectrometer (GEMS), launched in February 2020, provides the first hourly observations of gases by solar backscatter including SO2, NO2, HCHO, and CHOCHO (Kim et al., 2020).
Here we analyze recent (2015–2023) trends in air quality in South Korea by exploiting surface, airborne, and satellite observations to provide insights for the effectiveness of past regulation policies and future management. We interpret the trends in terms of the major drivers and evaluate consistency with annual bottom-up emission estimates from the Clean Air Policy Support System (CAPSS) of the MOE (S.-W. Choi et al., 2022). We start from 2015 when PM2.5 observations from the AirKorea network became available, with subsequent milestones including the May–June 2016 Korea–United States Air Quality (KORUS-AQ) field campaign (Crawford et al., 2021) and satellite observations from TROPOMI (starting in May 2018) and GEMS (starting in November 2020). We use and indicators from the satellite data to diagnose O3 and PM2.5 chemical regimes and their trends.
We make use of air quality observations in South Korea from surface sites, aircraft, and satellites to analyze annual, diurnal, and spatial variations of pollutants. The National Institute of Environmental Research (NIER) operates the AirKorea surface network of 650 monitoring sites as of 2023 (https://www.airkorea.or.kr/eng, last access: 8 January 2025), providing hourly data on CO, SO2, NO2, O3, PM10 (smaller than 10 µm diameter), and PM2.5 concentrations. Monthly VOC data (56 species) are available at a few urban sites. For annual trend analyses, we use observations from AirKorea sites that have continuous records from 2015 to 2023. We use least-squares linear regression to calculate annual trends and their error standard deviations at the 95 % confidence level. The KORUS-AQ field campaign in May–June 2016 included a detailed chemical payload aboard the DC-8 aircraft with extensive vertical profiling at different times of the day (Crawford et al., 2021). This was used by Yang et al. (2023) to infer diurnal profiles of NO2 vertical column densities (VCDs), and we will do the same here for HCHO and CHOCHO. Details on data processing and trend analysis are described in the Supplement.
Satellite observations for air quality over South Korea used in this work are compiled in Table 1. For all instruments, we filter out cloudy scenes using a cloud fraction threshold of 0.3. We further filter out geostationary observations with a solar zenith angle larger than 70°. Additional quality filtering is summarized in Table S1. CO is retrieved in both the shortwave infrared and thermal infrared (SWIR and TIR). NH3 is retrieved in the TIR. All other gases are retrieved in the ultraviolet–visible (UV–VIS) range. Tropospheric O3 can also be retrieved in the UV, but the measurements are difficult because of air scattering and the stratospheric column overhead, and different products are inconsistent over South Korea (Gaudel et al., 2018); therefore, we do not use them here. GOCI and GOCI-II AOD retrievals are for 550 nm wavelength.
OMI and TROPOMI make afternoon overpasses at 13:30 LT (local time). We make use of morning overpasses for MOPITT (10:30 LT) and IASI (09:30 LT). We use hourly daytime observations from GEMS (07:45–16:45 LT), GOCI (09:30–16:30 LT), and GOCI-II (08:15–17:15 LT). For annual trend analyses, we use GEMS observations made between 12:00–14:00 LT for consistency with the overpass time of OMI and TROPOMI measuring the same gases. We find no significant differences in observed trends when using surface observations sampled at satellite overpass times and therefore use all hours of the day.
Table 1Satellite observations used in this work.
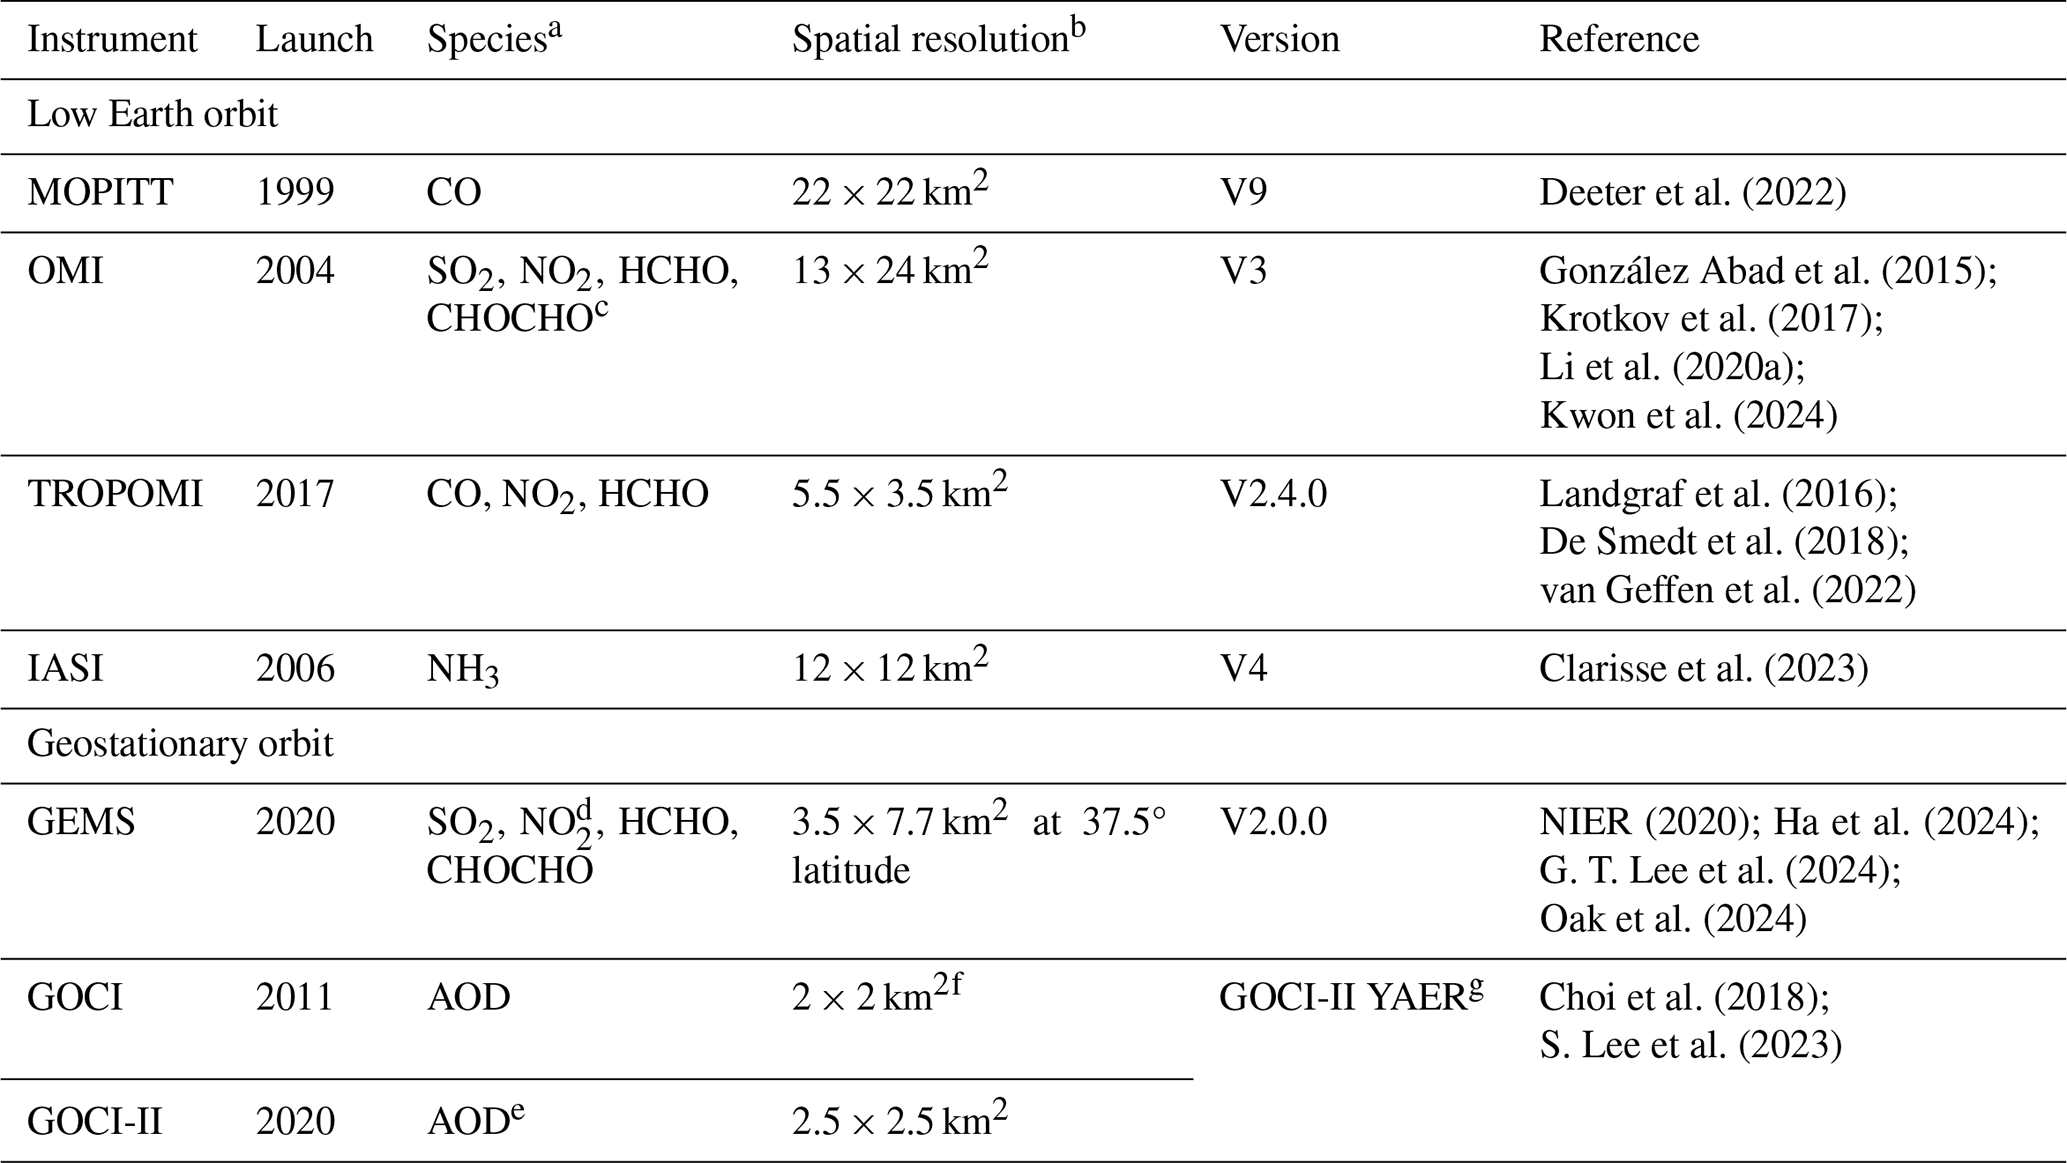
a Total atmospheric columns except for NO2 (tropospheric column). b Native pixel resolution of retrieval. c Provided at 1° × 1° by Kwon et al. (2024). d Bias-corrected by Oak et al. (2024). e Bias-corrected by applying a scale factor of 1.047 to account for the low bias in GOCI-II. See the Supplement for details. f Resolution of aggregated pixels for final aerosol product. g Yonsei aerosol retrieval.
Here we analyze spatial distributions and temporal trends of individual air pollutants using surface and satellite observations, and we compare the trends to the annual bottom-up estimates of anthropogenic emissions from CAPSS, reported with a 2-year lag (https://www.air.go.kr/eng/main.do, last access: 8 January 2025). CAPSS includes city-, county-, or district-level (Korean: -si, -gun, or -gu, respectively) emissions for source categories including fuel combustion, manufacturing, solvent use, mobile sources, agriculture, and anthropogenic biomass burning (biofuel, agriculture).
Figure 1 shows major anthropogenic source regions in South Korea. There are seven major cities with populations larger than 1 million. The Seoul Metropolitan Area (SMA; 37–37.8° N and 126.4–127.5° E) is the largest urban area which includes Seoul, Incheon, and surrounding suburbs, with concentrated electronics and chemical industries. The southeast region, including Busan and Ulsan, is the second-largest urban area and has petrochemical facilities; oil refineries; and steel, ship, and automobile manufacturing industries.
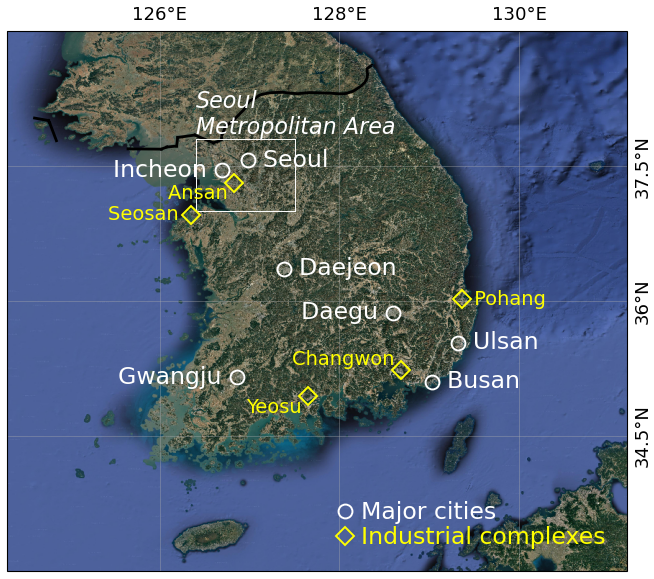
Figure 1Major source regions in South Korea. Large cities (>1 million) and industrial complexes are indicated in white and yellow, respectively. The Seoul Metropolitan Area (SMA) is defined as the rectangular domain covering 37–37.8° N and 126.4–127.5° E. Background surface imagery is from © Google Earth.
3.1 Carbon monoxide (CO)
CO levels in South Korea have consistently remained below the national air quality standards (9 ppmv for 8 h, 25 ppmv for 1 h) since the late 1990s (NIER, 2023). CO is nevertheless a useful tracer of pollution and plays an important role in driving ozone formation in South Korea (Gaubert et al., 2020; Kim et al., 2022). Anthropogenic CO emissions in CAPSS are 45 % from transportation (passenger vehicles, heavy-duty vehicles, ships) and 32 % from biomass burning (agricultural waste incineration, biofuels). Figure 2a–c compare 2021 CAPSS CO emissions with 2023 average surface CO and TROPOMI VCDs. Concentrations are highest in urban and industrial areas, but there is also a relatively high background, reflecting the long atmospheric lifetime of CO (2 months on average). Low VCDs over mountainous areas are due to surface elevation reducing the background column. This effect of surface elevation on VCDs is less apparent for shorter-lived species with weaker background contributions.
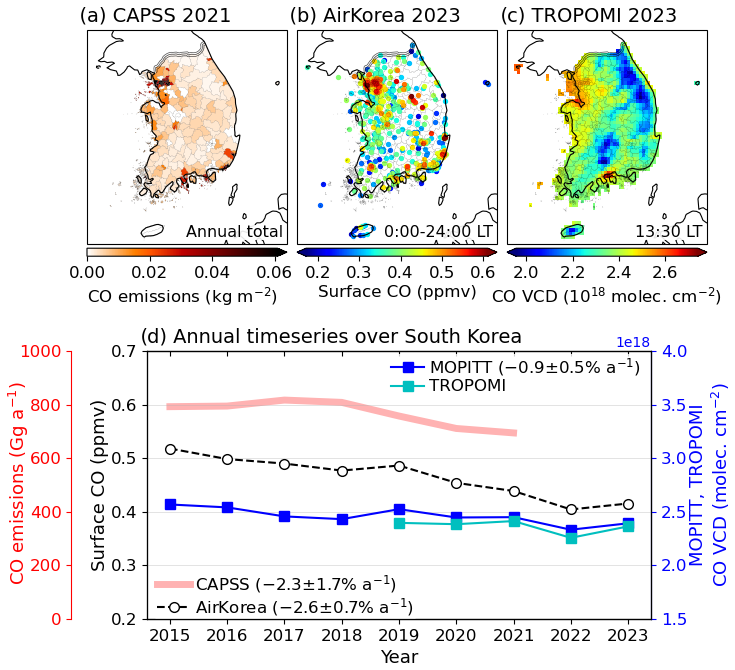
Figure 2Annual mean CO distributions and trends in South Korea. Top panels show spatial distributions of (a) 2021 anthropogenic CO emissions from CAPSS, (b) 2023 average AirKorea surface CO concentrations for 0:00−24:00 LT (local time), and (c) 2023 average TROPOMI CO vertical column densities (VCDs) at 13:30 LT mapped on a 0.1° × 0.1° grid. Lower panel (d) shows 2015–2023 trends in CAPSS CO emissions, surface CO averaged over all AirKorea sites with continuous records (00:00–24:00 LT), and CO VCDs from MOPITT (10:30 LT) and TROPOMI (13:30 LT) averaged over South Korea. Statistically significant trends (p value <0.05) are given inset with error standard deviations at the 95 % confidence level.
Figure 2d shows 2015–2023 CO trends, demonstrating consistency between CAPSS and atmospheric observations. CAPSS emissions and AirKorea surface concentrations decrease at similar rates of −2.3 ± 1.7 and −2.6 ± 0.7 % a−1, respectively. MOPITT decreases at a rate of −0.9 ± 0.5 % a−1, which is slower than surface concentrations because of the background contribution to the VCDs (∼ 2 × 10¹⁸ molecules cm−2). Chong et al. (2023) previously found a MOPITT CO decrease of −0.6 ± 0.1 % a−1 during 2005–2018. It is estimated that Chinese emissions contributed 21 %–25 % to the downward trend between 2016 and 2022 (Park et al., 2024; Kim et al., 2024).
3.2 Sulfur dioxide (SO2)
SO2 levels in South Korea have consistently remained below the national air quality standards (20 ppbv annual, 50 ppbv 24 h) over the past 2 decades due to large reductions in emissions from power plants and the petrochemical industry (NIER, 2023). However, there is continuing motivation for emission controls because SO2 is a precursor to PM2.5 sulfate (SO). Figure 3a–c compare 2021 CAPSS SO2 emissions with 2023 average surface SO2 and GEMS VCDs for all available observations. GEMS displays enhancements in the SMA, mid-south coast (power plants, petrochemical/steel industry), and northeastern regions (cement/concrete/pulp industry), consistent with OMI SO2 hotspots previously identified for 2011–2016 (Chong et al., 2020).
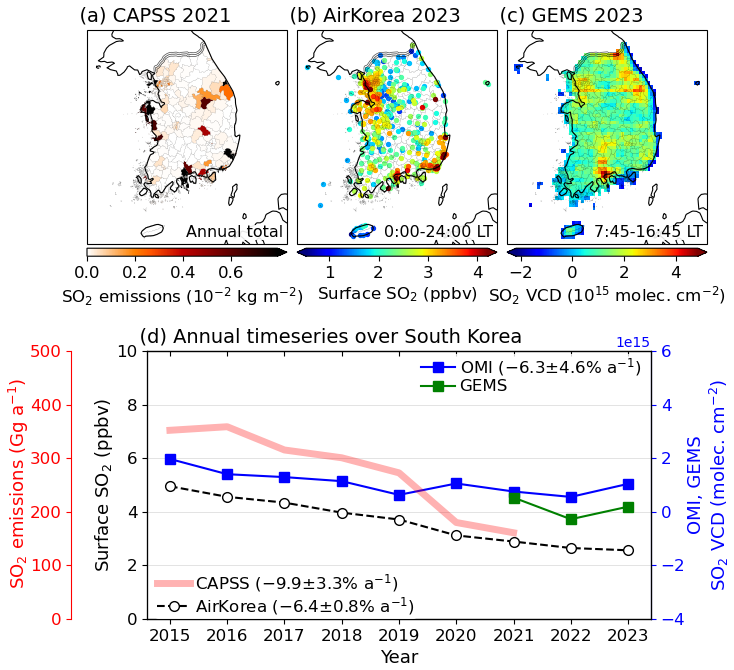
Figure 3Annual mean SO2 distributions and trends in South Korea. Top panels show spatial distributions of (a) 2021 anthropogenic SO2 emissions from CAPSS, (b) 2023 average AirKorea surface SO2 concentrations for 00:00–24:00 LT, and (c) 2023 average GEMS SO2 VCDs for the 07:45–16:45 LT observation period mapped on a 0.1° × 0.1° grid. Lower panel (d) shows 2015–2023 trends in CAPSS SO2 emissions, surface SO2 averaged over all AirKorea sites with continuous records (00:00–24:00 LT), and SO2 VCDs from OMI (13:30 LT) and GEMS (sampled at the OMI overpass time) averaged over South Korea. Statistically significant trends (p value <0.05) are given inset with error standard deviations at the 95 % confidence level.
Figure 3d shows good agreement between the CAPSS-reported emission trends and atmospheric observations. CAPSS-reported emissions have decreased at a rate of −9.9 ± 3.3 % a−1, while surface SO2 concentrations and OMI VCDs have decreased at similar rates of −6 % a−1 since 2015. However, there is large uncertainty in the satellite observations that likely contributes noise to the trend (Li et al., 2020a). Park et al. (2024) found that recent trends (2016–2022) in national mean surface SO2 were driven by reductions in both domestic (25 %) and Chinese (16 %) emissions, explaining the 41 % decrease shown in Fig. 3d.
3.3 Nitrogen dioxide (NO2)
NO2 levels exceeded the national standards (30 ppbv annual, 60 ppbv 24 h) at 28 % of the AirKorea sites in 2015 but fewer than 1 % in 2022 (NIER, 2023). NOx emissions in South Korea are dominated by the transportation sector, which account for 64 % of the CAPSS inventory. Control of NOx emissions is more recent than for CO and SO2 and has been motivated not only by the NO2 standards but also by the potential to reduce PM2.5 NO. CAPSS NOx emissions declined by 23 % from 2015 to 2021 in response to policies including stronger regulation on heavy-duty diesel engines (Song and Lee, 2020) and governmental PM management plans implemented in 2019 (Bae et al., 2022; Jeong et al., 2024).
Figure 4a–c compare 2021 CAPSS NOx emissions with 2023 average surface NO2 and GEMS tropospheric VCDs. Here we use the Oak et al. (2024) GEMS product calibrated to TROPOMI to remove artifacts. Surface concentrations and VCDs display similar spatial distributions, with the highest values in the SMA and other urban areas in the southeast. Figure 4d shows that surface NO2 and OMI tropospheric VCDs have decreased over the 2015–2023 period by 32 % and 36 %, respectively. The trend in CAPSS-reported emissions (−4.8 ± 2.7 % a−1) is consistent with surface observations (−4.4 ± 0.8 % a−1) and OMI VCDs (−4.6 ± 0.8 % a−1) during 2015–2023. Meteorology-corrected trends in tropospheric VCDs observed by ground-based remote sensing instruments at urban sites decreased at similar rates (−5.0 to −5.4 % a−1) during 2015–2020 (Choi et al., 2023). Long-term (2005–2019) records show that significant decreases in surface and OMI NO2 began in 2015 (Seo et al., 2021). CAPSS shows an increase from 2015 to 2016, which is due to updates in emission factors (Choi et al., 2020). Kim et al. (2024) found that only 2 % of the observed 23 % decrease in surface NO2 during 2016–2021 over South Korea was attributable to the Chinese contribution.
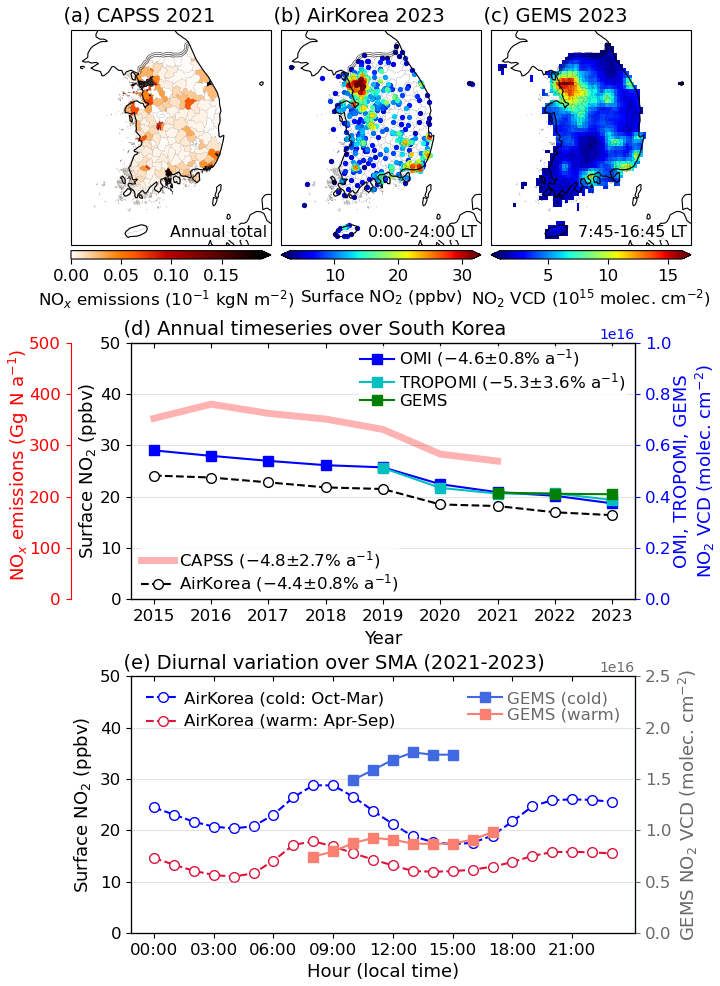
Figure 4Annual mean NO2 distributions and trends in South Korea. Top panels show spatial distributions of (a) 2021 anthropogenic NOx emissions from CAPSS, (b) 2023 average AirKorea surface NO2 concentrations for 00:00–24:00 LT, and (c) 2023 average GEMS tropospheric NO2 VCDs for the 07:45–16:45 LT observation period mapped on a 0.1° × 0.1° grid. Middle panel (d) shows 2015–2023 trends in CAPSS NOx emissions, surface NO2 averaged over all AirKorea sites with continuous records (00:00–24:00 LT), and tropospheric NO2 VCDs from OMI (13:30 LT), TROPOMI (13:30 LT), and GEMS (sampled at the OMI overpass time) averaged over South Korea. Statistically significant trends (p value <0.05) are given inset with error standard deviations at the 95 % confidence level. Lower panel (e) shows 2021–2023 seasonal mean (cold: October–March, warm: April–September) diurnal variations of AirKorea surface NO2 concentrations and GEMS VCDs over the SMA.
Figure 4e shows the 2021–2023 seasonal mean hourly variations of surface NO2 and GEMS VCDs over the SMA. Both surface and column NO2 are higher by a factor of 2 during the cold season, which can be explained by the longer NOx lifetime (Shah et al., 2020). NOx emissions in the SMA have small seasonal variations as they are dominated by mobile sources (Pandey et al., 2008; Lee and Park, 2022; Yang et al., 2024). The emissions are higher in the daytime (07:00–18:00 LT) than at night but do not show significant rush-hour enhancements, because traffic load is sustained with little variability throughout the daytime (Yang et al., 2024). Therefore, the peak in surface NO2 concentrations at 08:00–09:00 LT is not due to the rush hour but to accumulation of daytime emissions in a shallow mixed layer (Moutinho et al., 2020). NO2 then decreases in the morning by dilution as the mixed layer grows from solar heating, and it increases again in the evening when the mixed layer collapses (J. Li et al., 2021). Increasing NO2 photolysis as the morning progresses would also be expected to lower NO2 concentrations, but this is offset by entrainment of O3 from aloft as the mixed layer grows, such that the ratio increases during the morning hours (Yang et al., 2024). Geostationary satellite observations provide unique information on the diurnal variation of NO2 VCDs (Tian et al., 2018; Cheng et al., 2019; Edwards et al., 2024; Xu et al., 2024). This is illustrated in Fig. 4e for the SMA. A NOx budget analysis by Yang et al. (2024) showed that NO2 VCDs in Seoul increase steadily in the morning from accumulation of emissions as they are not affected by mixed-layer growth, reaching a steady state in the afternoon due mostly to loss from ventilation.
3.4 Non-methane volatile organic compounds (NMVOCs)
NMVOC emissions include important contributions from both anthropogenic and biogenic sources. More than half of anthropogenic VOC (AVOC) emissions according to CAPSS are from solvent use, while transportation is responsible for less than 10 %, although the latter may be underestimated by a factor of 2–3 according to source apportionment studies (Kim and Lee, 2018; Song et al., 2019; Kwon et al., 2021). CAPSS also does not account for residential emissions of volatile chemical products (VCPs), which could be large in South Korea as indicated by observations of elevated ethanol during KORUS-AQ (Travis et al., 2024). Annual total AVOC emissions are estimated to be a factor of 2 larger than biogenic VOCs (BVOCs) on a national level (Jang et al., 2020). However, BVOCs play an important role in O3 and SOA formation during summer (H. K. Kim et al., 2018; Oak et al., 2022; Lee and Park, 2022), when their emissions are comparable to those of AVOCs (J. Choi et al., 2022).
Figure 5a–b compare 2021 total AVOC emissions from CAPSS and BVOC emissions calculated from the Model of Emissions of Gases and Aerosols from Nature (MEGAN) (Guenther et al., 2012). The two have contrasting distributions, with AVOCs mostly being urban and industrial. Shown in Fig. 5c is the distribution of BTEX (≡ benzene + toluene + ethylbenzene + xylenes) concentrations observed at AirKorea sites, with high values over urban areas consistent with CAPSS. Benzene is elevated on the west and southern coasts where it originates from the steel industry, oil refineries, and petrochemical facilities (Seo et al., 2014; Fried et al., 2020; Cho et al., 2021). Toluene, xylenes, and ethylbenzene are abundant in the SMA (Song et al., 2019; Kim et al., 2021; Y. Lee et al., 2023) due to emissions from traffic and solvent use (Simpson et al., 2020).
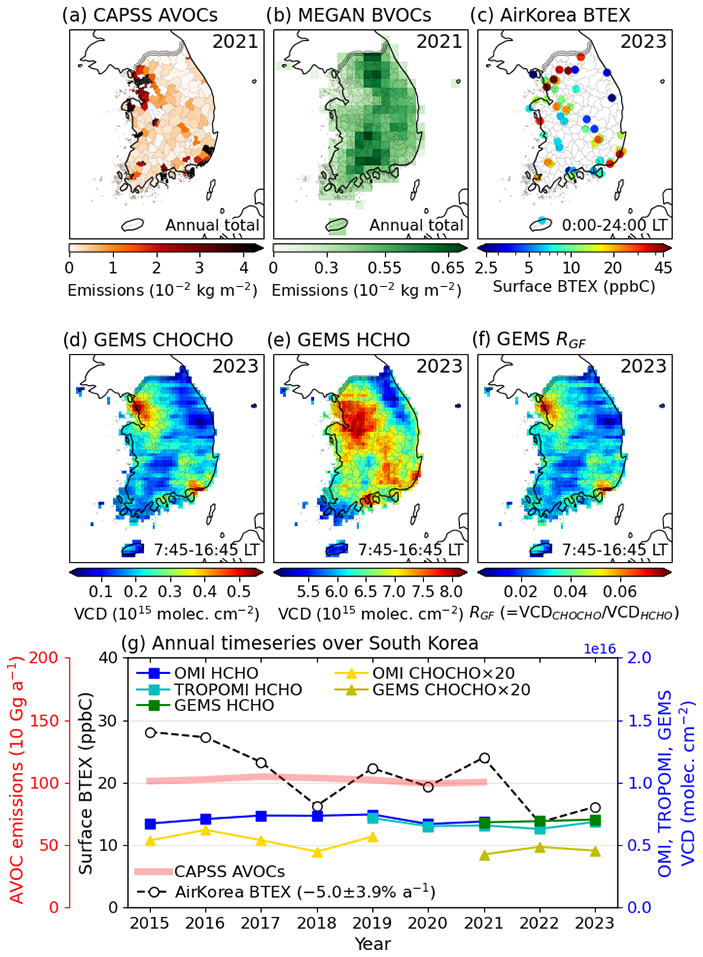
Figure 5Annual mean NMVOC distributions and trends in South Korea. Top panels (a–b) show 2021 anthropogenic VOC (AVOC) emissions from CAPSS and biogenic VOC (BVOC: sum of isoprene, monoterpenes, sesquiterpenes, acetaldehyde, acetone, methanol, ethanol) emissions from MEGAN, and panel (c) shows 2023 average AirKorea surface BTEX (≡ benzene + toluene + ethylbenzene + xylenes) concentrations for 00:00–24:00 LT. Middle panels (d–f) show spatial distributions of 2023 average GEMS glyoxal (CHOCHO) VCDs, formaldehyde (HCHO) VCDs, and glyoxal-to-formaldehyde ratio RGF () for the 07:45–16:45 LT observation period mapped on 0.1° × 0.1° grids. Lower panel (g) shows 2015–2023 trends in CAPSS AVOC emissions, surface BTEX averaged over AirKorea sites with continuous records (00:00–24:00 LT), and CHOCHO (20 times magnified) and HCHO VCDs averaged over South Korea from OMI (13:30 LT), TROPOMI (13:30 LT), and GEMS (sampled at the OMI overpass time). Statistically significant trends (p value <0.05) are given inset with error standard deviations at the 95 % confidence level. None of the satellite data show significant trends over the 2015–2023 period.
Figure 5d–e show spatial distributions of CHOCHO and HCHO VCDs from GEMS. These are common intermediates in the oxidation of NMVOCs, but CHOCHO is preferentially produced from aromatics (Kaiser et al., 2015; Li et al., 2016). Satellite observations are most sensitive to precursor NMVOCs with short lifetimes and prompt HCHO or CHOCHO yields including isoprene, alkenes, toluene, and xylenes (Palmer et al., 2003; Chan Miller et al., 2017; Bates et al., 2021). The GEMS CHOCHO and HCHO VCDs are elevated in major industrial regions, but CHOCHO shows hotspots for manufacturing industries (Incheon, Changwon), while HCHO shows hotspots for petrochemical facilities (Yeosu, Ulsan). HCHO observations are also more distributed, reflecting the larger BVOC contributions from isoprene.
Figure 5f shows the CHOCHO-to-HCHO ratio , illustrating the contrast in their sources. RGF is generally higher under anthropogenic dominance (Chen et al., 2023). Values range from 0.02 in rural regions to more than 0.05 in the SMA and Busan. In the USA, RGF values are below 0.03 even under polluted conditions (Chan Miller et al., 2017) and are down to 0.01 in rural regions with dominant biogenic sources (Kaiser et al., 2015). GEMS RGF values in South Korea are higher than 0.01 everywhere, indicating a more important role for AVOC emissions than in the USA, where these emissions have been strongly regulated for decades (Parrish et al., 2009; Warneke et al., 2012). Unlike for other pollutants and in contrast to the US, regulation of AVOCs in South Korea has been limited (Song and Lee, 2020; J. Kim et al., 2023). Figure 5g shows no significant trends in AVOC emissions and satellite observations of CHOCHO and HCHO, although surface BTEX decreased at −5.0 ± 3.9 % a−1 during 2015–2023.
Figure 6 compares diurnal variations of HCHO and CHOCHO VCDs in the SMA observed from GEMS (2021–2023) and DC-8 aircraft vertical profiles from near the surface to 8 km altitude during KORUS-AQ (May–June 2016). Computation of VCDs from the aircraft data is described in the Supplement. Mean loss frequencies of HCHO and CHOCHO against oxidation by OH and photolysis in the aircraft data average to 0.42 and 0.61 h−1, respectively, at 11:00–15:00 LT. We find that the GEMS columns are lower than the aircraft columns, consistent with previously reported low biases in satellite retrievals of CHOCHO (−50 %) and HCHO (−40 % to −20 %) (Zhu et al., 2016; Chan Miller et al., 2017; Zhu et al., 2020). HCHO VCDs are more than twice higher during the warm season (April–September) than the cold season (October–March), consistent with a biogenic contribution to HCHO, while CHOCHO VCDs show no seasonal difference. Both GEMS and aircraft show slight HCHO and CHOCHO increases in the morning from photochemical production (G. T. Lee et al., 2024), flattening by midday. The aircraft data show a late afternoon rise in HCHO for which we have no explanation and might reflect sparse sampling.
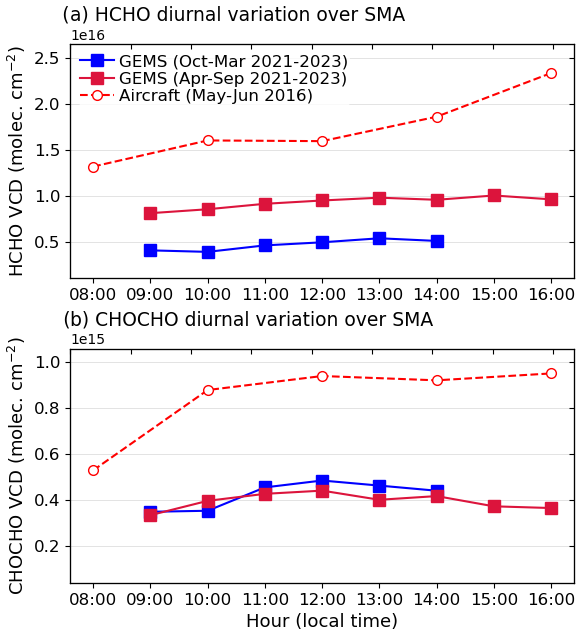
Figure 6Diurnal variations of HCHO and CHOCHO VCDs in the SMA. Upper panel (a) shows seasonal mean (blue: October–March, red: April–September) diurnal variations of HCHO VCDs from GEMS 2021–2023 observations and from KORUS-AQ (May–June 2016) DC-8 aircraft vertical profiles from near the surface to 8 km altitude over the SMA. Lower panel (b) shows the same for CHOCHO VCDs.
3.5 Ozone (O3)
None of the AirKorea monitoring sites met the MDA8 standard of 60 ppbv for O3 as of 2022 (NIER, 2023). O3 peaks in May–June in South Korea (Fig. 7a) with contributions from domestic emissions, wildfires, stratospheric intrusions, and transport from China (Lee and Park, 2022). Several studies have reported on the O3 increase in South Korea over the past 2 decades, using different O3 concentration metrics and time periods (Seo et al., 2018; Yeo and Kim, 2022; S.-W. Kim et al., 2023). We find that May–June 90th percentile MDA8 O3 calculated for individual AirKorea sites and then averaged across all sites shows an increase of 0.8 ± 0.9 ppbv a−1 during 2015–2023 (Fig. 7b).
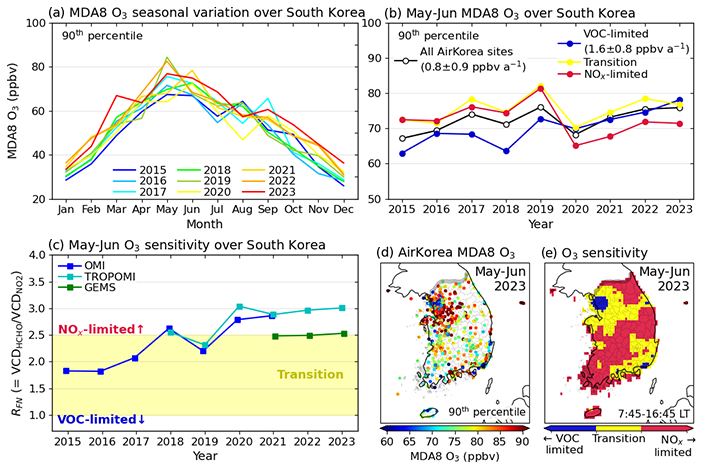
Figure 7O3 distribution, trend, and sensitivity to precursors in South Korea. Values are shown for the 90th percentile maximum 8 h daily average (MDA8) at individual AirKorea sites with continuous records. Top panels show averages of 90th percentile MDA8 O3 for 2015–2023 as (a) monthly variations in individual years and (b) long-term trends in May–June (when concentrations are highest) for sites in different sensitivity regimes inferred from 2023 GEMS observations. Statistically significant trends (p value <0.05) are given inset with error standard deviations at the 95 % confidence level. Lower left panel (c) shows May–June average time series of formaldehyde-to-NO2 ratios RFN () averaged over South Korea from OMI (13:30 LT), TROPOMI (13:30 LT), and GEMS (sampled at the OMI overpass time). Lower right panels show spatial distributions of May–June 2023 average (d) AirKorea 90th percentile MDA8 O3 and (e) O3 sensitivity regimes inferred from GEMS RFN (07:45–16:45 LT) mapped on a 0.1° × 0.1° grid. O3 sensitivity regimes are based on a RFN threshold of 2.5 from Jin et al. (2024).
Previous studies found that O3 formation in major cities in South Korea is in the VOC-limited regime, where decreasing NOx emissions cause O3 to increase (S. Kim et al., 2018; Oak et al., 2019; Souri et al., 2020; Lee et al., 2021; S.-W. Kim et al., 2023). However, as NOx emissions have decreased (Fig. 4) although VOC emissions have not (Fig. 5), O3 formation may shift to a NOx-limited regime. The HCHO-to-NO2 column ratio (), an indicator for O3 sensitivity to NOx versus VOCs (Martin et al., 2004; Duncan et al., 2010), increased steadily from 2015 to 2023 as seen from OMI, TROPOMI, and GEMS (Fig. 7c). Recent studies over northeast Asia suggest that NOx-limited regimes are found where RFN>2–3 (Ren et al., 2022; Jin et al., 2020, 2024). Here we use 2.5 as a threshold and find that South Korea is now mostly in the NOx-limited regime. Figure 7d–e show May–June 2023 90th percentile MDA8 O3 and its sensitivity regimes inferred from GEMS RFN. Most of the country is in the NOx-limited and transition regimes, while VOC-limited conditions are largely limited to the central SMA and Busan regions. The broader SMA and urban southeastern South Korea are in a transition regime where O3 is sensitive to both NOx and VOC emissions. These latter regions experience the most severe O3 pollution as both NOx and VOCs contribute to O3 formation.
Also shown in Fig. 7b are May–June 90th percentile MDA8 O3 trends for AirKorea sites in different sensitivity regimes based on the 2023 GEMS RFN. The O3 increase during 2015–2023 is only found in the VOC-limited areas (1.6 ± 0.8 ppbv a−1). O3 in NOx-limited areas does not show any noticeable increase. Reports of O3 increases in South Korea based on data from the AirKorea sites may be biased by the AirKorea sites being concentrated in the SMA, which has been mostly VOC-limited, but this is now changing as NOx emissions decrease. Our analysis suggests that O3 pollution in South Korea is now poised to decrease everywhere in response to continued NOx emission controls.
An additional challenge for South Korea to meet its air quality standard is the high background originating from East Asia, estimated to be 55 ppbv (Colombi et al., 2023). During the COVID-19 lockdown in 2020, precursor emissions significantly dropped in China but not in South Korea (Koo et al., 2020), which led to reduced long-range transport of O3 and hence lower background levels over South Korea (S.-W. Kim et al., 2023). This could explain the large decrease in O3 found between 2019 and 2020, especially in NOx-limited areas which are more sensitive to background contributions than local emissions.
3.6 Particulate matter (PM)
PM levels have steadily decreased in South Korea over the 2015–2023 period with more than 95 % of the AirKorea sites meeting the annual PM10 standard (50 µg m−3) since 2018. However, only 27 % of sites met the PM2.5 annual standard (15 µg m−3) in 2022, and only 4 % met the 24 h standard (35 µg m−3) (NIER, 2023). Figure 8a–c compare 2023 average PM10, PM2.5, and GOCI-II AOD which share similar spatial distributions. GOCI-II (2021–2023) is biased low relative to GOCI (2015–2020); therefore, we apply a scale factor of 1.047 to the GOCI-II data (Lee et al., 2023). Annual trends in PM10 (−4.0 ± 1.7 % a−1), PM2.5 (−5.0 ± 1.6 % a−1), and AOD (−4.4 ± 2.4 % a−1) over South Korea during 2015–2023 are consistent (Fig. 8d). Park et al. (2024) found that 14 % of the observed 33 % decrease in PM2.5 during 2016–2022 over South Korea was attributable to the Chinese contribution.
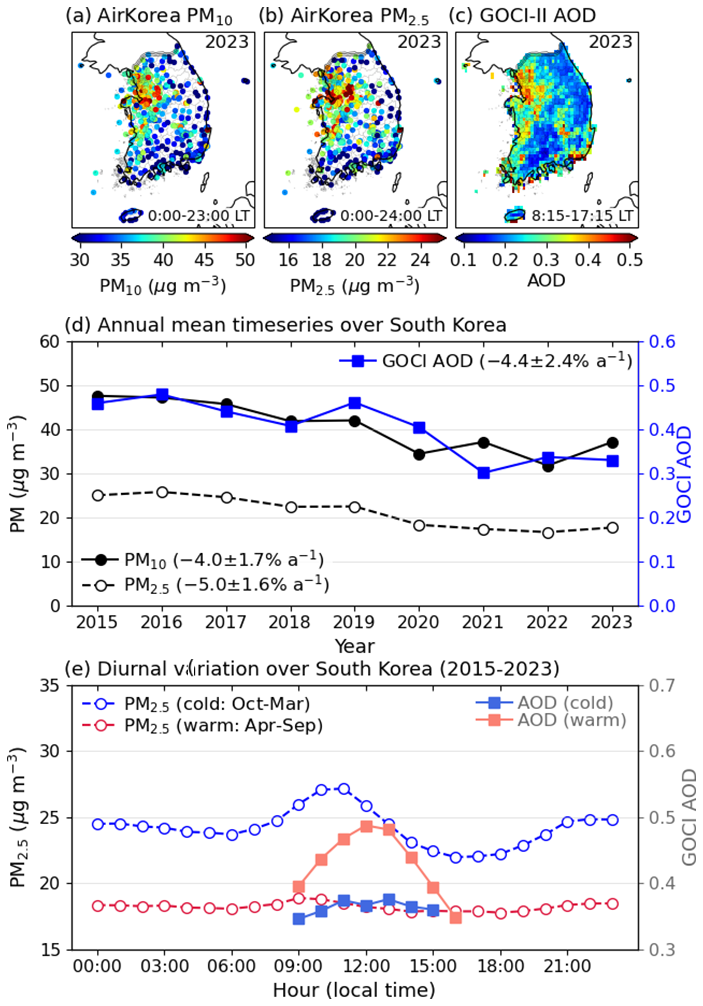
Figure 8Annual mean PM and aerosol optical depth (AOD) distributions and trends in South Korea. Top panels (a–b) show spatial distributions of 2023 average AirKorea PM10 and PM2.5 for 00:00–24:00 LT, and panel (c) shows 2023 average GOCI-II AOD for the 08:15–17:15 LT observation period mapped on a 0.1° × 0.1° grid. Middle panel (d) shows 2015–2023 trends in PM10 and PM2.5 averaged over all AirKorea sites with continuous records (00:00–24:00 LT), as well as GOCI (GOCI; 2015–2020, GOCI-II; 2021–2023) AOD (09:30–16:30 LT) averaged over South Korea. Statistically significant trends (p value <0.05) are given inset with error standard deviations at the 95 % confidence level. Lower panel (e) shows 2015–2023 seasonal mean (cold: October–March, warm: April–September) diurnal variations of AirKorea PM2.5 concentrations and GOCI AOD over South Korea. GOCI-II data have been corrected for a low bias relative to GOCI (Table 1).
Figure 8e shows seasonal mean hourly variations of surface PM2.5 and GOCI AOD. Surface PM2.5 peaks in winter to early spring, mostly attributable to sulfate–nitrate–ammonium aerosols (Zhai et al., 2021) and is at its minimum in summer during the monsoon period (H. M. Lee et al., 2024). Conversely, AOD peaks in spring and summer (March–August) due to dust events, chemical production of secondary aerosols, and hygroscopic growth at high relative humidity (Zhai et al., 2021). PM2.5 peaks at 09:00–11:00 LT and then decreases until late afternoon as the mixed layer grows and dilutes surface concentrations (Jordan et al., 2020). AOD rises in the morning and peaks at midday, reflecting photochemical production (Kim et al., 2015; Lennartson et al., 2018).
The 2015–2021 PM2.5 observations in Seoul show that all major PM2.5 components decreased except for NO, which accounts for 25 % of total PM2.5 during winter to early spring (H. M. Lee et al., 2024). Winter NO formation depends nonlinearly on NOx and NH3 emissions, with dominant sensitivity to either precursor that can be diagnosed from the VCD ratio and the NO2 VCD in satellite observations (Dang et al., 2023, 2024). Figure 9a–b compare 2021 CAPSS NH3 emissions and 2023 average NH3 VCDs observed by IASI; 76 % of anthropogenic NH3 emissions in South Korea originate from livestock manure management according to CAPSS. Transportation is also a significant source in urban areas (Park et al., 2023). Highest VCDs are found in the southern SMA, where livestock farming is concentrated, corresponding to a PM2.5 hotspot (Fig. 8b). Despite high NH3 emissions in the southeast coast, VCD enhancements are not observed there due to high SO2 emissions (Fig. 3a) and expected high SO production converting gas-phase NH3 to particle-phase ammonium (NH). Figure 9d indicates that annual total NH3 emissions have shown little change, while NH3 VCDs have significantly increased since 2015. Decreases in SO2 emissions and the resulting SO in both South Korea and China have left more NH3 available for NO formation (Jeong et al., 2022).
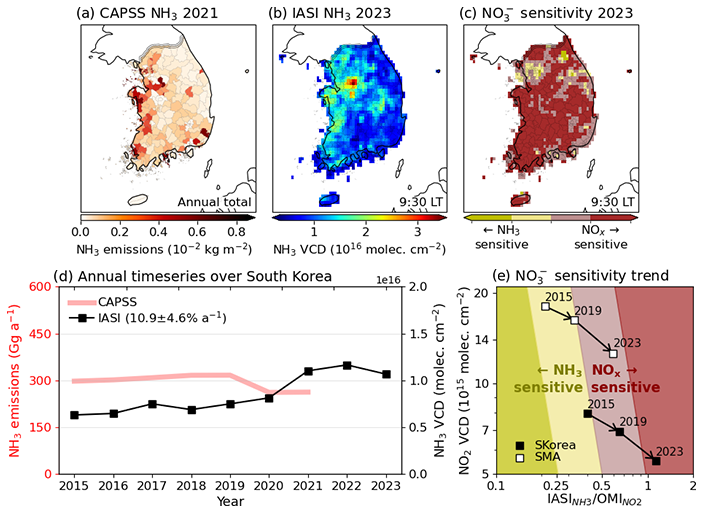
Figure 9Annual mean NH3 distributions, trends, and PM2.5 nitrate (NO) sensitivity in South Korea. Top panels show spatial distributions of (a) 2021 anthropogenic NH3 emissions from CAPSS, (b) 2023 average IASI NH3 VCDs at 9:30 LT overpass, and (c) 2023 cold season (October–March) NO sensitivity regimes inferred from IASI NH3 and GEMS NO2 (sampled at the IASI overpass time). VCDs are mapped on a 0.1° × 0.1° grid. Lower panel (d) shows 2015–2023 trends in CAPSS NH3 emissions and IASI NH3 VCDs (9:30 LT) averaged over South Korea. Statistically significant trends (p value <0.05) are given inset with error standard deviations at the 95 % confidence level. Lower right panel (e) shows the cold season NO sensitivity trends averaged over South Korea and over the SMA. NO sensitivity regimes are based on winter thresholds from Dang et al. (2024).
Figure 9c shows NO sensitivity regimes inferred from GEMS NO2 and IASI NH3 VCDs during the cold season (October–March) in 2023. Figure 9e shows the evolution of the sensitivity regimes inferred from OMI NO2 and IASI NH3 from 2015 to 2023. As NOx emissions have decreased, we find that NO formation over South Korea has transited from an NH3-sensitive to a NOx-sensitive regime. NH3-sensitive conditions are now mostly limited to parts of the SMA, and as NOx emissions continue to decrease, we can expect NO formation to be controlled by NOx emissions everywhere. Our analysis indicates that South Korea will increasingly benefit from controlling NOx emissions to improve both O3 and PM2.5 air quality in the future.
We analyzed the distributions and 2015–2023 trends of major air pollutants in South Korea using the AirKorea surface network, aircraft, and satellite observations. Air quality in South Korea has improved for primary pollutants over the past 2 decades, but surface O3 and PM2.5 still widely exceed national standards despite emission controls.
Surface CO and SO2 levels have stayed below air quality standards since the late 1990s, while NO2 is now below the air quality standard at almost all AirKorea sites. Anthropogenic CO and SO2 show steady and consistent declines from 2015 to 2023 in both surface concentrations and satellite vertical column densities (VCDs), consistent with the trends from the CAPSS national emissions inventory. NO2 surface concentrations decreased by 32 % from 2015 to 2023, while tropospheric NO2 VCDs decreased by 36 %, consistent with the 23 % decrease of NOx emissions in CAPSS.
Anthropogenic VOC emissions show no significant trend from 2015 to 2023 in the CAPSS inventory. This is consistent with HCHO and CHOCHO VCDs from satellites, although surface observations show a decrease in BTEX aromatic compounds. Satellite HCHO observations show contributions from both anthropogenic and biogenic VOCs, while CHOCHO is more specifically associated with BTEX. Diurnal variations of HCHO and CHOCHO over the Seoul Metropolitan Area (SMA) observed from the GEMS geostationary satellite instrument show a morning increase and a leveling off by midday. Aircraft vertical columns over the SMA during the KORUS-AQ campaign show similar diurnal variations but a late afternoon HCHO increase.
Surface O3 levels in South Korea peak in May–June, and observations at AirKorea sites show an average increase of 0.8 ppbv a−1 in the 90th percentile MDA8 O3 from 2015 to 2023. Such an O3 increase has been attributed to the effect of NOx emission reductions under VOC-limited conditions for O3 production. However, we find from the evolution of the satellite ratio from 2015 to 2023 that the O3 formation regime in South Korea has been shifting from VOC- to NOx-limited. GEMS satellite observations for 2023 indicate that most regions in South Korea are now NOx-limited or in a transition regime, and that VOC-limited conditions are confined to the central SMA and Busan regions. We find that the O3 increase at AirKorea sites is limited to sites still in the VOC-limited regime, whereas there is no increase for sites in the transition or NOx-limited regimes. Our results suggest that O3 across South Korea is poised to decrease in response to continued NOx emission controls.
Annual trends during 2015–2023 in PM10, PM2.5, and AOD show consistent decreases of 4 % a−1 to 5 % a−1. Diurnal variations in AODs seen from the GOCI satellite instrument show the importance of photochemical production as a source of PM. The only PM2.5 component not found to show a significant decrease over the 2015–2023 period is nitrate (NO). From the ratio observed by satellites and its trend over the 2015–2023 period, we find that PM2.5 NO formation in South Korea was mostly NH3-sensitive but has become increasingly NOx-sensitive as NOx emissions have decreased. As of 2023, NO formation across South Korea is dominantly NOx-sensitive except in parts of the SMA.
The vigorous NOx emission controls in South Korea have not yet yielded results in terms of decreasing O3 and PM2.5 NO. However, our results show that they have effectively shifted O3 production from a VOC-limited to a NOx-limited regime and NO formation from an NH3-sensitive to a NOx-sensitive regime. As NOx emissions continue to decrease, the benefits for decreasing O3 and PM2.5 should become apparent.
AirKorea surface network data are available at https://airkorea.or.kr/web/detailViewDown?pMENU_NO=125 (NIER, 2025). CAPSS annual emissions are available at https://www.air.go.kr/eng/capss/emission/year.do?menuId=190 (National Air Emission Inventory and Resesarch Center, 2025). MEGAN BVOC emissions are available at https://geos-chem.s3.amazonaws.com/index.html#HEMCO/OFFLINE_BIOVOC/v2021-12/0.25x0.3125/2021/ (Lin, 2025). KORUS-AQ aircraft data are available at https://doi.org/10.5067/Suborbital/KORUSAQ/DATA01 (NASA et al., 2025). Satellite products are available: MOPITT CO https://asdc.larc.nasa.gov/data/MOPITT/MOP03J.009/ (last access: 12 May 2025); OMI SO2 https://dx.doi.org/10.5067/Aura/OMI/DATA3008 (Li et al., 2020b), NO2 https://dx.doi.org/10.5067/Aura/OMI/DATA3007 (Krotkov et al., 2019), HCHO https://dx.doi.org/10.5067/Aura/OMI/DATA3010 (Chance, 2019), and CHOCHO https://doi.org/10.7910/DVN/Q1O2UE (Kwon, 2024); TROPOMI CO https://dx.doi.org/10.5270/S5P-bj3nry0 (ESA and SRON, 2025), NO2 https://dx.doi.org/10.5270/S5P-9bnp8q8 (ESA and KNMI, 2025a), and HCHO https://dx.doi.org/10.5270/S5P-vg1i7t0 (ESA and KNMI, 2025b); IASI NH3 https://iasi.aeris-data.fr/nh3/, EUMSAT and ULB-LATMOS, 2025; and GEMS SO2, HCHO, CHOCHO https://nesc.nier.go.kr/en/html/index.do (NIER et al., 2025), and NO2 https://doi.org/10.7910/DVN/ZQQJRO (Oak, 2024). GOCI AOD data are available upon request.
The supplement related to this article is available online at https://doi.org/10.5194/acp-25-3233-2025-supplement.
Original draft preparation, data processing, analysis, investigation, and visualization were done by YJO. DJJ contributed to project conceptualization. Review and editing were done by DJJ, DCP, RD, HC, SL, and JK. DCP, NKC, and SKK provided additional resources and support for the analysis.
The contact author has declared that none of the authors has any competing interests.
Publisher’s note: Copernicus Publications remains neutral with regard to jurisdictional claims made in the text, published maps, institutional affiliations, or any other geographical representation in this paper. While Copernicus Publications makes every effort to include appropriate place names, the final responsibility lies with the authors.
This research has been supported by the Samsung Advanced Institute of Technology (grant no. A41602).
This research has been supported by the Samsung Advanced Institute of Technology (grant no. A41602).
This paper was edited by Yves Balkanski and reviewed by two anonymous referees.
Bae, M., Kim, B.-U., Kim, H. C., Kim, J., and Kim, S.: Role of emissions and meteorology in the recent PM2.5 changes in China and South Korea from 2015 to 2018, Environ. Pollut., 270, 116233, https://doi.org/10.1016/j.envpol.2020.116233, 2021.
Bae, M., Kim, S., and Kim, S.: Quantitative Evaluation on the Drivers of PM2.5 Concentration Change in South Korea during the 1st–3rd Seasonal PM2.5 Management Periods, J. Korean Soc. Atmos. Environ., 38, 610–623, https://doi.org/10.5572/KOSAE.2022.38.4.610, 2022 (in Korean).
Bates, K. H., Jacob, D. J., Li, K., Ivatt, P. D., Evans, M. J., Yan, Y., and Lin, J.: Development and evaluation of a new compact mechanism for aromatic oxidation in atmospheric models, Atmos. Chem. Phys., 21, 18351–18374, https://doi.org/10.5194/acp-21-18351-2021, 2021.
Chance, K.: OMI/Aura Formaldehyde (HCHO) Total Column Daily L3 Weighted Mean Global 0.1deg Lat/Lon Grid V003, Goddard Earth Sciences Data and Information Services Center (GES DISC) [data set], https://doi.org/10.5067/Aura/OMI/DATA3010, 2019.
Chan Miller, C., Jacob, D. J., Marais, E. A., Yu, K., Travis, K. R., Kim, P. S., Fisher, J. A., Zhu, L., Wolfe, G. M., Hanisco, T. F., Keutsch, F. N., Kaiser, J., Min, K.-E., Brown, S. S., Washenfelder, R. A., González Abad, G., and Chance, K.: Glyoxal yield from isoprene oxidation and relation to formaldehyde: chemical mechanism, constraints from SENEX aircraft observations, and interpretation of OMI satellite data, Atmos. Chem. Phys., 17, 8725–8738, https://doi.org/10.5194/acp-17-8725-2017, 2017.
Chen, Y., Liu, C., Su, W., Hu, Q., Zhang, C., Liu, H., and Yin, H.: Identification of volatile organic compound emissions from anthropogenic and biogenic sources based on satellite observation of formaldehyde and glyoxal, Sci. Total Environ., 859, 159997, https://doi.org/10.1016/j.scitotenv.2022.159997, 2023.
Cheng, S., Ma, J., Cheng, W., Yan, P., Zhou, H., Zhou, L., and Yang, P.: Tropospheric NO2 vertical column densities retrieved from ground-based MAX-DOAS measurements at Shangdianzi regional atmospheric background station in China, J. Environ. Sci., 80, 186–196, https://doi.org/10.1016/j.jes.2018.12.012, 2019.
Cho, C., Clair, J. M. S., Liao, J., Wolfe, G. M., Jeong, S., Kang, D. i., Choi, J., Shin, M.-H., Park, J., Park, J.-H., Fried, A., Weinheimer, A., Blake, D. R., Diskin, G. S., Ullmann, K., Hall, S. R., Brune, W. H., Hanisco, T. F., and Min, K.-E.: Evolution of formaldehyde (HCHO) in a plume originating from a petrochemical industry and its volatile organic compounds (VOCs) emission rate estimation, Elementa: Science of the Anthropocene, 9, 00015, https://doi.org/10.1525/elementa.2021.00015, 2021.
Choi, J., Henze, D. K., Cao, H., Nowlan, C. R., González Abad, G., Kwon, H.-A., Lee, H.-M., Oak, Y. J., Park, R. J., Bates, K. H., Maasakkers, J. D., Wisthaler, A., and Weinheimer, A. J.: An Inversion Framework for Optimizing Non-Methane VOC Emissions Using Remote Sensing and Airborne Observations in Northeast Asia During the KORUS-AQ Field Campaign, J. Geophys. Res.-Atmos., 127, e2021JD035844, https://doi.org/10.1029/2021JD035844, 2022.
Choi, J., Henze, D. K., Nawaz, M. O., and Malley, C. S.: Source Attribution of Health Burdens From Ambient PM2.5, O3, and NO2 Exposure for Assessment of South Korean National Emission Control Scenarios by 2050, GeoHealth, 8, e2024GH001042, https://doi.org/10.1029/2024GH001042, 2024.
Choi, M., Kim, J., Lee, J., Kim, M., Park, Y.-J., Holben, B., Eck, T. F., Li, Z., and Song, C. H.: GOCI Yonsei aerosol retrieval version 2 products: an improved algorithm and error analysis with uncertainty estimation from 5-year validation over East Asia, Atmos. Meas. Tech., 11, 385–408, https://doi.org/10.5194/amt-11-385-2018, 2018.
Choi, S.-W., Kim, T., Lee, H.-K., Kim, H.-C., Han, J., Lee, K.-B., Lim, E.-h., Shin, S.-H., Jin, H.-A., Cho, E., Kim, Y.-M., and Yoo, C.: Analysis of the National Air Pollutant Emission Inventory (CAPSS 2016) and the Major Cause of Change in Republic of Korea, Asian Journal of Atmospheric Environment, 14, 422–445, https://doi.org/10.5572/ajae.2020.14.4.422, 2020.
Choi, S.-W., Cho, H., Hong, Y., Jo, H.-J., Park, M., Lee, H.-J., Choi, Y.-J., Shin, H.-H., Lee, D., Shin, E., Baek, W., Park, S.-K., Kim, E., Kim, H.-C., Song, S.-J., Park, Y., Kim, J., Baek, J., Kim, J., and Yoo, C.: Analysis of the National Air Pollutant Emissions Inventory (CAPSS 2018) Data and Assessment of Emissions Based on Air Quality Modeling in the Republic of Korea, Asian Journal of Atmospheric Environment, 16, 2022084, https://doi.org/10.5572/ajae.2022.084, 2022.
Choi, Y., Kanaya, Y., Takashima, H., Park, K., Lee, H., Chong, J., Kim, J. H., and Park, J.-S.: Changes in Tropospheric Nitrogen Dioxide Vertical Column Densities over Japan and Korea during the COVID-19 Using Pandora and MAX-DOAS, Aerosol Air Qual. Res., 23, 220145, https://doi.org/10.4209/aaqr.220145, 2023.
Chong, H., Lee, S., Kim, J., Jeong, U., Li, C., Krotkov, N., Nowlan, C., Al-Saadi, J., Janz, S., Kowalewski, M., Ahn, M.-H., Kang, M., Joanna, J., Haffner, D., Hu, L., Castellanos, P., Huey, L., Choi, M., Song, C., and Koo, J. H.: High-resolution mapping of SO2 using airborne observations from the GeoTASO instrument during the KORUS-AQ field study: PCA-based vertical column retrievals, Remote Sens. Environ., 241, 111725, https://doi.org/10.1016/j.rse.2020.111725, 2020.
Chong, H., Lee, S., Cho, Y., Kim, J., Koo, J.-H., Pyo Kim, Y., Kim, Y., Woo, J.-H., and Hyun Ahn, D.: Assessment of air quality in North Korea from satellite observations, Environ. Int., 171, 107708, https://doi.org/10.1016/j.envint.2022.107708, 2023.
Clarisse, L., Franco, B., Van Damme, M., Di Gioacchino, T., Hadji-Lazaro, J., Whitburn, S., Noppen, L., Hurtmans, D., Clerbaux, C., and Coheur, P.: The IASI NH3 version 4 product: averaging kernels and improved consistency, Atmos. Meas. Tech., 16, 5009–5028, https://doi.org/10.5194/amt-16-5009-2023, 2023.
Colombi, N. K., Jacob, D. J., Yang, L. H., Zhai, S., Shah, V., Grange, S. K., Yantosca, R. M., Kim, S., and Liao, H.: Why is ozone in South Korea and the Seoul metropolitan area so high and increasing?, Atmos. Chem. Phys., 23, 4031–4044, https://doi.org/10.5194/acp-23-4031-2023, 2023.
Crawford, J. H., Ahn, J.-Y., Al-Saadi, J., Chang, L., Emmons, L. K., Kim, J., Lee, G., Park, J.-H., Park, R. J., Woo, J. H., Song, C.-K., Hong, J.-H., Hong, Y.-D., Lefer, B. L., Lee, M., Lee, T., Kim, S., Min, K.-E., Yum, S. S., Shin, H. J., Kim, Y.-W., Choi, J.-S., Park, J.-S., Szykman, J. J., Long, R. W., Jordan, C. E., Simpson, I. J., Fried, A., Dibb, J. E., Cho, S., and Kim, Y. P.: The Korea–United States Air Quality (KORUS-AQ) field study, Elementa: Science of the Anthropocene, 9, 00163, https://doi.org/10.1525/elementa.2020.00163, 2021.
Dang, R., Jacob, D. J., Zhai, S., Coheur, P., Clarisse, L., Van Damme, M., Pendergrass, D. C., Choi, J.-S., Park, J.-S., Liu, Z., and Liao, H.: Diagnosing the Sensitivity of Particulate Nitrate to Precursor Emissions Using Satellite Observations of Ammonia and Nitrogen Dioxide, Geophys. Res. Lett., 50, e2023GL105761, https://doi.org/10.1029/2023GL105761, 2023.
Dang, R., Jacob, D. J., Zhai, S., Yang, L. H., Pendergrass, D. C., Coheur, P., Clarisse, L., Van Damme, M., Choi, J.-S., Park, J.-S., Liu, Z., Xie, P., and Liao, H.: A Satellite-Based Indicator for Diagnosing Particulate Nitrate Sensitivity to Precursor Emissions: Application to East Asia, Europe, and North America, Environ. Sci. Technol., 58, 20101–20113, https://doi.org/10.1021/acs.est.4c08082, 2024.
Deeter, M., Francis, G., Gille, J., Mao, D., Martínez-Alonso, S., Worden, H., Ziskin, D., Drummond, J., Commane, R., Diskin, G., and McKain, K.: The MOPITT Version 9 CO product: sampling enhancements and validation, Atmos. Meas. Tech., 15, 2325–2344, https://doi.org/10.5194/amt-15-2325-2022, 2022.
De Smedt, I., Theys, N., Yu, H., Danckaert, T., Lerot, C., Compernolle, S., Van Roozendael, M., Richter, A., Hilboll, A., Peters, E., Pedergnana, M., Loyola, D., Beirle, S., Wagner, T., Eskes, H., van Geffen, J., Boersma, K. F., and Veefkind, P.: Algorithm theoretical baseline for formaldehyde retrievals from S5P TROPOMI and from the QA4ECV project, Atmos. Meas. Tech., 11, 2395–2426, https://doi.org/10.5194/amt-11-2395-2018, 2018.
Duncan, B. N., Yoshida, Y., Olson, J. R., Sillman, S., Martin, R. V., Lamsal, L., Hu, Y., Pickering, K. E., Retscher, C., Allen, D. J., and Crawford, J. H.: Application of OMI observations to a space-based indicator of NOx and VOC controls on surface ozone formation, Atmos. Environ., 44, 2213–2223, https://doi.org/10.1016/j.atmosenv.2010.03.010, 2010.
Edwards, D. P., Emmons, L. K., Hauglustaine, D. A., Chu, D. A., Gille, J. C., Kaufman, Y. J., Pétron, G., Yurganov, L. N., Giglio, L., Deeter, M. N., Yudin, V., Ziskin, D. C., Warner, J., Lamarque, J.-F., Francis, G. L., Ho, S. P., Mao, D., Chen, J., Grechko, E. I., and Drummond, J. R.: Observations of carbon monoxide and aerosols from the Terra satellite: Northern Hemisphere variability, J. Geophys. Res.-Atmos., 109, D24202, https://doi.org/10.1029/2004JD004727, 2004.
Edwards, D. P., Martínez-Alonso, S., Jo, D. S., Ortega, I., Emmons, L. K., Orlando, J. J., Worden, H. M., Kim, J., Lee, H., Park, J., and Hong, H.: Quantifying the diurnal variation in atmospheric NO2 from Geostationary Environment Monitoring Spectrometer (GEMS) observations, Atmos. Chem. Phys., 24, 8943–8961, https://doi.org/10.5194/acp-24-8943-2024, 2024.
EUMSAT and ULB-LATMOS: IASI Level 3 (L3) Ammonia (NH3) total column, IASI [data set], https://iasi.aeris-data.fr/nh3/, last access: 12 March 2025.
European Space Agency (ESA) and Netherlands Institute for Space Research (SRON): TROPOMI Level 2 (L2) Carbon Monoxide (CO) total column, ESA [data set], https://doi.org/10.5270/S5P-bj3nry0, 2025.
European Space Agency (ESA) and Royal Netherlands Meteorological Institute (KNMI): TROPOMI Level 2 (L2) Nitrogen Dioxide (NO2), total and tropospheric columns, ESA [data set], https://doi.org/10.5270/S5P-9bnp8q8, 2025a.
European Space Agency (ESA) and Royal Netherlands Meteorological Institute (KNMI): TROPOMI Level 2 (L2) Formaldehyde (HCHO) total column, ESA [data set], https://doi.org/10.5270/S5P-vg1i7t0, 2025b.
Fried, A., Walega, J., Weibring, P., Richter, D., Simpson, I. J., Blake, D. R., Blake, N. J., Meinardi, S., Barletta, B., Hughes, S. C., Crawford, J. H., Diskin, G., Barrick, J., Hair, J., Fenn, M., Wisthaler, A., Mikoviny, T., Woo, J.-H., Park, M., Kim, J., Min, K.-E., Jeong, S., Wennberg, P. O., Kim, M. J., Crounse, J. D., Teng, A. P., Bennett, R., Yang-Martin, M., Shook, M. A., Huey, G., Tanner, D., Knote, C., Kim, J., Park, R., and Brune, W.: Airborne formaldehyde and volatile organic compound measurements over the Daesan petrochemical complex on Korea's northwest coast during the Korea-United States Air Quality study: Estimation of emission fluxes and effects on air quality, Elementa: Science of the Anthropocene, 8, 121, https://doi.org/10.1525/elementa.2020.121, 2020.
Gaubert, B., Emmons, L. K., Raeder, K., Tilmes, S., Miyazaki, K., Arellano Jr., A. F., Elguindi, N., Granier, C., Tang, W., Barré, J., Worden, H. M., Buchholz, R. R., Edwards, D. P., Franke, P., Anderson, J. L., Saunois, M., Schroeder, J., Woo, J.-H., Simpson, I. J., Blake, D. R., Meinardi, S., Wennberg, P. O., Crounse, J., Teng, A., Kim, M., Dickerson, R. R., He, H., Ren, X., Pusede, S. E., and Diskin, G. S.: Correcting model biases of CO in East Asia: impact on oxidant distributions during KORUS-AQ, Atmos. Chem. Phys., 20, 14617–14647, https://doi.org/10.5194/acp-20-14617-2020, 2020.
Gaudel, A., Cooper, O. R., Ancellet, G., Barret, B., Boynard, A., Burrows, J. P., Clerbaux, C., Coheur, P.-F., Cuesta, J., Cuevas, E., Doniki, S., Dufour, G., Ebojie, F., Foret, G., Garcia, O., Granados-Muñoz, M. J., Hannigan, J. W., Hase, F., Hassler, B., Huang, G., Hurtmans, D., Jaffe, D., Jones, N., Kalabokas, P., Kerridge, B., Kulawik, S., Latter, B., Leblanc, T., Le Flochmoën, E., Lin, W., Liu, J., Liu, X., Mahieu, E., McClure-Begley, A., Neu, J. L., Osman, M., Palm, M., Petetin, H., Petropavlovskikh, I., Querel, R., Rahpoe, N., Rozanov, A., Schultz, M. G., Schwab, J., Siddans, R., Smale, D., Steinbacher, M., Tanimoto, H., Tarasick, D. W., Thouret, V., Thompson, A. M., Trickl, T., Weatherhead, E., Wespes, C., Worden, H. M., Vigouroux, C., Xu, X., Zeng, G., and Ziemke, J.: Tropospheric Ozone Assessment Report: Present-day distribution and trends of tropospheric ozone relevant to climate and global atmospheric chemistry model evaluation, Elementa: Science of the Anthropocene, 6, 39, https://doi.org/10.1525/elementa.291, 2018.
González Abad, G., Liu, X., Chance, K., Wang, H., Kurosu, T. P., and Suleiman, R.: Updated Smithsonian Astrophysical Observatory Ozone Monitoring Instrument (SAO OMI) formaldehyde retrieval, Atmos. Meas. Tech., 8, 19–32, https://doi.org/10.5194/amt-8-19-2015, 2015.
Guenther, A. B., Jiang, X., Heald, C. L., Sakulyanontvittaya, T., Duhl, T., Emmons, L. K., and Wang, X.: The Model of Emissions of Gases and Aerosols from Nature version 2.1 (MEGAN2.1): an extended and updated framework for modeling biogenic emissions, Geosci. Model Dev., 5, 1471–1492, https://doi.org/10.5194/gmd-5-1471-2012, 2012.
Ha, E. S., Park, R. J., Kwon, H.-A., Lee, G. T., Lee, S. D., Shin, S., Lee, D.-W., Hong, H., Lerot, C., De Smedt, I., Danckaert, T., Hendrick, F., and Irie, H.: First evaluation of the GEMS glyoxal products against TROPOMI and ground-based measurements, Atmos. Meas. Tech., 17, 6369–6384, https://doi.org/10.5194/amt-17-6369-2024, 2024.
Jang, Y., Eo, Y., Jang, M., Woo, J.-H., Kim, Y., Lee, J.-B., and Lim, J.-H.: Impact of Land Cover and Leaf Area Index on BVOC Emissions over the Korean Peninsula, Atmosphere, 11, 806, https://doi.org/10.3390/atmos11080806, 2020.
Jeong, J. I., Seo, J., and Park, R. J.: Compromised Improvement of Poor Visibility Due to PM Chemical Composition Changes in South Korea, Remote Sensing, 14, 5310, https://doi.org/10.3390/rs14215310, 2022.
Jeong, J. I., Park, R. J., Song, C.-K., Yeh, S.-W., and Woo, J.-H.: Quantitative analysis of winter PM2.5 reduction in South Korea, 2019/20 to 2021/22: Contributions of meteorology and emissions, Sci. Total Environ., 907, 168179, https://doi.org/10.1016/j.scitotenv.2023.168179, 2024.
Jin, X., Fiore, A., Boersma, K. F., Smedt, I. D., and Valin, L.: Inferring Changes in Summertime Surface Ozone–NOx–VOC Chemistry over U.S. Urban Areas from Two Decades of Satellite and Ground-Based Observations, Environ. Sci. Technol., 54, 6518–6529, https://doi.org/10.1021/acs.est.9b07785, 2020.
Jin, X., Yang, Y., and Wang, S.: Observing the diurnal cycle of ozone-NOx-VOC sensitivity from geostationary satellite retrievals of ozone precursors, Abstract A21I-1872, AGU24, Washington DC, 9–13 December 2024, https://agu.confex.com/agu/agu24/meetingapp.cgi/Paper/1636887 (last access: 12 May 2025), 2024.
Jordan, C. E., Crawford, J. H., Beyersdorf, A. J., Eck, T. F., Halliday, H. S., Nault, B. A., Chang, L.-S., Park, J., Park, R., Lee, G., Kim, H., Ahn, J.-y., Cho, S., Shin, H. J., Lee, J. H., Jung, J., Kim, D.-S., Lee, M., Lee, T., Whitehill, A., Szykman, J., Schueneman, M. K., Campuzano-Jost, P., Jimenez, J. L., DiGangi, J. P., Diskin, G. S., Anderson, B. E., Moore, R. H., Ziemba, L. D., Fenn, M. A., Hair, J. W., Kuehn, R. E., Holz, R. E., Chen, G., Travis, K., Shook, M., Peterson, D. A., Lamb, K. D., and Schwarz, J. P.: Investigation of factors controlling PM2.5 variability across the South Korean Peninsula during KORUS-AQ, Elementa: Science of the Anthropocene, 8, 28, https://doi.org/10.1525/elementa.424, 2020.
Kaiser, J., Wolfe, G. M., Min, K. E., Brown, S. S., Miller, C. C., Jacob, D. J., deGouw, J. A., Graus, M., Hanisco, T. F., Holloway, J., Peischl, J., Pollack, I. B., Ryerson, T. B., Warneke, C., Washenfelder, R. A., and Keutsch, F. N.: Reassessing the ratio of glyoxal to formaldehyde as an indicator of hydrocarbon precursor speciation, Atmos. Chem. Phys., 15, 7571–7583, https://doi.org/10.5194/acp-15-7571-2015, 2015.
Kim, E., Kim, H. C., Kim, B.-U., Woo, J.-H., Liu, Y., and Kim, S.: Development of surface observation-based two-step emissions adjustment and its application on CO, NOx, and SO2 emissions in China and South Korea, Sci. Total Environ., 907, 167818, https://doi.org/10.1016/j.scitotenv.2023.167818, 2024.
Kim, H., Park, R. J., Kim, S., Brune, W. H., Diskin, G. S., Fried, A., Hall, S. R., Weinheimer, A. J., Wennberg, P., Wisthaler, A., Blake, D. R., and Ullmann, K.: Observed versus simulated OH reactivity during KORUS-AQ campaign: Implications for emission inventory and chemical environment in East Asia, Elementa: Science of the Anthropocene, 10, 00030, https://doi.org/10.1525/elementa.2022.00030, 2022.
Kim, H.-K., Song, C.-K., Han, K. M., Eo, Y. D., Song, C. H., Park, R., Hong, S.-C., Kim, S.-K., and Woo, J.-H.: Impact of biogenic emissions on early summer ozone and fine particulate matter exposure in the Seoul Metropolitan Area of Korea, Air Quality, Atmosphere & Health, 11, 1021–1035, https://doi.org/10.1007/s11869-018-0602-4, 2018.
Kim, J., Jeong, U., Ahn, M.-H., Kim, J. H., Park, R. J., Lee, H., Song, C. H., Choi, Y.-S., Lee, K.-H., Yoo, J.-M., Jeong, M.-J., Park, S. K., Lee, K.-M., Song, C.-K., Kim, S.-W., Kim, Y. J., Kim, S.-W., Kim, M., Go, S., Liu, X., Chance, K., Chan Miller, C., Al-Saadi, J., Veihelmann, B., Bhartia, P. K., Torres, O., Abad, G. G., Haffner, D. P., Ko, D. H., Lee, S. H., Woo, J.-H., Chong, H., Park, S. S., Nicks, D., Choi, W. J., Moon, K.-J., Cho, A., Yoon, J., Kim, S.-k., Hong, H., Lee, K., Lee, H., Lee, S., Choi, M., Veefkind, P., Levelt, P. F., Edwards, D. P., Kang, M., Eo, M., Bak, J., Baek, K., Kwon, H.-A., Yang, J., Park, J., Han, K. M., Kim, B.-R., Shin, H.-W., Choi, H., Lee, E., Chong, J., Cha, Y., Koo, J.-H., Irie, H., Hayashida, S., Kasai, Y., Kanaya, Y., Liu, C., Lin, J., Crawford, J. H., Carmichael, G. R., Newchurch, M. J., Lefer, B. L., Herman, J. R., Swap, R. J., Lau, A. K. H., Kurosu, T. P., Jaross, G., Ahlers, B., Dobber, M., McElroy, C. T., and Choi, Y.: New Era of Air Quality Monitoring from Space: Geostationary Environment Monitoring Spectrometer (GEMS), B. Am. Meteorol. Soc., 101, E1–E22, https://doi.org/10.1175/BAMS-D-18-0013.1, 2020.
Kim, J., Park, J., Hu, H., Crippa, M., Guizzardi, D., Chatani, S., Kurokawa, J., Morikawa, T., Yeo, S., Jin, H., and Woo, J.-H.: Long-term historical trends in air pollutant emissions in South Korea (2000–2018), Asian Journal of Atmospheric Environment, 17, 12, https://doi.org/10.1007/s44273-023-00013-w, 2023.
Kim, P. S., Jacob, D. J., Fisher, J. A., Travis, K., Yu, K., Zhu, L., Yantosca, R. M., Sulprizio, M. P., Jimenez, J. L., Campuzano-Jost, P., Froyd, K. D., Liao, J., Hair, J. W., Fenn, M. A., Butler, C. F., Wagner, N. L., Gordon, T. D., Welti, A., Wennberg, P. O., Crounse, J. D., St. Clair, J. M., Teng, A. P., Millet, D. B., Schwarz, J. P., Markovic, M. Z., and Perring, A. E.: Sources, seasonality, and trends of southeast US aerosol: an integrated analysis of surface, aircraft, and satellite observations with the GEOS-Chem chemical transport model, Atmos. Chem. Phys., 15, 10411–10433, https://doi.org/10.5194/acp-15-10411-2015, 2015.
Kim, S., Jeong, D., Sanchez, D., Wang, M., Seco, R., Blake, D., Meinardi, S., Barletta, B., Hughes, S., Jung, J., Kim, D., Lee, G., Lee, M., Ahn, J., Lee, S.-D., Cho, G., Sung, M.-Y., Lee, Y.-H., and Park, R.: The Controlling Factors of Photochemical Ozone Production in Seoul, South Korea, Aerosol Air Qual. Res., 18, 2253–2261, https://doi.org/10.4209/aaqr.2017.11.0452, 2018.
Kim, S.-J., Lee, S.-J., Lee, H.-Y., Park, H.-J., Kim, C.-H., Lim, H.-J., Lee, S.-B., Kim, J. Y., Schlink, U., and Choi, S.-D.: Spatial-seasonal variations and source identification of volatile organic compounds using passive air samplers in the metropolitan city of Seoul, South Korea, Atmos. Environ., 246, 118136, https://doi.org/10.1016/j.atmosenv.2020.118136, 2021.
Kim, S.-W., Kim, K.-M., Jeong, Y., Seo, S., Park, Y., and Kim, J.: Changes in surface ozone in South Korea on diurnal to decadal timescales for the period of 2001–2021, Atmos. Chem. Phys., 23, 12867–12886, https://doi.org/10.5194/acp-23-12867-2023, 2023.
Kim, Y. P. and Lee, G.: Trend of Air Quality in Seoul: Policy and Science, Aerosol Air Qual. Res., 18, 2141–2156, https://doi.org/10.4209/aaqr.2018.03.0081, 2018.
Koo, J.-H., Kim, J., Lee, Y. G., Park, S. S., Lee, S., Chong, H., Cho, Y., Kim, J., Choi, K., and Lee, T.: The implication of the air quality pattern in South Korea after the COVID-19 outbreak, Scientific Reports, 10, 22462, https://doi.org/10.1038/s41598-020-80429-4, 2020.
Krotkov, N. A., Lamsal, L. N., Celarier, E. A., Swartz, W. H., Marchenko, S. V., Bucsela, E. J., Chan, K. L., Wenig, M., and Zara, M.: The version 3 OMI NO2 standard product, Atmos. Meas. Tech., 10, 3133–3149, https://doi.org/10.5194/amt-10-3133-2017, 2017.
Krotkov, N. A., Lamsal, L. N., Marchenko, S. V., Celarier, E. A., Bucsela, E. J., Swartz, W. H., Joiner, J., and the OMI core team: OMI/Aura NO2 Cloud-Screened Total and Tropospheric Column L3 Global Gridded 0.25 degree x 0.25 degree V3, NASA Goddard Space Flight Center, Goddard Earth Sciences Data and Information Services Center (GES DISC) [data set], https://doi.org/10.5067/Aura/OMI/DATA3007, 2019.
Kwon, H.-A.: Monthly averaged glyoxal vertical column density, V1, Harvard Dataverse [data set], https://doi.org/10.7910/DVN/Q1O2UE, 2024.
Kwon, H.-A., Park, R. J., Oak, Y. J., Nowlan, C. R., Janz, S. J., Kowalewski, M. G., Fried, A., Walega, J., Bates, K. H., Choi, J., Blake, D. R., Wisthaler, A., and Woo, J.-H.: Top-down estimates of anthropogenic VOC emissions in South Korea using formaldehyde vertical column densities from aircraft during the KORUS-AQ campaign, Elementa: Science of the Anthropocene, 9, 00109, https://doi.org/10.1525/elementa.2021.00109, 2021.
Kwon, H.-A., González Abad, G., Chan Miller, C., Hall, K. R., Nowlan, C. R., O'Sullivan, E., Wang, H., Chong, H., Ayazpour, Z., Liu, X., and Chance, K.: Updated OMI Glyoxal Column Measurements Using Collection 4 Level 1B Radiances, Earth and Space Science, 11, e2024EA003705, https://doi.org/10.1029/2024EA003705, 2024.
Landgraf, J., aan de Brugh, J., Scheepmaker, R., Borsdorff, T., Hu, H., Houweling, S., Butz, A., Aben, I., and Hasekamp, O.: Carbon monoxide total column retrievals from TROPOMI shortwave infrared measurements, Atmos. Meas. Tech., 9, 4955–4975, https://doi.org/10.5194/amt-9-4955-2016, 2016.
Lee, G. T., Park, R. J., Kwon, H.-A., Ha, E. S., Lee, S. D., Shin, S., Ahn, M.-H., Kang, M., Choi, Y.-S., Kim, G., Lee, D.-W., Kim, D.-R., Hong, H., Langerock, B., Vigouroux, C., Lerot, C., Hendrick, F., Pinardi, G., De Smedt, I., Van Roozendael, M., Wang, P., Chong, H., Cho, Y., and Kim, J.: First evaluation of the GEMS formaldehyde product against TROPOMI and ground-based column measurements during the in-orbit test period, Atmos. Chem. Phys., 24, 4733–4749, https://doi.org/10.5194/acp-24-4733-2024, 2024.
Lee, H.-J., Chang, L.-S., Jaffe, D. A., Bak, J., Liu, X., Abad, G. G., Jo, H.-Y., Jo, Y.-J., Lee, J.-B., and Kim, C.-H.: Ozone Continues to Increase in East Asia Despite Decreasing NO2: Causes and Abatements, Remote Sensing, 13, 2177, https://doi.org/10.3390/rs13112177, 2021.
Lee, H.-M. and Park, R. J.: Factors determining the seasonal variation of ozone air quality in South Korea: Regional background versus domestic emission contributions, Environ. Pollut., 308, 119645, https://doi.org/10.1016/j.envpol.2022.119645, 2022.
Lee, H.-M., Kim, N. K., Ahn, J., Park, S.-M., Lee, J. Y., and Kim, Y. P.: When and why PM2.5 is high in Seoul, South Korea: Interpreting long-term (2015–2021) ground observations using machine learning and a chemical transport model, Sci. Total Environ., 920, 170822, https://doi.org/10.1016/j.scitotenv.2024.170822, 2024.
Lee, S., Choi, M., Kim, J., Park, Y.-J., Choi, J.-K., Lim, H., Lee, J., Kim, M., and Cho, Y.: Retrieval of aerosol optical properties from GOCI-II observations: Continuation of long-term geostationary aerosol monitoring over East Asia, Sci. Total Environ., 903, 166504, https://doi.org/10.1016/j.scitotenv.2023.166504, 2023.
Lee, Y., Won, S. R., Shin, H. J., Kim, D. G., and Lee, J. Y.: Seasonal Characteristics of Volatile Organic Compounds in Seoul, Korea: Major Sources and Contribution to Secondary Organic Aerosol Formation, Aerosol Air Qual. Res., 23, 220429, https://doi.org/10.4209/aaqr.220429, 2023.
Lennartson, E. M., Wang, J., Gu, J., Castro Garcia, L., Ge, C., Gao, M., Choi, M., Saide, P. E., Carmichael, G. R., Kim, J., and Janz, S. J.: Diurnal variation of aerosol optical depth and PM2.5 in South Korea: a synthesis from AERONET, satellite (GOCI), KORUS-AQ observation, and the WRF-Chem model, Atmos. Chem. Phys., 18, 15125–15144, https://doi.org/10.5194/acp-18-15125-2018, 2018.
Levelt, P. F., Oord, G. H. J. v. d., Dobber, M. R., Malkki, A., Huib, V., Johan de, V., Stammes, P., Lundell, J. O. V., and Saari, H.: The ozone monitoring instrument, IEEE T. Geosci. Remote, 44, 1093–1101, https://doi.org/10.1109/TGRS.2006.872333, 2006.
Li, C., Krotkov, N. A., Leonard, P. J. T., Carn, S., Joiner, J., Spurr, R. J. D., and Vasilkov, A.: Version 2 Ozone Monitoring Instrument SO2 product (OMSO2 V2): new anthropogenic SO2 vertical column density dataset, Atmos. Meas. Tech., 13, 6175–6191, https://doi.org/10.5194/amt-13-6175-2020, 2020a.
Li, C., Krotkov, N. A., and Leonard, P.: OMI/Aura Sulfur Dioxide (SO2) Total Column L3 1 day Best Pixel in 0.25 degree x 0.25 degree V3, Goddard Earth Sciences Data and Information Services Center (GES DISC) [data set], https://doi.org/10.5067/Aura/OMI/DATA3008, 2020b.
Li, J., Mao, J., Min, K.-E., Washenfelder, R. A., Brown, S. S., Kaiser, J., Keutsch, F. N., Volkamer, R., Wolfe, G. M., Hanisco, T. F., Pollack, I. B., Ryerson, T. B., Graus, M., Gilman, J. B., Lerner, B. M., Warneke, C., de Gouw, J. A., Middlebrook, A. M., Liao, J., Welti, A., Henderson, B. H., McNeill, V. F., Hall, S. R., Ullmann, K., Donner, L. J., Paulot, F., and Horowitz, L. W.: Observational constraints on glyoxal production from isoprene oxidation and its contribution to organic aerosol over the Southeast United States, J. Geophys. Res.-Atmos., 121, 9849–9861, https://doi.org/10.1002/2016JD025331, 2016.
Li, J., Wang, Y., Zhang, R., Smeltzer, C., Weinheimer, A., Herman, J., Boersma, K. F., Celarier, E. A., Long, R. W., Szykman, J. J., Delgado, R., Thompson, A. M., Knepp, T. N., Lamsal, L. N., Janz, S. J., Kowalewski, M. G., Liu, X., and Nowlan, C. R.: Comprehensive evaluations of diurnal NO2 measurements during DISCOVER-AQ 2011: effects of resolution-dependent representation of NOx emissions, Atmos. Chem. Phys., 21, 11133–11160, https://doi.org/10.5194/acp-21-11133-2021, 2021.
Li, K., Jacob, D. J., Liao, H., Qiu, Y., Shen, L., Zhai, S., Bates, K. H., Sulprizio, M. P., Song, S., Lu, X., Zhang, Q., Zheng, B., Zhang, Y., Zhang, J., Lee, H. C., and Kuk, S. K.: Ozone pollution in the North China Plain spreading into the late-winter haze season, P. Natl. Acad. Sci. USA, 118, e2015797118, https://doi.org/10.1073/pnas.2015797118, 2021.
Lin, J.: Grid-independent offline biogenic emissions, Geos Chem [data set], https://geos-chem.s3.amazonaws.com/index.html#HEMCO/OFFLINE_BIOVOC/v2021-12/0.25x0.3125/2021/, last access: 12 March 2025.
Martin, R. V., Fiore, A. M., and Van Donkelaar, A.: Space-based diagnosis of surface ozone sensitivity to anthropogenic emissions, Geophys. Res. Lett., 31, L06120, https://doi.org/10.1029/2004GL019416, 2004.
Moutinho, J. L., Liang, D., Golan, R., Sarnat, S. E., Weber, R., Sarnat, J. A., and Russell, A. G.: Near-road vehicle emissions air quality monitoring for exposure modeling, Atmos. Environ., 224, 117318, https://doi.org/10.1016/j.atmosenv.2020.117318, 2020.
NASA, NIER, and the KORUS-AQ science team: KORUS-AQ data archive, NASA [data set], https://doi.org/10.5067/Suborbital/KORUSAQ/DATA01, 2025.
National Air Emission Inventory and Resesarch Center: Annual CAPSS Emissions, National Air Emission Inventory and Resesarch Center [data set], https://www.air.go.kr/eng/capss/emission/year.do?menuId=190, last access: 12 March 2025.
National Institute of Environmental Research (NIER): AirKorea Annual Report, NIER [data set], https://airkorea.or.kr/web/detailViewDown?pMENU_NO=125, last access: 12 March 2025 (in Korean).
NIER: Geostationary Environment Monitoring Spectrometer (GEMS) Algorithm Theoretical Basis Document SO2 Retrieval Algorithm, https://nesc.nier.go.kr/en/html/satellite/doc/doc.do (last access: 12 May 2025), 2020.
NIER: 2022 Air Quality Annual Report, https://airkorea.or.kr/web/detailViewDown?pMENU_NO=125 (last access: 12 May 2025), 2023 (in Korean).
NIER, Pukyong University, and Seoul National University: GEMS Level 2 (L2) data, National Institute of Environmental Research [data set], https://nesc.nier.go.kr/en/html/index.do, last access: 12 March 2025,
Oak, Y.: A bias-corrected GEMS geostationary satellite product for nitrogen dioxide using machine learning to enforce consistency with the TROPOMI satellite instrument, V4, Harvard Dataverse [data set], https://doi.org/10.7910/DVN/ZQQJRO, 2024.
Oak, Y. J., Park, R. J., Schroeder, J. R., Crawford, J. H., Blake, D. R., Weinheimer, A. J., Woo, J.-H., Kim, S.-W., Yeo, H., Fried, A., Wisthaler, A., and Brune, W. H.: Evaluation of simulated O3 production efficiency during the KORUS-AQ campaign: Implications for anthropogenic NOx emissions in Korea, Elementa: Science of the Anthropocene, 7, 56, https://doi.org/10.1525/elementa.394, 2019.
Oak, Y. J., Park, R. J., Jo, D. S., Hodzic, A., Jimenez, J. L., Campuzano-Jost, P., Nault, B. A., Kim, H., Kim, H., Ha, E. S., Song, C.-K., Yi, S.-M., Diskin, G. S., Weinheimer, A. J., Blake, D. R., Wisthaler, A., Shim, M., and Shin, Y.: Evaluation of Secondary Organic Aerosol (SOA) Simulations for Seoul, Korea, J. Adv. Model. Earth Sy., 14, e2021MS002760, https://doi.org/10.1029/2021MS002760, 2022.
Oak, Y. J., Park, R. J., Lee, J.-T., and Byun, G.: Future air quality and premature mortality in Korea, Sci. Total Environ., 865, 161134, https://doi.org/10.1016/j.scitotenv.2022.161134, 2023.
Oak, Y. J., Jacob, D. J., Balasus, N., Yang, L. H., Chong, H., Park, J., Lee, H., Lee, G. T., Ha, E. S., Park, R. J., Kwon, H.-A., and Kim, J.: A bias-corrected GEMS geostationary satellite product for nitrogen dioxide using machine learning to enforce consistency with the TROPOMI satellite instrument, Atmos. Meas. Tech., 17, 5147–5159, https://doi.org/10.5194/amt-17-5147-2024, 2024.
Palmer, P. I., Jacob, D. J., Fiore, A. M., Martin, R. V., Chance, K., and Kurosu, T. P.: Mapping isoprene emissions over North America using formaldehyde column observations from space, J. Geophys. Res.-Atmos., 108, 4180, https://doi.org/10.1029/2002JD002153, 2003.
Pandey, S. K., Kim, K.-H., Chung, S.-Y., Cho, S. J., Kim, M. Y., and Shon, Z.-H.: Long-term study of NOx behavior at urban roadside and background locations in Seoul, Korea, Atmos. Environ., 42, 607–622, https://doi.org/10.1016/j.atmosenv.2007.10.015, 2008.
Park, D.-H., Kim, S.-W., Kim, M.-H., Yeo, H., Park, S. S., Nishizawa, T., Shimizu, A., and Kim, C.-H.: Impacts of local versus long-range transported aerosols on PM10 concentrations in Seoul, Korea: An estimate based on 11-year PM10 and lidar observations, Sci. Total Environ., 750, 141739, https://doi.org/10.1016/j.scitotenv.2020.141739, 2021.
Park, J. P., Kim, E. K., Kang, Y.-H. K., and Kim, S.: Assessment of Provincial Air Quality based on Air Quality Index during 2016–2022, J. Korean Soc. Atmos. Environ., 40, 225–241, 2024 (in Korean).
Park, T., Singh, R., Ban, J., Kim, K., Park, G., Kang, S., Choi, S., Song, J., Yu, D.-G., Bae, M.-S., Ahn, J., Jung, H.-J., Lim, Y.-J., Kim, H. W., Hwang, T. K., Choi, Y. J., Kim, S.-Y., Kim, H. S., Chang, Y. W., Shin, H. J., Lim, Y., Lee, J., Park, J., Choi, J., and Lee, T.: Seasonal and regional variations of atmospheric ammonia across the South Korean Peninsula, Asian Journal of Atmospheric Environment, 17, 6, https://doi.org/10.1007/s44273-023-00008-7, 2023.
Parrish, D. D., Kuster, W. C., Shao, M., Yokouchi, Y., Kondo, Y., Goldan, P. D., de Gouw, J. A., Koike, M., and Shirai, T.: Comparison of air pollutant emissions among mega-cities, Atmos. Environ., 43, 6435–6441, https://doi.org/10.1016/j.atmosenv.2009.06.024, 2009.
Pendergrass, D. C., Zhai, S., Kim, J., Koo, J.-H., Lee, S., Bae, M., Kim, S., Liao, H., and Jacob, D. J.: Continuous mapping of fine particulate matter (PM2.5) air quality in East Asia at daily 6 × 6 km2 resolution by application of a random forest algorithm to 2011–2019 GOCI geostationary satellite data, Atmos. Meas. Tech., 15, 1075–1091, https://doi.org/10.5194/amt-15-1075-2022, 2022.
Pendergrass, D. C., Jacob, D. J., Oak, Y. J., Lee, J., Kim, M., Kim, J., Lee, S., Zhai, S., Irie, H., and Liao, H.: A continuous 2011–2022 record of fine particulate matter (PM2.5) in East Asia at daily 2-km resolution from geostationary satellite observations: Population exposure and long-term trends, Atmos. Environ., 346, 121068, https://doi.org/10.1016/j.atmosenv.2025.121068, 2025.
Ren, J., Guo, F., and Xie, S.: Diagnosing ozone–NOx–VOC sensitivity and revealing causes of ozone increases in China based on 2013–2021 satellite retrievals, Atmos. Chem. Phys., 22, 15035–15047, https://doi.org/10.5194/acp-22-15035-2022, 2022.
Seo, J., Park, D.-S. R., Kim, J. Y., Youn, D., Lim, Y. B., and Kim, Y.: Effects of meteorology and emissions on urban air quality: a quantitative statistical approach to long-term records (1999–2016) in Seoul, South Korea, Atmos. Chem. Phys., 18, 16121–16137, https://doi.org/10.5194/acp-18-16121-2018, 2018.
Seo, S., Kim, S.-W., Kim, K.-M., Lamsal, L. N., and Jin, H.: Reductions in NO2 concentrations in Seoul, South Korea detected from space and ground-based monitors prior to and during the COVID-19 pandemic, Environmental Research Communications, 3, 051005, https://doi.org/10.1088/2515-7620/abed92, 2021.
Seo, Y.-K., Suvarapu, L., and Baek, S.-O.: Characterization of Odorous Compounds (VOC and Carbonyl Compounds) in the Ambient Air of Yeosu and Gwangyang, Large Industrial Areas of South Korea, Sci. World J., 2014, 824301, https://doi.org/10.1155/2014/824301, 2014.
Shah, V., Jacob, D. J., Li, K., Silvern, R. F., Zhai, S., Liu, M., Lin, J., and Zhang, Q.: Effect of changing NOx lifetime on the seasonality and long-term trends of satellite-observed tropospheric NO2 columns over China, Atmos. Chem. Phys., 20, 1483–1495, https://doi.org/10.5194/acp-20-1483-2020, 2020.
Simpson, I. J., Blake, D. R., Blake, N. J., Meinardi, S., Barletta, B., Hughes, S. C., Fleming, L. T., Crawford, J. H., Diskin, G. S., Emmons, L. K., Fried, A., Guo, H., Peterson, D. A., Wisthaler, A., Woo, J.-H., Barré, J., Gaubert, B., Kim, J., Kim, M. J., Kim, Y., Knote, C., Mikoviny, T., Pusede, S. E., Schroeder, J. R., Wang, Y., Wennberg, P. O., and Zeng, L.: Characterization, sources and reactivity of volatile organic compounds (VOCs) in Seoul and surrounding regions during KORUS-AQ, Elementa: Science of the Anthropocene, 8, 37, https://doi.org/10.1525/elementa.434, 2020.
Song, C.-K. and Lee, G.: Regional and Urban Air Quality in East Asia: South Korea, in: Handbook of Air Quality and Climate Change, edited by: Akimoto, H., and Tanimoto, H., Springer Nature Singapore, Singapore, 1–27, https://doi.org/10.1007/978-981-15-2527-8_70-1, 2020.
Song, S.-K., Shon, Z.-H., Kang, Y.-H., Kim, K.-H., Han, S.-B., Kang, M., Bang, J.-H., and Oh, I.: Source apportionment of VOCs and their impact on air quality and health in the megacity of Seoul, Environ. Pollut., 247, 763–774, https://doi.org/10.1016/j.envpol.2019.01.102, 2019.
Souri, A. H., Nowlan, C. R., Wolfe, G. M., Lamsal, L. N., Chan Miller, C. E., Abad, G. G., Janz, S. J., Fried, A., Blake, D. R., Weinheimer, A. J., Diskin, G. S., Liu, X., and Chance, K.: Revisiting the effectiveness of ratios for inferring ozone sensitivity to its precursors using high resolution airborne remote sensing observations in a high ozone episode during the KORUS-AQ campaign, Atmos. Environ., 224, 117341, https://doi.org/10.1016/j.atmosenv.2020.117341, 2020.
Tian, X., Xie, P., Xu, J., Li, A., Wang, Y., Qin, M., and Hu, Z.: Long-term observations of tropospheric NO2, SO2 and HCHO by MAX-DOAS in Yangtze River Delta area, China, J. Environ. Sci., 71, 207–221, https://doi.org/10.1016/j.jes.2018.03.006, 2018.
Travis, K. R., Nault, B. A., Crawford, J. H., Bates, K. H., Blake, D. R., Cohen, R. C., Fried, A., Hall, S. R., Huey, L. G., Lee, Y. R., Meinardi, S., Min, K.-E., Simpson, I. J., and Ullman, K.: Impact of improved representation of volatile organic compound emissions and production of NOx reservoirs on modeled urban ozone production, Atmos. Chem. Phys., 24, 9555–9572, https://doi.org/10.5194/acp-24-9555-2024, 2024.
Van Damme, M., Clarisse, L., Heald, C. L., Hurtmans, D., Ngadi, Y., Clerbaux, C., Dolman, A. J., Erisman, J. W., and Coheur, P. F.: Global distributions, time series and error characterization of atmospheric ammonia (NH3) from IASI satellite observations, Atmos. Chem. Phys., 14, 2905–2922, https://doi.org/10.5194/acp-14-2905-2014, 2014.
van Geffen, J., Eskes, H., Compernolle, S., Pinardi, G., Verhoelst, T., Lambert, J.-C., Sneep, M., ter Linden, M., Ludewig, A., Boersma, K. F., and Veefkind, J. P.: Sentinel-5P TROPOMI NO2 retrieval: impact of version v2.2 improvements and comparisons with OMI and ground-based data, Atmos. Meas. Tech., 15, 2037–2060, https://doi.org/10.5194/amt-15-2037-2022, 2022.
Veefkind, J. P., Aben, I., McMullan, K., Förster, H., de Vries, J., Otter, G., Claas, J., Eskes, H. J., de Haan, J. F., Kleipool, Q., van Weele, M., Hasekamp, O., Hoogeveen, R., Landgraf, J., Snel, R., Tol, P., Ingmann, P., Voors, R., Kruizinga, B., Vink, R., Visser, H., and Levelt, P. F.: TROPOMI on the ESA Sentinel-5 Precursor: A GMES mission for global observations of the atmospheric composition for climate, air quality and ozone layer applications, Remote Sens. Environ., 120, 70–83, https://doi.org/10.1016/j.rse.2011.09.027, 2012.
Warneke, C., de Gouw, J. A., Holloway, J. S., Peischl, J., Ryerson, T. B., Atlas, E., Blake, D., Trainer, M., and Parrish, D. D.: Multiyear trends in volatile organic compounds in Los Angeles, California: Five decades of decreasing emissions, J. Geophys. Res.-Atmos., 117, D00V17, https://doi.org/10.1029/2012JD017899, 2012.
Wie, J. and Moon, B.-K.: Impact of the Western North Pacific Subtropical High on summer surface ozone in the Korean Peninsula, Atmos. Pollut. Res., 9, 655–661, https://doi.org/10.1016/j.apr.2017.12.012, 2018.
Xu, T., Zhang, C., Xue, J., Hu, Q., Xing, C., and Liu, C.: Estimating Hourly Nitrogen Oxide Emissions over East Asia from Geostationary Satellite Measurements, Environ. Sci. Technol. Let., 11, 122–129, https://doi.org/10.1021/acs.estlett.3c00467, 2024.
Yang, L. H., Jacob, D. J., Colombi, N. K., Zhai, S., Bates, K. H., Shah, V., Beaudry, E., Yantosca, R. M., Lin, H., Brewer, J. F., Chong, H., Travis, K. R., Crawford, J. H., Lamsal, L. N., Koo, J.-H., and Kim, J.: Tropospheric NO2 vertical profiles over South Korea and their relation to oxidant chemistry: implications for geostationary satellite retrievals and the observation of NO2 diurnal variation from space, Atmos. Chem. Phys., 23, 2465–2481, https://doi.org/10.5194/acp-23-2465-2023, 2023.
Yang, L. H., Jacob, D. J., Dang, R., Oak, Y. J., Lin, H., Kim, J., Zhai, S., Colombi, N. K., Pendergrass, D. C., Beaudry, E., Shah, V., Feng, X., Yantosca, R. M., Chong, H., Park, J., Lee, H., Lee, W.-J., Kim, S., Kim, E., Travis, K. R., Crawford, J. H., and Liao, H.: Interpreting Geostationary Environment Monitoring Spectrometer (GEMS) geostationary satellite observations of the diurnal variation in nitrogen dioxide (NO2) over East Asia, Atmos. Chem. Phys., 24, 7027–7039, https://doi.org/10.5194/acp-24-7027-2024, 2024.
Yeo, M. J. and Kim, Y.: Long-term trends and affecting factors in the concentrations of criteria air pollutants in South Korea, J. Environ. Manage., 317, 115458, https://doi.org/10.1016/j.jenvman.2022.115458, 2022.
Zhai, S., Jacob, D. J., Wang, X., Shen, L., Li, K., Zhang, Y., Gui, K., Zhao, T., and Liao, H.: Fine particulate matter (PM2.5) trends in China, 2013–2018: separating contributions from anthropogenic emissions and meteorology, Atmos. Chem. Phys., 19, 11031–11041, https://doi.org/10.5194/acp-19-11031-2019, 2019.
Zhai, S., Jacob, D. J., Brewer, J. F., Li, K., Moch, J. M., Kim, J., Lee, S., Lim, H., Lee, H. C., Kuk, S. K., Park, R. J., Jeong, J. I., Wang, X., Liu, P., Luo, G., Yu, F., Meng, J., Martin, R. V., Travis, K. R., Hair, J. W., Anderson, B. E., Dibb, J. E., Jimenez, J. L., Campuzano-Jost, P., Nault, B. A., Woo, J.-H., Kim, Y., Zhang, Q., and Liao, H.: Relating geostationary satellite measurements of aerosol optical depth (AOD) over East Asia to fine particulate matter (PM2.5): insights from the KORUS-AQ aircraft campaign and GEOS-Chem model simulations, Atmos. Chem. Phys., 21, 16775–16791, https://doi.org/10.5194/acp-21-16775-2021, 2021.
Zhu, L., Jacob, D. J., Kim, P. S., Fisher, J. A., Yu, K., Travis, K. R., Mickley, L. J., Yantosca, R. M., Sulprizio, M. P., De Smedt, I., González Abad, G., Chance, K., Li, C., Ferrare, R., Fried, A., Hair, J. W., Hanisco, T. F., Richter, D., Jo Scarino, A., Walega, J., Weibring, P., and Wolfe, G. M.: Observing atmospheric formaldehyde (HCHO) from space: validation and intercomparison of six retrievals from four satellites (OMI, GOME2A, GOME2B, OMPS) with SEAC4RS aircraft observations over the southeast US, Atmos. Chem. Phys., 16, 13477–13490, https://doi.org/10.5194/acp-16-13477-2016, 2016.
Zhu, L., González Abad, G., Nowlan, C. R., Chan Miller, C., Chance, K., Apel, E. C., DiGangi, J. P., Fried, A., Hanisco, T. F., Hornbrook, R. S., Hu, L., Kaiser, J., Keutsch, F. N., Permar, W., St. Clair, J. M., and Wolfe, G. M.: Validation of satellite formaldehyde (HCHO) retrievals using observations from 12 aircraft campaigns, Atmos. Chem. Phys., 20, 12329–12345, https://doi.org/10.5194/acp-20-12329-2020, 2020.