the Creative Commons Attribution 4.0 License.
the Creative Commons Attribution 4.0 License.
 | 14 Mar 2025
Wind-driven emission of marine ice-nucleating particles in the Scripps Ocean-Atmosphere Research Simulator (SOARS)
Thomas C. J. Hill
Chamika K. Madawala
Raymond J. Leibensperger III
Samantha Greeney
Christopher D. Cappa
M. Dale Stokes
Grant B. Deane
Christopher Lee
Alexei V. Tivanski
Kimberly A. Prather
Paul J. DeMott
Sea spray aerosol (SSA) represents one of the most abundant natural aerosol types, contributing significantly to global aerosol mass and aerosol optical depth, as well as to both the magnitude of and the uncertainty in aerosol radiative forcing. In addition to its direct effects, SSA can also serve as ice-nucleating particles (INPs), which are required for the initiation of cloud glaciation at temperatures warmer than ca. −36 °C. This study presents initial results from the CHaracterizing Atmosphere-Ocean parameters in SOARS (CHAOS) mesocosm campaign, which was conducted in the new Scripps Ocean-Atmosphere Research Simulator (SOARS) wind–wave channel. SOARS allows for isolation of individual factors, such as wave height, wind speed, water temperature, or biological state, and can carefully vary them in a controlled manner. Here, we focus on the influence of wind speed on the emission of SSA and INPs. In agreement with recent Southern Ocean measurements, online INP concentrations during CHAOS showed an increasing relationship with wind speed, whereas offline CHAOS INP concentrations did not, which may be related to sampling inlet differences. Changes in the INP activated fraction, dominant INP particle morphology, and INP composition were seen to vary with wind. Seawater ice-nucleating entity concentrations during CHAOS were stable over time, indicating that changes in atmospheric INPs were driven by wind speed and wave-breaking mechanics rather than variations in seawater chemistry or biology. While specific emission mechanisms remain elusive, these observations may help explain some of the variability in INP concentration and composition that has been seen in ambient measurements.
- Article
(6800 KB) - Full-text XML
- BibTeX
- EndNote


Sea spray aerosol (SSA) constitutes marine-derived particles composed of mixtures of inorganic salts and organic compounds, with the exact composition and mixing state varying based on particle size, the production mechanism, and the underlying biology and geochemistry of the source seawater (e.g., Lewis and Schwartz, 2004; O'Dowd and de Leeuw, 2007; de Leeuw et al., 2011; Cochran et al., 2017). Along with mineral and soil dusts, SSA dominates atmospheric aerosol mass and contributes ∼30 % to globally averaged total aerosol optical depth (AOD) (O'Dowd and de Leeuw, 2007; Bellouin et al., 2013). SSA is generated through wind stress at the ocean surface, either through the direct tearing of breaking wave crests (spume drops) or as a result of bubble bursting (film and jet drops) following air entrainment during wave breaking (Lewis and Schwartz, 2004; O'Dowd and de Leeuw, 2007; Deike et al., 2022). Given its ubiquity in the atmosphere, SSA is an important contributor to both the magnitude of and the uncertainty in aerosol radiative forcing (Andreae, 2007; Carslaw et al., 2013, 2017; Forster et al., 2021). Additionally, oxidation of dimethyl sulfide (DMS) and other biogenic volatile organic compounds (BVOCs) emitted from the ocean can lead to the condensation of gas-phase species onto existing particles or to the formation of secondary marine aerosol (SMA) (Lewis and Schwartz, 2004; Quinn et al., 2017; Naik et al., 2021).
The indirect radiative impact of both SSA and SMA through their role as cloud condensation nuclei (CCN) has received considerable attention in observational, laboratory, and modeling studies (e.g., Pierce and Adams, 2006; Andreae, 2007; Grythe et al., 2014; Modini et al., 2015; McCoy et al., 2015a; Quinn et al., 2017; Heinze et al., 2019; Mayer et al., 2020; Gryspeerdt et al., 2023). Spurred by observations in remote ocean regions and laboratory mesocosm studies (Rosinski et al., 1987; Bigg, 1973, 1990; Knopf et al., 2011; DeMott et al., 2016), the contribution of marine aerosol to the ice-nucleating particle (INP) budget, and thus indirectly to cloud phase, has come under increasing focus in recent years (e.g., Burrows et al., 2013; Wilson et al., 2015; Irish et al., 2017; Vergara-Temprado et al., 2017, 2018; McCluskey et al., 2018c, b, a; Welti et al., 2018; Huang et al., 2018; Creamean et al., 2019; McCluskey et al., 2019; Schmale et al., 2019; Irish et al., 2019; Welti et al., 2020; Ickes et al., 2020; Hartmann et al., 2020, 2021; Zhao et al., 2021; Mitts et al., 2021; Tatzelt et al., 2022; Alpert et al., 2022; Steinke et al., 2022; Raatikainen et al., 2022; Lin et al., 2022; McCluskey et al., 2023; Raman et al., 2023; Miyakawa et al., 2023; Kawana et al., 2024). INPs are critical in initiating cloud glaciation at temperatures warmer than ca. −36 °C and thus exert a large influence on cloud properties related to phase, such as lifetime, precipitation formation, and radiative forcing (e.g., Kanji et al., 2017). Additionally, mixed-phase clouds, which contain both liquid and ice, play major roles in determining cloud feedbacks (McCoy et al., 2015b, 2016), global cloud radiative properties (Cesana and Storelvmo, 2017), and equilibrium climate sensitivity (Zelinka et al., 2020; Bjordal et al., 2020).
Measurements of ice nucleation in marine environments were first made in the late 1950s and 1960s (see Ickes et al., 2020, their Table 1). Since then, a few studies have suggested whole phytoplankton cells or marine bacteria may be the ice-nucleating components of SSA (Fall and Schnell, 1985; Knopf et al., 2011; Wilbourn et al., 2020; Beall et al., 2021). However, the majority of studies indicate that marine macromolecules, phytoplankton exudates, or other biogenic organic species are the ice-nucleating components based on the generally small size (<0.2 µm) of ice-nucleating entities in seawater and their relationship with biological activity (Schnell and Vali, 1976; Rosinski et al., 1987; Knopf et al., 2011; Wilson et al., 2015; Wang et al., 2015; Ladino et al., 2016; DeMott et al., 2016; Irish et al., 2017; McCluskey et al., 2018b; Alpert et al., 2022; Hill et al., 2023). Based on laboratory and mesocosm experiments, several studies have also inferred different components may be active at different temperatures, as well as at different times throughout the onset and decay of phytoplankton blooms (DeMott et al., 2016; McCluskey et al., 2018b; Ickes et al., 2020). In addition to the small and ubiquitous marine organic INPs, a second category of more intermittent, larger, and heat-sensitive marine INPs that are active at warmer temperatures has been identified (McCluskey et al., 2018b; Ickes et al., 2020; Hartmann et al., 2020; van Pinxteren et al., 2020). These may be associated with microbes or cellular debris but have not been definitively identified. Recent laboratory studies have pointed to the importance of supermicron SSA as a marine INP (Mitts et al., 2021); however, no assessment of the atmospheric transport of such particles has been conducted and ambient observations have yet to confirm this.
INP concentrations in remote marine regions are generally several orders of magnitude lower than those in continental areas (DeMott et al., 2016; McCluskey et al., 2018c; Welti et al., 2020; Tatzelt et al., 2022). Based on normalization by particle number or surface area, marine INPs are also significantly less efficient at nucleating ice than species such as mineral or soil dusts (DeMott et al., 2016; Kanji et al., 2017; McCluskey et al., 2018c). Despite this, in remote areas such as the Southern Ocean, marine INPs are hypothesized to be the dominant contributor to the INP budget due to the lack of continental influence (Burrows et al., 2013; Vergara-Temprado et al., 2017, 2018; McCluskey et al., 2019), and they may dominate seasonally or intermittently in other regions such as the high Arctic (Huang et al., 2018; Creamean et al., 2019; Hartmann et al., 2020; Ickes et al., 2020; Hartmann et al., 2021). Atmospheric concentrations of the small organic marine INP type were parameterized using observations from Mace Head in the North Atlantic (McCluskey et al., 2018c), and subsequent implementation in CAM5 (Community Atmosphere Model version 5) and CAM6 (version 6) compared well to observations made in the Southern Ocean (McCluskey et al., 2019, 2023). Other recent modeling work has focused on the intermittent, high-temperature marine INPs (Steinke et al., 2022) or on freezing kinetics of background SSA particles (Alpert et al., 2022). Despite these efforts, the fundamental factors controlling the emission of marine INPs from the sea surface to the atmosphere remain largely unknown.
Significantly more is known about the factors influencing the production of sea spray, although there is still huge variability in simulated SSA fluxes among models, especially in polar regions (de Leeuw et al., 2011; Grythe et al., 2014; Deike et al., 2022; Lapere et al., 2023). Numerous parameterizations for sea spray size distribution functions have been proposed (e.g., Monahan and Muircheartaigh, 1980; Monahan et al., 1986; Gong, 2003; Mårtensson et al., 2003; Lewis and Schwartz, 2004; de Leeuw et al., 2011; Sofiev et al., 2011; Jaeglé et al., 2011; Meskhidze et al., 2013; Ovadnevaite et al., 2014; Grythe et al., 2014; Salter et al., 2015), with the choice influencing not only emitted SSA number and mass, but also the simulated radiative budget and aerosol–cloud interactions once implemented in models (Grythe et al., 2014; McCoy et al., 2015a; Barthel et al., 2019; Johnson et al., 2020). Although wind speed is the dominant influence on SSA production (Lewis and Schwartz, 2004; O'Dowd and de Leeuw, 2007; de Leeuw et al., 2011), other factors including sea surface temperature (Mårtensson et al., 2003; Sellegri et al., 2006; Jaeglé et al., 2011; Zábori et al., 2012; Ovadnevaite et al., 2014; Salter et al., 2014, 2015; Schwier et al., 2017; Forestieri et al., 2018; Saliba et al., 2019; Barthel et al., 2019; Christiansen et al., 2019; Hartery et al., 2020; Liu et al., 2021; Zinke et al., 2022; Sellegri et al., 2023), salinity (Mårtensson et al., 2003; Zábori et al., 2012; Ovadnevaite et al., 2014; May et al., 2016; Nilsson et al., 2021; Zinke et al., 2022), and seawater biology and chemistry (O'Dowd et al., 2004; Sellegri et al., 2006; Fuentes et al., 2010; Wang et al., 2015; McCoy et al., 2015a; Schwier et al., 2017; Burrows et al., 2022; Forestieri et al., 2018; Saliba et al., 2019; Christiansen et al., 2019; Sellegri et al., 2023) have also been shown to influence production. Conflicting and sometimes contradictory results for the magnitude and even sign of the impact of each of these variables have been observed in laboratory and field measurements, which has not aided evaluation of the numerous available SSA source parameterizations.
The new Scripps Ocean-Atmosphere Research Simulator (SOARS) wind–wave channel at the Scripps Institution of Oceanography, University of California, San Diego, was designed to tackle some of these outstanding questions about the production and atmospheric impacts of SSA. This study focuses on the first results from the SOARS channel during the CHaracterizing Atmosphere-Ocean parameters in SOARS (CHAOS) mesocosm campaign, conducted for 2 months in 2022. The overarching goal of CHAOS was to understand and reduce uncertainty in the impact of wind speed on SSA production. Improvements over previous wave channel experiments (Prather et al., 2013; Wang et al., 2015; Sauer et al., 2022) include the ability to modulate wind speed in the wave channel, increasing atmospheric relevance. This study will touch on SSA production in SOARS but will primarily address the role of wind speed in emissions of marine INPs, which has not previously been characterized through controlled experiments.
2.1 Production of sea spray aerosols in SOARS
Measurements described in this study were collected during the CHaracterizing Atmosphere-Ocean parameters in SOARS (CHAOS) study during August 2022. SSA was produced in the new Scripps Ocean-Atmosphere Research Simulator (SOARS) wind–wave channel at the Scripps Institution of Oceanography (SIO), which is shown schematically in Fig. A1. The SOARS wave channel is 2.4 m wide, 2.4 m tall, and 36 m in length, with a nominal water volume of 103 680 L when filled. This is approximately 9 times the water volume of the glass wave channel described in Sauer et al. (2022), which was used during the preceding Sea Spray Chemistry and Particle Evolution (SeaSCAPE) campaign. Waves are generated with a paddle driven by a TEFC (totally enclosed, fan-cooled) electric motor, up to a maximum height of 0.9 m. The paddle is made of a fiberglass and foam core with an epoxy coating. It is strengthened with titanium rails, and the edges that contact the ceramic bearing pads on the walls and floor of the channel are covered in Teflon slides. A submerged polycarbonate ramp, or “beach”, at the end of the channel dissipates residual wave energy and reduces reflected interference within the breaking wave channel. SOARS features an enclosed air recirculation system with a split duct design above the wave channel where the wind turbines (fans) are located. There are additional (makeup) fans generating positive pressure to reduce mixing of ambient gas and aerosol into SOARS. Airflow through the makeup fans passes through HEPA and activated charcoal filters prior to entering the air ducts upstream of the main fans to remove particles and volatile organic compounds (VOCs) from the incoming airstream. At low wind speeds, HEPA filters and other user-selectable filters (i.e., activated charcoal) can also be included in line with the airstream in the recirculation vents to reduce particle and VOC concentrations in the SOARS headspace. A “tent” constructed of plastic sheeting was built around the paddle during CHAOS to minimize particle or VOC contamination of the SOARS headspace through paddle motion. The tent was positively pressurized with fans forcing air through MERV 8 and potassium permanganate filters to remove particles and VOCs.
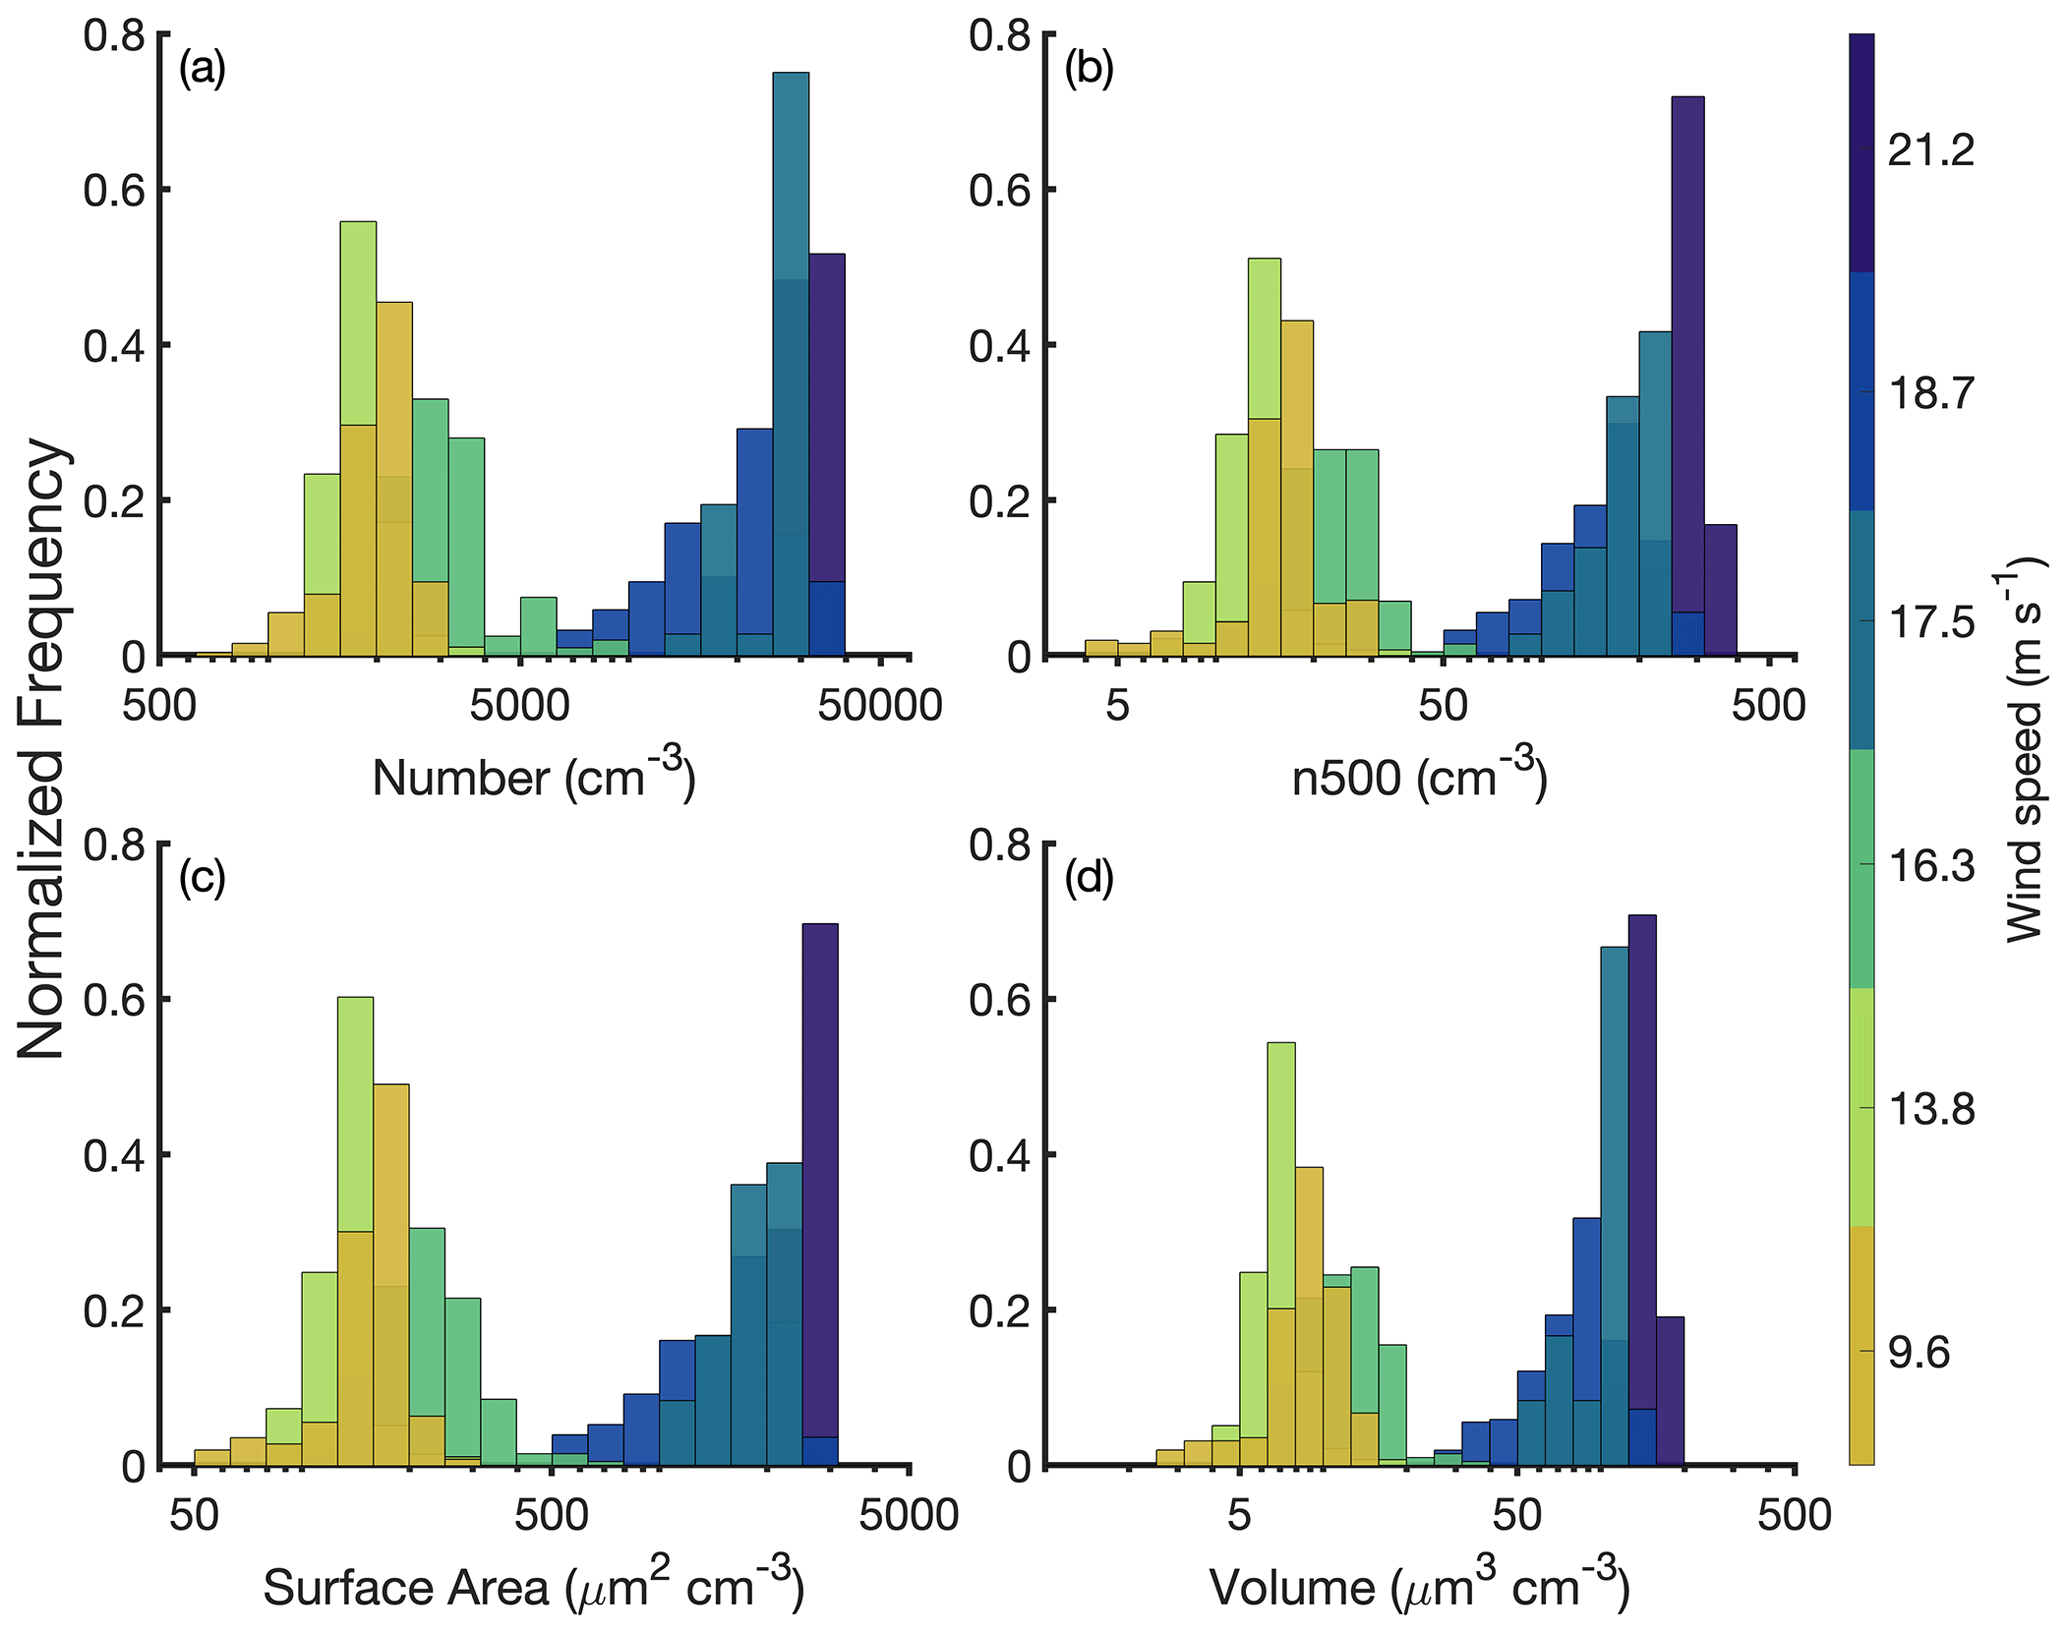
Figure 1Normalized frequency distributions of particle (a) number, (b) number >500 nm diameter (n500), (c) surface area, and (d) volume concentrations at each measured wind speed during CHAOS.
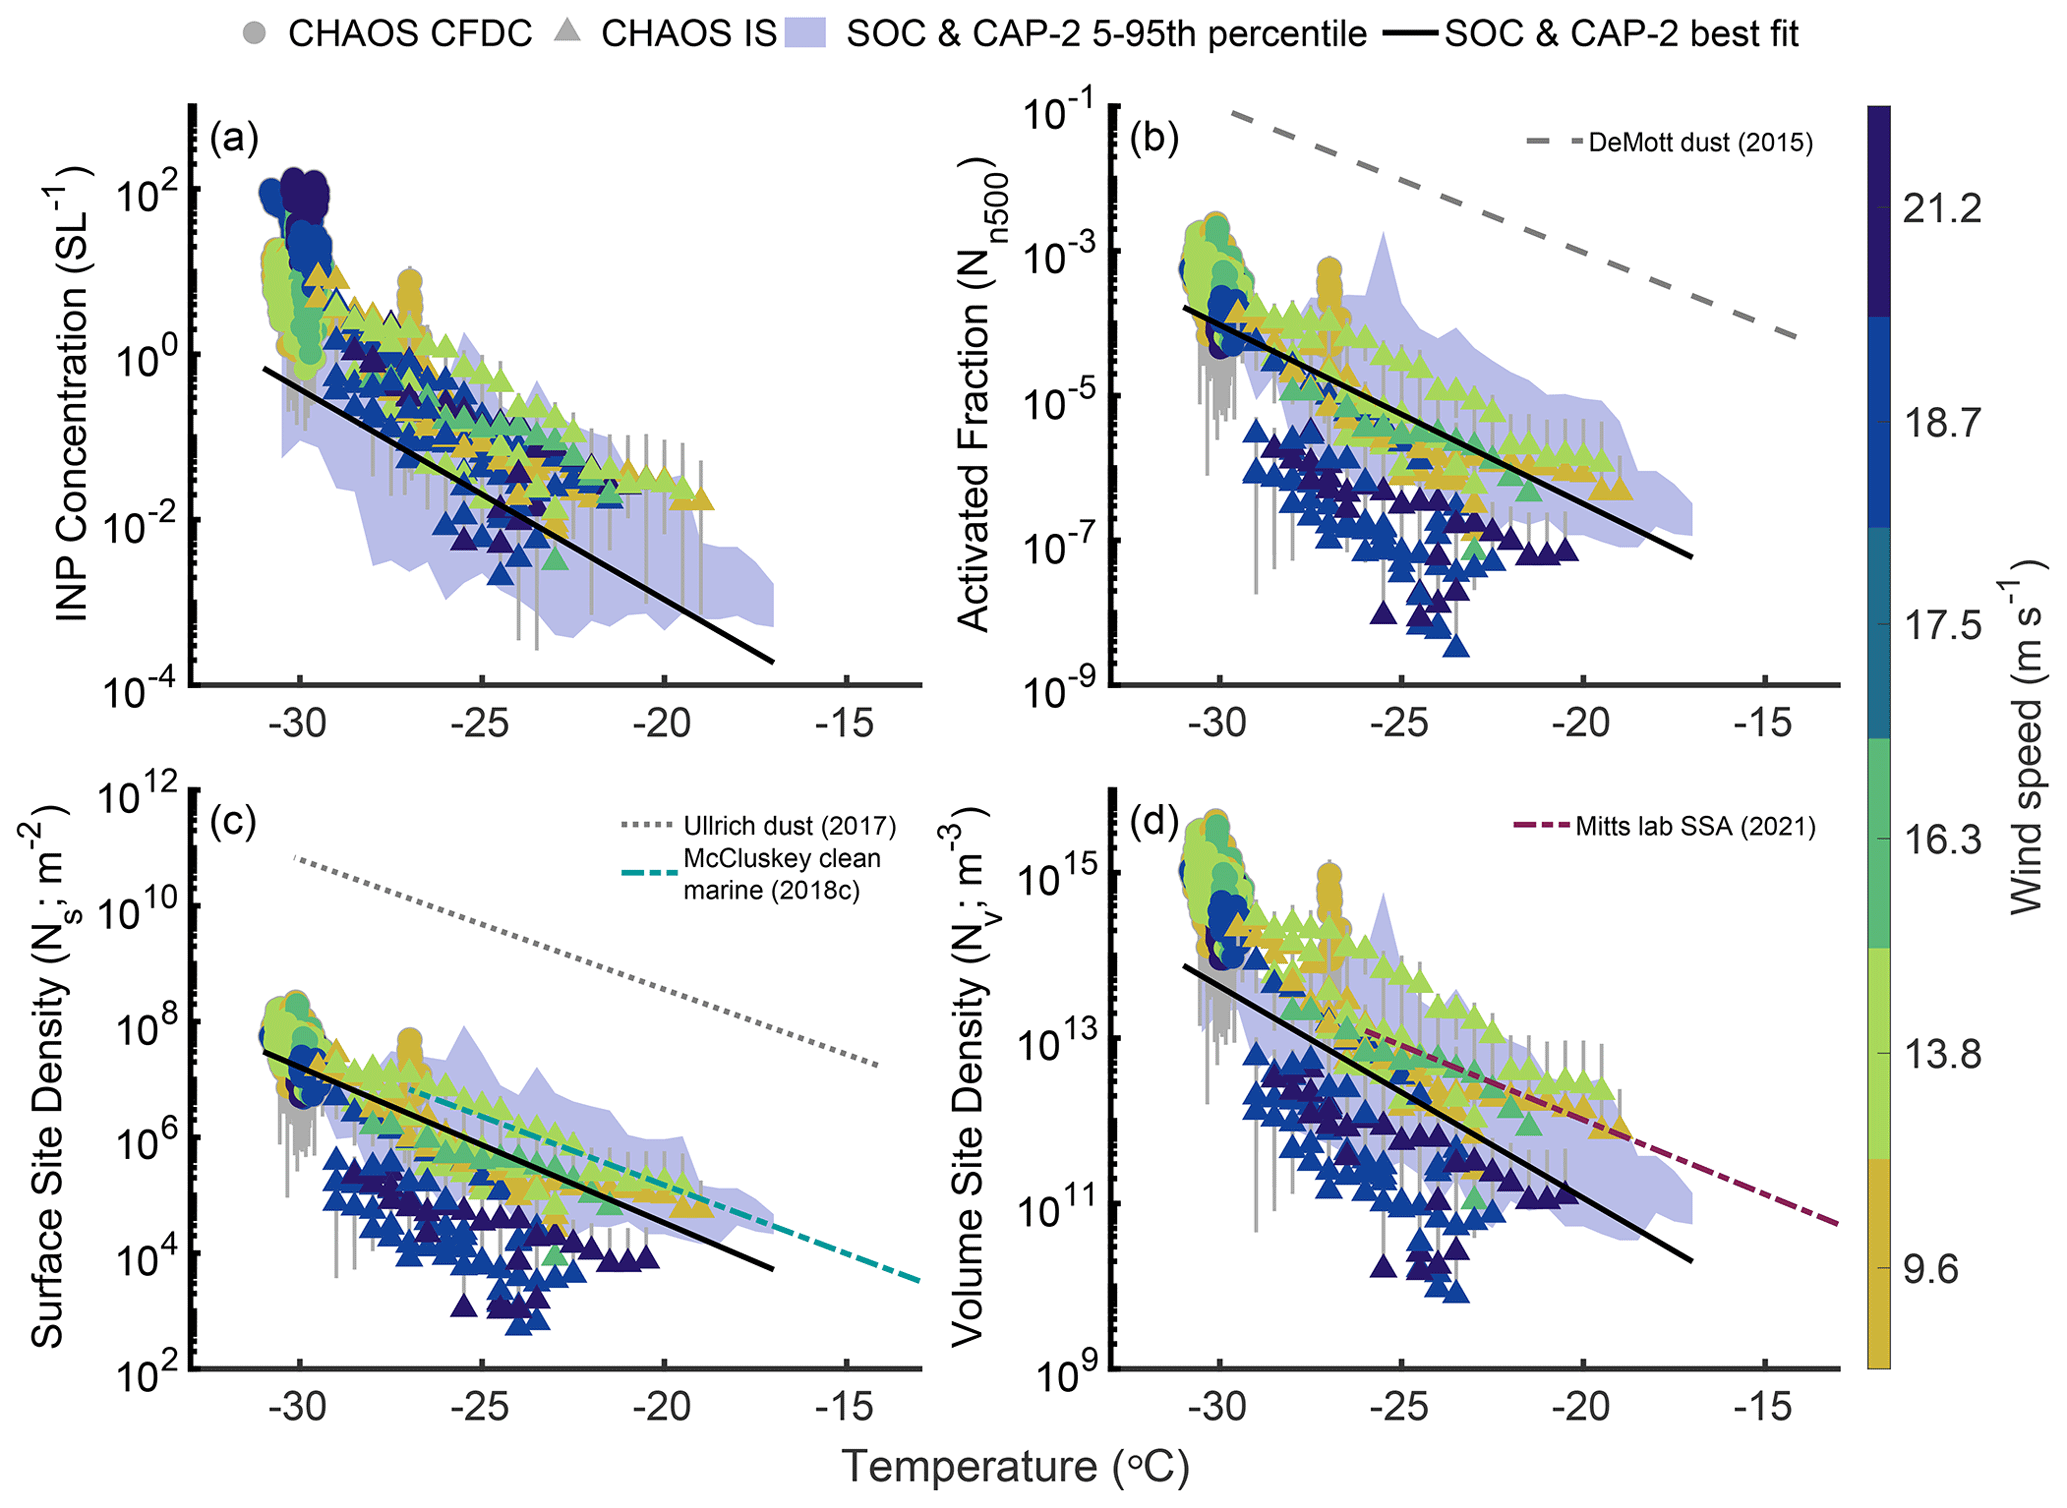
Figure 2INP number concentration (a) and INP number concentration normalized by n500 (Nn500) (b), aerosol surface area (Ns) (c), or aerosol volume (Nv)(d) temperature spectra during CHAOS. CFDC measurements are indicated by circles and IS filter observations by triangles; both are colored by the wind speed during each measurement period. The purple shading in each panel indicates the 5th–95th percentile of values observed in the marine boundary layer during SOCRATES and CAPRICORN-2 (Moore et al., 2024), and solid black lines are the best-fit lines for each variable from these campaigns. In (b), the dashed grey line shows the DeMott et al. (2015) parameterization for dust based on n500, using the median n500 value measured during 18.7 m s−1 wind speed periods. In (c), the dotted grey line indicates the Ullrich et al. (2017) parameterization for dust Ns, and the dashed blue line shows the Ns parameterization from McCluskey et al. (2018c) for North Atlantic clean marine air. The dashed magenta line in (d) indicates the Mitts et al. (2021) lab-based parameterization for marine Nv.
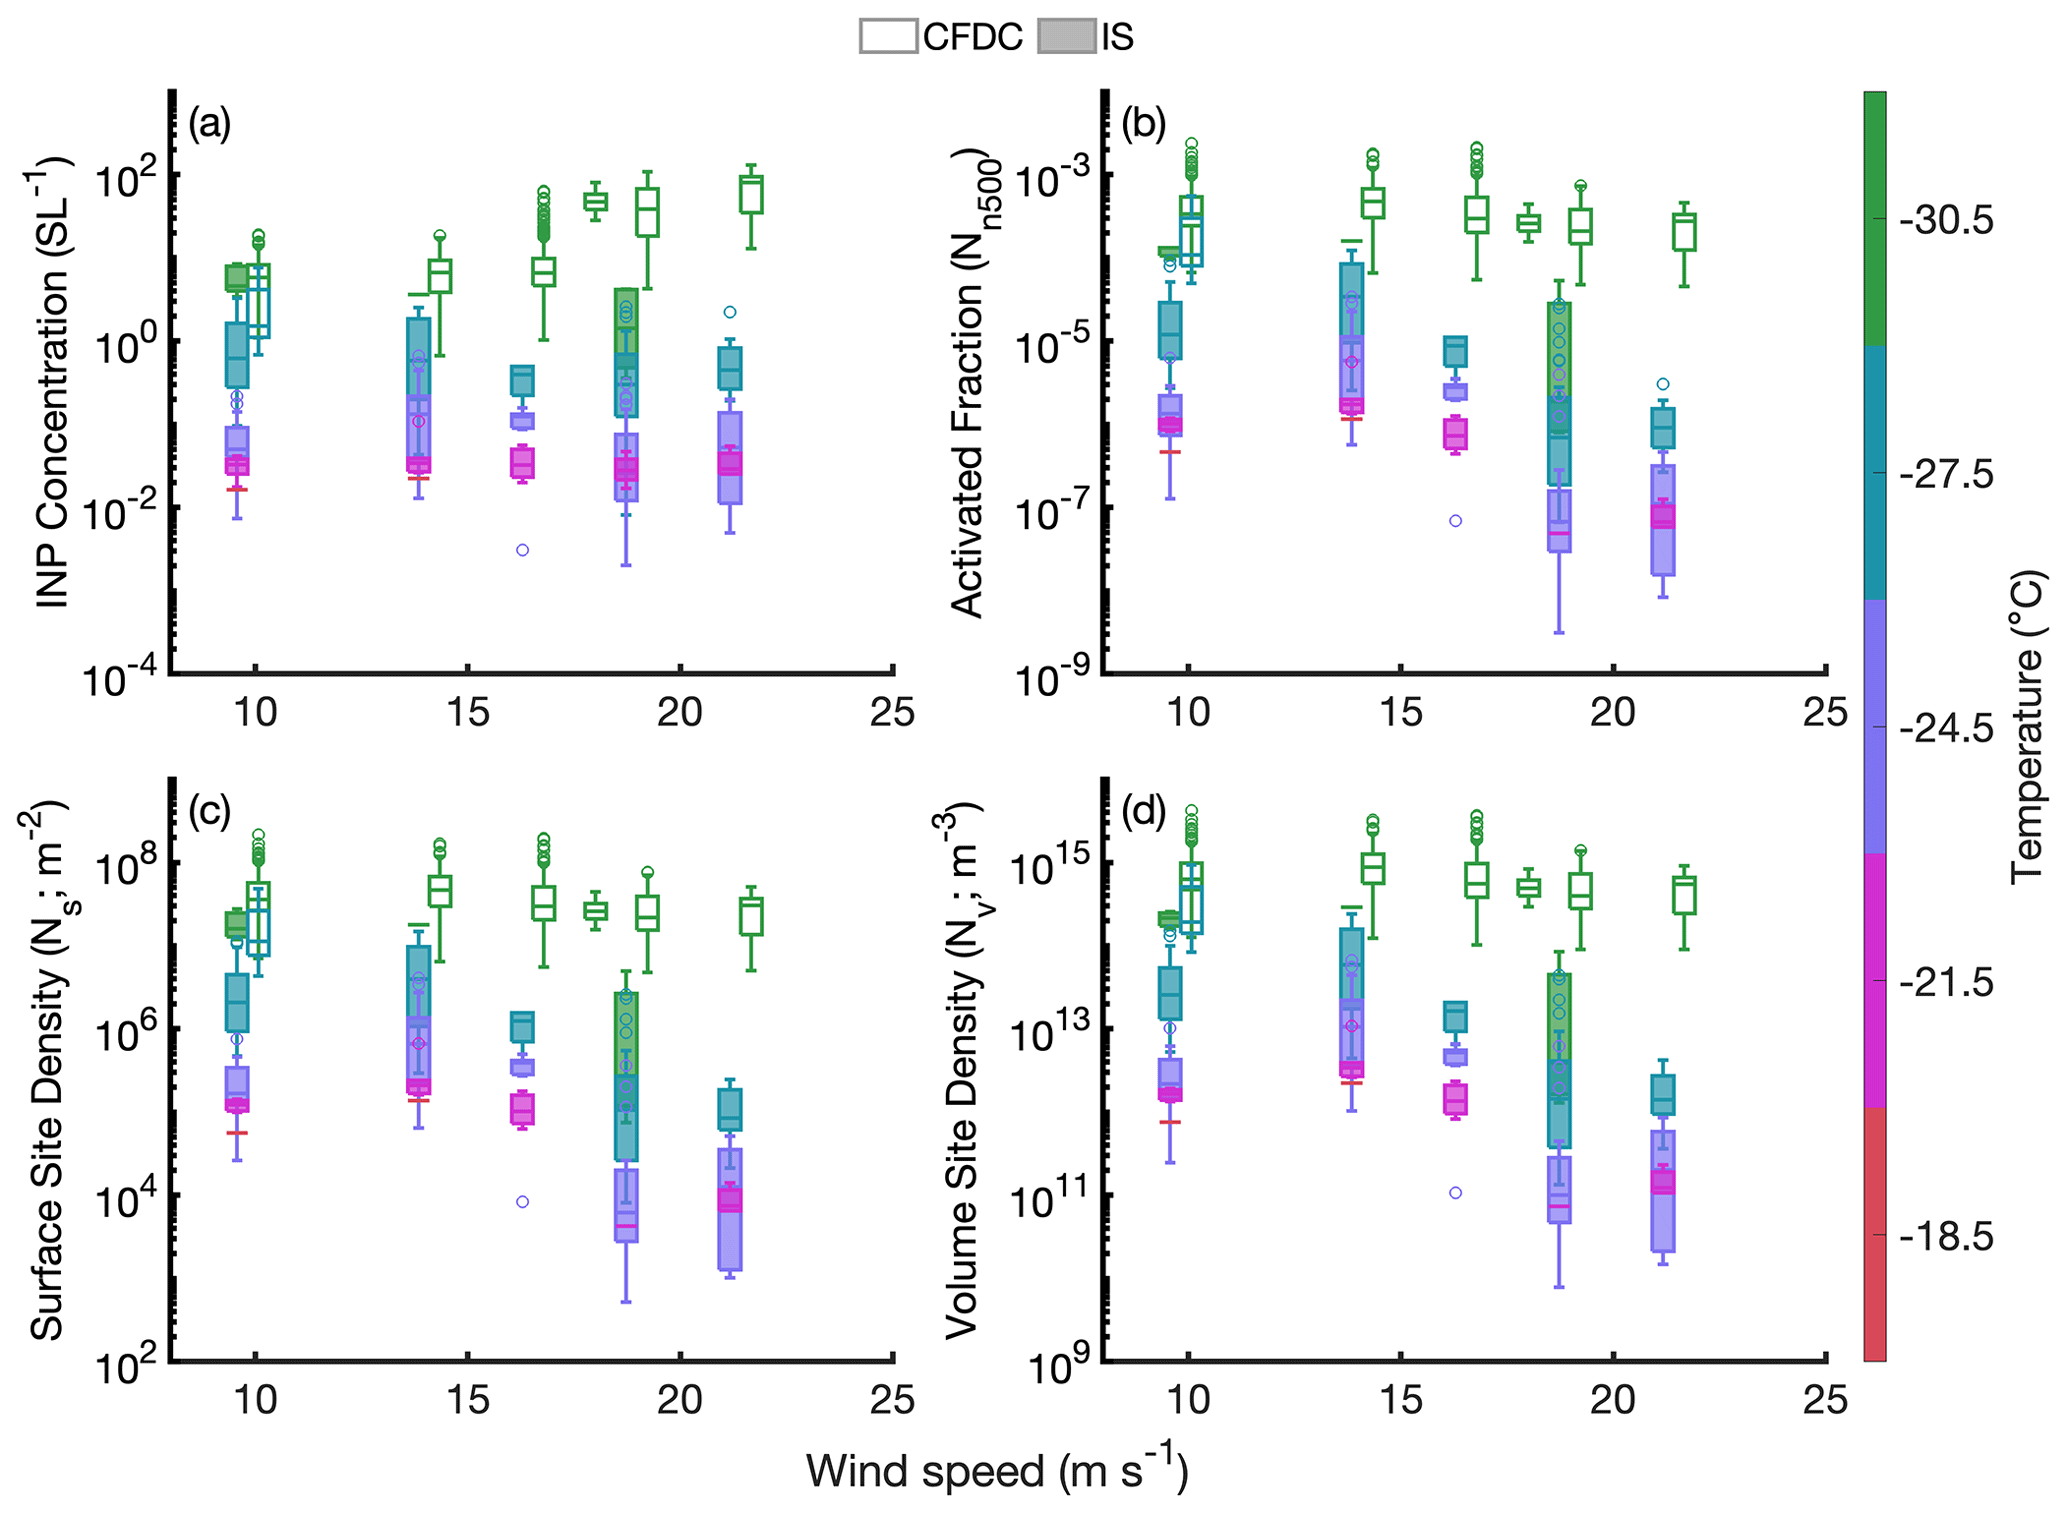
Figure 3Box plots of observed (a) INP concentration, (b) Nn500, (c) Ns, and (d) Nv as a function of wind speed during CHAOS. Observations are separated into 3 °C temperature bins (indicated by color), with CFDC measurements shown as open boxes and IS filter data as shaded boxes. CFDC data are offset to the right by +0.5 m s−1 for clarity.
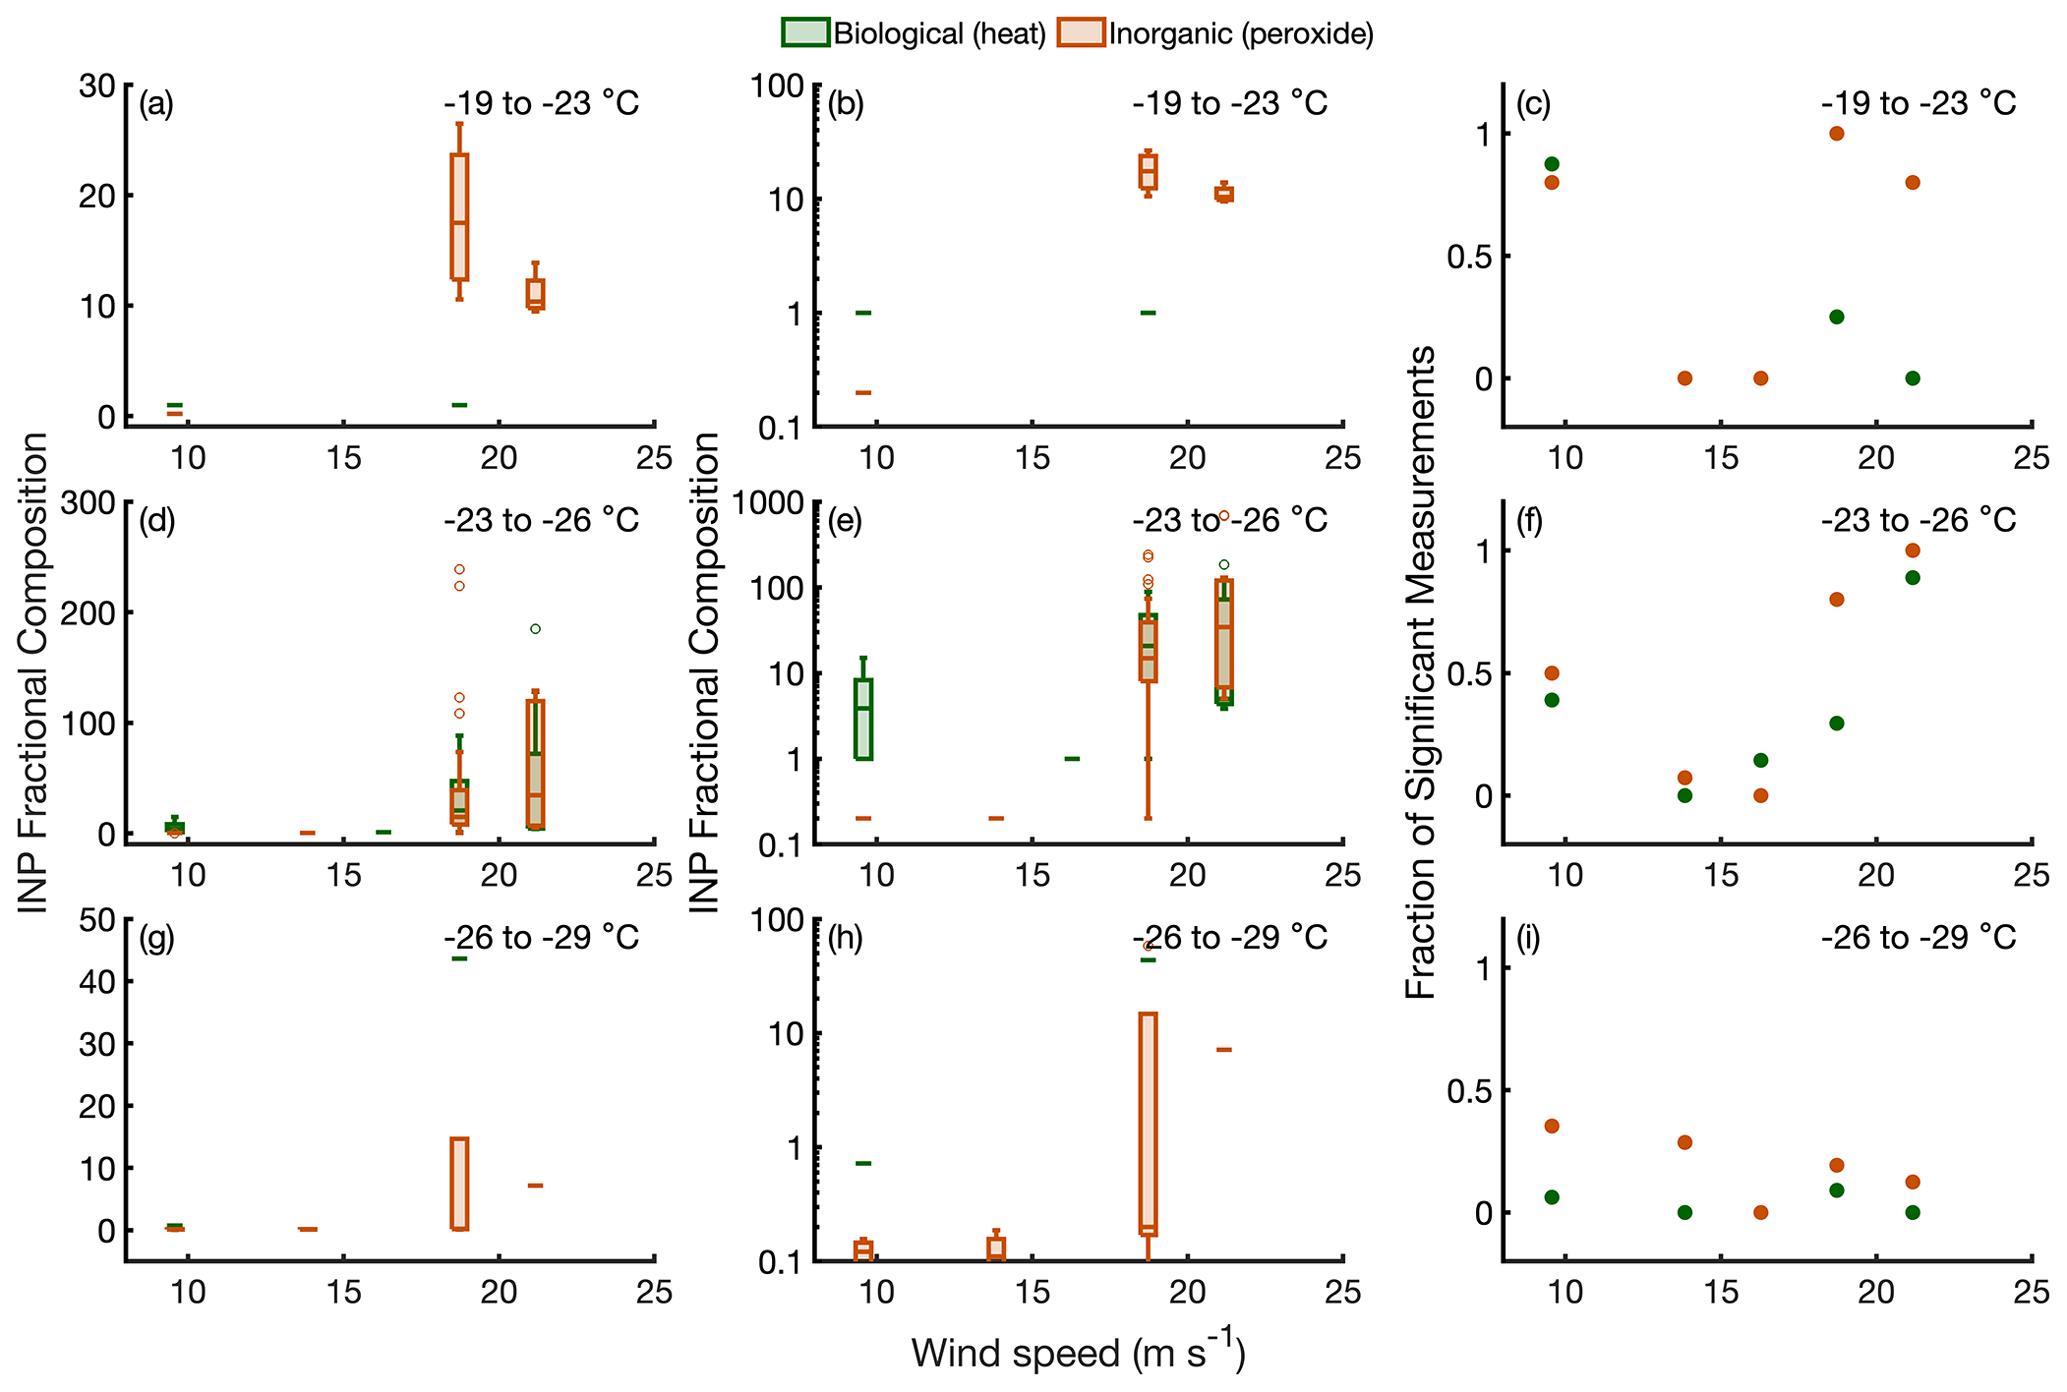
Figure 4Box plots of biological (green) and inorganic (orange) INP fractional composition as a function of wind speed for IS filter measurements at (a) −19 to −23 °C, (d) −23 to −26 °C, and (g) −26 to −29 °C. Panels (b), (e), and (h) are identical to (a), (d), and (g), respectively, except with a log y axis so that smaller values are visible; zero values are plotted at a fixed value of 0.2 on the log axes. Only treatments that differ from the base spectra at the 95 % confidence level are included in (a), (b), (d), (e), (g), and (h). Panels (c), (f), and (i) indicate the fraction of measurements meeting this criterion as a function of wind speed and at temperatures of −19 to −23 °C (c), −23 to −26 °C (f), and −26 to −29 °C (i).
Figure 5Percentage of particles from each morphological category observed during CHAOS at four of the measured wind speeds (9.6, 16.3, 18.7, and 21.2 m s−1). For each sample, the individual particles (N=50 for each sample) characterized were in the volume-equivalent diameter range of 0.05–1.0 µm.
Water to fill the SOARS channel is sourced from the Pacific Ocean at the nearby Scripps Pier. Seawater is pumped up at the end of the pier from 1–3 m above the seafloor, roughly filtered with an aluminum screen to remove large detritus, and then passes through a rotary drum filter with a variable mesh filter (18–120 µm) to remove phytoplankton (Jio, 2022). Filtered seawater then travels the length of the pier in a gravity flume. Unlike SeaSCAPE, the water volume required to fill the SOARS channel necessitated using the same plumbing and holding tanks as the nearby Birch Aquarium and other SIO labs instead of pumping water directly out of the gravity flume and transporting it by truck to the channel. At the pier entrance, seawater is passed through several additional coarse filters, fed into a large settling tank, and then filtered through high-capacity sand filters prior to being pumped into several large holding tanks (Jio, 2022). Finally, the filtered seawater is pumped or gravity-fed to labs and other facilities. The SOARS channel is filled using either gravity or adjustable-speed water pumps (typically ∼340 L min−1) and is optionally passed through additional filters and/or UV-sterilized. During CHAOS, seawater was not filtered or UV-sterilized, and the channel was gravity-filled from the seawater holding tanks. Four separate fills of the SOARS channel were conducted during CHAOS: 6–18 and 19–21 July and 1–12 and 14–26 August 2022. Only data from the two fills in August 2022 are presented in this study due to instrument availability and technical difficulties with the new paddle assembly. Between each water fill, the SOARS channel was drained and then pressure-washed with freshwater. Next, the channel was manually scrubbed and then rinsed again with freshwater before beginning the next water fill.
Water temperature in SOARS can be controlled between −1.6 and 30 °C and air temperature between −20 and 30 °C. Neither was held constant during CHAOS, and both were instead allowed to vary according to the ambient temperature. The channel contains built-in sensors at several locations for measuring air and water temperature, atmospheric CO2 concentration, and water salinity and turbidity. Since the entire SOARS channel is indoors, there are two optional lighting mechanisms. Six solar tubes (Solatube) centered on the middle one-third of the channel can redirect up to ∼6 % of ambient light into the channel, which penetrates the full depth of SOARS. A total of 40 000 W of PAR LEDs (ONCE AgriShift MLS, 400–700 nm) can provide supplemental lighting. During the third (1–12 August) and fourth (14–26 August) water fills considered here, the solar tubes were fully open throughout the experiment, and the PAR LEDs were on during 2–12 August 2022. A summary of water and air parameters in SOARS during August 2022 is shown in Fig. A2, including wind speed, chlorophyll a and total organic carbon (TOC) concentrations, air and water temperature, seawater salinity, and select seawater nutrient concentrations.
The SOARS paddle can be programmed to generate wave packets of variable wavelength and amplitude. During CHAOS, two wave packets were superimposed to form five wave crests, of which two break; this pattern was repeated for the duration of each sampling period. Between sampling periods, the air ducts were rinsed with freshwater, and then air at high wind speeds (21 m s−1) was used to remove any particle buildup from the channel and air duct walls. Finally, the headspace air was filtered at a low wind speed to remove particles. Then the wind turbines were set to generate the desired wind speed, and the paddle started to create waves. Occasionally, the wind turbines were run without the paddle, which can generate SSA at wind speeds higher than ∼17 m s−1. The wind turbine revolution-per-minute (rpm) set points were calibrated using an air velocity meter (TSI Inc., model 9545-A) installed inside the channel with no waves generated. Wind speeds were measured at 0.6 m above the water surface and extrapolated to a value at 10 m (U10) following Hsu et al. (1994), using P=0.11 and assuming near-neutral stability. Whitecap coverage was calculated from still images collected at high resolution for every measured wind speed. For each wave packet amplitude, there is a single wind turbine set point which generates a whitecap fraction representative of open-ocean conditions, based on the relationship described in Monahan and Muircheartaigh (1980). During CHAOS, the wave packet amplitude scale was fixed at 1.3, which yields an open-ocean equivalent whitecap coverage at a wind turbine set point of 1550 rpm (whitecap fraction 6.44 %±1.53 %), corresponding to an extrapolated U10 of 18.5 m s−1. Measurements collected during CHAOS were made at wind turbine speeds of 850, 1200, 1400, 1500, 1600, and 1800 rpm, which correspond to U10 values of 9.6, 13.8, 16.3, 17.5, 18.7, and 21.2 m s−1, respectively. Measurements made at 1600 rpm (18.7 m s−1) are considered to represent open-ocean breaking wave conditions, through comparison with Monahan and Muircheartaigh (1980). For all other wind speeds measured during CHAOS, the fixed wave amplitude meant the whitecap coverage is not comparable to equilibrium open-ocean conditions and only the relative influence of wind speed alone can be assessed.
2.2 Ice-nucleating particle measurements
Ice-nucleating particle measurements were conducted at all wind speeds. A Colorado State University (CSU) continuous-flow diffusion chamber (CFDC; Sect. 2.2.1) was used to capture online measurements at high temporal resolution (∼15 min), and aerosol filter samples were collected and subsequently analyzed with the CSU ice spectrometer (IS; Sect. 2.2.2) to provide INP temperature spectra down to −30 °C. Chemical pre-treatments of aerosol filter suspensions allowed INPs produced in SOARS to be classified by broad composition (Sect. 2.2.3), and atomic force microscopy (AFM) was used to assess INP morphology and phase state (Sect. 2.2.4). Water samples were collected daily from SOARS, and seawater ice-nucleating entity (INE) temperature spectra were also measured using the IS as a complement to the aerosol results (Sect. 2.2.2). CFDC measurements (Sect. 2.2.1) presented here exclude the first 15 min of each sampling period to allow particle concentrations to reach an approximate steady state. IS filters (Sect. 2.2.2) were started ∼15 min into each sampling period for the same reason.
2.2.1 Continuous-flow diffusion chamber
Real-time measurements of INP concentration were collected using a CSU continuous-flow diffusion chamber (CFDC), which is a vertically oriented, ice thermal diffusion chamber (Rogers, 1988; Rogers et al., 2001; DeMott et al., 2015). The HIAPER (CFDC-1H) version of the CFDC used during CHAOS has been previously described in detail and will only be briefly discussed here (e.g., McCluskey et al., 2018a; Moore, 2020; DeMott et al., 2023; Moore et al., 2024). Prior to entering the top of the CFDC chamber, the sample aerosol stream drawn from SOARS was dried to below the frost point with diffusion dryers and then passed through two sequential single-jet impactors (50 % aerodynamic diameter cut size D50=2.4 µm) to remove large aerosols. Within the chamber, particles are first exposed to near-steady-state humidity and temperature conditions conducive to the activation of cloud droplets and ice crystals, followed by exposure to a water-subsaturated region to evaporate haze and cloud droplets back to aerosol sizes. Ice crystals are then detected optically at the base of the chamber using an optical particle counter (OPC) and are distinguished by size from aerosols and any remaining cloud droplets (Barry et al., 2021b). The upper region of the chamber was held under water-supersaturated conditions (typically 104 % to 108 %) for this campaign to emphasize the immersion freezing mode of ice nucleation and give comparable results to offline techniques (DeMott et al., 2016, 2017, 2018; Barry et al., 2021b).
The aerosol lamina temperature was held at −25 or −30 °C during CHAOS to maximize the instrumental signal-to-noise ratio and accommodate limited sampling durations at each wind speed. Paired measurements of the sample airstream (10 min) and HEPA–filtered air (5 min) were used to quantify instrument noise (DeMott et al., 2017). All measurements presented here have been corrected for the CFDC background using adjacent filtered-air periods, as in Moore (2020) and Barry et al. (2021b). This correction is achieved using a Poisson model incorporating the detection rates of INPs during ambient and filtered-air measurements. Confidence intervals for INP concentrations and statistical differences between sample and filtered-air periods are assessed at the same time as the background correction and follow Krishnamoorthy and Lee (2012). All concentrations are converted to standard conditions to allow for direct comparisons between measurements at varying temperatures (STP; 0 °C and 100 kPa).
Nucleated ice crystals were collected for offline analysis following the OPC at the base of the CFDC chamber and analyzed using atomic force microscopy to ascertain differences in INP morphology and phase state with wind speed (Sect. 2.2.4). Ice crystals were collected onto substrates using a single-jet impactor with a 50 % cut size of 4 µm aerodynamic diameter (McCluskey et al., 2014; Barry et al., 2021b).
2.2.2 Ice spectrometer measurements
Aerosols produced in SOARS were collected onto pre-cleaned 0.2 µm pore size, 47 mm diameter track-etched polycarbonate membrane filters (Whatman Nuclepore) in pre-sterilized aluminum inline filter housings (Pall), using the protocols described in Barry et al. (2021a). Sample flow rates were held at ∼5 slpm (0 °C and 100 kPa), and the sample stream passed through a silica gel diffusion dryer prior to particle collection to prevent saturation/wetting of the filters. Filter collection volumes ranged from 182 to 855 standard liters, with the higher volumes representing longer sampling durations at lower wind speeds to increase collected particle mass. Blank filters were collected regularly by installing filters in housings and connecting them to the same tubing used for SSA sampling, without airflow. Seawater was sampled from either the rear end of the SOARS channel (beach) or underneath the aerosol sampling manifold, approximately halfway up the water column, using a peristaltic pump and silicone tubing to minimize cell rupture for biological measurements. Filters and seawater were either analyzed immediately or stored frozen (−20 °C) prior to analysis.
Offline measurements of INP and INE immersion freezing temperature spectra were made using the CSU ice spectrometer (IS), which has been comprehensively described in its present form elsewhere (Hiranuma et al., 2015; DeMott et al., 2018; Hill et al., 2023). Aerosol filters were resuspended in 8 mL of 0.1 µm filtered deionized (DI) water; then 50 µL aliquots of either seawater or aerosol suspensions were dispensed into sterile 96-well PCR trays (Optimum Ultra, Life Science Products). Dilutions of each sample were used to extend the measurement temperature range; these were made in 0.1 µm filtered DI water for aerosol filter suspensions and 0.1 µm filtered artificial seawater (NeoMarine, Brightwell Aquatics) for seawater samples. The trays were then placed into temperature-controlled aluminum blocks inside the IS and cooled at . Freezing events were detected optically from CCD camera images collected at 1 Hz. A 0.1 µm filtered DI water or artificial seawater negative control was included with each IS measurement and used to correct sample results for INPs present in the water used for resuspension and dilution. INP concentrations in the aerosol suspensions or seawater were calculated following Vali (1971) and then converted to concentrations in SOARS headspace air for aerosol filters (reported at STP; 0 °C and 100 kPa). Confidence intervals were derived following Agresti and Coull (1998), and the limit of detection (LOD) was determined as in Moore et al. (2024). The average background number of INPs from the collected blank filters (four) was used to adjust filter sample concentrations; measurements are not reported if blank-corrected values fell below zero (Moore et al., 2024). Temperature spectra of seawater samples have been adjusted by +2 °C to account for freezing-point depression due to salinity.
2.2.3 Chemical composition of INPs in the ice spectrometer
Inferences about INP composition are possible from pre-treatments of aerosol filter suspensions or seawater prior to analysis with the IS. Heat treatments are used to assess the contribution of biological INPs to a total sample population (Hill et al., 2016; Suski et al., 2018), as INPs produced by fungi and bacteria are often proteinaceous (Pummer et al., 2015) and denatured by heating. Aliquots of either resuspended particles from aerosol filters or seawater were immersed in boiling water for 20 min before being cooled to room temperature and then analyzed with the IS as normal (Sect. 2.2.2). The difference between the pre-heat-treated and post-heat-treated sample represents the biological INP contribution. The proportion of refractory, typically mineral, INPs is identified through oxidation experiments that remove organic material (Suski et al., 2018; McCluskey et al., 2018c). Sample aliquots are digested for 20 min with 10 % hydrogen peroxide while immersed in boiling water, with two UVB fluorescent bulbs (Exo Terra) illuminating the samples to generate hydroxyl radicals. After cooling, catalase (MP Biomedicals, PN 100429) is added to remove any excess hydrogen peroxide and prevent significant freezing-point depression (Suski et al., 2018). The INP temperature spectrum remaining after oxidation is inferred to be the mineral (or other inorganic) component, and the difference between pre- and post-oxidation spectra corresponds to organic INPs.
2.2.4 Single-particle atomic force microscopy of INPs
INPs collected in the CFDC were deposited onto hydrophobically coated (Rain-X) silicon substrates (Ted Pella, Inc.) and stored in clean Petri dishes inside a laminar flow hood (NuAire, Inc., NU-425-400) at ambient temperature (20–25 °C) and pressure prior to analysis (Lee et al., 2020; Kaluarachchi et al., 2022a, b). Samples collected at four wind speeds (9.6, 16.3, 18.7, and 21.2 m s−1) were analyzed to assess the distribution of physicochemical properties under varied wind stress. A 3D molecular force probe atomic force microscope (Asylum Research, Santa Barbara, CA) was used to image individual INPs at ambient temperature (20–25°C) and pressure, as described in prior studies (Ray et al., 2019; Lee et al., 2020). A custom humidity cell was used to control RH between 20 % and 60 %. Prior to AFM measurements at a particular RH, samples were allowed to equilibrate for at least 10 min to ensure thermodynamic equilibrium with the surrounding water vapor (Lee et al., 2017, 2020; Madawala et al., 2021). Silicon nitride AFM tips (MikroMasch, model CSC37, tip radius of curvature ∼10 nm, nominal spring constant 0.5–0.9 N m−1) were used for AFM imaging and force spectroscopy measurements (Lee et al., 2017; Madawala et al., 2021). AFM AC (intermittent contact) imaging mode was used to collect 3D height images of individual INPs to determine their morphology and to quantify their volume-equivalent diameter, as described previously (Ray et al., 2019; Kaluarachchi et al., 2022b). For morphological analysis, approximately 50 individual particles were studied for each sample, with volume-equivalent diameters ranging from 0.05–1.0 µm. Particles were classified into six main types: rounded, core–shell, prism-like, rod, aggregate, and irregular. Example images of particles at 20 % RH in each category are shown in Fig. A3.
The organic particle phase state was identified for samples at 20 % and 60 % RH, as in previous studies (Lee et al., 2017, 2020). These RH values were selected as benchmarks based on previous phase state studies on sucrose that showed solid-to-semisolid and semisolid-to-liquid phase transitions at ∼20 % and 60 % RH, respectively (Lee et al., 2017; Ray et al., 2019; Madawala et al., 2021). Briefly, AFM force spectroscopy (i.e., force plots) was performed on individual core–shell particles at a particular RH by probing within the shell region of each particle. At least five force plots were collected for each individual particle at both 20 % and 60 % RH, with a maximum force of 20 nN and scan rate of 1 Hz. The viscoelastic response distance (VRD) and relative indentation depth (RID), or ratio of the indentation depth to the particle height, were then quantified, which can be related to the viscosity of the material (Lee et al., 2020; Kaluarachchi et al., 2022a). A previously reported framework based on VRD and RID measurements was then utilized to identify the phase state of each particle at 20 % and 60 % RH (Lee et al., 2017). A total of 5, 19, 12, and 13 individual core–shell particles were studied for the 9.6, 16.3, 18.7, and 21.2 m s−1 wind speed conditions, respectively (Table C1).
Since the total number of individual particles that can be realistically studied with AFM is somewhat limited, a probability distribution analysis to assess the statistical significance of the AFM results was employed (Cappa et al., 2021, 2022; Kaluarachchi et al., 2022b). Briefly, the probability distribution curves associated with the likelihood of sampling one of the six particle morphology types, or one of the three phase states, were generated using a Markov chain Monte Carlo method for a “true” population of 10 000 particles. The resulting distributions were fit with Gaussian distributions to provide standard deviation estimates for both morphology and phase state measurements.
2.3 Aerosol size distribution measurements
Several dedicated instruments were used to measure aerosol size distributions during CHAOS, using different aerosol inlet configurations. All aerosol streams were dried with silica gel diffusion dryers prior to measurement to below the efflorescence relative humidity of sea salt, ∼45 %–48 % (Tang et al., 1997). The first set of measurements used in this study consist of a TSI scanning mobility particle sizer (TSI Inc., SMPS 3936) for aerosols in the range 14–750 nm and a TSI aerodynamic particle sizer (TSI Inc., APS 3321) for particles between 0.5–20 µm. The SMPS and APS sampled from a in. diameter stainless-steel inlet that entered the side of the SOARS channel and then turned 90° to face into the airflow. It was located approximately 0.6 m above the water surface and angled roughly 45° below the horizontal, towards the water's surface. The INP filter measurements were made with a similar inlet located 2–3 m further down the channel but oriented parallel to the water's surface. A second set of aerosol measurements were collected with a scanning electrical mobility spectrometer (BMI, SEMS model 2002) between 10 and 1340 nm (mobility diameter) and another aerodynamic particle sizer (TSI Inc., APS model 3321), both of which sampled behind a 2.5 µm cyclone. The SEMS and APS data were merged at 650 nm after converting the APS from aerodynamic to mobility diameter assuming a particle density of 2.0 g cm−3 (Zieger et al., 2017). The SEMS and APS sampled from a shared aerosol manifold with the CFDC, which had a vertically oriented in. diameter stainless-steel inlet that entered from the top of the SOARS channel and sampled ∼0.6 m above the water surface. Theoretical particle transmission efficiency calculations were performed for both sets of inlets (INP filter/SMPS + APS and CFDC/SEMS + APS) and are shown in Fig. A4 as a function of the SOARS wind speed. These calculations were performed in terms of aerodynamic diameter with a particle density ρ=1 and then corrected for the expected particle density, water uptake, and shape factor following Tang et al. (1997) and Zieger et al. (2017). Significant vibrations and vertical movement of the INP filter and SMPS + APS sampling inlets were observed at higher wind speeds, with unknown effects on particle line losses that are not accounted for in these theoretical calculations.
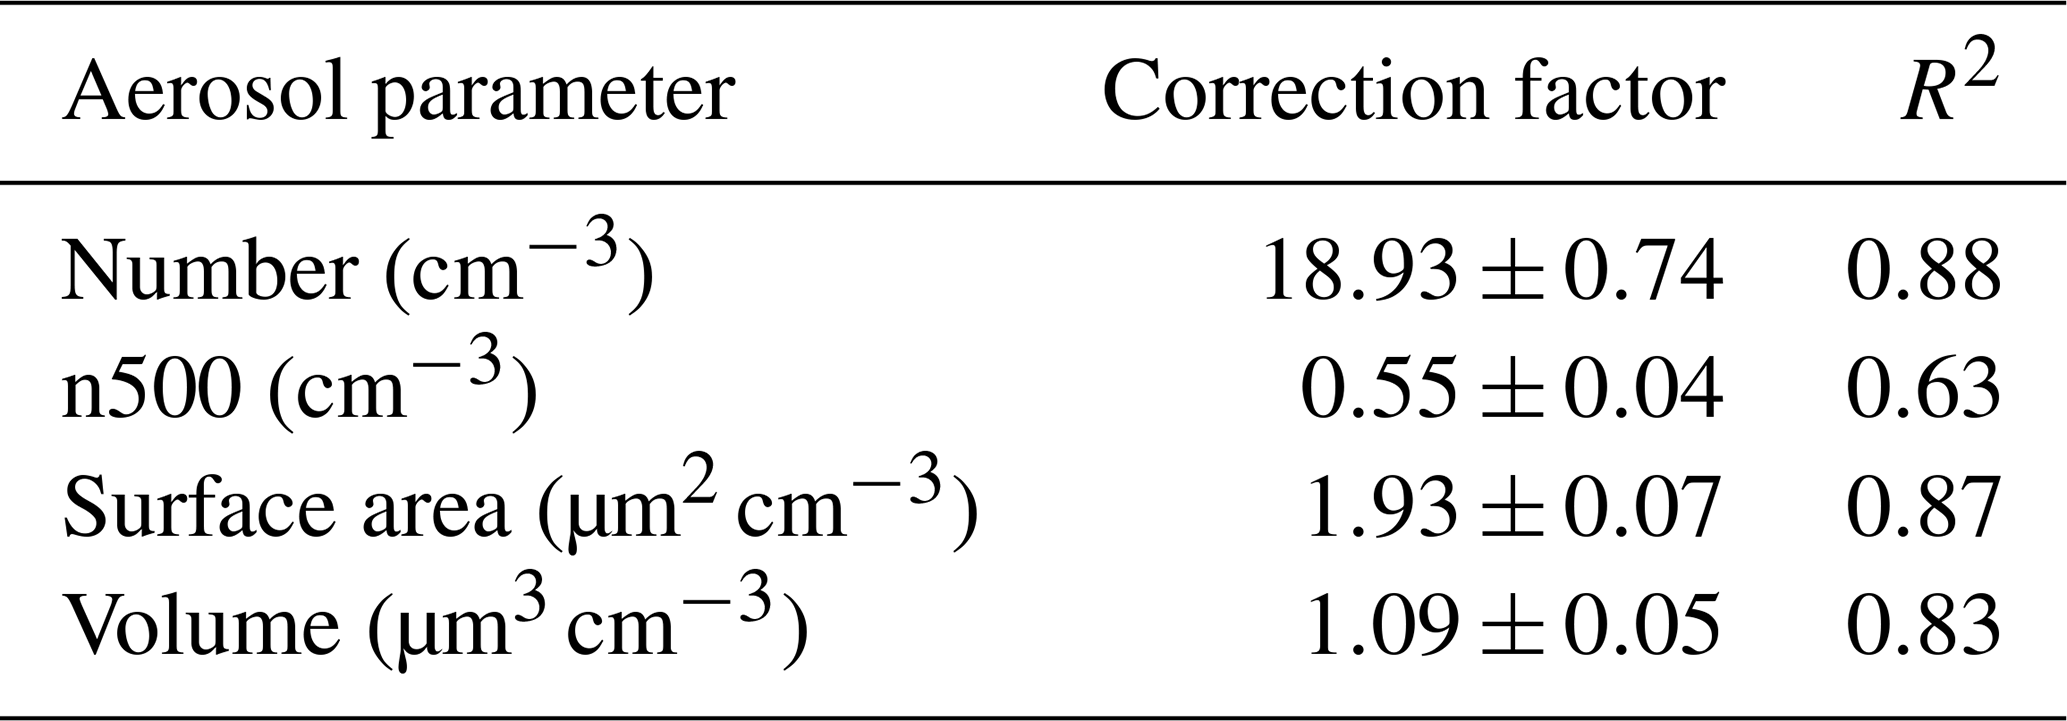
These particle measurements were primarily used to normalize the INP concentrations, as described in Sect. 3.1. Particle surface area and volume distributions were calculated for each number distribution assuming particle sphericity, as were number concentrations of particles larger than 500 nm dry diameter (n500). Due to the differences in expected aerosol transmission (Fig. A4) between the horizontally and vertically oriented inlets, the SMPS + APS data were used to normalize the INP filter results. The SEMS + APS observations were intended to be used to normalize the CFDC INP data; however, SEMS data were only available for the second half of August. Therefore, instead, data from the OPC at the base of the CFDC chamber were used to provide aerosol concentrations to normalize the CFDC INP measurements. Because the CFDC OPC is limited to particles larger than ∼300 nm, correction factors for total particle number, n500, surface area, and volume concentrations were derived for the CFDC OPC based on simultaneous SEMS + APS data (same wind speed). All CFDC OPC data shown here have had these corrections applied, which are given in Fig. A5 and Table C2.
CFDC operation requires the incoming airstream to be dried to below the frost point at the given measurement temperature (typically −25 or −30 °C), so aerosols enter the CFDC at dry sizes. However, particles will deliquesce, and some will activate into cloud droplets under the water-supersaturated conditions present in the top section of the CFDC chamber. Any particles not activated into ice crystals will evaporate in the water-subsaturated region at the bottom of the chamber (Sect. 2.2.1), which is held at ice saturation. Following Murphy and Koop (2005), the saturation vapor pressures with respect to ice and water were calculated during each period based on the measurement temperature and the resulting RH. Dry particle sizes were estimated assuming spherical sea salt particles with a hygroscopic growth factor (HGF) of 1.7 for the 70 %–75 % RH range calculated (Zieger et al., 2017). The CFDC OPC was calibrated against polystyrene latex spheres (PSLs) and glass beads of known sizes and refractive indices, and size distributions were calculated assuming a refractive index of n=1.5 for sea salt (Tang et al., 1997).
3.1 SSA and INP production at varying wind speeds
Measurements of both SSA and INPs were made at six U10 wind speed equivalents (9.6, 13.8, 16.3, 17.5, 18.7, and 21.2 m s−1) during CHAOS. Normalized histograms of integrated particle number, number >500 nm diameter (n500), surface area, and volume concentrations are shown in Fig. 1 for all measured wind speeds from the corrected CFDC OPC measurements, and example size distributions from the SEMS + APS and SMPS + APS are shown in Fig. A6 (Sect. 2.3). As expected from numerous previous measurements (e.g., Lewis and Schwartz, 2004; O'Dowd and de Leeuw, 2007; de Leeuw et al., 2011), particle concentrations generally increased with wind speed in the SOARS channel. Large variability in each aerosol metric was observed at all wind speeds (Fig. 1), with a clear increase in aerosol concentration between the 16.3 and 17.5 m s−1 wind speeds. This variability occurred for measurements collected both days or weeks apart and on the same day if wind speeds were repeated, and the source is unknown (see Fig. A6). A previous study of wind profiles in a wind–wave tank (Vollestad and Jensen, 2021) found that while the horizontal wind speed displayed the expected, approximately logarithmic, profile, secondary flows due to the confined channel were found to impact the observed vertical velocity structure. Modification of the near-surface wind and turbulence due to the presence of waves has been observed in wind–wave tanks (Zavadsky and Shemer, 2012; Villefer et al., 2021) and in models (Chen et al., 2019), and varies with the fetch (Lamont-Smith and Waseda, 2008), as well as with the presence of swell in addition to wind waves (Villefer et al., 2021). Variation in secondary flow structure is a possible explanation for some of the variability seen in particle concentrations at the same nominal wind speed during CHAOS.
The maximum observed values for particle number, surface area, and volume were much larger during CHAOS than for recent Southern Ocean measurements (Moore et al., 2022), by factors of , and ∼7, respectively. At least some of these differences are likely a result of the differences in timescale and fetch, with open-ocean measurements closer to steady state and integrated over a larger area with potentially more variability. Additionally, the SOARS channel is a closed system where horizontal and vertical SSA fluxes are suppressed, allowing particle concentrations to build until losses are equal to emissions. Size distribution measurements (Fig. A6) suggest that the size distribution shape and mode size are similar across wind speeds in SOARS but that there is larger variability in number concentration at higher wind speeds, particularly in the accumulation mode. At wind speeds below 18.5 m s−1, the fixed 1.3 amplitude-scaled waves generated by the SOARS paddle led to higher whitecap coverage than would be anticipated in the open ocean for equilibrium conditions, and for the highest wind speed (21.2 m s−1), whitecap coverage was lower than open-ocean values (Monahan and Muircheartaigh, 1980). This likely led to an overestimation of particle production at low wind speeds and underestimation at the highest. Additional tests are currently underway to study particle production when the wave amplitude is varied along with the wind speed to match open-ocean whitecap fractions, which may reduce some of the large observed variability in particle production during CHAOS.
A summary of the INP results from CHAOS, along with relevant model parameterizations, is displayed in Fig. 2, which shows INP measurements from the CFDC (Sect. 2.2.1) and IS filters (Sect. 2.2.2) as a function of temperature. Similar observations made in the Southern Ocean marine boundary layer (MBL) during the Southern Ocean Clouds, Radiation, Aerosol Transport Experimental Study (SOCRATES, hereafter SOC) aircraft campaign and the second Clouds, Aerosols, Precipitation, Radiation and atmospherIc Composition Over the southeRN ocean (CAPRICORN-2, hereafter CAP-2) ship campaign are shown in each panel in the light purple shading (Moore et al., 2024). Figure 2a shows measured INP concentrations, while the other panels show different normalization approaches commonly used in models (Fig. 2b and c) or suggested for marine INPs (Fig. 2d). Additional details on the normalization approaches used can be found in Appendix B. Figure 2b displays INP concentrations normalized by n500 (Nn500, Eq. B1), which has been used previously for dust (DeMott et al., 2015) and biological INPs (Tobo et al., 2013) due to observed relationships with supermicron aerosol. Figure 2c is normalized by aerosol surface area (Ns, Eq. B2), which has been widely used for multiple INP types, including marine INPs (Niemand et al., 2012; Ullrich et al., 2017; McCluskey et al., 2018c). Normalization by aerosol volume (Fig. 2d, Nv, Eq. B3) was suggested by Mitts et al. (2021) for marine INPs on the basis of laboratory experiments, but measurements from the Southern Ocean (Moore et al., 2024) did not support a similar relationship for ambient data, and nor do these measurements from CHAOS.
INP concentrations and normalized values vary in their consistency with CAP-2 and SOC measurements (Fig. 2), which themselves agreed well with previous observations from the Southern Ocean and mid-latitude North Atlantic (McCluskey et al., 2018a; Schmale et al., 2019; Tatzelt et al., 2022; Moore et al., 2024). In general, CHAOS measurements at wind speeds <17 m s−1 agree with those from SOC and CAP-2 and those at higher wind speeds do not, although there are some differences between CFDC and IS observations that will be discussed more below. INP concentrations during CHAOS were on the high end (above the 50th percentile) of Southern Ocean values, and CFDC ( °C) measurements at wind speeds above 17 m s−1 are above the 95th percentile of CAP-2 and SOC values by about an order of magnitude. As anticipated, the DeMott et al. (2015) n500-based parameterization (Fig. 2b) and Ullrich et al. (2017) Ns parameterization (Fig. 2c) for dust INPs overestimate CHAOS values by several orders of magnitude. Nn500 and Ns measured by the CFDC during CHAOS overlap with Southern Ocean observations, though they are biased high (Fig. 2b and c). IS Nn500 and Ns values for wind speeds <17 m s−1 are within the 5th–95th percentile of CAP-2 and SOC values, while those at high wind speeds are almost entirely below the 5th percentile. Interestingly, the agreement for Nv is better overall, although CFDC measurements are all above the 50th percentile and extend above the CAP-2 and SOC 95th percentile, while IS measurements at higher wind speeds fall below the 5th percentile (Fig. 2d). Similarly to the CAP-2 results (Moore et al., 2024), the Mitts et al. (2021) Nv parameterization has a lower slope than the CHAOS dataset and is near the upper bound of measured values at all temperatures. Variable agreement among Nn500, Ns, and Nv suggests a different shape to the particle size distribution in the SOARS channel than the Southern Ocean MBL, since all of the aerosol concentrations are enhanced in SOARS relative to ambient measurements, but only Nv has a range similar to ambient observations. This is supported by example size distributions from CHAOS, which show enhancements in aerosol concentrations between 0.1–1 µm relative to CAP-2 distributions, with the discrepancy increasing with wind speed (Fig. A6).
CFDC INP concentrations (circles in Fig. 2, °C) generally increase with wind speed, while variability is reduced following normalization by aerosol concentrations, as expected if INPs are emitted proportionally to SSA. The reduction in spread after normalization is shown even more clearly in the time series of CFDC data presented in Fig. A7. However, it is also clear from Fig. A7 that on some days, INP concentrations were the same up to a wind speed threshold of ∼17 m s−1 (8, 17–19 August 2022). Other days did not sample enough wind speeds to assess this variation. This agrees with what is observed for SSA concentrations in Fig. 1, which shows a distinct increase in aerosol concentrations between the 16.3 and 17.5 m s−1 wind speeds. On the other hand, INP concentrations measured from the aerosol filters (triangles in Fig. 2, °C) did not have a clear relationship with wind speed. This difference may be due to the different averaging times of the CFDC (∼5 min) vs. the IS filters (2–3 h), differences in inlet orientations or locations (Sect. 2.3), or differences in the aerosol sampled. The CFDC sampled ∼2 m upstream of the filters, with a vertically oriented inlet, whereas the IS filters used a horizontal inlet facing into the wind. Despite the anticipated enhancements in particle transmission at ∼1 µm for the IS filter inlet at higher wind speeds and otherwise similar efficiencies to the CFDC inlet (Fig. A4), the consistently higher concentrations measured by the CFDC at the same wind speed suggest that particle losses in the IS filter inlet may not be accurately captured by these theoretical calculations. Future studies should make both online and offline measurements using the same or more similar inlets to reduce these uncertainties. The IS and CFDC also largely measure INPs at different temperatures, with the CFDC primarily targeting INPs active ca. −30 °C and the IS sensitive to INPs at warmer temperatures. Temperature-dependent differences in INP composition may also be driving the observed discrepancy between the IS and CFDC results, especially if emission of different types has contrasting dependencies on wind speed.
Normalized INP concentrations for both instruments generally decreased with increasing wind speed, especially above ∼17 m s−1, although decreases were more modest for the CFDC than the IS. This can be seen more clearly in Fig. 3, which displays the same data as Fig. 2 as a function of wind speed in 3 °C temperature bins, with CFDC and IS filter ranges indicated by box plots. Also clear in Fig. 3 is the large inter-sample variability observed during CHAOS for measurements collected at similar wind speeds and temperatures. INP concentrations in the Southern Ocean MBL were found to increase with wind speed and to retain the same wind speed dependence after normalization by aerosol number, surface area, and volume (Moore et al., 2024). Even if only considering the CFDC observations, normalized INP concentrations have a small but negative relationship with wind speed during CHAOS. One possible explanation for this is that loss mechanisms such as dry and wet deposition have lower rates in SOARS, where aerosol was sampled from 0.6 m above the water surface, compared to the ambient marine boundary layer, where measurements were collected from 18.4 on the ship and ∼150 m on the aircraft during CAP-2 and SOC. This would alter the particle size distributions in SOARS, especially at larger sizes where loss rates are higher. As discussed earlier, higher concentrations were seen in the accumulation mode during CHAOS compared to CAP-2 (Fig. A6). Unfortunately, losses at larger sizes are hard to assess with the available size distribution measurements since the SEMS + APS sampled behind a 2.5 µm cyclone and the SMPS + APS had an inlet similar to the IS (Sect. 2.3) and thus likely also experienced additional losses not accounted for in the theoretical calculations. Overall, the results from CHAOS may be more representative of interfacial fluxes rather than marine boundary layer or cloud-base values. As previously discussed in relation to measured particle concentrations, the fixed 1.3 amplitude scaling for wave height used during CHAOS may also be obscuring the true INP–wind speed relationships, which requires further measurements with co-varying wave amplitude and wind speed to resolve.
Seawater INE concentrations were relatively stable throughout CHAOS (Fig. A8) and agree well with previous measurements from the Scripps Pier, as well as from the northern Indian Ocean (Beall et al., 2022) and mid-Atlantic (Gong et al., 2020), and are higher than observations from the Southern Ocean (McCluskey et al., 2018a) or Barents Sea (Hartmann et al., 2021) by 1–2 orders of magnitude. The INE stability across multiple fills of the SOARS channel and over time with the same water indicates the observed INP–wind speed relationships were driven by wind–wave interactions rather than biological activity during CHAOS. Seawater biology and chemistry, as well as air and water temperature, were not controlled during CHAOS and were allowed to vary throughout the experiments. This resulted in variations in seawater chlorophyll a, total organic carbon (TOC), temperature, salinity, and nutrient concentrations, among other factors (Fig. A2). As a result of collecting seawater from the SIO pier to fill the SOARS channel, the CHAOS measurements may be more representative of mid-latitude coastal marine regions than remote or polar ocean environments. In addition, the seawater was relatively warm (∼25 °C) as well as high in silicates, so additional measurements under a range of biogeochemical conditions are needed to assess the robustness of these findings.
3.2 INP composition and phase state changes under increasing wind speeds
The fractional composition of INPs (Sect. 2.2.3) as a function of wind speed is shown in Fig. 4 for three temperature ranges: −19 to −23 °C, −23 to −26 °C, and −26 to −29 °C. Composition data are only reported when the treated and untreated samples were different at the 95 % confidence level, and the fraction of data not meeting this criterion is shown in Fig. A9 as a function of temperature. The generally low fractions of heat-treated spectra that significantly differed from the base spectra (green dots in Fig. 4c, f, and i) indicate the collected INPs were largely unaffected by heat treatments, although consistently high biological fractions (∼1) were observed at temperatures °C and wind speeds below 15 m s−1 (Fig. 4a–c). Low wind speeds ( m s−1) may favor enrichment of biological INPs in the sea surface microlayer (Wilson et al., 2015; Engel et al., 2017; Irish et al., 2017; Ickes et al., 2020; Hill et al., 2023), which is consistent with this result. On several days, especially at the end of the second water fill (16–19 August 2022), heat treatments led to increased INP concentrations over the untreated filters at temperatures of −23 to −26 °C, which are shown as biological fractions >1 in Fig. 4d and e, especially at the highest wind speeds. This observation is uncommon but was observed by McCluskey et al. (2018b) during a laboratory-simulated phytoplankton bloom grown in a Marine Aerosol Reference Tank (MART; Stokes et al., 2013). It was suggested to be a result of lysis of microbial cells upon heating, releasing ice-nucleation-active material, or of the dissolution and redistribution of organic material between particles, leading to a net increase in the number of particles with ice-nucleation-active organic material. This contrasts with the consistent decrease after heating also presented in McCluskey et al. (2018b) for a phytoplankton bloom grown in the SIO glass channel during the IMPACTS (Investigation into Marine Particle Chemistry and Transfer Science) campaign (Wang et al., 2015), where larger proportions of biological INPs were inferred to be released in response to increased seawater biological activity.
Concentrations of heat-labile INPs during CHAOS ranged from to L−1 and, when normalized by aerosol n500, from to . Heat treatments which produced increased INP concentrations over the untreated filters are excluded from these ranges, since they are not representative of the emission of biological INPs during CHAOS but instead of post-emission modification. Samples meeting this criterion all had estimated biological INP fractions of 1, were at relatively warm temperatures (), and were predominantly collected at 9.6 m s−1 wind speed, in accordance with Fig. 4a–c. Both the concentrations and high biogenic fraction of these warm-temperature INPs from CHAOS are in agreement with recent INP measurements in the Arctic (Hartmann et al., 2020; Freitas et al., 2023), although Hartmann et al. (2020) concluded marine INPs were the likely source, while Freitas et al. (2023) determined local terrestrial primary biological aerosol particles (PBAPs) were the dominant contributor to their measurements. Using a plunging jet chamber to produce SSA, Freitas et al. (2022) estimated the production of PBAPs from Baltic seawater to be ∼1 in every 104 particles larger than 0.8 µm. This is about 3 orders of magnitude larger than the median proportion of biological INPs to total particles larger than 0.5 µm during CHAOS (∼6 in every 107), indicating that while marine biogenic particles can act as INPs, only a small fraction are able to do so, at least for temperatures .
At low wind speeds (<15 m s−1) and below −23 °C, heat-stable organic INPs (low biological and low inorganic fractional composition) were the dominant INP type, corresponding to the dissolved organic carbon (DOC)-type INP described in McCluskey et al. (2018b). This is in accordance with a number of laboratory (McCluskey et al., 2018b) and field (Rosinski et al., 1987; Wilson et al., 2015; Ladino et al., 2016; Alpert et al., 2022) measurements, although other studies have inferred the dominance of proteinaceous or heat-labile material (Knopf et al., 2011; Wang et al., 2015; Irish et al., 2017). By contrast, at higher wind speeds, inorganic or refractory INPs were the dominant type observed at all temperatures. At wind speeds >15 m s−1, nearly all peroxide-treated filter samples had higher INP concentrations than the untreated samples (inorganic fractional composition >1 in Fig. 4a–b, d–e, and g–h), and many of these corresponded to the heat-treated samples with enhanced INP concentrations described above. All of the samples with enhanced concentrations following peroxide digestion had a characteristic shape to their temperature spectra, an example of which is shown in Fig. A10. In contrast to the typical log-linear marine INP spectra (DeMott et al., 2016), dramatic increases are seen in peroxide-treated results at warm temperatures, which flatten out at around −23 °C and meet or approach the untreated spectra at around −27 °C. This is reminiscent of INP temperature spectra identified as biological (Hill et al., 2016; Suski et al., 2018), which have large warm-temperature INP populations that are reduced to log-linear spectra following heating and/or peroxide digestion, only inverted. An increase in INP concentration after peroxide digestion has not been reported before for marine INPs but is hypothesized to be the result of the enhanced release of large particles at high wind speeds in SOARS, which may contain multiple INPs. The production of spume droplets through the tearing of wave crests, which produces particles predominantly >10 µm and is increasingly active for wind speeds exceeding ∼9 m s−1 (Monahan et al., 1986; Sofiev et al., 2011), is the most likely mechanism consistent with the observed wind speed dependence. The atmospheric lifetime of such particles is very short, which may explain why this has not been observed in ambient measurements or laboratory studies with low wind speeds. Organic material in seawater, including carbohydrates, lipids, and proteins, is well known to self-assemble into microgels which can range in size from <10 nm (single macromolecule) to micrometer-sized colloidal gels (Chin et al., 1998; Verdugo, 2012). INPs could be trapped in this gel matrix, emitted as large spume drops, and then released following the breakdown of the organic material during peroxide digestion. If so, the composition of the INPs themselves cannot be inferred from these results, since they could be either inorganic contaminants (dust), which are stable against peroxide digestion, or heat-stable organics, which the 20 min digestion used here is not long enough to both release from their gel matrix and break down.
Additional information about the composition of INPs produced in SOARS was provided by AFM analysis of submicron ice crystal residuals collected in the CFDC (Sect. 2.2.4). Six particle categories were identified based on 3D height images of particles collected at four wind speeds (9.6, 16.3, 18.7, and 21.2 m s−1): rounded, core–shell, prism-like, rod, aggregate, and irregular (Fig. A3). These are similar to the categories identified for ice crystal residuals during SeaSCAPE (DeMott et al., 2023), except rod and irregular particles were not identified during SeaSCAPE. Some of the particles in the rod and irregular classes are morphologically similar to known contaminants from the SOARS channel itself, and these particle classes will not be further discussed here. Prism-like particles did not display a clear relationship with wind speed (Fig. 5). Rounded particles had relatively high abundances at low wind speeds (<17 m s−1), while core–shell particles increased in relative contribution with increasing wind speeds. Similar collections of SSA produced during CHAOS had identical relationships between relative contributions of core–shell and rounded particles with wind speed as the ice crystal residuals, suggesting that the INPs are subsets of all the observed SSA particle morphologies (Madawala et al., 2024). The SSA particles collected were also analyzed for elemental composition by scanning electron microscopy coupled with energy-dispersive X-ray spectroscopy (SEM–EDX) as in Ault et al. (2013), and for functional group characterization using atomic force microscopy–photothermal infrared spectroscopy (AFM–PTIR) following Or et al. (2018). SEM–EDX indicated that rounded SSA particles were organic carbon throughout, while core–shell particles had a cubic NaCl core and organic shell. Rounded particles had more diverse organic functional groups (fatty acids, complex sugars, and in some cases traces of sulfates and carbonates), and their composition was similar at both 9.6 and 18.7 m s−1. The shells of core–shell particles were dominated by aliphatic compounds at 9.6 m s−1, with the addition of oxygenated organics at 18.7 m s−1 (Madawala et al., 2024).
Viscoelastic response distance (VRD), which is related to the viscosity of the material (Lee et al., 2020; Kaluarachchi et al., 2022a), as well as to the particle phase state (Lee et al., 2017, 2020), was quantified for core–shell ice crystal residuals at 20 % and 60 % RH (Table C1). As anticipated due to the hygroscopicity of SSA, the fraction of semisolid shells increased between 20 % and 60 % RH at all wind speeds. Below 17 m s−1, the shell region of core–shell particles was predominantly solid at 20 % RH, while at higher wind speeds, shells were more often semisolid even at low RH. VRD measurements were only possible on semisolid shells and were similar at both 20 % and 60 % RH for a given wind speed but were higher for wind speeds >17 m s−1. The increased abundance of semisolid shells with higher VRD is consistent with lower viscosity and the presence of more oxygenated chemical species in the shell region of core–shell particles at higher wind speeds.
Initial results were presented here from the CHAOS campaign, which focused on the role of wind speed in the production of SSA and INPs using the new SOARS wind–wave channel at the Scripps Institution of Oceanography. As expected from numerous field and laboratory measurements, SSA concentrations increased with increasing wind speed (Fig. 1). Enhanced particle concentrations were observed relative to Southern Ocean MBL measurements in a similar wind speed range (Moore et al., 2022) by maximum factors of , and ∼7 for particle number, surface area, and volume, respectively. INP concentrations were broadly consistent with previous measurements from the Southern Ocean (McCluskey et al., 2018a; Schmale et al., 2019; Moore et al., 2024) and North Atlantic (McCluskey et al., 2018c), although SOARS concentrations were biased high and normalized concentrations biased low relative to ambient results (Fig. 2). This is likely related to the low sampling height over the water surface during CHAOS (0.6 m), which may capture more large particles than are typically sampled during shipboard or coastal campaigns where aerosol inlets may be 20+ and/or offset from the shore. As a result, measurements from CHAOS likely represent interfacial values and may not be directly comparable to MBL or cloud-base measurements.
INP concentrations also generally increased with wind speed, especially for the CFDC measurements, as was observed in the Southern Ocean MBL (Moore et al., 2024). However, normalized INP concentrations decreased with increasing wind speeds during CHAOS, while the opposite relationship was observed in Moore et al. (2024) for the Southern Ocean (Figs. 2 and 3). In addition to the low sampling inlet height and consequently lower particle losses, the fixed 1.3 amplitude scaling for wave height used during CHAOS may help explain this discrepancy. Further measurements where wind speed and wave amplitude are both varied to produce whitecap fractions representative of open-ocean conditions (Monahan and Muircheartaigh, 1980) are required to separate these mechanisms. Additionally, the large spread and highly variable particle concentrations observed for both SSA and INPs during CHAOS complicated analysis and should be addressed through detailed estimates of particle losses within the SOARS channel and inlets and more systematic sampling of wind speeds than was possible during CHAOS due to time constraints. Seawater INE concentrations during CHAOS were stable and consistent with previous measurements at the SIO pier and in other regions (McCluskey et al., 2018a; Gong et al., 2020; Hartmann et al., 2021; Beall et al., 2022), indicating that changes in atmospheric INPs during CHAOS were driven by wind speed and wave-breaking mechanics rather than variations in seawater chemistry or biology (Fig. A8).
Heat-stable organic INPs were the dominant composition at wind speeds below 15 m s−1 (Figs. 4 and A9), which corresponds to the DOC-type marine INP described in McCluskey et al. (2018b). A number of field measurements have also identified similar small heat-stable marine INPs (Rosinski et al., 1987; Wilson et al., 2015; Ladino et al., 2016; Alpert et al., 2022), although a second category of larger and proteinaceous (heat-labile) marine INPs has also been observed in both field and laboratory measurements (Knopf et al., 2011; Wang et al., 2015; Irish et al., 2017; McCluskey et al., 2018b). At high wind speeds, peroxide-treated filter samples almost uniformly had higher INP concentrations than untreated samples (Figs. 4 and A10), which has not been previously seen for marine INPs. We hypothesize that spume droplet production at higher wind speeds, coupled with the low height of the SOARS sampling inlet, may have allowed for the sampling of larger aggregate particles containing multiple INPs, which were broken up through peroxide digestion. The composition of INPs emitted in such gels is unknown, since results from CHAOS are consistent with dust or other inorganic contaminants that are unaffected by peroxide digestion or heat-stable organics that are only released from the larger particle and not broken down due to the 20 min digestions performed here. The very short atmospheric lifetime of large (>10 µm) spume droplets may explain why this has not been seen in ambient measurements or laboratory experiments without wind (Wang et al., 2015; McCluskey et al., 2018b). Entrapment of INEs in gels may also play a role in their low number concentrations in seawater (McCluskey et al., 2018a; Gong et al., 2020; Hartmann et al., 2021; Beall et al., 2022) compared to terrestrial sources such as soil or mineral dust, fungi, and permafrost (O'Sullivan et al., 2014; Fröhlich-Nowoisky et al., 2015; Hill et al., 2016; Kanji et al., 2017; Barry et al., 2023) due to both reduced emissions of large particles and enhanced oceanic deposition through marine snow formation or other processes.
AFM 3D height images of collected ice crystal residuals were used to identify six dominant particle morphologies, which were similar to residual classifications during SeaSCAPE (DeMott et al., 2023). Rounded particles were the most abundant morphology at wind speeds <17 m s−1, and core–shell particles dominated at higher wind speeds (Fig. 5). The abundance of core–shell particles with semisolid shells increased with wind speed, while the viscosity of the shells simultaneously decreased. This is consistent with an increasing contribution of oxygenated chemical species in the shells, which was also noted as an outcome of heterogeneous aging of INPs during SeaSCAPE (DeMott et al., 2023). It is possible that the decreased viscosity and more complex chemical composition at high wind speeds are related to the enhancement in INP concentration following peroxide digestions through increased water solubility of the shells, as was observed during SeaSCAPE for aged SSA (Kaluarachchi et al., 2022a).
The CHAOS campaign represents a first attempt at using the new SOARS wind–wave channel to isolate individual factors impacting SSA and INP emissions from seawater. Additional experiments with co-varying wind speed and wave amplitude are ongoing, focusing initially on measuring SSA (and not INP) concentrations. This is intended to generate realistic whitecap fraction–wind speed pairings to increase comparability with ambient data. Both SSA and INP concentrations measured by the CFDC increased with wind speed during CHAOS, as expected. IS measurements of INP concentration demonstrated a less clear trend with wind speed, which may be due to the use of separate inlets with different particle losses. The very low sampling height during CHAOS (0.6 m) relative to ambient measurements (several to 20+ m) may have led to decreased losses of large particles and requires further study before the comparability of such interfacial measurements to ambient marine boundary layer observations can be assessed. A mechanism involving spume droplet production of aggregate particles was proposed to explain the unexpected results of peroxide digestions of IS filters collected at high wind speeds, which also requires further observations to evaluate. Following additional characterization of particle losses in SOARS and aerosol sampling inlets and utilizing measurements with paired wind speed and whitecap fraction, future studies in the SOARS facility will be well poised to answer remaining questions about SSA and INP emissions as a function of wind speed, wave state, and temperature.
Figure A1Schematic of the Scripps Ocean-Atmosphere Research Simulator (SOARS) wind–wave channel at the Scripps Institution of Oceanography showing key features relevant to SSA production and seawater biology.
Figure A2Overview of SOARS parameters during CHAOS, including (a) wind speed and IS INP filter sampling times, (b) chlorophyll a and total organic carbon (TOC) concentrations, (c) air and water temperature and seawater salinity, and (d) select seawater nutrient concentrations. Nutrient concentrations shown in (d) are nitrite (), phosphate (), ammonium (), silicates, and nitrate (). The switch between the third (1–12 August) and fourth (14–26 August) fills of the SOARS channel is indicated in all panels by the dashed grey line. The period when the PAR LEDs were utilized in addition to the solar tubes for lighting is indicated by the yellow bar at the top of panel (b).
Figure A3Illustrative AFM 3D height images of six main particle morphological categories (rounded, core–shell, prism-like, rod, aggregate, and irregular) identified at four wind speeds of 9.6, 16.3, 18.7, and 21.2 m s−1. Images were all collected at 20 % RH.
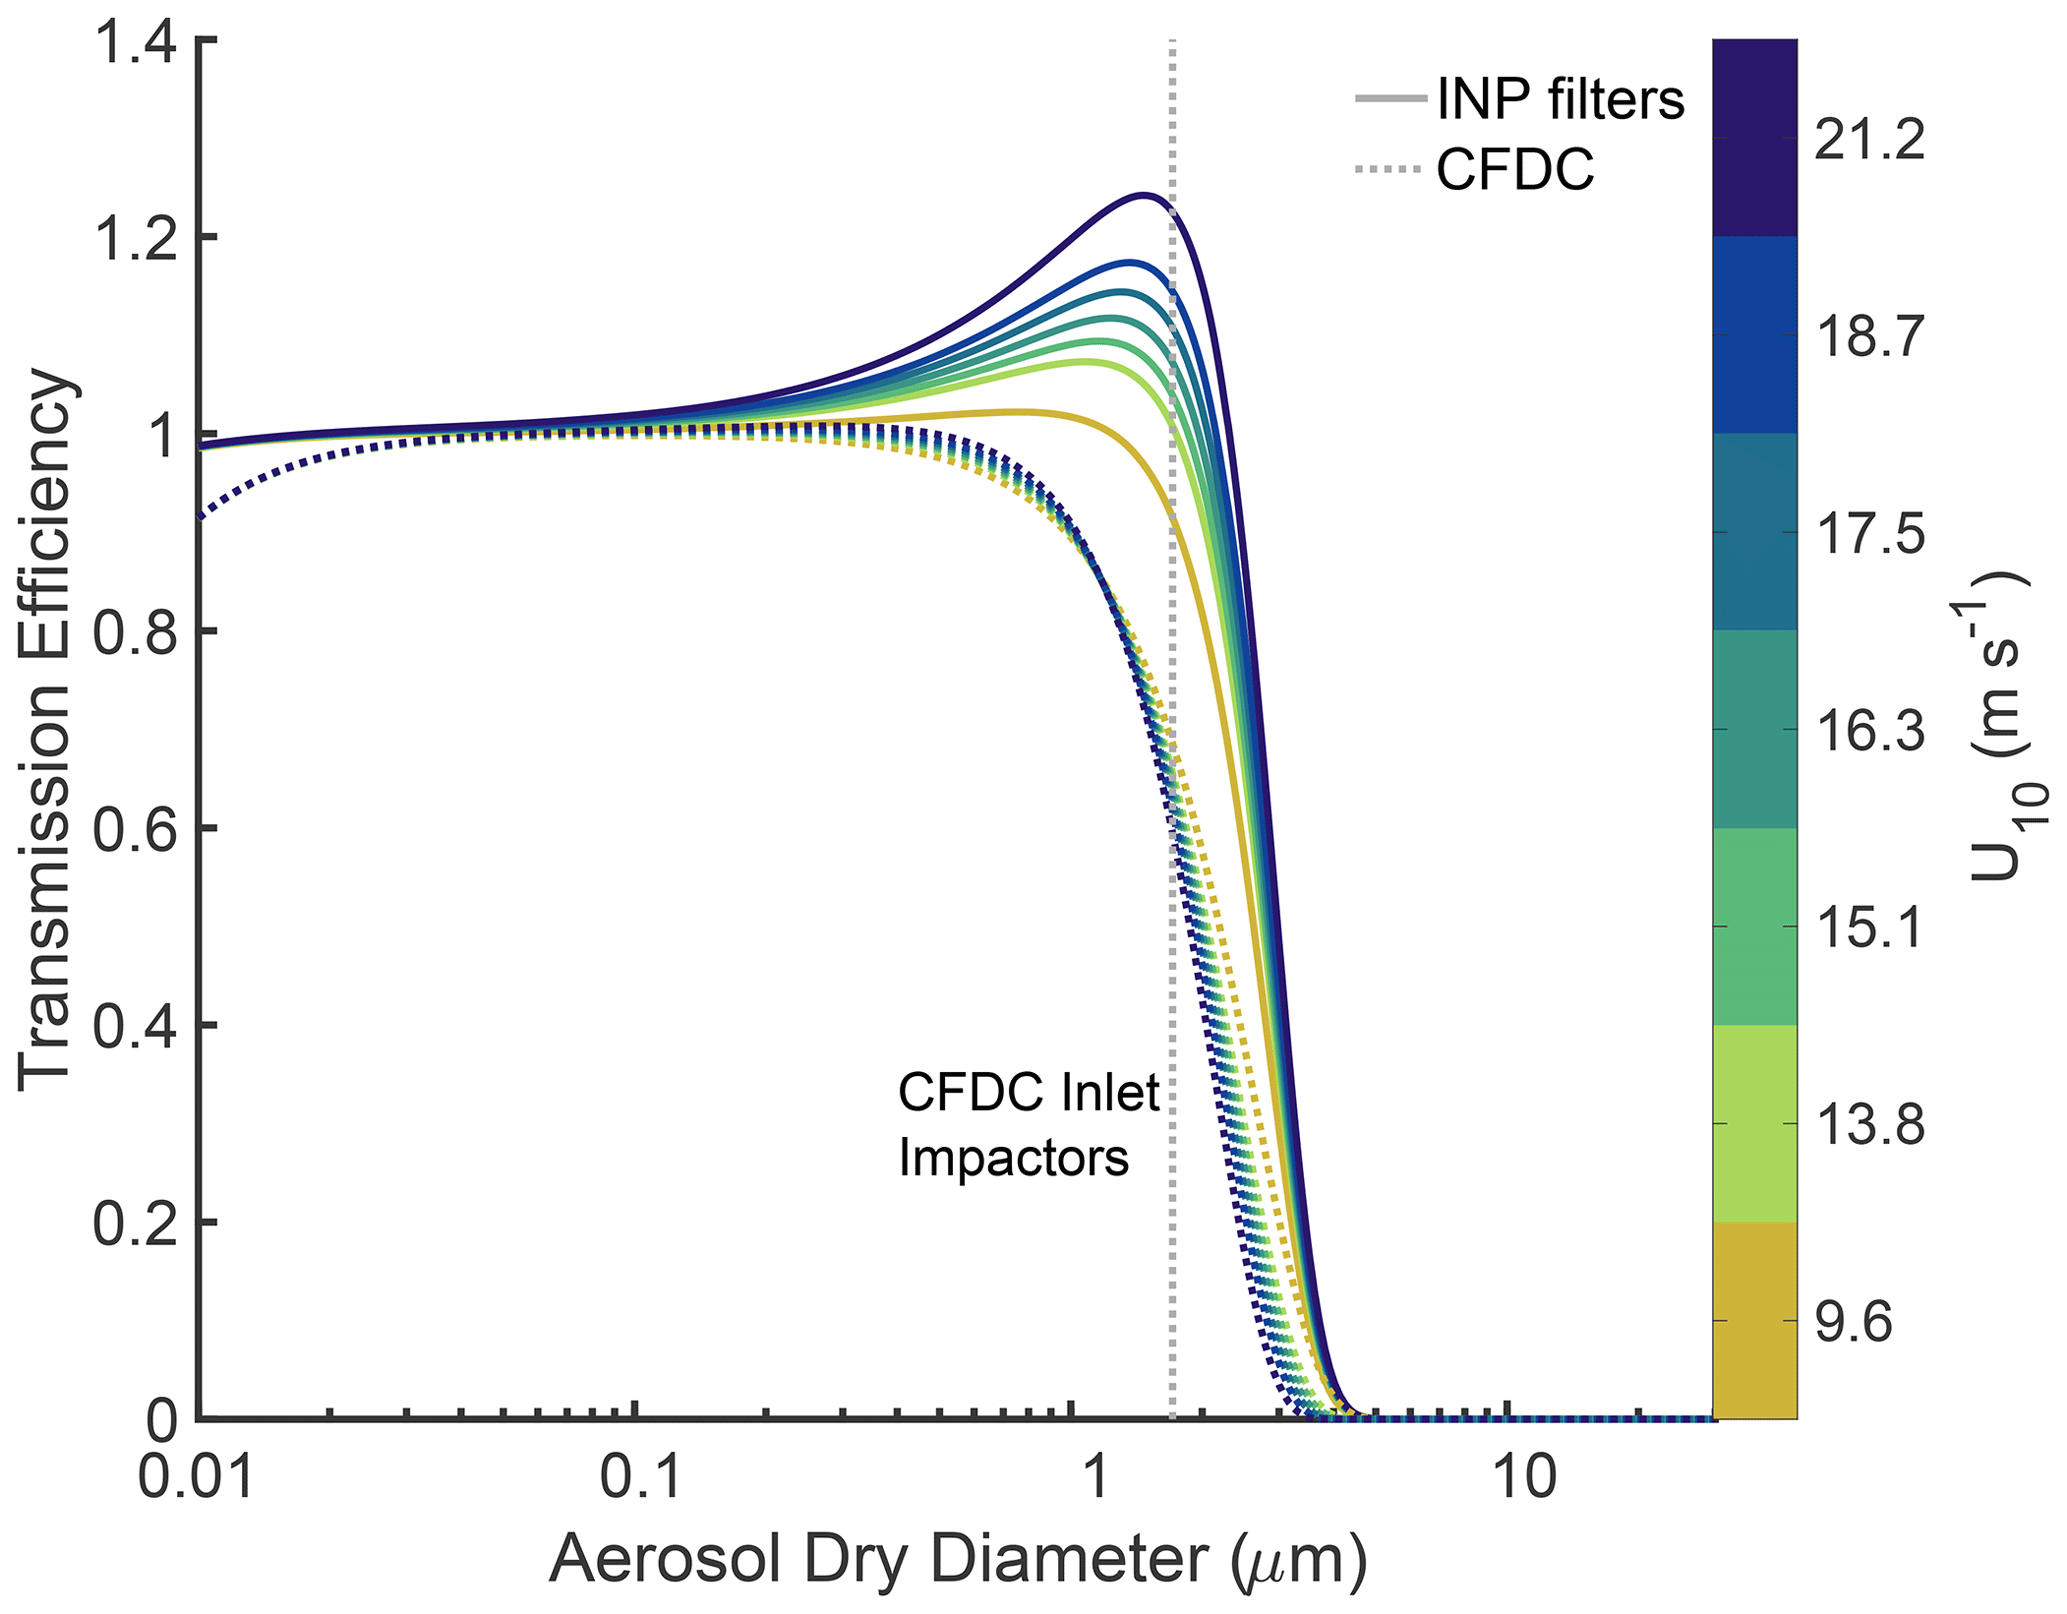
Figure A4Estimated particle transmission efficiency during CHAOS for particles reaching either the CFDC (SEMS + APS) or the INP filters (SMPS + APS), based on the different inlet geometries. These theoretical calculations used the von der Weiden et al. (2009) Particle Loss Calculator. Calculations were performed for the whole inlet in terms of aerodynamic diameter, with a particle density ρ=1, and then corrected for expected particle density, water uptake, and shape factor (Sect. 2.3). Colors indicate the wind speed of the measurement, with INP filter curves in solid lines and CFDC curves in dashed lines. The dashed vertical grey line indicates the 50 % cut size of the CFDC inlet impactors.
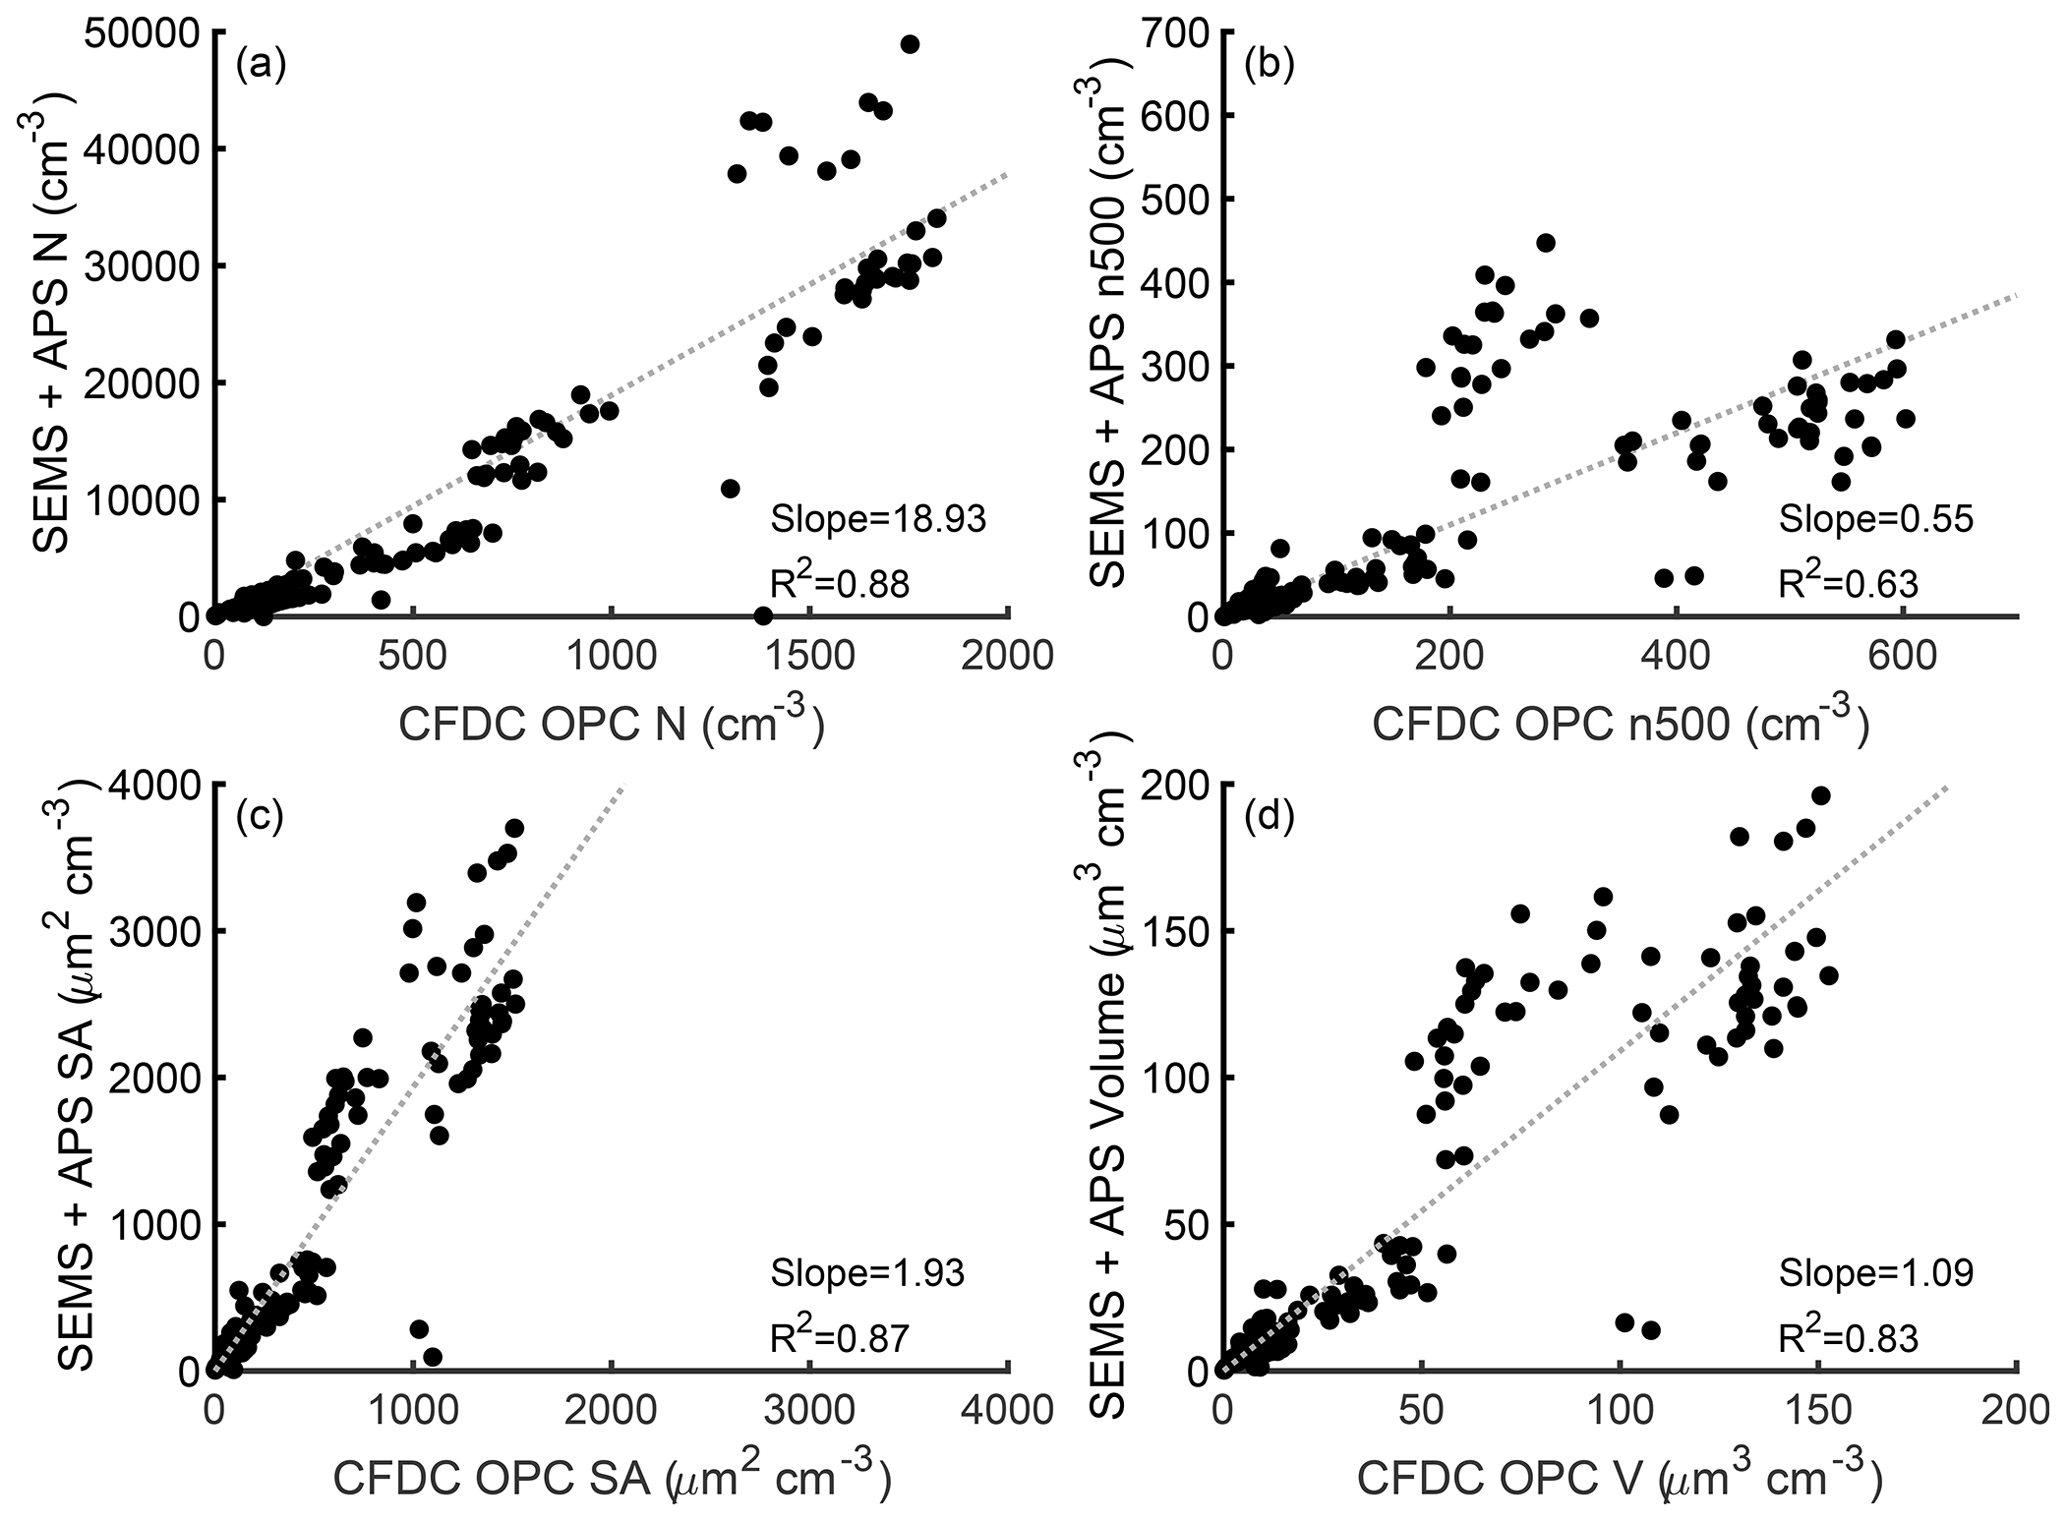
Figure A5Correction factors (slopes) derived for the CFDC OPC based on SEMS + APS aerosol measurements, for total particle number (a), number >500 nm diameter (n500) (b), particle surface area (c), and particle volume (d) concentrations. The correction factors for each aerosol parameter are also reported in Table C2.
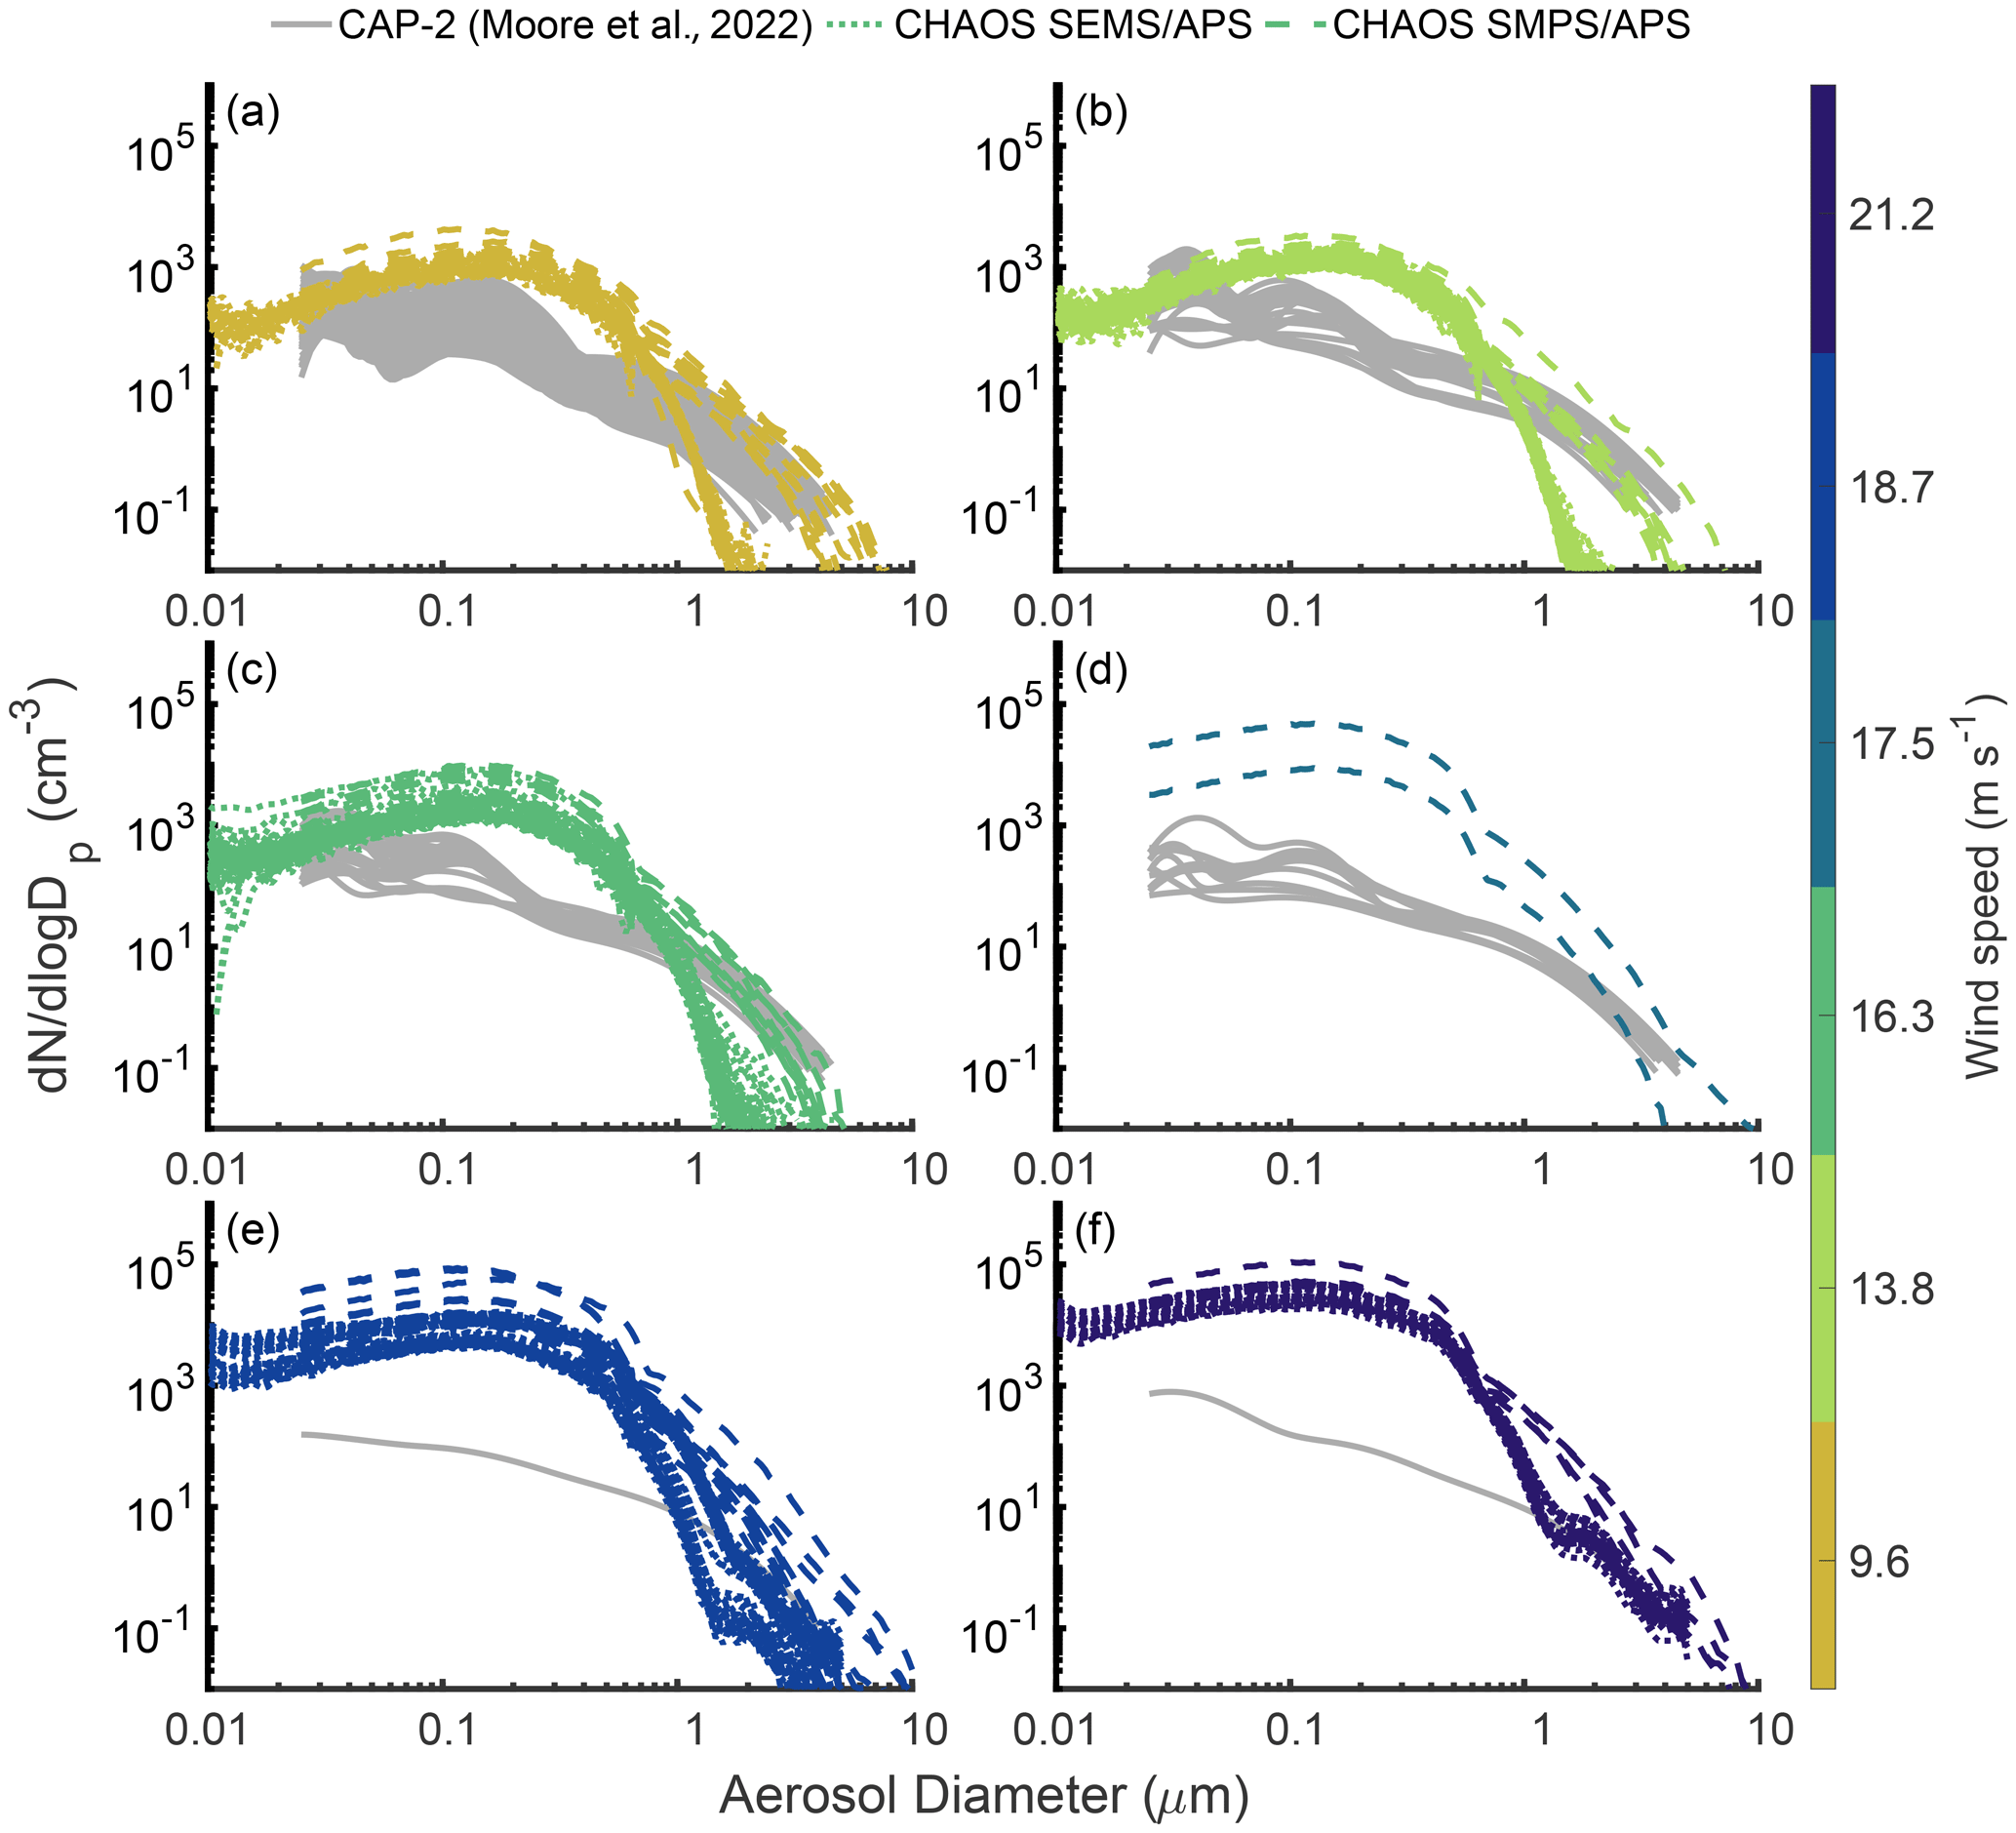
Figure A6CHAOS aerosol size distributions at (a) 9.6 m s−1 (yellow), (b) 13.8 m s−1 (light green), (c) 16.3 m s−1 (green), (d) 17.5 m s−1 (light blue), (e) 18.7 m s−1 (dark blue), and (f) 21.2 m s−1 (dark purple). Measurements from the SEMS + APS are shown in the colored dotted lines, SMPS + APS observations in the colored dashed lines, and observations from CAP-2 (Moore et al., 2022) in the solid grey lines if available. Measurements from CAP-2 are shown if they are within ±0.5 m s−1 of the SOARS U10 values.
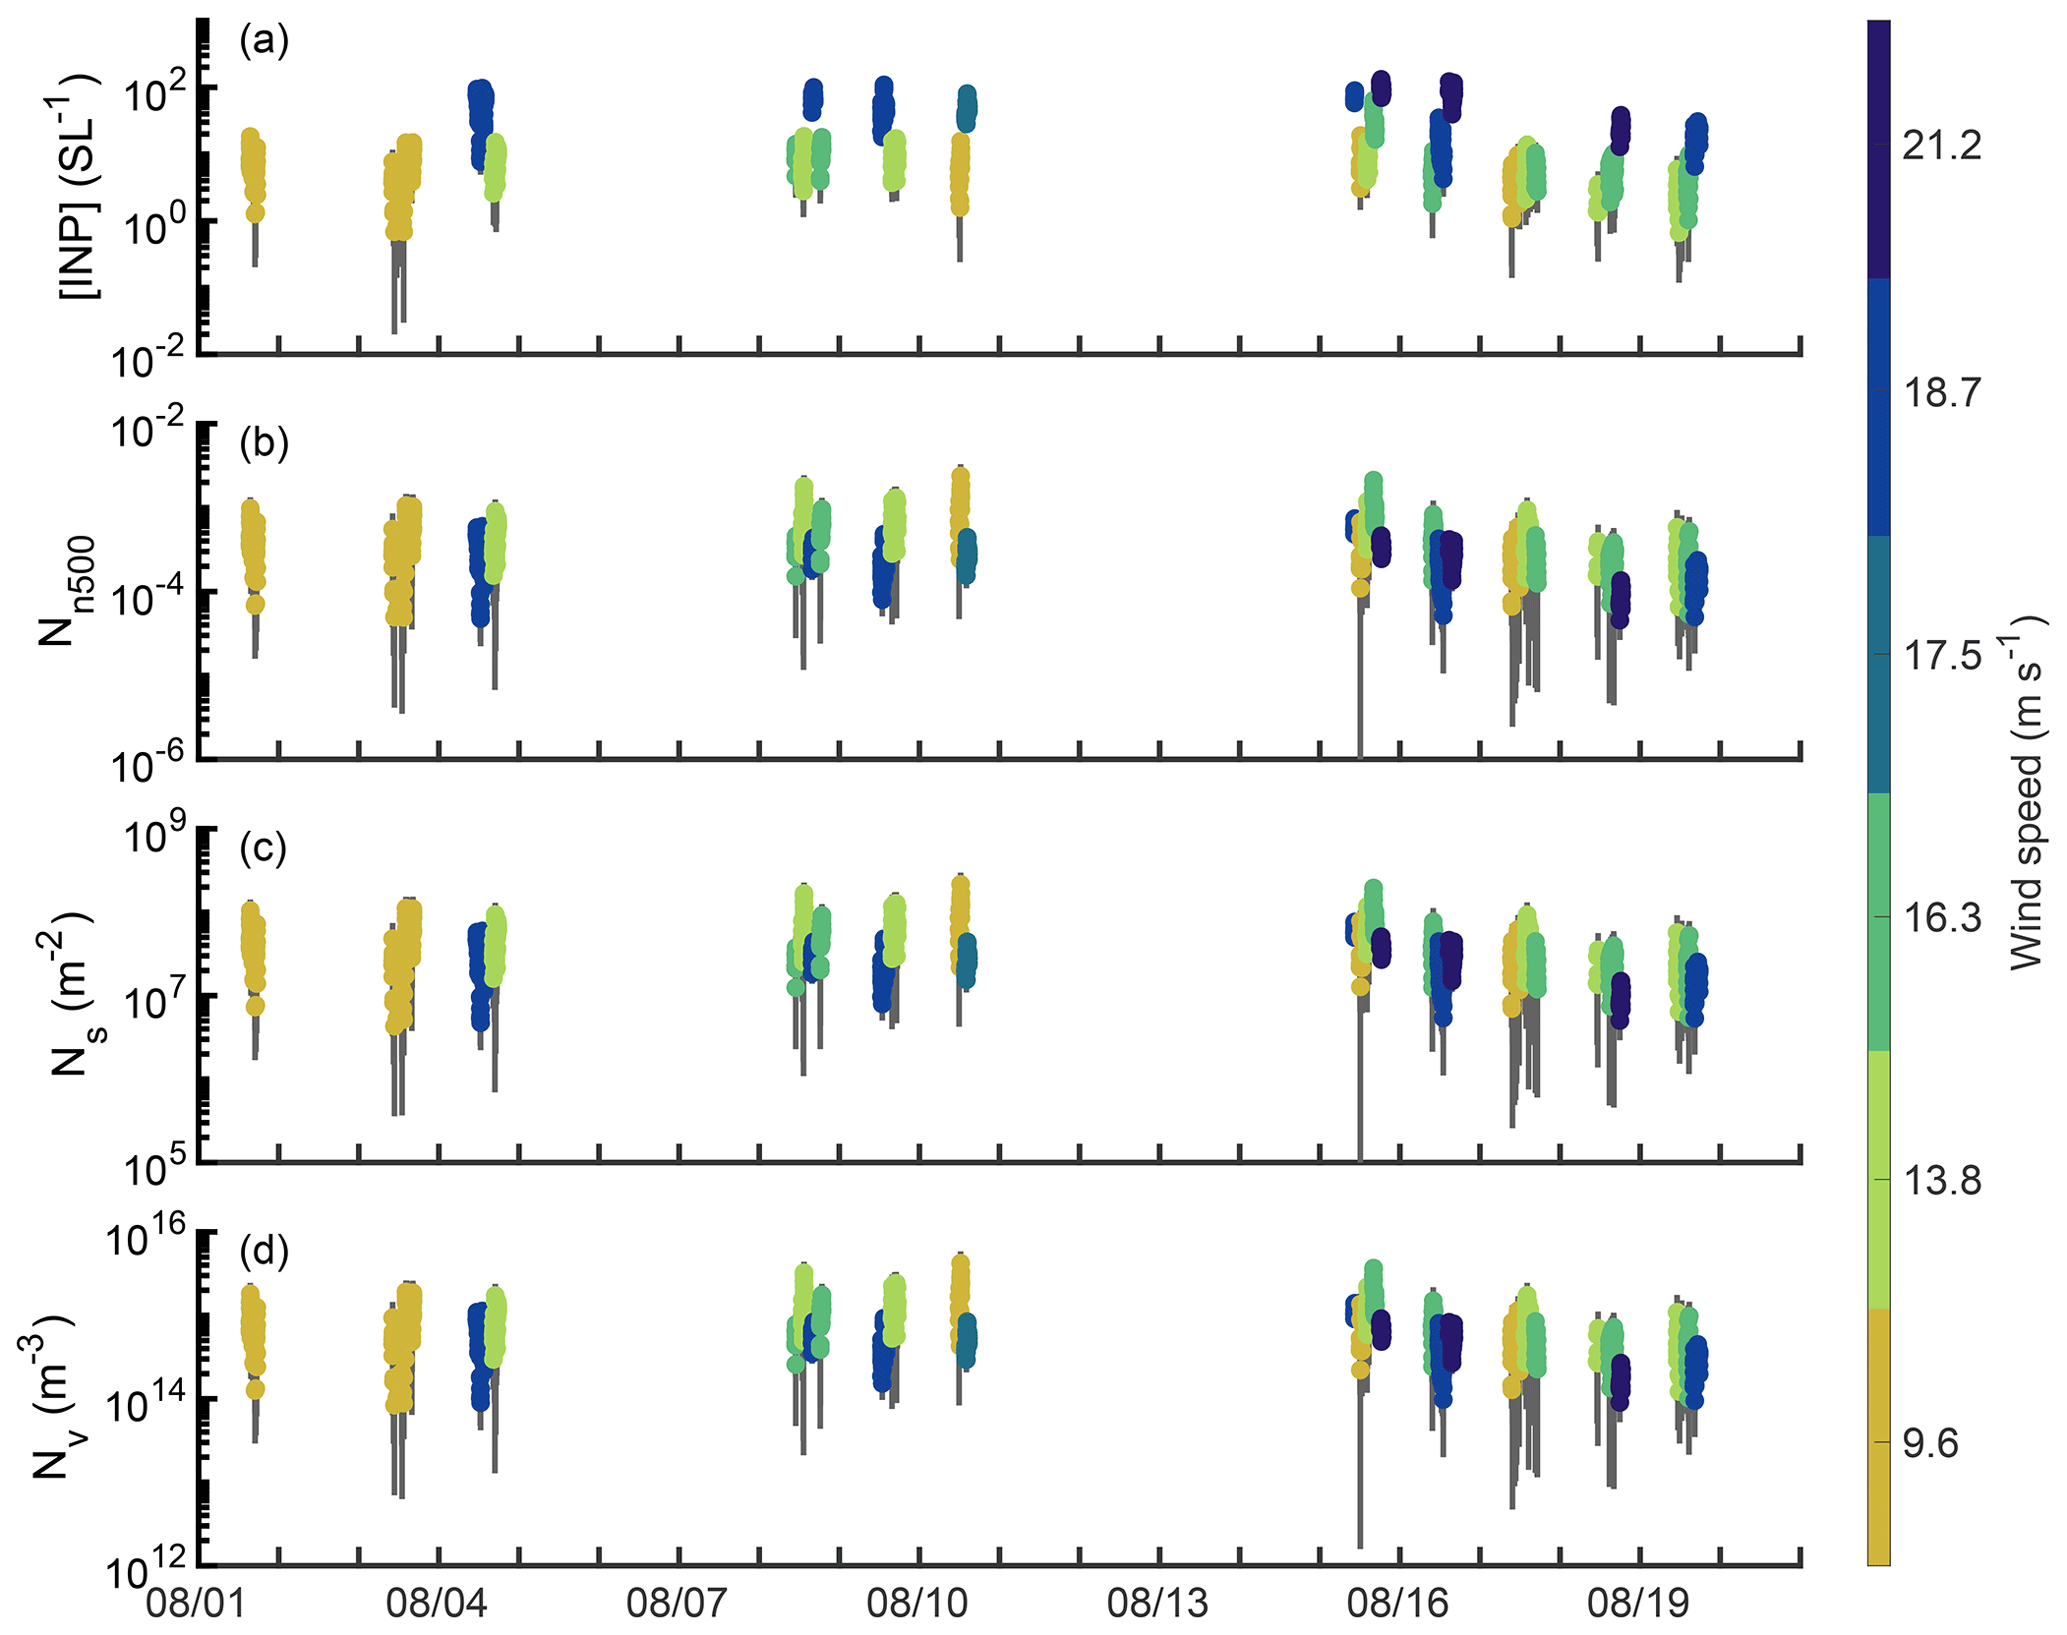
Figure A7Time series of CFDC INP number concentration (a) and INP number concentration normalized by n500 (Nn500) (b), aerosol surface area (Ns) (c), or aerosol volume (Nv)(d) during CHAOS. Observations are colored by the wind speed during each measurement period.
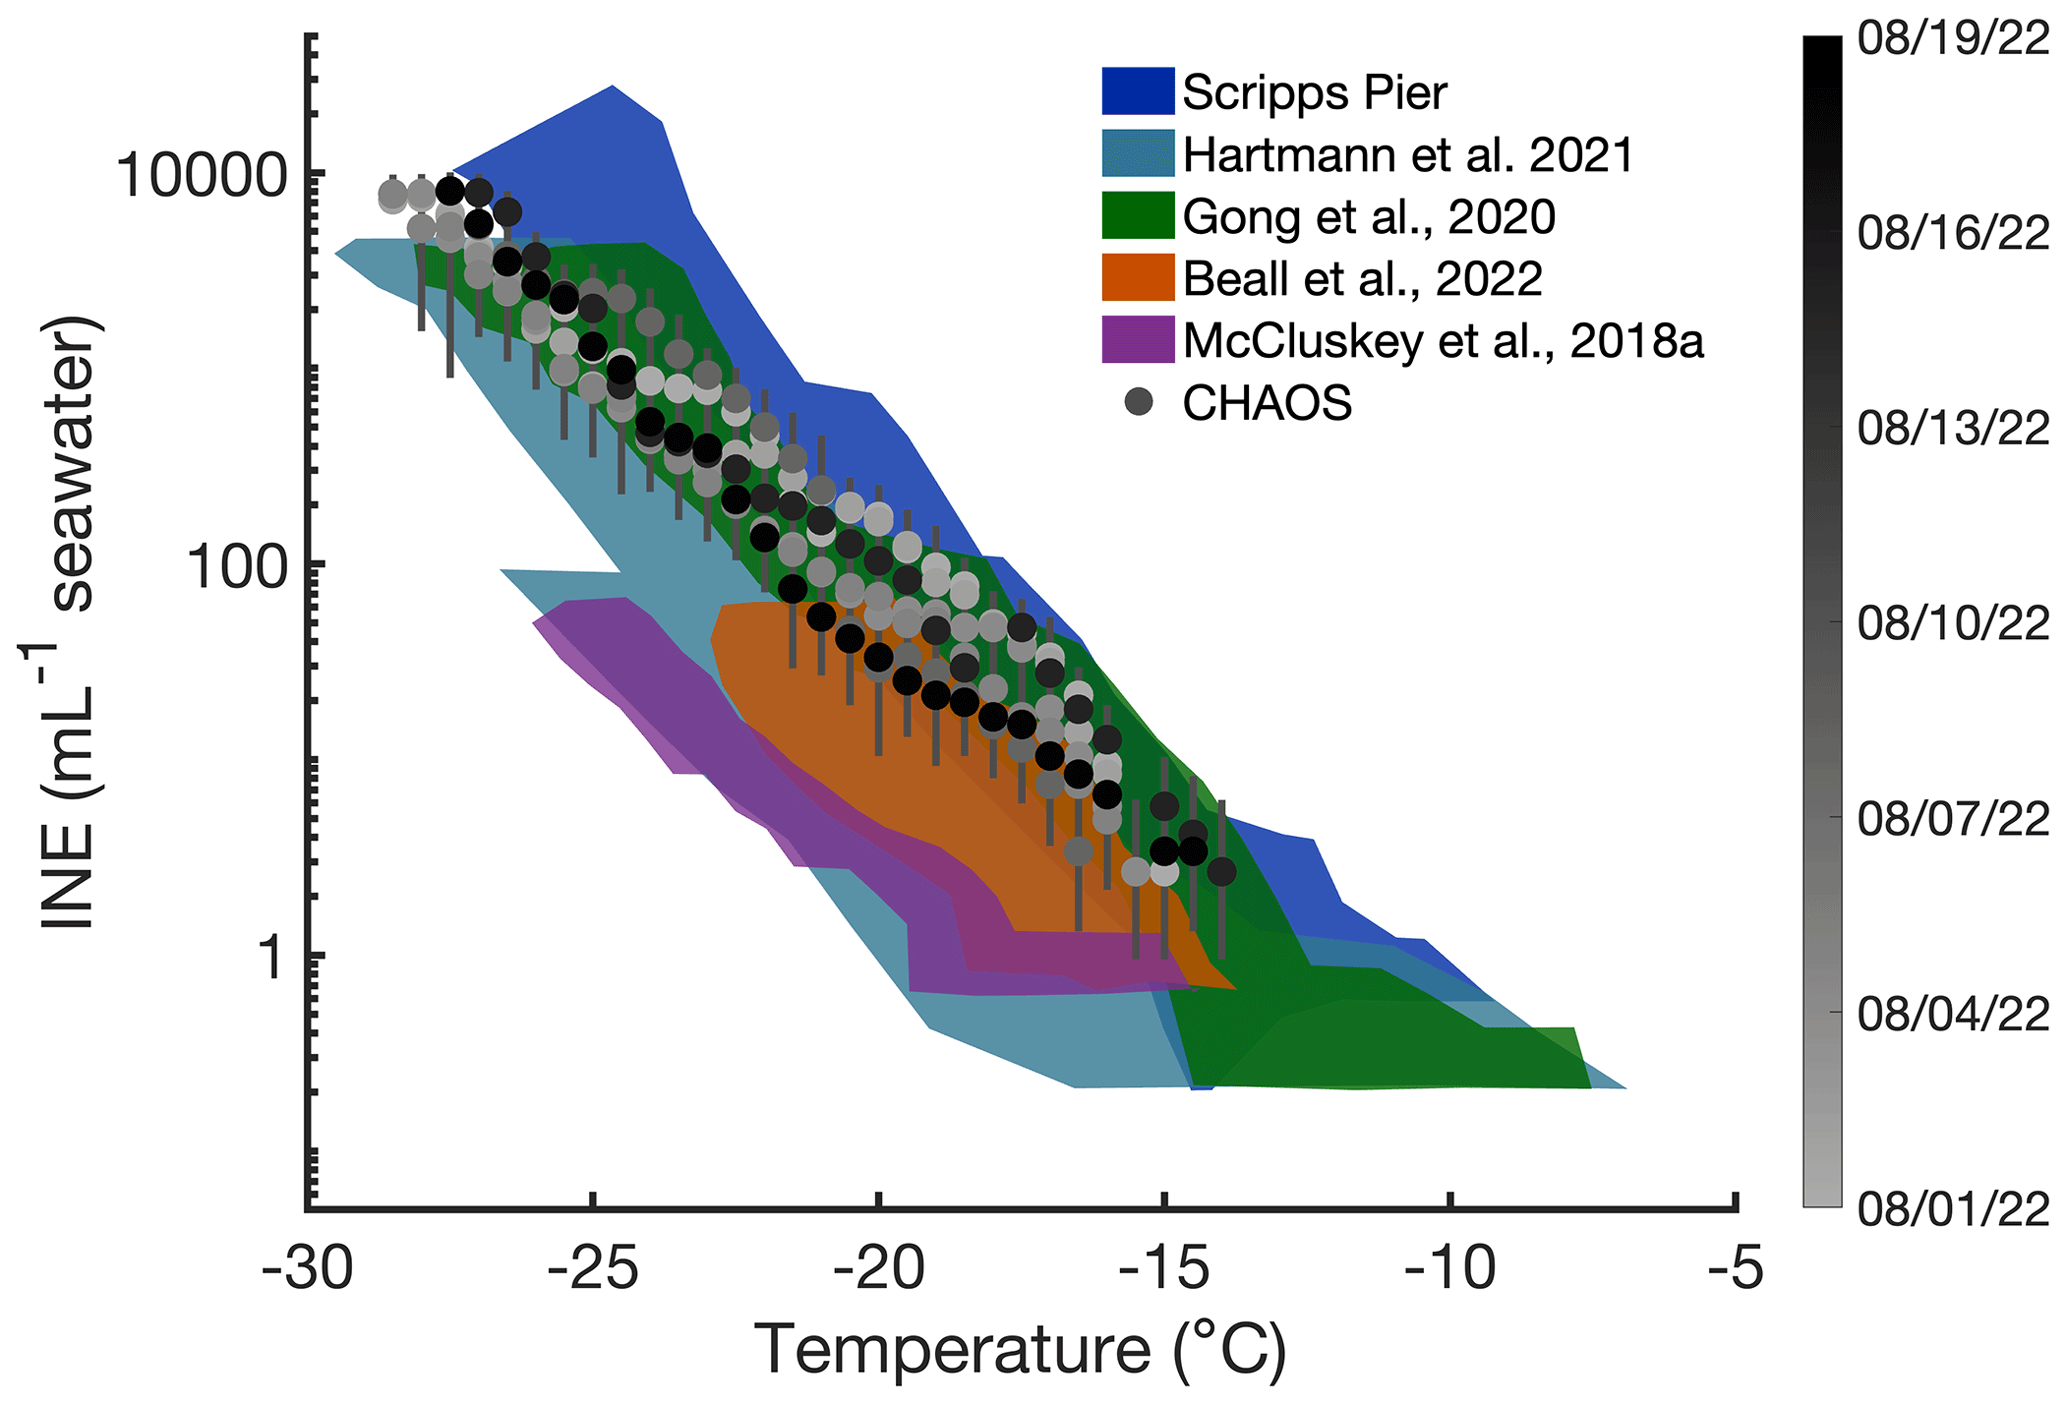
Figure A8Seawater INE temperature spectra during CHAOS (grey circles), shaded by collection date (month/day/year). Colored patches indicate comparisons with measurements from the Scripps Pier (dark blue), Barents Sea (Hartmann et al., 2021, light blue), mid-Atlantic (Gong et al., 2020, green), northern Indian Ocean (Beall et al., 2022, orange), and Southern Ocean (McCluskey et al., 2018a, purple).
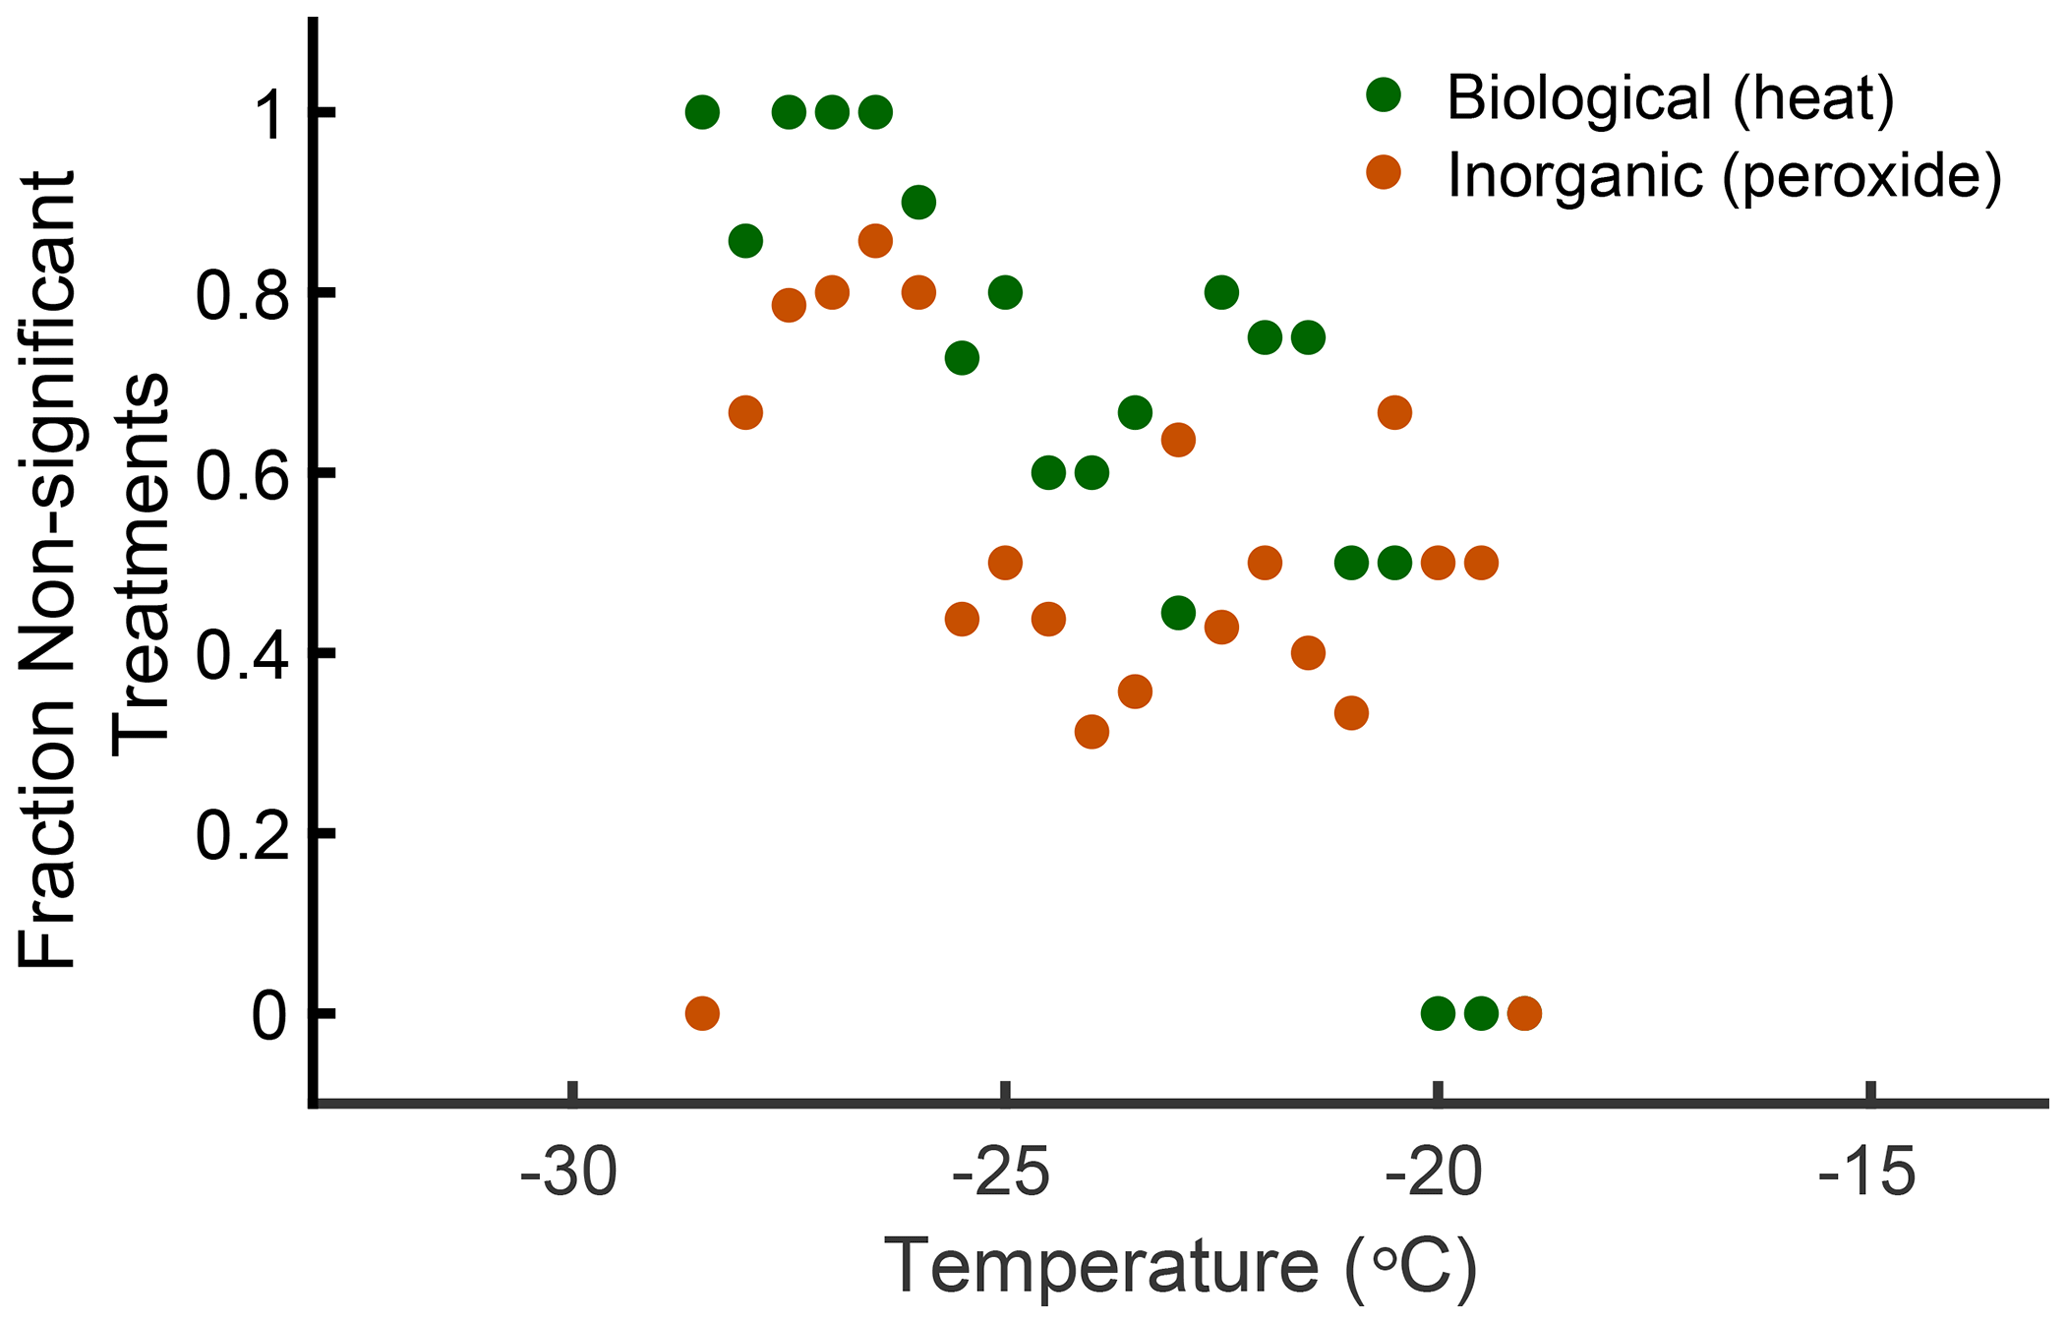
Figure A9Fraction of INP filter treatment results that are not statistically different from the base spectra at the 95 % confidence level. Results are shown as a function of temperature, with results for biological INPs (heat treatment) in green and inorganic INPs (peroxide treatment) in orange.
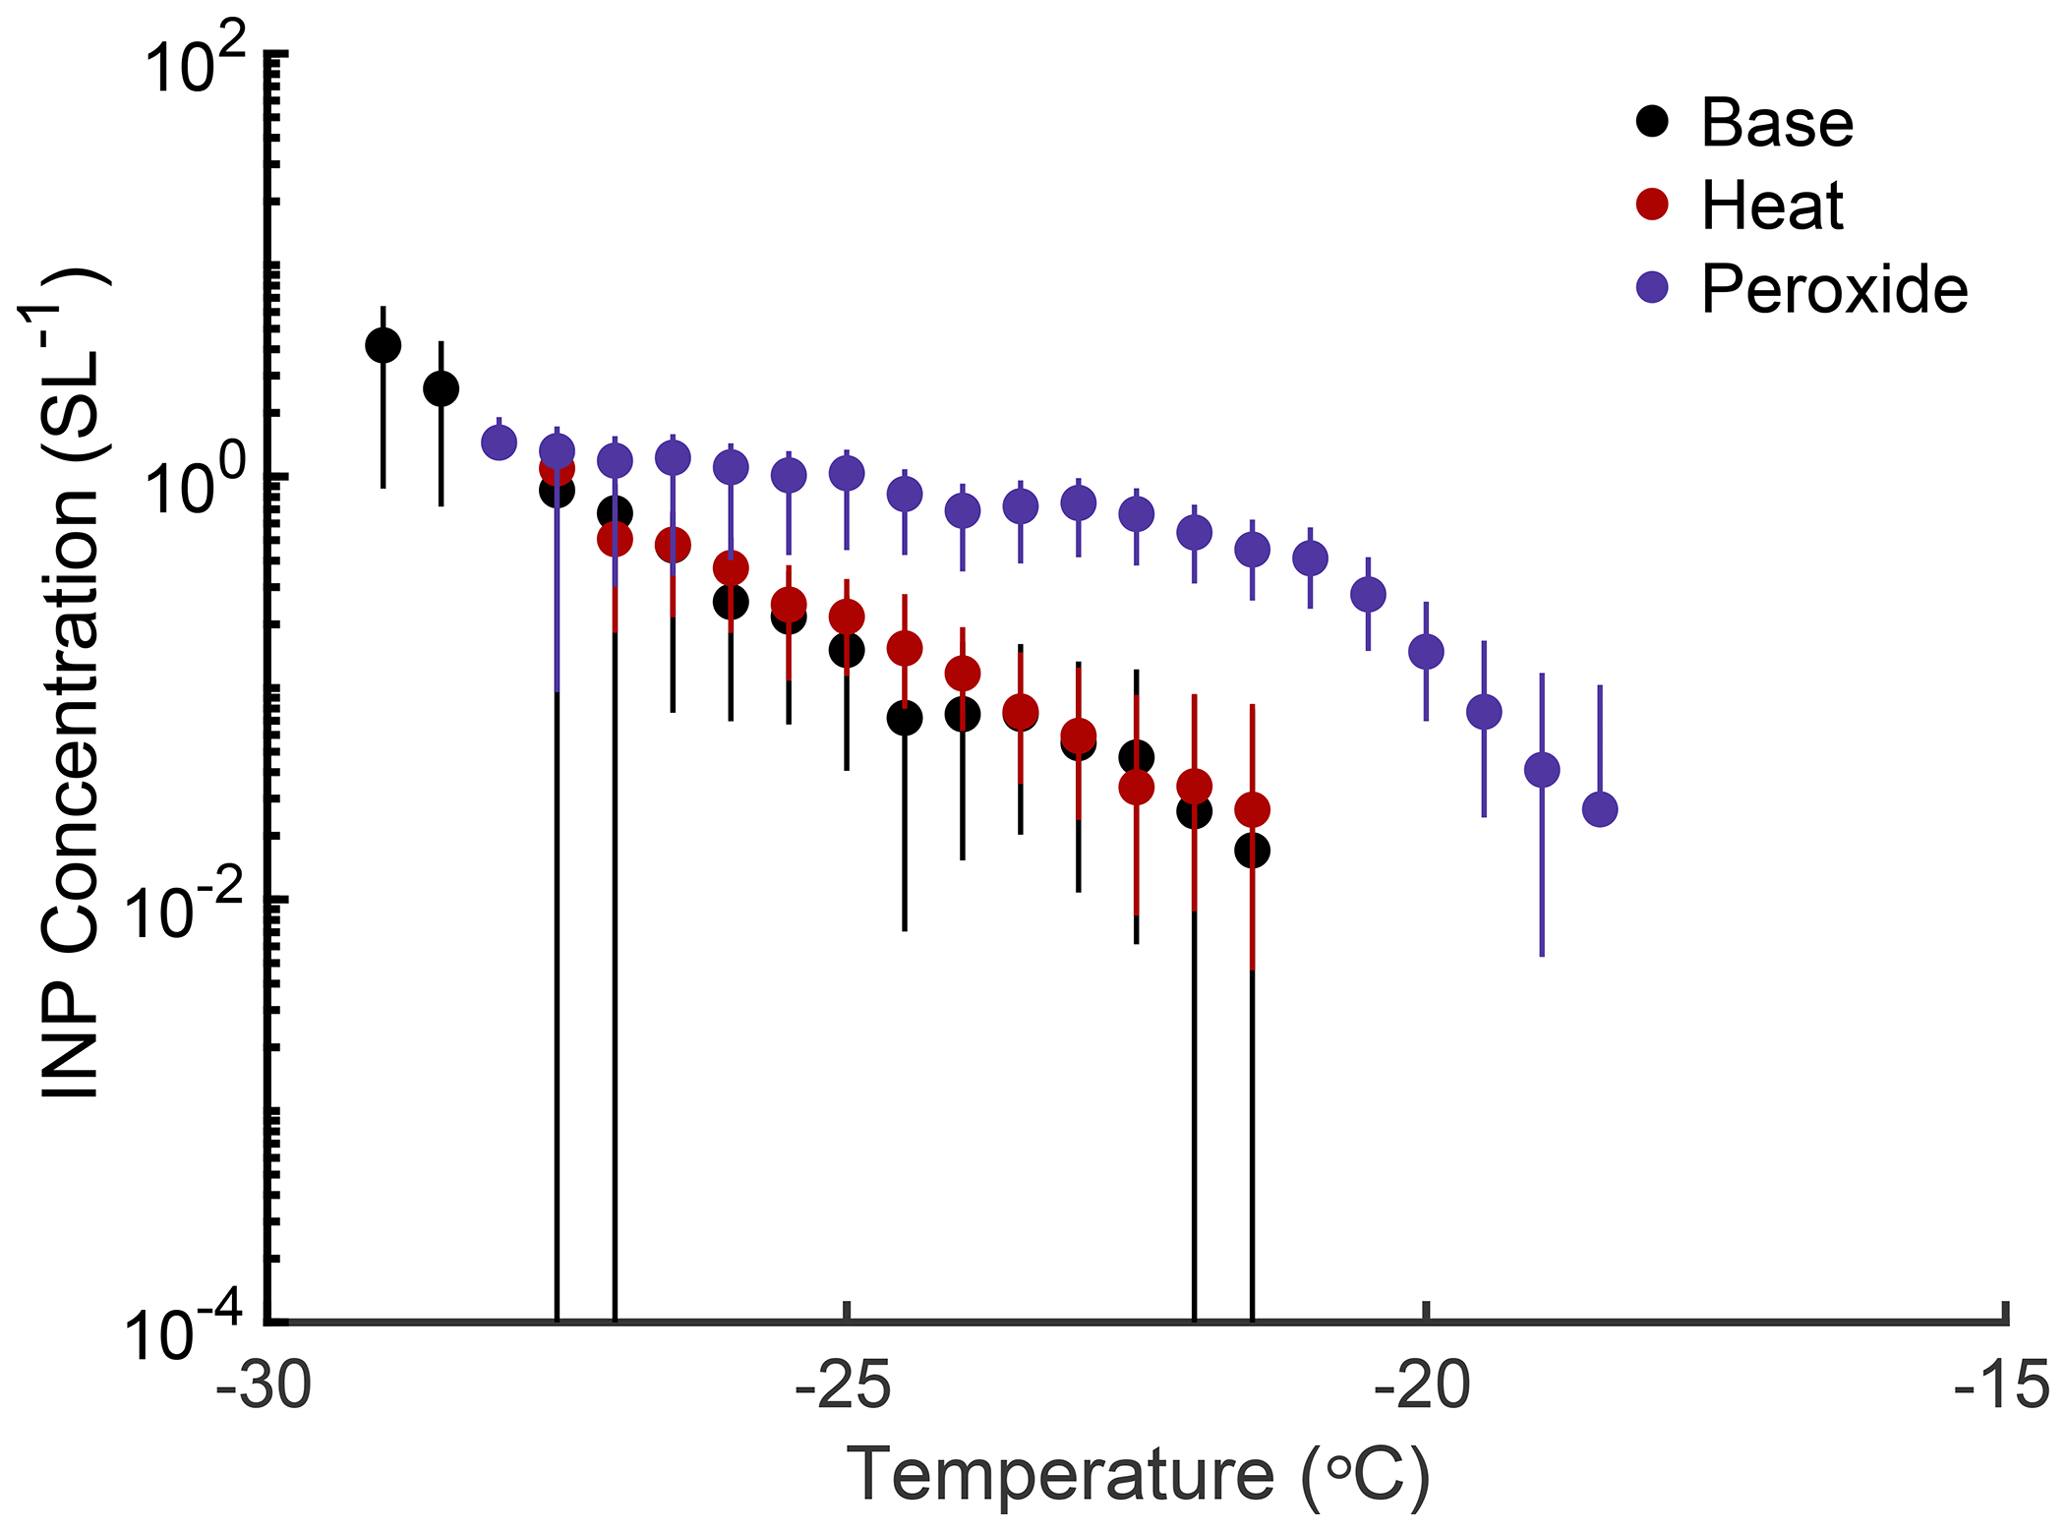
Figure A10An example IS filter temperature spectrum from 5 August 2022 (18.7 m s−1), with base measurements in black, heat-treated measurements in red, and peroxide-treated measurements in purple.
INP concentrations are often normalized by measured aerosol concentration in order to compare measurements among different aerosol types, locations, and collection methods or between lab, field, and model results. Normalization of INP concentrations with particle number, surface area, or volume concentration gives the activated fraction (Nn), surface active site density (Ns, Eq. B2), or volume active site density (Nv, Eq. B3), respectively. The activated fraction used in this study normalizes INP concentrations only by the number concentration of aerosols larger than 500 nm (n500), giving Nn500 (Eq. B1), as in several INP model parameterizations (e.g., DeMott et al., 2015; Tobo et al., 2013). Although surface active site density is typically abbreviated as ns, Ns is used throughout this paper to distinguish it from n500. In Eqs. (B1)–(B3), NINP is the INP concentration, T is temperature, n500 is the number concentration of aerosols larger than 500 nm, SAtot is the total aerosol surface area concentration, and Vtot is the total aerosol volume concentration.
Table C1Summary of the average (±1 standard deviation) percentage of core–shell INPs with solid, semisolid, and liquid shells emitted at different wind speeds (9.6, 16.3, 18.7, and 21.2 m s−1), as well as the average and range of viscoelastic response distances (VRDs) measured for particles with semisolid shells. Measurements were made at 20 % and 60 % RH.
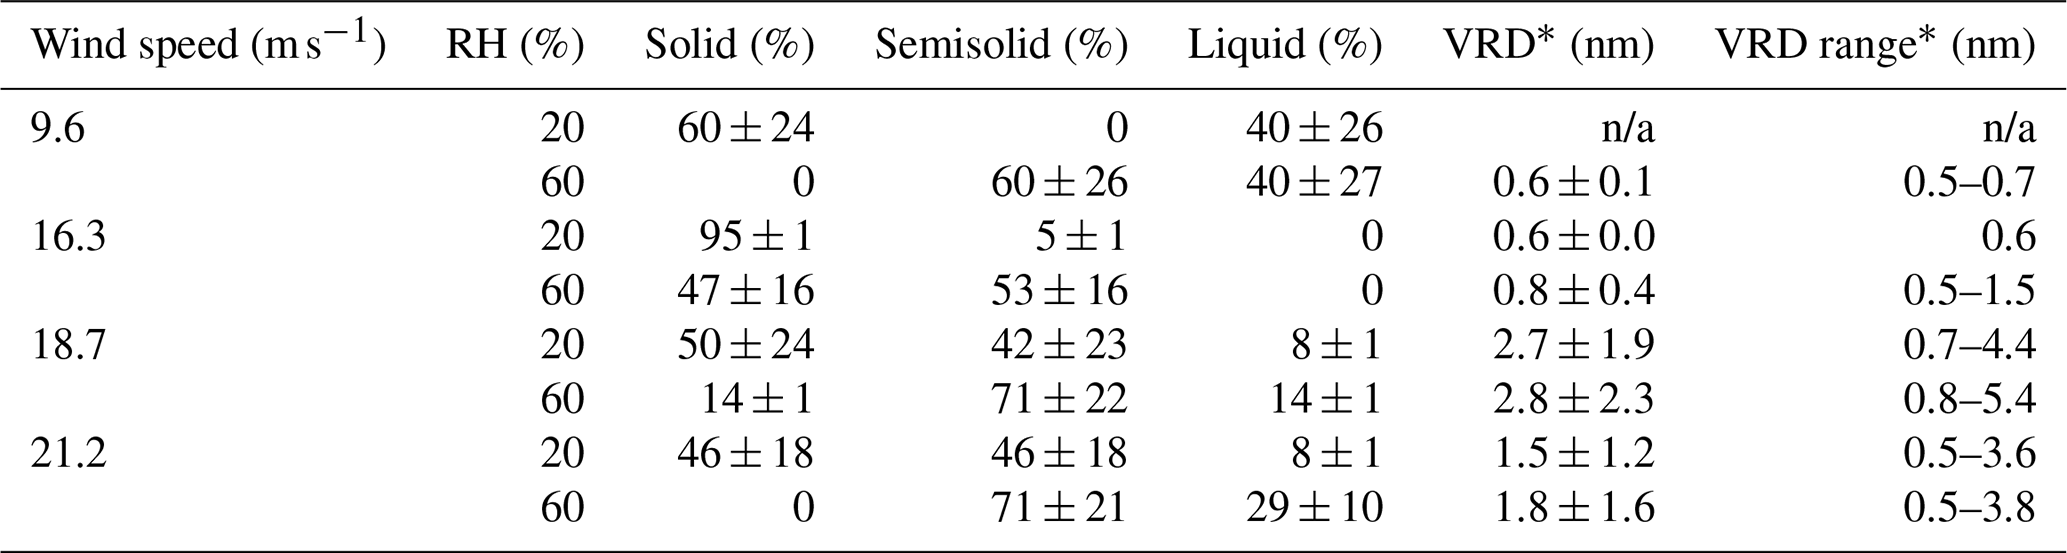
* Data reported only for core–shell particles with organic coatings classified as semisolid. n/a: not applicable.
Table C2Correction factors (and 95 % confidence bounds) for total particle number, number >500 nm diameter (n500), surface area, and volume concentrations measured by the CFDC OPC, which were derived by comparison with simultaneous (same wind speed) SEMS + APS measurements.
Data presented in this study are archived in the Dryad repository and are available at https://doi.org/10.5061/dryad.1jwstqk4z (Moore et al., 2025).
MDS, GBD, CL, and KAP designed the overall CHAOS campaign. KAM and PJD led the collection and processing of online INP measurements; KAM and TCJH led the collection and analysis of offline INP measurements, with assistance from SG. CKM and AVT led analyses and interpretation of AFM measurements of collected INPs. RJL III and CDC led the collection and analysis of supplementary aerosol measurements. KAM, CKM, and RJL III created figures. KAM led the writing and editing of this article, with contributions from all other authors.
The contact author has declared that none of the authors has any competing interests.
Any opinions, findings, and conclusions or recommendations expressed in this material are those of the authors and do not necessarily reflect the views of the National Science Foundation.
Publisher's note: Copernicus Publications remains neutral with regard to jurisdictional claims made in the text, published maps, institutional affiliations, or any other geographical representation in this paper. While Copernicus Publications makes every effort to include appropriate place names, the final responsibility lies with the authors.
The authors thank the entire CHAOS team for their hard work throughout the campaign. Particular thanks are due to Joseph Mayer, Robert Klidy, and the team at the Scripps Institution of Oceanography Marine Science Development Center for their engineering support. Thanks also go to Julie Dinasquet for providing seawater chemical and biological measurements during CHAOS and to Charbel Harb for estimates of the whitecap fraction in SOARS.
This work was funded by the National Science Foundation (NSF) through the NSF Center for Aerosol Impacts on Chemistry of the Environment (CAICE) (award CHE-1801971). Kathryn A. Moore also received support from an NSF Graduate Research Fellowship (grant no. 006784).
This paper was edited by Hang Su and reviewed by three anonymous referees.
Agresti, A. and Coull, B. A.: Approximate is better than “exact” for interval estimation of binomial proportions, Am. Stat., 52, 119, https://doi.org/10.2307/2685469, 1998. a
Alpert, P. A., Kilthau, W. P., O'Brien, R. E., Moffet, R. C., Gilles, M. K., Wang, B., Laskin, A., Aller, J. Y., and Knopf, D. A.: Ice-nucleating agents in sea spray aerosol identified and quantified with a holistic multimodal freezing model, Science Advances, 8, eabq6842, https://doi.org/10.1126/sciadv.abq6842, 2022. a, b, c, d, e
Andreae, M. O.: Aerosols before pollution, Science, 315, 50–51, https://doi.org/10.1126/science.1136529, 2007. a, b
Ault, A. P., Moffet, R. C., Baltrusaitis, J., Collins, D. B., Ruppel, M. J., Cuadra-Rodriguez, L. A., Zhao, D., Guasco, T. L., Ebben, C. J., Geiger, F. M., Bertram, T. H., Prather, K. A., and Grassian, V. H.: Size-dependent changes in sea spray aerosol composition and properties with different seawater conditions, Environ. Sci. Technol., 47, 5603–5612, https://doi.org/10.1021/es400416g, 2013. a
Barry, K. R., Hill, T. C. J., Jentzsch, C., Moffett, B. F., Stratmann, F., and DeMott, P. J.: Pragmatic protocols for working cleanly when measuring ice nucleating particles, Atmos. Res., 250, 105419, https://doi.org/10.1016/j.atmosres.2020.105419, 2021a. a
Barry, K. R., Hill, T. C. J., Levin, E. J. T., Twohy, C. H., Moore, K. A., Weller, Z. D., Toohey, D. W., Reeves, M., Campos, T., Geiss, R., Schill, G. P., Fischer, E. V., Kreidenweis, S. M., and DeMott, P. J.: Observations of ice nucleating particles in the free troposphere from western US wildfires, J. Geophys. Res.-Atmos., 126, e2020JD033752, https://doi.org/10.1029/2020JD033752, 2021b. a, b, c, d
Barry, K. R., Hill, T. C. J., Nieto-Caballero, M., Douglas, T. A., Kreidenweis, S. M., DeMott, P. J., and Creamean, J. M.: Active thermokarst regions contain rich sources of ice nucleating particles, EGUsphere [preprint], https://doi.org/10.5194/egusphere-2023-1208, 2023. a
Barthel, S., Tegen, I., and Wolke, R.: Do new sea spray aerosol source functions improve the results of a regional aerosol model?, Atmos. Environ., 198, 265–278, https://doi.org/10.1016/j.atmosenv.2018.10.016, 2019. a, b
Beall, C. M., Michaud, J. M., Fish, M. A., Dinasquet, J., Cornwell, G. C., Stokes, M. D., Burkart, M. D., Hill, T. C., DeMott, P. J., and Prather, K. A.: Cultivable halotolerant ice-nucleating bacteria and fungi in coastal precipitation, Atmos. Chem. Phys., 21, 9031–9045, https://doi.org/10.5194/acp-21-9031-2021, 2021. a
Beall, C. M., Hill, T. C. J., DeMott, P. J., Köneman, T., Pikridas, M., Drewnick, F., Harder, H., Pöhlker, C., Lelieveld, J., Weber, B., Iakovides, M., Prokeš, R., Sciare, J., Andreae, M. O., Stokes, M. D., and Prather, K. A.: Ice-nucleating particles near two major dust source regions, Atmos. Chem. Phys., 22, 12607–12627, https://doi.org/10.5194/acp-22-12607-2022, 2022. a, b, c, d
Bellouin, N., Quaas, J., Morcrette, J.-J., and Boucher, O.: Estimates of aerosol radiative forcing from the MACC re-analysis, Atmos. Chem. Phys., 13, 2045–2062, https://doi.org/10.5194/acp-13-2045-2013, 2013. a
Bigg, E.: Long-term trends in ice nucleus concentrations, Atmos. Res., 25, 409–415, https://doi.org/10.1016/0169-8095(90)90025-8, 1990. a
Bigg, E. K.: Ice nucleus concentrations in remote areas, J. Atmos. Sci., 30, 1153–1157, https://doi.org/10.1175/1520-0469(1973)030<1153:INCIRA>2.0.CO;2, 1973. a
Bjordal, J., Storelvmo, T., Alterskjær, K., and Carlsen, T.: Equilibrium climate sensitivity above 5 °C plausible due to state-dependent cloud feedback, Nat. Geosci., 13, 718–721, https://doi.org/10.1038/s41561-020-00649-1, 2020. a
Burrows, S. M., Hoose, C., Pöschl, U., and Lawrence, M. G.: Ice nuclei in marine air: biogenic particles or dust?, Atmos. Chem. Phys., 13, 245–267, https://doi.org/10.5194/acp-13-245-2013, 2013. a, b
Burrows, S. M., Easter, R. C., Liu, X., Ma, P.-L., Wang, H., Elliott, S. M., Singh, B., Zhang, K., and Rasch, P. J.: OCEANFILMS (Organic Compounds from Ecosystems to Aerosols: Natural Films and Interfaces via Langmuir Molecular Surfactants) sea spray organic aerosol emissions – implementation in a global climate model and impacts on clouds, Atmos. Chem. Phys., 22, 5223–5251, https://doi.org/10.5194/acp-22-5223-2022, 2022. a
Cappa, C. D., Asadi, S., Barreda, S., Wexler, A. S., Bouvier, N. M., and Ristenpart, W. D.: Expiratory aerosol particle escape from surgical masks due to imperfect sealing, Sci. Rep.-UK, 11, 12110, https://doi.org/10.1038/s41598-021-91487-7, 2021. a
Cappa, C. D., Ristenpart, W. D., Barreda, S., Bouvier, N. M., Levintal, E., Wexler, A. S., and Roman, S. A.: A Highly efficient cloth facemask design, Aerosol Sci. Tech., 56, 12–28, https://doi.org/10.1080/02786826.2021.1962795, 2022. a
Carslaw, K. S., Lee, L. A., Reddington, C. L., Pringle, K. J., Rap, A., Forster, P. M., Mann, G. W., Spracklen, D. V., Woodhouse, M. T., Regayre, L. A., and Pierce, J. R.: Large contribution of natural aerosols to uncertainty in indirect forcing, Nature, 503, 67–71, https://doi.org/10.1038/nature12674, 2013. a
Carslaw, K. S., Gordon, H., Hamilton, D. S., Johnson, J. S., Regayre, L. A., Yoshioka, M., and Pringle, K. J.: Aerosols in the pre-industrial atmosphere, Current Climate Change Reports, 3, 1–15, https://doi.org/10.1007/s40641-017-0061-2, 2017. a
Cesana, G. and Storelvmo, T.: Improving climate projections by understanding how cloud phase affects radiation, J. Geophys. Res.-Atmos., 122, 4594–4599, https://doi.org/10.1002/2017JD026927, 2017. a
Chen, S., Qiao, F., Jiang, W., Guo, J., and Dai, D.: Impact of surface waves on wind stress under low to moderate wind conditions, J. Phys. Oceanogr., 49, 2017–2028, https://doi.org/10.1175/JPO-D-18-0266.1, 2019. a
Chin, W.-C., Orellana, M. V., and Verdugo, P.: Spontaneous assembly of marine dissolved organic matter into polymer gels, Nature, 391, 568–572, https://doi.org/10.1038/35345, 1998. a
Christiansen, S., Salter, M. E., Gorokhova, E., Nguyen, Q. T., and Bilde, M.: Sea spray aerosol formation: laboratory results on the role of air entrainment, water temperature, and phytoplankton biomass, Environ. Sci. Technol., 53, 13107–13116, https://doi.org/10.1021/acs.est.9b04078, 2019. a, b
Cochran, R. E., Ryder, O. S., Grassian, V. H., and Prather, K. A.: Sea spray aerosol: the chemical link between the oceans, atmosphere, and climate, Accounts Chem. Res., 50, 599–604, https://doi.org/10.1021/acs.accounts.6b00603, 2017. a
Creamean, J. M., Cross, J. N., Pickart, R., McRaven, L., Lin, P., Pacini, A., Hanlon, R., Schmale, D. G., Ceniceros, J., Aydell, T., Colombi, N., Bolger, E., and DeMott, P. J.: Ice nucleating particles carried from below a phytoplankton bloom to the arctic atmosphere, Geophys. Res. Lett., 46, 8572–8581, https://doi.org/10.1029/2019GL083039, 2019. a, b
de Leeuw, G., Andreas, E. L., Anguelova, M. D., Fairall, C. W., Lewis, E. R., O'Dowd, C., Schulz, M., and Schwartz, S. E.: Production flux of sea spray aerosol, Rev. Geophys., 49, RG2001, https://doi.org/10.1029/2010RG000349, 2011. a, b, c, d, e
Deike, L., Reichl, B. G., and Paulot, F.: A mechanistic sea spray generation function based on the sea state and the physics of bubble bursting, AGU Advances, 3, e2022AV000750, https://doi.org/10.1029/2022AV000750, 2022. a, b
DeMott, P. J., Prenni, A. J., McMeeking, G. R., Sullivan, R. C., Petters, M. D., Tobo, Y., Niemand, M., Möhler, O., Snider, J. R., Wang, Z., and Kreidenweis, S. M.: Integrating laboratory and field data to quantify the immersion freezing ice nucleation activity of mineral dust particles, Atmos. Chem. Phys., 15, 393–409, https://doi.org/10.5194/acp-15-393-2015, 2015. a, b, c, d, e
DeMott, P. J., Hill, T. C. J., McCluskey, C. S., Prather, K. A., Collins, D. B., Sullivan, R. C., Ruppel, M. J., Mason, R. H., Irish, V. E., Lee, T., Hwang, C. Y., Rhee, T. S., Snider, J. R., McMeeking, G. R., Dhaniyala, S., Lewis, E. R., Wentzell, J. J. B., Abbatt, J. P. D., Lee, C., Sultana, C. M., Ault, A. P., Axson, J. L., Diaz Martinez, M., Venero, I., Santos-Figueroa, G., Stokes, M. D., Deane, G. B., Mayol-Bracero, O. L., Grassian, V. H., Bertram, T. H., Bertram, A. K., Moffett, B. F., and Franc, G. D.: Sea spray aerosol as a unique source of ice nucleating particles, P. Natl. Acad. Sci. USA, 113, 5797–5803, https://doi.org/10.1073/pnas.1514034112, 2016. a, b, c, d, e, f, g
DeMott, P. J., Hill, T. C. J., Petters, M. D., Bertram, A. K., Tobo, Y., Mason, R. H., Suski, K. J., McCluskey, C. S., Levin, E. J. T., Schill, G. P., Boose, Y., Rauker, A. M., Miller, A. J., Zaragoza, J., Rocci, K., Rothfuss, N. E., Taylor, H. P., Hader, J. D., Chou, C., Huffman, J. A., Pöschl, U., Prenni, A. J., and Kreidenweis, S. M.: Comparative measurements of ambient atmospheric concentrations of ice nucleating particles using multiple immersion freezing methods and a continuous flow diffusion chamber, Atmos. Chem. Phys., 17, 11227–11245, https://doi.org/10.5194/acp-17-11227-2017, 2017. a, b
DeMott, P. J., Möhler, O., Cziczo, D. J., Hiranuma, N., Petters, M. D., Petters, S. S., Belosi, F., Bingemer, H. G., Brooks, S. D., Budke, C., Burkert-Kohn, M., Collier, K. N., Danielczok, A., Eppers, O., Felgitsch, L., Garimella, S., Grothe, H., Herenz, P., Hill, T. C. J., Höhler, K., Kanji, Z. A., Kiselev, A., Koop, T., Kristensen, T. B., Krüger, K., Kulkarni, G., Levin, E. J. T., Murray, B. J., Nicosia, A., O'Sullivan, D., Peckhaus, A., Polen, M. J., Price, H. C., Reicher, N., Rothenberg, D. A., Rudich, Y., Santachiara, G., Schiebel, T., Schrod, J., Seifried, T. M., Stratmann, F., Sullivan, R. C., Suski, K. J., Szakáll, M., Taylor, H. P., Ullrich, R., Vergara-Temprado, J., Wagner, R., Whale, T. F., Weber, D., Welti, A., Wilson, T. W., Wolf, M. J., and Zenker, J.: The Fifth International Workshop on Ice Nucleation phase 2 (FIN-02): laboratory intercomparison of ice nucleation measurements, Atmos. Meas. Tech., 11, 6231–6257, https://doi.org/10.5194/amt-11-6231-2018, 2018. a, b
DeMott, P. J., Hill, T. C. J., Moore, K. A., Perkins, R. J., Mael, L. E., Busse, H. L., Lee, H., Kaluarachchi, C. P., Mayer, K. J., Sauer, J. S., Mitts, B. A., Tivanski, A. V., Grassian, V. H., Cappa, C. D., Bertram, T. H., and Prather, K. A.: Atmospheric oxidation impact on sea spray produced ice nucleating particles, Environmental Science: Atmospheres, 3, 1513–1532, https://doi.org/10.1039/D3EA00060E, 2023. a, b, c, d
Engel, A., Bange, H. W., Cunliffe, M., Burrows, S. M., Friedrichs, G., Galgani, L., Herrmann, H., Hertkorn, N., Johnson, M., Liss, P. S., Quinn, P. K., Schartau, M., Soloviev, A., Stolle, C., Upstill-Goddard, R. C., van Pinxteren, M., and Zäncker, B.: The ocean's vital skin: toward an integrated understanding of the sea surface microlayer, Frontiers in Marine Science, 4, 165, https://doi.org/10.3389/fmars.2017.00165, 2017. a
Fall, R. and Schnell, R. C.: Association of an ice-nucleating pseudomonad with cultures of the marine dinoflagellate, Heterocapsa niei, J. Mar. Res., 43, https://elischolar.library.yale.edu/journal_of_marine_research/1773, 1985. a
Forestieri, S. D., Moore, K. A., Borrero, R. M., Wang, A., Stokes, M. D., and Cappa, C. D.: Temperature and composition dependence of sea spray aerosol production, Geophys. Res. Lett., 45, 7218–7225, https://doi.org/10.1029/2018GL078193, 2018. a, b
Forster, P., Storelvmo, T., Armour, K., Collins, W., Dufresne, J.-L., Frame, D., Lunt, D. J., Mauritsen, T., Palmer, M. D., Watanabe, M., Wild, M., and Zhang, X.: The earth's energy budget, climate feedbacks, and climate sensitivity, in: Climate Change 2021: The Physical Science Basis. Contribution of Working Group I to the Sixth Assessment Report of the Intergovernmental Panel on Climate Change, edited by: Masson-Delmotte, V., Zhai, P., Pirani, A., Connors, S. L., Péan, C., Berger, S., Caud, N., Chen, Y., Goldfarb, L., Gomis, M. I., Huang, M., Leitzell, K., Lonnoy, E., Matthews, J. B. R., Maycock, T. K., Waterfield, T., Yelekçi, Ö., Yu, R., and Zhou, B., Cambridge University Press, Cambridge, UK and New York, NY, USA, https://doi.org/10.1017/9781009157896.001, 923–1054, 2021. a
Freitas, G. P., Stolle, C., Kaye, P. H., Stanley, W., Herlemann, D. P. R., Salter, M. E., and Zieger, P.: Emission of primary bioaerosol particles from baltic seawater, Environmental Science: Atmospheres, 2, 1170–1182, https://doi.org/10.1039/D2EA00047D, 2022. a
Freitas, G. P., Adachi, K., Conen, F., Heslin-Rees, D., Krejci, R., Tobo, Y., Yttri, K. E., and Zieger, P.: Regionally sourced bioaerosols drive high-temperature ice nucleating particles in the Arctic, Nat. Commun., 14, 5997, https://doi.org/10.1038/s41467-023-41696-7, 2023. a, b
Fröhlich-Nowoisky, J., Hill, T. C. J., Pummer, B. G., Yordanova, P., Franc, G. D., and Pöschl, U.: Ice nucleation activity in the widespread soil fungus Mortierella alpina, Biogeosciences, 12, 1057–1071, https://doi.org/10.5194/bg-12-1057-2015, 2015. a
Fuentes, E., Coe, H., Green, D., de Leeuw, G., and McFiggans, G.: On the impacts of phytoplankton-derived organic matter on the properties of the primary marine aerosol – Part 1: Source fluxes, Atmos. Chem. Phys., 10, 9295–9317, https://doi.org/10.5194/acp-10-9295-2010, 2010. a
Gong, S. L.: A parameterization of sea-salt aerosol source function for sub- and super-micron particles, Global Biogeochem. Cy., 17, 1097, https://doi.org/10.1029/2003GB002079, 2003. a
Gong, X., Wex, H., van Pinxteren, M., Triesch, N., Fomba, K. W., Lubitz, J., Stolle, C., Robinson, T.-B., Müller, T., Herrmann, H., and Stratmann, F.: Characterization of aerosol particles at Cabo Verde close to sea level and at the cloud level – Part 2: Ice-nucleating particles in air, cloud and seawater, Atmos. Chem. Phys., 20, 1451–1468, https://doi.org/10.5194/acp-20-1451-2020, 2020. a, b, c, d
Gryspeerdt, E., Povey, A. C., Grainger, R. G., Hasekamp, O., Hsu, N. C., Mulcahy, J. P., Sayer, A. M., and Sorooshian, A.: Uncertainty in aerosol–cloud radiative forcing is driven by clean conditions, Atmos. Chem. Phys., 23, 4115–4122, https://doi.org/10.5194/acp-23-4115-2023, 2023. a
Grythe, H., Ström, J., Krejci, R., Quinn, P., and Stohl, A.: A review of sea-spray aerosol source functions using a large global set of sea salt aerosol concentration measurements, Atmos. Chem. Phys., 14, 1277–1297, https://doi.org/10.5194/acp-14-1277-2014, 2014. a, b, c, d
Hartery, S., Toohey, D., Revell, L., Sellegri, K., Kuma, P., Harvey, M., and McDonald, A. J.: Constraining the surface flux of sea spray particles from the Southern Ocean, J. Geophys. Res.-Atmos., 125, e2019JD032026, https://doi.org/10.1029/2019JD032026, 2020. a
Hartmann, M., Adachi, K., Eppers, O., Haas, C., Herber, A., Holzinger, R., Hünerbein, A., Jäkel, E., Jentzsch, C., van Pinxteren, M., Wex, H., Willmes, S., and Stratmann, F.: Wintertime airborne measurements of ice nucleating particles in the high Arctic: a hint to a marine, biogenic source for ice nucleating particles, Geophys. Res. Lett., 47, e2020GL087770, https://doi.org/10.1029/2020GL087770, 2020. a, b, c, d, e
Hartmann, M., Gong, X., Kecorius, S., van Pinxteren, M., Vogl, T., Welti, A., Wex, H., Zeppenfeld, S., Herrmann, H., Wiedensohler, A., and Stratmann, F.: Terrestrial or marine – indications towards the origin of ice-nucleating particles during melt season in the European Arctic up to 83.7° N, Atmos. Chem. Phys., 21, 11613–11636, https://doi.org/10.5194/acp-21-11613-2021, 2021. a, b, c, d, e, f
Heinze, C., Eyring, V., Friedlingstein, P., Jones, C., Balkanski, Y., Collins, W., Fichefet, T., Gao, S., Hall, A., Ivanova, D., Knorr, W., Knutti, R., Löw, A., Ponater, M., Schultz, M. G., Schulz, M., Siebesma, P., Teixeira, J., Tselioudis, G., and Vancoppenolle, M.: ESD Reviews: Climate feedbacks in the Earth system and prospects for their evaluation, Earth Syst. Dynam., 10, 379–452, https://doi.org/10.5194/esd-10-379-2019, 2019. a
Hill, T. C. J., DeMott, P. J., Tobo, Y., Fröhlich-Nowoisky, J., Moffett, B. F., Franc, G. D., and Kreidenweis, S. M.: Sources of organic ice nucleating particles in soils, Atmos. Chem. Phys., 16, 7195–7211, https://doi.org/10.5194/acp-16-7195-2016, 2016. a, b, c
Hill, T. C. J., Malfatti, F., McCluskey, C. S., Schill, G. P., Santander, M. V., Moore, K. A., Rauker, A. M., Perkins, R. J., Celussi, M., Levin, E. J. T., Suski, K. J., Cornwell, G. C., Lee, C., Negro, P. D., Kreidenweis, S. M., Prather, K. A., and DeMott, P. J.: Resolving the controls over the production and emission of ice-nucleating particles in sea spray, Environmental Science: Atmospheres, 3, 970–990, https://doi.org/10.1039/D2EA00154C, 2023. a, b, c
Hiranuma, N., Augustin-Bauditz, S., Bingemer, H., Budke, C., Curtius, J., Danielczok, A., Diehl, K., Dreischmeier, K., Ebert, M., Frank, F., Hoffmann, N., Kandler, K., Kiselev, A., Koop, T., Leisner, T., Möhler, O., Nillius, B., Peckhaus, A., Rose, D., Weinbruch, S., Wex, H., Boose, Y., DeMott, P. J., Hader, J. D., Hill, T. C. J., Kanji, Z. A., Kulkarni, G., Levin, E. J. T., McCluskey, C. S., Murakami, M., Murray, B. J., Niedermeier, D., Petters, M. D., O'Sullivan, D., Saito, A., Schill, G. P., Tajiri, T., Tolbert, M. A., Welti, A., Whale, T. F., Wright, T. P., and Yamashita, K.: A comprehensive laboratory study on the immersion freezing behavior of illite NX particles: a comparison of 17 ice nucleation measurement techniques, Atmos. Chem. Phys., 15, 2489–2518, https://doi.org/10.5194/acp-15-2489-2015, 2015. a
Hsu, S. A., Meindl, E. A., and Gilhousen, D. B.: Determining the power-law wind-profile exponent under near-neutral stability conditions at sea, J. Appl. Meteorol. Clim., 33, 757–765, https://doi.org/10.1175/1520-0450(1994)033<0757:DTPLWP>2.0.CO;2, 1994. a
Huang, W. T. K., Ickes, L., Tegen, I., Rinaldi, M., Ceburnis, D., and Lohmann, U.: Global relevance of marine organic aerosol as ice nucleating particles, Atmos. Chem. Phys., 18, 11423–11445, https://doi.org/10.5194/acp-18-11423-2018, 2018. a, b
Ickes, L., Porter, G. C. E., Wagner, R., Adams, M. P., Bierbauer, S., Bertram, A. K., Bilde, M., Christiansen, S., Ekman, A. M. L., Gorokhova, E., Höhler, K., Kiselev, A. A., Leck, C., Möhler, O., Murray, B. J., Schiebel, T., Ullrich, R., and Salter, M. E.: The ice-nucleating activity of Arctic sea surface microlayer samples and marine algal cultures, Atmos. Chem. Phys., 20, 11089–11117, https://doi.org/10.5194/acp-20-11089-2020, 2020. a, b, c, d, e, f
Irish, V. E., Elizondo, P., Chen, J., Chou, C., Charette, J., Lizotte, M., Ladino, L. A., Wilson, T. W., Gosselin, M., Murray, B. J., Polishchuk, E., Abbatt, J. P. D., Miller, L. A., and Bertram, A. K.: Ice-nucleating particles in Canadian Arctic sea-surface microlayer and bulk seawater, Atmos. Chem. Phys., 17, 10583–10595, https://doi.org/10.5194/acp-17-10583-2017, 2017. a, b, c, d, e
Irish, V. E., Hanna, S. J., Willis, M. D., China, S., Thomas, J. L., Wentzell, J. J. B., Cirisan, A., Si, M., Leaitch, W. R., Murphy, J. G., Abbatt, J. P. D., Laskin, A., Girard, E., and Bertram, A. K.: Ice nucleating particles in the marine boundary layer in the Canadian Arctic during summer 2014, Atmos. Chem. Phys., 19, 1027–1039, https://doi.org/10.5194/acp-19-1027-2019, 2019. a
Jaeglé, L., Quinn, P. K., Bates, T. S., Alexander, B., and Lin, J.-T.: Global distribution of sea salt aerosols: new constraints from in situ and remote sensing observations, Atmos. Chem. Phys., 11, 3137–3157, https://doi.org/10.5194/acp-11-3137-2011, 2011. a, b
Jio, D. A.: An Examination of the Seawater Aquarium System at Scripps Institution of Oceanography, MS thesis, UC San Diego, ProQuest ID: Jio_ucsd_0033M_21775, Merritt ID: ark:/13030/m5x426c9, retrieved from: https://escholarship.org/uc/item/3vg6j3qr (last access: 26 February 2025), 2022. a, b
Johnson, J. S., Regayre, L. A., Yoshioka, M., Pringle, K. J., Turnock, S. T., Browse, J., Sexton, D. M. H., Rostron, J. W., Schutgens, N. A. J., Partridge, D. G., Liu, D., Allan, J. D., Coe, H., Ding, A., Cohen, D. D., Atanacio, A., Vakkari, V., Asmi, E., and Carslaw, K. S.: Robust observational constraint of uncertain aerosol processes and emissions in a climate model and the effect on aerosol radiative forcing, Atmos. Chem. Phys., 20, 9491–9524, https://doi.org/10.5194/acp-20-9491-2020, 2020. a
Kaluarachchi, C. P., Or, V. W., Lan, Y., Hasenecz, E. S., Kim, D., Madawala, C. K., Dorcé, G. P., Mayer, K. J., Sauer, J. S., Lee, C., Cappa, C. D., Bertram, T. H., Stone, E. A., Prather, K. A., Grassian, V. H., and Tivanski, A. V.: Effects of atmospheric aging processes on nascent sea spray aerosol physicochemical properties, ACS Earth and Space Chemistry, 6, 2732–2744, https://doi.org/10.1021/acsearthspacechem.2c00258, 2022a. a, b, c, d
Kaluarachchi, C. P., Or, V. W., Lan, Y., Madawala, C. K., Hasenecz, E. S., Crocker, D. R., Morris, C. K., Lee, H. D., Mayer, K. J., Sauer, J. S., Lee, C., Dorce, G., Malfatti, F., Stone, E. A., Cappa, C. D., Grassian, V. H., Prather, K. A., and Tivanski, A. V.: Size-dependent morphology, composition, phase state, and water uptake of nascent submicrometer sea spray aerosols during a phytoplankton bloom, ACS Earth and Space Chemistry, 6, 116–130, https://doi.org/10.1021/acsearthspacechem.1c00306, 2022b. a, b, c
Kanji, Z. A., Ladino, L. A., Wex, H., Boose, Y., Burkert-Kohn, M., Cziczo, D. J., and Krämer, M.: Overview of ice nucleating particles, Meteor. Mon., 58, 1.1–1.33, https://doi.org/10.1175/AMSMONOGRAPHS-D-16-0006.1, 2017. a, b, c
Kawana, K., Taketani, F., Matsumoto, K., Tobo, Y., Iwamoto, Y., Miyakawa, T., Ito, A., and Kanaya, Y.: Roles of marine biota in the formation of atmospheric bioaerosols, cloud condensation nuclei, and ice-nucleating particles over the North Pacific Ocean, Bering Sea, and Arctic Ocean, Atmos. Chem. Phys., 24, 1777–1799, https://doi.org/10.5194/acp-24-1777-2024, 2024. a
Knopf, D. A., Alpert, P. A., Wang, B., and Aller, J. Y.: Stimulation of ice nucleation by marine diatoms, Nat. Geosci., 4, 88–90, https://doi.org/10.1038/ngeo1037, 2011. a, b, c, d, e
Krishnamoorthy, K. and Lee, M.: New approximate confidence intervals for the difference between two Poisson means and comparison, J. Stat. Comput. Sim., 83, 2232–2243, https://doi.org/10.1080/00949655.2012.686616, 2012. a
Ladino, L. A., Yakobi-Hancock, J. D., Kilthau, W. P., Mason, R. H., Si, M., Li, J., Miller, L. A., Schiller, C. L., Huffman, J. A., Aller, J. Y., Knopf, D. A., Bertram, A. K., and Abbatt, J. P. D.: Addressing the ice nucleating abilities of marine aerosol: a combination of deposition mode laboratory and field measurements, Atmos. Environ., 132, 1–10, https://doi.org/10.1016/j.atmosenv.2016.02.028, 2016. a, b, c
Lamont-Smith, T. and Waseda, T.: Wind wave growth at short fetch, J. Phys. Oceanogr., 38, 1597–1606, https://doi.org/10.1175/2007JPO3712.1, 2008. a
Lapere, R., Thomas, J. L., Marelle, L., Ekman, A. M. L., Frey, M. M., Lund, M. T., Makkonen, R., Ranjithkumar, A., Salter, M. E., Samset, B. H., Schulz, M., Sogacheva, L., Yang, X., and Zieger, P.: The representation of sea salt aerosols and their role in polar climate within CMIP6, J. Geophys. Res.-Atmos., 128, e2022JD038235, https://doi.org/10.1029/2022JD038235, 2023. a
Lee, H. D., Ray, K. K., and Tivanski, A. V.: Solid, semisolid, and liquid phase states of individual submicrometer particles directly probed using atomic force microscopy, Anal. Chem., 89, 12720–12726, https://doi.org/10.1021/acs.analchem.7b02755, 2017. a, b, c, d, e, f
Lee, H. D., Morris, H. S., Laskina, O., Sultana, C. M., Lee, C., Jayarathne, T., Cox, J. L., Wang, X., Hasenecz, E. S., DeMott, P. J., Bertram, T. H., Cappa, C. D., Stone, E. A., Prather, K. A., Grassian, V. H., and Tivanski, A. V.: Organic enrichment, physical phase state, and surface tension depression of nascent core–shell sea spray aerosols during two phytoplankton blooms, ACS Earth and Space Chemistry, 4, 650–660, https://doi.org/10.1021/acsearthspacechem.0c00032, 2020. a, b, c, d, e, f, g
Lewis, E. R. and Schwartz, S. E.: Sea Salt Aerosol Production: Mechanisms, Methods, Measurements and Models—A Critical Review, vol. 152 of Geophysical Monograph, American Geophysical Union, Washington, DC, Print ISBN: 9780875904177, Online ISBN: 9781118666050, https://doi.org/10.1029/GM152, 2004. a, b, c, d, e, f
Lin, Y., Fan, J., Li, P., Leung, L.-R., DeMott, P. J., Goldberger, L., Comstock, J., Liu, Y., Jeong, J.-H., and Tomlinson, J.: Modeling impacts of ice-nucleating particles from marine aerosols on mixed-phase orographic clouds during 2015 ACAPEX field campaign, Atmos. Chem. Phys., 22, 6749–6771, https://doi.org/10.5194/acp-22-6749-2022, 2022. a
Liu, S., Liu, C.-C., Froyd, K. D., Schill, G. P., Murphy, D. M., Bui, T. P., Dean-Day, J. M., Weinzierl, B., Dollner, M., Diskin, G. S., Chen, G., and Gao, R.-S.: Sea spray aerosol concentration modulated by sea surface temperature, P. Natl. Acad. Sci. USA, 118, e2020583118, https://doi.org/10.1073/pnas.2020583118, 2021. a
Madawala, C. K., Lee, H. D., Kaluarachchi, C. P., and Tivanski, A. V.: Probing the water uptake and phase state of individual sucrose nanoparticles using atomic force microscopy, ACS Earth and Space Chemistry, 5, 2612–2620, https://doi.org/10.1021/acsearthspacechem.1c00101, 2021. a, b, c
Madawala, C. K., Molina, C., Kim, D., Gamage, D. K., Sun, M., Leibensperger, R. J. I., Mehndiratta, L., Lee, J., Kaluarachchi, C. P., Kimble, K. A., Sandstrom, G., Harb, C., Dinasquet, J., Malfatti, F., Prather, K. A., Deane, G. B., Stokes, M. D., Lee, C., Slade, J. H., Stone, E. A., Grassian, V. H., and Tivanski, A. V.: Effects of wind speed on size-dependent morphology and composition of sea spray aerosols, ACS Earth Space Chem., 8, 1609–1622, https://doi.org/10.1021/acsearthspacechem.4c00119, 2024. a, b
Mårtensson, E. M., Nilsson, E. D., de Leeuw, G., Cohen, L. H., and Hansson, H.-C.: Laboratory simulations and parameterization of the primary marine aerosol production, J. Geophys. Res.-Atmos., 108, 4297, https://doi.org/10.1029/2002JD002263, 2003. a, b, c
May, N. W., Axson, J. L., Watson, A., Pratt, K. A., and Ault, A. P.: Lake spray aerosol generation: a method for producing representative particles from freshwater wave breaking, Atmos. Meas. Tech., 9, 4311–4325, https://doi.org/10.5194/amt-9-4311-2016, 2016. a
Mayer, K. J., Wang, X., Santander, M. V., Mitts, B. A., Sauer, J. S., Sultana, C. M., Cappa, C. D., and Prather, K. A.: Secondary marine aerosol plays a dominant role over primary sea spray aerosol in cloud formation, ACS Central Science, 6, 2259–2266, https://doi.org/10.1021/acscentsci.0c00793, 2020. a
McCluskey, C. S., DeMott, P. J., Prenni, A. J., Levin, E. J. T., McMeeking, G. R., Sullivan, A. P., Hill, T. C. J., Nakao, S., Carrico, C. M., and Kreidenweis, S. M.: Characteristics of atmospheric ice nucleating particles associated with biomass burning in the US: prescribed burns and wildfires, J. Geophys. Res.-Atmos., 119, 10458–10470, https://doi.org/10.1002/2014JD021980, 2014. a
McCluskey, C. S., Hill, T. C. J., Humphries, R. S., Rauker, A. M., Moreau, S., Strutton, P. G., Chambers, S. D., Williams, A. G., McRobert, I., Ward, J., Keywood, M. D., Harnwell, J., Ponsonby, W., Loh, Z. M., Krummel, P. B., Protat, A., Kreidenweis, S. M., and DeMott, P. J.: Observations of ice nucleating particles over Southern Ocean waters, Geophys. Res. Lett., 45, 11989–11997, https://doi.org/10.1029/2018GL079981, 2018a. a, b, c, d, e, f, g, h
McCluskey, C. S., Hill, T. C. J., Sultana, C. M., Laskina, O., Trueblood, J., Santander, M. V., Beall, C. M., Michaud, J. M., Kreidenweis, S. M., Prather, K. A., Grassian, V., and DeMott, P. J.: A Mesocosm double feature: insights into the chemical makeup of marine ice nucleating particles, J. Atmos. Sci., 75, 2405–2423, https://doi.org/10.1175/JAS-D-17-0155.1, 2018b. a, b, c, d, e, f, g, h, i, j, k
McCluskey, C. S., Ovadnevaite, J., Rinaldi, M., Atkinson, J., Belosi, F., Ceburnis, D., Marullo, S., Hill, T. C. J., Lohmann, U., Kanji, Z. A., O'Dowd, C., Kreidenweis, S. M., and DeMott, P. J.: Marine and terrestrial organic ice-nucleating particles in pristine marine to continentally influenced Northeast Atlantic air masses, J. Geophys. Res.-Atmos., 123, 6196–6212, https://doi.org/10.1029/2017JD028033, 2018c. a, b, c, d, e, f, g, h
McCluskey, C. S., DeMott, P. J., Ma, P.-L., and Burrows, S. M.: Numerical representations of marine ice-nucleating particles in remote marine environments evaluated against observations, Geophys. Res. Lett., 46, 7838–7847, https://doi.org/10.1029/2018GL081861, 2019. a, b, c
McCluskey, C. S., Gettelman, A., Bardeen, C. G., DeMott, P. J., Moore, K. A., Kreidenweis, S. M., Hill, T. C. J., Barry, K. R., Twohy, C. H., Toohey, D. W., Rainwater, B., Jensen, J. B., Reeves, J. M., Alexander, S. P., and McFarquhar, G. M.: Simulating Southern Ocean aerosol and ice nucleating particles in the community earth system model version 2, J. Geophys. Res.-Atmos., 128, e2022JD036955, https://doi.org/10.1029/2022JD036955, 2023. a, b
McCoy, D. T., Burrows, S. M., Wood, R., Grosvenor, D. P., Elliott, S. M., Ma, P.-L., Rasch, P. J., and Hartmann, D. L.: Natural aerosols explain seasonal and spatial patterns of Southern Ocean cloud albedo, Science Advances, 1, e1500157, https://doi.org/10.1126/sciadv.1500157, 2015a. a, b, c
McCoy, D. T., Hartmann, D. L., Zelinka, M. D., Ceppi, P., and Grosvenor, D. P.: Mixed-phase cloud physics and Southern Ocean cloud feedback in climate models, J. Geophys. Res.-Atmos., 120, 9539–9554, https://doi.org/10.1002/2015JD023603, 2015b. a
McCoy, D. T., Tan, I., Hartmann, D. L., Zelinka, M. D., and Storelvmo, T.: On the relationships among cloud cover, mixed-phase partitioning, and planetary albedo in GCMs, J. Adv. Model. Earth Sy., 8, 650–668, https://doi.org/10.1002/2015MS000589, 2016. a
Meskhidze, N., Petters, M. D., Tsigaridis, K., Bates, T., O'Dowd, C., Reid, J., Lewis, E. R., Gantt, B., Anguelova, M. D., Bhave, P. V., Bird, J., Callaghan, A. H., Ceburnis, D., Chang, R., Clarke, A., de Leeuw, G., Deane, G., DeMott, P. J., Elliot, S., Facchini, M. C., Fairall, C. W., Hawkins, L., Hu, Y., Hudson, J. G., Johnson, M. S., Kaku, K. C., Keene, W. C., Kieber, D. J., Long, M. S., Mårtensson, M., Modini, R. L., Osburn, C. L., Prather, K. A., Pszenny, A., Rinaldi, M., Russell, L. M., Salter, M., Sayer, A. M., Smirnov, A., Suda, S. R., Toth, T. D., Worsnop, D. R., Wozniak, A., and Zorn, S. R.: Production mechanisms, number concentration, size distribution, chemical composition, and optical properties of sea spray aerosols, Atmos. Sci. Lett., 14, 207–213, https://doi.org/10.1002/asl2.441, 2013. a
Mitts, B. A., Wang, X., Lucero, D. D., Beall, C. M., Deane, G. B., DeMott, P. J., and Prather, K. A.: Importance of supermicron ice nucleating particles in nascent sea spray, Geophys. Res. Lett., 48, e2020GL089633, https://doi.org/10.1029/2020GL089633, 2021. a, b, c, d, e
Miyakawa, T., Taketani, F., Tobo, Y., Matsumoto, K., Yoshizue, M., Takigawa, M., and Kanaya, Y.: Measurements of aerosol particle size distributions and INPs over the Southern Ocean in the late Austral summer of 2017 on board the R/V Mirai: importance of the marine boundary layer structure, Earth and Space Science, 10, e2022EA002736, https://doi.org/10.1029/2022EA002736, 2023. a
Modini, R. L., Frossard, A. A., Ahlm, L., Russell, L. M., Corrigan, C. E., Roberts, G. C., Hawkins, L. N., Schroder, J. C., Bertram, A. K., Zhao, R., Lee, A. K. Y., Abbatt, J. P. D., Lin, J., Nenes, A., Wang, Z., Wonaschütz, A., Sorooshian, A., Noone, K. J., Jonsson, H., Seinfeld, J. H., Toom-Sauntry, D., Macdonald, A. M., and Leaitch, W. R.: Primary marine aerosol-cloud interactions off the coast of California, J. Geophys. Res.-Atmos., 120, 4282–4303, https://doi.org/10.1002/2014JD022963, 2015. a
Monahan, E. C. and Muircheartaigh, I.: Optimal power-law description of oceanic whitecap coverage dependence on wind speed, J. Phys. Oceanogr., 10, 2094–2099, https://doi.org/10.1175/1520-0485(1980)010<2094:OPLDOO>2.0.CO;2, 1980. a, b, c, d, e
Monahan, E. C., Spiel, D. E., and Davidson, K. L.: A model of marine aerosol generation via whitecaps and wave disruption, in: Oceanic Whitecaps: And Their Role in Air-Sea Exchange Processes, edited by: Monahan, E. C. and Niocaill, G. M., Oceanographic Sciences Library, Springer Netherlands, Dordrecht, https://doi.org/10.1007/978-94-009-4668-2_16, 167–174, 1986. a, b
Moore, K. A.: Constraining Marine Ice Nucleating Particle Parameterizations in Atmospheric Models Using Observations from the Southern Ocean, MS Thesis, Colorado State University, https://mountainscholar.org/handle/10217/208435 (last access: 26 February 2025), 2020. a, b
Moore, K. A., Alexander, S. P., Humphries, R. S., Jensen, J., Protat, A., Reeves, J. M., Sanchez, K. J., Kreidenweis, S. M., and DeMott, P. J.: Estimation of sea spray aerosol surface area over the Southern Ocean using scattering measurements, J. Geophys. Res.-Atmos., 127, e2022JD037009, https://doi.org/10.1029/2022JD037009, 2022. a, b, c
Moore, K. A., Hill, T. C. J., McCluskey, C. S., Twohy, C. H., Rainwater, B., Toohey, D. W., Sanchez, K. J., Kreidenweis, S. M., and DeMott, P. J.: Characterizing ice nucleating particles over the Southern Ocean using simultaneous aircraft and ship observations, J. Geophys. Res.-Atmos., 129, e2023JD039543, https://doi.org/10.1029/2023JD039543, 2024. a, b, c, d, e, f, g, h, i, j, k, l
Moore, K. A., Hill, T. C. J., Madawala, C. K., Leibensperger III, R. J., Greeney, S., Cappa, C. D., Stokes, M. D., Deane, G. B., Lee, C., Tivanski, A. V., Prather, K. A., and DeMott, P. J.: Data from: Wind-driven emission of marine ice nucleating particles in the Scripps Ocean-Atmosphere Research Simulator (SOARS), Dryad [data set], https://doi.org/10.5061/dryad.1jwstqk4z, 2025. a
Murphy, D. M. and Koop, T.: Review of the vapour pressures of ice and supercooled water for atmospheric applications, Q. J. Roy. Meteor. Soc., 131, 1539–1565, https://doi.org/10.1256/qj.04.94, 2005. a
Naik, V., Szopa, S., Adhikary, B., Artaxo Netto, P. E., Berntsen, T., Collins, W. D., Fuzzi, S., Gallardo, L., Kiendler-Scharr, A., Klimont, Z., Liao, H., Unger, N., and Zanis, P.: Short-Lived Climate Forcers, in: Climate Change 2021: The Physical Science Basis. Contribution of Working Group I to the Sixth Assessment Report of the Intergovernmental Panel on Climate Change, edited by: Masson-Delmotte, V., Zhai, P., Pirani, A., Connors, S. L., Péan, C., Berger, S., Caud, N., Chen, Y., Goldfarb, L., Gomis, M. I., Huang, M., Leitzell, K., Lonnoy, E., Matthews, J. B. R., Maycock, T. K., Waterfield, T., Yelekçi, Ö., Yu, R., and Zhou, B., Cambridge University Press, Cambridge, UK and New York, NY, USA, 817–922, https://doi.org/10.1017/9781009157896.001, 2021. a
Niemand, M., Möhler, O., Vogel, B., Vogel, H., Hoose, C., Connolly, P., Klein, H., Bingemer, H., DeMott, P. J., Skrotzki, J., and Leisner, T.: A particle-surface-area-based parameterization of immersion freezing on desert dust particles, J. Atmos. Sci., 69, 3077–3092, https://doi.org/10.1175/JAS-D-11-0249.1, 2012. a
Nilsson, E. D., Hultin, K. A. H., Mårtensson, E. M., Markuszewski, P., Rosman, K., and Krejci, R.: Baltic Sea spray emissions: in situ eddy covariance fluxes vs. simulated tank sea spray, Atmosphere, 12, 274, https://doi.org/10.3390/atmos12020274, 2021. a
O'Dowd, C. D. and de Leeuw, G.: Marine aerosol production: a review of the current knowledge, Philos. T. Roy. Soc. A, 365, 1753–1774, https://doi.org/10.1098/rsta.2007.2043, 2007. a, b, c, d, e
O'Dowd, C. D., Facchini, M. C., Cavalli, F., Ceburnis, D., Mircea, M., Decesari, S., Fuzzi, S., Yoon, Y. J., and Putaud, J.-P.: Biogenically driven organic contribution to marine aerosol, Nature, 431, 676–680, https://doi.org/10.1038/nature02959, 2004. a
Or, V. W., Estillore, A. D., Tivanski, A. V., and Grassian, V. H.: Lab on a tip: atomic force microscopy – photothermal infrared spectroscopy of atmospherically relevant organic/inorganic aerosol particles in the nanometer to micrometer size range, Analyst, 143, 2765–2774, https://doi.org/10.1039/C8AN00171E, 2018. a
O'Sullivan, D., Murray, B. J., Malkin, T. L., Whale, T. F., Umo, N. S., Atkinson, J. D., Price, H. C., Baustian, K. J., Browse, J., and Webb, M. E.: Ice nucleation by fertile soil dusts: relative importance of mineral and biogenic components, Atmos. Chem. Phys., 14, 1853–1867, https://doi.org/10.5194/acp-14-1853-2014, 2014. a
Ovadnevaite, J., Manders, A., de Leeuw, G., Ceburnis, D., Monahan, C., Partanen, A.-I., Korhonen, H., and O'Dowd, C. D.: A sea spray aerosol flux parameterization encapsulating wave state, Atmos. Chem. Phys., 14, 1837–1852, https://doi.org/10.5194/acp-14-1837-2014, 2014. a, b, c
Pierce, J. R. and Adams, P. J.: Global evaluation of CCN formation by direct emission of sea salt and growth of ultrafine sea salt, J. Geophys. Res.-Atmos., 111, D06203, https://doi.org/10.1029/2005JD006186, 2006. a
Prather, K. A., Bertram, T. H., Grassian, V. H., Deane, G. B., Stokes, M. D., DeMott, P. J., Aluwihare, L. I., Palenik, B. P., Azam, F., Seinfeld, J. H., Moffet, R. C., Molina, M. J., Cappa, C. D., Geiger, F. M., Roberts, G. C., Russell, L. M., Ault, A. P., Baltrusaitis, J., Collins, D. B., Corrigan, C. E., Cuadra-Rodriguez, L. A., Ebben, C. J., Forestieri, S. D., Guasco, T. L., Hersey, S. P., Kim, M. J., Lambert, W. F., Modini, R. L., Mui, W., Pedler, B. E., Ruppel, M. J., Ryder, O. S., Schoepp, N. G., Sullivan, R. C., and Zhao, D.: Bringing the ocean into the laboratory to probe the chemical complexity of sea spray aerosol, P. Natl. Acad. Sci. USA, 110, 7550–7555, https://doi.org/10.1073/pnas.1300262110, 2013. a
Pummer, B. G., Budke, C., Augustin-Bauditz, S., Niedermeier, D., Felgitsch, L., Kampf, C. J., Huber, R. G., Liedl, K. R., Loerting, T., Moschen, T., Schauperl, M., Tollinger, M., Morris, C. E., Wex, H., Grothe, H., Pöschl, U., Koop, T., and Fröhlich-Nowoisky, J.: Ice nucleation by water-soluble macromolecules, Atmos. Chem. Phys., 15, 4077–4091, https://doi.org/10.5194/acp-15-4077-2015, 2015. a
Quinn, P. K., Coffman, D. J., Johnson, J. E., Upchurch, L. M., and Bates, T. S.: Small fraction of marine cloud condensation nuclei made up of sea spray aerosol, Nat. Geosci., 10, 674–679, https://doi.org/10.1038/ngeo3003, 2017. a, b
Raatikainen, T., Prank, M., Ahola, J., Kokkola, H., Tonttila, J., and Romakkaniemi, S.: The effect of marine ice-nucleating particles on mixed-phase clouds, Atmos. Chem. Phys., 22, 3763–3778, https://doi.org/10.5194/acp-22-3763-2022, 2022. a
Raman, A., Hill, T., DeMott, P. J., Singh, B., Zhang, K., Ma, P.-L., Wu, M., Wang, H., Alexander, S. P., and Burrows, S. M.: Long-term variability in immersion-mode marine ice-nucleating particles from climate model simulations and observations, Atmos. Chem. Phys., 23, 5735–5762, https://doi.org/10.5194/acp-23-5735-2023, 2023. a
Ray, K. K., Lee, H. D., Gutierrez, M. A. J., Chang, F. J., and Tivanski, A. V.: Correlating 3D morphology, phase state, and viscoelastic properties of individual substrate-deposited particles, Anal. Chem., 91, 7621–7630, https://doi.org/10.1021/acs.analchem.9b00333, 2019. a, b, c
Rogers, D. C.: Development of a continuous flow thermal gradient diffusion chamber for ice nucleation studies, Atmos. Res., 22, 149–181, https://doi.org/10.1016/0169-8095(88)90005-1, 1988. a
Rogers, D. C., DeMott, P. J., Kreidenweis, S. M., and Chen, Y.: A Continuous-flow diffusion chamber for airborne measurements of ice nuclei, J. Atmos. Ocean. Tech., 18, 725–741, https://doi.org/10.1175/1520-0426(2001)018<0725:ACFDCF>2.0.CO;2, 2001. a
Rosinski, J., Haagenson, P. L., Nagamoto, C. T., and Parungo, F.: Nature of ice-forming nuclei in marine air masses, J. Aerosol Sci., 18, 291–309, https://doi.org/10.1016/0021-8502(87)90024-3, 1987. a, b, c, d
Saliba, G., Chen, C.-L., Lewis, S., Russell, L. M., Rivellini, L.-H., Lee, A. K. Y., Quinn, P. K., Bates, T. S., Haëntjens, N., Boss, E. S., Karp-Boss, L., Baetge, N., Carlson, C. A., and Behrenfeld, M. J.: Factors driving the seasonal and hourly variability of sea-spray aerosol number in the North Atlantic, P. Natl. Acad. Sci. USA, 116, 20309–20314, https://doi.org/10.1073/pnas.1907574116, 2019. a, b
Salter, M. E., Nilsson, E. D., Butcher, A., and Bilde, M.: On the seawater temperature dependence of the sea spray aerosol generated by a continuous plunging jet, J. Geophys. Res.-Atmos., 119, 9052–9072, https://doi.org/10.1002/2013JD021376, 2014. a
Salter, M. E., Zieger, P., Acosta Navarro, J. C., Grythe, H., Kirkevåg, A., Rosati, B., Riipinen, I., and Nilsson, E. D.: An empirically derived inorganic sea spray source function incorporating sea surface temperature, Atmos. Chem. Phys., 15, 11047–11066, https://doi.org/10.5194/acp-15-11047-2015, 2015. a, b
Sauer, J. S., Mayer, K. J., Lee, C., Alves, M. R., Amiri, S., Bahaveolos, C. J., Franklin, E. B., Crocker, D. R., Dang, D., Dinasquet, J., Garofalo, L. A., Kaluarachchi, C. P., Kilgour, D. B., Mael, L. E., Mitts, B. A., Moon, D. R., Moore, A. N., Morris, C. K., Mullenmeister, C. A., Ni, C.-M., Pendergraft, M. A., Petras, D., Simpson, R. M. C., Smith, S., Tumminello, P. R., Walker, J. L., DeMott, P. J., Farmer, D. K., Goldstein, A. H., Grassian, V. H., Jaffe, J. S., Malfatti, F., Martz, T. R., Slade, J. H., Tivanski, A. V., Bertram, T. H., Cappa, C. D., and Prather, K. A.: The Sea Spray Chemistry and Particle Evolution Study (SeaSCAPE): overview and experimental methods, Environ. Sci.-Proc. Imp., 24, 290–315, https://doi.org/10.1039/D1EM00260K, 2022. a, b
Schmale, J., Baccarini, A., Thurnherr, I., Henning, S., Efraim, A., Regayre, L., Bolas, C., Hartmann, M., Welti, A., Lehtipalo, K., Aemisegger, F., Tatzelt, C., Landwehr, S., Modini, R. L., Tummon, F., Johnson, J. S., Harris, N., Schnaiter, M., Toffoli, A., Derkani, M., Bukowiecki, N., Stratmann, F., Dommen, J., Baltensperger, U., Wernli, H., Rosenfeld, D., Gysel-Beer, M., and Carslaw, K. S.: Overview of the Antarctic circumnavigation expedition: Study of Preindustrial-like Aerosols and Their Climate Effects (ACE-SPACE), B. Am. Meteorol. Soc., 100, 2260–2283, https://doi.org/10.1175/BAMS-D-18-0187.1, 2019. a, b, c
Schnell, R. C. and Vali, G.: Biogenic ice nuclei: Part I. Terrestrial and marine sources, J. Atmos. Sci., 33, 1554–1564, https://doi.org/10.1175/1520-0469(1976)033<1554:BINPIT>2.0.CO;2, 1976. a
Schwier, A. N., Sellegri, K., Mas, S., Charrière, B., Pey, J., Rose, C., Temime-Roussel, B., Jaffrezo, J.-L., Parin, D., Picard, D., Ribeiro, M., Roberts, G., Sempéré, R., Marchand, N., and D'Anna, B.: Primary marine aerosol physical flux and chemical composition during a nutrient enrichment experiment in mesocosms in the Mediterranean Sea, Atmos. Chem. Phys., 17, 14645–14660, https://doi.org/10.5194/acp-17-14645-2017, 2017. a, b
Sellegri, K., O'Dowd, C. D., Yoon, Y. J., Jennings, S. G., and de Leeuw, G.: Surfactants and submicron sea spray generation, J. Geophys. Res.-Atmos., 111, D22215, https://doi.org/10.1029/2005JD006658, 2006. a, b
Sellegri, K., Barthelmeß, T., Trueblood, J., Cristi, A., Freney, E., Rose, C., Barr, N., Harvey, M., Safi, K., Deppeler, S., Thompson, K., Dillon, W., Engel, A., and Law, C.: Quantified effect of seawater biogeochemistry on the temperature dependence of sea spray aerosol fluxes, Atmos. Chem. Phys., 23, 12949–12964, https://doi.org/10.5194/acp-23-12949-2023, 2023. a, b
Sofiev, M., Soares, J., Prank, M., de Leeuw, G., and Kukkonen, J.: A regional-to-global model of emission and transport of sea salt particles in the atmosphere, J. Geophys. Res.-Atmos., 116, D21302, https://doi.org/10.1029/2010JD014713, 2011. a, b
Steinke, I., DeMott, P. J., Deane, G. B., Hill, T. C. J., Maltrud, M., Raman, A., and Burrows, S. M.: A numerical framework for simulating the atmospheric variability of supermicron marine biogenic ice nucleating particles, Atmos. Chem. Phys., 22, 847–859, https://doi.org/10.5194/acp-22-847-2022, 2022. a, b
Stokes, M. D., Deane, G. B., Prather, K., Bertram, T. H., Ruppel, M. J., Ryder, O. S., Brady, J. M., and Zhao, D.: A Marine Aerosol Reference Tank system as a breaking wave analogue for the production of foam and sea-spray aerosols, Atmos. Meas. Tech., 6, 1085–1094, https://doi.org/10.5194/amt-6-1085-2013, 2013. a
Suski, K. J., Hill, T. C. J., Levin, E. J. T., Miller, A., DeMott, P. J., and Kreidenweis, S. M.: Agricultural harvesting emissions of ice-nucleating particles, Atmos. Chem. Phys., 18, 13755–13771, https://doi.org/10.5194/acp-18-13755-2018, 2018. a, b, c, d
Tang, I. N., Tridico, A. C., and Fung, K. H.: Thermodynamic and optical properties of sea salt aerosols, J. Geophys. Res.-Atmos., 102, 23269–23275, https://doi.org/10.1029/97JD01806, 1997. a, b, c
Tatzelt, C., Henning, S., Welti, A., Baccarini, A., Hartmann, M., Gysel-Beer, M., van Pinxteren, M., Modini, R. L., Schmale, J., and Stratmann, F.: Circum-Antarctic abundance and properties of CCN and INPs, Atmos. Chem. Phys., 22, 9721–9745, https://doi.org/10.5194/acp-22-9721-2022, 2022. a, b, c
Tobo, Y., Prenni, A. J., DeMott, P. J., Huffman, J. A., McCluskey, C. S., Tian, G., Pöhlker, C., Pöschl, U., and Kreidenweis, S. M.: Biological aerosol particles as a key determinant of ice nuclei populations in a forest ecosystem, J. Geophys. Res.-Atmos., 118, 10,100–10,110, https://doi.org/10.1002/jgrd.50801, 2013. a, b
Ullrich, R., Hoose, C., Möhler, O., Niemand, M., Wagner, R., Höhler, K., Hiranuma, N., Saathoff, H., and Leisner, T.: A new ice nucleation active site parameterization for desert dust and soot, J. Atmos. Sci., 74, 699–717, https://doi.org/10.1175/JAS-D-16-0074.1, 2017. a, b, c
Vali, G.: Quantitative evaluation of experimental results on the heterogeneous freezing nucleation of supercooled liquids, J. Atmos. Sci., 28, 402–409, https://doi.org/10.1175/1520-0469(1971)028<0402:QEOERA>2.0.CO;2, 1971. a
van Pinxteren, M., Fomba, K. W., Triesch, N., Stolle, C., Wurl, O., Bahlmann, E., Gong, X., Voigtländer, J., Wex, H., Robinson, T.-B., Barthel, S., Zeppenfeld, S., Hoffmann, E. H., Roveretto, M., Li, C., Grosselin, B., Daële, V., Senf, F., van Pinxteren, D., Manzi, M., Zabalegui, N., Frka, S., Gašparović, B., Pereira, R., Li, T., Wen, L., Li, J., Zhu, C., Chen, H., Chen, J., Fiedler, B., von Tümpling, W., Read, K. A., Punjabi, S., Lewis, A. C., Hopkins, J. R., Carpenter, L. J., Peeken, I., Rixen, T., Schulz-Bull, D., Monge, M. E., Mellouki, A., George, C., Stratmann, F., and Herrmann, H.: Marine organic matter in the remote environment of the Cape Verde islands – an introduction and overview to the MarParCloud campaign, Atmos. Chem. Phys., 20, 6921–6951, https://doi.org/10.5194/acp-20-6921-2020, 2020. a
Verdugo, P.: Marine microgels, Annu. Rev. Mar. Sci., 4, 375–400, https://doi.org/10.1146/annurev-marine-120709-142759, 2012. a
Vergara-Temprado, J., Murray, B. J., Wilson, T. W., O'Sullivan, D., Browse, J., Pringle, K. J., Ardon-Dryer, K., Bertram, A. K., Burrows, S. M., Ceburnis, D., DeMott, P. J., Mason, R. H., O'Dowd, C. D., Rinaldi, M., and Carslaw, K. S.: Contribution of feldspar and marine organic aerosols to global ice nucleating particle concentrations, Atmos. Chem. Phys., 17, 3637–3658, https://doi.org/10.5194/acp-17-3637-2017, 2017. a, b
Vergara-Temprado, J., Miltenberger, A. K., Furtado, K., Grosvenor, D. P., Shipway, B. J., Hill, A. A., Wilkinson, J. M., Field, P. R., Murray, B. J., and Carslaw, K. S.: Strong control of southern ocean cloud reflectivity by ice-nucleating particles, P. Natl. Acad. Sci. USA, 115, 2687–2692, https://doi.org/10.1073/pnas.1721627115, 2018. a, b
Villefer, A., Benoit, M., Violeau, D., Luneau, C., and Branger, H.: Influence of following, regular, and irregular long waves on wind-wave growth with fetch: an experimental study, J. Phys. Oceanogr., 51, 3435–3448, https://doi.org/10.1175/JPO-D-21-0050.1, 2021. a, b
Vollestad, P. and Jensen, A.: Modification of airflow structure due to wave breaking on a submerged topography, Bound.-Lay. Meteorol., 180, 507–526, https://doi.org/10.1007/s10546-021-00631-3, 2021. a
von der Weiden, S.-L., Drewnick, F., and Borrmann, S.: Particle Loss Calculator – a new software tool for the assessment of the performance of aerosol inlet systems, Atmos. Meas. Tech., 2, 479–494, https://doi.org/10.5194/amt-2-479-2009, 2009. a
Wang, X., Sultana, C. M., Trueblood, J., Hill, T. C. J., Malfatti, F., Lee, C., Laskina, O., Moore, K. A., Beall, C. M., McCluskey, C. S., Cornwell, G. C., Zhou, Y., Cox, J. L., Pendergraft, M. A., Santander, M. V., Bertram, T. H., Cappa, C. D., Azam, F., DeMott, P. J., Grassian, V. H., and Prather, K. A.: Microbial control of sea spray aerosol composition: a tale of two blooms, ACS Central Science, 1, 124–131, https://doi.org/10.1021/acscentsci.5b00148, 2015. a, b, c, d, e, f, g
Welti, A., Müller, K., Fleming, Z. L., and Stratmann, F.: Concentration and variability of ice nuclei in the subtropical maritime boundary layer, Atmos. Chem. Phys., 18, 5307–5320, https://doi.org/10.5194/acp-18-5307-2018, 2018. a
Welti, A., Bigg, E. K., DeMott, P. J., Gong, X., Hartmann, M., Harvey, M., Henning, S., Herenz, P., Hill, T. C. J., Hornblow, B., Leck, C., Löffler, M., McCluskey, C. S., Rauker, A. M., Schmale, J., Tatzelt, C., van Pinxteren, M., and Stratmann, F.: Ship-based measurements of ice nuclei concentrations over the Arctic, Atlantic, Pacific and Southern oceans, Atmos. Chem. Phys., 20, 15191–15206, https://doi.org/10.5194/acp-20-15191-2020, 2020. a, b
Wilbourn, E. K., Thornton, D. C. O., Ott, C., Graff, J., Quinn, P. K., Bates, T. S., Betha, R., Russell, L. M., Behrenfeld, M. J., and Brooks, S. D.: Ice nucleation by marine aerosols over the North Atlantic Ocean in late spring, J. Geophys. Res.-Atmos., 125, e2019JD030913, https://doi.org/10.1029/2019JD030913, 2020. a
Wilson, T. W., Ladino, L. A., Alpert, P. A., Breckels, M. N., Brooks, I. M., Browse, J., Burrows, S. M., Carslaw, K. S., Huffman, J. A., Judd, C., Kilthau, W. P., Mason, R. H., McFiggans, G., Miller, L. A., Nájera, J. J., Polishchuk, E., Rae, S., Schiller, C. L., Si, M., Temprado, J. V., Whale, T. F., Wong, J. P. S., Wurl, O., Yakobi-Hancock, J. D., Abbatt, J. P. D., Aller, J. Y., Bertram, A. K., Knopf, D. A., and Murray, B. J.: A marine biogenic source of atmospheric ice-nucleating particles, Nature, 525, 234–238, https://doi.org/10.1038/nature14986, 2015. a, b, c, d, e
Zábori, J., Matissāns, M., Krejci, R., Nilsson, E. D., and Ström, J.: Artificial primary marine aerosol production: a laboratory study with varying water temperature, salinity, and succinic acid concentration, Atmos. Chem. Phys., 12, 10709–10724, https://doi.org/10.5194/acp-12-10709-2012, 2012. a, b
Zavadsky, A. and Shemer, L.: Characterization of turbulent airflow over evolving water-waves in a wind-wave tank, J. Geophys. Res.-Oceans, 117, C00J19, https://doi.org/10.1029/2011JC007790, 2012. a
Zelinka, M. D., Myers, T. A., McCoy, D. T., Po-Chedley, S., Caldwell, P. M., Ceppi, P., Klein, S. A., and Taylor, K. E.: Causes of higher climate sensitivity in CMIP6 models, Geophys. Res. Lett., 47, e2019GL085782, https://doi.org/10.1029/2019GL085782, 2020. a
Zhao, X., Liu, X., Burrows, S. M., and Shi, Y.: Effects of marine organic aerosols as sources of immersion-mode ice-nucleating particles on high-latitude mixed-phase clouds, Atmos. Chem. Phys., 21, 2305–2327, https://doi.org/10.5194/acp-21-2305-2021, 2021. a
Zieger, P., Väisänen, O., Corbin, J. C., Partridge, D. G., Bastelberger, S., Mousavi-Fard, M., Rosati, B., Gysel, M., Krieger, U. K., Leck, C., Nenes, A., Riipinen, I., Virtanen, A., and Salter, M. E.: Revising the hygroscopicity of inorganic sea salt particles, Nat. Commun., 8, 15883, https://doi.org/10.1038/ncomms15883, 2017. a, b, c
Zinke, J., Nilsson, E. D., Zieger, P., and Salter, M. E.: The effect of seawater salinity and seawater temperature on sea salt aerosol production, J. Geophys. Res.-Atmos., 127, e2021JD036005, https://doi.org/10.1029/2021JD036005, 2022. a, b
- Abstract
- Introduction
- Methods
- Results and discussion
- Conclusions
- Appendix A: Additional figures
- Appendix B: INP normalization
- Appendix C: Details on AFM VRD results and CFDC OPC correction factors
- Data availability
- Author contributions
- Competing interests
- Disclaimer
- Acknowledgements
- Financial support
- Review statement
- References