the Creative Commons Attribution 4.0 License.
the Creative Commons Attribution 4.0 License.
 | 28 Feb 2025
Characterization of brown carbon absorption in different European environments through source contribution analysis
Hector Navarro-Barboza
Jordi Rovira
Vincenzo Obiso
Andrea Pozzer
Marta Via
Andres Alastuey
Xavier Querol
Noemi Perez
Marjan Savadkoohi
Gang Chen
Jesus Yus-Díez
Matic Ivancic
Martin Rigler
Konstantinos Eleftheriadis
Stergios Vratolis
Olga Zografou
Maria Gini
Benjamin Chazeau
Nicolas Marchand
Andre S. H. Prevot
Kaspar Dallenbach
Mikael Ehn
Krista Luoma
Tuukka Petäjä
Anna Tobler
Jaroslaw Necki
Minna Aurela
Hilkka Timonen
Jarkko Niemi
Olivier Favez
Jean-Eudes Petit
Jean-Philippe Putaud
Christoph Hueglin
Nicolas Pascal
Aurélien Chauvigné
Sébastien Conil
Marco Pandolfi
Brown carbon (BrC) is a fraction of organic aerosol (OA) that absorbs radiation in the ultraviolet and short visible wavelengths. Its contribution to radiative forcing is uncertain due to limited knowledge of its imaginary refractive index (k). This study investigates the variability of k for OA from wildfires, residential, shipping, and traffic emission sources over Europe. The Multiscale Online Nonhydrostatic Atmosphere Chemistry (MONARCH) model simulated OA concentrations and source contributions, feeding an offline optical tool to constrain k values at 370 nm. The model was evaluated against OA mass concentrations from aerosol chemical speciation monitors (ACSMs) and filter sample measurements, as well as aerosol light absorption measurements at 370 nm derived from an Aethalometer™ from 12 sites across Europe. Results show that MONARCH captures the OA temporal variability across environments (regional, suburban, and urban background). Residential emissions are a major OA source in colder months, while secondary organic aerosol (SOA) dominates in warmer periods. Traffic is a minor primary OA contributor. Biomass and coal combustion significantly influence OA absorption, with shipping emissions also notable near harbors. Optimizing k values at 370 nm revealed significant variability in OA light absorption, influenced by emission sources and environmental conditions. Derived k values for biomass burning (0.03 to 0.13), residential (0.008 to 0.13), shipping (0.005 to 0.08), and traffic (0.005 to 0.07) sources improved model representation of OA absorption compared to a constant k. Introducing such emission source-specific constraints is an innovative approach to enhance OA absorption in atmospheric models.
- Article
(11987 KB) - Full-text XML
-
Supplement
(766 KB) - BibTeX
- EndNote


Brown carbon (BrC) is the fraction of organic aerosol (OA) which exhibits light-absorbing properties, particularly in the ultraviolet and visible spectrum (Andreae and Gelencsér, 2006; Laskin et al., 2015). The role of BrC in atmospheric radiative forcing, while possibly significant, remains incompletely quantified (Brown et al., 2018; Zhang et al., 2020a; Sand et al., 2021). This is in part due to the historical treatment of OA in atmospheric models as mostly scattering solar radiation (Feng et al., 2013). BrC emissions originate from a variety of sources, significantly influenced by regional factors, including biomass, biofuel, and fossil fuel (Lu et al., 2015) combustion. Global estimates of BrC emissions reveal distinct regional patterns (Xiong et al., 2022). In Africa and South America, more than 70 % of the primary BrC emissions are attributed to natural sources, such as wildfires. However, East Asia's BrC emissions are primarily anthropogenic, with residential solid fuel combustion accounting for more than 80 % of the emissions. Europe presents a more mixed source profile, where natural sources are currently considered to be responsible for approximately 36 % of BrC emissions, while residential activities (e.g., coal and solid biomass combustion for domestic heating) contribute approximately 48 %. Furthermore, BrC originates not only through primary emissions, but also through secondary formation processes in the atmosphere, such as darkening (Kumar et al., 2018; Li et al., 2023). However, as BrC ages in the atmosphere, it can undergo photochemical and oxidative processes that lead to a reduction in its absorption capabilities, a phenomenon known as photobleaching (Hems et al., 2021). The complexity of BrC lies in its changing absorption characteristics and diverse composition. In fact, factors like burning conditions, solar exposure, and chemical composition determine BrC optical properties such as the imaginary refractive index (k) and absorption Ångström exponent (AAE). The optical properties of BrC present high variability that arises from the formation of different chromophores and molecular structures, thus complicating the representation of BrC in climate models and our understanding of its atmospheric impact (Laskin et al., 2015; Brege et al., 2021; Washenfelder et al., 2022).
Several processes that alter BrC absorptive characteristics have recently been identified. Photobleaching stands out as a key process in this context. It describes the phenomenon in which BrC loses its absorptive capacity, particularly under conditions of high OH oxidation. For instance, a laboratory study conducted by Wong et al. (2019) observed that high-molecular -weight BrC undergoes initial photo-enhancement and subsequent gradual photobleaching, a phenomenon supported by observations from ambient BrC samples collected during fire seasons in Heraklion, Crete, Greece. Both primary BrC and secondary BrC are subject to photobleaching, as shown in various studies (e.g., Forrister et al., 2015; Wang et al., 2018b). In contrast to photobleaching, Kodros et al. (2020) introduced the concept of “dark aging” or darkening, a novel BrC secondary organic aerosol (SOA) formation pathway from biomass burning emissions. This process, which occurs under low or no light conditions and takes hours, involves OA oxidation initiated by the NO3 radical with phenol, cresol, and furanoic compounds as primary reactants, and it is influenced by relative humidity. Another process that has so far been less understood and is currently not treated in modeling studies is the lensing effect of BrC, as explored, e.g., by Basnet et al. (2024) and Cappa et al. (2012). This process can enhance the absorption of BrC. It is based on the mixing state of BrC, typically assuming a core–shell structure. In this structure, the core is composed of black carbon (BC), while the shell, which can consist of BrC or a purely scattering material, acts like a lens. This lens effect focuses and intensifies the light absorption of the entire particle, thereby potentially altering its radiative impact.
Understanding the optical properties of BrC is of fundamental importance, especially its k because it is a key parameter used to quantify the light-absorbing properties of BrC. However, this parameter is not well-constrained, and it exhibits significant uncertainty and variability. Research indicates that the imaginary refractive index of BrC can vary by 30 %–50 %, highlighting the complex and diverse nature of its light-absorbing properties (Wang et al., 2013). Further studies, such as by Cheng et al. (2021), suggest that light absorption properties of BrC vary depending on the source of the emission, as demonstrated in comparisons of BrC generated from different fuels. Saleh (2020) introduced a classification for BrC based on its imaginary refractive index at k550 into four categories ranging from very weakly (10−4 to 10−3) to strongly absorbing () BrC, with a noted correlation between BrC's source and its absorption category. This categorization highlights a gradient in absorption capabilities and associates more absorptive BrC, primarily resulting from high-temperature biomass combustion, with flatter absorption spectra. The classification underscores the complex and variable optical properties of BrC. It should be noted that the absorption categories for OA proposed by Saleh (2020) were based on 20 chamber experiments, which may not fully reflect the conditions found in the field.
A seminal work on modeling the effects of BrC in the atmosphere using 3D atmospheric models was the characterization of OA as absorbing with a k550 assigned of 0.27 by Park et al. (2010). Feng et al. (2013) extended this by modeling the absorbing fraction of OA separated into two categories: moderately absorbing, characterized by a k550 value of 0.003, and strongly absorbing, with a k550 value of 0.03. Lin et al. (2014) continued this approach and classified OA into two groups: low (k550:0.001) and high (k550:0.03). This classification, particularly distinguishing primary organic aerosol (POA) from SOA, was based on the understanding that POA generally exhibits greater absorption potential than SOA, which is chemically very different. Saleh et al. (2014) advanced the field by deriving equations based on experimental datasets to parameterize the absorption of OA from the ratio of emitted BC and OA. Subsequently, this parameterization was used in the GEOS-Chem model by Saleh et al. (2015) and Wang et al. (2018b) and in the CAM5 model by Brown et al. (2018) to represent OA absorption.
At a global scale, studies have highlighted the significant warming effect of BrC alongside BC and greenhouse gases (GHGs). Feng et al. (2013) estimated that BrC's warming effect could be approximately one-fourth that of BC, identifying BrC, mainly emitted from fuel combustion and open vegetation burning, as a substantial component contributing to global warming. Zhang et al. (2020a) suggested that BrC might be a larger heating source in the tropical free troposphere than BC. A recent study by Liu et al. (2023) found that a decrease in single-scattering albedo (SSA) at near-ultraviolet wavelengths significantly reduces the efficiency of the direct radiative forcing (DRF) due to strong absorption capabilities of BrC, which impacts both local and global radiation budgets. This is further supported by Wang et al. (2014), who utilized the GEOS-Chem model to demonstrate that incorporating BrC significantly improves the accuracy of absorption aerosol optical depth (AAOD) predictions by over 50 % at AERONET stations, contributing an estimated +0.11 Wm−2 to DRF.
Regional studies complement global models by offering detailed insights into BrC formation processes and its effects at a local scale, highlighting the importance of focusing on specific geographical areas to understand local and regional atmospheric phenomena. For example, research conducted in northwestern and southeastern Europe and northern peninsular Southeast Asia have revealed significant seasonal variations in BrC concentrations, which are particularly impactful in urban settings often due to residential wood burning (Zhang et al., 2020b; Paraskevopoulou et al., 2023; Methymaki et al., 2023; Pani et al., 2021). These variations not only affect air quality but also complicate the broader understanding of regional climate impacts. In addition, research conducted in the northwestern United States has examined the BrC emissions from wildfires. These studies indicate that the inclusion of SOA formation and photobleaching effects in atmospheric models can enhance the simulation of aerosol optical properties. For example, incorporating these processes improves the representation of aerosol optical depth (AOD) and SSA, making the model outputs more consistent with observed datasets (Neyestani and Saleh, 2022). These regional studies underscore the value of localized research in enhancing our understanding of BrC aerosols. They not only offer valuable understanding of the specific sources and behaviors of BrC in different environments but also help refine global models that are used to predict atmospheric conditions. Unlike these studies, which often focus on specific events or short time periods, the current research extends over an entire year, providing a comprehensive analysis of seasonal trends and identifying diverse BrC sources. This approach not only broadens the scope of understanding BrC dynamics, but also enhances the predictive capabilities of climate models concerning BrC's environmental impacts.
In this research, we aim to investigate the light absorption properties of OA in different environments in Europe. We employ both modeling techniques and experimental approaches to constrain specific k indexes for OA originating from different emission sources, such as fires, residential, shipping, traffic, and others. We use the Multiscale Online Nonhydrostatic Atmosphere Chemistry model (MONARCH; Badia and Jorba, 2015; Badia et al., 2017; Klose et al., 2021b; Navarro-Barboza et al., 2024) to simulate the light absorption of OA in Europe during 2018. Our results provide an estimate of OA light-absorbing properties in Europe. This comprehensive approach allows us to provide a first attempt to constrain OA optical properties representative of field conditions based on the current knowledge of emission sources and transport modeling. Although previous extensive studies in laboratory conditions such as Saleh (2020) are highly valuable for modeling purposes, they may not fully represent the actual ambient conditions.
In Sect. 2, we detail the experimental framework and the methodologies employed in this research. The observational dataset is introduced and the modeling tools and optimization method to derive k values described. Section 3 presents our results, starting with an evaluation of the modeled OA mass against observational datasets and providing an in-depth analysis of source contributions. We then discuss the optimization of k values under different assumptions for OA emission sources. Finally, Sect. 4 summarizes our key conclusions and outlines the recommendations arising from this study.
2.1 Observational dataset
The OA to organic carbon (OC) mass concentrations and multi-wavelength absorption measurements used in this study were collected at 12 sites in Europe covering urban, suburban, and regional background environments. Figure 1 and Table 1 show the geographical locations of these atmospheric research stations. Figure 1 also shows the relative contribution of black carbon (BC) and BrC to the total absorption measured at 370 nm that was obtained by applying the procedure detailed in the “BrC absorption from Aethalometer data” section.
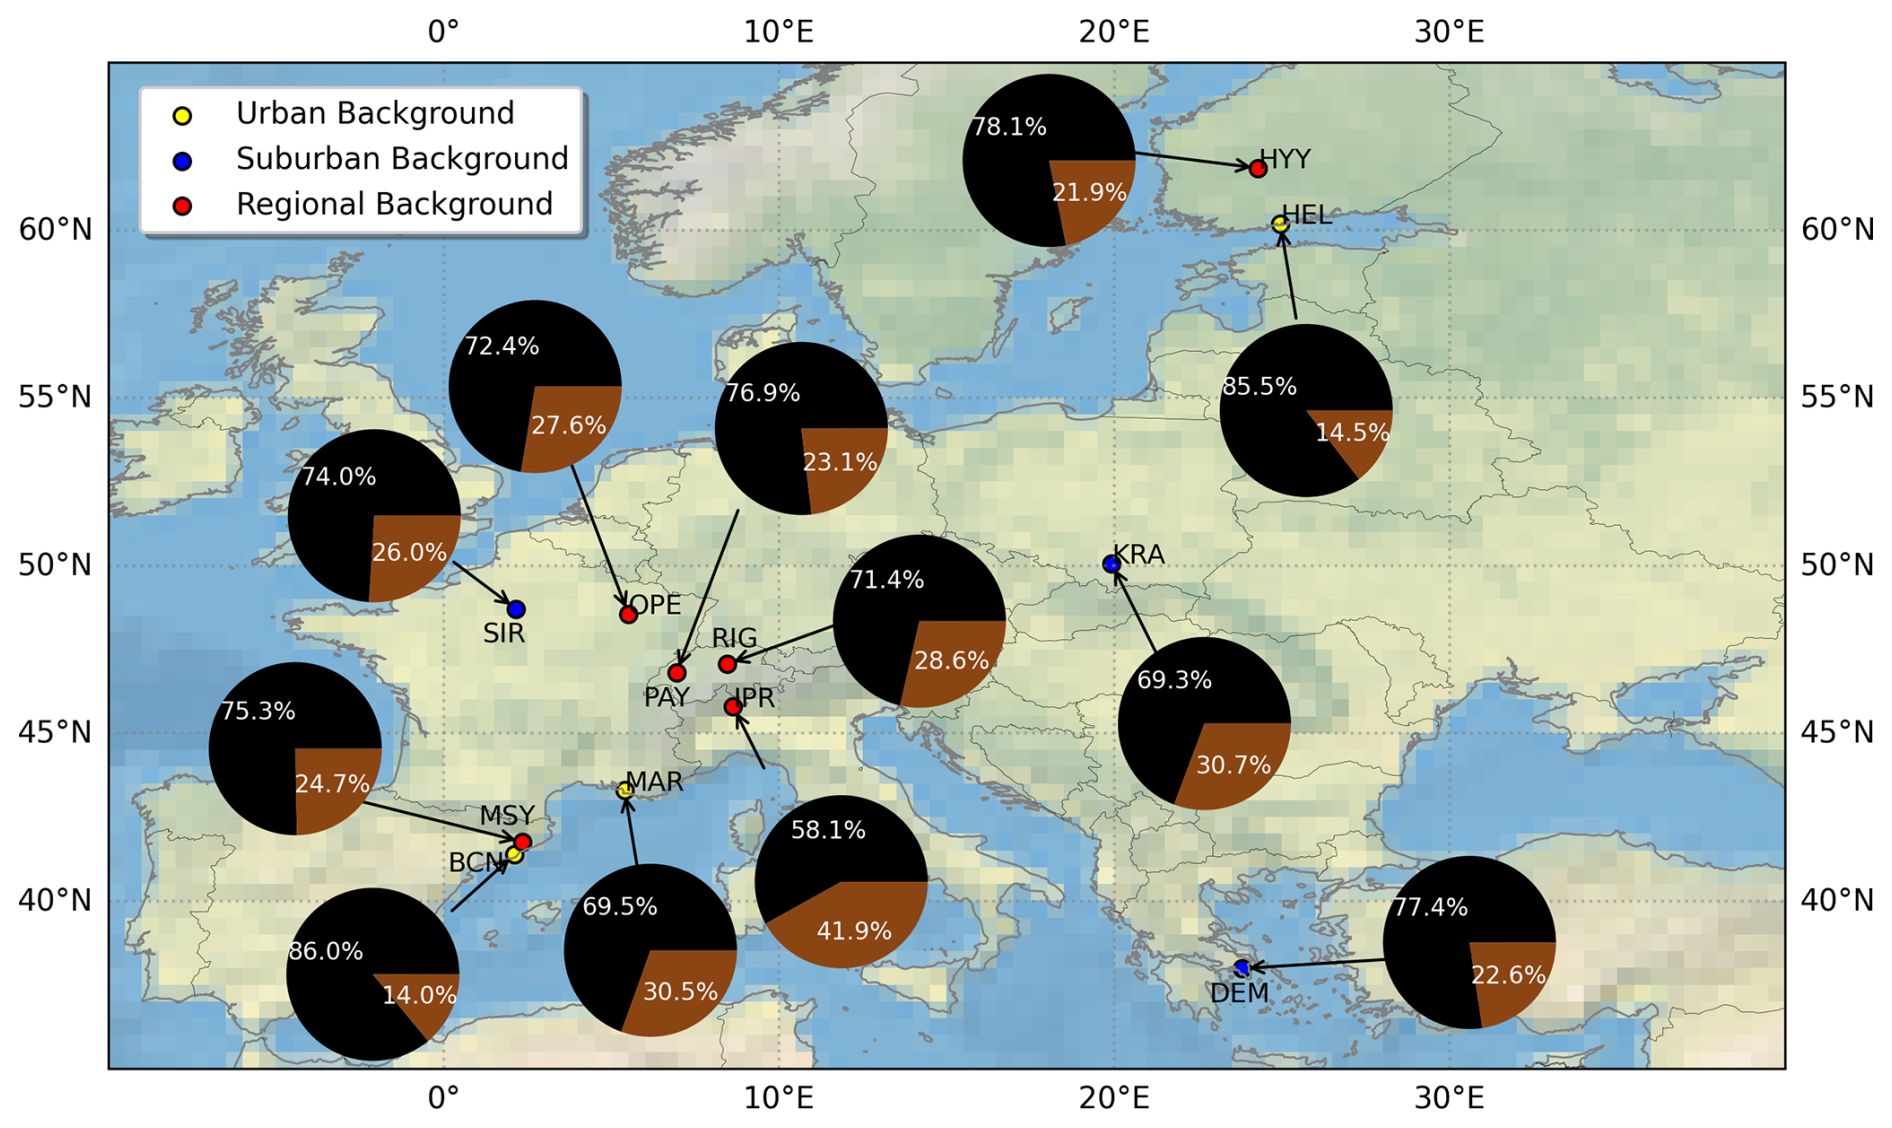
Figure 1Annual average contributions [%] of BrC (brown) and BC (black) to the total absorption at 370 nm, measured at 12 different monitoring stations across Europe in 2018. Station locations are marked by colored dots: urban background (yellow), suburban background (blue), and regional background (red). Station acronyms are listed in Table 1.
Data from these measurement sites were collected from different infrastructures and projects such as EBAS (https://ebas.nilu.no/, last access: 19 February 2025), the RI-URBANS Project (Savadkoohi et al., 2023, https://riurbans.eu/, last access: 19 February 2025), COLOSSAL COST Action (Chen et al., 2022, https://www.cost.eu/actions/CA16109/, last access: 19 February 2025), and the FOCI Project (https://www.project-foci.eu/wp/, last access: 19 February 2025). At some sites (Table 1), OA mass concentrations were directly provided by aerosol chemical speciation monitor (ACSM) instruments with 30 min time resolution (Chen et al., 2022), while OC mass concentrations were obtained from the analysis of 24 h filters by means of a thermal–optical offline technique (SUNSET Instruments) following the EUSAAR II Protocol (Cavalli et al., 2010). Details about ACSM instruments used for OA determination, measurement principles, accuracy, and the treatment of sources of error such as collection efficiency can be found in Ng et al. (2011), Middlebrook et al. (2012), Fröhlich et al. (2013), Freney et al. (2019), and Chen et al. (2022). At sites where OC mass concentrations from 24 h filters were available (Table 1), specific organic aerosol to organic carbon (OA OC) ratios were applied depending on the characteristic of the measurement sites. A factor of 1.4 is traditionally used, although some studies support larger values (e.g., Zhang et al., 2005). Here, we applied OA OC ratios of 1.8 at urban sites and 2.1 at regional and/or remote sites. These values agreed with some estimations reported in the literature. For example, Minguillón et al. (2011) reported OA OC ratios of 2.0 and 1.6 for the regional background, MSY, and urban background BCN sites, respectively. Similarly, Daellenbach et al. (2016) and Favez et al. (2010) documented OA OC ratios of 1.84 and 1.8 at two urban background sites in Switzerland and France, respectively.
Aerosol particle light absorption coefficients were derived at 7 different wavelengths (370, 470, 520, 590, 660, 880, and 950 nm) with 1 h time resolution using AE33/AE31 Aethalometers (Magee Scientific). An extensive description of the AE33 and AE31 instruments is provided, for example, by Drinovec et al. (2015, 2017) and Backman et al. (2017), respectively. Briefly, the Aethalometers measure the attenuation of light by aerosol particles collected onto a fiber filter tape converting the measured attenuation into absorption.
Table 1Monitoring stations used in this study.
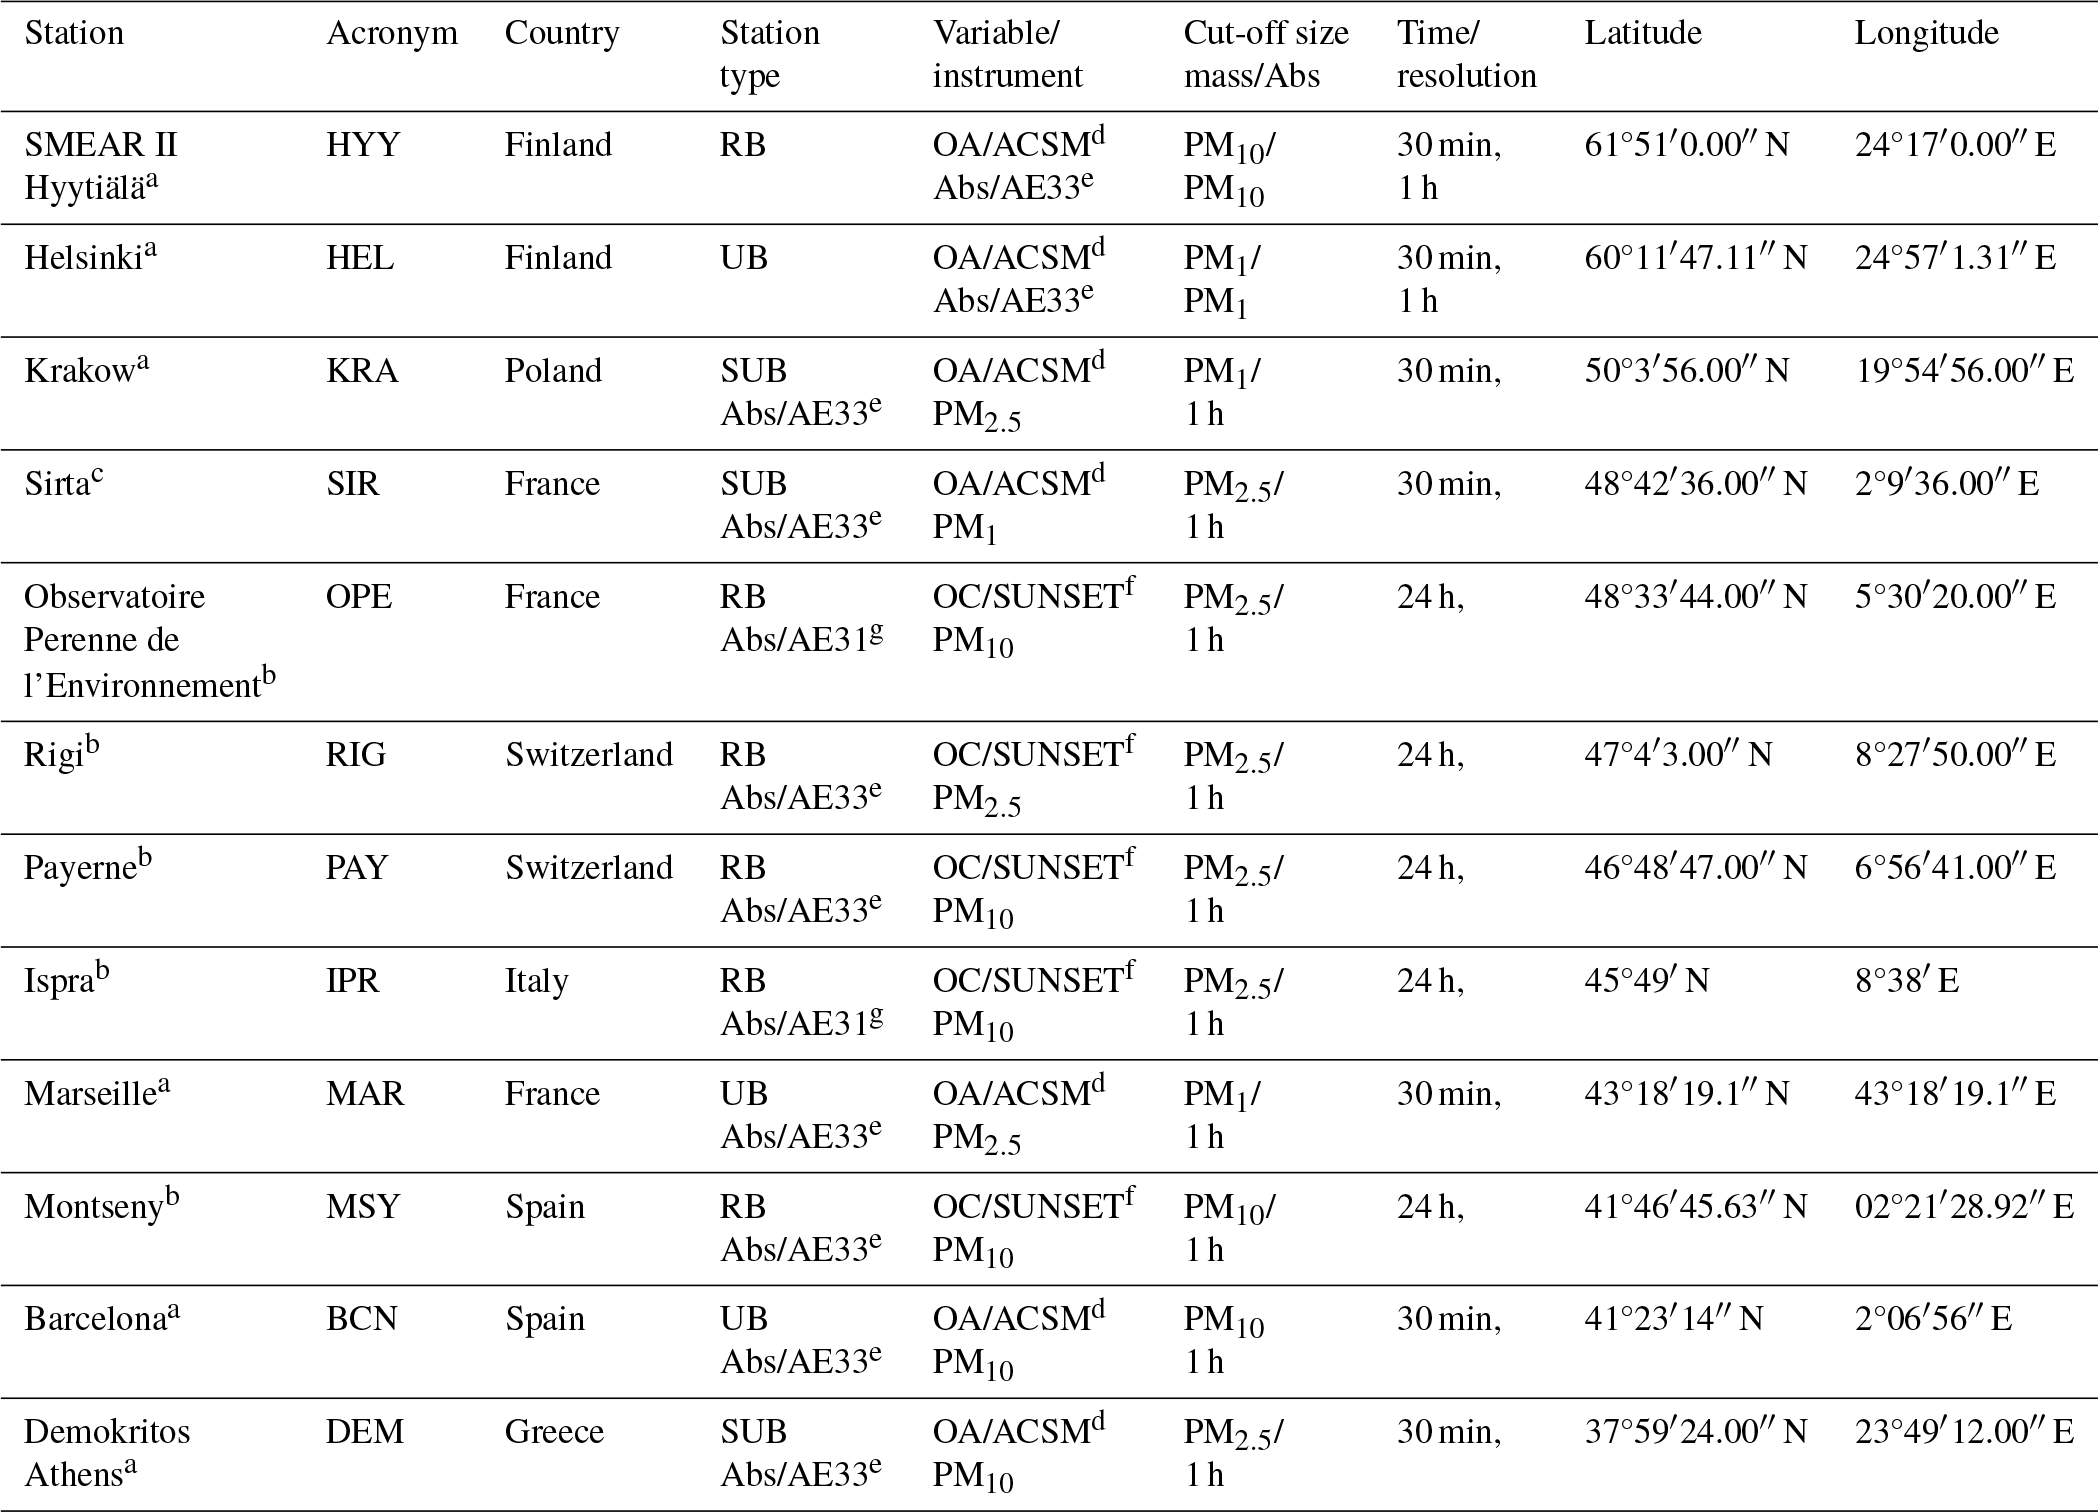
a Project/source: RI-URBANS/FOCI/COLOSSAL (Savadkoohi et al., 2023; Chen et al., 2022). b EBAS (https://ebas.nilu.no/, last access: 19 February 2025). c RI-URBANS/FOCI/EBAS (Savadkoohi et al. (2023); https://ebas.nilu.no/, last access: 19 February 2025). d OA/ACSM: organic aerosol/aerosol chemical speciation monitor. e Abs/AE33: total absorption (370–950 nm), Aethalometer AE33 model. f OC/SUNSET: organic carbon, OCEC carbon aerosol analyzer. g Abs/AE31: total absorption (370–950 nm), Aethalometer AE31 model.
BrC absorption from Aethalometer data
Most of the filter-based absorption techniques that determine the absorption coefficients from the measurements of light passing through an aerosol-laden filter (such as the Aethalometers) suffer from various systematic errors that need to be corrected. These artifacts include the enhancement of the measured attenuation due to multiple scattering of light by the filter fibers, a further enhancement of light attenuation due to the scattering of aerosols embedded in the filter, and a progressive saturation of the instrumental response due to the accumulation of the sample in the filter matrix (e.g., Bond et al., 1999; Weingartner et al., 2003; Moosmüller et al., 2009; Drinovec et al., 2015, 2017; Müller and Fiebig, 2018; Yus-Díez et al., 2021). Thus, absorption data from Aethalometer instruments need to be harmonized to account for these artifacts. All AE33 data were harmonized as described in Savadkoohi et al. (2023). AE31 data were taken from EBAS Level 2 quality-assured and quality-checked (QA/QC) dataset and were directly downloaded from the EBAS database (EBAS, https://ebas-data.nilu.no/, last access: 19 February 2025). These data were processed following the ACTRIS recommendations for the reporting of absorption (Müller and Fiebig, 2018), ensuring the comparability of absorption measurements across the sites by employing harmonized measurement protocols.
The contribution of brown carbon (BrC; babs,BrC(λ)) to the total measured absorption (babs(λ)) at different wavelengths from 370 to 660 nm was estimated by subtracting the absorption due to BC (BC; babs,BC(λ) from the measured (babs(λ)):
where AAEBC is the absorption Ångström exponent (AAE) of BC, which allows for the calculation of babs,BC(λ) (in units of Mm−1) from the measurements of babs,BC(λ) at 880 nm assuming that BrC does not absorb at 880 nm (e.g., Qin et al., 2018). It should be noted, however, that recent studies have shown the existence of specific dark BrC components in biomass burning (BB) smoke (tar balls or tar BrC) that can also absorb radiation in the near-infrared (e.g., Chakrabarty et al., 2010; Hoffer et al., 2016, 2017; Chakrabarty et al., 2023; Mathai et al., 2023). Thus, a contribution to near-IR absorption from the possible presence of dark BrC cannot be ruled and would lead to an underestimation of the BrC absorption reported here. However, the dark BrC contribution to absorption at 880 nm is expected to be smaller compared to that of BC. For example, Hoffer et al. (2017) reported that the absorption coefficient at 880 nm of dark BrC produced in a laboratory was 10 % of that at 470 nm and, consequently, even lower compared to that at 370 nm. Similarly, Cuesta-Mosquera et al. (2024) estimated a contribution of BrC to absorption at 880 nm of 3 % in a rural area in central Europe strongly affected by residential wood burning emissions in winter. Given the complexity of these specific BrC components, the imaginary refractive index (k) of tar balls generated in laboratory experiments varies over a wide range of values depending on the specific type of fuel (wood) burned and the different analytical method employed. For example, Mathai et al. (2023) reported k values at 550 nm of tar balls measured in ambient BB plumes 10 times lower than the values reported by Hoffer et al. (2016), Chakrabarty et al. (2010), Saleh et al. (2018), or Saleh (2020) for laboratory-generated particles. Also, Mathai et al. (2023) highlighted that even though Hoffer et al. (2016) and Chakrabarty et al. (2010) used similar methods, their k values were at least 10 times different. Thus, due to poorly characterized optical properties, the impact of tar BrC on IR absorption at ambient conditions is still uncertain. Consequently, here we follow the common practice of considering ambient BC to be the dominant absorber at 880 nm (e.g., Kirchstetter et al., 2004; Massabò et al., 2015; Liakakou et al., 2020; Zhang et al., 2020b; Yus-Díez et al., 2022).
One important source of uncertainty in Eqs. (1) and (2) is the AAE assumed for BC. In many studies a value of 1 was used (Liakakou et al., 2020; Tian et al., 2023; Cuesta-Mosquera et al., 2024, e.g.,). However, theoretical simulations have shown that the AAEBC can reasonably vary between 0.9 and 1.1 depending on the size and internal mixing of BC particles (Bond et al., 2013; Lu et al., 2015, e.g.,). Here we estimated the site-dependent AAEBC as the first percentile of the AAE frequency distribution. The AAE can be calculated from multi-wavelength (370, 470, 520, 590, 660, 880, and 950 nm) total absorption measurements as the linear fit in a log–log plot of the total absorption versus the measuring wavelengths. The effect of BrC absorption is to increase the AAE, and, consequently, the first percentile of AAE represents conditions where the absorption is dominated by BC. In order to reduce the noise, the first percentile at each site was calculated from AAE values obtained from a fit with R2>0.99 (Tobler et al., 2021; Glojek et al., 2024). Other approaches used a combination of Mie theory and experimental data to explore the wavelength dependence of AAEBC and proposed an estimation of babs,BrC(λ) based on the ratio between the AAE calculated from 370 to 520 nm and from 520 to 880 nm (Wang et al., 2018a; Li et al., 2019). However, this methodology assumed that BrC particles do not absorb at 520 nm, whereas it has been shown that the contribution of BrC to absorption at this wavelength can be high (e.g., Cuesta-Mosquera et al., 2024). As a consequence, other studies (e.g., Zhang et al., 2019; Luo et al., 2022) used the AAE calculated from 880 to 950 nm to calculate the AAEBC assuming that BrC particles do not absorb in the near-IR. Nevertheless, the latter methodology may suffer from additional uncertainties related to the possible low Aethalometer signal at 950 nm, which is frequently observed, especially at remote sites. Thus, it should be considered that the methodologies proposed to estimate AAEBC, including the use of the first percentile applied here, are prone to uncertainties. On the other hand, Zhang et al. (2020b) have reported an uncertainty of approximately 11 % in the estimation of the bAbs,BrC(370) contribution to bAbs,370 when using different AAE values ranging from 0.9 and 1.1. For sites included here, the first percentile method provides AAEBC values ranging from 0.928 to 1.088, confirming that this experimental method can provide reasonable estimations of the AAEBC. It should be noted that mineral dust particles from North African deserts can absorb at 880 nm even if much less efficiently compared to BC. We assumed that the effect of dust at the surface was present mostly in Mediterranean sites (such as BCN, MSY, and DEM) due to their proximity to dust source emissions (such as North African deserts). The measurements possibly affected by dust absorption were removed from the datasets of the above three sites. In the case of BCN and MSY, dusty days were detected using the methodology that has been officially accepted by the European Commission for reporting natural contributions to ambient PM levels over Europe (European Commission, 2011). At DEM, dusty days were detected and removed using the scattering Ångström exponent (SAE) from in situ surface nephelometer measurements available in the EBAS database (http://www.ebas.nilu.no, last access: 19 February 2025) assuming that SAE values lower than 1 indicate the presence of dust particles in the atmosphere (e.g., Valenzuela et al., 2015).
Figure 1 shows the average annual contributions of BC and BrC to the total absorption measured at 370 nm at 12 European stations, identified by color-coded markers indicating their background settings: yellow for urban, blue for suburban, and red for regional areas. Here we report the BrC absorption at 370 nm given that the BrC absorption efficiency is the highest in the UV spectral range, and consequently, the observed BrC absorption is less uncertain compared to the visible range. A low BrC contribution of around 14 % was observed at the urban sites of BCN and HEL, both affected by direct traffic emissions, making BC the dominant absorber at these sites (Okuljar et al., 2023; Via et al., 2021). The MAR urban site registered a higher BrC contribution (30 %), likely reflecting the accumulation of biomass burning emissions in winter and the presence of BrC sources such as shipping emissions (Corbin et al., 2018; Chazeau et al., 2022). Suburban stations, including SIR, KRA, and DEM, exhibit BrC contributions from 22 % to 30 %, reflecting a blend of local urban emissions and regional influences such as biomass burning and coal combustion. KRA is considered a pollution hotspot in Europe (e.g., Casotto et al., 2023), with high consumption of coal and wood (both important sources of BrC) for energy production and residential heating, making the OA concentrations measured in KRA the highest among the European measuring sites included in Chen et al. (2022). DEM and SIR are affected by biomass burning emissions, especially in winter, which causes a considerable accumulation of BrC during the cold season (see, e.g., Liakakou et al., 2020; Zhang et al., 2020a; Savadkoohi et al., 2023). Regional stations, represented by HYY, OPE, RIG, PAY, IPR, and MSY, display BrC contributions from 21 % to 41 %. These percentages indicate a mixture of biogenic sources, local emissions, agricultural activities, and transboundary pollution that affects the regional atmosphere. IPR stands out with the highest contribution (around 40 %), suggesting a significant contribution of low-temperature combustion processes such as residential sources (e.g., Putaud et al., 2018). Overall, although BC typically represents the most absorbing aerosols component at these stations (usually >70 %), it is noteworthy that BrC could contribute comparably to absorption in some instances.
2.2 Model description
2.2.1 The MONARCH atmospheric chemistry model
The MONARCH model (Jorba et al., 2012; Badia and Jorba, 2015; Badia et al., 2017; Klose et al., 2021b) consists of advanced chemistry and aerosol packages coupled online with the Nonhydrostatic Multiscale Model on the B-grid (NMMB; Janjic et al., 2001; Janjic and Gall, 2012). The model allows running both global and regional simulations with telescoping nests. Multiple choices of gas and aerosol chemistry schemes can be selected in the model. Here, we briefly describe the configuration adopted in this work.
The gas-phase chemistry solves the Carbon Bond 2005 chemical mechanism (CB05; Yarwood et al., 2005) extended with chlorine chemistry (Sarwar et al., 2012). The CB05 is well-formulated for urban to remote tropospheric conditions, and it uses photolysis rates computed with the Fast-J scheme (Wild et al., 2000) considering the physics of each model layer (e.g., clouds, absorbers such as ozone). A mass-based aerosol module describes the life cycle of dust, sea salt, BC, OA (both primary and secondary), sulfate, ammonium, and nitrate aerosol components (Spada, 2015). A sectional approach is used for dust and sea salt, while the other aerosol species are represented by a fine mode, except nitrate, which is extended with a coarse mode to consider the condensation of nitric acid on coarse particles. Sulfate production considers the gas-phase oxidation of both sulfur dioxide (SO2) and dimethyl sulfide, as well as the aqueous chemistry of SO2. The heterogeneous hydrolysis of N2O5 contributes to the production of nitric acid using the parameterization of Riemer et al. (2003). A thermodynamic equilibrium model (Metzger et al., 2002) solves the partitioning of semivolatile inorganic aerosol components in the fine mode, and an irreversible uptake reaction accounts for the production of coarse nitrate in dust and sea salt (Hanisch and Crowley, 2001; Tolocka et al., 2004). Different meteorology-driven emissions are computed online in MONARCH (i.e., mineral dust, sea salt, and biogenic gas species). The mineral dust scheme of the model is described in detail in Pérez et al. (2011) and Klose et al. (2021b). Sea salt emissions are calculated following the source function of Jaeglé et al. (2011) as described in Spada et al. (2013), while biogenic non-methane volatile organic compounds (NMVOCs) and soil NO emissions are estimated with the Model of Emissions of Gases and Aerosols from Nature (MEGAN) v2.04 model (Guenther et al., 2006).
Black carbon is represented in MONARCH following Chin et al. (2002). Two primary hydrophobic–hydrophilic modes are defined with an aging process converting mass from the hydrophobic to the hydrophilic mode with a lifetime of 1.2 d. Primary emissions are assumed to be emitted as 80 % hydrophobic.
The simple scheme proposed in Pai et al. (2020) is adopted to model OA. It is computationally efficient and reproduces the organic mass well assuming fixed SOA yields adjusted to match results from the more complex volatility-based scheme approach. Here, we briefly describe the scheme. Primary organic carbon (OC) emissions are emitted as 50 % hydrophobic and 50 % hydrophilic species. An OA OC ratio of 1.4 is adopted for the hydrophobic component, while the hydrophilic one assumes an OA OC ratio of 2.1 to convert OC to OA mass transported in the model. Similarly to BC, atmospheric aging of hydrophobic to hydrophilic primary species is simulated with a conversion lifetime of 1.15 d. In our implementation, no marine primary organic aerosol is considered. The scheme includes sources of SOA precursors from biogenic, pyrogenic, and anthropogenic origin with fixed SOA yields. Biogenic sources of SOA use a 3 % yield for isoprene and 10 % yield for both monoterpenes and sesquiterpenes. 50 % of biogenic SOA is emitted directly to account for the near-field formation of SOA. On the other hand, precursors from combustion emissions are scaled from CO emissions as a proxy, 1.3 % of which come from fires and biofuels (combustion sources) and 6.9 % from fossil fuels. The gas-phase SOA products are converted to the aerosol phase based on a first-order rate constant with a lifetime of 1 d.
2.2.2 Optical properties
We use an offline optical package (Obiso, 2018) to calculate the absorption by OA using the mass concentration simulated by the model. The package allows calculating intensive optical properties of a size-distributed particle ensemble, including the absorption efficiency (Qa) as the difference between extinction and scattering efficiencies (Mishchenko et al., 2002). The required input physical properties of the aerosols are the size distribution, the complex refractive index, the particle shape, and the hygroscopicity. Our package only uses the lognormal size distribution that is defined by two parameters: the geometric radius (rg) and the standard deviation (σg). The real (n) and imaginary (k) parts of the complex refractive index determine the scattering and absorption properties of the particles, respectively, and primarily depend on their internal composition. A spherical shape is assumed by default in the package, while the water uptake of the hydrophilic modes is taken into account through a grid of hygroscopic growth factors (α) defined for specific values of relative humidity (RH). The assumption of external mixture is adopted in the calculation of the absorption by OA.
The package is built on a dataset of monodisperse single-wavelength optical properties, pre-calculated using the Mie theory code by Mishchenko et al. (2002), whose structure allows computational efficiency while preserving application flexibility. In general, the optical properties of a single particle depend on the ratio of its size to the incident wavelength, rather than on those two quantities separately (Mishchenko et al., 2002). For this reason, the dataset is calculated on a grid of size parameters (, where r and λ are the particle radius and the incident wavelength, respectively) ranging from 0.011 to ∼1000. Following Gasteiger and Wiegner (2018), we apply an increment of 1 % to each grid value xi to obtain the next one; moreover, we store the optical properties integrated in very narrow size bins centered in each xi and ranging from to . The entire set of size parameters is then considered for a grid of real indexes (ranging from 1.3 to 2, with a step of 0.05) and imaginary indexes (from 0 to 1, with varying resolution across different orders of magnitude).
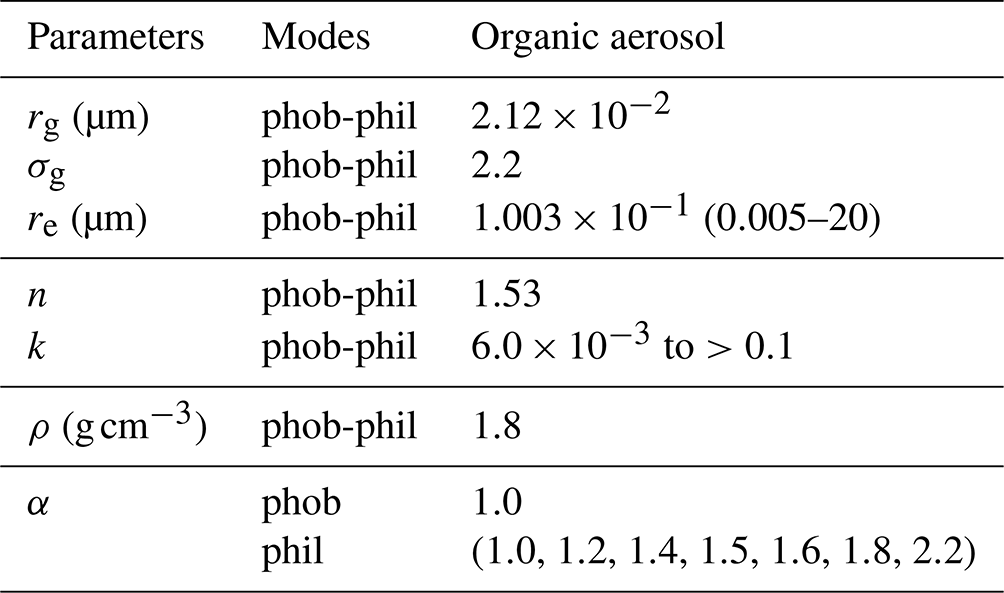
The physical properties of OA used in this work that align with the model aerosol representation are presented in Table 2. Size distribution and standard refractive indexes are taken from the Optical Properties of Aerosols and Clouds (OPAC) database (Hess et al., 1998). The hygroscopic growth factors for seven prescribed RH values are from Chin et al. (2002). Once the working wavelength of 370 nm is defined, which allows mapping the size parameters onto particle radii, the needed pre-calculated optical efficiencies are integrated over the input size distribution. Then, the actual extinction and scattering efficiencies corresponding to the input refractive index are obtained by means of bilinear interpolation from the integrated values at the four closest gridded refractive indexes. The water uptake affects both the input size distribution and refractive index of the hydrophilic modes of OA. Once a specific RH level calculated by the model is read, the corresponding hygroscopic growth factor is set by linearly interpolating between the closest gridded values and subsequently applied to the geometric radius of the size distribution (as well as to the extremes of the size integration): . The refractive index of the wet particles is obtained as the volume-weighted mean of the refractive index of the dry particles and that of water (the latter taken from Segelstein, 1981).
Once the size-integrated absorption efficiency is obtained, the absorption coefficient of OA is calculated as follows:
where Qa,w is the wet absorption efficiency, α3 is the wet-to-dry mean volume ratio, ρ is the mass density of the dry particles (Table 2), re,w is the wet effective radius (defined as the projected-surface-weighted mean radius), and M is the mass concentration of OA from the model. Note that the wet quantities only refer to the hydrophilic OA modes and tend towards the corresponding dry quantities for the hydrophobic mode (for which α=1).
Table 2Microphysical properties of the OA species implemented in the MONARCH model and used in this work for optical calculations (Spada, 2015; Chin et al., 2002; Hess et al., 1998): geometric radius (rg), standard deviation (σg) and effective radius (re) of the size distribution, real (n) and imaginary (k) refractive indexes, mass density (ρ), and hygroscopic growth factor (α). In the second column, phob stands for “hydrophobic mode” and phil for “hydrophilic mode”. The range extremes used for size integration (r1−r2) are reported within parentheses close to the corresponding re values. The seven values for α apply to the hydrophilic modes and are relative to RH levels of 0 %, 50 %, 70 %, 80 %, 90 %, 95 %, and 99 %. The refractive indexes reported are relative to a wavelength of 550 nm.
2.2.3 Emissions
The High-Elective Resolution Modelling Emission System version 3 (HERMESv3; Guevara et al., 2019, 2020) is used to provide anthropogenic, biomass burning, and ocean emissions to be used as input in the MONARCH model. In this study, we employ the global–regional module (HERMESv3_GR; Guevara et al., 2019), which allows users to flexibly combine gridded global and regional emission inventories. In addition, this module facilitates the application of country-specific scaling factors and masks. HERMESv3 disaggregates the original datasets both spatially and temporally and applies user-defined speciated emissions.
In this study, we used the European-scale emission inventory CAMS-REG-AP_v4.2 (Kuenen et al., 2022), developed under the Copernicus Atmosphere Monitoring Service (CAMS). Within this framework, CAMS-REG-AP_v4.2_REF2 represents a specific dataset or version of the CAMS-REG-AP_v4.2 inventory, which adopts a harmonized approach for consistently including the condensable fraction for residential wood combustion (RWC) particulate matter emissions. It is important to address the previously identified inconsistencies across European inventories, as highlighted by Denier Van Der Gon et al. (2015), which mainly stem from variable emission factors used by different countries accounting (or not) for condensables impacting modeling results (e.g., Navarro-Barboza et al., 2024). To accurately quantify biomass burning (BB) emissions, our study utilized data from the Global Fire Assimilation System version 1.2 (GFASv1.2) analysis. This dataset provides detailed emission fluxes derived from satellite information for various sources such as forest, grassland, and agricultural waste fires (Kaiser et al., 2012). Additionally, for oceanic dimethyl sulfide (DMS) emissions, we relied on the CAMS Global Ocean dataset (Lana et al., 2011; Granier et al., 2019).
2.3 Model simulations
We used the MONARCH model with a domain that covers the European continent and part of North Africa at a horizontal resolution of ∼20 km, as shown in Fig. 2. Perturbation runs (commonly know as the brute force method) were conducted to apportion the contribution from fires, traffic, shipping, residential, and other sources. Biomass burning emissions derived from the GFASv1.2 product are tagged (GFAS) as one of the main contributors to OA absorption. Traffic emissions (TRAF) categorized under sectors GNFR_F1, F2, F3, and F4 account for exhaust and non-exhaust emissions of gasoline, diesel, and liquefied petroleum gas vehicles. Shipping emissions (SHIP) are derived from the GNFR_D sector. The emissions from commercial, institutional, and residential sources (RESI) consider a wide range of sources related to buildings and facilities and are categorized under sector GNFR_C. RESI includes activities of combustion in different types of devices, including boilers, turbines, engines, and chimneys, for different fuel types (i.e., natural gas, wood, fuel oil, liquid petroleum gas (LPG), coal). In this sector, only combustion activities related to space heating, cooking, and water heating are included (cleaning activities are not considered). Furthermore, the rest of sources are tagged together as other sources (OTHR) including public power, industry, fugitives, solvents, aviation, off-road, waste, agriculture, and biogenic emissions.
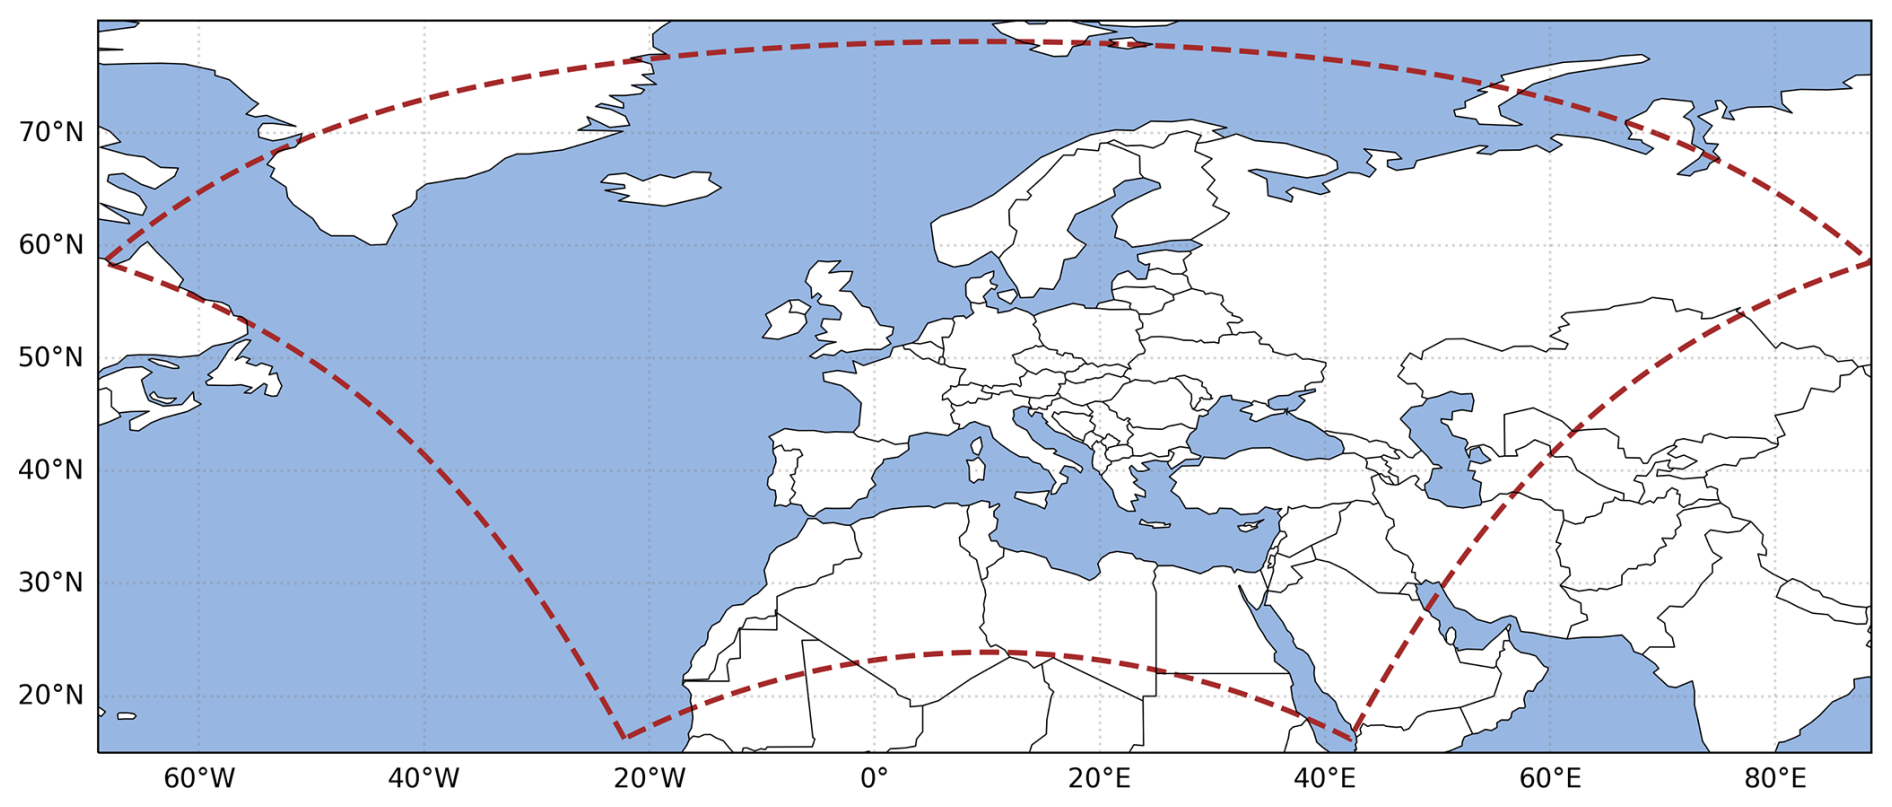
Figure 2Model domain at ∼20 km horizontal resolution.
The model ran with 24 vertical layers and a top of the atmosphere set at 50 hPa. Meteorology initial and boundary conditions were obtained from the ECMWF global model at 0.125° and the chemical boundary conditions from the CAMS global system at 0.45° (Flemming et al., 2015). The emissions were processed as described in Sect. 2.2.3. The atmospheric meteorological variables are initialized every 24 h to keep the modeled circulation close to observations, while the chemistry initial conditions are those prognostically estimated by MONARCH (i.e., every day the model uses as an initial state for these variables their modeled value at 24:00 UTC the day before). A spin-up period of 15 d is used to derive the chemistry initial conditions for 2018.
For efficient execution of the MONARCH modeling chain, we utilized the autosubmit workflow manager, a tool proven to be effective in such complex modeling simulations (Manubens-Gil et al., 2016).
2.4 Offline refractive index optimization
Since k is a highly uncertain parameter with a strong dependence on the sources of OA, we employed a method to derive an optimized k for each OA component (aggregating both primary and secondary contribution) that combines the results of the perturbation runs, which provides source apportionment of OA mass, and observations described in Sect. 2.1.
Based on the aerosol mass calculated by the model, we use the offline optical tool described in Sect. 2.2.2 to derive k values that minimize the error with the absorption measured at the 12 monitoring stations across Europe (Fig. S1 illustrates the steps of the optimization process). The optimized k values are derived using the SLSQP algorithm (Sequential Least Squares Programming), which is particularly well-suited for nonlinear objective functions and constraints to minimize a cost function. This process handles the task of minimizing the error between the modeled and observed absorption. The cost function calculated here evaluates this error at each time step, guided by predefined bounds for k values derived from Saleh (2020). These conditions categorize OA absorption into four optical classes: very weakly absorptive OA (VW-OA), weakly absorptive OA (W-OA), moderately absorptive OA (M-OA), and strongly absorptive OA (S-OA). Note that the Saleh (2020) categories for OA absorption were derived from 20 chamber experiments that may not be completely representative of ambient conditions in the field. Regarding the constraints used in the SLSQP algorithm, we have applied the condition which is based on extensive experimental and modeling results (Andreae et al., 1998; Bond et al., 2013; Laskin et al., 2015; Saleh, 2020), suggesting that OA from fires exhibits the highest k values. The resulting k values are representative of OA in environmental conditions, which may include interactions with other species, providing an empirical range of k values that account for various OA sources and potential interference.
For the computation of k at 370 nm within the optimization module, we adopt the equation described in Saleh (2020), which describes the wavelength dependency of k for BrC:
where k550 represents the imaginary refractive index (k) at 550 nm, λ is the wavelength in nanometers (nm), and w denotes the wavelength dependence. The values of w and k550 for each OA class (VW-OA, W-OA, M-OA, and S-OA) were determined based on Table 1 in Saleh (2020).
The optical calculation relies on the external mixing assumption. Attempting to constrain k of OA by assuming internal mixing or core–shell configurations with other species would be complex and unlikely to yield results with less uncertainty. The internal mixing approach would introduce additional modeling uncertainties, such as mixing rules, refractive indices of other species, and OA fractions relative to these species. Therefore, assuming externally mixed OA is considered a simpler approximation and more suited to constrain source-specific contributions, despite its inherent limitations.
2.5 Scenario-based approach for k optimization
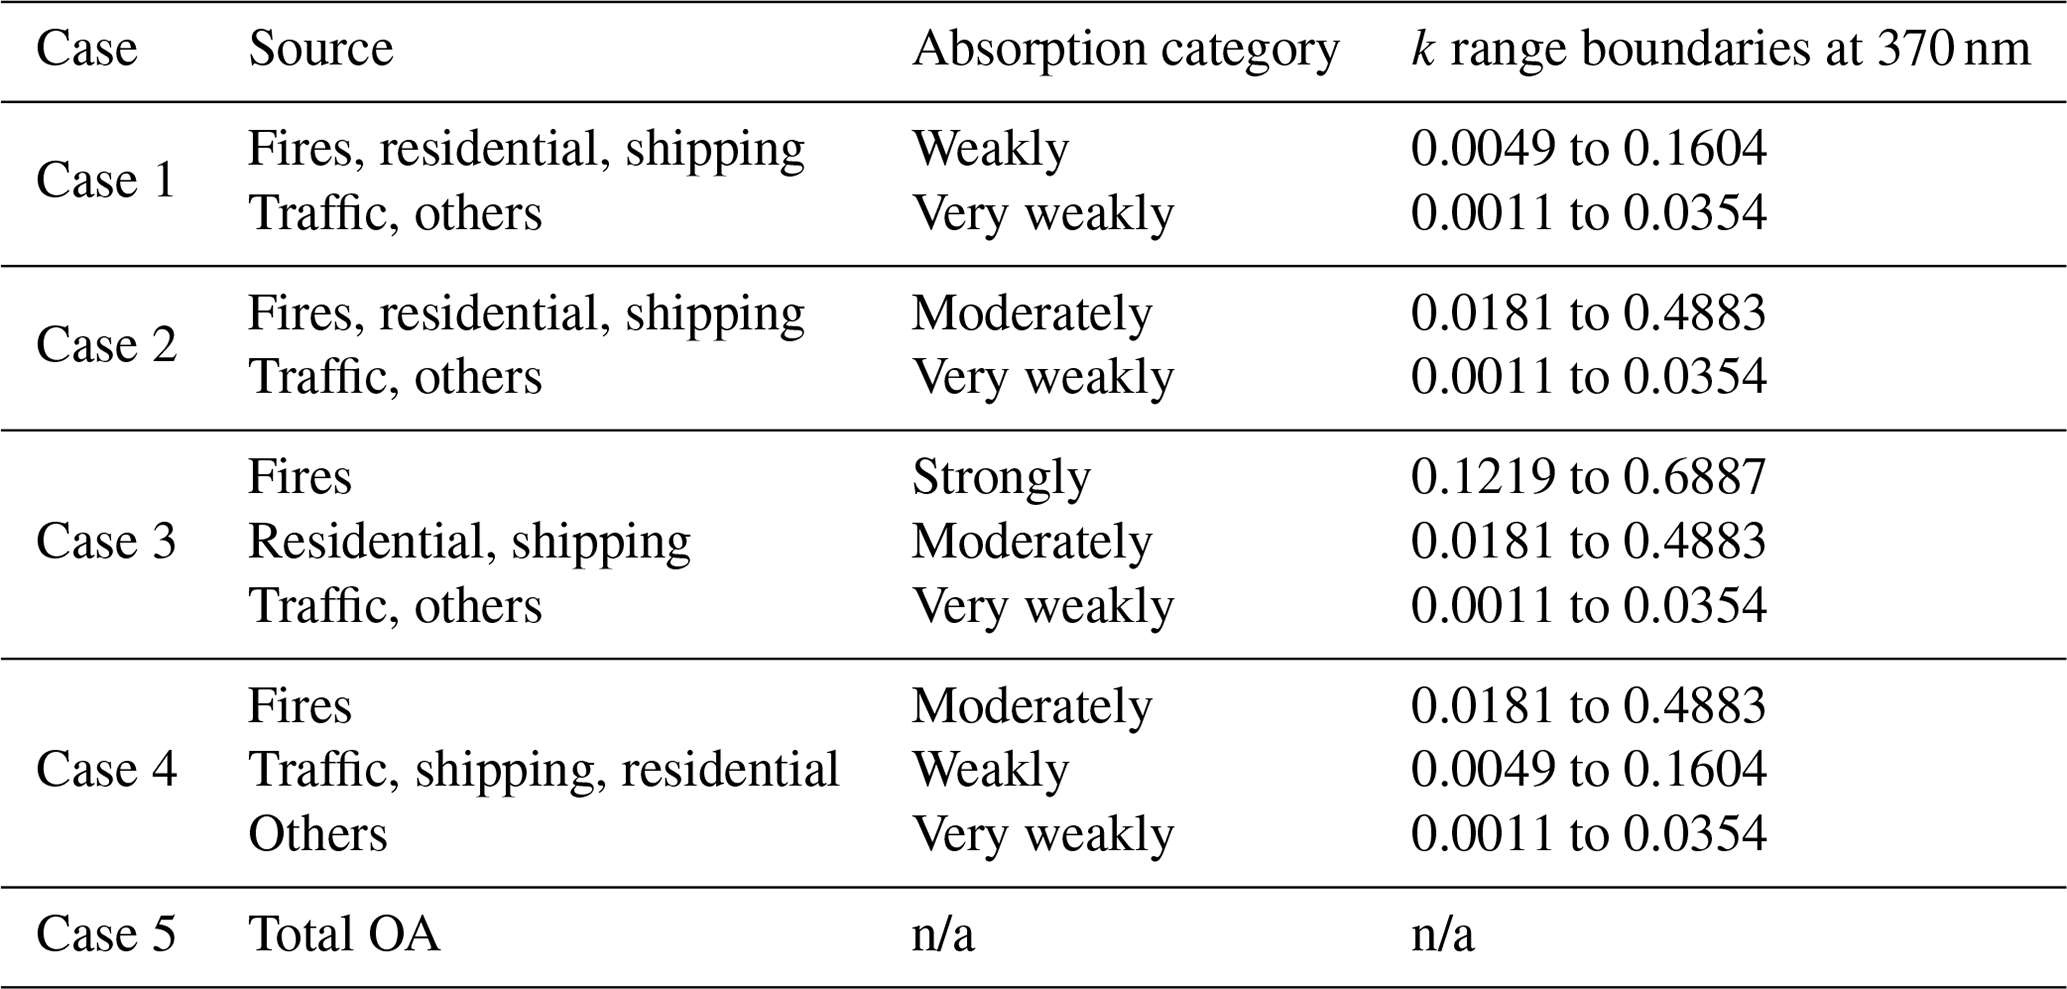
To investigate the absorption characteristics of different sources of OA, we have defined six distinct optimization cases, labeled Case 1 through Case 5, as detailed in Table 3. In particular, each case imposes different boundaries for the optimization method described above that are used to find the optimal k value for a specific OA source. The ranges, originally specified at 550 nm based on chamber experiments (Saleh, 2020), were adapted to 370 nm using the wavelength dependence (w values) provided in Table 1 of Saleh (2020). It is important to note that while the k ranges at 370 nm are broader and may overlap between categories, this is attributed to the greater wavelength dependence observed.
Table 3Scenarios and ranges of k used in the optimization process. n/a – not applicable.
We followed two strategies to optimize k. The first approach involves optimizing k individually at each monitoring station, allowing for a tailored assessment that accounts for local variations in the properties of OA. The second strategy consolidates data from all stations to derive a single unified k value, providing a broader and more generalized perspective on OA absorption characteristics. Both methods were applied separately for specific sources of OA and for the total OA observed, enabling a comprehensive analysis of the influence of source-specific and aggregated OA contributions on absorption properties. This dual approach ensures a robust optimization process that accommodates both localized and generalized environmental conditions.
As detailed in Table 3, Case 1 categorizes OA from fires (GFAS), residential (RESI), and shipping sources (SHIP) as weakly absorbing, with k values ranging from 0.0049 to 0.1604. In contrast, traffic (TRAF) and other sources (OTHR) are considered very weakly absorbing, with k values from 0.0011 to 0.0354. Case 2 adjusts the absorption levels for OA from GFAS, RESI, and SHIP to moderately absorbing, with k values from 0.0181 to 0.4883, while maintaining the same very weak absorption for TRAF and OTHR sources as observed in Case 1. In Case 3, OA from GFAS is assigned strong absorption properties with k values from 0.1219 to 0.6887, whereas RESI and SHIP are treated as having moderate absorption, similar to the k values in Case 2, and the TRAF and OTHR sources continue to be categorized as very weak absorbers. Case 4 adjusts the absorption categorization, treating fires with moderate absorption, while TRAF, SHIP, and RESI are considered weakly absorbing, and OTHR remains very weakly absorbing. Finally, Case 5 involves calculating the optimized k by integrating all OA components (ALL) without predefined boundaries, facilitating a comprehensive exploration of k values. Note that the contribution from both primary and secondary aerosols is accounted for within each OA categorization.
3.1 OA mass and source contribution
Our study focuses on understanding the light absorption properties of OA across different European environments. Since the light absorption of OA (ba) is intrinsically related to its mass concentration, the first step is to evaluate the accuracy and reliability of our model in simulating mass concentrations.
Figure 3 shows the time series of the measured and modeled OA mass concentrations for 2018 (note the varying y-axis scales in different panels).
The modeled concentrations of OA, derived from the source-tagged simulation, are represented by filled colors, where each color shows the contribution from different emission sources. Specifically, SHIP is marked in purple, RESI emissions in light blue, GFAS in orange, TRAF in black, and OTHR in brown (only the primary contribution is shown). Additionally, the secondary organic aerosol (SOA) contribution is depicted in green.
Overall, good agreement is observed between measured and modeled OA concentrations. We followed the performance assessment approach recommended by Emery et al. (2017) for statistical evaluation of photochemical models. These recommendations are based on statistical metrics that should meet the “goal” or “criteria” proposed by Boylan and Russell (2006), where the goal signifies the peak performance expected from a model, and the criteria represent a level of performance that should be achievable by most models (see Table S1 in Sect. S2 in the Supplement). A detailed statistical evaluation is included in Sect. S3. In general, the criteria are met in most stations and seasons, although some sites fall short of the more stringent goal (Table S2). A key trend observed is that the model performs most robustly during the spring season (MAM), with many stations reaching the goal and criteria. In contrast, the summer (JJA) and winter (DJF) seasons exhibit greater variability.
The residential component consistently emerges as the predominant source across all monitoring sites. A consistent seasonal pattern is evident, particularly during colder months, which is likely associated with the increase in residential heating demand during these months. However, Navarro-Barboza et al. (2024) identified inaccuracies in carbonaceous aerosol emissions attributed to the residential sector within the CAMS_REGv4.2 emission inventory for some western Mediterranean stations (Barcelona – BCN; Montseny – MSY), suggesting an overestimation of its contribution, which was particularly relevant during winter. This issue is shown in Fig. S3 and Sect. S4 in the Supplement, where results using a local bottom-up emission inventory for Spain (Guevara et al., 2020) reveal that traffic emissions are more significant than residential emissions at these sites. This represents a limitation of the dataset utilized in this study and underscores the need for continuous improvement of continental-scale emission inventories such as CAMS_REGv4.2, which remains among the best resources for modeling studies in Europe.
The second most significant contributor to OA mass is SOA, particularly during summer months. SOA shows important spatial and temporal variability, with mass formation peaking during warm periods. For example, as observed in HYY, the model tends to underestimate the high observed OA concentrations in July associated with high SOA mass formation (Heikkinen et al., 2021; Yli-Juuti et al., 2021). Similarly, the model underestimates the high OA concentrations observed in MSY in summer, which were also driven by SOA (e.g., In't Veld et al., 2021). The SOA yields utilized in this model simulation for biogenic precursors, as derived from Pai et al. (2020), might result in limited SOA production and could account for this negative bias.
Other contributions (OTHR) increase during the warm months in most stations, except KRA and IPR. The increase in activity could be related to the increased agricultural practices prevalent during the warmer period (e.g., agricultural waste burning). The emissions of SHIP contribute significantly to stations near ports, such as BCN, DEM, and MAR. The traffic contribution (TRAF) remains fairly low across all sites, although according to Chen et al. (2022), this component should be more pronounced at urban stations such as BCN, MAR, and HEL but non-negligible at non-urban stations. The low contribution of TRAF suggests a need for refinement in the emission inventory as discussed above.
Specific events, such as forest fires or high-pollution episodes, are reflected in pronounced peaks in both modeled and observed concentrations, highlighting the model's ability to respond to such episodes. In particular, a significant peak is observed towards the end of July in the MAR and DEM stations, potentially linked to a specific forest fire event, as depicted by the model fire contribution (orange in Fig. 3). This is corroborated by observations at DEM, although no observational data are available for MAR for that episode. However, the model does not effectively capture high-pollution events in KRA during winter, where peaks exceeding 60 µg m−3 were monitored. KRA is recognized as a major pollution hotspot in Europe (e.g., Casotto et al., 2023), mainly due to the extensive use of coal and wood for energy production and residential heating. This likely explains the elevated levels of OA monitored in KRA during the winter of 2018, since the prohibition of solid fuels (coal and wood) in boilers, stoves, and fireplaces was only implemented after September 2019. Furthermore, KRA's location within a basin with poor ventilation makes it susceptible to air pollution buildup (Sekula et al., 2022). These factors indicate potential shortcomings in the emissions data and the model's ability to accurately simulate strong inversion events.
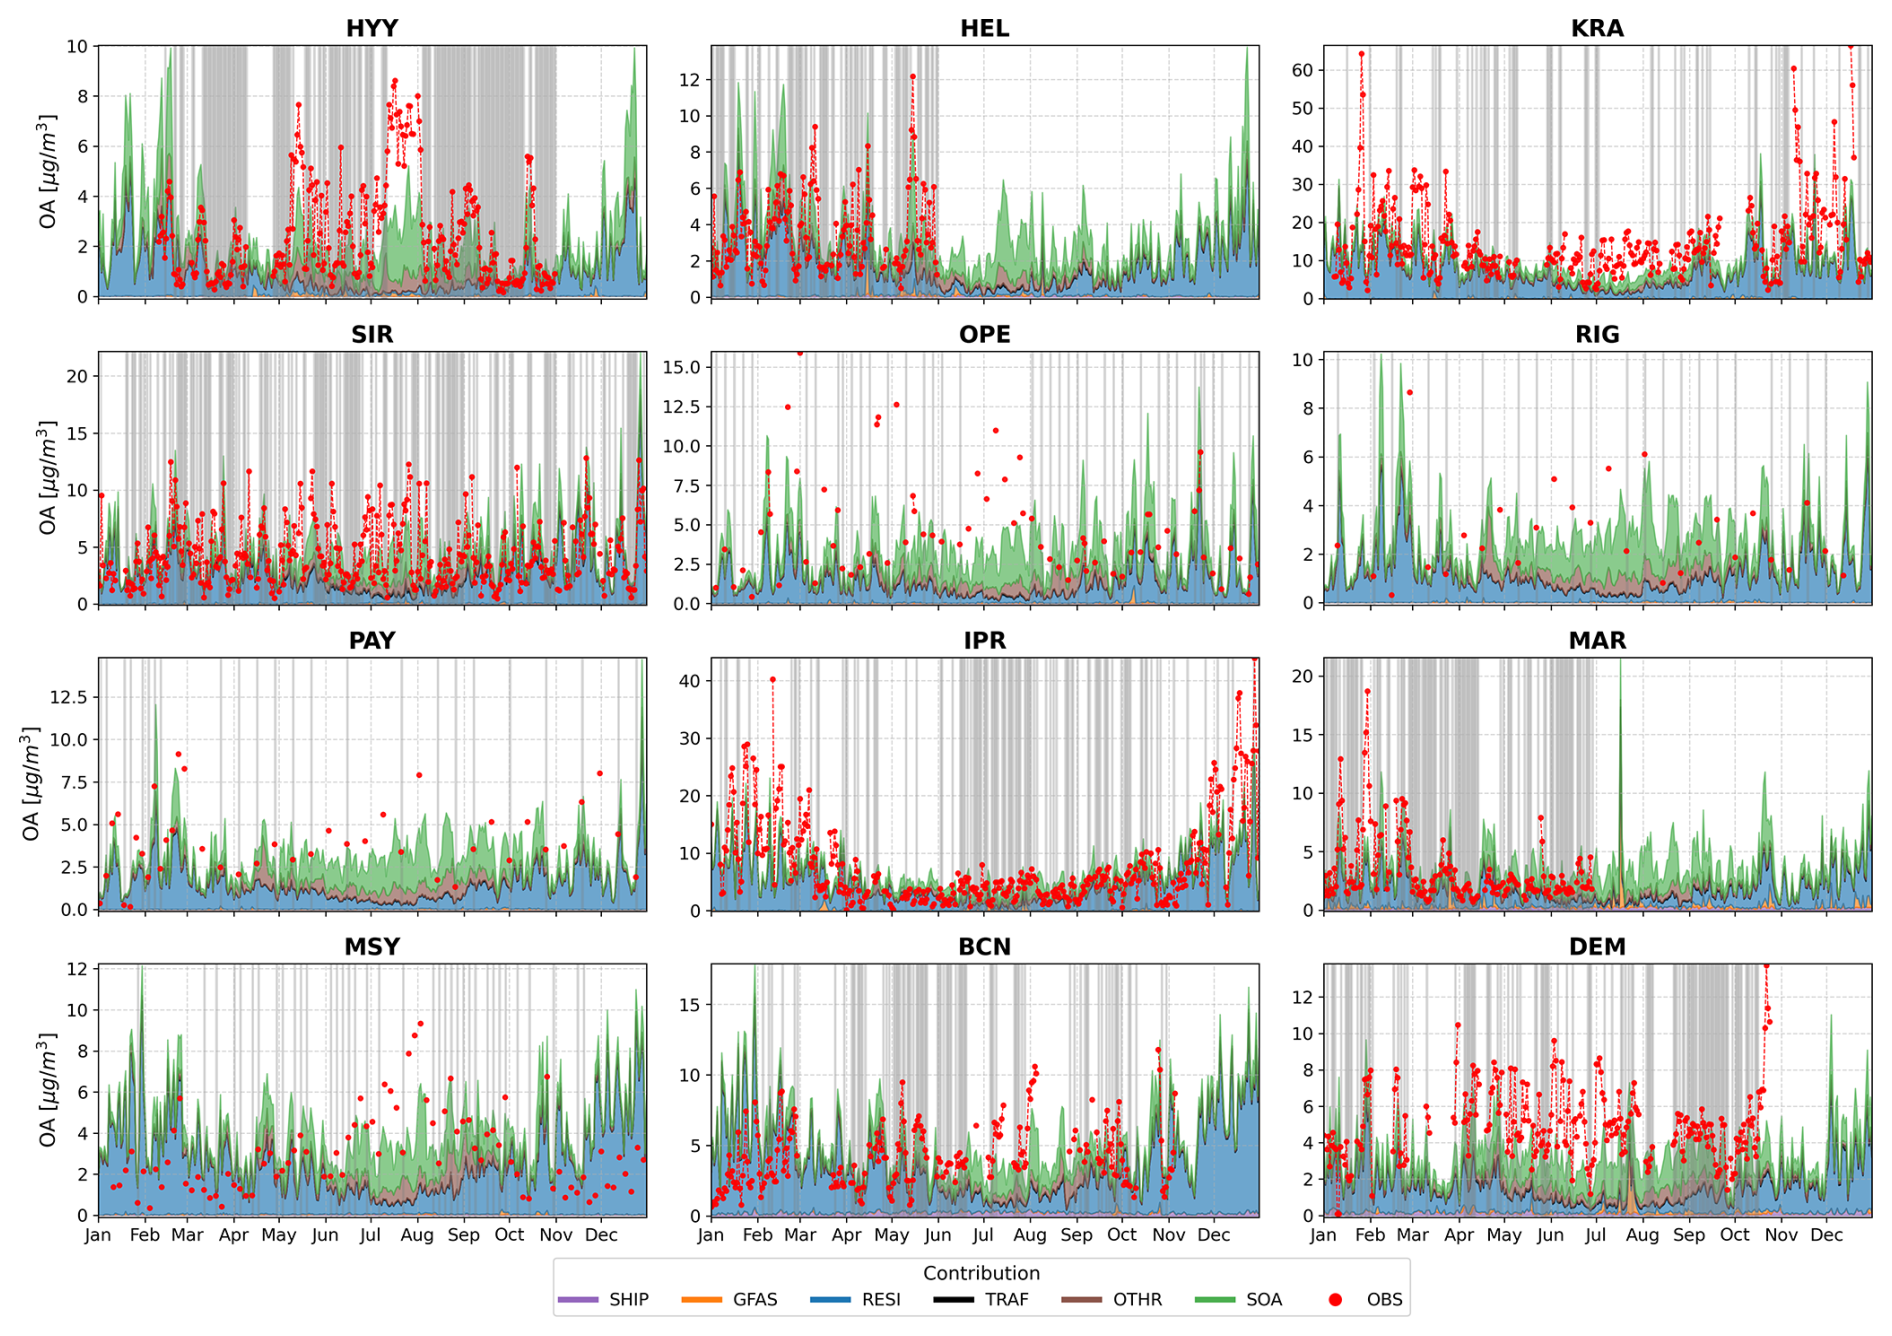
Figure 3Observed and modeled daily mean OA mass concentrations [µg m−3] at 12 European monitoring stations. Stacked colors represent contributions from different emission sources: shipping (SHIP), residential (RESI), fires (GFAS), and other (OTHR). SOA is shown as a separate component. Observed data points are indicated with red points. Gray background indicates that the bias is within an acceptable range (±1.5 µg m−3). Y-axis scales differ across panels.
3.2 Imaginary refractive index (k) optimization
The optimization of the imaginary refractive index (k) at 370 nm for OA across the 12 measurement stations presented challenges, primarily due to limitations in data coverage. Data points for the optimization process were selected based on their consistency with observed OA concentrations. However, the availability of data varied significantly between stations, imposing limitations on the optimization process.
This data coverage gap could potentially affect the representativeness of the k optimization results. The optimization process used a bias threshold, selecting only days where the simulation fell within ±1.5 µg m−3 of the OA measurements (gray background in Fig. 3). This approach aimed to improve the reliability of the results despite data limitations.
A detailed discussion of the optimized k values for Cases 1 through 4 is provided in Sect. S5. Overall, Case 4 was considered the most appropriate result to analyze absorption at the 12 measurement sites based on the consistent convergence of the different sources. A robust estimation of GFAS k in-between weakly and moderately absorbing OA was found, suggesting that GFAS OA cannot be treated as strongly absorbing. A similar result applies for RESI. In contrast, SHIP OA emissions appeared to be more weakly absorbing than moderately absorbing, whereas TRAF emissions leaned toward weakly absorbing rather than very weakly absorbing. Very low k values were derived for OTHR sources, confirming their very low absorption properties. In summary, the obtained k values followed the order GFAS>RESI>TRAF>SHIP>OTHR.
Figure 4 shows the resulting k at 370 nm for total and individual components of OA in the 12 sites. Results from two approaches are shown: optimizing k by individual station (stn) and by combining all data points (all). The figure compares results from Case 4, which uses source-tagged contributions, and Case 5, which applies a single value for all sources without source tagging.
Optimization based on the total OA mass per station, as in Case 5 (by stn), results in k values ranging from 0.005 (MSY site) to 0.07 (PAY site), which are representative of very weakly to weakly–moderately absorbing OA (Table 3). In fact, 0.07 also falls within the lower range of the moderately category. This is a result of the overlap of k ranges at 370 nm as mentioned before.
For REG stations, the optimized k values are notably low, reflecting the importance of the contribution of biogenic SOA at these sites. MSY stands out with the lowest k value of 0.005, which can be explained by the large contribution to OA from biogenic SOA (over 50 %) characterized by very low absorption properties (In't Veld et al., 2023; Nakayama et al., 2010, 2012). Similarly, the low k value (0.01) derived for HYY also indicates a high presence of biogenic SOA (Chen et al., 2022). Among regional stations, the highest OA k values were obtained for IPR (0.03) and PAY (0.03), likely reflecting the influence of agricultural and domestic biomass burning sources at these sites and the strong accumulation of absorbing POA in winter (see Fig. 3) (Lanz et al., 2010; Bozzetti et al., 2016; Daellenbach et al., 2017; Wolf et al., 2017).
In suburban environments, represented by KRA, SIR, and DEM, the k values suggested a mix of urban influence and regional aerosol contributions. For KRA, a pollution hotspot, a k value of 0.02 was derived. A moderately absorbing environment is likely due to coal combustion, shipping activities from river cruise boats, and household heating emissions (Casotto et al., 2023; Skiba et al., 2024). On the other hand, SIR and DEM present k values of 0.01 and 0.02, respectively, and are representative of environments that mix local urban emissions with regional air masses.
For urban stations, such as HEL, MAR, and BCN, weakly to moderately absorbing OA is derived, reflecting the diverse nature of urban emissions. Both HEL and BCN have similar k (0.0284 and 0.0262), while MAR presents a notably higher value (0.0494). The latter is attributed to harbor activities and local industrial emissions at that site (e.g., Chazeau et al., 2022).
Comparing the results with the single k derived from Case 5 (all) (dark green bars in Fig. 4), which corresponds to k of 0.02, suggests that OA across the different environments can be described on average as weakly absorbing. This result is attributed to the averaging effect of combining highly absorbing components with those that are very weakly absorbing into a single, undifferentiated category. Consequently, the optimization in this case likely masks the variability in absorption strengths of individual OA components observed across Europe and may introduce biases in model absorption estimates.
Now, we analyze the results using the granular data provided by each individual station and emission source, as in Case 4 (by stn), wherein the optimization is performed independently at each site (blue bars in Fig. 4), yielding different k values for each source. The observed variability for each component is as follows: GFAS ranges from 0.03 to 0.13, RESI from 0.008 to 0.13, SHIP from 0.005 to 0.08, TRAF from 0.005 to 0.07, and OTHR from 0.001 to 0.02. These variations are associated with the different environmental conditions of each station, within the limitations of our methodology to properly describe each environment and the fact that sources that are negligible at a specific site introduce additional complexity in deriving a robust estimate of k.
Among regional background stations, PAY stands out, showing the highest k for GFAS (0.13) and RESI (0.13) components, suggesting the significant influence of sources such as residential heating, which was previously observed by Ciarelli et al. (2016), or the strong impact of regional events such as wildfires or agricultural waste burning. In contrast, RIG shows the lowest k for GFAS (0.03), while MSY presents the lowest value for RESI (0.008). As our optimization of k relies on comparing absorption measurements with modeled OA source components (assuming ranges of k from different sources), there is an inherent relationship between mass contribution and absorption. This implies that although k is independent of mass, a sector contribution could assign higher or lower k values depending on the model uncertainties. Therefore, at regional sites like MSY, the lower k values for RESI may indicate reduced residential activity, as shown by Pandolfi et al. (2014) and Navarro-Barboza et al. (2024).
Suburban stations such as SIR, KRA, and DEM show consistent results across components, with k values for sources like GFAS and RESI significantly higher than for SHIP, TRAF, and OTHR. The k values for RESI and GFAS in DEM are nearly twice as high as those derived in SIR and KRA, indicating a mix of urban influence and regional aerosol contributions.
Conversely, urban stations, including HEL, MAR, and BCN, present significant variability, reflecting the diverse nature of urban emissions. MAR shows the highest k for GFAS and RESI (0.13), suggesting a strong contribution to absorption from these sources. Notably, TRAF (0.06) is more significant in these urban stations compared to regional and suburban locations. In HEL, k from shipping indicates a non-negligible contribution from this source, while in BCN, OTHR emerges as more significant (0.02), highlighting the complex and varied nature of urban aerosol sources.
Finally, Case 4 (all), represented by orange bars in Fig. 4, involved optimization by aggregating data from all stations while still differentiating between sources. The resulting k values were 0.06 for GFAS, 0.04 for RESI, 0.06 for SHIP, 0.005 for TRAF, and 0.0011 for OTHR. These results are consistent with those reported in the literature. For instance, Feng et al. (2013) derived a k of 0.075 for moderately absorbing BrC from biomass burning at 350 nm, which is in agreement with our optimization results for GFAS. Similarly, the k value for SHIP is consistent with Corbin et al. (2018), who reported a comparable value of 0.045 at 370 nm for this source. The optimized value for RESI is also consistent with the literature, considering its association with biofuel combustion. Our estimation for TRAF, however, appears to be more than 2 times higher than the value found in the literature for this source (0.002 at 365 nm for octane combustion as reported by Hossen et al., 2023). Nonetheless, we have observed considerable variability among URB sites, highlighting the intricate nature of urban environments. OTHR is identified as the least absorbing source, which is a reasonable outcome given its categorization.
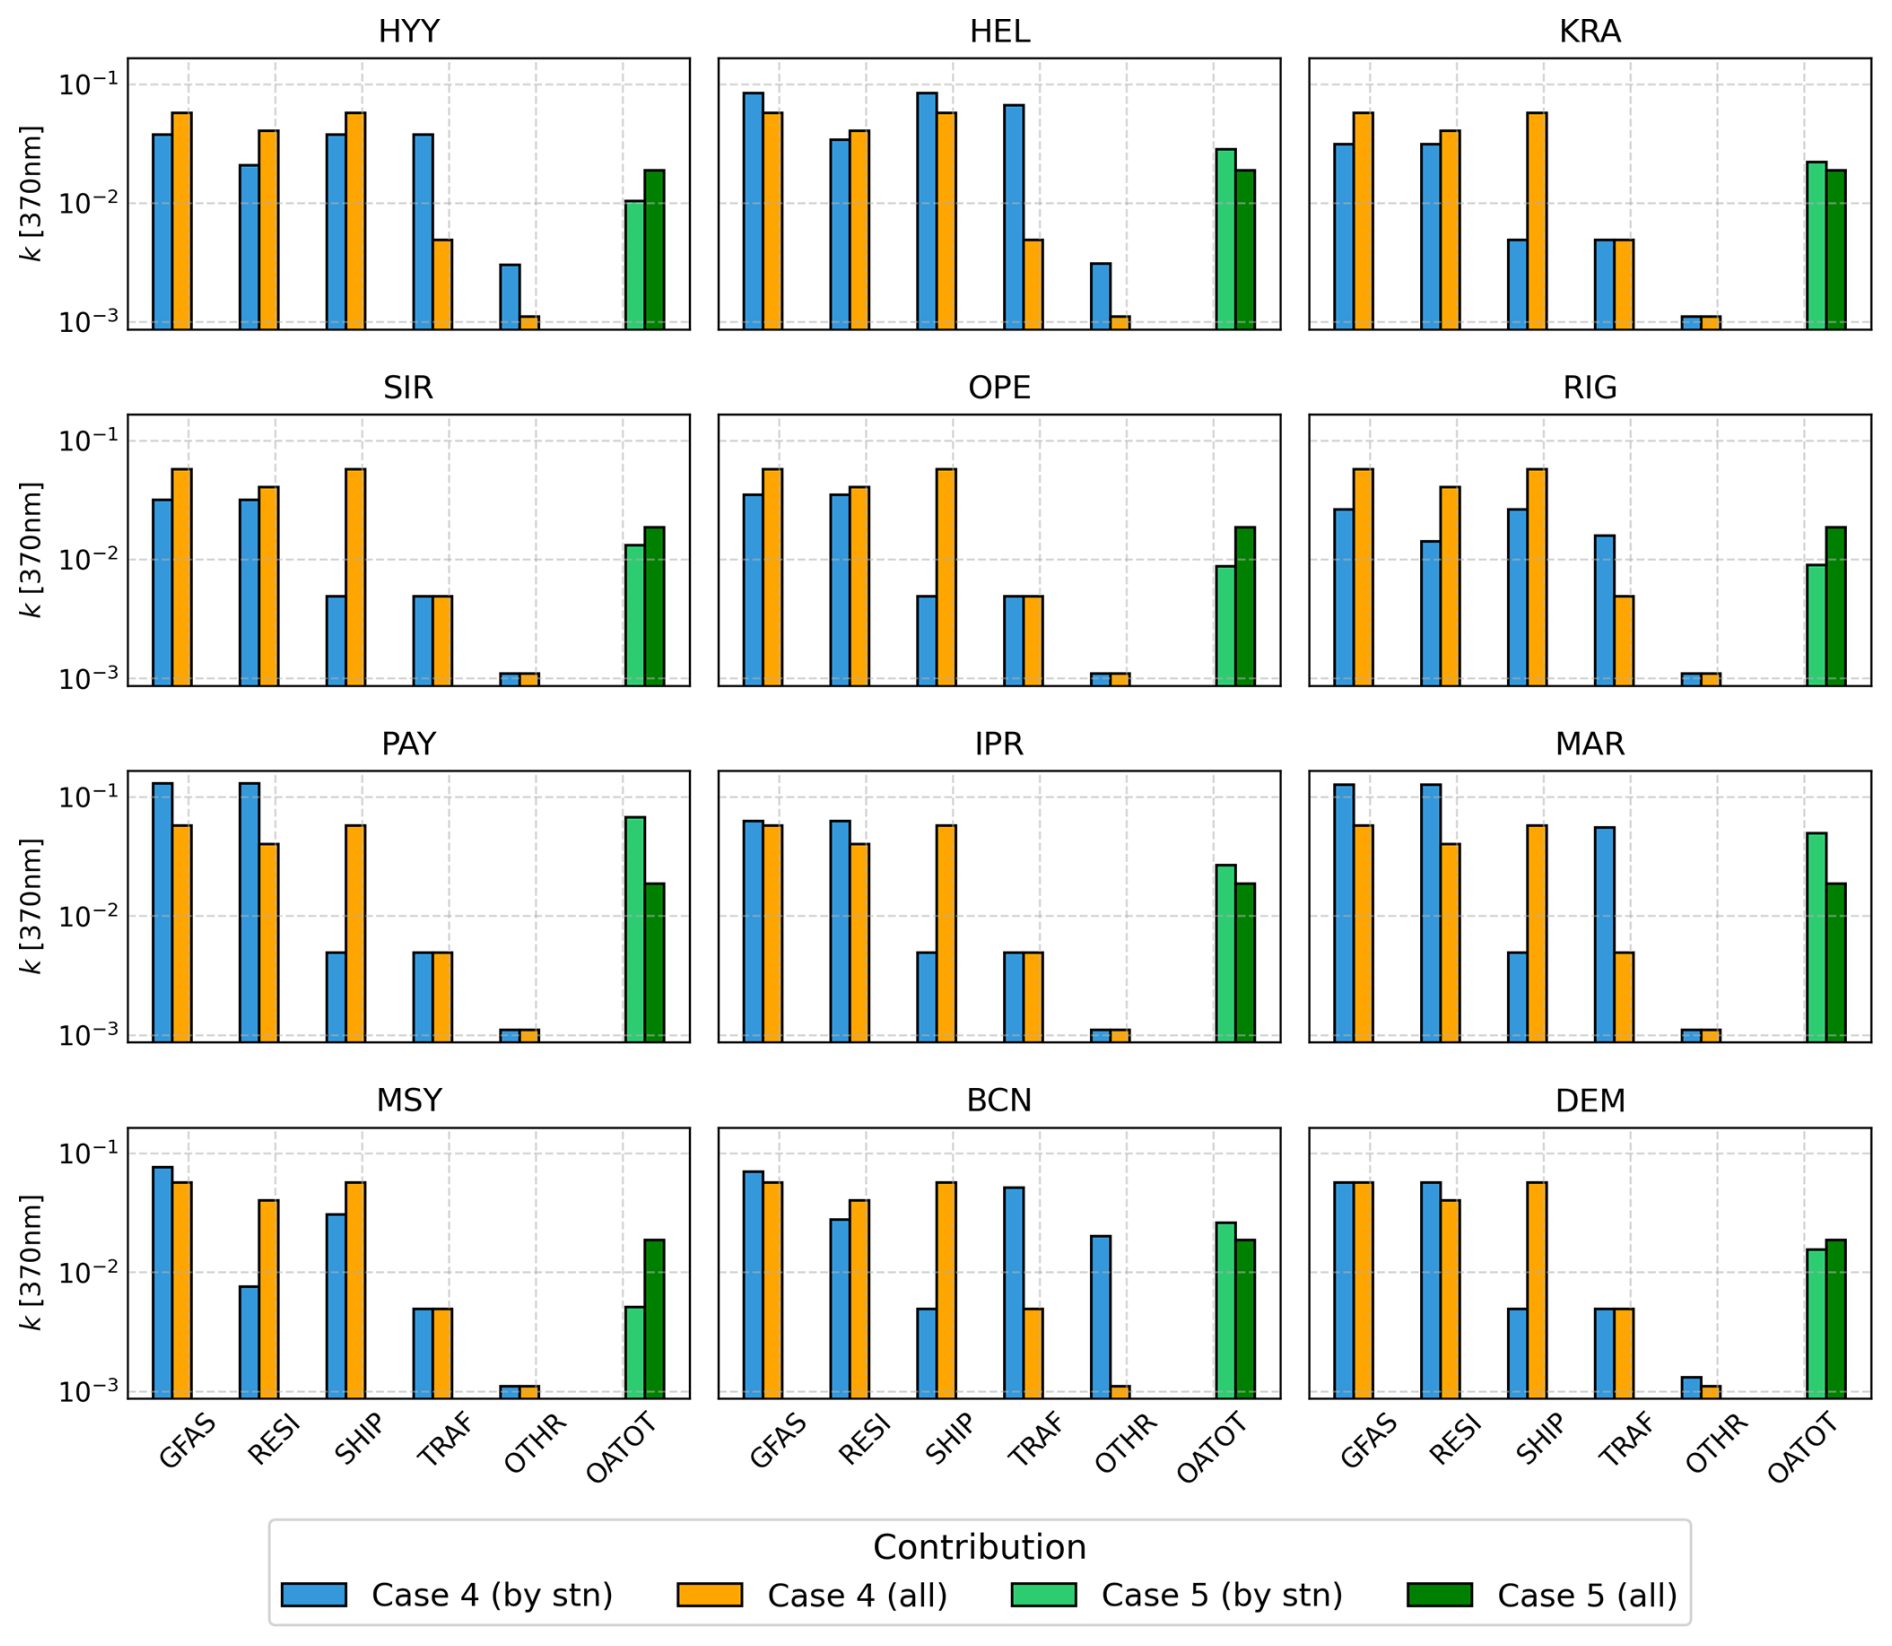
Figure 4Optimization of k at 370 nm for OA sources, comparing two strategies: Case 4 (source-tagged) optimizes k for five distinct sources (GFAS, TRAF, SHIP, RESI, OTHR), while Case 5 (non-source-tagged) optimizes a single k for total OA. Both cases show results from station-specific (by stn) and all-station combined (all) approaches.
In general, our findings agree well with values reported in the literature for specific sources. For instance, Pani et al. (2021) identified a k of 0.12 at 370 nm for biomass burning, closely aligned with the site most influenced by this source, such as PAY. Furthermore, the SHIP component in our study shows a significant k, approaching that of Corbin et al. (2018), who derived a value of 0.045 at 370 nm. Conversely, our TRAF results show a variation of k from 0.005 to 0.07, falling in the upper range reported in the literature for specific sources, such as 0.002 at 365 nm for BrC from octane combustion (Hossen et al., 2023) or 0.027 for propane, 0.006 for diesel, and 0.00074 for gasoline combustion reported at 550 nm (Lu et al., 2015).
3.3 OA absorption results
In this section, we build upon the k values derived in the previous section to analyze the OA absorption and its annual variability. We explore the impact of using results obtained from aggregating all data (all) versus exploiting the full granularity of the model and the observational dataset (by stn). The latter provides a closer alignment of the modeled absorption coefficients with the measurements as expected. Determining a specific k for each site and emission source gives detailed information on the absorption characteristics of the site environment. Nevertheless, this detailed information is too location-specific to be utilized in atmospheric models. Regardless, the analysis offers valuable information on the strengths and limitations of k discussed in the previous section for modeling applications.
Figure 5 shows a scatter plot of the monthly mean observed versus modeled OA absorption for source-tagged (Case 4) and non-source-tagged (Case 5) cases considering the “all” and “stn” approaches (Figs. S4 and S5 present similar information at daily resolution). Note that all observational data are used in this comparison beyond the observations employed in the optimization process (see Sect. 3.2). Additionally, Fig. 6 shows the time series of the absorption of OA at 370 nm simulated in Case 4 (all) and Case 5 (all) and the observational data for each monitoring site (by stn in Fig. S6). Although the absorption values could seem low, the annual mean OA absorption at 370 nm calculated from observations represented around 2 %–20 % of the total measured absorption at some regional or remote sites (MSY, OPE, and HYY), reaching contributions around 20 %–40 % at the remaining sites. The OA absorption is the lowest in summer due to the lack of important primary BrC sources such as domestic biomass burning.
In both figures, Case 4 (all) uses individual k values tailored to specific OA components (0.0571 for fires, 0.0403 for RESI, 0.0571 for SHIP, 0.0049 for TRAF, and 0.0011 for OTHR). Meanwhile, Case 5 (all) applies a single k value of 0.0187 across all sources. Case 5 represents the common approximation adopted by models in the literature (Takemura et al., 2005; Donner et al., 2011; Tegen et al., 2019) to describe the optical properties of aerosol components, where a single k is assigned to each aerosol component. Conversely, Case 4 introduces the refinement at the source level to investigate the benefit of exploiting the source contribution to describe absorption. The source-tagged method clearly allows the model to better account for the specific characteristics of OA source emissions at different sites, particularly in urban areas where sources of OA are more variable. In contrast, the non-source-tagged approach (Case 5) results in a broader range of errors, especially in higher-absorption environments such as urban and suburban areas.
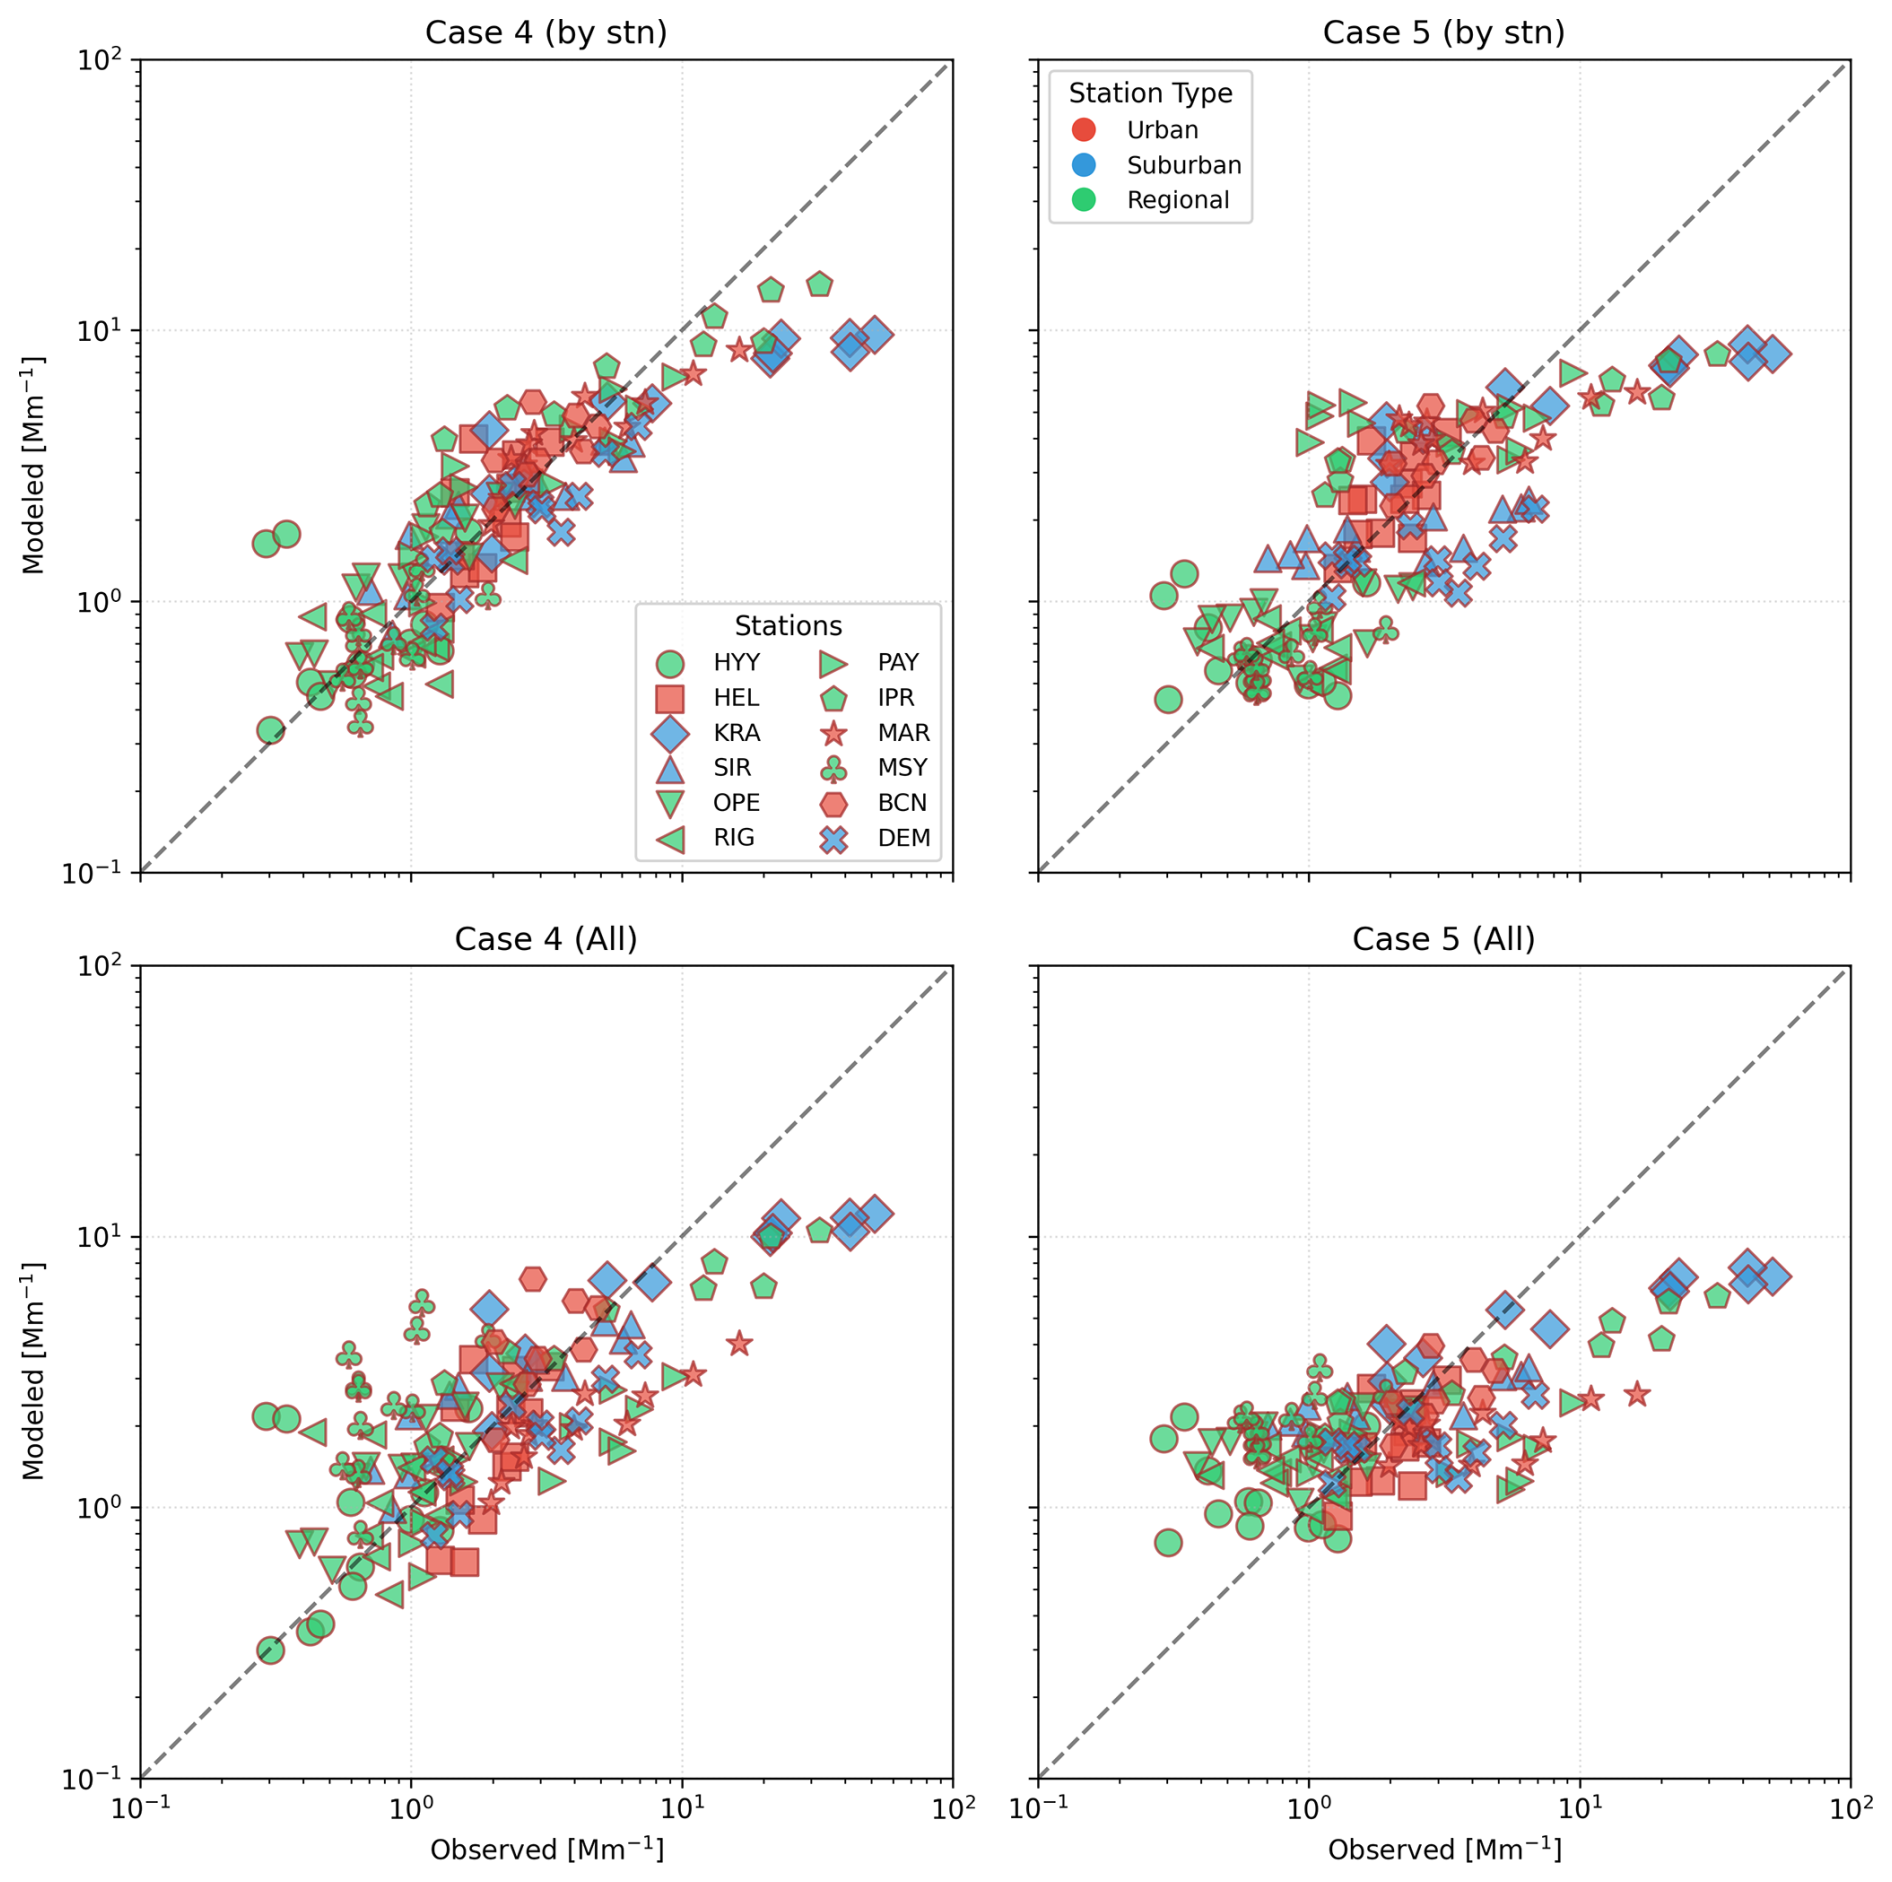
Figure 5Monthly mean observed versus modeled OA absorption for Case 4 and Case 5 including approaches by “stn” and “all”. Symbols indicate individual stations and colors indicate station type.
In Case 4 (all), the correlation coefficients (r) range from 0.34 to 0.74 across all stations, and the fractional bias (FB) values vary widely from −70 % to 107 % (yellow circles in Fig. S4). Regional stations (OPE, PAY, and IPR) generally exhibit high correlations (>0.6) and a tendency to overestimate. Similar correlation results are obtained when optimizing per station (Case 4, by stn, in Fig. S5), but with significant improvements in FB at all sites (see Table S4). The use of station-specific and source-specific k values substantially reduces the bias as expected.
Among regional background stations, MSY stands out by improving results from a strong overestimation throughout the year (FB: 107 %, assuming a constant k for each OA source over all aggregated data in Case 4 – all) to a slight underestimation in Case 4 (by stn), as shown in Figure S6 by the blue line. Both winter and summer periods are adjusted at this station, a good example of the added value of refining the characterization of sources for a specific environment. Other stations such as PAY, RIG, and IPR also show consistent improvements compared with Case 4 (all). In HYY, this overestimation is predominantly observed during the initial months, while in RIG, it becomes noticeable toward the end of the year. This pattern might not necessarily reflect higher absorption but could be due to overrepresentation of absorbing sources at these sites, which are characterized by the dominant contribution of biogenic SOA, typically with little or no absorption. For instance, the SHIP k value could be remarkably high, making it comparable to the values attributed to fires and potentially biasing the overall absorption metric at some of these sites.
Suburban stations such as SIR, KRA, and DEM show good r values in Case 4 (all), specifically 0.74, 0.57, and 0.67, respectively. SIR stands out with a small FB of 3.8 %, reflecting a very accurate representation of observed absorption. However, the model tends to underestimate the OA absorption for KRA and DEM, a phenomenon that is particularly pronounced at KRA (in both all and stn cases), where absorption values exceed 50 Mm−1 at 370 nm. This underestimation is likely related to the increased emissions of households and the energy industry at KRA site, as reported by Zgłobicki and Baran-Zgłobicka (2024), and the limitations previously highlighted in Sect. 3.1. The underestimation is predominantly observed during winter for KRA and DEM, whereas for SIR, the underestimation occurs mainly during warm months, as illustrated in Fig. 6. These seasonal discrepancies indicate that while the emission inventory (CAMS-REG-APv4.2) effectively captures the emissions near the SIR station, it may not fully account for the increased emissions during winter at KRA and DEM.
HEL, MAR, and BCN urban stations show very different model performances. On the one hand, MAR is characterized by a substantial underestimation with a low correlation value (0.49) and a notable negative FB of −82.3 %. In contrast, BCN exhibits significant overestimation in the first months of the year, likely related to attribution issues with residential, traffic, and shipping emissions as discussed in Sect. 3.1 and Sect. S4. On the other hand, HEL shows good agreement with the observations (r=0.51, FB ). The urban stations show different responses to the refined optimization by station. Modeled absorption improves compared to Case 4 (all) in BCN and MAR, while in HEL a slight degradation occurs during the colder months. The fire event identified by the model in July in MAR is simulated with a significant overestimation. This could indicate a limitation in the fire emissions data for this specific event.
In Case 5 (all), where no source-specific components for OA are considered, the correlation generally decreases compared to Case 4, with r values ranging from 0.28 to 0.65 across stations. FB values again show a wide variability, ranging from a strong underestimation at a suburban site such as KRA (FB ), particularly observed during winter, to an overestimation at a regional site such as OPE (FB =42 %), mainly observed during summer, and in MSY throughout the year. As seen before, results derived using k by station show clear improvement in FB at all sites.
The differences between Case 4 and Case 5 highlight the benefit of using source-specific k in simulating OA absorption. Although Case 5 represents the common practice in atmospheric modeling of using a unique refractive index to describe aerosol optical properties, Case 4 provides an additional refinement that even improves seasonality, as illustrated in Fig. 6 where Case 4 (all) follows increased absorption during winter and lower values during warmer months, while Case 5 (all) introduces important biases in some sites. Notably, OPE, SIR, and HYY show substantial overestimation during the summertime in Case 5 due to imposing an overly absorbing biogenic SOA, an issue that is effectively resolved in Case 4.
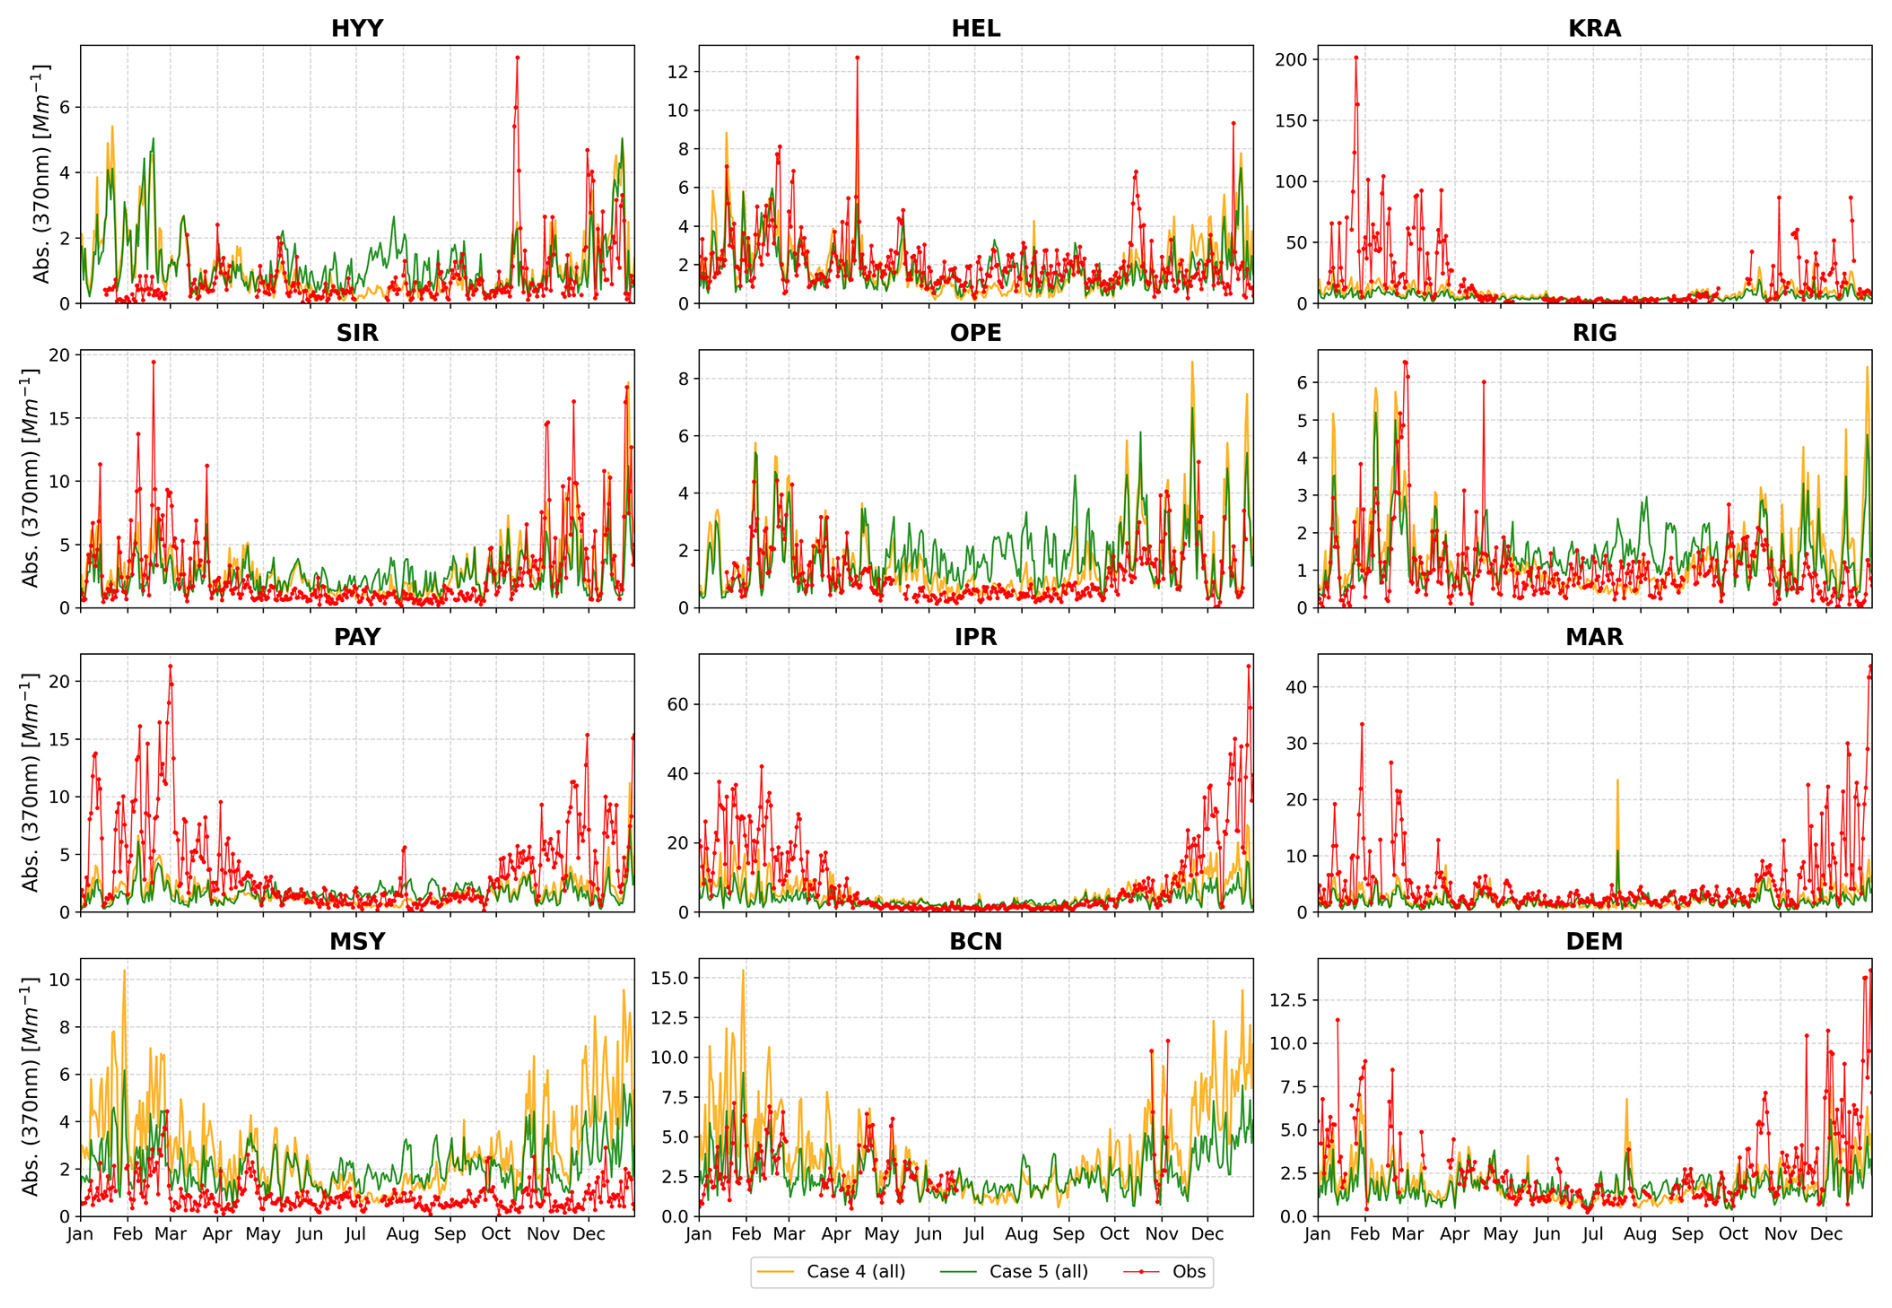
Figure 6OA light absorption (370 nm) time series for 12 sites. Observed (Obs, in red) and modeled absorption for Case 4 (all) (orange line) and Case 5 (all) (dark green line). k values are derived by combining data from all stations.
Finally, Fig. 7 shows the mean seasonal spatial variations in OA light absorption at 370 nm simulated by MONARCH at the surface level in Europe. Both the total absorption and the source contributions are shown. The results are calculated based on optimized k for each OA source derived from Case 4 (all).
The total OA absorption shows the combined effect from all sources, with higher absorption observed in central and eastern Europe. Particularly relevant are the hotspots in the Po Valley (Italy), with some regions in central and southern Poland and Romania reaching absorption values above 20 Mm−1. RESI is the dominant contributor to total OA absorption, especially during the colder seasons (DJF, SON). In winter, the mean total absorption in Europe is around 0.9 Mm−1, with residential sources explaining 80 % of this (0.7 Mm−1). Absorption shows a clear seasonality across Europe, as seen in Fig. 6. During summer, the contribution of RESI to light absorption (at 370 nm) in Europe reaches its minimum value, with a mean absorption of 0.1 Mm−1, representing 28 % of the summer OA absorption in Europe. The spring and autumn periods are still characterized by significant levels of absorption of 0.6 and 0.7 Mm−1 on average, respectively, dominated by RESI.
The second major source of absorption in our simulations is attributed to GFAS, particularly important during events in the summer (0.15 Mm−1 on average and maximum mean values above 10 Mm−1). The mean absorption over Europe from fires is lower compared to residential sources, but the surface dominates in certain areas, especially in northern and southeast Europe, where strong fires were detected by the satellite product. Notably, GFAS increases the background absorption in Europe with absorption values around 0.1 to 1 Mm−1. Spring and fall are important wildfire seasons in eastern Europe, where large regions are affected by notably high GFAS absorption.
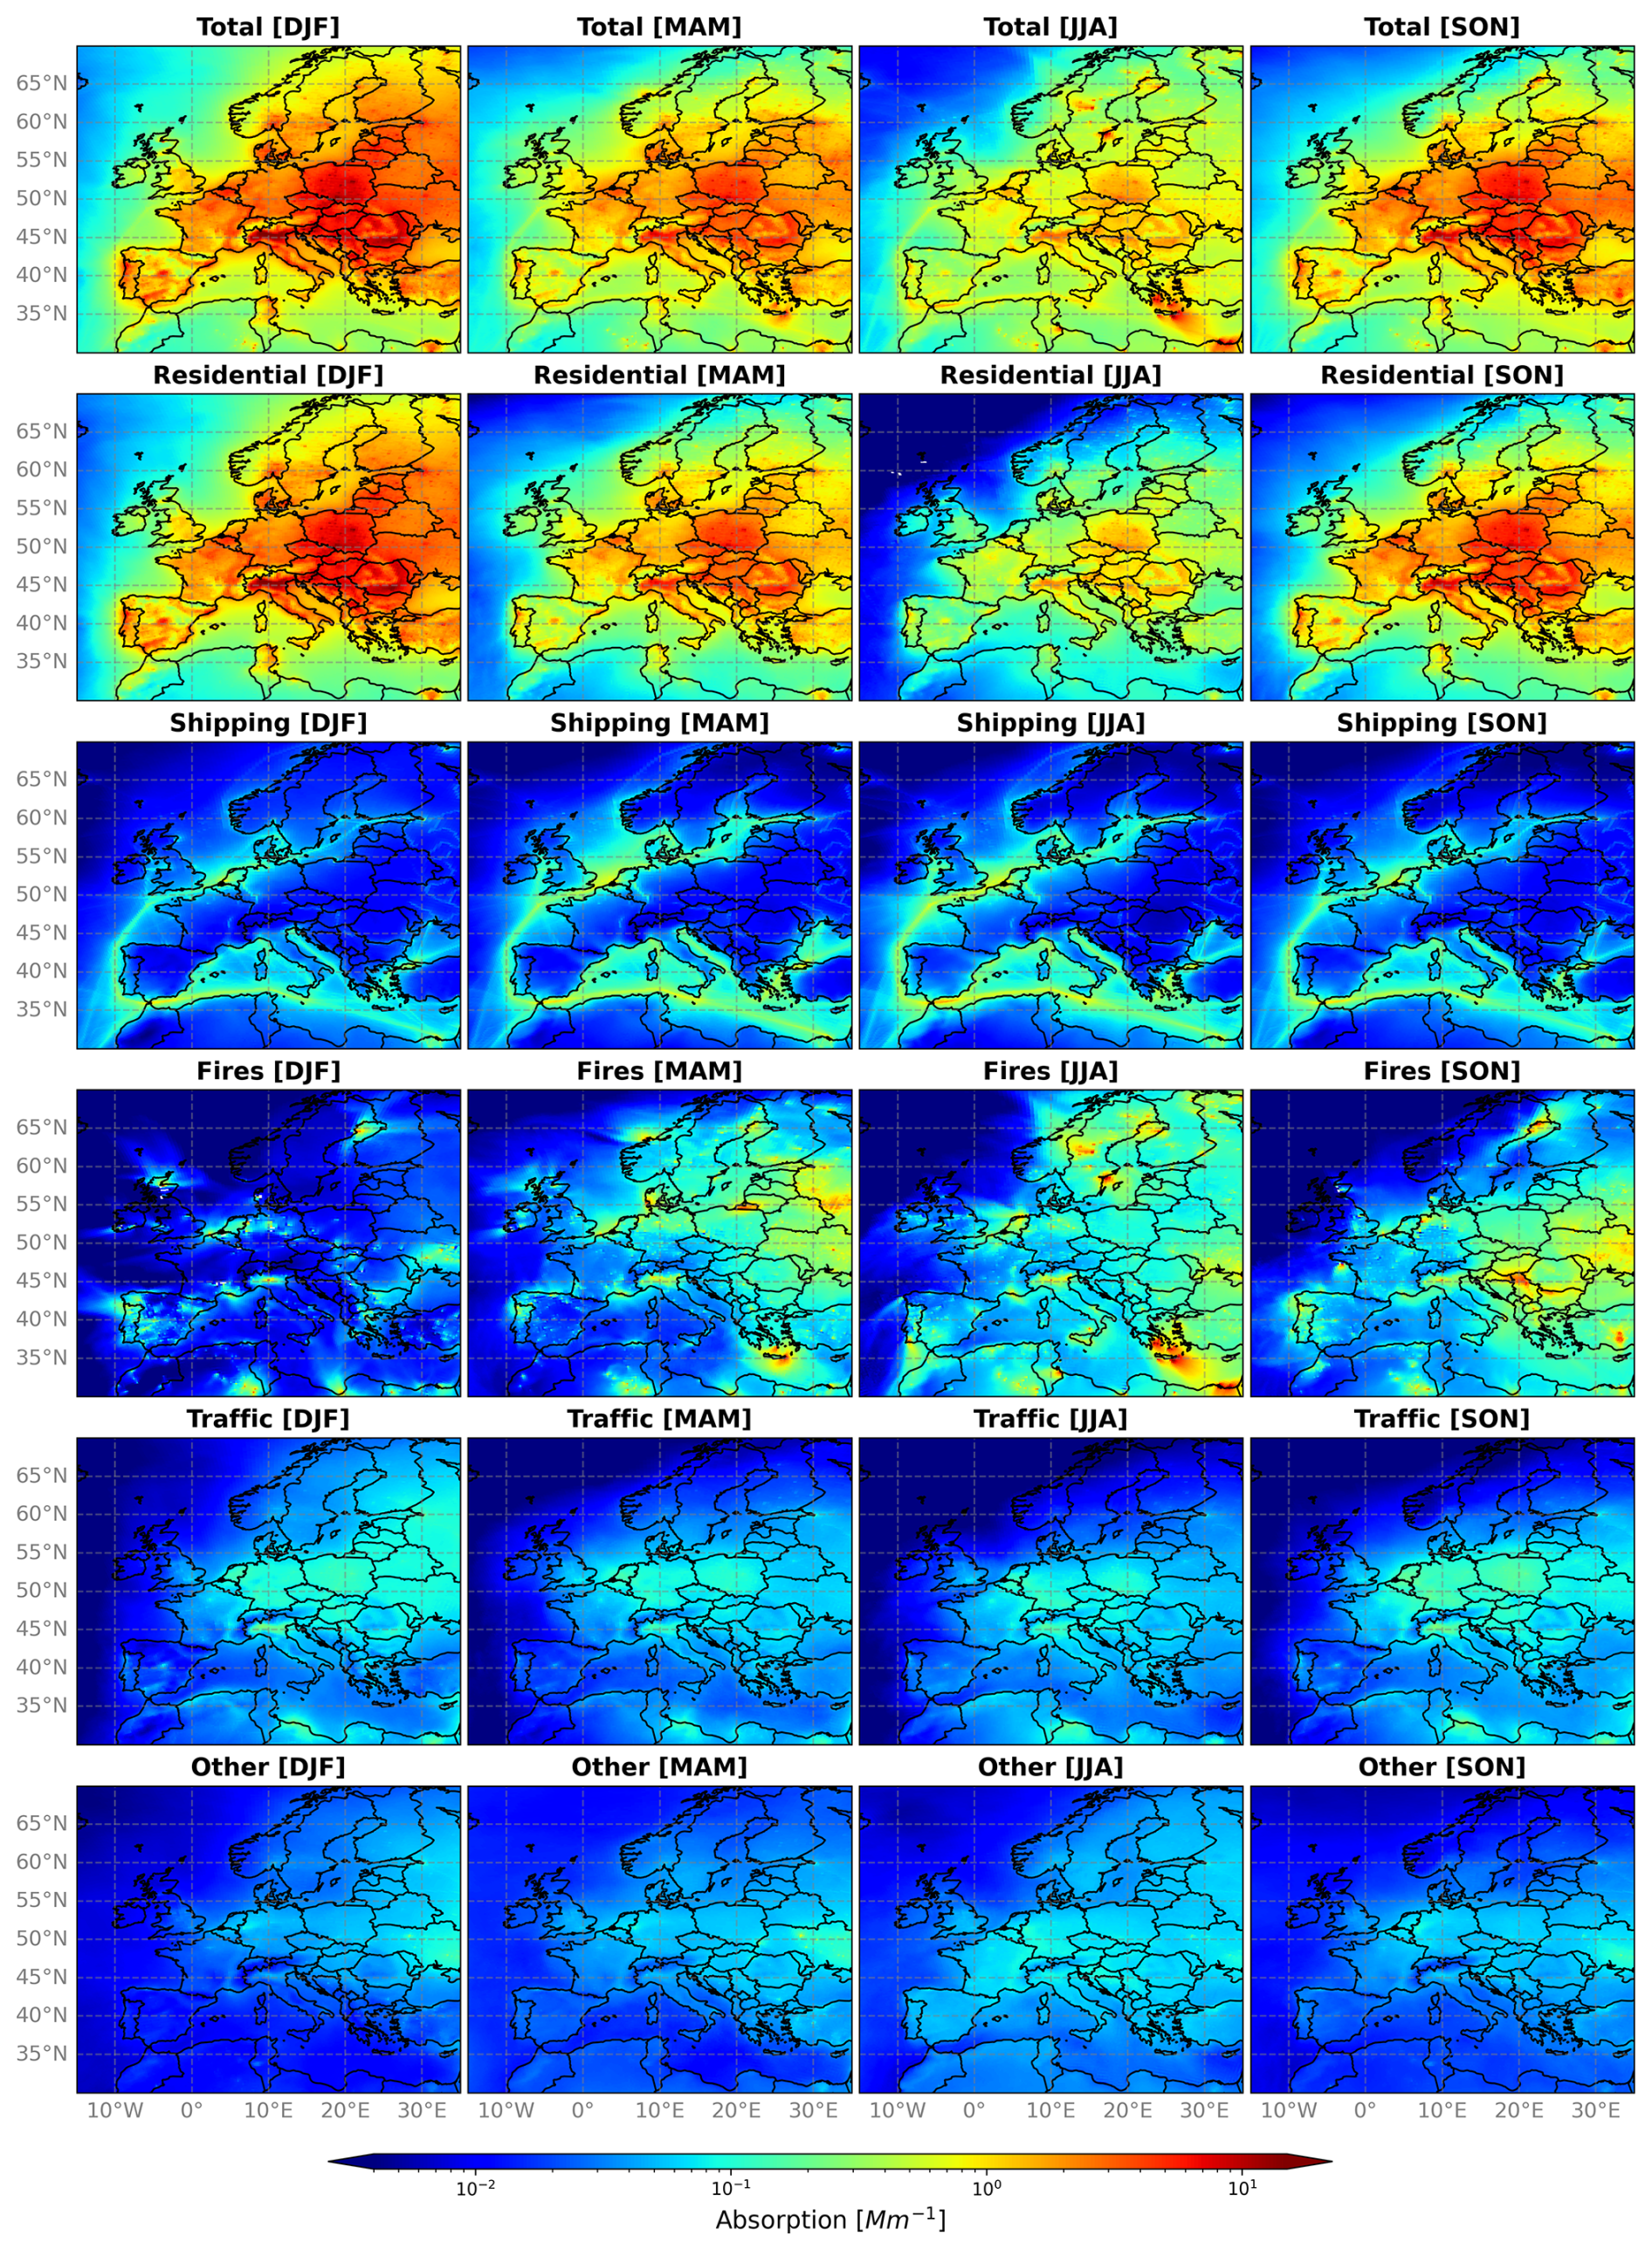
Figure 7Seasonal OA surface absorption (370 nm) source contributions in Europe, 2018. MONARCH simulation with optimized k values from Case 4 (all) (Fig. 4, orange bars). Columns: DJF, MAM, JJA, SON. Rows: total, residential, shipping, fires, traffic, other sources.
SHIP emerges as another significant contributor to light absorption, with high absorption levels reaching values close to 5 Mm−1 identified along major shipping routes, such as the English Channel, the North Sea, and the Mediterranean Sea. In this sense, coastal regions are affected by this source, and the Mediterranean Sea exhibits significant increases in absorption compared to inland areas. Some contributions are also visible along river routes in eastern Europe. Shipping sources contribute relatively little to mean absorption in Europe, with the highest values in spring (0.02 Mm−1).
Traffic-related light absorption is relatively low compared to residential and shipping sources. There is a slight increase in absorption in urban areas and major transportation corridors, with minor seasonal variability in this source. The traffic sources show their highest mean absorption in the surface layer in winter (0.04 Mm−1), dominant in central Europe. OTHR absorption is generally low across Europe, with minor seasonal variations. The highest mean OTHR absorption occurs in the autumn (0.08 Mm−1).
Overall, the insights gained from this analysis recommend adopting approaches towards refining k values used in models to better represent the unique characteristics of different environments and emission sources. The tailored approach of Case 4 (all), with its more granular differentiation of k values, contributes to the characterization of the different sites investigated in this work.
In this work, we have analyzed the light absorption of OA in Europe by optimizing the imaginary part of the OA refractive index (k) at 370 nm. Five different components of OA were studied including fires (GFAS), residential (RESI), shipping (SHIP), traffic (TRAF), and other sources (OTHR). Our analysis relied on 12 distinct monitoring stations, representative of regional, suburban, and urban background environments, to capture the diverse environmental conditions prevalent at each site. We used the MONARCH model to perform year-long simulation (year 2018) and developed an offline optical tool to derive optimized k values to characterize OA light absorption for each source under study. We used OA mass concentrations derived from aerosol chemical speciation monitor (ACSM) and filter-based measurements, as well as OA absorption retrieved from Aethalometer measurements.
The MONARCH model showed good performance in simulating OA concentrations in most stations, meeting the evaluation statistical benchmarks throughout the year, with peak performance in the spring season. RESI sources (which accounts for domestic heating, cooking, and water heating) dominated OA concentrations during the colder months. This share may be biased in some European regions by an overrepresentation of residential heating emissions in the CAMS-REG-AP_v42 inventory, as was already highlighted by Navarro-Barboza et al. (2024). SOA emerged as the second most significant contributor, especially during warmer periods at regional sites, such as MSY, HYY, OPE, RIG, and PAY, though it is slightly underestimated in summer, likely due to low biogenic SOA yields used in the model. SHIP emissions notably affected near-port stations, while TRAF emissions had a minimal influence. Despite the limitations identified, the model effectively captured specific events like wildfires and high-pollution episodes, demonstrating its ability to reproduce episodic events.
Optimization of k across stations has underscored the complex, dynamic nature of OA light-absorbing properties, influenced not only by emission sources but also by environmental conditions. Derived k values for total OA ranged from 0.005 (weakly absorbing) to 0.068 (weakly to moderately absorbing), indicating significant variability throughout Europe. This aligns with the existing knowledge that OA properties vary with composition, source, and atmospheric age (Cappa et al., 2011). Regional background stations such as MSY and HYY showed the lowest k values, consistent with their predominant biogenic SOA in these regions.
Optimizing k for OA sources highlighted the benefit of source apportionment in characterizing OA light-absorbing properties. Our results revealed the significant impact of local and regional emissions on k values. In PAY, elevated k values were derived for GFAS and RESI sources (e.g., biomass, coal combustion), aligned with the known strong absorption characteristics of biomass burning aerosols (Zhang et al., 2020b; Pani et al., 2021). This is further supported by evidence suggesting that BrC from biomass burning can undergo significant dark chemical processing, affecting more than 70 % of OA from this source (Kodros et al., 2020). Other regional stations such as HYY, OPE, RIG, and MSY showed the dominance of SOA from biogenic emissions, which explains their low k values (Zhao et al., 2015). In urban environments, TRAF emissions emerged as a significant contributor to light absorption, with derived k values (0.06) twice those reported for specific TRAF emissions (e.g., propane, diesel, gasoline) (Hossen et al., 2023; Lu et al., 2015), highlighting the complexity in urban environments. Stations near ports demonstrated the relevant SHIP contribution to OA light absorption, consistent with previous studies (Kapoor et al., 2023). In summary, we have derived specific ranges of k values at 370 nm for various emission sources using all the granular information available in our study as follows.
-
Biomass burning (GFAS): k values range from 0.03 to 0.13. This broad range reflects the variability between stations close to and far from fire sources, highlighting the diverse impact of biomass burning on OA absorption and the significance of bleaching processes.
-
Residential sources (RESI): k values range from 0.008 to 0.13, highlighting the variability in residential activities and practices across different regions (e.g., extensive use of coal combustion in KRA).
-
Shipping sources (SHIP): Near port areas, k values range from 0.005 to 0.08. In some sites, this is the second most absorbing source identified in our study in terms of k values.
-
Traffic (TRAF): k values range from 0.005 to 0.07, i.e., larger than found for specific traffic emission sources in the literature. This result indicates possible unaccounted for processes contributing to enhanced absorption in urban environments.
-
Other sources (OTHR): k values range from 0.001 to 0.02. These sources include emissions from power generation, industry, solvents, aviation, waste treatment and disposal, and agriculture and exhibit lower absorption properties, indicating the varied influence of emissions on OA absorption.
The implementation of these source-specific k values significantly improves model performance compared to using a constant k value for OA absorption. This is actually a common practice in atmospheric models that typically adopt k value at 550 nm ranging from 0.005 to 0.006 (Matsui and Mahowald, 2017; Tegen et al., 2019; Bozzo et al., 2020; Wang et al., 2013; Burgos et al., 2020). This widespread modeling practice underscores the relevance of our findings, proposing a refined method for determining k values that could improve the accuracy of future estimates of BrC radiative forcing.
Our analysis of source contribution to OA light absorption at the surface level in Europe, based on optimized k values, revealed the highest total absorption in central and eastern Europe, with hotspots in the Po Valley, Poland, and Romania. RESI sources dominate OA absorption, especially in colder seasons (DJF, SON), accounting for 80 % of total absorption in winter and 28 % in summer. GFAS is the second major source, particularly in summer, while SHIP significantly impacts coastal regions and major shipping routes. TRAF absorption is relatively low with minor seasonal variability, peaking in winter in central Europe. OTHR sources contribute minimally to total absorption levels with little seasonal variation.
This study acknowledges limitations in current models and emission inventories that may cause discrepancies between observed and modeled data. Underestimation of OA light absorption could stem from underpredicted biomass burning or biofuel emissions or uncertainties in particle size and mixing state (Huang et al., 2013). Additionally, the role of BrC may be underestimated in the study, as fossil fuel OA could also be light-absorbing (Lee et al., 2014). Future enhancements should aim at refining emission inventories, improving BrC and SOA representation in atmospheric models, and increasing BrC light absorption measurements across Europe to better constrain source effects on OA optical properties.
By establishing a link between laboratory measurements, field observations, and modeling experiments, our study offers insights to advance in the characterization of OA optical properties in models and reduce the uncertainties in aerosol–climate interactions and their broader environmental implications.
The MONARCH model is available at https://earth.bsc.es/gitlab/es/monarch (last access: 19 February 2025) under the GPLv3 license (https://doi.org/10.5281/zenodo.5215467, Klose et al., 2021a).
The observational data for OA mass concentrations are publicly available on Zenodo at https://doi.org/10.5281/zenodo.6522811 (Chen, 2022). Observational data for absorption coefficients, including both brown carbon (BrC) and black carbon (BC), can be accessed at https://doi.org/10.5281/zenodo.13365276 (Rovira et al., 2024). Model results for mass concentrations and absorption coefficients are available at https://doi.org/10.5281/zenodo.14914247 (Navarro Barboza et al., 2025).
The supplement related to this article is available online at https://doi.org/10.5194/acp-25-2667-2025-supplement.
HNB, MP, and OJ contributed to the conceptualization, design, and analysis of the work. HNB contributed to the emissions processing, conducting MONARCH runs, and data processing. VO and HNB contributed to the optical property calculations. JR, MP, MV, AA, XQ, NoP, MS, GC, JYD, MI, MR, KE, SV, OZ, MG, BC, NM, ASHP, KD, ME, KL, TP, AT, JaroN, MA, HT, JarkN, OF, JEP, JPP, CH, NiP, AC, and SC contributed to the provision of measurement data. APo contributed to data analysis. OJ, MP, XQ, and AA contributed to acquiring funding. HNB, MP, and OJ prepared the manuscript with contributions from all co-authors.
At least one of the (co-)authors is a member of the editorial board of Atmospheric Chemistry and Physics. The peer-review process was guided by an independent editor, and the authors also have no other competing interests to declare.
Publisher’s note: Copernicus Publications remains neutral with regard to jurisdictional claims made in the text, published maps, institutional affiliations, or any other geographical representation in this paper. While Copernicus Publications makes every effort to include appropriate place names, the final responsibility lies with the authors.
Hector Navarro-Barboza was funded by grant PRE2018-084988 from the FPI program by the Spanish Ministry of the Economy and Competitiveness. The research leading to these results has received funding from the Ministerio de Ciencia, Innovación y Universidades as part of the BROWNING project (grant no. RTI2018-099894-B-I00 funded by MCIN/AEI/10.13039/501100011033 and by “ERDF A way of making Europe”) and the Ministerio de Asuntos Económicos y Transformación Digital, Gobierno de España, as part of the CAIAC project (grant no. PID2019-108990PB-100). The research leading to these results has also received funding from EU HORIZON EUROPE under grant agreement no. 101056783 (FOCI project), EU HORIZON 2020 under grant agreement no. 821205 (FORCES project) and no. 101036245 (RI-URBANS project), and the Department of Research and Universities of the Government of Catalonia via the Research Group Atmospheric Composition (codes 2021 SGR 01550 and 2021 SGR 00447). IDAEA-CSIC is a Centre of Excellence Severo Ochoa (Spanish Ministry of Science and Innovation, grant no. CEX2018-000794-S) and receives funding from the cost action of Chemical On-Line cOmpoSition and Source Apportionment of fine aerosoL (COLOSSAL, CA16109), by Generalitat de Catalunya (D.G. Atmospheric Pollution Prevention and Control; AGAUR 2017 SGR41). We thank ACTRIS for providing data for some sites of this study. Finnish Meteorological Institute researchers gratefully acknowledge funding from the Research Council of Finland via the project Black and Brown Carbon in the Atmosphere and the Cryosphere (BBrCAC) (decision no. 341271). Jesus Yus-Díez is supported by the European Union's Horizon Europe research and innovation program under the Marie Skłodowska–Curie Postdoctoral Fellowship Programme, and SMASH is co-funded by the Republic of Slovenia and the European Union from the European Regional Development Fund under grant agreement no. 101081355.
BSC researchers thankfully acknowledge the computer resources at Marenostrum and the technical support provided by the Barcelona Supercomputing Center (RES-AECT-2022-1-0008, RES-AECT-2022-2-0003).
This research has been supported by the Ministerio de Ciencia e Innovación (grant no. PRE2018-084988), the Ministerio de Ciencia, Innovación y Universidades (grant no. RTI2018-099894-B-I00), the Ministerio de Asuntos Económicos y Transformación Digital, Gobierno de España (grant no. PID2019-108990PB-100), the EU HORIZON European Research Council (grant no. 101056783), and Horizon 2020 (grant nos. 821205, 101036245).
This paper was edited by Allan Bertram and reviewed by two anonymous referees.
Andreae, M., Andreae, T., Annegarn, H., Beer, J., Cachier, H., Le Canut, P., Elbert, W., Maenhaut, W., Salma, I., Wienhold, F., and Zenker, T.: Airborne studies of aerosol emissions from savanna fires in southern Africa: 2. Aerosol chemical composition, J. Geophys. Res.-Atmos., 103, 32119–32128, 1998. a
Andreae, M. O. and Gelencsér, A.: Black carbon or brown carbon? The nature of light-absorbing carbonaceous aerosols, Atmos. Chem. Phys., 6, 3131–3148, https://doi.org/10.5194/acp-6-3131-2006, 2006. a
Backman, J., Schmeisser, L., Virkkula, A., Ogren, J. A., Asmi, E., Starkweather, S., Sharma, S., Eleftheriadis, K., Uttal, T., Jefferson, A., Bergin, M., Makshtas, A., Tunved, P., and Fiebig, M.: On Aethalometer measurement uncertainties and an instrument correction factor for the Arctic, Atmos. Meas. Tech., 10, 5039–5062, https://doi.org/10.5194/amt-10-5039-2017, 2017. a
Badia, A. and Jorba, O.: Gas-phase evaluation of the online NMMB/BSC-CTM model over Europe for 2010 in the framework of the AQMEII-Phase2 project, Atmos. Environ., 115, 657–669, 2015. a, b
Badia, A., Jorba, O., Voulgarakis, A., Dabdub, D., Pérez García-Pando, C., Hilboll, A., Gonçalves, M., and Janjic, Z.: Description and evaluation of the Multiscale Online Nonhydrostatic AtmospheRe CHemistry model (NMMB-MONARCH) version 1.0: gas-phase chemistry at global scale, Geosci. Model Dev., 10, 609–638, https://doi.org/10.5194/gmd-10-609-2017, 2017. a, b
Basnet, S., Hartikainen, A., Virkkula, A., Yli-Pirilä, P., Kortelainen, M., Suhonen, H., Kilpeläinen, L., Ihalainen, M., Väätäinen, S., Louhisalmi, J., Somero, M., Tissari, J., Jakobi, G., Zimmermann, R., Kilpeläinen, A., and Sippula, O.: Contribution of brown carbon to light absorption in emissions of European residential biomass combustion appliances, Atmos. Chem. Phys., 24, 3197–3215, https://doi.org/10.5194/acp-24-3197-2024, 2024. a
Bond, T. C., Anderson, T. L., and Campbell, D.: Calibration and intercomparison of filter-based measurements of visible light absorption by aerosols, Aerosol Sci. Technol., 30, 582–600, 1999. a
Bond, T. C., Doherty, S. J., Fahey, D. W., Forster, P. M., Berntsen, T., DeAngelo, B. J., Flanner, M. G., Ghan, S., Kärcher, B., Koch, D., Kinne, S., Kondo, Y., Quinn, P. K., Sarofim, M. C., Schultz, M. G., Schulz, M., Venkataraman, C., Zhang, H., Zhang, S., Bellouin, N., Guttikunda, S. K., Hopke, P. K., Jacobson, M. Z., Kaiser, J. W., Klimont, Z., Lohmann, U., Schwarz, J. P., Shindell, D., Storelvmo, T., Warren, S. G., and Zender, C. S.: Bounding the role of black carbon in the climate system: A scientific assessment, J. Geophys. Res.-Atmos., 118, 5380–5552, 2013. a, b
Boylan, J. W. and Russell, A. G.: PM and light extinction model performance metrics, goals, and criteria for three-dimensional air quality models, Atmos. Environ., 40, 4946–4959, 2006. a
Bozzetti, C., Daellenbach, K. R., Hueglin, C., Fermo, P., Sciare, J., Kasper-Giebl, A., Mazar, Y., Abbaszade, G., El Kazzi, M., Gonzalez, R., Shuster-Meiseles, T., Flasch, M., Wolf, R., Křepelová, A., Canonaco, F., Schnelle-Kreis, J., Slowik, J. G., Zimmermann, R., Rudich, Y., Baltensperger, U., El Haddad, I., and Prévôt, A. S. H.: Size-resolved identification, characterization, and quantification of primary biological organic aerosol at a European rural site, Environ. Sci. Technol., 50, 3425–3434, 2016. a
Bozzo, A., Benedetti, A., Flemming, J., Kipling, Z., and Rémy, S.: An aerosol climatology for global models based on the tropospheric aerosol scheme in the Integrated Forecasting System of ECMWF, Geosci. Model Dev., 13, 1007–1034, https://doi.org/10.5194/gmd-13-1007-2020, 2020. a
Brege, M. A., China, S., Schum, S., Zelenyuk, A., and Mazzoleni, L. R.: Extreme molecular complexity resulting in a continuum of carbonaceous species in biomass burning tar balls from wildfire smoke, ACS Earth and Space Chemistry, 5, 2729–2739, 2021. a
Brown, H., Liu, X., Feng, Y., Jiang, Y., Wu, M., Lu, Z., Wu, C., Murphy, S., and Pokhrel, R.: Radiative effect and climate impacts of brown carbon with the Community Atmosphere Model (CAM5), Atmos. Chem. Phys., 18, 17745–17768, https://doi.org/10.5194/acp-18-17745-2018, 2018. a, b
Burgos, M. A., Andrews, E., Titos, G., Benedetti, A., Bian, H., Buchard, V., Curci, G., Kipling, Z., Kirkevåg, A., Kokkola, H., Laakso, A., Letertre-Danczak, J., Lund, M. T., Matsui, H., Myhre, G., Randles, C., Schulz, M., van Noije, T., Zhang, K., Alados-Arboledas, L., Baltensperger, U., Jefferson, A., Sherman, J., Sun, J., Weingartner, E., and Zieger, P.: A global model–measurement evaluation of particle light scattering coefficients at elevated relative humidity, Atmos. Chem. Phys., 20, 10231–10258, https://doi.org/10.5194/acp-20-10231-2020, 2020. a
Cappa, C. D., Che, D. L., Kessler, S. H., Kroll, J. H., and Wilson, K. R.: Variations in organic aerosol optical and hygroscopic properties upon heterogeneous OH oxidation, J. Geophys. Res.-Atmos., 116, https://doi.org/10.1029/2011JD015918, 2011. a
Cappa, C. D., Onasch, T. B., Massoli, P., Worsnop, D. R., Bates, T. S., Cross, E. S., Davidovits, P., Hakala, J., Hayden, K. L., Jobson, B. T., Kolesar, K. R., Lack, D. A., Lerner, B. M., Li, S. M., Mellon, D., Nuaaman, I., Olfert, J. S., Petäjä, T., Quinn, P. K., Song, C., et al.: Radiative absorption enhancements due to the mixing state of atmospheric black carbon, Science, 337, 1078–1081, 2012. a
Casotto, R., Skiba, A., Rauber, M., Strähl, J., Tobler, A., Bhattu, D., Lamkaddam, H., Manousakas, M. I., Salazar, G., Cui, T., Canonaco, F., Samek, L., Ryś, A., El Haddad, I., Kasper-Giebl, A., Baltensperger, U., Necki, J., Szidat, S., Styszko, K., Slowik, J. G., Prévôt, A. S., and Daellenbach, K. R.: Organic aerosol sources in Krakow, Poland, before implementation of a solid fuel residential heating ban, Sci. Total Environ., 855, 158655, https://doi.org/10.1016/j.scitotenv.2022.158655, 2023. a, b, c
Cavalli, F., Viana, M., Yttri, K. E., Genberg, J., and Putaud, J.-P.: Toward a standardised thermal-optical protocol for measuring atmospheric organic and elemental carbon: the EUSAAR protocol, Atmos. Meas. Tech., 3, 79–89, https://doi.org/10.5194/amt-3-79-2010, 2010. a
Chakrabarty, R. K., Moosmüller, H., Chen, L.-W. A., Lewis, K., Arnott, W. P., Mazzoleni, C., Dubey, M. K., Wold, C. E., Hao, W. M., and Kreidenweis, S. M.: Brown carbon in tar balls from smoldering biomass combustion, Atmos. Chem. Phys., 10, 6363–6370, https://doi.org/10.5194/acp-10-6363-2010, 2010. a, b, c
Chakrabarty, R. K., Shetty, N. J., Thind, A. S., Beeler, P., Sumlin, B. J., Zhang, C., Liu, P., Idrobo, J. C., Adachi, K., Wagner, N. L., Schwarz, J. P., Ahern, A., Sedlacek, A. J., Lambe, A., Daube, C., Lyu, M., Liu, C., Herndon, S., Onasch, T. B., and Mishra, R.: Shortwave absorption by wildfire smoke dominated by dark brown carbon, Nat. Geosci., 16, 683–688, 2023. a
Chazeau, B., El Haddad, I., Canonaco, F., Temime-Roussel, B., d'Anna, B., Gille, G., Mesbah, B., Prévôt, A. S., Wortham, H., and Marchand, N.: Organic aerosol source apportionment by using rolling positive matrix factorization: Application to a Mediterranean coastal city, Atmos. Environ., 14, 100176, https://doi.org/10.1016/j.aeaoa.2022.100176, 2022. a, b
Chen, G.: European Aerosol Phenomenology – 8: Harmonised Source Apportionment of Organic Aerosol using 22 Year-long ACSM/AMS Datasets (Version 1st), Zenodo [data set], https://doi.org/10.5281/zenodo.6522811, 2022. a
Chen, G., Canonaco, F., Tobler, A., Aas, W., Alastuey, A., Allan, J., Atabakhsh, S., Aurela, M., Baltensperger, U., Bougiatioti, A., and et al.: European aerosol phenomenology- 8: Harmonised source apportionment of organic aerosol using 22 Year-long ACSM/AMS datasets, Environ. Int., 166, 107325, https://doi.org/10.1016/j.envint.2022.107325, 2022. a, b, c, d, e, f, g
Cheng, Z., Atwi, K., Hajj, O. E., Ijeli, I., Fischer, D. A., Smith, G., and Saleh, R.: Discrepancies between brown carbon light-absorption properties retrieved from online and offline measurements, Aerosol Sci. Technol., 55, 92–103, 2021. a
Chin, M., Ginoux, P., Kinne, S., Torres, O., Holben, B. N., Duncan, B. N., Martin, R. V., Logan, J. A., Higurashi, A., and Nakajima, T.: Tropospheric aerosol optical thickness from the GOCART model and comparisons with satellite and Sun photometer measurements, J. Atmos. Sci., 59, 461–483, 2002. a, b, c
Ciarelli, G., Aksoyoglu, S., Crippa, M., Jimenez, J.-L., Nemitz, E., Sellegri, K., Äijälä, M., Carbone, S., Mohr, C., O'Dowd, C., Poulain, L., Baltensperger, U., and Prévôt, A. S. H.: Evaluation of European air quality modelled by CAMx including the volatility basis set scheme, Atmos. Chem. Phys., 16, 10313–10332, https://doi.org/10.5194/acp-16-10313-2016, 2016. a
Corbin, J. C., Pieber, S. M., Czech, H., Zanatta, M., Jakobi, G., Massabò, D., Orasche, J., El Haddad, I., Mensah, A. A., Stengel, B., Drinovec, L., Mocnik, G., Zimmermann, R., Prévôt, A. S. H., and Gysel, M.: Brown and black carbon emitted by a marine engine operated on heavy fuel oil and distillate fuels: optical properties, size distributions, and emission factors, J. Geophys. Res.-Atmos., 123, 6175–6195, 2018. a, b, c
Cuesta-Mosquera, A., Glojek, K., Močnik, G., Drinovec, L., Gregorič, A., Rigler, M., Ogrin, M., Romshoo, B., Weinhold, K., Merkel, M., van Pinxteren, D., Herrmann, H., Wiedensohler, A., Pöhlker, M., and Müller, T.: Optical properties and simple forcing efficiency of the organic aerosols and black carbon emitted by residential wood burning in rural central Europe, Atmos. Chem. Phys., 24, 2583–2605, https://doi.org/10.5194/acp-24-2583-2024, 2024. a, b, c
Daellenbach, K. R., Bozzetti, C., Křepelová, A., Canonaco, F., Wolf, R., Zotter, P., Fermo, P., Crippa, M., Slowik, J. G., Sosedova, Y., Zhang, Y., Huang, R.-J., Poulain, L., Szidat, S., Baltensperger, U., El Haddad, I., and Prévôt, A. S. H.: Characterization and source apportionment of organic aerosol using offline aerosol mass spectrometry, Atmos. Meas. Tech., 9, 23–39, https://doi.org/10.5194/amt-9-23-2016, 2016. a
Daellenbach, K. R., Stefenelli, G., Bozzetti, C., Vlachou, A., Fermo, P., Gonzalez, R., Piazzalunga, A., Colombi, C., Canonaco, F., Hueglin, C., Kasper-Giebl, A., Jaffrezo, J.-L., Bianchi, F., Slowik, J. G., Baltensperger, U., El-Haddad, I., and Prévôt, A. S. H.: Long-term chemical analysis and organic aerosol source apportionment at nine sites in central Europe: source identification and uncertainty assessment, Atmos. Chem. Phys., 17, 13265–13282, https://doi.org/10.5194/acp-17-13265-2017, 2017. a
Denier van der Gon, H. A. C., Bergström, R., Fountoukis, C., Johansson, C., Pandis, S. N., Simpson, D., and Visschedijk, A. J. H.: Particulate emissions from residential wood combustion in Europe – revised estimates and an evaluation, Atmos. Chem. Phys., 15, 6503–6519, https://doi.org/10.5194/acp-15-6503-2015, 2015. a
Donner, L. J., Wyman, B. L., Hemler, R. S., Horowitz, L. W., Ming, Y., Zhao, M., Golaz, J.-C., Ginoux, P., Lin, S.-J., Schwarzkopf, M. D., Austin, J., Alaka, G., Cooke, W. F., Delworth, T. L., Freidenreich, S. M., Gordon, C. T., Griffies, S. M., Held, I. M., Hurlin, W. J., Klein, S. A., Knutson, T. R., Langenhorst, A. R., Lee, H.-C., Lin, Y., Magi, B. I., Malyshev, S. L., Milly, P. C. D., Naik, V., Nath, M. J., Pincus, R., Ploshay, J. J., Ramaswamy, V., Seman, C. J., Shevliakova, E., Sirutis, J. J., Stern, W. F., Stouffer, R. J., Wilson, R. J., Winton, M., Wittenberg, A. T., and Zeng, F.: The dynamical core, physical parameterizations, and basic simulation characteristics of the atmospheric component AM3 of the GFDL global coupled model CM3, J. Climate, 24, 3484–3519, 2011. a
Drinovec, L., Močnik, G., Zotter, P., Prévôt, A. S. H., Ruckstuhl, C., Coz, E., Rupakheti, M., Sciare, J., Müller, T., Wiedensohler, A., and Hansen, A. D. A.: The “dual-spot” Aethalometer: an improved measurement of aerosol black carbon with real-time loading compensation, Atmos. Meas. Tech., 8, 1965–1979, https://doi.org/10.5194/amt-8-1965-2015, 2015. a, b
Drinovec, L., Gregorič, A., Zotter, P., Wolf, R., Bruns, E. A., Prévôt, A. S. H., Petit, J.-E., Favez, O., Sciare, J., Arnold, I. J., Chakrabarty, R. K., Moosmüller, H., Filep, A., and Močnik, G.: The filter-loading effect by ambient aerosols in filter absorption photometers depends on the coating of the sampled particles, Atmos. Meas. Tech., 10, 1043–1059, https://doi.org/10.5194/amt-10-1043-2017, 2017. a, b
Emery, C., Liu, Z., Russell, A. G., Odman, M. T., Yarwood, G., and Kumar, N.: Recommendations on statistics and benchmarks to assess photochemical model performance, J. Air Waste Manage., 67, 582–598, 2017. a
European Commission: Commission Staff Working Paper Establishing Guidelines for Determination of Contributions From the Resuspension of Particulates Following Winter Sanding or Salting of Roads Under the Directive 2008/50/EC on Ambient Air Quality and Cleaner Air for Europe, European Commission, SEC(2011) 207, 43 pp., http://ec.europa.eu/environment/air/quality/legislation/pdf/sec_2011_0207.pdf (last access: 19 February 2025), 2011. a
Favez, O., El Haddad, I., Piot, C., Boréave, A., Abidi, E., Marchand, N., Jaffrezo, J.-L., Besombes, J.-L., Personnaz, M.-B., Sciare, J., Wortham, H., George, C., and D'Anna, B.: Inter-comparison of source apportionment models for the estimation of wood burning aerosols during wintertime in an Alpine city (Grenoble, France), Atmos. Chem. Phys., 10, 5295–5314, https://doi.org/10.5194/acp-10-5295-2010, 2010. a
Feng, Y., Ramanathan, V., and Kotamarthi, V. R.: Brown carbon: a significant atmospheric absorber of solar radiation?, Atmos. Chem. Phys., 13, 8607–8621, https://doi.org/10.5194/acp-13-8607-2013, 2013. a, b, c, d
Flemming, J., Huijnen, V., Arteta, J., Bechtold, P., Beljaars, A., Blechschmidt, A.-M., Diamantakis, M., Engelen, R. J., Gaudel, A., Inness, A., Jones, L., Josse, B., Katragkou, E., Marecal, V., Peuch, V.-H., Richter, A., Schultz, M. G., Stein, O., and Tsikerdekis, A.: Tropospheric chemistry in the Integrated Forecasting System of ECMWF, Geosci. Model Dev., 8, 975–1003, https://doi.org/10.5194/gmd-8-975-2015, 2015. a
Forrister, H., Liu, J., Scheuer, E., Dibb, J., Ziemba, L., Thornhill, K. L., Anderson, B., Diskin, G., Perring, A. E., Schwarz, J. P., Campuzano-Jost, P., Day, D. A., Palm, B. B., Jimenez, J. L., Nenes, A., and Weber, R. J.: Evolution of brown carbon in wildfire plumes, Geophys. Res. Lett., 42, 4623–4630, 2015. a
Freney, E., Zhang, Y., Croteau, P., Amodeo, T., Williams, L., Truong, F., Petit, J.-E., Sciare, J., Sarda-Esteve, R., Bonnaire, N., Arumae, T., Aurela, M., Bougiatioti, A., Mihalopoulos, N., Coz, E., Artinano, B., Crenn, V., Elste, T., Heikkinen, L., Poulain, L., Wiedensohler, A., Herrmann, H., Priestman, M., Alastuey, A., Stavroulas, I., Tobler, A., Vasilescu, J., Zanca, N., Canagaratna, M., Carbone, C., Flentje, H., Green, D., Maasikmets, M., Marmureanu, L., Cruz Minguillon, M., Prevot, A. S. H., Gros, V., Jayne, J., and Favez, O.: The second ACTRIS inter-comparison (2016) for Aerosol Chemical Speciation Monitors (ACSM): Calibration protocols and instrument performance evaluations, Aerosol Sci. Technol., 53, 830–842, 2019. a
Fröhlich, R., Cubison, M. J., Slowik, J. G., Bukowiecki, N., Prévôt, A. S. H., Baltensperger, U., Schneider, J., Kimmel, J. R., Gonin, M., Rohner, U., Worsnop, D. R., and Jayne, J. T.: The ToF-ACSM: a portable aerosol chemical speciation monitor with TOFMS detection, Atmos. Meas. Tech., 6, 3225–3241, https://doi.org/10.5194/amt-6-3225-2013, 2013. a
Gasteiger, J. and Wiegner, M.: MOPSMAP v1.0: a versatile tool for the modeling of aerosol optical properties, Geosci. Model Dev., 11, 2739–2762, https://doi.org/10.5194/gmd-11-2739-2018, 2018. a
Glojek, K., Thuy, V. D. N., Weber, S., Uzu, G., Manousakas, M., Elazzouzi, R., Džepina, K., Darfeuil, S., Ginot, P., Jaffrezo, J., Žabkar, R., Turšič, J., Podkoritnik, A., and Močnik, G.: Annual variation of source contributions to PM10 and oxidative potential in a mountainous area with traffic, biomass burning, cement-plant and biogenic influences, Environ. Int., 189, 108787, https://doi.org/10.1016/j.envint.2024.108787, 2024. a
Granier, C., Darras, S., van Der Gon, H. D., Jana, D., Elguindi, N., Bo, G., Michael, G., Marc, G., Jalkanen, J. P., Kuenen, J., and Liousse, C.: The Copernicus atmosphere monitoring service global and regional emissions (April 2019 version), PhD thesis, Copernicus Atmosphere Monitoring Service, 2019. a
Guenther, A., Karl, T., Harley, P., Wiedinmyer, C., Palmer, P. I., and Geron, C.: Estimates of global terrestrial isoprene emissions using MEGAN (Model of Emissions of Gases and Aerosols from Nature), Atmos. Chem. Phys., 6, 3181–3210, https://doi.org/10.5194/acp-6-3181-2006, 2006. a
Guevara, M., Tena, C., Porquet, M., Jorba, O., and Pérez García-Pando, C.: HERMESv3, a stand-alone multi-scale atmospheric emission modelling framework – Part 1: global and regional module, Geosci. Model Dev., 12, 1885–1907, https://doi.org/10.5194/gmd-12-1885-2019, 2019. a, b
Guevara, M., Tena, C., Porquet, M., Jorba, O., and Pérez García-Pando, C.: HERMESv3, a stand-alone multi-scale atmospheric emission modelling framework – Part 2: The bottom–up module, Geosci. Model Dev., 13, 873–903, https://doi.org/10.5194/gmd-13-873-2020, 2020. a, b
Hanisch, F. and Crowley, J. N.: The heterogeneous reactivity of gaseous nitric acid on authentic mineral dust samples, and on individual mineral and clay mineral components, Phys. Chem. Chem. Phys., 3, 2474–2482, 2001. a
Heikkinen, L., Äijälä, M., Daellenbach, K. R., Chen, G., Garmash, O., Aliaga, D., Graeffe, F., Räty, M., Luoma, K., Aalto, P., Kulmala, M., Petäjä, T., Worsnop, D., and Ehn, M.: Eight years of sub-micrometre organic aerosol composition data from the boreal forest characterized using a machine-learning approach, Atmos. Chem. Phys., 21, 10081–10109, https://doi.org/10.5194/acp-21-10081-2021, 2021. a
Hems, R. F., Schnitzler, E. G., Liu-Kang, C., Cappa, C. D., and Abbatt, J. P.: Aging of atmospheric brown carbon aerosol, ACS Earth and Space Chemistry, 5, 722–748, 2021. a
Hess, M., Koepke, P., and Schult, I.: Optical properties of aerosols and clouds: The software package OPAC, B. Am. Meteor. Soc., 79, 831–844, 1998. a, b
Hoffer, A., Tóth, A., Nyirő-Kósa, I., Pósfai, M., and Gelencsér, A.: Light absorption properties of laboratory-generated tar ball particles, Atmos. Chem. Phys., 16, 239–246, https://doi.org/10.5194/acp-16-239-2016, 2016. a, b, c
Hoffer, A., Tóth, Á., Pósfai, M., Chung, C. E., and Gelencsér, A.: Brown carbon absorption in the red and near-infrared spectral region, Atmos. Meas. Tech., 10, 2353–2359, https://doi.org/10.5194/amt-10-2353-2017, 2017. a, b
Hossen, M. A.-a., Roy, S., Zaman, S. U., and Salam, A.: Emission of water soluble brown carbon from different combustion sources: optical properties and functional group characterisation, Environ. Res. Commun., 5, 081002, https://doi.org/10.1088/2515-7620/acea1d, 2023. a, b, c
Huang, Y., Wu, S., Dubey, M. K., and French, N. H. F.: Impact of aging mechanism on model simulated carbonaceous aerosols, Atmos. Chem. Phys., 13, 6329–6343, https://doi.org/10.5194/acp-13-6329-2013, 2013. a
In't Veld, M., Alastuey, A., Pandolfi, M., Amato, F., Perez, N., Reche, C., Via, M., Minguillon, M. C., Escudero, M., and Querol, X.: Compositional changes of PM2.5 in NE Spain during 2009–2018: A trend analysis of the chemical composition and source apportionment, Sci. Total Environ., 795, 148728, https://doi.org/10.1016/j.scitotenv.2021.148728, 2021. a
In't Veld, M., Khare, P., Hao, Y., Reche, C., Pérez, N., Alastuey, A., Yus-Díez, J., Marchand, N., Prevot, A. S. H., Querol, X., and Daellenbach, K. R.: Characterizing the sources of ambient PM10 organic aerosol in urban and rural Catalonia, Spain, Sci. Total Environ., 902, 166440, https://doi.org/10.1016/j.scitotenv.2023.166440, 2023. a
Jaeglé, L., Quinn, P. K., Bates, T. S., Alexander, B., and Lin, J.-T.: Global distribution of sea salt aerosols: new constraints from in situ and remote sensing observations, Atmos. Chem. Phys., 11, 3137–3157, https://doi.org/10.5194/acp-11-3137-2011, 2011. a
Janjic, Z. and Gall, L.: Scientific documentation of the NCEP nonhydrostatic multiscale model on the B grid (NMMB). Part 1 Dynamics, Tech. rep., National center for atmospheric research, https://doi.org/10.5065/D6WH2MZX, 2012. a
Janjic, Z. I., Gerrity Jr, J., and Nickovic, S.: An alternative approach to nonhydrostatic modeling, Mon. Weather Rev., 129, 1164–1178, 2001. a
Jorba, O., Dabdub, D., Blaszczak-Boxe, C., Pérez, C., Janjic, Z., Baldasano, J., Spada, M., Badia, A., and Gonçalves, M.: Potential significance of photoexcited NO2 on global air quality with the NMMB/BSC chemical transport model, J. Geophys. Res.-Atmos., 117, https://doi.org/10.1029/2012JD017730, 2012. a
Kaiser, J. W., Heil, A., Andreae, M. O., Benedetti, A., Chubarova, N., Jones, L., Morcrette, J.-J., Razinger, M., Schultz, M. G., Suttie, M., and van der Werf, G. R.: Biomass burning emissions estimated with a global fire assimilation system based on observed fire radiative power, Biogeosciences, 9, 527–554, https://doi.org/10.5194/bg-9-527-2012, 2012. a
Kapoor, T. S., Phuleria, H. C., Sumlin, B., Shetty, N., Anurag, G., Bansal, M., Duhan, S. S., Khan, M. S., Laura, J. S., Manwani, P., Chakrabarty, R. K., and Venkataraman, C.: Optical Properties and Refractive Index of Wintertime Aerosol at a Highly Polluted North-Indian Site, J. Geophys. Res.-Atmos., 128, e2022JD038272, https://doi.org/10.1029/2022JD038272, 2023. a
Kirchstetter, T. W., Novakov, T., and Hobbs, P. V.: Evidence that the spectral dependence of light absorption by aerosols is affected by organic carbon, J. Geophys. Res.-Atmos., 109, https://doi.org/10.1029/2004JD004999, 2004. a
Klose, M., Jorba, O., Gonçalves Ageitos, M., Escribano, J., Dawson, M. L., Obiso, V., Di Tomaso, E., Basart, S., Montané Pinto, G., Macchia, F., Ginoux, P., Guerschman, J., Prigent, C., Huang, Y., Kok, J. F., Miller, R. L., and Pérez García-Pando, C.: Mineral dust cycle in the Multiscale Online Nonhydrostatic AtmospheRe CHemistry model (MONARCH) Version 2.0, Geosci. Model Dev., 14, 6403–6444, https://doi.org/10.5194/gmd-14-6403-2021, 2021b. a, b, c
Klose, M., Jorba, O., Gonçalves Ageitos, M., Escribano, J., Dawson, M. L., Obiso, V., Di Tomaso, E., Basart, S., Montané Pinto, G., Macchia, F., and Pérez García-Pando, C.: MONARCH: Multiscale Online Nonhydrostatic AtmospheRe CHemistry model Version 2.0 (v2.0.0), Zenodo [code], https://doi.org/10.5281/zenodo.5215467, 2021a. a
Kodros, J., Papanastasiou, D., Paglione, M., Masiol, M., Squizzato, S., Florou, K., Kołodziejczyk, A., Skyllakou, K., Nenes, A., and Pandis, S.: The oxidizing power of the dark side: Rapid nocturnal aging of biomass burning as an overlooked source of oxidized organic aerosol, EGU General Assembly 2020, Online, 4–8 May 2020, EGU2020-7382, https://doi.org/10.5194/egusphere-egu2020-7382, 2020. a, b
Kuenen, J., Dellaert, S., Visschedijk, A., Jalkanen, J.-P., Super, I., and Denier van der Gon, H.: CAMS-REG-v4: a state-of-the-art high-resolution European emission inventory for air quality modelling, Earth Syst. Sci. Data, 14, 491–515, https://doi.org/10.5194/essd-14-491-2022, 2022. a
Kumar, N. K., Corbin, J. C., Bruns, E. A., Massabó, D., Slowik, J. G., Drinovec, L., Močnik, G., Prati, P., Vlachou, A., Baltensperger, U., Gysel, M., El-Haddad, I., and Prévôt, A. S. H.: Production of particulate brown carbon during atmospheric aging of residential wood-burning emissions, Atmos. Chem. Phys., 18, 17843–17861, https://doi.org/10.5194/acp-18-17843-2018, 2018. a
Lana, A., Bell, T. G., Simó, R., Vallina, S. M., Ballabrera-Poy, J., Kettle, A. J., Dachs, J., Bopp, L., Saltzman, E. S., Stefels, J., Johnson, J. E., and Liss, P. S.: An updated climatology of surface dimethlysulfide concentrations and emission fluxes in the global ocean, Global Biogeochem. Cy., 25, 1, https://doi.org/10.1029/2010GB003850, 2011. a
Lanz, V. A., Prévôt, A. S. H., Alfarra, M. R., Weimer, S., Mohr, C., DeCarlo, P. F., Gianini, M. F. D., Hueglin, C., Schneider, J., Favez, O., D'Anna, B., George, C., and Baltensperger, U.: Characterization of aerosol chemical composition with aerosol mass spectrometry in Central Europe: an overview, Atmos. Chem. Phys., 10, 10453–10471, https://doi.org/10.5194/acp-10-10453-2010, 2010. a
Laskin, A., Laskin, J., and Nizkorodov, S. A.: Chemistry of atmospheric brown carbon, Chemi. Rev., 115, 4335–4382, 2015. a, b, c
Lee, H. J., Aiona, P. K., Laskin, A., Laskin, J., and Nizkorodov, S. A.: Effect of solar radiation on the optical properties and molecular composition of laboratory proxies of atmospheric brown carbon, Environ. Sci. Technol., 48, 10217–10226, 2014. a
Li, L., Dubovik, O., Derimian, Y., Schuster, G. L., Lapyonok, T., Litvinov, P., Ducos, F., Fuertes, D., Chen, C., Li, Z., Lopatin, A., Torres, B., and Che, H.: Retrieval of aerosol components directly from satellite and ground-based measurements, Atmos. Chem. Phys., 19, 13409–13443, https://doi.org/10.5194/acp-19-13409-2019, 2019. a
Li, Q., Liu, D., Jiang, X., Tian, P., Wu, Y., Li, S., Hu, K., Liu, Q., Huang, M., Li, R., Bi, K., Kong, S., Ding, D., and Yu, C.: Concurrent photochemical whitening and darkening of ambient brown carbon, Atmos. Chem. Phys., 23, 9439–9453, https://doi.org/10.5194/acp-23-9439-2023, 2023. a
Liakakou, E., Stavroulas, I., Kaskaoutis, D., Grivas, G., Paraskevopoulou, D., Dumka, U., Tsagkaraki, M., Bougiatioti, A., Oikonomou, K., Sciare, J., Gerasopoulos, E., and Mihalopoulos, N.: Long-term variability, source apportionment and spectral properties of black carbon at an urban background site in Athens, Greece, Atmos. Environ., 222, 117137, https://doi.org/10.1016/j.atmosenv.2019.117137, 2020. a, b, c
Lin, G., Penner, J. E., Flanner, M. G., Sillman, S., Xu, L., and Zhou, C.: Radiative forcing of organic aerosol in the atmosphere and on snow: Effects of SOA and brown carbon, J. Geophys. Res.-Atmos., 119, 7453–7476, 2014. a
Liu, Q., Xu, X., Zhao, W., Zhou, J., Rahman, M. M., Cai, Y., Wang, S., Fang, B., and Zhang, W.: Broadband spectrum characteristics and radiative effects of primary brown carbon from wood pyrolysis, Sci. Total Environ., 882, 163500, https://doi.org/10.1016/j.scitotenv.2023.163500, 2023. a
Lu, Z., Streets, D. G., Winijkul, E., Yan, F., Chen, Y., Bond, T. C., Feng, Y., Dubey, M. K., Liu, S., Pinto, J. P., and Carmichael, G. R.: Light absorption properties and radiative effects of primary organic aerosol emissions, Environ. Sci. Technol., 49, 4868–4877, 2015. a, b, c, d
Luo, B., Kuang, Y., Huang, S., Song, Q., Hu, W., Li, W., Peng, Y., Chen, D., Yue, D., Yuan, B., and Shao, M.: Parameterizations of size distribution and refractive index of biomass burning organic aerosol with black carbon content, Atmos. Chem. Phys., 22, 12401–12415, https://doi.org/10.5194/acp-22-12401-2022, 2022. a
Manubens-Gil, D., Vegas-Regidor, J., Prodhomme, C., Mula-Valls, O., and Doblas-Reyes, F. J.: Seamless management of ensemble climate prediction experiments on HPC platforms, 2016 International Conference on High Performance Computing & Simulation (HPCS), Innsbruck, Austria, 2016, 895–900, https://doi.org/10.1109/HPCSim.2016.7568429, 2016. a
Massabò, D., Caponi, L., Bernardoni, V., Bove, M., Brotto, P., Calzolai, G., Cassola, F., Chiari, M., Fedi, M., Fermo, P., and et al.: Multi-wavelength optical determination of black and brown carbon in atmospheric aerosols, Atmos. Environ., 108, 1–12, 2015. a
Mathai, S., Veghte, D., Kovarik, L., Mazzoleni, C., Tseng, K.-P., Bucci, S., Capek, T., Cheng, Z., Marinoni, A., and China, S.: Optical Properties of Individual Tar Balls in the Free Troposphere, Environ. Sci. Technol., 57, 16834–16842, 2023. a, b, c
Matsui, H. and Mahowald, N.: Development of a global aerosol model using a two-dimensional sectional method: 2. Evaluation and sensitivity simulations, J. Adv. Model. Earth Sy., 9, 1887–1920, 2017. a
Methymaki, G., Bossioli, E., Boucouvala, D., Nenes, A., and Tombrou, M.: Brown carbon absorption in the Mediterranean basin from local and long-range transported biomass burning air masses, Atmos. Environ., 306, 119822, https://doi.org/10.1016/j.atmosenv.2023.119822, 2023. a
Metzger, S., Dentener, F., Pandis, S., and Lelieveld, J.: Gas/aerosol partitioning: 1. A computationally efficient model, J. Geophys. Res.-Atmos., 107, ACH-16, https://doi.org/10.1029/2001JD001102, 2002. a
Middlebrook, A. M., Bahreini, R., Jimenez, J. L., and Canagaratna, M. R.: Evaluation of composition-dependent collection efficiencies for the aerodyne aerosol mass spectrometer using field data, Aerosol Sci. Technol., 46, 258–271, 2012. a
Minguillón, M. C., Perron, N., Querol, X., Szidat, S., Fahrni, S. M., Alastuey, A., Jimenez, J. L., Mohr, C., Ortega, A. M., Day, D. A., Lanz, V. A., Wacker, L., Reche, C., Cusack, M., Amato, F., Kiss, G., Hoffer, A., Decesari, S., Moretti, F., Hillamo, R., Teinilä, K., Seco, R., Peñuelas, J., Metzger, A., Schallhart, S., Müller, M., Hansel, A., Burkhart, J. F., Baltensperger, U., and Prévôt, A. S. H.: Fossil versus contemporary sources of fine elemental and organic carbonaceous particulate matter during the DAURE campaign in Northeast Spain, Atmos. Chem. Phys., 11, 12067–12084, https://doi.org/10.5194/acp-11-12067-2011, 2011. a
Mishchenko, M. I., Travis, L. D., and Lacis, A. A.: Scattering, absorption, and emission of light by small particles, Cambridge university press, ISBN 9780521782524, 052178252X, 2002. a, b, c
Moosmüller, H., Chakrabarty, R., and Arnott, W.: Aerosol light absorption and its measurement: A review, J. Quant. Spectrosc. Ra., 110, 844–878, 2009. a
Müller, T. and Fiebig, M.: ACTRIS In Situ Aerosol: Guidelines for Manual QC of AE33 absorption photometer data, https://www.actris-ecac.eu/ (last access: 3 January 2024), 2018. a, b
Nakayama, T., Matsumi, Y., Sato, K., Imamura, T., Yamazaki, A., and Uchiyama, A.: Laboratory studies on optical properties of secondary organic aerosols generated during the photooxidation of toluene and the ozonolysis of α-pinene, J. Geophys. Res.-Atmos., 115, D24, https://doi.org/10.1029/2010JD014387, 2010. a
Nakayama, T., Sato, K., Matsumi, Y., Imamura, T., Yamazaki, A., and Uchiyama, A.: Wavelength dependence of refractive index of secondary organic aerosols generated during the ozonolysis and photooxidation of α-pinene, Sola, 8, 119–123, 2012. a
Navarro-Barboza, H., Pandolfi, M., Guevara, M., Enciso, S., Tena, C., Via, M., Yus-Díez, J., Reche, C., Pérez, N., Alastuey, A., Querol, X., and Jorba, O.: Uncertainties in source allocation of carbonaceous aerosols in a Mediterranean region, Environ. Int., 183, 108252, https://doi.org/10.1016/j.envint.2023.108252, 2024. a, b, c, d, e
Navarro Barboza, H., Jorba, O., and Pandolfi, M.: Characterization of Brown Carbon absorption in different European environments through source contribution analysis, Zenodo [data set], https://doi.org/10.5281/zenodo.14914247, 2025. a
Neyestani, S. E. and Saleh, R.: Observationally constrained representation of brown carbon emissions from wildfires in a chemical transport model, Environmental Science: Atmospheres, 2, 192–201, 2022. a
Ng, N. L., Herndon, S. C., Trimborn, A., Canagaratna, M. R., Croteau, P., Onasch, T. B., Sueper, D., Worsnop, D. R., Zhang, Q., Sun, Y., and Jayne, J. T.: An Aerosol Chemical Speciation Monitor (ACSM) for routine monitoring of the composition and mass concentrations of ambient aerosol, Aerosol Sci. Technol., 45, 780–794, 2011. a
Obiso, V.: Assessment of dynamic aerosol-radiation interaction in atmospheric models, PhD thesis, 2018. a
Okuljar, M., Garmash, O., Olin, M., Kalliokoski, J., Timonen, H., Niemi, J. V., Paasonen, P., Kontkanen, J., Zhang, Y., Hellén, H., Kuuluvainen, H., Aurela, M., Manninen, H. E., Sipilä, M., Rönkkö, T., Petäjä, T., Kulmala, M., Dal Maso, M., and Ehn, M.: Influence of anthropogenic emissions on the composition of highly oxygenated organic molecules in Helsinki: a street canyon and urban background station comparison, Atmos. Chem. Phys., 23, 12965–12983, https://doi.org/10.5194/acp-23-12965-2023, 2023. a
Pai, S. J., Heald, C. L., Pierce, J. R., Farina, S. C., Marais, E. A., Jimenez, J. L., Campuzano-Jost, P., Nault, B. A., Middlebrook, A. M., Coe, H., Shilling, J. E., Bahreini, R., Dingle, J. H., and Vu, K.: An evaluation of global organic aerosol schemes using airborne observations, Atmos. Chem. Phys., 20, 2637–2665, https://doi.org/10.5194/acp-20-2637-2020, 2020. a, b
Pandolfi, M., Querol, X., Alastuey, A., Jimenez, J., Jorba, O., Day, D., Ortega, A., Cubison, M., Comerón, A., Sicard, M., Mohr, C., Prévôt, A. S. H., Minguillón, M. C., Pey, J., Baldasano, J. M., Burkhart, J. F., Seco, R., Peñuelas, J., van Drooge, B. L., Artiñano, B., Di Marco, C., Nemitz, E., Schallhart, S., Metzger, A., Hansel, A., Lorente, J., Ng, S., Jayne, J., and Szidat, S.: Effects of sources and meteorology on particulate matter in the Western Mediterranean Basin: An overview of the DAURE campaign, J. Geophys. Res.-Atmos., 119, 4978–5010, 2014. a
Pani, S. K., Lin, N.-H., Griffith, S. M., Chantara, S., Lee, C.-T., Thepnuan, D., and Tsai, Y. I.: Brown carbon light absorption over an urban environment in northern peninsular Southeast Asia, Environ. Pollut., 276, 116735, https://doi.org/10.1016/j.envpol.2021.116735, 2021. a, b, c
Paraskevopoulou, D., Kaskaoutis, D., Grivas, G., Bikkina, S., Tsagkaraki, M., Vrettou, I., Tavernaraki, K., Papoutsidaki, K., Stavroulas, I., Liakakou, E., Bougiatioti, A., Oikonomou, K., Gerasopoulos, E., and Mihalopoulos, N.: Brown carbon absorption and radiative effects under intense residential wood burning conditions in Southeastern Europe: New insights into the abundance and absorptivity of methanol-soluble organic aerosols, Sci. Total Environ., 860, 160434, https://doi.org/10.1016/j.scitotenv.2022.160434, 2023. a
Park, R. J., Kim, M. J., Jeong, J. I., Youn, D., and Kim, S.: A contribution of brown carbon aerosol to the aerosol light absorption and its radiative forcing in East Asia, Atmos. Environ., 44, 1414–1421, 2010. a
Pérez, C., Haustein, K., Janjic, Z., Jorba, O., Huneeus, N., Baldasano, J. M., Black, T., Basart, S., Nickovic, S., Miller, R. L., Perlwitz, J. P., Schulz, M., and Thomson, M.: Atmospheric dust modeling from meso to global scales with the online NMMB/BSC-Dust model – Part 1: Model description, annual simulations and evaluation, Atmos. Chem. Phys., 11, 13001–13027, https://doi.org/10.5194/acp-11-13001-2011, 2011. a
Putaud, J.-P., Cavalli, F., Crippa, M., Putaud, J. P., Cavalli, F., and Crippa, M. : Long-term trends in black carbon from biomass and fossil fuel combustion detected at the JRC atmospheric observatory in Ispra, https://doi.org/10.2760/5944, 2018. a
Qin, Y. M., Tan, H. B., Li, Y. J., Li, Z. J., Schurman, M. I., Liu, L., Wu, C., and Chan, C. K.: Chemical characteristics of brown carbon in atmospheric particles at a suburban site near Guangzhou, China, Atmos. Chem. Phys., 18, 16409–16418, https://doi.org/10.5194/acp-18-16409-2018, 2018. a
Riemer, N., Vogel, H., Vogel, B., Schell, B., Ackermann, I., Kessler, C., and Hass, H.: Impact of the heterogeneous hydrolysis of N2O5 on chemistry and nitrate aerosol formation in the lower troposphere under photosmog conditions, J. Geophys. Res.-Atmos., 108, D4, https://doi.org/10.1029/2002JD002436, 2003. a
Rovira, J., Savadkoohi, M., and Pandolfi, M.: A European aerosol phenomenology – 9: LIGHT ABSORPTION PROPERTIES OF CARBONACEOUS AEROSOL PARTICLES ACROSS SURFACE EUROPE (1.0.0), Zenodo [data set], https://doi.org/10.5281/zenodo.13365276, 2024. a
Saleh, R.: From measurements to models: toward accurate representation of brown carbon in climate calculations, Current Pollution Reports, 6, 90–104, 2020. a, b, c, d, e, f, g, h, i, j, k
Saleh, R., Robinson, E. S., Tkacik, D. S., Ahern, A. T., Liu, S., Aiken, A. C., Sullivan, R. C., Presto, A. A., Dubey, M. K., Yokelson, R. J., Donahue, N. M., and Robinson, A. L.: Brownness of organics in aerosols from biomass burning linked to their black carbon content, Nat. Geosci., 7, 647–650, 2014. a
Saleh, R., Marks, M., Heo, J., Adams, P. J., Donahue, N. M., and Robinson, A. L.: Contribution of brown carbon and lensing to the direct radiative effect of carbonaceous aerosols from biomass and biofuel burning emissions, J. Geophys. Res.-Atmos., 120, 10–285, 2015. a
Saleh, R., Cheng, Z., and Atwi, K.: The brown–black continuum of light-absorbing combustion aerosols, Environ. Sci. Technol. Lett., 5, 508–513, 2018. a
Sand, M., Samset, B. H., Myhre, G., Gliß, J., Bauer, S. E., Bian, H., Chin, M., Checa-Garcia, R., Ginoux, P., Kipling, Z., Kirkevåg, A., Kokkola, H., Le Sager, P., Lund, M. T., Matsui, H., van Noije, T., Olivié, D. J. L., Remy, S., Schulz, M., Stier, P., Stjern, C. W., Takemura, T., Tsigaridis, K., Tsyro, S. G., and Watson-Parris, D.: Aerosol absorption in global models from AeroCom phase III, Atmos. Chem. Phys., 21, 15929–15947, https://doi.org/10.5194/acp-21-15929-2021, 2021. a
Sarwar, G., Simon, H., Bhave, P., and Yarwood, G.: Examining the impact of heterogeneous nitryl chloride production on air quality across the United States, Atmos. Chem. Phys., 12, 6455–6473, https://doi.org/10.5194/acp-12-6455-2012, 2012. a
Savadkoohi, M., Pandolfi, M., Reche, C., Niemi, J. V., Mooibroek, D., Titos, G., Green, D. C., Tremper, A. H., Hueglin, C., Liakakou, E., Mihalopoulos, N., Stavroulas, I., Artiñano, B., Coz, E., Alados-Arboledas, L., Beddows, D., Riffault, V., De Brito, J. F., Bastian, S., Baudic, A., Colombi, C., Costabile, F., Chazeau, B., Marchand, N., Gómez-Amo, J. L., Estellés, V., Matos, V., van der Gaag, E., Gille, G., Luoma, K., Manninen, H. E., Norman, M., Silvergren, S., Petit, J.-E., Putaud, J.-P., Rattigan, O. V., Timonen, H., Tuch, T., Merkel, M., Weinhold, K., Vratolis, S., Vasilescu, J., Favez, O., Harrison, R. M., Laj, P., Wiedensohler, A., Hopke, P. K., Petäjä, T., Alastuey, A., and Querol, X.: The variability of mass concentrations and source apportionment analysis of equivalent black carbon across urban Europe, Environ. Int., 178, 108081, https://doi.org/10.1016/j.envint.2023.108081, 2023. a, b, c, d, e
Segelstein, D. J.: The complex refractive index of water, PhD thesis, University of Missouri, Kansas City, https://finding-aids.library.umkc.edu/repositories/4/archival_objects/394637 (last access: 19 February 2025) 1981. a
Sekula, P., Ustrnul, Z., Bokwa, A., Bochenek, B., and Zimnoch, M.: Random forests assessment of the role of atmospheric circulation in PM10 in an urban area with complex topography, Sustainability, 14, 3388, https://doi.org/10.3390/su14063388, 2022. a
Skiba, A., Styszko, K., Tobler, A., Casotto, R., Gorczyca, Z., Furman, P., Samek, L., Wideł, D., Zimnoch, M., Kasper-Giebl, A., Slowik, J. G., Daellenbach, K. R., Prevot, A. S. H., and Różański, K.: Source attribution of carbonaceous fraction of particulate matter in the urban atmosphere based on chemical and carbon isotope composition, Sci. Rep., 14, 7234, https://doi.org/10.1038/s41598-024-57829-x, 2024. a
Spada, M.: Development and evaluation of an atmospheric aerosol module implemented within the NMMB/BSC-CTM, PhD thesis, Universitat Politècnica de Catalunya, http://hdl.handle.net/10803/327593, 2015. a, b
Spada, M., Jorba, O., Pérez García-Pando, C., Janjic, Z., and Baldasano, J. M.: Modeling and evaluation of the global sea-salt aerosol distribution: sensitivity to size-resolved and sea-surface temperature dependent emission schemes, Atmos. Chem. Phys., 13, 11735–11755, https://doi.org/10.5194/acp-13-11735-2013, 2013. a
Takemura, T., Nozawa, T., Emori, S., Nakajima, T. Y., and Nakajima, T.: Simulation of climate response to aerosol direct and indirect effects with aerosol transport-radiation model, J. Geophys. Res.-Atmos., 110, https://doi.org/10.1029/2004JD005029, 2005. a
Tegen, I., Neubauer, D., Ferrachat, S., Siegenthaler-Le Drian, C., Bey, I., Schutgens, N., Stier, P., Watson-Parris, D., Stanelle, T., Schmidt, H., Rast, S., Kokkola, H., Schultz, M., Schroeder, S., Daskalakis, N., Barthel, S., Heinold, B., and Lohmann, U.: The global aerosol–climate model ECHAM6.3–HAM2.3 – Part 1: Aerosol evaluation, Geosci. Model Dev., 12, 1643–1677, https://doi.org/10.5194/gmd-12-1643-2019, 2019. a, b
Tian, J., Wang, Q., Ma, Y., Wang, J., Han, Y., and Cao, J.: Impacts of biomass burning and photochemical processing on the light absorption of brown carbon in the southeastern Tibetan Plateau, Atmos. Chem. Phys., 23, 1879–1892, https://doi.org/10.5194/acp-23-1879-2023, 2023. a
Tobler, A. K., Skiba, A., Canonaco, F., Močnik, G., Rai, P., Chen, G., Bartyzel, J., Zimnoch, M., Styszko, K., Nęcki, J., Furger, M., Różański, K., Baltensperger, U., Slowik, J. G., and Prevot, A. S. H.: Characterization of non-refractory (NR) PM1 and source apportionment of organic aerosol in Kraków, Poland, Atmos. Chem. Phys., 21, 14893–14906, https://doi.org/10.5194/acp-21-14893-2021, 2021. a
Tolocka, M. P., Saul, T. D., and Johnston, M. V.: Reactive uptake of nitric acid into aqueous sodium chloride droplets using real-time single-particle mass spectrometry, J. Phys. Chem. A, 108, 2659–2665, 2004. a
Valenzuela, A., Olmo, F., Lyamani, H., Antón, M., Titos, G., Cazorla, A., and Alados-Arboledas, L.: Aerosol scattering and absorption Angström exponents as indicators of dust and dust-free days over Granada (Spain), Atmos. Res., 154, 1–13, 2015. a
Via, M., Minguillón, M. C., Reche, C., Querol, X., and Alastuey, A.: Increase in secondary organic aerosol in an urban environment, Atmos. Chem. Phys., 21, 8323–8339, https://doi.org/10.5194/acp-21-8323-2021, 2021. a
Wang, J., Nie, W., Cheng, Y., Shen, Y., Chi, X., Wang, J., Huang, X., Xie, Y., Sun, P., Xu, Z., Qi, X., Su, H., and Ding, A.: Light absorption of brown carbon in eastern China based on 3-year multi-wavelength aerosol optical property observations and an improved absorption Ångström exponent segregation method, Atmos. Chem. Phys., 18, 9061–9074, https://doi.org/10.5194/acp-18-9061-2018, 2018a. a
Wang, L., Li, Z., Tian, Q., Ma, Y., Zhang, F., Zhang, Y., Li, D., Li, K., and Li, L.: Estimate of aerosol absorbing components of black carbon, brown carbon, and dust from ground-based remote sensing data of sun-sky radiometers, J. Geophys. Res.-Atmos., 118, 6534–6543, 2013. a, b
Wang, X., Heald, C. L., Ridley, D. A., Schwarz, J. P., Spackman, J. R., Perring, A. E., Coe, H., Liu, D., and Clarke, A. D.: Exploiting simultaneous observational constraints on mass and absorption to estimate the global direct radiative forcing of black carbon and brown carbon, Atmos. Chem. Phys., 14, 10989–11010, https://doi.org/10.5194/acp-14-10989-2014, 2014. a
Wang, X., Heald, C. L., Liu, J., Weber, R. J., Campuzano-Jost, P., Jimenez, J. L., Schwarz, J. P., and Perring, A. E.: Exploring the observational constraints on the simulation of brown carbon, Atmos. Chem. Phys., 18, 635–653, https://doi.org/10.5194/acp-18-635-2018, 2018b. a, b
Washenfelder, R., Azzarello, L., Ball, K., Brown, S., Decker, Z., Franchin, A., Fredrickson, C., Hayden, K., Holmes, C., Middlebrook, A., Palm, B. B., Pierce, R. B., Price, D. J., Roberts, J. M., Robinson, M. A., Thornton, J. A., Womack, C. C., and Young, C. J.: Complexity in the evolution, composition, and spectroscopy of brown carbon in aircraft measurements of wildfire plumes, Geophys. Res. Lett., 49, e2022GL098951, https://doi.org/10.1029/2022GL098951, 2022. a
Weingartner, E., Saathoff, H., Schnaiter, M., Streit, N., Bitnar, B., and Baltensperger, U.: Absorption of light by soot particles: determination of the absorption coefficient by means of aethalometers, J. Aerosol Sci., 34, 1445–1463, 2003. a
Wild, O., Zhu, X., and Prather, M. J.: Fast-J: Accurate simulation of in-and below-cloud photolysis in tropospheric chemical models, J. Atmos. Chem., 37, 245–282, 2000. a
Wolf, R., El-Haddad, I., Slowik, J., Dällenbach, K., Bruns, E., Vasilescu, J., Baltensperger, U., and Prévôt, A.: Contribution of bacteria-like particles to PM2.5 aerosol in urban and rural environments, Atmos. Environ., 160, 97–106, 2017. a
Wong, J. P. S., Tsagkaraki, M., Tsiodra, I., Mihalopoulos, N., Violaki, K., Kanakidou, M., Sciare, J., Nenes, A., and Weber, R. J.: Atmospheric evolution of molecular-weight-separated brown carbon from biomass burning, Atmos. Chem. Phys., 19, 7319–7334, https://doi.org/10.5194/acp-19-7319-2019, 2019. a
Xiong, R., Li, J., Zhang, Y., Zhang, L., Jiang, K., Zheng, H., Kong, S., Shen, H., Cheng, H., Shen, G., Cheng H., Shen, G., and Tao, S.: Global brown carbon emissions from combustion sources, Environmental Science and Ecotechnology, 12, 100201, https://doi.org/10.1016/j.ese.2022.100201, 2022. a
Yarwood, G., Rao, S., Yocke, M., and Whitten, G.: Updates to the carbon bond chemical mechanism: CB05, Final report to the US EPA, RT-0400675, 8, 13, 2005. a
Yli-Juuti, T., Mielonen, T., Heikkinen, L., Arola, A., Ehn, M., Isokääntä, S., Keskinen, H. M., Kulmala, M., Laakso, A., Lipponen, A., Luoma, K., Mikkonen, S., Nieminen, T., Paasonen, P., Petäjä, T., Romakkaniemi, S., Tonttila, J., Kokkola, H., and Virtanen, A.: Significance of the organic aerosol driven climate feedback in the boreal area, Nat. Commun., 12, 5637, https://doi.org/10.1038/s41467-021-25850-7, 2021. a
Yus-Díez, J., Bernardoni, V., Močnik, G., Alastuey, A., Ciniglia, D., Ivančič, M., Querol, X., Perez, N., Reche, C., Rigler, M., Vecchi, R., Valentini, S., and Pandolfi, M.: Determination of the multiple-scattering correction factor and its cross-sensitivity to scattering and wavelength dependence for different AE33 Aethalometer filter tapes: a multi-instrumental approach, Atmos. Meas. Tech., 14, 6335–6355, https://doi.org/10.5194/amt-14-6335-2021, 2021. a
Yus-Díez, J., Via, M., Alastuey, A., Karanasiou, A., Minguillón, M. C., Perez, N., Querol, X., Reche, C., Ivančič, M., Rigler, M., and Pandolfi, M.: Absorption enhancement of black carbon particles in a Mediterranean city and countryside: effect of particulate matter chemistry, ageing and trend analysis, Atmos. Chem. Phys., 22, 8439–8456, https://doi.org/10.5194/acp-22-8439-2022, 2022. a
Zgłobicki, W. and Baran-Zgłobicka, B.: Air pollution in major Polish cities in the period 2005–2021: Intensity, effects and attempts to reduce it, Environ. Res., 240, 117497, https://doi.org/10.1016/j.envres.2023.117497, 2024. a
Zhang, A., Wang, Y., Zhang, Y., Weber, R. J., Song, Y., Ke, Z., and Zou, Y.: Modeling the global radiative effect of brown carbon: a potentially larger heating source in the tropical free troposphere than black carbon, Atmos. Chem. Phys., 20, 1901–1920, https://doi.org/10.5194/acp-20-1901-2020, 2020a. a, b, c
Zhang, G., Peng, L., Lian, X., Lin, Q., Bi, X., Chen, D., Li, M., Li, L., Wang, X., and Sheng, G.: An improved absorption Ångström exponent (AAE)-based method for evaluating the contribution of light absorption from brown carbon with a high-time resolution, Aerosol Air Qual. Res., 19, 15–24, 2019. a
Zhang, Q., Worsnop, D. R., Canagaratna, M. R., and Jimenez, J. L.: Hydrocarbon-like and oxygenated organic aerosols in Pittsburgh: insights into sources and processes of organic aerosols, Atmos. Chem. Phys., 5, 3289–3311, https://doi.org/10.5194/acp-5-3289-2005, 2005. a
Zhang, Y., Albinet, A., Petit, J.-E., Jacob, V., Chevrier, F., Gille, G., Pontet, S., Chrétien, E., Dominik-Sègue, M., Levigoureux, G., Močnik, G., Gros, V., Jaffrezo, J.-L., and Favez, O.: Substantial brown carbon emissions from wintertime residential wood burning over France, Sci. Total Environ., 743, 140752, https://doi.org/10.1016/j.scitotenv.2020.140752, 2020b. a, b, c, d
Zhao, R., Lee, A. K. Y., Huang, L., Li, X., Yang, F., and Abbatt, J. P. D.: Photochemical processing of aqueous atmospheric brown carbon, Atmos. Chem. Phys., 15, 6087–6100, https://doi.org/10.5194/acp-15-6087-2015, 2015. a