the Creative Commons Attribution 4.0 License.
the Creative Commons Attribution 4.0 License.
 | 28 Feb 2025
Contributions of the synoptic meteorology to the seasonal cloud condensation nuclei cycle over the Southern Ocean
Tahereh Alinejadtabrizi
Francisco Lang
Steven Siems
Michael Manton
Luis Ackermann
Melita Keywood
Ruhi Humphries
Paul Krummel
Alastair Williams
Greg Ayers
Cloud condensation nuclei (CCN) play a fundamental role in determining the microphysical properties of low-level clouds that are crucial for defining the energy budget over the Southern Ocean (SO). However, many aspects of the CCN budget over the SO remains poorly understood, including the role of the synoptic meteorology. In this study, we classify six distinct synoptic regimes over the Kennaook / Cape Grim Observatory (CGO) and examine their influence on the seasonal cycle of the CCN concentration (NCCN). Three “winter” regimes are dominant when the subtropical ridge (STR) is strong and centered at lower latitudes, while three “summer” regimes prevail when the STR shifts to higher latitudes. Distinct winter and summer “baseline” synoptic patterns contribute to the seasonal cycle of NCCN, with the winter baseline regime characterized by heavier precipitation (0.10 vs. 0.03 mm h−1), a deeper boundary layer (850 vs. 900 hPa), and lower NCCN (71 vs. 137 cm−3) than the summer one. Across these two baseline regimes, we observe a significant inverse relationship between precipitation and NCCN, underscoring the contribution of precipitation in reducing NCCN over the SO. An analysis of air mass back-trajectories, specifically at the free-troposphere level, supports this seasonal distinction, with wintertime air masses originating more frequently from higher latitudes. The summertime STR is seen as a barrier to Antarctic air masses reaching the latitude of the CGO. Conversely, the summer baseline regime is found to pass more frequently over continental Australia before reaching the CGO, consistent with enhanced radon concentrations.
- Article
(4034 KB) - Full-text XML
- BibTeX
- EndNote


Low-altitude clouds, frequently found in or near the marine atmospheric boundary layer (MABL), are prevalent over mid-latitude oceans (Wood, 2012) and are a pivotal component of the Earth's climate system due to their direct impact on the energy budget and hydrological cycle (Trenberth and Fasullo, 2010; Williams et al., 2013; Bodas-Salcedo et al., 2014; Tan et al., 2016; Schuddeboom and McDonald, 2021). These clouds are not only notoriously difficult to simulate accurately within climate models (Forbes and Ahlgrimm, 2014; Kay et al., 2016) but also exhibit a profound impact on the climate sensitivity of these simulations, especially over the Southern Ocean (SO), as highlighted in the latest phase of the Coupled Model Intercomparison Project (CMIP6) (Zelinka et al., 2020). The radiative properties of these clouds are highly sensitive to their macrophysics and microphysics (Wood, 2012; Wood et al., 2012), such as the cloud droplet number concentration (Nd). Evidence from the Southern Ocean Clouds, Radiation, Aerosol Transport Experimental Study (SOCRATES) emphasized the intimate connection between Nd, cloud condensation nuclei concentrations (NCCN), and aerosol properties in this region. Such insights highlight the critical role of aerosols, particularly cloud condensation nuclei (CCN), in shaping cloud properties and radiative effects over the SO (McFarquhar et al., 2021) and the complex interplay between aerosols, cloud formation, precipitation, and the local dynamics and thermodynamics of the MABL.
The NCCN over the SO has been studied for decades (e.g., Gras, 1990, 1995; Ayers et al., 1997; Gras and Keywood, 2017; Humphries et al., 2021) due to its importance and the availability of long-term, high-quality field observations. Located at the northwest tip of Tasmania (40°41′ S, 144°41′ E), the Kennaook / Cape Grim Observatory (CGO) has been providing unique access to pristine air masses off the SO during “baseline” conditions (Gras and Keywood, 2017; Humphries et al., 2023) since 1976. It is worth noting that, henceforth, the term “pristine” refers to air masses with low NCCN. This program is the principal Australian contribution to the World Meteorological Organization (WMO) Global Atmosphere Watch (GAW) (Gras and Keywood, 2017). From the earliest observations, the CGO record has revealed a robust seasonal cycle in NCCN (Bigg et al., 1984; Ayers et al., 1997; Gras and Keywood, 2017; Humphries et al., 2023). During the austral winter (June–August, JJA), the NCCN is at a minimum, while peaks are observed over the summer months (December–February, DJF).
Dimethylsulfide (DMS), primarily originating from planktonic algae in seawater, emerges as a substantial source of CCN over oceanic regions (Charlson et al., 1987). While marine biological sources predominantly govern NCCN during the summer months, multiple elements, such as sea salt particles produced from sea spray and bubble bursting, contribute to CCN levels throughout the year over the SO (e.g., Ayers and Cainey, 2007; Korhonen et al., 2008; Quinn and Bates, 2011; Hudson et al., 2011; Quinn et al., 2014; Sanchez et al., 2018; Twohy et al., 2021). Beyond these primary contributors, various other sinks (e.g., coalescence scavenging) and sources (e.g., secondary particles) influence the CCN budget over the SO (e.g., Vallina et al., 2006; Fossum et al., 2018; Humphries et al., 2023; Niu et al., 2024), some of which have not been as extensively studied.
Early simulations of the CCN budget within the SO MABL were driven by the CGO record (Ayers et al., 1995), demonstrating the importance of the seasonality of the biogenic activity within the surface fluxes. Such simulations were arguably limited, as a complete 1-D CCN budget of the MABL not only needs surface sources but must also include entrainment from the free troposphere as a potential source (Clarke et al., 1998; Capaldo et al., 1999; Katoshevski et al., 1999; Jimi et al., 2007; Wood et al., 2012; Rose et al., 2017). Since new-particle formation is rare in the MABL (Bates et al., 1998), the exchange with the free troposphere can supply particles that grow into CCN (Korhonen et al., 2008; Williamson et al., 2019; Sanchez et al., 2021). Furthermore, such simple budget models need to include the sink terms from coalescence scavenging and wet deposition (Feingold et al., 1996; Mechem et al., 2006; Wood, 2006; Kang et al., 2022; Alinejadtabrizi et al., 2024), although no such observations have routinely been available. Kang et al. (2022), employing the SOCRATES campaign over the SO, along with a simplified but more comprehensive budget model (developed initially by Wood et al., 2012), highlighted entrainment from the free troposphere as a crucial source during the summertime and coalescence scavenging as a key sink of CCN over the SO (Sanchez et al., 2021). Painemal et al. (2023) also investigated the influence of distinct synoptic patterns dominant over the western North Atlantic during wintertime, demonstrating the critical role of synoptic meteorology in regulating aerosol–cloud–meteorology interactions. Their findings highlight how variations in atmospheric regimes impact cloud microphysics, boundary layer dynamics, and NCCN, emphasizing the importance of accounting for synoptic-scale influences when interpreting CCN variability and aerosol–cloud interactions in extratropical regions.
Examining baseline air masses, Alinejadtabrizi et al. (2024) established a relationship between the NCCN, the cloud morphology, the precipitation, and the synoptic meteorology. Mesoscale cellular convection (MCC) is commonly observed across these latitudes (Danker et al., 2022; Lang et al., 2022, 2024), with open MCC being more common during winter. Alinejadtabrizi et al. (2024) established that lower concentrations of CCN coincided with the occurrence of open MCC and relatively heavier precipitation rates in comparison to when closed MCC was observed upwind of the CGO. The mean precipitation rate for open MCC was 6 times greater than for closed MCC, underscoring the importance of wet deposition in removing CCN from the MABL during baseline conditions. This research suggests that the seasonality in the synoptic meteorology may be contributing to the observed seasonal cycle in NCCN through the sink associated with the precipitation rate.
Located at 41° S, the seasonal cycle of the meteorology governing the CGO reflects the annual advance and retreat of the Hadley cell and subtropical ridge (STR) (e.g., Pittock, 1973; Dima and Wallace, 2003; Larsen and Nicholls, 2009; Cai et al., 2011). Defined by the mean latitude and intensity of high-pressure systems near the mid-latitudes, the STR is highly correlated to seasonal rainfall and wind patterns (Larsen and Nicholls, 2009; Grose et al., 2015) and temperatures (Pepler et al., 2018) across Australia. Mace and Avey (2017) documented a seasonal cycle in the meteorology, specifically cloud properties and precipitation processes in warm clouds, over the SO using the A-Train satellite data (consistent with other works; e.g., Boers et al., 1998; McCoy et al., 2014, 2015; Huang et al., 2015; Fletcher et al., 2016; Lang et al., 2018, 2022, 2024).
Moving beyond the biogenic production of DMS, our investigation aims to extend our understanding of the role of the synoptic meteorology in shaping the observed seasonal cycle in the NCCN over the CGO under baseline conditions. Specifically, we seek to better appreciate the role of the synoptic meteorology in defining the seasonal precipitation and free-troposphere transport of aerosols. Employing a K-means clustering algorithm, we first define the synoptic meteorology over the CGO, which includes separate clusters for wintertime and summertime baseline conditions. Observations of precipitation underscore the significant role of wet deposition as a sink term contributing to the observed seasonality. Using back-trajectories for these synoptic clusters, we also examine the seasonality in the air mass origin of the free-troposphere transport across the SO. Using radon observations as a proxy for terrestrial influences, we find further evidence of meteorological controls in defining the CCN budget. Finally, the analysis revealed that the STR acts as a seasonal barrier, modulating the connectivity between mid- and higher latitudes, which, in turn, can influence the observed air mass characteristics at the CGO.
The meteorological data set is taken from the fifth generation of the ECMWF Reanalysis v5 (ERA5) produced by the European Centre for Medium-Range Weather Forecasts (ECMWF) (Hersbach et al., 2020), which is available through the Copernicus Climate Change Service Climate Data Store (https://cds.climate.copernicus.eu, last access: August 2024). Our analysis employs 8036 virtual soundings taken twice per day (00:00 and 12:00 UTC) over a period of 11 years (2011–2021) over the grid point nearest to the CGO.
A simple K-means clustering algorithm (Anderberg, 1973) is employed to classify the 11 years of synoptic meteorology based on the low-altitude thermodynamic structure. The K-means clustering algorithm has been widely utilized over the SO to investigate cloud regimes (e.g., Gordon and Norris, 2010; Haynes et al., 2011; Mason et al., 2014), the climatology of MABL (Truong et al., 2020, 2022), and MABL's responses to synoptic forcing (e.g., Hande et al., 2012; Lang et al., 2018; Montoya Duque et al., 2022, 2023). Consistent with the approach of Lang et al. (2018) and Truong et al. (2020), a set of 15 variables is employed for the clustering analysis. These include four variables (the temperature, relative humidity, and zonal and meridional winds) at the three different atmospheric levels (925, 850, and 700 hPa) and three surface variables (pressure, air temperature, and relative humidity). Standardization is applied to each variable before clustering. Initially, the analysis considers the number of the clusters (K) ranging from 2 to 10 (results not shown). Ultimately, six clusters were chosen as this represents the minimum number of clusters that effectively differentiates the synoptic meteorology.
To provide further environmental context for each cluster, the estimated inversion strength (EIS), which reflects the strength of the boundary layer inversion, was calculated. Following Wood and Bretherton (2006), the EIS is defined as
where LTS is the lower-tropospheric stability, defined as the difference in potential temperature between the 700 hPa level and the surface () (Klein and Hartmann, 1993), and is the moist adiabatic potential temperature gradient at 850 hPa. z700 is the altitude of the 700 hPa level, and LCL is the lifting condensation level. The total column water vapor (TCWV) or total precipitable water is also used as an indicator for assessing the atmospheric moisture content and estimating the potential precipitation.
Hourly observations of CCN spanning 11 years are available from the CGO, located at the northwestern tip of Tasmania. The particle measurements at the CGO, initiated in the mid-1970s with a range of technologies, align with the recommendations of the World Meteorological Organization's Global Atmosphere Watch (WMO GAW) program under the Aerosol Program (Gras and Keywood, 2017; Humphries et al., 2023). This study utilizes the NCCN at 0.5 % supersaturation (model CCN-100; Droplet Measurement Technologies, Longmont, CO, USA) for the same twice-daily 8036 soundings. CCN data for other supersaturation levels are not available at these times. Data can be accessed through the World Data Centre for Aerosols (http://www.gaw-wdca.org/, last access: August 2024). Additionally, hourly measurements of radon, as an unequivocal tracer of terrestrial influences on sampled air masses (Zahorowski et al., 2013; Chambers et al., 2015, 2018), are conducted using a dual-flow-loop two-filter atmospheric radon detector over the CGO station (Whittlestone and Zahorowski, 1998; Williams and Chambers, 2016). The hourly precipitation data (in mm h−1) were also obtained from the Australian Bureau of Meteorology rain gauge stationed close to the CGO (station ID: 091331) for the corresponding times. The detection threshold of the rain gauge is 0.2 mm. Over the 11-year period of interest, precipitation is recorded only 12 % of the time, while 88 % of the time the precipitation was recorded to be 0 mm. Due to this high occurrence of non-precipitating conditions, the median precipitation value is zero, necessitating the use of the mean precipitation value for analysis, unlike the NCCN, where the median was used. These observations also highlight the nature of precipitation over our study area, where intermittent precipitation is often experienced, which may occur within 1 h, followed by dry conditions in the next. This variability is consistent by the dominance of open and closed MCCs over the region (e.g., Alinejadtabrizi et al., 2024).
Traditionally for the CGO, the baseline sector is defined as periods with surface wind directions between 190 and 280° (Ayers and Gillett, 2000; Gras et al., 2009) coupled with radon concentrations below various thresholds such as 150 mBq m−3 (Gras and Keywood, 2017). No distinction is made for the season. We define this constraint as the “CGO baseline” hereafter, as opposed to the “winter baseline” and “summer baseline” clusters produced from our cluster analysis. Air sampled in the CGO baseline sector has typically traversed several thousand kilometers across the SO, with minimal recent anthropogenic and terrestrial influences (Ayers and Gillett, 2000; Gras and Keywood, 2017).
The Hybrid Single-Particle Lagrangian Integrated Trajectory (HYSPLIT) model was employed for running the back-trajectories (Draxler and Hess, 1998) to analyze the source of the air parcels, along with the hourly ERA5 data that served as the input for meteorological parameters.
The application of the K-means clustering algorithm (K=6) to the 11 years of ERA5 atmospheric profiles (twice per day) over the CGO has revealed distinct synoptic patterns that vary seasonally. The mean sea level pressure (MSLP) composite plots for these six clusters (Fig. 1) demonstrate a clear division into two groups based on the location of high-pressure centers. The top row in Fig. 1 shows three clusters with high-pressure centers located over lower latitudes, and the bottom row features three clusters with high-pressure centers positioned over higher latitudes. This distinction will be examined in greater detail later in this section.
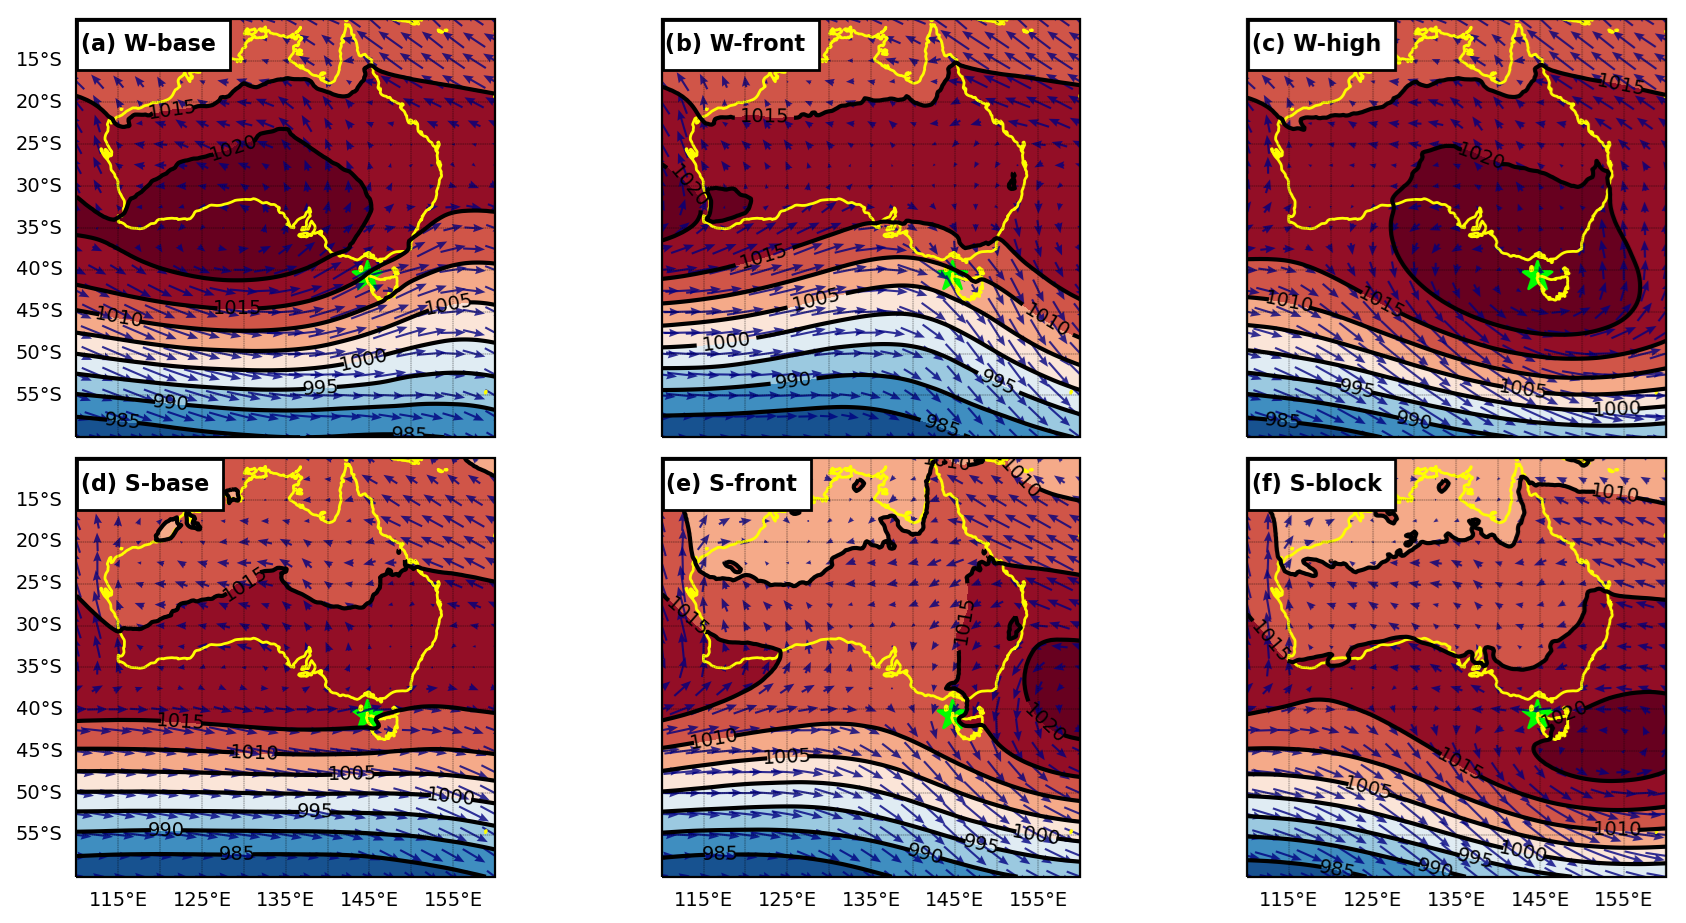
Figure 1MSLP composite for six synoptic clusters: (a) winter baseline (W-base), (b) winter frontal (W-front), (c) winter high pressure (W-high), (d) summer baseline (S-base), (e) summer frontal (S-front), and (f) summer blocking (S-block) (2011–2021). The dark blue wind vectors (at 10 m) overlaid. The star symbol highlights the location of the CGO.
Further distinctions are noted by the column. In the left-hand column (Fig. 1a and d), the MSLP contours are aligned from southwest to northeast near the CGO (highlighted by star in Fig. 1), with wind vectors oriented from the southwest toward the station. This configuration indicates that the CGO predominantly experiences a southwesterly or baseline air mass in these clusters. In contrast, the middle column (Fig. 1b and e) displays MSLP contours and wind vectors oriented from northwest to southeast, suggesting a continental influence on the air mass. The right-hand column (Fig. 1c and f) shows clusters in which the CGO is located near high-pressure centers with weak surface winds. Based on these observations, the clusters are initially categorized into three synoptic groups, namely baseline (characterized by baseline air masses from higher latitudes), frontal (influenced by continental air masses from the northwest), and high pressure (associated with weak surface winds near high-pressure centers).
To further explore the differences between the three main synoptic groups identified earlier (between the columns), we examine the frequency of occurrence of each cluster throughout the year (Fig. 2a). Three clusters, shown in blue, exhibit higher frequencies during the austral winter months (June, July, August, and September), while the other three, shown in red, are more prevalent during the austral summer months (December, January, February, and March). To simplify the interpretation, the clusters are further grouped into two seasonal categories, namely winter clusters (names starting with “W”) and summer clusters (names starting with “S”). Throughout all figures, winter clusters are represented in blue and the top row and summer clusters in red and the bottom row. It should be noted that due to the inherent variability in the synoptic meteorology, some data points from winter may be classified within the summer clusters, and vice versa.
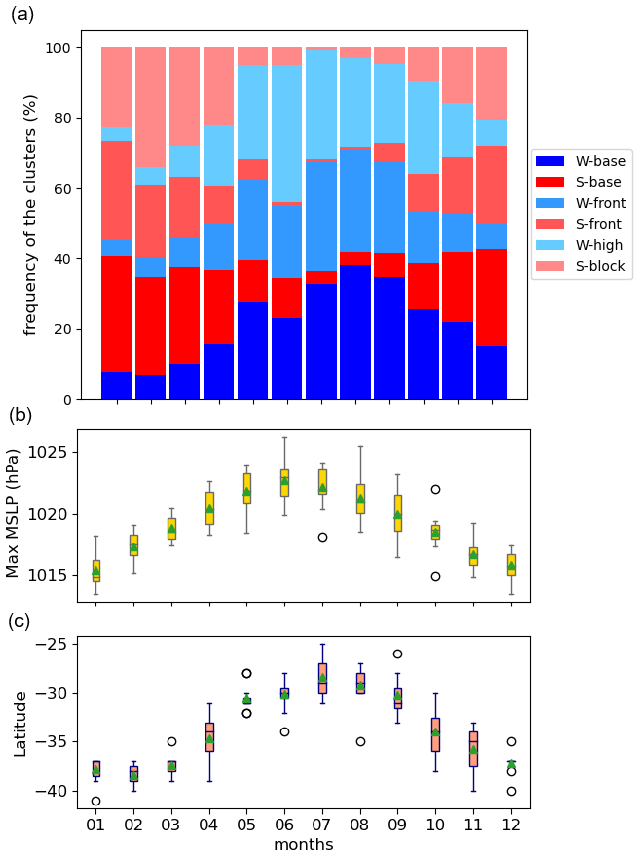
Figure 2Observed seasonality in (a) the frequency of appearance of the six clusters, (b) the maximum MSLP (intensity) itself, and (c) the latitude at which the maximum MSLP occurs (2011–2021). The green triangles in the box-and-whisker plots represent the mean values, whereas the middle line inside the boxes represents the median, and the top and bottom of the boxes indicate the 25th and 75th percentiles. Hollow circles denote outliers.
To better understand the observed seasonality, we analyze the location and intensity of the subtropical ridge (STR) using MSLP data from ERA5, covering the same 11-year period (twice daily). Zonal MSLP values were calculated for each latitude between 10–60° S, spanning longitudes from 110–160° E for each month. Then the maximum MSLP (intensity) and its latitude of occurrence were determined, as shown in Fig. 2b and c, respectively. Figure 2c illustrates the well-documented annual progression of the STR over our 11-year study period, migrating to lower latitudes during the austral winter (JJA) and higher latitudes in the austral summer (DJF). This behavior aligns with the established literature (e.g., Williams and Stone, 2009; Larsen and Nicholls, 2009). Figure 2b shows that as the STR shifts equatorward, its maximum pressure increases, while lower pressures are observed during summer when the STR is located further poleward, which is again consistent with the findings of Larsen and Nicholls (2009). The seasonal cycles of all six clusters are seen to be highly correlated with the migration of the STR, reflecting the role of the synoptic meteorology in determining the air mass being observed at the CGO (Fig. 2).
Next, we examine composite soundings for the six clusters using the ERA5 data sets (Fig. 3). Starting with the left-hand column (Fig. 3a and d), a southwesterly wind is observed at the surface, consistent with the composite MSLP plots (Fig. 1a and d). The wintertime composite (Fig. 3a) has a more southerly heading of the two. As we move from the boundary layer into the free troposphere, the wind direction remains largely unchanged in winter (Fig. 3a) but turns more westerly in the summer cluster (Fig. 3d). The inversion is seen to be deeper in the winter (∼850 hPa) (Table B1). Conversely, the inversion is shallower (∼900 hPa) for the summer composite (Fig. 3d). Again, the 1000 hPa winds align closely with the definition of the CGO baseline conditions (e.g., Ayers et al., 1995; Gras and Keywood, 2017; Humphries et al., 2023), supporting their classification as summertime (S-base) and wintertime (W-base) baseline clusters. We note that the composite W-base sounding is similar to the composite open MCC sounding of Alinejadtabrizi et al. (2024, their Fig. 2b), while the composite S-base sounding is similar to the composite closed MCC sounding (their Fig. 2a). Lang et al. (2022) have previously established that open MCC occurs more frequently during the winter in the region upwind of the CGO.
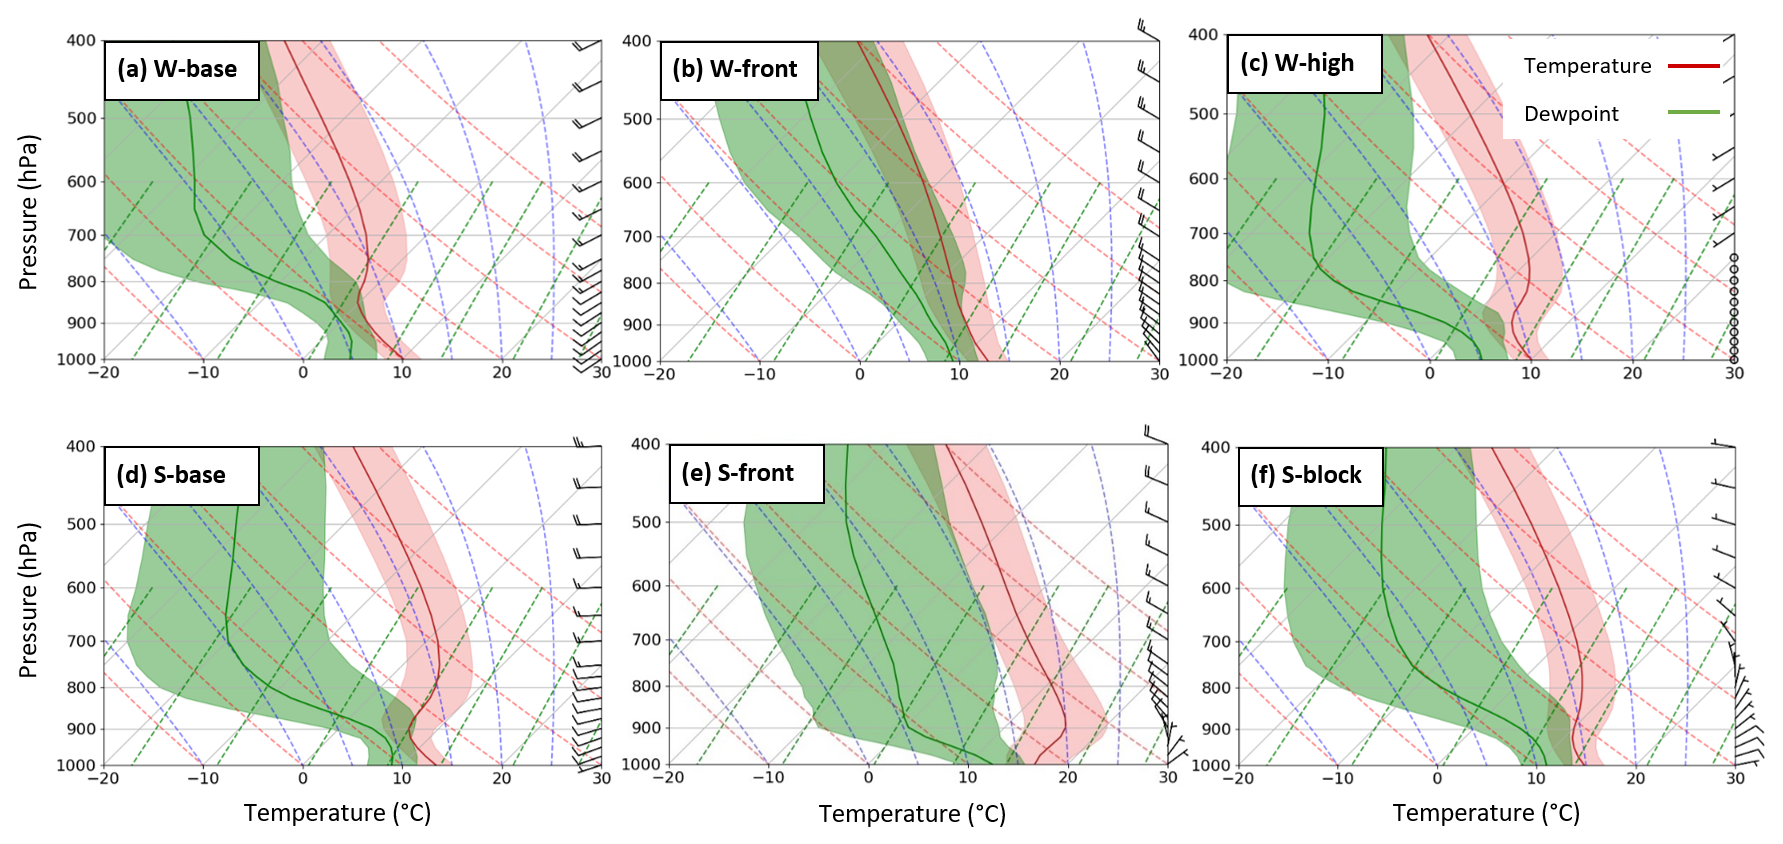
Figure 3Composite soundings for the six clusters (2011–2021), with the shaded region indicating 1 standard deviation. Winter clusters are displayed in the top row (a–c), while the bottom row (d–f) shows the summer clusters.
The EIS also reflects this pattern, with a higher EIS for the S-base (4.3 °K for W-base vs. 6.6 °K for S-base) indicating more stable conditions (Table B1), which is favorable for the closed MCCs (McCoy et al., 2017). This is consistent with the prevalence of closed MCCs during summer, as noted in the literature (e.g., Lang et al., 2022; Alinejadtabrizi et al., 2024).
Moving to the middle column (Fig. 3b and e), a strong northwesterly wind is evident through the free troposphere, consistent with their classification as frontal clusters, namely W-front and S-front, respectively. The S-front cluster shows strong turning through the boundary layer. When turning our attention to the last two clusters in the right-hand column (Fig. 3c and f), it is clear that they show a relatively pronounced inversion. The cluster which is more common during the winter (Fig. 3c) features a relatively deeper inversion at ∼900 hPa, where the EIS is 6.3 K. The other cluster (Fig. 3f) has an inversion at ∼950 hPa with an EIS of 4.7 K (Table B1). The top composite displays zero wind speed, consistent with the MSLP composite (Fig. 1c) and reinforcing the classification of this cluster as a high-pressure system (W-high). The bottom one, on the other hand, illustrates a blocking system commonly observed during the summer season (S-block) (Risbey et al., 2013).
In summary, a simple K-means clustering has led to the identification of six distinct clusters that exhibit specific synoptic and seasonal meteorological characteristics over the CGO. The two baseline clusters are most common, and when combined, they occur ∼40 % of the time. The two frontal clusters occur ∼27 % of the time when combined. Finally, W-high and S-block occur ∼33 % of the time when combined (more details can also be found in Table 1).
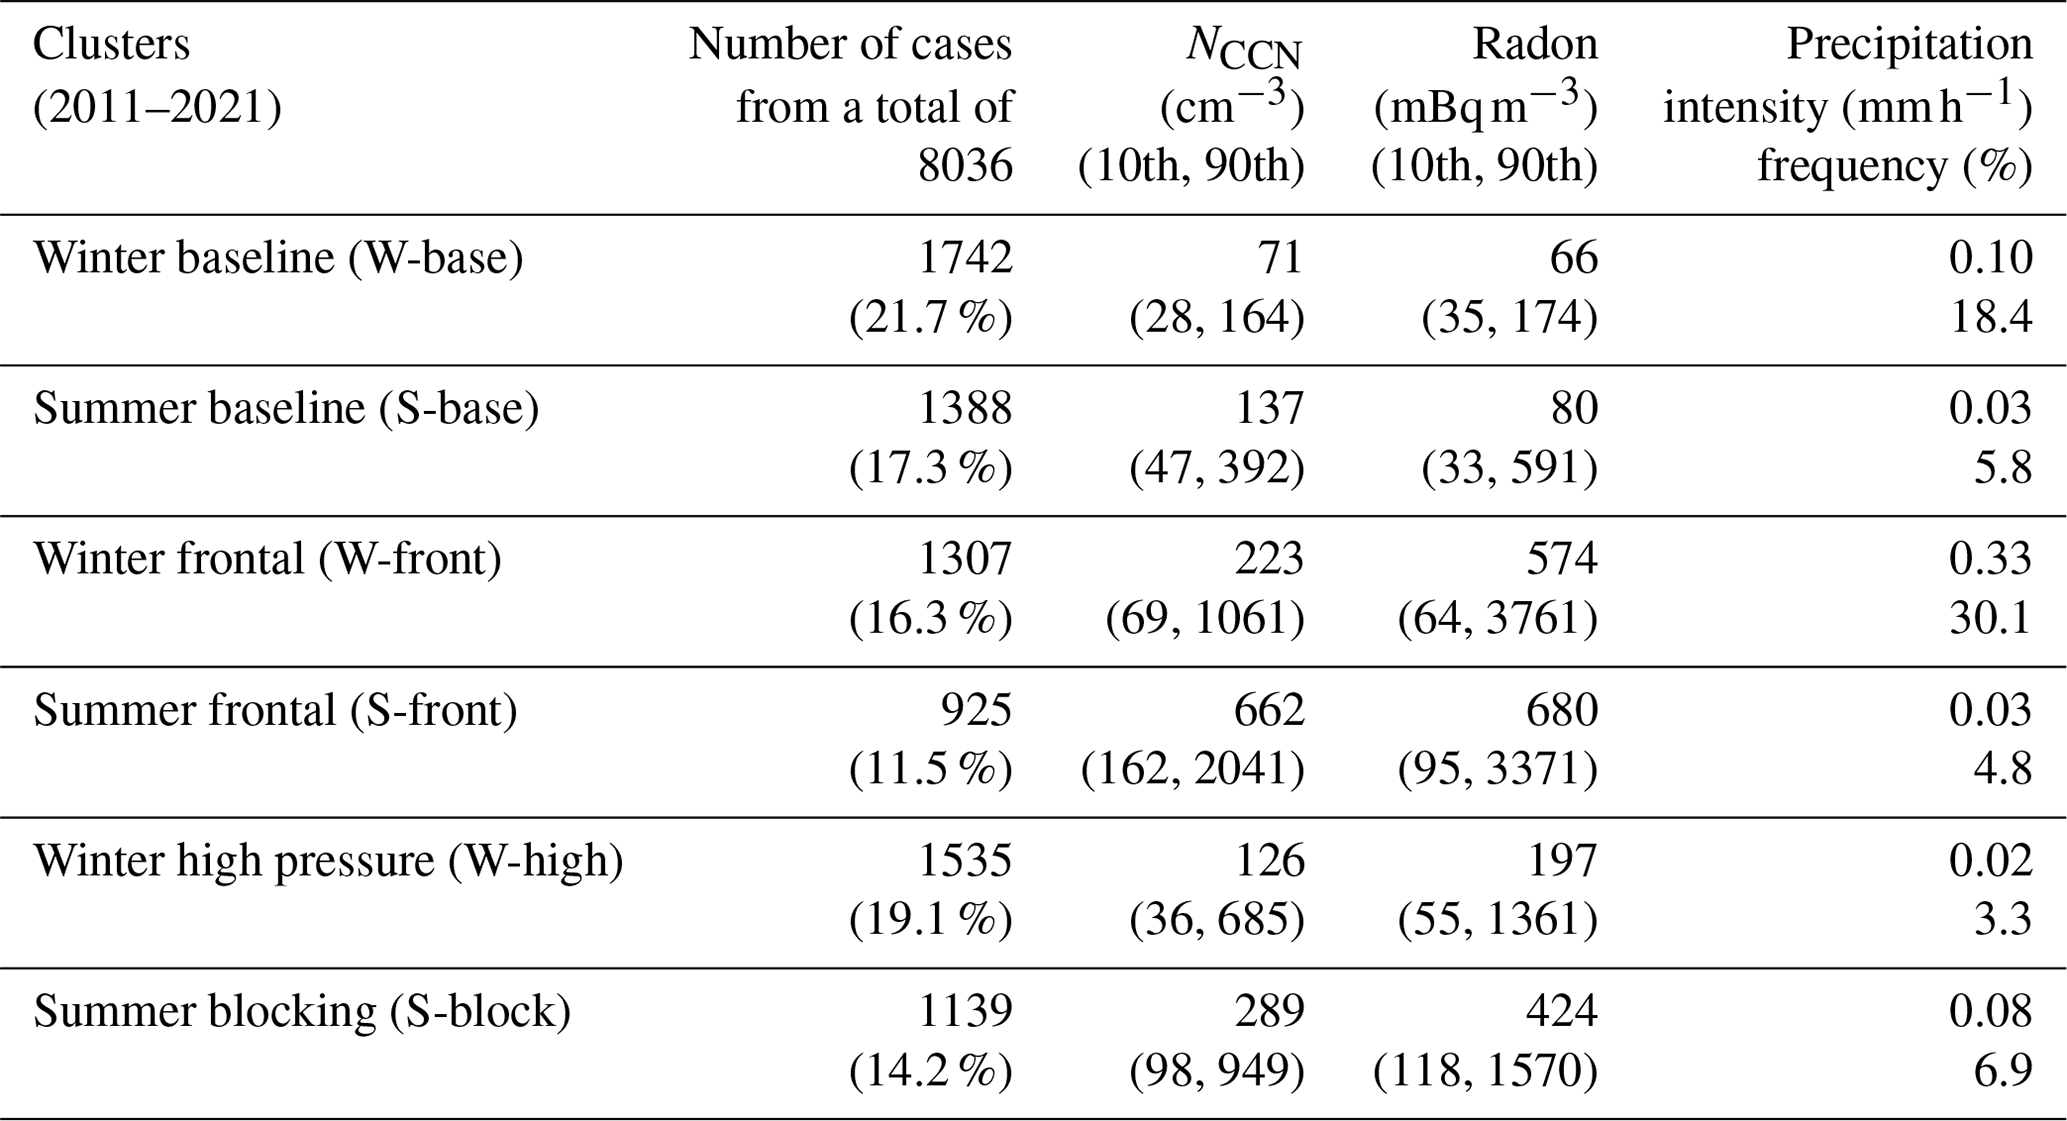
Table 1Median CCN and radon concentration, along with their 10th and 90th percentile values and the mean precipitation intensity and frequency for the six clusters.
The 72 h back-trajectories at the boundary layer elevation (500 m) (Fig. 4) reveal the history of the air mass being observed at the CGO for each of the six clusters, largely confirming the synoptic classification. A period of 72 h has been selected to capture the connectivity between lower latitudes (the continent) and higher latitudes (Antarctica). This time frame also aligns with the typical timescale between cyclones in the Southern Hemisphere (Jimi et al., 2007). The air mass of baseline clusters (Fig. 4a and d) predominantly originates over the SO, suggesting the minimal terrestrial influence. These two clusters also display the greatest displacement compared to the other four clusters (with the W-base having the greatest average length of ∼3743 km), reflecting the influence of strong westerly winds across the SO storm track. Back trajectories for W-base have a more southerly heading at the CGO and are more likely to have originated at higher latitudes, with 22 % of these trajectories crossing the 60° S latitude and even occasionally reaching Antarctica. The S-base back-trajectories have a more westerly heading at the CGO, with only 2 % originating from higher latitudes (crossing 60° S).
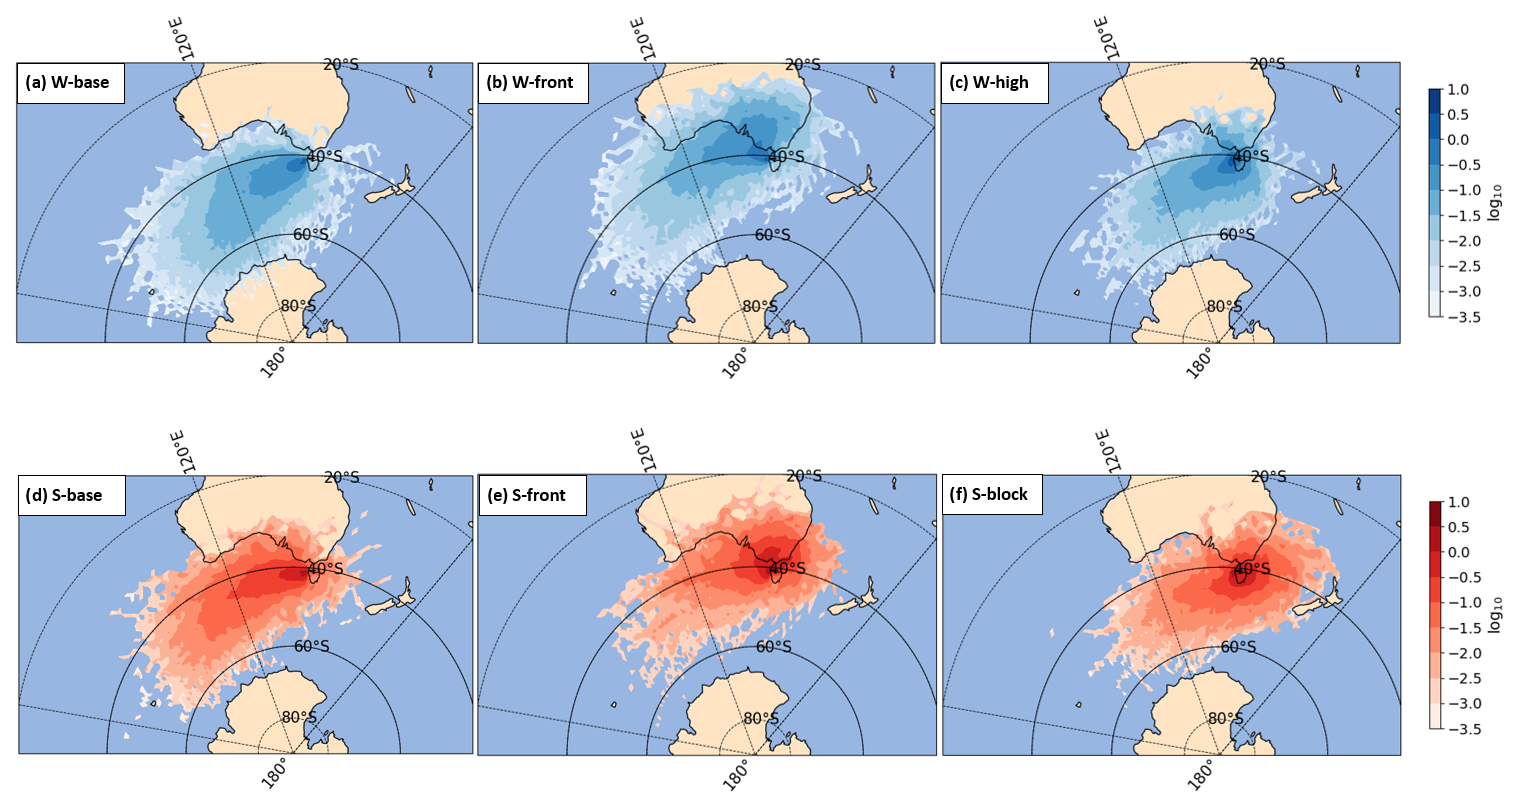
Figure 4Frequency of the distribution of 72 h back-trajectories at the altitude of 500 m (boundary layer) for six clusters (2011–2021).
Back trajectories for both frontal clusters (Fig. 4b and e) suggest a likely terrestrial influence on air masses reaching the CGO. During the winter, when the STR is furthest north, the back-trajectories still commonly originate over the SO but can loop over the continent before reaching the CGO. Finally, the back-trajectories for W-high (Fig. 4c) and S-block (Fig. 4f) reflect the weak wind speeds near the CGO due to smallest spreads during these synoptic conditions.
Having used the ERA5 reanalysis to define the synoptic meteorology at the CGO, we now employ these six synoptic clusters to isolate the influence of the meteorology on the CGO records (Table 1). For each of the six clusters, the median CCN and radon concentrations and mean precipitation intensity and frequency are calculated and discussed in the following sections. We assessed whether these parameters are different between our clusters, testing the null hypothesis that any differences are only due to random variations. Not surprisingly, W-base is characterized as the most pristine air mass (NCCN 71 cm−3; radon 66 mBq m−3), with the least exposure to terrestrial influences. S-base, which does pass over Australia more commonly, has around twice the concentration of CCN (NCCN 137 cm−3) and higher radon (80 mBq m−3). The differences in the median CCN and radon concentration between these two baseline clusters were found to be statistically significant (p<0.05) when using the Whitney U test (this test is suitable for working with the medians). When combined, the baseline clusters yield a large seasonal cycle in CCN consistent with previous results (Ayers et al., 1997; Gras and Keywood, 2017; Humphries et al., 2023).
Conversely, the two frontal clusters are the least pristine, with more than 3 times greater NCCN than the corresponding baseline clusters. W-front (NCCN 223 cm−3; radon 574 mBq m−3) is still more pristine than S-front (NCCN 662 cm−3; radon 680 mBq m−3) for the CCN and radon concentration. This aligns with the well-established understanding that air masses off the continent carry higher aerosol levels from urban and industrial sources, contributing to elevated NCCN (e.g., Ayers et al., 1982). The differences in NCCN between our two frontal clusters were found to be statistically significant (p<0.05) through the Whitney U test, while the difference in radon was not statistically significant (p=0.052). Finally, the two remaining clusters, W-high (NCCN 126 cm−3; radon 197 mBq m−3) and S-block (NCCN 289 cm−3; radon 424 mBq m−3), fall in between the extremes. In this case, the differences are both statistically significant (p<0.05). Overall, the combined summer clusters have a higher NCCN and radon concentration than the combined winter clusters.
4.1 Precipitation
Overall, we find the precipitation rate and frequency for each of the six clusters to be highly consistent with the composite soundings (Fig. 3). The differences in the mean precipitation between the clusters were found to be statistically significant when using the two-tailed Student t test (this test is appropriate for comparing the mean of different groups) (p<0.05). W-front has the greatest precipitation intensity and frequency (0.33 mm h−1 and 30.1 %, respectively) consistent with a weak boundary layer inversion (EIS=1.2 °K), a high relative humidity up through the free troposphere (∼69 %), and also relatively high TCWV (∼19.6 mm) (Table B1). Conversely, W-high, which has the smallest precipitation intensity and frequency (0.02 mm h−1, 3.3 %), has a strong (EIS=6.3 °K) and shallow boundary layer inversion (∼900 hPa), a low relative humidity through the free troposphere (∼34 %), and a relatively low TCWV (∼12.1 mm) (Table B1). S-front, the cluster with the next weakest precipitation intensity and frequency (0.03 mm h−1, 4.8 %), has a relatively strong inversion (EIS=3.9 °K) (Table B1).
A strong seasonal difference in the precipitation is present for the baseline clusters, where W-base precipitates (intensity of 0.10 mm h−1 and frequency of 18.4 %) at 3 times the intensity and frequency of S-base (0.03 mm h−1, 5.8 %). W-base also has a weaker (EIS of 4.3 °K for W-base vs. 6.6 °K for S-base) and higher boundary layer inversion (∼850 hPa for W-base vs. ∼900 hPa for S-base) (Fig. 3a and d) (Table B1). The higher precipitation frequency and intensity during W-base are consistent with our earlier note of the resemblance between the W-base sounding and that of open MCCs in Alinejadtabrizi et al. (2024, their Fig. 2b), which exhibited a higher precipitation frequency and intensity when present upwind of the CGO (Alinejadtabrizi et al., 2024). It is noteworthy that open MCCs are often accompanied by frequent light precipitation or drizzle (Ahn et al., 2017). Overall, higher wintertime precipitation rates are also consistent with the migration of the STR to lower latitudes during the wintertime (Fig. 2c). Manton et al. (2020) reported a negative correlation between the precipitation and MSLP over the SO.
Focusing on the baseline air masses, we further explore the inverse relationship between precipitation and NCCN. The higher precipitation rate and lower NCCN of W-base is consistent with that proposed by Kang et al. (2022), Sanchez et al. (2021), and Alinejadtabrizi et al. (2024), regarding the role of coalescence scavenging and wet deposition in cleansing the atmosphere and reducing NCCN. The apparent negative correlation of precipitation and NCCN is also evident within the two frontal clusters. While W-front and S-front have similar concentrations of radon (574 and 680 mBq m−3, respectively), the S-front NCCN (662 cm−3) is more than 3 times as great as the W-front NCCN (223 cm−3), with the W-front precipitation (intensity of 0.33 mm h−1 and frequency of 30.1 %) being an order of magnitude greater than that of the S-front (intensity of 0.03 mm h−1 and frequency of 4.8 %). In the case of the last two clusters (W-high and S-block), however, we observe higher precipitation in summertime (S-block) coinciding with a higher NCCN level. Comparing the back-trajectory plots for these clusters (Fig. 4c and f), we observe that W-high air masses spend less time over land than those of S-block, presumably acquiring relatively fewer aerosols on average.
Based on the relationships established in the hourly records of the cloud morphology, NCCN and the precipitation rate, and the seasonality of the cloud morphology (mesoscale cellular convection) upwind of the CGO (Lang et al., 2022), Alinejadtabrizi et al. (2024) hypothesized that a seasonal cycle exists in the baseline precipitation rate at the CGO and that wet deposition from this precipitation contributes to the seasonal cycle in NCCN. Combining these two baseline synoptic patterns (W-base and S-base) returns the historic seasonal cycle in NCCN at the CGO (e.g., Gras and Keywood, 2017; Humphries et al., 2023) (Fig. 5a), with a peak concentration observed during summer and a minimum over winter. While this approach obscures the role of the synoptic meteorology, it allows us to examine the seasonal cycle in the baseline precipitation rate at the CGO and its correlation with the seasonal cycle in NCCN. To strengthen the analysis, we further separated NCCN into precipitating and non-precipitating conditions, enabling a clearer view of the impact of precipitation on NCCN. However, due to the intermittent nature of precipitation over the study area, cases classified as non-precipitating may still be influenced by precipitation from preceding or subsequent events. To address this, we introduced a “non-precipitating (5 h)” condition, defined as hours with no rain during the 3 h prior and no rain in the subsequent hour. While this approach provided a limited subset (1786 cases) of all non-precipitation hours (2511 cases), it allowed us to isolate periods with minimal influence by wet deposition. Figure 5a illustrates the seasonal variation in the median NCCN for the combined baseline observations under precipitating (cyan circles), non-precipitating (orange triangles), and non-precipitating (5 h) (purple diamonds) conditions. The mean (circles) and median (stars) precipitation intensity (for precipitating conditions) and frequency (crosses) are shown in the bottom panel (Fig. 5b). A clear negative relationship between precipitation and NCCN is evident.
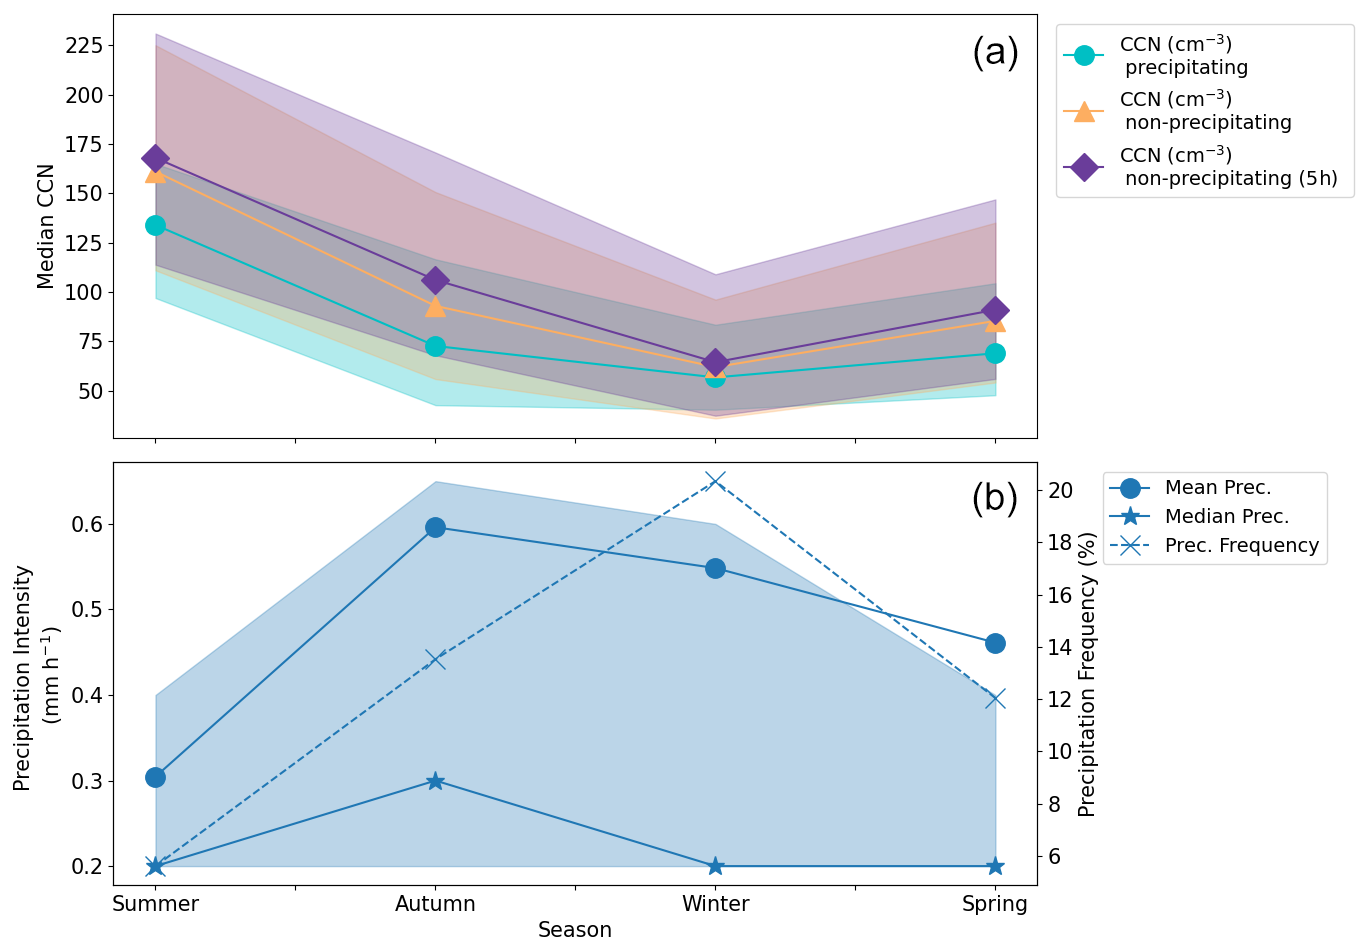
Figure 5Seasonal cycle of the median NCCN (a), along with the mean precipitation intensity and frequency (b), in the two baseline clusters. The shaded area shows the 25th and 75th percentiles. Median CCN concentrations are shown separately for precipitating conditions (circles), non-precipitating conditions (triangles), and conditions with no rain during the 3 preceding hours and no rain in the subsequent hour (diamonds).
This analysis confirms the first part of the hypothesis regarding the seasonal cycle in the baseline precipitation. The frequency of precipitation is 5.6 % in summer (DJF), with a mean intensity of 0.30 mm h−1, and 20.3 % in winter (JJA), with a mean intensity of 0.55 mm h−1. The strong negative relationship between the baseline precipitation and NCCN and lower NCCN for the precipitating condition offers further support to the second part of the hypothesis, suggesting that wet deposition contributes to the seasonal cycle in NCCN. However, while these findings highlight the importance of wet deposition as a potential sink for NCCN, they do not provide conclusive evidence of its relative contribution to the overall NCCN budget. Other factors, including biogenic production and sea salt emissions, are likely to play significant roles. Quantifying the relative importance of wet deposition and coalescence scavenging as sink terms compared to these other processes remains a critical area for future research, emphasizing the complexity of precipitation processes and the need for further investigation.
4.2 Free-troposphere entrainment
While two primary explanations for the observed seasonal cycle of NCCN at the CGO are increased biological production in summer (source-dominant) and greater precipitation during winter (sink-dominant), another potential source term is the entrainment of free-troposphere air. We note that the baseline radon concentration is significantly higher in summer than winter (Table 1). Since radon is a well-established tracer of continental air masses and is largely insensitive to precipitation, this seasonal difference suggests that the summertime baseline air is more likely to have passed over or near continental Australia. Given the significant positive correlation between radon and NCCN (not shown), we hypothesize that this terrestrial influence could also contribute to the seasonal difference in baseline NCCN, either directly through surface emissions or through free-troposphere entrainment (Covert et al., 1996).
Kang et al. (2022) identified the role of free-troposphere entrainment of CCN from biogenic sources in controlling the cloud droplet number concentration during SOCRATES, which was held during the austral summer. In contrast, our focus is on the potential contribution of continental air masses rather than biogenic sources. Previous studies, including the ORACLES (ObseRvations of Aerosols above CLouds and their intEractionS) project, have demonstrated that terrestrial emissions can affect aerosol concentrations through long-range transport and entrainment processes (Redemann et al., 2021). For example, aerosols from terrestrial biomass burning or industrial sources have been shown to modulate NCCN, even in remote marine environments, supporting the plausibility of similar processes in our study area. Within this cluster framework, we can also explore the potential for the entrainment of air from the free troposphere to contribute to the seasonal difference in NCCN.
Figure 6a and b examine the relative differences in the air mass origin between winter and summer baseline conditions at 500 and 2500 m, respectively. The 2500 m level is considered part of the free troposphere to ensure the trajectories remain above shallow boundary layer clouds, as indicated by the composite soundings. In this analysis, the logarithm of the frequency of W-base is subtracted from the logarithm of the frequency of S-base. Mathematically, this is the same as taking the logarithm of the ratios of the frequencies. Positive values (red) indicate that summer parcels were more likely than winter parcels to have passed over a given location. This red region is seen to be located over and nearby continental Australia. Negative values (blue) suggest that wintertime baseline parcels are more likely to have originated over the high latitudes of the SO. This pattern also suggests that the location of the STR plays a role in defining the origin of these air masses.
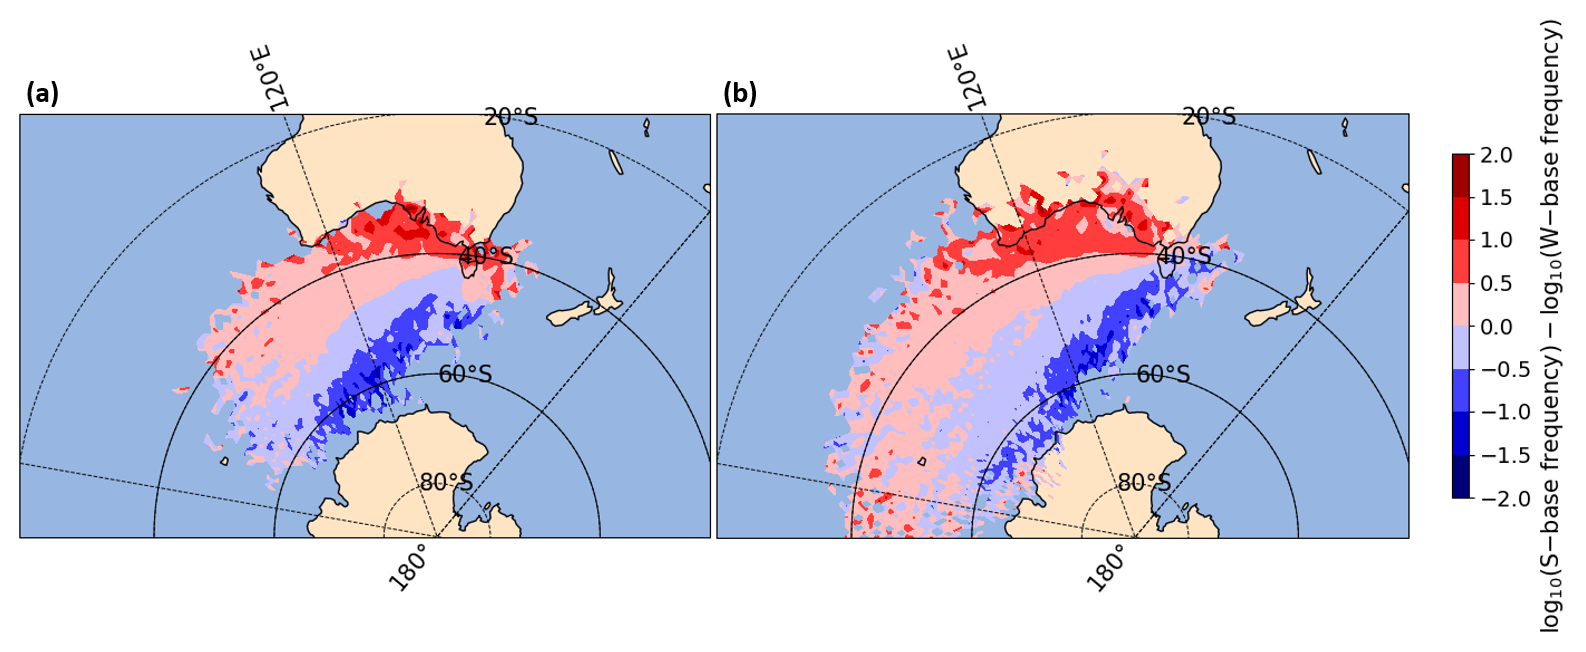
Figure 6Difference in 72 h back-trajectories between the S-base (red) and W-base (blue) clusters at the (a) 500 m (boundary layer) and (b) 2500 m (free troposphere) level.
While Fig. 6b suggests that there is the potential for any free-troposphere entrainment to contribute to the higher surface observations of NCCN, it is inconclusive. For one, the boundary layer air mass is experiencing this same behavior, so we cannot isolate whether any summertime enhancement of NCCN is coming directly from the boundary layer/surface or through the free troposphere. Furthermore, we have no measure of the entrainment and potential cloud processing in connecting the free troposphere air mass to the surface observations. An analysis of the evolution of the altitude of the back-trajectories (Fig. A1) suggests that air parcels are primarily subsiding as they approach the CGO. However, to fully assess the efficiency of entrainment over the CGO, estimation on cloud processing and entrainment are required, but these subgrid-scale processes are not captured by ERA5. Ultimately, our results suggest that it is more likely for the free-troposphere air mass to have been influenced by continental Australia for summertime conditions than wintertime conditions.
In an effort to eliminate the potential of direct surface emissions, baseline air parcels were filtered according to their proximity to Australia. If any point of an air parcel's 72 h back-trajectory passed north of 40° S, i.e., came close to mainland Australia, the air parcel was removed. This filter removed 24 % of all W-base hourly records and 55 % for S-base. After removing these air masses that pass close to Australia, a statistically significant difference remains in NCCN between the “high-latitude” S-base (122 cm−3) and the “high-latitude” W-base clusters (71 cm−3). However, no significant difference is observed in their radon concentration (∼63 mBq m−3). This suggests that air masses originating from high latitudes are not strongly affected by the entrainment of Australian aerosol sources through the free troposphere, regardless of season. The observed difference in NCCN, on the other hand, could be attributed to variations in sources, such as biogenic production and the sinks, e.g., precipitation.
Based on the clusters produced from the ERA5 thermodynamics through the lower free troposphere, we have defined the W-base and S-base clusters. These clusters are independent of the established CGO definition(s) of baseline conditions in the literature. We now explore the consistency between these two different methods of defining baseline (Fig. 7). This analysis helps to demonstrate the robustness of our findings with the CGO baseline definitions. Moreover, it highlights the potential significance of synoptic meteorology in understanding baseline conditions.
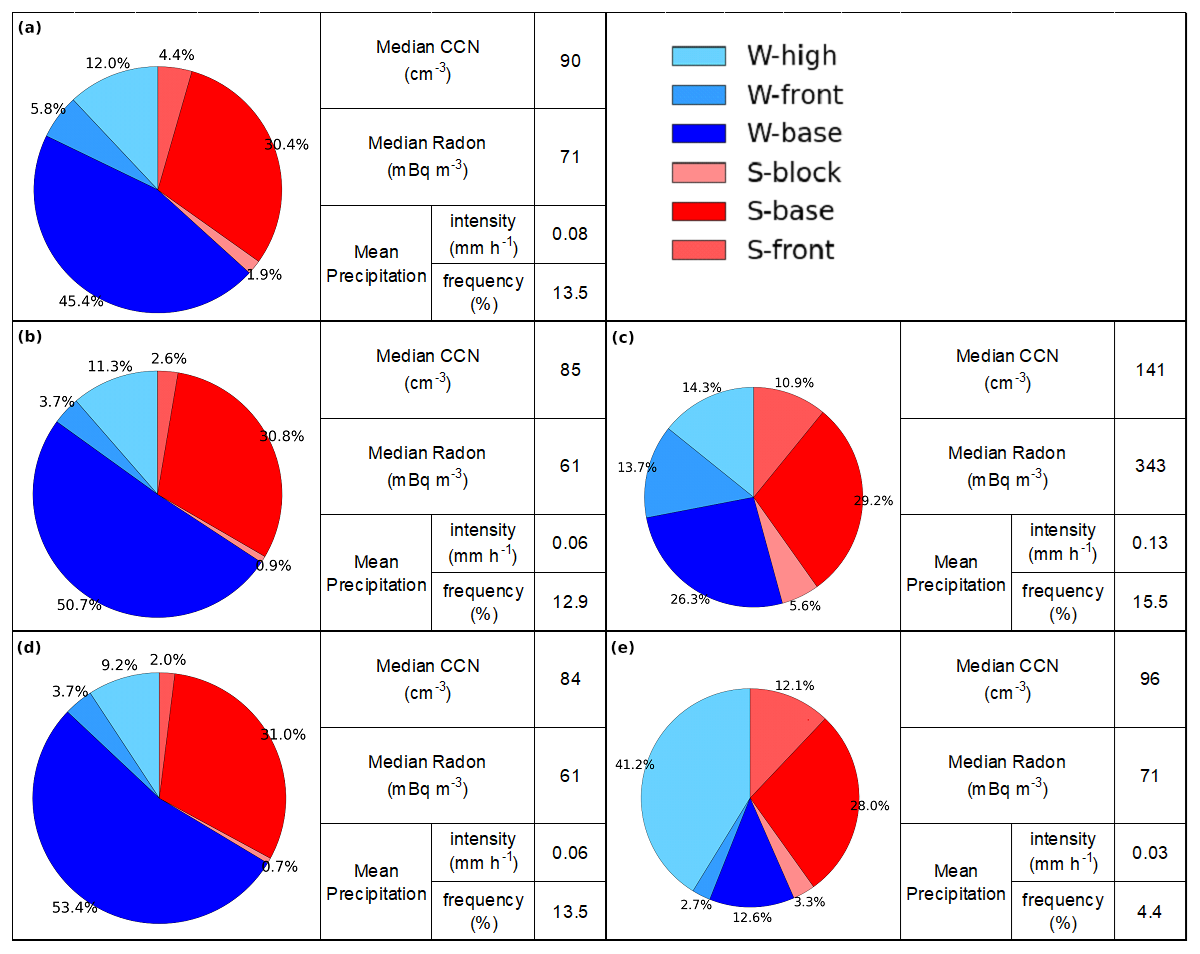
Figure 7Comparison of derived clusters with the CGO baseline criteria using three criteria: (a) wind direction (190–280°), (b) wind direction + radon <150 mBq m−3, (c) cases removed when adding radon criterion to panel (a), (d) wind direction and radon + wind speed >5 m s−1, and (e) cases removed when adding wind speed criterion to panel (b).
The primary criterion for the CGO baseline is that the local surface wind heading must be between 190 and 280°, i.e., a southwesterly to westerly heading. Over our 11-year record (twice per day), we have 3478-hourly records that meet this criterion using ERA5 winds. We acknowledge that there may be discrepancies between the measured local winds and the ERA5 winds. Of these 3478-hourly records, ∼75 % are classified as W-base and S-base. Of the remaining 25 %, roughly half (12 %) come from the W-high cluster. This single criterion for defining the baseline is known to be weak, with the median NCCN at 90 cm−3 and radon at 71 mBq m−3 (Fig. 7a), indicating that continental air masses are being sampled. Looking at this conversely, ∼91 % of the W-base hourly records and ∼76 % of the S-base hourly records meet this primary CGO baseline definition. The clustering of ERA5 records is highly consistent with this CGO criterion.
To reduce the influence of terrestrial air masses, it is common for the CGO baseline criteria to be further constrained through removing air masses with high radon concentrations. This radon threshold has become more and more strict over time, reflecting an increasing appreciation of the potential influence of the free-troposphere entrainment. We have chosen to employ one of the earlier (weaker) radon thresholds of 150 mBq m−3, which still proves to be highly effective, reducing the value of the median NCCN from 90 to 85 cm−3 and radon concentration from 71 to 61 mBq m−3. This additional constraint removes nearly 20 % of the records. We find that nearly 81 % of the remaining 2728-hourly records would now be classified as our baseline clusters (W-base and S-base). The W-high cluster still accounts for over 11 % of these records (Fig. 7b). Most of the records filtered out by this second threshold came from S-base, again highlighting the increased potential for free-troposphere entrainment and direct surface emissions of radon during summer (Fig. 7c). It should be noted that a stricter radon threshold (80 mBq m−3) has been examined, and the results (not shown here) indicate that it does not affect the median NCCN. However, the median radon has decreased from 61 to 51 mBq m−3. Also, the percentages of contribution of each cluster do not change significantly.
A third criterion based on wind speed can be further applied to the CGO baseline definition. Following the literature, we set a minimum wind speed of 5 m s−1 (Jimi et al., 2007), which removes a further 7 % of the record. W-base and S-base comprise nearly 85 % of these remaining records. CCN and the radon concentration do not show changes by this last constraint (Fig. 7d). Not surprisingly, W-high records, which have low surface wind speeds, are primarily removed by this last constraint (Fig. 7e). Nevertheless, over 9 % of this highly constrained CGO baseline record still come from W-high rather than baseline clusters.
It is interesting to directly compare the efficiency of the two different methods of defining baseline conditions. The most constrained CGO definition, using all three thresholds, produces a median value of 84 cm−3 for NCCN and 61 mBq m−3 for radon. This method makes no distinction for winter or summer. Conversely the original W-base cluster produced values of 71 cm−3 and 66 mBq m−3 for NCCN and radon, respectively, while the S-base cluster produced values of 137 cm−3 and 80 mBq m−3 (Table 1). This again suggests that the seasonal changes in the meteorology are having a direct effect on the seasonal cycle of NCCN, as observed at the CGO.
Our study provides new insight into the impact that the synoptic meteorology has on the observed seasonality in NCCN at the CGO. Specifically, we explore how the seasonality of the synoptic meteorology affects precipitation, which acts as a sink through wet deposition, and the free troposphere transport of terrestrial air masses, which acts as a source of NCCN through entrainment.
Utilizing clustering analysis on ERA5 thermodynamic data, we observed a strong seasonal cycle in the synoptic meteorology. Specifically, three synoptic clusters (W-base, W-front, and W-high) were found to be more prevalent during the winter months (JJA), while another three (S-base, S-front, and S-block) were more common in summertime (DJF). The baseline clusters, W-base and S-base, are characterized by southwesterly winds at the surface, with a deeper boundary layer inversion in winter suggesting more frequent precipitation from shallow MABL clouds. The frontal clusters, W-front and S-front, feature strong northwesterly winds through the free troposphere, with W-front exhibiting higher relative humidity. W-high displays near-zero wind speed, on average, and minimal precipitation, while S-block is characterized by low wind speed and anti-cyclonic atmospheric conditions.
Not surprisingly, the W-base cluster is characterized as the most pristine air mass, while S-base, which occasionally passes over Australia, exhibits around twice the concentration of CCN and 20 % higher radon concentration. These findings highlight a large seasonal cycle in NCCN that is consistent with previous research (Ayers et al., 1997; Gras and Keywood, 2017; Humphries et al., 2023). Conversely, the two frontal clusters are identified as the least pristine, with NCCN more than 3 times greater than the corresponding baseline clusters. The two remaining clusters, W-high and S-block, fall between the extremes. Overall, the combined summer clusters (S-base, S-front, and S-block) exhibit higher CCN and radon concentrations than the combined winter clusters (W-base, W-front, and W-high).
Our analysis reveals an inverse relationship between the precipitation and NCCN during the baseline and frontal clusters, highlighting the role of coalescence scavenging and wet deposition in cleansing the atmosphere and reducing NCCN over the SO (Kang et al., 2022; Sanchez et al., 2021; Alinejadtabrizi et al., 2024).
Our analysis of the role of free-troposphere entrainment at the CGO was inconclusive. While the back-trajectory analysis reveals that S-base is more commonly affected by terrestrial (Australia) influences, it was not possible to isolate the free-troposphere entrainment of NCCN from direct surface emissions. Either way, however, the S-base air mass is more frequently affected by terrestrial sources than the W-base air masses, again revealing that other sources are contributing to the seasonal cycle in NCCN as observed at the CGO, other than biogenic production.
On average, the characteristics of our two baseline clusters are consistent with those of the traditional CGO baseline air mass. Our analysis finds that the wintertime baseline precipitation is approximately 3 times greater than that during the summer, helping make the wintertime baseline air mass more “pristine” through wet deposition. An examination of the transport of the overlying free-troposphere air also finds a distinct seasonal cycle, with terrestrial air masses more commonly passing over Kennaook / Cape Grim during the summer season, when the subtropical ridge is furthest poleward. The entrainment of this terrestrial free-troposphere air into the boundary layer will also contribute to seasonal cycle in NCCN.
Our analysis of back-trajectories reveals that overall, during the winter, when the STR resides further north towards the Equator, the CGO exhibits heightened connectivity to the higher latitudes and Antarctica. Conversely, during summer when the STR shifts poleward, this connectivity is weakened. In effect, the STR acts as a barrier. This seasonal modulation underscores the significant influence of large-scale meteorological patterns on air mass observed at the CGO.
With respect to our understanding of the CGO baseline air mass, two salient points arise. First, the current criteria for defining the CGO baseline air mass include a non-negligible percentage from the W-high synoptic class. Second, and more importantly, there are significant seasonal differences in the boundary layer structure, precipitation, and air mass origin (boundary layer and free troposphere). Echoing the conclusions of Quinn and Bates (2011), a full understanding of the NCCN budget over the SO is far more complex than simply an understanding of the biogenic production. In particular, it is essential to understand the role of precipitation from shallow convection across the SO (Siems et al., 2022; Alinejadtabrizi et al., 2024).
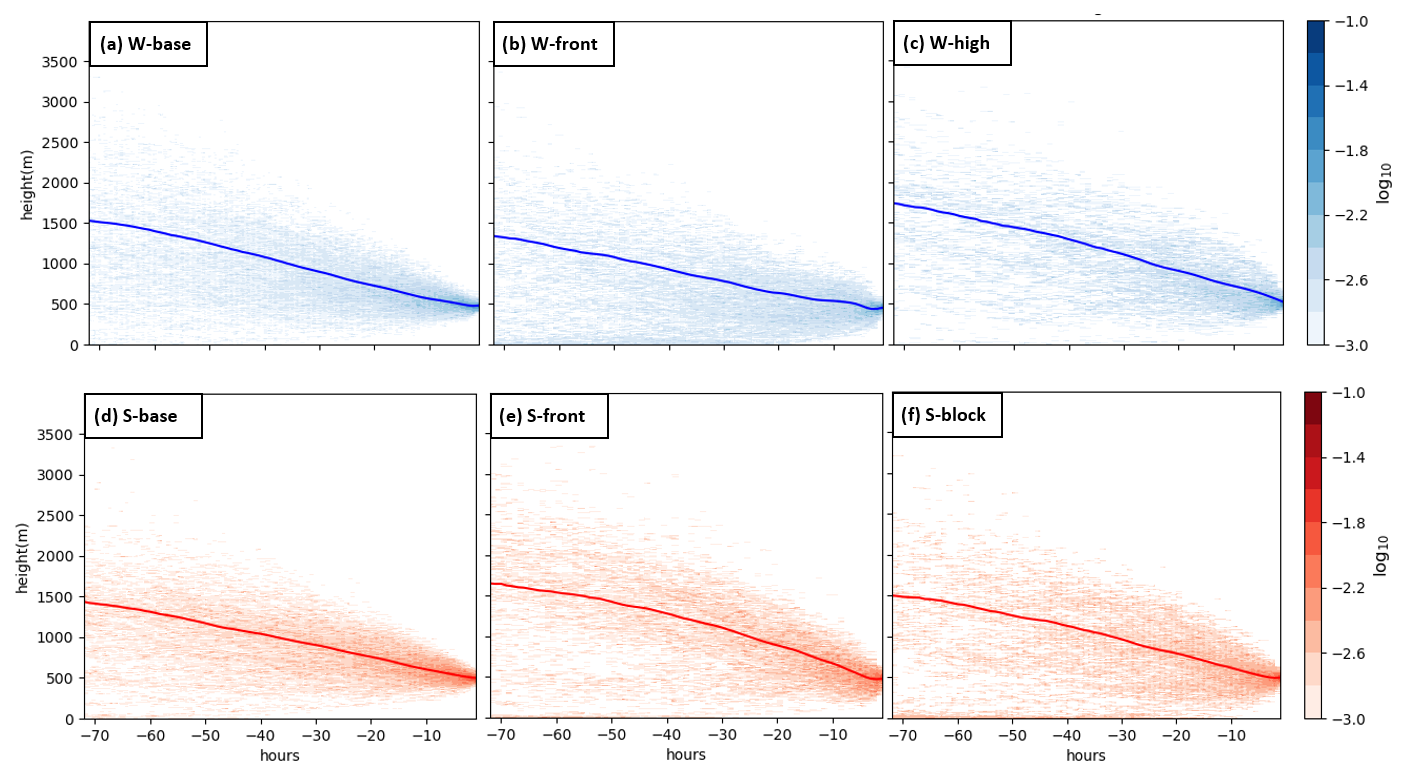
Figure A1Frequency of the height distribution of 72 h back-trajectories at 500 m (boundary layer) level, with the average as a solid line, for six clusters (2011–2021).
Table B1Mean inversion height (hPa), TCWV (mm), and EIS (K) for each cluster.
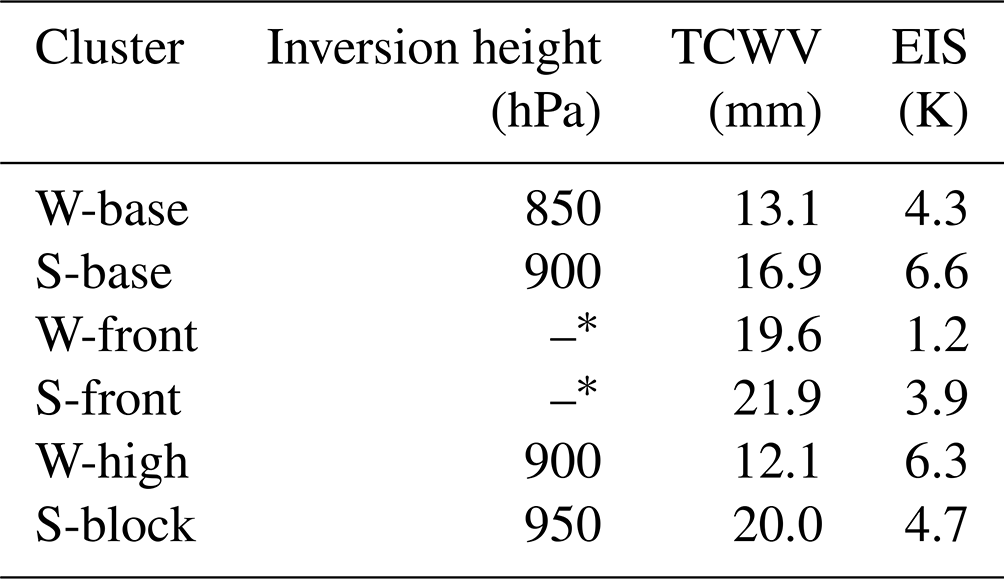
∗ There is no clear inversion for the frontal systems.
The NCCN measurements, analyzed during the current study, are available in the World Data Centre for Aerosols (https://www.gaw-wdca.org/browse-obtain-data/, WMO, 2024). The ECMWF-ERA5 reanalysis data sets are available through the Copernicus Climate Change Service Climate Data Store (https://cds.climate.copernicus.eu/datasets?q=era5+hourly&limit=30, ECMWF, 2024). The precipitation data can be obtained by contacting (climatedata@bom.gov.au). The radon data are available from the World Data Centre for Greenhouse Gases (2024) (https://gaw.kishou.go.jp/search/station#5011) and from Alastair Williams at the Australian Nuclear Science and Technology Organisation (ANSTO).
TA performed the data analysis and prepared the original draft of the paper. All co-authors provided editorial feedback on the paper. All co-authors read and approved the final paper.
At least one of the (co-)authors is a member of the editorial board of Atmospheric Chemistry and Physics. The peer-review process was guided by an independent editor, and the authors also have no other competing interests to declare.
Publisher's note: Copernicus Publications remains neutral with regard to jurisdictional claims made in the text, published maps, institutional affiliations, or any other geographical representation in this paper. While Copernicus Publications makes every effort to include appropriate place names, the final responsibility lies with the authors.
This research has been supported by Securing Antarctica's Environmental Future (SAEF), a Special Research Initiative of the Australian Research Council (SRI20010005); by the Australian Research Council (ARC) Centre of Excellence for Climate Extremes (CE170100023); and by the ARC Discovery Projects (DP190101362). Continued support for the Kennaook / Cape Grim Program from the Australian Bureau of Meteorology and Commonwealth Scientific and Industrial Research Organisation (CSIRO) is also gratefully acknowledged.
This research has been supported by the Australian Research Council (ARC; grant nos. SRI20010005, CE170100023, and DP190101362).
This paper was edited by Greg McFarquhar and reviewed by two anonymous referees.
Ahn, E., Huang, Y., Chubb, T. H., Baumgardner, D., Isaac, P., de Hoog, M., Siems, S. T., and Manton, M. J.: In situ observations of wintertime low-altitude clouds over the Southern Ocean, Q. J. Roy. Meteor. Soc., 143, 1381–1394, 2017. a
Alinejadtabrizi, T., Lang, F., Huang, Y., Ackermann, L., Keywood, M., Ayers, G., Krummel, P., Humphries, R., Williams, A., and Siems, S.: Wet deposition in shallow convection over the Southern Ocean, npj Climate and Atmospheric Science, 7, 76, https://doi.org/10.1038/s41612-024-00625-1, 2024. a, b, c, d, e, f, g, h, i, j, k, l
Anderberg, M. R.: Cluster analysis for applications, Monographs and textbooks on probability and mathematical statistics, New York, Academic Press, 1973. a
Ayers, G. and Gillett, R.: DMS and its oxidation products in the remote marine atmosphere: implications for climate and atmospheric chemistry, J. Sea Res., 43, 275–286, 2000. a, b
Ayers, G., Bigg, E., Turvey, D., and Manton, M.: Urban influence on condensation nuclei over a continent, Atmos. Environ. (1967), 16, 951–954, 1982. a
Ayers, G., Bentley, S., Ivey, J., and Forgan, B.: Dimethylsulfide in marine air at Cape Grim, 41 S, J. Geophys. Res.-Atmos., 100, 21013–21021, 1995. a, b
Ayers, G. P. and Cainey, J. M.: The CLAW hypothesis: a review of the major developments, Environ. Chem., 4, 366–374, 2007. a
Ayers, G. P., Cainey, J. M., Gillett, R., and Ivey, J. P.: Atmospheric sulphur and cloud condensation nuclei in marine air in the Southern Hemisphere, Philos. T. Roy. Soc. B, 352, 203–211, 1997. a, b, c, d
Bates, T. S., Huebert, B. J., Gras, J. L., Griffiths, F. B., and Durkee, P. A.: International Global Atmospheric Chemistry (IGAC) project's first aerosol characterization experiment (ACE 1): Overview, J. Geophys. Res.-Atmos., 103, 16297–16318, 1998. a
Bigg, E., Gras, J., and Evans, C.: Origin of Aitken particles in remote regions of the Southern Hemisphere, J. Atmos. Chem., 1, 203–214, 1984. a
Bodas-Salcedo, A., Williams, K. D., Ringer, M. A., Beau, I., Cole, J. N., Dufresne, J.-L., Koshiro, T., Stevens, B., Wang, Z., and Yokohata, T.: Origins of the solar radiation biases over the Southern Ocean in CFMIP2 models, J. Climate, 27, 41–56, 2014. a
Boers, R., Jensen, J., and Krummel, P.: Microphysical and short-wave radiative structure of stratocumulus clouds over the Southern Ocean: Summer results and seasonal differences, Q. J. Roy. Meteor. Soc., 124, 151–168, 1998. a
Cai, W., Van Rensch, P., and Cowan, T.: Influence of global-scale variability on the subtropical ridge over southeast Australia, J. Climate, 24, 6035–6053, 2011. a
Capaldo, K. P., Kasibhatla, P., and Pandis, S. N.: Is aerosol production within the remote marine boundary layer sufficient to maintain observed concentrations?, J. Geophys. Res.-Atmos., 104, 3483–3500, 1999. a
Chambers, S. D., Williams, A. G., Crawford, J., and Griffiths, A. D.: On the use of radon for quantifying the effects of atmospheric stability on urban emissions, Atmos. Chem. Phys., 15, 1175–1190, https://doi.org/10.5194/acp-15-1175-2015, 2015. a
Chambers, S. D., Preunkert, S., Weller, R., Hong, S.-B., Humphries, R. S., Tositti, L., Angot, H., Legrand, M., Williams, A. G., Griffiths, A. D., Crawford, J., Simmons, J., Choi, T. J., Krummel, P. B., Molloy, S., Loh, Z., Galbally, I., Wilson, S., Magand, O., Sprovieri, F., Pirrone, N., and Dommergue, A.: Characterizing Atmospheric Transport Pathways to Antarctica and the Remote Southern Ocean Using Radon-222, Front. Earth Sci., 6, https://doi.org/10.3389/feart.2018.00190, 2018. a
Charlson, R. J., Lovelock, J. E., Andreae, M. O., and Warren, S. G.: Oceanic phytoplankton, atmospheric sulphur, cloud albedo and climate, Nature, 326, 655–661, 1987. a
Clarke, A., Varner, J., Eisele, F., Mauldin, R., Tanner, D., and Litchy, M.: Particle production in the remote marine atmosphere: Cloud outflow and subsidence during ACE 1, J. Geophys. Res.-Atmos., 103, 16397–16409, 1998. a
Covert, D. S., Kapustin, V. N., Bates, T. S., and Quinn, P. K.: Physical properties of marine boundary layer aerosol particles of the mid-Pacific in relation to sources and meteorological transport, J. Geophys. Res.-Atmos., 101, 6919–6930, https://doi.org/10.1029/95JD03068, 1996. a
Danker, J., Sourdeval, O., McCoy, I. L., Wood, R., and Possner, A.: Exploring relations between cloud morphology, cloud phase, and cloud radiative properties in Southern Ocean's stratocumulus clouds, Atmos. Chem. Phys., 22, 10247–10265, https://doi.org/10.5194/acp-22-10247-2022, 2022. a
Dima, I. M. and Wallace, J. M.: On the seasonality of the Hadley cell, J. Atmos. Sci., 60, 1522–1527, 2003. a
Draxler, R. R. and Hess, G. D.: An overview of the HYSPLIT_4 modeling system for trajectories, dispersion, and deposition, Aust. Meteorol. Mag., 47, 295–308, 1998. a
ECMWF – European Centre for Medium-Range Weather Forecasts: ERA5 reanalysis data, ECMWF [data set], https://cds.climate.copernicus.eu/datasets?q=era5+hourly&limit=30, last access: August 2024. a
Feingold, G., Kreidenweis, S. M., Stevens, B., and Cotton, W.: Numerical simulations of stratocumulus processing of cloud condensation nuclei through collision-coalescence, J. Geophys. Res.-Atmos., 101, 21391–21402, 1996. a
Fletcher, J. K., Mason, S., and Jakob, C.: A Climatology of Clouds in Marine Cold Air Outbreaks in Both Hemispheres, J. Climate, 29, 6677–6692, https://doi.org/10.1175/JCLI-D-15-0783.1, 2016. a
Forbes, R. M. and Ahlgrimm, M.: On the Representation of High-Latitude Boundary Layer Mixed-Phase Cloud in the ECMWF Global Model, Mon. Weather Rev., 142, 3425–3445, https://doi.org/10.1175/MWR-D-13-00325.1, 2014. a
Fossum, K. N., Ovadnevaite, J., Ceburnis, D., Dall'Osto, M., Marullo, S., Bellacicco, M., Simó, R., Liu, D., Flynn, M., Zuend, A., and O'Dowd, C.: Summertime Primary and Secondary Contributions to Southern Ocean Cloud Condensation Nuclei, Sci. Rep.-UK, 8, 13844, https://doi.org/10.1038/s41598-018-32047-4, 2018. a
Gordon, N. D. and Norris, J. R.: Cluster analysis of midlatitude oceanic cloud regimes: mean properties and temperature sensitivity, Atmos. Chem. Phys., 10, 6435–6459, https://doi.org/10.5194/acp-10-6435-2010, 2010. a
Gras, J.: CN, CCN and particle size in Southern Ocean air at Cape Grim, Atmos. Res., 35, 233–251, 1995. a
Gras, J. L.: Cloud condensation nuclei over the Southern Ocean, Geophys. Res. Lett., 17, 1565–1567, 1990. a
Gras, J. L. and Keywood, M.: Cloud condensation nuclei over the Southern Ocean: wind dependence and seasonal cycles, Atmos. Chem. Phys., 17, 4419–4432, https://doi.org/10.5194/acp-17-4419-2017, 2017. a, b, c, d, e, f, g, h, i, j, k
Gras, J. L., Jimi, S. I., Siems, S. T., and Krummel, P. B.: Postfrontal nanoparticles at Cape Grim: observations, Environ. Chem., 6, 508–514, https://doi.org/10.1071/EN09075, 2009. a
Grose, M., Timbal, B., Wilson, L., Bathols, J., and Kent, D.: The subtropical ridge in CMIP5 models, and implications for projections of rainfall in southeast Australia, Aust. Meteorol. Ocean., 65, 90–106, 2015. a
Hande, L. B., Siems, S. T., and Manton, M. J.: Observed Trends in Wind Speed over the Southern Ocean, Geophys. Res. Lett., 39, L11802, https://doi.org/10.1029/2012GL051734, 2012. a
Haynes, J. M., Jakob, C., Rossow, W. B., Tselioudis, G., and Brown, J.: Major Characteristics of Southern Ocean Cloud Regimes and Their Effects on the Energy Budget, J. Climate, 24, 5061–5080, https://doi.org/10.1175/2011JCLI4052.1, 2011. a
Hersbach, H., Bell, B., Berrisford, P., Hirahara, S., Horányi, A., Muñoz-Sabater, J., Nicolas, J., Peubey, C., Radu, R., Schepers, D., Simmons, A., Soci, C., Abdalla, S., Abellan, X., Balsamo, G., Bechtold, P., Biavati, G., Bidlot, J., Bonavita, M., De Chiara, G., Dahlgren, P., Dee, D., Diamantakis, M., Dragani, R., Flemming, J., Forbes, R., Fuentes, M., Geer, A., Haimberger, L., Healy, S., Hogan, R. J., Hólm, E., Janisková, M., Keeley, S., Laloyaux, P., Lopez, P., Lupu, C., Radnoti, G., de Rosnay, P., Rozum, I., Vamborg, F., Villaume, S., and Thépaut, J.-N.: The ERA5 global reanalysis, Q. J. Roy. Meteor. Soc., 146, 1999–2049, https://doi.org/10.1002/qj.3803, 2020. a
Huang, Y., Protat, A., Siems, S. T., and Manton, M. J.: A-Train observations of maritime midlatitude storm-track cloud systems: Comparing the Southern Ocean against the North Atlantic, J. Climate, 28, 1920–1939, 2015. a
Hudson, J. G., Noble, S., and Jha, V.: On the relative role of sea salt cloud condensation nuclei (CCN), J. Atmos. Chem., 68, 71–88, 2011. a
Humphries, R. S., Keywood, M. D., Gribben, S., McRobert, I. M., Ward, J. P., Selleck, P., Taylor, S., Harnwell, J., Flynn, C., Kulkarni, G. R., Mace, G. G., Protat, A., Alexander, S. P., and McFarquhar, G.: Southern Ocean latitudinal gradients of cloud condensation nuclei, Atmos. Chem. Phys., 21, 12757–12782, https://doi.org/10.5194/acp-21-12757-2021, 2021. a
Humphries, R. S., Keywood, M. D., Ward, J. P., Harnwell, J., Alexander, S. P., Klekociuk, A. R., Hara, K., McRobert, I. M., Protat, A., Alroe, J., Cravigan, L. T., Miljevic, B., Ristovski, Z. D., Schofield, R., Wilson, S. R., Flynn, C. J., Kulkarni, G. R., Mace, G. G., McFarquhar, G. M., Chambers, S. D., Williams, A. G., and Griffiths, A. D.: Measurement report: Understanding the seasonal cycle of Southern Ocean aerosols, Atmos. Chem. Phys., 23, 3749–3777, https://doi.org/10.5194/acp-23-3749-2023, 2023. a, b, c, d, e, f, g, h
Jimi, S. I., Gras, J., Siems, S. T., and Krummel, P. B.: A short climatology of nanoparticles at the Cape Grim Baseline Air Pollution Station, Tasmania, Environ. Chem., 4, 301–309, https://doi.org/10.1071/EN07038, 2007. a, b, c
Kang, L., Marchand, R., Wood, R., and McCoy, I. L.: Coalescence scavenging drives droplet number concentration in southern ocean low clouds, Geophys. Res. Lett., 49, e2022GL097819, https://doi.org/10.1029/2022GL097819, 2022. a, b, c, d, e
Katoshevski, D., Nenes, A., and Seinfeld, J. H.: A study of processes that govern the maintenance of aerosols in the marine boundary layer, J. Aerosol Sci., 30, 503–532, 1999. a
Kay, J. E., Wall, C., Yettella, V., Medeiros, B., Hannay, C., Caldwell, P., and Bitz, C.: Global Climate Impacts of Fixing the Southern Ocean Shortwave Radiation Bias in the Community Earth System Model (CESM), J. Climate, 29, 4617–4636, https://doi.org/10.1175/JCLI-D-15-0358.1, 2016. a
Klein, S. A. and Hartmann, D. L.: The seasonal cycle of low stratiform clouds, J. Climate, 6, 1587–1606, 1993. a
Korhonen, H., Carslaw, K. S., Spracklen, D. V., Mann, G. W., and Woodhouse, M. T.: Influence of oceanic dimethyl sulfide emissions on cloud condensation nuclei concentrations and seasonality over the remote Southern Hemisphere oceans: A global model study, J. Geophys. Res.-Atmos., 113, D15204, https://doi.org/10.1029/2007JD009718, 2008. a, b
Lang, F., Huang, Y., Siems, S. T., and Manton, M. J.: Characteristics of the Marine Atmospheric Boundary Layer Over the Southern Ocean in Response to the Synoptic Forcing, J. Geophys. Res.-Atmos., 123, 7799–7820, https://doi.org/10.1029/2018JD028700, 2018. a, b, c
Lang, F., Ackermann, L., Huang, Y., Truong, S. C. H., Siems, S. T., and Manton, M. J.: A climatology of open and closed mesoscale cellular convection over the Southern Ocean derived from Himawari-8 observations, Atmos. Chem. Phys., 22, 2135–2152, https://doi.org/10.5194/acp-22-2135-2022, 2022. a, b, c, d, e
Lang, F., Siems, S. T., Huang, Y., Alinejadtabrizi, T., and Ackermann, L.: On the relationship between mesoscale cellular convection and meteorological forcing: comparing the Southern Ocean against the North Pacific, Atmos. Chem. Phys., 24, 1451–1466, https://doi.org/10.5194/acp-24-1451-2024, 2024. a, b
Larsen, S. H. and Nicholls, N.: Southern Australian rainfall and the subtropical ridge: Variations, interrelationships, and trends, Geophys. Res. Lett., 36, L08708, https://doi.org/10.1029/2009GL037786, 2009. a, b, c, d
Mace, G. G. and Avey, S.: Seasonal variability of warm boundary layer cloud and precipitation properties in the Southern Ocean as diagnosed from A-Train data, J. Geophys. Res.-Atmos., 122, 1015–1032, https://doi.org/10.1002/2016JD025348, 2017. a
Manton, M. J., Huang, Y., and Siems, S. T.: Variations in Precipitation across the Southern Ocean, J. Climate, 33, 10653–10670, https://doi.org/10.1175/JCLI-D-20-0120.1, 2020. a
Mason, S., Jakob, C., Protat, A., and Delanoë, J.: Characterizing observed midtopped cloud regimes associated with Southern Ocean shortwave radiation biases, J. Climate, 27, 6189–6203, 2014. a
McCoy, D. T., Hartmann, D. L., and Grosvenor, D. P.: Observed Southern Ocean Cloud Properties and Shortwave Reflection. Part I: Calculation of SW Flux from Observed Cloud Properties, J. Climate, 27, 8836–8857, https://doi.org/10.1175/JCLI-D-14-00287.1, 2014. a
McCoy, D. T., Burrows, S. M., Wood, R., Grosvenor, D. P., Elliott, S. M., Ma, P.-L., Rasch, P. J., and Hartmann, D. L.: Natural aerosols explain seasonal and spatial patterns of Southern Ocean cloud albedo, Science Advances, 1, e1500157, https://doi.org/10.1126/sciadv.1500157, 2015. a
McCoy, I. L., Wood, R., and Fletcher, J. K.: Identifying meteorological controls on open and closed mesoscale cellular convection associated with marine cold air outbreaks, J. Geophys. Res.-Atmos., 122, 11678–11702, 2017. a
McFarquhar, G. M., Bretherton, C. S., Marchand, R., Protat, A., DeMott, P. J., Alexander, S. P., Roberts, G. C., Twohy, C. H., Toohey, D., and Siems, S.: Observations of clouds, aerosols, precipitation, and surface radiation over the Southern Ocean: An overview of CAPRICORN, MARCUS, MICRE, and SOCRATES, B. Am. Meteorol. Soc., 102, E894–E928, 2021. a
Mechem, D. B., Robinson, P. C., and Kogan, Y. L.: Processing of cloud condensation nuclei by collision-coalescence in a mesoscale model, J. Geophys. Res.-Atmos., 111, D18204, https://doi.org/10.1029/2006JD007183, 2006. a
Montoya Duque, E., Huang, Y., Siems, S. T., May, P. T., Protat, A., and McFarquhar, G. M.: A Characterization of Clouds and Precipitation Over the Southern Ocean From Synoptic to Micro Scales During the CAPRICORN Field Campaigns, J. Geophys. Res.-Atmos., 127, e2022JD036796, https://doi.org/10.1029/2022JD036796, 2022. a
Montoya Duque, E., Huang, Y., May, P. T., and Siems, S. T.: An Evaluation of IMERG and ERA5 Quantitative Precipitation Estimates over the Southern Ocean Using Shipborne Observations, J. Appl. Meteorol. Clim., 62, 1479–1495, https://doi.org/10.1175/JAMC-D-23-0039.1, 2023. a
Niu, Q., McFarquhar, G. M., Marchand, R., Theisen, A., Cavallo, S. M., Flynn, C., DeMott, P. J., McCluskey, C. S., Humphries, R. S., and Hill, T. C. J.: 62° S Witnesses the Transition of Boundary Layer Marine Aerosol Pattern Over the Southern Ocean (50° S–68° S, 63° E–150° E) During the Spring and Summer: Results From MARCUS (I), J. Geophys. Res.-Atmos., 129, e2023JD040396, https://doi.org/10.1029/2023JD040396, 2024. a
Painemal, D., Chellappan, S., Smith Jr., W. L., Spangenberg, D., Park, J. M., Ackerman, A., Chen, J., Crosbie, E., Ferrare, R., Hair, J., Kirschler, S., Li, X.-Y., McComiskey, A., Moore, R. H., Sanchez, K., Sorooshian, A., Tornow, F., Voigt, C., Wang, H., Winstead, E., Zeng, X., Ziemba, L., and Zuidema, P.: Wintertime Synoptic Patterns of Midlatitude Boundary Layer Clouds Over the Western North Atlantic: Climatology and Insights From In Situ ACTIVATE Observations, J. Geophys. Res.-Atmos., 128, e2022JD037725, https://doi.org/10.1029/2022JD037725, 2023. a
Pepler, A., Ashcroft, L., and Trewin, B.: The relationship between the subtropical ridge and Australian temperatures, Journal of Southern Hemisphere Earth Systems Science, 68, 201–214, https://doi.org/10.1071/ES18011, 2018. a
Pittock, A.: Global meridional interactions in stratosphere and troposphere, Q. J. Roy. Meteor. Soc., 99, 424–437, 1973. a
Quinn, P. K. and Bates, T. S.: The case against climate regulation via oceanic phytoplankton sulphur emissions, Nature, 480, 51–56, 2011. a, b
Quinn, P. K., Bates, T. S., Schulz, K. S., Coffman, D., Frossard, A., Russell, L., Keene, W., and Kieber, D.: Contribution of sea surface carbon pool to organic matter enrichment in sea spray aerosol, Nat. Geosci., 7, 228–232, 2014. a
Redemann, J., Wood, R., Zuidema, P., Doherty, S. J., Luna, B., LeBlanc, S. E., Diamond, M. S., Shinozuka, Y., Chang, I. Y., Ueyama, R., Pfister, L., Ryoo, J.-M., Dobracki, A. N., da Silva, A. M., Longo, K. M., Kacenelenbogen, M. S., Flynn, C. J., Pistone, K., Knox, N. M., Piketh, S. J., Haywood, J. M., Formenti, P., Mallet, M., Stier, P., Ackerman, A. S., Bauer, S. E., Fridlind, A. M., Carmichael, G. R., Saide, P. E., Ferrada, G. A., Howell, S. G., Freitag, S., Cairns, B., Holben, B. N., Knobelspiesse, K. D., Tanelli, S., L'Ecuyer, T. S., Dzambo, A. M., Sy, O. O., McFarquhar, G. M., Poellot, M. R., Gupta, S., O'Brien, J. R., Nenes, A., Kacarab, M., Wong, J. P. S., Small-Griswold, J. D., Thornhill, K. L., Noone, D., Podolske, J. R., Schmidt, K. S., Pilewskie, P., Chen, H., Cochrane, S. P., Sedlacek, A. J., Lang, T. J., Stith, E., Segal-Rozenhaimer, M., Ferrare, R. A., Burton, S. P., Hostetler, C. A., Diner, D. J., Seidel, F. C., Platnick, S. E., Myers, J. S., Meyer, K. G., Spangenberg, D. A., Maring, H., and Gao, L.: An overview of the ORACLES (ObseRvations of Aerosols above CLouds and their intEractionS) project: aerosol–cloud–radiation interactions in the southeast Atlantic basin, Atmos. Chem. Phys., 21, 1507–1563, https://doi.org/10.5194/acp-21-1507-2021, 2021. a
Risbey, J. S., Pook, M. J., and McIntosh, P. C.: Spatial trends in synoptic rainfall in southern Australia, Geophys. Res. Lett., 40, 3781–3785, https://doi.org/10.1002/grl.50739, 2013. a
Rose, C., Sellegri, K., Moreno, I., Velarde, F., Ramonet, M., Weinhold, K., Krejci, R., Andrade, M., Wiedensohler, A., Ginot, P., and Laj, P.: CCN production by new particle formation in the free troposphere, Atmos. Chem. Phys., 17, 1529–1541, https://doi.org/10.5194/acp-17-1529-2017, 2017. a
Sanchez, K. J., Chen, C.-L., Russell, L. M., Betha, R., Liu, J., Price, D. J., Massoli, P., Ziemba, L. D., Crosbie, E. C., and Moore, R. H.: Substantial seasonal contribution of observed biogenic sulfate particles to cloud condensation nuclei, Sci. Rep.-UK, 8, 3235, https://doi.org/10.1038/s41598-018-21590-9, 2018. a
Sanchez, K. J., Roberts, G. C., Saliba, G., Russell, L. M., Twohy, C., Reeves, J. M., Humphries, R. S., Keywood, M. D., Ward, J. P., and McRobert, I. M.: Measurement report: Cloud processes and the transport of biological emissions affect southern ocean particle and cloud condensation nuclei concentrations, Atmos. Chem. Phys., 21, 3427–3446, https://doi.org/10.5194/acp-21-3427-2021, 2021. a, b, c, d
Schuddeboom, A. and McDonald, A.: The Southern Ocean radiative bias, cloud compensating errors, and equilibrium climate sensitivity in CMIP6 models, J. Geophys. Res.-Atmos., 126, e2021JD035310, https://doi.org/10.1029/2021JD035310, 2021. a
Siems, S. T., Huang, Y., and Manton, M. J.: Southern Ocean precipitation: Toward a process-level understanding, WIREs Clim. Change, 13, e800, https://doi.org/10.1002/wcc.800, 2022. a
Tan, I., Storelvmo, T., and Zelinka, M. D.: Observational constraints on mixed-phase clouds imply higher climate sensitivity, Science, 352, 224–227, 2016. a
Trenberth, K. E. and Fasullo, J. T.: Simulation of present-day and twenty-first-century energy budgets of the southern oceans, J. Climate, 23, 440–454, 2010. a
Truong, S. C. H., Huang, Y., Lang, F., Messmer, M., Simmonds, I., Siems, S. T., and Manton, M. J.: A Climatology of the Marine Atmospheric Boundary Layer Over the Southern Ocean From Four Field Campaigns During 2016–2018, J. Geophys. Res.-Atmos., 125, e2020JD033214, https://doi.org/10.1029/2020JD033214, 2020. a, b
Truong, S. C. H., Huang, Y., Siems, S. T., Manton, M. J., and Lang, F.: Biases in the thermodynamic structure over the Southern Ocean in ERA5 and their radiative implications, Int. J. Climatol., 42, 7685–7702, 2022. a
Twohy, C. H., DeMott, P. J., Russell, L. M., Toohey, D. W., Rainwater, B., Geiss, R., Sanchez, K. J., Lewis, S., Roberts, G. C., and Humphries, R. S.: Cloud-nucleating particles over the Southern Ocean in a changing climate, Earths Future, 9, e2020EF001673, https://doi.org/10.1029/2020EF001673, 2021. a
Vallina, S. M., Simó, R., and Gassó, S.: What controls CCN seasonality in the Southern Ocean? A statistical analysis based on satellite-derived chlorophyll and CCN and model-estimated OH radical and rainfall, Global Biogeochem. Cy., 20, GB1014, https://doi.org/10.1029/2005GB002597, 2006. a
Whittlestone, S. and Zahorowski, W.: Baseline radon detectors for shipboard use: Development and deployment in the First Aerosol Characterization Experiment (ACE 1), J. Geophys. Res.-Atmos., 103, 16743–16751, https://doi.org/10.1029/98JD00687, 1998. a
Williams, A. and Chambers, S.: A history of radon measurements at Cape Grim, Baseline Atmospheric Program (Australia) History and Recollections, 40th Anniversary Special Edn., 131–146, 2016. a
Williams, A. A. J. and Stone, R. C.: An assessment of relationships between the Australian subtropical ridge, rainfall variability, and high-latitude circulation patterns, Int. J. Climatol., 29, 691–709, https://doi.org/10.1002/joc.1732, 2009. a
Williams, K. D., Bodas-Salcedo, A., Déqué, M., Fermepin, S., Medeiros, B., Watanabe, M., Jakob, C., Klein, S. A., Senior, C. A., and Williamson, D. L.: The Transpose-AMIP II experiment and its application to the understanding of Southern Ocean cloud biases in climate models, J. Climate, 26, 3258–3274, 2013. a
Williamson, C. J., Kupc, A., Axisa, D., Bilsback, K. R., Bui, T., Campuzano-Jost, P., Dollner, M., Froyd, K. D., Hodshire, A. L., Jimenez, J. L., Kodros, J. K., Luo, G., Murphy, D. M., Nault, B. A., Ray, E. A., Weinzierl, B., Wilson, J. C., Yu, F., Yu, P., Pierce, J. R., and Brock, C. A.: A large source of cloud condensation nuclei from new particle formation in the tropics, Nature, 574, 399–403, https://doi.org/10.1038/s41586-019-1638-9, 2019. a
WMO: Global Atmosphere Watch- World Data Centre for Aerosols, CCN concentration, WMO [data set], https://www.gaw-wdca.org/browse-obtain-data/, last access: August 2024. a
Wood, R.: Rate of loss of cloud droplets by coalescence in warm clouds, J. Geophys. Res.-Atmos., 111, D21205, https://doi.org/10.1029/2006JD007553, 2006. a
Wood, R.: Stratocumulus clouds, Mon. Weather Rev., 140, 2373–2423, 2012. a, b
Wood, R. and Bretherton, C. S.: On the Relationship between Stratiform Low Cloud Cover and Lower-Tropospheric Stability, J. Climate, 19, 6425–6432, https://doi.org/10.1175/JCLI3988.1, 2006. a
Wood, R., Leon, D., Lebsock, M., Snider, J., and Clarke, A. D.: Precipitation driving of droplet concentration variability in marine low clouds, J. Geophys. Res.-Atmos., 117, D19210, https://doi.org/10.1029/2012JD018305, 2012. a, b, c
World Data Centre for Greenhouse Gases: Radon measurements, World Data Centre for Greenhouse Gases [data set], https://gaw.kishou.go.jp/search/station#5011, last access: August 2024. a
Zahorowski, W., Griffiths, A. D., Chambers, S. D., Williams, A. G., Law, R. M., Crawford, J., and Werczynski, S.: Constraining annual and seasonal radon-222 flux density from the Southern Ocean using radon-222 concentrations in the boundary layer at Cape Grim, Tellus B, 65, 19622, https://doi.org/10.3402/tellusb.v65i0.19622, 2013. a
Zelinka, M. D., Myers, T. A., McCoy, D. T., Po-Chedley, S., Caldwell, P. M., Ceppi, P., Klein, S. A., and Taylor, K. E.: Causes of higher climate sensitivity in CMIP6 models, Geophys. Res. Lett., 47, e2019GL085782, https://doi.org/10.1029/2019GL085782, 2020. a
- Abstract
- Introduction
- Data and methodology
- Synoptic classification
- Air mass characteristics
- Relationship to the CGO baseline air masses
- Discussion and conclusion
- Appendix A: Evidence of the subsidence over the CGO
- Appendix B: Further environmental context for each cluster
- Data availability
- Author contributions
- Competing interests
- Disclaimer
- Acknowledgements
- Financial support
- Review statement
- References
Clouds over the Southern Ocean are crucial to Earth's energy balance, but understanding the factors that control them is complex. Our research examines how weather patterns affect tiny particles called cloud condensation nuclei (CCN), which influence cloud properties. Using data from Kennaook / Cape Grim, we found that winter air from Antarctica brings cleaner conditions with lower CCN, while summer patterns from Australia transport more particles. Precipitation also helps reduce CCN in winter.
Clouds over the Southern Ocean are crucial to Earth's energy balance, but understanding...
- Abstract
- Introduction
- Data and methodology
- Synoptic classification
- Air mass characteristics
- Relationship to the CGO baseline air masses
- Discussion and conclusion
- Appendix A: Evidence of the subsidence over the CGO
- Appendix B: Further environmental context for each cluster
- Data availability
- Author contributions
- Competing interests
- Disclaimer
- Acknowledgements
- Financial support
- Review statement
- References