the Creative Commons Attribution 4.0 License.
the Creative Commons Attribution 4.0 License.
 | 27 Feb 2025
Measurement report: Cloud condensation nuclei (CCN) activity in the South China Sea from shipborne observations during the summer and winter of 2021 – seasonal variation and anthropogenic influence
Hengjia Ou
Yongyun Zhang
Xue Ni
Baoling Liang
Qibin Sun
Shixin Mai
Cuizhi Sun
Shengzhen Zhou
Haichao Wang
Jiaren Sun
Understanding seasonal variations in cloud condensation nuclei (CCN) activity and the impact of anthropogenic emissions in marine environments is crucial for assessing climate change. This study presents findings from two shipborne observations conducted in the South China Sea (SCS) during the summer and winter of 2021. In summer, higher particle number concentrations but lower mass concentrations of non-refractory submicron particles (NR-PM1) were observed, driven by Aitken-mode particle dominance. In contrast, winter showed a more balanced distribution between Aitken and accumulation-mode particles. Summer particles were more hygroscopic, exhibiting higher activation ratios (ARs) at all supersaturation (SS) levels. Distinct air mass periods were identified: in summer, terrestrial air masses from Luzon (“Luzon” period) and the area formerly referred to as the Indochinese Peninsula (hereafter “Indochinese Peninsula” period) and marine air masses; in winter, periods were influenced by mainland China (hereafter “Mainland China” period), a mix of mainland China and marine air masses (“Mixed” period), and purely marine air masses. The Luzon period in summer exhibited the highest particle number concentration, especially in the Aitken mode, resulting in the highest CCN number concentration (NCCN). Aerosol hygroscopicity was higher during the Indochinese Peninsula period compared to the Luzon period, leading to a higher bulk AR due to the combination of higher hygroscopicity and a greater fraction of accumulation-mode particles. The Mainland China period in winter showed a high nitrate fraction in the NR-PM1, but the inorganic fraction was similar to it in the Luzon period, resulting in comparable hygroscopicity at low SS to the Luzon period. However, smaller particle hygroscopicity was significantly lower in the Mainland China period compared to summer. The Mixed period in winter exhibited a higher fraction of accumulation-mode particles, causing a higher bulk AR compared to the Mainland China period. Overall, summer terrestrial air masses increased the Aitken-mode particle and CCN concentration, while winter terrestrial air masses led to higher concentration of large particles and lower hygroscopicity of fine particles. CCN closure analysis, considering aerosol composition and mixing state, revealed that summer aerosols were primarily internally mixed, whereas smaller aerosols in winter were primarily externally mixed. The potential effect of undetected sea salt may lead to an underestimation of aerosol hygroscopicity in summer. This study highlights significant seasonal differences in aerosol properties and the impact of different types of terrestrial air masses on CCN activity in the SCS, contributing to our understanding of regional climate influences.
- Article
(5521 KB) - Full-text XML
-
Supplement
(2658 KB) - BibTeX
- EndNote


Aerosols can act as cloud condensation nuclei (CCN), influencing cloud formation, lifespan, and albedo, thus indirectly impacting global radiative balance (Fletcher, 1962; Albrecht, 1989). The aerosol–cloud interaction currently represents the largest uncertainty in radiative forcing within climate models, ranging from −1.7 to −0.3 W m−2 (IPCC, 2021). This uncertainty can be partially attributed to the significant spatiotemporal variability in the aerosol size distribution and the ability of atmospheric aerosol particles acting as CCN (CCN activity) (Fitzgerald, 1973; Jimenez et al., 2009; Sihto et al., 2011). Thus, field measurements of aerosol size distribution and physicochemical properties are needed to better understand the radiative forcing exerted by atmospheric aerosol particles.
Previous studies suggest that particle number size distribution (PNSD) is a primary factor influencing CCN concentrations (Dusek et al., 2006; Rose et al., 2010; Pöhlker et al., 2016; Burkart et al., 2011). The PNSD can account for 84 %–96 % of the variability in the CCN concentrations (NCCN) (Dusek et al., 2006), while CCN activities may also play a significant role in the NCCN (Quinn et al., 2008; Cai et al., 2018; Ovadnevaite et al., 2017; Liu et al., 2018; Crosbie et al., 2015), which are primarily governed by the particle size, chemical composition, mixing state, surface tension, and hygroscopicity (Köhler, 1936; Seinfeld and Pandis, 2016). Among these factors, the impact of hygroscopicity on CCN activities has received great attention in recent years (Petters and Kreidenweis, 2007; Ajith et al., 2022; Rose et al., 2010). Petters and Kreidenweis (2007) proposed the κ–Köhler theory based on the Köhler theory to quantify the ability of aerosol particles to absorb moisture and become CCN based on the aerosol hygroscopicity parameters (κ). Ajith et al. (2022) showed that 64 % of particles can be activated as CCN when κ is equal to 0.37, whereas when κ decreases to 0.23, only 48 % of particles can be activated in the tropical coastal area.
Significant seasonal variations in PNSD and hygroscopicity under both terrestrial and marine environments were observed in previous field observations, leading to the seasonal variations in NCCN (Crosbie et al., 2015; Schmale et al., 2018; Burkart et al., 2011; Bougiatioti et al., 2009; Sihto et al., 2011; Leena et al., 2016; Ross et al., 2003; Gras and Keywood, 2017; Quinn et al., 2019). Crosbie et al. (2015) revealed that in the urban area of Arizona, particles had larger sizes and higher hygroscopicity, and NCCN was also higher during winter, while a higher abundance of smaller particles was observed during summer, owing to stronger photochemical reactions. In pristine environments like mountain, coastal, and forested regions, seasonal variations in NCCN and PNSD were more pronounced than urban and rural areas (Schmale et al., 2018). Pöhlker et al. (2016) observed significant differences in NCCN between the wet and dry seasons in the Amazon rainforest, while the κ values remained relatively stable. They also noted increased particle concentrations and aerosol hygroscopicity, both subject to the impact of long-range transport originating from anthropogenic emissions. Observations in marine areas during different seasons are relatively scarce compared with those in inland areas. Gras (1995) found that both particle concentration and NCCN in the Southern Ocean reached their peaks during summer and gradually decreased to their valleys in winter. Quinn et al. (2019) showed that sea spray aerosols only make a relatively significant contribution to NCCN during winter in the western North Atlantic, while in other seasons, the primary contribution comes from biogenic aerosols oxidized from dimethyl sulfide (DMS). Zheng et al. (2020) revealed that sulfate dominates the particle condensational growth to CCN sizes during summer in the eastern North Atlantic, while secondary organic aerosols played a significant role in particle growth throughout all seasons. These results indicate that CCN activity and concentration could vary in a large range during different seasons. Thus, further observations across different seasons in marine environments are needed to enhance our understanding of marine CCN activities and their seasonal variations.
The South China Sea (SCS), located in Southeast Asia and bordered by China, the area formerly referred to as the Indochinese Peninsula (hereafter “Indochinese Peninsula”), and Maritime Southeast Asia, is significantly influenced by air pollutants transported through terrestrial air masses. Studies have shown that these pollutants play a crucial role in determining aerosol concentration and properties in the region (Atwood et al., 2017; Xiao et al., 2017; Geng et al., 2019; Liang et al., 2021; Sun et al., 2023; Qin et al., 2024). For instance, Xiao et al. (2017) reported that 69.7 % of nitrate and 57.5 % of sulfate in the SCS originated from fossil fuel combustion, particularly coal burning in Chinese coastal regions. Additionally, Liang et al. (2021) and Sun et al. (2023) observed an increase in the organic fraction and concentration of submicron aerosols when the region was influenced by terrestrial air masses from mainland China and the Indochinese Peninsula in the northern SCS. Further studies highlighted the variation in aerosol properties under different air mass influences. Atwood et al. (2017) found a significant bimodal particle distribution with a κ value of 0.65 in the southern SCS under marine air mass influence, whereas a unimodal distribution with a κ of 0.4 was observed under continental air mass influence.
The SCS experiences a typical monsoon climate with distinct seasonal wind direction changes (Wang et al., 2009). The northeast monsoon, occurring from November to March, is characterized by stronger average wind speeds and longer period compared to the southwest monsoon, which dominates from June to August. The transitional periods occur from April to May and September to October. During the northeast monsoon, air pollutants are primarily transported to the SCS by terrestrial air masses from China (Xiao et al., 2017; Liu et al., 2014; Geng et al., 2019). In contrast, during the summer, pollutants mainly originate from terrestrial air masses from the Indochinese Peninsula and Maritime Southeast Asia (Geng et al., 2019; Liang et al., 2021; Sun et al., 2023). These varying sources of anthropogenic emissions exert different impacts on CCN activity differently across seasons. Additionally, when the marine boundary layer over the SCS is influenced by various natural and anthropogenic sources, resulting in altered aerosol properties, the characteristics of cumulus clouds are correspondingly affected (Miller et al., 2023). This indicates that aerosol–cloud interactions vary between winter and summer seasons. However, due to limited observational data, our understanding of seasonal variations in CCN activity in the SCS remains incomplete. Conducting comprehensive observational studies on CCN activity across different seasons is essential for improving our understanding of aerosol–cloud interactions on the SCS.
In this study, we conducted two shipborne observations in the SCS during summer (5 May–9 June 2021) and winter (19–29 December 2021). Our observations with online instruments focused on measuring aerosol chemical composition, PNSD, and CCN activation in the region. Our results provide valuable insights into the differences in CCN activity between winter and summer, as well as the influence of different types of terrestrial air masses on CCN activity in the SCS across different seasons.
2.1 Cruise information and onboard measurements
2.1.1 Cruise information
This study consists of two research cruises conducted during the summer and winter of 2021, respectively. These two cruises were interdisciplinary scientific expeditions, integrating fields such as marine geology, oceanography, and atmospheric environment. The primary objective in the atmospheric environment was to investigate the impact of summer and winter monsoons on the atmospheric environment of the South China Sea (SCS). The summer and winter cruises were carried out respectively by the vessels Tan Kah Kee and Sun Yat-sen University. The Tan Kah Kee is an oceanographic research vessel with a length of 77.7 m, a beam of 16.24 m, and a displacement of 3611 t. The Sun Yat-sen University is a comprehensive oceanographic training vessel with a total length of 114.3 m, a beam of 19.4 m, and a displacement of 6880 t.
The first cruise was from 5 May to 9 June 2021. The cruise started from Xiamen port and traversed from the northern to the central–southern South China Sea, then circled back near Hainan Island, and finally returned to Xiamen port. The second cruise was from 19 December to 29 December 2021. It began from Gaolan port in Zhuhai and reached the vicinity of Yongxing Island and ultimately returned to Gaolan port (Fig. 1a). Unfortunately, due to adverse weather conditions, such as strong winter monsoon winds causing poor sea conditions, and the fact that it was the first scientific deployment of the research vessel Sun Yat-sen University, the winter cruise had a shorter duration and covered a narrower spatial range, remaining only in the northern SCS (Fig. S1), compared to the summer cruise. On both cruises, most of the instruments were housed in a single compartment, and the sampling lines were extended from the window of the compartment to the height of the ship's bridge (∼ 17 m above sea level) (Fig. 1a).
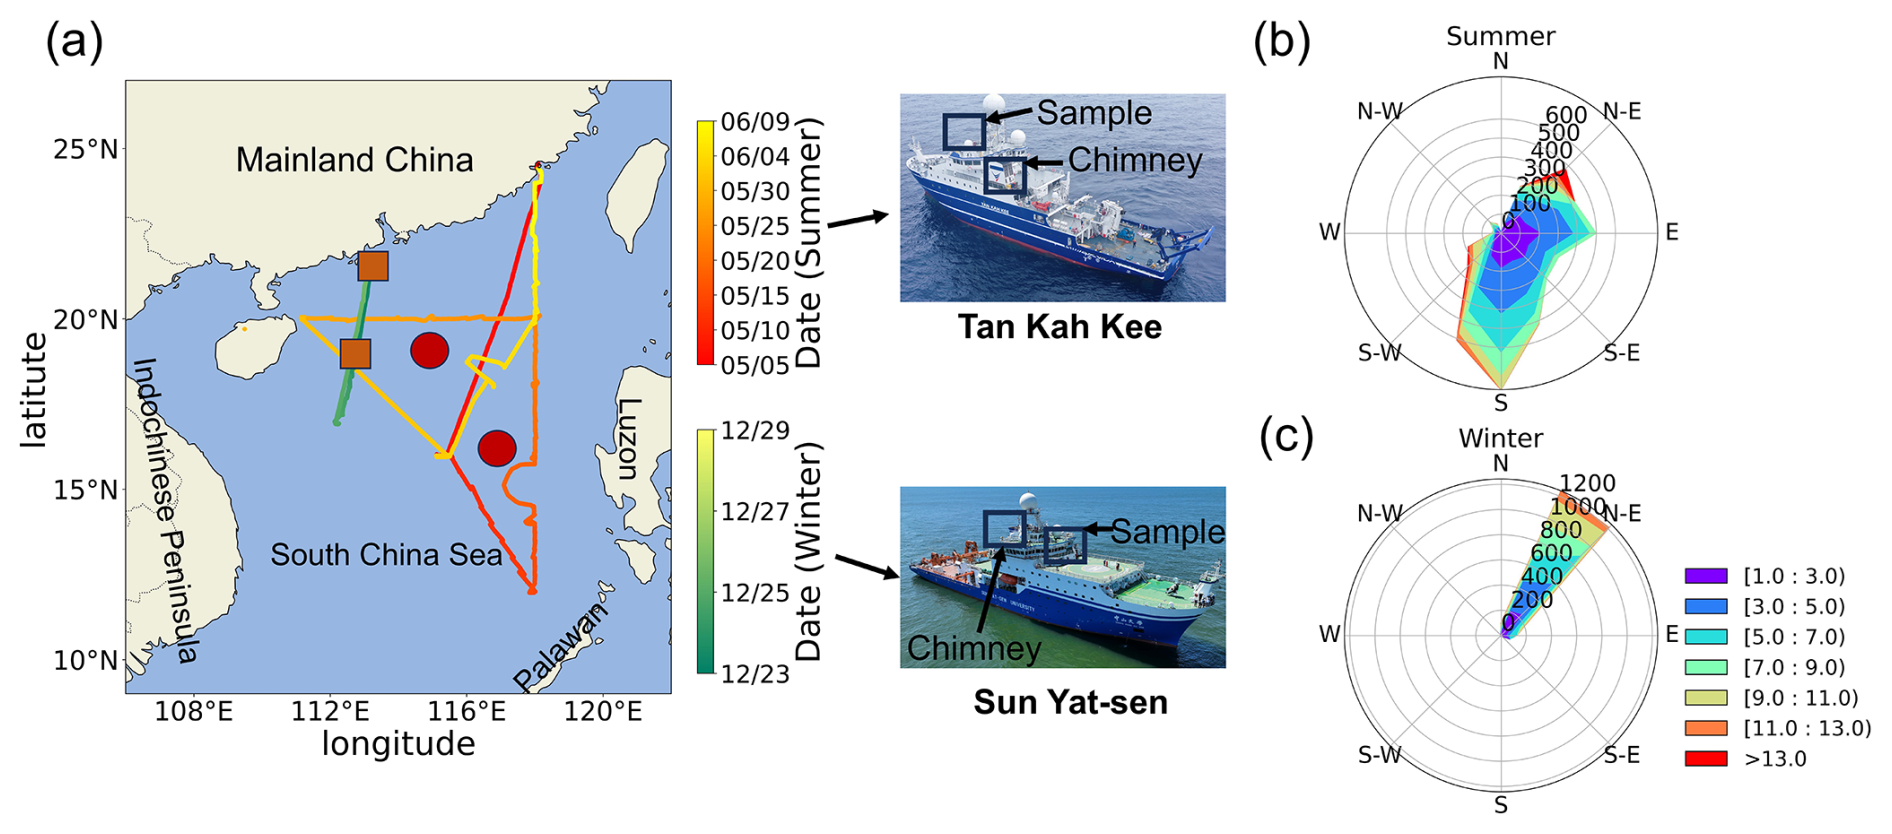
Figure 1The cruises of two shipborne observations and the location of sample line and chimney of Tan Kah Kee and Sun Yat-sen scientific vessels. (a) Wind rose of the wind direction and wind speed in summer and winter cruises. The radius represents the frequency of wind direction occurrences, and the shaded areas indicate wind speed (b, c). The red circles are the midpoints of the ship trajectory selected for backward trajectory and cluster analysis in summer, and the orange squares are the midpoints of the ship trajectory selected for backward trajectory and cluster analysis in winter.
2.1.2 Size-resolved cloud condensation nuclei activity measurement
The size-resolved CCN activity was measured using the scanning mobility CCN analysis (SMCA) method proposed by Moore et al. (2010), employing a combination of a scanning mobility particle sizer (SMPS) system and a cloud condensation nuclei counter (CCNc-200, DMT Inc., USA) (Fig. S2). The SMPS system consisted of a differential mobility analyzer (DMA; model 3082, TSI., Inc.) and a condensation particle counter (CPC; model 3756, TSI Inc.). The SMPS and the CCNc system were used to measure PNSD and size-resolved CCN number concentration at a mobility size range of 10–500 and 10–593 nm in summer and winter campaign, respectively. Unfortunately, due to the malfunction of the flow sensor in column B on both cruises, only the data from column A are presented in this study. During the SMCA measurement, the particles were first passed through a Nafion dryer to remove moisture and then neutralized using a neutralizer. After that, they were subjected to size selection with a DMA. The particles were then split between a CPC (1 L min−1) for particle concentration measurement and a CCNc (0.5 L min−1) for CCN measurement at a specific supersaturation (SS). To maintain sample flow through the DMA, diluted air (0.5 L min−1) was added to the CPC inlet stream. The effect of the diluted air was accounted for in the PNSD data processing (Fig. S2). The supersaturation of the CCNc was set at 0.2 %, 0.4 %, and 0.7 % in the summer campaign and 0.1 %, 0.2 %, 0.4 %, and 0.7 % in the winter campaign, respectively. During the measurement process, each supersaturation level was held constant for 20 min, with the DMA completing a full scanning cycle every 5 min. During the measurements, supersaturation levels varied incrementally between 0.1 % and 0.2 %, 0.2 % and 0.4 %, and 0.4 % and 0.7 %, with temperature stabilization times ranging from a few seconds to several tens of seconds. However, reducing the supersaturation from 0.7 % to 0.1 % or 0.2 % required approximately 5 min for stabilization. For data processing, only instances where the temperature remained stable throughout the DMA scanning phase were included in the analysis. Before the measurements, the CCNc was calibrated with ammonium sulfate ((NH4)2SO4) particles at each set SS. Detailed description of the instrument configuration and calibration can be found in Cai et al. (2018). The uncertainty in the instrument's measurement of size-resolved particle number concentration is approximately 5 %–6 % (Moore et al., 2010).
2.1.3 Aerosol chemical composition measurement
The chemical composition of atmospheric non-refractory submicron particulate matter (NR-PM1), including sulfate, nitrate, organics, ammonium, and chloride, was measured using an online time-of-flight ACSM (ToF-ACSM; Aerodyne Inc., USA). The sampling time of the ToF-ACSM was approximately 10 min. The ionization efficiency (IE) and relative ionization efficiency (RIE) values of the instrument were calibrated using ammonium nitrate (NH4NO3) and ammonium sulfate ((NH4)2SO4) both before the start and after the completion of the campaigns. The calibration gives an IE value of 103.4 and 98.9 ions pg−1 for nitrate in summer and winter cruises, respectively. The RIE values for ammonium were 3.31 and 3.33 during the summer and winter, respectively, while the ones for sulfate were 1.02 and 0.81 during the summer and winter, respectively. The collection efficiency (CE) was determined as shown in Sun et al. (2023), and time-independent CE values were used in this study. Detailed CE calculation and discussion can be found in the Supplement (Sect. S1 and Fig. S3). The values obtained using the time-independent CE method show a deviation of approximately 3 % compared to those obtained with a constant CE of 0.5. Assuming an average aerosol density of 1.5 g cm−3 (Geller et al., 2006), the mass concentrations measured by the SMPS and ToF-ACSM exhibit a strong overall correlation, with correlation coefficients of 0.84 in summer and 0.93 in winter. During the pre-onset phase of the summer monsoon (prior to 24 May), periodic discrepancies were observed between the ACSM and SMPS data, likely due to the influence of refractory aerosol (i.e., black carbon). This issue is discussed in detail in Sect. S1. The black carbon (BC) mass concentrations were measured using an Aethalometer (Model AE33, Magee Scientific, USA) with a 1 min time resolution (Drinovec et al., 2015). Notably, the BC mass concentrations obtained from AE33 are referred to as equivalent BC mass concentrations, as they represent the combined light absorption of BC at 880 nm. Prior to entering the AE33, the sampled air was passed through a PM2.5 cyclone (BGI Inc., Waltham, MA, USA) to exclude particles larger than 2.5 µm.
2.1.4 Meteorological parameter measurements
The meteorological elements, including temperature, relative humility (RH), wind speed, and wind direction, were measured by the combined automatic weather station (AWS430, Vaisala Inc., Finland) on board the vessels (Sun et al., 2024). During the winter cruises, meteorology data before 22 December 2022 were missed due to the calibration for the automatic weather station (WXT536, Vaisala Inc., Finland) before this date. The time series of meteorological data are presented in Fig. S5. The AWS430 provides measurement accuracies of ±2 % for wind speed, ±2 % for wind direction, ±0.3 °C for temperature, and ±1 % for relative humidity (within the range of 0 %–90 %). Similarly, the WXT536 offers accuracies of ±3 % for wind speed, ±3 % for wind direction, ±0.3 °C for temperature, and ±3 % for relative humidity (within the range of 0 %–90 %) (https://www.vaisala.com, last access: 30 November 2024).
2.2 Data analysis
2.2.1 CCN activation
The size-resolved number concentrations of total particle and cloud condensation nuclei were obtained from the SMPS and CCNc through the SMCA method. The activation diameter was determined by fitting the activation ratio (AR, ) and dry diameter at each supersaturation through the following equation:
where AR indicates the size-resolved AR; DP represents dry particle diameter (nm); and B, C, and D50 are the three fitting parameters, representing the asymptote, the slope, and the inflection point of the sigmoid, respectively (Moore et al., 2010). The D50 parameter, also known as the critical diameter, corresponds to the particle size at which 50 % of the particles are activated at a specific SS. The fitting results from the SMCA method measured in this study are presented in Fig. S6.
The hygroscopicity parameter (κ), which represents CCN activity according to the κ-Köhler equation, is calculated as follows (Petters and Kreidenweis, 2007):
where ρw is the density of pure water (about 997.04 kg m−3 at 298.15 K), MW is the molecular weight of water (0.018 kg mol−1), corresponds to the surface tension of the solution-air interface and is assumed to be equal to the surface tension of pure water ( N m−1 at 298.15 K), R is the universal gas constant (8.314 J mol−1 K−1), T denotes thermodynamic temperature in kelvin (298.15 K), and D50 is the critical diameter (in m). Additionally, it is noted that the estimated κ values refer to particles with the D50.
According to κ-Köhler theory, in the following discussion, the hygroscopicity of small particles is associated with hygroscopicity at high SS, whereas the hygroscopicity of large particles is linked to hygroscopicity at low SS.
During part of the summer measurement period, the D50 at 0.7 % supersaturation ranged between 30 and 40. However, due to lower concentrations during these times, instrument noise introduced greater measurement uncertainty, as demonstrated in Fig. S7. Consequently, the average D50 and κ at 0.7 % SS are not included in Table 1.
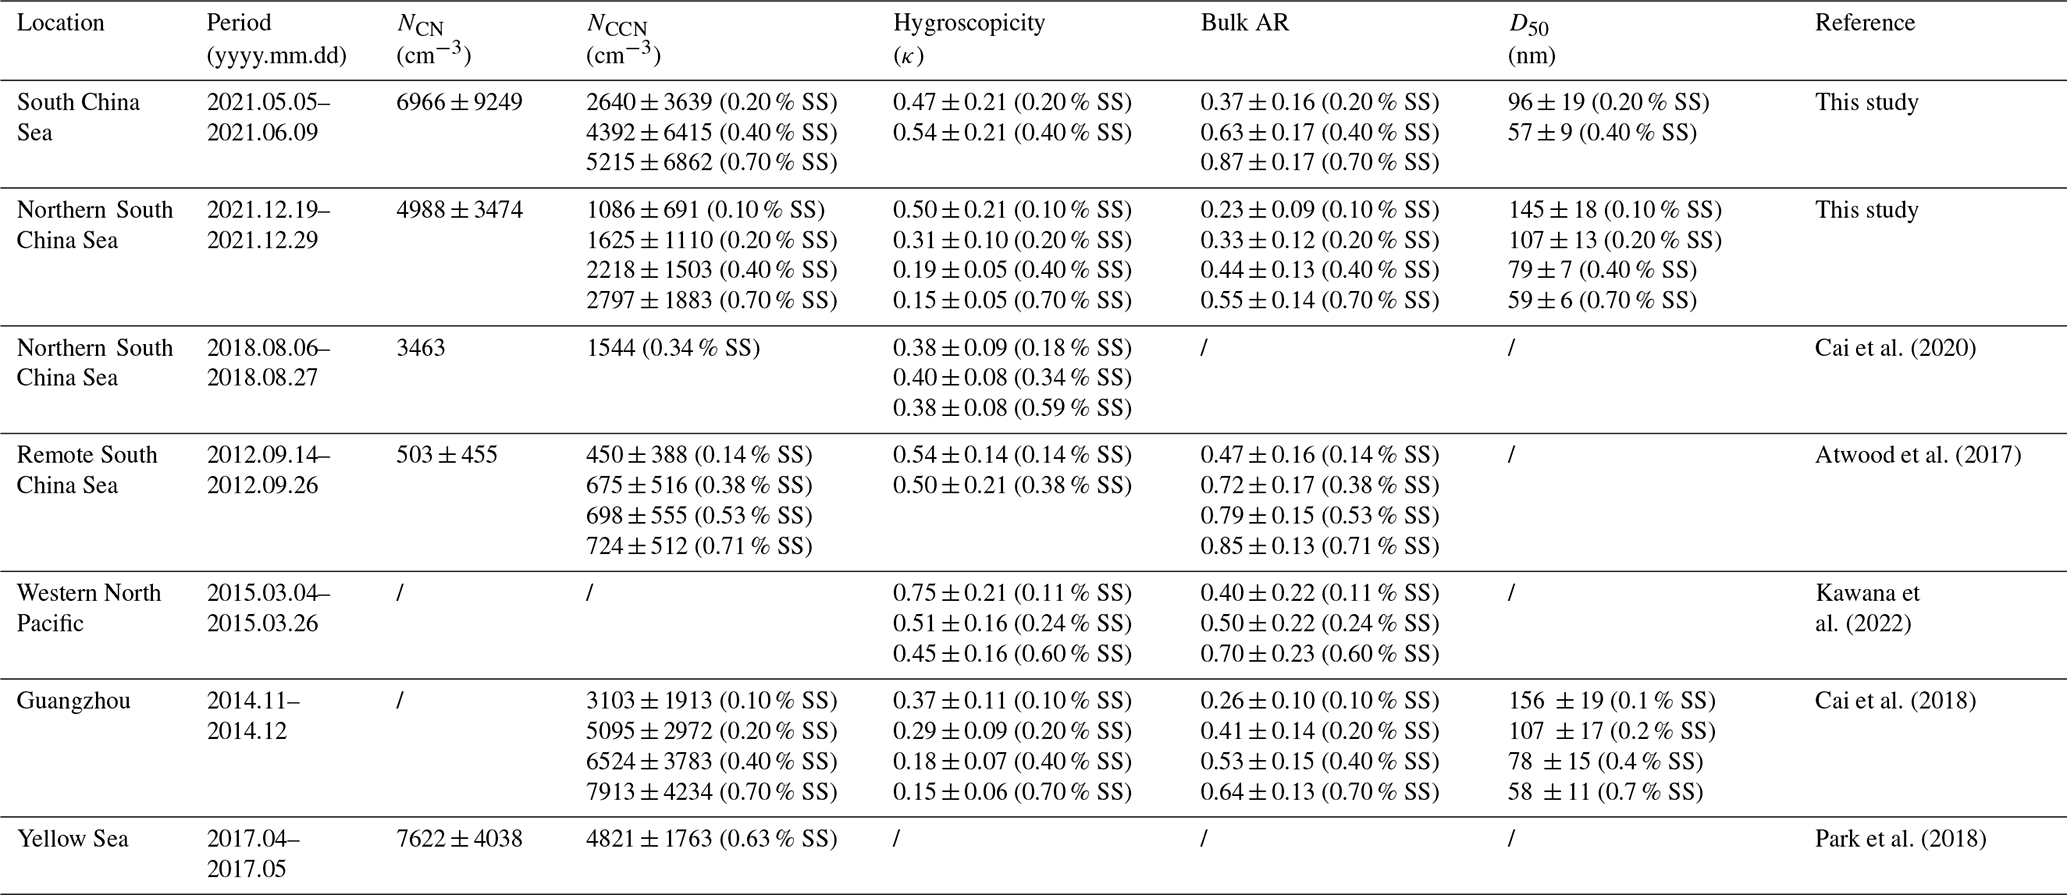
Table 1The particle number concentration and, at different SS, the cloud condensation nuclei number concentration, the hygroscopicity, the bulk activation ratio (AR), and the activation diameter (D50) in different studies.
2.2.2 Closure method
According to Petters and Kreidenweis (2007), κ can be predicted by a simple mixing rule based on chemical volume fractions:
where εi and κi are the volume fraction and hygroscopicity parameter for the specific dry component in the mixture. We obtained ε from aerosol chemical composition measured by the ToF-ACSM. In this study, κ values for (NH4)2SO4 (0.48), NH4NO3 (0.58), and NaCl (1.1) represent the κ values of SO, NO, and Cl− provided by the ToF-ACSM (Huang et al., 2022). In addition, the κ of organics was 0.1 at this study according to Huang et al. (2022). The density of (NH4)2SO4, NH4NO3, NaCl, and organics are 1769, 1720, 2165, and 1400 kg m−3 (Huang et al., 2022; Gysel et al., 2007).
2.2.3 CCN concentration and activation ratio calculation
Due to the malfunction of column B, the CCN concentration (NCCN) was calculated based on the size-resolved AR at a specific SS from the SMCA method and observed particle number concentration. It can be calculated by the following equation (Cai et al., 2018):
where NCCN(SS) is the CCN concentration at a specific SS, AR(SS, DP) is the ratio of NCCN at a specific SS to NCN on a specific diameter from the SMCA method, and NCN(DP) is the particle number concentration at a specific diameter (Dp). Due to the absence of direct measurements for total NCCN, we refer to the NCCN derived from Eq. (4) as observed values (NCCN,obs) in this study. Previous research has shown that this method (size-resolved CCN from one column in CCNc-200) provides results closely matching those obtained from direct measurement (from another column in CCNc-200), supporting its reliability (Meng et al., 2014; Lathem and Nenes, 2011).
The NCCN (referred as NCCN,sim(SS)) can be predicted by D50 from the closure method (D50,sim(SS)) and NCN according to the following equation (Jurányi et al., 2011):
where the D50,sim(SS) is calculated based on Eqs. (2) and (3).
The bulk AR at a specific SS can be calculated by
where NCN,tot represents the total particle number concentration.
To investigate the impact of the fraction and mixing state of aerosol on NCCN, two CCN simulation schemes are applied in this study (Patel and Jiang, 2021).
-
Internally mixed scheme. The aerosol composition from the ToF-ACSM was assumed to be size-independent and internally mixed. All aerosols have an identical chemical composition in the whole size range. NCCN is calculated by κsim and measured PNSD according to Eqs. (2), (3), and (5) (Fig. S8a).
-
Externally mixed scheme. The aerosol composition from the ToF-ACSM was assumed to be size-independent and externally mixed. Four types of aerosols ((NH4)2SO4, NH4NO3, NaCl, and organics) are assumed to have the same proportion for all sizes. The D50 from each species was calculated by Eq. (2) according to their κ values mentioned in Sect. 2.2.2. NCCN is calculated according to Eq. (5) (Fig. S8b and Table S1).
To access the simulation result from these two schemes, normalized mean bias (NMB) was used in this study:
where NCCN,sim is the simulated NCCN from two schemes, and NCCN,obs is the observed NCCN.
2.2.4 Fitting of lognormal modes to particle number size distributions
The multi-lognormal distribution function (Eq. 8) is used to parameterize and optimize the descriptions of the measured PNSD (Heintzenberg, 1994) and is widely applied in aerosol research (Cai et al., 2020; Boyer et al., 2023; Zhu and Wang, 2024). An automatic mode-fitting algorithm (Hussein et al., 2005) is used to generate the model-fitted results.
where DP is the diameter of a particle. Each lognormal mode is characterized by three parameters: the mode number concentration (Ni), geometric variance (σg,i), and geometric mean diameter (GMD; ). The total number of lognormal modes used to describe the PNSD is denoted by n. These modes are fitted using an algorithm applied to each particle size distribution, with one to three lognormal distributions used per time step. The algorithm classifies the PNSD into nucleation, Aitken, and accumulation modes based on their GMDs. The GMD for nucleation modes (GMD1) typically ranges from 3 to 30 nm, for Aitken modes (GMD2) it ranges from 30 to 100 nm, and for accumulation modes (GMD3) it is above 100 nm (Heintzenberg, 1994; Hussein et al., 2005; Zhu and Wang, 2024).
2.2.5 Backward trajectory simulation and cluster analysis
Backward trajectory calculations were performed using MeteoInfo, an open-source software suite (Wang, 2014), to determine potential source origins. Weekly GDAS1 (Global Data Assimilation System at a resolution of 1°) files were downloaded from the NOAA Air Resource Laboratory (ARL) website (https://www.ready.noaa.gov/gdas1.php, last access: 30 August 2024). The calculation of backward trajectories is performed every 1 h based on the location mentioned below, generating 72 h backward trajectories at 500 m.
To clarify the sources of air masses, the cluster analysis was applied in this study, which was performed by TrajStat, a plug-in module of MeteoInfo, based on the k-means method (http://meteothink.org/docs/trajstat/cluster_cal.html, last access: 2 September 2024). According to the report by the China Meteorological Administration (Chao et al., 2022), the summer monsoon in 2021 broke out during the sixth pentad of May. Therefore, based on the timing of the monsoon onset and the actual trajectory of the ship, we selected two representative midpoints of the ship track for backward trajectory calculations and cluster analysis in summer: the midpoint of the ship's track before the onset of the summer monsoon (5–23 May) and the midpoint of the track after the summer monsoon began (24 May–9 June). In the winter cruise, backward trajectories calculation and cluster analysis were performed at two specific locations: the ship's anchorage near Dawanshan Island (“Big Ten-thousand Mountain Island”; 19–21 and 27–29 December) and the midpoint between Dawanshan Island and Yongxing Island (22–26 December). To ensure the accuracy of the backward trajectory calculations and cluster analysis, we compared the trajectories at the midpoints with those from the ship's actual locations to verify consistency in air mass sources (Fig. S9). Minor discrepancies may exist between the air mass origins at certain midpoints and the actual ship locations. However, overall, the air mass origins at the midpoints are representative of those at the actual locations. We further examined the trajectories for each cluster to verify their alignment with the air mass origins they represent (Fig. S10). The results demonstrate that cluster analysis was well conducted. Additionally, Fig. S10 illustrates the average altitude variation as the age in hours increases across different periods. During summer, the altitude of the clusters remained below 880 hPa, indicating that they resided within the boundary layer (about 800 hPa). While in winter, the altitude of the clusters was higher than in summer, especially for the cluster during the mixed period (peaked at about 755 hPa). However, these clusters were generally within or close to the boundary layer. These results suggest that the back trajectories could represent the characteristics of the air masses originating from these specified regions.
2.2.6 Data quality control
To ensure reliable atmospheric samples in the SCS and mitigate the influence of research vessel emissions, we applied the following data processing procedures (Huang et al., 2018; Cai et al., 2020; Liang et al., 2021).
Firstly, we identified organic compounds, black carbon (BC), and small particulate matter (41.4 nm particles) as indicators of ship emissions, recognizing their sudden peak values as indicative of the ship's own emissions.
Secondly, we accounted for the relative positions of the ship's chimney and the sampling tube. During the summer cruise, we excluded data corresponding to a relative wind direction (with respect to the ship's bow) between 150 and 270° and a relative wind speed (with respect to the ship's speed) of less than 2.5 m s−1 (Figs. S12a, S13a1, and S14a–c). During the winter cruise, we excluded data for a relative wind direction between 150 and 220° and a relative wind speed of less than 2.5 m s−1 (Figs. S12b, S13b1, and S14d–f).
Applying these criteria, 74.8 % of the data in summer and 92.2 % in winter (both at 10 min resolution) were classified as “clean” and retained for analysis. The time series of data before and after quality control is shown in Fig. S15.
3.1 CCN concentration and aerosol characteristics over the SCS in summer and winter
Figure 2 presented the time series of PNSD (a1 and a2), NR-PM1 mass concentrations and fractions (b1 and b2 and c1 and c2), number concentrations of CCN (d1 and d2), and hygroscopicity κ values (e1 and e2) during two campaigns in summer and winter. During the summer cruise, we observed two distinct periods around the onset of the summer monsoon. The South China Sea (SCS) summer monsoon began in the sixth pentad of May (Chao et al., 2022). In winter, the influence of the winter monsoon persisted throughout the entire observation period (Fig. 1c). Despite our measurements being limited to the northern SCS in winter, the impact of the Northeast Monsoon on the SCS was evident.
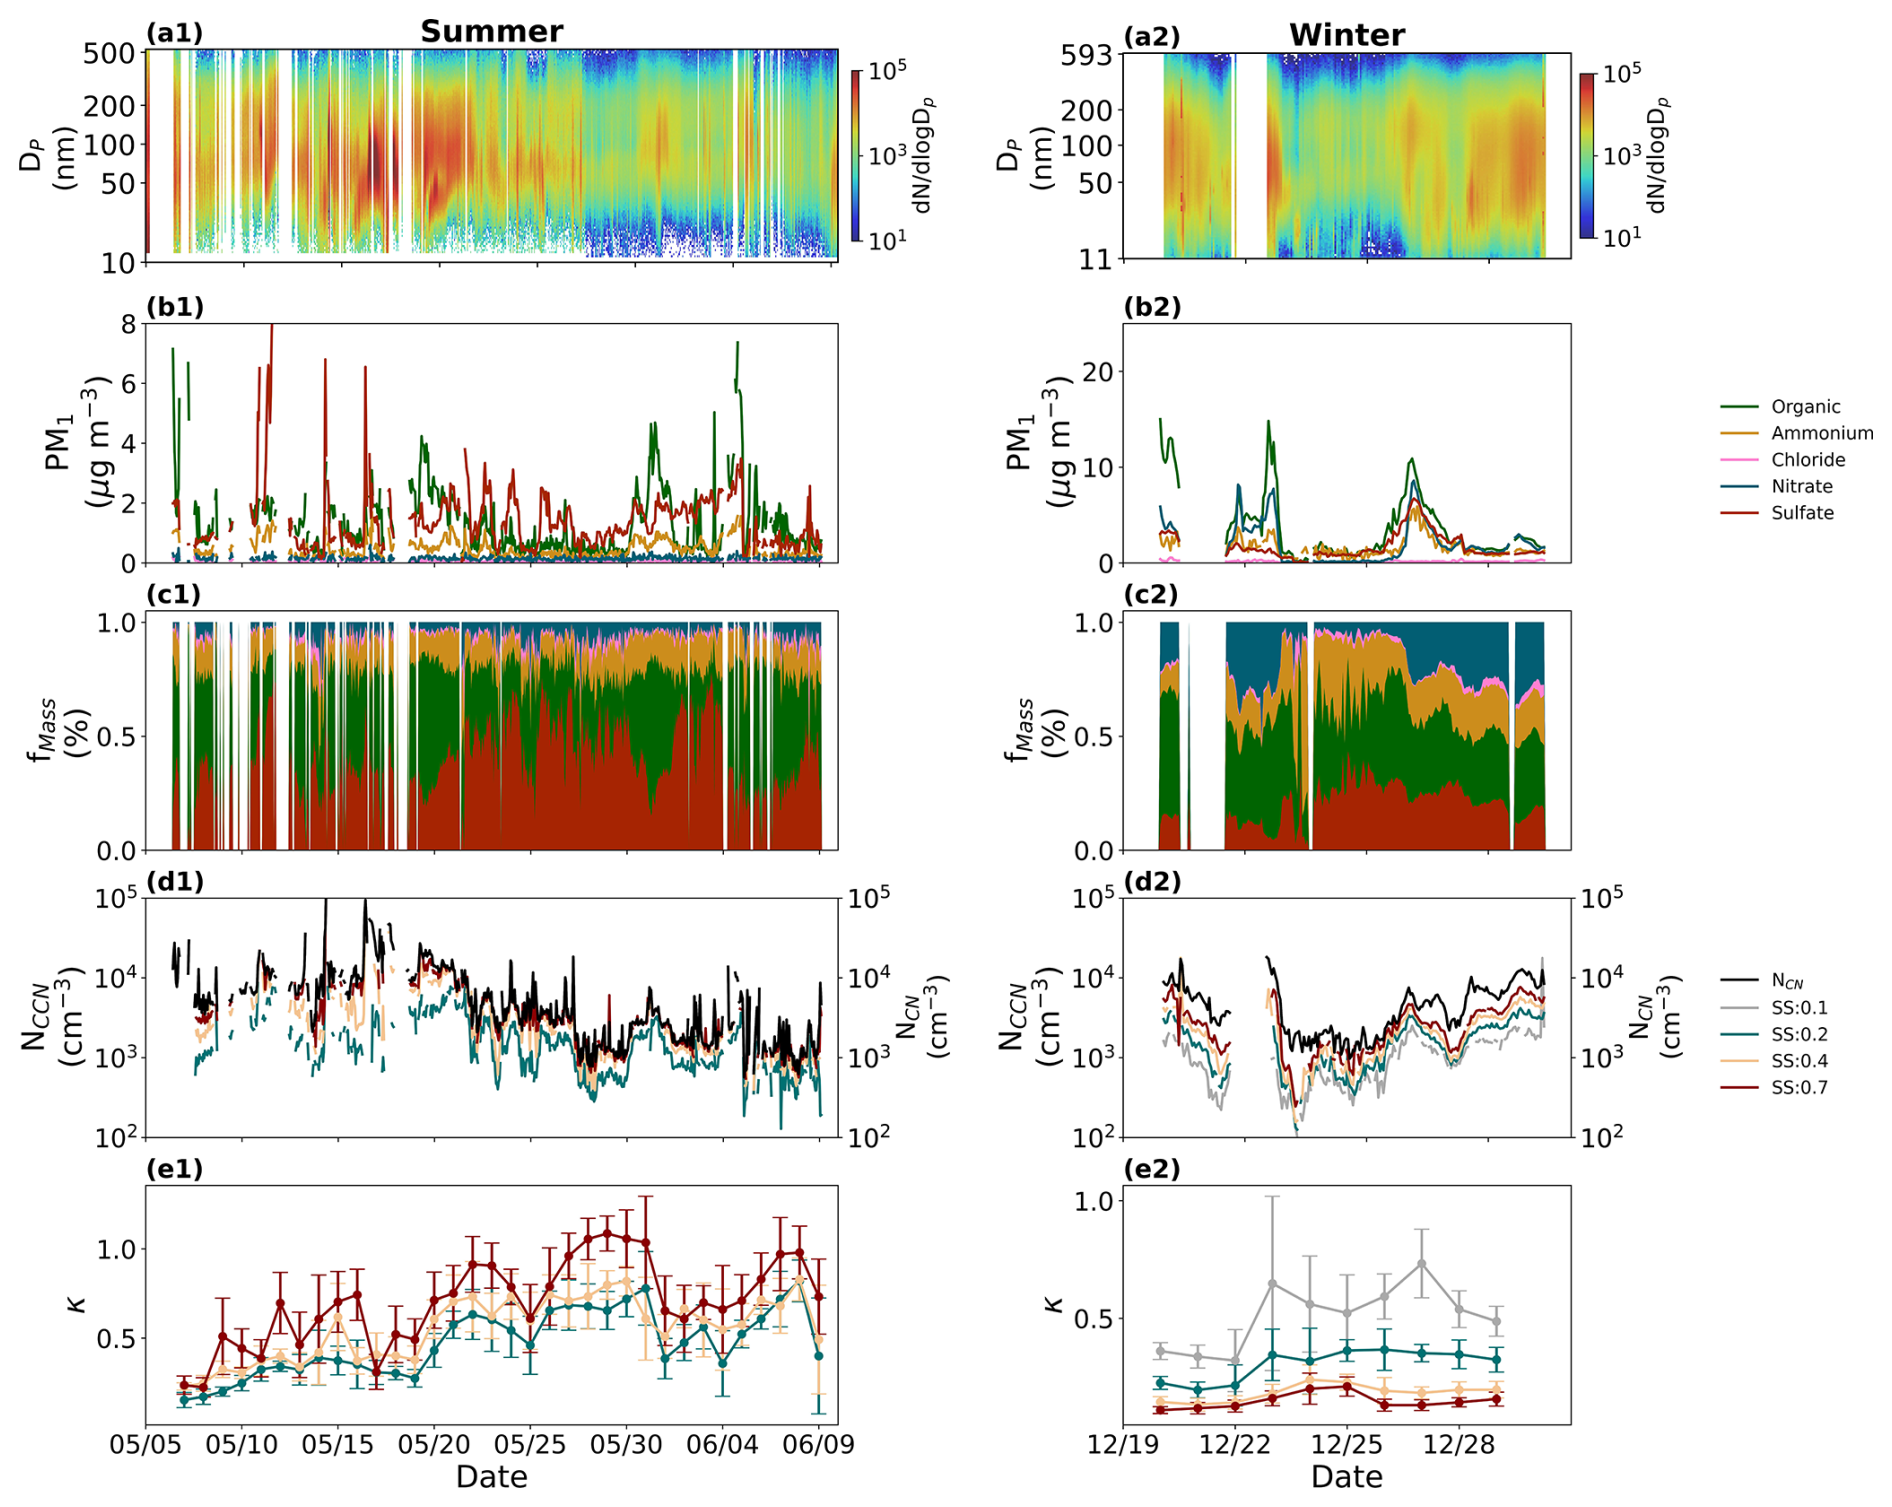
Figure 2Time series of (a) particle number size distribution; (b) mass concentration of NR-PM1; (c) the mass fraction; (d) total particle number concentration and cloud condensation nuclei number contribution under supersaturation of 0.1 %, 0.2 %, 0.4 %, and 0.7 %; and (e) aerosol hygroscopicity. The number 1 in panel labels means time series in summer, and number 2 means time series in winter.
The average particle number concentration in summer (6966 cm−3) was higher than in winter (4988 cm−3), primarily due to the higher number concentration of Aitken-mode particles in summer (Fig. 3a–b). In summer, particles were concentrated in smaller sizes, whereas in winter, particle size distribution was relatively balanced between the Aitken mode (2185 cm−3) and the accumulation mode (2176 cm−3) (Fig. 3a–b).
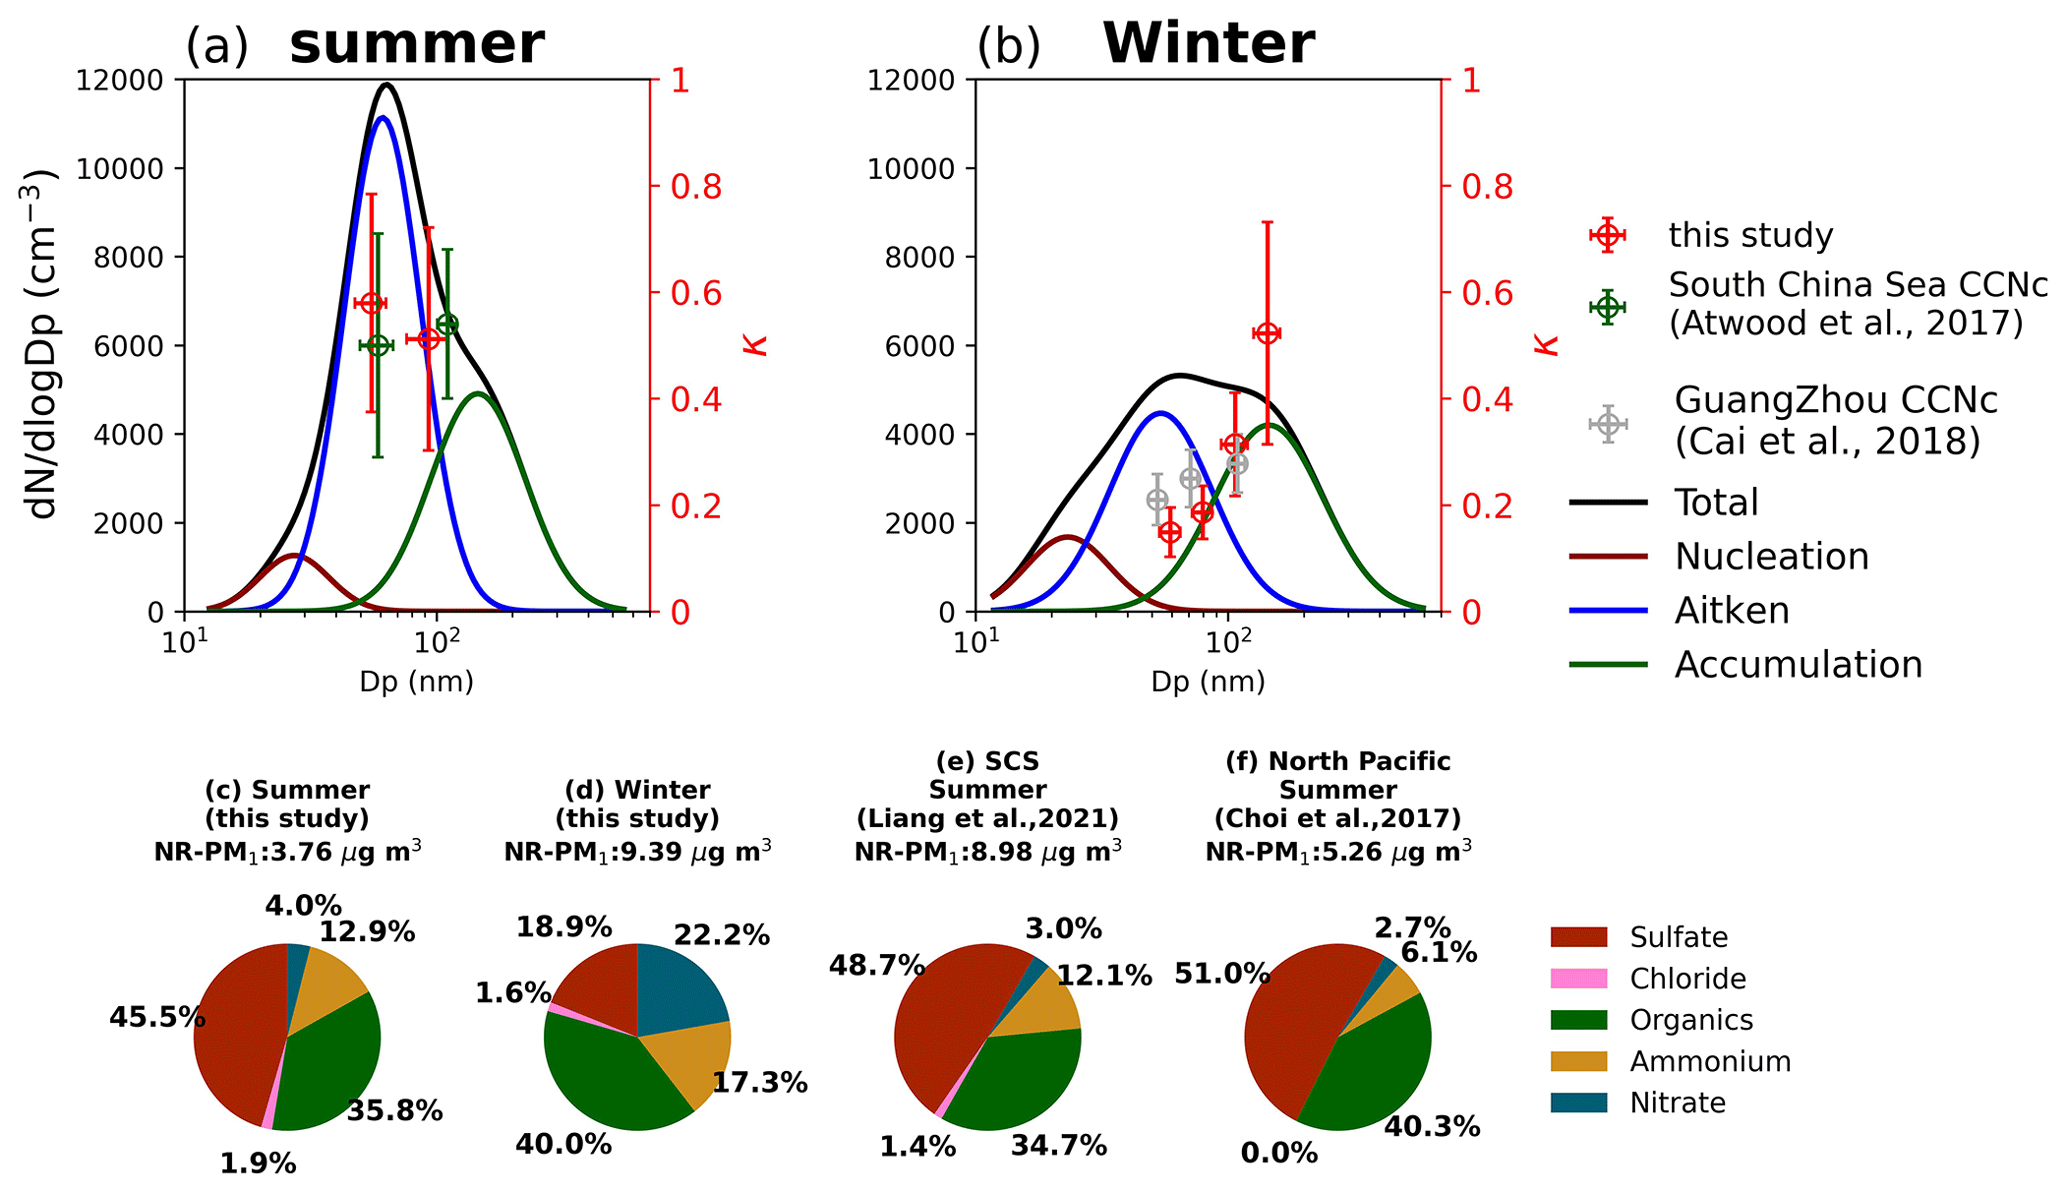
Figure 3Particle number size distribution in summer (a) and winter (b). The red markers represent the activation diameters and hygroscopicity parameters corresponding to 0.1 %, 0.2 %, 0.4 %, and 0.7 % supersaturations in this study (without 0.1 % in summer). The green markers represent the hygroscopicity parameters reported in Atwood et al. (2017) for the southern South China Sea during summer. The gray markers represent the hygroscopicity parameters documented in Cai et al. (2018) for the Pearl River Delta region during winter. The fraction of NR-PM1 in summer (c) and winter (d) in this study, in the northern SCS reported by Liang et al. (2021) (e), and in the North Pacific reported by Choi et al. (2017) (f).
The average mass concentration of NR-PM1 was 3.76 µg m−3 in summer and increased to 9.39 µg m−3 in winter (Fig. 3c–d). In summer, the dominant aerosol component was sulfate (45.5 %), followed by organics (35.8 %), ammonium (12.9 %), nitrate (4.0 %), and chloride (1.9 %) (Fig. 3c), similar to the pattern observed in the northern SCS during the summer of 2018 (Fig. 3e) (Liang et al., 2021). However, in winter, organics became the predominant aerosol component (37 %), with nitrate (22.2 %) replacing sulfate (18.9 %) as the highest proportion of inorganic components (Fig. 3d). Although NCN was higher in summer than in winter, the particle volume size distribution indicates that a higher fraction of particles was concentrated in larger size in winter, which significantly influenced mass concentration, resulting in a higher NR-PM1 concentration (Fig. S16).
The average number concentration of cloud condensation nuclei (NCCN) in summer was higher than in winter at all supersaturation (SS) levels (Table 1). The ratio of NCCN between summer and winter was smaller at high SS ( and 0.54 at 0.4 % SS and 0.7 % SS, respectively) compared to low SS ( at 0.2 % SS), likely due to the significant difference in number concentration of Aitken-mode particles between the two seasons (Fig. 3a–b). Compared to the observation in the Yellow Sea, a region similarly influenced by terrestrial air masses from mainland China, the NCCN values were lower in winter, while in summer, the NCCN values were more comparable to those observed in the Yellow Sea (4821 cm−3 at 0.63 % SS) (Park et al., 2018).
The aerosol hygroscopicity (κ) was higher in summer than in winter (Table 1). In addition, the hygroscopicity pattern varied between seasons: in summer, κ increased with SS (from 0.47 to 0.54 between 0.2 % SS and 0.4 % SS), while in winter, κ decreased with SS (from 0.50 to 0.15 between 0.1 % SS and 0.7 % SS) (Fig. 3a–b). This contrasting trend may be related to the reduced sulfate fraction in smaller sizes during winter, as sulfate production via DMS oxidation is diminished due to lower sea surface temperatures in winter (18.0 °C) compared to summer (29.3 °C), which in turn inhibits DMS production by phytoplankton (Bates et al., 1987; Kouvarakis and Mihalopoulos, 2002). Additionally, it could be linked to the mixing state of the particles, with further discussion provided in the following sections. The winter κ pattern was similar to observations in the western North Pacific (Table 1) (Kawana et al., 2022). Additionally, the winter κ values were comparable to those in Guangzhou (Cai et al., 2020), adjacent to the SCS, indicating that the northern SCS is influenced by air masses from mainland China under the significant influence of the Northeast Monsoon during winter.
3.2 Anthropogenic influence on CCN concentration in different seasons
Cluster analysis revealed distinct periods influenced by various air masses. In summer, three terrestrial air mass sources were identified: Luzon Island (hereafter referred to as Luzon), Palawan Island, and the Indochinese Peninsula, along with a marine air mass source (Fig. 4a). Given the limited influence of air masses from Palawan Island, this period was excluded from the study. Consequently, the study focused on periods dominated by air masses from Luzon (“Luzon period”), the Indochinese Peninsula (“Indochinese Peninsula” period), and marine sources (“Marine-s” period). In winter, the air mass sources included mainland China (hereafter “Mainland China” period), a mixture of mainland China and the South China Sea (referred to as “Mixed”), and a marine source (“Marine-w” period) (Fig. 4b).
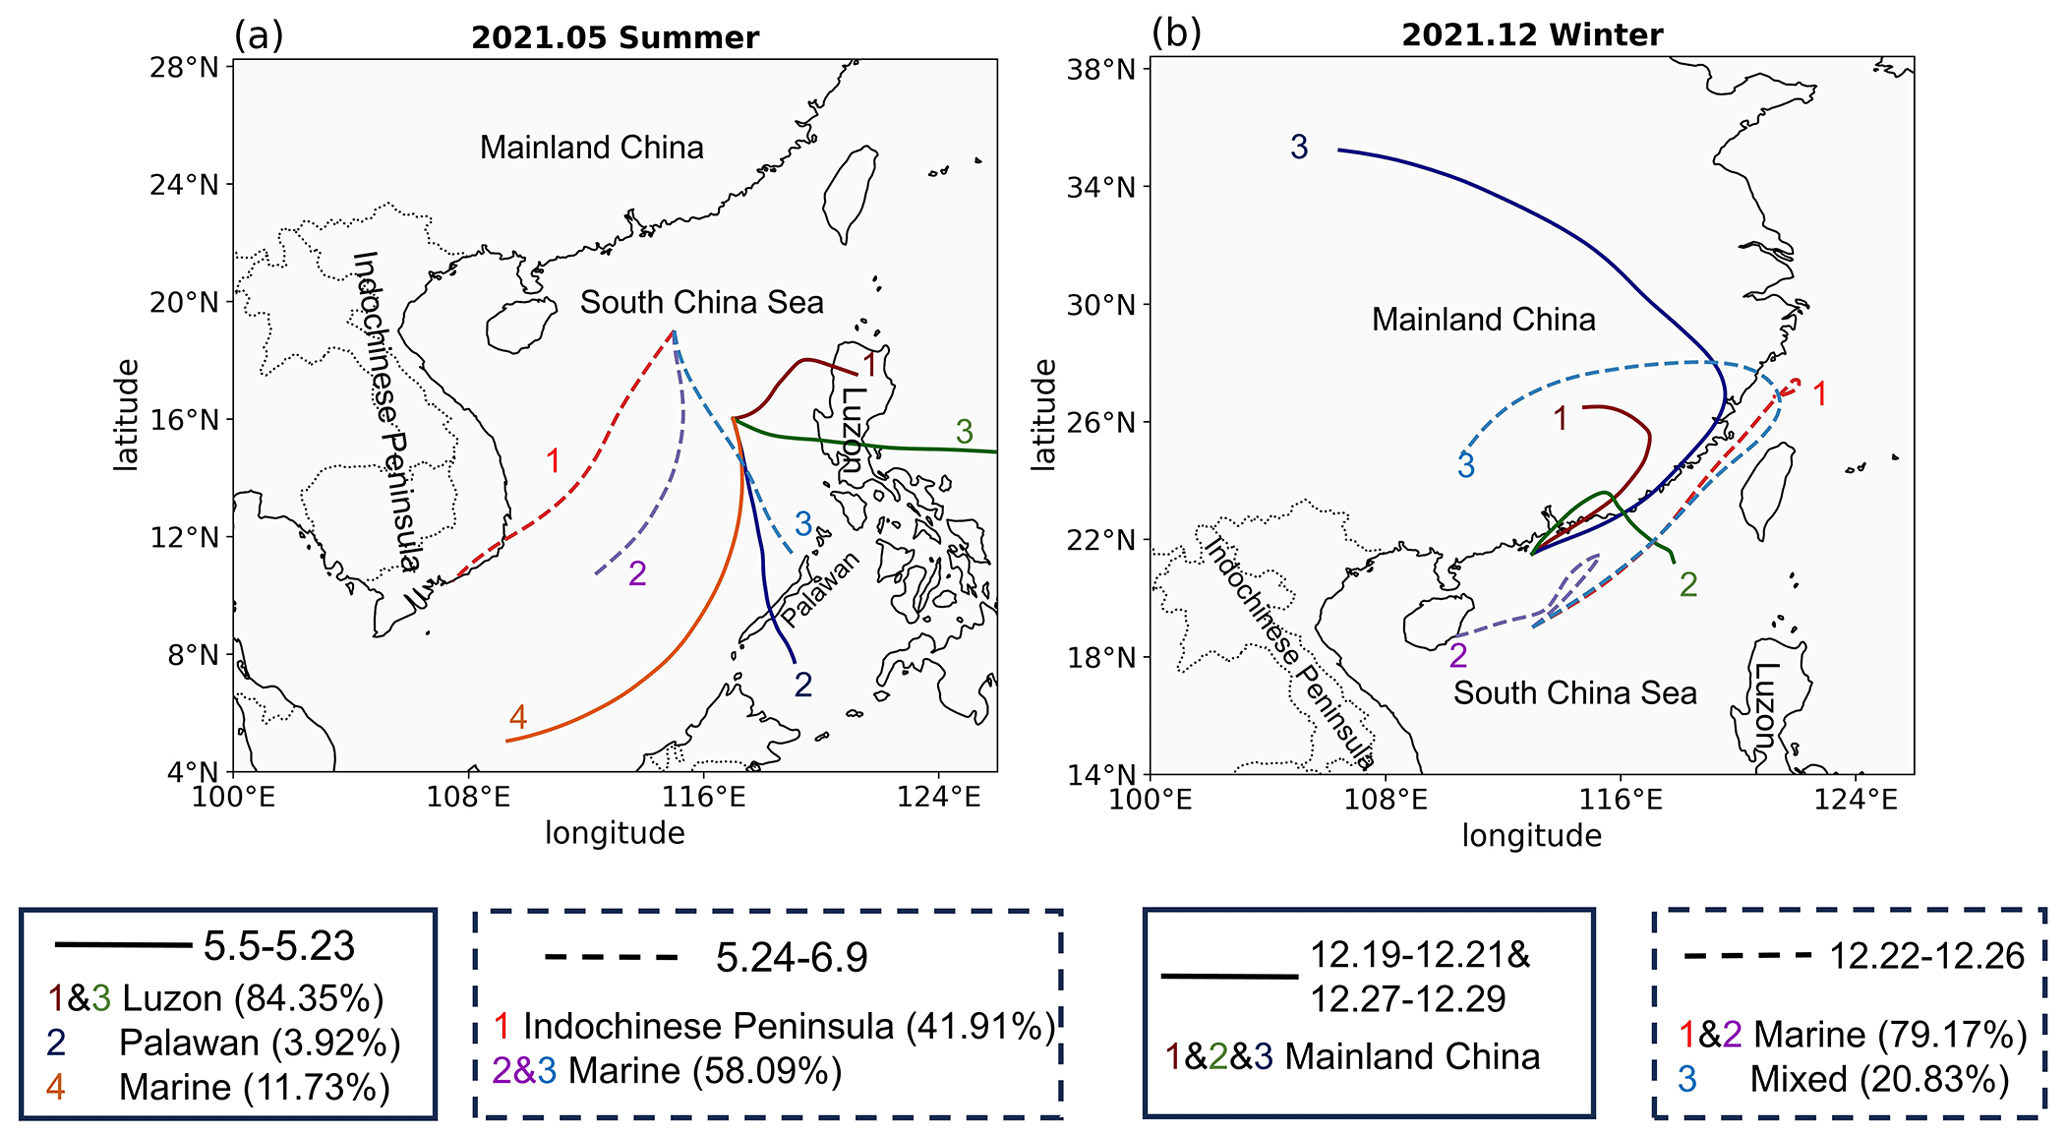
Figure 4The cluster analysis results in summer (a) and winter (b). The solid line in summer means cluster analysis from 5 to 24 May and the dashed line in summer means cluster analysis from 25 May to 9 June. The solid line in winter means cluster analysis from 19 to 21 December and 27 to 29 December, and the dashed line in winter means cluster analysis from 22 to 26 December.
As shown in Fig. 5, terrestrial air masses could significantly affect the aerosol chemical composition in the SCS, resulting in higher NR-PM1 mass concentration and a higher fraction of organic compounds compared to those influenced by marine air masses. Additionally, the particles number concentration in the accumulation mode and the NCCN at low supersaturation (SS) were higher during periods influenced by terrestrial air masses (Luzon period) than those during marine air mass periods (Table 2). Notably, we were able to obtain an accurate D50 at 0.7 % supersaturation only during the Luzon period in summer. Due to the relatively lower hygroscopicity compared to other summer periods, the corresponding D50 at 0.7 % SS ranged between 40 and 60 nm, with a relatively high NCN,tot and CCN (Fig. S7), allowing for a more precise measurement of D50. As a result, the κ at 0.7 % SS shown in Fig. 7 was specific to the Luzon period in summer.
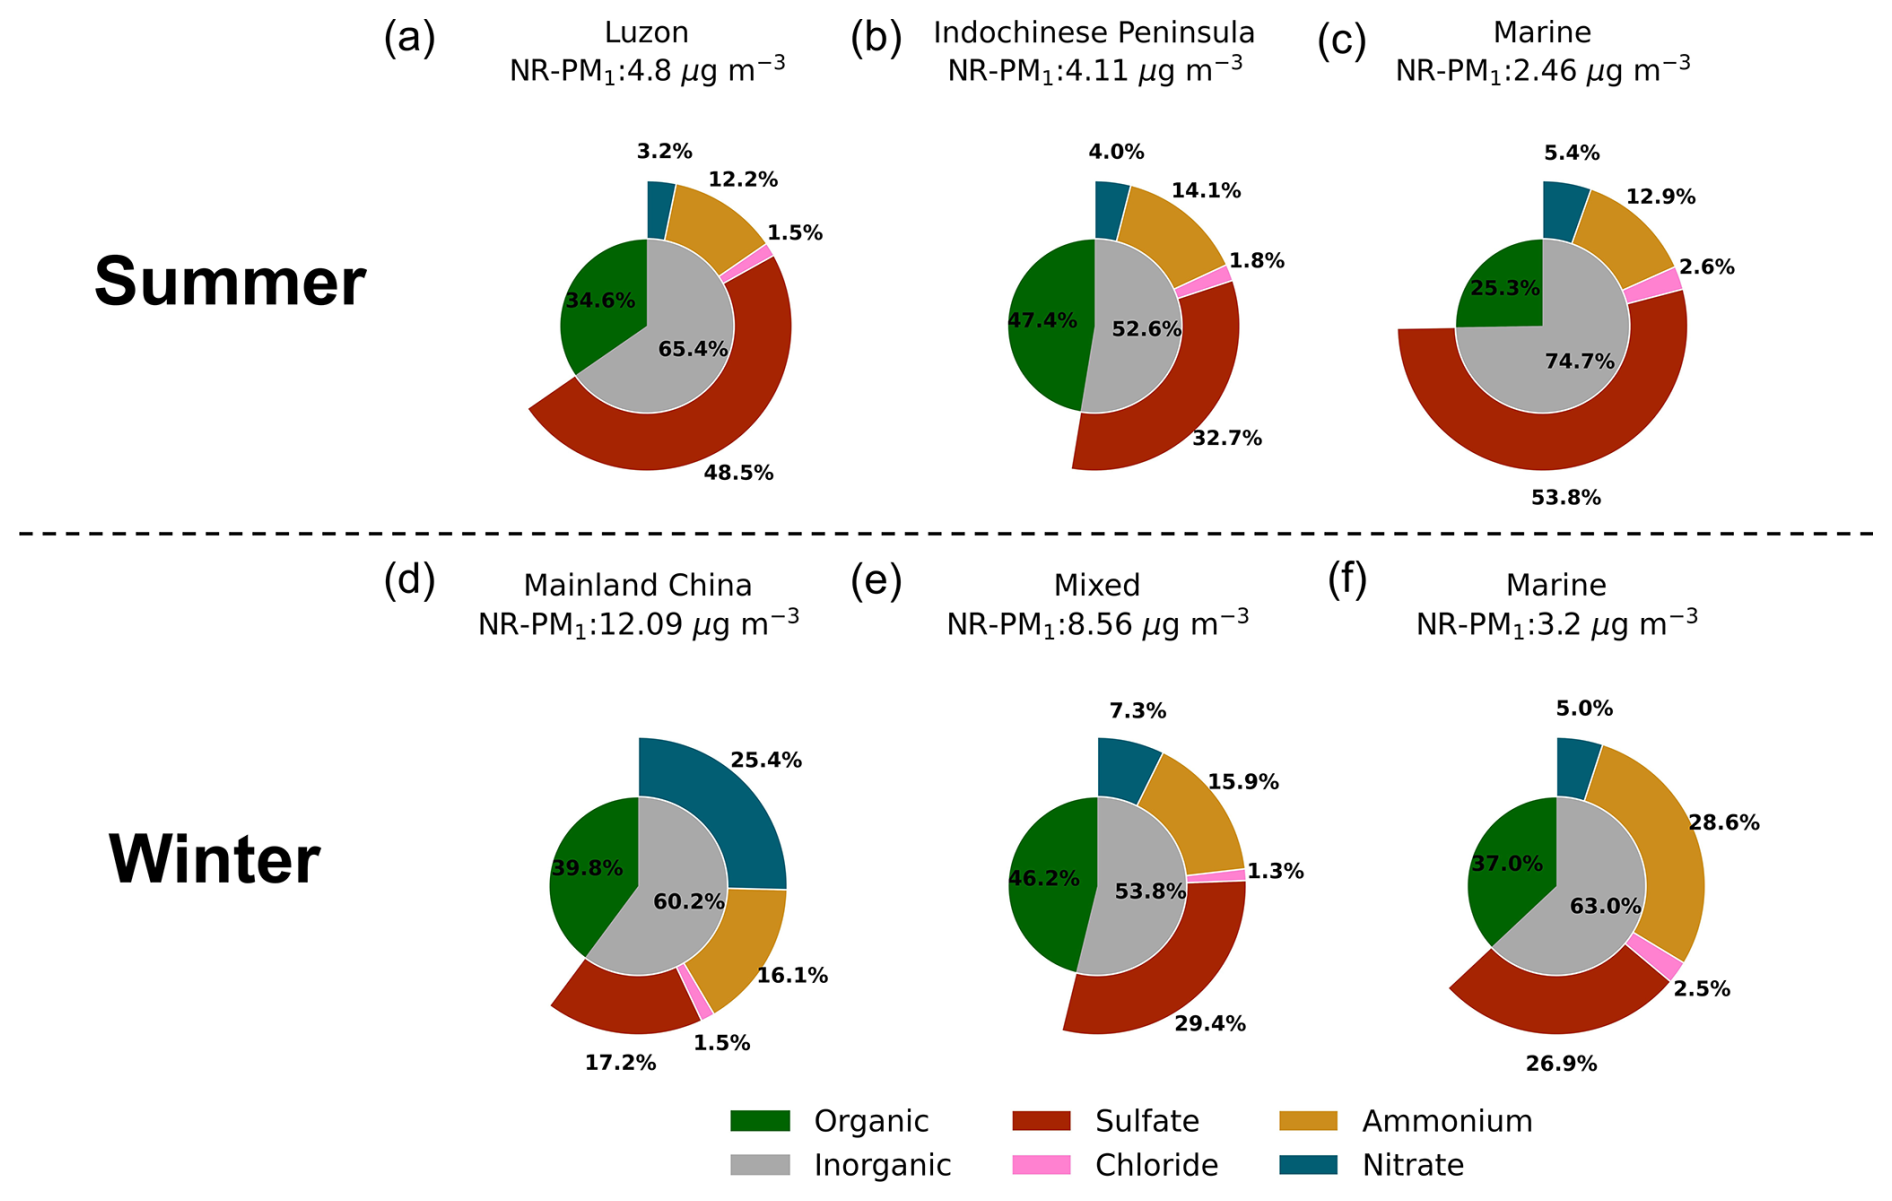
Figure 5The fraction of NR-PM1 in the Luzon period (a), the Indochinese Peninsula period (b), and the Marine-s period (c) in summer. The fraction of NR-PM1 in the Mainland China period (d), the Mixed period (e), and the Marine-w period (f) in winter.
Table 2The particle number concentration, cloud condensation nuclei number concentration, and the bulk activation ratio in different periods.
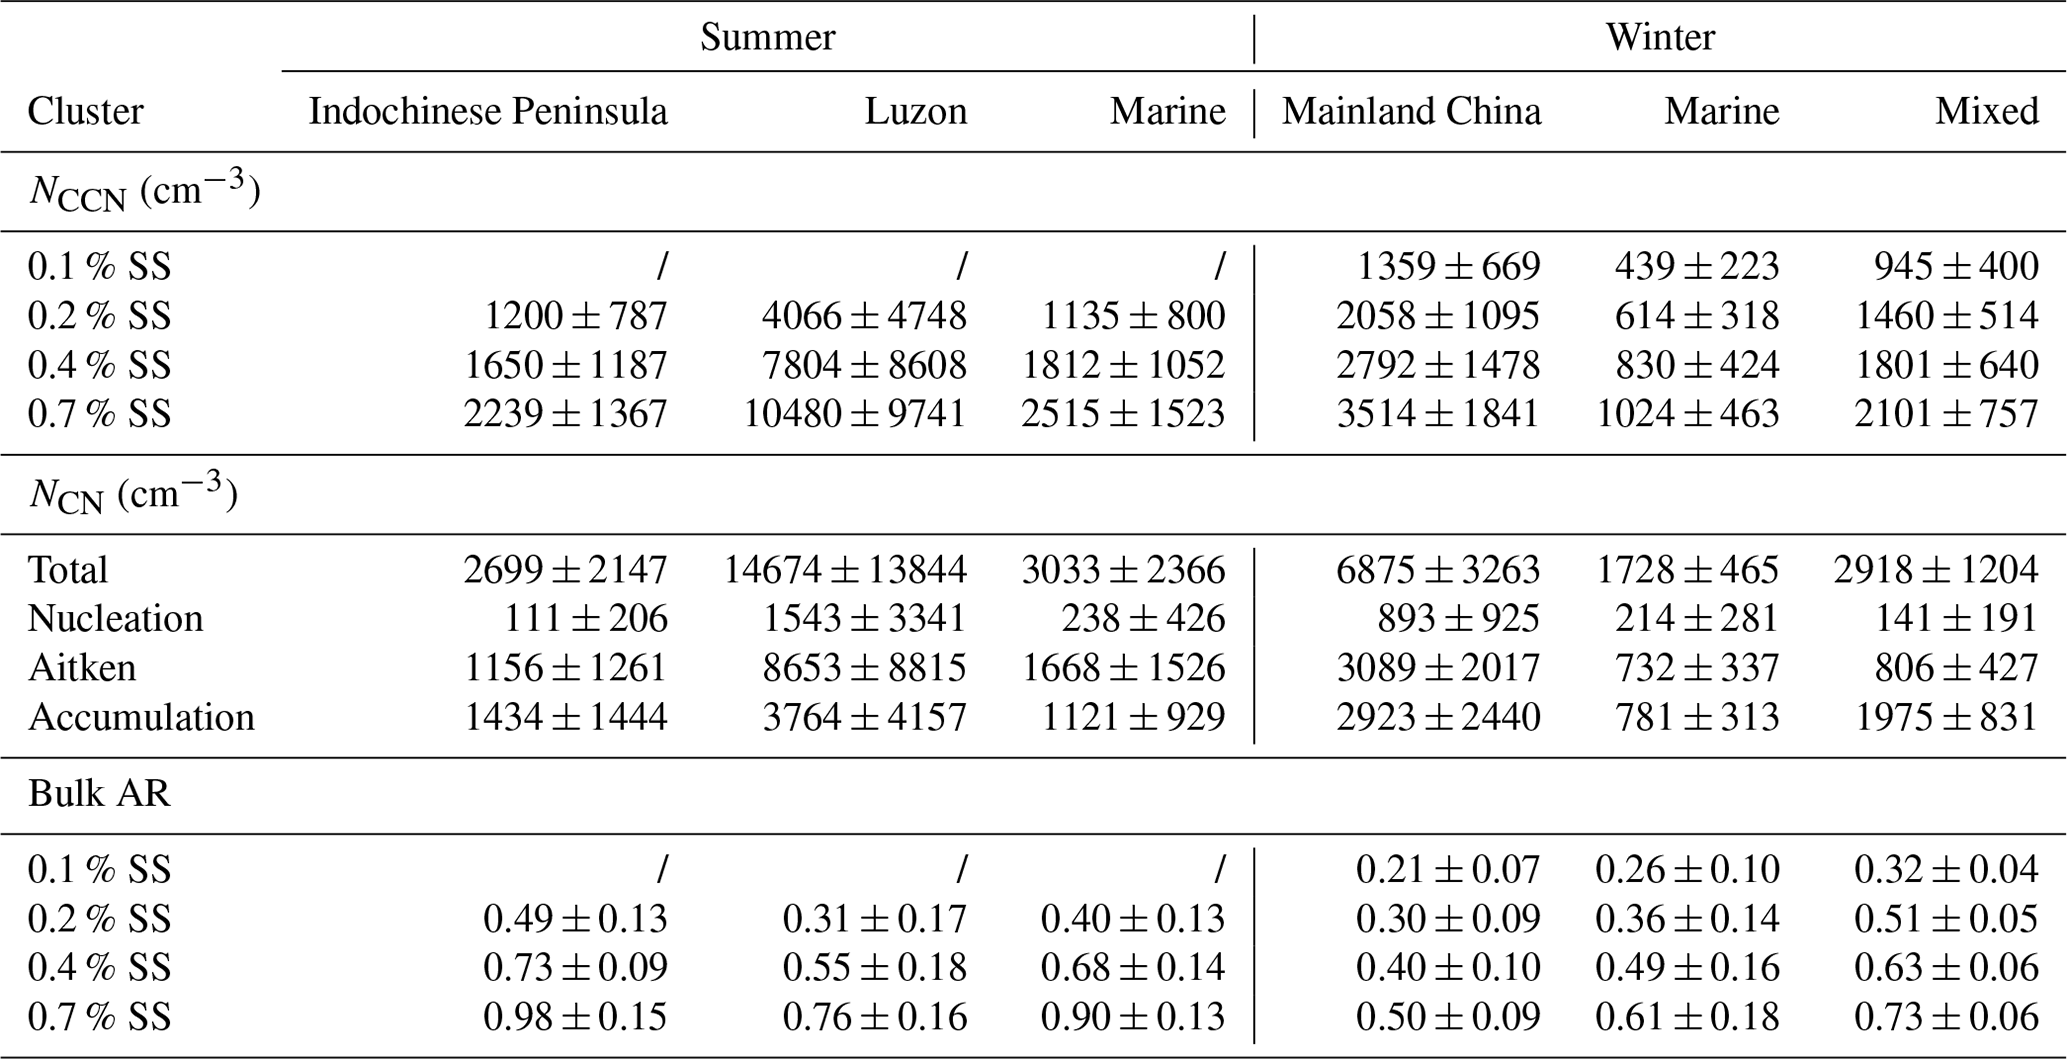
In summer, the Luzon period exhibited the highest NCN, attributed to the elevated particle concentration in the Aitken mode, compared to all other periods in both summer and winter (Fig. 6a and Table 1). This high fraction of Aitken-mode particles led to the lowest bulk AR among the summer periods (Fig. 7a), as a larger fraction of particles were centered on a size range lower than the D50 (Fig. 7b). Furthermore, the prevalence of a higher fraction of Aitken-mode particles during terrestrial air mass periods is commonly correlated with the influence of fresh anthropogenic emissions (Beddows et al., 2015), which could lower the hygroscopicity and consequently suppress the bulk AR.
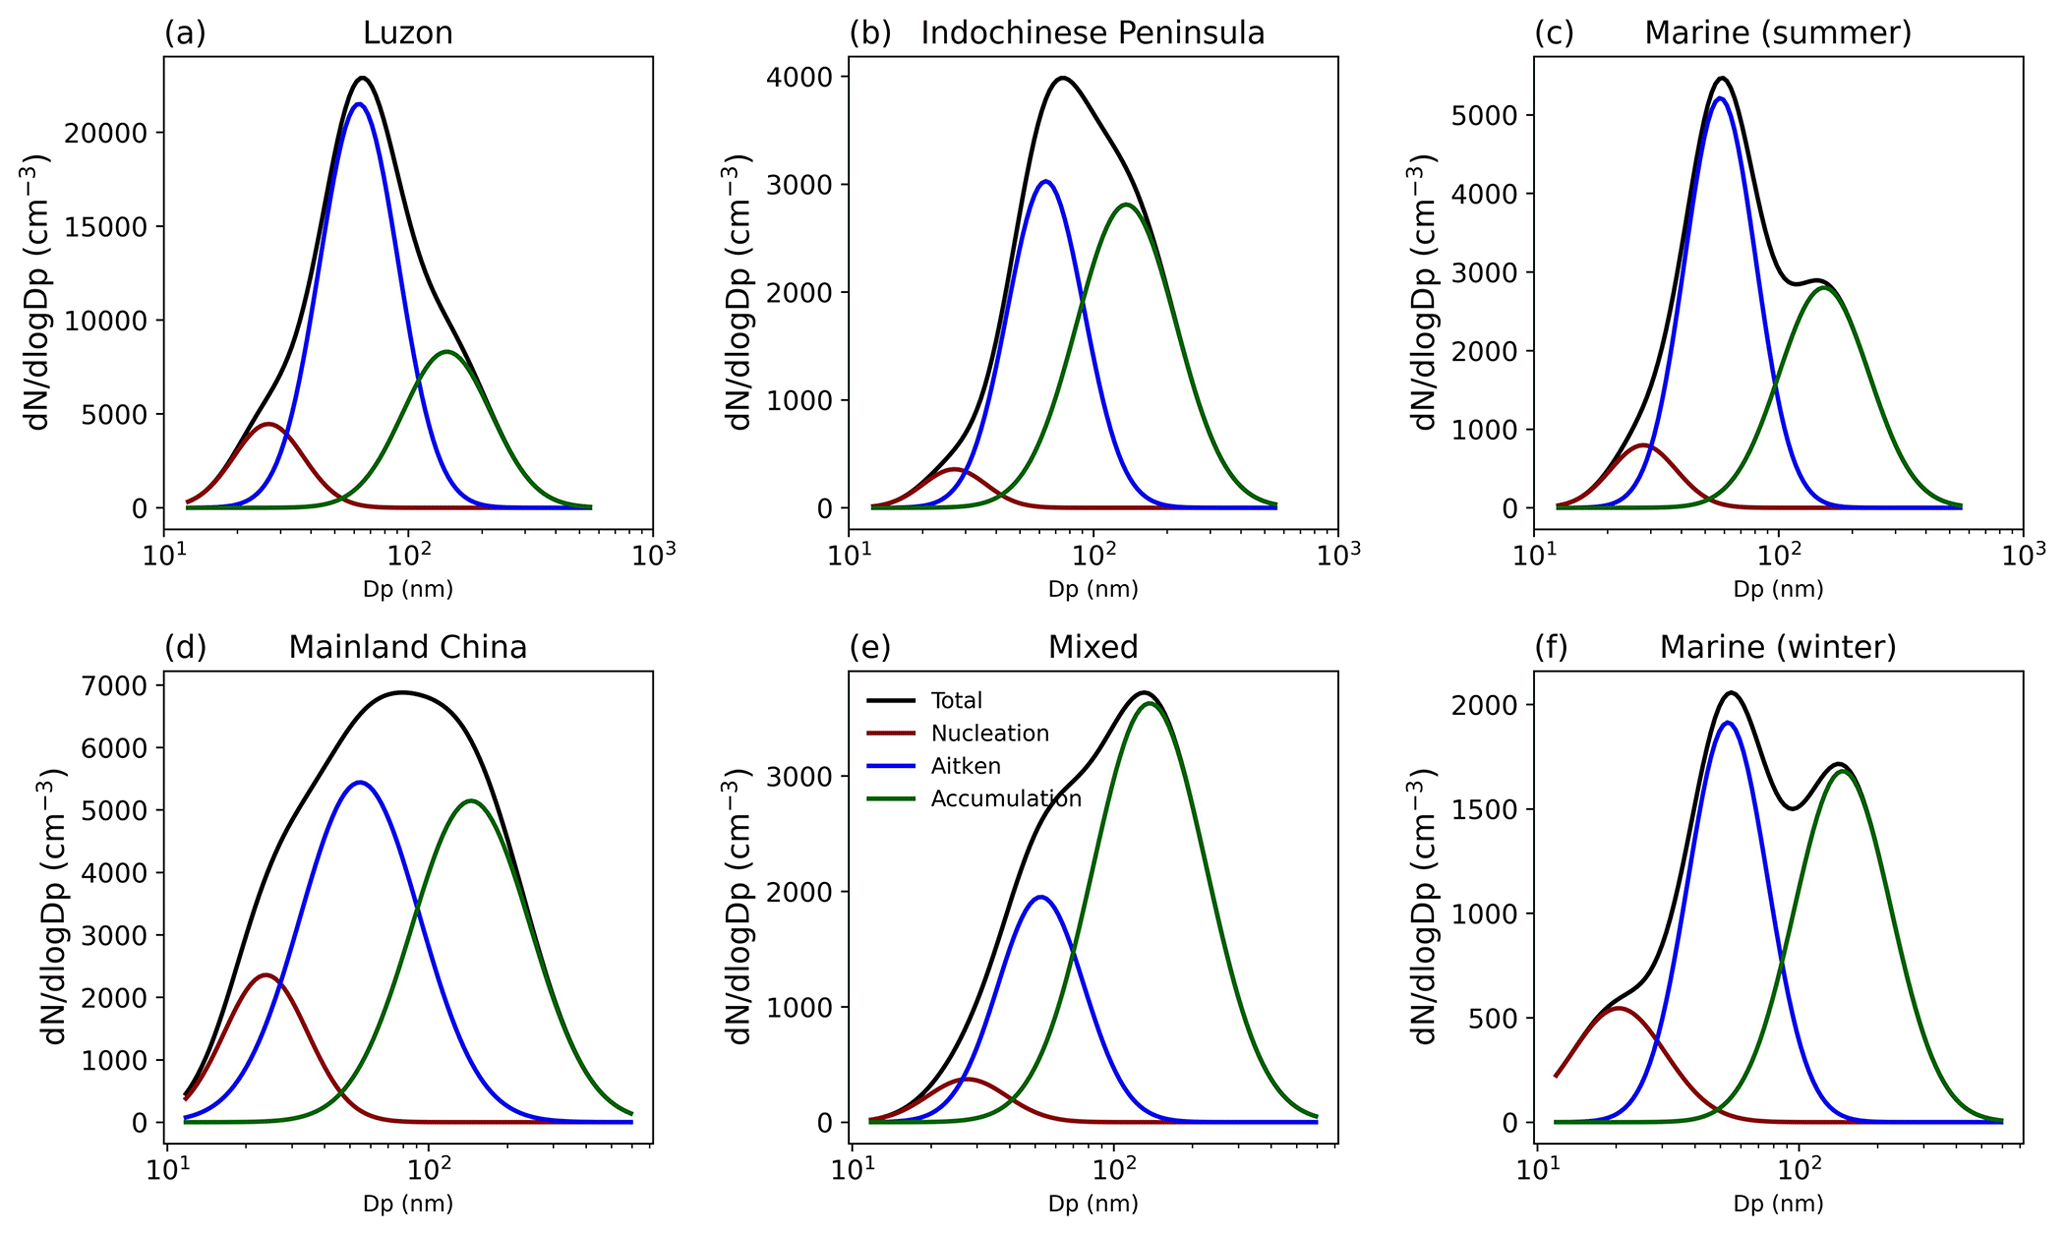
Figure 6The particle number size distribution (PNSD) in the Luzon period (a), the Indochinese Peninsula period (b), and the Marine-s period (c) in summer. The PNSD in the Mainland China period (d), the Mixed period (e), and the Marine-w period (f) in winter.
Figure 7The bulk activation ratio (AR) at different supersaturation (SS) in different periods (a). The aerosol hygroscopicity (κ) at different supersaturation (SS) in different periods (b).
In the Indochinese Peninsula period, the NCN was lower than in the Marine-s period (Table 2). This difference was mainly due to the variation of Aitken-mode particles, while accumulation-mode particles were higher during the Indochinese Peninsula period than in the Marine-s period (Table 2). The Marine-s period primarily occurred during the transition phase before the onset of summer monsoon, when wind direction shifted from the east (Luzon direction) to the southwest (Indochinese Peninsula direction). Anthropogenic emissions from Luzon still affected the marine atmosphere, leading to higher concentrations of Aitken-mode particles compared to the Indochinese Peninsula period (Table 2). The higher fraction of accumulation-mode particles and higher hygroscopicity during the Indochinese Peninsula period resulted in a higher bulk AR compared to the Luzon period. Despite a higher organic fraction in NR-PM1 during the Indochinese Peninsula period (Fig. 5), hygroscopicity was still higher due to a higher oxidation degree of organics, indicated by a higher 44 to 43 ratio (5.87 compared to 5.60 in the Luzon period) (Lambe et al., 2011; Jimenez et al., 2009). Additionally, higher wind speeds during this period (7.26 m s−1 compared to 3.18 m s−1 in the Luzon period) potentially led a higher fraction of sea salt (Huang et al., 2022), resulting in a higher aerosol hygroscopicity. Unfortunately, owing to instrument limits, sea salt cannot be detected by the ToF-ACSM.
In winter, nitrate accounted for the highest fraction of NR-PM1 (25.4 %) during the Mainland China period compared to other periods (Fig. 5d). Due to similar hygroscopicity between nitrate and sulfate, as well as comparable inorganic fractions between the Mainland China and Luzon periods, κ at 0.2 % SS was also similar between these two periods (0.30 and 0.33, respectively) (Fig. 7b). However, aerosol hygroscopicity at small sizes (high SS) was much lower in the Mainland China period than in the Luzon period (Fig. 7b), contributing to the low bulk AR in the Mainland China period (Fig. 7a). The BC mass concentration was higher during the Mainland China period (2.25 µg m−3) compared to the Luzon period (0.72 µg m−3). This suggests that the lower hygroscopicity in smaller particles during the Mainland China period may be attributed to a larger fraction of hydrophobic BC. Additionally, as discussed in Sect. 3.1, the reduced biological activity during winter, which results in a decline in the fraction of small-particle sulfate and an increase in the fraction of organics, may also contribute to this low hygroscopicity in small particles (at high SS, Fig. 7b). The similar fractions of Aitken-mode and accumulation particles indicated that PNSD could not fully explain the low bulk AR in the Mainland China period. Overall, lower NCN and bulk AR in the Mainland China period compared to the Luzon period resulted in a lower NCCN.
During the Mixed period, NCCN was lower than in the Mainland China period, which can be attributed to the decreased NCN (Table 2). However, accumulation-mode particles dominated, unlike in other terrestrial air mass periods (Fig. 6), resulting in a significantly higher bulk AR compared to the Mainland China period. Organic aerosol hygroscopicity was also higher during the Mixed period, supported by a higher 44 to 43 ratio (3.88 vs. 3.10 in the Mainland China period), which explains the greater hygroscopicity despite a higher organic fraction in NR-PM1. Additionally, the lower BC concentration in the Mixed period (1.20 µg m−3 vs. 2.25 µg m−3in the Mainland China period) suggests a smaller BC fraction. Moreover, the higher wind speeds during the Mixed period (10.77 m s−1 vs. 7.14 m s−1 in the Mainland China period) could have increased the sea salt fraction, further enhancing aerosol hygroscopicity.
3.3 CCN closure analysis
The CCN closure method is a widely used approach that connects CCN activity with aerosol chemical composition (Cai et al., 2018; Meng et al., 2014; Deng et al., 2013). Studies have demonstrated that the aerosol mixing state is crucial for accurately parameterizing CCN activity (Su et al., 2010; Wang et al., 2010; Ervens et al., 2010). Moreover, the CCN closure method provides a framework for investigating the influence of aerosol mixing states on CCN activity (Padró et al., 2012; Wang et al., 2018; Patel and Jiang, 2021). In this study, we applied two schemes based on the CCN closure method, as described in Sect. 2.2.3, which consider aerosol composition and mixing state. The fitting parameters and coefficient of determination (R2) are presented in Table 3, while the fitting plots for both schemes are shown in Figs. S17 and S18. In addition, the NMB from these schemes is presented in Fig. 8.
Table 3The slope and coefficient of determination (in parentheses) in CCN closure analysis at different supersaturations in different periods.
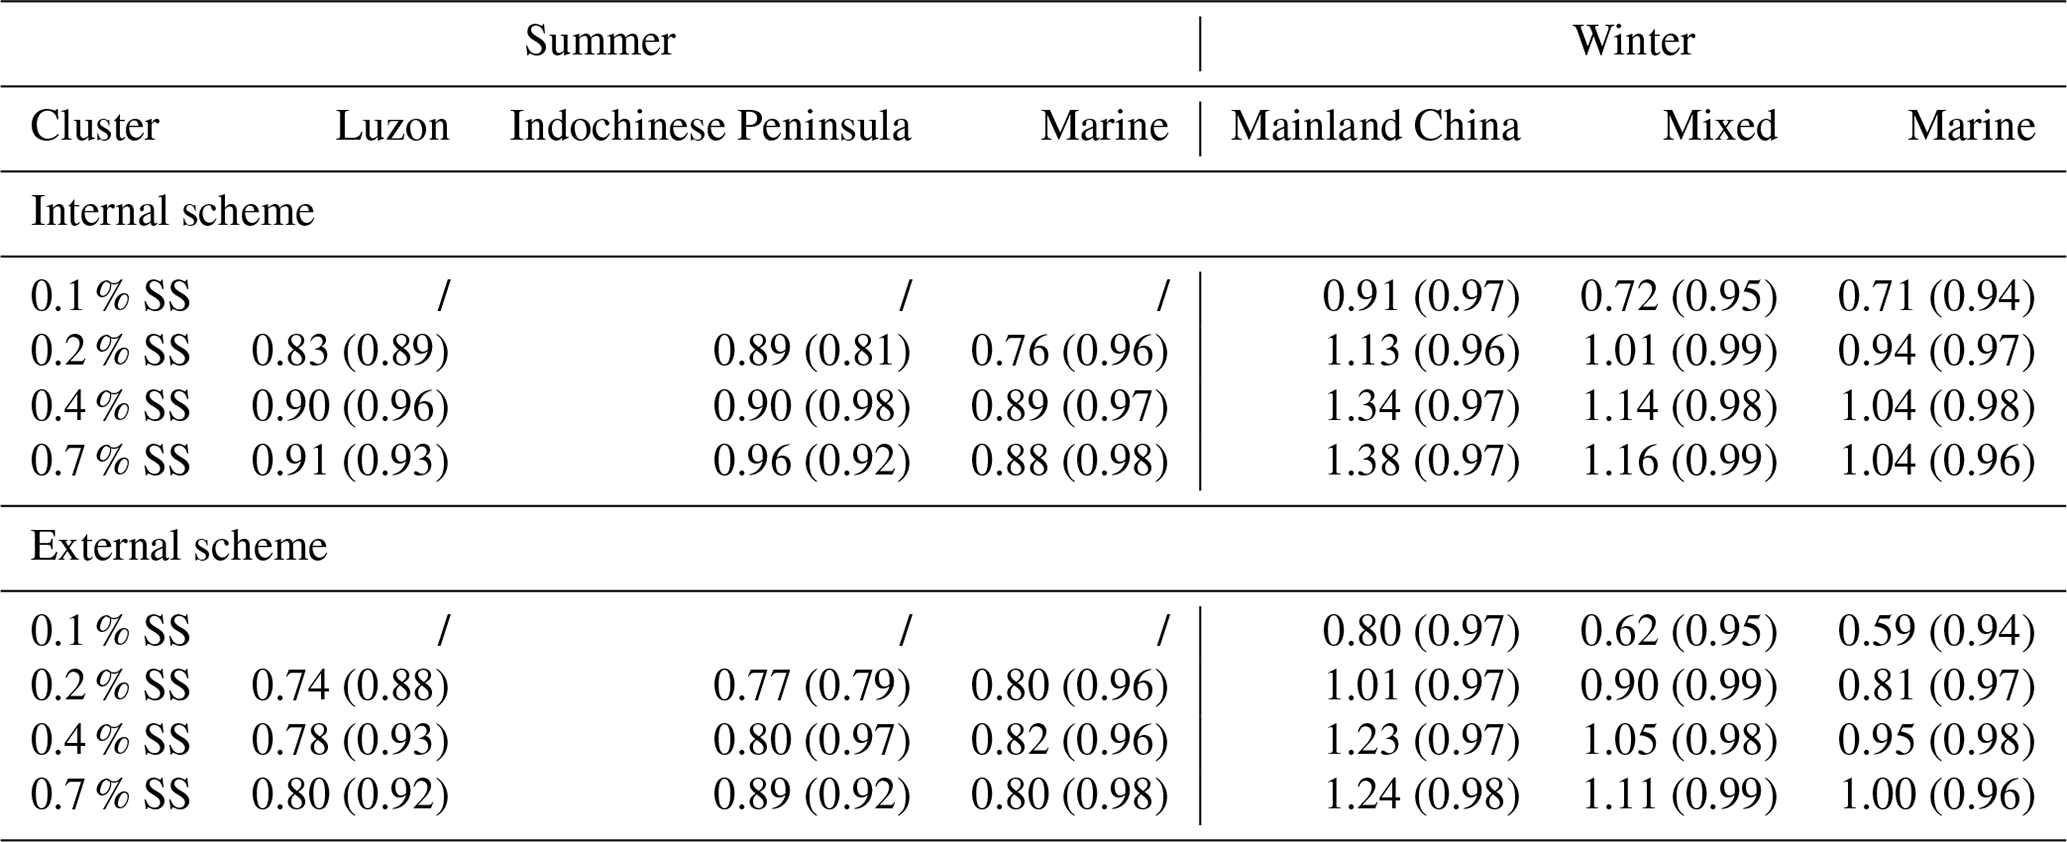
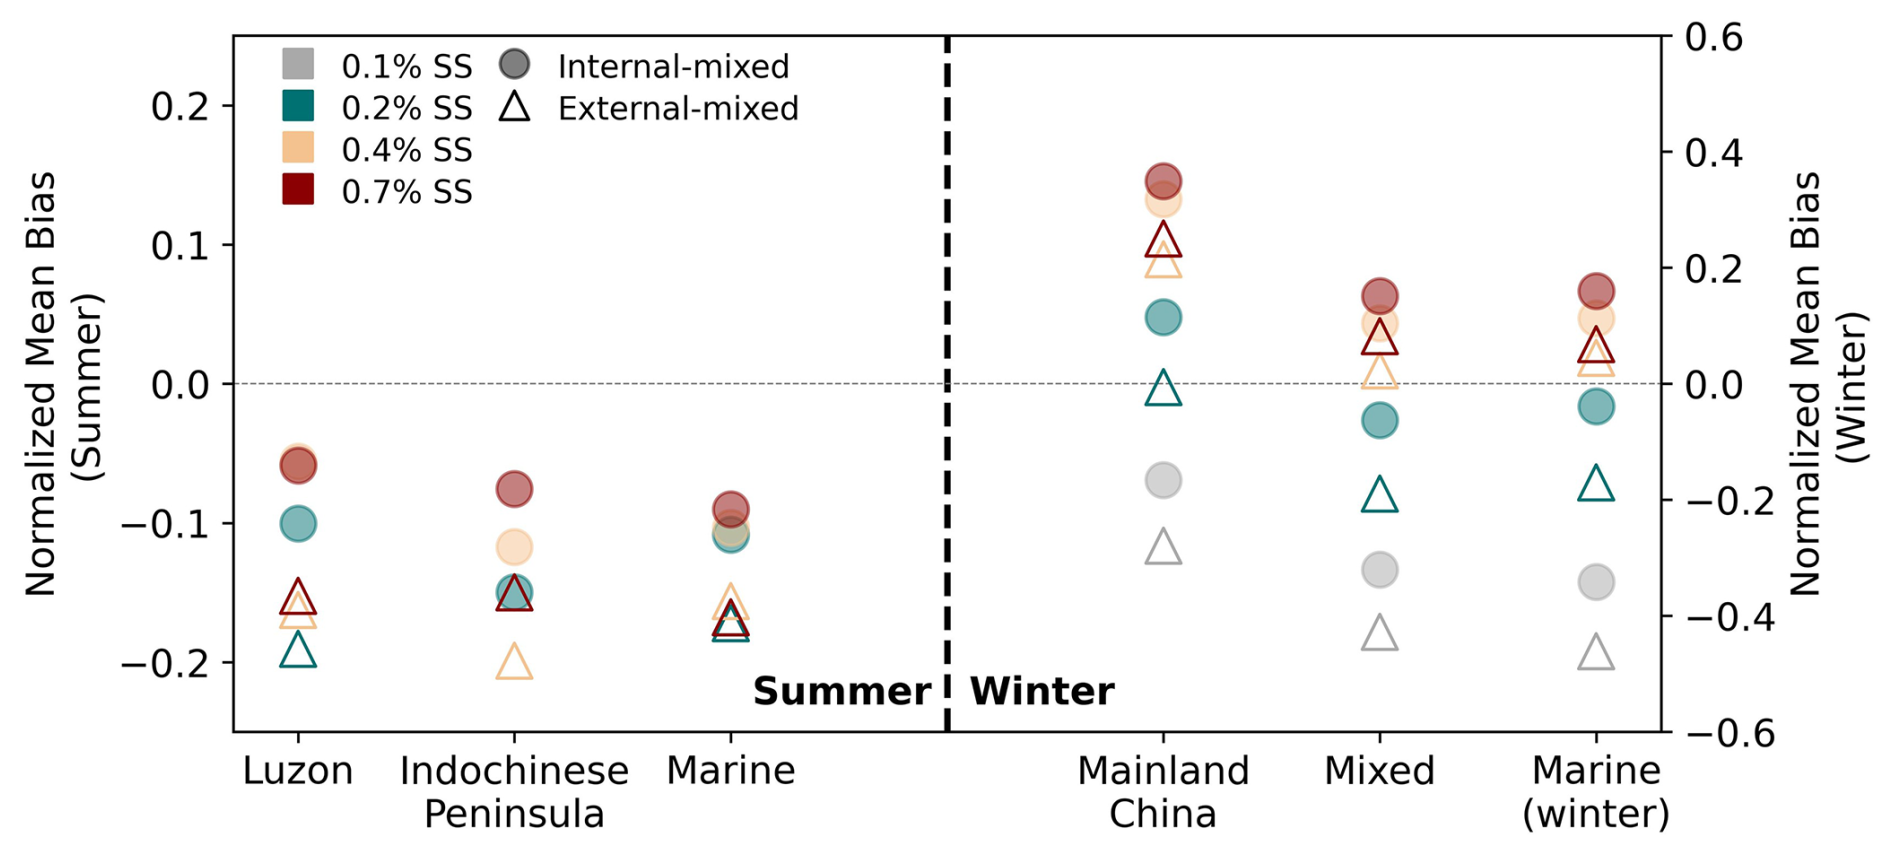
Figure 8The normalized mean bias (NMB) calculated by the internally mixed scheme and the externally mixed scheme according to CCN closure method. The circles denote the internally mixed scheme, and the triangles denote the externally mixed scheme. Different colors mean different supersaturations.
In summer, the NMB was always lower than 0, which indicated that simulated aerosol hygroscopicity was lower than observed values (Fig. 8). Sea salt, which cannot be detected by the ToF-ACSM, may account for a higher fraction in summer due to low aerosol concentration in summer (Fig. 3c), resulting in the underestimation of aerosol hygroscopicity. The NMB exhibits similar trends, with changes in SS in all three periods in summer. A better fitting result appeared at high SS, which indicated a greater underestimation of the hygroscopicity of larger particles. In addition, the internally mixed scheme had more accurate results than the externally mixed scheme in summer (Fig. 8), suggesting that the aerosol was primary internally mixed in summer.
In winter, the externally mixed scheme always showed a better result than the internally mixed scheme at high SS (0.4 % SS and 0.7 % SS), indicating that particles in small size were mainly externally mixed. Considering the low hygroscopicity of small-sized particles in winter, it is likely that a significant fraction of these particles consists of externally mixed BC, which probably originated from fresh anthropogenic emissions and remains unmixed with other inorganic salts and organics. As BC ages, inorganic and organic components adhere to it, which would lead to an increase in diameter and particles tending to be internally mixed (Sarangi et al., 2019). This transition resulted in higher hygroscopicity in large-sized particles compared to the smaller-sized particles. In addition, overestimation of aerosol hygroscopicity at high SS could be owing to a higher fraction of non- or less-hygroscopic components (such as organics and BC) at small particle sizes. The predicted NCCN at 0.1 % SS is 20 %–40 % lower than the observed concentrations, whereas the predictions at 0.2 % SS more closely match the observed values (Fig. 8). This discrepancy may be due to the higher fraction of sea salt in larger particles. However, due to instrumental limitations, the ToF-ACSM cannot detect BC and sea salt. Future observations including BC and sea salt are needed to better assess their effects on aerosol hygroscopicity in the South China Sea (SCS). In addition, further study of size-resolved aerosol composition can also enhance the understanding on CCN activity in the SCS.
In this study, we investigated the seasonal variations of cloud condensation nuclei (CCN) activity in the South China Sea (SCS) and explored the impact of anthropogenic emissions. Shipborne observations were conducted during the summer (5 May–9 June) and winter (19–29 December) of 2021. We measured CCN activity, chemical composition, and particle number size distribution (PNSD) using several onboard instruments, including a ToF-ACSM, a CCNc, an SMPS, and an AE33. Observations included periods before and after the summer monsoon onset and periods influenced by the winter monsoon.
Our results show that particle number concentration (NCN) and CCN number concentration (NCCN) were higher in summer than in winter, while the mass concentration of non-refractory submicron particulate matter (NR-PM1) was lower in summer. This difference is primarily attributed to the predominance of Aitken-mode particles in summer, contrasted with a higher concentration of accumulation-mode particles in winter. Additionally, aerosol hygroscopicity and bulk AR were found to be higher in summer than in winter.
Backward trajectory and cluster analyses identified distinct influences from various air masses. In summer, we identified periods affected by terrestrial air masses from Luzon Island (the Luzon period) and the former Indochinese Peninsula (the Indochinese Peninsula period), alongside a period influenced by marine air masses (the Marine-s period). In winter, the periods were influenced by terrestrial air masses from mainland China (the Mainland China period), a mix of mainland China and marine sources (the Mixed period), and marine air masses (the Marine-w period). Terrestrial air mass periods exhibited higher NR-PM1 mass concentrations, organic fractions, and NCCN, particularly at low supersaturation, compared to those influenced by marine air masses.
During the Luzon period, high NCCN was observed, attributed to high NCN, especially in the Aitken mode. This high concentration in the Aitken mode resulted in a low bulk AR at 0.2 % SS, indicating a higher fraction of primary organic aerosol with low hygroscopicity. This caused lower overall hygroscopicity compared to other summer periods. The lower ratio of 44 to 43 also suggested a lower oxidation degree of organics in this period. In the Indochinese Peninsula period, a higher fraction of the accumulation-mode particles compared to the Luzon period led to a higher bulk AR, combined with increased hygroscopicity.
In winter, the Mainland China period was characterized by a high nitrate fraction in the NR-PM1. The similar inorganic fractions in the NR-PM1 between the Mainland China and Luzon periods resulted in comparable aerosol hygroscopicity at low supersaturation (0.2 % SS). However, at higher supersaturation levels (0.4 % and 0.7 % SS), the Mainland China period demonstrated significantly lower hygroscopicity, which led to a reduced bulk AR at elevated supersaturation. During the Mixed period, accumulation-mode particles predominated, leading to a high bulk AR. This indicated an aging process during transport, with more oxidized organics and higher aerosol hygroscopicity. The lower black carbon (BC) fraction and the higher sea salt fraction from high wind speed contributed to higher hygroscopicity in the Mixed period compared to the Mainland China period, despite the high organic fraction.
The CCN closure analysis, considering aerosol composition and mixing state, revealed that aerosols in summer were primarily internally mixed, while in winter, small-sized aerosols were primarily externally mixed. This distinction is crucial for climate models predicting NCCN in the SCS. The underestimation of aerosol hygroscopicity in summer suggests that the effect of sea salt should be considered.
Our study highlights significant seasonal differences in CCN activity in the SCS and the influence of different types of terrestrial air masses. Future studies that include size-resolved aerosol composition and obtain more precise measurements of BC and sea salt are needed to better understand CCN activity in this region. Additionally, our observation in winter focused on the CCN activity over the northern SCS, while the influence of air masses from mainland China in the remote SCS was still unclear. Further observations in remote SCS areas could help clarify the anthropogenic influence during winter under the effect of the winter monsoon.
Data from the measurements are available at https://doi.org/10.6084/m9.figshare.25472545.v2 (Ou et al., 2024).
The supplement related to this article is available online at https://doi.org/10.5194/acp-25-2495-2025-supplement.
HO, MC, and JZ designed the research. YZ, XN, BL, and CS performed the measurements. HO, MC, QS, and SM analyzed the data. SZ and HW provided useful comments on the paper. HO, MC, and JZ wrote the paper with contributions from all co-authors.
The contact author has declared that none of the authors has any competing interests.
Publisher’s note: Copernicus Publications remains neutral with regard to jurisdictional claims made in the text, published maps, institutional affiliations, or any other geographical representation in this paper. While Copernicus Publications makes every effort to include appropriate place names, the final responsibility lies with the authors.
Additional support from the crew of the vessels Tan Kah Kee and Sun Yat-sen University is greatly acknowledged. We sincerely thank the reviewers and editors for their valuable suggestions during the review process, which have been instrumental in enhancing the quality of this paper. Lastly, we wish to honor the memory of Zhao Jun and express our heartfelt gratitude for his significant contributions to this work.
This work was supported by the National Natural Science Foundation of China (NSFC) (grant nos. 42305123 and 42175115) and the Guangdong Basic and Applied Basic Research Foundation (grant nos. 2023A1515012240 and 2024A1515030221).
This paper was edited by Armin Sorooshian and reviewed by five anonymous referees.
Ajith, T. C, Kompalli, S. K., and Babu, S. S.: Role of Aerosol Physicochemical Properties on Aerosol Hygroscopicity and Cloud Condensation Nuclei Activity in a Tropical Coastal Atmosphere, ACS Earth Space Chem., 6, 1527–1542, https://doi.org/10.1021/acsearthspacechem.2c00044, 2022.
Albrecht, B. A.: Aerosols, cloud microphysics, and fractional cloudiness, Science, 245, 1227–1230, https://doi.org/10.1126/science.245.4923.1227, 1989.
Atwood, S. A., Reid, J. S., Kreidenweis, S. M., Blake, D. R., Jonsson, H. H., Lagrosas, N. D., Xian, P., Reid, E. A., Sessions, W. R., and Simpas, J. B.: Size-resolved aerosol and cloud condensation nuclei (CCN) properties in the remote marine South China Sea – Part 1: Observations and source classification, Atmos. Chem. Phys., 17, 1105–1123, https://doi.org/10.5194/acp-17-1105-2017, 2017.
Bates, T. S., Cline, J. D., Gammon, R. H., and Kelly-Hansen, S. R.: Regional and seasonal variations in the flux of oceanic dimethylsulfide to the atmosphere, J. Geophys. Res.-Oceans, 92, 2930–2938, https://doi.org/10.1029/JC092iC03p02930, 1987.
Beddows, D. C. S., Harrison, R. M., Green, D. C., and Fuller, G. W.: Receptor modelling of both particle composition and size distribution from a background site in London, UK, Atmos. Chem. Phys., 15, 10107–10125, https://doi.org/10.5194/acp-15-10107-2015, 2015.
Bougiatioti, A., Fountoukis, C., Kalivitis, N., Pandis, S. N., Nenes, A., and Mihalopoulos, N.: Cloud condensation nuclei measurements in the marine boundary layer of the Eastern Mediterranean: CCN closure and droplet growth kinetics, Atmos. Chem. Phys., 9, 7053–7066, https://doi.org/10.5194/acp-9-7053-2009, 2009.
Boyer, M., Aliaga, D., Pernov, J. B., Angot, H., Quéléver, L. L. J., Dada, L., Heutte, B., Dall'Osto, M., Beddows, D. C. S., Brasseur, Z., Beck, I., Bucci, S., Duetsch, M., Stohl, A., Laurila, T., Asmi, E., Massling, A., Thomas, D. C., Nøjgaard, J. K., Chan, T., Sharma, S., Tunved, P., Krejci, R., Hansson, H. C., Bianchi, F., Lehtipalo, K., Wiedensohler, A., Weinhold, K., Kulmala, M., Petäjä, T., Sipilä, M., Schmale, J., and Jokinen, T.: A full year of aerosol size distribution data from the central Arctic under an extreme positive Arctic Oscillation: insights from the Multidisciplinary drifting Observatory for the Study of Arctic Climate (MOSAiC) expedition, Atmos. Chem. Phys., 23, 389–415, https://doi.org/10.5194/acp-23-389-2023, 2023.
Burkart, J., Steiner, G., Reischl, G., and Hitzenberger, R.: Long-term study of cloud condensation nuclei (CCN) activation of the atmospheric aerosol in Vienna, Atmos. Environ., 45, 5751–5759, https://doi.org/10.1016/j.atmosenv.2011.07.022, 2011.
Cai, M., Tan, H., Chan, C. K., Qin, Y., Xu, H., Li, F., Schurman, M. I., Liu, L., and Zhao, J.: The size-resolved cloud condensation nuclei (CCN) activity and its prediction based on aerosol hygroscopicity and composition in the Pearl Delta River (PRD) region during wintertime 2014, Atmos. Chem. Phys., 18, 16419–16437, https://doi.org/10.5194/acp-18-16419-2018, 2018.
Cai, M., Liang, B., Sun, Q., Zhou, S., Chen, X., Yuan, B., Shao, M., Tan, H., and Zhao, J.: Effects of continental emissions on cloud condensation nuclei (CCN) activity in the northern South China Sea during summertime 2018, Atmos. Chem. Phys., 20, 9153–9167, https://doi.org/10.5194/acp-20-9153-2020, 2020.
Chao, Q., Xiao, C., Li, w., Wang, L., Sun, L., Chen, X., Chen, Y., Li, Y., Gao, G., Liu, Y., Zhang, D., Ai, W., Chen, Y., Cui, T., Dai, T., Feng, A., Guo, Y., Huang, D., Jiang, Y., Li, D., Li, M., Liu, B., Liu, Y., Lv, Z., Mei, m., Wang, Q., Wang, Y., Yin, Y., Zeng, H., Zhang, Y., Zhai, J., Zhao, L., Zhi, R., Zhong, H., Zhou, X., Zhou, X., Zhu, X., and Wu, H.: China Climate Bulletin (2022), China Meteorological Administration, https://www.cma.gov.cn/zfxxgk/gknr/qxbg/202303/t20230324_5396394.html (last access: 4 July 2024), 2022.
Choi, Y., Rhee, T. S., Collett, J. L., Park, T., Park, S.-M., Seo, B.-K., Park, G., Park, K., and Lee, T.: Aerosol concentrations and composition in the North Pacific marine boundary layer, Atmos. Environ., 171, 165–172, https://doi.org/10.1016/j.atmosenv.2017.09.047, 2017.
Crosbie, E., Youn, J.-S., Balch, B., Wonaschütz, A., Shingler, T., Wang, Z., Conant, W. C., Betterton, E. A., and Sorooshian, A.: On the competition among aerosol number, size and composition in predicting CCN variability: a multi-annual field study in an urbanized desert, Atmos. Chem. Phys., 15, 6943–6958, https://doi.org/10.5194/acp-15-6943-2015, 2015.
Deng, Z. Z., Zhao, C. S., Ma, N., Ran, L., Zhou, G. Q., Lu, D. R., and Zhou, X. J.: An examination of parameterizations for the CCN number concentration based on in situ measurements of aerosol activation properties in the North China Plain, Atmos. Chem. Phys., 13, 6227–6237, https://doi.org/10.5194/acp-13-6227-2013, 2013.
Drinovec, L., Močnik, G., Zotter, P., Prévôt, A. S. H., Ruckstuhl, C., Coz, E., Rupakheti, M., Sciare, J., Müller, T., Wiedensohler, A., and Hansen, A. D. A.: The “dual-spot” Aethalometer: an improved measurement of aerosol black carbon with real-time loading compensation, Atmos. Meas. Tech., 8, 1965–1979, https://doi.org/10.5194/amt-8-1965-2015, 2015.
Dusek, U., Frank, G. P., Hildebrandt, L., Curtius, J., Schneider, J., Walter, S., Chand, D., Drewnick, F., Hings, S., Jung, D., Borrmann, S., and Andreae, M. O.: Size matters more than chemistry for cloud-nucleating ability of aerosol particles, Science, 312, 1375–1378, https://doi.org/10.1126/science.1125261, 2006.
Ervens, B., Cubison, M. J., Andrews, E., Feingold, G., Ogren, J. A., Jimenez, J. L., Quinn, P. K., Bates, T. S., Wang, J., Zhang, Q., Coe, H., Flynn, M., and Allan, J. D.: CCN predictions using simplified assumptions of organic aerosol composition and mixing state: a synthesis from six different locations, Atmos. Chem. Phys., 10, 4795–4807, https://doi.org/10.5194/acp-10-4795-2010, 2010.
Fitzgerald, J. W.: Dependence of the Supersaturation Spectrum of CCN on Aerosol Size Distribution and Composition, J. Atmos. Sci., 30, 628–634, https://doi.org/10.1175/1520-0469(1973)030<0628:DOTSSO>2.0.CO;2, 1973.
Fletcher, N. H.: he physics of rainclouds, Cambridge University Press, Cambridge, England, ISBN 9780521154796, 1962.
Geller, M., Biswas, S., and Sioutas, C.: Determination of Particle Effective Density in Urban Environments with a Differential Mobility Analyzer and Aerosol Particle Mass Analyzer, Aerosol Sci. Tech., 40, 709–723, https://doi.org/10.1080/02786820600803925, 2006.
Geng, X. F., Zhong, G. C., Li, J., Cheng, Z. B., Mo, Y. Z., Mao, S. D., Su, T., Jiang, H. Y., Ni, K. W., and Zhang, G.: Molecular marker study of aerosols in the northern South China Sea: Impact of atmospheric outflow from the Indo-China Peninsula and South China, Atmos. Environ., 206, 225–236, https://doi.org/10.1016/j.atmosenv.2019.02.033, 2019.
Gras, J. L.: CN, CCN and particle size in Southern Ocean air at Cape Grim, Atmos. Res., 35, 233–251, https://doi.org/10.1016/0169-8095(94)00021-5, 1995.
Gras, J. L. and Keywood, M.: Cloud condensation nuclei over the Southern Ocean: wind dependence and seasonal cycles, Atmos. Chem. Phys., 17, 4419–4432, https://doi.org/10.5194/acp-17-4419-2017, 2017.
Gysel, M., Crosier, J., Topping, D. O., Whitehead, J. D., Bower, K. N., Cubison, M. J., Williams, P. I., Flynn, M. J., McFiggans, G. B., and Coe, H.: Closure study between chemical composition and hygroscopic growth of aerosol particles during TORCH2, Atmos. Chem. Phys., 7, 6131–6144, https://doi.org/10.5194/acp-7-6131-2007, 2007.
Heintzenberg, J.: Properties of the Log-Normal Particle Size Distribution, Aerosol. Sci. Tech., 21, 46–48, https://doi.org/10.1080/02786829408959695, 1994.
Huang, S., Wu, Z., Poulain, L., van Pinxteren, M., Merkel, M., Assmann, D., Herrmann, H., and Wiedensohler, A.: Source apportionment of the organic aerosol over the Atlantic Ocean from 53° N to 53° S: significant contributions from marine emissions and long-range transport, Atmos. Chem. Phys., 18, 18043–18062, https://doi.org/10.5194/acp-18-18043-2018, 2018.
Huang, S., Wu, Z., Wang, Y., Poulain, L., Höpner, F., Merkel, M., Herrmann, H., and Wiedensohler, A.: Aerosol Hygroscopicity and its Link to Chemical Composition in a Remote Marine Environment Based on Three Transatlantic Measurements, Environ. Sci. Technol., 56, 9613–9622, https://doi.org/10.1021/acs.est.2c00785, 2022.
Hussein, T., Dal Maso, M., Petäjä, T., Koponen, I., Paatero, P., Aalto, P., Hämeri, K., and Kulmala, M.: Evaluation of an automatic algorithm for fitting the particle number size distribution, Boreal Env. Res., 10, 337–355, 2005
IPCC: Annex I: Observational Products, in: Climate Change 2021 The Physical Science Basis, edited by: Masson-Delmotte, V., Zhai, P., Pirani, A., Connors, S. L., Péan, C., Berger, S., Caud, N., Chen, Y., Goldfarb, L., Gomis, M. I., Huang, M., Leitzell, K., Lonnoy, E., Matthews, J. B. R., Maycock, T. K., Waterfield, T., Yelekçi, O., Yu, R., and Zhou, B., Cambridge University Press, Cambridge, United Kingdom and New York, NY, USA, 2061–2086, https://doi.org/10.1017/9781009157896.015, 2021.
Jimenez, J. L., Canagaratna, M. R., Donahue, N. M., Prevot, A. S., Zhang, Q., Kroll, J. H., DeCarlo, P. F., Allan, J. D., Coe, H., Ng, N. L., Aiken, A. C., Docherty, K. S., Ulbrich, I. M., Grieshop, A. P., Robinson, A. L., Duplissy, J., Smith, J. D., Wilson, K. R., Lanz, V. A., Hueglin, C., Sun, Y. L., Tian, J., Laaksonen, A., Raatikainen, T., Rautiainen, J., Vaattovaara, P., Ehn, M., Kulmala, M., Tomlinson, J. M., Collins, D. R., Cubison, M. J., Dunlea, E. J., Huffman, J. A., Onasch, T. B., Alfarra, M. R., Williams, P. I., Bower, K., Kondo, Y., Schneider, J., Drewnick, F., Borrmann, S., Weimer, S., Demerjian, K., Salcedo, D., Cottrell, L., Griffin, R., Takami, A., Miyoshi, T., Hatakeyama, S., Shimono, A., Sun, J. Y., Zhang, Y. M., Dzepina, K., Kimmel, J. R., Sueper, D., Jayne, J. T., Herndon, S. C., Trimborn, A. M., Williams, L. R., Wood, E. C., Middlebrook, A. M., Kolb, C. E., Baltensperger, U., and Worsnop, D. R.: Evolution of organic aerosols in the atmosphere, Science, 326, 1525–1529, https://doi.org/10.1126/science.1180353, 2009.
Jurányi, Z., Gysel, M., Weingartner, E., Bukowiecki, N., Kammermann, L., and Baltensperger, U.: A 17 month climatology of the cloud condensation nuclei number concentration at the high alpine site Jungfraujoch, J. Geophys. Res., 116, D10204, https://doi.org/10.1029/2010jd015199, 2011.
Kawana, K., Miyazaki, Y., Omori, Y., Tanimoto, H., Kagami, S., Suzuki, K., Yamashita, Y., Nishioka, J., Deng, Y. G., Yai, H., and Mochida, M.: Number-Size Distribution and CCN Activity of Atmospheric Aerosols in the Western North Pacific During Spring Pre-Bloom Period: Influences of Terrestrial and Marine Sources, J. Geophys. Res.-Atmos., 127, e2022JD036690, https://doi.org/10.1029/2022JD036690, 2022.
Köhler, H.: The nucleus in and the growth of hygroscopic droplets, Trans. Faraday Soc., 32, 1152–1161, https://doi.org/10.1039/TF9363201152, 1936.
Kouvarakis, G. and Mihalopoulos, N.: Seasonal variation of dimethylsulfide in the gas phase and of methanesulfonate and non-sea-salt sulfate in the aerosols phase in the Eastern Mediterranean atmosphere, Atmos. Environ., 36, 929–938, https://doi.org/10.1016/s1352-2310(01)00511-8, 2002.
Lambe, A. T., Onasch, T. B., Massoli, P., Croasdale, D. R., Wright, J. P., Ahern, A. T., Williams, L. R., Worsnop, D. R., Brune, W. H., and Davidovits, P.: Laboratory studies of the chemical composition and cloud condensation nuclei (CCN) activity of secondary organic aerosol (SOA) and oxidized primary organic aerosol (OPOA), Atmos. Chem. Phys., 11, 8913–8928, https://doi.org/10.5194/acp-11-8913-2011, 2011.
Lathem, T. L. and Nenes, A.: Water Vapor Depletion in the DMT Continuous-Flow CCN Chamber: Effects on Supersaturation and Droplet Growth, Aerosol. Sci. Tech., 45, 604–615, https://doi.org/10.1080/02786826.2010.551146, 2011.
Leena, P. P., Pandithurai, G., Anilkumar, V., Murugavel, P., Sonbawne, S. M., and Dani, K. K.: Seasonal variability in aerosol, CCN and their relationship observed at a high altitude site in Western Ghats, Meteorol. Atmos. Phys., 128, 143–153, https://doi.org/10.1007/s00703-015-0406-0, 2016.
Liang, B., Cai, M., Sun, Q., Zhou, S., and Zhao, J.: Source apportionment of marine atmospheric aerosols in northern South China Sea during summertime 2018, Environ. Pollut., 289, 117948, https://doi.org/10.1016/j.envpol.2021.117948, 2021.
Liu, P., Song, M., Zhao, T., Gunthe, S. S., Ham, S., He, Y., Qin, Y. M., Gong, Z., Amorim, J. C., Bertram, A. K., and Martin, S. T.: Resolving the mechanisms of hygroscopic growth and cloud condensation nuclei activity for organic particulate matter, Nat. Commun, 9, 4076, https://doi.org/10.1038/s41467-018-06622-2, 2018.
Liu, Y., Sun, L., Zhou, X., Luo, Y., Huang, W., Yang, C., Wang, Y., and Huang, T.: A 1400-year terrigenous dust record on a coral island in South China Sea, Sci. Rep., 4, 4994, https://doi.org/10.1038/srep04994, 2014.
Meng, J. W., Yeung, M. C., Li, Y. J., Lee, B. Y. L., and Chan, C. K.: Size-resolved cloud condensation nuclei (CCN) activity and closure analysis at the HKUST Supersite in Hong Kong, Atmos. Chem. Phys., 14, 10267–10282, https://doi.org/10.5194/acp-14-10267-2014, 2014.
Miller, R. M., Rauber, R. M., Di Girolamo, L., Rilloraza, M., Fu, D., McFarquhar, G. M., Nesbitt, S. W., Ziemba, L. D., Woods, S., and Thornhill, K. L.: Influence of natural and anthropogenic aerosols on cloud base droplet size distributions in clouds over the South China Sea and West Pacific, Atmos. Chem. Phys., 23, 8959–8977, https://doi.org/10.5194/acp-23-8959-2023, 2023.
Moore, R. H., Nenes, A., and Medina, J.: Scanning Mobility CCN Analysis-A Method for Fast Measurements of Size-Resolved CCN Distributions and Activation Kinetics, Aerosol. Sci. Tech., 44, 861–871, https://doi.org/10.1080/02786826.2010.498715, 2010.
Ou, H., Cai, M., Zhang, Y., Ni, X., Liang, B., Sun, Q., Mai, S., Sun, C., Zhou, S., Wang, H., Sun, j., and Zhao, J.: Measurement Report: Seasonal variation and anthropogenic influence on cloud condensation nuclei (CCN) activity in the South China Sea: Insights from shipborne observations during summer and winter of 2021, figshare [data set], https://doi.org/10.6084/m9.figshare.25472545.v2, 2024.
Ovadnevaite, J., Zuend, A., Laaksonen, A., Sanchez, K. J., Roberts, G., Ceburnis, D., Decesari, S., Rinaldi, M., Hodas, N., Facchini, M. C., Seinfeld, J. H., and O' Dowd, C.: Surface tension prevails over solute effect in organic-influenced cloud droplet activation, Nature, 546, 637–641, https://doi.org/10.1038/nature22806, 2017.
Padró, L. T., Moore, R. H., Zhang, X., Rastogi, N., Weber, R. J., and Nenes, A.: Mixing state and compositional effects on CCN activity and droplet growth kinetics of size-resolved CCN in an urban environment, Atmos. Chem. Phys., 12, 10239–10255, https://doi.org/10.5194/acp-12-10239-2012, 2012.
Park, M., Yum, S. S., Kim, N., Cha, J. W., Shin, B., and Ryoo, S.-B.: Characterization of submicron aerosols and CCN over the Yellow Sea measured onboard the Gisang 1 research vessel using the positive matrix factorization analysis method, Atmos. Res., 214, 430–441, https://doi.org/10.1016/j.atmosres.2018.08.015, 2018.
Patel, P. N. and Jiang, J. H.: Cloud condensation nuclei characteristics at the Southern Great Plains site: role of particle size distribution and aerosol hygroscopicity, Environ. Res. Commun., 3, 075002, https://doi.org/10.1088/2515-7620/ac0e0b, 2021.
Petters, M. D. and Kreidenweis, S. M.: A single parameter representation of hygroscopic growth and cloud condensation nucleus activity, Atmos. Chem. Phys., 7, 1961–1971, https://doi.org/10.5194/acp-7-1961-2007, 2007.
Pöhlker, M. L., Pöhlker, C., Ditas, F., Klimach, T., Hrabe de Angelis, I., Araújo, A., Brito, J., Carbone, S., Cheng, Y., Chi, X., Ditz, R., Gunthe, S. S., Kesselmeier, J., Könemann, T., Lavrič, J. V., Martin, S. T., Mikhailov, E., Moran-Zuloaga, D., Rose, D., Saturno, J., Su, H., Thalman, R., Walter, D., Wang, J., Wolff, S., Barbosa, H. M. J., Artaxo, P., Andreae, M. O., and Pöschl, U.: Long-term observations of cloud condensation nuclei in the Amazon rain forest – Part 1: Aerosol size distribution, hygroscopicity, and new model parametrizations for CCN prediction, Atmos. Chem. Phys., 16, 15709–15740, https://doi.org/10.5194/acp-16-15709-2016, 2016.
Qin, Y., Wang, H., Wang, Y., Lu, X., Tang, H., Zhang, J., Li, L., and Fan, S.: Wildfires in Southeast Asia pollute the atmosphere in the northern South China Sea, Sci. Bull. (Beijing), 69, 1011–1015, https://doi.org/10.1016/j.scib.2024.02.026, 2024.
Quinn, P. K., Bates, T. S., Coffman, D. J., and Covert, D. S.: Influence of particle size and chemistry on the cloud nucleating properties of aerosols, Atmos. Chem. Phys., 8, 1029–1042, https://doi.org/10.5194/acp-8-1029-2008, 2008.
Quinn, P. K., Bates, T. S., Coffman, D. J., Upchurch, L., Johnson, J. E., Moore, R., Ziemba, L., Bell, T. G., Saltzman, E. S., Graff, J., and Behrenfeld, M. J.: Seasonal Variations in Western North Atlantic Remote Marine Aerosol Properties, J. Geophys. Res.-Atmos., 124, 14240–14261, https://doi.org/10.1029/2019jd031740, 2019.
Rose, D., Nowak, A., Achtert, P., Wiedensohler, A., Hu, M., Shao, M., Zhang, Y., Andreae, M. O., and Pöschl, U.: Cloud condensation nuclei in polluted air and biomass burning smoke near the mega-city Guangzhou, China – Part 1: Size-resolved measurements and implications for the modeling of aerosol particle hygroscopicity and CCN activity, Atmos. Chem. Phys., 10, 3365–3383, https://doi.org/10.5194/acp-10-3365-2010, 2010.
Ross, K. E., Piketh, S. J., Bruintjes, R. T., Burger, R. P., Swap, R. J., and Annegarn, H. J.: Spatial and seasonal variations in CCN distribution and the aerosol-CCN relationship over southern Africa, J. Geophys. Res.-Atmos., 108, 8481, https://doi.org/10.1029/2002jd002384, 2003.
Sarangi, B., Ramachandran, S., Rajesh, T. A., and Dhaker, V. K.: Black carbon linked aerosol hygroscopic growth: Size and mixing state are crucial, Atmos. Environ., 200, 110–118, https://doi.org/10.1016/j.atmosenv.2018.12.001, 2019.
Schmale, J., Henning, S., Decesari, S., Henzing, B., Keskinen, H., Sellegri, K., Ovadnevaite, J., Pöhlker, M. L., Brito, J., Bougiatioti, A., Kristensson, A., Kalivitis, N., Stavroulas, I., Carbone, S., Jefferson, A., Park, M., Schlag, P., Iwamoto, Y., Aalto, P., Äijälä, M., Bukowiecki, N., Ehn, M., Frank, G., Fröhlich, R., Frumau, A., Herrmann, E., Herrmann, H., Holzinger, R., Kos, G., Kulmala, M., Mihalopoulos, N., Nenes, A., O'Dowd, C., Petäjä, T., Picard, D., Pöhlker, C., Pöschl, U., Poulain, L., Prévôt, A. S. H., Swietlicki, E., Andreae, M. O., Artaxo, P., Wiedensohler, A., Ogren, J., Matsuki, A., Yum, S. S., Stratmann, F., Baltensperger, U., and Gysel, M.: Long-term cloud condensation nuclei number concentration, particle number size distribution and chemical composition measurements at regionally representative observatories, Atmos. Chem. Phys., 18, 2853–2881, https://doi.org/10.5194/acp-18-2853-2018, 2018.
Seinfeld, J. H. and Pandis, S. N.: Atmospheric Chemistry And Physics: From Air Pollution To Climate Change, 3rd edn., Wiley, Hoboken, New Jersey, ISBN 978-1-118-94740-1, 2016.
Sihto, S.-L., Mikkilä, J., Vanhanen, J., Ehn, M., Liao, L., Lehtipalo, K., Aalto, P. P., Duplissy, J., Petäjä, T., Kerminen, V.-M., Boy, M., and Kulmala, M.: Seasonal variation of CCN concentrations and aerosol activation properties in boreal forest, Atmos. Chem. Phys., 11, 13269–13285, https://doi.org/10.5194/acp-11-13269-2011, 2011.
Su, H., Rose, D., Cheng, Y. F., Gunthe, S. S., Massling, A., Stock, M., Wiedensohler, A., Andreae, M. O., and Pöschl, U.: Hygroscopicity distribution concept for measurement data analysis and modeling of aerosol particle mixing state with regard to hygroscopic growth and CCN activation, Atmos. Chem. Phys., 10, 7489–7503, https://doi.org/10.5194/acp-10-7489-2010, 2010.
Sun, C., Zhang, Y., Liang, B., Gao, M., Sun, X., Li, F., Ni, X., Sun, Q., Ou, H., Chen, D., Zhou, S., and Zhao, J.: Morphological and optical properties of carbonaceous aerosol particles from ship emissions and biomass burning during a summer cruise measurement in the South China Sea, Atmos. Chem. Phys., 24, 3043–3063, https://doi.org/10.5194/acp-24-3043-2024, 2024.
Sun, Q., Liang, B., Cai, M., Zhang, Y., Ou, H., Ni, X., Sun, X., Han, B., Deng, X., Zhou, S., and Zhao, J.: Cruise observation of the marine atmosphere and ship emissions in South China Sea: Aerosol composition, sources, and the aging process, Environ. Pollut., 316, 120539, https://doi.org/10.1016/j.envpol.2022.120539, 2023.
Wang, B., Huang, F., Wu, Z., Yang, J., Fu, X., and Kikuchi, K.: Multi-scale climate variability of the South China Sea monsoon: A review, Dynam. Atmos. Oceans, 47, 15–37, https://doi.org/10.1016/j.dynatmoce.2008.09.004, 2009.
Wang, J., Cubison, M. J., Aiken, A. C., Jimenez, J. L., and Collins, D. R.: The importance of aerosol mixing state and size-resolved composition on CCN concentration and the variation of the importance with atmospheric aging of aerosols, Atmos. Chem. Phys., 10, 7267–7283, https://doi.org/10.5194/acp-10-7267-2010, 2010.
Wang, Y., Li, Z., Zhang, Y., Du, W., Zhang, F., Tan, H., Xu, H., Fan, T., Jin, X., Fan, X., Dong, Z., Wang, Q., and Sun, Y.: Characterization of aerosol hygroscopicity, mixing state, and CCN activity at a suburban site in the central North China Plain, Atmos. Chem. Phys., 18, 11739–11752, https://doi.org/10.5194/acp-18-11739-2018, 2018.
Wang, Y. Q.: MeteoInfo: GIS software for meteorological data visualization and analysis, Meteorol. Appl., 21, 360–368, https://doi.org/10.1002/met.1345, 2014.
Xiao, H.-W., Xiao, H.-Y., Luo, L., Shen, C.-Y., Long, A.-M., Chen, L., Long, Z.-H., and Li, D.-N.: Atmospheric aerosol compositions over the South China Sea: temporal variability and source apportionment, Atmos. Chem. Phys., 17, 3199–3214, https://doi.org/10.5194/acp-17-3199-2017, 2017.
Zheng, G., Kuang, C., Uin, J., Watson, T., and Wang, J.: Large contribution of organics to condensational growth and formation of cloud condensation nuclei (CCN) in the remote marine boundary layer, Atmos. Chem. Phys., 20, 12515–12525, https://doi.org/10.5194/acp-20-12515-2020, 2020.
Zhu, K. and Wang, L.: A comprehensive study on the validation and application of multi-lognormal distribution models for atmospheric particles, Atmos. Environ., 338, 120813, https://doi.org/10.1016/j.atmosenv.2024.120813, 2024.