the Creative Commons Attribution 4.0 License.
the Creative Commons Attribution 4.0 License.
 | 26 Feb 2025
Vertical changes in volatile organic compounds (VOCs) and impacts on photochemical ozone formation
Xiao-Bing Li
Yibo Huangfu
Suxia Yang
Jipeng Qi
Xianjun He
Sihang Wang
Yubin Chen
Qing Yang
Yongxin Song
Yuwen Peng
Guiqian Tang
Jian Gao
Min Shao
Volatile organic compounds (VOCs) play crucial roles in regulating the formation of tropospheric ozone. However, limited knowledge on the interactions between vertical VOC variations and photochemical ozone formation in the planetary boundary layer (PBL) has hindered effective ozone control strategies, especially in large cities. In this study, we investigated the vertical changes in concentrations, compositions, and key driving factors of a large suite of VOCs using online gradient measurements taken from a 325 m tall tower in urban Beijing. The impacts of these vertical VOC variations on photochemical ozone formation were also analyzed using box model simulations. Our results indicate that VOCs exhibited distinct vertical variation patterns due to their differences in sources and chemical reactivities, along with the diurnal evolution of the PBL. During daytime, reactive VOCs (e.g., hydrocarbons) are rapidly oxidized as they mix upward, accompanied by the formation and accumulation of oxygenated VOCs (OVOCs) in the middle and upper layers. In addition, the photochemical formation of ozone responds positively to changes in both NOx and VOCs. As a result, the production rate of ozone declines with height due to the simultaneous decreases in concentrations of reactive VOCs and NOx but remains high in the middle and upper layers. The strong production of ozone aloft is primarily driven by the presence of high OVOC concentrations. Therefore, careful consideration should be given to the vertical variations in both photochemical ozone production rates and formation regimes in the whole PBL when developing regional ozone control strategies.
- Article
(6302 KB) - Full-text XML
-
Supplement
(1308 KB) - BibTeX
- EndNote


Volatile organic compounds (VOCs) are crucial constituents of atmospheric chemicals (Li et al., 2022b) and play important roles in regulating the atmospheric oxidation capacity and contributing to the photochemical formation of tropospheric ozone (Zhao et al., 2022; X. Yang et al., 2024). Ozone is a major air pollutant in urban environments, with increasing trends reported globally over recent decades (Fleming et al., 2018; Cooper et al., 2020), despite stringent measures to control its precursor emissions (Y.-H. Wang et al., 2020; Yeo and Kim, 2021; Li et al., 2022a; Perdigones et al., 2022). As highlighted in previous studies, reducing emissions of reactive VOCs is key to controlling ozone pollution at present and in the foreseeable future (Zhao et al., 2022; Wang et al., 2024).
The primary prerequisite for effective regional ozone pollution control is the determination of the photochemical ozone formation regime (Souri et al., 2020; Zhao et al., 2022), which facilitates the development of reduction schemes for key precursor emissions (Ou et al., 2016; Wang et al., 2019). The main challenges in controlling ozone pollution stem from the complex compositions of its precursors (e.g., VOCs and NOx) in ambient air (Guo et al., 2017; Wu et al., 2020; Li et al., 2022b), as well as the complicated responses of photochemical ozone formation to changes in these precursors (Shao et al., 2021; Perdigones et al., 2022). Furthermore, the interactions between vertical variations in ozone precursors and ozone formation remain unclear (Tang et al., 2017; Sun et al., 2018; Li et al., 2024), adding to the complexity of ozone pollution control.
In most cases, the identification of key ozone precursors has been conducted using ground-level observations (Qi et al., 2021; Lu et al., 2022) or compiled source emission inventories (Ou et al., 2015; An et al., 2021; N. Wang et al., 2022). While these methods are undoubtedly helpful in determining key ozone precursors and corresponding reduction strategies, they often encounter unexpected uncertainties in urban regions (Mo et al., 2018, 2020). Consequently, ground-level measurements of ozone precursors have been favored to constrain model calculations (Lu et al., 2012; H. Wang et al., 2022; Yang et al., 2022) or provide empirical evidence for hypothesized theories (Hofzumahaus et al., 2009; W. Wang et al., 2022). However, these ground-level measurements cannot fully characterize atmospheric chemical processes in the entire planetary boundary layer (PBL) due to strong vertical variations in precursor concentrations (Velasco et al., 2008; Li et al., 2018; Sun et al., 2018).
Ambient VOCs, as crucial ozone precursors, are composed of myriad species (Wu et al., 2020; Gkatzelis et al., 2021; Ye et al., 2021; He et al., 2022) and serve diverse functions in photochemical ozone formation (Vo et al., 2018; C. Li et al., 2022; Zhang et al., 2022). Owing to the impact of variations in emission sources, chemical removal, advection and convection transport, and secondary formation, the concentration and composition of VOCs typically display notable vertical variability within the PBL, especially in urban areas (Li et al., 2022b). The ozone formation regime likely undergoes significant transitions from the ground to the upper boundary layer (Li et al., 2024; Liu et al., 2024a). Ozone generated throughout the PBL can influence surface ozone levels due to enhanced atmospheric vertical mixing during the day. Consequently, it is imperative to comprehend the vertical variations in and principal determinants of VOCs, as well as their effects on photochemical ozone formation within the PBL.
With the rapid development of cities in the past 2 decades in China, a large number of pollution-emitting industries and factories have been relocated from city centers to alleviate air pollution. Concurrently, there has been a swift increase in the ownership of electric vehicles (Guo et al., 2021). These shifts in energy consumption have driven the change in concentrations and compositions of VOCs in major cities like Beijing (Liu et al., 2024b), subsequently affecting photochemical ozone formation (Wang et al., 2024). However, the vertical variations in and key drivers of VOCs and their impacts on photochemical ozone formation in the urban PBL remain elusive. A primary hurdle in studying these vertical changes in photochemical ozone formation is the scarcity of reliable vertical VOC data (Dieu Hien et al., 2019; Li et al., 2022b). Engaging in vertical profiling of VOCs, ensuring all necessary species are represented, and obtaining a sufficient sample size are especially challenging in the lower PBL where atmospheric chemical reactions are the most intense (Benish et al., 2020; Kim et al., 2021).
Previous studies on vertical distributions of photochemical ozone formation in the PBL have been conducted using measurements of a limited number of VOC species and samples (Zhang et al., 2018; Benish et al., 2020; Geng et al., 2020). In this study, online gradient measurements of ozone, NOx, and a large suite of VOCs were made on a 325 m tall tower in urban Beijing during the summer of 2021. Additionally, box model simulations constrained by the gradient measurements were performed to analyze the vertical variations in and key drivers of VOCs as well as their impacts on photochemical ozone formation.
2.1 Description of the site, instrument, and field campaign
The data utilized in this study were derived from an intensive field campaign conducted at the Beijing meteorological tower (BMT; 39°58′ N, 116°23′ E) between 6 July and 4 August 2021. The BMT has a height of 325 m and is located in the northern part of downtown Beijing, positioned between the third and fourth ring roads (Fig. S1 in the Supplement). A vertical observation system, established using long perfluoroalkoxy alkane (PFA) Teflon tubes (o.d.: 1/2 in.), was used to make online gradient measurements of ozone, NOx, and a set of VOCs on the BMT. Five specific heights, namely 15, 47, 102, 200, and 320 m above ground level, were selected to mount the tube inlets, as depicted in Fig. S3 in the Supplement. An additional inlet, situated approximately 5 m above ground level, was mounted on the rooftop of the observation room that was adjacent to the tower. Consequently, the vertical observation system included a total of six sampling inlets. The sampling inlet at the 15 m height was not utilized during this field campaign.
Filters were installed downstream of the tubing inlets on the tower to remove fine particles. A rotary vane vacuum pump was used to simultaneously and continuously draw sample air from the five tubes, ensuring that all tubes were flushed by ambient air to reduce tubing delays of sticky organic compounds (Pagonis et al., 2017; Liu et al., 2019). Five critical orifices were employed to control the flow rate of the airstream in each tubing, resulting in flow rates ranging between 15 and 20 slpm (standard liters per minute). Instruments drew sample air from the five tubes sequentially through a Teflon solenoid valve group at designated time intervals. The switching time intervals of the Teflon solenoid valve group were set to 4 min during this field campaign. The measurements of trace gases in the first and last minute of a 4 min period were discarded to eliminate cross interferences between different inlet heights. Detailed information on the vertical observation system and the assessment of trace gas measurements through hundreds of meters long PFA tubes has been provided in our previous works (Li et al., 2023; Song et al., 2024; Q. Yang et al., 2024).
Ozone was measured using the ultraviolet photometry method (49i, Thermo Fisher Scientific Inc., USA). NO, NO2, and NOx were measured using the chemiluminescence method (42i, Thermo Fisher Scientific Inc., USA). Gradient measurements of ozone and NOx were conducted at a time resolution of 10 s. The photolysis frequencies of NO2, represented by j(NO2), were measured by a spectrometer (PFS-100, Focused Photonics Inc., China) situated on the rooftop of the observation room and have a time resolution of 8 s. In situ measurements of meteorological parameters including wind speed, air temperature, and relative humidity were made at 15 heights between 8 and 320 m on the BMT with a time resolution of 20 s. Planetary boundary layer height (PBLH) was obtained from the Air Resources Laboratory (https://ready.arl.noaa.gov/READYamet.php, last access: 10 June 2024) and was linearly interpolated to hourly values based on the initial time resolutions of 3 h (Li and Fan, 2022).
A high-resolution proton-transfer-reaction quadrupole-interface time-of-flight mass spectrometer (PTR-ToF-MS; Ionicon Analytik, Austria) was employed to measure VOCs at a time resolution of 10 s. The PTR-ToF-MS used both the hydronium ion (H3O+) (Yuan et al., 2017; Wu et al., 2020; Li et al., 2022b) and the nitric oxide ion (NO+) (C. Wang et al., 2020) as reagent ions. These two reagent ions were automatically switched every 60 min for H3O+ and every 22 min for NO+ throughout the campaign. The PTR-ToF-MS operated at an value of approximately 120 Td in H3O+ mode and an value of around 60 Td in NO+ mode. Instrument backgrounds were automatically measured during the last 2 min of each operation mode by passing ambient air through a platinum catalyst heated to 365°. A gas standard containing 39 VOC species was used to calibrate the PTR-ToF-MS daily. Sensitivities for the remaining species were determined based on reaction kinetics of the PTR-ToF-MS (Wu et al., 2020). Impacts of ambient humidity on the PTR-ToF-MS measurements were corrected by using humidity-dependence curves of VOCs obtained in our laboratory (C. Wang et al., 2020; Wu et al., 2020). Carbon dioxide (CO2 in dry air) and humidity were measured using a CO2 and H2O gas analyzer (Li-840A, LI-COR Inc., USA) at a time resolution of 10 s.
Gradient measurements of the total OH reactivity (OHR) of atmospheric trace gases were made using the improved comparative reactivity method (ICRM) developed by our team (W. Wang et al., 2021) from 28 to 31 July. In addition, gradient measurements of carbon monoxide (CO), methane (CH4), CO2, and H2O were simultaneously measured using the cavity ring-down spectroscopy (CRDS) method (G2401, Picarro Inc., USA) at a time resolution of 10 s from 15 May to 25 June. Sulfur dioxide (SO2) was measured using the ultraviolet fluorescence method (43i, Thermo Fisher Scientific Inc., USA) at a time resolution of 10 s from 25 June to 3 August. The total OHR of VOCs, denoted by OHRVOCs, can be estimated by excluding the OHRs of the inorganic species (namely ozone, NOx, CO, SO2, and CH4). It should be noted that gradient measurements of CH4 and CO were not made during 28–31 July, and their average concentrations in daytime (11:00–16:00 LT) between 15 May and 25 June at 5 m were used for all altitudes to calculate OHRVOCs. This method will bring minor uncertainties due to the minor vertical differences in the concentrations of CH4 and CO in daytime (Fig. S4). The OHR of VOCs can also be calculated by summing the products of their measured concentrations and their reaction rate coefficients with OH radicals, as formulated in Eq. (1):
where is the reaction rate coefficient of the i VOC species with OH radicals, and [VOCi] is the concentration of the i VOC species.
2.2 Estimation of NMHC concentrations at the BMT site
The PTR-ToF-MS is limited in its ability to measure VOC species with proton affinities higher than H2O (691 kJ mol−1) when operating in the H3O+ mode (Yuan et al., 2017). This limitation results in the absence of certain nonmethane hydrocarbons (NMHCs), such as alkanes and many alkene species, which play important roles in photochemical ozone formation. To obtain a comprehensive understanding of vertical variations in the concentrations, compositions, and environmental impacts of VOCs, this study estimated the vertical profiles of unmeasured NMHC species based on the concentrations of measured VOCs using the PTR-ToF-MS. Detailed information on the estimation of NMHC concentrations is provided in the Supplement.
2.3 Box model setup
A zero-dimension box model (F0AM) coupled with the Master Chemical Mechanism (v3.3.1) (Wolfe et al., 2016; Yang et al., 2022) was used to compute the production rate of ozone, denoted by P(O3) as formulated in Eq. (2):
where [HO2] and [NO] are the concentrations of HO2 and NO, and [RiO2] is the concentration of the ith organic peroxyl radical. The relative incremental reactivity (RIR) of photochemical ozone production to changes in different precursors was determined using Eq. (3):
where X represents ozone precursors, is the contribution of X to the production rate of Ox, ΔX is the amount of change in ozone precursors, and S(X) is the initial concentration of X. RIR values were used to discern sensitivities of photochemical ozone formation to changes in precursor gases. A positive RIR(X) value suggests that an increase in X enhances ozone formation, while a negative RIR value indicates that an increase in X inhibits ozone formation.
Model calculations were constrained by measurements of ozone, NOx, CO, a suite of VOCs, air temperature, and relative humidity. In addition to the measured or estimated concentrations of NMHCs, nine oxygenated VOC (OVOC) species (Table S1) measured by PTR-ToF-MS were used to constrain the model calculation. The model was run in a time-dependent mode with a time resolution of 5 min and a spin-up period of 2 d (Lu et al., 2012; W. Wang et al., 2022). The dry deposition velocity of ozone was set as 0.27 cm s−1 when calculating P(O3) at 5 m and was zeroed out when calculating P(O3) at other heights.
3.1 Temporal and vertical variations in concentrations of trace gases
As shown in Fig. 1, the meteorology in Beijing was characterized by high air temperature (27.3±2.9°), high humidity (83.9 % ± 16.2 %), and gentle winds (1.1±0.4 m s−1) throughout the campaign. The intense solar radiation, elevated air temperature, and mild winds favored the photochemical formation and accumulation of ozone, leading to frequent occurrences of ozone pollution episodes. Figure 1 also presents time series of mixing ratios of ozone and its selected precursors (namely isoprene, toluene, monoterpenes, and NOx) along with j(NO2) measured at 5 m. The campaign mean ozone mixing ratio was 45.6±25.3 ppb, but the maximum hourly mean ozone mixing ratio reached 129.3 ppb, indicating strong photochemical reactions in urban Beijing during the campaign. Surface ozone concentrations exhibited a typical diurnal variation pattern with the maximum occurring at 16:00 LT (Fig. S6), implying its predominant source from local photochemical production.
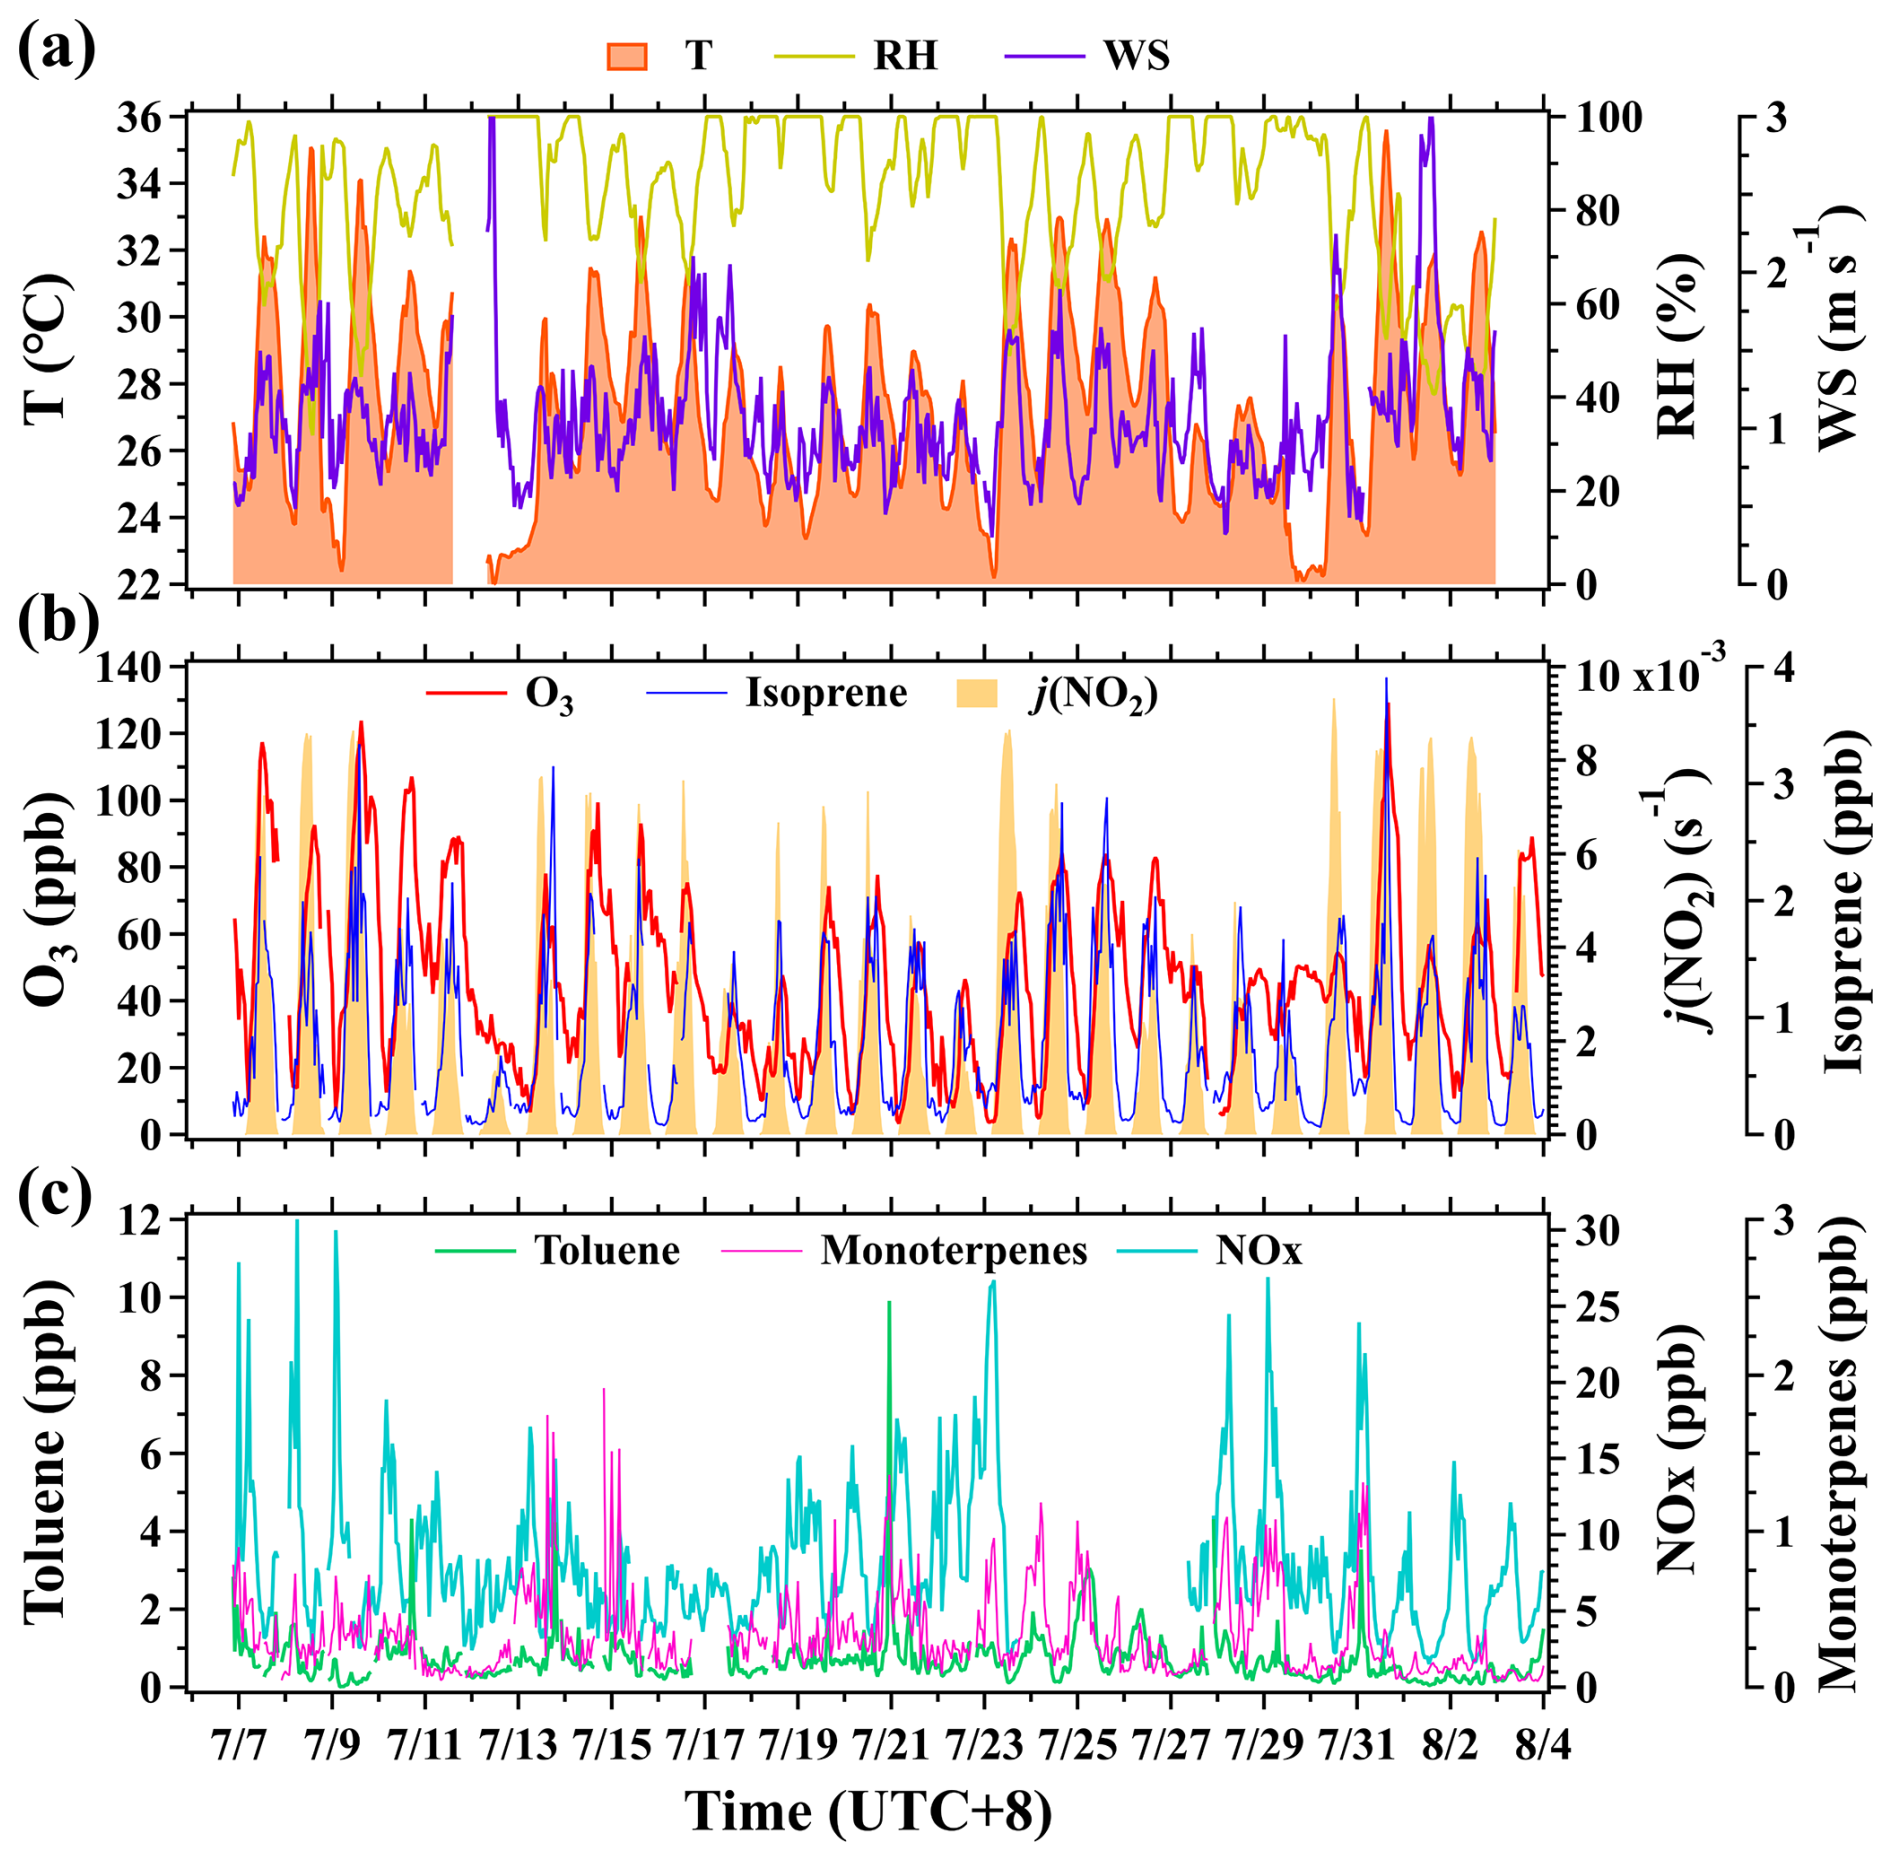
Figure 1Time series of hourly mean air temperature (T), relative humidity (RH), wind speed (WS), and mixing ratios of surface ozone, NOx, and VOC species along with j(NO2) at the BMT site during the campaign. Meteorological parameters were measured 8 m above ground level, and mixing ratios of ozone and its selected precursors were measured 5 m above ground level.
Isoprene is a typical tracer of biogenic emissions and is also a highly reactive VOC species (Atkinson and Arey, 2003). Isoprene had a campaign mean mixing ratio of 0.7±0.6 ppb. The average diurnal profile of isoprene at 5 m had a unimodal pattern with the maximum occurring at 14:00 LT (Fig. S6), exhibiting strong dependence on solar radiation. Monoterpenes were also generally recognized as typical tracers of biogenic emissions (Gómez et al., 2020) and had a campaign mean mixing ratio of 0.3±0.3 ppb. The average diurnal profile of monoterpenes was characterized by low mixing ratios in daytime with two peaks occurring at 05:00 and 20:00 LT.
Toluene and NOx are recognized as typical tracers of anthropogenic emissions in urban regions (Niu et al., 2017; Li et al., 2022b), with campaign mean mixing ratios of 0.7±0.7 and 8.1±4.8 ppb, respectively. The average diurnal profiles of toluene and NOx at 5 m exhibited similar variations, with larger values at night than during the day. Based on the measured concentrations of and diurnal variations in ozone and its key precursors at ground level, it can be inferred that urban Beijing is experiencing severe ozone pollution, which is predominantly contributed by local photochemical production. As key ozone precursors, ambient concentrations of VOCs are contributed by the mixture of anthropogenic and biogenic sources.
Figure 2 shows the average diurnal and vertical variations in mixing ratios of ozone, NOx, Ox (O3+ NO2), and six selected VOC species (three hydrocarbons and three OVOCs) within the measurement height range of 5–320 m. High mixing ratios of ozone were observed in the afternoon following the enhancement of solar radiation, which was consistent with the diurnal change pattern of ozone concentrations at the ground level. The vertical gradients of ozone mixing ratios were positive throughout the day but substantially enhanced at night (Fig. 3). The lower ozone mixing ratios near the surface than aloft were mainly caused by the enhancement of dry deposition and NO titration (Brown et al., 2007; Ma et al., 2013; Li et al., 2022a).
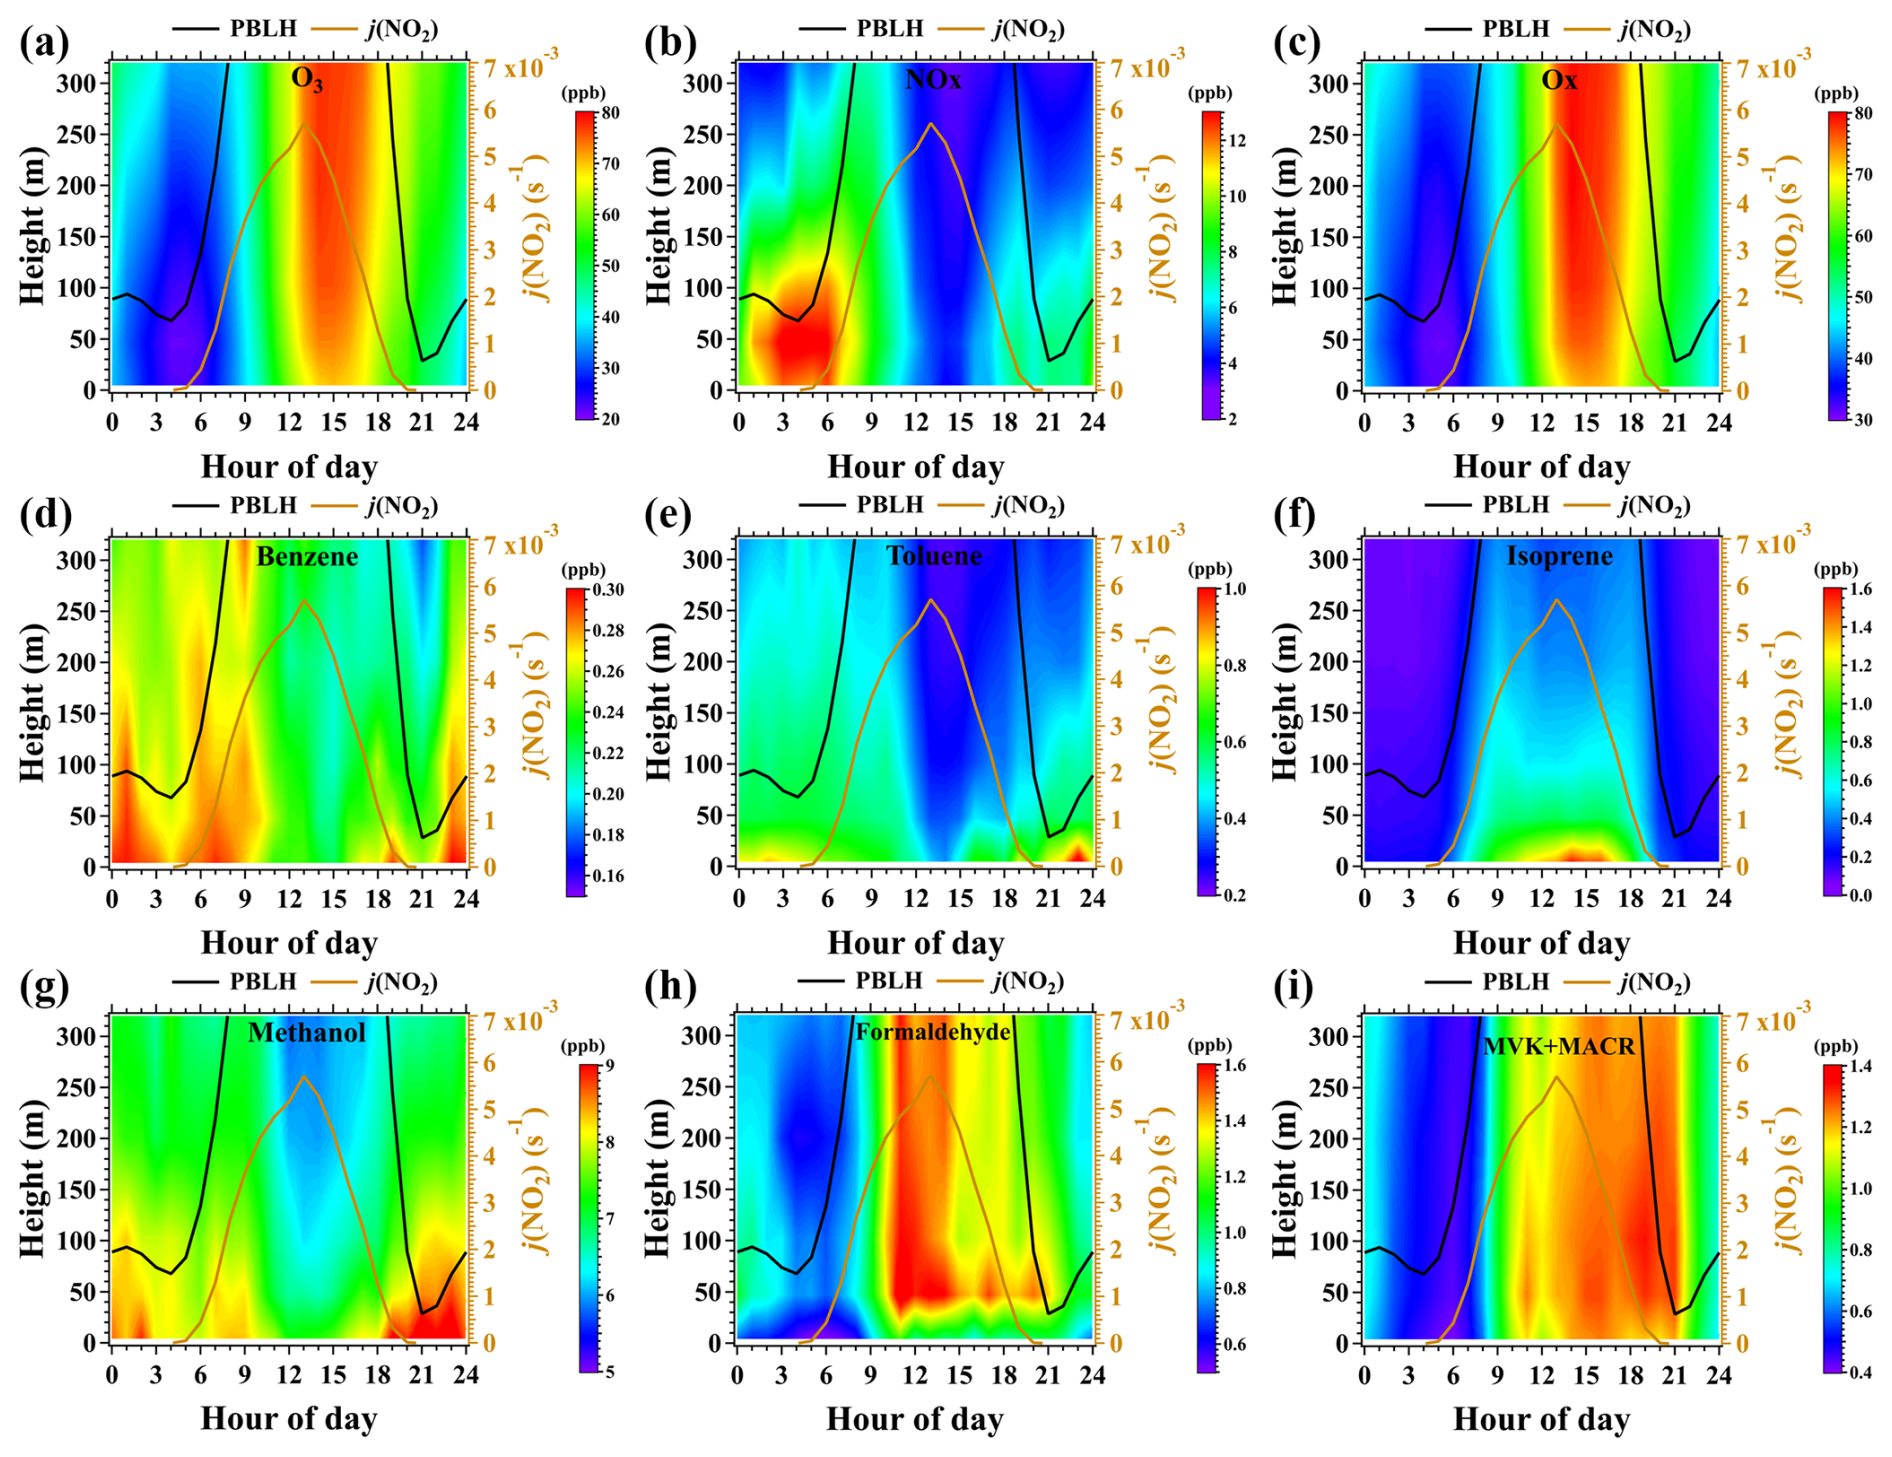
Figure 2Average diurnal and vertical variations in mixing ratios of ozone, NOx, Ox (O3 + NO2), and six selected VOC species along with the average diurnal profiles of PBLH and j(NO2) during the campaign. The figures were obtained by linearly interpolating the data at the five inlet heights on both altitude and temporal scales.
NOx is a primary pollutant and mainly contributed by vehicular exhaust in urban regions. In contrast to ozone, NOx mixing ratios were low in daytime and exhibited negative vertical gradients throughout the day, as shown in Figs. 2b and 3a–b. In nighttime, large amounts of local NOx emissions were trapped and accumulated in a shallow boundary layer (< 100 m). NOx concentrations rapidly decreased with height, even in the overlying residual layer, due to the suppression of turbulence vertical mixing. With the onset of sunlight, the PBL rapidly expanded due to the surface heating effect. The accumulated high concentrations of NOx in the shallow nocturnal boundary layer were thereupon diluted and removed by photochemical reactions.
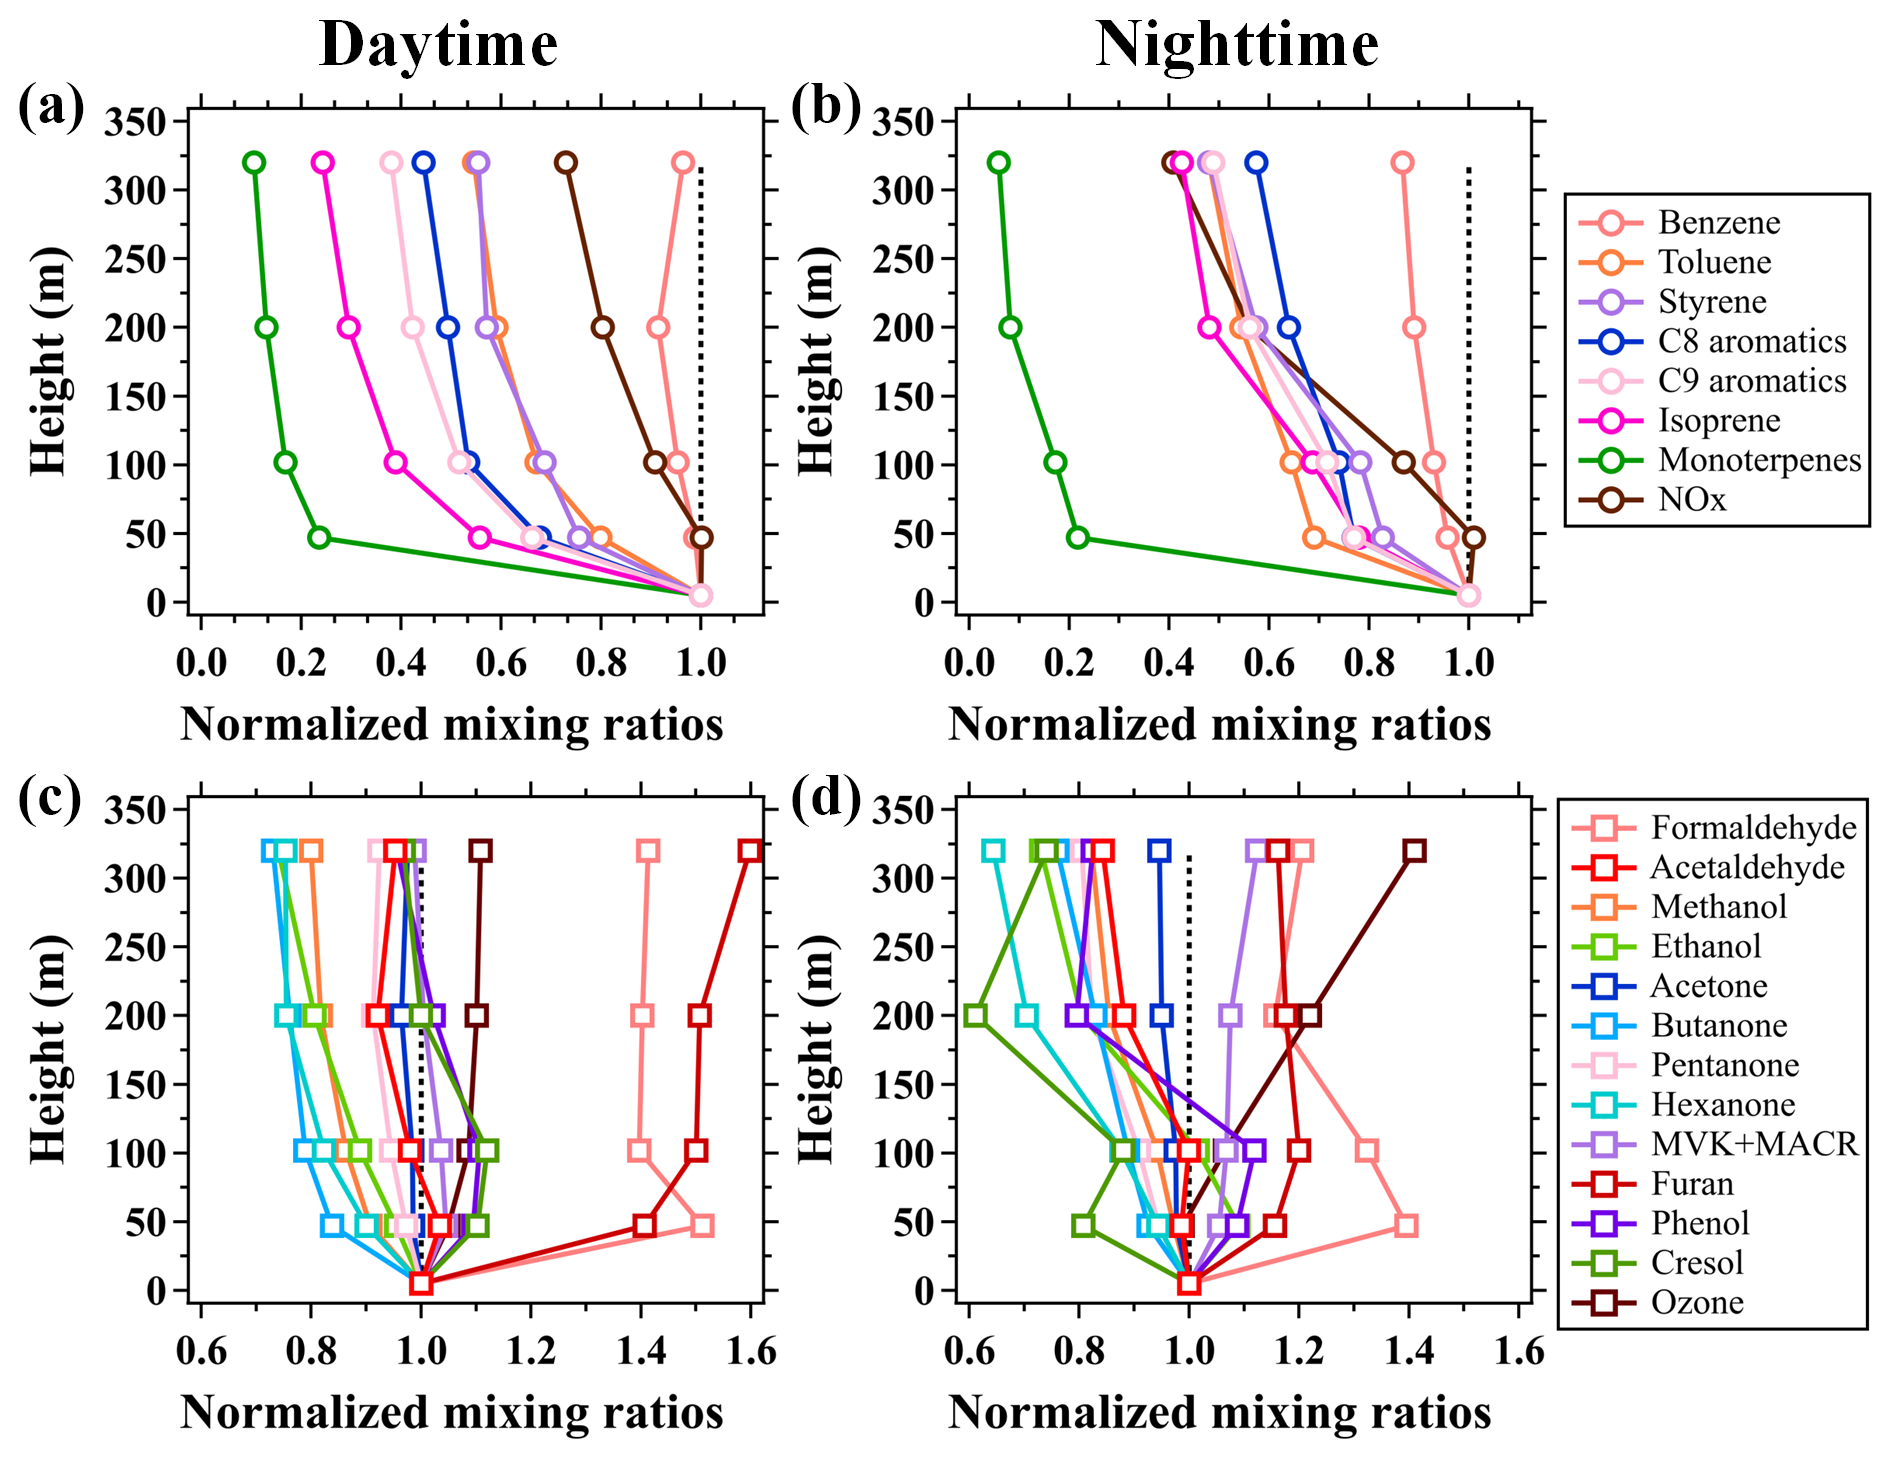
Figure 3Average vertical profiles of (a–b) NMHCs and NOx and (c–d) OVOCs and O3 during the daytime (11:00–16:00 LT) and nighttime (23:00–04:00 LT) of the campaign. The mixing ratios of the chemical species measured above 5 m are normalized to those at 5 m.
Ox is frequently used as a conserved metric to investigate the temporal and spatial variability of ozone by eliminating the NO titration effect. As shown in Fig. 2c, the mixing ratios of Ox had similar diurnal and vertical variation patterns to those of ozone, but the vertical gradients of Ox were weaker than those of ozone. This result suggests that the vertical distribution of NO concentrations played an important role in regulating the vertical change in ozone concentrations. The enhanced positive gradients of ozone mixing ratios at night were predominantly due to the strict suppression of turbulence vertical mixing (Geyer and Stutz, 2004). The higher concentrations of ozone aloft are considered to be the residual of the ozone produced in the daytime PBL and have been recognized as an important reservoir for the enhancement of surface ozone in morning periods (Kaser et al., 2017; Li and Fan, 2022; He et al., 2023).
Benzene and toluene demonstrated similar diurnal and vertical variations to NOx, with low concentrations in daytime and high concentrations at night, as shown in Figs. 2d–f and 3a–b. The concentrations of both benzene and toluene decreased with height throughout the day, confirming their primary emissions from ground-level sources. However, unlike benzene, the diurnal and vertical variations in toluene were more pronounced. Isoprene emissions are highly dependent on solar radiation, resulting in their higher concentrations in the early afternoon compared to other times of the day. Isoprene mixing ratios also exhibited strong negative vertical gradients below 320 m throughout the day. In contrast to toluene, isoprene concentrations decreased more rapidly with height in the daytime. For instance, the mixing ratios of isoprene decreased by approximately 70 % from 5 to 320 m in the daytime, while they decreased by only 30 % for toluene.
Figure 3a–b show the average vertical profiles of the NMHCs, normalized to their respective ground-level concentrations measured by the PTR-ToF-MS in daytime and nighttime. The normalized mixing ratios of the NMHCs exhibited significantly differentiated gradients in daytime. In contrast, apart from monoterpenes, the differences in the vertical gradients of the normalized vertical profiles for other NMHCs were relatively small at night. The differentiated vertical gradients of the NMHCs in daytime were primarily caused by their intrinsic chemical reactivities, such as reactions with OH radicals. As shown in Fig. 4, the concentration ratios of the NMHC species between 320 and 5 m with kOH values lower than cm−3 molec.−1 s−1 exhibited slight variability and rapidly declined with the further increases in kOH. The lower NMHC concentrations at higher altitudes were predominantly caused by the combined effects of atmospheric diffusion and chemical removal (Sangiorgi et al., 2011).
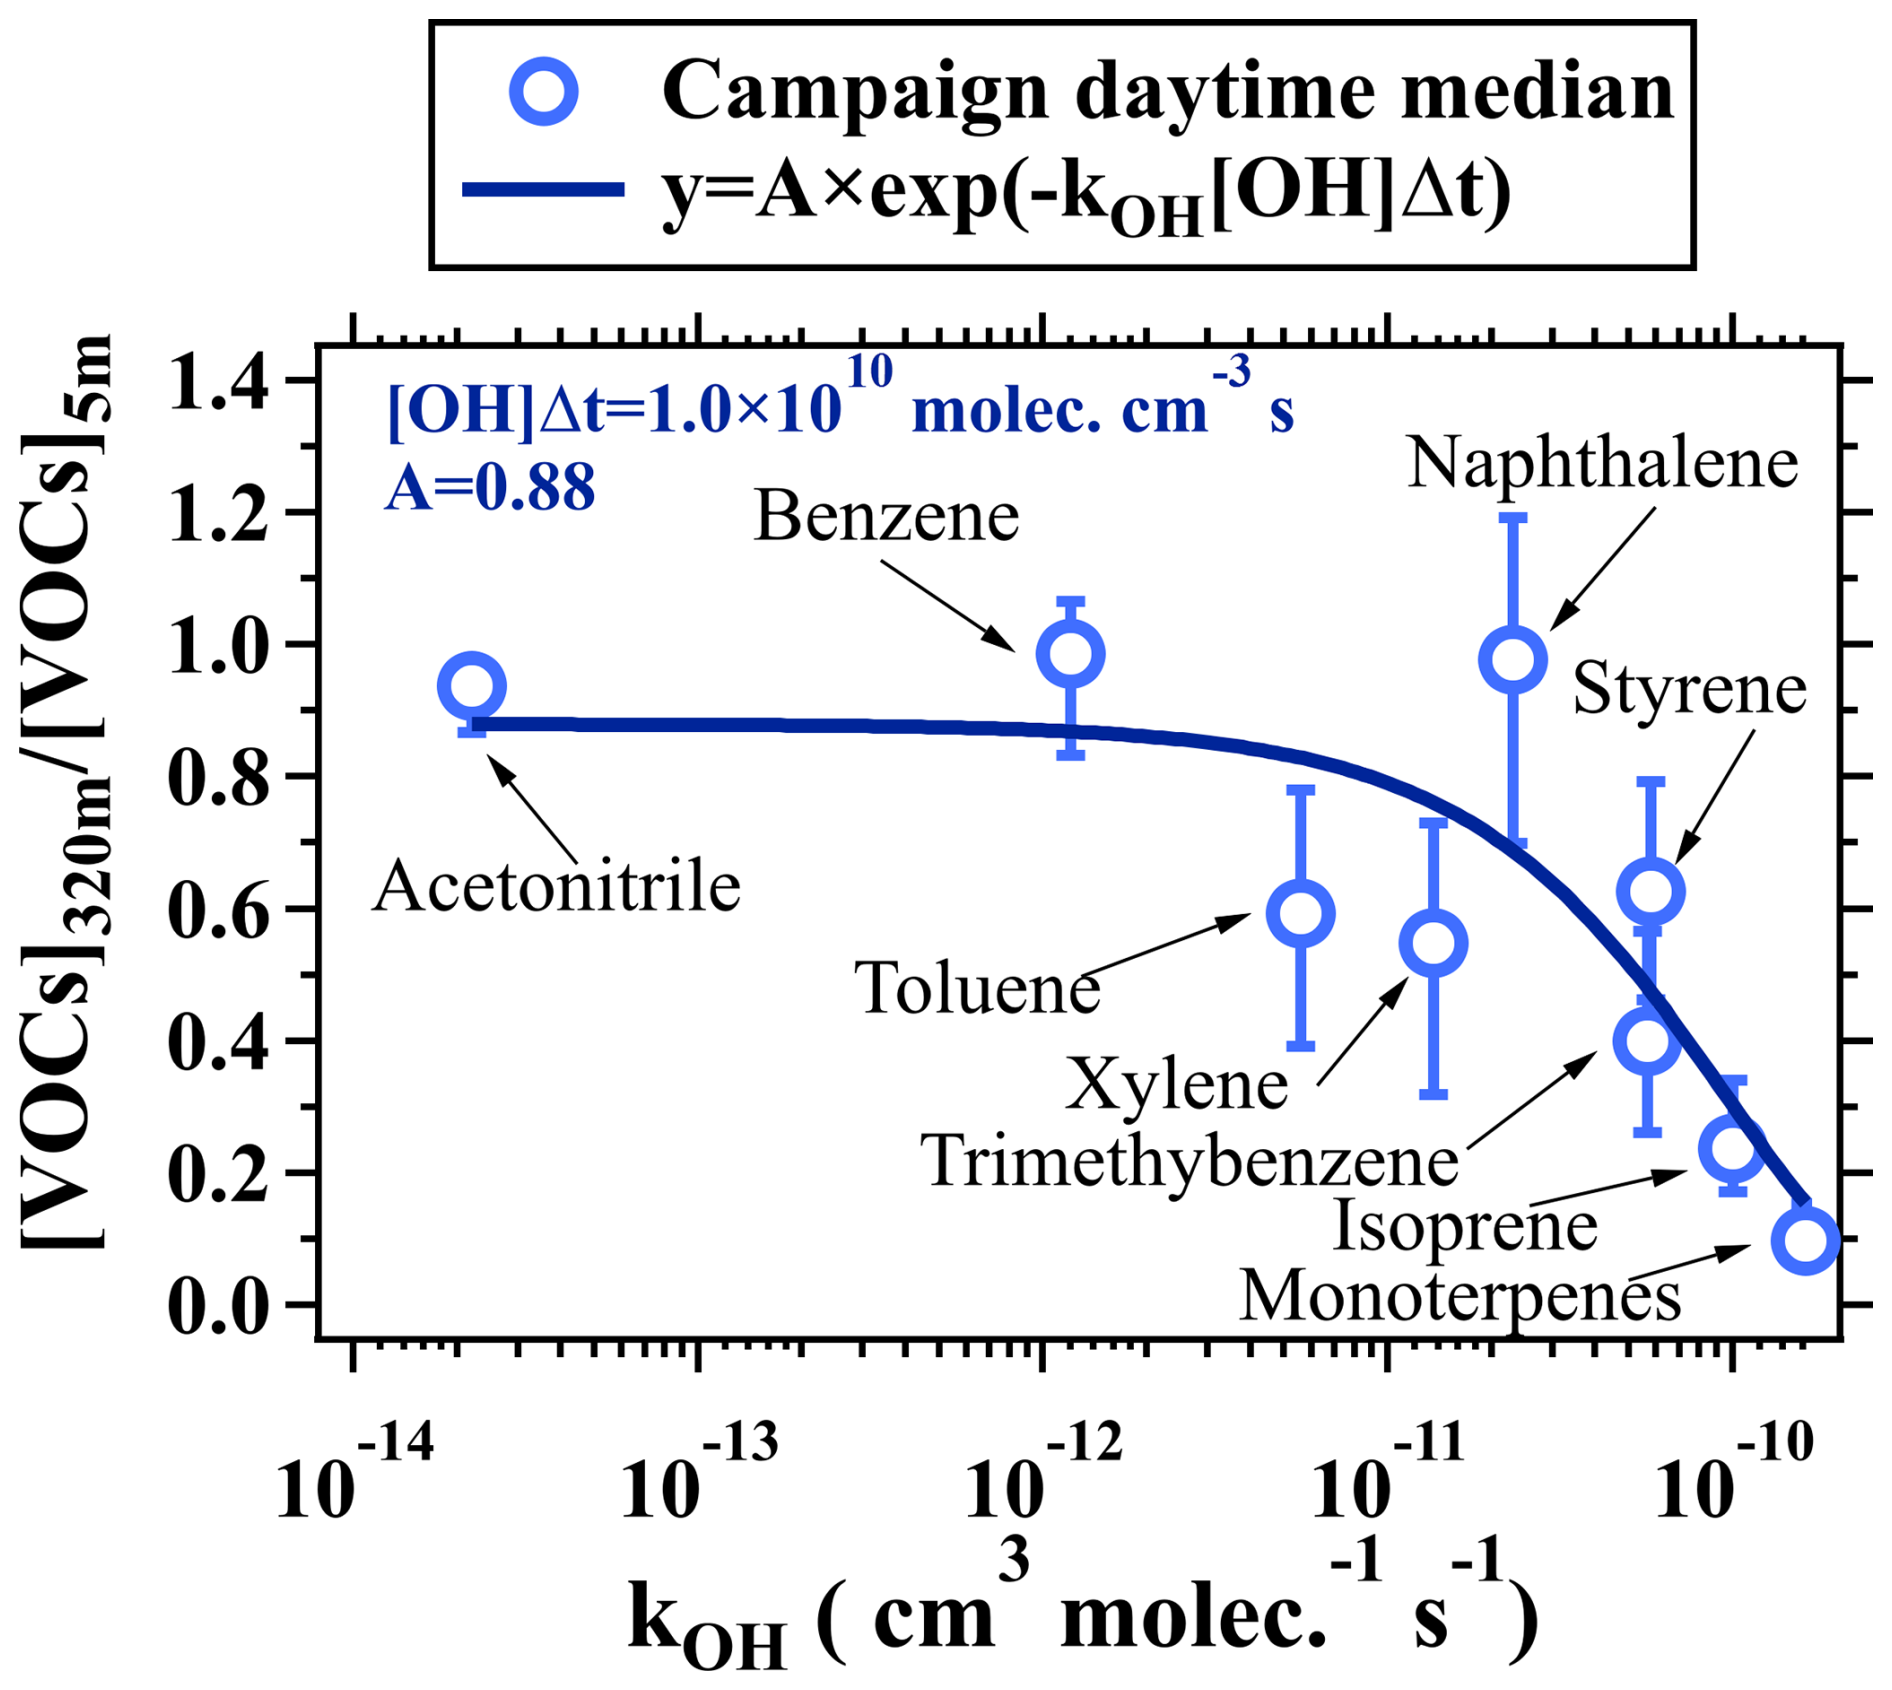
Figure 4The change in ratios of NMHC concentrations (including acetonitrile) between 320 and 5 m as a function of kOH. The vertically resolved measurements of VOCs made on the BMT in daytime during the campaign were used for analysis. The hollow markers represent median values, and the error bars indicate the range between the 25th and 75th percentiles.
Considering the effects of atmospheric diffusion and chemical removal by reactions with OH radicals, concentration ratios of NMHC species between 320 and 5 m in daytime can be estimated using Eq. (4):
where y represents concentration ratios of the NMHC species between two altitudes, A represents the effect of atmospheric dilution, kOH is the reaction rate coefficient of NMHCs with OH radicals, [OH] is the concentration of OH radicals, and Δt is the turbulence mixing timescale between the two altitudes. The term [OH]Δt thus refers to the exposure of NMHCs to OH radicals between the two altitudes. As shown in Fig. 4, the average concentration ratios of NMHCs between 320 and 5 m in daytime during the campaign can be reproduced well using Eq. (4) with the coefficients A of 0.88 and [OH]Δt of 1.0×10¹⁰ molec. cm−3 s. Atmospheric diffusion processes have the same impact on the vertical distributions of all trace gases. The differences in the vertical gradients of NMHCs were mainly determined by the differences in their chemical removal rates without considering influences from advection transport.
Methanol, as one of the most abundant OVOC species in the atmosphere, had its lowest concentrations during daytime and displayed negative vertical gradients throughout the day, as shown in Fig. 2g. The vertical and diurnal variations in methanol suggest that its ambient concentrations in urban Beijing were mainly contributed by local primary emissions. Conversely, formaldehyde and MVK + MACR (the first-generation oxidation products of isoprene), as the photochemical oxidation products of NMHCs, had higher concentrations during daytime than at night and exhibited relatively weak vertical concentration gradients (Fig. 2h–i). This is mainly because these OVOCs are produced from the oxidation of NMHCs during turbulence vertical mixing and will accumulate in high altitudes. These phenomena were also observed for other OVOC species, as shown in Fig. 3.
The vertical and diurnal variations in concentrations of ozone, NOx, and VOCs are intricately governed by their sources, their chemical reactivities, and the evolution of the PBL (namely the vertical dilution conditions). A significant accumulation of VOCs in the shallow nocturnal PBL is subsequently vertically diluted and chemically removed during daytime, thereby impacting the photochemical formation of ozone within the daytime PBL. In addition, the observed vertical changes in concentrations of VOCs imply that they will play distinct roles in contributing to photochemical ozone formation.
3.2 Vertical variations in contributions of VOCs to OHR
During the daytime, VOCs are primarily oxidized by OH radicals and contribute to the photochemical formation of ozone. To provide an overview of the vertical variations in the contributions of different VOCs to OHR, an additional 1204 ions measured by the PTR-ToF-MS, which can be quantified, were used for analysis. All the VOCs were classified into three large categories, namely CxHy (including alkanes, alkenes, aromatics, and other hydrocarbons; 121 species), OVOCs (CxHyO1, 121 species; CxHyO2, 120 species; CxHyO≥3, 256 species), and -containing species (653 species), as shown in Fig. 5. Acetylene is included in alkenes.

Figure 5(a) Mean mixing ratios and (b) OHRs of different VOC categories at the five inlet heights in daytime during the campaign.
Figure 5a illustrates that the total mixing ratios of VOCs in daytime exhibited a slight downward trend from 5 to 320 m, primarily due to the rapid decrease in the mixing ratios of the CxHy category. The total mixing ratios of the CxHy category decreased from 16.8 to 10.6 ppb from 5 to 320 m, with alkanes making the largest contribution, followed by alkenes, aromatics, and other CxHy. Alkanes constituted 58 % of the total mixing ratios of CxHy at 5 m, but this proportion increased to 65 % at 320 m. The fractional contributions of alkenes and aromatics in the total mixing ratios of CxHy declined slightly between these two altitudes from 28 % to 22 % and from 12 % to 10 %, respectively. As for OVOCs, the CxHyO1 category was the most abundant among the measurements, contributing 52 %–58 % of the total mixing ratios at the five heights, followed by the CxHyO2 (8 %–10 %) and CxHyO≥3 (2 %) categories. The mixing ratios of the -containing category varied slightly around 2.8 ppb between 5–320 m, contributing to approximately 6 % of the total VOC concentrations.
Similar to the vertical variations in concentrations, the OHRs of the CxHy category, denoted by OHRCH, also rapidly decreased from 6.9 to 2.5 s−1 between 5 and 320 m, accounting for 52 %–31 % of the total OHRs of VOCs (Fig. 5b). Fractional contributions of alkenes (40 %–18 %), alkanes (5 %), and aromatics (5 %–4 %) to the total OHRs of VOCs all exhibited decreasing tendencies from 5 to 320 m. The total OHRs of alkenes decreased more quickly from 5 to 320 m than those of alkanes and aromatics. The OHRs of the other CxHy category stabilized at approximately 0.3 s−1 below 320 m, exhibiting an increasing contribution (2 %–4 %) to the total OHRs of VOCs with the increase in height. The OHRs of other VOC categories varied only slightly without exhibiting a clear variation trend from 5 to 320 m during the day. As a result, the fractional contributions of the CxHyO1 (27 %–42 %), CxHyO2 (12 %–18 %), CxHyO≥3 (5 %–7 %), and -containing (2 %–4 %) categories in the total OHRs of VOCs all increased with height. The increased contributions of OVOCs and -containing species to the total concentrations and OHRs of VOCs implied that air masses became more aged with the increase in height.
As depicted in Fig. 6a–b, high OHRCH values were mainly constrained in the PBL and were mainly contributed by biogenic hydrocarbons, specifically isoprene, during daytime due to their high OH reactivities and enhanced emissions. The fractional contributions of isoprene in OHRCH decreased rapidly with increasing height (Fig. 7a). For instance, isoprene accounted for a campaign median fraction of 58 % in OHRCH at 5 m in daytime, making it a frequent contributor to photochemical ozone formation in urban regions. However, this fraction decreased to 38 % at 320 m. Therefore, it can be speculated that the total contributions of hydrocarbons to the total OHRs of VOCs will also rapidly decline from 320 m to the top of the PBL, which typically ranges from several hundreds of meters to approximately 2–3 km in daytime (Fig. S7).
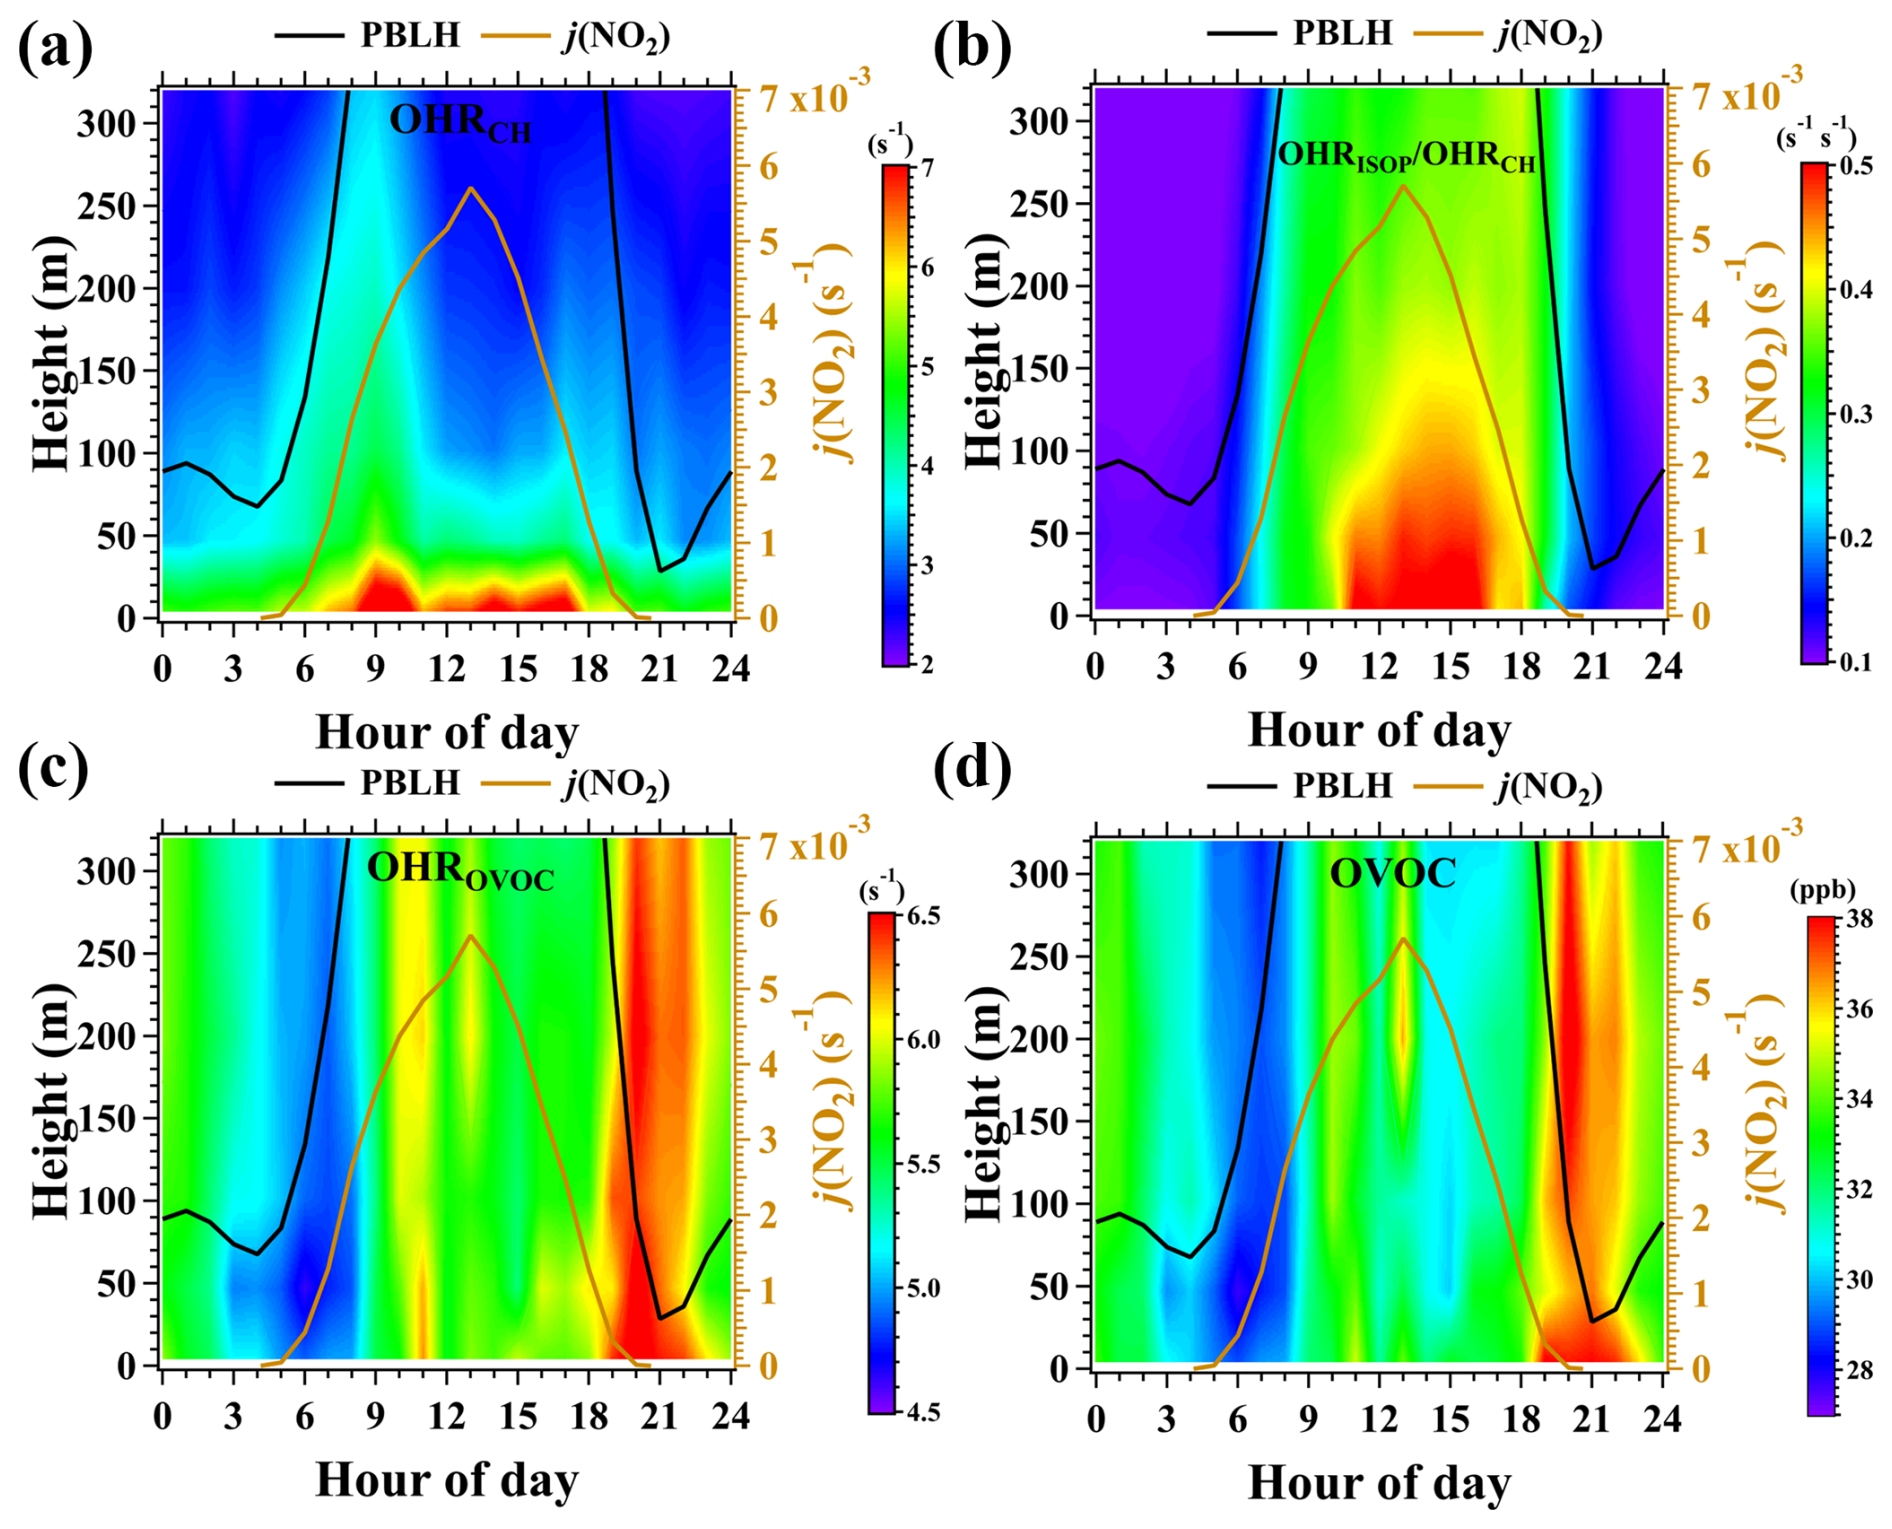
Figure 6(a–b) Average diurnal and vertical variations in the OHRs of CxHy and the OHR ratios of isoprene to CxHy (OHRISOP OHRCH) during the campaign. (c–d) Average diurnal and vertical variations in the mixing ratios and OHRs of OVOC. ISOP refers to isoprene. The figures were obtained by linearly interpolating the data at the five measurement heights on both altitude and temporal scales.
The total concentrations and OHRs of OVOCs decreased only slightly with the increase in height below 320 m in daytime, as shown in Fig. 6c–d. This is consistent with the results of Y. Wang et al. (2021), who observed high concentrations of OVOCs in the upper PBL. Consequently, the ratio of OHROVOC to OHRCH, denoted by OHROVOC OHRCH, rapidly increased from 0.87 at 5 m to 2.6 at 320 m (Fig. 7a). This suggests that OVOCs may play more important roles in regulating photochemical ozone formation in the middle and upper layers. To assess their potential roles in contributing to photochemical ozone formation throughout the PBL, we calculated the mean OHRs (MOHRs) of different VOC categories in daytime using Eq. (5):
where MOHR(X) is the MOHR of the VOC category X, and [X]i is the concentration of X at the ith altitude (namely 5, 47, 102, 200, and 320 m for hi) above ground level.
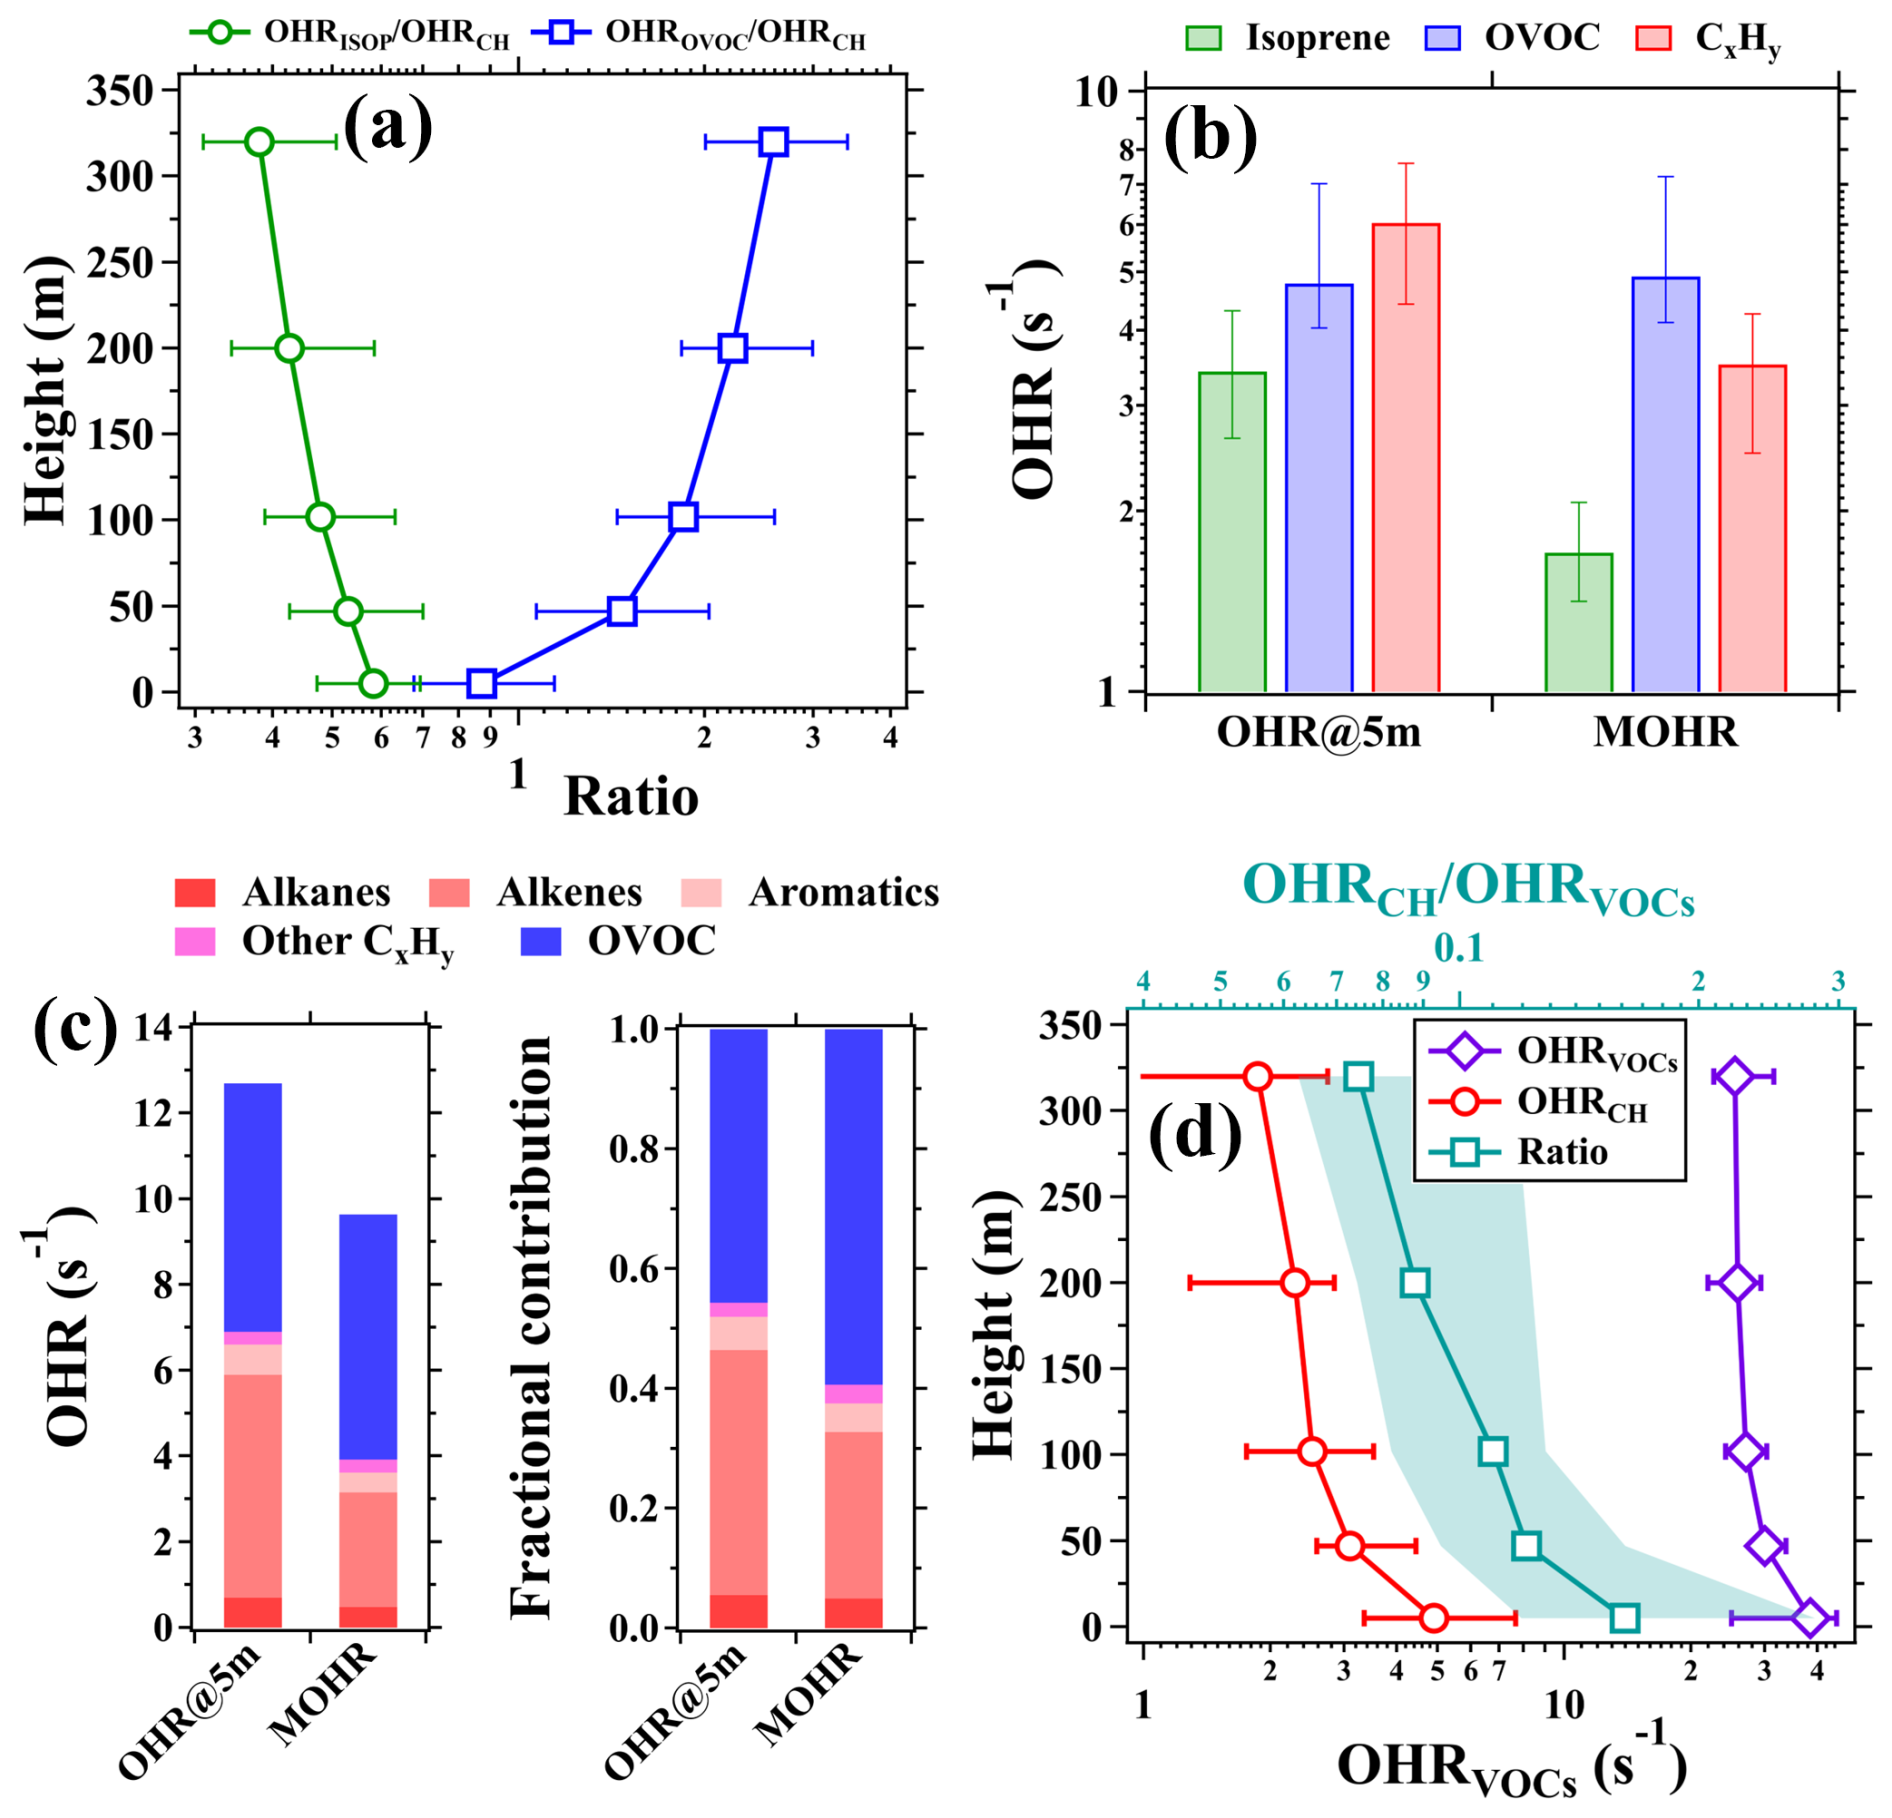
Figure 7(a) Average vertical profiles of OHR ratios of isoprene to CxHy (OHRISOP OHRCH) and OVOC to NMHC (OHROVOC OHRCH). (b) Median values of the OHR at 5 m and the mean OHR (MOHR) between 5 and 320 m for isoprene, OVOC, and CxHy. (c) Mean contributions of different VOC categories to the MOHR below 320 m and the OHR at 5 m. (d) Vertical profiles of the measured OHRVOCs and the calculated OHRCH (bottom axis) and the OHRCH OHRVOCs ratios (top axis) during 28–31 July 2021. The data used for analysis in panels (a)–(d) were within the time window from 11:00 to 16:00 LT during the campaign. The markers in panels (a) and (d) represent median values. The shaded areas and error bars in panels (a), (b), and (d) indicate the range between the 25th and 75th percentiles.
As shown in Fig. 7b, the campaign median MOHR for isoprene was 1.7 s−1 and accounted for 48 % of the campaign median MOHR of the CxHy category. This fraction was significantly lower than that of isoprene (57 %) in OHRCH at 5 m. In addition, the campaign median MOHR of the CxHy category (3.5 s−1) was also significantly lower than OHRCH (6.0 s−1) at 5 m. By contrast, the campaign median MOHR of OVOCs (4.8 s−1) was comparable to that of OHROVOC (4.9 s−1) at 5 m. As unsaturated hydrocarbons, most alkene species are more reactive than alkanes and aromatics (Atkinson and Arey, 2003). As a result, alkenes had dominant contributions to the MOHR of the CxHy category and OHRCH at 5 m in daytime. As shown in Fig. 7c, the campaign mean OHRs of alkanes, alkenes, and aromatics at 5 m in daytime were 0.7, 5.2, and 0.7 s−1, respectively, accounting for 10 %, 75 %, and 10 % of OHRCH. However, the campaign mean MOHRs of alkanes, alkenes, and aromatics were 0.5, 2.7, and 0.5 s−1, respectively, accounting for 12 %, 68 %, and 12 % of the MOHRs of NMHC. We can also expect that the total contributions of alkenes to the MOHR of the CxHy category in daytime will significantly decrease if their vertical distributions in the whole PBL are considered.
This study investigated and compared the vertical profiles of measured OHRVOCs and calculated OHRCH during daytime over the period of 28–31 July, as shown in Fig. 7d. The campaign median of the measured OHRVOCs exhibited a slow decrease from 38.4 s−1 at 5 m to 25.4 s−1 at 320 m. As anticipated, the OHRCH OHRVOCs ratio declined rapidly from 16 % to 7 % from 5 to 320 m. It is important to note that the small OHRCH OHRVOCs ratio and its declining trend with the increasing height do not imply an insignificant role of hydrocarbons in regulating the secondary pollutant formation in higher altitudes. The measured concentrations of hydrocarbons are merely the remnants of chemical reactions. The oxidation products of NMHCs, such as OVOCs and organic nitrates, formed during vertical mixing in daytime, will continue to participate in atmospheric chemical reactions.
3.3 Vertical variations in photochemical ozone formation
The surface ozone budget is intimately linked to the vertical variations in photochemical ozone formation throughout the PBL. Previous studies have consistently reported that the photochemical formation of ozone, encompassing both P(O3) and ozone formation regimes (namely the NOx-limited, VOC-limited, and transition regimes), is highly dependent on the change in its precursors (Shao et al., 2021; Yang et al., 2022). Consequently, any changes in the concentrations and compositions of VOCs and NOx within the PBL will inevitably lead to alternations in the vertical distribution of P(O3) and ozone formation regimes (Tang et al., 2017; Li et al., 2024).
Figure 8a illustrates the average dependence of P(O3) on NOx concentrations along with the normalized probability density (NPD) distribution of NOx concentrations at 5, 200, and 320 m in daytime during the field campaign. At different heights, P(O3) all rapidly increased with the rise in NOx until a critical NOx mixing ratio was reached, after which P(O3) decreased slowly. The critical NOx mixing ratios decreased from approximately 9.5 ppb at 5 m to 5.0 ppb at 320 m, primarily caused by the decreases in both NOx concentrations and the OHRs of VOCs. As also shown in Fig. 8a, the majority of the measured NOx mixing ratios falls into the transition zone of the P(O3)–NOx curves, suggesting that the photochemical ozone formation in Beijing belonged to the transition regime below 320 m.
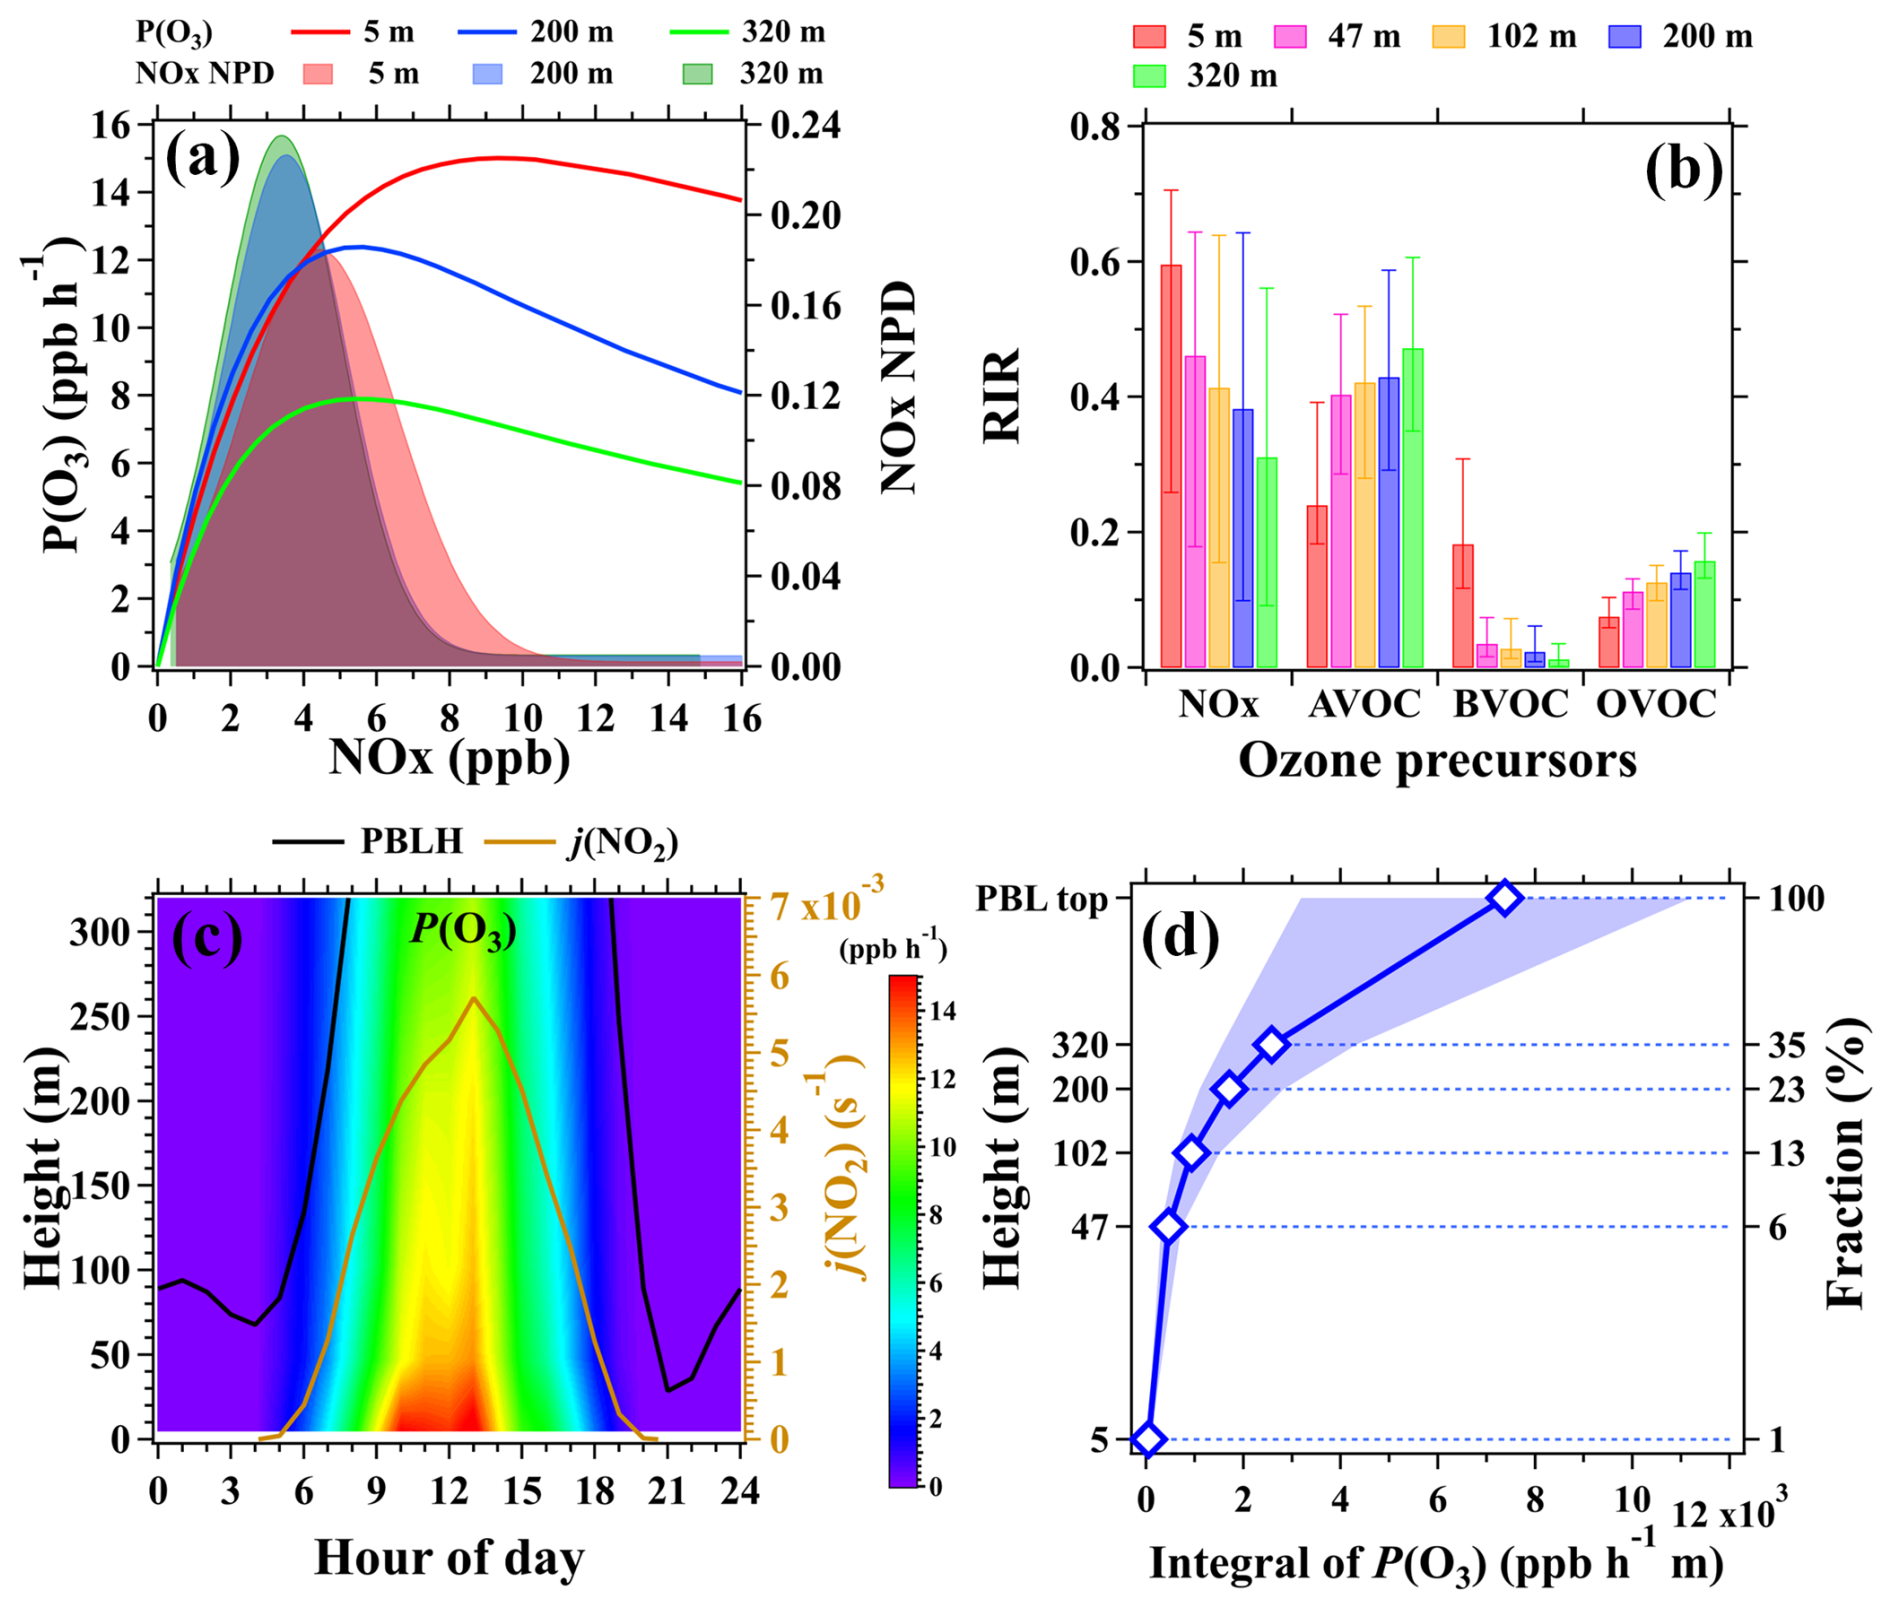
Figure 8(a) Left axis – average dependence of P(O3) on NOx concentrations in daytime during the campaign; right axis – normalized probability density (NPD) of NOx mixing ratios in daytime at the three inlet heights. (b) Median RIR values of photochemical ozone formation with respect to changes in NOx, AVOCs (NMHCs excluding BVOC), BVOCs (isoprene), and OVOCs (nine OVOC species in Table S1) at the five inlet heights. The error bars indicate the range between the 25th and 75th percentiles. (c) Average diurnal and vertical variations in P(O3) during the campaign. The figure was obtained by linearly interpolating the data at the five measurement heights on both altitude and temporal scales. (d) The vertical profile of the integral of P(O3) in daytime during the campaign, with markers indicating the median values and shaded areas indicating the range between the 25th and 75th percentiles.
RIR values were also calculated using the box model results to further elucidate the sensitivities of photochemical ozone formation to changes in multiple precursors at different altitudes. As shown in Fig. 8b, positive RIR values were observed for both NOx and various VOC groups at the five heights, further confirming that the photochemical ozone formation belonged to the transition regime in the lower layer. RIR values for NOx declined rapidly from 5 to 320 m, implying that the photochemical ozone formation in higher altitudes was more prone to be controlled by the abundance of VOCs. This is also manifested by the increasing RIR values for both AVOCs and OVOCs from 5 to 320 m. RIR values for BVOCs decreased significantly with height due to their rapid removal by reactions with OH radicals when being vertically mixed. These results are consistent with the results in Sect. 3.3 suggesting that the less reactive AVOCs and OVOCs are the dominant species in regulating photochemical formation of ozone in urban regions aloft.
According to the vertical distribution patterns of the photochemical ozone formation regime, P(O3) decreases with increasing height alongside simultaneous declines in concentrations of both NOx and VOCs. Figure 8c presents the average diurnal and vertical variations in P(O3) calculated by the box model during the campaign. The P(O3) values were higher in daytime and correlated well with j(NO2). P(O3) decreased from the ground to 320 m, where it still maintained a relatively high value of approximately 10 ppb h−1 at noon. These results highlight that the photochemical formation of ozone aloft also remained strong compared to that at ground level. Consequently, the downward transport of ozone from high altitudes, driven by turbulence mixing, can become a significant source of surface ozone during the day (Karl et al., 2023).
Due to the measurement height limitation, the vertical distributions of P(O3) in the middle and upper parts of the PBL were not determined in this study. As reported by the work in Benish et al. (2020), P(O3) typically exhibited weak and nearly linear decline tendencies from 300 m to the top of the PBL during daytime. P(O3) at the PBL top was approximately half of that at 300 m. Consequently, we can assume that P(O3) decreased linearly from 320 m to the top of the PBL. The integral of P(O3) at different heights within the PBL can then be estimated using a similar method to that described in Eq. (5).
As shown in Fig. 8d, the total amount of ozone photochemically produced below 47 m constituted a mere 6 % of the entire PBL. This fractional contribution increased to approximately 35 % at 320 m, further corroborating the finding that the majority of the boundary layer ozone was produced in the middle and upper layers. Given the enhancement of turbulence vertical mixing in daytime, ozone produced at high altitudes becomes a significant source of surface ozone. This is substantiated by the widespread reports of strong downward ozone fluxes in the bottom part of the PBL (tens of meters above ground level) (Fares et al., 2010; Liu et al., 2021; Karl et al., 2023). Consequently, when devising ozone control strategies, particularly in urban regions with intricate precursor emissions, careful considerations should be given to the vertical variations in the formation regimes of ozone in the PBL.
Inadequate vertical distribution data of volatile organic compounds (VOCs) pose a significant barrier to fully comprehending the mechanisms underlying photochemical ozone formation and devising effective mitigation strategies. To address this concern, we made vertical gradient measurements of VOCs, NOx, and ozone based on a 325 m tall tower in urban Beijing during the summer of 2021. This study offered more exhaustive and nuanced insights into the vertical variability of VOCs compared to previous studies. Our findings underscored that the vertical variations in VOCs were strictly regulated by the diurnal evolution of the PBL and chemical processes. In daytime, reactive NMHCs were rapidly oxidized when they were mixed upward along with the formation of OVOCs. As a result, concentrations of NMHCs decreased with height, and many OVOC species increased with height. OVOC species played more significant roles in regulating photochemical ozone formation in urban regions aloft.
Model simulations unveiled that the photochemical formation of ozone belongs to the transition regime in the lower PBL and that it becomes more sensitive to changes in the concentrations of AVOCs and OVOCs with height. With the further increase in height, the photochemical formation of ozone may change to the NOx control regime due to the total OHR of VOCs decreasing much slower than NOx concentrations. P(O3) exhibited decreasing tendencies with height due to coupled declines in concentrations of NOx and VOCs. P(O3) still remained large in high altitudes, likely driven by high OVOC concentrations. This implies that the bulk of ozone formation occurs within the middle and upper strata of the PBL rather than proximate to the ground surface. Therefore, regional ozone control strategies necessitate meticulous consideration of vertical gradients in P(O3) and the varying regimes of photochemical ozone formation throughout the entire PBL.
The vertical variations in the concentrations and compositions of VOCs significantly influence ozone formation. In addition, the vertical changes in chemical reaction environments (e.g., temperature, humidity, and solar radiation) and concentrations of other chemicals (e.g., particulate matters, NOx, and ozone) can also impact the degradation pathways of VOCs. These factors also affect the formation pathways and production yields of other secondary air pollutants, such as formic acid, isocyanic acid, and secondary organic aerosol. This is particularly crucial for the highly reactive NMHCs in urban areas with complex anthropogenic and biogenic emissions.
Limitations of our study include the confinement of measurements below 320 m due to the tower's height, leaving the middle and upper daytime PBL's VOC distributions and chemistries unexplored. Additionally, the absence of measurements for some key chemical species like HONO, organic aerosol components, and reactive halogen species might have implications for the accuracy of our box model results. Future endeavors could integrate multiple observational techniques to capture a broader vertical scope and a more comprehensive suite of species, thereby enhancing our understanding of how vertical variations in VOC chemistry impact secondary pollution formation.
The observational data used in this study are available from the corresponding author upon request.
The supplement related to this article is available online at https://doi.org/10.5194/acp-25-2459-2025-supplement.
BY, XBL, and YH designed the research. XBL, BY, YH, XS, JQ, XH, SW, YC, QY, YS, YP, GT, JG, and MS contributed to data collection and data analysis. XBL, SY, and BY designed and performed the box model simulations. XBL and BY wrote the paper with contributions from all coauthors. All the coauthors discussed the results and reviewed the paper.
The contact author has declared that none of the authors has any competing interests.
Publisher’s note: Copernicus Publications remains neutral with regard to jurisdictional claims made in the text, published maps, institutional affiliations, or any other geographical representation in this paper. While Copernicus Publications makes every effort to include appropriate place names, the final responsibility lies with the authors.
The authors would like to thank the personnel who participated in data collection, instrument maintenance, and logistic support during the field campaign.
This work was financially supported by the National Key R&D Program of China (grant nos. 2023YFC3706103, 2023YFC3706201, 2023YFC3710900, and 2022YFC3700604) and the National Natural Science Foundation of China (grant nos. 42305095, 42475107, 42121004, 42275103, 42205094, and 42230701). This work was also supported by the Guangdong Basic and Applied Basic Research Foundation (grant no. 2024A1515011570) and Guangzhou Basic and Applied Basic Research Foundation (grant no. 2024A04J3958).
This paper was edited by Arthur Chan and reviewed by two anonymous referees.
An, J., Huang, Y., Huang, C., Wang, X., Yan, R., Wang, Q., Wang, H., Jing, S., Zhang, Y., Liu, Y., Chen, Y., Xu, C., Qiao, L., Zhou, M., Zhu, S., Hu, Q., Lu, J., and Chen, C.: Emission inventory of air pollutants and chemical speciation for specific anthropogenic sources based on local measurements in the Yangtze River Delta region, China, Atmos. Chem. Phys., 21, 2003–2025, https://doi.org/10.5194/acp-21-2003-2021, 2021.
Atkinson, R. and Arey, J.: Atmospheric Degradation of Volatile Organic Compounds, Chem. Rev., 103, 4605–4638, https://doi.org/10.1021/cr0206420, 2003.
Benish, S. E., He, H., Ren, X., Roberts, S. J., Salawitch, R. J., Li, Z., Wang, F., Wang, Y., Zhang, F., Shao, M., Lu, S., and Dickerson, R. R.: Measurement report: Aircraft observations of ozone, nitrogen oxides, and volatile organic compounds over Hebei Province, China, Atmos. Chem. Phys., 20, 14523–14545, https://doi.org/10.5194/acp-20-14523-2020, 2020.
Brown, S. S., Dubé, W. P., Osthoff, H. D., Wolfe, D. E., Angevine, W. M., and Ravishankara, A. R.: High resolution vertical distributions of NO3 and N2O5 through the nocturnal boundary layer, Atmos. Chem. Phys., 7, 139–149, https://doi.org/10.5194/acp-7-139-2007, 2007.
Cooper, O. R., Schultz, M. G., Schroeder, S., Chang, K.-L., Gaudel, A., Benitez, G. C., Cuevas, E., Froehlich, M., Galbally, I. E., Molloy, S., Kubistin, D., Lu, X., McClure-Begley, A., Nedelec, P., O'Brien, J., Oltmans, S. J., Petropavlovskikh, I., Ries, L., Senik, I., Sjoeberg, K., Solberg, S., Spain, G. T., Spangl, W., Steinbacher, M., Tarasick, D., Thouret, V., and Xu, X.: Multi-decadal surface ozone trends at globally distributed remote locations, Elementa-Sci. Anthropo., 8, 23, https://doi.org/10.1525/elementa.420, 2020.
Dieu Hien, V. T., Lin, C., Thanh, V. C., Kim Oanh, N. T., Thanh, B. X., Weng, C.-E., Yuan, C.-S., and Rene, E. R.: An overview of the development of vertical sampling technologies for ambient volatile organic compounds (VOCs), J. Environ. Manage., 247, 401–412, https://doi.org/10.1016/j.jenvman.2019.06.090, 2019.
Fares, S., McKay, M., Holzinger, R., and Goldstein, A. H.: Ozone fluxes in a Pinus ponderosa ecosystem are dominated by non-stomatal processes: Evidence from long-term continuous measurements, Agr. Forest Meteorol., 150, 420–431, https://doi.org/10.1016/j.agrformet.2010.01.007, 2010.
Fleming, Z. L., Doherty, R. M., von Schneidemesser, E., Malley, C. S., Cooper, O. R., Pinto, J. P., Colette, A., Xu, X., Simpson, D., Schultz, M. G., Lefohn, A. S., Hamad, S., Moolla, R., Solberg, S., and Feng, Z.: Tropospheric Ozone Assessment Report: Present-day ozone distribution and trends relevant to human health, Elementa-Sci. Anthropo., 6, 12, https://doi.org/10.1525/elementa.273 2018.
Geng, C., Wang, J., Yin, B., Zhao, R., Li, P., Yang, W., Xiao, Z., Li, S., Li, K., and Bai, Z.: Vertical distribution of volatile organic compounds conducted by tethered balloon in the Beijing-Tianjin-Hebei region of China, J. Environ. Sci., 95, 121–129, https://doi.org/10.1016/j.jes.2020.03.026, 2020.
Geyer, A. and Stutz, J.: Vertical profiles of NO3, N2O5, O3, and NOx in the nocturnal boundary layer: 2. Model studies on the altitude dependence of composition and chemistry, J. Geophys. Res.-Atmos., 109, D12307, https://doi.org/10.1029/2003jd004211, 2004.
Gkatzelis, G. I., Coggon, M. M., McDonald, B. C., Peischl, J., Gilman, J. B., Aikin, K. C., Robinson, M. A., Canonaco, F., Prevot, A. S. H., Trainer, M., and Warneke, C.: Observations Confirm that Volatile Chemical Products Are a Major Source of Petrochemical Emissions in U.S. Cities, Environ. Sci. Technol., 55, 4332–4343, https://doi.org/10.1021/acs.est.0c05471, 2021.
Gómez, M. C., Durana, N., García, J. A., de Blas, M., Sáez de Cámara, E., García-Ruiz, E., Gangoiti, G., Torre-Pascual, E., and Iza, J.: Long-term measurement of biogenic volatile organic compounds in a rural background area: Contribution to ozone formation, Atmos. Environ., 224, 117315, https://doi.org/10.1016/j.atmosenv.2020.117315, 2020.
Guo, H., Ling, Z. H., Cheng, H. R., Simpson, I. J., Lyu, X. P., Wang, X. M., Shao, M., Lu, H. X., Ayoko, G., Zhang, Y. L., Saunders, S. M., Lam, S. H. M., Wang, J. L., and Blake, D. R.: Tropospheric volatile organic compounds in China, Sci. Total. Environ., 574, 1021–1043, https://doi.org/10.1016/j.scitotenv.2016.09.116, 2017.
Guo, J.-X., Zeng, Y., Zhu, K., and Tan, X.: Vehicle mix evaluation in Beijing's passenger-car sector: From air pollution control perspective, Sci. Total Environ., 785, 147264, https://doi.org/10.1016/j.scitotenv.2021.147264, 2021.
He, G., He, C., Wang, H., Lu, X., Pei, C., Qiu, X., Liu, C., Wang, Y., Liu, N., Zhang, J., Lei, L., Liu, Y., Wang, H., Deng, T., Fan, Q., and Fan, S.: Nighttime ozone in the lower boundary layer: insights from 3-year tower-based measurements in South China and regional air quality modeling, Atmos. Chem. Phys., 23, 13107–13124, https://doi.org/10.5194/acp-23-13107-2023, 2023.
He, X., Yuan, B., Wu, C., Wang, S., Wang, C., Huangfu, Y., Qi, J., Ma, N., Xu, W., Wang, M., Chen, W., Su, H., Cheng, Y., and Shao, M.: Volatile organic compounds in wintertime North China Plain: Insights from measurements of proton transfer reaction time-of-flight mass spectrometer (PTR-ToF-MS), J. Environ. Sci. (China), 114, 98–114, https://doi.org/10.1016/j.jes.2021.08.010, 2022.
Hofzumahaus, A., Rohrer, F., Lu, K., Bohn, B., Brauers, T., Chang, C.-C., Fuchs, H., Holland, F., Kita, K., Kondo, Y., Li, X., Lou, S., Shao, M., Zeng, L., Wahner, A., and Zhang, Y.: Amplified Trace Gas Removal in the Troposphere, Science, 324, 1702–1704, https://doi.org/10.1126/science.1164566, 2009.
Karl, T., Lamprecht, C., Graus, M., Cede, A., Tiefengraber, M., Vila-Guerau de Arellano, J., Gurarie, D., and Lenschow, D.: High urban NOx triggers a substantial chemical downward flux of ozone, Sci. Adv., 9, eadd2365, https://doi.org/10.1126/sciadv.add2365, 2023.
Kaser, L., Patton, E. G., Pfister, G. G., Weinheimer, A. J., Montzka, D. D., Flocke, F., Thompson, A. M., Stauffer, R. M., and Halliday, H. S.: The effect of entrainment through atmospheric boundary layer growth on observed and modeled surface ozone in the Colorado Front Range, J. Geophys. Res.-Atmos., 122, 6075–6093, https://doi.org/10.1002/2016jd026245, 2017.
Kim, S., Seco, R., Gu, D., Sanchez, D., Jeong, D., Guenther, A. B., Lee, Y., Mak, J. E., Su, L., Kim, D. B., Lee, Y., Ahn, J.-Y., McGee, T., Sullivan, J., Long, R., Brune, W. H., Thames, A., Wisthaler, A., Mueller, M., Mikoviny, T., Weinheimer, A., Yang, M., Woo, J.-H., Kim, S., and Park, H.: The role of a suburban forest in controlling vertical trace gas and OH reactivity distributions – a case study for the Seoul metropolitan area, Faraday Discuss, 226, 537–550, https://doi.org/10.1039/d0fd00081g, 2021.
Li, C., Liu, Y., Cheng, B., Zhang, Y., Liu, X., Qu, Y., An, J., Kong, L., Zhang, Y., Zhang, C., Tan, Q., and Feng, M.: A comprehensive investigation on volatile organic compounds (VOCs) in 2018 in Beijing, China: Characteristics, sources and behaviours in response to O3 formation, Sci. Total Environ., 806, 150247, https://doi.org/10.1016/j.scitotenv.2021.150247, 2022.
Li, X.-B. and Fan, G.: Interannual variations, sources, and health impacts of the springtime ozone in Shanghai, Environ. Pollut., 306, 119458, https://doi.org/10.1016/j.envpol.2022.119458, 2022.
Li, X.-B., Wang, D., Lu, Q.-C., Peng, Z.-R., Fu, Q., Hu, X.-M., Huo, J., Xiu, G., Li, B., Li, C., Wang, D.-S., and Wang, H.: Three-dimensional analysis of ozone and PM2.5 distributions obtained by observations of tethered balloon and unmanned aerial vehicle in Shanghai, China, Stoch. Env. Res. Risk A, 32, 1189–1203, https://doi.org/10.1007/s00477-018-1524-2, 2018.
Li, X.-B., Yuan, B., Parrish, D. D., Chen, D., Song, Y., Yang, S., Liu, Z., and Shao, M.: Long-term trend of ozone in southern China reveals future mitigation strategy for air pollution, Atmos. Environ., 269, 118869, https://doi.org/10.1016/j.atmosenv.2021.118869, 2022a.
Li, X.-B., Yuan, B., Wang, S., Wang, C., Lan, J., Liu, Z., Song, Y., He, X., Huangfu, Y., Pei, C., Cheng, P., Yang, S., Qi, J., Wu, C., Huang, S., You, Y., Chang, M., Zheng, H., Yang, W., Wang, X., and Shao, M.: Variations and sources of volatile organic compounds (VOCs) in urban region: insights from measurements on a tall tower, Atmos. Chem. Phys., 22, 10567–10587, https://doi.org/10.5194/acp-22-10567-2022, 2022b.
Li, X.-B., Zhang, C., Liu, A., Yuan, B., Yang, H., Liu, C., Wang, S., Huangfu, Y., Qi, J., Liu, Z., He, X., Song, X., Chen, Y., Peng, Y., Zhang, X., Zheng, E., Yang, L., Yang, Q., Qin, G., Zhou, J., and Shao, M.: Assessment of long tubing in measuring atmospheric trace gases: applications on tall towers, Environ. Sci.-Atmos., 3, 506–520, https://doi.org/10.1039/d2ea00110a, 2023.
Li, X., Wang, W., Yang, S., Cheng, Y., Zeng, L., Yu, X., Lu, S., Liu, Y., Hu, M., Xie, S., Huang, X., Zhou, J., Shi, L., Xu, H., Lin, S., Liu, H., Feng, M., Song, D., Tan, Q., and Zhang, Y.: Ozone sensitivity regimes vary at different heights in the planetary boundary layer, Sci. Total Environ., 944, 173712, https://doi.org/10.1016/j.scitotenv.2024.173712, 2024.
Liu, X., Deming, B., Pagonis, D., Day, D. A., Palm, B. B., Talukdar, R., Roberts, J. M., Veres, P. R., Krechmer, J. E., Thornton, J. A., de Gouw, J. A., Ziemann, P. J., and Jimenez, J. L.: Effects of gas–wall interactions on measurements of semivolatile compounds and small polar molecules, Atmos. Meas. Tech., 12, 3137–3149, https://doi.org/10.5194/amt-12-3137-2019, 2019.
Liu, Y., Tang, G., Wang, Y., Cheng, M., Gao, J., and Wang, Y.: Spatiotemporal differences in tropospheric ozone sensitivity and the impact of “dual carbon” goal, Sci. Bull., 69, 422–425, https://doi.org/10.1016/j.scib.2023.12.026, 2024a.
Liu, Y., Yin, S., Zhang, S., Ma, W., Zhang, X., Qiu, P., Li, C., Wang, G., Hou, D., Zhang, X., An, J., Sun, Y., Li, J., Zhang, Z., Chen, J., Tian, H., Liu, X., and Liu, L.: Drivers and impacts of decreasing concentrations of atmospheric volatile organic compounds (VOCs) in Beijing during 2016–2020, Sci. Total Environ., 906, 167847, https://doi.org/10.1016/j.scitotenv.2023.167847, 2024b.
Liu, Z., Pan, Y., Song, T., Hu, B., Wang, L., and Wang, Y.: Eddy covariance measurements of ozone flux above and below a southern subtropical forest canopy, Sci. Total Environ., 791, 148338, https://doi.org/10.1016/j.scitotenv.2021.148338, 2021.
Lu, K. D., Rohrer, F., Holland, F., Fuchs, H., Bohn, B., Brauers, T., Chang, C. C., Häseler, R., Hu, M., Kita, K., Kondo, Y., Li, X., Lou, S. R., Nehr, S., Shao, M., Zeng, L. M., Wahner, A., Zhang, Y. H., and Hofzumahaus, A.: Observation and modelling of OH and HO2 concentrations in the Pearl River Delta 2006: a missing OH source in a VOC rich atmosphere, Atmos. Chem. Phys., 12, 1541–1569, https://doi.org/10.5194/acp-12-1541-2012, 2012.
Lu, Y., Pang, X., Lyu, Y., Li, J., Xing, B., Chen, J., Mao, Y., Shang, Q., and Wu, H.: Characteristics and sources analysis of ambient volatile organic compounds in a typical industrial park: Implications for ozone formation in 2022 Asian Games, Sci. Total Environ., 848, 157746, https://doi.org/10.1016/j.scitotenv.2022.157746, 2022.
Ma, Z., Xu, H., Meng, W., Zhang, X., Xu, J., Liu, Q., and Wang, Y.: Vertical ozone characteristics in urban boundary layer in Beijing, Environ. Monit. Assess., 185, 5449–5460, https://doi.org/10.1007/s10661-012-2958-5, 2013.
Mo, Z., Shao, M., Wang, W., Liu, Y., Wang, M., and Lu, S.: Evaluation of biogenic isoprene emissions and their contribution to ozone formation by ground-based measurements in Beijing, China, Sci. Total Environ., 627, 1485–1494, https://doi.org/10.1016/j.scitotenv.2018.01.336, 2018.
Mo, Z., Huang, S., Yuan, B., Pei, C., Song, Q., Qi, J., Wang, M., Wang, B., Wang, C., Li, M., Zhang, Q., and Shao, M.: Deriving emission fluxes of volatile organic compounds from tower observation in the Pearl River Delta, China, Sci. Total Environ., 741, 139763, https://doi.org/10.1016/j.scitotenv.2020.139763, 2020.
Niu, H., Li, K., Chu, B., Su, W., and Li, J.: Heterogeneous Reactions between Toluene and NO2 on Mineral Particles under Simulated Atmospheric Conditions, Environ. Sci. Technol., 51, 9596–9604, https://doi.org/10.1021/acs.est.7b00194, 2017.
Ou, J., Zheng, J., Li, R., Huang, X., Zhong, Z., Zhong, L., and Lin, H.: Speciated OVOC and VOC emission inventories and their implications for reactivity-based ozone control strategy in the Pearl River Delta region, China, Sci. Total Environ., 530–531, 393–402, https://doi.org/10.1016/j.scitotenv.2015.05.062, 2015.
Ou, J., Yuan, Z., Zheng, J., Huang, Z., Shao, M., Li, Z., Huang, X., Guo, H., and Louie, P. K. K.: Ambient Ozone Control in a Photochemically Active Region: Short-Term Despiking or Long-Term Attainment?, Environ. Sci. Technol., 50, 5720–5728, https://doi.org/10.1021/acs.est.6b00345, 2016.
Pagonis, D., Krechmer, J. E., de Gouw, J., Jimenez, J. L., and Ziemann, P. J.: Effects of gas–wall partitioning in Teflon tubing and instrumentation on time-resolved measurements of gas-phase organic compounds, Atmos. Meas. Tech., 10, 4687–4696, https://doi.org/10.5194/amt-10-4687-2017, 2017.
Perdigones, B. C., Lee, S., Cohen, R. C., Park, J.-H., and Min, K.-E.: Two Decades of Changes in Summertime Ozone Production in California's South Coast Air Basin, Environ. Sci. Technol., 56, 10586–10595, https://doi.org/10.1021/acs.est.2c01026, 2022.
Qi, J., Mo, Z., Yuan, B., Huang, S., Huangfu, Y., Wang, Z., Li, X., Yang, S., Wang, W., Zhao, Y., Wang, X., Wang, W., Liu, K., and Shao, M.: An observation approach in evaluation of ozone production to precursor changes during the COVID-19 lockdown, Atmos. Environ., 262, 118618, https://doi.org/10.1016/j.atmosenv.2021.118618, 2021.
Sangiorgi, G., Ferrero, L., Perrone, M. G., Bolzacchini, E., Duane, M., and Larsen, B. R.: Vertical distribution of hydrocarbons in the low troposphere below and above the mixing height: Tethered balloon measurements in Milan, Italy, Environ Pollut, 159, 3545–3552, https://doi.org/10.1016/j.envpol.2011.08.012, 2011.
Shao, M., Wang, W., Yuan, B., Parrish, D. D., Li, X., Lu, K., Wu, L., Wang, X., Mo, Z., Yang, S., Peng, Y., Kuang, Y., Chen, W., Hu, M., Zeng, L., Su, H., Cheng, Y., Zheng, J., and Zhang, Y.: Quantifying the role of PM2.5 dropping in variations of ground-level ozone: Inter-comparison between Beijing and Los Angeles, Sci. Total Environ., 788, 147712, https://doi.org/10.1016/j.scitotenv.2021.147712, 2021.
Song, X., Li, X.-B., Yuan, B., He, X., Chen, Y., Wang, S., Huangfu, Y., Peng, Y., Zhang, C., Liu, A., Yang, H., Liu, C., Li, J., and Shao, M.: Elucidating key factors in regulating budgets of ozone and its precursors in atmospheric boundary layer, Clim. Atmos. Sci., 7, 262, doi;10.1038/s41612-024-00818-8, 2024.
Souri, A. H., Nowlan, C. R., Wolfe, G. M., Lamsal, L. N., Chan Miller, C. E., Abad, G. G., Janz, S. J., Fried, A., Blake, D. R., Weinheimer, A. J., Diskin, G. S., Liu, X., and Chance, K.: Revisiting the effectiveness of HCHO/NO2 ratios for inferring ozone sensitivity to its precursors using high resolution airborne remote sensing observations in a high ozone episode during the KORUS-AQ campaign, Atmos. Environ., 224, 117341, https://doi.org/10.1016/j.atmosenv.2020.117341, 2020.
Sun, J., Wang, Y., Wu, F., Tang, G., Wang, L., Wang, Y., and Yang, Y.: Vertical characteristics of VOCs in the lower troposphere over the North China Plain during pollution periods, Environ. Pollut., 236, 907–915, https://doi.org/10.1016/j.envpol.2017.10.051, 2018.
Tang, G., Zhu, X., Xin, J., Hu, B., Song, T., Sun, Y., Zhang, J., Wang, L., Cheng, M., Chao, N., Kong, L., Li, X., and Wang, Y.: Modelling study of boundary-layer ozone over northern China – Part I: Ozone budget in summer, Atmos. Res., 187, 128–137, https://doi.org/10.1016/j.atmosres.2016.10.017, 2017.
Velasco, E., Márquez, C., Bueno, E., Bernabé, R. M., Sánchez, A., Fentanes, O., Wöhrnschimmel, H., Cárdenas, B., Kamilla, A., Wakamatsu, S., and Molina, L. T.: Vertical distribution of ozone and VOCs in the low boundary layer of Mexico City, Atmos. Chem. Phys., 8, 3061–3079, https://doi.org/10.5194/acp-8-3061-2008, 2008.
Vo, T.-D.-H., Lin, C., Weng, C.-E., Yuan, C.-S., Lee, C.-W., Hung, C.-H., Bui, X.-T., Lo, K.-C., and Lin, J.-X.: Vertical stratification of volatile organic compounds and their photochemical product formation potential in an industrial urban area, J. Environ. Manage., 217, 327–336, https://doi.org/10.1016/j.jenvman.2018.03.101, 2018.
Wang, C., Yuan, B., Wu, C., Wang, S., Qi, J., Wang, B., Wang, Z., Hu, W., Chen, W., Ye, C., Wang, W., Sun, Y., Wang, C., Huang, S., Song, W., Wang, X., Yang, S., Zhang, S., Xu, W., Ma, N., Zhang, Z., Jiang, B., Su, H., Cheng, Y., Wang, X., and Shao, M.: Measurements of higher alkanes using NO+ chemical ionization in PTR-ToF-MS: important contributions of higher alkanes to secondary organic aerosols in China, Atmos. Chem. Phys., 20, 14123–14138, https://doi.org/10.5194/acp-20-14123-2020, 2020.
Wang, H., Ma, X., Tan, Z., Wang, H., Chen, X., Chen, S., Gao, Y., Liu, Y., Liu, Y., Yang, X., Yuan, B., Zeng, L., Huang, C., Lu, K., and Zhang, Y.: Anthropogenic monoterpenes aggravating ozone pollution, Natl. Sci. Rev., 9, nwac103, https://doi.org/10.1093/nsr/nwac103, 2022.
Wang, N., Lyu, X., Deng, X., Huang, X., Jiang, F., and Ding, A.: Aggravating O3 pollution due to NOx emission control in eastern China, Sci. Total Environ., 677, 732–744, https://doi.org/10.1016/j.scitotenv.2019.04.388, 2019.
Wang, N., Huang, X., Xu, J., Wang, T., Tan, Z.-M., and Ding, A.: Typhoon-boosted biogenic emission aggravates cross-regional ozone pollution in China, Sci. Adv., 8, eabl6166, https://doi.org/10.1126/sciadv.abl6166 2022.
Wang, W., Qi, J., Zhou, J., Yuan, B., Peng, Y., Wang, S., Yang, S., Williams, J., Sinha, V., and Shao, M.: The improved comparative reactivity method (ICRM): measurements of OH reactivity under high-NOx conditions in ambient air, Atmos. Meas. Tech., 14, 2285–2298, https://doi.org/10.5194/amt-14-2285-2021, 2021.
Wang, W., Yuan, B., Peng, Y., Su, H., Cheng, Y., Yang, S., Wu, C., Qi, J., Bao, F., Huangfu, Y., Wang, C., Ye, C., Wang, Z., Wang, B., Wang, X., Song, W., Hu, W., Cheng, P., Zhu, M., Zheng, J., and Shao, M.: Direct observations indicate photodegradable oxygenated volatile organic compounds (OVOCs) as larger contributors to radicals and ozone production in the atmosphere, Atmos. Chem. Phys., 22, 4117–4128, https://doi.org/10.5194/acp-22-4117-2022, 2022.
Wang, W., Li, X., Cheng, Y., Parrish, D. D., Ni, R., Tan, Z., Liu, Y., Lu, S., Wu, Y., Chen, S., Lu, K., Hu, M., Zeng, L., Shao, M., Huang, C., Tian, X., Leung, K. M., Chen, L., Fan, M., Zhang, Q., Rohrer, F., Wahner, A., Pöschl, U., Su, H., and Zhang, Y.: Ozone pollution mitigation strategy informed by long-term trends of atmospheric oxidation capacity, Nat. Geosci., 17, 20–25, https://doi.org/10.1038/s41561-023-01334-9, 2024.
Wang, Y., Wang, Y., Tang, G., Yang, Y., Li, X., Yao, D., Wu, S., Kang, Y., Wang, M., and Wang, Y.: High gaseous carbonyl concentrations in the upper boundary layer in Shijiazhuang, China, Sci. Total Environ., 799, 149438, https://doi.org/10.1016/j.scitotenv.2021.149438, 2021.
Wang, Y. H., Gao, W. K., Wang, S., Song, T., Gong, Z. Y., Ji, D. S., Wang, L. L., Liu, Z. R., Tang, G. Q., Huo, Y. F., Tian, S. L., Li, J. Y., Li, M. G., Yang, Y., Chu, B. W., Petaja, T., Kerminen, V. M., He, H., Hao, J. M., Kulmala, M., Wang, Y. S., and Zhang, Y. H.: Contrasting trends of PM2.5 and surface-ozone concentrations in China from 2013 to 2017, Nat. Sci. Rev., 7, 1331–1339, https://doi.org/10.1093/nsr/nwaa032, 2020.
Wolfe, G. M., Marvin, M. R., Roberts, S. J., Travis, K. R., and Liao, J.: The Framework for 0-D Atmospheric Modeling (F0AM) v3.1, Geosci. Model Dev., 9, 3309–3319, https://doi.org/10.5194/gmd-9-3309-2016, 2016.
Wu, C., Wang, C., Wang, S., Wang, W., Yuan, B., Qi, J., Wang, B., Wang, H., Wang, C., Song, W., Wang, X., Hu, W., Lou, S., Ye, C., Peng, Y., Wang, Z., Huangfu, Y., Xie, Y., Zhu, M., Zheng, J., Wang, X., Jiang, B., Zhang, Z., and Shao, M.: Measurement report: Important contributions of oxygenated compounds to emissions and chemistry of volatile organic compounds in urban air, Atmos. Chem. Phys., 20, 14769–14785, https://doi.org/10.5194/acp-20-14769-2020, 2020.
Yang, Q., Li, X.-B., Yuan, B., Zhang, X., Huangfu, Y., Yang, L., He, X., Qi, J., and Shao, M.: Measurement report: Enhanced photochemical formation of formic and isocyanic acids in urban regions aloft – insights from tower-based online gradient measurements, Atmos. Chem. Phys., 24, 6865–6882, https://doi.org/10.5194/acp-24-6865-2024, 2024.
Yang, S., Yuan, B., Peng, Y., Huang, S., Chen, W., Hu, W., Pei, C., Zhou, J., Parrish, D. D., Wang, W., He, X., Cheng, C., Li, X.-B., Yang, X., Song, Y., Wang, H., Qi, J., Wang, B., Wang, C., Wang, C., Wang, Z., Li, T., Zheng, E., Wang, S., Wu, C., Cai, M., Ye, C., Song, W., Cheng, P., Chen, D., Wang, X., Zhang, Z., Wang, X., Zheng, J., and Shao, M.: The formation and mitigation of nitrate pollution: comparison between urban and suburban environments, Atmos. Chem. Phys., 22, 4539–4556, https://doi.org/10.5194/acp-22-4539-2022, 2022.
Yang, X., Wang, H., Lu, K., Ma, X., Tan, Z., Long, B., Chen, X., Li, C., Zhai, T., Li, Y., Qu, K., Xia, Y., Zhang, Y., Li, X., Chen, S., Dong, H., Zeng, L., and Zhang, Y.: Reactive aldehyde chemistry explains the missing source of hydroxyl radicals, Nat. Commun., 15, 1648, https://doi.org/10.1038/s41467-024-45885-w, 2024.
Ye, C., Yuan, B., Lin, Y., Wang, Z., Hu, W., Li, T., Chen, W., Wu, C., Wang, C., Huang, S., Qi, J., Wang, B., Wang, C., Song, W., Wang, X., Zheng, E., Krechmer, J. E., Ye, P., Zhang, Z., Wang, X., Worsnop, D. R., and Shao, M.: Chemical characterization of oxygenated organic compounds in the gas phase and particle phase using iodide CIMS with FIGAERO in urban air, Atmos. Chem. Phys., 21, 8455–8478, https://doi.org/10.5194/acp-21-8455-2021, 2021.
Yeo, M. J. and Kim, Y. P.: Long-term trends of surface ozone in Korea, J. Clean. Prod., 294, 125352, https://doi.org/10.1016/j.jclepro.2020.125352, 2021.
Yuan, B., Koss, A. R., Warneke, C., Coggon, M., Sekimoto, K., and de Gouw, J. A.: Proton-Transfer-Reaction Mass Spectrometry: Applications in Atmospheric Sciences, Chem. Rev., 117, 13187–13229, https://doi.org/10.1021/acs.chemrev.7b00325, 2017.
Zhang, K., Xiu, G., Zhou, L., Bian, Q., Duan, Y., Fei, D., Wang, D., and Fu, Q.: Vertical distribution of volatile organic compounds within the lower troposphere in late spring of Shanghai, Atmos. Environ., 186, 150–157, https://doi.org/10.1016/j.atmosenv.2018.03.044, 2018.
Zhang, Y., Xue, L., Mu, J., Chen, T., Li, H., Gao, J., and Wang, W.: Developing the Maximum Incremental Reactivity for Volatile Organic Compounds in Major Cities of Central-Eastern China, J. Geophys. Res.-Atmospheres, 127, e2022JD037296, https://doi.org/10.1029/2022JD037296, 2022.
Zhao, M., Zhang, Y., Pei, C., Chen, T., Mu, J., Liu, Y., Wang, Y., Wang, W., and Xue, L.: Worsening ozone air pollution with reduced NOx and VOCs in the Pearl River Delta region in autumn 2019: Implications for national control policy in China, J. Environ. Manage., 324, 116327, https://doi.org/10.1016/j.jenvman.2022.116327, 2022.