the Creative Commons Attribution 4.0 License.
the Creative Commons Attribution 4.0 License.
 | 19 Feb 2025
Observations of high-time-resolution and size-resolved aerosol chemical composition and microphysics in the central Arctic: implications for climate-relevant particle properties
Benjamin Heutte
Nora Bergner
Hélène Angot
Jakob B. Pernov
Lubna Dada
Jessica A. Mirrielees
Ivo Beck
Andrea Baccarini
Matthew Boyer
Jessie M. Creamean
Kaspar R. Daellenbach
Imad El Haddad
Markus M. Frey
Silvia Henning
Tiia Laurila
Vaios Moschos
Tuukka Petäjä
Kerri A. Pratt
Lauriane L. J. Quéléver
Matthew D. Shupe
Paul Zieger
Tuija Jokinen
Aerosols play a critical role in the Arctic's radiative balance, influencing solar radiation and cloud formation. Limited observations in the central Arctic leave gaps in understanding aerosol dynamics year-round, affecting model predictions of climate-relevant aerosol properties. Here, we present the first annual high-time-resolution observations of submicron aerosol chemical composition in the central Arctic during the Arctic Ocean 2018 (AO2018) and the 2019–2020 Multidisciplinary drifting Observatory for the Study of Arctic Climate (MOSAiC) expeditions. Seasonal variations in the aerosol mass concentrations and chemical composition in the central Arctic were found to be driven by typical Arctic seasonal regimes and resemble those of pan-Arctic land-based stations. Organic aerosols dominated the pristine summer, while anthropogenic sulfate prevailed in autumn and spring under haze conditions. Ammonium, which impacts aerosol acidity, was consistently less abundant, relative to sulfate, in the central Arctic compared to lower latitudes of the Arctic. Cyclonic (storm) activity was found to have a significant influence on aerosol variability by enhancing emissions from local sources and the transport of remote aerosol. Local wind-generated particles contributed up to 80 % (20 %) of the cloud condensation nuclei population in autumn (spring). While the analysis presented herein provides the current central Arctic aerosol baseline, which will serve to improve climate model predictions in the region, it also underscores the importance of integrating short-timescale processes, such as seasonal wind-driven aerosol sources from blowing snow and open leads/ocean in model simulations. This is particularly important, given the decline in mid-latitude anthropogenic emissions and the increase in local ones.
- Article
(4197 KB) - Full-text XML
-
Supplement
(11262 KB) - BibTeX
- EndNote


Under the influence of climate change, surface temperatures in the Arctic have increased at a rate nearly 4-fold compared to that of the global average, with the highest warming rates in the dark autumn and winter months (Rantanen et al., 2022). This phenomenon, referred to as Arctic amplification, is associated with a rapidly changing Arctic environment (Serreze and Barry, 2011), including a substantial loss of sea ice in the central Arctic (Jahn et al., 2024; Stroeve and Notz, 2018). The resulting decrease in the surface albedo is only one of the many feedback mechanisms contributing to the amplified warming (Pithan and Mauritsen, 2014; Serreze and Barry, 2011; Wendisch et al., 2023). Aerosols, acting as short-lived climate forcers, have long been recognized as being important components of the Arctic radiative balance (Barrie, 1986; Schmale et al., 2021; Shaw and Stamnes, 1980; Shindell and Faluvegi, 2009). First, through aerosol–radiation interactions (ARIs), aerosols can directly scatter (cooling effect) or absorb (warming effect; at the altitude of the absorbing layer) the incoming shortwave solar radiation. Second, through aerosol–cloud interactions (ACIs), a subset of aerosols can act as cloud condensation nuclei (CCN) or ice-nucleating particles (INPs) which, depending on their physicochemical properties and abundance, can modulate the cloud formation, lifetime (Albrecht, 1989), and radiative properties (Twomey, 1977).
Regarding ARIs, although the overall effect in the Arctic remains a net cooling (Li et al., 2022; Quinn et al., 2008; von Salzen et al., 2022; Sand et al., 2015), the reduction in anthropogenic emissions of sulfur dioxide (a precursor to sulfate) over the past few decades, related to emission regulation policies and the fall of the former Soviet Union in the 1990s, has contributed to the observed Arctic warming because of a diminished dimming effect (Acosta Navarro et al., 2016; Breider et al., 2017; Gong et al., 2010; von Salzen et al., 2022; Shindell and Faluvegi, 2009). Regarding ACIs, in the central Arctic, clouds have a net warming effect throughout most of the year due to the re-emission of terrestrial longwave radiation by low-level clouds, especially during the dark autumn and winter months (Curry and Ebert, 1992; Shupe and Intrieri, 2004). Clouds exert a net negative forcing for a brief period in summer over Arctic sea ice (Intrieri et al., 2002; Shupe and Intrieri, 2004). Present-day models struggle to represent the sign and magnitude of the seasonally varying cloud radiative effects in the Arctic (Tjernström et al., 2008; Taylor et al., 2019; Wei et al., 2021; Yeo et al., 2022), amongst others, owing to poorly simulated CCN and INPs that define the cloud phase. Overall, ARIs and ACIs are heavily dependent on the particle size, chemical composition, and abundance, which all follow a significant seasonality in the Arctic (e.g., Croft et al., 2016b; Freud et al., 2017; Karlsson et al., 2021; Nguyen et al., 2016; Platt et al., 2022; Quinn et al., 2002; Schmale et al., 2022; Sharma et al., 2013; Tunved et al., 2013; Zieger et al., 2023). This pattern is driven by seasonally varying local and regional environmental and meteorological conditions, including air temperature, shortwave radiation, sea ice extent, atmospheric stratification (and boundary layer dynamics), and the strength of the Arctic polar vortex (Willis et al., 2018, and references therein).
In winter (December–February) and spring (March–May), aerosol mass concentrations in most locations are impacted by long-range-transported anthropogenic (and natural) aerosols from lower latitudes associated with an expansion of the Arctic front further south to as low as 40° N (Barrie and Hoff, 1984; Quinn et al., 2007). This implies that pollution emitted within the polar dome, particularly from Eurasia (Willis et al., 2018), is exposed to thermodynamically facilitated poleward isentropic transport into the high Arctic boundary layer (Stohl, 2006). In addition, the prevalent dry and stratified atmospheric conditions at this time of the year, which minimize aerosol removal processes, lead to the observed accumulation of atmospheric pollutants during the Arctic haze (Croft et al., 2016b; Mitchell, 1957; Quinn et al., 2007; Rahn et al., 1977; Rahn and McCaffrey, 1980; Shaw, 1995). Haze is primarily composed of aged accumulation mode particles, comprising a mixture of sulfate, organics, black carbon, ammonium, and nitrate (Lange et al., 2018; Moschos et al., 2022b; Quinn et al., 2007), with the potential to strongly affect atmospheric radiative properties (e.g., Quinn et al., 2002, 2008; Schmale et al., 2022; Schmeisser et al., 2018; Shaw and Stamnes, 1980). Sulfate has been found to be the major component of Arctic haze (Quinn et al., 2007, and references therein), generally making for very acidic aerosols that are only partly neutralized by low concentrations of ammonium at the surface (Fisher et al., 2011) but ultimately depending on the mixing state of the particles (Kirpes et al., 2018). Atmospheric aging during air mass transport is a key mechanism that controls the particle activation potential, especially for black carbon and organic species (Ervens et al., 2010; Jimenez et al., 2009; Liu et al., 2011). Aging can occur through the condensation of low-volatility gases on existing particles, coagulation processes, cloud processing, and/or photooxidation reactions. Several studies from across the Arctic have reported annual cycles of haze tracers (mainly sulfate and black carbon), spanning from January to April, with a maximum typically in March and April (e.g., Croft et al., 2016b; Platt et al., 2022; Quinn et al., 2007; Schmale et al., 2022; Sharma et al., 2006). Local emissions of sea salt from wind-driven mechanisms, including sea spray and blowing snow, are also an important source of aerosol loading in the Arctic in winter and spring, particularly when some of the highest yearly wind speeds occur (Chen et al., 2022; Gong et al., 2023; Huang and Jaeglé, 2017; Kirpes et al., 2019; Lapere et al., 2024; Marelle et al., 2021; May et al., 2016; Radke et al., 1976).
During the transition from spring to summer, the Arctic front retracts northward, thus limiting the long-range transport of emissions from lower latitudes (Bozem et al., 2019). This is associated with more frequent precipitation and a weaker atmospheric stratification locally and along the trajectory of transported air masses. As a result, the summertime Arctic (June–August) is characterized by relatively low aerosol mass concentrations from more local/regional emissions (Stohl, 2006). The aerosol population in summer is dominated by Aitken mode and nucleation mode particles originating from local biogenic sources (Boyer et al., 2023; Freud et al., 2017; Pernov et al., 2022; Tunved et al., 2013; Willis et al., 2017). These include primary marine and terrestrial aerosols, secondary particles formed via new particle formation (Baccarini et al., 2020; Beck et al., 2020; Brean et al., 2023; Schmale and Baccarini, 2021), or the condensation of precursor gases onto pre-existing particles (Willis et al., 2016). Organic aerosols from different sources contribute significantly to the submicron aerosol mass concentrations in summer (e.g., Chang et al., 2011; Croft et al., 2019; Fu et al., 2009, 2013; Köllner et al., 2021; Leaitch et al., 2018; Moschos et al., 2022b; Nielsen et al., 2019; Siegel et al., 2021). One important organic compound in summer is methanesulfonic acid (MSA), an oxidation product of marine-sourced dimethylsulfide (DMS), while part of the sulfate mass present in the summer Arctic boundary layer also originates from DMS oxidation (Barnes et al., 2006; Leaitch et al., 2013; Leck and Persson, 1996).
Finally, the autumn season (September–November) marks a minimum in the total particle number and mass concentration, with a dominant accumulation mode, owing to limited transport from lower latitudes, less frequent new-particle-formation events, and efficient wet removal of particles (Croft et al., 2016b). However, little is known about the aerosol chemical composition and sources during this season, especially in the central Arctic.
Present-day knowledge on the seasonally varying chemical composition in the Arctic, and the processes related to it, has predominantly been obtained from observations at land-based stations (AMAP, 2006; Moschos et al., 2022a; Platt et al., 2022; Schmale et al., 2022; Sharma et al., 2019; Ström et al., 2003). Whether the observations from these lower-latitude stations can be extrapolated throughout the Arctic, particularly to the central Arctic, remains an open question (Freud et al., 2017; Schmale et al., 2021). Direct observations of aerosol physicochemical properties in the central Arctic have historically been limited to short ship-based and aircraft summertime campaigns. Among those, a series of expeditions on board the Swedish icebreaker (I/B) Oden significantly contributed to our understanding of aerosol processes in the summertime central Arctic Ocean. Such expeditions (and examples references from the literature) include the International Arctic Ocean Expeditions of 1991 (Leck et al., 1996; Leck and Persson, 1996), 1996 (Hillamo et al., 2001; Leck et al., 2001; Zhou et al., 2001), 2001 (Leck et al., 2004; Tjernström, 2005), and 2018 (Karlsson et al., 2022; Lawler et al., 2021; Siegel et al., 2021), as well as the Arctic Summer Cloud Ocean Study (ASCOS) expedition in 2008 (Chang et al., 2011; Hamacher-Barth et al., 2016; Mauritsen et al., 2011; Tjernström et al., 2014). Despite the year-round observations at the land-based stations, there are still severe knowledge gaps on aerosol sources, sinks, chemical composition, and associated processes in the Arctic (Schmale et al., 2021; Willis et al., 2018) which stem from a general lack of organic aerosol and speciation measurements, an observation bias in the central Arctic summer, and a lack of vertical profiles. The Arctic boundary layer is highly stratified for most of the year due to strong temperature inversions (Jozef et al., 2024), which means that surface and ship-based observations are generally only representative of the Arctic boundary layer (Köllner et al., 2021; Willis et al., 2019). The available information appears to be insufficient for models to satisfactorily (i.e., without a large model spread) reproduce the seasonality and abundance of anthropogenic and natural aerosol species throughout the Arctic (AMAP, 2011, 2015; Eckhardt et al., 2015; Lapere et al., 2023; Shindell et al., 2008).
In particular, measurements of bulk chemical composition in the Arctic have often been limited to offline techniques through the analyses of aerosols collected on filter samples (e.g., Hillamo et al., 2001; Moschos et al., 2022a; Schmale et al., 2022). Although such techniques offer a good quantitative and qualitative assessment of the aerosol bulk chemical composition, the time resolution over which they are performed (days to weeks) is evidently insufficient to resolve processes happening on shorter timescales (e.g., in-cloud aerosol processing, wind-driven aerosolization processes, and intense pollution transport events). Detailed chemical composition and mixing state information have been obtained from single-particle microscopy measurements (e.g., Adachi et al., 2022; Bigg and Leck, 2008; Hamacher-Barth et al., 2016; Kirpes et al., 2022). The development of online aerosol mass spectrometry techniques over the last few decades has provided the ability to study aerosol chemical composition at much higher temporal and spectral resolutions, shedding light on the sources and processes controlling the Arctic aerosol populations (e.g., Chang et al., 2011; Gunsch et al., 2020; Karlsson et al., 2022; Köllner et al., 2021; Nielsen et al., 2019; Ovadnevaite et al., 2011a; Willis et al., 2016). Yet, studies reporting online measurements from aerosol mass spectrometers in the Arctic remain scarce due to the technical complexities associated with the operation of such instruments in remote environments.
Furthermore, in the rapidly changing Arctic, it is expected that local and remote emission sources and processes of anthropogenic and natural aerosols will change (Schmale et al., 2021), associated with socioeconomic changes within the Arctic and sub-Arctic regions, changing atmospheric transport patterns (Heslin-Rees et al., 2020; Pernov et al., 2022), sea ice retreat, increased liquid precipitation (Bintanja and Andry, 2017), and ecosystem shifts (Lannuzel et al., 2020). The summer melt season will likely further lengthen at the expense of a shortened winter sea ice growth (Markus et al., 2009; Stroeve et al., 2014), having direct consequences on the coupled ocean–sea ice–atmosphere processes (Willis et al., 2023). The role that transition seasons (i.e., spring and autumn) will play in this changing seasonality is yet to be elucidated with present-day measurements. Importantly, the frequency and intensity of extreme synoptic-scale circulation events, including cyclones and warm and moist air mass intrusions into the Arctic have increased over the last few decades (Graham et al., 2017; Overland, 2021; Zhang et al., 2023). While such events have been shown to be associated with high levels of pollutants transported to the Arctic in spring, profoundly affecting aerosol chemical composition and CCN populations (Dada et al., 2022a; Stohl et al., 2007), less is known on the aerosol-driven impact of such extreme events in the pristine autumn transition season when the ocean freeze-up happens.
In this study, we investigate the annual cycle of the aerosol chemical composition in the central Arctic, based on unique year-long aerosol physicochemical measurements, collected with a high-resolution aerosol mass spectrometer during two ship-based expeditions to the central Arctic between 2018 and 2020, namely the Arctic Ocean 2018 (AO2018) expedition (Baccarini et al., 2020; Karlsson et al., 2022) and the 2019–2020 Multidisciplinary drifting Observatory for the Study of Arctic Climate (MOSAiC) expedition (Shupe et al., 2022). We assess the relevance of land-based pan-Arctic station observations for the central Arctic conditions through a comparison of our measurements with those from various stations. Finally, we infer the processes governing the central Arctic aerosol populations using high-time-resolution and size-resolved chemical measurements. We investigate, through case studies and a clustering of particle number size distributions, the contribution of local and remote aerosol sources to the overall aerosol and CCN number concentration in the dark and pristine autumn season, as well as during the spring haze season, with specific emphasis on storm-induced high-concentration events.
2.1 The MOCCHA and MOSAiC expeditions
Data used in this study were collected during the Microbiology–Ocean–Cloud Coupling in the High Arctic (MOCCHA) campaign as part of the Arctic Ocean 2018 (AO2018) expedition, as well as during the 2019–2020 Multidisciplinary drifting Observatory for the Study of Arctic Climate (MOSAiC) expedition, both taking place in the central Arctic Ocean (Fig. 1). These two expeditions set out to gather observational data, using state-of-the-art instrumentation, to close knowledge gaps on the coupled atmospheric–ice–ocean–ecosystem processes driving, or influenced by, the changing Arctic climate. This work primarily focuses on surface observations made during MOSAiC. Measurements from MOCCHA close the summer data gap when no chemical composition measurements were available during MOSAiC (see Sect. 2.2).
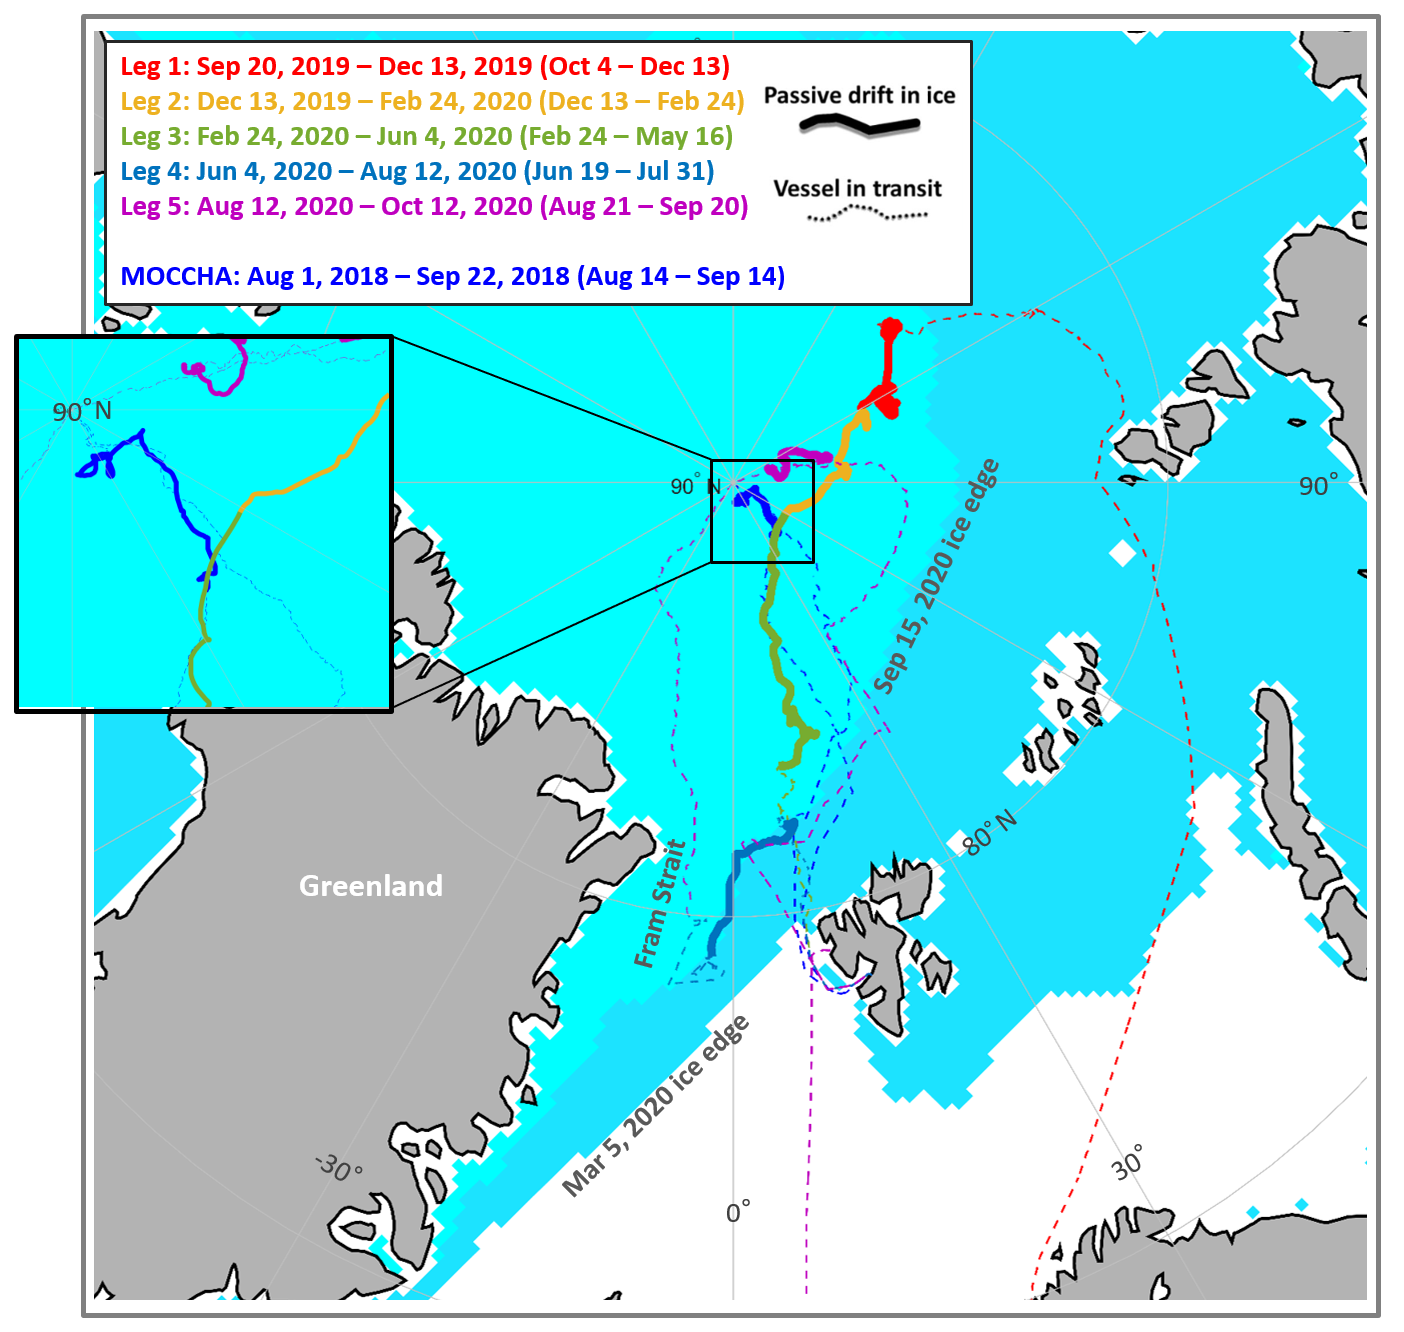
Figure 1Expedition tracks during MOSAiC and MOCCHA. The MOSAiC track is adapted from Shupe et al. (2022) and colored by the legs of the expedition. Periods of passive drift by Polarstern and Oden (solid) and periods of transit when the vessel was underway (dotted) are distinguished. The inclusive dates for each of the five legs during MOSAiC and the whole MOCCHA campaign are given in the legend, with the second set of dates in parentheses being the dates spent in passive drift. A zoomed-in inset above 88° N is provided for the MOCCHA campaign. The approximate sea ice edge at the annual maximum (5 March 2020) and minimum (15 September 2020), from NIMBUS-7 and DMSP SSM/I-SSMIS passive microwave data (National Snow and Ice Data Center; Cavalieri et al., 1996), is also provided for the MOSAiC year.
During MOCCHA, the Swedish I/B Oden was moored to an ice floe and drifted with the central Arctic sea ice at latitudes higher than 88° N between 14 August and 14 September 2018. Detailed descriptions of the campaign, the aerosol instrumentation, and the sampling conditions can be found elsewhere (Baccarini et al., 2020; Karlsson et al., 2022; Lawler et al., 2021; Siegel et al., 2021). During MOSAiC, the German research vessel (R/V) Polarstern (Knust, 2017) drifted in the central Arctic, while moored to an ice floe, from 4 October 2019 to 20 September 2020 at latitudes mostly above 80° N. In Fig. 1, we show the minimum and maximum sea ice extent, respectively, reached on 15 September and 5 March 2020. Polarstern was generally far away from the marginal ice zone and the open ocean, except for the drift period during leg 4 in midsummer (i.e., between 19 June and 31 July). This means that the results presented in this study are mostly representative of the ice-covered central Arctic Ocean region. Most of the measurements relevant to this work were carried out in the Swiss container on board Polarstern, combining aerosol physicochemical properties (Heutte et al., 2023b) and trace gas measurements (Angot et al., 2022b). For further information on the expedition conditions and technical descriptions of the observations performed by the “atmosphere”, “oceanography”, and “snow and sea ice” teams, refer to Shupe et al. (2022), Rabe et al. (2022), and Nicolaus et al. (2022), respectively. Importantly, for MOCCHA and MOSAiC, aerosols were sampled through heated inlet lines, ensuring that sampling occurred at relative humidities below 40 % (see Heutte et al., 2023c, for measurements of temperature and relative humidity inside the inlet and Heutte et al., 2023b, for a description of the inlet system and flow rates), resulting in measurements of dried particles, following the Global Atmosphere Watch standards for aerosol sampling (WMO, 2016).
2.2 Aerosol chemical composition measurements
The bulk chemical composition of non-refractory submicron aerosols (NR-PM1) was measured using an Aerodyne high-resolution time-of-flight aerosol mass spectrometer (HR-ToF-AMS; hereafter referred to as AMS) during MOCCHA and MOSAiC. Detailed technical descriptions of the AMS functioning can be found in DeCarlo et al. (2006) and Canagaratna et al. (2007). Readers are referred to Heutte et al. (2023b) for the description of the AMS operation, including calibrations, during MOSAiC and to Karlsson et al. (2022) during MOCCHA. Importantly, the same instrument was used on both expeditions. We refer to “non-refractory” species as the species that are flash-vaporized in the AMS at a temperature below ∼ 600 °C that of the resistively heated tungsten vaporizer. In practice, such species include sulfate (SO), nitrate (NO), ammonium (NH), chloride (Chl), and organics (Org). Refractory species, including black carbon, sea salt, crustal materials, and metal oxides, are hence not quantitatively detected by the AMS. However, a small fraction of the refractory species can undergo slow vaporization and surface ionization at 600 °C (Drewnick et al., 2015; Ovadnevaite et al., 2012). For example, sea salt, which has a boiling point temperature of 1465 °C, can still be partly vaporized at 600 °C and contribute to the Chl signal (Zorn et al., 2008). Furthermore, the AMS can efficiently measure non-refractory species that are internally mixed with refractory ones (e.g., an organic coating on sea salt) (Salcedo et al., 2006). During MOSAiC (MOCCHA), the AMS was operated with an effective time resolution of 90 s (60 s). In this work, the data were averaged (arithmetic mean) to either 10 min or 1 h, depending on the analysis purposes. The detection limits for the five main chemical species, SO, NO, NH, Chl, and Org, are reported in Table S1 in the Supplement at 10 min and 1 h time resolutions. Values below detection limit were not removed when calculating monthly statistics (from the hourly averaged data) reported in Sect. 3.1. In the cases where the fraction of data below the detection limit was high (i.e., > 50 %; see Table S1), we clearly stated it, and the data were not further analyzed. Instrumental failures caused the AMS to cease functioning during MOSAiC between 5 December 2019 and 29 February 2020, between 30 May and 6 June 2020, and after 10 July 2020. Issues with the AMS turbo pumps rendered the NH measurements very noisy in June and July 2020; thus the NH data were discarded for that period (Heutte et al., 2023b).
Scaling factors, derived from a mass closure analysis between the AMS and a scanning mobility particle sizer (SMPS; see Sect. 2.3), were applied to the species' mass concentrations during MOSAiC (Heutte et al., 2023b). These scaling factors were derived and applied independently for the measurement periods in-between the non-operational periods mentioned above (Heutte et al., 2023b). The scaled concentrations are expected to be upper estimates that add some uncertainty to the data. For the MOCCHA data, such a mass closure was performed by Karlsson et al. (2022) between the AMS and a custom-made differential mobility particle sizer (DMPS), and no scaling factors were applied to the AMS in this case given the closure agreement.
As previously mentioned, sea salt cannot be quantified using the AMS. However, following the approach suggested by Ovadnevaite et al. (2012), we estimated the particulate sodium chloride mass concentrations with the AMS using the signal of the 23Na35Cl+ fragment at the mass-to-charge ratio () of 58 (see Fig. S1). Based on a calibration of the AMS with sea salt, Ovadnevaite et al. (2012) found that the 23Na35Cl+ sea salt surrogate should be multiplied by a calibration factor of 51. Therefore, we multiplied our 23Na35Cl+ signal by 51 to estimate sea salt mass concentrations, averaged to 10 min time resolution. In the absence of any AMS calibration for sea salt during MOSAiC, and because the calibration factor reported by Ovadnevaite et al. (2012) is likely only valid for the AMS they used (with its particular tuning), sea salt mass concentrations reported in this study can only be considered estimates and should be looked at qualitatively rather than quantitatively. Hence, concentrations are reported in arbitrary units (a.u.) rather than µg m−3.
The particle time-of-flight (PToF) feature of the AMS also enables the retrieval of the size-resolved chemical composition (Jimenez et al., 2003; Salcedo et al., 2006; Zhang et al., 2005). The particle vacuum aerodynamic diameter is inferred from the time it takes for the particle to travel from the mechanical chopper (determining time zero of flight) to the detector. Velocity calibrations, used to convert the PToF to diameter, were regularly performed during MOSAiC, using size-selected monodisperse ammonium nitrate (NH4NO3) and ammonium sulfate ((NH4)2SO4) particles. Importantly, it should be mentioned that the calibration factor used to convert the measured PToF to diameter relied on a comparison with SMPS data and a conversion from the vacuum aerodynamic diameter (Dva) to the mobility diameter (Dm). This relation is linearly dependent on the particle density (ρ), if we assume that particles are spherical (). Hence, an uncertainty in the density estimated from the particle chemical composition (see calculation details in Heutte et al., 2023b) would propagate into an uncertainty in the same magnitude for the mass size distribution. Given the relatively low signal-to-noise ratio of the measured species in the pristine atmosphere of the central Arctic, size distributions in this work are only reported as monthly medians for sulfate and organics for a set of months during MOSAiC. A monomodal log-normal distribution was fitted to each monthly mass size distribution to retrieve the mode diameter using the Multipeak Fitting package in Igor Pro v9.02.
Equivalent black carbon (eBC) mass concentrations were obtained from the measurement of light attenuation at 880 nm on a filter tape, using an Aethalometer model AE33 (Magee Scientific, Berkeley, USA). A description of the AE33 operation during MOSAiC and of the data processing can be found in Heutte et al. (2023b) and Boyer et al. (2023). The Aethalometer and AMS were sampling air through the same inlet. The original 1 Hz eBC data were averaged to 10 min and 1 h time resolutions, complementing the chemical composition obtained from the AMS. The same instrument was used during MOCCHA, with the same data processing procedure. A comparison was performed between the AE33 and a multi-angle absorption photometer (MAAP) for the MOCCHA eBC data, and both instruments agreed well and were within 20 % of each other (R2 = 0.77; not shown).
2.3 Aerosol number concentration and size distribution measurements
During MOCCHA, the particle number size distributions (PNSDs) of aerosols between 18 and 660 nm (Dm) were measured with a custom-made SMPS at a time resolution of 3 min (time for a complete scan through all size bins). Further information on the acquisition and processing of the data is provided by Baccarini and Schmale (2020) and Baccarini et al. (2020). During MOSAiC, a commercial SMPS (TSI, USA) was used to measure the PNSD between 10 and 500 nm (Boyer et al., 2023) at a time resolution of 5 min (scan time). The instrument was located in the Aerosol Observing System (AOS) container (Uin et al., 2019), operated as part of the United States Department of Energy Atmospheric Radiation Measurement (ARM) facility, 1.5 m away from the Swiss container. In this work, PNSD data were used to retrieve the total aerosol volume (in the common size range from 18 to 500 nm), assuming particles are spherical, where data were previously averaged to a 1 h time resolution. When only the MOSAiC data are used, in Sect. 3.2 and 3.3, particle number concentrations (PNCs) are reported using the size range of the MOSAiC SMPS (i.e., between 10 and 500 nm).
During MOSAiC, an aerodynamic particle sizer spectrometer model 3321 (APS; TSI, USA) was used to measure the coarse-mode PNSDs between 1.06 and 16.1 µm (Heutte et al., 2023b). The supermicron PNCs (N> 1000 nm) reported in this work were averaged to 10 min time resolution.
2.4 Ancillary measurements
The description of the following ancillary measurements only refers to observations made during MOSAiC, and the results are presented and discussed in Sect. 3.2 and 3.3.
2.4.1 Carbon dioxide measurements
Hourly averaged carbon dioxide (CO2) dry-air mole fractions used in this study result from the merging of several cross-evaluated measurements with cavity ring-down spectroscopes during MOSAiC. Measurements were performed in the University of Colorado (CU) container using a commercial Picarro instrument (model G2311-f); on the sea ice at Met City (a few hundred meters away from Polarstern), also using Picarro model G2311-f; and in the Swiss container using Picarro model G2401. Additional discrete whole-air samples were collected for post-cruise analysis at the National Oceanic and Atmospheric Administration (NOAA) Global Monitoring Laboratory (GML) and included in the data-merging procedure. Details regarding the instruments' operation, calibration, data processing, and the creation of the merged dataset can be found in Angot et al. (2022b).
2.4.2 CCN measurements
Measurements of CCN number concentrations were performed during MOSAiC using a cloud condensation nuclei counter (CCNC) model CCN-100 (Droplet Measurements Technologies, Boulder, USA) colocated with the Aethalometer and the AMS in the Swiss container. The supersaturation (SS) in the instrument's chamber was set to 0.15 %, 0.2 %, 0.3 %, 0.5 %, and 1 % SS throughout 1 h cycles (Heutte et al., 2023b). CCN number concentrations were averaged, for each SS level, to a 10 min time resolution (resulting in one 10 min average data point for each SS level per hour).
2.4.3 Aerosol light scattering measurements
The aerosol total light scattering coefficients at the blue (450 nm), green (550 nm), and red (700 nm) wavelengths were measured during MOSAiC using an integrating nephelometer (TSI; model 3563) located in the AOS container. Scattering coefficients were measured at 1 min time resolution and corrected to account for the size-dependent truncation (incomplete collection) of strongly forward- or backward-scattered light (Koontz et al., 2022). Using an impactor at the inlet of the external sampling system, the aerodynamic diameter cutoff of sampled particles was alternated between 1 and 10 µm. In this study, we used the submicron measurements averaged at 10 min time resolution.
2.4.4 Snowdrift density and blowing snow event identification
During MOSAiC, the particle number flux of airborne snow particles was measured, at 1 min time resolution, using two open-path snow particle counters (SPC-95; Niigata Electric Co., Ltd), and used to compute the snowdrift density (Gong et al., 2023). Blowing snow periods were identified (Gong et al., 2023) as times when airborne snow particles were detected and when the wind speed measured at 10 m above the snow surface exceeded a critical value, which was empirically estimated from the temperature-dependent parameterization proposed by Li and Pomeroy (1997). The two SPCs, Unit 1104 and Unit 1206, were located at 0.08 and 10 m above the snow surface, respectively. In this study, the SPC at 0.08 m was used to report the snowdrift density and derive the blowing snow flag, except for October and November 2019, where the instrument was not operational, and data from the SPC at 10 m were used instead.
2.4.5 Satellite-derived lead fraction
In our study, we use a published dataset of lead fractions (von Albedyll et al., 2024). In brief, lead fractions, within a 50 km radius from Polarstern, were derived from a divergence-based method using satellite synthetic-aperture radar (SAR) data with a spatial resolution of 700 m. The daily available divergence and convergence fields were accumulated for up to 10 subsequent dates to account for leads continuously opening or closing. In this work, we used the divergence-derived lead fractions with no accumulation (LFno accu, div), which represent newly opened leads, as well as the lead fractions accumulated five times (LF), which account for leads opening, closing, or staying open within a 5 d period.
2.5 Identification and removal of pollution from ship emissions
Ship-based measurements of some atmospheric variables (including aerosol physicochemical properties) can be greatly influenced by local pollution from research activities (Beck et al., 2022). Exhausts from the ship's stack can be an important source of particles that needs to be distinguished from the ambient aerosol signal. Other sources of local contamination, including snowmobiles, diesel generators, and helicopters, can also be important sources of local pollution, discretely affecting the ambient aerosol measurements. Not all instruments react the same way to fresh pollution from fossil fuel combustion. Hence, different pollution detection methods were applied to the various datasets and are described in detail by Heutte et al. (2023b) for the Swiss container aerosol measurements during MOSAiC. In short, AMS measurements were cleaned from local pollution influence by identifying periods where the measured chemical spectrum resembled (cosine similarity) that of a chosen spectrum of fresh hydrocarbon emissions. This method was applied analogously to the AMS data from MOCCHA. In total, 43 % of the available AMS measurements (MOCCHA + MOSAiC) were identified as being influenced by local pollution emissions. All the other MOSAiC datasets were cleaned using a multi-step pollution detection algorithm (PDA) developed by Beck et al. (2022). A similar method to the PDA was employed by Baccarini et al. (2020) to remove local pollution from the MOCCHA SMPS data used in this analysis.
2.6 Clustering of the particle number size distributions
The measured PNSDs from the SMPS, averaged to a 10 min time resolution, were grouped using the Hartigan–Wong k-means clustering algorithm (Hartigan and Wong, 1979), as commonly done for clustering of PNSDs (e.g., Beddows et al., 2009; Boyer et al., 2023; Pernov et al., 2022). This analysis was performed separately for the data from October to November and from March to April, taking the PNSDs normalized to the vector length as input for the algorithm. The number of clusters for the solution was initially varied from 3 to 30, and it was concluded that the eight-cluster solution was best at describing the October–November aerosol size distributions, while the seven-cluster solution was optimal for the March–April period. The resulting clusters were further manually merged into four clusters for the October–November period and three clusters for the March–April period, based on similarities in their potential dominating source (i.e., locally sourced, long-range-transported, or low concentration background) and the shape of their median size distribution. Additional information on the criteria for choosing the number of clusters and the manual attributions to more comprehensive “potential source” groups are provided in Sect. S4. A bimodal log-normal distribution was fitted to each cluster's median PNSD using the Multipeak Fitting package in Igor Pro v9.02, and the fitting modal parameters (location and amplitude of the modes) are given in Table S2. The results of the clustering analysis are presented and discussed in Sect. 3.3.1.
3.1 Bulk submicron aerosol yearly chemical composition
Figure 2a shows the high-time-resolution (1 h) annual cycle of bulk submicron aerosol mass concentration and composition measured during the MOCCHA and MOSAiC expeditions. The unpolluted relative fractions of each species to the submicron aerosol (PM1) mass during different measurement periods are given in Fig. 2b–e. In this work, total PM1 is defined as the sum of AMS-based non-refractory SO, Org, NO, Chl, and NH mass concentrations and Aethalometer-based eBC mass concentrations. Figure 3 shows the annual cycle of each species with monthly statistics (median and interquartile range). For completeness, we show the seasonality of the total aerosol volume (Vtot) for particles between 18 and 500 nm in mobility diameter. Vtot is used as a proxy for PM1 for months when AMS data are missing. This annual cycle is segregated into five distinct periods, namely August to September 2018, October to December 2019, January to February 2020, March to May 2020, and June to July 2020. The start and end dates of these periods were determined from (1) the different physicochemical processes associated with each period and the resulting contrasted aerosol mass concentrations and composition and from (2) the data availability imposed by the expeditions' timing and instruments' functioning. Furthermore, we argue that the MOCCHA data from summer 2018 can be considered representative of the central Arctic Ocean late-summer conditions and hence are used to replace the missing MOSAiC late-summer (2020) data for the following reasons. First, long-term observations at coastal Arctic land-based stations have revealed minimal interannual variability in summer SO and eBC mass concentration (Gong et al., 2010) or total aerosol mass (Tunved et al., 2013). Second, as MOCCHA and MOSAiC summers were separated by 2 years only, the influence of long-term trends in species mass concentrations can be neglected, especially as there are not so many statistically significant trends in summer (Schmale et al., 2022). Due to the similarities in aerosol chemical composition between the MOSAiC June–July and the MOCCHA August–September data, the discussion for these two periods is provided jointly (see Sect. 3.1.1).
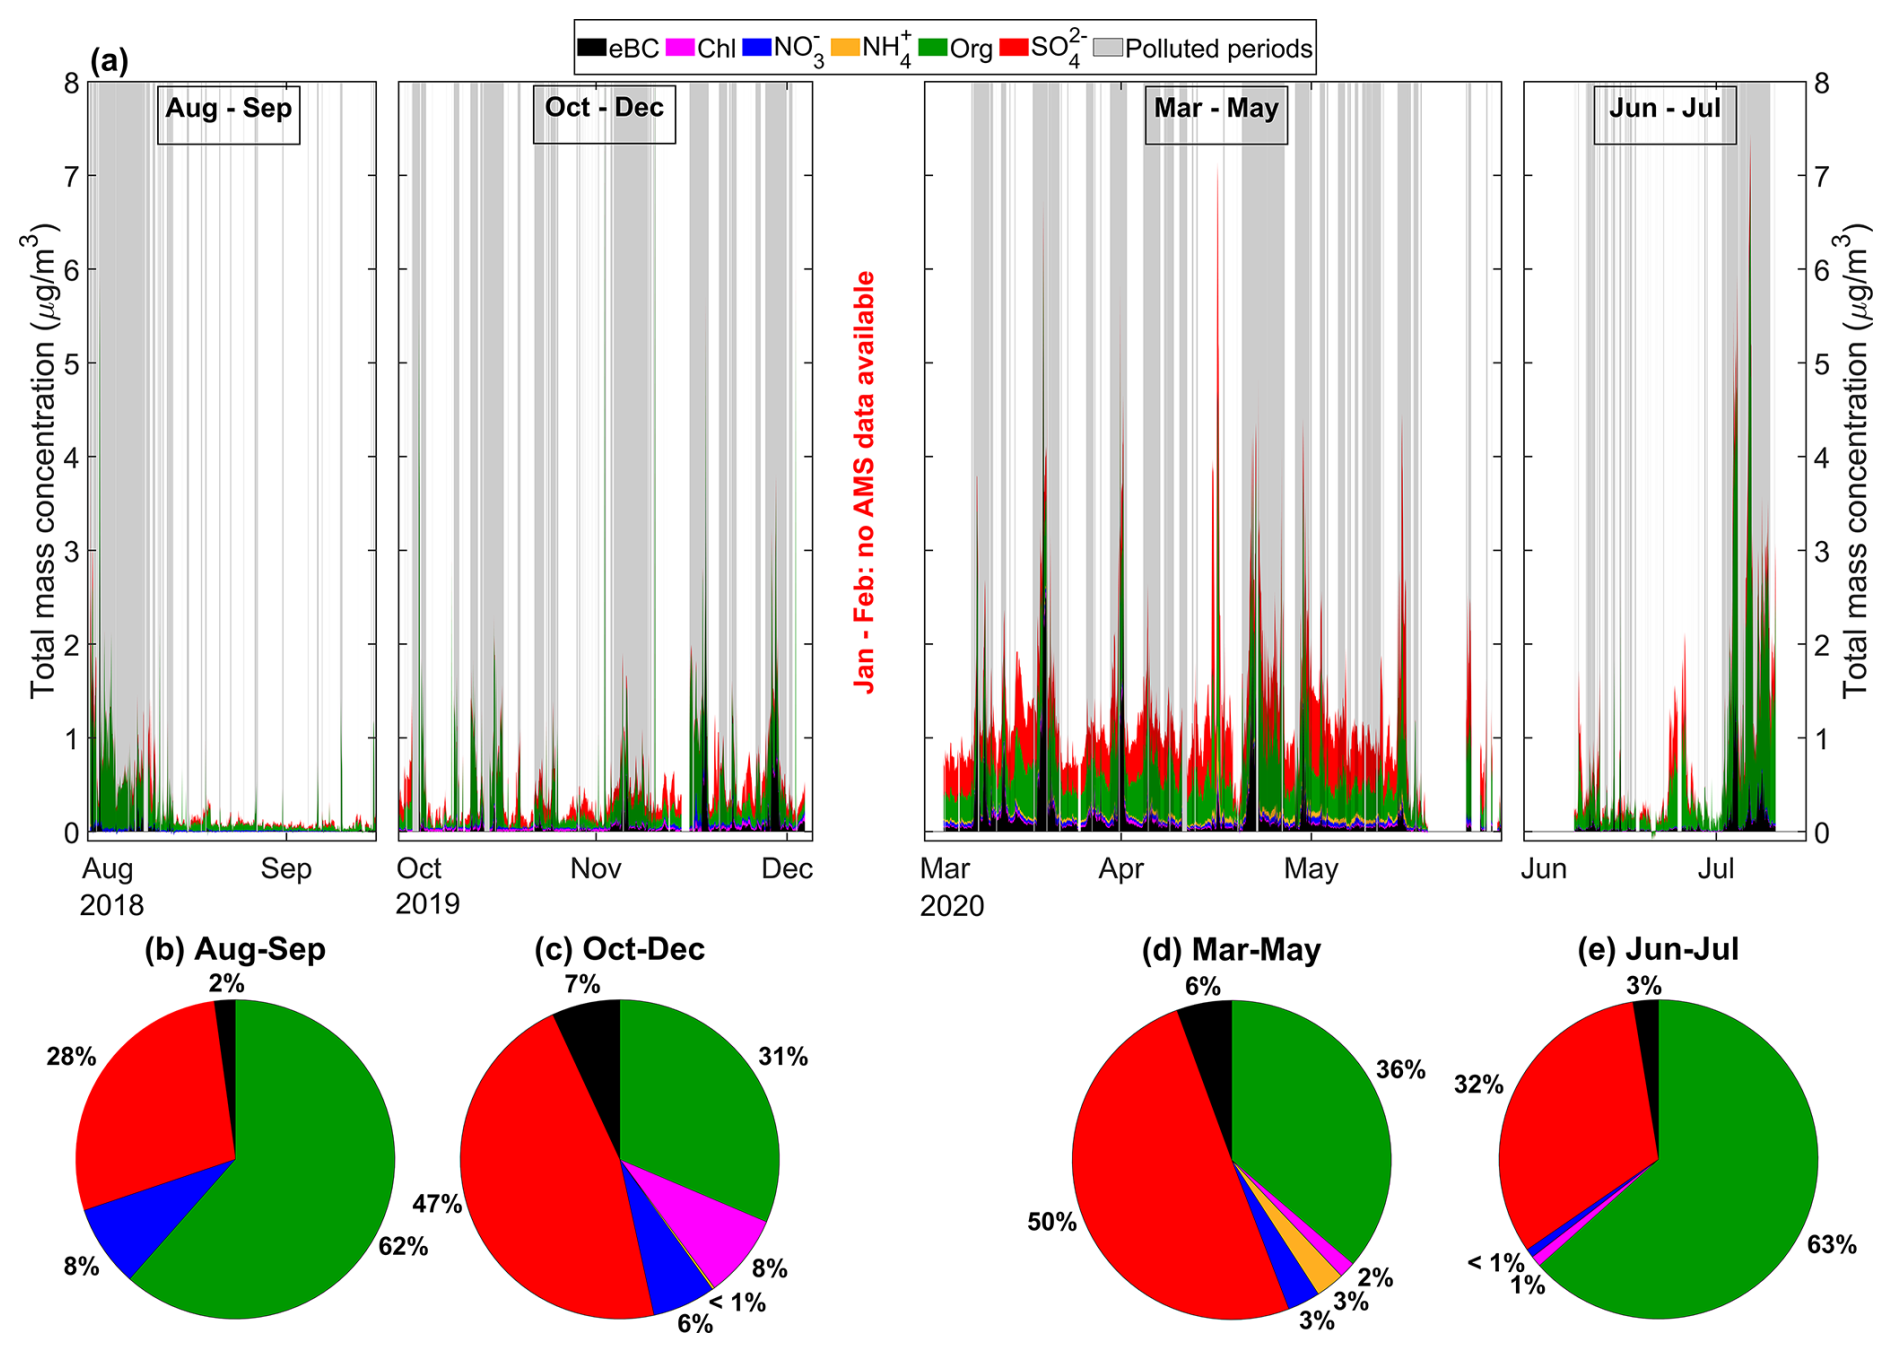
Figure 2Bulk submicron aerosol mass composition measured with the AMS and Aethalometer during the MOCCHA and MOSAiC expeditions. The year-long time series of these species (a) is shown as the 1 h averaged total mass concentration from August to September 2018 (MOCCHA) and from October 2019 to July 2020 (MOSAiC). Periods identified as being affected by local pollution from research activities are indicated with vertical areas shaded grey and are excluded from any subsequent analysis. The unpolluted relative contributions of the main aerosol species to the total summed mass concentration are shown during MOCCHA for the (b) August–September 2018 period and during MOSAiC for the (c) October–December 2019 period, (d) March–May 2020 period, and (e) June–July 2020 period. The fractional contribution was derived by summing the mass of each species over the respective period and dividing by the total PM1 mass of that period. Ammonium was not considered for the June–July period due to instrumental issues. Note that, during MOSAiC, the AMS was not operational between early December 2019 and March 2020, and this period is therefore not represented with a pie chart.
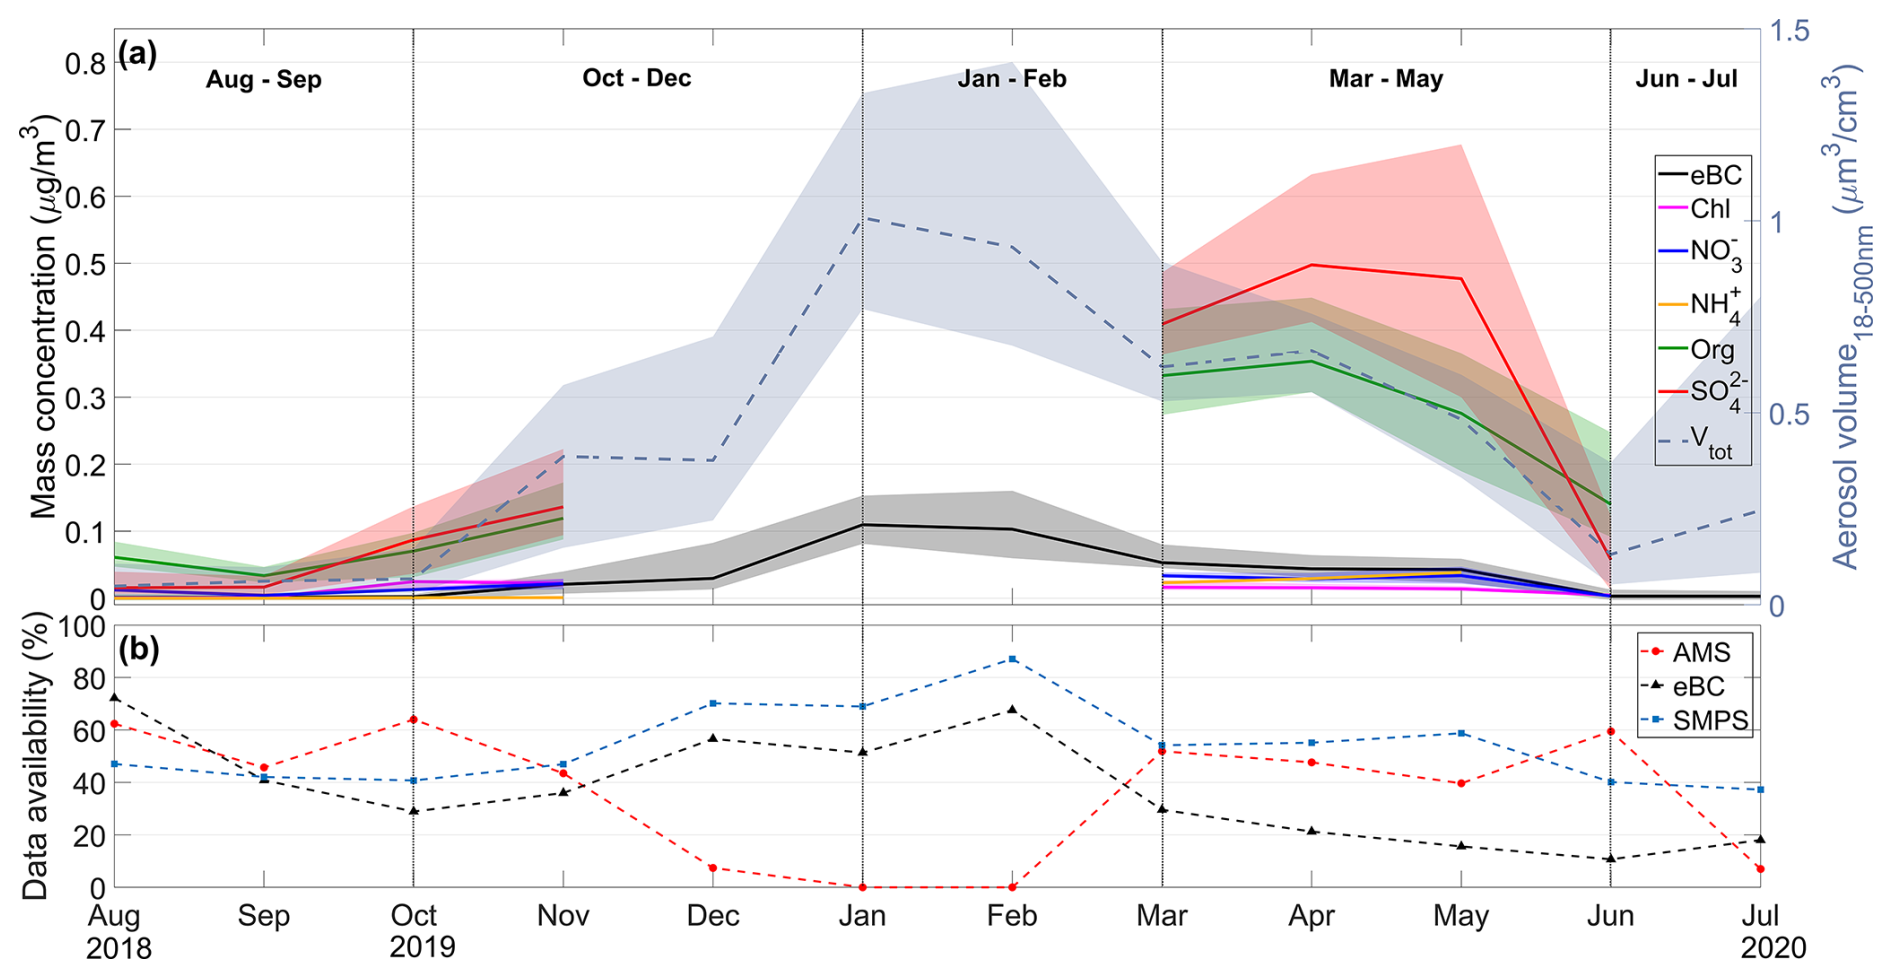
Figure 3Monthly seasonality of the bulk submicron aerosol mass composition measured with the AMS and Aethalometer during the MOCCHA and MOSAiC expeditions. Monthly medians are shown in panel (a), along with the 25th (75th) quantile as the lower- (upper-) envelope boundary for the different chemical species and for the total aerosol volume (18–500 nm) calculated from the PNSDs of the SMPS. The monthly statistics, calculated from the hourly averaged concentrations, consider only unpolluted data and the percentages of available data per month and per instrument (i.e., data retained after the quality and pollution flags have been applied to the datasets) are shown in panel (b). August and September are from the MOCCHA expedition, while other months are from MOSAiC. The vertical dashed line indicates the separation from the five distinct periods discussed in the text. Median mass concentrations from the AMS are not reported for December 2019 and July 2020 due to low data availability (< 10 %), and no AMS data are available for January and February 2020.
3.1.1 June–September: summer (MOCCHA and MOSAiC)
In early summer (1 June–10 July 2020; during MOSAiC) and late summer (1 August–15 September 2018; during MOCCHA), organics had the largest mass contribution to the total PM1 (62 %–63 %; Fig. 2b and e), followed by SO (28 %–32 %), while eBC contributed 2 %–3 %. Nitrate accounted for 8 % of the total PM1 mass in late summer during MOCCHA and was mostly below the detection limit (Table S1) in early summer during MOSAiC. However, it should be noted that NO measurements during MOCCHA were likely overestimated due to interferences between the NO+ and C18O+ fragments at 30 in the AMS. Hence, NO will not be further discussed in this section. Chloride was below the detection limit during MOCCHA and contributed 1 % of the PM1 mass in June during MOSAiC. Finally, NH was either below the detection limit (during MOCCHA) or excluded due to instrumental issues (in June–July during MOSAiC; see Sect. 2.2). Overall, we observed very low mass concentrations for the different species at this time of the year, which is typical and characteristic of the high Arctic during this season (Leaitch et al., 2018; Massling et al., 2015; Schmale et al., 2022; Ström et al., 2003). This is likely the combined result of (1) limited long-range transport of aerosols from lower latitudes, as the extent of the Arctic dome is small (Stohl, 2006), and (2) the efficient wet and dry removal of locally emitted and transported aerosols, as previously observed and modeled (Browse et al., 2012; Freud et al., 2017; Pernov et al., 2022). In June, during MOSAiC, median (25th quantile, 75th quantile) concentrations of Org and SO were 0.14 (0.09 and 0.25) and 0.057 (0.012 and 0.122) µg m−3, respectively. These values are larger than the ones found in August during MOCCHA, namely 0.06 (0.05 and 0.08) and 0.016 (0.006 and 0.040) µg m−3 for Org and SO, respectively. The lower concentrations during MOCCHA can likely be explained by the position of Oden high up in the pack ice (> 88° N; see Fig. 1), far away from most open-ocean marine and terrestrial sources. Chang et al. (2011) reported similar mass concentrations of the organics (median Org = 0.055 µg m−3) at such high latitudes in August–September 2008, although with a higher sulfate fraction to the total mass of 45 % (median SO = 0.051 µg m−3). The very low mass concentrations for the different species in summer are also reflected in the low Vtot values (median = 0.131 µm3 cm−3 in June and 0.049 µm3 cm−3 in August). The large variability in Vtot in July (interquartile range = 0.719 µm3 cm−3) could be indicative of intermittent events of transport or the local release of organic material from melt ponds, the marginal ice zone, or nearby coastal and open-ocean areas (Chang et al., 2011). In general, it is likely that organic aerosols at this time of the year are dominated by local/regional natural marine and terrestrial biogenic sources (e.g., Baccarini et al., 2020; Chang et al., 2011; Hamacher-Barth et al., 2016; Heintzenberg et al., 2015; Siegel et al., 2021), with relevance towards cloud formation (Bulatovic et al., 2021; Duplessis et al., 2024; Karlsson et al., 2022). With the present observations, we further emphasize the major contribution of organics, which are likely naturally sourced, for the central Arctic submicron aerosol budget in summer. A follow-up source apportionment study will elucidate the sources associated with organic aerosols (including MSA) in the summertime central Arctic during MOSAiC.
3.1.2 October–December: autumn (MOSAiC)
October marked the beginning of the dark season in the central Arctic, associated with a decrease in surface temperatures (Shupe et al., 2022). In the transition from summer to autumn, we observed a drastic change in the aerosol chemical composition, whereby SO became the dominant measured species by mass (47 %, Fig. 2c), followed by Org (31 %), Chl (8 %), eBC (7 %), and NO (6 %). NH was mostly below the detection limit. The combined increase in the fraction of SO and eBC, and the decrease in the fraction of Org, compared to summer is indicative of changes in the aerosol sources, sinks, and processing. The ongoing ocean freeze-up, coupled with the dark conditions, gradually decreases the influence of local marine aerosol sources (Leck and Persson, 1996; Moschos et al., 2022b; Schmale et al., 2022), while long-range transport of anthropogenic pollutants from lower latitudes occurs more readily towards the winter (Boyer et al., 2023; Moschos et al., 2022b; Quinn et al., 2009). During MOSAiC, November and December experienced several storms (see the annual wind speed measurements from the 2D ultrasonic anemometer on board Polarstern (Schmithüsen, 2021a, b, c, d, e) in Fig. S2), which have been shown to greatly increase the number of fine-sea-salt (NaCl) aerosols associated with the sublimation of salty blowing snow and/or sea spray aerosol (SSA) emissions from open leads (Chen et al., 2022; Gong et al., 2023). The elevated chloride fraction seen here may be related to NaCl, but the interpretation remains difficult because of the limited ability of the AMS to measure it (see Sect. 2.2). Another possibility is non-refractory chloride that partitioned into the particles (Hara et al., 2002). Using instead the NaCl+ fragment at 58 (Ovadnevaite et al., 2012), we discuss the contribution of sea salt in the aerosol budget in autumn in Sect. 3.2 and 3.3. Similarly, for NO, part of the signal could be associated with sodium nitrate following the chloride displacement in aged sea salt particles (Gard et al., 1998), while long-range transport of NO in haze particles is also likely playing a role (Quinn et al., 2007). Due to the logistical complexities associated with in situ measurements in the central Arctic Ocean at this time of the year, reports of aerosol chemical composition are scarce, which challenges the comparison of our dataset with others. However, observations of aerosol number concentrations and size distributions from lower-latitude land-based stations commonly reported October as the yearly minimum in PNCs as a result of enhanced wet removal and limited long-range transport of pollutants (e.g., Croft et al., 2016b; Freud et al., 2017; Nguyen et al., 2016; Pernov et al., 2022; Tunved et al., 2013). In line with these studies, the yearly total aerosol number concentration reached a minimum in October during MOSAiC (Boyer et al., 2023) and the same for Vtot (median = 0.067 µm3 cm−3, Fig. 3a). In November, the median mass concentrations of Org and SO reached their seasonal maximum (i.e., for autumn), with medians (25th quantile and 75th quantile) of 0.12 (0.09 and 0.17) and 0.136 (0.094 and 0.223) µg m−3, respectively. Although limited, we show in Sect. 3.2.2, based on our high-time-resolution dataset, that the long-range transport of anthropogenic pollutants is an important and climate-relevant contribution to the central Arctic aerosol budget in autumn and likely represents the start of the well-known haze period.
3.1.3 January–February: winter (MOSAiC)
Wintertime during MOSAiC (here defined as January and February 2020) marked the peak of the year 2020 haze season, with the highest yearly median aerosol total volume and eBC mass concentration observed in January (1.008 µm3 cm−3 and 0.11 µg m−3, respectively). This unusually early timing for the occurrence and intensity of Arctic haze has been discussed by Boyer et al. (2023) and was attributed to a record-breaking positive phase of the Arctic Oscillation (AO) between January and March 2020 (Lawrence et al., 2020), leading to enhanced air mass transport from lower latitudes to the central Arctic. The authors demonstrated the importance of Russia/Siberia as a pollution source for eBC and accumulation mode aerosol number concentrations (N100–500) during these 2 months, with eBC and N100–500 reaching their annual maxima in January. As already mentioned, the AMS was not measuring at this time of the year due to instrument malfunctions. Hence, it was not possible to derive any chemical composition information except for BC; however, given the similar fractional mass chemical composition for the neighboring months (see Fig. 2c–d), it is likely that SO was the dominant non-refractory species by mass. Nonetheless, due to a low abundance of photochemically produced oxidants in the dark winter conditions and the limited cloud liquid water for aqueous-phase reactions in the high Arctic, we could also expect that primary emissions such as BC or primary anthropogenic organics (Moschos et al., 2022b) dominated over secondary processes that would produce particulate sulfate (Schmale et al., 2022) and secondary organics. The two latter species have their peak contribution in March and April across Arctic observatories (Moschos et al., 2022a; Schmale et al., 2022). Wintertime oxidation pathways could have, however, still resulted in SO being a dominant species in the dark months of January and February in the context of anomalously high positive AO. Such pathways involve, for instance, the metal-catalyzed in-cloud oxidation of SO2 by O2 (Alexander et al., 2009; McCabe et al., 2006) and the poleward transport of SO formed at lower latitudes, where sunlight is available for photo-oxidation. This is also supported by recent findings from Boyer et al. (2024), who found a close agreement between measured high-SO2 mixing ratios and simulated SO mass concentrations using the ECLIPSE v6b emission inventory coupled with back-trajectories in January and February 2020 at the location of Polarstern. Primary SO (i.e., emitted as fully oxidized from coal- and oil-burning stacks), which was found by Moon et al. (2024) to be the dominant source of SO in a polluted city of the Alaskan sub-Arctic, could also have contributed to the central Arctic winter SO budget, since the process likely applies to other locations around the Arctic, including Siberia. Without additional observational evidence, this will not be discussed further, and the focus will be turned towards the spring Arctic haze chemical characterization (see Sect. 3.1.4).
3.1.4 March–May: spring (MOSAiC)
The spring season (March–May) was characterized by elevated PM1 concentrations, where SO contributed by 50 % to the measured mass, followed by Org (36 %), eBC (6 %), NH (3 %), NO (3 %), and Chl (2 %). This pattern is representative of the well-studied Arctic haze phenomenon (Nielsen et al., 2019; Quinn et al., 2007). A number of high mass concentration events were also observed, such as on 15 March when PM1 mass concentration neared 2 µg m−3 and during two intense episodes of warm and moist air mass intrusions from northern Eurasia on 15 and 16 April, when pollution levels ([PM1] ≥ 4 µg m−3) became comparable to central European urban pollution levels (Dada et al., 2022a). Dada et al. (2022a) showed that the sudden direct transport of pollution to the central Arctic can have important impacts on climate-relevant properties (i.e., acidity, oxidation state, and, hence, hygroscopicity). The highest monthly median mass concentrations in spring were found in April, with medians (25th quantile and 75th quantile) of 0.35 (0.31 and 045) and 0.50 (0.41 and 0.63) µg m−3 for Org and SO, respectively. At this time of the year, atmospheric conditions favored transport from lower latitudes compared to summer (Bozem et al., 2019), and Boyer et al. (2023) found that the surface aerosol population was largely influenced by transport from Siberia in spring during MOSAiC. The prevalence of SO observed here corroborates that Russia/Siberia is an important source of pollution to the central Arctic haze burden (Hirdman et al., 2010; Petäjä et al., 2020) as industrial activities in these regions (mainly metal smelters) are known to be important sources of atmospheric sulfur (Sipilä et al., 2021). We also measured relatively low NH concentrations at the surface. Observational and modeling studies have shown strong vertical gradient of NH SO ratio in the springtime Arctic, with higher concentrations of NH in the upper (free) troposphere than in the boundary layer resulting from a stronger contribution of east Asian anthropogenic (agricultural) NH emissions at higher altitudes (Fisher et al., 2011; Willis et al., 2019). Together, these observations suggest that submicron aerosols measured in the springtime at the surface are very acidic, with potential implications for the partitioning of gaseous organic acids to particle phase, as observed for MSA during MOSAiC (Dada et al., 2022a). In May, SO concentrations remained high, especially at the beginning of the month, when large-scale vertical mixing associated with the collapse of the polar vortex could have introduced large quantities of aged particles into the troposphere from aloft (Ansmann et al., 2023). Natural sources of sulfur species from DMS oxidation had a growing contribution to gaseous sulfur compounds (MSA) during this month and towards summer (Boyer et al., 2024), with the initiation of the summer sea ice melt in late May (Shupe et al., 2022). The detailed aerosol chemical and geographical sources during haze, especially those of organics, will be presented in a follow-up source apportionment study.
3.1.5 Comparison of MOSAiC and MOCCHA observations to pan-Arctic land-based stations
To understand potential spatiotemporal variability, we compared our yearly chemical composition observations with measurements from six land-based stations around the Arctic (Fig. 4), including Alert, Canada (ALT); Baranova, Russia (BAR); Gruvebadet, Svalbard/Norway (GRU); Pallas, Finland (PAL); Villum, Greenland (VRS); and Zeppelin, Svalbard/Norway (ZEP), with measurements from 2015 to 2019, depending on the station (see Fig. 4 caption for details). Further information on the location of these stations, their sampling methods, and a description of their yearly cycles of chemical composition were presented and discussed by Moschos et al. (2022a). The results of this comparison need nonetheless to be interpreted with caution for several reasons: (1) the sampling method differed substantially as offline analysis of weekly to bi-weekly filter samples by ion chromatography for inorganic ions, and an OC EC sunset analyzer for organics was employed for the pan-Arctic datasets, while an AMS was used during MOCCHA and MOSAiC; (2) the sampling sites for the pan-Arctic datasets are located at lower latitudes than those at which MOSAiC and MOCCHA took place; (3) the cutoff size for the sampling inlets was different, with 10 µm (PM10) for the filter samples and 1 µm (PM1) for the AMS; and (4), finally, for the anomaly calculations, the yearly mean value for MOCCHA and MOSAiC could be biased by the fact that data were missing in December, January, February, and July. Despite this, intercomparisons of the trends in the chemical species were still possible.
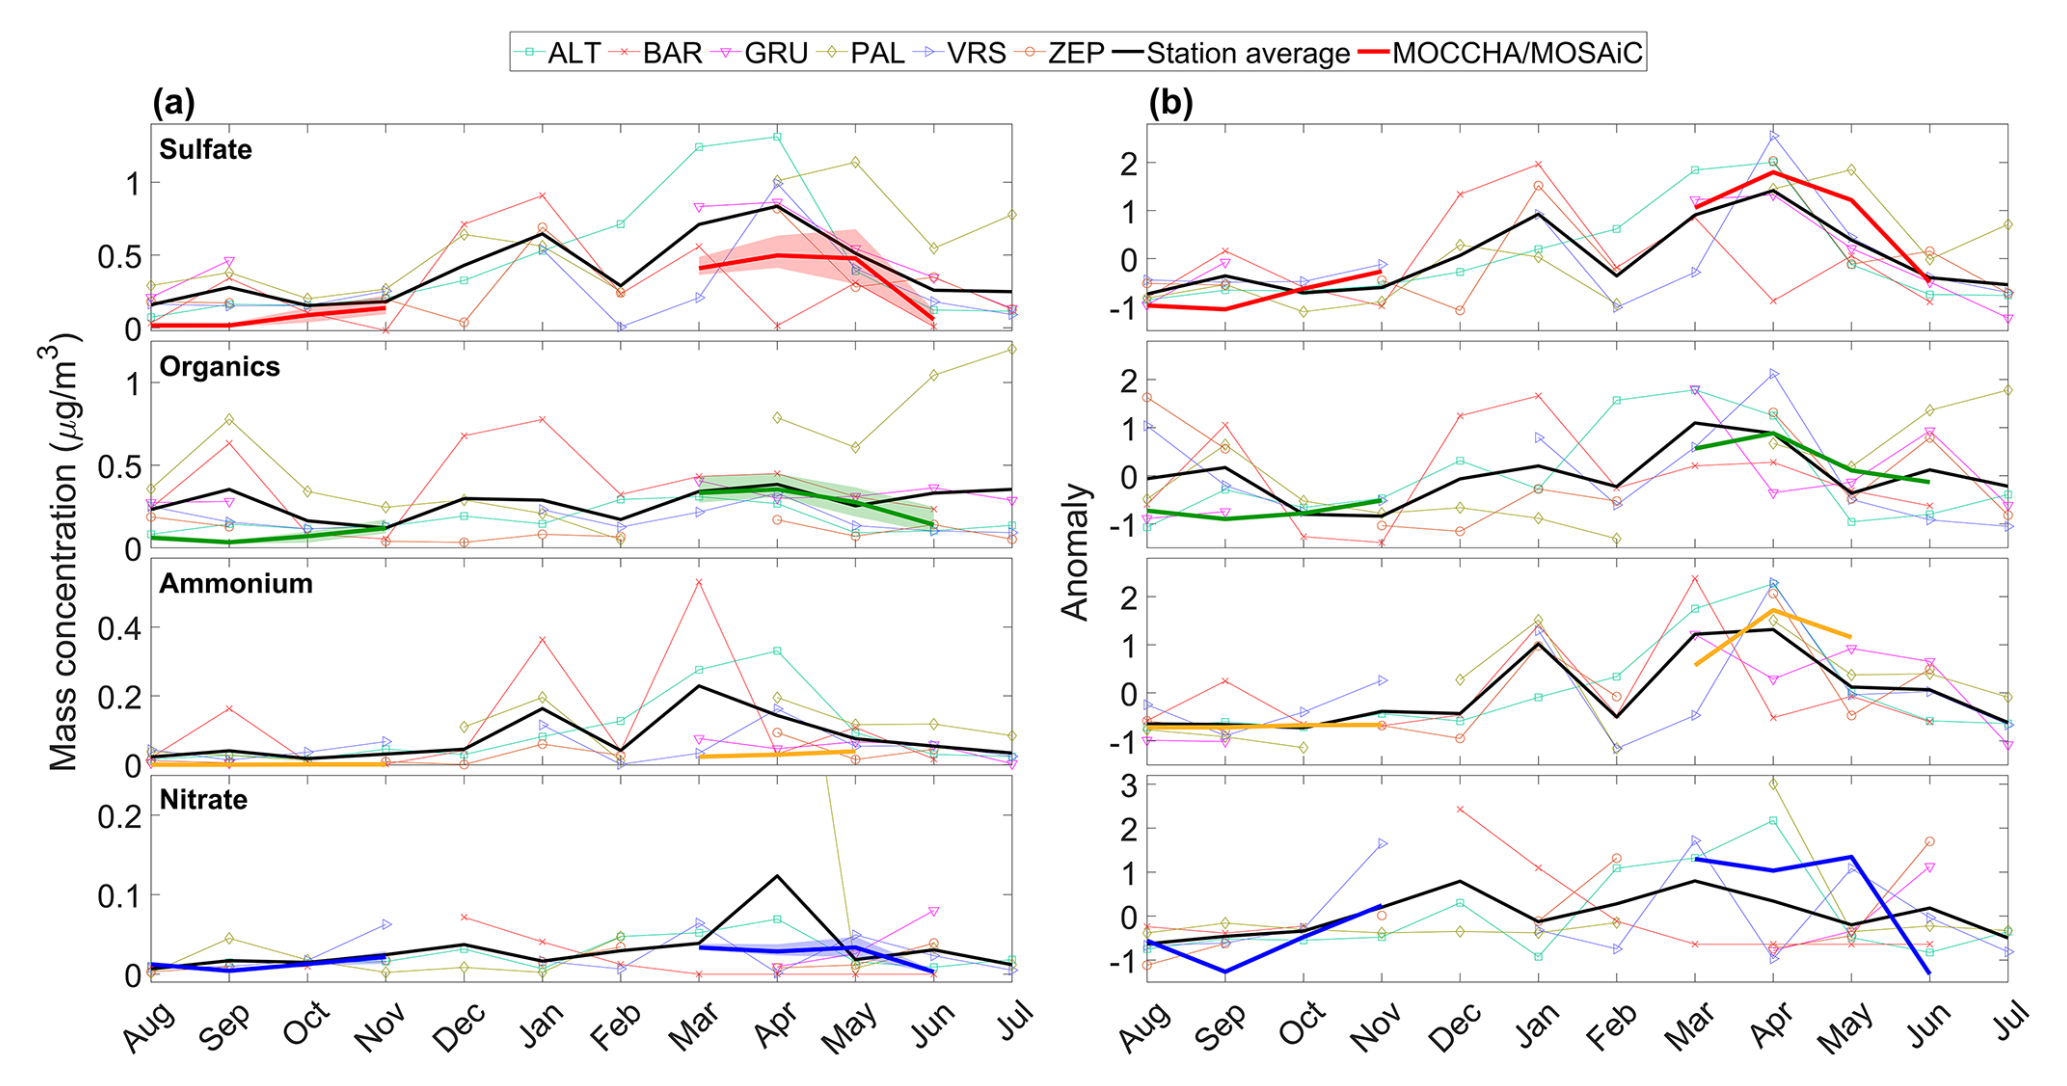
Figure 4Comparison of the seasonal cycles of absolute (a) and standardized (b) monthly mass concentration of submicron non-refractory sulfate, organics, ammonium, and nitrate from MOCCHA (August–September) and MOSAiC (October–June) to filter-based PM10 measurements from six Arctic land-based stations (Moschos et al., 2022a). The stations (and sampling periods) are the following: ALT (April 2015–December 2018), BAR (April 2015–November 2016), GRU (March 2017–August 2018), PAL (August 2018–August 2019), VRS (December 2017–December 2018), and ZEP (January 2017–December 2018). The anomalies in panel (b) were calculated using the absolute mass concentration values as (monthly_mean_site − annual_mean_site) annual_standard_deviation_site. The thin colored lines correspond to each station's yearly cycle, and thick colored lines represent the MOCCHA and MOSAiC data, with the 25th and 75th quantiles as the shaded envelope for the mass concentration. The thick black lines correspond to the station average for each chemical species. For MOCCHA and MOSAiC, data identified as affected by local contamination were not considered in the computation of the monthly statistics. The y axis for nitrate in panel (a) was cropped for readability (the value for PAL in April is equal to 0.654 µg m−3).
Sulfate, organics, and nitrate were, on average, within the same range of absolute mass concentrations in the central Arctic as at the land-based stations, although geographical variability was evident (e.g., high-SO concentration at ALT in spring or high-Org concentrations at PAL in summer) and expected (Schmale et al., 2021). These similarities are remarkable when considering the differences in the sampling conditions described above between the two datasets. An exception was for August and September during MOCCHA, where SO and Org (median SO = 0.016 µg m−3 and median Org = 0.050 µg m−3) were consistently lower than at the various land-based stations (median SO = 0.218 µg m−3 and median Org = 0.293 µg m−3 for the August–September station average). As discussed in Sect. 3.1.1, Oden was close to the North Pole and deep in the pack ice, which partly isolated it from most remote natural and anthropogenic sources. SO during springtime also exhibited lower concentrations in the central Arctic during MOSAiC (median = 0.446 µg m−3, for March–May) compared to other land-based stations (median = 0.697 µg m−3). Interestingly, at the same time, organics levels (median = 0.329 µg m−3) were relatively similar to the station measurements (median = 0.334 µg m−3). This could possibly suggest that SO and Org had different emission intensities or different sources. Alternatively, the fraction of sulfate in the coarse mode (PM10) could have been larger than that of organics, which could explain the difference between the PM1 MOSAiC observations and the PM10 pan-Arctic observations. NO was generally low in the central Arctic (yearly median = 0.017 µg m−3) and at the stations (yearly median = 0.021 µg m−3). In the case of MOCCHA and MOSAiC, this was potentially furthered by the PM1 limitation, since a large fraction of NO is expected to be found in supermicron-sized, and more alkaline, sea salt particles (Cavalli et al., 2004; Fenger et al., 2013; Mukherjee et al., 2021; Ricard et al., 2002; Saltzman, 2009).
A striking difference was observed for ammonium, which was found to be consistently less abundant throughout the year in the central Arctic (yearly median = 0.001 µg m−3) compared to the land-based stations (yearly median = 0.043 µg m−3), especially in spring. This results in generally more acidic aerosols in the central Arctic. Differences could be explained by a stronger contribution of ammonia emissions at Arctic coastal sites from migratory seabird colonies (Croft et al., 2016a), as well as different spatiotemporal NH contributions from open biomass burning events in the Arctic or sub-Arctic regions (Gramlich et al., 2024). In light of the decreasing sulfate concentrations in the Arctic (Schmale et al., 2022), efforts should be maintained to rigorously monitor aerosol chemical composition in the future, as there is a range of aerosol physicochemical processes that depends on the particles' acidity (Pye et al., 2020); for example, the partitioning of nitrate into the particle phase tends to increase as the sulfate-to-ammonium ratio decreases (Sharma et al., 2019).
Regarding the seasonality of the anomaly values (Fig. 4b), the haze signal peaking in March/April appeared to be similar for all species between MOSAiC and the pan-Arctic station averages. As stated above, the summer peak for organics was not observed during MOCCHA, resulting in a lower summer anomaly. This comparative study shows that long-term observations at Arctic land-based stations are relevant to the central Arctic seasonal cycle of chemical composition and mass loading. Differences are nonetheless noticeable, in particular for ammonium, which seems to be far less abundant in the central Arctic throughout the year, as well as sulfate and organics in summer.
3.2 Case studies on storm-driven locally emitted and long-range-transported aerosols
Compared to the relatively low time resolution imposed by aerosol filter sampling, the present year-long MOCCHA/MOSAiC dataset also offers unique opportunities to study aerosol processes happening on short timescales, which can elucidate important aspects other than the large-scale features of, e.g., Arctic haze. In particular, the MOSAiC dataset covers seasons with high-time-resolution observations other than summer, where previous central Arctic measurements are already available (e.g., Chang et al., 2011; Karlsson et al., 2022; Lawler et al., 2021). Our dataset allows us to answer several questions, as follows. Are there any significant changes in aerosol chemical composition on shorter timescales over the central Arctic Ocean? If so, by how much do the aerosol mass and number concentrations deviate from the background conditions or monthly medians/means, what are the sources of the particles, and what are their contributions to the CCN population and direct radiative budget? How long do these episodes last, what drives them, and what is their impact?
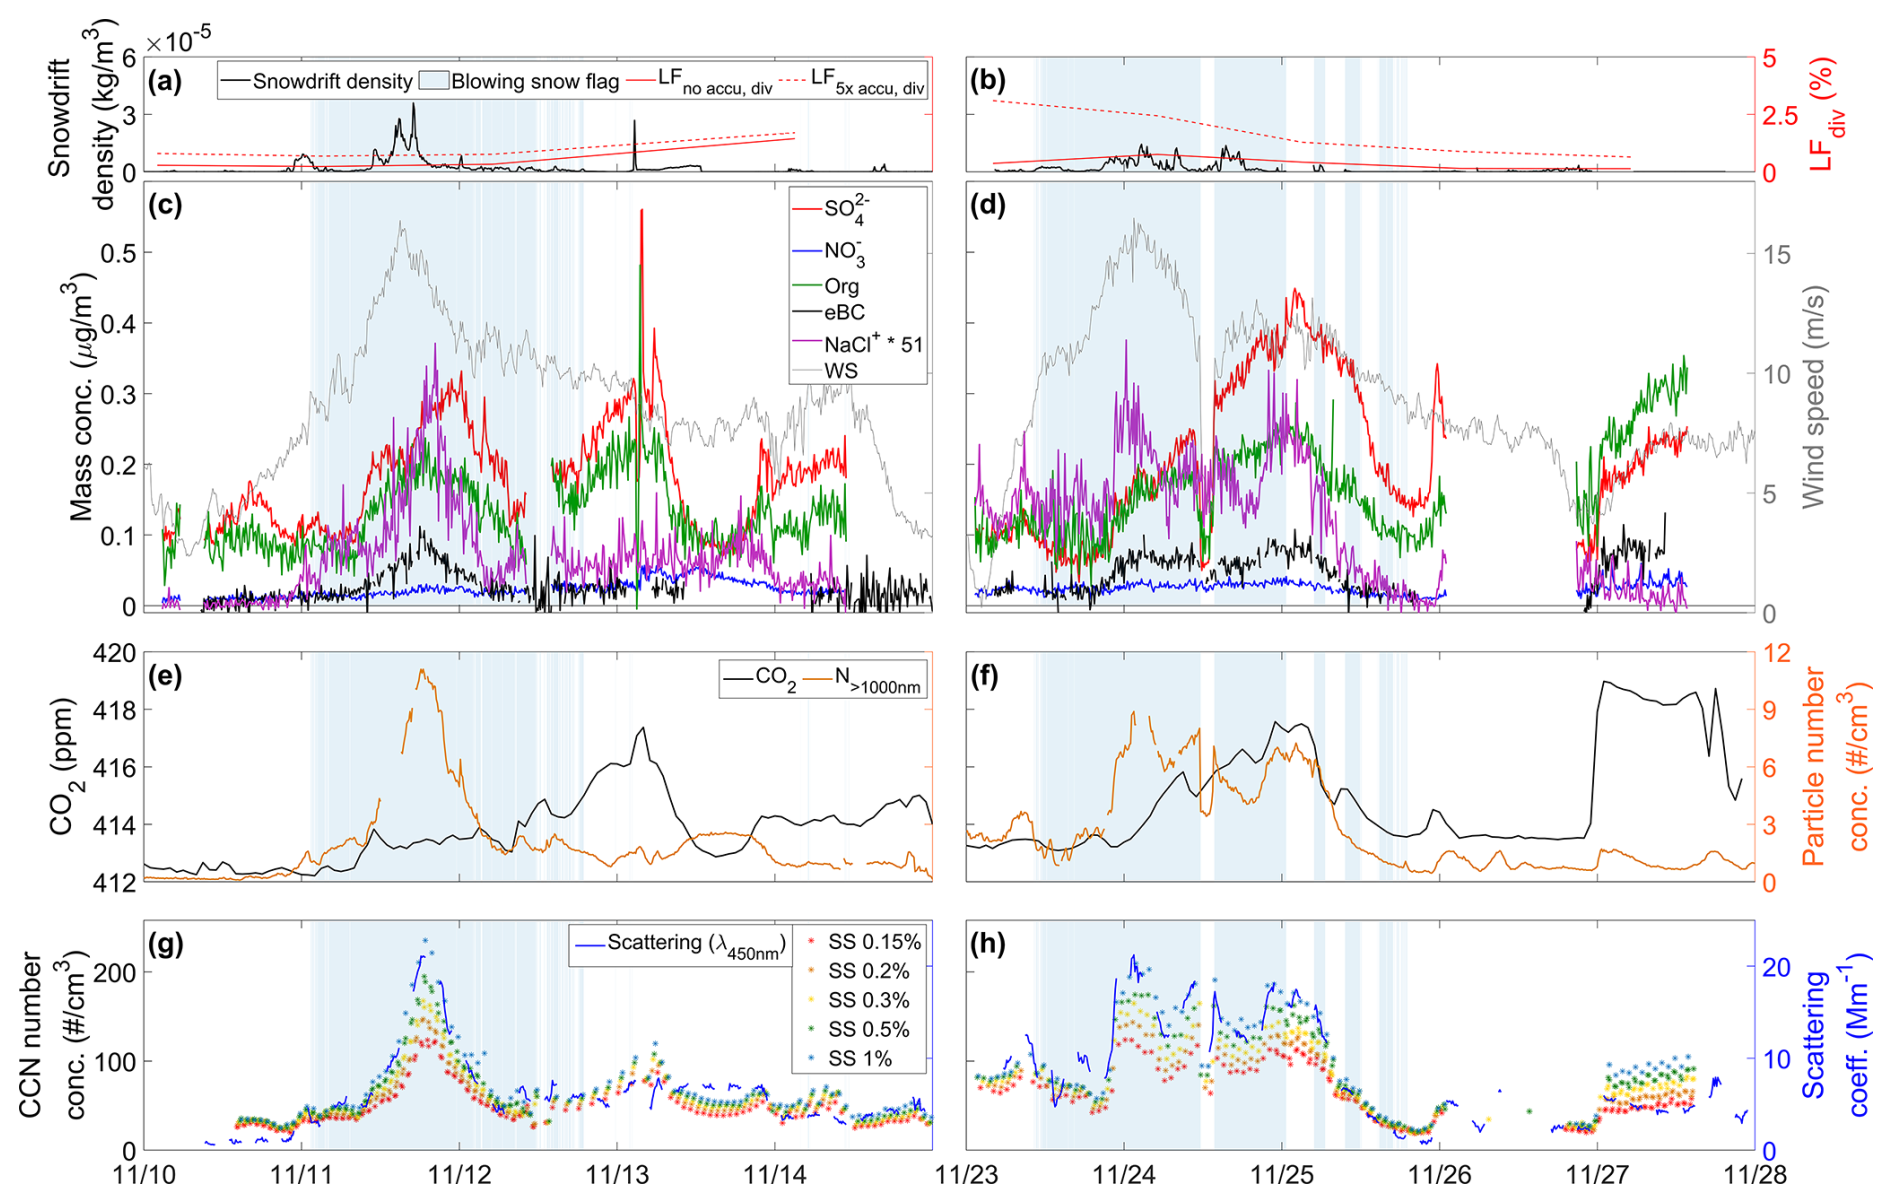
Figure 5High-time-resolution case studies of two storms in November 2019 during MOSAiC. The snowdrift density at 10 m above ground and the 50 km radius accumulated divergence-derived lead fractions with no accumulation (LFno accu, div) and accumulated five times (LF) are shown in panel (a) for the first storm from 10 to 15 November 2019 and in panel (b) for the second storm from 23 to 28 November 2019. The aerosol chemical composition, eBC mass concentrations, and wind speed are shown in panels (c) and (d) for the first and second storms, respectively. NaCl signals are in arbitrary units. CO2 dry-air mole fraction and coarse-mode particle number concentrations are shown in panels (e) and (f) for the first and second storms, respectively. CCN number concentrations and total light scattering coefficient at the blue wavelength are shown in panels (g) and (h) for the first and second storms, respectively. For all panels, the shading in blue indicates periods when blowing/drifting snow was detected. All measurements were averaged to a 10 min time resolution, except for CO2, which is hourly, and LFdiv, which depends on satellite data availability. Data identified as affected by local contamination (pollution) were removed.
We observed such rapid and intense increases in aerosol mass and number concentrations during periods of strong cyclonic (storm) activity. During MOSAiC, several storms occurred between autumn 2019 and spring 2020 (Rinke et al., 2021). Here, we focus our analysis on two major storms which happened in November 2019 (Fig. 5). For comparability, the same case study analysis was performed for spring storms in March 2020 when Arctic haze is present, and the detailed discussion can be found in Sect. S3.1. These storms were chosen based on the data availability (i.e., low influence from local pollution emissions) and the condition that the maximum wind speed during the storm exceeded 15 m s−1. Given the relatively low aerosol number concentrations in autumn (Boyer et al., 2023), the central Arctic climate system at this time is expected to be particularly sensitive to the aerosol population. The combination of high-time-resolution chemical composition (Fig. 5c, d) and dynamical and physicochemical source markers (Fig. 5a, b, e, f), optical properties, and CCN number concentrations (Fig. 5g, h) discussed below is important to uncover the sources that contributed to the aerosol and CCN populations in the overlooked dark autumn period. The measured chemical species shown in Fig. 5c and d (i.e., SO, Org, NaCl, and eBC) showed distinct temporal evolution during the two storms. While NaCl and eBC were correlated with the local wind speed, suggesting a wind-dependent aerosol generation as a source, SO and Org correlated more with CO2, indicating that these were likely primarily long-range-transported species. The discussion hereafter will hence be separated in two, first addressing the contribution from local sources (Sect. 3.2.1) and then the contribution from remote sources (Sect. 3.2.2). Note that all times reported are in UTC.
3.2.1 Wind-dependent aerosol generation as a local source of aerosols
During the first storm, the wind speed, measured on board Polarstern, started to increase on 10 November, reaching a maximum on 11 November, with values above 16 m s−1. Blowing or drifting snow was detected (see Sect. 2.4.4) without interruption between 11 November at 01:30 and 12 November at 12:00. Compared to the background period prior to the event from 12:00 to 22:00 on 10 November, a strong increase in N> 1000 nm was observed (by a factor of ∼ 54 from 0.2 to 10.7 cm−3), following, with a 3 h lag, the increase in wind speed (3 h lag Pearson correlation (ρpearson) = 0.87; p value < 0.001). Similarly, the NaCl signal correlated greatly with N> 1000 nm (ρpearson = 0.89; p value < 0.001) and increased by a factor of ∼ 87 during the storm (from 0.003 to 0.26 a.u.). Since supermicron particles are mainly related to primary particles formed by mechanical processes (Seinfeld and Pandis, 2016), in this case wind-generated, the comparison of NaCl signal was made with N> 1000 nm rather than with submicron PNCs (N10–500 nm) from the SMPS, which would be influenced by other sources such as long-range transport. Nonetheless, we show (in Fig. S4a) a comparison between N> 1000 nm and N10–500 nm during the storm, where the two were highly covariant, especially during the blowing snow episode (ρpearson = 0.99; p value < 0.001). Despite the PM1 limitation of the AMS, the fact that the submicron NaCl signal correlated with N> 1000 nm is an indication that sea salt was likely present in the blowing snow, as expected (Frey et al., 2020; Gong et al., 2023). It is also likely that a fraction of the observed increase in submicron NaCl signal originated from wind-driven SSA emissions from neighboring open leads in the sea ice, as has been observed elsewhere (e.g., Chen et al., 2022; Kirpes et al., 2019; Myers et al., 2021; Nilsson et al., 2001; Radke et al., 1976), especially since storms are associated with the mechanical deformation of the sea ice and leads opening (von Albedyll et al., 2024). However, as shown in Fig. 5a, the lead fraction (spatial resolution of 700 m) within a 50 km radius of Polarstern was less than 1 % during the storm. Hence, comparing the relative surface area of open leads to that of sea ice covered by salty snow (i.e., well above 95 %), submicron NaCl emissions from salty blowing snow can conceivably dominate over SSA emissions from leads. A recent modeling study suggested an anti-phased seasonal contribution of leads and blowing snow to sea spray fluxes in the high Arctic, with leads being the dominant source of sea salt in terms of mass in summertime and blowing snow being dominant in winter (Lapere et al., 2024). Furthermore, it cannot be entirely excluded that the observed wind-driven increase in N> 1000 nm and submicron NaCl came from longer-range-transported SSA from the ice-free Arctic Ocean. As a sea salt source apportionment is impossible here, the increase in its signal has to be seen as a mixed contribution from various wind-dependent emission sources, where blowing snow may be the dominant one. The exact strengths of these different SSA sources remain an open research question and cannot be fully answered here. Hence, for any further references to blowing snow, we implicitly include wind-generated SSA as a potential additional contribution to our observations.
The wind-driven increase in N> 1000 nm and NaCl mass concentrations resulted in a proportional increase in the CCN number concentrations (shown for SS levels from 0.15 % to 1 % in Fig. 5g). We found correlations (ρpearson) between the NaCl signal and CCN number concentrations between 0.84 and 0.88, depending on the SS level (all p values < 0.001), during blowing snow. Compared to the background period, CCN number concentrations during the storm peak increased by factors of ∼ 4 (from 27.0 to 119.3 cm−3), ∼ 5 (from 30.2 to 144.5 cm−3), ∼ 5 (from 32.1 to 161.3 cm−3), ∼ 6 (from 32.4 to 186.0 cm−3), and ∼ 7 (from 33.1 to 228.3 cm−3) at SS levels of 0.15 %, 0.2 %, 0.3 %, 0.5 %, and 1 %, respectively. The larger increase for higher SS levels is indicative of the presence of Aitken mode particles (as seen in Fig. S4a, with the stronger increase in 10-80 nm particles compared to the 80–200 or 200–500 nm ones) generated from blowing snow and SSA, which are only activated in the instrument when the SS is high enough to overcome the high curvature of these small particles (Kelvin effect). In ambient autumn conditions (i.e., not in the artificial conditions of the CCNC), high values of maximum cloud supersaturation (> 1 %) are likely to happen (Duplessis et al., 2024; Motos et al., 2023), making the Aitken mode fraction of blowing snow-related particles climate-relevant. The strong enhancement of CCN number concentrations from fine sea salt particles associated with blowing snow has been shown by Gong et al. (2023) for several blowing snow events during MOSAiC in autumn and winter. The authors further estimated, from model simulations including sea salt aerosol generation from blowing snow, that the increase in CCN number concentrations associated with blowing snow led to an increase in the downwelling longwave radiation of about +2.3 W m−2 under cloudy-sky conditions from November to April. We also observed a blowing-snow-related increase in the total submicron aerosol light scattering coefficient (shown for the blue wavelength in Fig. 5g), tightly following the NaCl signal time series (ρpearson = 0.90; p value < 0.001). Compared to 10 November background, the scattering coefficient increased by a factor of ∼ 21 at the storm's peak (from 1.0 to 21.0 Mm−1). The production of wavelength-dependent scattering particles during blowing snow episodes would be specifically relevant for radiative forcing at lower latitudes of the central Arctic and other times of the year, where sunlight is present (Bergner et al., 2025).
Overall, the same strong relations between wind speed, N> 1000 nm, NaCl signal, scattering coefficient, and CCN number concentrations were observed for the second storm case (Fig. 5b, d, f, h), where blowing snow was identified from 23 November at 10:00 to 25 November at 01:00, with an intermittent break in the storm on 24 November from 11:30 to 13:30. Defining the background period from 01:00 to 10:00 on 23 November (i.e., just before the blowing snow event) and the storm's peak from 01:00 to 03:00 on 24 November, we find an increase in the NaCl signal by a factor of ∼ 2 (from 0.14 to 0.25), for N> 1000 nm by a factor of ∼ 4 (from 2.4 to 8.5 cm−3), for the scattering coefficient by a factor of ∼ 2 (from 10.7 to 19.4 Mm−1), and for the CCN number concentration by a factor of ∼ 2 at all SS levels (e.g., from 26.9 to 203.3 cm−3 at 1 % SS). The background concentration seemed, nonetheless, to be elevated already before the blowing snow event. If we consider the background period from 15:00 to 22:00 on 25 November (i.e., after the blowing snow event, when the influence of wind speed on the considered variables seemed minimized), we found relative increases by factors of ∼ 25, 11, and 15 for the NaCl signal, N> 1000 nm, and the scattering coefficient, respectively, and between ∼ 5 and ∼ 8 for CCN number concentrations (the increase being larger at higher SS levels). Although the relative increases differed between the two storms due to the different background conditions, the absolute values reached during the storms were very similar. In agreement with Gong et al. (2023), the large deviations from the relatively pristine background suggest that blowing snow episodes are an important, but intermittent, source of scattering particles and CCN in autumn in the central Arctic. As discussed by Bergner et al. (2025), the vertical extent of the blowing snow layer made these particles directly relevant at cloud level during MOSAiC. Further analysis is needed to better quantify these impacts. In spring, we observed similar relative wind-dependent increases in the variables discussed above, although with a smaller magnitude (Sect. S3.1.1).
Another major observation during both storms was the strong correlation between NaCl and eBC during blowing snow (ρpearson = 0.74, with p value < 0.001, and ρpearson = 0.59, with p value < 0.001, for the first and second blowing snow events, respectively). This indicates that eBC was possibly contained in the sublimated particles from blowing snow. It should be noted here that the eBC measurements could be slightly overestimated due to the enhancement of light absorption in the filter matrix under the presence of strongly scattering particles (associated with a high single-scattering albedo (SSAlb); Drinovec et al., 2022). However, during both storms, the SSAlb was below 0.94 (not shown), which is below the 0.99 threshold where strong bias emerges, as experimentally determined by Drinovec et al. (2022). Compared to background conditions, the mass concentration of eBC increased by factors of ∼ 12 (from 0.008 to 0.092 µg m−3) and ∼ 4 (from 0.016 to 0.066 µg m−3) during the first and second storms, respectively, reaching levels comparable to Arctic haze conditions (see Sect. 3.1.3–3.1.4 and Fig. 3a). To our knowledge, this is the first time that such an observation has been made. The source of deposited eBC on the snowpack is uncertain but could be explained by one, or a combination, of the following two hypotheses. On the one hand, eBC could have been transported long range from lower latitudes and subsequently dry- or wet-deposited on the snowpack. On the other hand, it is also conceivable that eBC on the snowpack originated from Polarstern's stack indirectly. Continuous in situ observations of eBC in snow, as well as measurements in collected snow, would be needed to further examine the hypotheses presented above. In any case, the re-emission of previously deposited eBC could represent an important and overlooked source of atmospheric eBC in the central Arctic during a period when long-range transport is still limited by the extent of the polar dome. Due to its hydrophobic properties, eBC could influence the CCN activation potential of the sublimated blowing snow particles, depending on the mixing state of the particles (Motos et al., 2019; Zieger et al., 2023). Additionally, eBC contributes to atmospheric warming and stratification through the absorption of incoming shortwave radiation (Flanner, 2013). The latter effect is irrelevant during the dark autumn months but could become important with the return of solar radiation in spring and at lower latitudes of the Arctic, where sunlight is present for longer during autumn. In spring, we also found a storm peak increase in eBC by a factor of ∼ 2, but the data availability was insufficient to draw robust conclusions on the source of the eBC during the storm (see Sect. S3.1.1). Overall, future studies and observational campaigns should focus on the characterization of this process, especially in the likely scenario where shipping becomes more important in the Arctic (Gilgen et al., 2018; Smith and Stephenson, 2013) and where this potential eBC-cycling process becomes increasingly relevant.
3.2.2 Long-range transport as a remote source of aerosol
Around 11 November, a shift from anomalously low to high surface temperature, associated with two consecutive cyclones, triggered the storms presented above (Rinke et al., 2021). These synoptic-scale events were associated with air mass transport from lower latitudes, especially from northern Siberia (see Fig. S6). During the first storm, the gradual increase in CO2 on 11 November, peaking on 13 November (an increase of ∼ 6 ppm), was evidence of the air mass change associated with the cyclonic conditions. Likewise, for the second storm, CO2 started increasing on 24 November and peaked on 25 November (an increase of ∼ 4 ppm). For both cyclones, the perturbed CO2 signal was highly correlated with that of SO (ρpearson = 0.69, with p value < 0.001, and ρpearson = 0.89, with p value < 0.001, for the first and second storms, respectively), following a distinct temporal evolution from that of the wind-speed-related variables discussed before. This decoupling is evident during the first storm, on 13 November, when SO and CO2 peaked when the wind speed was continuously decreasing and N> 1000 nm and NaCl signals were low. In contrast with the blowing snow period when N> 1000 nm and N10–500 nm were highly correlated, the correlations dropped to ρpearson = 0.42 and ρpearson = 0.40 (p values < 0.001) outside the blowing snow events for the first and second storms, respectively (see Fig. S4a, b), highlighting that the sources of these particles were different. The peak SO during the first (∼ 0.32 µg m−3) and second (∼ 0.44 µg m−3) storms was, respectively, ∼ 2 and ∼ 3 times larger than the monthly SO median concentration in November (see Sect. 3.1.2). Organics behave similarly to SO, reaching about 0.26 µg m−3 during both storms, or ∼ 2 times that of the November median Org concentration. The relative abundance of SO, the increase in CO2, and the related emission source region (i.e., Siberia) indicate that the pollution brought to the central Arctic under these cyclonic conditions was anthropogenic in origin. In spring, we observed an increase in SO and Org during a storm on 15 March, associated with air masses traveling from eastern Siberia (Sect. S3.1.2). The influence from long-range transport during spring storms was, however, partly masked by the high haze background concentrations.
We also observed a temporal co-variation between the mass concentrations of SO and Org and the number concentrations of CCN, particularly when the influence of blowing snow was ruled out (i.e., outside the blowing snow flag). As such, the increase in CCN number concentrations on 13 November, reaching 87.2, 95.4, 101.9, 107.7, and 119.6 cm−3 at the respective SS levels of 0.15 %, 0.2 %, 0.3 %, 0.5 %, and 1 %, was likely related to the increase in SO and Org mass concentrations from long-range transport. The smaller spread in CCN number concentrations with increasing SS compared to that of the blowing snow-related increase, as discussed before, indicates that the size distributions of the long-range-transported material contained fewer Aitken mode particles, as seen in Fig. S4a. For the second storm, the sharp increase in the CO2 mixing ratio (and SO and Org mass concentrations) on 27 November, was also associated with an increase in CCN number concentration at all SS levels, although with a larger spread. The larger CCN concentration with increasing SS (∼ 95 cm−3 at 1 % SS versus 45 cm−3 at 0.15 % SS) could here be explained by the fact that organics became the dominant species and that because of their lower hygroscopicity compared to SO (Siegel et al., 2022) they required higher SS levels for droplet activation. Alternatively, a larger fraction of Aitken mode particles could also explain this behavior. However, as seen in Fig. S4b, PNCs in the size range 80–200 nm dominated over Aitken mode particles in the size range 10–80 nm.
Overall, under these cyclonic conditions, CCN number concentrations are influenced by both wind-driven local aerosol production from blowing snow and SSA, as well as from long-range-transported aerosols. Yet, the latter process plays a smaller role. Together, these large increases in CCN number concentration can increase cloud emissivity and longevity and could be in direct relation with the measured anomalously high downward longwave radiation in November during MOSAiC (Rinke et al., 2021).
3.3 Aerosol size distributions during autumn and spring
3.3.1 Contribution of local and remote sources to the submicron particle number size distributions
We found that local wind-dependent aerosol generation and long-range transport were important sources of aerosols during the autumn and spring storms during MOSAiC. We extended this approach to the entire periods of October to November 2019 and March to April 2020 by clustering the PNSDs into distinct clusters (see Sect. S4.1 for a description). Figure 6a shows the resulting median size distributions in October–November associated with the clusters, where each SMPS time step was uniquely assigned to time periods classified by blowing-snow-related (BLSN), long-range-transport-related (LRT), long-range-transport-related to larger but fewer particles (LRT-aged), or low-concentration background conditions (BG). For March–April, the PNSDs were clustered into BLSN, haze-related (Haze), or bimodal haze-related (Haze bimodal), as shown in Fig. 6b. For a direct comparison of the shape of the clustered PNSDs, the normalized size distributions clusters are provided in Fig. S12. The fitting modal parameters (location and amplitude of the modes) are given in Table S2. Median values (and 25th–75th quantiles) of N> 1000 nm, N10–500 nm, SO, eBC, NaCl, and CCN concentrations associated with each cluster are given in Table 1. Importantly, the k-means clustering algorithm is a statistical dimensionality reduction method and cannot be used to separate the contribution of various aerosol sources to each single PNSD measured. In other words, the names given to the clusters do not indicate that the PNSDs included in each cluster are the result of a single contributing emission source, as multiple sources contribute to every aerosol size distribution. Names hence indicate the likely dominating process and source.
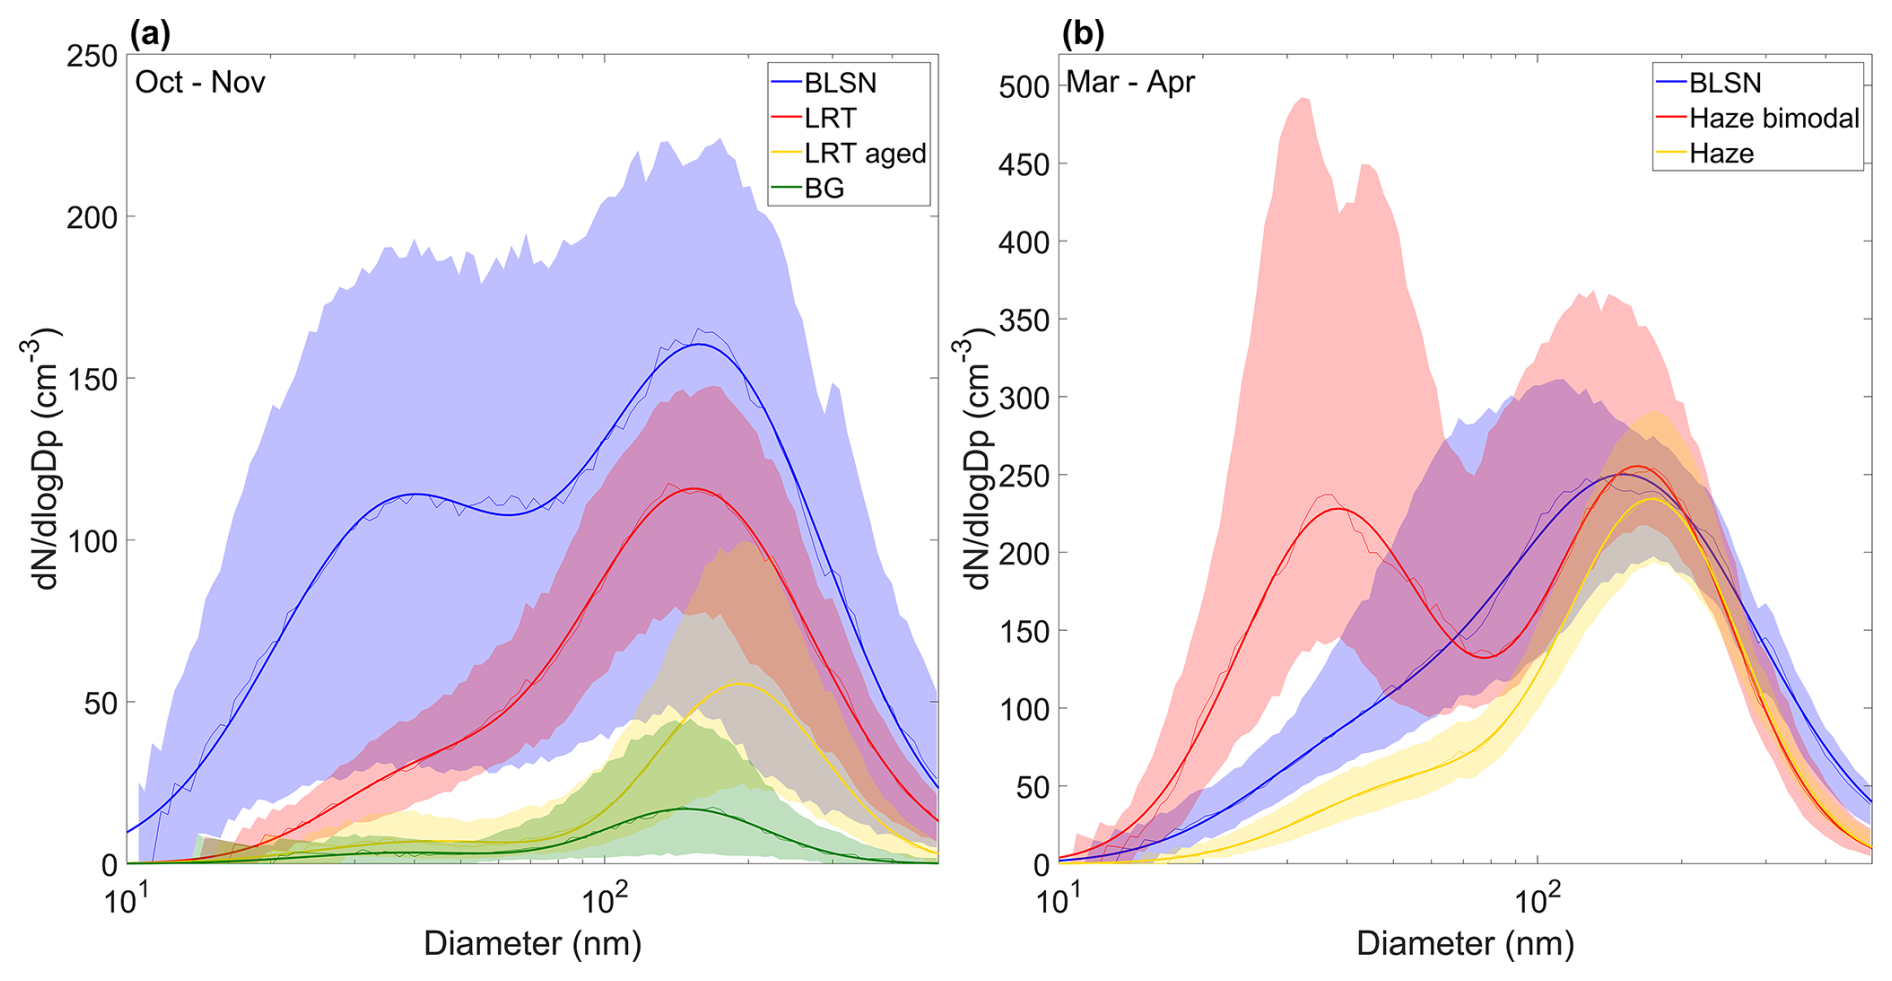
Figure 6Clustered PNSDs in (a) October–November and (b) March–April. PNSDs were uniquely attributed to each cluster, namely blowing-snow-related (BLSN), long-range-transport-related (LRT), long-range-transport-related to larger but fewer particles (LRT-aged), low-concentration background conditions (BG), haze-related, or bimodal haze-related (Haze bimodal). Thin solid lines correspond to the medians of the clusters' size distribution, while the thick solid lines show the bimodal log-normal distributions fitted to the medians. The lower (upper) boundary of the transparent envelops correspond to the 25th (75th) percentile of the clustered size distributions.
Table 1Median (25th quantile and 75th quantile) values of N> 1000 nm, N10–500 nm, SO, eBC, NaCl, and CCN concentrations associated with the PNSD clusters in October–November (autumn) and March–April (spring). Note that there are no exclusion criteria on the number of data points available in each cluster to compute the statistics and that the number of data points in each cluster is different for all the variables. An asterisk (∗) next to the median value indicates that the distribution of the variable associated with the cluster is statistically different, at the 5 % significance level using the Wilcoxon rank sum test, from the one associated with the BG cluster (in autumn) and the Haze cluster (in spring).
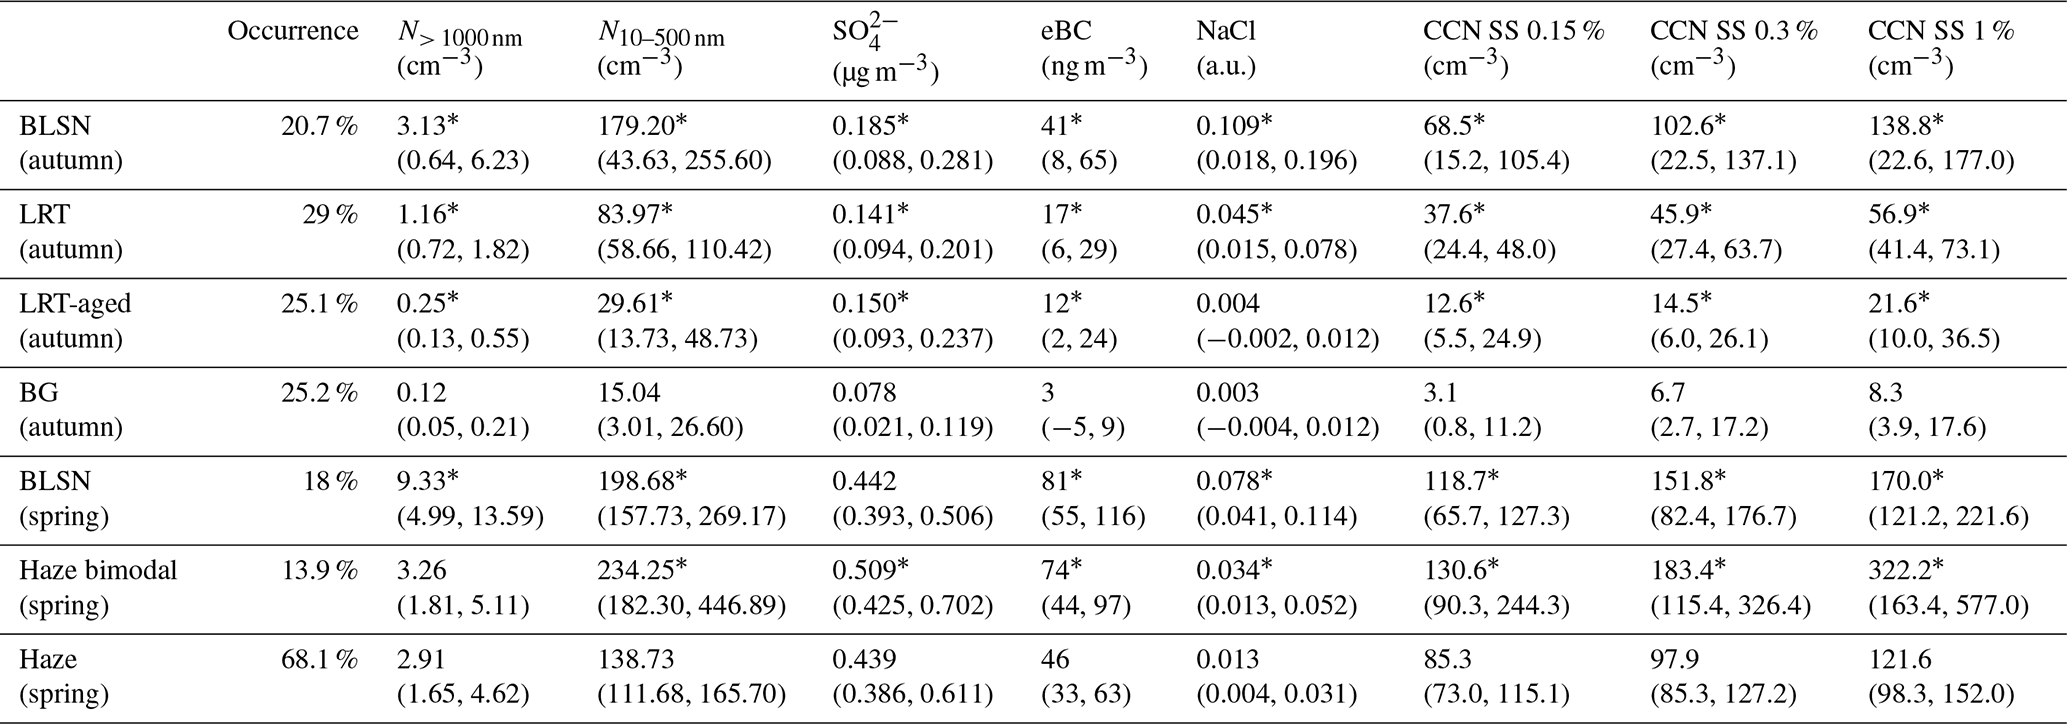
In October–November, the BG size distribution was characterized by very low SO (median = 0.078 µg m−3) and eBC (median = 3 ng m−3) mass concentrations and by low number concentrations of sub- and supermicron particles (median N10–500 nm = 15.04 cm−3; median N> 1000 nm = 0.12 cm−3), with a weak (fitted) Aitken mode at 38 ± 2 nm and a dominant accumulation mode at 148 ± 1 nm. Overall, a quarter (25.2 %) of all available SMPS PNSDs during this period were in the BG cluster, mostly in October (see Fig. S9). In contrast, the BLSN cluster was associated with high concentrations of submicron particles (median N10–500 nm = 179.20 cm−3), with strong contributions of Aitken mode particles (mode at 36 ± 1 nm) and, predominantly, accumulation mode particles (mode at 165 ± 2 nm). Spikes in N10–500 nm, contributing to the high 75th quantile value (255.6 cm−3), were observed when blowing/drifting snow was detected (see Fig. S9b), making blowing snow a potential important contribution to the BLSN PNSDs, in line with findings from Gong et al. (2023). The accumulation mode particles could also be related to the long-range-transported particles, which co-occurred with wind-generated aerosols during the storms (see Sect. 3.2). The Aitken shoulder is also consistent with recent work from Xu et al. (2022), showing Aitken mode sea spray aerosol, and also consistent with ultrafine aerosols observed during spring in Utqiaġvik, Alaska, related to lead-based sea spray aerosol (Myers et al., 2021). This highlights that blowing snow as a source of aerosol is likely not the only process that contributes to the shape of the BLSN cluster size distributions and that other local wind-sourced aerosols (e.g., sea spray from open leads) should be considered. As such, it is important to mention that the BLSN cluster refers to periods when blowing snow was observed, but it is not exclusively associated with blowing snow particles. The BLSN cluster, representing 20.7 % of all available PNSD observations in October–November, was also associated with higher NaCl mass concentrations (a factor of ∼ 37), N> 1000 nm (a factor of ∼ 26), and eBC (a factor of ∼ 14) compared to the BG cluster. Furthermore, CCN number concentrations were greatly enhanced within the BLSN cluster periods, with medians of 68.5 cm−3 at 0.15 %, 102.6 cm−3 at 0.3 % SS, and 138.8 cm−3 at 1 % SS, which are ∼ 23, ∼ 15, and ∼ 17 times larger than BG median CCN concentrations at these SS levels, respectively. The LRT cluster's median size distribution is monomodal, dominated by an accumulation mode at 155 ± 1 nm, and only a weak Aitken mode at 41 ± 1 nm associated with a median N10–500 nm value of 83.97 cm−3 (∼ 6 times higher than the BG value). CCN number concentrations and SO mass concentrations were also enhanced for LRT compared to BG (Table 1). The second LRT cluster (i.e., LRT-aged) was characterized by a lower median N10–500 nm value of 29.61 cm−3 and an accumulation mode at 192 ± 1 nm. This could be indicative of longer atmospheric residence times of the particles, thus yielding lower concentrations through dilution and larger particles through aging and coagulation processes. Similar PNSD clusters were found at VRS and other Arctic stations, namely “Haze” and “Aged”, with strong contributions in November and with the main accumulation mode diameters similar to the ones found for our two LRT clusters (Dall'Osto et al., 2019; Lange et al., 2018, 2019; Pernov et al., 2022). Overall, LRT and LRT-aged contained, respectively, 29 % and 25.1 % of all available PNSD measurements in October–November. Since the BG median size distribution shape closely resembles that of the LRT one (i.e., dominant accumulation mode around 150 nm and weak Aitken mode), the background autumnal aerosol population could be interpreted as diluted long-range-transported aerosols. To estimate the contribution of each “main source” (cluster) to the CCN population, we divided the summed CCN number concentrations associated with a given cluster throughout the October–November period by the total (all clusters) summed CCN number concentrations for the same period. We used CCN concentrations at 0.3 % SS, which is assumed to be a representative SS level in autumn in the Arctic (Motos et al., 2023). This approach yielded contributions of 80 %, 17 %, and 3 % to the October–November CCN number concentrations (at 0.3 % SS) for BLSN, LRT + LRT-aged, and BG, respectively.
In March–April, under the high-aerosol background concentration characteristic of Arctic haze (see Sect. 3.1.4), we refer to background conditions with what we call the Haze cluster. The size distributions of the Haze cluster were strongly stable (i.e., low interquartile range) and dominated by an accumulation mode at 176 ± 1 nm and a small Aitken shoulder at 57 ± 1 nm. Overall, the Haze cluster size distribution was characteristic of haze conditions in the Arctic (Boyer et al., 2023; Croft et al., 2016b; Tunved et al., 2013). The association of this cluster with background conditions mostly stems from the fact that this cluster comprised 68.1 % of all PNSD observations in March–April. In contrast with the October–November period, the background Haze concentrations in March–April were high (median N10–500 nm = 138.73 cm−3; median SO = 0.439 µg m−3; similar to the overall March–April SO median in Sect. 3.1.4) as a result of more intense long-range transport pollution events and reduced sinks. These more intense long-range transport events are partly the ones that made up the Haze bimodal cluster, where a higher number of concentrations were reached (median N10–500 nm = 234.25 cm−3), along with high SO and eBC mass concentrations (median SO = 0.509 µg m−3; median eBC = 74 ng m−3). The median Haze bimodal size distribution had roughly equal magnitudes of the Aitken mode (at 38 ± 0.2 nm) and accumulation mode (at 163 ± 1 nm), although with a large interquartile range. Aerosol cloud processing could explain the distinct bimodal distribution shape with a Hoppel minimum (indicative of aerosol cloud processing; Hoppel et al., 1986) at about 80 nm, which is a similar value to what was found elsewhere in the Arctic (Boyer et al., 2023; Freud et al., 2017; Gramlich et al., 2023; Karlsson et al., 2022). Fast transport, differences in the contributing source regions, and contributions from newly formed particles are all possible explanations for the higher contribution of Aitken mode particles to the Haze bimodal cluster PNSDs. Freud et al. (2017) demonstrated the importance of cloud processing as a source of accumulation mode particles in the Arctic, suggesting that, overall, our Haze cluster could have been associated with more cloud processing than the Haze bimodal cluster. Haze bimodal comprised 13.9 % of the March–April PNSD observations but mainly occurred around the mid-April warm-air-mass intrusions (Fig. S11), where the changes in aerosol physicochemical properties associated with these fast-transport events were discussed by Dada et al. (2022a). Similar to October–November, the BLSN cluster in March–April was associated with high submicron PNCs (median N10–500 nm = 198.68 cm−3), contributing 18 % of all available PNSD observations, primarily during times when blowing/drifting snow was detected (see Fig. S11b). While the accumulation mode (at 156 ± 3 nm) contribution to the median BLSN PNSD was higher in March–April compared to October–November (see Table S2), the Aitken mode (at 43 ± 2 nm) amplitude was lower. This is also visible when comparing the shapes of the normalized autumn and spring BLSN PNSDs (see Fig. S12). Part of these PNSD differences could be due to differences in the surface snow salinity, size of the blowing snow particles, or snow age, which are all parameters that have been shown through modeling to influence the size of the dry sea salt particles produced from blowing snow (Yang et al., 2008, 2019). Regarding the relation to the measured CCN concentrations and following the same approach as for the October–November period, we find that the BLSN cluster contributed to 20 % of the March–April CCN number concentrations at 0.3 % SS, while Haze contributed 61 % and Haze bimodal 19 %. Although the fraction of blowing-snow-related CCN (remembering that other sources are likely contributing to the BLSN cluster) is smaller compared to autumn, blowing snow episodes remain an important (local) source of CCN, whose importance could increase in the future as the contribution of anthropogenic emissions to the haze burden decreases.
Using daily averaged PNSDs, Boyer et al. (2023) performed a similar PNSD clustering analysis for the entire MOSAiC year (October 2019–October 2020). The authors reported a bimodal cluster, with modal diameters of 46.1 and 135.8 nm, and the highest occurrence in November and April. While this cluster was not attributed to any particular emission process in their study, our results suggest that the bimodal nature of the PNSDs in November and April could have originated from different processes (i.e., locally produced blowing snow and SSA particles in November and long-range-transported cloud-processed particles in April). This highlights the importance of concurrent high-time-resolution observations of aerosol size distributions and chemical composition to understand short-term aerosol variability in the central Arctic and the emission processes related to it.
3.3.2 Size-resolved chemical composition measurements
We obtained size-resolved chemical information for sulfate and organics using the AMS, which can provide critical information, such as the inference of the aerosol mixing state, to complement the PNSD analysis from Sect. 3.3.1. The monthly median of the size distributions of sulfate (in autumn and spring) and organics (in spring only) is shown in Fig. 7, and Fig. S13 shows the same distributions with interquartile range (25th and 75th quantiles). Each mass size distribution was normalized to its maximum to compare their shapes and mode diameters (in the vacuum aerodynamic diameter). The locations of the fitted modes of the monthly mass size distributions for sulfate and organics are given in Table S3.
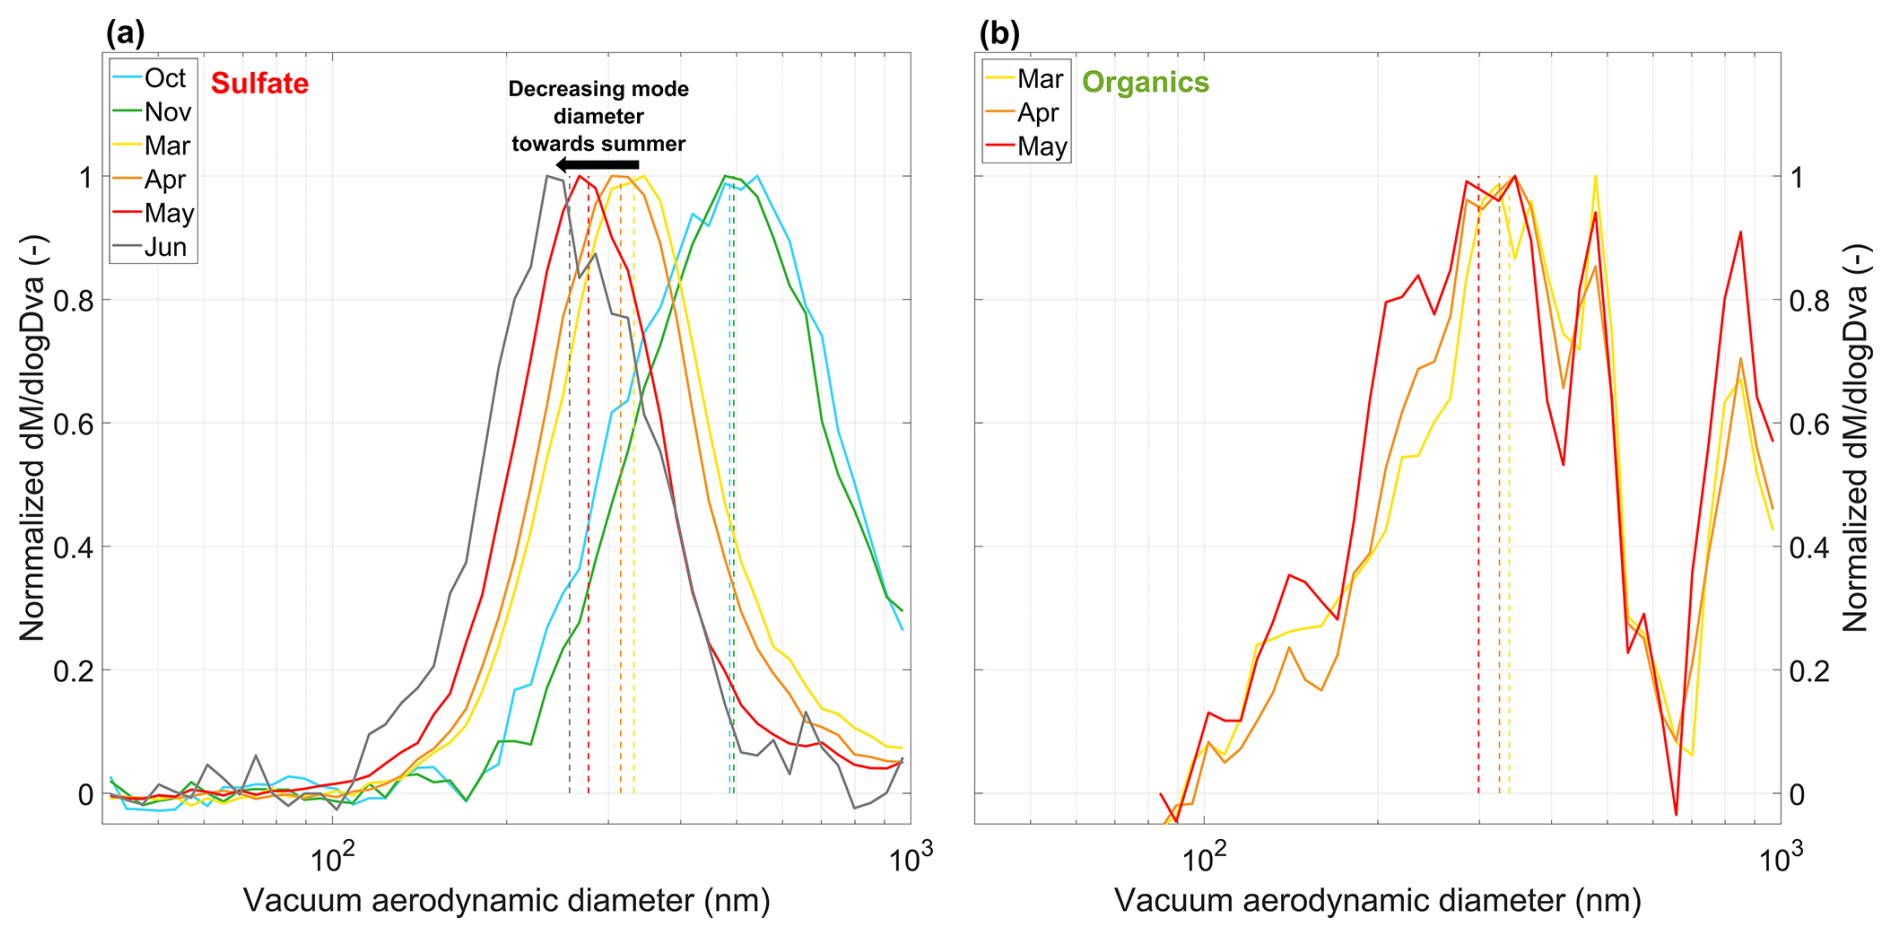
Figure 7Species-specific size distributions of sulfate (a) and organics (b) during MOSAiC presented as monthly median values. The thick colored lines represent the medians of the species-specific size distributions, which were normalized by the distributions' maximum value. Dotted lines represent the mode diameter, estimated from fitting a monomodal log-normal distribution through the observations. All the months that are not shown in both panels had a signal-to-noise ratio that is too low for the PToF data to be analyzed and is mainly for organics outside of the spring months. The monthly medians exclude polluted data for both sulfate and organics. Due to gas phase interactions with the organics' PToF signal, the size distributions of organics in panel (b) were truncated below 80 nm.
Sulfate mass in autumn was characterized by a monomodal distribution with mode diameters at 486 ± 3 and 494 ± 2 nm for October and November, respectively. Our observations in Fig. 7a and S14 suggest that autumn was characterized by a smaller number of particles for which most of the (SO) mass was contained in the larger range of the size distribution (i.e., above ∼ 400 nm in the vacuum aerodynamic diameter or above 267 nm in the mobility diameter, assuming an average particle density of 1.5 g cm−3 (Hegg et al., 1996) and spherically shaped particles). It is possible that the SO mass could be related to the LRT-aged cluster in Fig. 6, which was associated with slightly higher (p value = 0.03) SO median mass concentration (0.150 µg m−3) compared to the LRT cluster (0.141 µg m−3), as reported in Table 1, and larger particles overall. In spring, the monomodal distributions had a mode diameter at around 300 nm (seasonal average from March–June = 295 nm), consistent with the characteristics of the Haze PNSD cluster in Sect. 3.3.1, which represented more than two-thirds of the March–April observations. This mode diameter is in line with past studies that have used stage impactor aerosol collection and chemical characterization with ion chromatography in the Arctic (Hillamo et al., 2001; Leck and Persson, 1996; Mukherjee et al., 2021; Ricard et al., 2002). Overall, we observed a non-negligible decrease in the SO mode diameter from October (486 ± 3 nm) to June (257 ± 2 nm). This decrease in mode diameter was also observed for the submicron particle volume size distribution from the SMPS (see Fig. S14b). Using ion chromatography measurements of non-sea-salt sulfate, Quinn et al. (2002) found smaller submicron sulfate mass scattering efficiency in summer (July–September) compared to spring (March–June) at Utqiaġvik, Alaska. The authors, however, argued that these differences were negligible and concluded that the sulfate size distribution was unchanged throughout the year. Our observations show that this is not the case, at least in the central Arctic, and that further measurements of size-resolved chemistry in the central Arctic are needed to resolve the influence of sulfate particle size on the climate-relevant scattering efficiency property.
Organics in spring exhibited a bimodal size distribution. The main mode diameter was found at a similar diameter as for sulfate (i.e., around 300 nm; seasonal average March–May = 321 nm), which indicates that, at these sizes, the two species were probably internally mixed. Apart from some variability around the main mode, a second mode was observed above 650 nm, with an unknown mode diameter above 1 µm. We could not estimate the location of this mode as the decrease in the signal above 900 nm was likely related to a decrease in the transmission efficiency at the upper cutoff of the lens. The second mode was also likely missed in the PNSD analysis presented in Sect. 3.3.1 due to the size limitation of the SMPS (10-500 nm). By integrating the monthly median mass size distributions of organics for March–May, we found reasonable agreements with the monthly medians obtained from the mass spectral quantification (see Fig. 3). Indeed, we obtained median organics mass concentrations from the integrated size distributions (mass spectra) of 0.420 (0.334), 0.465 (0.357), and 0.360 (0.283) µg m−3 for March, April, and May, respectively. Integrating the second organic mode only (i.e., from 650 nm onward, which corresponds to the approximated location of the minimum between the first and second modes), we found that about 15 %, 17 %, and 19 % of the submicron organic mass is in this second mode for March, April, and May. These percentage contributions are, however, lower estimates, due to the decreased lens transmission efficiency near 1 µm. We hypothesize that this mode corresponded to organic-coated sea salt particles, where only the organics are detected by the AMS, and the sea salt core is left (mostly) undetected due to its refractory nature. Sea spray particles with organic coatings have been observed in previous Arctic studies (Hawkins and Russell, 2010; Kirpes et al., 2019), as well as lab-generated nascent SSA (Ault et al., 2013; Kaluarachchi et al., 2022; Mirrielees et al., 2022). The organic coating is obtained during bubble bursting at the sea surface microlayer (Blanchard, 1975). The classes of organic compounds identified in individual sea spray particles collected in the Arctic include saccharides, fatty acids, and amino acids (Hawkins and Russell, 2010; Kirpes et al., 2019). Such an organic coating can have an impact on the particle CCN activation potential that is two-fold. (1) Through the presence of non-soluble surfactants on the outer shell of the particle, the surface tension can decrease, thus increasing the particle's activation potential (Giddings and Baker, 1977; Ovadnevaite et al., 2017); (2) the lower hygroscopicity of organics can, on the other hand, decrease the particles' activation potential (Ovadnevaite et al., 2011b). Both effects would play a more important role in particular for smaller particle sizes. Both effects could also offset each other, leading to small changes in CCN activity, as shown in controlled laboratory experiments (Moore et al., 2011). It remains to be elucidated what the impact of such organic coatings on CCN activation could be for these large particles in our study.
In this study, we report the first year-long observations of size-resolved submicron aerosol chemical composition in the central Arctic based on high-time-resolution measurements from a HR-ToF-AMS. Overall, the yearly cycle of the main non-refractory species mass concentrations (i.e., sulfate, organic, nitrate, ammonium, and chloride) exhibited variations that were typical of the Arctic's aerosol seasonal regimes (Moschos et al., 2022a; Schmale et al., 2022). In June–September, under some of the lowest yearly submicron mass concentrations, the aerosol population was largely dominated by organics in terms of mass (∼ 63 % of PM1). In autumn and spring, under Arctic haze conditions, anthropogenic emissions from lower latitudes constituted the main source of PM1, with a dominant SO fraction (47 % and 50 % for October–November and March–May, respectively) and an important contribution of eBC (6 %–7 %). Due to instrumental failures, statistically representative datasets on aerosol chemistry are unfortunately missing for winter.
Comparing the year-round central Arctic PM1 chemical composition to observations from a set of pan-Arctic land-based stations (Moschos et al., 2022a), we found comparable results in terms of seasonality and, under certain conditions, absolute mass. Mostly, summer observations over pack ice in the central Arctic showed lower mass concentrations compared to the coastal land-based sites, likely related to the remoteness of the region and being away from most open-ocean marine and terrestrial aerosol sources. Ammonium appeared to be far less abundant in the central Arctic throughout the year than at lower latitudes, with potential implications in terms of aerosols' acidity. The relative agreement between central- and pan-Arctic yearly chemical composition observations suggests that, under current conditions (i.e., the extent of the winter and summer sea ice cover and atmospheric transport pathways), aerosol measurements from land-based monitoring sites can generally be extrapolated to the central Arctic. Whether this statement also applies to the speciation of organic aerosol will be investigated in a follow-up study.
Our real-time observations also allowed for high-time-resolution process studies. In autumn, when concentrations are generally low, we observed spikes in aerosol mass concentrations, with significant deviation from the background conditions. Such events were observed during the springtime haze period as well, despite the higher background concentration. We attributed these events to cyclonic (storm) activity over, or adjacent to, the central Arctic Ocean. The sensitivity of the central Arctic to the impact of cyclones was found to be two-fold. First, increasing wind speed was related to the elevated number and mass of sub- and supermicron aerosols upon the sublimation of blowing snow and/or lead-based sea spray emissions, with sea salt levels up to 80 times larger than in low-wind conditions. Black carbon was found to correlate with sea salt during the blowing snow events, indicating that these two species likely shared a common source process or controlling factor. Second, the cyclonic conditions were found to be associated with long-range transport of aerosols from Siberia, introducing high levels of, presumably anthropogenic, sulfate and organic aerosols. Overall, both local (wind-generated) and long-range-transported aerosol sources under stormy conditions contributed to enhanced CCN number concentrations in autumn and spring.
The same conclusions were also reached when statistically analyzing seasonal data as opposed to considering case studies. PNSDs were clustered into source-related observations of aerosol physicochemical properties (i.e., number concentration, size distribution, and chemical composition). Blowing snow, more generally local wind-generated particles, represented an important source of Aitken and accumulation mode particles in autumn and spring, associated with high sea salt levels, total submicron PNCs, and CCN number concentrations within the BLSN cluster. Approximately 20 % of all autumn and spring observations of PNSDs were associated with blowing snow events, as also found by Gong et al. (2023) and Bergner et al. (2025). Long-range-transported aerosols were shown to contribute either in the form of the diluted and aged accumulation mode (LRT-aged cluster in autumn and Haze clusters in spring) or as more intense pollution spikes associated with higher SO, eBC, and CCN concentrations (LRT cluster in autumn and Haze bimodal cluster in spring). Importantly, in autumn, when aerosol number concentrations were low in general, we found that the BLSN cluster was associated with about 80 % of the total seasonal CCN population at 0.3 % SS. In spring, when anthropogenic haze dominated, the BLSN cluster was associated with about 20 % of the CCN, at the same SS level. While it was suggested that particles locally produced from the sublimation of salty blowing snow particles made an important contribution to the BLSN cluster, we could not fully isolate their contribution with regards to other potential sources (e.g., emissions from nearby open leads or long-range-transported aerosols).
Based on size-resolved chemistry measurements, we also showed that organic and sulfate accumulation mode aerosols were internally mixed in autumn and spring. A second size mode above 650 nm Dva was observed for the organics in spring, which represented at least 15 %–19 % of the total submicron organic mass. We hypothesize that this second mode was related to organic coating on sea spray particles obtained during bubble bursting at the sea surface microlayer. The low concentrations during seasons other than spring meant that mass spectrometric data were below the detection limit and did not allow for a more detailed analysis of the particle size of organics. Particulate sulfate, however, was abundant enough in autumn and spring, and we observe a reduction in diameter from ∼ 480 nm Dva in October to ∼ 260 nm Dva in June, with potential implications for the scattering efficiency of these particles.
Our observations demonstrate that understanding aerosol concentrations and their contribution to CCN in the central Arctic requires information on short-timescale processes such as wind-generated particles, e.g., from blowing snow and sea spray, since observations particularly between October and May could not be described by Arctic haze contributions alone. Recent work by the Arctic Monitoring and Assessment Programme (AMAP, 2021; von Salzen et al., 2022) has shown that reduction in anthropogenic haze, especially sulfate, will lead to significant Arctic warming (+0.8 °C; range 0.4–1.4 °C; from 1995–2014 average to 2050, following SSP1-2.6) due to reduced scattering by long-range-transported aerosols. However, the model simulations did not consider local natural Arctic aerosol sources such as from blowing snow or lead-based SSA and aerosol–cloud interactions, which are particularly important for the surface temperature through longwave forcing in the absence of solar radiation. Our results suggest that wind-generated (including blowing snow-generated) particles could produce CCN number concentrations of comparable or higher magnitude compared to haze particles, particularly in autumn. It is hence essential to conduct further simulations that take these new observations and aerosol–cloud interactions into account, specifically in scenarios with significantly declining anthropogenic haze, to better constrain the aerosol effect on Arctic surface temperature.
The following datasets were collected during MOCCHA:
-
chemical composition from the HR-ToF-AMS, available at https://doi.org/10.17043/oden-ao-2018-aerosol-ams-1 (Dada et al., 2022b);
-
equivalent black carbon mass concentration from the AE33, available at https://doi.org/10.17043/oden-ao-2018-aerosol-ebc-ae33-1 (Heutte et al., 2024); and
-
aerosol size distribution (18–660 nm) from the SMPS, available at https://doi.org/10.17043/oden-ao-2018-aerosol-smps-1 (Baccarini and Schmale, 2020).
The following datasets were collected during MOSAiC:
-
chemical composition from the HR-ToF-AMS, available at https://doi.org/10.1594/PANGAEA.961009 (Heutte et al., 2023a);
-
equivalent black carbon mass concentration from the AE33, available at https://doi.org/10.1594/PANGAEA.952251 (Heutte et al., 2022);
-
aerosol size distribution (10–500 nm) from the SMPS, available at https://doi.org/10.5439/1476898 (Kuang et al., 2022);
-
aerosol number concentration from the APS, available at https://doi.org/10.1594/PANGAEA.960923 (Bergner et al., 2023a);
-
cloud condensation nuclei, available at https://doi.org/10.1594/PANGAEA.961131 (Bergner et al., 2023b);
-
merged carbon dioxide dry-air mole fractions, available at https://doi.org/10.1594/PANGAEA.944272 (Angot et al., 2022a);
-
submicron aerosol total light scattering coefficient, available at https://doi.org/10.5439/1228051 (Koontz et al., 2022);
-
temperature and relative humidity in the inlet of the Swiss container, available at https://doi.org/10.1594/PANGAEA.961007 (Heutte et al., 2023c);
-
atmospheric snow particle flux from the SPCs, available at https://doi.org/10.5285/7d8e401b-2c75-4ee4-a753-c24b7e91e6e9 (Frey et al., 2023);
-
sea ice lead fractions, available at https://doi.org/10.1594/PANGAEA.963671 (von Albedyll, 2024);
-
continuous meteorological surface measurements, available at https://doi.org/10.1594/PANGAEA.935221 (Schmithüsen, 2021a), https://doi.org/10.1594/PANGAEA.935222 (Schmithüsen, 2021b), https://doi.org/10.1594/PANGAEA.935223 (Schmithüsen, 2021c), https://doi.org/10.1594/PANGAEA.935224 (Schmithüsen, 2021d), and https://doi.org/10.1594/PANGAEA.935225 (Schmithüsen, 2021e); and
-
sea ice concentrations from satellite passive microwave data, available at https://doi.org/10.5067/8GQ8LZQVL0VL (Cavalieri et al., 1996).
The supplement related to this article is available online at https://doi.org/10.5194/acp-25-2207-2025-supplement.
BH wrote the paper with input from JS, and all the authors provided comments/revisions. JS, AB, and PZ conducted the MOCCHA field measurements reported in this work. LLJQ, IB, TL, JS, and TJ conducted the MOSAiC field measurements reported in this work. VM and IEH provided the pan-Arctic chemical composition measurements. SH lent and calibrated the CCNC. BH, LD, NB, HA, MMF, and IB provided and interpreted datasets, with help from JBP, JMC, KAP, MB, IEH, KRD, and JS.
JS and TP obtained the funding for the Swiss container during MOSAiC, and JS conceived the field measurements.
At least one of the (co-)authors is a member of the editorial board of Atmospheric Chemistry and Physics. The peer-review process was guided by an independent editor, and the authors also have no other competing interests to declare.
Publisher's note: Copernicus Publications remains neutral with regard to jurisdictional claims made in the text, published maps, institutional affiliations, or any other geographical representation in this paper. While Copernicus Publications makes every effort to include appropriate place names, the final responsibility lies with the authors.
Data reported in this work were produced as part of the international Multidisciplinary drifting Observatory for the Study of Arctic Climate (MOSAiC) expedition with the tag MOSAiC20192020. The authors would like to thank the teams at the Paul Scherrer Institute and the Institute for Atmospheric and Earth System Research (INAR) for their land-based support during the MOSAiC expedition. We also thank all those who contributed to MOSAiC and made this endeavor possible (Nixdorf et al., 2021). For the expedition AO2018, the Swedish Polar Research Secretariat (SPRS) provided access to the I/B Oden and logistical support in collaboration with the U.S. National Science Foundation (NSF). We are grateful to the chief scientists Caroline Leck and Patricia Matrai for planning, technical support, and the coordination of AO2018 and the SPRS logistical staff and I/B Oden's captain Mattias Peterson and his crew for expert field support. Funding for the expedition AO2018 was provided to Caroline Leck by the NSF and SPRS cost-sharing Understanding Arctic Ocean 2018. Julia Schmale holds the Ingvar Kamprad chair for Extreme Environments Research sponsored by Ferring Pharmaceuticals. A subset of the data was obtained from the Atmospheric Radiation Measurement (ARM) User Facility, a U.S. Department of Energy (DOE) Office of Science User Facility managed by the Biological and Environmental Research Program. We thank Silvia Bucci and the FLEXPART group at the University of Vienna for calculating the air mass back-trajectories with the FLEXPART model.
This research has been supported by the Schweizerischer Nationalfonds zur Förderung der Wissenschaftlichen Forschung (grant nos. 200021_188478, 200021_169090, PZPGP2_201992, and PZ00P2_216181), the Swiss Polar Institute (grant no. DIRCR-2018-004), the Fondation BNP Paribas (Polar Access Fund 2018), the Alfred Wegener Institute Helmholtz Centre for Polar and Marine Research (grant no. AWI_PS122_00), the Knut och Alice Wallenbergs Stiftelse (grant no. 2016.0024), the Vetenskapsrådet (grant nos. 2018-05045, 2016-05100, 824-2013-222, and 2016-03518), the Natural Environment Research Council (grant nos. NE/R009686/1 and NE/S00257X/1), the NERC National Capability International grant SURface FluxEs In AnTarctica (SURFEIT) (grant no. NE/X009319/1), the Research Council of Finland (grant nos. 337552, 333397, and 337549), the U.S. Department of Energy (grant nos. DE-SC0022046 and DE-SC0019251), the National Oceanic and Atmospheric Administration (grant no. NA22OAR4320151), and the Swiss Data Science Center (project C20-01; Arctic climate change: exploring the Natural Aerosol baseline for improved model Predictions; ArcticNAP). This project has also received funding from the European Union's Horizon 2020 research and innovation programme under grant no. 101003826 via the project CRiceS (Climate relevant interactions and feedbacks: the key role of sea ice and Snow in the polar and global climate system) and from grant no. 714621 via the project GASPARCON (Molecular steps of gas-to-particle conversion: From oxidation to precursors, clusters and secondary aerosol particles).
This paper was edited by Hang Su and reviewed by three anonymous referees.
Acosta Navarro, J. C., Varma, V., Riipinen, I., Seland, Ø., Kirkevåg, A., Struthers, H., Iversen, T., Hansson, H.-C., and Ekman, A. M. L.: Amplification of Arctic warming by past air pollution reductions in Europe, Nat. Geosci., 9, 277–281, https://doi.org/10.1038/ngeo2673, 2016.
Adachi, K., Tobo, Y., Koike, M., Freitas, G., Zieger, P., and Krejci, R.: Composition and mixing state of Arctic aerosol and cloud residual particles from long-term single-particle observations at Zeppelin Observatory, Svalbard, Atmos. Chem. Phys., 22, 14421–14439, https://doi.org/10.5194/acp-22-14421-2022, 2022.
Albrecht, B. A.: Aerosols, Cloud Microphysics, and Fractional Cloudiness, Science, 245, 1227–1230, https://doi.org/10.1126/science.245.4923.1227, 1989.
Alexander, B., Park, R. J., Jacob, D. J., and Gong, S.: Transition metal-catalyzed oxidation of atmospheric sulfur: Global implications for the sulfur budget, J. Geophys. Res.-Atmos., 114, D02309, https://doi.org/10.1029/2008JD010486, 2009.
AMAP: Arctic pollution 2006: Acidification and Arctic haze, Arctic Monitoring and Assessment Programme (AMAP), Oslo, Norway, ISBN 82-7971-045-0, 2006.
AMAP: The Impact of Black Carbon on Arctic Climate, Arctic Monitoring and Assessment Programme (AMAP), Oslo, Norway, ISBN 978-82-7971-069-1, 2011.
AMAP: AMAP Assessment 2015: Black Carbon and Ozone as Arctic Climate Forcers, Arctic Monitoring and Assessment Programme (AMAP), Oslo, Norway, ISBN 978-82-7971-092-9, 2015.
AMAP: AMAP Assesment 2021: Impacts of Short-lived Climate Forcers on Arctic Climate, Air Quality, and Human Health., Arctic Monitoring and Assessment Programme (AMAP), Tromsø, Norway, ISBN 978-82-7971-202-2, 2021.
Angot, H., Blomquist, B., Howard, D., Archer, S., Bariteau, L., Beck, I., Helmig, D., Hueber, J., Jacobi, H.-W., Jokinen, T., Lan, X., Laurila, T., Madronich, M., Posman, K., Quéléver, L., and Schmale, J.: Carbon dioxide dry air mole fractions measured during MOSAiC 2019/2020 (merged dataset), PANGAEA [data set], https://doi.org/10.1594/PANGAEA.944272, 2022a.
Angot, H., Blomquist, B., Howard, D., Archer, S., Bariteau, L., Beck, I., Boyer, M., Crotwell, M., Helmig, D., Hueber, J., Jacobi, H.-W., Jokinen, T., Kulmala, M., Lan, X., Laurila, T., Madronich, M., Neff, D., Petäjä, T., Posman, K., Quéléver, L., Shupe, M. D., Vimont, I., and Schmale, J.: Year-round trace gas measurements in the central Arctic during the MOSAiC expedition, Sci. Data, 9, 723, https://doi.org/10.1038/s41597-022-01769-6, 2022b.
Ansmann, A., Ohneiser, K., Engelmann, R., Radenz, M., Griesche, H., Hofer, J., Althausen, D., Creamean, J. M., Boyer, M. C., Knopf, D. A., Dahlke, S., Maturilli, M., Gebauer, H., Bühl, J., Jimenez, C., Seifert, P., and Wandinger, U.: Annual cycle of aerosol properties over the central Arctic during MOSAiC 2019–2020 – light-extinction, CCN, and INP levels from the boundary layer to the tropopause, EGUsphere [preprint], https://doi.org/10.5194/egusphere-2023-444, 2023.
Ault, A. P., Moffet, R. C., Baltrusaitis, J., Collins, D. B., Ruppel, M. J., Cuadra-Rodriguez, L. A., Zhao, D., Guasco, T. L., Ebben, C. J., Geiger, F. M., Bertram, T. H., Prather, K. A., and Grassian, V. H.: Size-Dependent Changes in Sea Spray Aerosol Composition and Properties with Different Seawater Conditions, Environ. Sci. Technol., 47, 5603–5612, https://doi.org/10.1021/es400416g, 2013.
Baccarini, A. and Schmale, J.: Size distribution of interstitial and total particles between 18 and 660 nm collected during the Arctic Ocean 2018 expedition, Bolin Centre Database [data set], https://doi.org/10.17043/oden-ao-2018-aerosol-smps-1, 2020.
Baccarini, A., Karlsson, L., Dommen, J., Duplessis, P., Vüllers, J., Brooks, I. M., Saiz-Lopez, A., Salter, M., Tjernström, M., Baltensperger, U., Zieger, P., and Schmale, J.: Frequent new particle formation over the high Arctic pack ice by enhanced iodine emissions, Nat. Commun., 11, 4924, https://doi.org/10.1038/s41467-020-18551-0, 2020.
Barnes, I., Hjorth, J., and Mihalopoulos, N.: Dimethyl Sulfide and Dimethyl Sulfoxide and Their Oxidation in the Atmosphere, Chem. Rev., 106, 940–975, https://doi.org/10.1021/cr020529+, 2006.
Barrie, L. A.: Arctic air pollution: An overview of current knowledge, Atmos. Environ., 20, 643–663, https://doi.org/10.1016/0004-6981(86)90180-0, 1986.
Barrie, L. A. and Hoff, R. M.: The oxidation rate and residence time of sulphur dioxide in the arctic atmosphere, Atmos. Environ., 18, 2711–2722, https://doi.org/10.1016/0004-6981(84)90337-8, 1984.
Beck, I., Angot, H., Baccarini, A., Dada, L., Quéléver, L., Jokinen, T., Laurila, T., Lampimäki, M., Bukowiecki, N., Boyer, M., Gong, X., Gysel-Beer, M., Petäjä, T., Wang, J., and Schmale, J.: Automated identification of local contamination in remote atmospheric composition time series, Atmos. Meas. Tech., 15, 4195–4224, https://doi.org/10.5194/amt-15-4195-2022, 2022.
Beck, L. J., Sarnela, N., Junninen, H., Hoppe, C. J. M., Garmash, O., Bianchi, F., Riva, M., Rose, C., Peräkylä, O., Wimmer, D., Kausiala, O., Jokinen, T., Ahonen, L., Mikkilä, J., Hakala, J., He, X.-C., Kontkanen, J., Wolf, K. K. E., Cappelletti, D., Mazzola, M., Traversi, R., Petroselli, C., Viola, A. P., Vitale, V., Lange, R., Massling, A., Nøjgaard, J. K., Krejci, R., Karlsson, L., Zieger, P., Jang, S., Lee, K., Vakkari, V., Lampilahti, J., Thakur, R. C., Leino, K., Kangasluoma, J., Duplissy, E.-M., Siivola, E., Marbouti, M., Tham, Y. J., Saiz-Lopez, A., Petäjä, T., Ehn, M., Worsnop, D. R., Skov, H., Kulmala, M., Kerminen, V.-M., and Sipilä, M.: Differing Mechanisms of New Particle Formation at Two Arctic Sites, Geophys. Res. Lett., 48, e2020GL091334, https://doi.org/10.1029/2020GL091334, 2020.
Beddows, D. C. S., Dall'Osto, M., and Harrison, R. M.: Cluster Analysis of Rural, Urban, and Curbside Atmospheric Particle Size Data, Environ. Sci. Technol., 43, 4694–4700, https://doi.org/10.1021/es803121t, 2009.
Bergner, N., Beck, I., Quéléver, L., Jokinen, T., Laurila, T., Dada, L., and Schmale, J.: Aerodynamic Particle Sizer spectrometer (APS) aerosol number concentrations, measured in the Swiss container during MOSAiC 2019/2020, PANGAEA [data set], https://doi.org/10.1594/PANGAEA.960923, 2023a.
Bergner, N., Heutte, B., Angot, H., Dada, L., Beck, I., Quéléver, L., Jokinen, T., Laurila, T., and Schmale, J.: Cloud Condensation Nuclei (CCN) concentrations measured in the Swiss container during MOSAiC 2019/2020, PANGAEA [data set], https://doi.org/10.1594/PANGAEA.961131, 2023b.
Bergner, N., Heutte, B., Beck, I., Pernov, J. B., Angot, H., Arnold, S. R., Boyer, M., Creamean, J. M., Engelmann, R., Frey, M. M., Gong, X., Henning, S., James, T., Matrosov, S. Y., Mirrielees, J. A., Petaja, T., Pratt, K. A., Quéléver, L. L. J., Schneebeli, M., Uin, J., Wang, J., and Schmale, J.: Characterization and effects of aerosols during blowing snow events in the central Arctic, Elem. Sci. Anth., accepted, 2025.
Bigg, E. K. and Leck, C.: The composition of fragments of bubbles bursting at the ocean surface, J. Geophys. Res.-Atmos., 113, D11209, https://doi.org/10.1029/2007JD009078, 2008.
Bintanja, R. and Andry, O.: Towards a rain-dominated Arctic, Nat. Clim. Chang., 7, 263–267, https://doi.org/10.1038/nclimate3240, 2017.
Blanchard, D. C.: Bubble Scavenging and the Water-to-Air Transfer of Organic Material in the Sea, in: Applied Chemistry at Protein Interfaces, American Chemical Society, vol. 145, 360–387, https://doi.org/10.1021/ba-1975-0145.ch018, 1975.
Boyer, M., Aliaga, D., Pernov, J. B., Angot, H., Quéléver, L. L. J., Dada, L., Heutte, B., Dall'Osto, M., Beddows, D. C. S., Brasseur, Z., Beck, I., Bucci, S., Duetsch, M., Stohl, A., Laurila, T., Asmi, E., Massling, A., Thomas, D. C., Nøjgaard, J. K., Chan, T., Sharma, S., Tunved, P., Krejci, R., Hansson, H. C., Bianchi, F., Lehtipalo, K., Wiedensohler, A., Weinhold, K., Kulmala, M., Petäjä, T., Sipilä, M., Schmale, J., and Jokinen, T.: A full year of aerosol size distribution data from the central Arctic under an extreme positive Arctic Oscillation: insights from the Multidisciplinary drifting Observatory for the Study of Arctic Climate (MOSAiC) expedition, Atmos. Chem. Phys., 23, 389–415, https://doi.org/10.5194/acp-23-389-2023, 2023.
Boyer, M., Aliaga, D., Quéléver, L. L. J., Bucci, S., Angot, H., Dada, L., Heutte, B., Beck, L., Duetsch, M., Stohl, A., Beck, I., Laurila, T., Sarnela, N., Thakur, R. C., Miljevic, B., Kulmala, M., Petäjä, T., Sipilä, M., Schmale, J., and Jokinen, T.: The annual cycle and sources of relevant aerosol precursor vapors in the central Arctic during the MOSAiC expedition, Atmos. Chem. Phys., 24, 12595–12621, https://doi.org/10.5194/acp-24-12595-2024, 2024.
Bozem, H., Hoor, P., Kunkel, D., Köllner, F., Schneider, J., Herber, A., Schulz, H., Leaitch, W. R., Aliabadi, A. A., Willis, M. D., Burkart, J., and Abbatt, J. P. D.: Characterization of transport regimes and the polar dome during Arctic spring and summer using in situ aircraft measurements, Atmos. Chem. Phys., 19, 15049–15071, https://doi.org/10.5194/acp-19-15049-2019, 2019.
Brean, J., Beddows, D. C. S., Harrison, R. M., Song, C., Tunved, P., Ström, J., Krejci, R., Freud, E., Massling, A., Skov, H., Asmi, E., Lupi, A., and Dall'Osto, M.: Collective geographical ecoregions and precursor sources driving Arctic new particle formation, Atmos. Chem. Phys., 23, 2183–2198, https://doi.org/10.5194/acp-23-2183-2023, 2023.
Breider, T. J., Mickley, L. J., Jacob, D. J., Ge, C., Wang, J., Payer Sulprizio, M., Croft, B., Ridley, D. A., McConnell, J. R., Sharma, S., Husain, L., Dutkiewicz, V. A., Eleftheriadis, K., Skov, H., and Hopke, P. K.: Multidecadal trends in aerosol radiative forcing over the Arctic: Contribution of changes in anthropogenic aerosol to Arctic warming since 1980, J. Geophys. Res.-Atmos., 122, 3573–3594, https://doi.org/10.1002/2016JD025321, 2017.
Browse, J., Carslaw, K. S., Arnold, S. R., Pringle, K., and Boucher, O.: The scavenging processes controlling the seasonal cycle in Arctic sulphate and black carbon aerosol, Atmos. Chem. Phys., 12, 6775–6798, https://doi.org/10.5194/acp-12-6775-2012, 2012.
Bulatovic, I., Igel, A. L., Leck, C., Heintzenberg, J., Riipinen, I., and Ekman, A. M. L.: The importance of Aitken mode aerosol particles for cloud sustenance in the summertime high Arctic – a simulation study supported by observational data, Atmos. Chem. Phys., 21, 3871–3897, https://doi.org/10.5194/acp-21-3871-2021, 2021.
Canagaratna, M. R., Jayne, J. T., Jimenez, J. L., Allan, J. D., Alfarra, M. R., Zhang, Q., Onasch, T. B., Drewnick, F., Coe, H., Middlebrook, A., Delia, A., Williams, L. R., Trimborn, A. M., Northway, M. J., DeCarlo, P. F., Kolb, C. E., Davidovits, P., and Worsnop, D. R.: Chemical and microphysical characterization of ambient aerosols with the aerodyne aerosol mass spectrometer, Mass Spectrom. Rev., 26, 185–222, https://doi.org/10.1002/mas.20115, 2007.
Cavalieri, D. J., Parkinson, C. L., Gloersen, P., and Zwally, H. J.: Sea Ice Concentrations from Nimbus-7 SMMR and DMSP SSM/I-SSMIS Passive Microwave Data, NASA National Snow and Ice Data Center Distributed Active Archive Center [data set], https://doi.org/10.5067/8GQ8LZQVL0VL, 1996.
Cavalli, F., Facchini, M. C., Decesari, S., Mircea, M., Emblico, L., Fuzzi, S., Ceburnis, D., Yoon, Y. J., O'Dowd, C. D., Putaud, J.-P., and Dell'Acqua, A.: Advances in characterization of size-resolved organic matter in marine aerosol over the North Atlantic, J. Geophys. Res.-Atmos., 109, D24215, https://doi.org/10.1029/2004JD005137, 2004.
Chang, R. Y.-W., Leck, C., Graus, M., Müller, M., Paatero, J., Burkhart, J. F., Stohl, A., Orr, L. H., Hayden, K., Li, S.-M., Hansel, A., Tjernström, M., Leaitch, W. R., and Abbatt, J. P. D.: Aerosol composition and sources in the central Arctic Ocean during ASCOS, Atmos. Chem. Phys., 11, 10619–10636, https://doi.org/10.5194/acp-11-10619-2011, 2011.
Chen, Q., Mirrielees, J. A., Thanekar, S., Loeb, N. A., Kirpes, R. M., Upchurch, L. M., Barget, A. J., Lata, N. N., Raso, A. R. W., McNamara, S. M., China, S., Quinn, P. K., Ault, A. P., Kennedy, A., Shepson, P. B., Fuentes, J. D., and Pratt, K. A.: Atmospheric particle abundance and sea salt aerosol observations in the springtime Arctic: a focus on blowing snow and leads, Atmos. Chem. Phys., 22, 15263–15285, https://doi.org/10.5194/acp-22-15263-2022, 2022.
Croft, B., Wentworth, G. R., Martin, R. V., Leaitch, W. R., Murphy, J. G., Murphy, B. N., Kodros, J. K., Abbatt, J. P. D., and Pierce, J. R.: Contribution of Arctic seabird-colony ammonia to atmospheric particles and cloud-albedo radiative effect, Nat. Commun., 7, 13444, https://doi.org/10.1038/ncomms13444, 2016a.
Croft, B., Martin, R. V., Leaitch, W. R., Tunved, P., Breider, T. J., D'Andrea, S. D., and Pierce, J. R.: Processes controlling the annual cycle of Arctic aerosol number and size distributions, Atmos. Chem. Phys., 16, 3665–3682, https://doi.org/10.5194/acp-16-3665-2016, 2016b.
Croft, B., Martin, R. V., Leaitch, W. R., Burkart, J., Chang, R. Y.-W., Collins, D. B., Hayes, P. L., Hodshire, A. L., Huang, L., Kodros, J. K., Moravek, A., Mungall, E. L., Murphy, J. G., Sharma, S., Tremblay, S., Wentworth, G. R., Willis, M. D., Abbatt, J. P. D., and Pierce, J. R.: Arctic marine secondary organic aerosol contributes significantly to summertime particle size distributions in the Canadian Arctic Archipelago, Atmos. Chem. Phys., 19, 2787–2812, https://doi.org/10.5194/acp-19-2787-2019, 2019.
Curry, J. A. and Ebert, E. E.: Annual Cycle of Radiation Fluxes over the Arctic Ocean: Sensitivity to Cloud Optical Properties, J. Climate, 5, 1267–1280, https://doi.org/10.1175/1520-0442(1992)005<1267:ACORFO>2.0.CO;2, 1992.
Dada, L., Angot, H., Beck, I., Baccarini, A., Quéléver, L. L. J., Boyer, M., Laurila, T., Brasseur, Z., Jozef, G., de Boer, G., Shupe, M. D., Henning, S., Bucci, S., Dütsch, M., Stohl, A., Petäjä, T., Daellenbach, K. R., Jokinen, T., and Schmale, J.: A central arctic extreme aerosol event triggered by a warm air-mass intrusion, Nat. Commun., 13, 5290, https://doi.org/10.1038/s41467-022-32872-2, 2022a.
Dada, L., Schmale, J., Daellenbach, K. R., and Baccarini, A.: Aerosol chemical composition during the Arctic Ocean 2018 expedition (Dataset version 1), Bolin Centre Database [data set], https://doi.org/10.17043/oden-ao-2018-aerosol-ams-1, 2022b.
Dall'Osto, M., Beddows, D. C. S., Tunved, P., Harrison, R. M., Lupi, A., Vitale, V., Becagli, S., Traversi, R., Park, K.-T., Yoon, Y. J., Massling, A., Skov, H., Lange, R., Strom, J., and Krejci, R.: Simultaneous measurements of aerosol size distributions at three sites in the European high Arctic, Atmos. Chem. Phys., 19, 7377–7395, https://doi.org/10.5194/acp-19-7377-2019, 2019.
DeCarlo, P. F., Kimmel, J. R., Trimborn, A., Northway, M. J., Jayne, J. T., Aiken, A. C., Gonin, M., Fuhrer, K., Horvath, T., Docherty, K. S., Worsnop, D. R., and Jimenez, J. L.: Field-Deployable, High-Resolution, Time-of-Flight Aerosol Mass Spectrometer, Anal. Chem., 78, 8281–8289, https://doi.org/10.1021/ac061249n, 2006.
Drewnick, F., Diesch, J.-M., Faber, P., and Borrmann, S.: Aerosol mass spectrometry: particle–vaporizer interactions and their consequences for the measurements, Atmos. Meas. Tech., 8, 3811–3830, https://doi.org/10.5194/amt-8-3811-2015, 2015.
Drinovec, L., Jagodič, U., Pirker, L., Škarabot, M., Kurtjak, M., Vidović, K., Ferrero, L., Visser, B., Röhrbein, J., Weingartner, E., Kalbermatter, D. M., Vasilatou, K., Bühlmann, T., Pascale, C., Müller, T., Wiedensohler, A., and Močnik, G.: A dual-wavelength photothermal aerosol absorption monitor: design, calibration and performance, Atmos. Meas. Tech., 15, 3805–3825, https://doi.org/10.5194/amt-15-3805-2022, 2022.
Duplessis, P., Karlsson, L., Baccarini, A., Wheeler, M., Leaitch, W. R., Svenningsson, B., Leck, C., Schmale, J., Zieger, P., and Chang, R. Y.-W.: Highly Hygroscopic Aerosols Facilitate Summer and Early-Autumn Cloud Formation at Extremely Low Concentrations Over the Central Arctic Ocean, J. Geophys. Res.-Atmos., 129, e2023JD039159, https://doi.org/10.1029/2023JD039159, 2024.
Eckhardt, S., Quennehen, B., Olivié, D. J. L., Berntsen, T. K., Cherian, R., Christensen, J. H., Collins, W., Crepinsek, S., Daskalakis, N., Flanner, M., Herber, A., Heyes, C., Hodnebrog, Ø., Huang, L., Kanakidou, M., Klimont, Z., Langner, J., Law, K. S., Lund, M. T., Mahmood, R., Massling, A., Myriokefalitakis, S., Nielsen, I. E., Nøjgaard, J. K., Quaas, J., Quinn, P. K., Raut, J.-C., Rumbold, S. T., Schulz, M., Sharma, S., Skeie, R. B., Skov, H., Uttal, T., von Salzen, K., and Stohl, A.: Current model capabilities for simulating black carbon and sulfate concentrations in the Arctic atmosphere: a multi-model evaluation using a comprehensive measurement data set, Atmos. Chem. Phys., 15, 9413–9433, https://doi.org/10.5194/acp-15-9413-2015, 2015.
Ervens, B., Cubison, M. J., Andrews, E., Feingold, G., Ogren, J. A., Jimenez, J. L., Quinn, P. K., Bates, T. S., Wang, J., Zhang, Q., Coe, H., Flynn, M., and Allan, J. D.: CCN predictions using simplified assumptions of organic aerosol composition and mixing state: a synthesis from six different locations, Atmos. Chem. Phys., 10, 4795–4807, https://doi.org/10.5194/acp-10-4795-2010, 2010.
Fenger, M., Sørensen, L. L., Kristensen, K., Jensen, B., Nguyen, Q. T., Nøjgaard, J. K., Massling, A., Skov, H., Becker, T., and Glasius, M.: Sources of anions in aerosols in northeast Greenland during late winter, Atmos. Chem. Phys., 13, 1569–1578, https://doi.org/10.5194/acp-13-1569-2013, 2013.
Fisher, J. A., Jacob, D. J., Wang, Q., Bahreini, R., Carouge, C. C., Cubison, M. J., Dibb, J. E., Diehl, T., Jimenez, J. L., Leibensperger, E. M., Lu, Z., Meinders, M. B. J., Pye, H. O. T., Quinn, P. K., Sharma, S., Streets, D. G., van Donkelaar, A., and Yantosca, R. M.: Sources, distribution, and acidity of sulfate–ammonium aerosol in the Arctic in winter–spring, Atmos. Environ., 45, 7301–7318, https://doi.org/10.1016/j.atmosenv.2011.08.030, 2011.
Flanner, M. G.: Arctic climate sensitivity to local black carbon, J. Geophys. Res.-Atmos., 118, 1840–1851, https://doi.org/10.1002/jgrd.50176, 2013.
Freud, E., Krejci, R., Tunved, P., Leaitch, R., Nguyen, Q. T., Massling, A., Skov, H., and Barrie, L.: Pan-Arctic aerosol number size distributions: seasonality and transport patterns, Atmos. Chem. Phys., 17, 8101–8128, https://doi.org/10.5194/acp-17-8101-2017, 2017.
Frey, M., Wagner, D., Kirchgaessner, A., Uttal, T., and Shupe, M. D.: Atmospheric snow particle flux in the Central Arctic during MOSAiC 2019-20 (Version 1.0), NERC EDS UK Polar Data Centre [data set], https://doi.org/10.5285/7d8e401b-2c75-4ee4-a753-c24b7e91e6e9, 2023.
Frey, M. M., Norris, S. J., Brooks, I. M., Anderson, P. S., Nishimura, K., Yang, X., Jones, A. E., Nerentorp Mastromonaco, M. G., Jones, D. H., and Wolff, E. W.: First direct observation of sea salt aerosol production from blowing snow above sea ice, Atmos. Chem. Phys., 20, 2549–2578, https://doi.org/10.5194/acp-20-2549-2020, 2020.
Fu, P., Kawamura, K., Chen, J., and Barrie, L. A.: Isoprene, Monoterpene, and Sesquiterpene Oxidation Products in the High Arctic Aerosols during Late Winter to Early Summer, Environ. Sci. Technol., 43, 4022–4028, https://doi.org/10.1021/es803669a, 2009.
Fu, P. Q., Kawamura, K., Chen, J., Charrière, B., and Sempéré, R.: Organic molecular composition of marine aerosols over the Arctic Ocean in summer: contributions of primary emission and secondary aerosol formation, Biogeosciences, 10, 653–667, https://doi.org/10.5194/bg-10-653-2013, 2013.
Gard, E. E., Kleeman, M. J., Gross, D. S., Hughes, L. S., Allen, J. O., Morrical, B. D., Fergenson, D. P., Dienes, T., E. Gälli, M., Johnson, R. J., Cass, G. R., and Prather, K. A.: Direct Observation of Heterogeneous Chemistry in the Atmosphere, Science, 279, 1184–1187, https://doi.org/10.1126/science.279.5354.1184, 1998.
Giddings, W. P. and Baker, M. B.: Sources and Effects of Monolayers on Atmospheric Water Droplets, J. Atmos. Sci., 34, 1957–1964, https://doi.org/10.1175/1520-0469(1977)034<1957:SAEOMO>2.0.CO;2, 1977.
Gilgen, A., Huang, W. T. K., Ickes, L., Neubauer, D., and Lohmann, U.: How important are future marine and shipping aerosol emissions in a warming Arctic summer and autumn?, Atmos. Chem. Phys., 18, 10521–10555, https://doi.org/10.5194/acp-18-10521-2018, 2018.
Gong, S. L., Zhao, T. L., Sharma, S., Toom-Sauntry, D., Lavoué, D., Zhang, X. B., Leaitch, W. R., and Barrie, L. A.: Identification of trends and interannual variability of sulfate and black carbon in the Canadian High Arctic: 1981–2007, J. Geophys. Res.-Atmos., 115, D07305, https://doi.org/10.1029/2009JD012943, 2010.
Gong, X., Zhang, J., Croft, B., Yang, X., Frey, M. M., Bergner, N., Chang, R. Y.-W., Creamean, J. M., Kuang, C., Martin, R. V., Ranjithkumar, A., Sedlacek, A. J., Uin, J., Willmes, S., Zawadowicz, M. A., Pierce, J. R., Shupe, M. D., Schmale, J., and Wang, J.: Arctic warming by abundant fine sea salt aerosols from blowing snow, Nat. Geosci., 16, 768–774, https://doi.org/10.1038/s41561-023-01254-8, 2023.
Graham, R. M., Cohen, L., Petty, A. A., Boisvert, L. N., Rinke, A., Hudson, S. R., Nicolaus, M., and Granskog, M. A.: Increasing frequency and duration of Arctic winter warming events, Geophys. Res. Lett., 44, 6974–6983, https://doi.org/10.1002/2017GL073395, 2017.
Gramlich, Y., Siegel, K., Haslett, S. L., Freitas, G., Krejci, R., Zieger, P., and Mohr, C.: Revealing the chemical characteristics of Arctic low-level cloud residuals – in situ observations from a mountain site, Atmos. Chem. Phys., 23, 6813–6834, https://doi.org/10.5194/acp-23-6813-2023, 2023.
Gramlich, Y., Siegel, K., Haslett, S. L., Cremer, R. S., Lunder, C., Kommula, S. M., Buchholz, A., Yttri, K. E., Chen, G., Krejci, R., Zieger, P., Virtanen, A., Riipinen, I., and Mohr, C.: Impact of Biomass Burning on Arctic Aerosol Composition, ACS Earth Space Chem., 8, 920–936, https://doi.org/10.1021/acsearthspacechem.3c00187, 2024.
Gunsch, M. J., Liu, J., Moffett, C. E., Sheesley, R. J., Wang, N., Zhang, Q., Watson, T. B., and Pratt, K. A.: Diesel Soot and Amine-Containing Organic Sulfate Aerosols in an Arctic Oil Field, Environ. Sci. Technol., 54, 92–101, https://doi.org/10.1021/acs.est.9b04825, 2020.
Hamacher-Barth, E., Leck, C., and Jansson, K.: Size-resolved morphological properties of the high Arctic summer aerosol during ASCOS-2008, Atmos. Chem. Phys., 16, 6577–6593, https://doi.org/10.5194/acp-16-6577-2016, 2016.
Hara, K., Osada, K., Matsunaga, K., Iwasaka, Y., Shibata, T., and Furuya, K.: Atmospheric inorganic chlorine and bromine species in Arctic boundary layer of the winter/spring, J. Geophys. Res.-Atmos., 107, AAC 4-1–AAC 4-15, https://doi.org/10.1029/2001JD001008, 2002.
Hartigan, J. A. and Wong, M. A.: Algorithm AS 136: A K-Means Clustering Algorithm, J. Roy. Stat. Soc. C-App., 28, 100–108, https://doi.org/10.2307/2346830, 1979.
Hawkins, L. N. and Russell, L. M.: Polysaccharides, Proteins, and Phytoplankton Fragments: Four Chemically Distinct Types of Marine Primary Organic Aerosol Classified by Single Particle Spectromicroscopy, Adv. Meteorol., 2010, e612132, https://doi.org/10.1155/2010/612132, 2010.
Hegg, D. A., Hobbs, P. V., Gassó, S., Nance, J. D., and Rangno, A. L.: Aerosol measurements in the Arctic relevant to direct and indirect radiative forcing, J. Geophys. Res.-Atmos., 101, 23349–23363, https://doi.org/10.1029/96JD02246, 1996.
Heintzenberg, J., Leck, C., and Tunved, P.: Potential source regions and processes of aerosol in the summer Arctic, Atmos. Chem. Phys., 15, 6487–6502, https://doi.org/10.5194/acp-15-6487-2015, 2015.
Heslin-Rees, D., Burgos, M., Hansson, H.-C., Krejci, R., Ström, J., Tunved, P., and Zieger, P.: From a polar to a marine environment: has the changing Arctic led to a shift in aerosol light scattering properties?, Atmos. Chem. Phys., 20, 13671–13686, https://doi.org/10.5194/acp-20-13671-2020, 2020.
Heutte, B., Beck, I., Quéléver, L., Jokinen, T., Laurila, T., Dada, L., and Schmale, J.: Equivalent black carbon concentration in 10 minutes time resolution, measured in the Swiss container during MOSAiC 2019/2020, PANGAEA [data set], https://doi.org/10.1594/PANGAEA.952251, 2022.
Heutte, B., Dada, L., Angot, H., Daellenbach, K. R., El Haddad, I., Beck, I., Quéléver, L., Jokinen, T., Laurila, T., and Schmale, J.: Bulk size-resolved chemical composition and mass concentration of non-refractory submicron aerosols measured in the Swiss container during MOSAiC 2019/2020, PANGAEA [data set], https://doi.org/10.1594/PANGAEA.961009, 2023a.
Heutte, B., Bergner, N., Beck, I., Angot, H., Dada, L., Quéléver, L. L. J., Laurila, T., Boyer, M., Brasseur, Z., Daellenbach, K. R., Henning, S., Kuang, C., Kulmala, M., Lampilahti, J., Lampimäki, M., Petäjä, T., Shupe, M. D., Sipilä, M., Uin, J., Jokinen, T., and Schmale, J.: Measurements of aerosol microphysical and chemical properties in the central Arctic atmosphere during MOSAiC, Sci. Data, 10, 1–16, https://doi.org/10.1038/s41597-023-02586-1, 2023b.
Heutte, B., Beck, I., Quéléver, L., Jokinen, T., Laurila, T., and Schmale, J.: Temperature and relative humidity in 10 min time resolution measured in the total inlet of the Swiss container during MOSAiC 2019/2020, PANGAEA [data set], https://doi.org/10.1594/PANGAEA.961007, 2023c.
Heutte, B., Baccarini, A., Zieger, P., and Schmale, J.: Equivalent black carbon concentration measured with an aethalometer AE33 during the Arctic Ocean 2018 expedition (1.0), Bolin Centre Database [data set], https://doi.org/10.17043/oden-ao-2018-aerosol-ebc-ae33-1, 2024.
Hillamo, R., Kerminen, V.-M., Aurela, M., Mäkelä, T., Maenhaut, W., and Leek, C.: Modal structure of chemical mass size distribution in the high Arctic aerosol, J. Geophys. Res.-Atmos., 106, 27555–27571, https://doi.org/10.1029/2001JD001119, 2001.
Hirdman, D., Burkhart, J. F., Sodemann, H., Eckhardt, S., Jefferson, A., Quinn, P. K., Sharma, S., Ström, J., and Stohl, A.: Long-term trends of black carbon and sulphate aerosol in the Arctic: changes in atmospheric transport and source region emissions, Atmos. Chem. Phys., 10, 9351–9368, https://doi.org/10.5194/acp-10-9351-2010, 2010.
Hoppel, W. A., Frick, G. M., and Larson, R. E.: Effect of nonprecipitating clouds on the aerosol size distribution in the marine boundary layer, Geophys. Res. Lett., 13, 125–128, https://doi.org/10.1029/GL013i002p00125, 1986.
Huang, J. and Jaeglé, L.: Wintertime enhancements of sea salt aerosol in polar regions consistent with a sea ice source from blowing snow, Atmos. Chem. Phys., 17, 3699–3712, https://doi.org/10.5194/acp-17-3699-2017, 2017.
Intrieri, J. M., Fairall, C. W., Shupe, M. D., Persson, P. O. G., Andreas, E. L., Guest, P. S., and Moritz, R. E.: An annual cycle of Arctic surface cloud forcing at SHEBA, J. Geophys. Res.-Oceans, 107, SHE 13-1–SHE 13-14, https://doi.org/10.1029/2000JC000439, 2002.
Jahn, A., Holland, M. M., and Kay, J. E.: Projections of an ice-free Arctic Ocean, Nat. Rev. Earth Environ., 5, 1–13, https://doi.org/10.1038/s43017-023-00515-9, 2024.
Jimenez, J. L., Jayne, J. T., Shi, Q., Kolb, C. E., Worsnop, D. R., Yourshaw, I., Seinfeld, J. H., Flagan, R. C., Zhang, X., Smith, K. A., Morris, J. W., and Davidovits, P.: Ambient aerosol sampling using the Aerodyne Aerosol Mass Spectrometer, J. Geophys. Res.-Atmos., 108, 8425, https://doi.org/10.1029/2001JD001213, 2003.
Jimenez, J. L., Canagaratna, M. R., Donahue, N. M., Prevot, A. S. H., Zhang, Q., Kroll, J. H., DeCarlo, P. F., Allan, J. D., Coe, H., Ng, N. L., Aiken, A. C., Docherty, K. S., Ulbrich, I. M., Grieshop, A. P., Robinson, A. L., Duplissy, J., Smith, J. D., Wilson, K. R., Lanz, V. A., Hueglin, C., Sun, Y. L., Tian, J., Laaksonen, A., Raatikainen, T., Rautiainen, J., Vaattovaara, P., Ehn, M., Kulmala, M., Tomlinson, J. M., Collins, D. R., Cubison, M. J., E., Dunlea, J., Huffman, J. A., Onasch, T. B., Alfarra, M. R., Williams, P. I., Bower, K., Kondo, Y., Schneider, J., Drewnick, F., Borrmann, S., Weimer, S., Demerjian, K., Salcedo, D., Cottrell, L., Griffin, R., Takami, A., Miyoshi, T., Hatakeyama, S., Shimono, A., Sun, J. Y., Zhang, Y. M., Dzepina, K., Kimmel, J. R., Sueper, D., Jayne, J. T., Herndon, S. C., Trimborn, A. M., Williams, L. R., Wood, E. C., Middlebrook, A. M., Kolb, C. E., Baltensperger, U., and Worsnop, D. R.: Evolution of Organic Aerosols in the Atmosphere, Science, 326, 1525–1529, https://doi.org/10.1126/science.1180353, 2009.
Jozef, G. C., Cassano, J. J., Dahlke, S., Dice, M., Cox, C. J., and de Boer, G.: An overview of the vertical structure of the atmospheric boundary layer in the central Arctic during MOSAiC, Atmos. Chem. Phys., 24, 1429–1450, https://doi.org/10.5194/acp-24-1429-2024, 2024.
Kaluarachchi, C. P., Or, V. W., Lan, Y., Madawala, C. K., Hasenecz, E. S., Crocker, D. R., Morris, C. K., Lee, H. D., Mayer, K. J., Sauer, J. S., Lee, C., Dorce, G., Malfatti, F., Stone, E. A., Cappa, C. D., Grassian, V. H., Prather, K. A., and Tivanski, A. V.: Size-Dependent Morphology, Composition, Phase State, and Water Uptake of Nascent Submicrometer Sea Spray Aerosols during a Phytoplankton Bloom, ACS Earth Space Chem., 6, 116–130, https://doi.org/10.1021/acsearthspacechem.1c00306, 2022.
Karlsson, L., Krejci, R., Koike, M., Ebell, K., and Zieger, P.: A long-term study of cloud residuals from low-level Arctic clouds, Atmos. Chem. Phys., 21, 8933–8959, https://doi.org/10.5194/acp-21-8933-2021, 2021.
Karlsson, L., Baccarini, A., Duplessis, P., Baumgardner, D., Brooks, I. M., Chang, R. Y.-W., Dada, L., Dällenbach, K. R., Heikkinen, L., Krejci, R., Leaitch, W. R., Leck, C., Partridge, D. G., Salter, M. E., Wernli, H., Wheeler, M. J., Schmale, J., and Zieger, P.: Physical and Chemical Properties of Cloud Droplet Residuals and Aerosol Particles During the Arctic Ocean 2018 Expedition, J. Geophys. Res.-Atmos., 127, e2021JD036383, https://doi.org/10.1029/2021JD036383, 2022.
Kirpes, R. M., Bondy, A. L., Bonanno, D., Moffet, R. C., Wang, B., Laskin, A., Ault, A. P., and Pratt, K. A.: Secondary sulfate is internally mixed with sea spray aerosol and organic aerosol in the winter Arctic, Atmos. Chem. Phys., 18, 3937–3949, https://doi.org/10.5194/acp-18-3937-2018, 2018.
Kirpes, R. M., Bonanno, D., May, N. W., Fraund, M., Barget, A. J., Moffet, R. C., Ault, A. P., and Pratt, K. A.: Wintertime Arctic Sea Spray Aerosol Composition Controlled by Sea Ice Lead Microbiology, ACS Cent. Sci., 5, 1760–1767, https://doi.org/10.1021/acscentsci.9b00541, 2019.
Kirpes, R. M., Lei, Z., Fraund, M., Gunsch, M. J., May, N. W., Barrett, T. E., Moffett, C. E., Schauer, A. J., Alexander, B., Upchurch, L. M., China, S., Quinn, P. K., Moffet, R. C., Laskin, A., Sheesley, R. J., Pratt, K. A., and Ault, A. P.: Solid organic-coated ammonium sulfate particles at high relative humidity in the summertime Arctic atmosphere, P. Natl. Acad. Sci. USA, 119, e2104496119, https://doi.org/10.1073/pnas.2104496119, 2022.
Knust, R.: Polar Research and Supply Vessel POLARSTERN Operated by the Alfred-Wegener-Institute, Journal of large-scale research facilities, 3, A119–A119, https://doi.org/10.17815/jlsrf-3-163, 2017.
Köllner, F., Schneider, J., Willis, M. D., Schulz, H., Kunkel, D., Bozem, H., Hoor, P., Klimach, T., Helleis, F., Burkart, J., Leaitch, W. R., Aliabadi, A. A., Abbatt, J. P. D., Herber, A. B., and Borrmann, S.: Chemical composition and source attribution of sub-micrometre aerosol particles in the summertime Arctic lower troposphere, Atmos. Chem. Phys., 21, 6509–6539, https://doi.org/10.5194/acp-21-6509-2021, 2021.
Koontz, A., Flynn, C., Uin, J., Jefferson, A., Andrews, E., Salwen, C., and Hayes, C.: Nephelometer (AOSNEPHDRY). Atmospheric Radiation Measurement (ARM) User Facility [data set], https://doi.org/10.5439/1228051, 2022.
Kuang, C., Singh, A., Howie, J., Salwen, C., and Hayes, C.: Scanning mobility particle sizer (AOSSMPS), Atmospheric Radiation Measurement (ARM) User Facility [data set], https://doi.org/10.5439/1476898, 2022.
Lange, R., Dall'Osto, M., Skov, H., Nøjgaard, J. K., Nielsen, I. E., Beddows, D. C. S., Simo, R., Harrison, R. M., and Massling, A.: Characterization of distinct Arctic aerosol accumulation modes and their sources, Atmos. Environ., 183, 1–10, https://doi.org/10.1016/j.atmosenv.2018.03.060, 2018.
Lange, R., Dall'Osto, M., Wex, H., Skov, H., and Massling, A.: Large Summer Contribution of Organic Biogenic Aerosols to Arctic Cloud Condensation Nuclei, Geophys. Res. Lett., 46, 11500–11509, https://doi.org/10.1029/2019GL084142, 2019.
Lannuzel, D., Tedesco, L., van Leeuwe, M., Campbell, K., Flores, H., Delille, B., Miller, L., Stefels, J., Assmy, P., Bowman, J., Brown, K., Castellani, G., Chierici, M., Crabeck, O., Damm, E., Else, B., Fransson, A., Fripiat, F., Geilfus, N.-X., Jacques, C., Jones, E., Kaartokallio, H., Kotovitch, M., Meiners, K., Moreau, S., Nomura, D., Peeken, I., Rintala, J.-M., Steiner, N., Tison, J.-L., Vancoppenolle, M., Van der Linden, F., Vichi, M., and Wongpan, P.: The future of Arctic sea-ice biogeochemistry and ice-associated ecosystems, Nat. Clim. Chang., 10, 983–992, https://doi.org/10.1038/s41558-020-00940-4, 2020.
Lapere, R., Thomas, J. L., Marelle, L., Ekman, A. M. L., Frey, M. M., Lund, M. T., Makkonen, R., Ranjithkumar, A., Salter, M. E., Samset, B. H., Schulz, M., Sogacheva, L., Yang, X., and Zieger, P.: The Representation of Sea Salt Aerosols and Their Role in Polar Climate Within CMIP6, J. Geophys. Res.-Atmos., 128, e2022JD038235, https://doi.org/10.1029/2022JD038235, 2023.
Lapere, R., Marelle, L., Rampal, P., Brodeau, L., Melsheimer, C., Spreen, G., and Thomas, J. L.: Modeling the contribution of leads to sea spray aerosol in the high Arctic, Atmos. Chem. Phys., 24, 12107–12132, https://doi.org/10.5194/acp-24-12107-2024, 2024.
Lawler, M. J., Saltzman, E. S., Karlsson, L., Zieger, P., Salter, M., Baccarini, A., Schmale, J., and Leck, C.: New Insights Into the Composition and Origins of Ultrafine Aerosol in the Summertime High Arctic, Geophys. Res. Lett., 48, e2021GL094395, https://doi.org/10.1029/2021GL094395, 2021.
Lawrence, Z. D., Perlwitz, J., Butler, A. H., Manney, G. L., Newman, P. A., Lee, S. H., and Nash, E. R.: The Remarkably Strong Arctic Stratospheric Polar Vortex of Winter 2020: Links to Record-Breaking Arctic Oscillation and Ozone Loss, J. Geophys. Res.-Atmos., 125, e2020JD033271, https://doi.org/10.1029/2020JD033271, 2020.
Leaitch, W. R., Sharma, S., Huang, L., Toom-Sauntry, D., Chivulescu, A., Macdonald, A. M., von Salzen, K., Pierce, J. R., Bertram, A. K., Schroder, J. C., Shantz, N. C., Chang, R. Y.-W., and Norman, A.-L.: Dimethyl sulfide control of the clean summertime Arctic aerosol and cloud, Elem. Sci. Anth., 1, 000017, https://doi.org/10.12952/journal.elementa.000017, 2013.
Leaitch, W. R., Russell, L. M., Liu, J., Kolonjari, F., Toom, D., Huang, L., Sharma, S., Chivulescu, A., Veber, D., and Zhang, W.: Organic functional groups in the submicron aerosol at 82.5° N, 62.5° W from 2012 to 2014, Atmos. Chem. Phys., 18, 3269–3287, https://doi.org/10.5194/acp-18-3269-2018, 2018.
Leck, C. and Persson, C.: Seasonal and short-term variability in dimethyl sulfide, sulfur dioxide and biogenic sulfur and sea salt aerosol particles in the arctic marine boundary layer during summer and autumn, Tellus B, 48, 272–299, https://doi.org/10.1034/j.1600-0889.48.issue2.1.x, 1996.
Leck, C., Bigg, E. K., Covert, D. S., Heintzenberg, J., Maenhaut, W., Nilsson, E. D., and Wiedensohler, A.: Overview of the atmospheric research program during the International Arctic Ocean Expedition of 1991 (IAOE-91) and its scientific results, Tellus B, 48, 136–155, https://doi.org/10.3402/tellusb.v48i2.15833, 1996.
Leck, C., Nilsson, E. D., Bigg, E. K., and Bäcklin, L.: Atmospheric program on the Arctic Ocean Expedition 1996 (AOE-96): An overview of scientific goals, experimental approach, and instruments, J. Geophys. Res.-Atmos., 106, 32051–32067, https://doi.org/10.1029/2000JD900461, 2001.
Leck, C., Tjernström, M., Matrai, P., Swietlicki, E., and Bigg, K.: Can marine micro-organisms influence melting of the Arctic pack ice?, Eos, Transactions American Geophysical Union, 85, 25–32, https://doi.org/10.1029/2004EO030001, 2004.
Li, J., Carlson, B. E., Yung, Y. L., Lv, D., Hansen, J., Penner, J. E., Liao, H., Ramaswamy, V., Kahn, R. A., Zhang, P., Dubovik, O., Ding, A., Lacis, A. A., Zhang, L., and Dong, Y.: Scattering and absorbing aerosols in the climate system, Nat. Rev. Earth Environ., 3, 363–379, https://doi.org/10.1038/s43017-022-00296-7, 2022.
Li, L. and Pomeroy, J. W.: Probability of occurrence of blowing snow, J. Geophys. Res.-Atmos., 102, 21955–21964, https://doi.org/10.1029/97JD01522, 1997.
Liu, J., Fan, S., Horowitz, L. W., and Levy II, H.: Evaluation of factors controlling long-range transport of black carbon to the Arctic, J. Geophys. Res.-Atmos., 116, D04307, https://doi.org/10.1029/2010JD015145, 2011.
Marelle, L., Thomas, J. L., Ahmed, S., Tuite, K., Stutz, J., Dommergue, A., Simpson, W. R., Frey, M. M., and Baladima, F.: Implementation and Impacts of Surface and Blowing Snow Sources of Arctic Bromine Activation Within WRF-Chem 4.1.1, J. Adv. Model. Earth Sy., 13, e2020MS002391, https://doi.org/10.1029/2020MS002391, 2021.
Markus, T., Stroeve, J. C., and Miller, J.: Recent changes in Arctic sea ice melt onset, freezeup, and melt season length, J. Geophys. Res.-Oceans, 114, C12024, https://doi.org/10.1029/2009JC005436, 2009.
Massling, A., Nielsen, I. E., Kristensen, D., Christensen, J. H., Sørensen, L. L., Jensen, B., Nguyen, Q. T., Nøjgaard, J. K., Glasius, M., and Skov, H.: Atmospheric black carbon and sulfate concentrations in Northeast Greenland, Atmos. Chem. Phys., 15, 9681–9692, https://doi.org/10.5194/acp-15-9681-2015, 2015.
Mauritsen, T., Sedlar, J., Tjernström, M., Leck, C., Martin, M., Shupe, M., Sjogren, S., Sierau, B., Persson, P. O. G., Brooks, I. M., and Swietlicki, E.: An Arctic CCN-limited cloud-aerosol regime, Atmos. Chem. Phys., 11, 165–173, https://doi.org/10.5194/acp-11-165-2011, 2011.
May, N. W., Quinn, P. K., McNamara, S. M., and Pratt, K. A.: Multiyear study of the dependence of sea salt aerosol on wind speed and sea ice conditions in the coastal Arctic, J. Geophys. Res.-Atmos., 121, 9208–9219, https://doi.org/10.1002/2016JD025273, 2016.
McCabe, J. R., Savarino, J., Alexander, B., Gong, S., and Thiemens, M. H.: Isotopic constraints on non-photochemical sulfate production in the Arctic winter, Geophys. Res. Lett., 33, L05810, https://doi.org/10.1029/2005GL025164, 2006.
Mirrielees, J. A., Kirpes, R. M., Haas, S. M., Rauschenberg, C. D., Matrai, P. A., Remenapp, A., Boschi, V. L., Grannas, A. M., Pratt, K. A., and Ault, A. P.: Probing Individual Particles Generated at the Freshwater–Seawater Interface through Combined Raman, Photothermal Infrared, and X-ray Spectroscopic Characterization, ACS Meas. Sci. Au, 2, 605–619, https://doi.org/10.1021/acsmeasuresciau.2c00041, 2022.
Mitchell, J. M.: Visual range in the polar regions with particular reference to the Alaskan Arctic, J. Atmos. Terr. Phys, 17, 195–211, 1957.
Moon, A., Jongebloed, U., Dingilian, K. K., Schauer, A. J., Chan, Y.-C., Cesler-Maloney, M., Simpson, W. R., Weber, R. J., Tsiang, L., Yazbeck, F., Zhai, S., Wedum, A., Turner, A. J., Albertin, S., Bekki, S., Savarino, J., Gribanov, K., Pratt, K. A., Costa, E. J., Anastasio, C., Sunday, M. O., Heinlein, L. M. D., Mao, J., and Alexander, B.: Primary Sulfate Is the Dominant Source of Particulate Sulfate during Winter in Fairbanks, Alaska, ACS EST Air, 1, 139–149, https://doi.org/10.1021/acsestair.3c00023, 2024.
Moore, M. J. K., Furutani, H., Roberts, G. C., Moffet, R. C., Gilles, M. K., Palenik, B., and Prather, K. A.: Effect of organic compounds on cloud condensation nuclei (CCN) activity of sea spray aerosol produced by bubble bursting, Atmos. Environ., 45, 7462–7469, https://doi.org/10.1016/j.atmosenv.2011.04.034, 2011.
Moschos, V., Schmale, J., Aas, W., Becagli, S., Calzolai, G., Eleftheriadis, K., Moffett, C. E., Schnelle-Kreis, J., Severi, M., Sharma, S., Skov, H., Vestenius, M., Zhang, W., Hakola, H., Hellén, H., Huang, L., Jaffrezo, J.-L., Massling, A., Nøjgaard, J. K., Petäjä, T., Popovicheva, O., Sheesley, R. J., Traversi, R., Yttri, K. E., Prévôt, A. S. H., Baltensperger, U., and El Haddad, I.: Elucidating the present-day chemical composition, seasonality and source regions of climate-relevant aerosols across the Arctic land surface, Environ. Res. Lett., 17, 034032, https://doi.org/10.1088/1748-9326/ac444b, 2022a.
Moschos, V., Dzepina, K., Bhattu, D., Lamkaddam, H., Casotto, R., Daellenbach, K. R., Canonaco, F., Rai, P., Aas, W., Becagli, S., Calzolai, G., Eleftheriadis, K., Moffett, C. E., Schnelle-Kreis, J., Severi, M., Sharma, S., Skov, H., Vestenius, M., Zhang, W., Hakola, H., Hellén, H., Huang, L., Jaffrezo, J.-L., Massling, A., Nøjgaard, J. K., Petäjä, T., Popovicheva, O., Sheesley, R. J., Traversi, R., Yttri, K. E., Schmale, J., Prévôt, A. S. H., Baltensperger, U., and El Haddad, I.: Equal abundance of summertime natural and wintertime anthropogenic Arctic organic aerosols, Nat. Geosci., 15, 196–202, https://doi.org/10.1038/s41561-021-00891-1, 2022b.
Motos, G., Schmale, J., Corbin, J. C., Zanatta, M., Baltensperger, U., and Gysel-Beer, M.: Droplet activation behaviour of atmospheric black carbon particles in fog as a function of their size and mixing state, Atmos. Chem. Phys., 19, 2183–2207, https://doi.org/10.5194/acp-19-2183-2019, 2019.
Motos, G., Freitas, G., Georgakaki, P., Wieder, J., Li, G., Aas, W., Lunder, C., Krejci, R., Pasquier, J. T., Henneberger, J., David, R. O., Ritter, C., Mohr, C., Zieger, P., and Nenes, A.: Aerosol and dynamical contributions to cloud droplet formation in Arctic low-level clouds, Atmos. Chem. Phys., 23, 13941–13956, https://doi.org/10.5194/acp-23-13941-2023, 2023.
Mukherjee, P., Marsay, C. M., Yu, S., Buck, C. S., Landing, W. M., and Gao, Y.: Concentrations and size-distributions of water-soluble inorganic and organic species on aerosols over the Arctic Ocean observed during the US GEOTRACES Western Arctic Cruise GN01, Atmos. Environ., 261, 118569, https://doi.org/10.1016/j.atmosenv.2021.118569, 2021.
Myers, D. C., Lawler, M. J., Mauldin, R. L., Sjostedt, S., Dubey, M., Abbatt, J., and Smith, J. N.: Indirect Measurements of the Composition of Ultrafine Particles in the Arctic Late-Winter, J. Geophys. Res.-Atmos., 126, e2021JD035428, https://doi.org/10.1029/2021JD035428, 2021.
Nguyen, Q. T., Glasius, M., Sørensen, L. L., Jensen, B., Skov, H., Birmili, W., Wiedensohler, A., Kristensson, A., Nøjgaard, J. K., and Massling, A.: Seasonal variation of atmospheric particle number concentrations, new particle formation and atmospheric oxidation capacity at the high Arctic site Villum Research Station, Station Nord, Atmos. Chem. Phys., 16, 11319–11336, https://doi.org/10.5194/acp-16-11319-2016, 2016.
Nicolaus, M., Perovich, D. K., Spreen, G., Granskog, M. A., von Albedyll, L., Angelopoulos, M., Anhaus, P., Arndt, S., Belter, H. J., Bessonov, V., Birnbaum, G., Brauchle, J., Calmer, R., Cardellach, E., Cheng, B., Clemens-Sewall, D., Dadic, R., Damm, E., de Boer, G., Demir, O., Dethloff, K., Divine, D. V., Fong, A. A., Fons, S., Frey, M. M., Fuchs, N., Gabarró, C., Gerland, S., Goessling, H. F., Gradinger, R., Haapala, J., Haas, C., Hamilton, J., Hannula, H.-R., Hendricks, S., Herber, A., Heuzé, C., Hoppmann, M., Høyland, K. V., Huntemann, M., Hutchings, J. K., Hwang, B., Itkin, P., Jacobi, H.-W., Jaggi, M., Jutila, A., Kaleschke, L., Katlein, C., Kolabutin, N., Krampe, D., Kristensen, S. S., Krumpen, T., Kurtz, N., Lampert, A., Lange, B. A., Lei, R., Light, B., Linhardt, F., Liston, G. E., Loose, B., Macfarlane, A. R., Mahmud, M., Matero, I. O., Maus, S., Morgenstern, A., Naderpour, R., Nandan, V., Niubom, A., Oggier, M., Oppelt, N., Pätzold, F., Perron, C., Petrovsky, T., Pirazzini, R., Polashenski, C., Rabe, B., Raphael, I. A., Regnery, J., Rex, M., Ricker, R., Riemann-Campe, K., Rinke, A., Rohde, J., Salganik, E., Scharien, R. K., Schiller, M., Schneebeli, M., Semmling, M., Shimanchuk, E., Shupe, M. D., Smith, M. M., Smolyanitsky, V., Sokolov, V., Stanton, T., Stroeve, J., Thielke, L., Timofeeva, A., Tonboe, R. T., Tavri, A., Tsamados, M., Wagner, D. N., Watkins, D., Webster, M., and Wendisch, M.: Overview of the MOSAiC expedition: Snow and sea ice, Elem. Sci. Anth., 10, 000046, https://doi.org/10.1525/elementa.2021.000046, 2022.
Nielsen, I. E., Skov, H., Massling, A., Eriksson, A. C., Dall'Osto, M., Junninen, H., Sarnela, N., Lange, R., Collier, S., Zhang, Q., Cappa, C. D., and Nøjgaard, J. K.: Biogenic and anthropogenic sources of aerosols at the High Arctic site Villum Research Station, Atmos. Chem. Phys., 19, 10239–10256, https://doi.org/10.5194/acp-19-10239-2019, 2019.
Nilsson, E. D., Rannik, Ü., Swietlicki, E., Leck, C., Aalto, P. P., Zhou, J., and Norman, M.: Turbulent aerosol fluxes over the Arctic Ocean: 2. Wind-driven sources from the sea, J. Geophys. Res.-Atmos., 106, 32139–32154, https://doi.org/10.1029/2000JD900747, 2001.
Nixdorf, U., Dethloff, K., Rex, M., Shupe, M., Sommerfeld, A., Perovich, D. K., Nicolaus, M., Heuzé, C., Rabe, B., Loose, B., Damm, E., Gradinger, R., Fong, A., Maslowski, W., Rinke, A., Kwok, R., Spreen, G., Wendisch, M., Herber, A., Hirsekorn, M., Mohaupt, V., Frickenhaus, S., Immerz, A., Weiss-Tuider, K., König, B., Mengedoht, D., Regnery, J., Gerchow, P., Ransby, D., Krumpen, T., Morgenstern, A., Haas, C., Kanzow, T., Rack, F. R., Saitzev, V., Sokolov, V., Makarov, A., Schwarze, S., Wunderlich, T., Wurr, K., and Boetius, A.: MOSAiC Extended Acknowledgement, Zenodo, https://doi.org/10.5281/zenodo.5541624, 2021.
Ovadnevaite, J., O'Dowd, C., Dall'Osto, M., Ceburnis, D., Worsnop, D. R., and Berresheim, H.: Detecting high contributions of primary organic matter to marine aerosol: A case study, Geophys. Res. Lett., 38, L02807, https://doi.org/10.1029/2010GL046083, 2011a.
Ovadnevaite, J., Ceburnis, D., Martucci, G., Bialek, J., Monahan, C., Rinaldi, M., Facchini, M. C., Berresheim, H., Worsnop, D. R., and O'Dowd, C.: Primary marine organic aerosol: A dichotomy of low hygroscopicity and high CCN activity, Geophys. Res. Lett., 38, L21806, https://doi.org/10.1029/2011GL048869, 2011b.
Ovadnevaite, J., Ceburnis, D., Canagaratna, M., Berresheim, H., Bialek, J., Martucci, G., Worsnop, D. R., and O'Dowd, C.: On the effect of wind speed on submicron sea salt mass concentrations and source fluxes, J. Geophys. Res.-Atmos., 117, D16201, https://doi.org/10.1029/2011JD017379, 2012.
Ovadnevaite, J., Zuend, A., Laaksonen, A., Sanchez, K. J., Roberts, G., Ceburnis, D., Decesari, S., Rinaldi, M., Hodas, N., Facchini, M. C., Seinfeld, J. H., and O' Dowd, C.: Surface tension prevails over solute effect in organic-influenced cloud droplet activation, Nature, 546, 637–641, https://doi.org/10.1038/nature22806, 2017.
Overland, J. E.: Rare events in the Arctic, Climatic Change, 168, 27, https://doi.org/10.1007/s10584-021-03238-2, 2021.
Pernov, J. B., Beddows, D., Thomas, D. C., Dall'Osto, M., Harrison, R. M., Schmale, J., Skov, H., and Massling, A.: Increased aerosol concentrations in the High Arctic attributable to changing atmospheric transport patterns, npj Clim. Atmos. Sci., 5, 1–13, https://doi.org/10.1038/s41612-022-00286-y, 2022.
Petäjä, T., Duplissy, E.-M., Tabakova, K., Schmale, J., Altstädter, B., Ancellet, G., Arshinov, M., Balin, Y., Baltensperger, U., Bange, J., Beamish, A., Belan, B., Berchet, A., Bossi, R., Cairns, W. R. L., Ebinghaus, R., El Haddad, I., Ferreira-Araujo, B., Franck, A., Huang, L., Hyvärinen, A., Humbert, A., Kalogridis, A.-C., Konstantinov, P., Lampert, A., MacLeod, M., Magand, O., Mahura, A., Marelle, L., Masloboev, V., Moisseev, D., Moschos, V., Neckel, N., Onishi, T., Osterwalder, S., Ovaska, A., Paasonen, P., Panchenko, M., Pankratov, F., Pernov, J. B., Platis, A., Popovicheva, O., Raut, J.-C., Riandet, A., Sachs, T., Salvatori, R., Salzano, R., Schröder, L., Schön, M., Shevchenko, V., Skov, H., Sonke, J. E., Spolaor, A., Stathopoulos, V. K., Strahlendorff, M., Thomas, J. L., Vitale, V., Vratolis, S., Barbante, C., Chabrillat, S., Dommergue, A., Eleftheriadis, K., Heilimo, J., Law, K. S., Massling, A., Noe, S. M., Paris, J.-D., Prévôt, A. S. H., Riipinen, I., Wehner, B., Xie, Z., and Lappalainen, H. K.: Overview: Integrative and Comprehensive Understanding on Polar Environments (iCUPE) – concept and initial results, Atmos. Chem. Phys., 20, 8551–8592, https://doi.org/10.5194/acp-20-8551-2020, 2020.
Pithan, F. and Mauritsen, T.: Arctic amplification dominated by temperature feedbacks in contemporary climate models, Nat. Geosci., 7, 181–184, https://doi.org/10.1038/ngeo2071, 2014.
Platt, S. M., Hov, Ø., Berg, T., Breivik, K., Eckhardt, S., Eleftheriadis, K., Evangeliou, N., Fiebig, M., Fisher, R., Hansen, G., Hansson, H.-C., Heintzenberg, J., Hermansen, O., Heslin-Rees, D., Holmén, K., Hudson, S., Kallenborn, R., Krejci, R., Krognes, T., Larssen, S., Lowry, D., Lund Myhre, C., Lunder, C., Nisbet, E., Nizzetto, P. B., Park, K.-T., Pedersen, C. A., Aspmo Pfaffhuber, K., Röckmann, T., Schmidbauer, N., Solberg, S., Stohl, A., Ström, J., Svendby, T., Tunved, P., Tørnkvist, K., van der Veen, C., Vratolis, S., Yoon, Y. J., Yttri, K. E., Zieger, P., Aas, W., and Tørseth, K.: Atmospheric composition in the European Arctic and 30 years of the Zeppelin Observatory, Ny-Ålesund, Atmos. Chem. Phys., 22, 3321–3369, https://doi.org/10.5194/acp-22-3321-2022, 2022.
Pye, H. O. T., Nenes, A., Alexander, B., Ault, A. P., Barth, M. C., Clegg, S. L., Collett Jr., J. L., Fahey, K. M., Hennigan, C. J., Herrmann, H., Kanakidou, M., Kelly, J. T., Ku, I.-T., McNeill, V. F., Riemer, N., Schaefer, T., Shi, G., Tilgner, A., Walker, J. T., Wang, T., Weber, R., Xing, J., Zaveri, R. A., and Zuend, A.: The acidity of atmospheric particles and clouds, Atmos. Chem. Phys., 20, 4809–4888, https://doi.org/10.5194/acp-20-4809-2020, 2020.
Quinn, P. K., Miller, T. L., Bates, T. S., Ogren, J. A., Andrews, E., and Shaw, G. E.: A 3-year record of simultaneously measured aerosol chemical and optical properties at Barrow, Alaska, J. Geophys. Res.-Atmos., 107, AAC 8-1–AAC 8-15, https://doi.org/10.1029/2001JD001248, 2002.
Quinn, P. K., Shaw, G., Andrews, E., Dutton, E. G., Ruoho-Airola, T., and Gong, S. L.: Arctic haze: current trends and knowledge gaps, Tellus B, 59, 99–114, https://doi.org/10.1111/j.1600-0889.2006.00238.x, 2007.
Quinn, P. K., Bates, T. S., Baum, E., Doubleday, N., Fiore, A. M., Flanner, M., Fridlind, A., Garrett, T. J., Koch, D., Menon, S., Shindell, D., Stohl, A., and Warren, S. G.: Short-lived pollutants in the Arctic: their climate impact and possible mitigation strategies, Atmos. Chem. Phys., 8, 1723–1735, https://doi.org/10.5194/acp-8-1723-2008, 2008.
Quinn, P. K., Bates, T. S., Schulz, K., and Shaw, G. E.: Decadal trends in aerosol chemical composition at Barrow, Alaska: 1976–2008, Atmos. Chem. Phys., 9, 8883–8888, https://doi.org/10.5194/acp-9-8883-2009, 2009.
Rabe, B., Heuzé, C., Regnery, J., Aksenov, Y., Allerholt, J., Athanase, M., Bai, Y., Basque, C., Bauch, D., Baumann, T. M., Chen, D., Cole, S. T., Craw, L., Davies, A., Damm, E., Dethloff, K., Divine, D. V., Doglioni, F., Ebert, F., Fang, Y.-C., Fer, I., Fong, A. A., Gradinger, R., Granskog, M. A., Graupner, R., Haas, C., He, H., He, Y., Hoppmann, M., Janout, M., Kadko, D., Kanzow, T., Karam, S., Kawaguchi, Y., Koenig, Z., Kong, B., Krishfield, R. A., Krumpen, T., Kuhlmey, D., Kuznetsov, I., Lan, M., Laukert, G., Lei, R., Li, T., Torres-Valdés, S., Lin, L., Lin, L., Liu, H., Liu, N., Loose, B., Ma, X., McKay, R., Mallet, M., Mallett, R. D. C., Maslowski, W., Mertens, C., Mohrholz, V., Muilwijk, M., Nicolaus, M., O'Brien, J. K., Perovich, D., Ren, J., Rex, M., Ribeiro, N., Rinke, A., Schaffer, J., Schuffenhauer, I., Schulz, K., Shupe, M. D., Shaw, W., Sokolov, V., Sommerfeld, A., Spreen, G., Stanton, T., Stephens, M., Su, J., Sukhikh, N., Sundfjord, A., Thomisch, K., Tippenhauer, S., Toole, J. M., Vredenborg, M., Walter, M., Wang, H., Wang, L., Wang, Y., Wendisch, M., Zhao, J., Zhou, M., and Zhu, J.: Overview of the MOSAiC expedition: Physical oceanography, Elem. Sci. Anth., 10, 00062, https://doi.org/10.1525/elementa.2021.00062, 2022.
Radke, L. F., Hobbs, P. V., and Pinnons, J. E.: Observations of Cloud Condensation Nuclei, Sodium-Containing Particles, Ice Nuclei and the Light-Scattering Coefficient Near Barrow, Alaska, J. Appl. Meteorol. Clim., 15, 982–995, https://doi.org/10.1175/1520-0450(1976)015<0982:OOCCNS>2.0.CO;2, 1976.
Rahn, K. A. and McCaffrey, R. J.: On the Origin and Transport of the Winter Arctic Aerosol, Ann. NY Acad. Sci., 338, 486–503, https://doi.org/10.1111/j.1749-6632.1980.tb17142.x, 1980.
Rahn, K. A., Borys, R. D., and Shaw, G. E.: The Asian source of Arctic haze bands, Nature, 268, 713–715, https://doi.org/10.1038/268713a0, 1977.
Rantanen, M., Karpechko, A. Y., Lipponen, A., Nordling, K., Hyvärinen, O., Ruosteenoja, K., Vihma, T., and Laaksonen, A.: The Arctic has warmed nearly four times faster than the globe since 1979, Commun. Earth Environ., 3, 1–10, https://doi.org/10.1038/s43247-022-00498-3, 2022.
Ricard, V., Jaffrezo, J.-L., Kerminen, V.-M., Hillamo, R. E., Teinilä, K., and Maenhaut, W.: Size distributions and modal parameters of aerosol constituents in northern Finland during the European Arctic Aerosol Study, J. Geophys. Res.-Atmos., 107, AAC 4-1–AAC 4-18, https://doi.org/10.1029/2001JD001130, 2002.
Rinke, A., Cassano, J. J., Cassano, E. N., Jaiser, R., and Handorf, D.: Meteorological conditions during the MOSAiC expedition: Normal or anomalous?, Elem. Sci. Anth., 9, 00023, https://doi.org/10.1525/elementa.2021.00023, 2021.
Salcedo, D., Onasch, T. B., Dzepina, K., Canagaratna, M. R., Zhang, Q., Huffman, J. A., DeCarlo, P. F., Jayne, J. T., Mortimer, P., Worsnop, D. R., Kolb, C. E., Johnson, K. S., Zuberi, B., Marr, L. C., Volkamer, R., Molina, L. T., Molina, M. J., Cardenas, B., Bernabé, R. M., Márquez, C., Gaffney, J. S., Marley, N. A., Laskin, A., Shutthanandan, V., Xie, Y., Brune, W., Lesher, R., Shirley, T., and Jimenez, J. L.: Characterization of ambient aerosols in Mexico City during the MCMA-2003 campaign with Aerosol Mass Spectrometry: results from the CENICA Supersite, Atmos. Chem. Phys., 6, 925–946, https://doi.org/10.5194/acp-6-925-2006, 2006.
Saltzman, E. S.: Marine aerosols, Geophys. Monogr. Ser., 187, 17–35, https://doi.org/10.1029/2008GM000769, 2009.
Sand, M., Berntsen, T. K., von Salzen, K., Flanner, M. G., Langner, J., and Victor, D. G.: Response of Arctic temperature to changes in emissions of short-lived climate forcers, Nat. Clim. Chang., 6, 286–289, https://doi.org/10.1038/nclimate2880, 2015.
Schmale, J. and Baccarini, A.: Progress in Unraveling Atmospheric New Particle Formation and Growth Across the Arctic, Geophys. Res. Lett., 48, e2021GL094198, https://doi.org/10.1029/2021GL094198, 2021.
Schmale, J., Zieger, P., and Ekman, A. M. L.: Aerosols in current and future Arctic climate, Nat. Clim. Chang., 11, 95–105, https://doi.org/10.1038/s41558-020-00969-5, 2021.
Schmale, J., Sharma, S., Decesari, S., Pernov, J., Massling, A., Hansson, H.-C., von Salzen, K., Skov, H., Andrews, E., Quinn, P. K., Upchurch, L. M., Eleftheriadis, K., Traversi, R., Gilardoni, S., Mazzola, M., Laing, J., and Hopke, P.: Pan-Arctic seasonal cycles and long-term trends of aerosol properties from 10 observatories, Atmos. Chem. Phys., 22, 3067–3096, https://doi.org/10.5194/acp-22-3067-2022, 2022.
Schmeisser, L., Backman, J., Ogren, J. A., Andrews, E., Asmi, E., Starkweather, S., Uttal, T., Fiebig, M., Sharma, S., Eleftheriadis, K., Vratolis, S., Bergin, M., Tunved, P., and Jefferson, A.: Seasonality of aerosol optical properties in the Arctic, Atmos. Chem. Phys., 18, 11599–11622, https://doi.org/10.5194/acp-18-11599-2018, 2018.
Schmithüsen, H.: Continuous meteorological surface measurement during POLARSTERN cruise PS122/1, Alfred Wegener Institute, Helmholtz Centre for Polar and Marine Research, Bremerhaven, PANGAEA [data set], https://doi.org/10.1594/PANGAEA.935221, 2021a.
Schmithüsen, H.: Continuous meteorological surface measurement during POLARSTERN cruise PS122/2, Alfred Wegener Institute, Helmholtz Centre for Polar and Marine Research, Bremerhaven, PANGAEA [data set], https://doi.org/10.1594/PANGAEA.935222, 2021b.
Schmithüsen, H.: Continuous meteorological surface measurement during POLARSTERN cruise PS122/3, Alfred Wegener Institute, Helmholtz Centre for Polar and Marine Research, Bremerhaven, PANGAEA [data set], https://doi.org/10.1594/PANGAEA.935223, 2021c.
Schmithüsen, H.: Continuous meteorological surface measurement during POLARSTERN cruise PS122/4, Alfred Wegener Institute, Helmholtz Centre for Polar and Marine Research, Bremerhaven, PANGAEA [data set], https://doi.org/10.1594/PANGAEA.935224, 2021d.
Schmithüsen, H.: Continuous meteorological surface measurement during POLARSTERN cruise PS122/5, Alfred Wegener Institute, Helmholtz Centre for Polar and Marine Research, Bremerhaven, PANGAEA [data set], https://doi.org/10.1594/PANGAEA.935225, 2021e.
Seinfeld, J. H. and Pandis, S. N.: Atmospheric Chemistry and Physics: From Air Pollution to Climate Change, 3rd edn., John Wiley & Sons, 1120 pp., ISBN 978-1-118-94740-1, 2016.
Serreze, M. C. and Barry, R. G.: Processes and impacts of Arctic amplification: A research synthesis, Global Planet. Change, 77, 85–96, https://doi.org/10.1016/j.gloplacha.2011.03.004, 2011.
Sharma, S., Andrews, E., Barrie, L. A., Ogren, J. A., and Lavoué, D.: Variations and sources of the equivalent black carbon in the high Arctic revealed by long-term observations at Alert and Barrow: 1989–2003, J. Geophys. Res.-Atmos., 111, D14208, https://doi.org/10.1029/2005JD006581, 2006.
Sharma, S., Ishizawa, M., Chan, D., Lavoué, D., Andrews, E., Eleftheriadis, K., and Maksyutov, S.: 16-year simulation of Arctic black carbon: Transport, source contribution, and sensitivity analysis on deposition, J. Geophys. Res.-Atmos., 118, 943–964, https://doi.org/10.1029/2012JD017774, 2013.
Sharma, S., Barrie, L. A., Magnusson, E., Brattström, G., Leaitch, W. r., Steffen, A., and Landsberger, S.: A Factor and Trends Analysis of Multidecadal Lower Tropospheric Observations of Arctic Aerosol Composition, Black Carbon, Ozone, and Mercury at Alert, Canada, J. Geophys. Res.-Atmos., 124, 14133–14161, https://doi.org/10.1029/2019JD030844, 2019.
Shaw, G. E.: The Arctic Haze Phenomenon, B. Am. Meteorol. Soc., 76, 2403–2413, https://doi.org/10.1175/1520-0477(1995)076<2403:TAHP>2.0.CO;2, 1995.
Shaw, G. E. and Stamnes, K.: Arctic Haze: Perturbation of the Polar Radiation Budget, Ann. NY Acad. Sci., 338, 533–539, https://doi.org/10.1111/j.1749-6632.1980.tb17145.x, 1980.
Shindell, D. and Faluvegi, G.: Climate response to regional radiative forcing during the twentieth century, Nat. Geosci., 2, 294–300, https://doi.org/10.1038/ngeo473, 2009.
Shindell, D. T., Chin, M., Dentener, F., Doherty, R. M., Faluvegi, G., Fiore, A. M., Hess, P., Koch, D. M., MacKenzie, I. A., Sanderson, M. G., Schultz, M. G., Schulz, M., Stevenson, D. S., Teich, H., Textor, C., Wild, O., Bergmann, D. J., Bey, I., Bian, H., Cuvelier, C., Duncan, B. N., Folberth, G., Horowitz, L. W., Jonson, J., Kaminski, J. W., Marmer, E., Park, R., Pringle, K. J., Schroeder, S., Szopa, S., Takemura, T., Zeng, G., Keating, T. J., and Zuber, A.: A multi-model assessment of pollution transport to the Arctic, Atmos. Chem. Phys., 8, 5353–5372, https://doi.org/10.5194/acp-8-5353-2008, 2008.
Shupe, M. D. and Intrieri, J. M.: Cloud Radiative Forcing of the Arctic Surface: The Influence of Cloud Properties, Surface Albedo, and Solar Zenith Angle, J. Climate, 17, 616–628, https://doi.org/10.1175/1520-0442(2004)017<0616:CRFOTA>2.0.CO;2, 2004.
Shupe, M. D., Rex, M., Blomquist, B., Persson, P. O. G., Schmale, J., Uttal, T., Althausen, D., Angot, H., Archer, S., Bariteau, L., Beck, I., Bilberry, J., Bucci, S., Buck, C., Boyer, M., Brasseur, Z., Brooks, I. M., Calmer, R., Cassano, J., Castro, V., Chu, D., Costa, D., Cox, C. J., Creamean, J., Crewell, S., Dahlke, S., Damm, E., de Boer, G., Deckelmann, H., Dethloff, K., Dütsch, M., Ebell, K., Ehrlich, A., Ellis, J., Engelmann, R., Fong, A. A., Frey, M. M., Gallagher, M. R., Ganzeveld, L., Gradinger, R., Graeser, J., Greenamyer, V., Griesche, H., Griffiths, S., Hamilton, J., Heinemann, G., Helmig, D., Herber, A., Heuzé, C., Hofer, J., Houchens, T., Howard, D., Inoue, J., Jacobi, H.-W., Jaiser, R., Jokinen, T., Jourdan, O., Jozef, G., King, W., Kirchgaessner, A., Klingebiel, M., Krassovski, M., Krumpen, T., Lampert, A., Landing, W., Laurila, T., Lawrence, D., Lonardi, M., Loose, B., Lüpkes, C., Maahn, M., Macke, A., Maslowski, W., Marsay, C., Maturilli, M., Mech, M., Morris, S., Moser, M., Nicolaus, M., Ortega, P., Osborn, J., Pätzold, F., Perovich, D. K., Petäjä, T., Pilz, C., Pirazzini, R., Posman, K., Powers, H., Pratt, K. A., Preußer, A., Quéléver, L., Radenz, M., Rabe, B., Rinke, A., Sachs, T., Schulz, A., Siebert, H., Silva, T., Solomon, A., Sommerfeld, A., Spreen, G., Stephens, M., Stohl, A., Svensson G., Uin, J., Viegas, J., Voigt, C., von der Gathen, P., Wehner, B., Welker, J. M., Wendisch, M., Werner, M., Xie, Z., and Yue, F.: Overview of the MOSAiC expedition: Atmosphere, Elem. Sci. Anth., 10, 00060, https://doi.org/10.1525/elementa.2021.00060, 2022.
Siegel, K., Karlsson, L., Zieger, P., Baccarini, A., Schmale, J., Lawler, M., Salter, M., Leck, C., Ekman, A. M. L., Riipinen, I., and Mohr, C.: Insights into the molecular composition of semi-volatile aerosols in the summertime central Arctic Ocean using FIGAERO-CIMS, Environ. Sci.-Atmos., 1, 161–175, https://doi.org/10.1039/D0EA00023J, 2021.
Siegel, K., Neuberger, A., Karlsson, L., Zieger, P., Mattsson, F., Duplessis, P., Dada, L., Daellenbach, K., Schmale, J., Baccarini, A., Krejci, R., Svenningsson, B., Chang, R., Ekman, A. M. L., Riipinen, I., and Mohr, C.: Using Novel Molecular-Level Chemical Composition Observations of High Arctic Organic Aerosol for Predictions of Cloud Condensation Nuclei, Environ. Sci. Technol., 56, 13888–13899, https://doi.org/10.1021/acs.est.2c02162, 2022.
Sipilä, M., Sarnela, N., Neitola, K., Laitinen, T., Kemppainen, D., Beck, L., Duplissy, E.-M., Kuittinen, S., Lehmusjärvi, T., Lampilahti, J., Kerminen, V.-M., Lehtipalo, K., Aalto, P. P., Keronen, P., Siivola, E., Rantala, P. A., Worsnop, D. R., Kulmala, M., Jokinen, T., and Petäjä, T.: Wintertime subarctic new particle formation from Kola Peninsula sulfur emissions, Atmos. Chem. Phys., 21, 17559–17576, https://doi.org/10.5194/acp-21-17559-2021, 2021.
Smith, L. C. and Stephenson, S. R.: New Trans-Arctic shipping routes navigable by midcentury, P. Natl. Acad. Sci. USA, 110, E1191–E1195, https://doi.org/10.1073/pnas.1214212110, 2013.
Stohl, A.: Characteristics of atmospheric transport into the Arctic troposphere, J. Geophys. Res.-Atmos., 111, D11306, https://doi.org/10.1029/2005JD006888, 2006.
Stohl, A., Berg, T., Burkhart, J. F., Fjǽraa, A. M., Forster, C., Herber, A., Hov, Ø., Lunder, C., McMillan, W. W., Oltmans, S., Shiobara, M., Simpson, D., Solberg, S., Stebel, K., Ström, J., Tørseth, K., Treffeisen, R., Virkkunen, K., and Yttri, K. E.: Arctic smoke – record high air pollution levels in the European Arctic due to agricultural fires in Eastern Europe in spring 2006, Atmos. Chem. Phys., 7, 511–534, https://doi.org/10.5194/acp-7-511-2007, 2007.
Stroeve, J. and Notz, D.: Changing state of Arctic sea ice across all seasons, Environ. Res. Lett., 13, 103001, https://doi.org/10.1088/1748-9326/aade56, 2018.
Stroeve, J. C., Markus, T., Boisvert, L., Miller, J., and Barrett, A.: Changes in Arctic melt season and implications for sea ice loss, Geophys. Res. Lett., 41, 1216–1225, https://doi.org/10.1002/2013GL058951, 2014.
Ström, J., Umegård, J., Tørseth, K., Tunved, P., Hansson, H.-C., Holmén, K., Wismann, V., Herber, A., and König-Langlo, G.: One year of particle size distribution and aerosol chemical composition measurements at the Zeppelin Station, Svalbard, March 2000–March 2001, Phys. Chem. Earth A/B/C, 28, 1181–1190, https://doi.org/10.1016/j.pce.2003.08.058, 2003.
Taylor, P. C., Boeke, R. C., Li, Y., and Thompson, D. W. J.: Arctic cloud annual cycle biases in climate models, Atmos. Chem. Phys., 19, 8759–8782, https://doi.org/10.5194/acp-19-8759-2019, 2019.
Tjernström, M.: The Summer Arctic Boundary Layer during the Arctic Ocean Experiment 2001 (AOE-2001), Bound.-Lay. Meteorol., 117, 5–36, https://doi.org/10.1007/s10546-004-5641-8, 2005.
Tjernström, M., Sedlar, J., and Shupe, M. D.: How Well Do Regional Climate Models Reproduce Radiation and Clouds in the Arctic? An Evaluation of ARCMIP Simulations, J. Appl. Meteorol. Clim., 47, 2405–2422, https://doi.org/10.1175/2008JAMC1845.1, 2008.
Tjernström, M., Leck, C., Birch, C. E., Bottenheim, J. W., Brooks, B. J., Brooks, I. M., Bäcklin, L., Chang, R. Y.-W., de Leeuw, G., Di Liberto, L., de la Rosa, S., Granath, E., Graus, M., Hansel, A., Heintzenberg, J., Held, A., Hind, A., Johnston, P., Knulst, J., Martin, M., Matrai, P. A., Mauritsen, T., Müller, M., Norris, S. J., Orellana, M. V., Orsini, D. A., Paatero, J., Persson, P. O. G., Gao, Q., Rauschenberg, C., Ristovski, Z., Sedlar, J., Shupe, M. D., Sierau, B., Sirevaag, A., Sjogren, S., Stetzer, O., Swietlicki, E., Szczodrak, M., Vaattovaara, P., Wahlberg, N., Westberg, M., and Wheeler, C. R.: The Arctic Summer Cloud Ocean Study (ASCOS): overview and experimental design, Atmos. Chem. Phys., 14, 2823–2869, https://doi.org/10.5194/acp-14-2823-2014, 2014.
Tunved, P., Ström, J., and Krejci, R.: Arctic aerosol life cycle: linking aerosol size distributions observed between 2000 and 2010 with air mass transport and precipitation at Zeppelin station, Ny-Ålesund, Svalbard, Atmos. Chem. Phys., 13, 3643–3660, https://doi.org/10.5194/acp-13-3643-2013, 2013.
Twomey, S.: The Influence of Pollution on the Shortwave Albedo of Clouds, J. Atmos. Sci., 34, 1149–1152, https://doi.org/10.1175/1520-0469(1977)034<1149:TIOPOT>2.0.CO;2, 1977.
Uin, J., Aiken, A. C., Dubey, M. K., Kuang, C., Pekour, M., Salwen, C., Sedlacek, A. J., Senum, G., Smith, S., Wang, J., Watson, T. B., and Springston, S. R.: Atmospheric Radiation Measurement (ARM) Aerosol Observing Systems (AOS) for Surface-Based In Situ Atmospheric Aerosol and Trace Gas Measurements, J. Atmos. Ocean. Tech., 36, 2429–2447, https://doi.org/10.1175/JTECH-D-19-0077.1, 2019.
von Albedyll, L.: Sea ice lead fractions from SAR-derived sea ice divergence in the Transpolar Drift during MOSAiC 2019/2020, PANGAEA [data set], https://doi.org/10.1594/PANGAEA.963671, 2024.
von Albedyll, L., Hendricks, S., Hutter, N., Murashkin, D., Kaleschke, L., Willmes, S., Thielke, L., Tian-Kunze, X., Spreen, G., and Haas, C.: Lead fractions from SAR-derived sea ice divergence during MOSAiC, The Cryosphere, 18, 1259–1285, https://doi.org/10.5194/tc-18-1259-2024, 2024.
von Salzen, K., Whaley, C. H., Anenberg, S. C., Van Dingenen, R., Klimont, Z., Flanner, M. G., Mahmood, R., Arnold, S. R., Beagley, S., Chien, R.-Y., Christensen, J. H., Eckhardt, S., Ekman, A. M. L., Evangeliou, N., Faluvegi, G., Fu, J. S., Gauss, M., Gong, W., Hjorth, J. L., Im, U., Krishnan, S., Kupiainen, K., Kühn, T., Langner, J., Law, K. S., Marelle, L., Olivié, D., Onishi, T., Oshima, N., Paunu, V.-V., Peng, Y., Plummer, D., Pozzoli, L., Rao, S., Raut, J.-C., Sand, M., Schmale, J., Sigmond, M., Thomas, M. A., Tsigaridis, K., Tsyro, S., Turnock, S. T., Wang, M., and Winter, B.: Clean air policies are key for successfully mitigating Arctic warming, Commun. Earth Environ., 3, 1–11, https://doi.org/10.1038/s43247-022-00555-x, 2022.
Wei, J., Wang, Z., Gu, M., Luo, J.-J., and Wang, Y.: An evaluation of the Arctic clouds and surface radiative fluxes in CMIP6 models, Acta Oceanol. Sin., 40, 85–102, https://doi.org/10.1007/s13131-021-1705-6, 2021.
Wendisch, M., Brückner, M., Crewell, S., Ehrlich, A., Notholt, J., Lüpkes, C., Macke, A., Burrows, J. P., Rinke, A., Quaas, J., Maturilli, M., Schemann, V., Shupe, M. D., Akansu, E. F., Barrientos-Velasco, C., Bärfuss, K., Blechschmidt, A.-M., Block, K., Bougoudis, I., Bozem, H., Böckmann, C., Bracher, A., Bresson, H., Bretschneider, L., Buschmann, M., Chechin, D. G., Chylik, J., Dahlke, S., Deneke, H., Dethloff, K., Donth, T., Dorn, W., Dupuy, R., Ebell, K., Egerer, U., Engelmann, R., Eppers, O., Gerdes, R., Gierens, R., Gorodetskaya, I. V., Gottschalk, M., Griesche, H., Gryanik, V. M., Handorf, D., Harm-Altstädter, B., Hartmann, J., Hartmann, M., Heinold, B., Herber, A., Herrmann, H., Heygster, G., Höschel, I., Hofmann, Z., Hölemann, J., Hünerbein, A., Jafariserajehlou, S., Jäkel, E., Jacobi, C., Janout, M., Jansen, F., Jourdan, O., Jurányi, Z., Kalesse-Los, H., Kanzow, T., Käthner, R., Kliesch, L. L., Klingebiel, M., Knudsen, E. M., Kovács, T., Körtke, W., Krampe, D., Kretzschmar, J., Kreyling, D., Kulla, B., Kunkel, D., Lampert, A., Lauer, M., Lelli, L., Lerber, A. von, Linke, O., Löhnert, U., Lonardi, M., Losa, S. N., Losch, M., Maahn, M., Mech, M., Mei, L., Mertes, S., Metzner, E., Mewes, D., Michaelis, J., Mioche, G., Moser, M., Nakoudi, K., Neggers, R., Neuber, R., Nomokonova, T., Oelker, J., Papakonstantinou-Presvelou, I., Pätzold, F., Pefanis, V., Pohl, C., van Pinxteren, M., Radovan, A., Rhein, M., Rex, M., Richter, A., Risse, N., Ritter, C., Rostosky, P., Rozanov, V. V., Ruiz Donoso, E., Saavedra Garfias, P., Salzmann, M., Schacht, J., Schäfer, M., Schneider, J., Schnierstein, N., Seifert, P., Seo, S., Siebert, H., Soppa, M. A., Spreen, G., Stachlewska, I. S., Stapf, J., Stratmann, F., Tegen, I., Viceto, C., Voigt, C., Vountas, M., Walbröl. A., Walter, M., Wehner, B., Wex, H., Willmes, S., Zanatta, M., and Zeppenfeld, S.: Atmospheric and Surface Processes, and Feedback Mechanisms Determining Arctic Amplification: A Review of First Results and Prospects of the (AC)3 Project, B. Am. Meteorol. Soc., 104, E208–E242, https://doi.org/10.1175/BAMS-D-21-0218.1, 2023.
Willis, M. D., Burkart, J., Thomas, J. L., Köllner, F., Schneider, J., Bozem, H., Hoor, P. M., Aliabadi, A. A., Schulz, H., Herber, A. B., Leaitch, W. R., and Abbatt, J. P. D.: Growth of nucleation mode particles in the summertime Arctic: a case study, Atmos. Chem. Phys., 16, 7663–7679, https://doi.org/10.5194/acp-16-7663-2016, 2016.
Willis, M. D., Köllner, F., Burkart, J., Bozem, H., Thomas, J. L., Schneider, J., Aliabadi, A. A., Hoor, P. M., Schulz, H., Herber, A. B., Leaitch, W. R., and Abbatt, J. P. D.: Evidence for marine biogenic influence on summertime Arctic aerosol, Geophys. Res. Lett., 44, 6460–6470, https://doi.org/10.1002/2017GL073359, 2017.
Willis, M. D., Leaitch, W. R., and Abbatt, J. P. D.: Processes Controlling the Composition and Abundance of Arctic Aerosol, Rev. Geophys., 56, 621–671, https://doi.org/10.1029/2018RG000602, 2018.
Willis, M. D., Bozem, H., Kunkel, D., Lee, A. K. Y., Schulz, H., Burkart, J., Aliabadi, A. A., Herber, A. B., Leaitch, W. R., and Abbatt, J. P. D.: Aircraft-based measurements of High Arctic springtime aerosol show evidence for vertically varying sources, transport and composition, Atmos. Chem. Phys., 19, 57–76, https://doi.org/10.5194/acp-19-57-2019, 2019.
Willis, M. D., Lannuzel, D., Else, B., Angot, H., Campbell, K., Crabeck, O., Delille, B., Hayashida, H., Lizotte, M., Loose, B., Meiners, K. M., Miller, L., Moreau, S., Nomura, D., Prytherch, J., Schmale, J., Steiner, N., Tedesco, L., and Thomas, J.: Polar oceans and sea ice in a changing climate, Elem. Sci. Anth., 11, 00056, https://doi.org/10.1525/elementa.2023.00056, 2023.
WMO: WMO/GAW Aerosol Measurements Procedures, Guidelines and Recommendations, World Meteorological Organization (WMO), ISBN 978-92-63-11177-7, 2016.
Xu, W., Ovadnevaite, J., Fossum, K. N., Lin, C., Huang, R.-J., Ceburnis, D., and O'Dowd, C.: Sea spray as an obscured source for marine cloud nuclei, Nat. Geosci., 15, 282–286, https://doi.org/10.1038/s41561-022-00917-2, 2022.
Yang, X., Pyle, J. A., and Cox, R. A.: Sea salt aerosol production and bromine release: Role of snow on sea ice, Geophys. Res. Lett., 35, L16815, https://doi.org/10.1029/2008GL034536, 2008.
Yang, X., Frey, M. M., Rhodes, R. H., Norris, S. J., Brooks, I. M., Anderson, P. S., Nishimura, K., Jones, A. E., and Wolff, E. W.: Sea salt aerosol production via sublimating wind-blown saline snow particles over sea ice: parameterizations and relevant microphysical mechanisms, Atmos. Chem. Phys., 19, 8407–8424, https://doi.org/10.5194/acp-19-8407-2019, 2019.
Yeo, H., Kim, M.-H., Son, S.-W., Jeong, J.-H., Yoon, J.-H., Kim, B.-M., and Kim, S.-W.: Arctic cloud properties and associated radiative effects in the three newer reanalysis datasets (ERA5, MERRA-2, JRA-55): Discrepancies and possible causes, Atmos. Res., 270, 106080, https://doi.org/10.1016/j.atmosres.2022.106080, 2022.
Zhang, Q., Canagaratna, M. R., Jayne, J. T., Worsnop, D. R., and Jimenez, J.-L.: Time- and size-resolved chemical composition of submicron particles in Pittsburgh: Implications for aerosol sources and processes, J. Geophys. Res.-Atmos., 110, D07S09, https://doi.org/10.1029/2004JD004649, 2005.
Zhang, X., Tang, H., Zhang, J., Walsh, J. E., Roesler, E. L., Hillman, B., Ballinger, T. J., and Weijer, W.: Arctic cyclones have become more intense and longer-lived over the past seven decades, Commun. Earth Environ., 4, 1–12, https://doi.org/10.1038/s43247-023-01003-0, 2023.
Zhou, J., Swietlicki, E., Berg, O. H., Aalto, P. P., Hämeri, K., Nilsson, E. D., and Leck, C.: Hygroscopic properties of aerosol particles over the central Arctic Ocean during summer, J. Geophys. Res.-Atmos., 106, 32111–32123, https://doi.org/10.1029/2000JD900426, 2001.
Zieger, P., Heslin-Rees, D., Karlsson, L., Koike, M., Modini, R., and Krejci, R.: Black carbon scavenging by low-level Arctic clouds, Nat. Commun., 14, 5488, https://doi.org/10.1038/s41467-023-41221-w, 2023.
Zorn, S. R., Drewnick, F., Schott, M., Hoffmann, T., and Borrmann, S.: Characterization of the South Atlantic marine boundary layer aerosol using an aerodyne aerosol mass spectrometer, Atmos. Chem. Phys., 8, 4711–4728, https://doi.org/10.5194/acp-8-4711-2008, 2008.