the Creative Commons Attribution 4.0 License.
the Creative Commons Attribution 4.0 License.
 | 12 Feb 2025
Atmospheric carbonyl compounds are crucial in regional ozone heavy pollution: insights from the Chengdu Plain Urban Agglomeration, China
Jiemeng Bao
Xin Zhang
Zhenhai Wu
Li Zhou
Jun Qian
Qinwen Tan
Fumo Yang
Junhui Chen
Yunfeng Li
Hefan Liu
Liqun Deng
Hong Li
Gaseous carbonyl compounds serve as crucial precursors and intermediates in atmospheric photochemical reactions, significantly contributing to ambient ozone formation. To determine whether the impact of carbonyl compounds on regional ozone pollution is driven by their abundance or by specific secondary chemical processes, simultaneous field observations and observation-based modeling of ambient carbonyls were conducted at nine sites within the Chengdu Plain Urban Agglomeration (CPUA), China, during 4–18 August 2019, when three episodes of regional heavy ozone pollution occurred across eight cities within CPUA. Throughout the study, the total mixing ratios of 15 carbonyls ranged from 10.7 ± 4.2 to 35.2 ± 13.4 ppbv. The spatial distribution reveals that regions with higher concentrations of carbonyl compounds, such as around Chengdu, are also areas with more severe ozone pollution. Both the abundance and the chemical reactivity of carbonyl compounds, especially formaldehyde and acetaldehyde, play crucial roles in ozone formation in the CPUA. On ozone pollution days, carbonyl concentrations significantly increased by 22.8 % to 66.2 %. While the abundance of carbonyls is an important factor, their significant role in heavy ozone pollution within the CPUA is primarily driven by secondary chemical processes, particularly those involving alkenes and biogenic volatile organic compounds (BVOCs). Sites with higher average ozone concentrations during observations were mainly in the VOC-limited regime, while others were in the transitional regime. Additionally, the mutual transport of carbonyl compounds between cities in the CPUA suggests that regional collaboration is essential to address ozone pollution effectively. These findings offer valuable insights for developing effective strategies to control regional ozone pollution.
- Article
(4883 KB) - Full-text XML
-
Supplement
(1661 KB) - BibTeX
- EndNote


Atmospheric carbonyl compounds play a pivotal role in tropospheric chemistry, acting as crucial precursors to both ozone (O3) and secondary organic aerosols (SOAs), a fact recognized for decades (Altshuller and Cardelino, 1993; Grosjean and Seinfeld, 1989). Their importance has been confirmed by numerous studies over the years (Guo et al., 2004; Hallquist et al., 2009; Wang et al., 2020; Ye et al., 2021; Coggon et al., 2019), highlighting their significant contribution to atmospheric photochemistry and air pollution. Over the past 2 decades, severe air pollution in China has driven substantial research efforts to understand the contributions of carbonyl compounds to these environmental challenges. Studies have shown that photolysis of carbonyl compounds is a major source of ROX radicals (Grosjean and Seinfeld, 1989; Zhang et al., 2016a). These compounds can be photolyzed and react with OH radicals to form a large number of HO2 and RO2 radicals, which increase the atmospheric oxidation capacity and participate in the NOX photochemical cycle, leading to ozone formation (Zhang et al., 2016a; Meng et al., 2017). Additionally, dialdehydes such as glyoxal and methylglyoxal undergo heterogeneous reactions with aqueous particulate matter, rapidly forming SOA (Lou et al., 2010; Xue et al., 2016; Yuan et al., 2012). Ambient carbonyl compounds not only affect the environment but also pose direct health risks to humans. They can harm ecosystems through deposition and adsorption processes (Yang et al., 2018). They also pose direct health risks to humans, including sensitization, carcinogenesis, and mutagenicity (Fuchs et al., 2017).
Recent research has increasingly focused on understanding the spatial and temporal variability of carbonyl compounds in highly polluted regions, particularly in China, where rapid industrialization has led to severe air quality challenges. Xue et al. (2013) and Duan et al. (2012) reported typical ambient concentrations of carbonyl compounds ranging from a few µg m−3 to tens of µg m−3 in urban areas, depending on the specific compounds and regions studied. For example, formaldehyde concentrations in highly polluted areas can exceed 10 µg m−3. Shen et al. (2013) and Fu et al. (2008) observed significant diurnal variation, with higher concentrations of carbonyl compounds during the daytime, particularly in the afternoon, driven by photochemical production. Concentrations can increase by as much as 50 %–100 % during peak sunlight hours compared to nighttime levels. Pang and Mu (2006) and Rao et al. (2016) identified key sources of carbonyl compounds, including vehicular emissions, industrial activities, and secondary formation from volatile organic compound (VOC) oxidation in the atmosphere. In urban environments, vehicular emissions are often a dominant primary source, while secondary formation contributes significantly during daytime due to photochemical processes. The results highlight severe and spatiotemporal variations of carbonyl pollution in China. High levels are found mainly in the North China Plain (NCP), the Yangtze River Delta (YRD), and the Pearl River Delta (PRD) (Duan et al., 2008; Shao et al., 2009; Tan et al., 2018; Wang et al., 2018; Xue et al., 2014, 2013; Yang et al., 2017). Urban areas generally exhibit higher carbonyl levels than suburban and rural areas due to human activities (Xue et al., 2013). Despite the progress made, significant gaps remain in understanding the spatiotemporal distribution and source apportionment of carbonyl compounds, particularly in urban agglomerations. Existing research has primarily focused on urban areas in rapidly developing regions like the NCP, YRD, and PRD. Moreover, studies have often emphasized the overall role of VOCs in ozone pollution, with less attention given to specific carbonyl compounds and their individual contributions to atmospheric oxidation capacity and ozone formation (Meng et al., 2017).
Monitoring carbonyl compounds in the atmosphere is challenging due to their typically low concentrations (ppt–ppb levels), necessitating highly sensitive analytical methods. The diversity of carbonyl compounds, including multiple isomers, requires highly selective analytical techniques for differentiation. Current measurement technologies limit our understanding of the spatiotemporal distribution of carbonyl compounds, affecting the accurate assessment of their environmental behavior, sources, and transport (Xue et al., 2013; Sahu and Saxena, 2015). While numerous studies have explored the role of carbonyl compounds in ozone production, many focus on general mechanisms rather than specific compounds or regional variations (Atkinson and Arey, 2003; Monks et al., 2015).
Atmospheric carbonyl compounds originate from both primary and secondary sources (Pang and Mu, 2006; Rao et al., 2016). Primary sources include the incomplete combustion of fossil fuels and biomass, industrial emissions, emissions from the catering industry, and releases from plants. Secondary sources arise from the atmospheric photochemical oxidation of VOCs (Xue et al., 2013), particularly alkenes, aromatics, and isoprene, which typically dominate the secondary formation of carbonyls. However, distinguishing between primary and secondary contributions remains challenging. Existing source apportionment methods, such as characteristic species ratios and multiple linear regression, often lack the resolution to differentiate these sources accurately, especially for non-vehicular emissions and secondary formation. The limitations of these methods underscore the need for more advanced approaches to better quantify the secondary formation mechanisms of carbonyl compounds and their regional impact on ozone formation. Despite significant advancements in studying atmospheric carbonyls, key gaps remain in understanding their precise spatiotemporal distribution and source apportionment. Specifically, there is a need for studies that examine how carbonyls vary across different environments – urban, suburban, and rural – and during varying pollution events. Without such targeted analysis, our understanding of the behavior of carbonyl compounds and their contribution to ozone pollution remains incomplete, particularly in regions experiencing severe pollution.
This study focuses on atmospheric carbonyl compounds and their roles in photochemical pollution within the Chengdu Plain Urban Agglomeration (CPUA) of China. The CPUA includes eight cities: Chengdu, Mianyang, Deyang, Leshan, Meishan, Yaan, Suining, and Ziyang. This region has a developed economy and a high degree of internationalization. The CPUA is located on the western edge of the Sichuan Basin, surrounded by mountain ranges, which easily block airflow. The unique climatic environment of the CPUA features low wind speeds year-round, a high frequency of static winds, short hours of sunshine, frequent winter inversions, and a pronounced heat island effect in summer. These climatic characteristics significantly impact the variations in air pollutant concentrations, making the region prone to ozone pollution in summer and haze pollution in winter. (Li et al., 2013; Hu et al., 2017; Zhang et al., 2010). Although previous studies have shown that ozone formation in urban Chengdu is primarily VOC-limited (Tan et al., 2018), with aromatic hydrocarbons and alkenes contributing significantly to ozone generation in summer (Xu et al., 2020), these studies mainly focus on single cities and overall VOCs. There is still limited understanding of whether the significant roles of carbonyl compounds in ozone formation are primarily due to their abundance or whether specific chemical reactions involving carbonyls drive this process. This study aims to address these gaps by investigating the spatial distribution, sources, and specific chemical pathways of carbonyl compounds across the entire CPUA and assessing their contributions to regional ozone pollution and inter-city air transport mechanisms.
To address these research gaps, this study involves an intensive field observation experiment conducted by the Sichuan Academy of Environmental Sciences, Peking University, Sichuan University, and the Chinese Academy of Environmental Sciences. Atmospheric carbonyl compounds were observed at nine sites in eight cities within the CPUA for 15 d during a period of heavy ozone pollution in August 2019. Samples were analyzed using 2,4-dinitrophenylhydrazine solid-phase adsorption or high-performance liquid chromatography (HPLC). The study aims to characterize the atmospheric carbonyl compounds in the CPUA; assess their influence on photochemical pollution; identify key carbonyl compounds that may play crucial roles in heavy ozone pollution in the CPUA; and evaluate the contribution of primary emissions, air pollution transport, and secondary generation to key carbonyl compounds through a combination of multivariate linear regression modeling and observation-based modeling. This research aims to provide technical support for controlling carbonyl compounds pollution in the CPUA and to reduce their contributions to ozone pollution.
2.1 Observation sites' profile
In this study, a total of nine offline sampling sites for atmospheric carbonyl compounds were set up in eight cities in the CPUA from 4 to 18 August 2019 (Table S1 in the Supplement). Considering that this study focused on the pollution characterization of carbonyl compounds in urban areas, one urban site was selected in each city. In addition, in order to compare and study the pollution characteristics of carbonyl compounds in the suburbs, a suburban site was set up in Xinjin County, Chengdu. For the selection of urban sites in each city, priority is given to those choices of setup in the vicinity of the state-controlled site, and the perimeter of the sites should be open and unobstructed and have no obvious pollution sources, with convenient transportation and power supply. The distribution of specific sites is shown in Fig. 1.
Ozone concentrations were measured using the UV absorption method with a Thermo O3 analyzer (Model 49i), with data sourced from national control stations near each sampling site. Nitrogen dioxide (NO2) was measured by chemiluminescence following chemical conversion to nitric oxide (NO) using a molybdenum catalyst; however, this method is known to have interferences from other NOZ species. Carbon monoxide (CO) was measured via infrared absorption with a Thermo instrument (Model 20). All Thermo instruments were carefully maintained and calibrated daily at 01:00 CST (China standard time; UTC+8; this time zone applies to all times mentioned in the paper) to ensure measurement accuracy. Measurements for ozone, NO2, and CO were collected with a time resolution of 1 h. Simultaneously, meteorological parameters – temperature, relative humidity (RH), wind speed, and direction – were recorded at each observation site using an automatic weather station (PC-4, JZYG, China), also at a 1 h resolution.
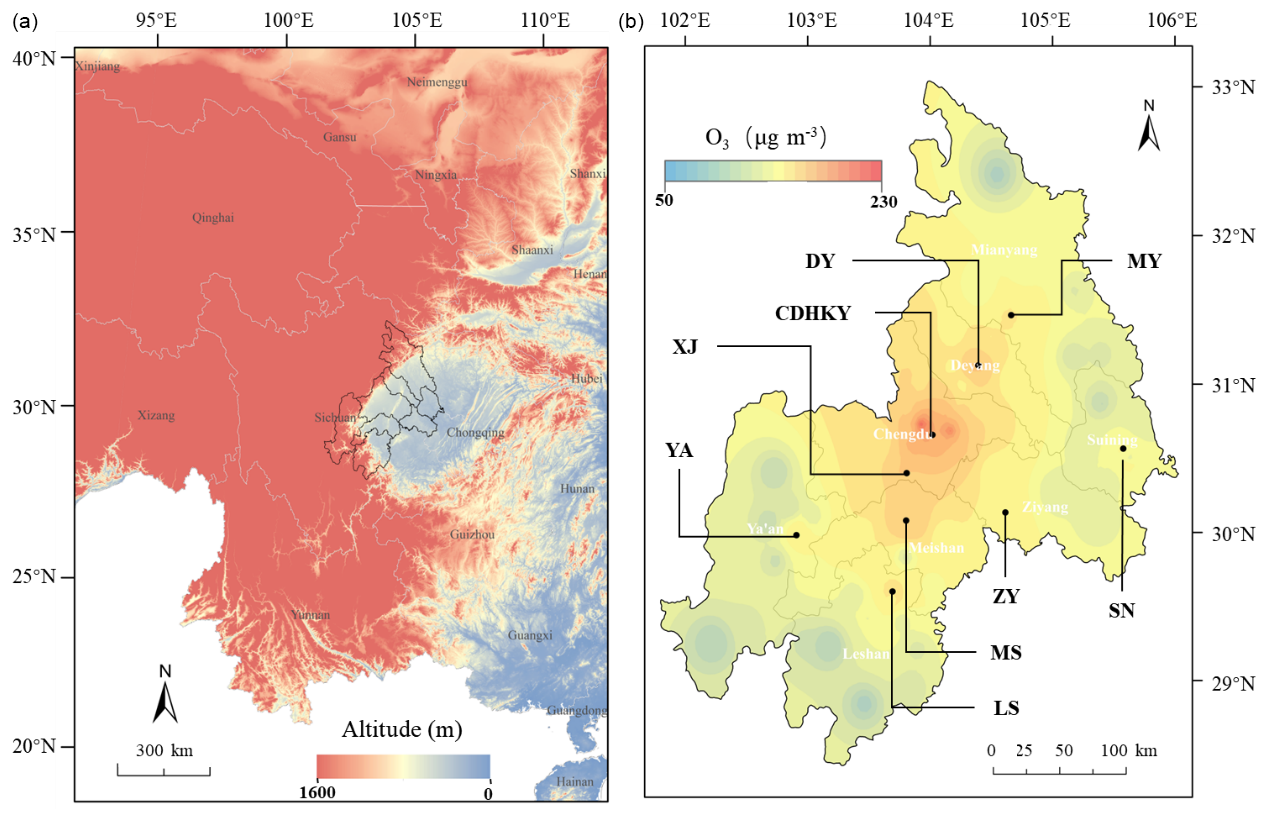
Figure 1Distribution of sampling sites. Panel (a) shows the elevation map of the Sichuan Basin, highlighting the geographical features of the region, with elevation data sourced from the Geospatial Data Cloud (https://www.gscloud.cn/#page1/2, last access: 3 August 2023). Panel (b) presents the spatial distribution of ozone concentrations in the CPUA during the observation period (4–18 August 2019), with ozone data obtained from national control stations near each sampling site. Black dots represent the locations of the sampling sites, labeled as follows: MY (Mianyang), DY (Deyang), CDHKY (Chengdu Environmental Science Research Institute), XJ (Xinjin), SN (Suining), ZY (Ziyang), MS (Meishan), YA (Ya'an), and LS (Leshan). The color bar in the top-left corner corresponds to interpolated ozone concentrations, with each color representing a concentration gradient.
2.2 Sample collection
The sampling of atmospheric carbonyl compounds mainly referred to the TO-11A standard of the United States Environmental Protection Agency (US EPA) and the National Environmental Protection Standard of the People's Republic of China HJ 683-2014 high-performance liquid chromatography method for the determination of atmospheric carbonyl compounds, and the sampling was carried out using silica gel sampling tubes (IC-DN3501 from Tianjin Bonna-Agela) coated with DNPH (2,4-dinitrophenylhydrazine). In this study, an automatic sampler for carbonyl compounds (Zhang et al., 2019) was used to continuously collect atmospheric carbonyl compounds. From 4 to 18 August 2019, air samples were collected every 2 h with a sampling flow rate of 0.8 L min−1. In addition, in order to prevent the impact of ozone and rainwater in the atmospheric air on sample collection, a potassium iodide ozone removal column (KI 140 from Tianjin Bonna-Agela) was installed, and a water removal agent made by ourselves (Bao et al., 2022; Wang et al., 2020) was added at the front end of the sample tube. Two blank samples were collected before and after the sampling, and blank samples were also collected for different batches of sampling tubes. The samples were frozen at −18 °C and analyzed within 1 month.
Atmospheric VOCs were sampled using SUMMA tanks, stainless steel tanks with electropolished and silanized inner walls, manufactured by Entech in the United States, with a sampling volume of 3.2 L. The sampling was controlled by a constant current integral sampler to sampling for an average of 1 h. From 4 to 18 August 2019, two VOC samples were collected each day at each site, at 08:00–9:00 and 14:00–15:00 (no samples were taken under special weather conditions, such as rain). On August 11, 12, and 16 °C, six samples were collected per day to capture diurnal variations under ozone pollution events, at the following times: 08:00–09:00, 10:00–11:00, 12:00–13:00, 14:00–15:00, 16:00–17:00, and 18:00–19:00.
2.3 Sample analysis
The carbonyl compounds samples were qualitatively and quantitatively analyzed using high-performance liquid chromatography (HPLC) (LC-20AD, Shimadzu, Japan) and an ultraviolet detector (SPD-20A, Shimadzu, Japan), mainly based on the US EPA TO-11A standard and the Chinese HJ 683-2014 standard. The DNPH sampling column after sampling was slowly eluted into a volumetric flask using acetonitrile (chromatographically pure, Thermo Fisher Scientific China) to 5.0 mL. Then, 1.5 mL of the sample was transferred into an HPLC sample bottle and sealed and stored in a refrigerator at <4° to complete the pre-treatment. Prior to sample analysis, a standard solution of the concentration gradient was prepared using TO-11A standard solution (Supelco, USA) and used as the external standard. The correlation coefficient (R2) of the standard curve was greater than 0.995. The detection limit of the device was 0.56–5.57 ng mL−1, and the quantification limit was 1.87–18.56 ng mL−1 (Table S2). Then, 20 µL of the pretreated sample was extracted through the autosampler and injected into the HPLC/UV system, detected by a UV detector with a wavelength of 360 nm, qualified by a retention time value, and quantified by peak area value, and the qualitative and quantitative analysis data of carbonyl compounds were obtained after conversion. The HPLC conditions referred to Chinese environmental protection standard HJ 683-2014: binary gradient washing was performed using acetonitrile and water, 60 % acetonitrile was held for 20 min, acetonitrile was increased linearly from 60 % to 100 % within 20–30 min, and acetonitrile was reduced to 60 % again within 30–32 min and held for 8 min; the column oven was kept at 40°. It should be noted that while the sampling and analysis method was effective for most carbonyl compounds, ketones, including methyl vinyl ketone (MVK), were not well sampled during the field observations. As a result, data for MVK and other ketones were missing. During the observation period, DNPH cartridges and HPLC analysis technique were used to detect a total of 15 carbonyl compounds (Table S2).
The atmospheric VOCs were analyzed using the TO-14 and TO-15 methods, which are recommended by the US EPA. These methods involve frozen preconcentration coupled with gas chromatography and mass spectrometry (GC-MS). TO-15 is a method for detecting and quantifying a wide range of VOCs from air samples. The VOCs were pre-concentrated by the Entech7100 system at a low temperature and then quantified by an Agilent GC-MS. During the sample analysis, four internal standard gases (bromochloromethane, 1,4-difluorobenzene, chlorobenzene-d5, and 4-bromofluorobenzene) were used. A multi-point calibration curve was created using a standard gas containing 118 VOCs, including PAMS compounds, TO-15 target analytes, and carbonyl compounds. PAMS (Photochemical Assessment Monitoring Stations) compounds are a subset of hydrocarbons known to contribute to ozone formation, such as ethane, ethylene, and propane.
2.4 Data analysis
2.4.1 Ozone pollution assessment criteria
According to the Technical Regulation on Ambient Air Quality Index (on trial), National Environmental Protection Standard of the People's Republic of China HJ 633-2012, days with an ozone pollution index (IAQI) of 100 or higher during the observation period were designated as pollution days, while days with an IAQI below 100 were considered clean days. This study compared the pollution characteristics of carbonyl compounds between pollution days and clean days. Additionally, the concentrations of formaldehyde, acetaldehyde, and acetone observed during the summer of 2009–2013 in economically developed and industrialized areas such as Beijing, Shanghai, and Guangzhou in China, as well as locations in South America (Brazil), Asia (Thailand), Europe (France), and North America (United States), were selected and compared.
2.4.2 Ozone formation sensitivity
Previous studies have shown that the formaldehyde-to-NO2 ratio (FNR) can be used to determine the sensitivity of O3–NOX–VOCs (Schroeder et al., 2017; Tonnesen and Dennis, 2000; Vermeuel et al., 2019). Most studies used satellite remote-sensing-based FNR, but the FNR column concentration ratios inverted by satellite remote sensing mainly represented the average photochemical of the troposphere, and the concentration distributions of HCHO and NO2 in the vertical direction were inconsistent (Hong et al., 2022; Schroeder et al., 2017). So, there is a large uncertainty to develop ground-level ozone pollution prevention and control measures. In this study, sensitivity analysis of ground-level ozone formation was carried out based on the ratio of ground-level HCHO to NO2 during the observation period at the nine sites of eight cities in the CPUA. FNR <0.55 ± 0.16 and FNR >1.0 ± 0.3 were defined as showing VOC-limited and NOX-limited regimes, respectively, and the FNR ratio ranging from 0.55 ± 0.16 to 1.0 ± 0.3 was defined as showing a NOX- and VOC-co-limited regime (Liu et al., 2021; Zhang et al., 2022).
2.4.3 Exploration of secondary formation mechanisms
2.4.4 (1) Atmospheric chemical reactivity
In this study, the contribution of atmospheric chemical reactivity of carbonyl compounds to ozone formation was evaluated using the OH free radical consumption rate (LOH) and ozone formation potential (OFP):
where [OVOC]i was the observed concentration of the i (i=1 to n) carbonyl compound, in molecule cm−3, and ki(OH) was the rate constants of the i carbonyl compound reacting with OH radicals, in cm3 (molecule s)−1. The unit of LOH is s−1, representing the rate of OH radical consumption. The selected ki(OH) values were from the literature (Atkinson and Arey, 2003).
where MIR was the maximum incremental reactivity of the ith carbonyl compound in g O3 (grams of ozone formed) per gram of VOC, and the MIR values of each species were from the California Code of Regulations (https://govt.westlaw.com, last access: 17 July 2023). [OVOC]i was the mass concentration of the ith carbonyl compound, in µg m−3. The unit of OFP is µg m−3, representing the potential ozone formation.
2.4.5 (2) Observation-based model (OBM)
The observation-based model (OBM) is a box model that uses actual observational data to evaluate the sensitivity of secondary pollutant formation mechanisms to their precursor emissions. By constraining the model with atmospheric observation data, typical secondary pollutants and parameters such as NOX, SO2, CO, VOCs, temperature, humidity, pressure, and JNO2 are input into the model as hourly observational data to calculate the chemical formation and consumption of secondary pollutants and free radicals. In this study, the OBM used the Master Chemical Mechanism (MCM) (v3.3.1, https://mcm.york.ac.uk, last access: 22 October 2023), which is quite a detailed chemical mechanism that describes the chemical processes of 143 VOC species from emission to degradation in the atmosphere, including approximately 6700 species and 17 000 inorganic and organic reactions. In this version of the MCM, a total of 19 carbonyl compounds are included, comprising 9 aldehydes and 10 ketones. Of these, 9 carbonyl compounds were measured in this study, including formaldehyde, acetaldehyde, acetone, propionaldehyde, crotonaldehyde, butyraldehyde, isovaleraldehyde, valeraldehyde, and hexaldehyde. The MCM can simulate atmospheric photochemical reaction processes under near-real conditions and calculate the concentrations of highly reactive species, quantifying the reaction rates of all species involved. For VOCs, especially carbonyls, that were not directly measured, the MCM uses estimated values derived from emission inventories, literature data, and assumptions based on similar species to provide estimates for their concentrations and reaction rates.
Relative incremental reactivity (RIR) was first used by Cardelino and Chameides (1995) to simulate the response of ozone to precursor changes through scenario tests using box model calculations. RIR was calculated by assuming that the concentration of a given carbonyl compound precursor decreased by a certain proportion could cause the change of the concentration of the carbonyl compound, so as to further judge the effect of VOCs on the formation of carbonyl compounds. Combining the concentrations and activity levels of 15 carbonyl compounds during the observation period, this study focused on formaldehyde, acetaldehyde, and acetone as the primary research targets. The impacts of various AVOCs (anthropogenic VOCs), including alkanes, alkenes, alkynes, and aromatic hydrocarbons, as well as BVOCs (biogenic VOCs) like isoprene, on the formation of formaldehyde, acetaldehyde, and acetone were assessed using OBM classification. Specific species of anthropogenic source VOCs (alkanes, alkenes, alkynes, and aromatic hydrocarbons) and biogenic VOCs (isoprene) are detailed in Table S3.
VOC observations, conventional gases (NO2, CO, and SO2), and meteorological parameters (temperature, relative humidity, and pressure) were inputted into the model. It was assumed that the pollutants are well mixed. Under the constraints of the measured hourly concentration data of pollutants, the atmospheric chemical process was simulated to obtain the source-effect relationship of the measured pollutants. By assuming the reduction of the source effect, the RIRs of different carbonyl compounds precursors were calculated, and the sensitivities of carbonyl compounds to different pollutants were obtained, and then the secondary formation mechanism of carbonyl compounds was determined. The formula to calculate the RIR is as follows:
where X was a specific species; PY(X) was the net formation rate of species y; and S(X) was the total amount of emissions of species X in a certain period, i.e., the source effect of species X. ΔS(X) was the change in total emissions of X caused by the hypothetical change in source effect, ΔPY(X) was the change in PY(X) after the change in source effect S(X), and RIR(X) was the relative incremental reactivity of species X. The species Y in this study were formaldehyde, acetaldehyde and acetone, respectively, and pollutant X was reduced by 20 %.
The absolute RIR of the precursor reflects the sensitivity of carbonyl compounds' formation to the precursor. The higher the absolute RIR, the more sensitive the carbonyl compounds' formation to the precursor. A positive RIR value indicates that reducing the species can reduce the formation rate of species Y, and a negative RIR value indicates that reducing the species can increase the formation rate of species Y.
2.4.6 Source analysis
2.4.7 (1) Multi-linear regression model
There is a good correlation between concentrations of compounds of the same or similar source in the atmosphere. Based on this property, it was assumed that the primary and secondary sources of carbonyl compounds were linearly correlated with the selected tracers, and then a quantitative source model was established by multiple linear statistical regression analysis (Kanjanasiranont et al., 2016a; Li et al., 2010; Ling et al., 2017; Luecken et al., 2012; Lui et al., 2017; Wang et al., 2017). In general, CO is the marker product of typical anthropogenic combustion source emissions, mainly from vehicle exhaust emissions and coal combustion. Ozone, as an indicator of photochemical smog, is a typical secondary formation pollutant. In this study, CO and ozone were selected as tracers of primary source and secondary source of carbonyl compounds, respectively. The formula is as follows:
where [carbonyl], [CO], and [O3] represented the observed mixing ratios of carbonyl compounds, CO, and ozone, respectively (in ppbv). β0, β1, and β2 were coefficients obtained by a multiple linear regression fitting model (in ppbv ppbv−1). β0 represented the background concentration of a given carbonyl compound, and β1 represented the emission ratio of the carbonyl compound relative to CO. β1[CO] and β2[O3] represented the concentrations of carbonyl compound in primary emission and secondary formation, respectively (in ppbv).
In addition, the relative contribution of primary emissions, secondary formation, and background concentrations of carbonyl compounds can be calculated using the following formula:
where Pprimary represented the contribution of the primary emission of a given carbonyl compound (%), Psecondary represented the contribution of the secondary formation of the carbonyl compound species (%), and Pbackground represented the contribution of the carbonyl compound species from sources other than primary emissions and secondary formation (%).
2.4.8 (2) Backward trajectory model
The effects of long-distance air mass transport on the pollution of carbonyl compounds in the CPUA were studied using MeteoInfo software and the TrajStat plug-in (http://www.meteothink.org/downloads/index.html, last access: 12 November 2023). In this model, meteorological data were relevant meteorological data from the Global Data Assimilation System (GDAS) database (ftp://arlftp.arlhq.noaa.gov/pub/archives/gdasl, last access: 12 November 2023). A trajectory simulation height of 500 m above ground level (a.g.l.) was selected. The duration of backward trajectory was 48 h. The daily start time was 00:00 UTC. The analog frequency was 2 h. The backward trajectory diagram was calculated. Meanwhile, the clustering method in TrajStat software and the Euclidean distance algorithm were used to cluster the airflow trajectory to the CPUA. And then the statistical analysis was carried out in combination with the corresponding pollutant mass concentration characteristics.
3.1 Overview of air quality during observation period
Due to the influence of cooling and precipitation caused by cold air intrusion, the early observation period (from 4 to 6 August 2019) in the Chengdu Plain Urban Agglomeration (CPUA) experienced slightly lower temperatures (25.1 °C) and higher humidity (87.6 %). These conditions were unfavorable for ozone formation. Although ozone itself is not easily removed by rain, precipitation reduces ozone pollution by washing away its precursors, such as nitrogen oxides (NOX) and polar volatile organic compounds (VOCs), such as aldehydes and ketones, decreasing sunlight exposure and enhancing atmospheric dispersion. However, as temperatures increased and humidity dropped in the subsequent days, more favorable conditions for ozone formation emerged, leading to heavy and persistent regional ozone pollution in the CPUA. By 12 August, the mean temperature had gradually increased to 29.1 °C, while it averaged 27.7 °C from 13 to 14 August. During this time, cumulative precipitation reached 975 mm, resulting in temporary alleviation of ozone pollution. Subsequently, temperatures rose again from 15 to 18 August, with the mean temperature persisting above 28.4 °C for several days, accompanied by a decrease in humidity to a minimum of 64.8 % on 17 August. Overall, during the observation period (from 4 August 2019, 00:00, to 18 August 2019, 24:00), three episodes of severe ozone pollution occurred, namely EP1 (7 to 9 August), EP2 (10 to 13 August), and EP3 (15 to 18 August), as depicted in Fig. 2.
Figure 3 illustrates the temporal and spatial variations of ozone and NO2 concentrations, as well as temperature and humidity at each site during the observation period. After observing the spatial distribution of ozone concentration during EP1, it is evident that the severity of pollution reached heavily polluted levels, with Chengdu recording an MDA8 concentration of 297 µg m−3 on 7 August. This distribution demonstrated a radial decrease from Chengdu to the surrounding areas. However, the subsequent episodes, EP2 and EP3, exhibited even broader ranges of ozone pollution and more pronounced spatial movements. During the early stages of EP2 and EP3 (from 10 to 11 and from 14 to 15 August, respectively), high ozone concentrations were observed in the Chengdu–Deyang–Mianyang region. In the middle stages (12 August and from 16 to 17 August, respectively), influenced by northerly airflow, regions with high ozone concentrations expanded to the central (Meishan, Ziyang, and Suining) and southwestern (Leshan and Ya'an) parts of the CPUA. In the later stages (13 and 18 August), under the influence of northwesterly airflow, regions with high ozone concentrations (Meishan and Leshan) moved southward again, while ozone pollution in other areas of the CPUA gradually weakened. On 11 to 12 and 16 to 17 August, ozone concentrations in the eight cities of the CPUA reached light pollution levels or higher, with the heaviest pollution recorded on 12 August. Specifically, Deyang, Mianyang, Suining, and Meishan reached moderate pollution levels, while Chengdu reached heavy pollution, with a concentration of 324 µg m−3.
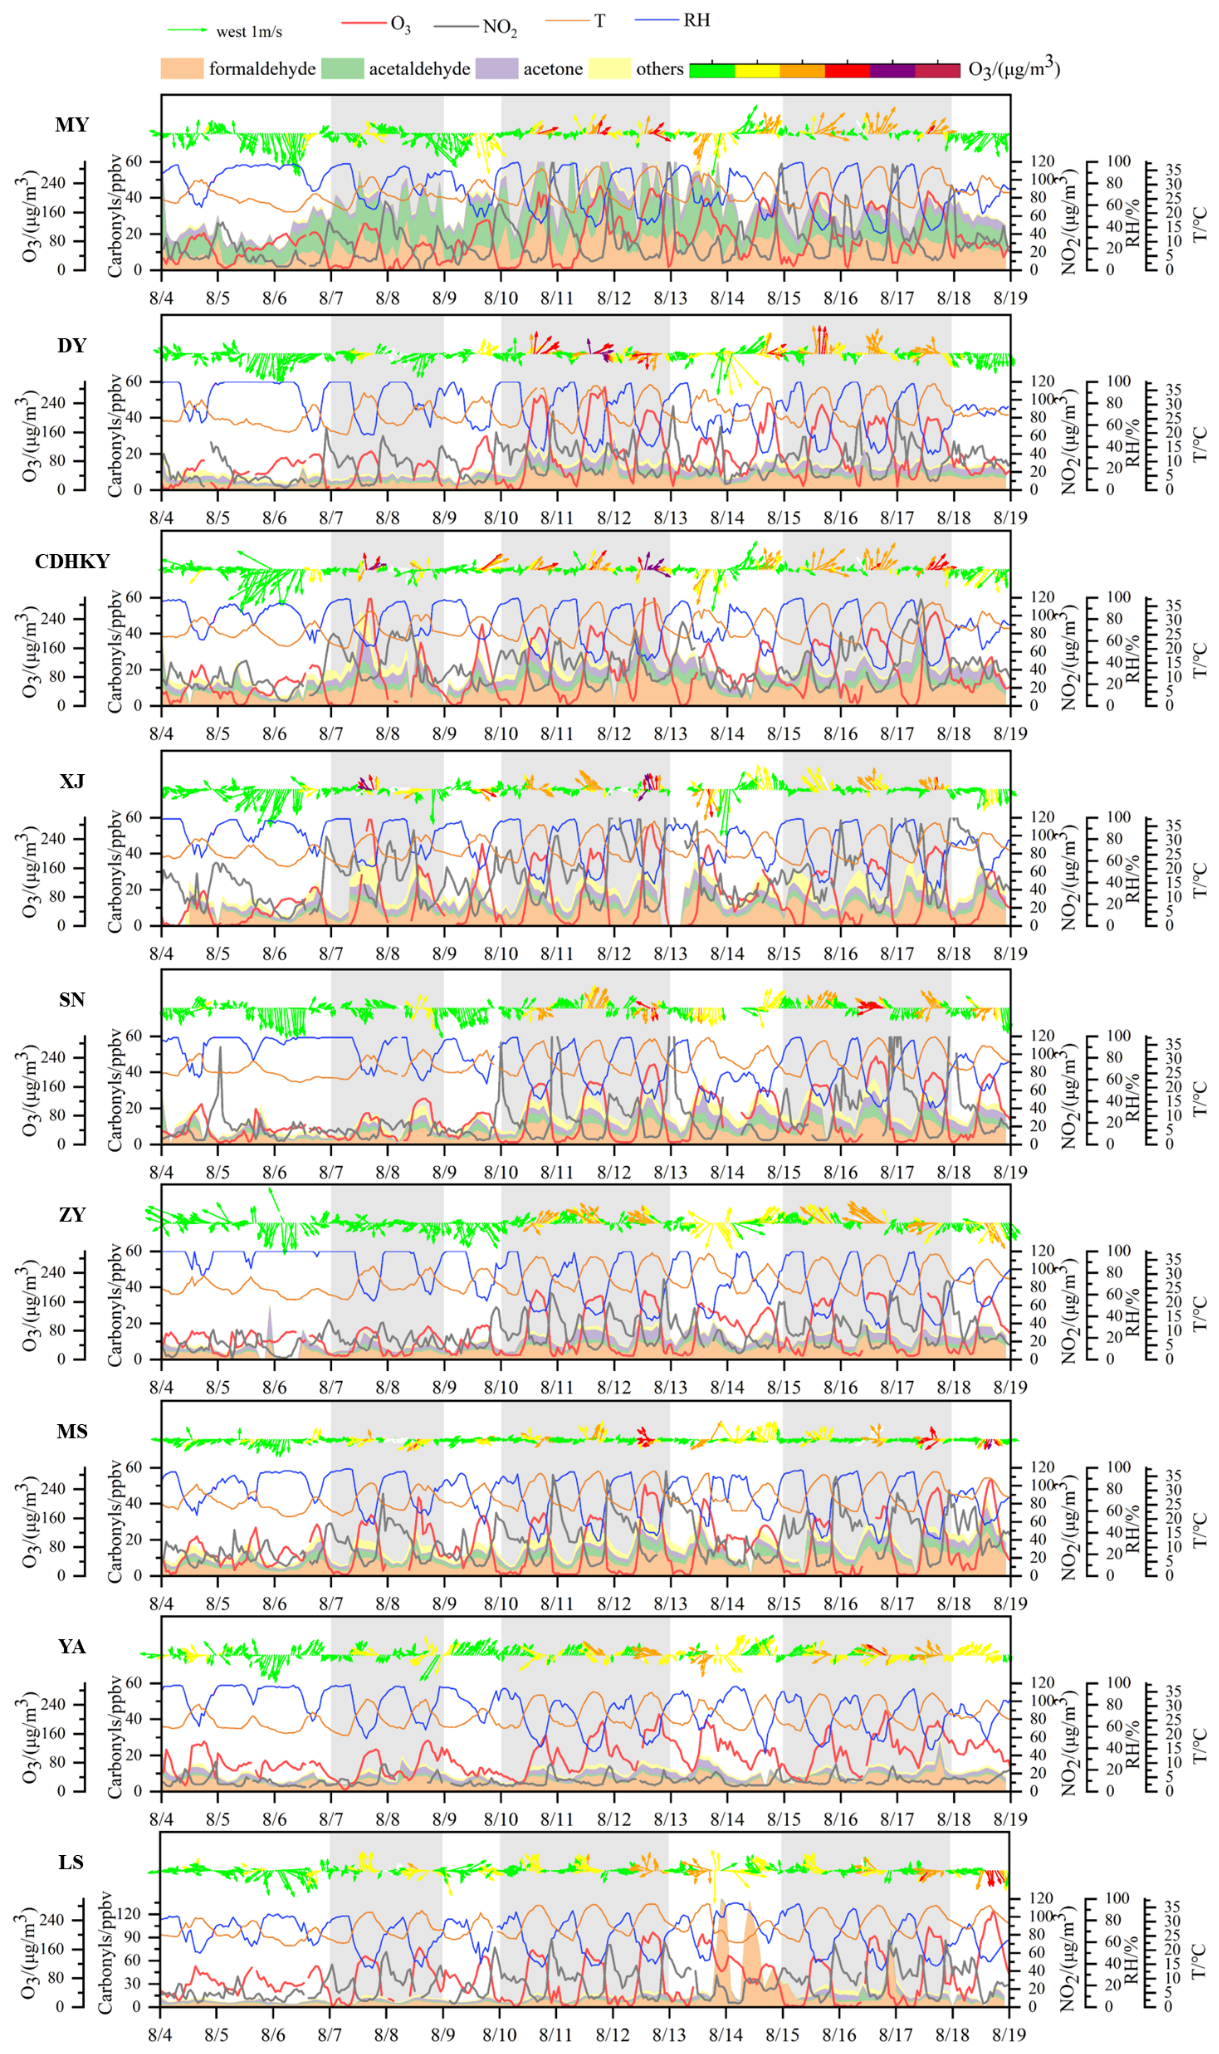
Figure 2Overview of air quality at each site during the observation period. The gray shaded parts respectively represent the three heavy ozone pollution episodes (EP1, EP2, EP3).
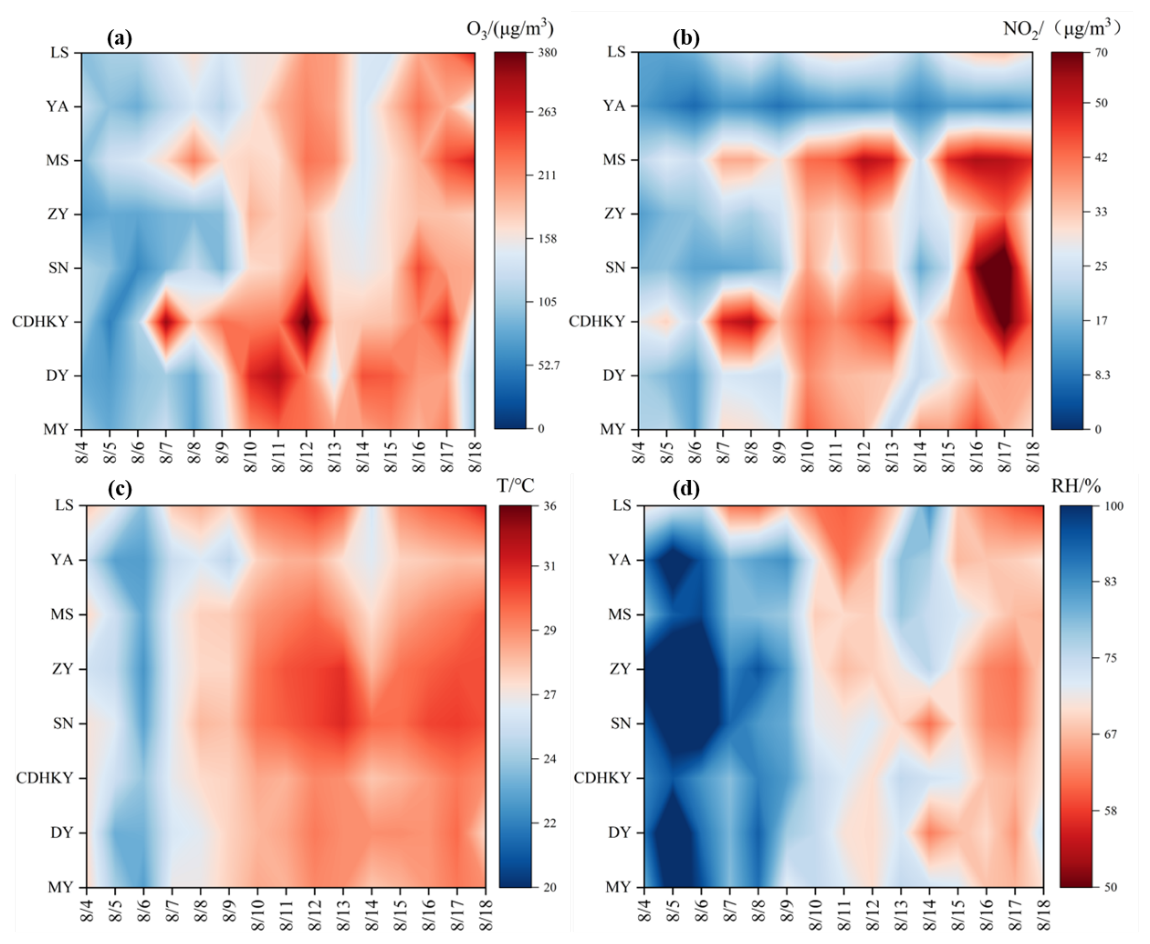
Figure 3Temporal and spatial variations of (a) ozone concentration, (b) NO2 concentration, (c) temperature, and (d) humidity in the CPUA during the observation period.
3.2 Comparative characterization of carbonyl compounds
3.2.1 Ambient levels
During the observation period, we utilized 2,4-dinitrophenylhydrazine (DNPH) cartridge and high-performance liquid chromatography (HPLC) analysis to quantify 15 carbonyl compounds. The concentrations and relative proportions of these compounds are summarized in Table 1. The average total concentration of the 15 carbonyls in the CPUA was 17.4 ± 5.3 ppb. Overall, areas with elevated concentrations of carbonyl compounds were primarily concentrated in and around Chengdu in both northern and southern directions. The MY site, located to the north of Chengdu, exhibited the highest concentration of carbonyl compounds (35.2 ± 13.4 ppb), while the YA site, situated southwest of Chengdu, showed the lowest concentration (10.7 ± 4.2 ppb).
Table 1Daily mean ± standard error of carbonyl compound mixing ratios (ppbv) at each site in the CPUA during the observation period. Sum: the total sum of carbonyl compound mixing ratios across all compounds at each site.
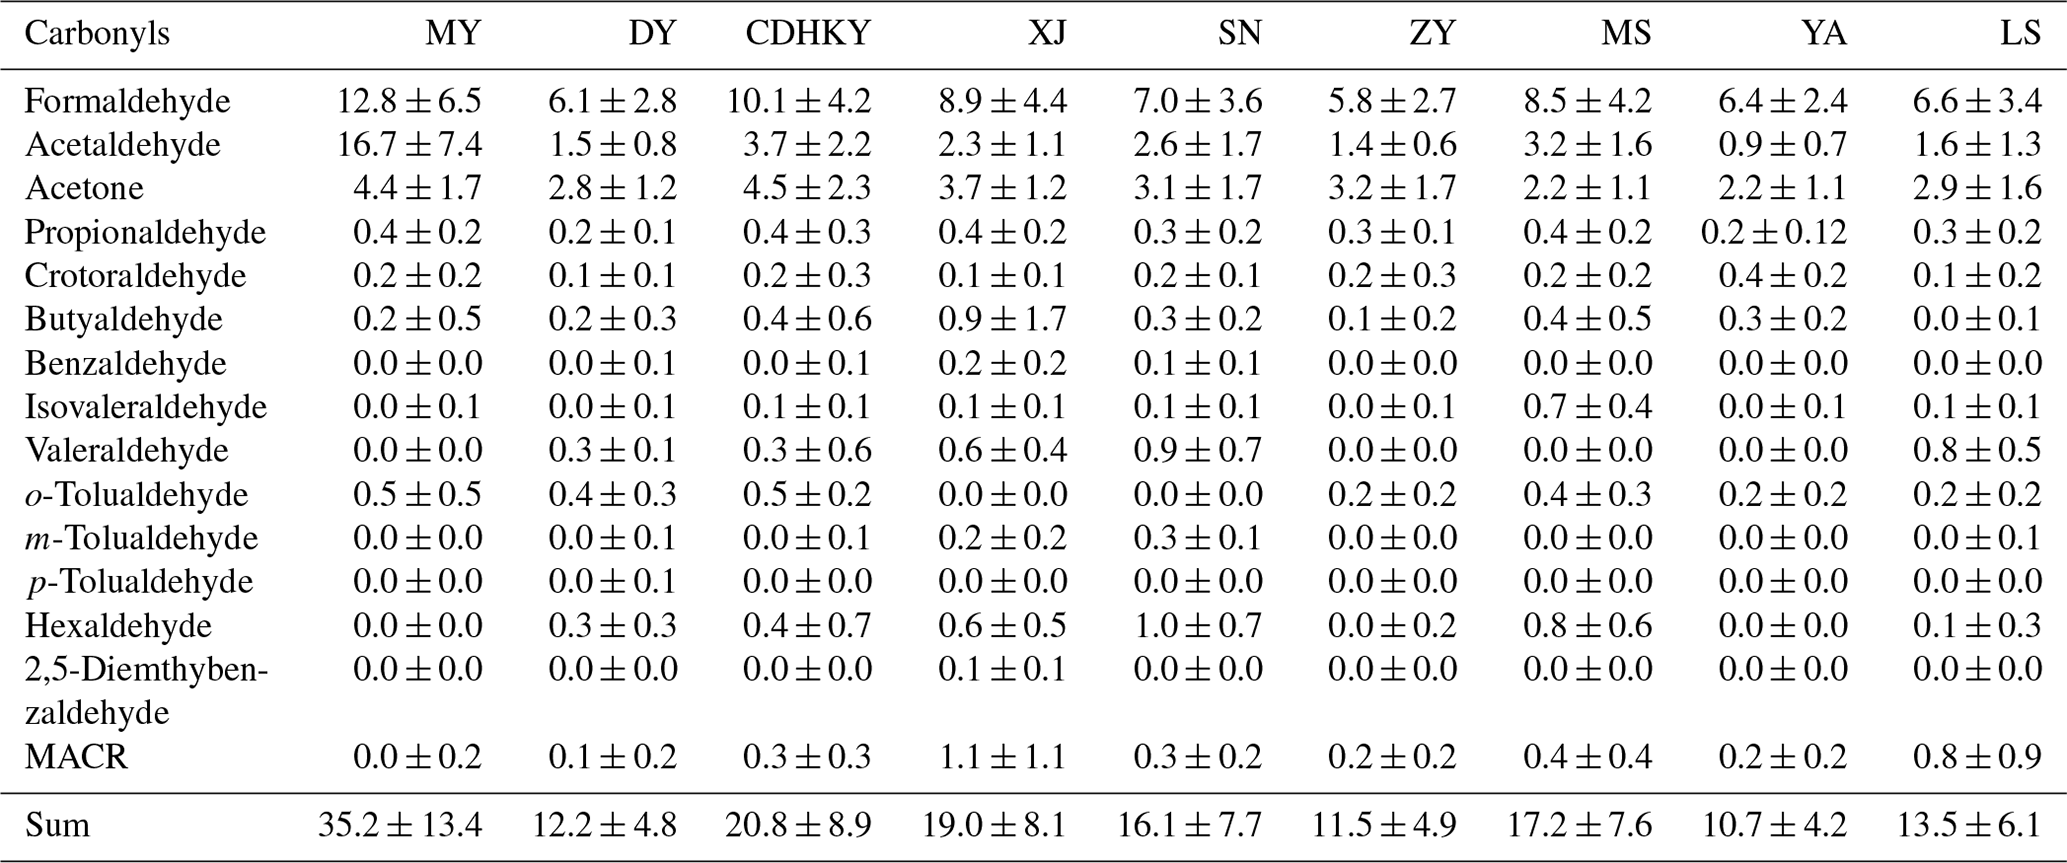
Figure S1 in the Supplement illustrates the relationship between ozone concentration and carbonyl compounds' concentration at each site during the observation period. It is evident that the spatial distribution of carbonyl compound concentrations is similar to that of ozone concentration. Regions with severe ozone pollution tend to exhibit higher concentrations of carbonyl compounds. The variation in carbonyl compound concentrations is primarily attributed to anthropogenic emissions and prevailing summer wind directions in the CPUA. Chengdu is the most economically developed city in the CPUA, with notably higher GDP and industrial production values than other regions. Chengdu's major industries include coal-fired power plants, chemical plants, and metallurgy and building materials plants, and high concentrations of carbonyls were observed here. The unique basin climate of the CPUA, characterized by intense sunlight and stable atmospheric conditions, facilitates the accumulation of pollutants. The large amount of industrial emissions and the strong photochemical reaction contribute to ozone pollution. Additionally, during the summer, prevailing northerly winds in the CPUA facilitate the downwind transport of pollutants from upwind sources, leading to regional pollution. It is noteworthy that the concentration of carbonyl compounds at the MY site significantly exceeds that at the CDHKY site. Mianyang, with its industrial roots, consistently maintains its position as the second-highest GDP contributor in Sichuan Province. The electronics information industry stands as Mianyang's primary economic driver, constituting approximately half of the city's total output value. Studies investigating the volatile organic compound (VOC) source profile in Chengdu (Zhou et al., 2021) reveal that ethanol and carbonyls predominantly characterize electronics manufacturing emissions.
3.2.2 Compositional characteristics
According to the composition characteristics of 15 carbonyl compounds in the ambient air of each city during the observation period (Table S4). Formaldehyde was the most abundant carbonyl found in these sites followed by acetone and acetaldehyde, which is widely observed in previous studies. The measured ratios of formaldehyde, acetone, and acetaldehyde across different sites ranged from 36.4 % to 59.4 % (average 48.1 %), 12.4 % to 28.1 % (average 19.9 %), and 8.2 % to 47.3 % (average 17.5 %), respectively. In this study, the total measured formaldehyde, acetaldehyde, and acetone (FAT) account for over 78 % of the total carbonyls' concentrations. At the MY and ZY sites, this proportion even exceeded 90 %. It is noteworthy that isobutyraldehyde (MACR) ranks fourth in the volume concentration of 15 carbonyls measured in the ambient air surrounding XJ, accounting for 5.3 %. MACR, a characteristic product of isoprene photooxidation from biogenic sources, possibly originates from the abundant vegetation surrounding XJ. It reflects the period's relatively active photochemical reactions, with substantial contributions from secondary formation to the measured carbonyls' composition.
The observed levels of FAT in different areas were influenced by various factors including sampling period, geographic location, meteorological conditions, chemical removal, and source emissions (Zhang et al., 2016b). Despite these influences, comparisons remain valuable in providing an overview of ambient carbonyl levels in the CPUA. During the summer of 2010, a nationwide survey of ambient monocarbonyl compounds that was conducted simultaneously at nine sites (Ho et al., 2015) found that the total FAT concentration was highest in Chengdu (14.96 ppb), followed by Beijing (11.83 ppb) and Wuhan (11.70 ppb). Beijing, as the capital of China, and Wuhan, being one of the top 10 most populous cities in China, played significant roles in this comparison. In our study, the CDHKY site within CPUA exhibited the highest FAT concentration, with values of 18.25 ppb, surpassing those recorded in 2010. Furthermore, the total FAT concentrations observed at the CPUA and XJ sites, with values of 14.99 and 14.90 ppb respectively in our study, closely resemble those reported in August 2010 in Chengdu. The consistently high levels of carbonyl compounds observed in Chengdu, both in 2010 and our current study, indicate that the city likely experiences higher concentrations of these pollutants compared to other regions across the country. However, more extensive temporal data would be beneficial to fully validate this pattern at a national scale. Comparing our findings to international studies, the FAT concentrations at the CDHKY site were lower than those reported in Rio de Janeiro, Brazil (da Silva et al., 2016), during July to October 2013 (35.43 ppb) but higher than those in Bangkok, Thailand (Kanjanasiranont et al., 2016b); Orleans, France (Jiang et al., 2016); and the United States (Murillo et al., 2012), with values of 9.05, 6.12, and 5.76 ppb, respectively.
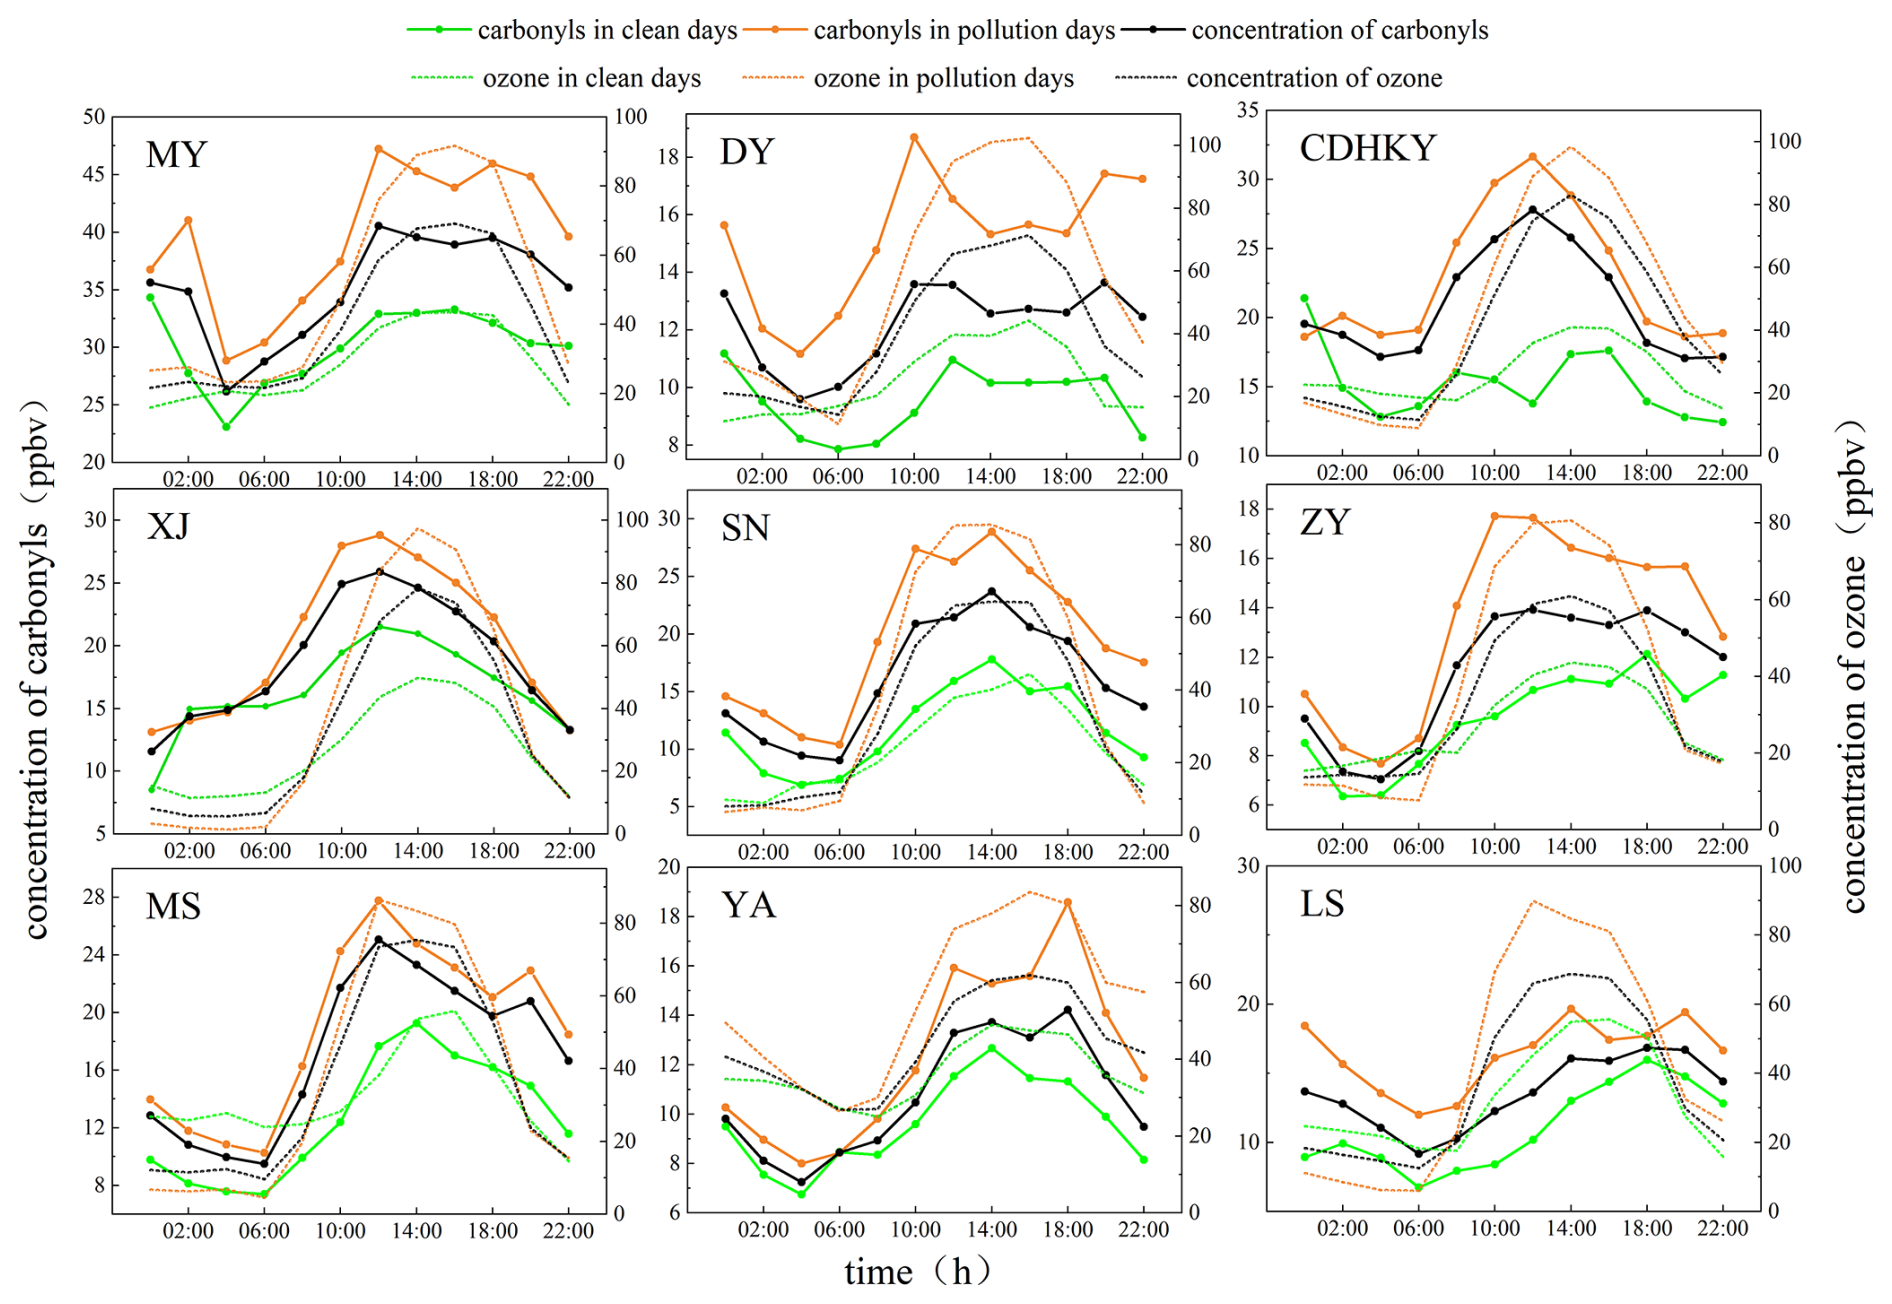
Figure 4Diurnal variations of carbonyl compounds and ozone concentrations at each site in the CPUA during the observation period.
3.3 Temporal variations of carbonyl compounds
The diurnal variation of the total mixing ratio of ambient carbonyl compounds and ozone concentrations around each site in the CPUA during the observation period is shown in Fig. 4. According to the observation results, the diurnal trend of ozone concentration at each site showed a “unimodal” variation characteristic; that is, it gradually increased from the morning to the peak of one day at noon and then decreased. The diurnal variation of the total mixing ratio of carbonyl compounds at each site generally showed a characteristic of high during the daytime and low at night. The concentration of carbonyl compounds during the day (06:00–16:00) was 48.8 % higher than that at night (18:00–4:00) at the XJ site. This indicated that the concentration of carbonyl compounds increased by photochemical production during the daytime. Additionally, deposition processes, particularly dry deposition at night, likely contribute to the observed diurnal variation in carbonyl levels. The diurnal variation characteristics of each site were different. For example, the diurnal variation characteristics of carbonyl compounds' concentration at CDHKY, XJ, and SN sites were consistent with those of ozone. The diurnal variation of carbonyl compounds' concentrations at other sites showed “double peaks”, peaking at 10:00–12:00 and 18:00–20:00, respectively. The concentrations of carbonyl compounds at night were also higher at MY, DY, and LS sites. The diurnal minimum values of the total concentration of carbonyl compounds and ozone concentration appeared at a similar time, usually at 04:00 or 06:00. The first peak of the total mixing ratio of carbonyl compounds occurred earlier than the maximum ozone concentration of the day. The first peak of the total mixing ratio of carbonyl compounds mostly occurred between 10:00 and 12:00, and the maximum ozone concentration mostly occurred between 14:00 and 16:00. This was related to the fact that carbonyl compounds were important precursors of ozone.
In general, the diurnal variation of the total concentration of carbonyl compounds on pollution days and clean days was high during the daytime and low at night. The total mixing ratio of carbonyl compounds on pollution days was 22.8 %–66.2 % higher than that on clean days. At the same time, the increase in concentration of carbonyl compounds during the daytime on pollution days was higher than that on clean days. This suggested that the increase in the concentration of carbonyl compounds during the daytime contributed to ozone pollution.
3.4 Atmospheric photochemical reactivity of carbonyl compounds
During the observation period, the total OH radical consumption rate (LOH) and total ozone formation potential (OFP) of the 15 carbonyl compounds at each site are depicted in Fig. 5. The ranking of total LOH and total OFP at each site is consistent, except for the YA and ZY sites with lower concentrations of carbonyl compounds, where the atmospheric photochemical reactivity ranking also aligns with the concentration. Among all sites, the MY and CD sites display the highest reactivity, while the YA and ZY sites exhibit the lowest reactivity. During the observation period, carbonyl compounds significantly contributed to ozone formation. The contributions to the OFP of total VOCs (alkanes, alkenes, alkynes, aromatics, and carbonyl compounds) at the MY, SN, ZY, YA, and LS sites ranged from 19.5 % to 48.6 %. Formaldehyde and acetaldehyde were identified as the most reactive species in the atmosphere, surpassing other carbonyl compounds in reactivity due to their higher concentrations and inherent reactivity, especially formaldehyde. However, acetone exhibited high inertness and a prolonged atmospheric lifetime, leading to its accumulation in ambient air with concentrations higher than other carbonyl compounds except for formaldehyde and acetaldehyde. Thus, despite its elevated concentration, acetone's reactivity remained relatively low.
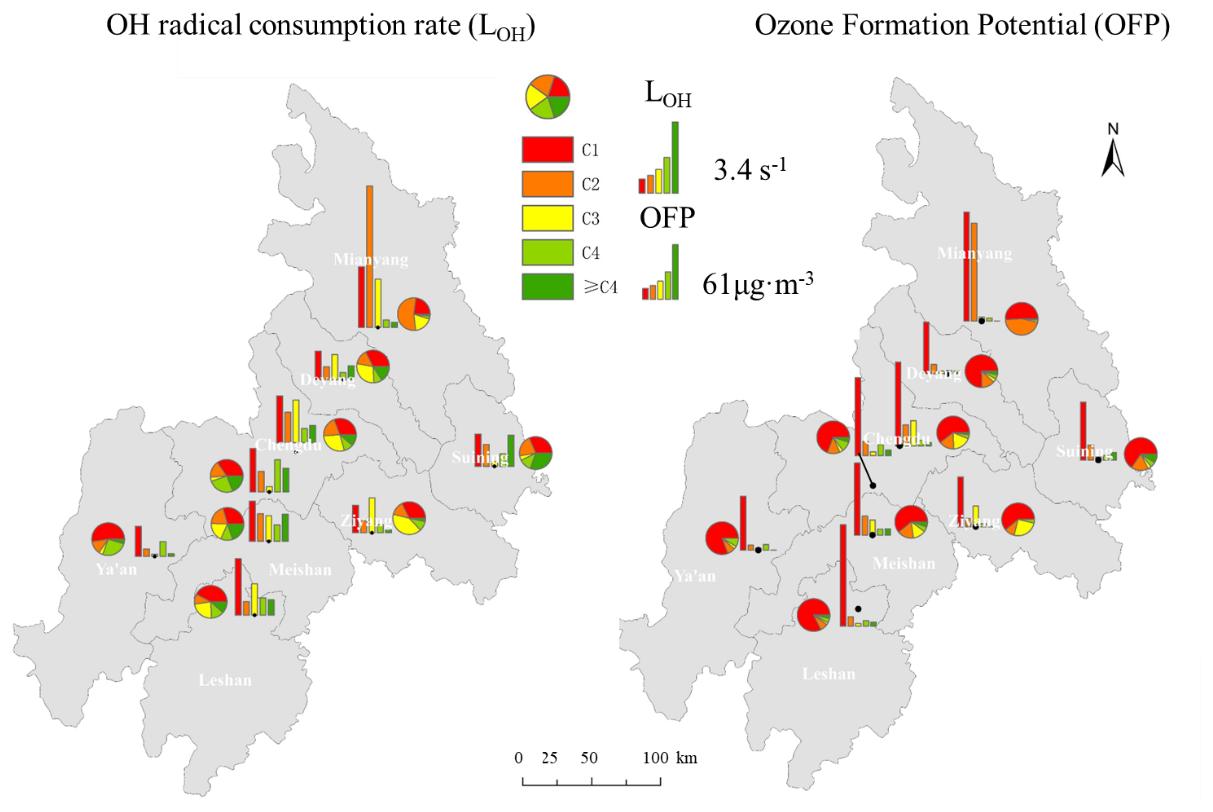
Figure 5LOH and OFP of carbonyl compounds at each site in the CPUA during the observation period.
3.5 Sensitivity analysis of ozone formation based on the formaldehyde-to-NO2 ratio (FNR)
The change in O3 formation sensitivity of each site in the CPUA during the observation period is shown in Fig. 6. As can be seen from the Fig. 6, most sites remain in the VOC-limited regime during the clean period and EP1 to EP3. Economically developed cities such as Chengdu and Meishan, with high levels of formaldehyde and NO2, remain in the VOC-limited regime. Ya'an, as a city with the lowest GDP ranking in the CPUA, with low levels of formaldehyde and NO2, remains in the transitional regime.
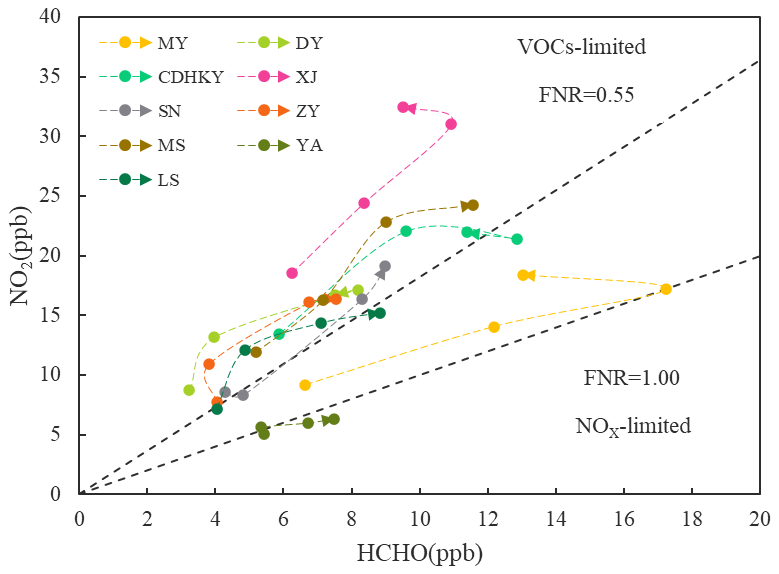
Figure 6The change of O3 formation sensitivity of each site in the CPUA during the observation period. The arrows represent time steps from the clean period to EP1 to EP2 to EP3.
The daily variation of O3 formation sensitivity and ozone concentration at each site in the CPUA during the observation period is shown in Fig. S4. The mean FNR of each site ranged from 0.48 to 1.29 during the observation period. The FNRs were lower than 0.55 ± 0.16 at XJ, DY, ZY, CDHKY, and MS and higher than 1.0 at LS, SN, YA, and MY. At the same time, the mean ozone concentration at each site was between 138 and 192 µg m−3. The mean ozone concentration in XJ, DY, CDHKY, and MS was 166–192 µg m−3, and it was 150–164 µg m−3 in LS, SN, YA, and MY. Therefore, it could be seen that most of the sites with high mean ozone concentrations during the observation period, like CDHKY, XJ, MS, and Deyang sites, were in the VOC-limited regime, and most of the stations with low mean ozone concentrations during the observation period such as YA, SN, MY, and LS were in the transitional regime. It was worth noting that the mean ozone concentration at the ZY site (only 138 µg m−3) during the observation period was much lower than that of other sites, but most of the ZY site was in VOC-limited regime, which was mainly related to the low concentration of formaldehyde. In addition, the FNR value of the MY site was also relatively high, which was mainly caused by the high concentration of formaldehyde.
Based on the ratio of the formaldehyde-to-NO2 mixing ratio, most sites remain in the VOC-limited regime during the observation period. The sites with heavy ozone pollution were in the VOC-limited regime, and the sites with light ozone pollution were in the transitional regime. Photochemical reactivity (LOH and OFP) analysis showed that formaldehyde and acetaldehyde contributed significantly to the enhancement of atmospheric oxidation and ozone formation potential. Therefore, when heavy ozone pollution occurs in the CPUA, special attention should be paid to the control of VOCs, especially formaldehyde and acetaldehyde in carbonyl compounds, under the coordinated control of NOX and VOCs. Overall, this study reveals the important contribution of carbonyl compounds to ozone pollution in the CPUA and provides scientific support for the establishment of ozone pollution prevention and control measures.
3.6 Source analysis of carbonyl compounds
3.6.1 Quantitative source analysis of key carbonyl compounds
Table S7 in the Supplement provides a summary of the background and primary emissions concentrations of formaldehyde, acetaldehyde, and acetone at nine sites across the eight cities of the CPUA, along with the proportion of secondary formation contributing to their concentrations. Background concentrations and primary emissions of formaldehyde, acetaldehyde, and acetone ranged from 50 % to 80 %, 46 % to 83 %, and 45 % to 78 %, respectively. Secondary formation accounted for 20 % to 50 %, 17 % to 54 %, and 22 % to 55 % of their concentrations, respectively. Notably, in SN and YA, the secondary formation of formaldehyde contributed half of the observed concentration, indicating it as the predominant source, while acetaldehyde's secondary formation also prevailed in these sites. Conversely, acetone, with lower reactivity, primarily originated from background concentrations and primary emissions at other sites except YA. Moreover, background concentrations and primary emissions were identified as the main contributors to carbonyl compounds in XJ and LS.
Figure 7 illustrates the secondary formation concentrations of formaldehyde, acetaldehyde, and acetone at each site in the CPUA under both clean and polluted conditions. Under polluted conditions, the secondary concentrations of formaldehyde, acetaldehyde, and acetone exceeded those in clean conditions by 58.8 %, 54.6 %, and 57.6 %, respectively. The most significant increases in secondary concentrations were observed at the SN site, while relatively smaller increases were observed at LS and XJ.
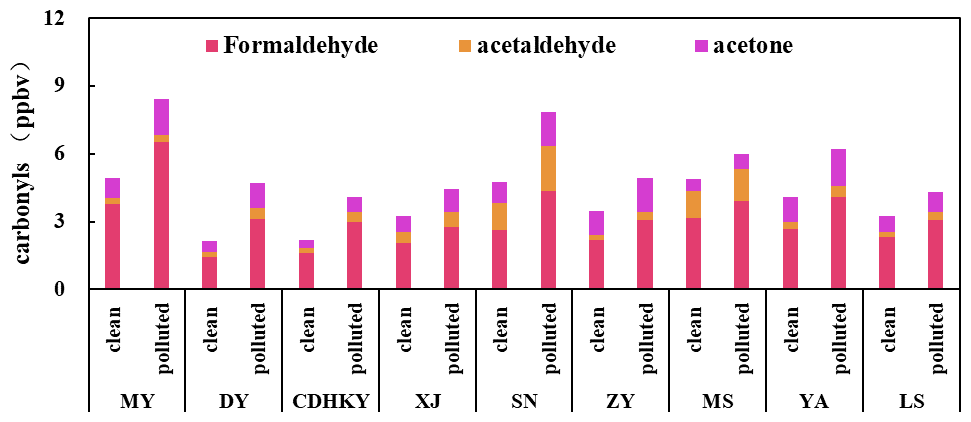
Figure 7Concentrations of formaldehyde, acetaldehyde and acetone in secondary formation under different pollution conditions at each site in the CPUA during the observation period.
3.6.2 Exploration of the secondary formation mechanisms of key carbonyl compounds
In this study, we utilized VOC data collected on 11, 12, and 16 August when all eight cities in the CPUA were experiencing mild to severe ozone pollution. We calculated the relative incremental reactivity (RIR) of formaldehyde, acetaldehyde, and acetone at the MY, SN, ZY, YA, and LS sites on these days. The OBM analysis allowed us to assess the impact of anthropogenic VOCs (alkanes, alkenes, alkynes, aromatics) and biogenic VOCs (e.g., isoprene) on carbonyl compound formation in the context of regional ozone pollution events (Fig. 8). Overall, the sensitivities of different anthropogenic source and plant source VOCs to formaldehyde, acetaldehyde, and acetone were consistent among sites. For formaldehyde, reducing alkenes in anthropogenic source VOCs and plant VOCs was the most effective way to control formaldehyde concentration, while reducing alkenes in anthropogenic source VOCs was also beneficial to reduce the formation of acetaldehyde. For acetone with low reactivity, the alkanes in anthropogenic source VOCs were the most sensitive to the formation of acetone, followed by alkenes and BVOCs. Only the RIR value of alkanes was greater than zero, and the RIR values of both alkenes and BVOCs were less than zero, indicating that reducing alkanes could reduce the formation of acetone, while reducing alkenes and BVOCs was not conducive to acetone concentration control.
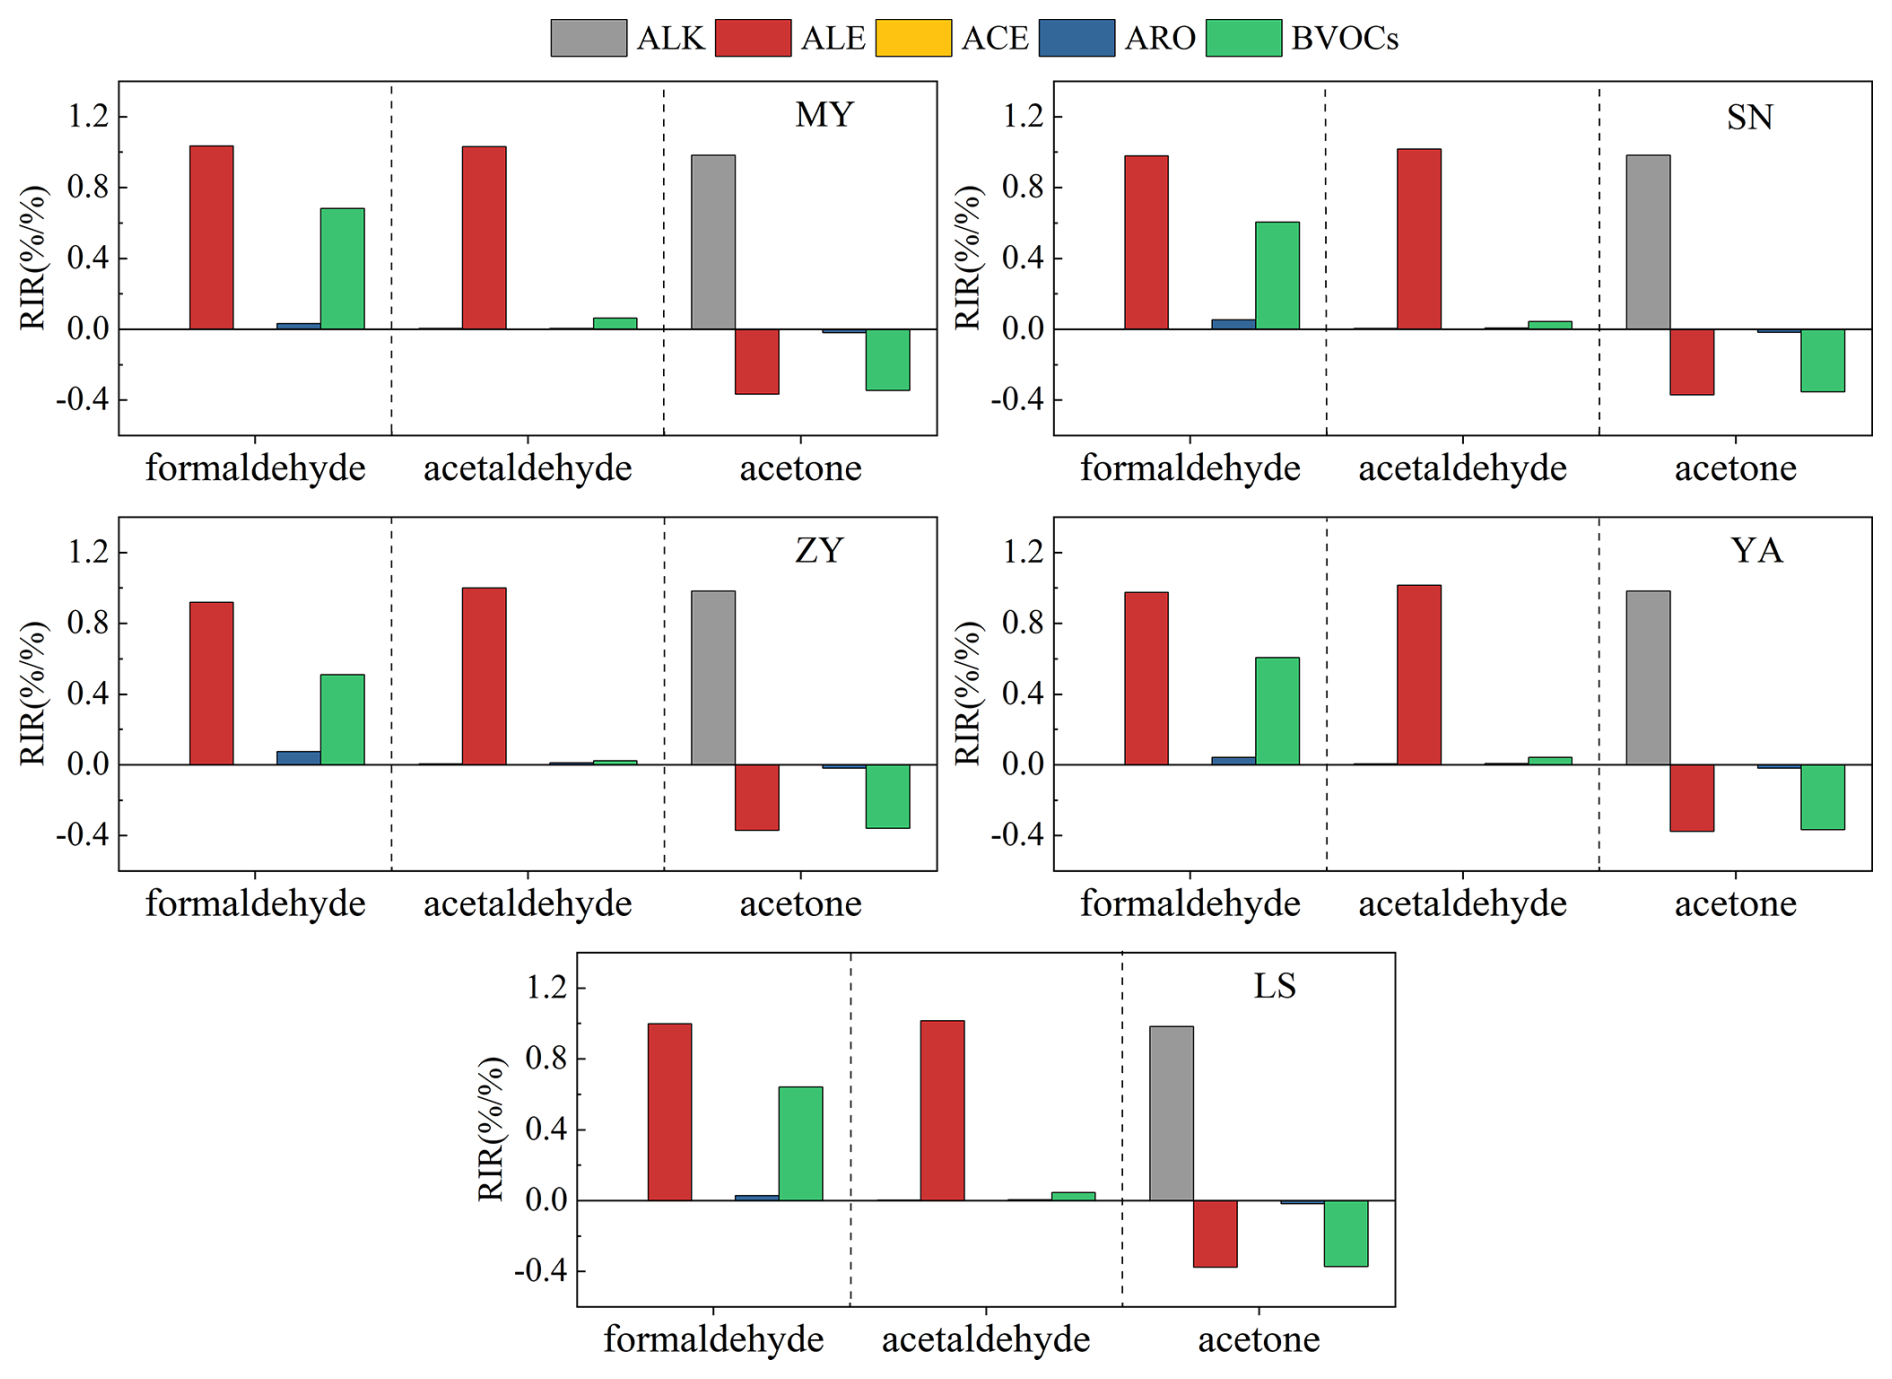
Figure 8Mean RIRs of formaldehyde, acetaldehyde, and acetone to different anthropogenic source VOCs (alkanes (ALK), alkenes (ALE), alkynes (ACE), and aromatics (ARO)) and biogenic VOCs (BVOCs) at MY, SN, ZY, YA, and LS sites on 11, 12, and 16 August.
3.6.3 Influence of regional transportation contribution
The TrajStat trajectory model was used to calculate and cluster the 24 h backward trajectories of air quality at the sampling sites. The backward trajectory during sampling is shown in Fig. S5. During the observation period, the pollution of carbonyl compounds in the cities of the CPUA was affected by the mutual transport among cities in Sichuan Province, especially along the MY–DY–CDHKY route. In addition, the surrounding provinces and cities of Sichuan Province (Gansu and Chongqing) also contributed to the carbonyl compounds of the CPUA.
The potential sources of carbonyl compounds at different pollution stages at the CDHKY during the observation period are shown in Fig. 9. It can be seen from the figure that there are differences in the potential sources of carbonyl compounds among different pollution stages at the CDHKY site. The concentration of local carbonyl compounds in CDHKY was high during the early observation period and EP1, due to local sources, and was also affected by the northern airflow, and carbonyl compounds were also affected by the transport from MY, DY, and other northern regions. Under the effect of the continuous northern airflow, the local source emissions decreased during EP1, and the potential source of carbonyl compounds shifted from the junction between CDHKY and ZY. During EP3, under the combined influence of the western airflow, the contribution of transport from SN and ZY to carbonyl compounds increased, while emissions from local sources also increased.
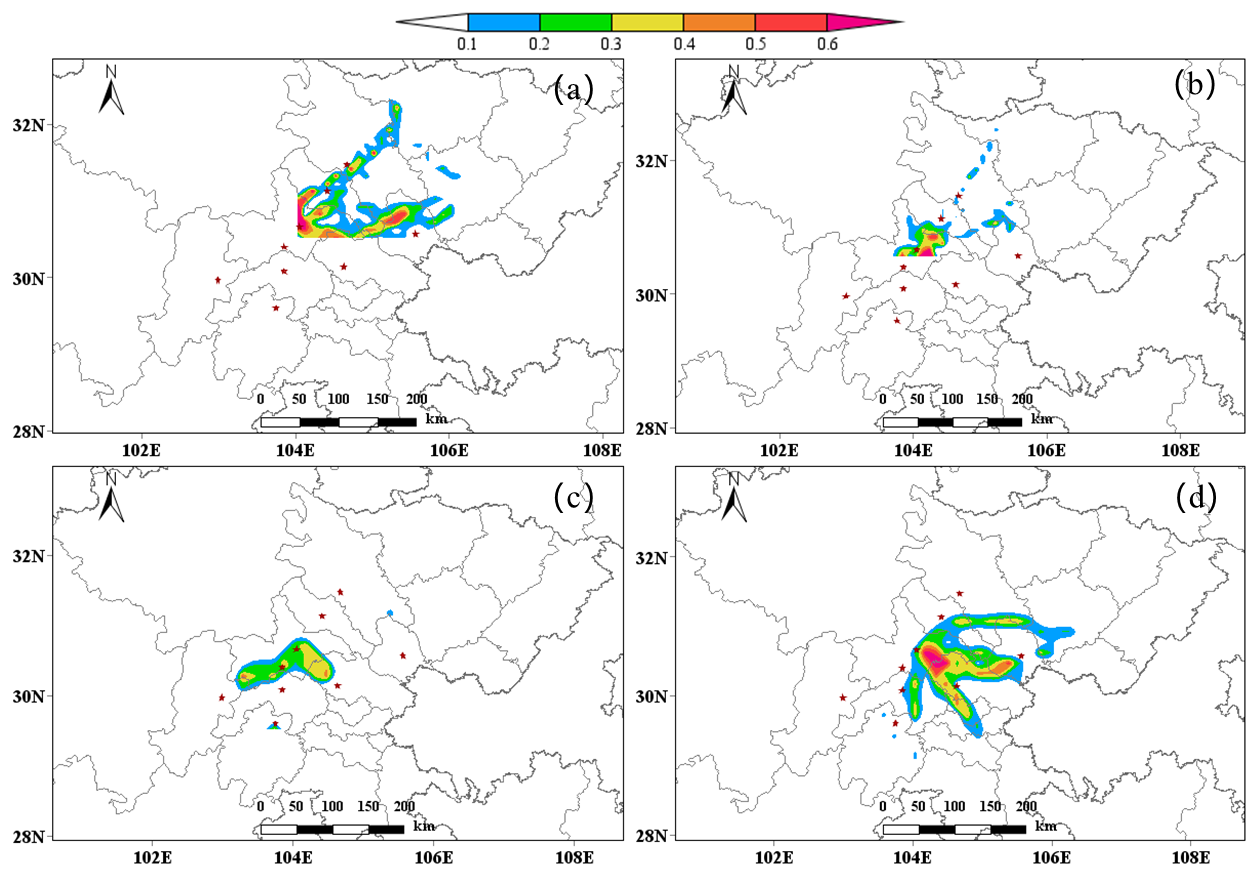
Figure 9Analysis of potential sources of carbonyl compounds at different periods at the CDHKY site during the observation period: (a) 4–6 August, (b) 7–9 August, (c) 10–13 August, and (d) 15–18 August.
During a comprehensive atmospheric observation campaign conducted at nine sites across the CPUA from 4 to 18 August 2019, three regional heavy ozone pollution episodes (EP1 to EP3) were observed. This study extensively examines the concentration variations, atmospheric chemical reactivity, and sources of carbonyls during this period. The average total concentrations of 15 carbonyl compounds across the nine sites within eight cities of the CPUA were measured to be 17.4 ± 5.3 ppb. Spatial analysis indicated that areas with higher carbonyl concentrations were concentrated around Chengdu, extending both north and south. Notably, regions with elevated carbonyl compound concentrations also tended to experience more severe ozone pollution. Formaldehyde (36.4 %–64.3 %), acetone (12.4 %–28.1 %), and acetaldehyde (8.2 %–47.3 %) constituted the predominant species by volume concentration. Chengdu exhibited FAT concentrations surpassing national and international levels, indicating heightened levels compared to other regions.
Compared to clean days, carbonyl compound concentrations were significantly higher on ozone pollution days, with increases ranging from 22.8 % to 66.2 %. Between 19.5 % and 48.6 % of the total volatile organic compound (VOC) ozone formation potential (OFP) was attributed to the 15 carbonyl compounds, highlighting their substantial contribution to ozone formation, particularly formaldehyde and acetaldehyde. While primary emissions are the main sources of these compounds, secondary formation processes contributed over 30 % on average to the concentrations of formaldehyde, acetaldehyde, and acetone. Under ozone pollution conditions, the secondary formation concentrations of these three compounds were notably higher than on clean days, with increases of 58.8 %, 54.6 %, and 57.6 %, respectively, emphasizing the critical role of secondary processes in exacerbating regional ozone pollution. Observation-based modeling revealed that formaldehyde and acetaldehyde primarily originated from the secondary formation of alkenes and BVOCs, while acetone mainly stemmed from the secondary formation of alkanes. These findings highlight that while the concentration of carbonyl compounds is important, their significant impact on ozone formation is primarily driven by secondary chemistry. Specifically, the secondary formation of these compounds from alkenes and biogenic BVOCs plays a key role in this process.
Ground-level observations of the formaldehyde-to-NO2 ratio (FNR) were utilized to assess the sensitivity of ground-level ozone formation. Analysis of FNR revealed that sites experiencing heavy ozone pollution exhibited lower FNRs, indicating a VOC-limited regime, while sites with lighter ozone pollution were categorized into a transitional regime. Furthermore, it is recommended to establish a scientific control mechanism for both NOX and VOCs, with special attention to formaldehyde, acetaldehyde, and acetone and their alkene precursors. Additionally, considering the regional nature of pollution, this study suggests that carbonyl compound pollution is influenced by mutual transport among cities within the CPUA, notably along the MY–DY–CDHKY route. Establishing a collaborative prevention and control mechanism among cities within the CPUA and neighboring provinces and cities is crucial to effectively address carbonyl compounds and ozone pollution in the region in the future.
Observational data including meteorological parameters and air pollutants used in this study are available from the corresponding authors upon request (lihong@craes.org.cn).
The supplement related to this article is available online at https://doi.org/10.5194/acp-25-1899-2025-supplement.
HoL and JB designed this study. XZ, ZW, JB, LZ, QT, and FY coordinated the selection of field observation sites, including locations for both VOC and carbonyl grid sampling. QT and HeL supported the collection of carbonyls at one site. ZW and XZ assisted in carbonyl sampling. XZ and YL assisted in carbonyl sample analysis and data collection. LZ and HeL organized the analysis of VOC measurements. JQ, JC, and LD provided support in project funding application. JB performed the data analysis and wrote the paper with contributions from all co-authors. HoL reviewed the paper, provided comments, and finalized it.
The contact author has declared that none of the authors has any competing interests.
Publisher's note: Copernicus Publications remains neutral with regard to jurisdictional claims made in the text, published maps, institutional affiliations, or any other geographical representation in this paper. While Copernicus Publications makes every effort to include appropriate place names, the final responsibility lies with the authors.
The authors would like to express their sincere appreciation to Keding Lu and Xin Li of Peking University for their organization of the intensive field observation experiment on the formation mechanisms of photochemical pollution in summer in the CPUA of China. They also want to show their deep gratitude to Yulei Ma, Tianli Song, Xiaodong Wu, Ning Wang, and He Zijun Liu of Sichuan University, as well as Xin Zhang (female) and Hefan Liu of Chengdu Academy of Environmental Protection Sciences for their help in sampling. They are also grateful to Liping Liu of Sichuan Agricultural University in Ya'an City, Kaiyao Lv of Mianyang High-tech Zone Management Committee, Yong Xiao of Deyang Municipal Education Bureau, Ying Ni of Meishan Ecological Environment Bureau, Aihua Zou of Leshan Ecological Environment Bureau, and Chuhan Wang of the Chinese Academy of Environmental Sciences for their substantial support during field observations. Special thanks are given to Zhen He and Manfei Yin of the Chinese Academy of Environmental Sciences for their assistance in analyzing samples from the XJ site.
This research has been supported by the research project on “Analysis of Multiple Causes of Atmospheric Ozone Pollution in Urban Agglomerations of Chengdu Plain and Development of Management, Prevention, and Control System” of the Sichuan Academy of Environmental Sciences (grant no. 510201201905430).
This paper was edited by Rob MacKenzie and reviewed by Rob MacKenzie and one anonymous referee.
Altshuller, A. P. and Cardelino, C.: Atmospheric chemistry of VOCs and NOx: Implications for ozone formation, Environ. Sci. Technol., 27, 1104–1117, https://doi.org/10.1021/es00043a001, 1993.
Atkinson, R. and Arey, J.: Atmospheric degradation of volatile organic compounds, Chem. Rev., 103, 4605–4638, https://doi.org/10.1021/cr0206420, 2003.
Bao, J., Li, H., Wu, Z., Zhang, X., Zhang, H., Li, Y., Qian, J., Chen, J., and Deng, L.: Atmospheric carbonyls in a heavy ozone pollution episode at a metropolis in Southwest China: Characteristics, health risk assessment, sources analysis, J. Environ. Sci., 113, 40–54, https://doi.org/10.1016/j.jes.2021.05.029, 2022.
Cardelino, C. and Chameides, W.: An observation-based model for analyzing ozone precursor relationships in the urban atmosphere, J. Air Waste Manage., 45, 161–180, 1995.
Coggon, M. M., Veres, P. R., Yuan, B., Koss, A. R., Warneke, C., Gilman, J. B., Lerner, B. M., Peischl, J., Aikin, K. C., Stockwell, C. E., Hatch, L. E., Ryerson, T. B., and de Gouw, J. A.: Emissions of organic carbonyl compounds from biomass burning: A global source of reactive carbon to the atmosphere, Environ. Sci. Technol., 53, 11401–11412, 2019.
da Silva, D. B. N., Martins, E. M., and Corrêa, S. M.: Role of carbonyls and aromatics in the formation of tropospheric ozone in Rio de Janeiro, Brazil, Environ. Monit. Assess., 188, 289, https://doi.org/10.1007/s10661-016-5278-3, 2016.
Duan, J., Tan, J., Yang, L., Wu, S., and Hao, J.: Concentration, sources and ozone formation potential of volatile organic compounds (VOCs) during ozone episode in Beijing, Atmos. Res., 88, 25–35, https://doi.org/10.1016/j.atmosres.2007.09.004, 2008.
Duan, J., Guo, S., Tan, J., Wang, S., and Chai, F.: Characteristics of atmospheric carbonyls during haze days in Beijing, China, Atmos. Res., 114–115, 17–27, https://doi.org/10.1016/j.atmosres.2012.05.010, 2012.
Fu, T.-M., Jacob, D. J., Wittrock, F., Burrows, J. P., Vrekoussis, M., and Henze, D. K.: Global budgets of atmospheric glyoxal and methylglyoxal, and implications for formation of secondary organic aerosols, J. Geophys. Res.-Atmos., 113, D15303, https://doi.org/10.1029/2007JD009505, 2008.
Fuchs, H., Tan, Z., Lu, K., Bohn, B., Broch, S., Brown, S. S., Dong, H., Gomm, S., Häseler, R., He, L., Hofzumahaus, A., Holland, F., Li, X., Liu, Y., Lu, S., Min, K.-E., Rohrer, F., Shao, M., Wang, B., Wang, M., Wu, Y., Zeng, L., Zhang, Y., Wahner, A., and Zhang, Y.: OH reactivity at a rural site (Wangdu) in the North China Plain: contributions from OH reactants and experimental OH budget, Atmos. Chem. Phys., 17, 645–661, https://doi.org/10.5194/acp-17-645-2017, 2017.
Grosjean, D. and Seinfeld, J. H.: Parameterization of the formation potential of secondary organic aerosols, Atmos. Environ., 23, 1733–1747, https://doi.org/10.1016/0004-6981(89)90058-9, 1989.
Guo, H., Wang, T., Simpson, I. J., Blake, D. R., Yu, X. M., Kwok, Y. H., and Li, Y. S.: Source contributions to ambient VOCs and CO at a rural site in eastern China, Atmos. Environ., 38, 4551–4560, https://doi.org/10.1016/j.atmosenv.2004.05.004, 2004.
Hallquist, M., Wenger, J. C., Baltensperger, U., Rudich, Y., Simpson, D., Claeys, M., Dommen, J., Donahue, N. M., George, C., Goldstein, A. H., Hamilton, J. F., Herrmann, H., Hoffmann, T., Iinuma, Y., Jang, M., Jenkin, M. E., Jimenez, J. L., Kiendler-Scharr, A., Maenhaut, W., McFiggans, G., Mentel, Th. F., Monod, A., Prévôt, A. S. H., Seinfeld, J. H., Surratt, J. D., Szmigielski, R., and Wildt, J.: The formation, properties and impact of secondary organic aerosol: current and emerging issues, Atmos. Chem. Phys., 9, 5155–5236, https://doi.org/10.5194/acp-9-5155-2009, 2009.
Ho, K. F., Ho, S. S. H., Huang, R.-J., Dai, W. T., Cao, J. J., Tian, L., and Deng, W. J.: Spatiotemporal distribution of carbonyl compounds in China, Environ. Pollut., 197, 316–324, https://doi.org/10.1016/j.envpol.2014.11.014, 2015.
Hong, Q., Zhu, L., Xing, C., Hu, Q., Lin, H., Zhang, C., Zhao, C., Liu, T., Su, W., and Liu, C.: Inferring vertical variability and diurnal evolution of O3 formation sensitivity based on the vertical distribution of summertime HCHO and NO2 in Guangzhou, China, Sci. Total Environ., 827, 154045, https://doi.org/10.1016/j.scitotenv.2022.154045, 2022.
Hu, J., Wang, P., Ying, Q., Zhang, H., Chen, J., Ge, X., Li, X., Jiang, J., Wang, S., Zhang, J., Zhao, Y., and Zhang, Y.: Modeling biogenic and anthropogenic secondary organic aerosol in China, Atmos. Chem. Phys., 17, 77–92, https://doi.org/10.5194/acp-17-77-2017, 2017.
Jiang, Z., Grosselin, B., Daële, V., Mellouki, A., and Mu, Y.: Seasonal, diurnal and nocturnal variations of carbonyl compounds in the semi-urban environment of Orléans, France, J. Environ. Sci., 40, 84–91, https://doi.org/10.1016/j.jes.2015.11.016, 2016.
Kanjanasiranont, N., Prueksasit, T., Morknoy, D., Tunsaringkarn, T., Sematong, S., Siriwong, W., Zapaung, K., and Rungsiyothin, A.: Determination of ambient air concentrations and personal exposure risk levels of outdoor workers to carbonyl compounds and BTEX in the inner city of Bangkok, Thailand, Atmos. Pollut. Res., 7, 268–277, https://doi.org/10.1016/j.apr.2015.10.008, 2016a.
Kanjanasiranont, N., Prueksasit, T., Morknoy, D., Tunsaringkarn, T., Sematong, S., Siriwong, W., Zapaung, K., and Rungsiyothin, A.: Determination of ambient air concentrations and personal exposure risk levels of outdoor workers to carbonyl compounds and BTEX in the inner city of Bangkok, Thailand, Atmos. Pollut. Res., 7, 268–277, https://doi.org/10.1016/j.apr.2015.10.008, 2016b.
Li, N., Fu, T.-M., Cao, J., Lee, S., Huang, X.-F., He, L.-Y., Ho, K.-F., Fu, J. S., and Lam, Y.-F.: Sources of secondary organic aerosols in the Pearl River Delta region in fall: Contributions from the aqueous reactive uptake of dicarbonyls, Atmos. Environ., 76, 200–207, https://doi.org/10.1016/j.atmosenv.2012.12.005, 2013.
Li, Y., Shao, M., Lu, S., Chang, C.-C., and Dasgupta, P. K.: Variations and sources of ambient formaldehyde for the 2008 Beijing Olympic games, Atmos. Environ., 44, 2632–2639, https://doi.org/10.1016/j.atmosenv.2010.03.045, 2010.
Ling, Z. H., Zhao, J., Fan, S. J., and Wang, X. M.: Sources of formaldehyde and their contributions to photochemical O3 formation at an urban site in the Pearl River Delta, southern China, Chemosphere, 168, 1293–1301, https://doi.org/10.1016/j.chemosphere.2016.11.140, 2017.
Liu, J., Li, X., Tan, Z., Wang, W., Yang, Y., Zhu, Y., Yang, S., Song, M., Chen, S., Wang, H., Lu, K., Zeng, L., and Zhang, Y.: Assessing the Ratios of Formaldehyde and Glyoxal to NO2 as Indicators of O3–NOx–VOC Sensitivity, Environ. Sci. Technol., 55, 10935–10945, https://doi.org/10.1021/acs.est.0c07506, 2021.
Lou, S., Holland, F., Rohrer, F., Lu, K., Bohn, B., Brauers, T., Chang, C. C., Fuchs, H., Häseler, R., Kita, K., Kondo, Y., Li, X., Shao, M., Zeng, L., Wahner, A., Zhang, Y., Wang, W., and Hofzumahaus, A.: Atmospheric OH reactivities in the Pearl River Delta – China in summer 2006: measurement and model results, Atmos. Chem. Phys., 10, 11243–11260, https://doi.org/10.5194/acp-10-11243-2010, 2010.
Luecken, D. J., Hutzell, W. T., Strum, M. L., and Pouliot, G. A.: Regional sources of atmospheric formaldehyde and acetaldehyde, and implications for atmospheric modeling, Atmos. Environ., 47, 477–490, https://doi.org/10.1016/j.atmosenv.2011.10.005, 2012.
Lui, K. H., Ho, S. S. H., Louie, P. K. K., Chan, C. S., Lee, S. C., Hu, D., Chan, P. W., Lee, J. C. W., and Ho, K. F.: Seasonal behavior of carbonyls and source characterization of formaldehyde (HCHO) in ambient air, Atmos. Environ., 152, 51–60, https://doi.org/10.1016/j.atmosenv.2016.12.004, 2017.
Meng, X. Y., Gong, Z. Y., Ye, C. X., Wang, S., Sun, H., and Zhang, X.: Characteristics of ozone concentration changes in 74 cities from 2013 to 2016, China Environmental Monitoring, 33, 101–108, https://doi.org/10.19316/j.issn.1002-6002.2017.05.15, 2017 (in Chinese).
Monks, P. S., Archibald, A. T., Colette, A., Cooper, O., Coyle, M., Derwent, R., Fowler, D., Granier, C., Law, K. S., Mills, G. E., Stevenson, D. S., Tarasova, O., Thouret, V., von Schneidemesser, E., Sommariva, R., Wild, O., and Williams, M. L.: Tropospheric ozone and its precursors from the urban to the global scale from air quality to short-lived climate forcer, Atmos. Chem. Phys., 15, 8889–8973, https://doi.org/10.5194/acp-15-8889-2015, 2015.
Murillo, J. H., Marín, J. F. R., and Román, S. R.: Determination of carbonyls and their sources in three sites of the metropolitan area of Costa Rica, Central America, Environ. Monit. Assess., 184, 53–61, https://doi.org/10.1007/s10661-011-1946-5, 2012.
Pang, X. and Mu, Y.: Seasonal and diurnal variations of carbonyl compounds in Beijing ambient air, Atmos. Environ., 40, 6313–6320, https://doi.org/10.1016/j.atmosenv.2006.05.044, 2006.
Rao, Z., Chen, Z., Liang, H., Huang, L., and Huang, D.: Carbonyl compounds over urban Beijing: Concentrations on haze and non-haze days and effects on radical chemistry, Atmos. Environ., 124, 207–216, https://doi.org/10.1016/j.atmosenv.2015.06.050, 2016.
Sahu, L. K. and Saxena, P.: High time-resolved volatile organic compounds measurements at an urban location in India: Sources, variability, and role in ozone formation, Environ. Sci. Pollut. Res., 22, 3975–3986, 2015.
Schroeder, J. R., Crawford, J. H., Fried, A., Walega, J., Weinheimer, A., Wisthaler, A., Müller, M., Mikoviny, T., Chen, G., Shook, M., Blake, D. R., and Tonnesen, G. S.: New insights into the column CH2 O/NO2 ratio as an indicator of near-surface ozone sensitivity, J. Geophys. Res.-Atmos., 122, 8885–8907, https://doi.org/10.1002/2017JD026781, 2017.
Shao, M., Lu, S., Liu, Y., Xie, X., Chang, C., Huang, S., and Chen, Z.: Volatile organic compounds measured in summer in Beijing and their role in ground-level ozone formation, J. Geophys. Res.-Atmos., 114, D00G06, https://doi.org/10.1029/2008JD010863, 2009.
Shen, X., Zhao, Y., Chen, Z., and Huang, D.: Heterogeneous reactions of volatile organic compounds in the atmosphere, Atmos. Environ., 68, 297–314, https://doi.org/10.1016/j.atmosenv.2012.11.027, 2013.
Tan, Z., Lu, K., Jiang, M., Su, R., Dong, H., Zeng, L., Xie, S., Tan, Q., and Zhang, Y.: Exploring ozone pollution in Chengdu, southwestern China: A case study from radical chemistry to O3-VOC-NOx sensitivity, Sci. Total Environ., 636, 775–786, https://doi.org/10.1016/j.scitotenv.2018.04.286, 2018.
Tonnesen, G. S. and Dennis, R. L.: Analysis of radical propagation efficiency to assess ozone sensitivity to hydrocarbons and NOx: 2. Long-lived species as indicators of ozone concentration sensitivity, J. Geophys. Res.-Atmos., 105, 9227–9241, https://doi.org/10.1029/1999JD900372, 2000.
Vermeuel, M. P., Novak, G. A., Alwe, H. D., Hughes, D. D., Kaleel, R., Dickens, A. F., Kenski, D., Czarnetzki, A. C., Stone, E. A., Stanier, C. O., Pierce, R. B., Millet, D. B., and Bertram, T. H.: Sensitivity of Ozone Production to NOx and VOC Along the Lake Michigan Coastline, J. Geophys. Res.-Atmos., 124, 10989–11006, https://doi.org/10.1029/2019JD030842, 2019.
Wang, C., Huang, X.-F., Han, Y., Zhu, B., and He, L.-Y.: Sources and Potential Photochemical Roles of Formaldehyde in an Urban Atmosphere in South China, J. Geophys. Res.-Atmos., 122, 11934–11947, https://doi.org/10.1002/2017JD027266, 2017.
Wang, Y., Guo, H., Zou, S., Lyu, X., Ling, Z., Cheng, H., and Zeren, Y.: Surface O3 photochemistry over the South China Sea: Application of a near-explicit chemical mechanism box model, Environ. Pollut., 234, 155–166, https://doi.org/10.1016/j.envpol.2017.11.001, 2018.
Wang, C., Zhang, X., Wu, M., Gao, J., Gao, R., Bi, F., Wu, Z., Zhao, D., Hui, Y., Chai, F., and Li, H.: Pollution characteristics and source analysis of carbonyl compounds in suburban ambient air of Shenyang, Res. Environ. Sci., 33, 2771–2784, https://doi.org/10.13198/j.issn.1001-6929.2020.03.39, 2020 (in Chinese).
Xu, C. X., Chen, J. H., Li, Y., He, M., Feng, X. Q., Han, L., Liu, Z., and Qian, J.: Anthropogenic air pollutant emission inventory and characteristics in Sichuan Province based on the second national pollution source census data, Environ. Sci., 41, 4482–4494, https://doi.org/10.13227/j.hjkx.202002162, 2020 (in Chinese).
Xue, L., Gu, R., Wang, T., Wang, X., Saunders, S., Blake, D., Louie, P. K. K., Luk, C. W. Y., Simpson, I., Xu, Z., Wang, Z., Gao, Y., Lee, S., Mellouki, A., and Wang, W.: Oxidative capacity and radical chemistry in the polluted atmosphere of Hong Kong and Pearl River Delta region: analysis of a severe photochemical smog episode, Atmos. Chem. Phys., 16, 9891–9903, https://doi.org/10.5194/acp-16-9891-2016, 2016.
Xue, L., Wang, T., Louie, P. K. K., Luk, C. W. Y., Blake, D. R., Gao, J., and Lee, S. H.: Increasing external effects negate local efforts to control ozone air pollution: A case study of Hong Kong and implications for other Chinese cities, Environ. Sci. Technol., 47, 10299–10305, 2013.
Xue, L. K., Wang, T., Guo, H., Blake, D. R., Tang, J., Zhang, X. C., Saunders, S. M., and Wang, W. X.: Sources and photochemistry of volatile organic compounds in the remote atmosphere of western China: results from the Mt. Waliguan Observatory, Atmos. Chem. Phys., 13, 8551–8567, https://doi.org/10.5194/acp-13-8551-2013, 2013.
Xue, L. K., Wang, T., Gao, J., Ding, A. J., Zhou, X. H., Blake, D. R., Wang, X. F., Saunders, S. M., Fan, S. J., Zuo, H. C., Zhang, Q. Z., and Wang, W. X.: Ground-level ozone in four Chinese cities: precursors, regional transport and heterogeneous processes, Atmos. Chem. Phys., 14, 13175–13188, https://doi.org/10.5194/acp-14-13175-2014, 2014.
Yang, X., Xue, L., Yao, L., Li, Q., Wen, L., Zhu, Y., Chen, T., Wang, X., Yang, L., Wang, T., Lee, S., Chen, J., and Wang, W.: Carbonyl compounds at Mount Tai in the North China Plain: Characteristics, sources, and effects on ozone formation, Atmos. Res., 196, 53–61, https://doi.org/10.1016/j.atmosres.2017.06.005, 2017.
Yang, X., Xue, L., Wang, T., Wang, X., Gao, J., Lee, S., Blake, D. R., Chai, F., and Wang, W.: Observations and Explicit Modeling of Summertime Carbonyl Formation in Beijing: Identification of Key Precursor Species and Their Impact on Atmospheric Oxidation Chemistry, J. Geophys. Res.-Atmos., 123, 1426–1440, https://doi.org/10.1002/2017JD027403, 2018.
Ye, Z., Xie, S., Wu, Y., Zhang, Y., Chen, T., and Li, Y.: Characterization of carbonyl compounds and their contributions to ozone and secondary organic aerosol formation in a megacity, Environ. Sci. Technol., 55, 9465–9474, 2021.
Yuan, B., Chen, W., Shao, M., Wang, M., Lu, S., Wang, Bin, Liu, Y., Chang, C.-C., and Wang, Boguang: Measurements of ambient hydrocarbons and carbonyls in the Pearl River Delta (PRD), China, Atmos. Res., 116, 93–104, https://doi.org/10.1016/j.atmosres.2012.03.006, 2012.
Zhang, X., Chen, Z. M., and Zhao, Y.: Laboratory simulation for the aqueous OH-oxidation of methyl vinyl ketone and methacrolein: significance to the in-cloud SOA production, Atmos. Chem. Phys., 10, 9551–9561, https://doi.org/10.5194/acp-10-9551-2010, 2010.
Zhang, X., Li, H., Zhang, C. L., Zhang, Y. J., He, Z., Gao, R., and Wang, W. X.: Optimization and preliminary application of detection methods for aldehydes and ketones in ambient air, Res. Environ. Sci., 32, 821–829, https://doi.org/10.13198/j.issn.1001-6929.2019.03.12, 2019 (in Chinese).
Zhang, X., Wu, Z., He, Z., Zhong, X., Bi, F., Li, Y., Gao, R., Li, H., and Wang, W.: Spatiotemporal patterns and ozone sensitivity of gaseous carbonyls at eleven urban sites in southeastern China, Sci. Total Environ., 824, 153719, https://doi.org/10.1016/j.scitotenv.2022.153719, 2022.
Zhang, Y., Wang, X., Wen, S., Herrmann, H., Yang, W., Huang, X., Zhang, Z., Huang, Z., He, Q., and George, C.: On-road vehicle emissions of glyoxal and methylglyoxal from tunnel tests in urban Guangzhou, China, Atmos. Environ., 127, 55–60, https://doi.org/10.1016/j.atmosenv.2015.12.017, 2016a.
Zhang, Z., Zhang, Y., Wang, X., Lü, S., Huang, Z., Huang, X., Yang, W., Wang, Y., and Zhang, Q.: Spatiotemporal patterns and source implications of aromatic hydrocarbons at six rural sites across China's developed coastal regions, J. Geophys. Res.-Atmos., 121, 6669–6687, https://doi.org/10.1002/2016JD025115, 2016b.
Zhou, Z., Tan, Q., Deng, Y., Lu, C., Song, D., Zhou, X., Zhang, X., and Jiang, X.: Source profiles and reactivity of volatile organic compounds from anthropogenic sources of a megacity in southwest China, Sci. Total Environ., 790, 148149, https://doi.org/10.1016/j.scitotenv.2021.148149, 2021.