the Creative Commons Attribution 4.0 License.
the Creative Commons Attribution 4.0 License.
 | 19 Dec 2025
Measurement report: Insights into seasonal dynamics and planetary boundary layer influences on aerosol chemical components in suburban Nanjing from one-year observation
Jialu Xu
Yingjie Zhang
Bin Zhu
Chunsong Lu
Yuanjian Yang
Junhui Zhang
Xiaofan Zuo
Zhanghanshu Han
Rui Zhang
Understanding the seasonal behavior of fine particles (PM2.5) and its chemical components is critical for improving air quality in the Yangtze River Delta (YRD), a densely populated and polluted region in China. While previous studies have addressed PM2.5 mass trends, the role of planetary boundary layer height (PBLH) in modulating chemical composition remains insufficiently explored. This study investigates seasonal variations and PBLH effects on PM2.5 chemical components based on year-round field measurements (December 2020–November 2021) at Nanjing University of Information Science and Technology. Annual mean PM2.5 mass concentration is , with winter peaks (48.3 µg m−3) and summer lows (20.4 µg m−3). Organic aerosol dominates PM2.5, followed by sulfate in warmer seasons and nitrate in winter. Stable meteorological conditions promote the accumulation of primary aerosols and nitrate. The accumulation of SOA and sulfate remains substantial under elevated PBLH conditions, owing to strong photochemical production, rendering them relatively insensitive to PBLH variations. In contrast, during cold and humid winters, shallow PBLH promotes nitrate buildup, which subsequently suppresses boundary layer development, forming positive feedback that accelerates nitrate concentration growth. Source apportionment reveals that the contrasting seasonal sources, shaped by both local chemistry and regional transport, emphasize the need for seasonally adaptive and region-specific emission control measures.
- Article
(8574 KB) - Full-text XML
- Companion paper
-
Supplement
(13459 KB) - BibTeX
- EndNote


Fine particulate matter (PM2.5), defined as particles with an aerodynamic diameter less than 2.5 µm, is a major environmental and public health concern due to its adverse effects on air quality, visibility, and human health. Exposure to PM2.5 has been linked to increased risks of respiratory and cardiovascular diseases, premature mortality, and reduced life expectancy (Pui et al., 2014; Beelen et al., 2015). The major components of PM2.5 include organic aerosol (OA), inorganic ions such as nitrate (), sulfate (), ammonium (), chloride (Chl), and black carbon (BC). Each of these components arises from distinct sources and formation pathways. For example, BC is emitted directly from incomplete combustion of fossil fuels and biomass, while nitrate and sulfate are typically formed through secondary chemical processes involving the oxidation of nitrogen oxides (NOx) and sulfur dioxide (SO2), respectively.
Secondary inorganic aerosols exhibit strong seasonal dependencies. Nitrate formation is particularly enhanced during cold and humid seasons, as low temperature (T) and high relative humidity (RH) promote heterogeneous reactions, especially the hydrolysis of nitrogen pentoxide (N2O5) on aerosol surfaces (Wang et al., 2015). These reactions are more efficient under stable winter meteorology, leading to elevated nitrate concentrations in many mid- and high- latitude continental regions (Alexander et al., 2020). In contrast, sulfate formation occurs via both gas-phase oxidation (primarily by OH radicals) and aqueous-phase pathways involving oxidants such as hydrogen peroxide (H2O2), ozone (O3), and nitrogen dioxide (NO2). The aqueous-phase route tends to dominate under high RH and cloud presence, especially in summer, when photochemistry enhances the production of oxidants (Zhang et al., 2016; Liu et al., 2021). Thus, sulfate exhibits a different seasonal pattern, often peaking in warm, humid, and photochemically active periods. Ammonium, as a crucial role of neutralizing agent, regulates aerosol acidity and modulates the gas-particle partitioning of nitrate and sulfate (Wang et al., 2016; Xian et al., 2023)
OA, especially secondary organic aerosol (SOA), presents additional complexity due to its wide variety of precursors and formation mechanisms. Source apportionment of OA is commonly achieved using statistical tools such as positive matrix factorization (PMF) and the multilinear engine (ME-2), which deconvolute time-resolved mass spectra into distinct factors associated with sources or processes (Ulbrich et al., 2009; Canonaco et al., 2013). High-resolution instruments like the aerosol chemical speciation monitor (ACSM) and aerosol mass spectrometer (AMS) have been widely used to study aerosol chemical composition. For example, Zhang et al. (2017) reported that during autumn in Nanjing, primary organic aerosol (POA) in PM2.5 originates from traffic, cooking, and biomass burning, while SOA formation is driven by RH. In contrast, summertime SOA formation in rural Yangtze River Delta (YRD) areas is largely photochemically driven (Huang et al., 2020). These findings highlight the strong seasonal and spatial variability of both organic and inorganic PM2.5 components.
The planetary boundary layer height (PBLH) is a key meteorological parameter that influences pollutant dispersion and vertical mixing. A well-established negative correlation exists between PBLH and near-surface PM2.5 concentrations (Minoura and Shimo, 2011; Wang et al., 2018; Han et al., 2024). Under low PBLH and stagnant conditions, primary pollutants such as BC and POA can accumulate rapidly. Meanwhile, secondary aerosols respond more dynamically to PBLH due to their dependence on atmospheric oxidation, humidity, and solar radiation. For instance, low PBLH in winter exacerbates BC accumulation in the YRD (Lu et al., 2019), while high PBLH in the North China Plain (NCP) facilitates SO2-to-sulfate conversion, and low PBLH promotes nitrate enrichment (Si et al., 2019). In southern cities like Guangzhou, high PBLH promotes SOA formation by enhancing O3 transport and particle-phase oxidation processes (Li et al., 2024).
In recent decades, rapid industrialization and urbanization in China have exacerbated PM2.5 pollution, especially in highly developed regions such as the YRD. As one of the most densely populated and economically active areas in China, the YRD suffers from frequent haze episodes and elevated PM2.5 levels. Nanjing, a key city in the YRD, serves as a representative urban environment where PM2.5 pollution displays complex seasonal variations and diverse chemical composition. Numerous studies have highlighted that PM2.5 in this region is influenced by both local sources and regional transport, modulated by meteorological factors such as T, RH, and wind patterns (Sun et al., 2015; Zhu et al., 2021) Thus, Nanjing serves as an ideal representative region for understanding the complex interactions between emissions, atmospheric processes, and meteorology in the YRD.
Research on the seasonal and spatial variability of PM2.5 components has advanced. Remote sensing technologies, such as micro-pulse lidar (MPL), now enable high-resolution PBLH estimation based on aerosol backscatter profiles (Su et al., 2020; Han et al., 2024; Yang et al., 2025). However, many studies focus on bulk PM2.5 mass or limited chemical species, often rely on simulation data and some studies feature short observation periods. There remains a need for comprehensive, long-term and high-temporal-resolution observational studies in the YRD that resolve the full chemical profile of PM2.5 and quantify its modulation by planetary boundary layer processes across seasons especially under current emission control policies.
To address these gaps, this study conducted a comprehensive one-year field campaign in Nanjing from December 2020 to November 2021. Continuous online measurements of PM2.5 chemical components and PBLH are obtained using a quadrupole aerosol chemical speciation monitor (Q-ACSM), aethalometer, and MPL. The objectives are to (1) characterize the seasonal and diurnal variations of PM2.5 chemical components, (2) quantify the influence of PBLH on component-specific mass concentrations, and (3) identify potential source regions using positive matrix factorization and potential source contribution function (PSCF) analysis.
2.1 Campaign and measurement site
A comprehensive field campaign was conducted from 2020 to 2021 at the special test field of national integrated meteorological observation on the campus of Nanjing University of Information Science and Technology (NUIST; 32°13′ N, 118°46′ E, altitude: 22 m) in the northern suburbs of Nanjing, China (Fig. 1a). This observation experiment aims to investigate the effects of PBLH on the chemical composition and seasonal evolution of PM2.5, while also exploring broader atmospheric processes, including aerosol dynamics and boundary layer development. The NUIST site, located in a suburban area influenced by a mix of urban, industrial, and regional emission sources (Fig. 1b), is well-suited to represent the complex pollution profile of the YRD (Song et al., 2023). For this study, a one-year subset of high-temporal-resolution aerosol measurement data, covering December 2020 to November 2021, is analysed to examine the seasonal characteristics of PM2.5 components and their responses to PBLH variations.
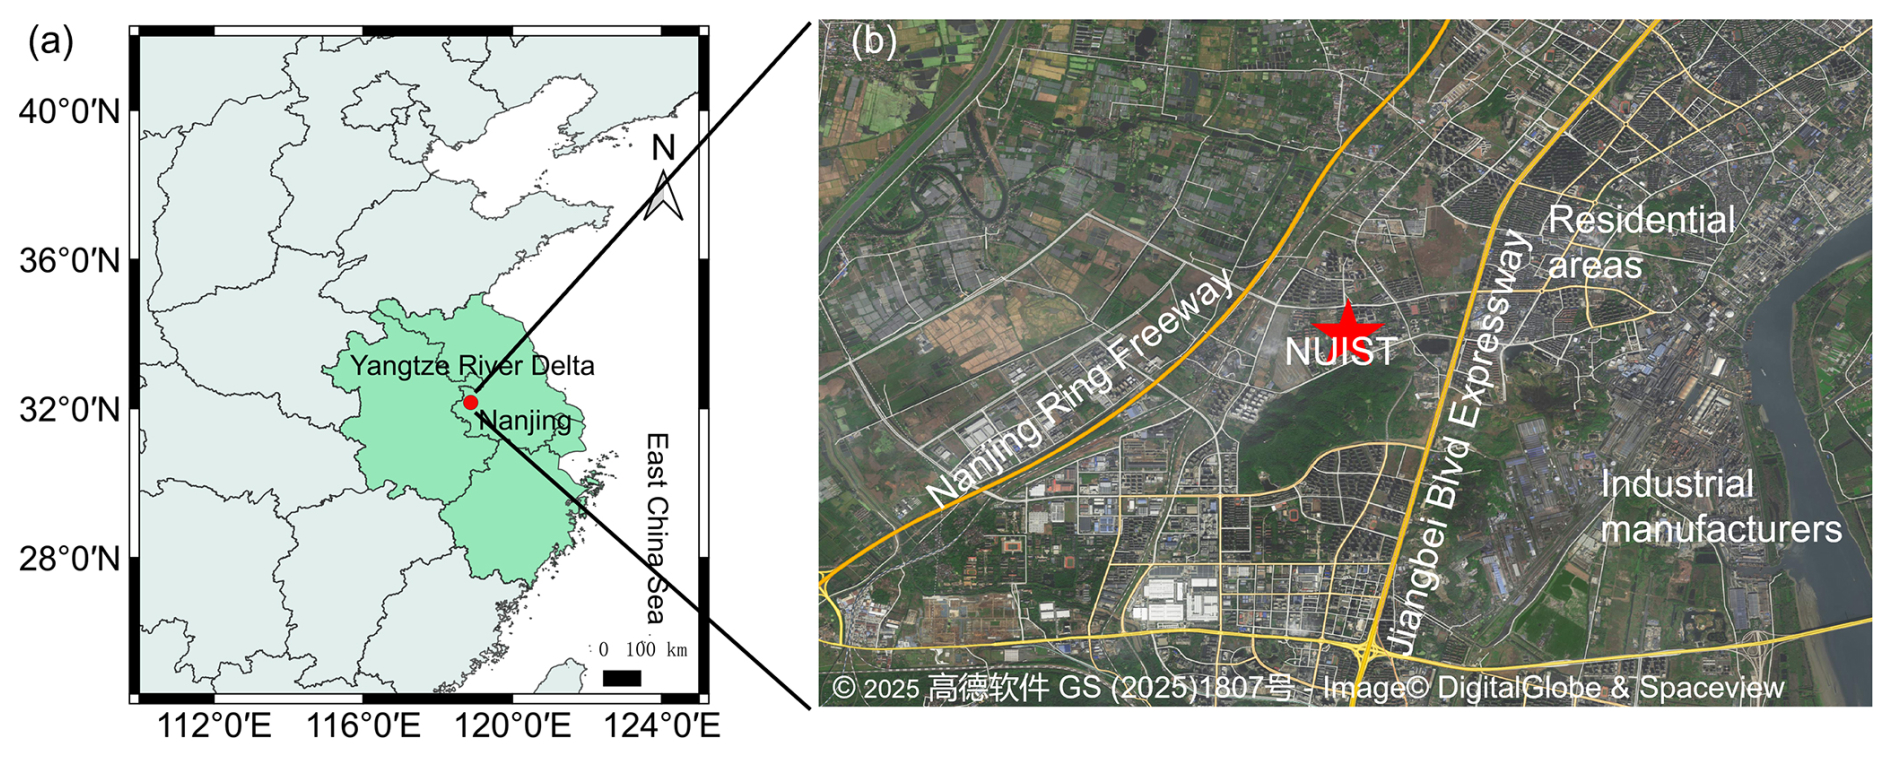
Figure 1(a) Geographical location of Nanjing in the Yangtze River Delta and (b) the distribution of pollution sources around the NUIST observation site (source: Gaode Map, GS (2025)1807). The base map contains data from DigitalGlobe and Spaceview.
2.2 Instruments
A Q-ACSM, equipped with a PM2.5 lens system, is used to measure non-refractory PM2.5 (NR-PM2.5) components, including organic aerosol, nitrate, sulfate, ammonium, and chloride. The Q-ACSM vaporizes and ionizes aerosol samples at 600 °C in an ionization chamber, with the resulting aerosol mass spectra analysed by a quadrupole mass spectrometer, providing mass concentrations at a 15 min time resolution (Wang et al., 2021). The mass concentration of equivalent BC is calculated from a seven-wavelength aethalometer (model AE-33, Magee Scientific) at the BC6 channel based on its optical absorption properties. Both the Q-ACSM and aethalometer are connected to a PM2.5 cyclone inlet installed on the rooftop (∼4 m above ground) of the sampling station. A silica gel dryer is installed between the cyclone and instruments to keep the RH of the sample flow below 40 %. In this study, the sum of aerosol mass concentrations measured by Q-ACSM and aethalometer is defined as the PM2.5 mass concentration.
PBLH data are derived from a micro-pulse lidar (MPL-4B, Sigma Space). The laser emission wavelength of MPL is 532 nm, and the laser repetition rate is 2500 Hz. Raw MPL data undergo corrections for background subtraction, saturation, overlap, post-pulse effects, and range to obtain normalized signals (Campbell et al., 2002). PBLH is determined as the height of the first occurrence of a negative gradient in the backscattering coefficient, following methodologies described in Huang et al. (2023) and Han et al. (2024). The retrieval of PBLH using this method is subject to uncertainties, primarily including interference from aerosol/cloud layers above planetary boundary layer and a blind zone below 270 m. Importantly, these uncertainties predominantly affect the absolute value of PBLH. Given that the study emphasizes the relative changes, diurnal cycles, and seasonal trends of PBLH and its correlation with aerosol composition, the conclusions remain robust.
Routine calibration and maintenance are performed throughout the observation period, with data from instrument malfunctions, calibrations, and maintenance periods excluded from analysis. Meteorological parameters, including T, RH, wind direction (WD), wind speed (WS), and precipitation, are obtained from the meteorological observatory at NUIST. Gaseous pollutant data (CO, O3, SO2, and NO2) are sourced from the Maigaoqiao site of the China National Environmental Monitoring Centre (CNEMC, https://air.cnemc.cn:18014/, last access: 31 July 2025), located approximately 14 km southeast of the NUIST site.
2.3 ACSM data analysis
The NR-PM2.5 data measured by Q-ACSM are processed with the ACSM Local software written in Igor Pro to derive the mass concentration, chemical composition, and mass spectra of organic and inorganic species. The calibration is conducted using pure ammonium nitrate and ammonium sulfate particles selected by a differential mobility analyser (DMA, TSI) and counted by a condensation particle counter (Ng et al., 2011). Based on the calibration, the relative ionization efficiency (RIE) is determined to be 5.73 for ammonium, 1 for sulfate, and for nitrate as the response factor. Default RIE values are applied for nitrate (1.1), OA (1.4), and chloride (1.3) (Canagaratna et al., 2007). A newly developed capture vaporizer replaces the standard vaporizer to eliminate the incomplete detection of aerosols from particle bounce, resulting in a collection efficiency (CE) of 1 (Hu et al., 2017).
PMF analysis of ACSM organic mass spectra is performed using the PMF Evaluation Tool (PET v2.08A) in Igor Pro. Detailed PMF procedures are described in Ulbrich et al. (2009). Ions with 's between 12 and 148 are included for PMF analysis. Data and error matrices are preprocessed according to Zhang et al. (2016). To account for seasonal variations in photochemical aging and primary emissions, which violate PMF's assumption of constant mass spectral profiles, PMF analysis is performed separately on seasonal datasets (Sun et al., 2018). Due to the absence of independent tracers for validation, the default solution (fpeak=0) is selected for each season. This approach resolves OA into POA and SOA, constrained by complex emission backgrounds and instrument sensitivity limits.
Correlation coefficients between OA factors and tracers are shown in Fig. S1 in the Supplement. POA exhibits strong correlations with BC and NO2, reflecting primary emission sources such as combustion. SOA shows a strong correlation with sulfate. Seasonal mass spectral profiles and time series of OA factors (Fig. S2 in the Supplement) align with those reported by Zhang et al. (2017) measured at another site in Nanjing. The SOA profiles feature a peak at 44, attributed to oxidized organic fragments () from aged organics (Aiken et al., 2009). POA spectra are dominated by hydrocarbon ions ( at 27, 41, 55, 69 and at 29, 43, 57, 71), indicative of coal, gasoline, and diesel combustion (Mohr et al., 2012; Crippa et al., 2013). Elevated 44 in POA spectra suggests atmospheric aging of primary aerosols.
2.4 Potential source contribution function analysis
To identify potential source regions contributing to PM2.5 and its chemical components, 48 h backward trajectories are calculated at a release height of 300 m using the Hybrid Single-Particle Lagrangian Integrated Trajectory (HYSPLIT) model (Wang, 2014). The HYSPLIT model utilizes hourly Global Data Assimilation System (GDAS) reanalysis data from the National Centers for Environmental Prediction (NCEP) as meteorological inputs. The PSCF analysis, a widely used method for pinpointing upwind emission sources based on HYSPLIT trajectories (Cheng et al., 1993), is applied to quantify the probability that air masses transported emissions to the NUIST receptor site. The study domain covers all trajectory endpoints within 20–45° N and 105–130° E, divided into 1°×1° grid cells.
The PSCF value for each cell (i,j) is defined as: , where the nij denotes the total number of trajectory endpoints in cell (i,j), and mij represents endpoints exceeding the 75th percentile concentration threshold. To reduce uncertainties arising from grid cells with a limited number of points, a weighting function proposed by Polissar et al. (1999) is applied. The areas with high PSCF values indicate a potential source of high concentrations of chemical components.
3.1 Overview
Figure 2 illustrates pronounced seasonal variations in PM2.5 chemical components, PBLH, and T during the observation period, with RH showing relatively stable monthly values. The YRD exhibits consistently high RH levels, with an annual average of ∼71 % and monthly means exceeding 60 % year-round. The annual average PM2.5 concentration () is similar with measurements from the Shanghai's Pudong New Area in the eastern YRD (Fu et al., 2022). Monthly average PM2.5 mass concentrations range from 20.4 to 48.3 µg m−3 (Fig. 2a), with accumulation enhanced under high RH (Fig. S3a in the Supplement), low WS (Fig. S3b), and suppressed PBLH (Fig. S3c), which collectively inhibit vertical dispersion and horizontal transport of pollutants.
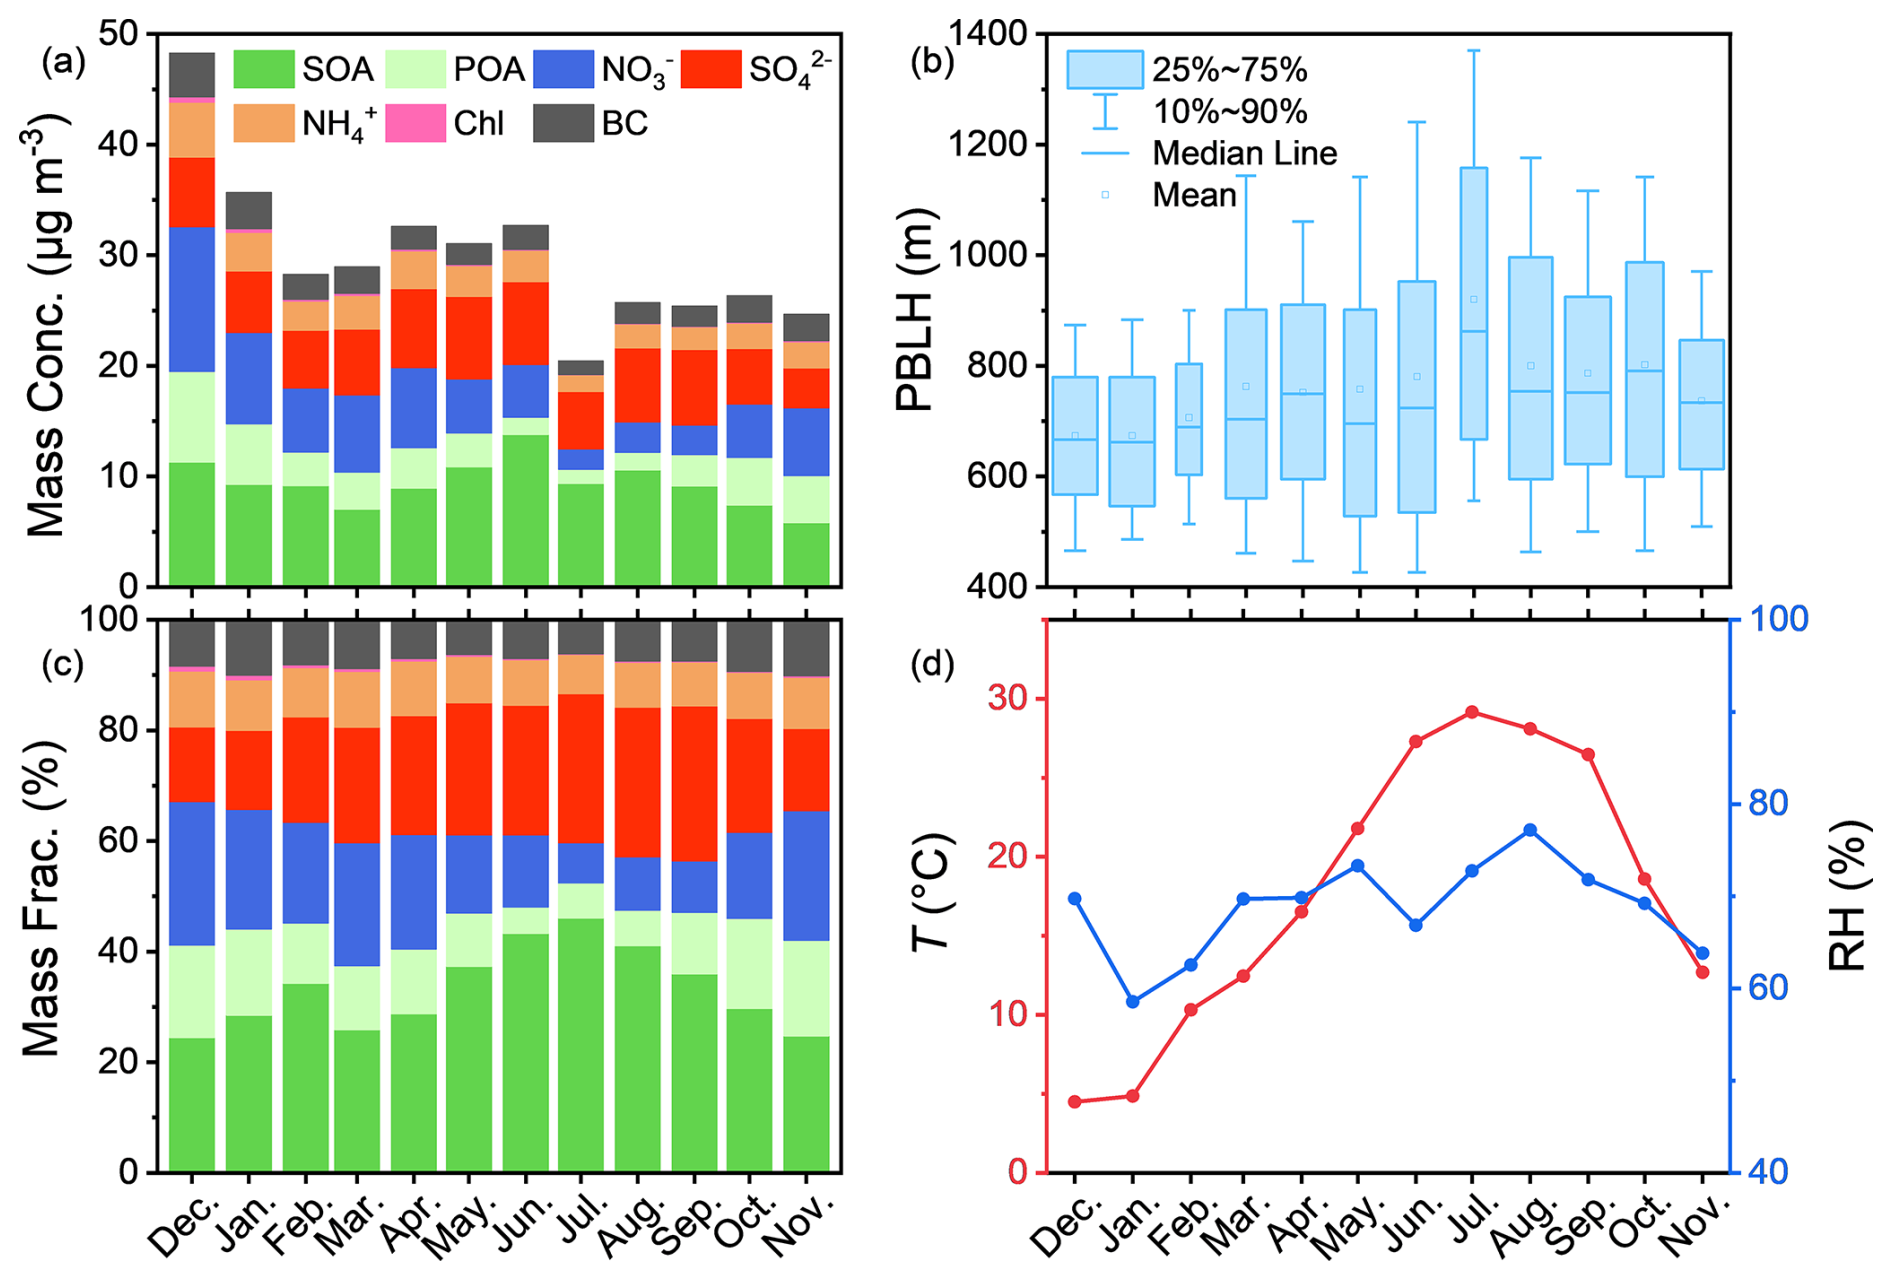
Figure 2Monthly average (a) mass concentration and (c) mass fraction of diverse chemical components of PM2.5. Monthly average (b) PBLH, (d) T, and RH.
The highest monthly average PM2.5 mass concentration (48.3 µg m−3) occurs in December, driven by frequent winter haze episodes in the YRD (Zhong et al., 2018) and limited precipitation (Fig. S4c4 in the Supplement), which reduces aerosol wet scavenging. Concurrently, the lowest monthly average PBLH (673.4 m, Fig. 2b) restricts pollutant diffusion. In contrast, February exhibits lower PM2.5 mass concentration due to six rainfall days (Fig. S4c4) and higher WS (Fig. S4e4), enhancing wet scavenging and dispersion (Wu et al., 2022). The lowest PM2.5 mass concentration (20.4 µg m−3) is recorded in July, coinciding with peak PBLH (920.3 m), WS (2.02 m s−1), and rainfall frequency (15 rainfall days, Fig. S4c2), which promotes wet deposition and pollutant dispersion.
OA dominates PM2.5 composition in most months, followed by sulfate in spring, summer, and autumn, and nitrate in winter (Fig. 2c), consistent with prior Nanjing observations (Wang et al., 2016; Xian et al., 2023). POA mass concentration and fraction peak in winter, followed by autumn, spring, and summer, with the highest values under low T and high RH (Fig. 3a and b). These conditions correspond to high PM2.5, low WS, and suppressed PBLH (Fig. S3), indicating that stable meteorological conditions favor primary aerosol accumulation. Similar RH and T dependences are observed for BC and chloride (Fig. S5 in the Supplement). At low T and low RH, secondary aerosol formation is suppressed, increasing the POA mass fraction in PM2.5 without significant concentration changes (Fig. 3a and b).
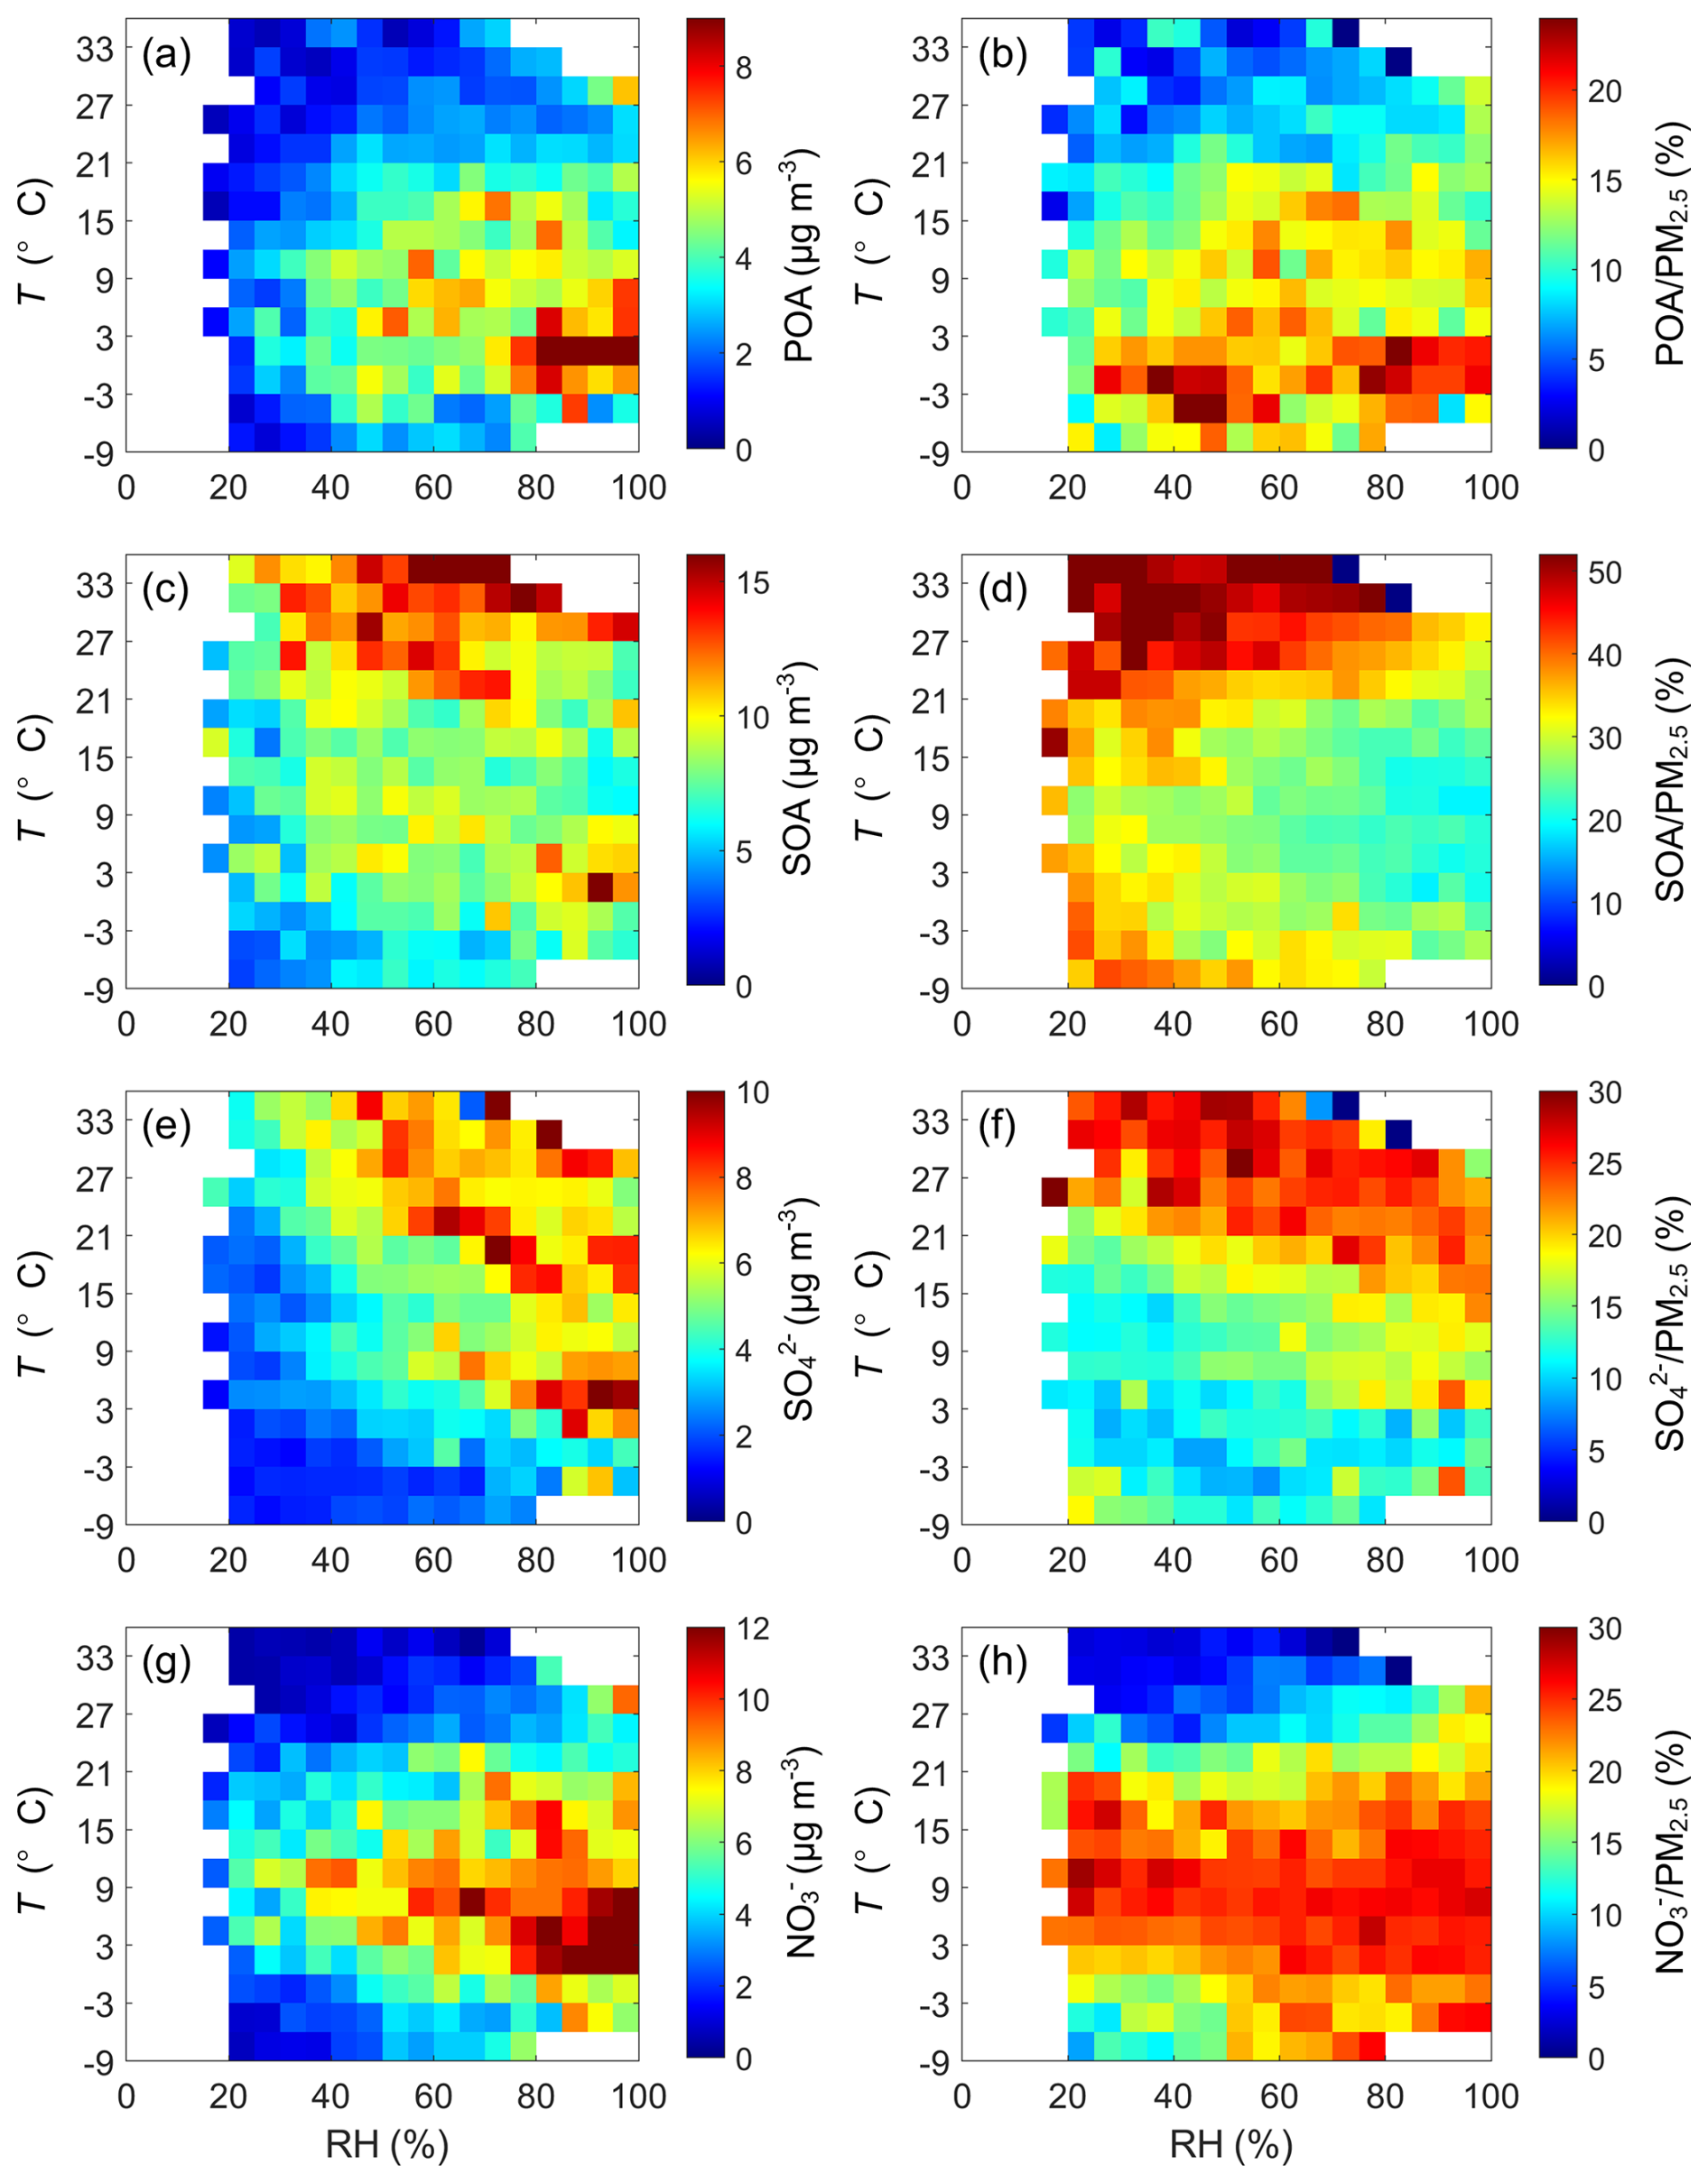
Figure 3 dependence of mass concentrations and mass fractions in PM2.5 of POA, SOA, sulfate, and nitrate for the entire period. The data are grouped into grids with increments of RH and T being 5 % and 3 °C, respectively. Grid cells with the number of data points fewer than 10 are excluded.
In contrast, SOA exhibits the highest mass concentration and fraction in summer and the lowest in winter, driven by intense photochemical oxidation at high T (Fig. 3c and d, Huang et al., 2020). Enhanced southeasterly monsoon winds in summer likely increases biogenic SOA transport from southern hilly areas (Wu et al., 2016). At low T and low RH, SOA mass concentration is reduced, but its mass fraction increases due to inhibited sulfate and nitrate formation. Sulfate mass fraction mirrors SOA's seasonality (highest in summer, lowest in winter; Fig. 2c), with smaller concentration variations (Fig. 2a). Sulfate formation is co-regulated by T and RH, with high T accelerating gas-phase SO2 oxidation and high RH enhancing aqueous-phase reactions, resulting in peak sulfate concentrations and fractions at high T and high RH (Fig. 3e and f). This contrasts with the NCP, where aqueous-phase reactions dominate sulfate formation (Sun et al., 2015), highlighting T as a key driver in the YRD. Nitrate peaks in winter and declines in summer (Fig. 3g and h), with high T promoting volatilization to gaseous nitric acid (HNO3) and high RH enhancing aqueous-phase formation (Sun et al., 2013a). Consequently, nitrate exhibits the highest concentrations at low T and high RH, aligning with PM2.5 hotspots (Fig. S3a) and underscoring its role in winter pollution episodes.
To investigate the dynamic responses of the formation and accumulation processes of highly responsive secondary chemical components to meteorological factors, the relationships between the monthly average mass fractions of chemical components in PM2.5 and monthly average T and PBLH are analysed (Figs. 4 and S6 in the Supplement). It is found that the monthly average mass fractions of SOA, sulfate, and nitrate show strong T dependencies (Fig. 4a), with correlation coefficients of RSOA-T=0.86 (positive), (strong positive), and (strong negative) with monthly average T. Similar correlations with PBLH are observed: RSOA-PBLH=0.70 (positive), (positive), and (negative) (Fig. 4b). These patterns align with T correlations, as higher T typically coincides with elevated PBLH, though the relationship is nonlinear. The negative correlation between nitrate and PBLH reflects enhanced vertical mixing under high PBLH, which disperses aerosols and reduces concentrations. Conversely, the positive correlations for SOA and sulfate suggest that increased PBLH does not fully offset their formation and accumulation, driven by photochemical and transport processes. Note that the PBLH value of 920 m in Fig. 4b represents a typical summertime observation from July and is physically consistent with seasonal boundary layer development. As a valid data point, its inclusion does not change the core finding of a differential PBLH impact on secondary aerosols (Fig. S7 in the Supplement).
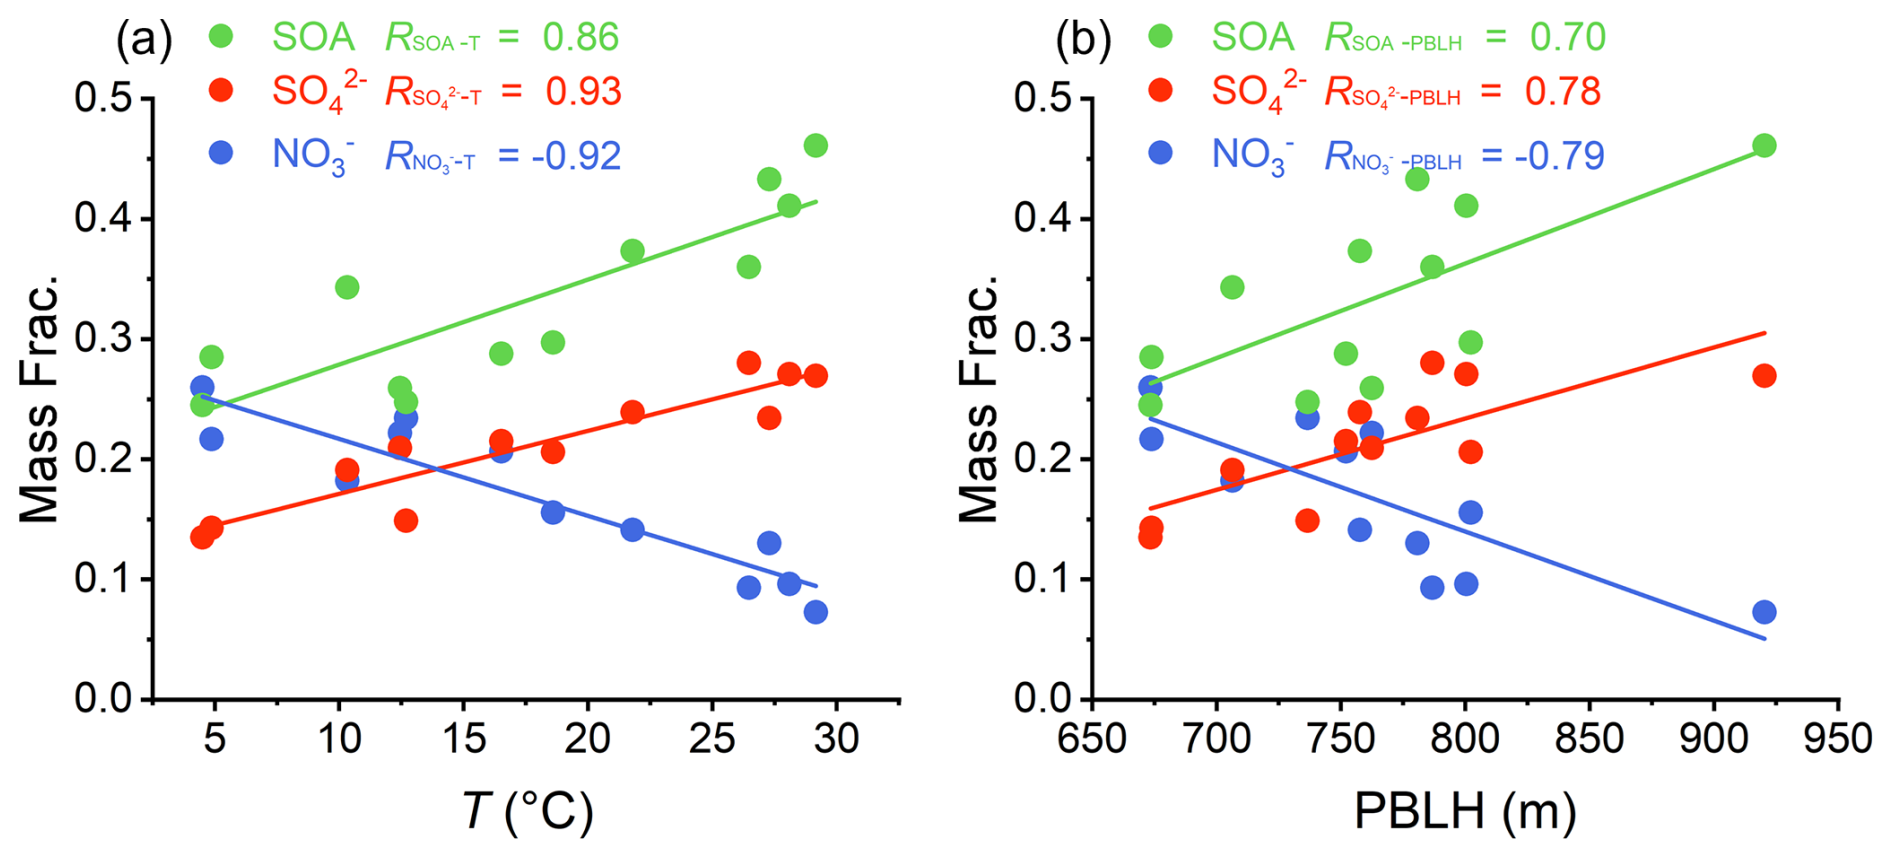
Figure 4The correlation and linear fitting lines between the monthly average mass fractions of SOA, sulfate, nitrate in PM2.5 and the corresponding monthly average (a) T and (b) PBLH. RSOA-T, , : correlation coefficients with T. RSOA-PBLH, , : correlation coefficients with PBLH.
In summary, PM2.5 concentrations and composition are influenced by meteorological factors and secondary formation processes. Stable conditions (low WS and PBLH) promote primary aerosol (POA, BC, chloride) accumulation, while T drives secondary aerosol dynamics. Low T enhances nitrate formation, whereas high T favors sulfate and SOA production. PBLH exerts differential effects: elevated PBLH facilitates dispersion of primary aerosols and nitrate, reducing their concentrations, but does not significantly counteract sulfate and SOA accumulation due to their strong generation processes.
3.2 Chemical composition dynamics of PM2.5 pollution
To investigate the role of different chemical components in pollution events, the distinct impacts of PM2.5 chemical components on pollution evolution during elevated aerosol loading at the NUIST site are illustrated by Fig. 5. PM2.5 mass concentrations exhibit a positively skewed distribution, with most values clustering at lower mass loadings and a smaller fraction extending to higher levels. Frequent winter haze episodes create a positive feedback mechanism between high aerosol concentrations and low PBLH (Su et al., 2020), broadening the PM2.5 frequency distribution to a maximum of 120 µg m−3 (Fig. 5d). Notably, moderate (10–40 µg m−3) and high (50–80 µg m−3) PM2.5 concentration ranges occur more frequently in winter, forming distinct primary and secondary peaks in the distribution.
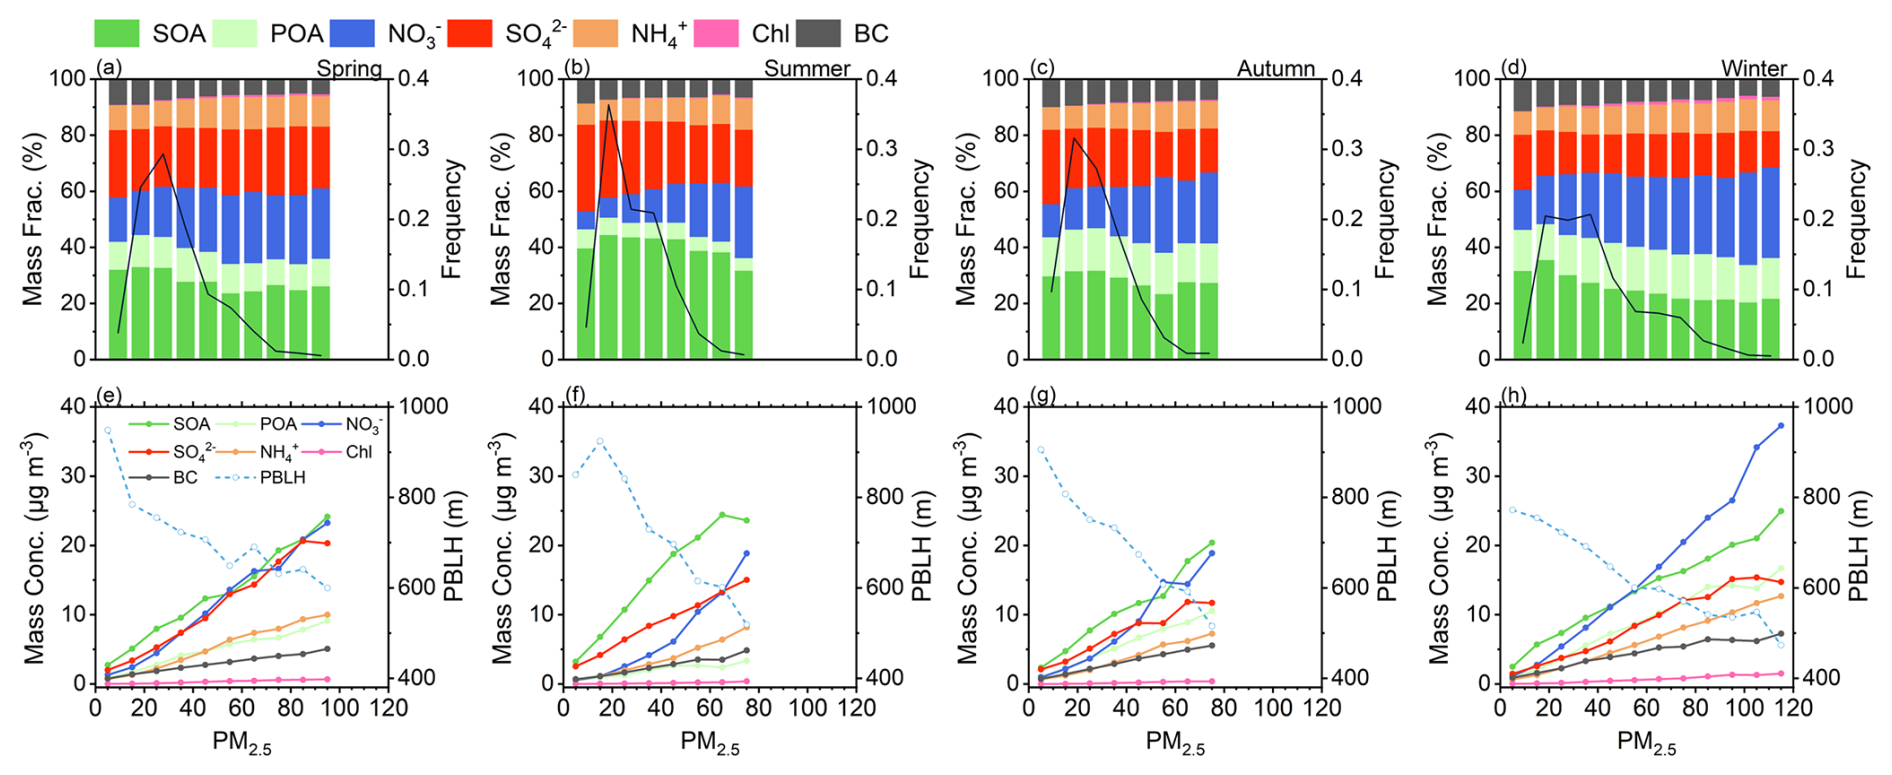
Figure 5Mass fractions of PM2.5 chemical components (left y axis) and frequency distribution of PM2.5 data points relative to the total number of data points (right y axis, black line) as a function of PM2.5 mass concentration in (a) spring, (b) summer, (c) autumn, and (d) winter at the NUIST site. Mass concentrations of PM2.5 chemical components (left y axis) and PBLH (right y axis, blue dashed line) as a function of PM2.5 mass concentration in (e) spring, (f) summer, (g) autumn, and (h) winter. Data are grouped in PM2.5 bins with 10 µg m−3 increments. Bins containing fewer than 10 data points are excluded.
Across all seasons, PBLH generally decreases nearly monotonically with increasing PM2.5 mass concentrations (Fig. 5e–h). However, exceptions occur in spring (60–70 µg m−3, Fig. 5e) and winter (100–110 µg m−3, Fig. 5h), where PBLH deviates from a strictly decreasing trend. These deviations suggest that during certain high-pollution episodes, the dilution effect of the boundary layer fails to counteract pollutant generation and accumulation.
The mass fraction of POA decreases with increasing PM2.5 mass concentrations in spring and summer but remains stable in autumn and winter, indicating a consistent contribution of POA to PM2.5 during colder seasons (Fig. 5a–d). Similarly, primary aerosols (POA, BC, and chloride) exhibit declining mass fractions across all seasons as PM2.5 levels rise, suggesting a diminishing role of primary emissions during pollution accumulation.
In spring, the mass fraction of SOA increases under low PM2.5 conditions but slightly decreases at higher loadings while maintaining relatively high values (Fig. 5a). This pattern likely results from reduced competition for gaseous volatile organic compounds (VOCs) precursors in low-PM2.5 environments, where inorganic aerosols (e.g., sulfate and nitrate) are less abundant and oxidants are more available (Ehn et al., 2014; Kerminen et al., 2018). Conversely, high PM2.5 levels increase inorganic aerosol concentrations, leading to precursor depletion or saturation effects that reduce SOA formation efficiency. Seasonal trends in SOA mass fractions during summer and autumn mirror those in spring, with consistently higher values in summer (Fig. 5b and c). In winter, while SOA mass concentration follows a similar trend to spring and autumn (Fig. 5h), its mass fraction decreases markedly with rising PM2.5 (Fig. 5d), primarily due to the dominance of nitrate, which significantly increases in mass and dilutes the relative contribution of SOA.
Among secondary inorganic components, the mass fraction of nitrate exhibits a significant increase with rising PM2.5 mass concentrations across all seasons, consistent with previous findings highlighting its dominant role in heavy pollution episodes (Xian et al., 2023). Notably, during winter, the incremental growth rate of nitrate mass concentration surpasses that of other seasons, even exceeding SOA levels when PM2.5 exceeds 50 µg m−3 (Fig. 5h). This phenomenon is likely attributed to accelerated heterogeneous hydrolysis of dinitrogen pentoxide (N2O5) under low-T and high-RH conditions (Fig. 3g), driving rapid nitrate accumulation and establishing it as the predominant pollutant during winter haze events (Alexander et al., 2020). In contrast, sulfate maintains relatively stable mass fractions in spring and winter without significant PM2.5 dependency (Fig. 5a and d), reflecting its regional and long-range transport characteristics (Sun et al., 2015). However, sulfate mass fractions gradually decline with increasing PM2.5 in summer and autumn. In summer, elevated T enhances sulfate contributions compared to nitrate at low PM2.5 concentrations (), but nitrate surpasses sulfate at higher PM2.5 levels due to its efficient formation during pollution episodes (Fig. 5b and f). By autumn, cooling T enables nitrate to dominate over sulfate at PM2.5 concentrations above 40 µg m−3 (Fig. 5c and g).
In summary, winter haze episodes intensify pollution through the positive feedback mechanism between elevated aerosols and suppressed PBLH. Primary aerosols contribute less to PM2.5 as pollution accumulates, while secondary components, particularly nitrate, increasingly dominate, especially in winter. SOA contributions vary by season and inorganic aerosol concentrations, while sulfate exhibits regional transport characteristics.
3.3 Diurnal dynamics of PM2.5 chemical components
Figure 6 illustrates the diurnal variations of PM2.5 chemical components across four seasons at the NUIST site. SOA mass concentrations increase during daytime and decrease at night in all seasons (Fig. 6a). Sulfate exhibits a relatively flat diurnal profile (Fig. 6b), reflecting its regional transport-dominated characteristics. Nitrate displays distinct seasonal diurnal patterns: in spring, summer, and autumn, a morning peak occurs around 08:00 local time (LT), followed by a gradual decline due to rising T and PBLH. In winter, however, nitrate concentrations increase until noon (12:00 LT) before stabilizing (Fig. 6c). Ammonium reflects the combined dynamics of ammonium sulfate and ammonium nitrate (Fig. 6d, Xu et al., 2014). POA and BC exhibit bimodal diurnal patterns (Fig. 6e and f), with peaks during morning rush hours, declines linked to reduced traffic and PBLH growth, and secondary peaks around 17:00 LT due to evening traffic and PBLH suppression (Hu et al., 2017). Notably, winter morning peaks for POA and BC occur later than in summer, likely due to delayed sunrise and commuter activity in colder months (Zhu et al., 2021).
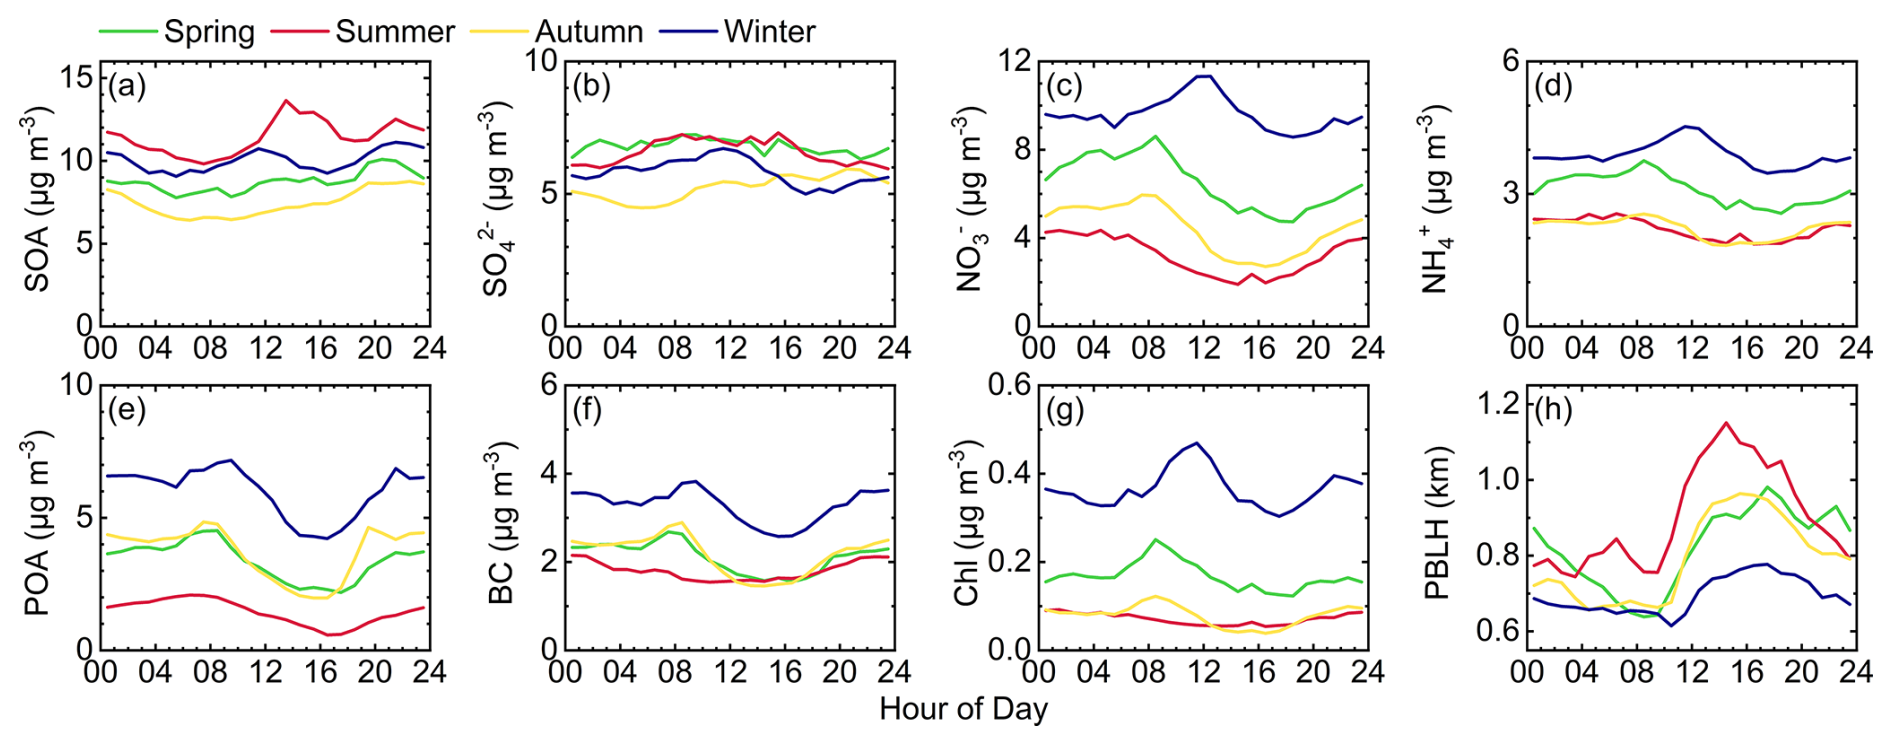
Figure 6Average diurnal variations of (a) SOA, (b) sulfate, (c) nitrate, (d) ammonium, (e) POA, (f) BC, (g) chloride, and (h) PBLH during four seasons.
PBLH significantly modulates the diurnal variations of PM2.5 chemical components. Previous studies often use the ratio of aerosol mass concentrations to CO concentrations to assess the dilution effect of PBLH variations (e.g., Kuang et al., 2020). However, this approach assumes CO variability is solely driven by PBLH fluctuations, overlooking emission source variations. To address this limitation, high-temporal-resolution PBLH data from the MPL are utilized. To isolate emission sources and secondary formation effects on local pollution, [component]*PBLH is employed to approximate the aerosol loading within the boundary layer in this study, thereby removing the dilution effect. It is important to note that while the absolute value of this parameter is not a direct physical measurement, its diurnal evolution provides valuable insights for investigating source processes and chemical mechanisms.
Raw observations show that during daytime PBLH elevation (10:00–16:00 LT, Fig. 6h), POA and BC concentration decrease by 40 %–60 % (Fig. 6e and f). As primary components, their diurnal patterns are strongly governed by planetary boundary layer dynamics. After removing the dilution effect, [POA]*[PBLH] and [BC]*[PBLH] exhibit flattened diurnal trends (Fig. 7e and f), confirming PBLH rise accelerates daytime concentration declines. Residual bimodal patterns in [POA]*[PBLH] and [BC]*[PBLH] align with traffic emissions in morning and evening rush hours, highlighting vehicular sources as their dominant source. The persistent bimodal pattern confirms that targeted traffic emission controls during morning and evening rush hours would effectively curtail exposure to primary pollutants like BC and POA in the urban environment. A minor midday peak in [POA]*[PBLH] likely reflects localized cooking-related emissions (Zhang et al., 2018), which is masked by PBLH dilution in raw observations.
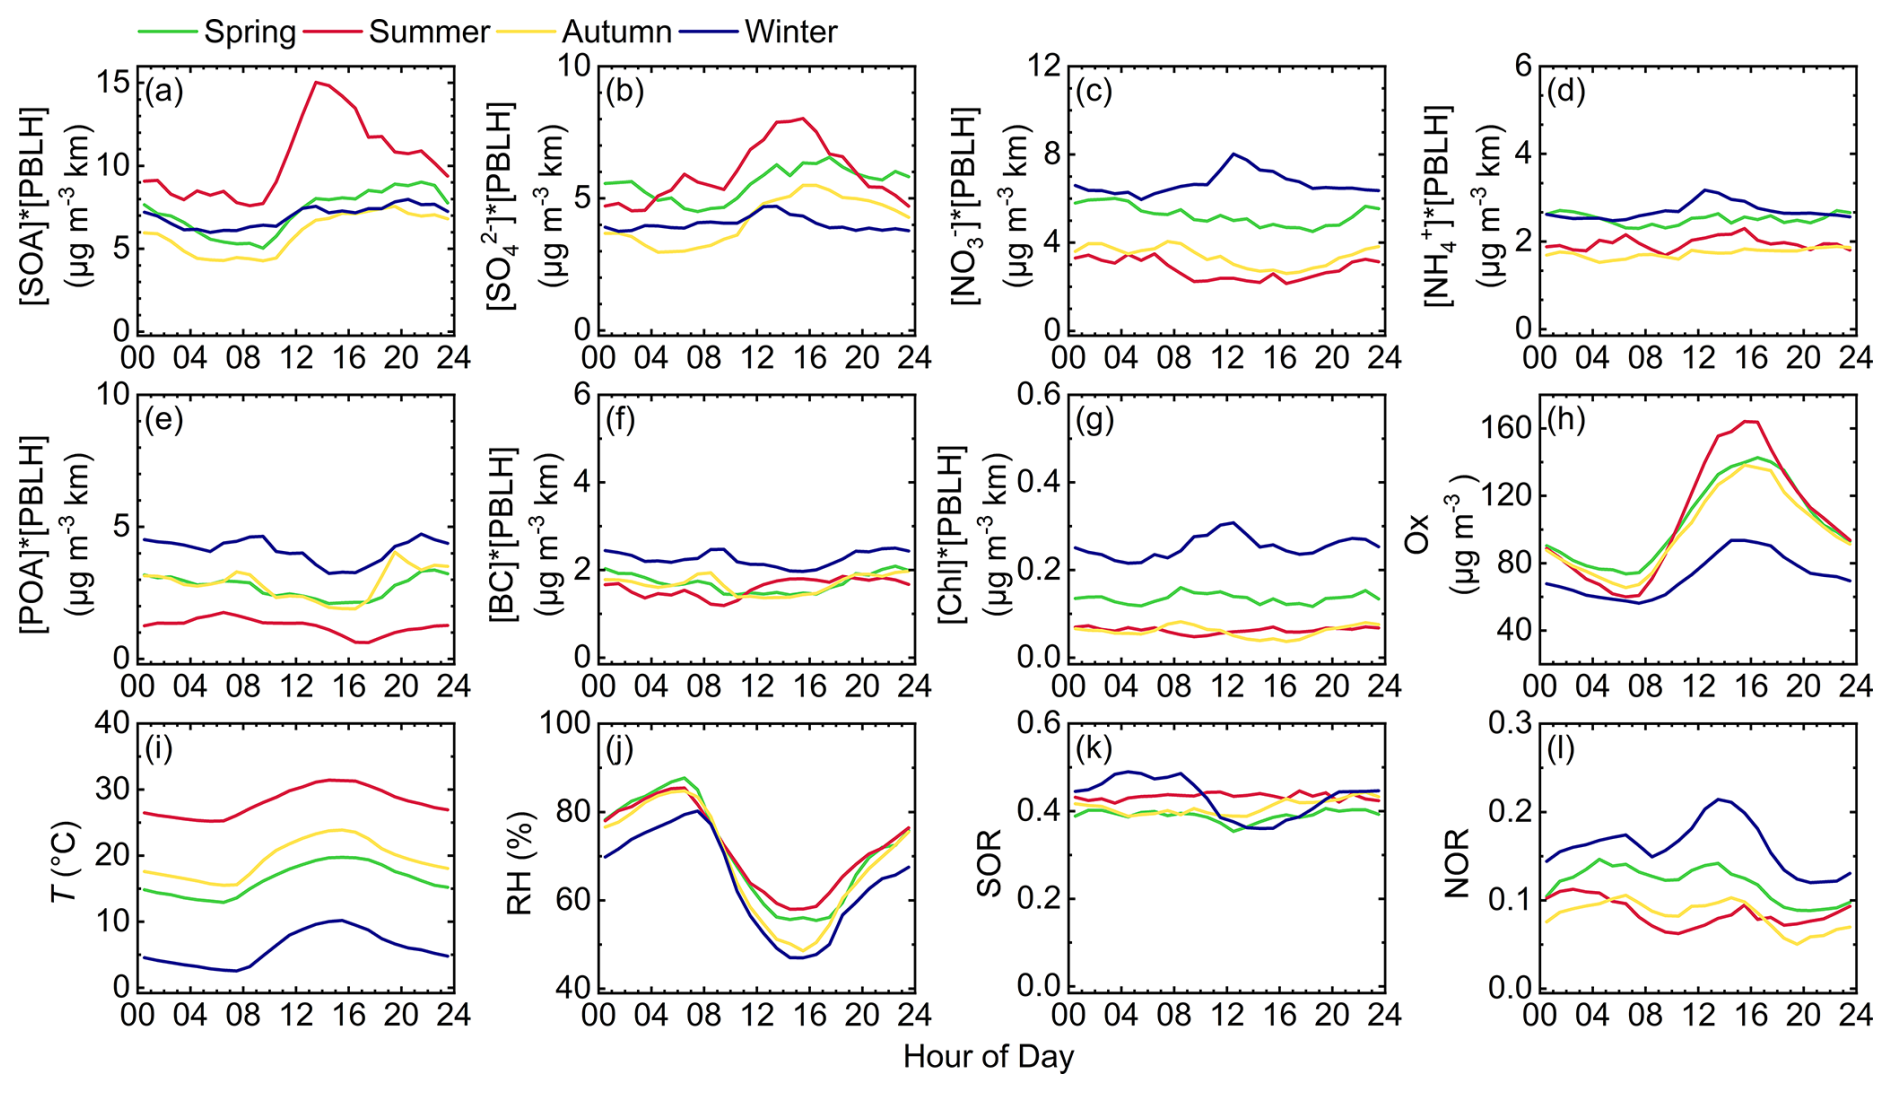
Figure 7Average diurnal variations of (a–g) PM2.5 chemical components after removing the dilution effect of planetary boundary layer, (h) photochemical oxidant (Ox), (i) T, (j) RH, (k) sulfate oxidation ratio (SOR), and (l) nitrogen oxidation ratio (NOR) during four seasons. To isolate emission sources and secondary formation effects on local pollution, the average diurnal variations of PM2.5 chemical components are multiplied by PBLH to remove the dilution effect (denoted as [component]*[PBLH], e.g., [POA]*[PBLH], [BC]*[PBLH]) in a–g panels.
In summer, from 09:00–14:00 LT, and [SOA]*[PBLH] increase by 48 % and 32 %, respectively (Fig. 7a and b), significantly exceeding raw data trends (Fig. 6a and b). This indicates that daytime PBLH increase suppresses secondary component accumulation through enhanced vertical dispersion. A synchronized increase in photochemical oxidant concentrations (, Fig. 7h) underscores the dominant role of photochemical oxidation in sulfate and SOA formation during summer. This also explains the low POA contribution in summer, as emitted POA undergoes rapid secondary reactions under intense solar radiation and atmospheric oxidation, transforming into SOA (Takeuchi et al., 2022). Similar daytime increases in and [SOA]*[PBLH] occur in spring and autumn, though with smaller magnitudes compared to summer. Winter exhibits flatter diurnal variations, suggesting influences from regional pollution and long-term accumulation (Sun et al., 2015). It implies that curtailing the key precursor emissions VOCs and SO2, during the morning and early afternoon in summer could effectively suppress the photochemical formation of SOA and sulfate, thereby alleviating daytime particulate pollution.
The average diurnal variations of sulfate oxidation ratio (, n refers to molar concentration) in spring, summer and autumn are very slight (Fig. 7k). Unlike the RH-driven sulfate formation in the NCP (Sun et al., 2013a), aqueous-phase reactions contribute limitedly to sulfate variation in the YRD during spring, summer, and autumn nights. The difference may stem from the YRD's persistently high RH (>60 % year-round) compared to the NCP's larger RH fluctuations (23.4 %–60.5 %) and lower baseline humidity (Xu et al., 2024). During winter nights (00:00–08:00 LT), the SOR significantly increases, which may be attributed to aqueous-phase secondary formation. However, does not show an obvious increasing trend at night, indicating that the contribution of local formation to sulfate is limited, and its diurnal variations are mainly influenced by regional transport.
Figures 6c and 7c show similar diurnal variation patterns of nitrate in spring, summer and autumn. Daytime T increases induce ammonium nitrate volatilization, reducing during the day (Fig. 7c), which indicates that nitrate formation in these three seasons is primarily governed by thermodynamics (Griffith et al., 2015). However, the decrease is smaller than in raw data (Fig. 6c), indicating that PBLH rise accelerates nitrate concentration declines. Winter exhibits distinct behavior, with a 25.5 % increase in and a distinct increase in nitrogen oxidation ratio (, Fig. 7l) from 09:00–13:00 LT, reflecting competition between thermodynamic and photochemical processes. Suppressed PBLH, combined with photochemical activity, enhances nitrate accumulation (Sun et al., 2013b). The contrasting diurnal patterns highlight distinct control strategies: broad NOx reductions in warm seasons, contrasted with stringent NOx controls during winter mornings and nights to impede rapid nitrate accumulation facilitated by stable conditions.
In conclusion, PM2.5 chemical components exhibit significant diurnal variations modulated by PBLH dynamics. Primary aerosols (POA and BC) show bimodal diurnal patterns driven by traffic emissions, with daytime PBLH rise accelerating concentration declines. Part of secondary components (SOA and sulfate) increase during the daytime due to photochemical oxidation, but PBLH elevation suppresses their accumulation. Nitrate's diurnal variations are seasonally dependent: PBLH growth accelerates volatilization in warmer seasons, while winter's low PBLH and photochemical activity promote nitrate accumulation. These patterns inform time-specific emission control strategies, encompassing traffic controls during rush hours to mitigate primary aerosols, precursor reductions during peak photochemical periods to limit secondary aerosols, and rigorous winter NOx controls during nights and mornings to avert severe nitrate pollution.
3.4 Sensitivity of PM2.5 chemical components to PBLH
To further study the influence of PBLH on different chemical components, the changes in PM2.5 chemical components with decreasing PBLH across four seasons at the NUIST site are illustrated in Fig. 8. The sensitivity of a specified chemical component to PBLH changes (SPBLH) is defined quantitatively as:
Here, SPBLH specifically represents the absolute rate of change in PM2.5 chemical components with decreasing PBLH, where ΔC is the change in mass concentration and ΔPBLH is the change in PBLH. In this study, we report SPBLH in units of , representing the concentration change per 100 m decrease in PBLH.
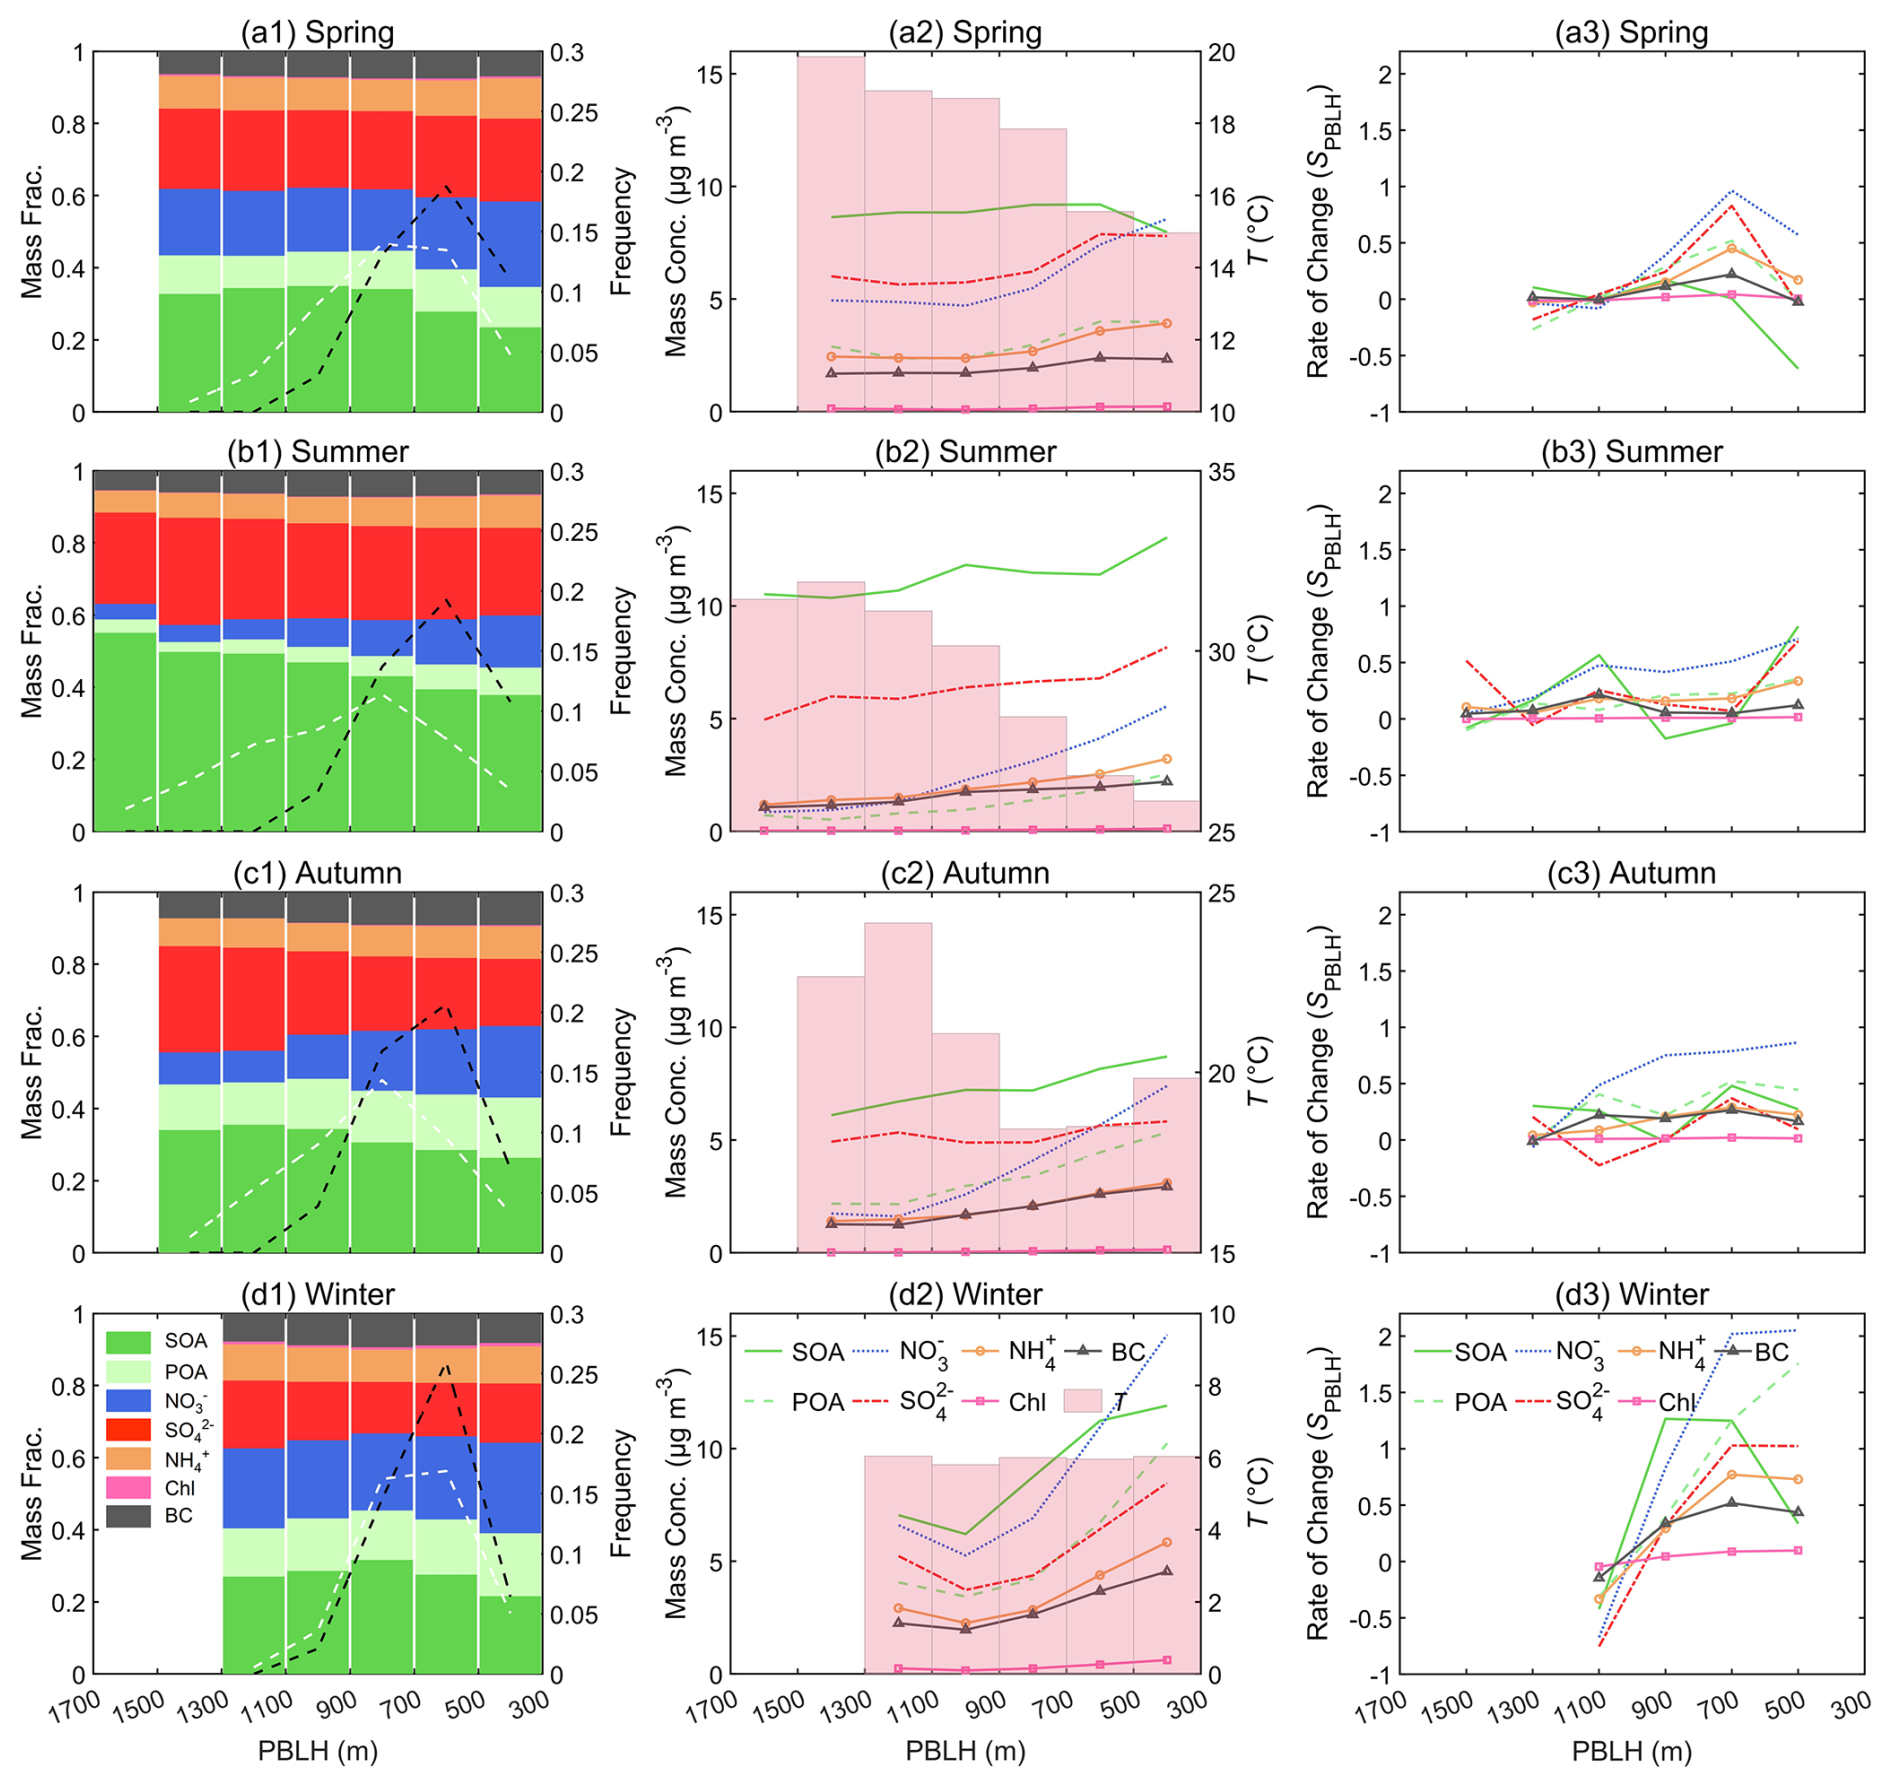
Figure 8(a1–d1) The mass fraction of PM2.5 chemical components as a function of PBLH distribution (left y axis) and frequency distribution of PBLH data points relative to the total number of data points (right y axis, white dashed line represents daytime and black dashed line represents nighttime) in four seasons. (a2–d2) The mass concentration of PM2.5 chemical components (left y axis) and the T (right y axis, pink columns) as a function of PBLH distribution in four seasons. (a3–d3) The rate of change in PM2.5 chemical components (S, units: ) with the decrease of PBLH in four seasons. The data are grouped in PBLH bins with 200 m increments. Bins with the number of data points fewer than 10 are excluded.
As PBLH decreases, the SPBLH of POA is higher than that of BC within the 300–900 m PBLH range (Fig. 8a3–d3), suggesting that the concentration of POA increases at a faster rate with the lowering of the PBLH than do those of BC. The total contribution of primary aerosols (POA, BC, and chloride) to PM2.5 increases across all seasons as PBLH declines (Fig. 8a1–d1), reflecting the enhanced accumulation of locally emitted primary aerosols under low PBLH conditions.
In spring, PM2.5 chemical components display complex relationships with PBLH. Notably, SOA and sulfate mass concentrations are anomalously lower under low PBLH (300–500 m) than at higher PBLH (500–700 m) (Fig. 8a2). Further analysis reveals that, at PBLH between 300 and 500 m, lower WS (1.6 m s−1), lower T (15.0 °C), higher RH (92.3 %) and higher frequency of nighttime occurrences suppress the photochemical formation and accumulation of SOA and sulfate, counteracting accumulation effects of low PBL. In contrast, nitrate mass concentrations are significantly affected by the accumulation effect at low PBLH in spring, exhibiting a negative correlation with PBLH.
In summer and autumn, pronounced diurnal differences in PBLH influence component dynamics. Sulfate and SOA dominate PM2.5 pollution during daytime under high PBLH and elevated T (Fig. 8b1 and b2), but their mass fractions decrease as PBLH declines. Nitrate exhibits the opposite trend, with mass concentrations surging by 331.0 % in summer and 313.0 % in autumn as PBLH decreases, far exceeding increases in sulfate (56.0 % in summer, 21.0 % in autumn) and SOA (25.0 % in summer, 44.0 % in autumn, Fig. 8b2 and c2). As noted in Sect. 3.2, sulfate and SOA prevail during low-pollution, high-PBLH episodes, while nitrate dominates during high-pollution, low-PBLH episodes. However, summer heatwaves reduce the thermal stability of ammonium nitrate, such that nitrate's dominance is limited to low-PBLH periods only in autumn. In contrast to SOA and sulfate, which generally exhibit lower SPBLH across the PBLH range, nitrate shows consistently higher sensitivity (Fig. 8b3 and c3). This indicates that although low PBLH restricts vertical pollutant dispersion, sulfate and SOA, primarily driven by photochemical processes, are more sensitive to T and solar radiation than to PBLH variations.
In winter, all aerosol chemical components exhibit heightened sensitivity to PBLH. As PBLH decreases, both the rise in mass concentration and the SPBLH are significantly greater than in other seasons (Fig. 8d2 and d3). Nitrate shows the greatest sensitivity to PBLH, with its SPBLH reaching a peak value exceeding 2. Within the 300–500 m PBLH range, nitrate constitutes 25.0 % of PM2.5, emerging as the dominant component (Fig. 8d1). The consistently low T (∼6 °C) across all PBLH intervals (Fig. 8d2) fosters conditions conducive to thermodynamic stability of ammonium nitrate (Kang et al., 2022). As illustrated in Fig. S8d in the Supplement, low PBLH conditions are associated with elevated RH and reduced WS. This humid environment markedly enhances nitrate formation through heterogeneous pathways, such as N2O5 hydrolysis (Peng et al., 2024). Simultaneously, low PBLH limits the vertical diffusion of precursors, leading to their accumulation near the surface and further boosting chemical production efficiency. The pronounced sensitivity of nitrate highlights the critical need for proactive emission control measures to avert the swift escalation of severe pollution episodes in winter.
In summary, PBLH regulates PM2.5 chemical components through its influence on aerosol dispersion and interactions with temperature, photochemical reactions, and regional transport processes. POA shows greater sensitivity to PBLH variations than BC. In spring, reduced temperatures at low PBLH constrain SOA and sulfate formation, counteracting accumulation effects. In summer and autumn, SOA and sulfate are less sensitive to PBLH due to photochemical dominance, while nitrate exhibits heightened sensitivity. In winter, low PBLH and cold temperatures amplify the sensitivity of all components. Nitrate exhibits the highest sensitivity to PBLH across all seasons, with particularly pronounced effects under low PBLH conditions in winter. Its rapid accumulation during this period is primarily fueled by the high humidity linked to low PBLH, which vigorously promotes heterogeneous reactions like N2O5 hydrolysis. At the same time, the sustained low temperatures ensure the thermodynamic stability required for nitrate to persist in the particulate phase.
3.5 Source apportionment of PM2.5 chemical components
PSCF analysis and pollution rose diagrams (Figs. 9 and 10) reveal distinct seasonal source patterns for PM2.5 chemical components. For POA, high-potential source areas are predominantly located south of the NUIST site during spring, summer, and autumn (Fig. 9a), with elevated concentrations in the pollution roses occurring mainly at low wind speeds from southeasterly directions (Fig. 10a). This pattern suggests dominant influences from local industrial emissions. In winter, however, POA source regions expand northward to the NCP (Fig. 9a4), and the pollution roses indicate high POA concentrations at higher WS from northerly and southeasterly directions (Fig. 10a4), pointing to a combination of local emissions and long-range transport from the north (Cao et al., 2022). POA concentrations generally exhibit an inverse relationship with PBLH in the pollution roses (Fig. 10a1–a4 vs. e1–e4), highlighting the role of a lower PBLH in promoting primary aerosol accumulation. Notably, in winter, under northeasterly winds of 4–4.5 m s−1, all components show peak concentrations, corresponding to a PBLH of ∼570 m (Fig. 10a4–e4). Although this PBLH is not the seasonal minimum, it facilitates horizontal transport of industrial and urban pollutants from the northeast while suppressing vertical dispersion, collectively leading to heavy pollution.
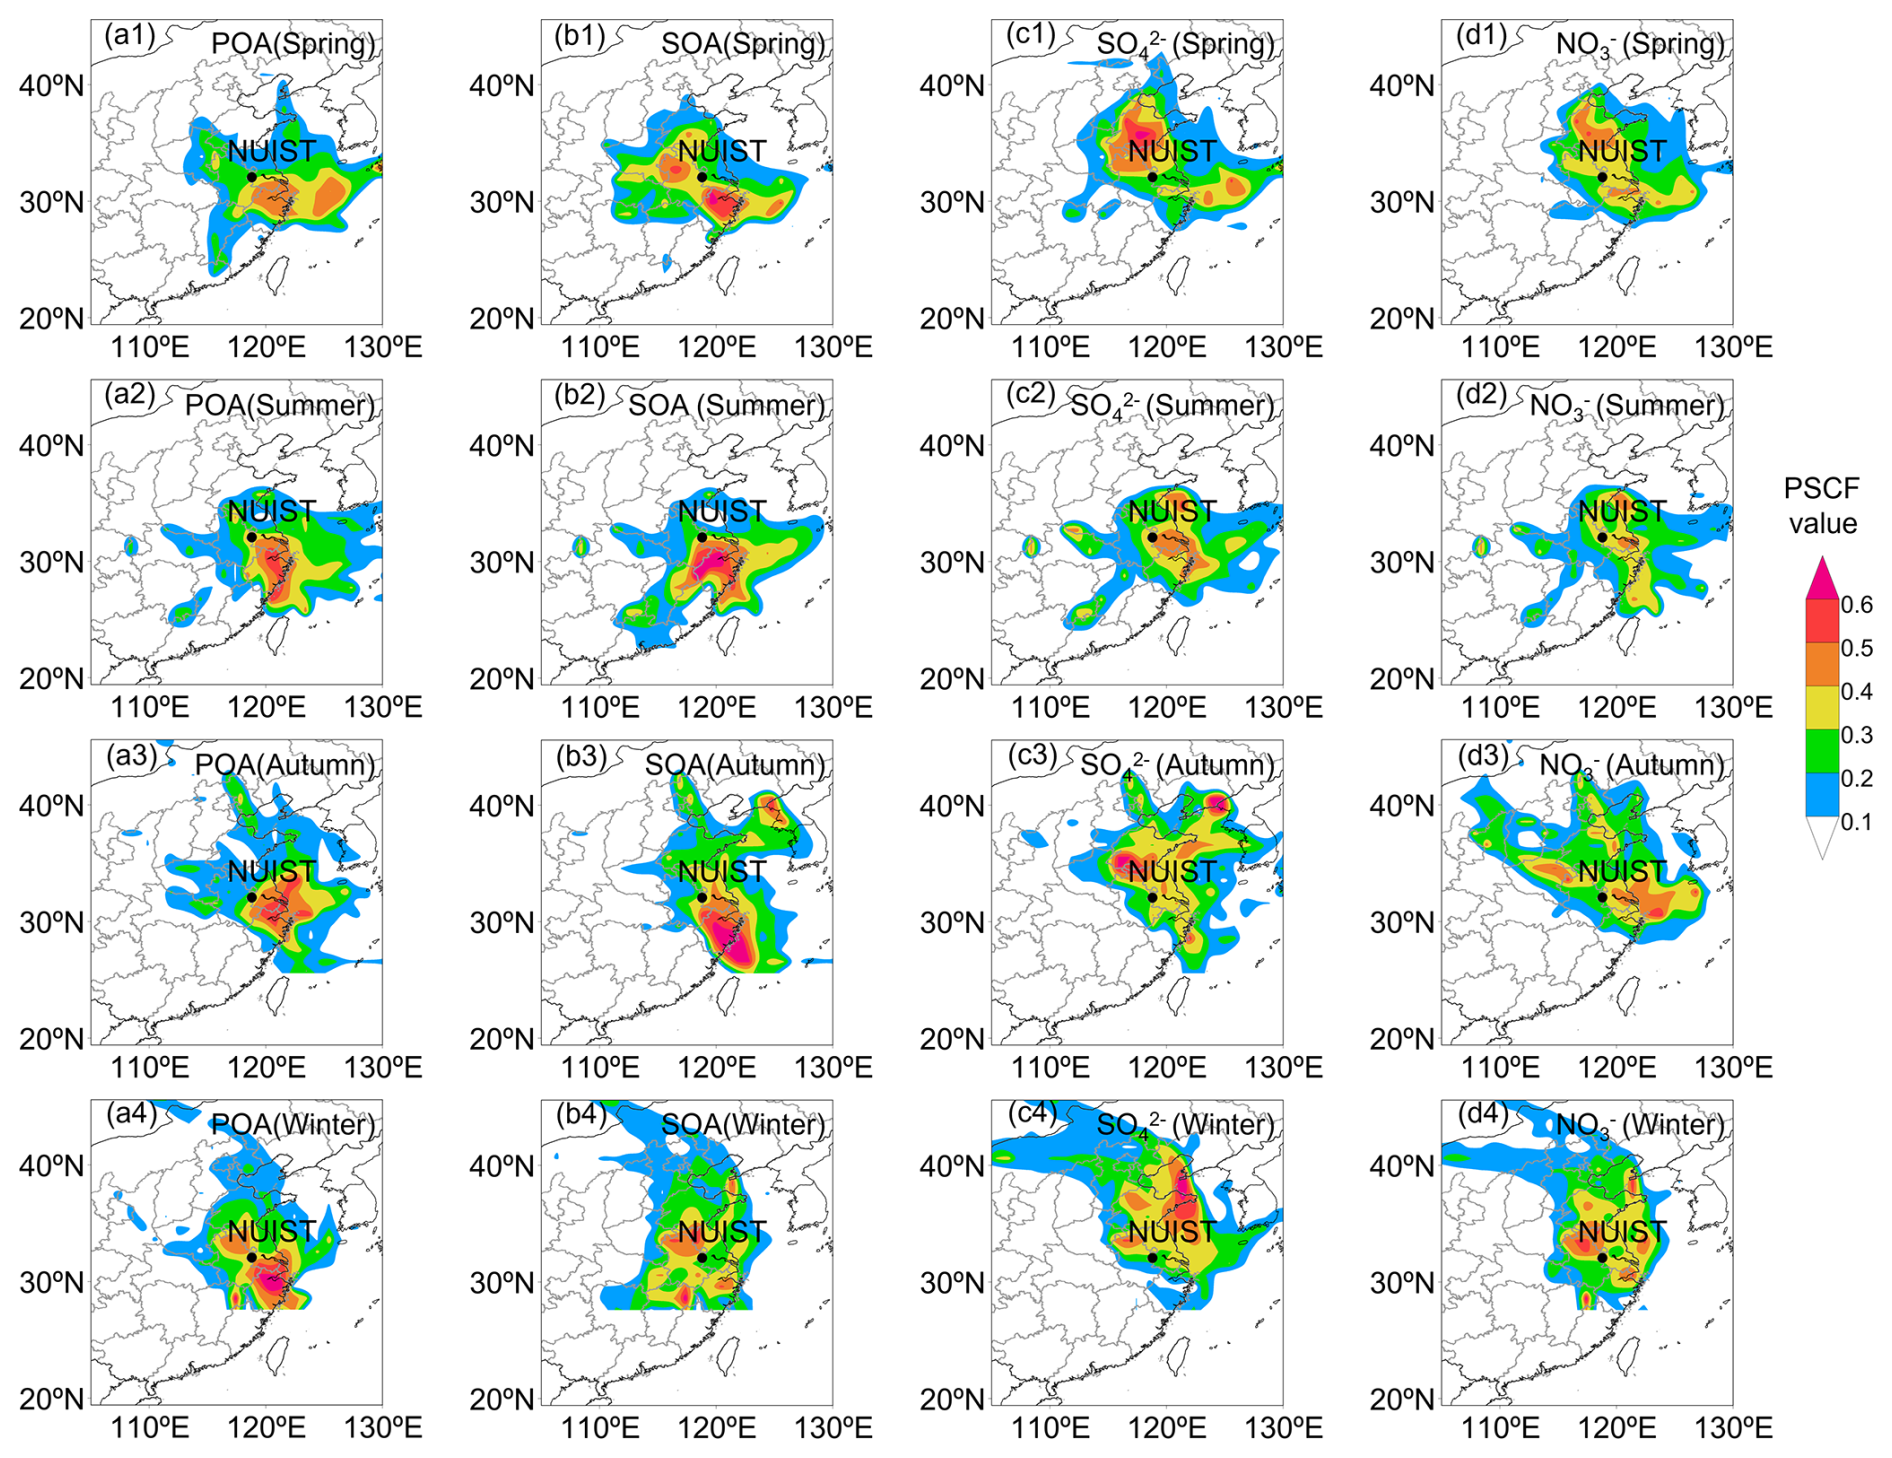
Figure 9PSCF analysis of (a) POA, (b) SOA, (c) sulfate, and (d) nitrate in PM2.5 during four seasons. The black dot indicates the NUIST site. The color scale indicates the values of PSCF.
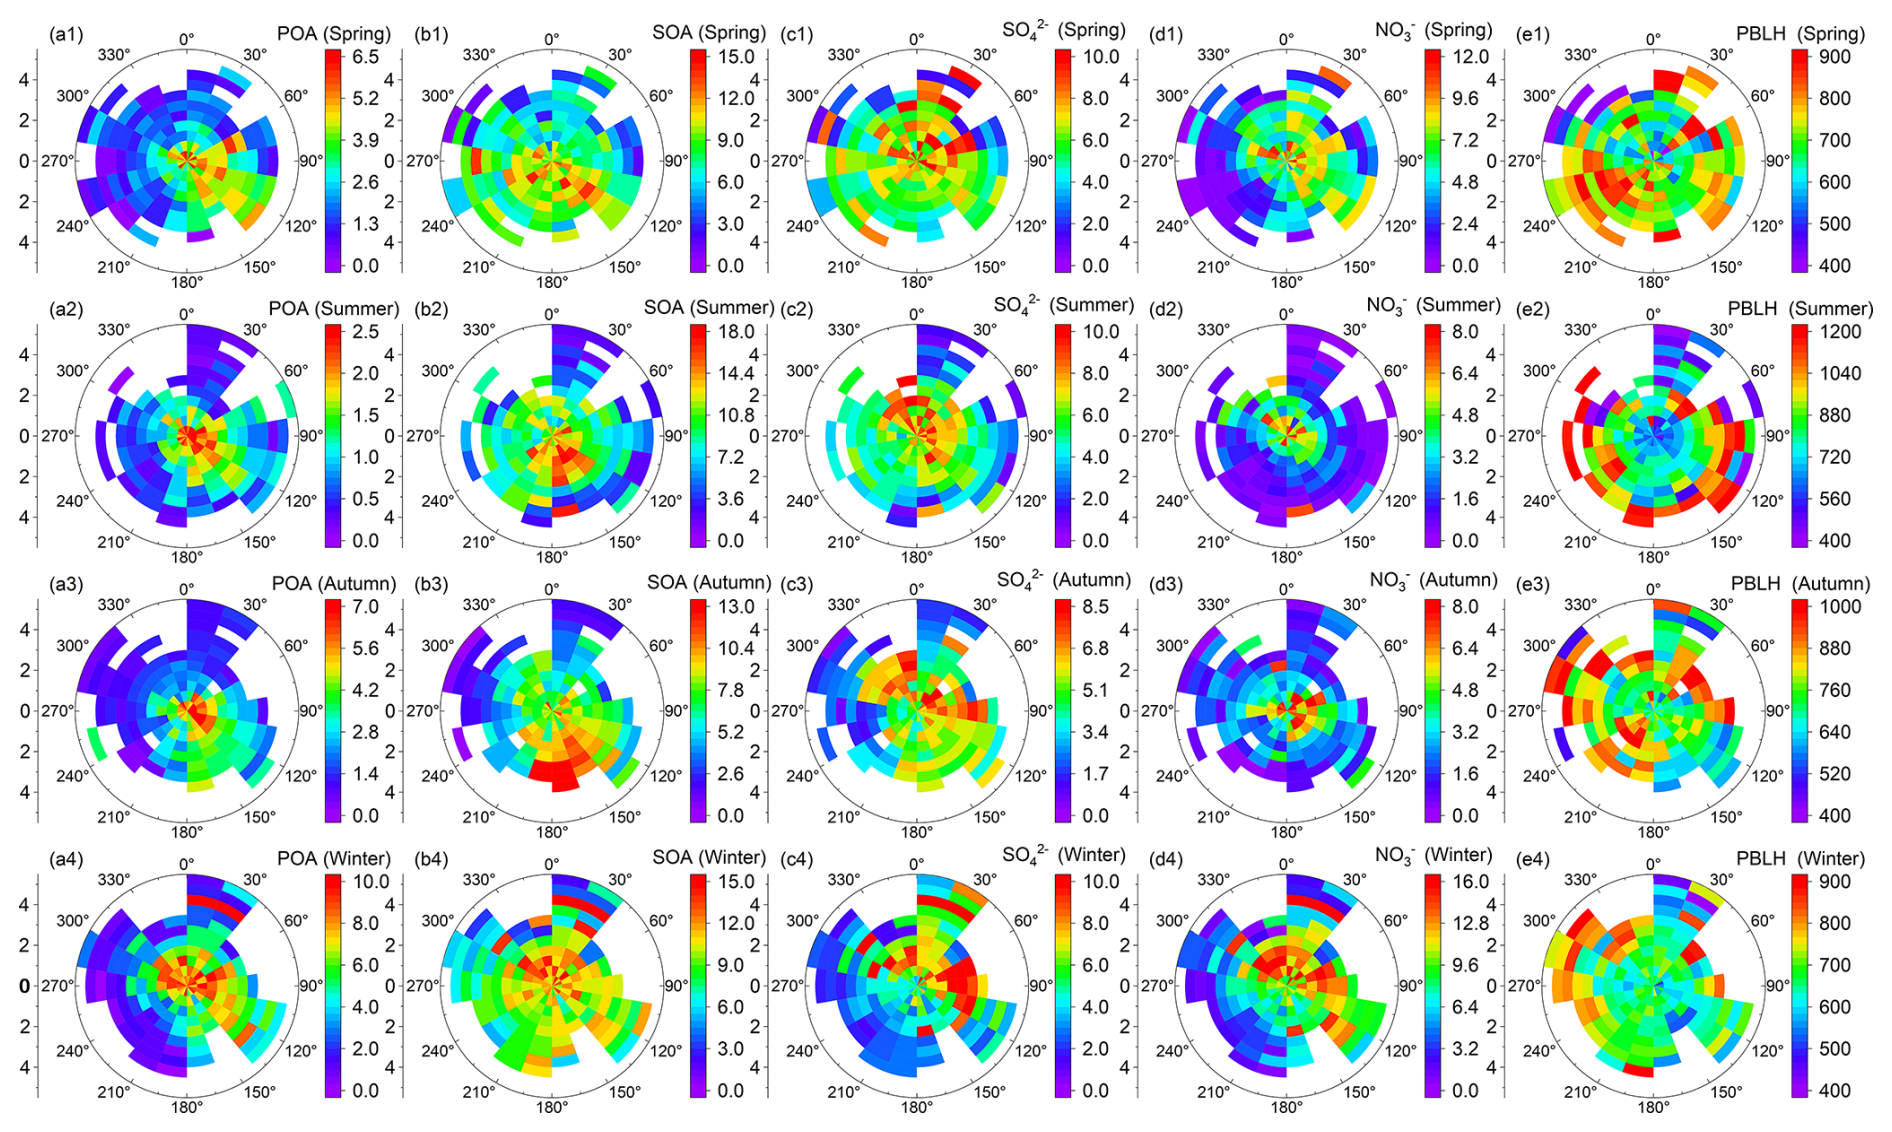
Figure 10Pollution roses of (a) POA, (b) SOA, (c) sulfate, (d) nitrate and (e) PBLH during four seasons. The data are grouped into grids with increments of WS and WD being 0.5 m s−1 and 20°, respectively. The unit of color scale is µg m−3.
Similar PSCF and pollution rose patterns for POA and SOA in summer (Figs. 9a2 and b2 and 10a2 and b2) imply shared emission sources, corroborating enhanced photochemical activity that drives rapid SOA formation from gaseous precursors and POA conversion under elevated temperatures. SOA's high-potential sources in summer and autumn concentrate in southeastern forested hills south of the site (Fig. 9b2 and b3), aligning with concentration maxima under southeasterly winds (Fig. 10b2 and b3). Elevated SOA under easterly winds and higher wind speeds corresponds to increased PBLH, facilitating precursor transport. This aligns with southeastern monsoon flows conveying biogenic precursors from southern forests (Wang et al., 2017). Summer SOA peaks at lower wind speeds suggest local formation alongside regional transport, whereas autumn patterns emphasize stronger transport. In winter, SOA sources expand to the NCP (Fig. 9b4), with peaks under northerly winds (Fig. 10b4). Associated higher PBLH indicates substantial long-range northern transport contributions to winter SOA.
Sulfate source regions predominantly localize within the YRD in summer (Fig. 9c2), with concentration maxima at low WS (Fig. 10c2), underscoring the prevalence of local photochemical formation under elevated T. In spring, autumn, and winter, these regions shift northward to the NCP (Fig. 9c), exhibiting more dispersed high-concentration patterns in pollution roses (Fig. 10c1, c3, and c4), indicative of enhanced regional transport. This seasonal dichotomy aligns with sulfate's diurnal patterns. Furthermore, elevated sulfate concentrations under higher WS and PBLH across all seasons reinforce the significance of long-range transport.
Nitrate source regions localize proximate to the NUIST site in summer (Fig. 9d2), with concentration maxima at low WS (Fig. 10d2), attributable to nitrate's elevated volatility and constrained transport under warm conditions. In winter, nitrate sources coincide with those of SOA (Fig. 9d4), promoted by low T and high RH that enhance aqueous-phase formation. Winter nitrate peaks manifest at higher WS in the pollution rose (Fig. 10d4), inversely correlating with PBLH distribution, thereby emphasizing the shallow boundary layer contribution to nitrate accumulation via inhibited vertical dispersion and expedited chemical production.
These results elucidate the interactions among local emissions, regional transport, and meteorological factors (e.g., WD, PBLH) in determining PM2.5 chemical composition. The differentiated source patterns emphasize the imperative for tailored emission control strategies, including reductions in industrial and combustion sources within the YRD and northern provinces to attenuate winter POA and nitrate, as well as regulation of biogenic precursors to curtail summer SOA.
This study reveals distinct seasonal and diurnal patterns in PM2.5 chemical composition and their interactions with meteorological factors, particularly PBLH. PM2.5 exhibits pronounced seasonal variations, ranging from 20.4 µg m−3 in July to 48.3 µg m−3 in December. Stable meteorological conditions, characterized by low PBLH (e.g., 673.4 m in winter) and low WS, promote the accumulation of primary aerosols, including POA, BC, and chloride, particularly during winter haze episodes. Secondary aerosols, mainly including SOA, sulfate, and nitrate, show strong T dependencies, with SOA and sulfate peaking in summer due to intense photochemical oxidation, while nitrate dominates in winter under low T and high RH.
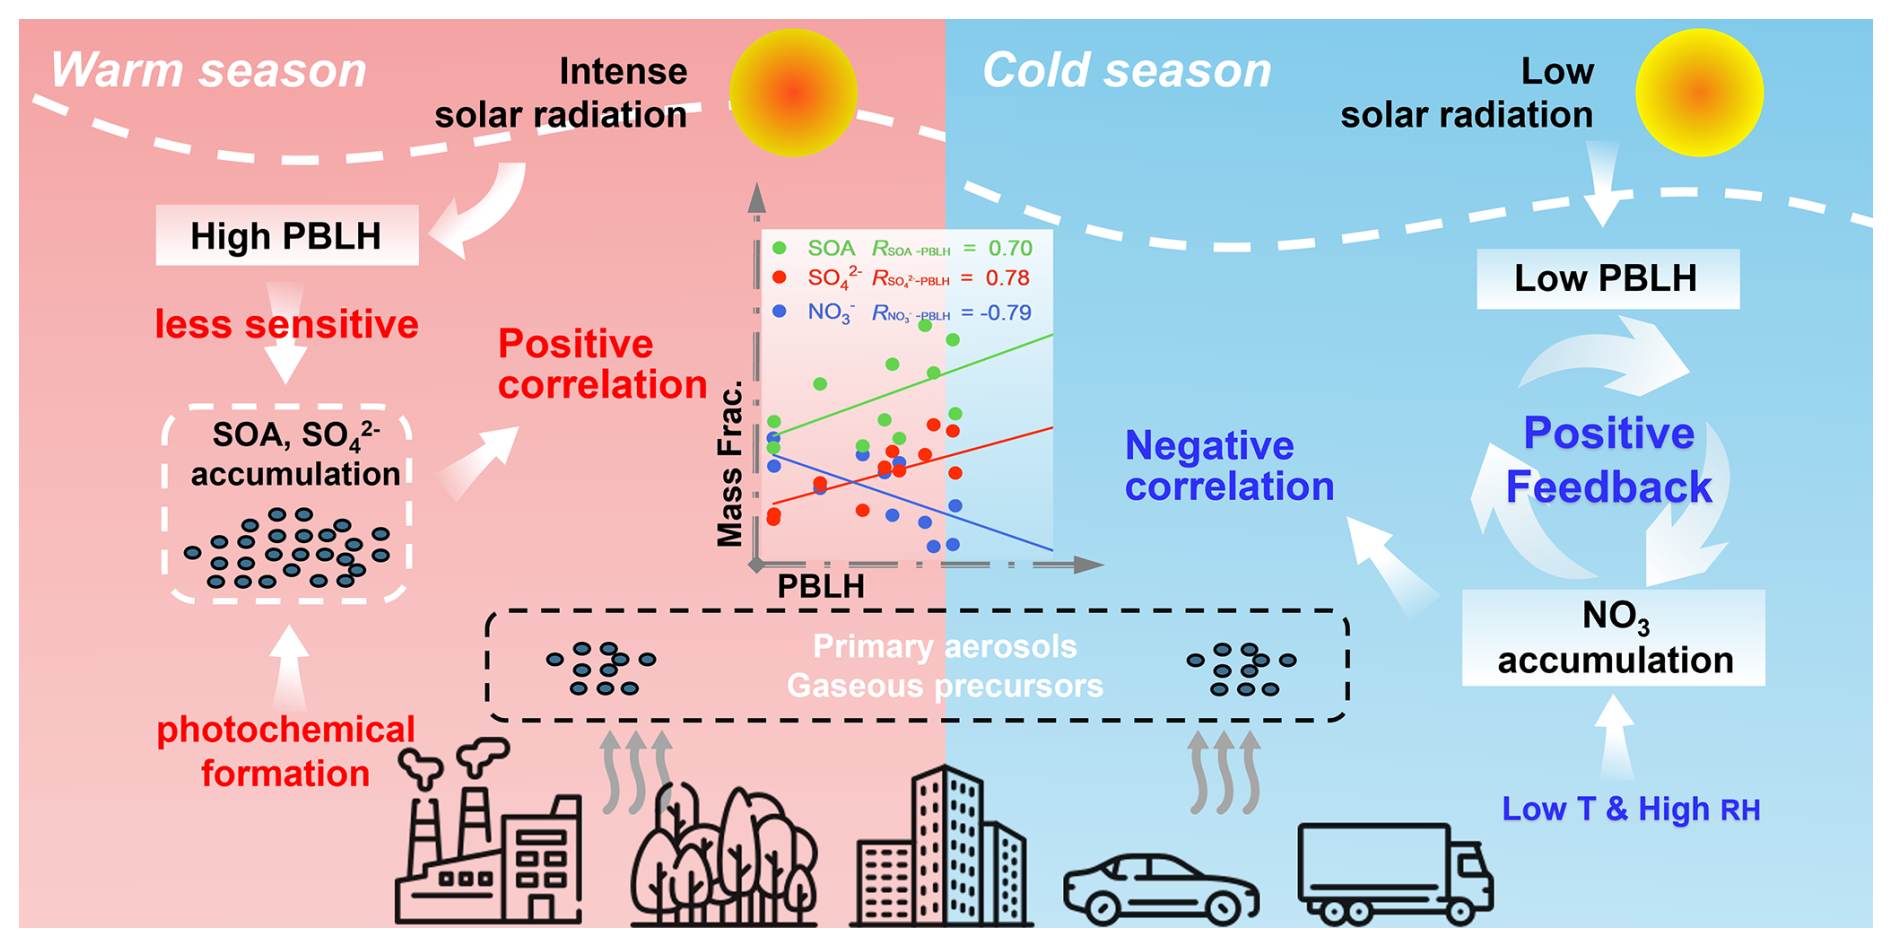
Figure 11Schematic diagram illustrating seasonal contrasts in the relationships between PBLH and PM2.5 chemical components. During the warm season, intense photochemical oxidation under elevated PBLH enhances the formation of SOA and sulfate, both of which exhibit relatively low sensitivity to PBLH variations. In contrast, the cold season features lower PBLH, which facilitates nitrate formation and accumulation, reinforced by a strong positive feedback loop between heightened aerosol loading and boundary layer suppression.
PBLH differentially modulates PM2.5 chemical components, with underlying mechanisms depicted in Fig. 11. High PBLH facilitates the dispersion of primary aerosols and nitrate, significantly reducing their mass concentrations, especially during daytime in warmer seasons. However, SOA and sulfate accumulation persist under high PBLH due to robust photochemical formation, and thus they are less sensitive to PBLH variations. In a cold and humid winter, low PBLH facilitates nitrate formation and accumulation, which in turn further inhibits the development of PBL, establishing a positive feedback loop that leads to an explosive growth in nitrate concentrations. Diurnal variations further highlight PBLH's role: primary aerosols show bimodal patterns linked to traffic emissions, while SOA and sulfate increase during daytime due to photochemical activity, moderated by PBLH-driven dispersion. POA is influenced by local emissions and long-range transport from the north in winter. SOA sources concentrate in southeastern hilly forest areas in summer and autumn, driven by biogenic precursor transport, while winter SOA aligns with northern coal combustion sources under low PBLH. Sulfate sources localize within the YRD in summer but shift to the NCP in other seasons, reflecting regional transport. Nitrate sources cluster near the NUIST site in summer due to its volatility, but align with northern sources in winter, enhanced by aqueous-phase formation and low PBLH.
These findings underscore the complex interplay of local emissions, regional transport, and meteorological factors in shaping PM2.5 pollution in the YRD. The differential responses of PM2.5 chemical components to PBLH highlight the need for targeted air quality strategies. Reducing industrial and combustion emissions in the YRD and northern regions can mitigate winter POA and nitrate pollution, while controlling volatile organic compound emissions is critical for reducing summer SOA. Targeted traffic, precursor, and NOx emissions at critical periods can effectively mitigate both primary and secondary aerosol formation. These insights provide a scientific foundation for developing season-specific air quality management policies in Nanjing and the broader YRD, addressing both local and regional pollution sources to improve public health and environmental quality.
Data used in the study are available at https://doi.org/10.57760/sciencedb.32420 (Wang, 2025). It is also available from the corresponding author upon request (yuyingwang@nuist.edu.cn).
The supplement related to this article is available online at https://doi.org/10.5194/acp-25-18599-2025-supplement.
YW designed the experiment. The aerosol data analysis was performed by JX, YZ and YW. JX, JZ, ZH, RZ and YW participated in the field campaign. Other co-authors participated in science discussions and suggested analyses. The paper was written by JX with contributions from all co-authors.
The contact author has declared that none of the authors has any competing interests.
Publisher's note: Copernicus Publications remains neutral with regard to jurisdictional claims made in the text, published maps, institutional affiliations, or any other geographical representation in this paper. While Copernicus Publications makes every effort to include appropriate place names, the final responsibility lies with the authors. Views expressed in the text are those of the authors and do not necessarily reflect the views of the publisher.
We thank all participants in the field campaign for their tireless work and cooperation.
This work is funded by National Natural Science Foundation of China (NSFC) research projects (grant nos. 42030606 and 42575093).
This paper was edited by Yuan Wang and reviewed by four anonymous referees.
Aiken, A. C., Salcedo, D., Cubison, M. J., Huffman, J. A., DeCarlo, P. F., Ulbrich, I. M., Docherty, K. S., Sueper, D., Kimmel, J. R., Worsnop, D. R., Trimborn, A., Northway, M., Stone, E. A., Schauer, J. J., Volkamer, R. M., Fortner, E., de Foy, B., Wang, J., Laskin, A., Shutthanandan, V., Zheng, J., Zhang, R., Gaffney, J., Marley, N. A., Paredes-Miranda, G., Arnott, W. P., Molina, L. T., Sosa, G., and Jimenez, J. L.: Mexico City aerosol analysis during MILAGRO using high resolution aerosol mass spectrometry at the urban supersite (T0) – Part 1: Fine particle composition and organic source apportionment, Atmos. Chem. Phys., 9, 6633–6653, https://doi.org/10.5194/acp-9-6633-2009, 2009.
Alexander, B., Sherwen, T., Holmes, C. D., Fisher, J. A., Chen, Q., Evans, M. J., and Kasibhatla, P.: Global inorganic nitrate production mechanisms: comparison of a global model with nitrate isotope observations, Atmos. Chem. Phys., 20, 3859–3877, https://doi.org/10.5194/acp-20-3859-2020, 2020.
Beelen, R., Hoek, G., Raaschou-Nielsen, O., Stafoggia, M., Andersen, Z. J., Weinmayr, G., Hoffmann, B., Wolf, K., Samoli, E., Fischer, P. H., Nieuwenhuijsen, M. J., Xun, W. W., Katsouyanni, K., Dimakopoulou, K., Marcon, A., Vartiainen, E., Lanki, T., Yli-Tuomi, T., Oftedal, B., Schwarze, P. E., Nafstad, P., De Faire, U., Pedersen, N. L., Östenson, C.-G., Fratiglioni, L., Penell, J., Korek, M., Pershagen, G., Eriksen, K. T., Overvad, K., Sørensen, M., Eeftens, M., Peeters, P. H., Meliefste, K., Wang, M., Bueno-de-Mesquita, H. B., Sugiri, D., Krämer, U., Heinrich, J., de Hoogh, K., Key, T., Peters, A., Hampel, R., Concin, H., Nagel, G., Jaensch, A., Ineichen, A., Tsai, M.-Y., Schaffner, E., Probst-Hensch, N. M., Schindler, C., Ragettli Martina, S., Vilier, A., Clavel-Chapelon, F., Declercq, C., Ricceri, F., Sacerdote, C., Galassi, C., Migliore, E., Ranzi, A., Cesaroni, G., Badaloni, C., Forastiere, F., Katsoulis, M., Trichopoulou, A., Keuken, M., Jedynska, A., Kooter, I. M., Kukkonen, J., Sokhi, R. S., Vineis, P., and Brunekreef, B.: Natural-Cause Mortality and Long-Term Exposure to Particle Components: An Analysis of 19 European Cohorts within the Multi-Center ESCAPE Project, Environ. Health Perspect., 123, 525–533, https://doi.org/10.1289/ehp.1408095, 2015.
Campbell, J. R., Hlavka, D. L., Welton, E. J., Flynn, C. J., Turner, D. D., Spinhirne, J. D., Scott, V. S., and Hwang, I. H.: Full-Time, Eye-Safe Cloud and Aerosol Lidar Observation at Atmospheric Radiation Measurement Program Sites: Instruments and Data Processing, J. Atmos. Ocean. Technol., 19, 431–442, https://doi.org/10.1175/1520-0426(2002)019<0431:FTESCA>2.0.CO;2, 2002.
Canagaratna, M. R., Jayne, J. T., Jimenez, J. L., Allan, J. D., Alfarra, M. R., Zhang, Q., Onasch, T. B., Drewnick, F., Coe, H., Middlebrook, A., Delia, A., Williams, L. R., Trimborn, A. M., Northway, M. J., DeCarlo, P. F., Kolb, C. E., Davidovits, P., and Worsnop, D. R.: Chemical and microphysical characterization of ambient aerosols with the aerodyne aerosol mass spectrometer, Mass Spectrom. Rev., 26, 185–222, https://doi.org/10.1002/mas.20115, 2007.
Canonaco, F., Crippa, M., Slowik, J. G., Baltensperger, U., and Prévôt, A. S. H.: SoFi, an IGOR-based interface for the efficient use of the generalized multilinear engine (ME-2) for the source apportionment: ME-2 application to aerosol mass spectrometer data, Atmos. Meas. Tech., 6, 3649–3661, https://doi.org/10.5194/amt-6-3649-2013, 2013.
Cao, M., Li, W., Ge, P., Chen, M., and Wang, J.: Seasonal variations and potential sources of biomass burning tracers in particulate matter in Nanjing aerosols during 2017–2018, Chemosphere, 303, 135015, https://doi.org/10.1016/j.chemosphere.2022.135015, 2022.
Cheng, M. D., Hopke, P. K., Barrie, L., Rippe, A., Olson, M., and Landsberger, S.: Qualitative determination of source regions of aerosol in Canadian high Arctic, Environ. Sci. Technol., 27, 2063–2071, https://doi.org/10.1021/es00047a011, 1993.
Crippa, M., Canonaco, F., Slowik, J. G., El Haddad, I., DeCarlo, P. F., Mohr, C., Heringa, M. F., Chirico, R., Marchand, N., Temime-Roussel, B., Abidi, E., Poulain, L., Wiedensohler, A., Baltensperger, U., and Prévôt, A. S. H.: Primary and secondary organic aerosol origin by combined gas-particle phase source apportionment, Atmos. Chem. Phys., 13, 8411–8426, https://doi.org/10.5194/acp-13-8411-2013, 2013.
Ehn, M., Thornton, J. A., Kleist, E., Sipilä, M., Junninen, H., Pullinen, I., Springer, M., Rubach, F., Tillmann, R., Lee, B., Lopez-Hilfiker, F., Andres, S., Acir, I.-H., Rissanen, M., Jokinen, T., Schobesberger, S., Kangasluoma, J., Kontkanen, J., Nieminen, T., Kurtén, T., Nielsen, L. B., Jørgensen, S., Kjaergaard, H. G., Canagaratna, M., Maso, M. D., Berndt, T., Petäjä, T., Wahner, A., Kerminen, V.-M., Kulmala, M., Worsnop, D. R., Wildt, J., and Mentel, T. F.: A large source of low-volatility secondary organic aerosol, Nature, 506, 476–479, https://doi.org/10.1038/nature13032, 2014.
Fu, Z., Cheng, L., Ye, X., Ma, Z., Wang, R., Duan, Y., Juntao, H., and Chen, J.: Characteristics of aerosol chemistry and acidity in Shanghai after PM2.5 satisfied national guideline: Insight into future emission control, Sci. Total Environ., 827, 154319, https://doi.org/10.1016/j.scitotenv.2022.154319, 2022.
Griffith, S. M., Huang, X. H. H., Louie, P. K. K., and Yu, J. Z.: Characterizing the thermodynamic and chemical composition factors controlling PM2.5 nitrate: Insights gained from two years of online measurements in Hong Kong, Atmos. Environ., 122, 864–875, https://doi.org/10.1016/j.atmosenv.2015.02.009, 2015.
Han, Z., Wang, Y., Xu, J., Shang, Y., Li, Z., Lu, C., Zhan, P., Song, X., Lv, M., and Yang, Y.: Assessment of Multiple Planetary Boundary Layer Height Retrieval Methods and Their Impact on PM2.5 and Its Chemical Compositions throughout a Year in Nanjing, Remote Sens., 16, 3464, https://doi.org/10.3390/rs16183464, 2024.
Hu, W., Campuzano-Jost, P., Day, D. A., Croteau, P., Canagaratna, M. R., Jayne, J. T., Worsnop, D. R., and Jimenez, J. L.: Evaluation of the new capture vaporizer for aerosol mass spectrometers (AMS) through field studies of inorganic species, Aerosol Sci. Technol., 51, 735–754, https://doi.org/10.1080/02786826.2017.1296104, 2017.
Huang, D. D., Kong, L., Gao, J., Lou, S., Qiao, L., Zhou, M., Ma, Y., Zhu, S., Wang, H., Chen, S., Zeng, L., and Huang, C.: Insights into the formation and properties of secondary organic aerosol at a background site in Yangtze River Delta region of China: Aqueous-phase processing vs. photochemical oxidation, Atmos. Environ., 239, 117716, https://doi.org/10.1016/j.atmosenv.2020.117716, 2020.
Huang, X., Wang, Y., Shang, Y., Song, X., Zhang, R., Wang, Y., Li, Z., and Yang, Y.: Contrasting the effect of aerosol properties on the planetary boundary layer height in Beijing and Nanjing, Atmos. Environ., 308, 119861, https://doi.org/10.1016/j.atmosenv.2023.119861, 2023.
Kang, H., Zhu, B., de Leeuw, G., Yu, B., van der A, R. J., and Lu, W.: Impact of urban heat island on inorganic aerosol in the lower free troposphere: a case study in Hangzhou, China, Atmos. Chem. Phys., 22, 10623–10634, https://doi.org/10.5194/acp-22-10623-2022, 2022.
Kerminen, V.-M., Chen, X., Vakkari, V., Petäjä, T., Kulmala, M., and Bianchi, F.: Atmospheric new particle formation and growth: review of field observations, Environ. Res. Lett., 13, 103003, https://doi.org/10.1088/1748-9326/aadf3c, 2018.
Kuang, Y., He, Y., Xu, W., Yuan, B., Zhang, G., Ma, Z., Wu, C., Wang, C., Wang, S., Zhang, S., Tao, J., Ma, N., Su, H., Cheng, Y., Shao, M., and Sun, Y.: Photochemical Aqueous-Phase Reactions Induce Rapid Daytime Formation of Oxygenated Organic Aerosol on the North China Plain, Environ. Sci. Technol., 54, 3849–3860, https://doi.org/10.1021/acs.est.9b06836, 2020.
Li, Y., Ren, H., Zhou, S., Pei, C., Gao, M., Liang, Y., Ye, D., Sun, X., Li, F., Zhao, J., Hang, J., Fan, S., and Fu, P.: Tower-based profiles of wintertime secondary organic aerosols in the urban boundary layer over Guangzhou, Sci. Total Environ., 950, 175326, https://doi.org/10.1016/j.scitotenv.2024.175326, 2024.
Liu, T., Chan, A. W. H., and Abbatt, J. P. D.: Multiphase Oxidation of Sulfur Dioxide in Aerosol Particles: Implications for Sulfate Formation in Polluted Environments, Environ. Sci. Technol., 55, 4227–4242, https://doi.org/10.1021/acs.est.0c06496, 2021.
Lu, Y., Zhu, B., Huang, Y., Shi, S., Wang, H., An, J., and Yu, X.: Vertical distributions of black carbon aerosols over rural areas of the Yangtze River Delta in winter, Sci. Total Environ., 661, 1–9, https://doi.org/10.1016/j.scitotenv.2019.01.170, 2019.
Minoura, H. and Shimo, N.: Spatial distribution of particle number concentration and its volume change in the planetary boundary layer over Tokyo and its suburban areas, Atmos. Environ., 45, 4603–4610, https://doi.org/10.1016/j.atmosenv.2011.05.064, 2011.
Mohr, C., DeCarlo, P. F., Heringa, M. F., Chirico, R., Slowik, J. G., Richter, R., Reche, C., Alastuey, A., Querol, X., Seco, R., Peñuelas, J., Jiménez, J. L., Crippa, M., Zimmermann, R., Baltensperger, U., and Prévôt, A. S. H.: Identification and quantification of organic aerosol from cooking and other sources in Barcelona using aerosol mass spectrometer data, Atmos. Chem. Phys., 12, 1649–1665, https://doi.org/10.5194/acp-12-1649-2012, 2012.
Ng, N. L., Herndon, S. C., Trimborn, A., Canagaratna, M. R., Croteau, P. L., Onasch, T. B., Sueper, D., Worsnop, D. R., Zhang, Q., Sun, Y. L., and Jayne, J. T.: An Aerosol Chemical Speciation Monitor (ACSM) for Routine Monitoring of the Composition and Mass Concentrations of Ambient Aerosol, Aerosol Sci. Technol., 45, 780–794, https://doi.org/10.1080/02786826.2011.560211, 2011.
Peng, W., Zhu, B., Kang, H., Chen, K., Lu, W., Lu, C., Kang, N., Hu, J., Chen, H., and Liao, H.: Inconsistent 3-D Structures and Sources of Sulfate Ammonium and Nitrate Ammonium Aerosols During Cold Front Episodes, J. Geophys. Res.-Atmos., 129, https://doi.org/10.1029/2023jd039958, 2024.
Polissar, A. V., Hopke, P. K., Paatero, P., Kaufmann, Y. J., Hall, D. K., Bodhaine, B. A., Dutton, E. G., and Harris, J. M.: The aerosol at Barrow, Alaska: long-term trends and source locations, Atmos. Environ., 33, 2441–2458, https://doi.org/10.1016/S1352-2310(98)00423-3, 1999.
Pui, D. Y. H., Chen, S.-C., and Zuo, Z.: PM2.5 in China: Measurements, sources, visibility and health effects, and mitigation, Particuology, 13, 1–26, https://doi.org/10.1016/j.partic.2013.11.001, 2014.
Si, Y., Li, S., Chen, L., Yu, C., Wang, H., and Wang, Y.: Impact of precursor gases and meteorological variables on satellite-estimated near-surface sulfate and nitrate concentrations over the North China Plain, Atmos. Environ., 199, 345–356, https://doi.org/10.1016/j.atmosenv.2018.11.030, 2019.
Song, X., Wang, Y., Huang, X., Wang, Y., Li, Z., Zhu, B., Ren, R., An, J., Yan, J., Zhang, R., Shang, Y., and Zhan, P.: The Impacts of Dust Storms With Different Transport Pathways on Aerosol Chemical Compositions and Optical Hygroscopicity of Fine Particles in the Yangtze River Delta, J. Geophys. Res.-Atmos., 128, https://doi.org/10.1016/j.atmosenv.2013.06.019, 2023.
Su, T., Li, Z., Li, C., Li, J., Han, W., Shen, C., Tan, W., Wei, J., and Guo, J.: The significant impact of aerosol vertical structure on lower atmosphere stability and its critical role in aerosol–planetary boundary layer (PBL) interactions, Atmos. Chem. Phys., 20, 3713–3724, https://doi.org/10.5194/acp-20-3713-2020, 2020.
Sun, Y., Wang, Z., Fu, P., Jiang, Q., Yang, T., Li, J., and Ge, X.: The impact of relative humidity on aerosol composition and evolution processes during wintertime in Beijing, China, Atmos. Environ., 77, 927–934, https://doi.org/10.1016/j.atmosenv.2013.06.019, 2013a.
Sun, Y., Xu, W., Zhang, Q., Jiang, Q., Canonaco, F., Prévôt, A. S. H., Fu, P., Li, J., Jayne, J., Worsnop, D. R., and Wang, Z.: Source apportionment of organic aerosol from 2-year highly time-resolved measurements by an aerosol chemical speciation monitor in Beijing, China, Atmos. Chem. Phys., 18, 8469–8489, https://doi.org/10.5194/acp-18-8469-2018, 2018.
Sun, Y. L., Wang, Z. F., Fu, P. Q., Yang, T., Jiang, Q., Dong, H. B., Li, J., and Jia, J. J.: Aerosol composition, sources and processes during wintertime in Beijing, China, Atmos. Chem. Phys., 13, 4577–4592, https://doi.org/10.5194/acp-13-4577-2013, 2013b.
Sun, Y. L., Wang, Z. F., Du, W., Zhang, Q., Wang, Q. Q., Fu, P. Q., Pan, X. L., Li, J., Jayne, J., and Worsnop, D. R.: Long-term real-time measurements of aerosol particle composition in Beijing, China: seasonal variations, meteorological effects, and source analysis, Atmos. Chem. Phys., 15, 10149–10165, https://doi.org/10.5194/acp-15-10149-2015, 2015.
Takeuchi, M., Berkemeier, T., Eris, G., and Ng, N. L.: Non-linear effects of secondary organic aerosol formation and properties in multi-precursor systems, Nat. Commun., 13, 7883, https://doi.org/10.1038/s41467-022-35546-1, 2022.
Ulbrich, I. M., Canagaratna, M. R., Zhang, Q., Worsnop, D. R., and Jimenez, J. L.: Interpretation of organic components from Positive Matrix Factorization of aerosol mass spectrometric data, Atmos. Chem. Phys., 9, 2891–2918, https://doi.org/10.5194/acp-9-2891-2009, 2009.
Wang, H., Zhu, B., Shen, L., Xu, H., An, J., Xue, G., and Cao, J.: Water-soluble ions in atmospheric aerosols measured in five sites in the Yangtze River Delta, China: Size-fractionated, seasonal variations and sources, Atmos. Environ., 123, 370–379, https://doi.org/10.1016/j.atmosenv.2015.05.070, 2015.
Wang, J., Ge, X., Chen, Y., Shen, Y., Zhang, Q., Sun, Y., Xu, J., Ge, S., Yu, H., and Chen, M.: Highly time-resolved urban aerosol characteristics during springtime in Yangtze River Delta, China: insights from soot particle aerosol mass spectrometry, Atmos. Chem. Phys., 16, 9109–9127, https://doi.org/10.5194/acp-16-9109-2016, 2016.
Wang, Y.: NUIST aerosol chemical composition and PBLH (V1), Science Data Bank [data set], https://doi.org/10.57760/sciencedb.32420, 2025.
Wang, Y., Li, Z., Zhang, Y., Du, W., Zhang, F., Tan, H., Xu, H., Fan, T., Jin, X., Fan, X., Dong, Z., Wang, Q., and Sun, Y.: Characterization of aerosol hygroscopicity, mixing state, and CCN activity at a suburban site in the central North China Plain, Atmos. Chem. Phys., 18, 11739–11752, https://doi.org/10.5194/acp-18-11739-2018, 2018.
Wang, Y., Li, Z., Wang, Q., Jin, X., Yan, P., Cribb, M., Li, Y., Yuan, C., Wu, H., Wu, T., Ren, R., and Cai, Z.: Enhancement of secondary aerosol formation by reduced anthropogenic emissions during Spring Festival 2019 and enlightenment for regional PM2.5 control in Beijing, Atmos. Chem. Phys., 21, 915–926, https://doi.org/10.5194/acp-21-915-2021, 2021.
Wang, Y. Q.: MeteoInfo: GIS software for meteorological data visualization and analysis, Meteorol. Appl., 21, 360–368, https://doi.org/10.1002/met.1345, 2014.
Wang, Z., Lin, L., Yang, M., Xu, Y., and Li, J.: Disentangling fast and slow responses of the East Asian summer monsoon to reflecting and absorbing aerosol forcings, Atmos. Chem. Phys., 17, 11075–11088, https://doi.org/10.5194/acp-17-11075-2017, 2017.
Wu, G., Li, Z., Fu, C., Zhang, X., Zhang, R., Zhang, R., Zhou, T., Li, J., Li, J., Zhou, D., Wu, L., Zhou, L., He, B., and Huang, R.: Advances in studying interactions between aerosols and monsoon in China, Sci. China Earth Sci., 59, 1–16, https://doi.org/10.1007/s11430-015-5198-z, 2016.
Wu, Y., Wang, Y., Zhou, Y., Liu, X., Tang, Y., Wang, Y., Zhang, R., and Li, Z.: The wet scavenging of air pollutants through artificial precipitation enhancement: A case study in the Yangtze River Delta, Front. Environ. Sci., 10, https://doi.org/10.3389/fenvs.2022.1027902, 2022.
Xian, J., Cui, S., Chen, X., Wang, J., Xiong, Y., Gu, C., Wang, Y., Zhang, Y., Li, H., Wang, J., and Ge, X.: Online chemical characterization of atmospheric fine secondary aerosols and organic nitrates in summer Nanjing, China, Atmos. Res., 290, 106783, https://doi.org/10.1016/j.atmosres.2023.106783, 2023.
Xu, J., Zhang, Q., Chen, M., Ge, X., Ren, J., and Qin, D.: Chemical composition, sources, and processes of urban aerosols during summertime in northwest China: insights from high-resolution aerosol mass spectrometry, Atmos. Chem. Phys., 14, 12593–12611, https://doi.org/10.5194/acp-14-12593-2014, 2014.
Xu, P., Yang, Y., Gao, W., Huang, W., Yu, Y., Hu, B., Hu, J., Gao, D., Geng, J., Liu, Y., Wang, S., Kong, F., and Wang, Y.: Comprehensive the seasonal characterization of atmospheric submicron particles at urban sites in the North China Plain, Atmos. Res., 304, 107388, https://doi.org/10.1016/j.atmosres.2024.107388, 2024.
Yang, Y., Li, Z., Guo, J., Wang, Y., Wu, H., Shang, Y., Wang, Y., Zhu, L., and Yan, X.: Revolutionizing Clear-Sky Humidity Profile Retrieval with Multi-Angle-Aware Networks for Ground-Based Microwave Radiometers, J. Remote Sens., 5, https://doi.org/10.34133/remotesensing.0736, 2025.
Zhang, Y., Sun, Y., Du, W., Wang, Q., Chen, C., Han, T., Lin, J., Zhao, J., Xu, W., Gao, J., Li, J., Fu, P., Wang, Z., and Han, Y.: Response of aerosol composition to different emission scenarios in Beijing, China, Sci. Total Environ., 571, 902–908, https://doi.org/10.1016/j.scitotenv.2016.07.073, 2016.
Zhang, Y., Tang, L., Croteau, P. L., Favez, O., Sun, Y., Canagaratna, M. R., Wang, Z., Couvidat, F., Albinet, A., Zhang, H., Sciare, J., Prévôt, A. S. H., Jayne, J. T., and Worsnop, D. R.: Field characterization of the PM2.5 Aerosol Chemical Speciation Monitor: insights into the composition, sources, and processes of fine particles in eastern China, Atmos. Chem. Phys., 17, 14501–14517, https://doi.org/10.5194/acp-17-14501-2017, 2017.
Zhang, Y., Du, W., Wang, Y., Wang, Q., Wang, H., Zheng, H., Zhang, F., Shi, H., Bian, Y., Han, Y., Fu, P., Canonaco, F., Prévôt, A. S. H., Zhu, T., Wang, P., Li, Z., and Sun, Y.: Aerosol chemistry and particle growth events at an urban downwind site in North China Plain, Atmos. Chem. Phys., 18, 14637–14651, https://doi.org/10.5194/acp-18-14637-2018, 2018.
Zhong, S., Qian, Y., Sarangi, C., Zhao, C., Leung, R., Wang, H., Yan, H., Yang, T., and Yang, B.: Urbanization Effect on Winter Haze in the Yangtze River Delta Region of China, Geophys. Res. Lett., 45, 6710–6718, https://doi.org/10.1029/2018GL077239, 2018.
Zhu, W., Zhou, M., Cheng, Z., Yan, N., Huang, C., Qiao, L., Wang, H., Liu, Y., Lou, S., and Guo, S.: Seasonal variation of aerosol compositions in Shanghai, China: Insights from particle aerosol mass spectrometer observations, Sci. Total Environ., 771, 144948, https://doi.org/10.1016/j.scitotenv.2021.144948, 2021.