the Creative Commons Attribution 4.0 License.
the Creative Commons Attribution 4.0 License.
 | 19 Dec 2025
Aerosol effects on convective storms under pseudo-global warming conditions: insights from case studies in Germany
Lina Lucas
Christian Barthlott
Corinna Hoose
Peter Knippertz
Germany is heading toward a future with warmer temperatures due to climate change, and potentially cleaner air from electrification and stricter emission regulations. But how will these evolving environmental conditions affect severe convective storms? This study addresses this question by simulating three supercell events in high resolution using the ICOsahedral Non-hydrostatic (ICON) model. The events observed during the Swabian MOSES field campaigns in 2021 and 2023 are analysed using the pseudo-global warming approach to assess their evolution in a warmer climate. The effects of aerosols on clouds and precipitation were considered using a two-moment microphysics scheme in four temperature rise scenarios, providing detailed insights into the underlying microphysical mechanisms. The results indicate that higher temperatures generally enhance convection, resulting in more intense convective cells, increased precipitation amounts, and more extreme rainfall and hail events. Additionally, warmer conditions increase the likelihood of supercell formation and more intense mesocyclones. In some cases, precipitation increases exceed 7 % K−1, indicating super-Clausius–Clapeyron scaling and suggesting that additional dynamical and microphysical processes amplify rainfall beyond thermodynamic expectations. An important finding is that hailstones grow larger under lower cloud condensation nuclei (CCN) concentrations, and the area affected by large hail expands by up to 400 %, indicating growing severity and reach of hail events. In addition, lower CCN concentrations are associated with a reduced cold-to-warm rain formation ratio and decreased precipitation efficiency. These aerosol-related effects appear largely independent of temperature, showing consistent patterns across all simulated warming scenarios. These findings indicate the intensity of severe weather events, such as convective storms and flash floods, may increase in a future climate.
- Article
(9132 KB) - Full-text XML
- BibTeX
- EndNote


Convective storms, particularly supercells, are significant weather phenomena known for their destructive potential. They can produce severe weather events such as heavy rainfall, strong winds, lightning, and large hail (Markowski and Richardson, 2010). For example, from 22 to 24 June 2021, multiple severe hailstorms struck southern Germany, France, Switzerland, Austria, and the Czech Republic, resulting in approximately EUR 4 billion of damage (Kunz et al., 2022). On 23 June 2021, a supercell formed in southwestern Germany, resulting in hailstones reaching maximum diameters of up to 4 cm and ground hail accumulations reaching depths of 30 cm, accompanied by heavy rainfall, and associated flooding (Kunz et al., 2022). In Europe, the highest hail frequencies occur during summer along the slopes of high mountain ridges, such as the Alps, Pyrenees, and the Carpathians, aligning with observed lightning hotspots (Cui et al., 2025). However, maps of mesocyclonic storm tracks between April and September 2013 to 2017 show that there is no particular region prone to supercells in Germany (Wapler, 2021). In recent years, the frequency of weather-related hazards has increased, largely attributed to a warming climate (Hoeppe, 2016; Rädler et al., 2018; Púčik et al., 2019; Taszarek et al., 2019; Raupach et al., 2021). In the period 1950–2021, additive logistic models applied to the ERA5 reanalysis indicate significant increases of lightning and hail across most of Europe (Battaglioli et al., 2023). Especially Germany and the Alps experienced an increase in the annual occurrence of extreme weather events involving lightning, hail exceeding 2 cm in diameter, and wind speeds surpassing 25 m s−1 (Rädler et al., 2018).
Recent modelling studies have explored how convective storms respond to rising temperatures using the pseudo-global warming (PGW) approach, which isolates thermodynamic effects by modifying initial and boundary conditions in high-resolution simulations. In this framework, large-scale circulation patterns are preserved, but the temperature profile in the initial and boundary conditions is uniformly increased, and humidity is adjusted according to the Clausius–Clapeyron relationship under constant relative humidity. This ensures that only thermodynamic effects are perturbed, while synoptic-scale dynamics remain unchanged. These studies confirm that warming can intensify deep convection and hail production, though the magnitude and spatial characteristics of these changes vary with model configuration and regional context (Feng et al., 2024; Lin et al., 2024; Tahara et al., 2025). For example, using a PGW-approach with 3 K warming, Thurnherr et al. (2025) found an increase in summer hail frequency in northeastern Europe and a decrease to the southwest for intense and severe hail days, related to changes in low-tropospheric water vapor content, convective available potential energy (CAPE) and convective inhibition (CIN). As a result, considerable uncertainty remains regarding how convective hazards such as hailstorms or supercells will evolve in a future climate.
The Clausius–Clapeyron (CC) relationship provides a thermodynamic estimate that atmospheric moisture, and hence precipitation intensity, increases by approximately 6 %–7 % per degree of warming. However, several observational and modelling studies report larger increases, a phenomenon known as super-CC scaling. Such behaviour, where precipitation intensifies beyond 7 % K−1, has been documented in convective and orographic rainfall events (Lenderink and Van Meijgaard, 2008; Haerter and Berg, 2009; Chen et al., 2024). These deviations are thought to result from a combination of dynamic and microphysical processes, including convective organisation (Semie and Bony, 2020), stronger updraughts and latent heating (Lenderink et al., 2017), mesoscale circulations (Fowler et al., 2021), and aerosol–cloud interactions (Martinkova and Kysely, 2020). Large-scale (synoptic) forcing may also play a role. In some cases, stronger synoptic lift or enhanced moisture convergence under warming could intensify convection and contribute to super-CC responses (Fowler et al., 2021). However, the degree to which such effects contribute remains uncertain.
Alongside thermodynamic changes, aerosol concentrations, especially those of cloud condensation nuclei (CCN), play a crucial role in shaping convective storm behaviour (Tao et al., 2007; Barthlott et al., 2022b; Thomas et al., 2023). CCN influence cloud microphysics by affecting droplet formation, growth, and the phase transitions within clouds, which in turn modulate precipitation efficiency, storm dynamics, and hail formation (Fan et al., 2016; Allen et al., 2020). Due to stricter emission regulations, anthropogenic aerosol concentrations are projected to decline in North America and Europe (Smith et al., 2011; Leibensperger et al., 2012; Genz et al., 2020), while economic growth in regions such as Asia may lead to increased CCN emissions. In addition to anthropogenic sources, natural aerosols, such as dust, sea salt, volcanic emissions, and biomass burning, also contribute significantly to aerosol variability and may respond to climate drivers like temperature and wind changes (Chin et al., 2014; van Oldenborgh et al., 2021; Yli-Juuti et al., 2021). Moreover, aerosols remain a major source of uncertainty in climate projections, particularly in simulating extreme weather events (Watson-Parris and Smith, 2022) Several recent studies have reported that warming alters convective environments, favouring more intense systems while suppressing weaker ones (Rasmussen et al., 2020; Huang et al., 2024; Mallinson et al., 2024; Yang et al., 2024). For instance, Mallinson et al. (2024) observed larger hailstones primarily in the cold season, while Trapp et al. (2019) reported increases throughout the year. Using European climate simulations with a +3 K PGW-approach, Brennan et al. (2025b) found that hailstorms are projected to become more severe and frequent, but hail frequency trends vary across Europe. Despite growing interest in this area, the future behaviour of extreme convective storms remains uncertain.
In parallel, the forecasting skill of numerical weather prediction (NWP) models has improved considerably over recent decades, thanks to advances in computational power, data assimilation, and parametrisation schemes (Magnusson and Källén, 2013; Bauer et al., 2015; Buizza, 2019). However, predicting convective precipitation remains a challenge due to the complexity and non-linearity of the involved processes. Storm initiation and evolution are influenced by factors such as synoptic-scale flow, orography, and land surface heterogeneity (Kirshbaum et al., 2018). On a microphysical scale, aerosol–cloud interactions add further uncertainty. Acting as CCN, aerosols influence droplet size and precipitation processes. High CCN concentrations typically result in more numerous, smaller droplets, delaying precipitation onset but potentially intensifying storms through latent heat release at higher altitudes (Seifert et al., 2012). This process is described by the cold-phase convection invigoration theory, which suggests that enhanced freezing of supercooled droplets in polluted environments increases latent heat release in the upper parts of clouds, thereby strengthening updraughts and storm intensity (Rosenfeld et al., 2008). However, this theory remains highly debated: while some studies report stronger storms under polluted conditions, others find weaker or negligible effects depending on model setup and environmental factors (Altaratz et al., 2014; Fan et al., 2018; Igel and van den Heever, 2021). Moreover, Barthlott et al. (2022a) found a systematic decrease in precipitation with increasing aerosol loading for cases with weak synoptic forcing, but nonsystematic responses for some of the strong synoptic forcing realisations. Therefore, this study investigates the response of convective storms to global warming and aerosol effects in Germany. Its uniqueness lies in the combined consideration of temperature changes and varying CCN concentrations. This allows for a more comprehensive understanding of how multiple drivers may shape future storm behaviour. The analysis focuses on convective parameters and precipitation characteristics. While particular attention is given to supercell-relevant metrics such as updraught helicity, the domain-mean evaluations also include other forms of convection (e.g., single cells and multicells) that occurred alongside the supercells in the chosen case studies. To support this integrated analysis, the study employs high-resolution, convection-permitting simulations with the ICOsahedral Non-hydrostatic (ICON) model at a 1 km grid spacing. This fine resolution is essential for explicitly permitting convection, enabling a more accurate representation of storm dynamics and temperature-induced effects. Additionally, the double-moment microphysics scheme of Seifert and Beheng (2006) is used to simulate aerosol effects on both liquid and mixed-phase clouds. By considering both temperature and aerosol influences, this approach provides new insights into the microphysical mechanisms shaping storm intensity, precipitation patterns, and supercell development under changing environmental conditions. The study focuses on real-case simulations of supercell events in Germany, including cases from the Swabian MOSES field campaigns conducted in the summers of 2021 and 2023 in southwestern Germany (Fig. 1). The remainder of this paper is structured as follows: Sect. 2 describes the model setup, discusses cases and methodology, Sect. 3 presents the results of the evaluation, and Sect. 4 summarises the key findings and conclusions.
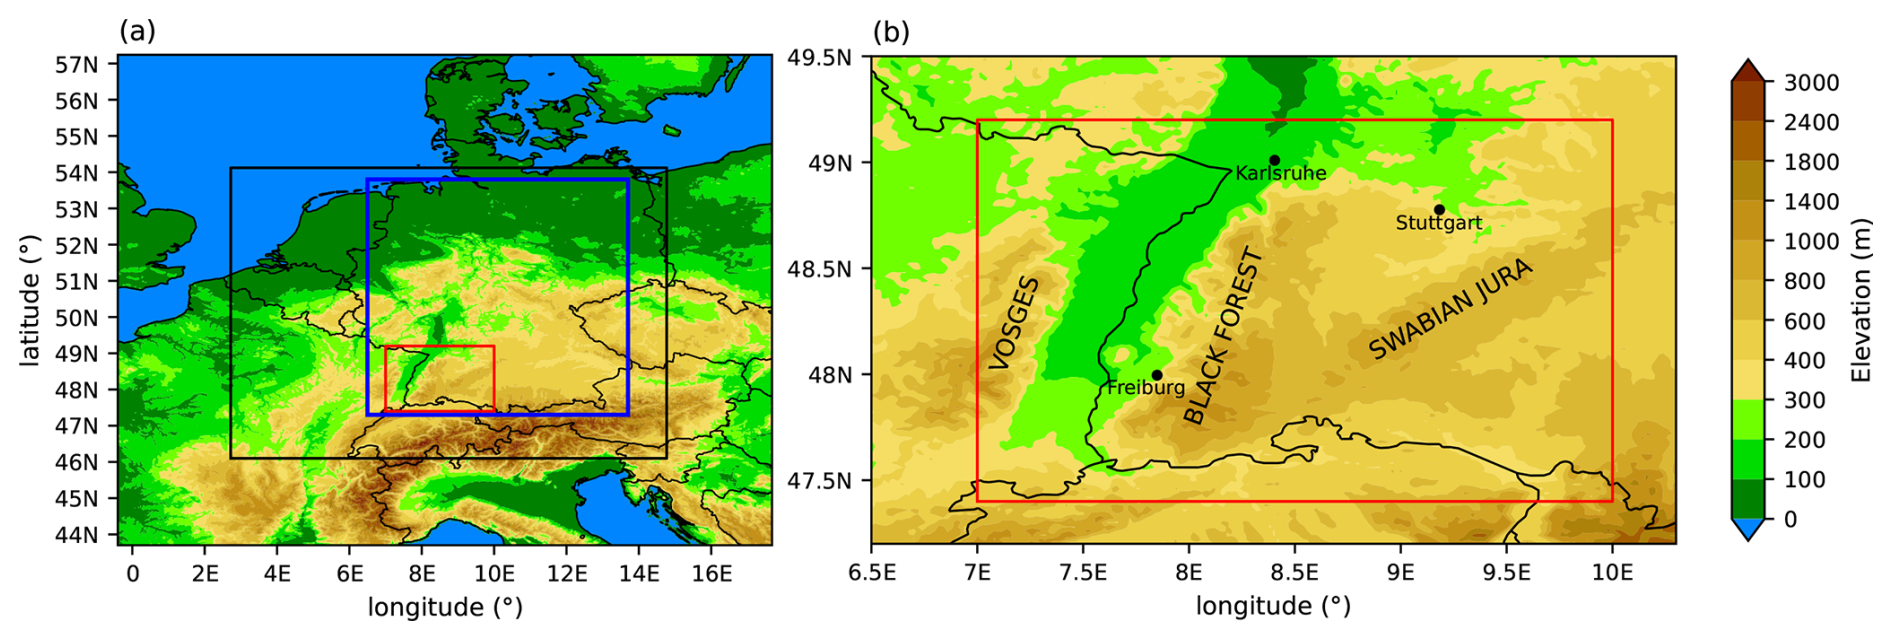
Figure 1(a) Orography of Central Europe (m a.m.s.l.) with the black box indicating the simulation domain with a 1 km grid, the blue box denoting the Germany evaluation domain, and the red box the Swabian MOSES field campaign domain. (b) Orography of the MOSES area, showing a zoomed-in view of the region marked by the red box in (a).
2.1 Model description
All simulations in this study are conducted using version 2.6.6 of the ICON model (Zängl et al., 2015), which employs an icosahedral-triangular Arakawa C grid. The simulation domain covers Germany and parts of neighbouring countries (Fig. 1), with a horizontal grid spacing of 1 km. The vertical coordinates contain 100 terrain-following levels with a model top at a height of 22 km. ICON uses the smooth level vertical (SLEVE) coordinate, allowing a faster transition to a smoother vertical grid (Schär et al., 2002; Leuenberger et al., 2010). Furthermore, the model uses the double-moment microphysics scheme of Seifert and Beheng (2006) to simulate aerosol effects on liquid and mixed-phase clouds. The scheme predicts the mass and number densities of six hydrometeor types: cloud droplets, raindrops, cloud ice, snow, graupel, and hail, and parametrises homogeneous and heterogeneous nucleation processes, including cloud condensation nuclei activation. Also, turbulence effects on droplet coalescence, raindrop breakup, and size-dependent collision efficiencies are taken into account. Ice nucleating particle (INP) concentrations were set to summertime conditions for immersion and deposition freezing in Germany (Hande et al., 2015). A time step of 10 s is used, and the data is written out every 30 min. In addition, data for tracking convective cells is written out every 5 min. Further model settings are given in Table 1.
(Hande et al., 2015)Kärcher and Lohmann (2002)Kärcher et al. (2006)Segal and Khain (2006)(Heise et al., 2006)(Raschendorfer, 2001)(Hogan and Bozzo, 2018)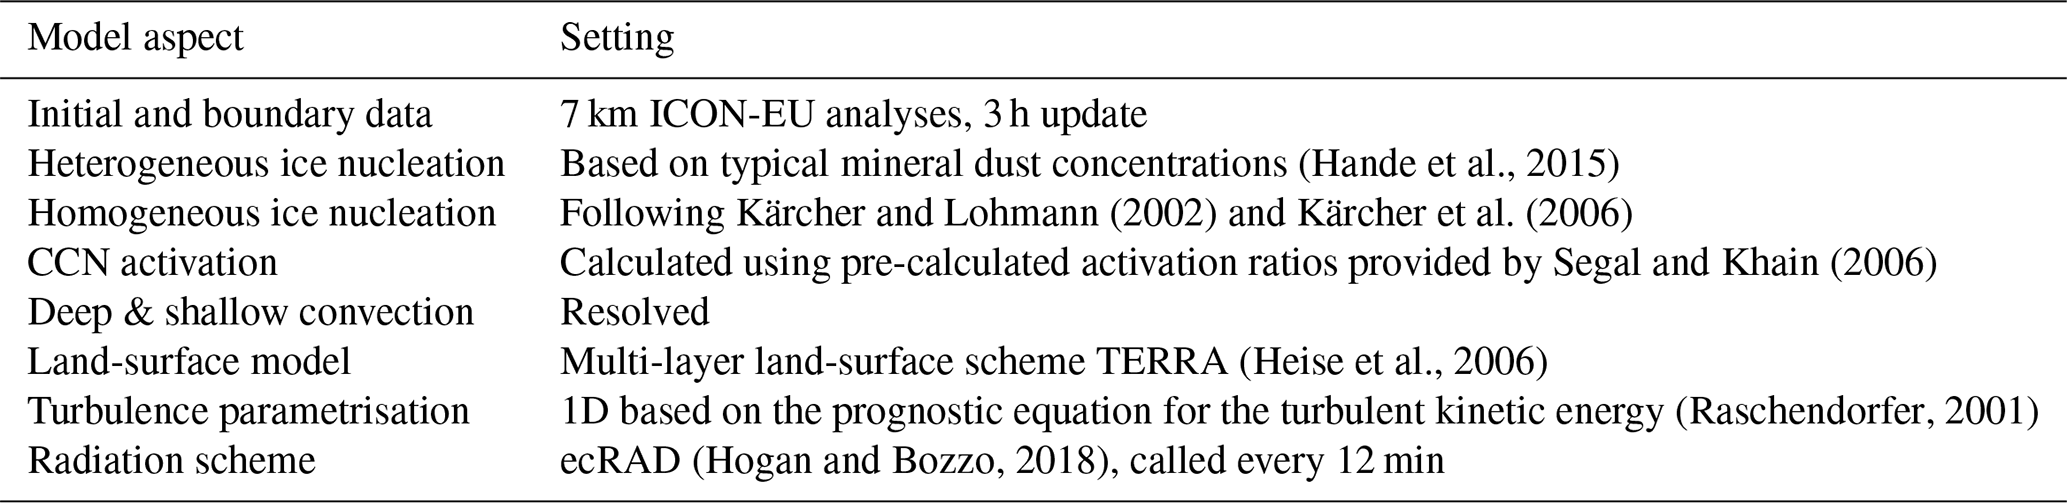
2.2 Simulations overview
To investigate the impact of aerosols on convective storms in a warmer climate, each case is simulated for five different temperatures, with four CCN concentrations applied to each scenario.
-
Temperature. This study investigates the response of convective storms to a warming climate using a PGW approach (Brogli et al., 2023). For each day, five temperature scenarios are simulated, including one reference case. In the remaining four scenarios, the atmospheric temperature is uniformly increased throughout the entire column by increments of ΔT= +1, +2, +3, +4 K. To maintain consistency with the temperature adjustments, the specific humidity is recalculated using the Clausius-Clapeyron relation under the assumption of constant relative humidity. Although several studies report decreasing relative humidity trends over Central Europe during summer, the PGW framework applied here assumes constant RH when recomputing specific humidity. This choice is intentional, as it allows the thermodynamic impact of uniform warming to be isolated. Since the goal of this study is to assess the sensitivity of convective storms to temperature perturbations and CCN concentrations, introducing changes in RH would confound these effects and shift the experiment away from a controlled thermodynamic perturbation. Additionally, to ensure physical consistency, the pressure at each model level is adjusted by numerically integrating the hydrostatic balance equation:
from the surface to the top of the atmosphere, using the reference simulation's surface pressure as the initial condition (Schär et al., 1996; Kröner et al., 2017). Hereby, g represents the gravitational acceleration, p(z) the pressure at height z, R the specific gas constant for dry air, and T(z) the temperature profile as a function of height. Furthermore, soil temperature and soil surface temperature are adjusted by applying the same temperature increments as imposed on the atmosphere.
-
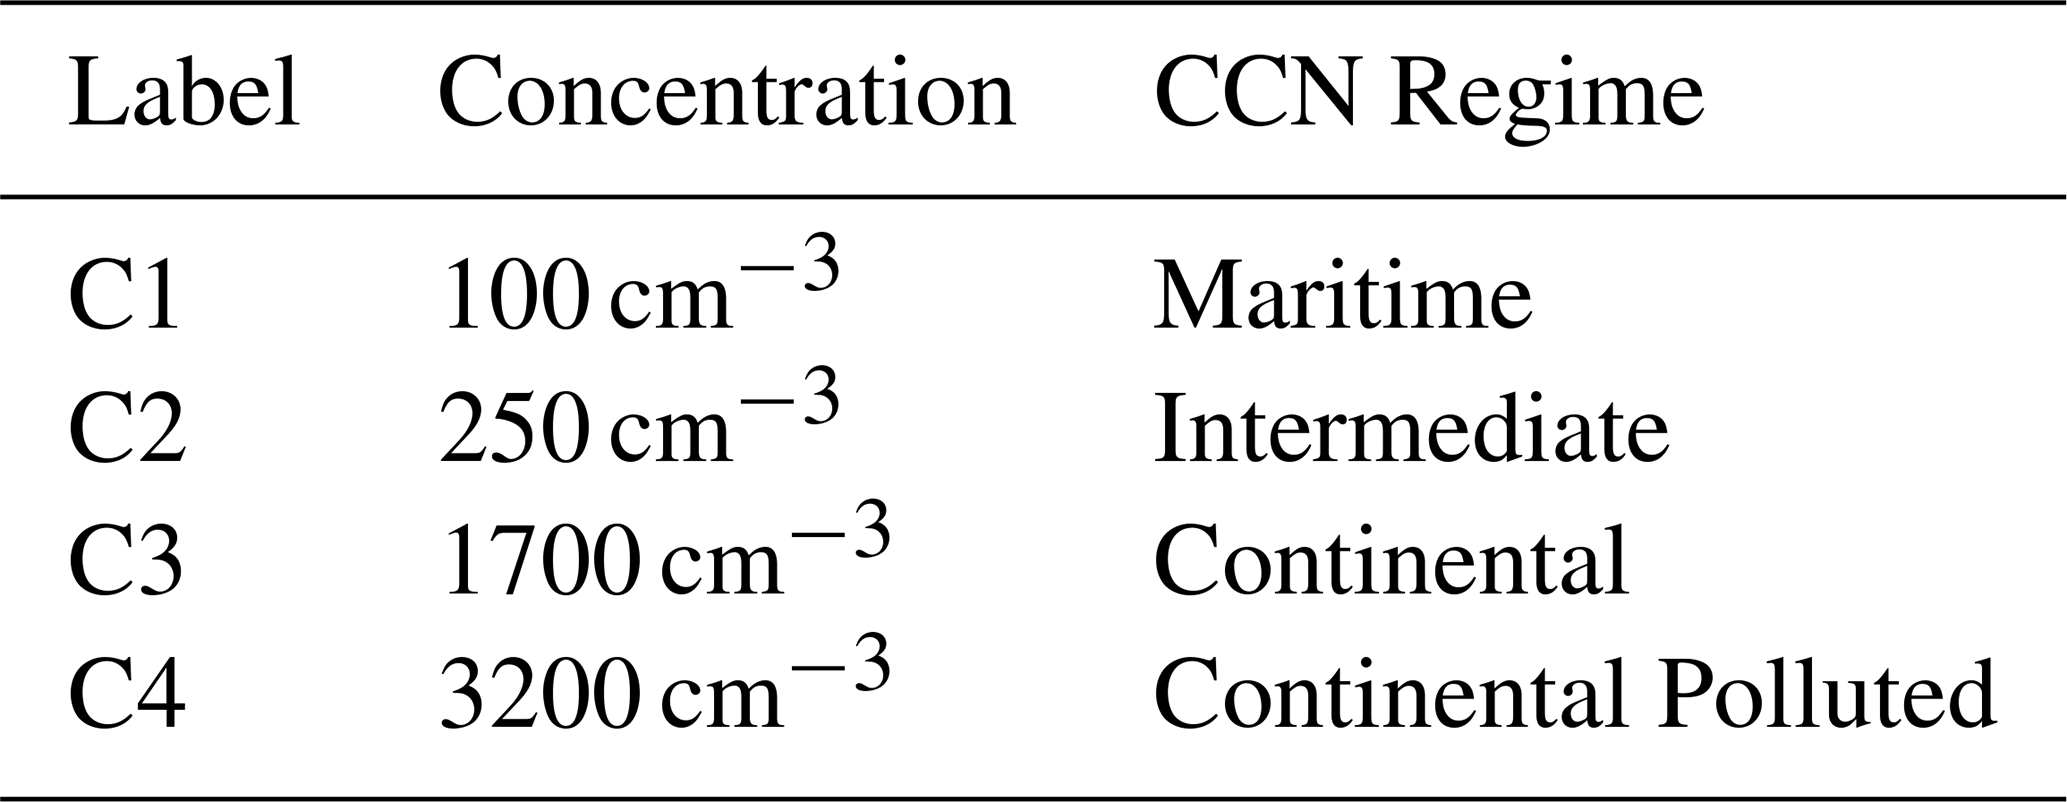
CCN concentration. The activation of CCN from aerosol particles is calculated using look-up tables with pre-calculated activation ratios provided by Segal and Khain (2006). In that scheme, four different CCN concentrations ranging from low to very high concentrations can be chosen (Table 2). The continental CCN concentration (C3) is chosen as the reference concentration, as this aerosol assumption represents typical conditions of central Europe (Hande et al., 2016; Costa-Surós et al., 2020).
Table 2Classification of cloud condensation nuclei (CCN) concentrations and their corresponding labels (Segal and Khain, 2006).
In addition, the applied PGW method, which assumes vertically uniform warming while preserving relative humidity, does not capture potential changes in the lapse rate (e.g. Brogli et al., 2021) or modifications in large-scale weather systems that may result from a weakened polar jet stream. Likewise, humidity gradients that could emerge over extended simulation periods are not represented. Nevertheless, our findings, generated with an advanced double-moment microphysics scheme that explicitly resolves hail, offer important insights into the influence of aerosols on mixed-phase clouds under various warming conditions.
2.3 Analysed cases
This study examines three supercell events from the Swabian MOSES field campaigns conducted in 2021 (Kunz et al., 2022) and 2023 (Handwerker et al., 2025). The 2021 campaign aimed to investigate convective storms associated with heavy rain and hail and large-scale heatwaves associated with droughts, while in 2023, the emphasis was on convective storms associated with heavy rain and hail, localised flooding, and pollutant inputs to water bodies. It focused on capturing entire events from their onset through development to their impact. Both campaigns were conducted in southwestern Germany, including the Neckar Valley and Swabian Alb (Fig. 1). This area was selected because hailstorms most frequently occur south of Stuttgart and over the Swabian Alb (Kunz and Puskeiler, 2010; Puskeiler et al., 2016). To evaluate the accuracy of the ICON model simulations, results are compared to radar-derived precipitation data from the RADOLAN (Radar Online Adjustment) algorithm provided by the German Weather Service (DWD). No systematic comparison with observations and no evaluation in this direction are carried out, as this is not the goal of the present study. The RADOLAN data are only used to ensure that the simulations reproduce the general precipitation pattern of the selected day. The study is designed as a sensitivity study, focusing on how the model responds to changes in the prescribed parameters. By analysing these simulations across different atmospheric conditions, this study captures a diverse range of convective storm characteristics. Each case represents a distinct convective scenario, highlighting variations in convective cell behaviour (Fig. 2).
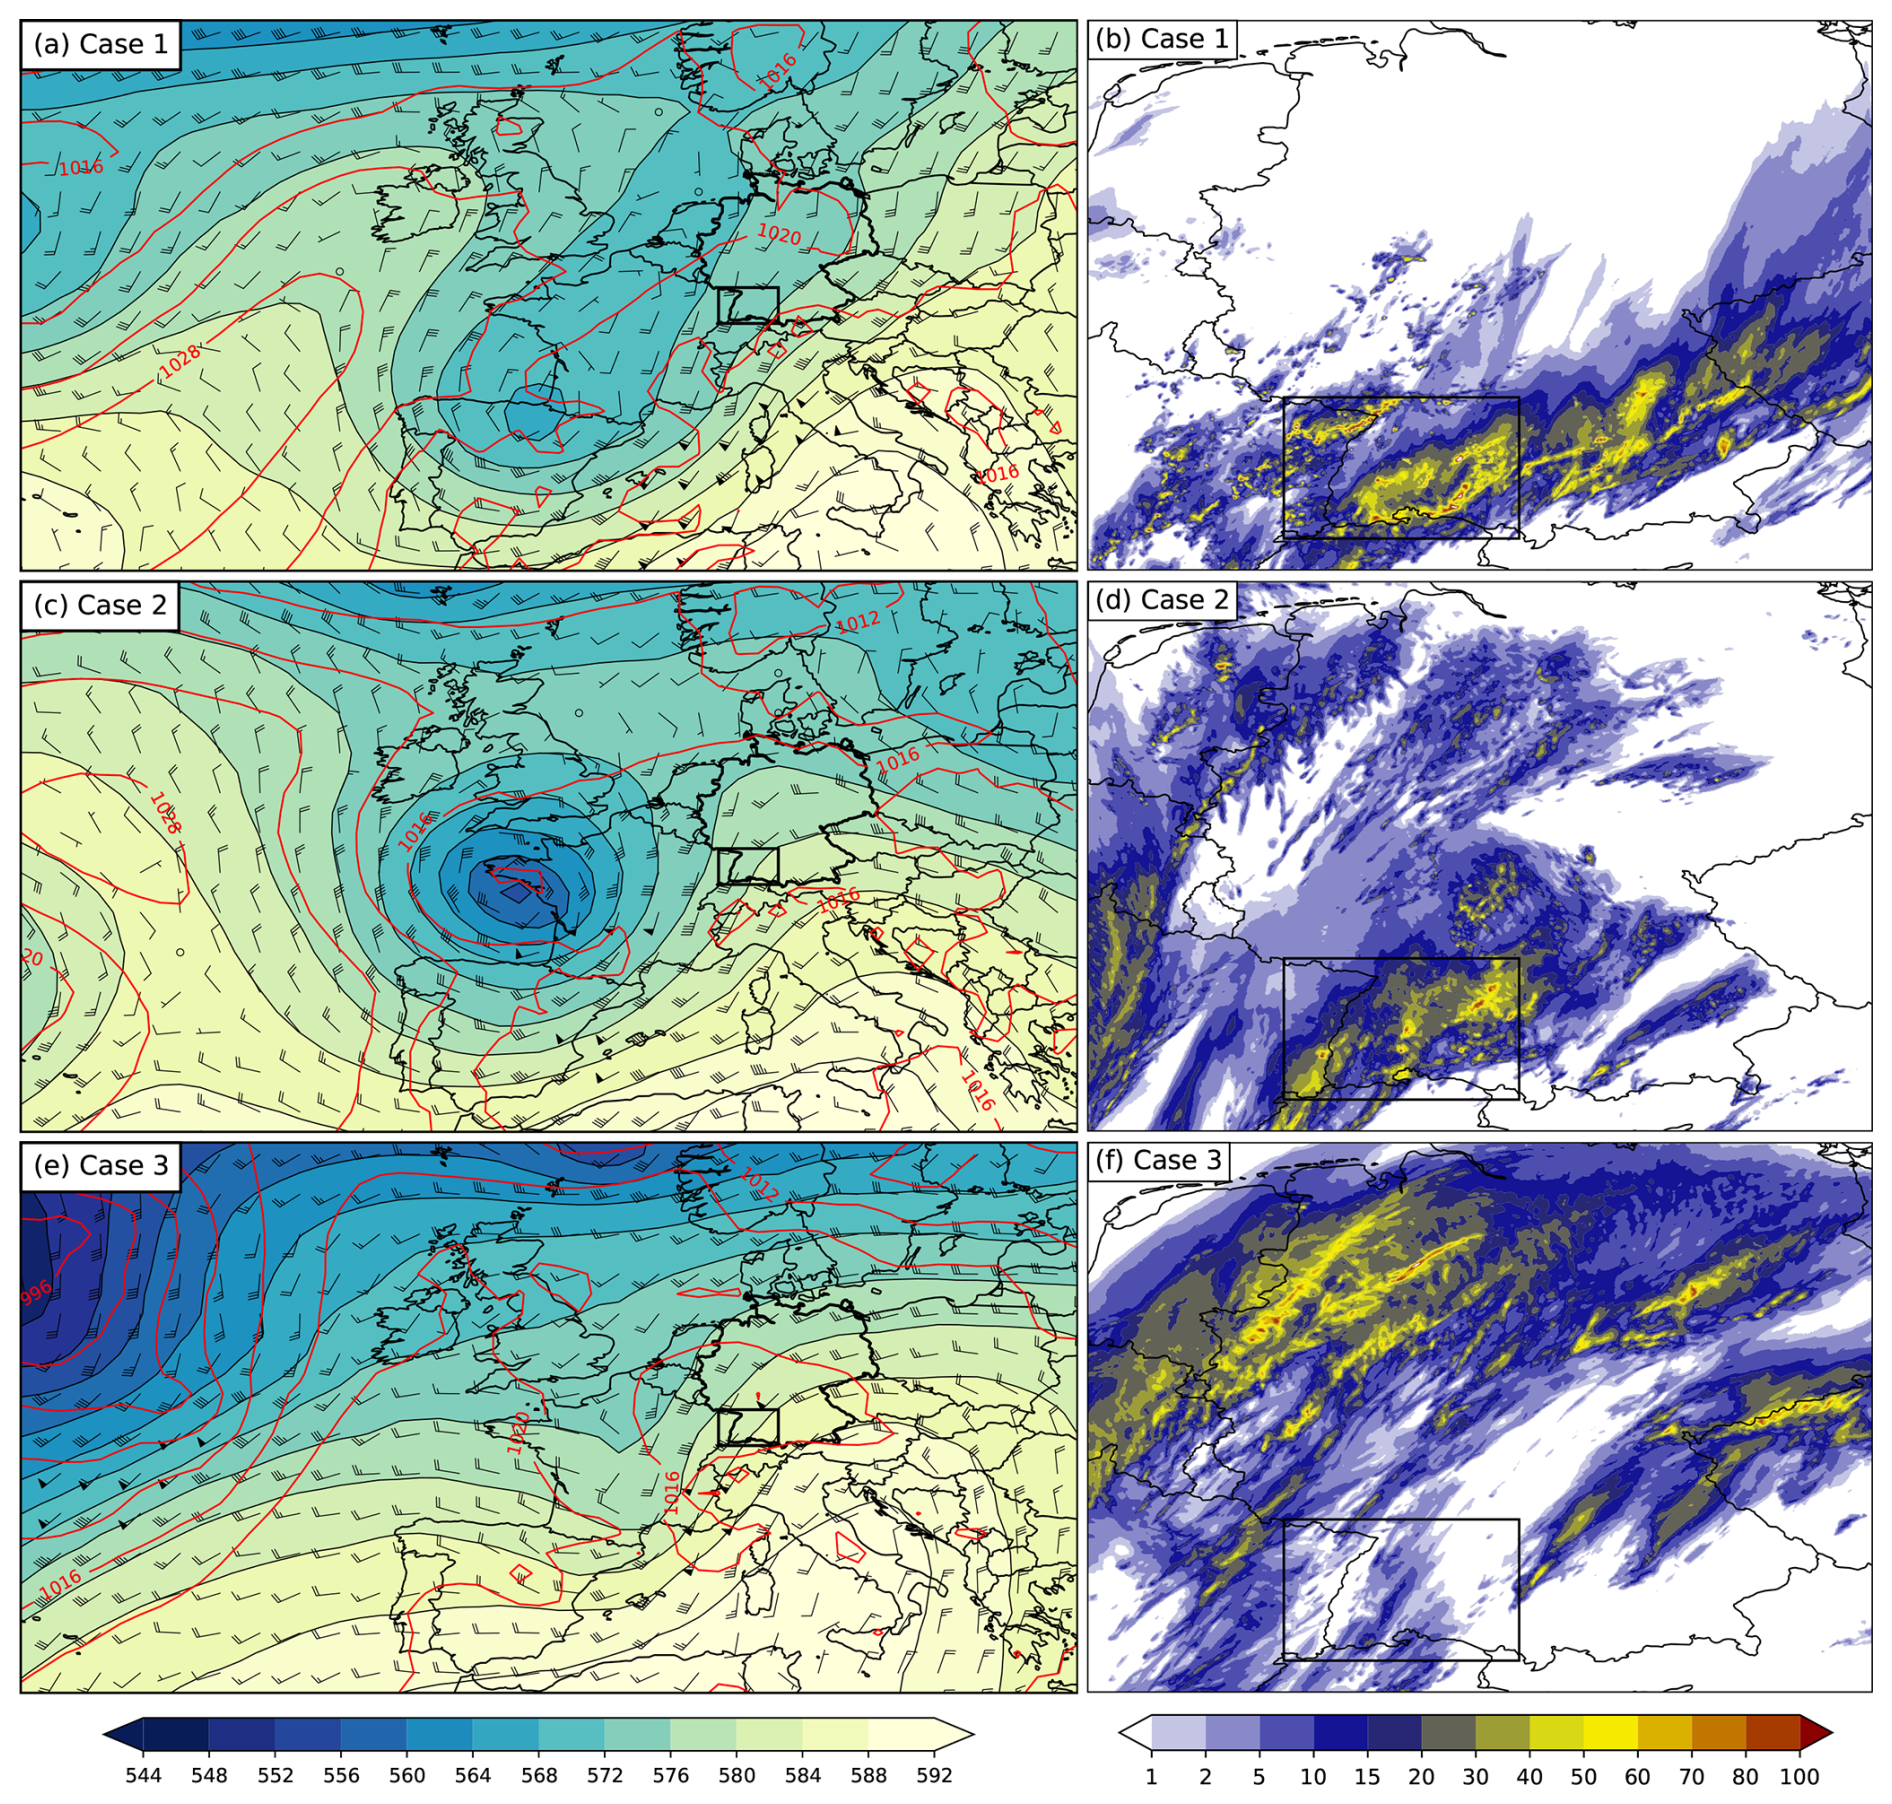
Figure 2(a, c, e) Global Forecast System (GFS) analysis at 12:00 UTC showing 500 hPa geopotential height (gpdm; shading), sea-level pressure (hPa, red contours), and 500 hPa wind barbs for case 1 (23 June 2021), case 2 (28 June 2021), and case 3 (22 June 2023). (b, d, f) Accumulated precipitation over 24 h across the entire Germany domain from the reference simulation using continental CCN concentrations (mm). The black box indicates the MOSES domain as in Fig. 1.
2.3.1 Case 1: 23 June 2021
On 23 June 2021, a weakening trough stretched from southern Scandinavia to southern Spain (Fig. 2a). During the day, a shortwave trough moved along its eastern side and reached Germany in the early afternoon. Deep convection occurred with an increase in CAPE in the middle layer over southwest Germany to around 950 J kg−1 by midday. Moderately strong winds from a south-westerly direction prevailed in the middle troposphere over Germany. At the surface, a large area of high pressure extended over the North Atlantic, across western Europe, and to northern Germany. A stationary front, a remnant of a multi-core area of low pressure from the previous days, which was now connected to a surface low over Finland, lay over southern Germany and persisted in the following days (Barthlott et al., 2024). The deep layer shear (DLS) reached 18 m s−1 on average in the MOSES domain, indicating suitable conditions for supercell formation.
2.3.2 Case 2: 28 June 2021
On 28 June 2021, a trough was located over the west coast of France and covered the area from Great Britain to Spain (Fig. 2c). Over Germany, a slightly strengthening ridge was present, while a short-wave trough passed over southwest Germany in the afternoon. As a result, Germany was affected by moderately strong winds coming from the southwest. A high-pressure field formed over the Atlantic, and pressure values around 580 hPa were reached in the middle troposphere over Central Europe. Averaged over the Germany evaluation domain, DLS reached values of 20 m s−1 which also reflects the potential of supercell formation. Intense hailstorms also occurred over Switzerland on that day: Kopp et al. (2023) provide a synoptic discussion, hail-storm tracks, and radar data, also for southwestern Germany, whereas Brennan et al. (2025a) present a comprehensive model-based case study to unravel the complex processes involved in the genesis, intensification, and dissipation of this impactful weather event.
2.3.3 Case 3: 22 June 2023
On 22 June 2023, the synoptic setup featured a prominent trough over the North Atlantic and France and a ridge over southeastern Europe (Fig. 2e). This pattern was associated with a low-pressure system to the northwest and a high-pressure system to the southeast. The resulting pressure gradient led to strong southwesterly flow across Central Europe, advecting warm and moist air and supporting large-scale ascent that contributed to the initiation of convection. As on the other days, suitable conditions for supercell formation were simulated here with DLS values of 19 m s−1 in the MOSES domain.
2.4 Evaluation techniques
The following analyses apply different techniques to quantify key aspects of convective storms, including cold pool dynamics, hailstone size distributions, and the occurrence and evolution of convective cells. It is important to emphasise that, although the selected case days were chosen because they featured supercell events, the diagnostics are not limited to supercells. Many of the evaluations, such as domain-mean precipitation, cold pools, or convective cell number or lifetime, inherently capture the behaviour of all convective cells within the model domain. This means that the results reflect the combined response of single cells, multicells, and supercells that coexist during the simulations. The methods outlined in the following subsections, therefore, provide insight into the overall convective response, while still allowing for the interpretation of processes particularly relevant to supercells.
2.4.1 Cold pools
Cold pools offer additional insight into convective intensity. They consist of volumes of negatively buoyant air that originate from evaporative cooling in precipitating downdraughts (Hirt et al., 2020). They are characterised by negative temperature anomalies, which can be derived using the density potential temperature defined by Hirt et al. (2020) as:
where θ is the potential temperature, rv is the water vapour mixing ratio, and rw, ri, rr, rs, rg, and rh are the mixing ratios of cloud water, cloud ice, rain, snow, graupel, and hail, respectively. The local perturbation of density potential temperature is calculated relative to a spatiotemporal moving average , using a horizontal window of 166 grid points (≈ 166 km) and a temporal window of 8 h as in Hirt et al. (2020). They also conducted sensitivity analyses with different spatial filtering scales and with/without temporal filtering, which did not show a strong influence on the qualitative behaviour of the results. For that reason, the same values are used in our study. This combination of spatial and temporal filtering enables the identification of large cold pools while background θρ gradients at the coast are still sufficiently resolved to detect cold pools there (Hirt et al., 2020). To isolate cold pool structures, the domain-mean perturbation is subtracted: . Cold pools are identified by applying thresholds: only perturbations below −2 K, associated with precipitation rates exceeding 10 mm h−1, and with horizontal extents greater than 6 km are considered. The remaining cold pool perturbations are used to compute a density distribution function for each temperature and CCN concentration scenario.
2.4.2 Hail sizes
To evaluate hailstone sizes in the model, hailstone size distributions are calculated using a generalised Gamma distribution:
whereby ν represents the shape parameter, μ the dispersion parameter and x is the particle mass. A and λ are calculated from the predicted mass and number densities. Different combinations of ν and μ with values between 0 and 1 lead to different distributions. If μ=1, the function reduces to a classical Γ-distribution, for the result is the Weibull distribution, and for an exponential distribution is calculated (Seifert and Beheng, 2006). For this evaluation, ν=1 and are used, which are the parameters for hail in this model. This function is rewritten as a function of diameter D, using which is true for spherical particles (Khain et al., 2015):
with , , , and . N0 represents the intercept parameter and ρ the bulk hydrometeor density. This formulation is used to derive hailstone size distributions for the subsequent analysis.
2.4.3 Tracking of convective cells
The occurrence of convective cells is analysed using version 1.5.3 of the Python package Tobac (Tracking and Object-Based Analysis of Clouds (Heikenfeld et al., 2019; Sokolowsky et al., 2024). Tobac is a software to identify, track, and analyse clouds and other meteorological phenomena such as updraughts, precipitation, and radiation. The tool uses algorithms to identify features and link them into consistent trajectories. Tobac links features between consecutive time steps using a nearest-neighbour and overlap-based approach. When a feature splits into multiple successors, the trajectory continues along the largest successor while the others are recorded as new tracks. In the case of mergers, the trajectory of the largest predecessor is continued, and the additional features are terminated. In this study, the number of convective cells refers to the number of unique tracks initiated during the simulation period. In this study, updraughts of cells at high temporal resolution (5 min) between 06:00 and 24:00 UTC are tracked. For the updraught tracking, first, the data of the maximum updraught between 3 and 8 km height and the total condensate mixing ratio, which means the total amount of liquid and frozen water per mass of dry air, is calculated. Afterwards, several thresholds (3, 5, 10 m s−1) are used to track updraughts to better resolve overlapping cells. In addition, only updraughts with a minimum area of 10 grid cells are used as features, and a maximum distance of 25 grid cells is selected when linking features. As a segmentation threshold, a value of 0.5−3 kg kg−1 is chosen as the condensate mixing ratio to identify the cloud volumes corresponding to the individual identified updraughts (Heikenfeld et al., 2019). To track only longer-lived cells, only tracks with a minimum lifetime of 30 min are used for the evaluation. The tracking approach, therefore, captures all convective cells within the domain, not only supercells.
This section presents the results of ICON simulations evaluating the sensitivity of convective storms to atmospheric warming and changes in CCN concentration. The analysis focuses on both thermodynamic and microphysical aspects of storm behaviour. Section 3.1 examines the intensity of convective cells, focusing on CAPE, CIN, and updraught helicity as indicators of supercell intensity. It also analyses how changes in temperature and CCN concentrations affect up- and downdraught velocities and cold pool intensities, providing insight into the resulting storm dynamics. Section 3.2 investigates precipitation responses, including changes in total and extreme rainfall and hail, deviations from Clausius–Clapeyron scaling, and the evolution of hailstone size distributions under future climate conditions. Section 3.3 analyses the frequency and lifetime of convective cells using object-based tracking methods. Finally, Sect. 3.4 explores aerosol–cloud interactions, detailing how CCN concentrations influence hydrometeor content, microphysical process rates, the cold-to-warm rain formation ratio, and precipitation efficiency.
3.1 Intensity of convective cells
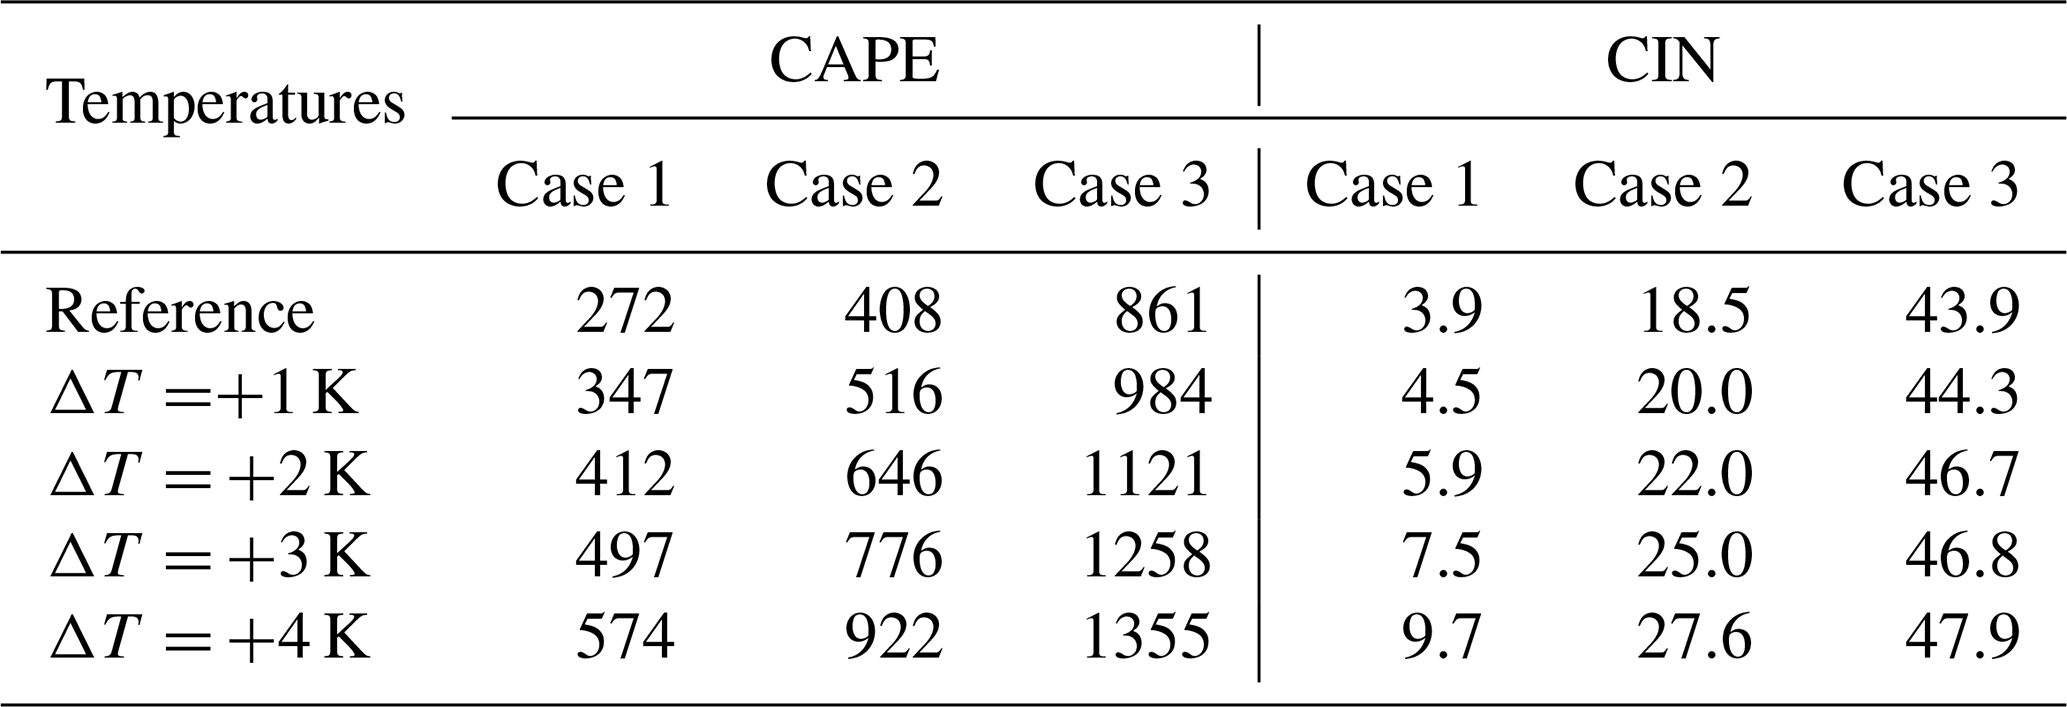
In all three cases, CAPE and CIN exhibit an increasing trend with rising temperatures. The maximum values of CAPE and the minimum values of CIN, taken from the mean daily time series, are summarised in Table 3. The rate of increase is relatively uniform across the different simulated temperatures, indicating that the sensitivity of CAPE and CIN to temperature is largely independent of the magnitude of warming, particularly during the time of day when convection is most active. However, the absolute increase in CAPE varies among cases between 65–85 J kg−1 on case 1, 108–146 J kg−1 on case 2, and 97–137 J kg−1 on case 3. CIN exhibits only a modest enhancement, typically on the order of a few J kg−1. While maintaining the relative humidity, the dew point increases less than the temperature, leading to a higher lifting condensation level and a higher level of free convection. The increase in CAPE can be explained by the steeper moist adiabats for increased temperatures with higher equilibrium levels. Similar findings have been reported in previous studies (Rasmussen et al., 2020; Huang et al., 2024; Mallinson et al., 2024; Yang et al., 2024), which also observed increased CAPE and CIN in PGW experiments. These results suggest a more favourable environment for convective systems if the triggering is sufficiently strong to overcome CIN and less favourable conditions for weaker trigger mechanisms due to the rise in CIN. Since the cases involve supercell events, an additional parameter is used to quantify the intensity of such storms. Supercells are characterised by a rotating updraught known as a mesocyclone, which plays a crucial role in their organisation, longevity, and severe weather potential (Markowski and Richardson, 2010). A widely used parameter for identifying such rotating updraughts is the updraught helicity (UH), which quantifies the strength of vertically integrated rotation within a storm. UH can be calculated by integrating the product of the vertical velocity w and the vorticity ζ:
In this study, the product is integrated from 2100 to 5000 m a.g.l., focusing on storm rotation in the lower to middle troposphere (Kain et al., 2008). UH provides a useful way to detect and quantify rotating convective storms, as higher values indicate stronger updraught rotation. By mapping UH, the presence and intensity of mesocyclones can be visualised (Weisman and Rotunno, 2000; Thompson et al., 2007). To identify potential supercell regions, a threshold of 75 m2 s−2 is applied, as in Ashley et al. (2023). Although the threshold in Ashley et al. (2023) was established on 4 km resolution data, the same value is used here despite the higher resolution of 1 km, since the focus is not on the exact threshold itself but on the relative changes. Consistently, an additional analysis of the 99.95th percentile, similar to the approach of Wang et al. (2022), yielded values close to 75 m2 s−2, supporting the choice of this threshold. Supercell dynamics are also strongly controlled by vertical wind shear. In the PGW framework applied here, the wind profiles are not systematically modified, so shear conditions remain close to those of the reference synoptic environments. Thus, the changes in helicity discussed below primarily reflect thermodynamic influences, while potential shear-related modifications are not represented.
Table 3Maximum values of the time series of domain-mean CAPE and minimum values of CIN, shown for all three case studies and all temperature simulations.
Helicity changes across the different temperature simulations are assessed by computing the mean values above this threshold and the number of grid cells that exceed it (Fig. 3). The analysis focuses on time frames associated with potential supercell development and the strongest convective activity: between 12:00 and 20:00 UTC for cases 1 and 2 and between 10:00 and 20:00 UTC for case 3. Across all three cases and CCN concentrations, higher temperatures lead to an increase in both the mean helicity values and the number of grid cells exceeding 75 m2 s−2. These findings indicate that a warmer future may be associated with an increased likelihood of supercell formation, greater supercell intensity, or a combination of both. However, it is also found that mean helicity values plateau and, in some instances, decrease for the highest simulated temperatures.
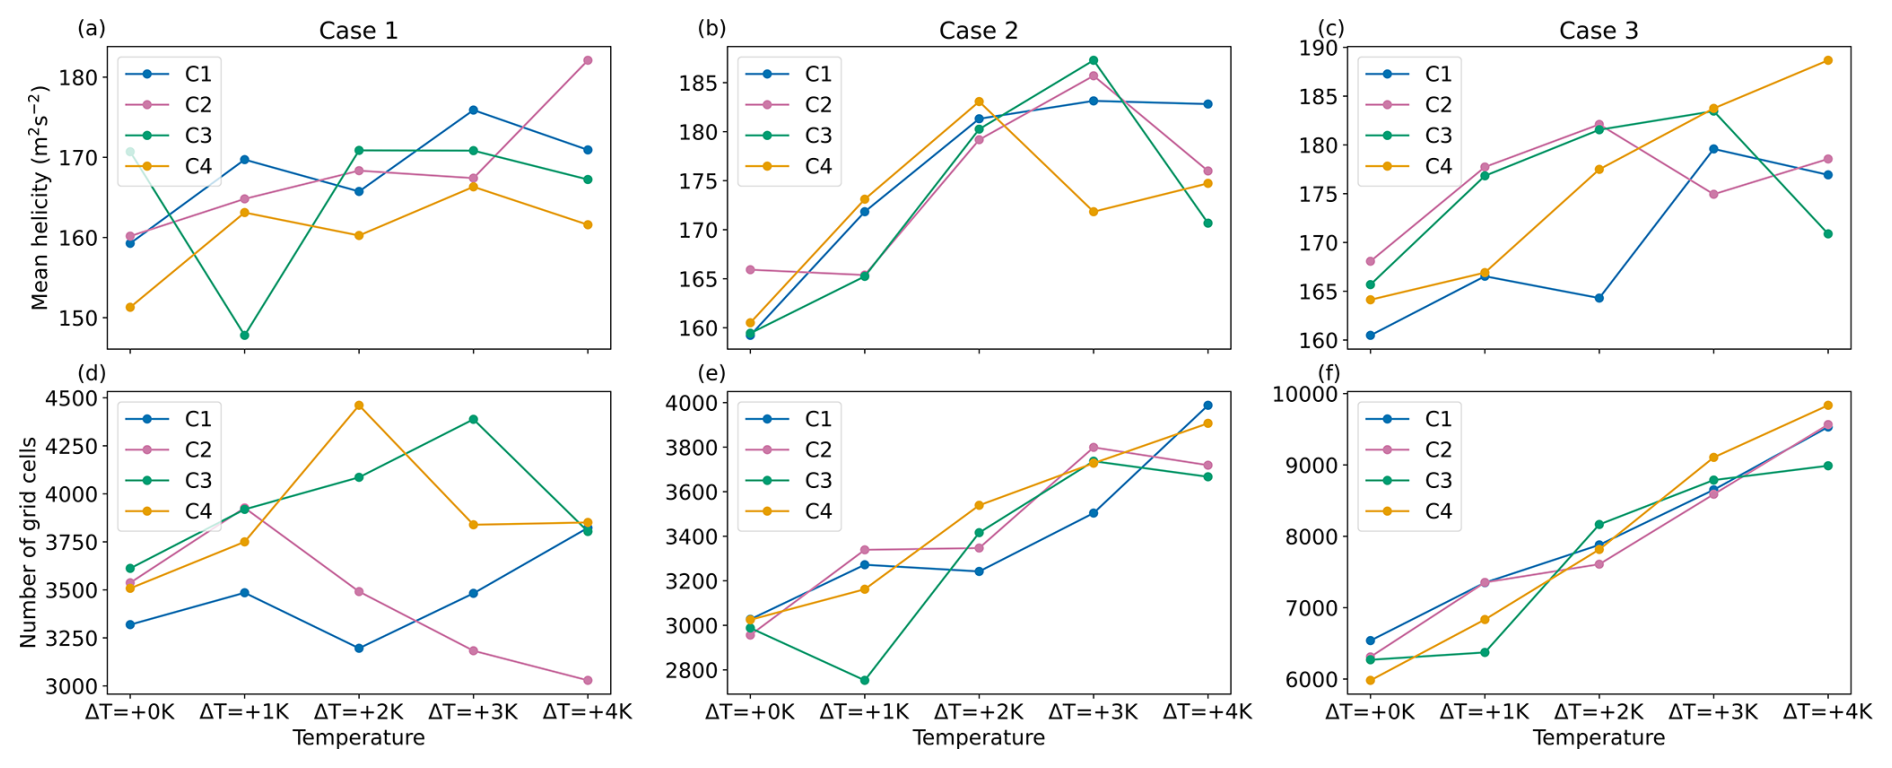
Figure 3Mean helicity over the whole Germany domain of values larger than 75 m2 s−2 for (a) case 1 from 12:00 to 20:00 UTC, (b) case 2 from 12:00 to 20:00 UTC, and for (c) case 3 from 10:00 to 20:00 UTC. Number of grid points with helicity values larger than 75 m2 s−2 (d) case 1 from 12:00 to 20:00 UTC, (e) case 2 from 12:00 to 20:00 UTC, and for (f) case 3 from 10:00 to 20:00 UTC.
While CCN concentrations do not show a uniform impact on helicity values across all simulations, distinct variations are observed in some cases between different CCN scenarios. In contrast, temperature shows a consistent and stronger influence, with helicity values increasing systematically under warmer conditions. Overall, the impact of temperature on helicity is more pronounced than that of CCN concentration.
The influence of atmospheric warming on convective cell dynamics is illustrated by frequency differences of vertical winds as a function of height and magnitude in Fig. 4 for case 2. As temperatures rise, both updraught and downdraught velocities intensify in the upper troposphere, indicating enhanced convective activity under warmer conditions. Updraughts in the range of 0–40 m s−1 increase by approximately 50 %–100 %, while the most intense updraughts show increases exceeding 300 % in the +4 K simulation. A similar pattern is observed for downdraughts: lower intensities increase by 50 %–100 %, with the strongest downdraughts (10–20 m s−1) increasing by more than 300 % under the same warming scenario. This general intensification of vertical motion in the upper troposphere is consistently observed across all three analysed cases. However, it is primarily the moderate up- and downdraughts that show this robust increase in all cases, while the most extreme velocities exhibit more case-to-case variability.
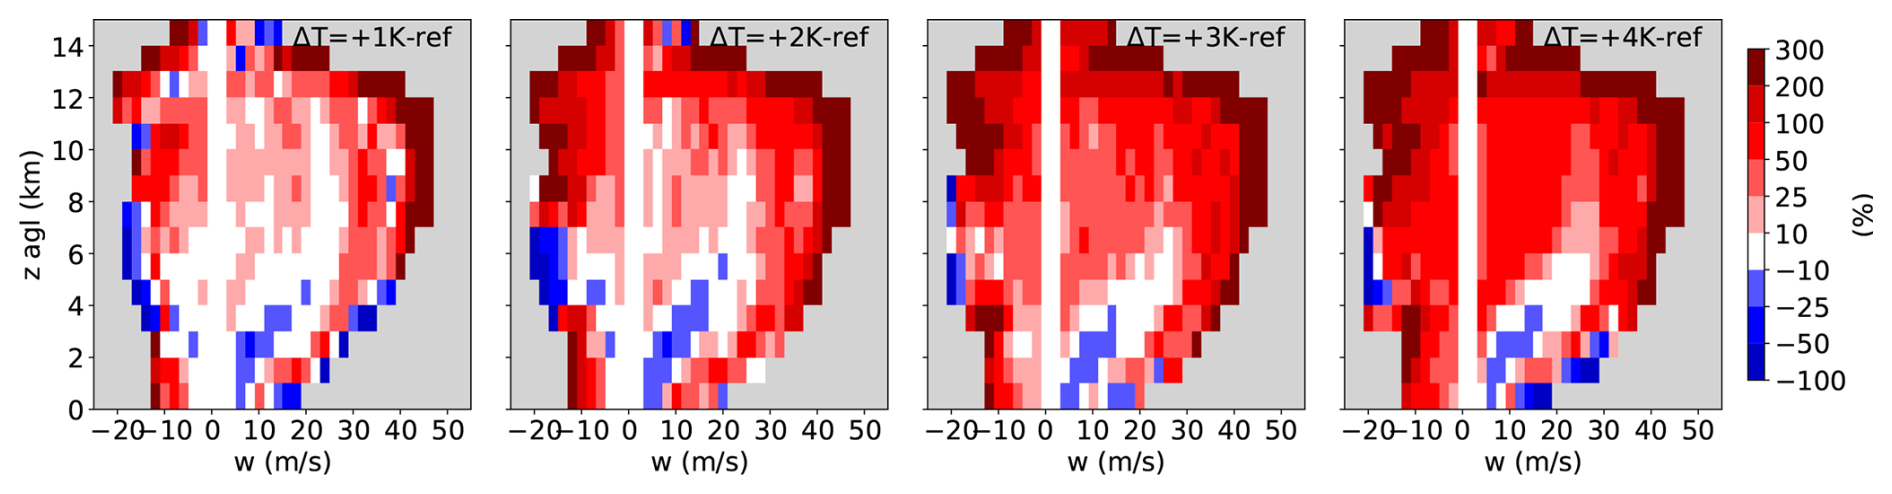
Figure 4Frequency difference of vertical velocity as a function of height and wind magnitude for different warming scenarios with respect to the reference temperature evaluated over the MOSES domain and the full 24 h simulation period. All panels represent continental CCN concentrations (C3).
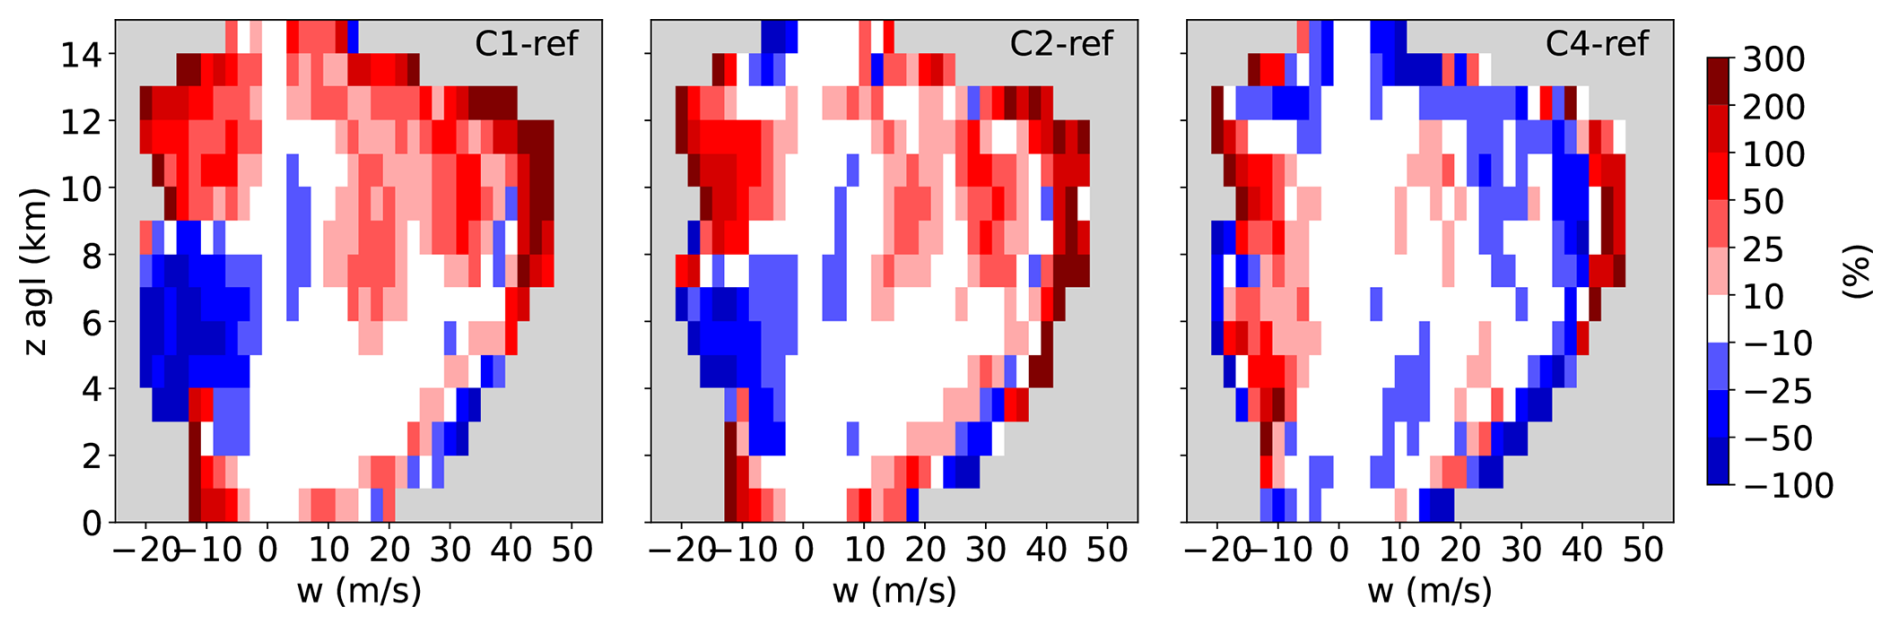
Figure 5Frequency difference of vertical velocity as a function of height and wind magnitude for different CCN concentrations with respect to the reference CCN concentrations (C3) evaluated over the MOSES domain and the full 24 h simulation period. All panels represent the reference temperature without global warming.
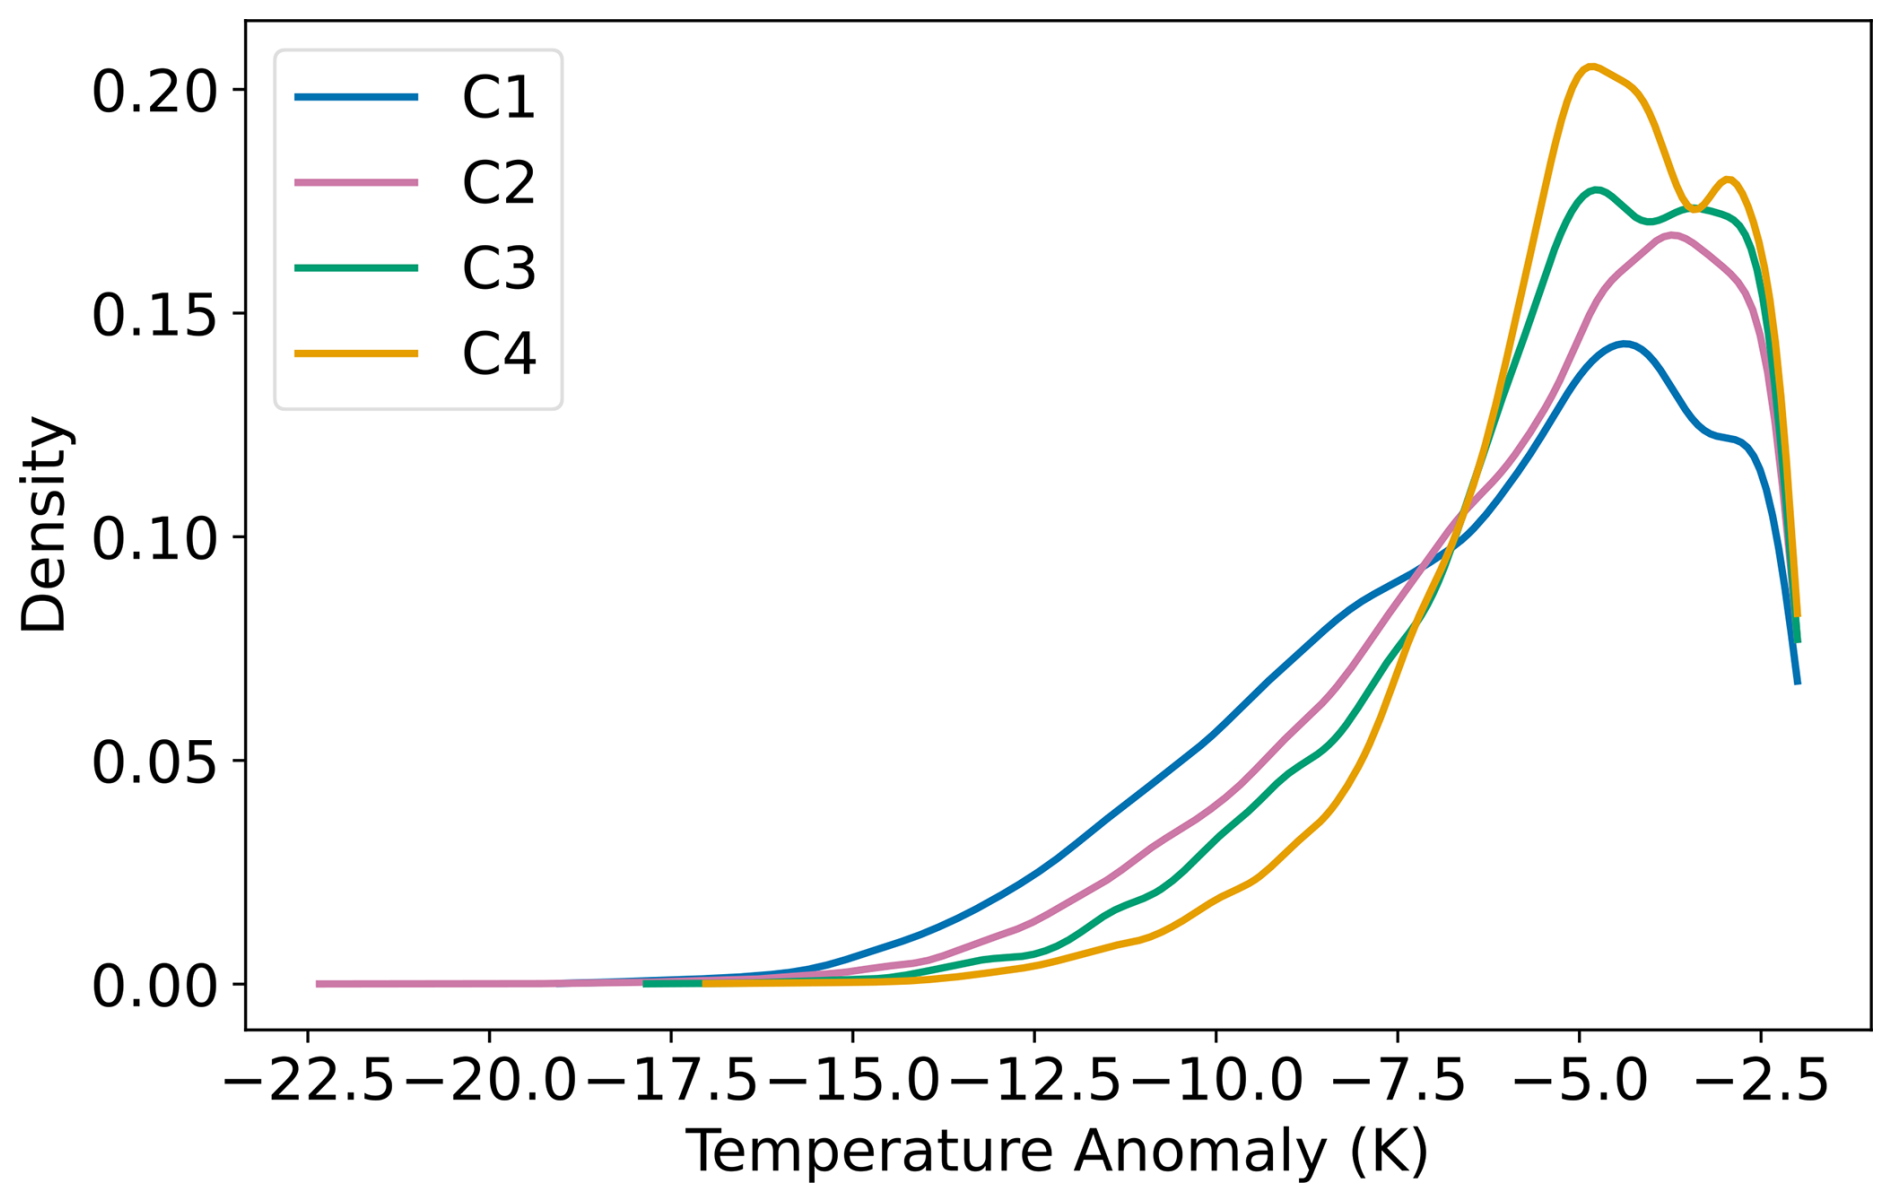
In contrast, changes in CCN concentration influence the frequency and distribution of vertical velocities. For higher CCN concentrations, the occurrence of strong updraughts (20–30 m s−1) in the upper troposphere decreases (Fig. 5). While downdraught intensity also weakens in the upper troposphere, a slight increase is observed in the middle to upper troposphere. Near the surface, downdraught strength again diminishes. This vertical structure could be linked to enhanced precipitation loading aloft in a low CCN environment, which contributes to stronger downdraughts at mid-levels but less pronounced impacts near the surface. To further investigate the impact of CCN concentration on convective dynamics, cold pools are analysed as an additional measure of storm intensity. Cold pools, which form through evaporative cooling in precipitating downdraughts, influence storm organisation and surface outflows. The methods used to identify and quantify cold pools in this study are described in Sect. 2.4.1. Figure 6 illustrates how varying CCN concentrations affect the strength and distribution of cold pool anomalies. The highest CCN case (C4) exhibits a pronounced peak around −5 K with a narrow distribution and a short tail, indicating frequent but moderate cold pool anomalies. As CCN concentrations decrease, the distributions broaden and develop longer tails, indicating greater variability and a higher occurrence of stronger cold anomalies. This enhanced cold pool intensity at lower CCN concentrations is also reflected in the downdraughts: increased downdraught strength is observed in the lower troposphere under low CCN conditions (not shown). This behaviour is consistent with the known mechanism in which enhanced subcloud evaporative cooling leads to stronger cold pool formation and, consequently, more intense downdraughts. The increased evaporation under low CCN conditions is further promoted by the formation of larger raindrops, which evaporate more efficiently as they fall through the subcloud layer, enhancing cooling.
3.2 Precipitation
To evaluate changes in precipitation, the behaviour of rain and hail is analysed separately for all days (Fig. 7). First, the total amount of rain and hail is examined. Rain exhibits an increasing trend across all days, with increases ranging from approximately 15 % to 70 % in the +4 K simulation. Hail also increases with rising temperatures, exhibiting a greater relative change compared to rain. In cases 1 and 2, hail increases by around 30 %. However, in case 3, hail increases by nearly 200 %, suggesting that synoptic-scale forcing likely played a role. Synoptic-scale environments significantly influence the response of hailstorms to climate warming, with frontal systems exhibiting a more substantial increase in large hail occurrences compared to other synoptic setups (Fan et al., 2022). In the present experiments, the imposed warming does not modify the large-scale dynamics, so the prevailing synoptic situation of each analysed day remains unchanged. In a warmer climate, however, storm tracks and jet streams are projected to shift poleward, and changes in cyclone and frontal characteristics are expected (Harvey et al., 2020; Priestley and Catto, 2022). Such changes would alter the frequency and structure of synoptic environments conducive to severe convection and hail, further underlining the importance of the background synoptic forcing for interpreting the results of this sensitivity study. To assess changes in extreme precipitation events, the 95th percentile of rain and hail amounts is analysed. For rain, the 95th percentile consistently increases with temperature, indicating that even heavier rainfall events will occur, heightening the risk of flash floods. In cases 2 and 3, extreme rainfall amounts increase by approximately 50 % in a +4 K warming scenario. A similar trend is observed for hail, with a substantial increase in the 95th percentile. In case 3, extreme hail amounts rise by over 200 %, indicating a strongly increased potential for severe hailstorms and elevated damage risks in a warmer climate. Next, the number of grid cells experiencing extreme rainfall and hailfall (95th percentile) is evaluated. Again, a notable increase is observed. In case 3, a +4 K temperature increase results in a 400 % expansion of the area impacted by large hail amounts. This corresponds to an increase from 369 to 3995 km2, representing a dramatic growth from an area comparable to the size of Munich to one comparable to the island of Mallorca. Even the smallest increase, observed in case 1, amounts to 100 %, representing a doubling of the impacted region. The effects of CCN concentrations on precipitation will be discussed later in Sect. 3.4.
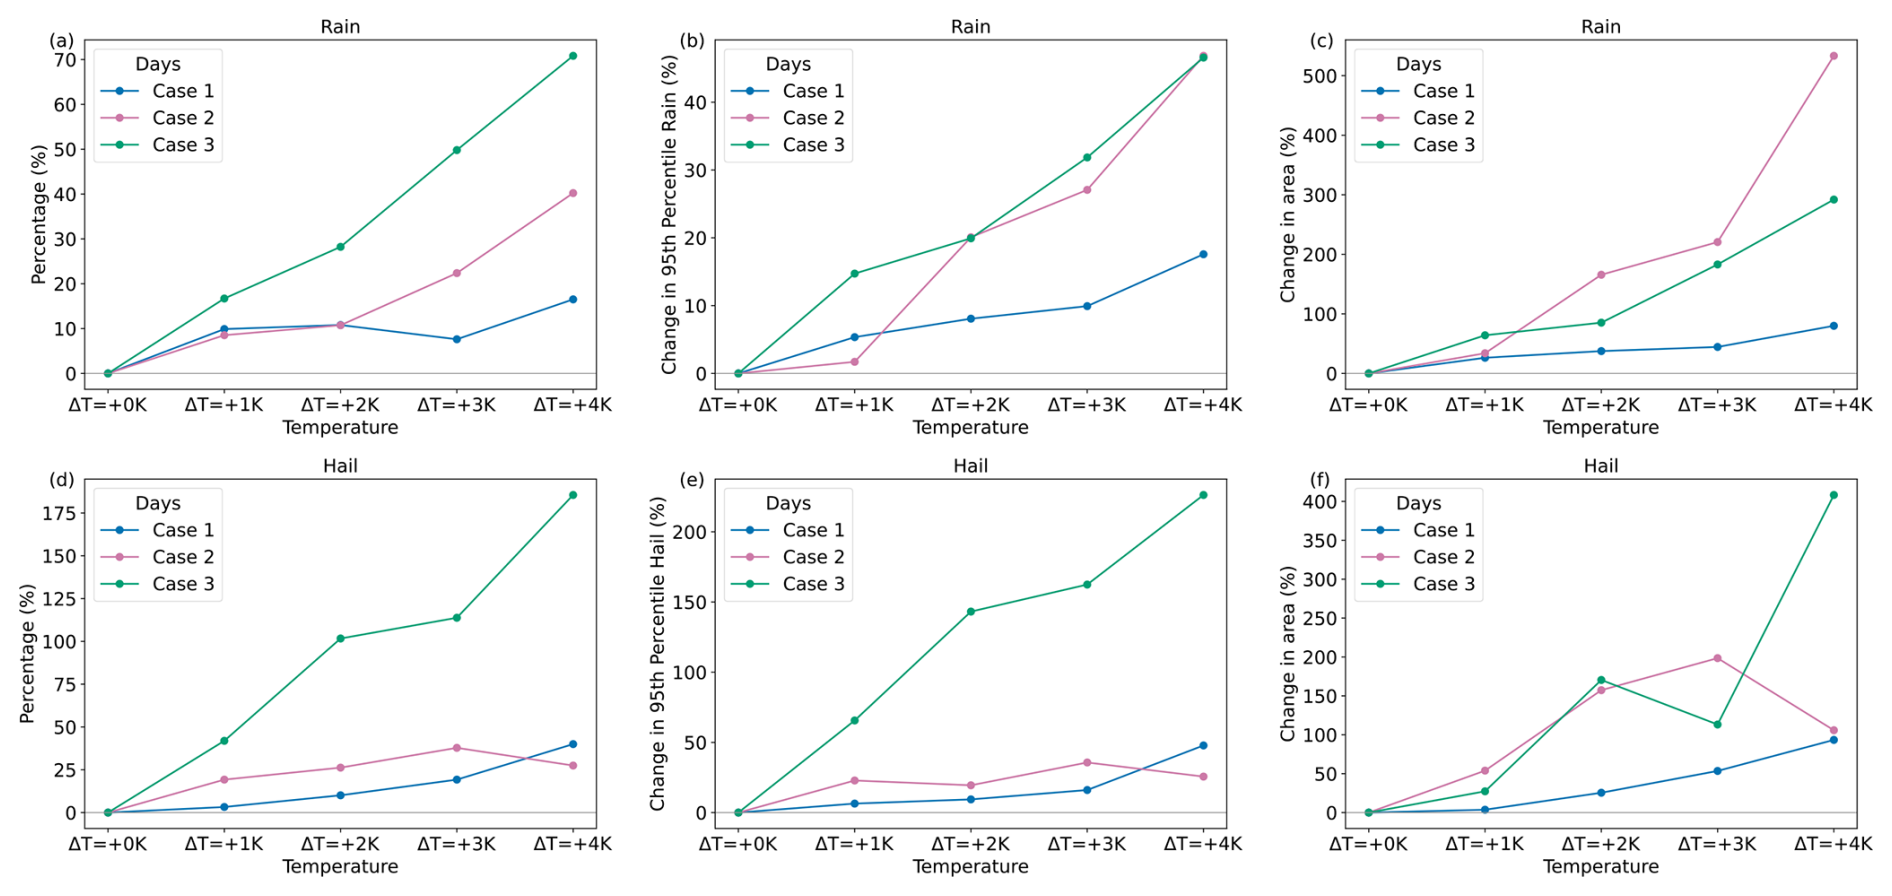
Figure 7Percentage change of the daily amount (24 h accumulated) of (a) rain and (d) hail, the change in the 95th percentile of (b) rain and (e) hail, and the change in the area affected by daily totals of (c) rain >45 mm and (f) hail >10 mm (the 95th percentile) for changing atmospheric temperatures on all three simulated days (different line colours) for a continental CCN concentration (C3) and in the MOSES domain for Cases 1 and 2 and the Germany domain for case 3. The domains are defined in Fig. 1.
3.2.1 Hail sizes
Because hail damage assessments are primarily based on hailstone sizes (Kim et al., 2023; Schmid et al., 2024), this section focuses on how hailstone sizes respond to variations in temperature and CCN concentration. The resulting mean hail size distributions at the surface for case 1 are presented in Fig. 8a. To assess how hail sizes respond to changes in temperature and CCN concentration, the maxima of the distributions are analysed as indicators of the dominant hailstone size (Fig. 8b–d). The results reveal a systematic increase in hailstone size with increasing temperatures across all CCN concentrations. Furthermore, lower CCN concentrations are also associated with larger hail sizes. In addition, the simultaneous rise of the freezing level promotes melting of smaller hailstones, while the larger hailstones produced in stronger updraughts are much less affected due to their smaller surface area relative to their volume. As a result, the surface hail size distribution shifts toward fewer small hailstones but a greater occurrence of large ones, consistent with findings in the current literature (Raupach et al., 2021). Overall, variations in CCN concentration appear to affect hail size to a magnitude similar to that of temperature changes. Given that both future warming and decreasing CCN concentrations are expected, these factors are likely to contribute to the formation of larger hailstones under future atmospheric conditions. Because domain averages of the dominant hailstone sizes are computed from individual size distributions at each grid point, the mean values in Fig. 8b–d are comparatively small and always below 1 cm in diameter. It should be pointed out that larger dominant values up to the maximum extent of the hail size distribution do occur when their spatial distribution in the respective evaluation area is analysed (not shown).
To evaluate the impact of temperature and CCN concentration on the largest hail sizes, the hail size distribution is extended beyond the model’s initial output up to the point where the distribution curve returns to a relative frequency of 0.0025. In the model, the particle mass x is constrained by a maximum value xmax, which limits the simulated hail size distribution (Fig. 8a) and excludes hailstones larger than 2.3 cm. However, when comparing the extended size distribution curve for larger x with the model’s output, both follow the same trend, indicating that the distribution can be reliably extended to account for larger hailstones. Therefore, the hail sizes corresponding to a distribution value of 0.0025 are determined from the extended hail size distribution curve and analysed using the same approach as for the dominant hailstone sizes. The results reveal an almost identical pattern for the changes in dominant and maximum hailstone sizes (not shown), confirming that not only do medium-sized hailstones grow larger in a warmer climate, but the large hailstones also experience strong growth. These findings are particularly concerning given the high damage potential associated with large hailstones.
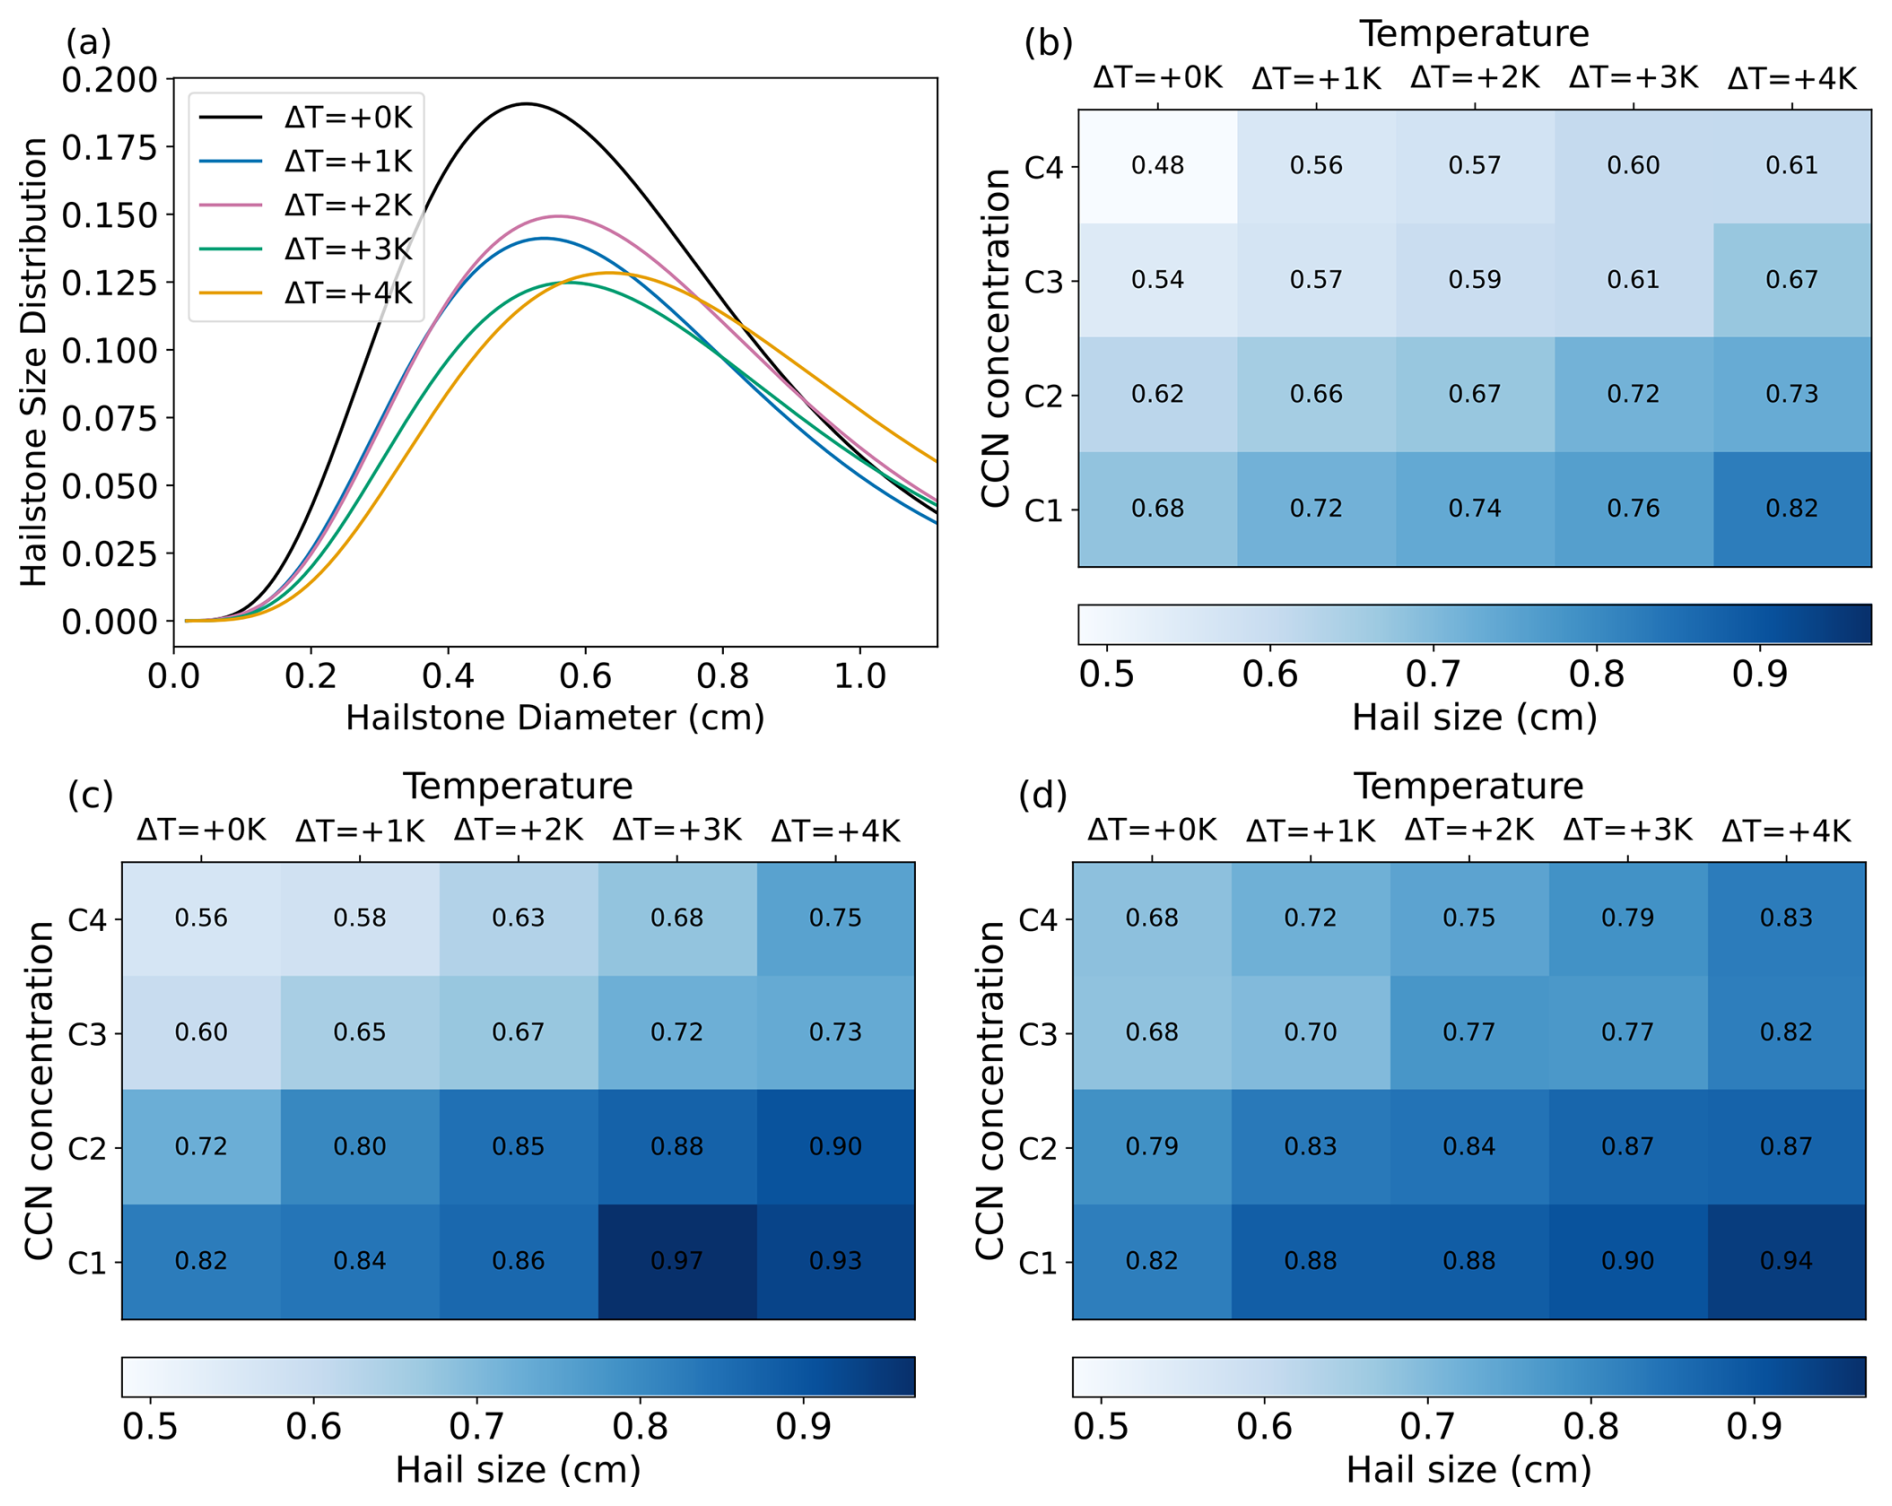
Figure 8(a) Mean hailstone size distribution for all simulation temperatures using the continental CCN concentration (C3) for case 1. (b, c, d) Dominant hailstone sizes for different temperature regimes and CCN concentrations for (b) case 1, (c) case 2, and (d) case 3. For cases 1 and 2, the MOSES domain was analysed and for case 3, the Germany domain. The domains are defined in Fig. 1.
3.2.2 Clausius-Clapeyron scaling
To explain the observed increase in precipitation, Clausius–Clapeyron (CC) scaling provides an essential theoretical framework. Although uncertainties persist, it is widely accepted that rising temperatures intensify heavy precipitation events by increasing the atmosphere's water vapour-holding capacity (Hardwick Jones et al., 2010). According to the CC relationship, water vapour content, and consequently precipitation, increases by approximately 6 % K−1–7 % K−1 (Risser and Wehner, 2017). This study investigates to what extent precipitation changes in convective storm events follow the expected CC scaling, and whether deviations from this rate, known as super-CC responses, can be identified under warming conditions. In our simulations, water vapour content is adjusted according to CC scaling, ensuring an initial increase close to the predicted 7 % K−1 (not shown). However, accumulated precipitation does not consistently follow this trend, as shown in Fig. 9. In particular, case 1 and case 3 exhibit distinctly greater increases in precipitation, far exceeding 7 % K−1. For case 3, precipitation increases by more than 17 % K−1, while for case 1, an increase of over 9 % K−1 is simulated. These extreme increases persist even when only looking at rainfall and not total precipitation, suggesting the presence of super-CC scaling effects. In contrast, in case 2, precipitation follows the expected CC scaling, increasing by 6.5 % K−1. One possible explanation for the strong deviation in case 3 is the presence of moderate to strong large-scale synoptic ascent supporting convection initiation (see Fig. 2e). In line with previous findings, such as those by Fowler et al. (2021), stronger synoptic-scale ascent and enhanced moisture convergence under warmer conditions may amplify convection and contribute to super-CC responses. This indicates that while CC scaling explains part of the observed precipitation increase, additional dynamical and microphysical processes must also contribute to the deviations beyond the thermodynamic expectation for cases 1 and 3, necessitating further investigation to identify the mechanisms driving these super-CC precipitation trends. The non-linear character of microphysical processes and the chaotic nature of atmospheric convection, in which small differences in environmental conditions can lead to large impacts on simulated storms, are likely key factors behind the super-CC scaling. Convection triggering is also highly dependent on environmental conditions; small differences in temperature or humidity can determine whether or not deep convection is initiated at a given time and location. For example, different CCN concentrations can determine whether or not a supercell is successfully simulated (Barthlott et al., 2024). The strong invigoration of convection with temperature has been discussed to amplify the scaling rate with temperature or shifts from low-intensity stratiform rainfall to higher-intensity convective rainfall (Da Silva and Haerter, 2025). It should be noted that the short predictability timescale of convective processes, particularly during initiation, can lead to non-linear responses. This inherent sensitivity may contribute to some of the amplified or variable trends observed in the simulations.
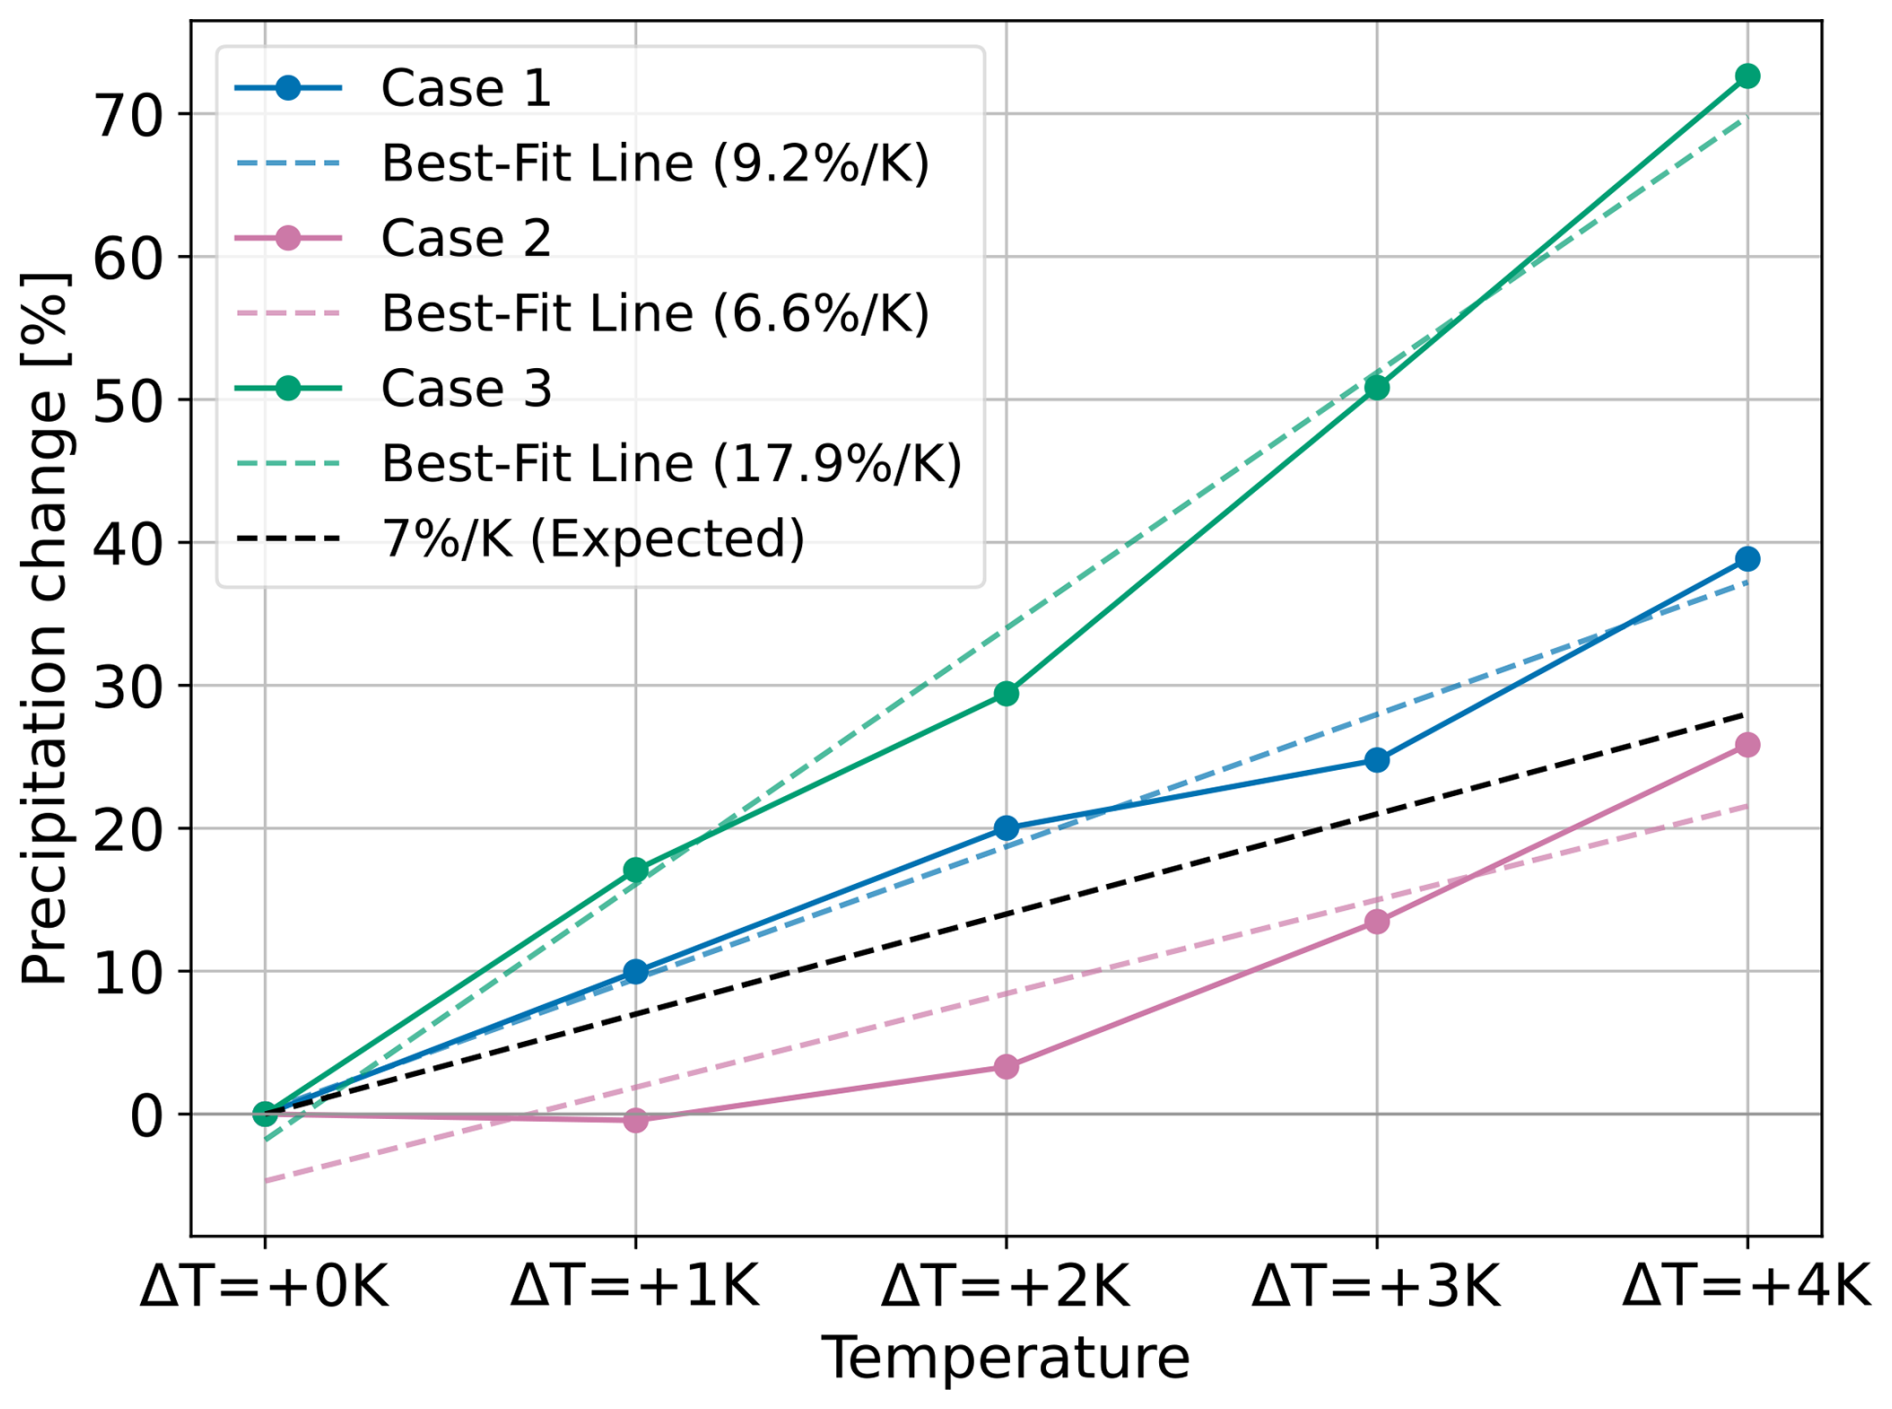
Figure 9Percentage increase in total daily precipitation over the Germany domain and corresponding best-fit lines, compared to the expected Clausius–Clapeyron scaling of 7 % K−1. Solid lines represent the percentage increase in precipitation over the entire day, while the dashed lines in matching colours show the respective best-fit trends. The domain is defined in Fig. 1.
Although all PGW approaches maintain relative humidity at model initialisation and specific humidity increases according to the CC relationship (e.g. Kröner et al., 2017), regional climate simulations of Feldmann et al. (2025) have also shown a decrease in frequency of supercell thunderstorms over the Iberian Peninsula and southwestern France which are subject to strong surface warming and relative humidity decreases in the course of the simulations. Such long-term effects cannot be included in our study because our interest is in a detailed process understanding of aerosol–cloud interactions with high-resolution simulations of individual cases with a sophisticated microphysics scheme and explicit hail particle class.
3.3 Convective Cell Frequency and Lifespan
To further analyse the occurrence of convective cells, the Tobac tracking tool was used as described in Sect. 2.4.3 to assess how their number and lifetime are affected by temperature changes in the atmosphere (Fig. 10). For brevity, maps of cell tracks from the numerical sensitivity experiments are omitted, and the analysis focuses instead on the average number of cells and their lifetimes. All days show an increase in the mean number of convective cells and a decrease in their mean lifetime in simulations with higher temperatures. The increase in the number of cells is quite substantial and ranges between +37 % and +63 % for a +4 K warming scenario, whereas the mean lifetimes are reduced by 5–20 min only. These averages were computed using all detected convective cells, not only supercells. After investigating precipitation rates, an explanation for the shorter lifetimes of convective cells is found. Precipitation is found to start simultaneously across all investigated temperatures, with higher temperatures leading to greater peak intensities, followed by an earlier decline. This behaviour can be explained by the fact that higher temperatures enhance convective intensity, leading to a faster depletion of the available CAPE, even when overall CAPE is higher. This interpretation is supported by the observed increase in up- and downdraught velocities (Fig. 4), ultimately resulting in shorter cell lifetimes.
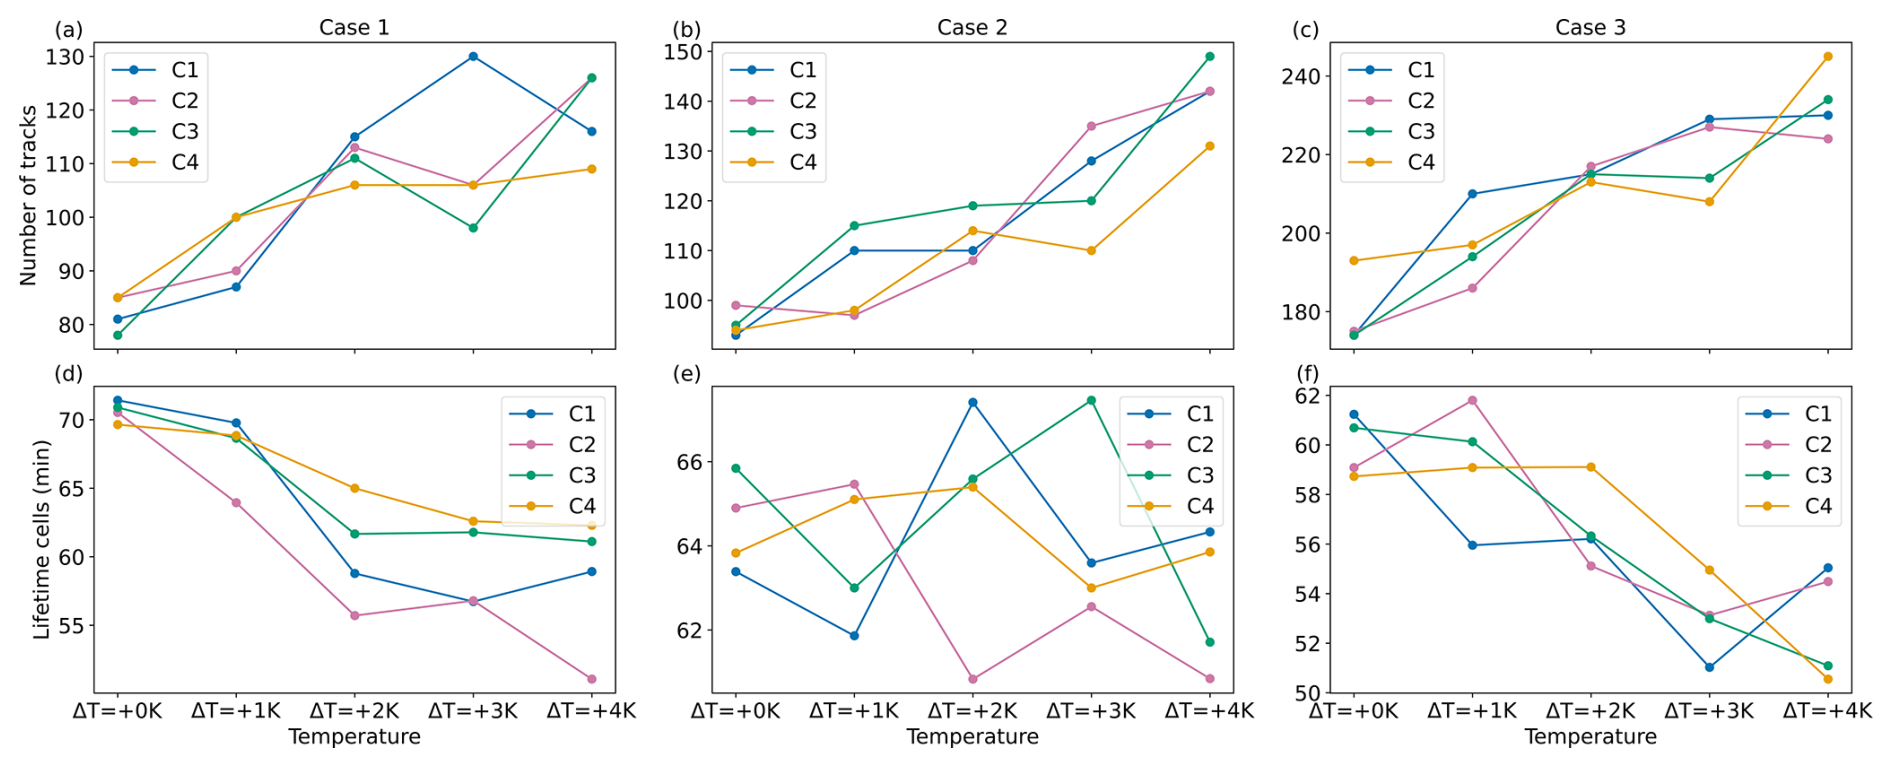
Figure 10Number of tracks detected by the Tobac tool for (a) case 1, (b) case 2, and (c) case 3, and mean lifetimes of convective cells for all temperature regimes and CCN concentrations for (d) case 1, (e) case 2, and (f) case 3. All values are calculated between 06:00 and 24:00 UTC. The MOSES domain was used for cases 1 and 2, while the Germany domain was used for case 3. Line colours indicate the different CCN concentrations. The domains are defined in Fig. 1.
3.4 Aerosol-cloud interactions (ACI)
To gain an overview of how precipitation is affected by CCN concentration, changes in surface precipitation and total column-integrated parameters such as cloud water, rain, ice, snow, graupel, and hail are analysed (Fig. 11). Additionally, process rates of microphysical mechanisms are examined to explain the changes that have been observed. This analysis focuses on the results from the reference temperature simulations, as all temperature variations exhibited similar behaviour and, therefore, do not require a separate discussion. Following this analysis, the effects of temperature and CCN concentration on cold and warm rain formation processes, as well as on precipitation efficiency, are discussed.
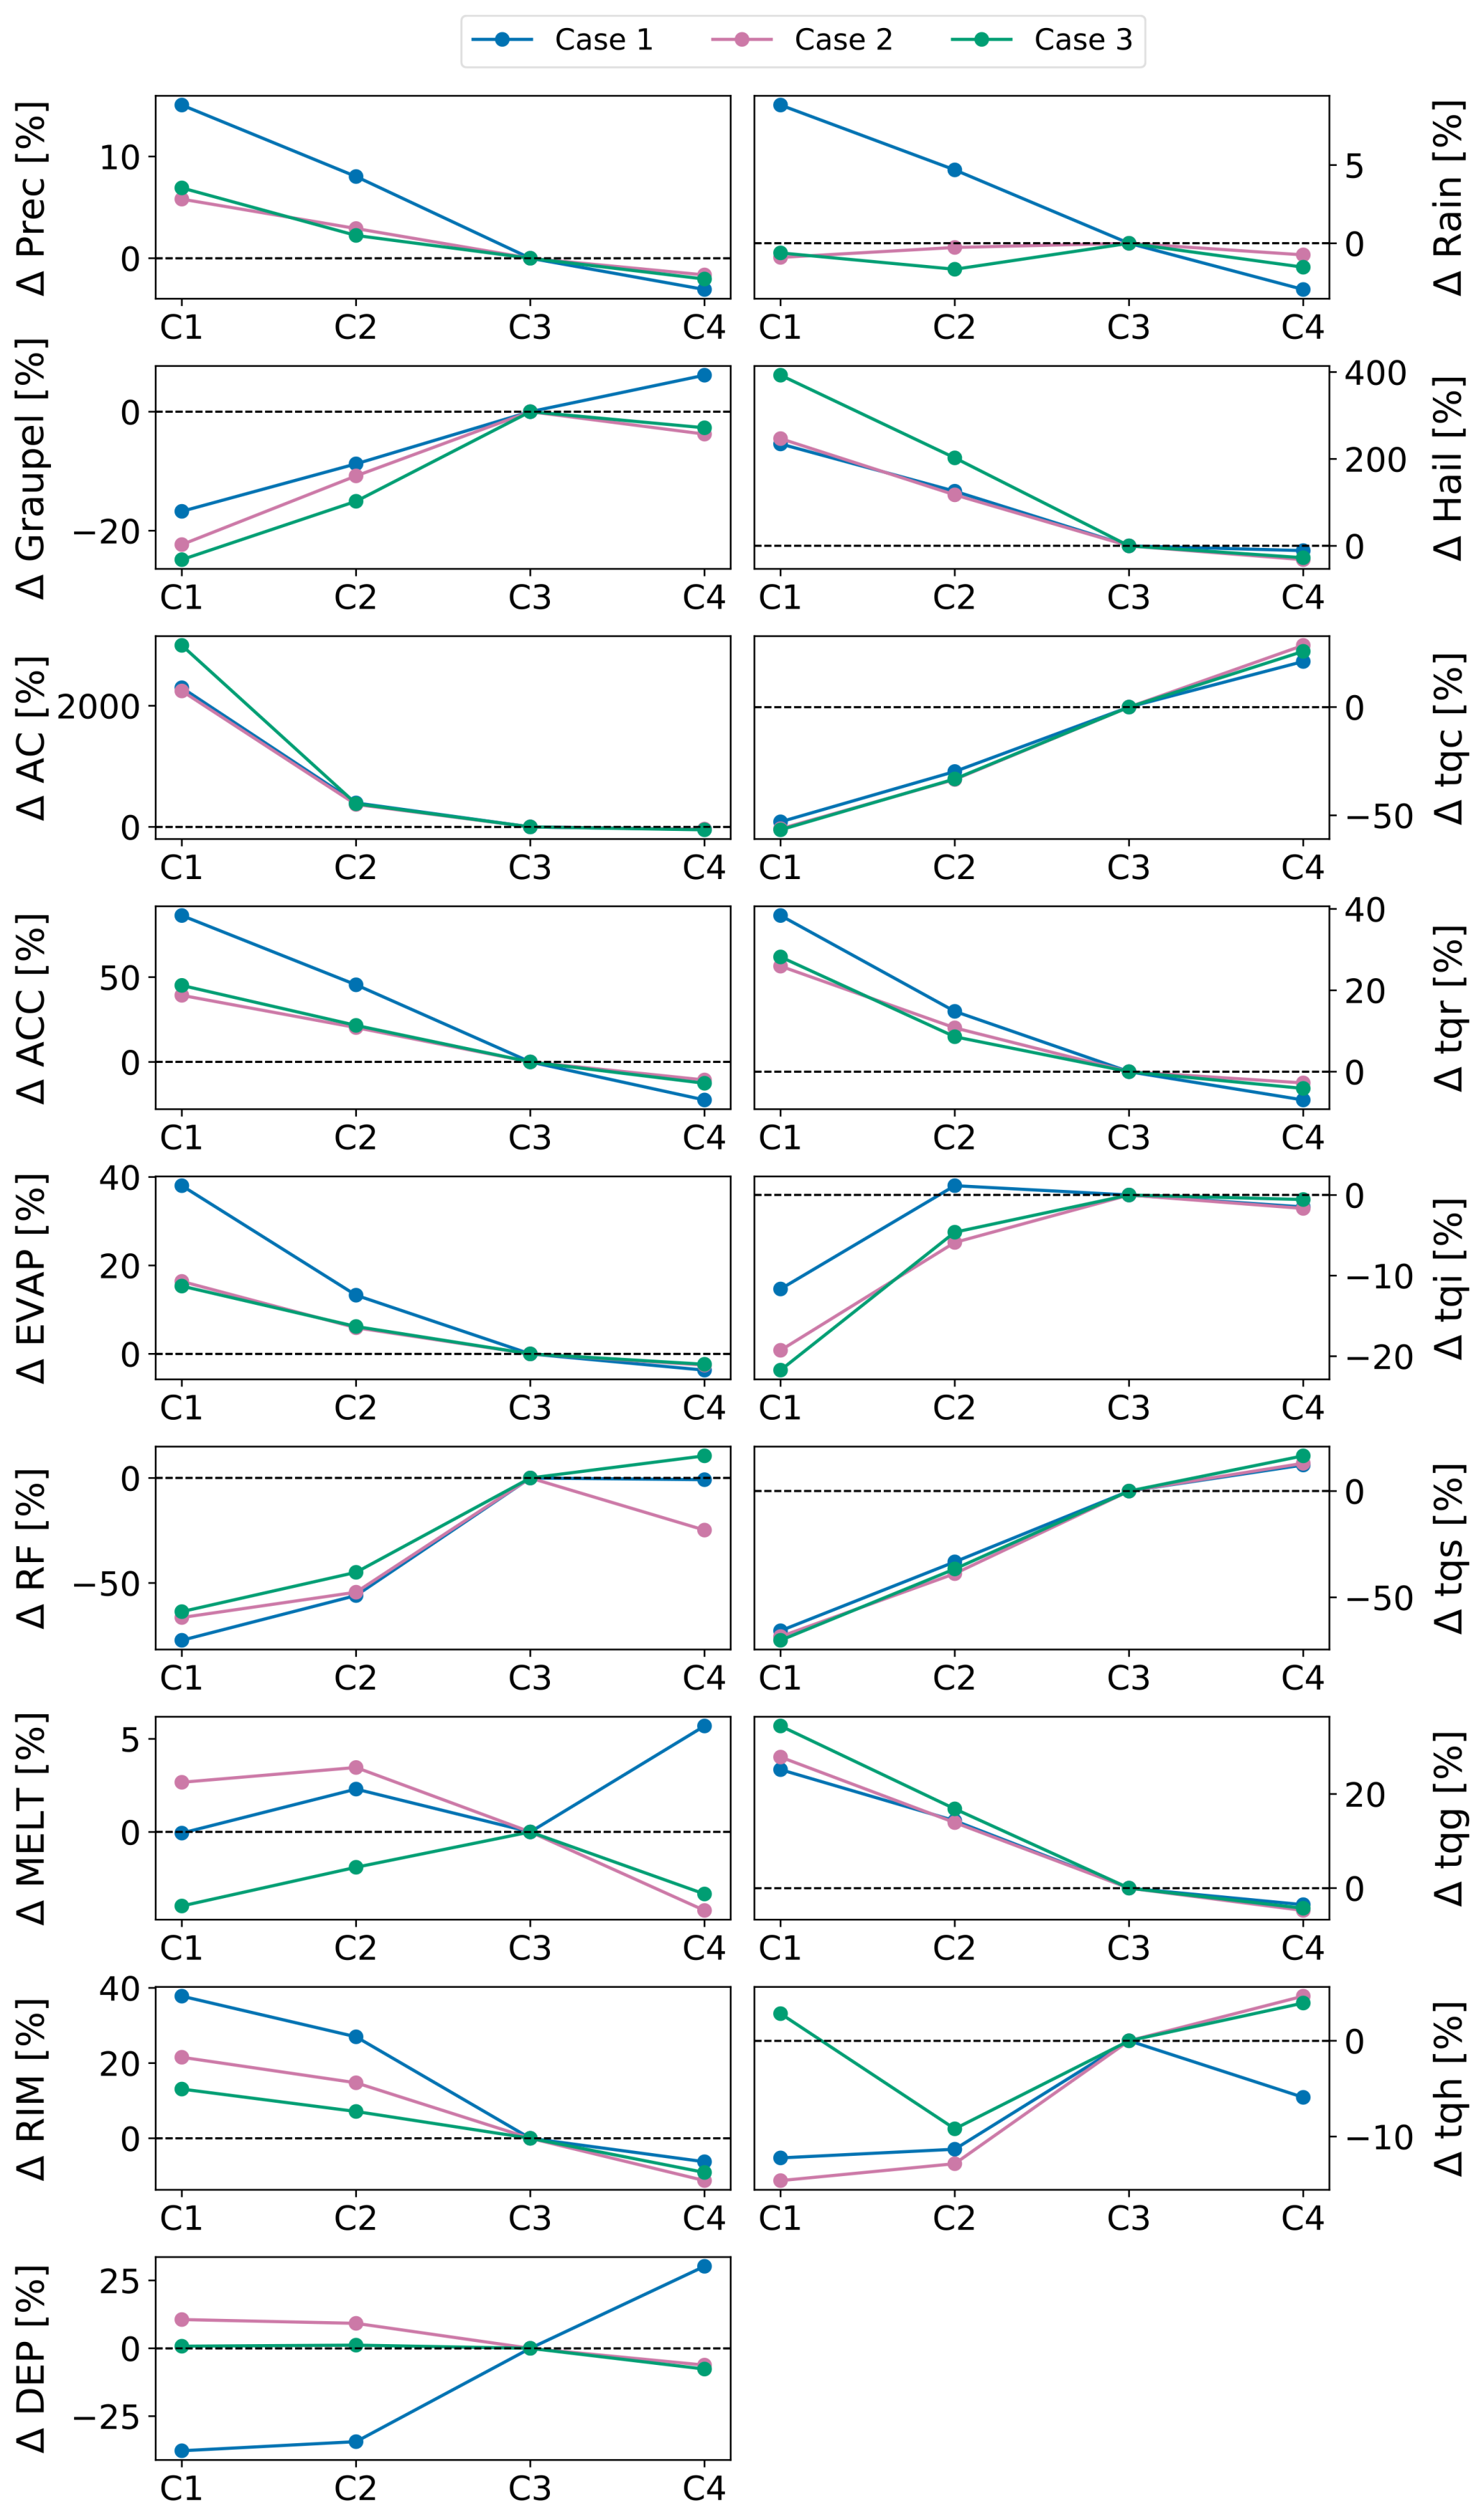
Figure 11Percentage deviations of spatiotemporal averages of autoconversion (AC), accretion (ACC), evaporation (EVAP), rain freezing (RF), melting (MELT), total riming (RIM), deposition (DEP) (left column) and of total column integrated cloud water (tqc), rain (tqr), ice (tqi), snow (tqs), graupel (tqg) and hail (tqh) amounts (right column) from the respective reference run C3 with continental CCN assumption. All points refer to the reference temperature scenario without increments. The Germany domain was used, which is defined in Fig. 1.
3.4.1 Microphysical processes
Generally, a higher CCN concentration results in suppressed precipitation formation due to the more numerous but smaller cloud droplets, making the collision and coalescence process less efficient (Fan et al., 2017). Despite this initial suppression, the cold-phase convective invigoration theory suggests that delayed precipitation at high CCN levels can ultimately lead to more intense convection and stronger rainfall, along with the formation of more cold-phase hydrometeors (Rosenfeld et al., 2008). In contrast, lower CCN concentrations typically lead to fewer but larger cloud droplets, facilitating more efficient precipitation processes (Yau and Rogers, 1996). In all three simulated cases, total precipitation decreases for higher CCN concentrations. Rain does not exhibit a clear trend, graupel increases, and hail shows a large decrease of more than 200 % under higher CCN conditions (Fig. 11a–d). Higher CCN concentrations are expected to increase the number of cloud droplets while reducing their size, which may not always lead to a higher total cloud water mass. However, enhanced droplet nucleation can still result in increased column-integrated cloud water due to suppressed precipitation processes, a pattern that is observed across all three cases (Fig. 11f). Additionally, a decrease in the autoconversion and accretion processes is observed (Fig. 11e, g), both contributing to rain formation, explaining the decrease in rain within the atmosphere. At the same time, evaporation is enhanced for low CCN concentrations (Fig. 11i), which could explain why the increase in column-integrated rain for low CCN concentrations does not result in an increase in surface rain on all three days. Moreover, total column-integrated ice and snow (Fig. 11j, l) increases under polluted conditions, aligning with the cold-phase convection invigoration theory. This theory suggests that delayed precipitation formation allows cloud water to ascend to higher altitudes, transitioning into ice and other frozen hydrometeors. However, the cold-phase convection theory also predicts enhanced convection, which is not supported by the observed updraught intensities (not shown). Instead, a reversed trend emerges, with stronger up-and-downdraughts occurring at lower CCN concentrations. These findings raise questions about the applicability of the cold-phase convective invigoration hypothesis in this context. While the theory proposes that increased aerosol concentrations enhance storm intensity through latent heat release during freezing, its overall validity remains uncertain. Numerous studies report contradictory results depending on cloud type, environmental conditions, and the choice of microphysical schemes (van den Heever et al., 2011; Altaratz et al., 2014; Fan et al., 2017). Recent theoretical work even suggests that aerosol-induced updraught enhancements may be much weaker or even negative than previously assumed (Altaratz et al., 2014; Igel and van den Heever, 2021).
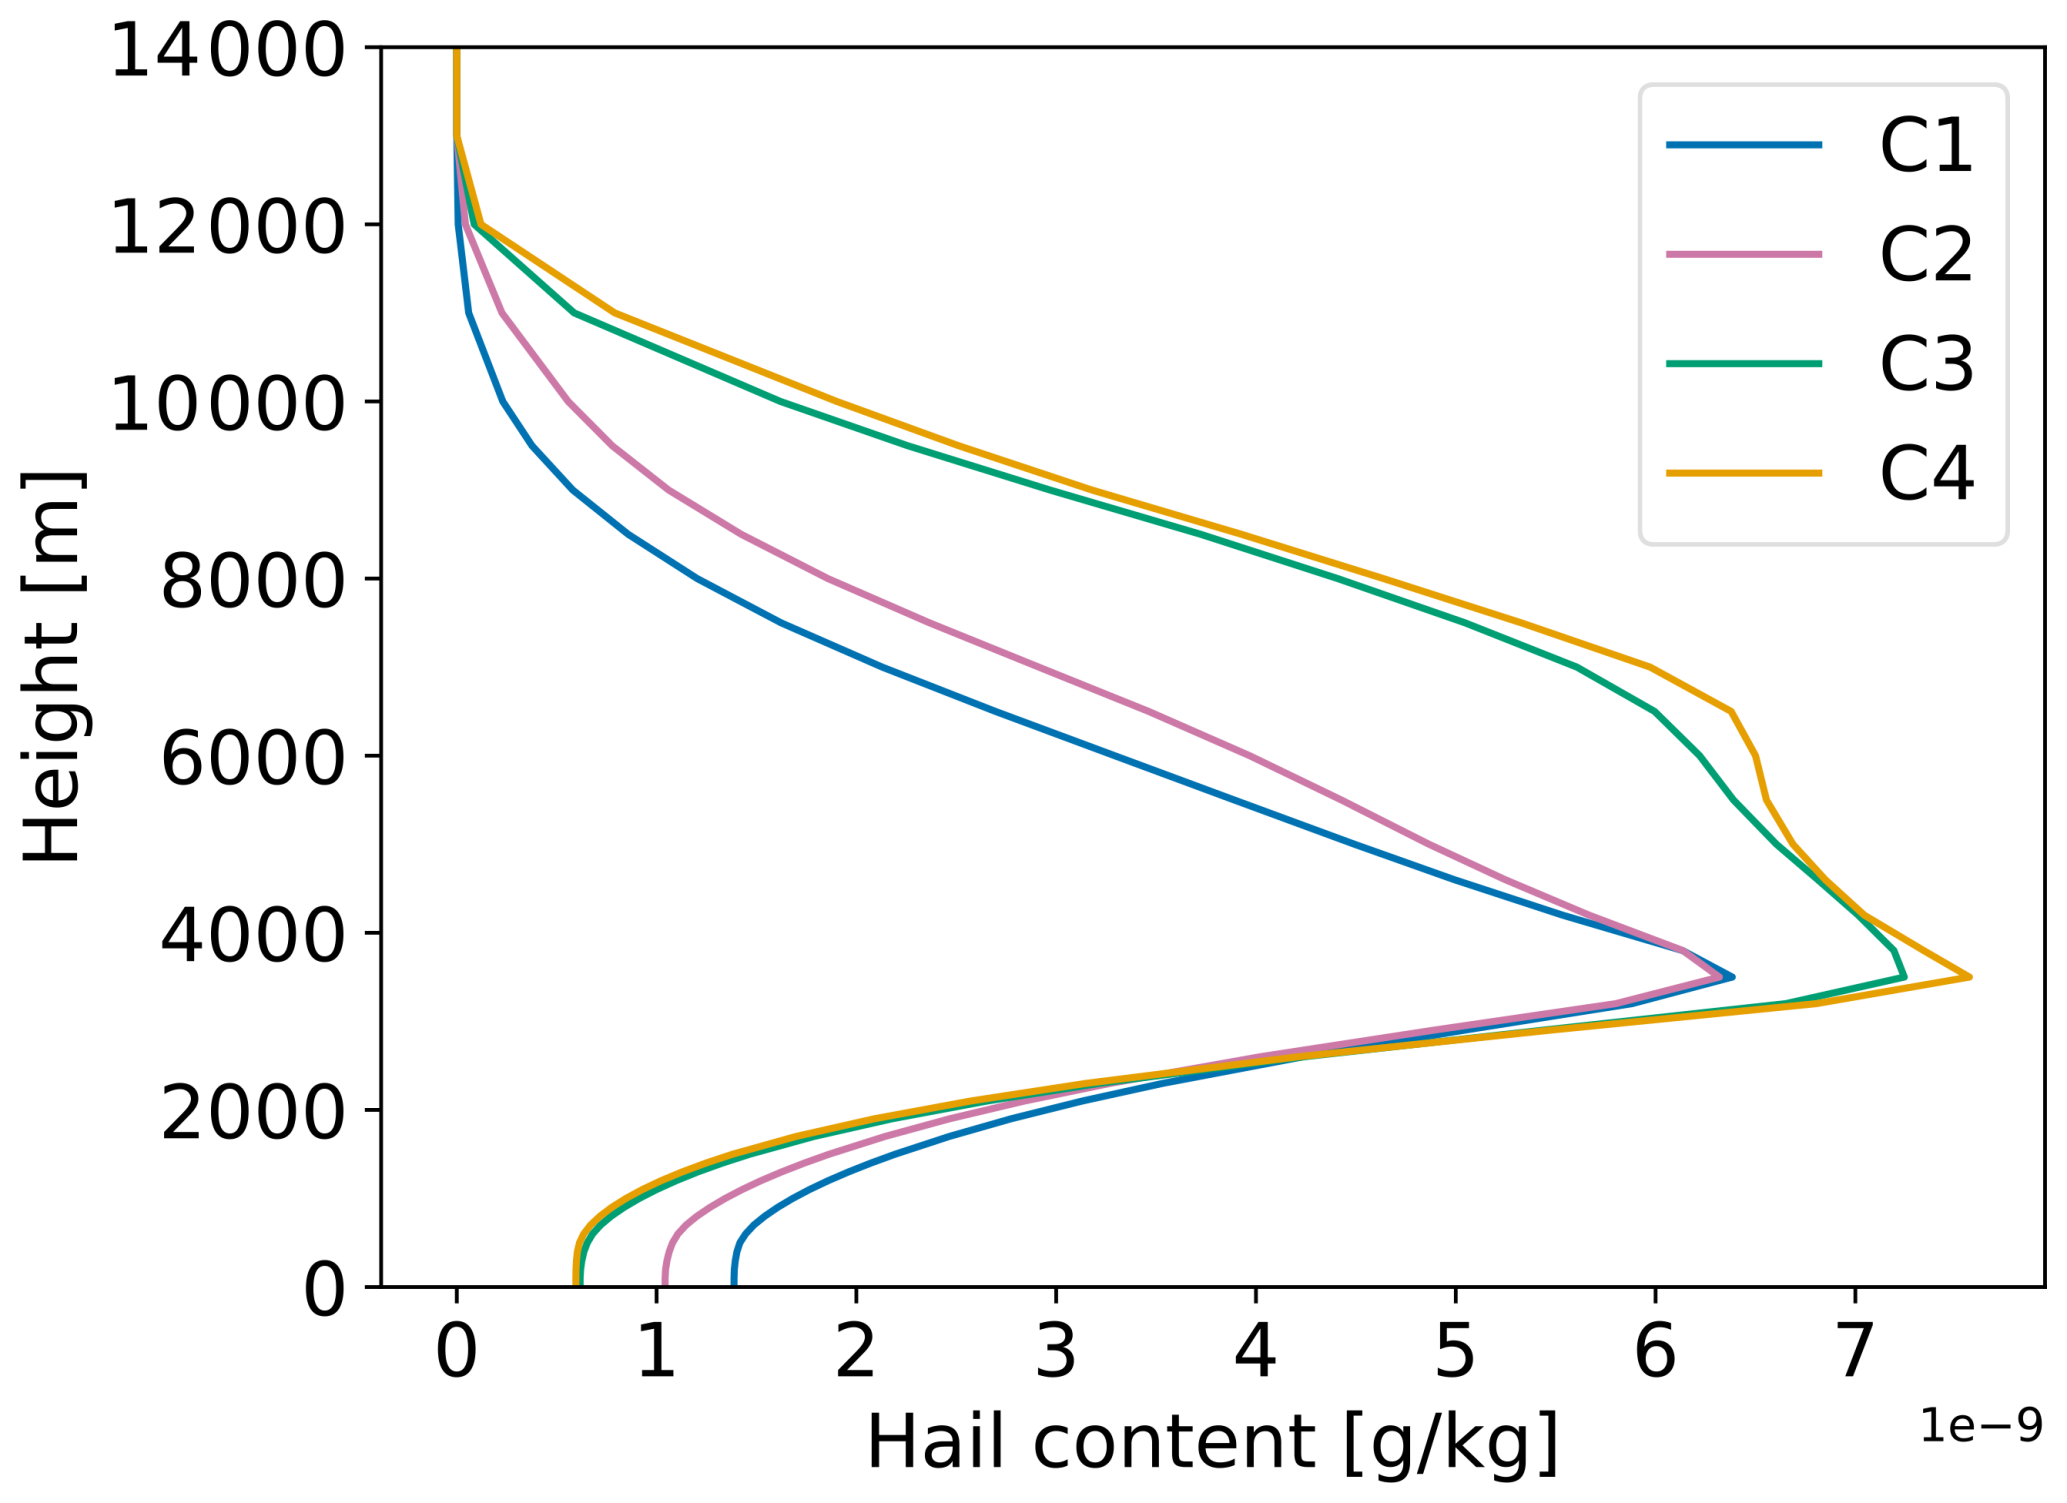
Figure 12Vertical profiles of spatio-temporal averages of hail content in the MOSES domain for different CCN concentrations on 23 June 2021 (case 1). The domain is defined in Fig. 1.
Rain freezing, deposition, and riming are all processes contributing to graupel and hail formation (Fig. 11k, q, o). The only hail production component that strongly decreases with higher CCN concentrations, mirroring the trend in surface hail content, is total riming, which exhibits an average change between 20 % and 40 %. However, riming is the most important contributor to hail and graupel formation, with a magnitude approximately four times greater than rain freezing and deposition. Consequently, rain freezing and deposition have a negligible impact on hail formation. Interestingly, while column-integrated graupel content decreases in a high CCN environment within the column (Fig. 11n), hail content increases (Fig. 11p), which is the opposite of what occurs at the surface. Typically, a decrease in the total column would not be expected to correspond with an increase at the surface. To understand this behaviour, it is essential to consider the differences in hailstone sizes at varying CCN concentrations. This study previously found that hailstones grow larger in low CCN environments. Conversely, in low CCN environments, where hailstones are larger, melting is expected to be less efficient due to their lower surface-to-mass ratio. This interpretation is consistent with the vertical profiles of hail content (Fig. 12), which suggest reduced melting in low CCN cases (the lowest maximum around 4 km agl of all different CCN concentrations, but the largest values at the ground). It should be noted that the model output provides combined melting rates of hail and graupel, so hail-only melting cannot be quantified separately. Nevertheless, the earlier analysis of hail size distributions at the surface (Fig. 8) clearly shows that larger hailstones reach the ground under low CCN concentrations, and the reduced efficiency of melting provides a plausible mechanism for this behaviour. A comparable mechanism operates in warmer environments: stronger updraughts favour the growth of larger hailstones, which are less sensitive to melting due to their lower surface-to-mass ratio, while smaller stones are more prone to melting during descent. This dual effect explains why both warming and CCN reductions contribute to a coherent shift in the hail size distribution towards larger hailstones at the surface. Simultaneously, more graupel transforms into hail, while the remaining graupel melts before reaching the surface, leading to a decrease in surface graupel content under lower CCN conditions. This mechanism could also explain the overall relatively constant melting rates (Fig. 11m). However, since the output of the model does not differentiate between the melting rates of graupel and hail, direct verification of this hypothesis remains challenging.
3.4.2 Rain formation processes and precipitation efficiency
Rain can form through warm and cold processes. Given that the simulations are done for various temperatures and CCN concentrations, it is anticipated that the ratio between cold and warm rain formation will differ. This ratio is determined by dividing the contributions of processes that generate cold and warm rain, respectively, as follows:
DEP represents deposition, RIM denotes riming, and AC and ACC are autoconversion and accretion (Barthlott et al., 2022a). Figure 13 presents the results for each simulation day, showing variations in temperature and CCN concentrations. Across all days, higher CCN concentrations are associated with an increased cold-to-warm rain formation ratio, indicating a stronger contribution of cold rain processes. From a physical perspective, high concentrations of aerosols slow down the onset of warm rain by inhibiting autoconversion and lowering the effectiveness of collision–coalescence. Consequently, a larger amount of cloud water can ascend into the mixed-phase region, where it contributes to cold-rain formation. Consequently, a shift to the cold pathway exists. In the scenarios with higher temperatures, the cold-to-warm ratio is systematically reduced across all CCN regimes. The higher the temperature increment, the lower the resulting cold-to-warm ratio. As expected with higher freezing levels in warmer environments, the vertical range for the warm-phase pathway increases, whereas the one for the cold-rain pathway decreases. As a result, the percentage increase with larger aerosol loads is smaller for higher temperatures.
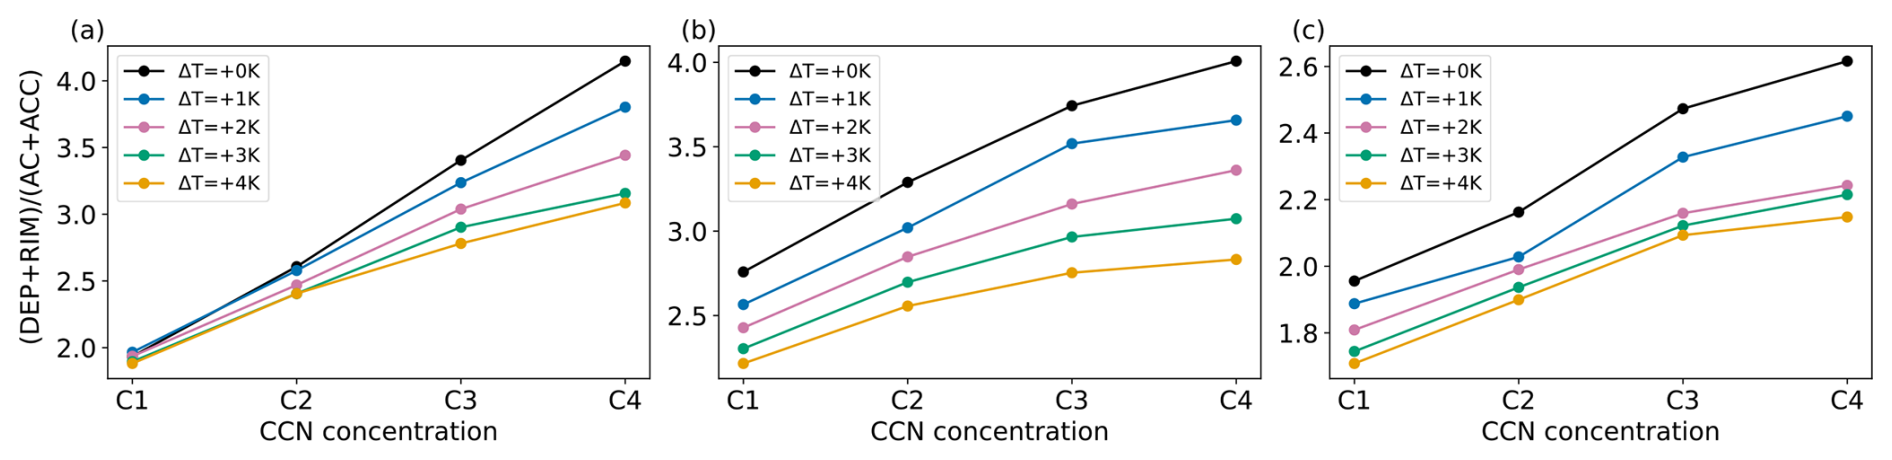
Figure 13Cold-to-warm rain ratio (DEP + RIM(AC + ACC) for different CCN concentrations and temperatures for (a) case 1, (b) case 2, and (c) case 3. For cases 1 and 2, the MOSES domain was analysed for case 3, the Germany domain. The domains are defined in Fig. 1.
Figure 14a displays the ratio of cold-to-warm rain formation processes, as a function of precipitation rate for case 1. The ratio increases systematically with CCN concentration, from approximately 1.9 for C1 to over 4.1 for C4. This represents more than a twofold increase in the relative contribution of cold rain processes when moving from the lowest to the highest CCN scenario. This trend underscores the pronounced sensitivity of rain formation mechanisms to CCN concentrations: higher CCN concentrations suppress warm rain formation through delayed autoconversion and enhanced cloud droplet competition, thereby shifting precipitation generation toward cold processes, such as deposition and riming. Importantly, the ratio remains remarkably stable across a broad range of precipitation rates above 0.2 mm per 30 min. This stability suggests a shift in microphysical regimes primarily driven by CCN concentration, consistent with findings from Barthlott and Hoose (2018).
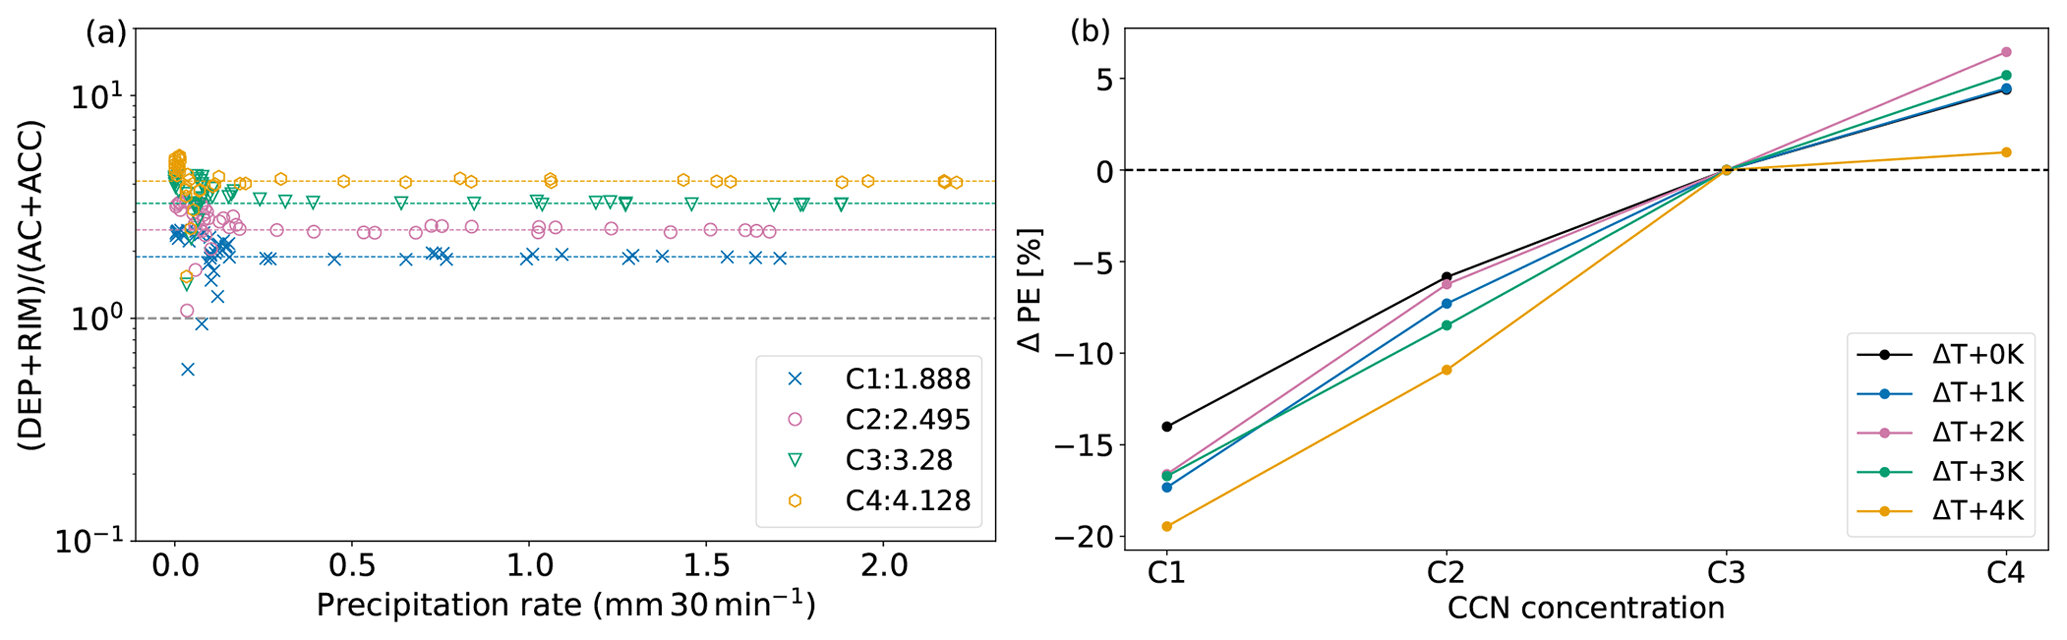
Figure 14(a) Cold-to-warm rain ratios (DEP + RIM)(AC + ACC) plotted for each half an hour for different CCN concentrations (case 1): C1 (blue cross), C2 (orange circle), C3 (green triangle), C4 (red hexagon). Dashed lines in the corresponding colour represent the mean taken for all data points having precipitation rates larger than 0.2 mm 30 min−1. The legend includes the mean cold-to-warm rain ratios of each CCN concentration shown by the dashed lines. (b) Precipitation efficiency of all four CCN concentrations for all simulation temperatures for case 1. The MOSES domain was used, which is defined in Fig. 1.
Another important parameter for precipitation formation is precipitation efficiency (PE). Total surface precipitation (P) is determined by both the generation of hydrometeors (G) and the fraction of this condensate that ultimately reaches the ground, described as PE. PE is defined as the ratio of precipitation to the generation term,
where G includes all processes that generate condensates in the atmosphere, namely deposition, riming, autoconversion, and accretion (Baur et al., 2022). Analysing PE provides additional diagnostic insight into how efficiently clouds convert condensate into surface precipitation. In particular, PE highlights the role of microphysical processes such as evaporation and melting, which cannot be inferred directly from P or G alone. Figure 14b shows the calculated PE for case 1 and the sensitivity to varying CCN concentrations, reflecting the relationship between condensate production and the amount of precipitation reaching the surface. An increase in PE is observed with higher CCN concentrations, indicating that a larger fraction of the formed hydrometeors reaches the surface. The generation term G (not shown) was also analysed separately and shows a decreasing trend with increasing CCN concentrations. Since total precipitation P depends on both PE and G, the net effect varies: if the increase in PE outweighs the decrease in G, precipitation increases, and vice versa. In most simulations, precipitation decreases with higher CCN levels (not shown), except for case 3, where precipitation remains nearly constant at +2 K and even increases at +3 K. Overall, the changes in precipitation remain relatively modest, typically within 10 %.
This study investigated how convective storms in Germany, especially supercells, would evolve under future climate conditions and environments with different aerosol loads. To explore these influences, this study conducted convection-permitting real-case simulations of supercell events previously observed during the Swabian MOSES field campaigns of 2021 and 2023. These events were simulated across five temperature scenarios, including a reference simulation, +1, +2, +3, and +4 K, and four different CCN concentrations ranging from low to very high CCN concentrations to observe storm behaviour under varied environmental conditions. The temperature perturbations were applied using the PGW approach, which isolates thermodynamic climate signals by consistently modifying initial and boundary conditions. This methodology enables a controlled investigation of the sensitivity of convective storm characteristics, such as storm intensity, duration, and convective precipitation, to future warming. By employing high-resolution, convection-permitting simulations on a 1 km grid, this research enables a detailed examination of convective processes, a depth of analysis that cannot be found in similar studies. This high-resolution model enables a comprehensive understanding of the dynamics of supercells and storm intensities in response to changing environmental conditions. The results demonstrate that higher temperatures generally increase convective parameters such as CAPE and CIN, leading to more intense convection and a greater number of convective cells overall. This, in turn, accelerates the depletion of CAPE. The shorter lifetimes of convective cells in warmer environments further illustrate this effect. Other papers, such as Huang et al. (2024); Mallinson et al. (2024); Yang et al. (2024), also observed an increase in CAPE and CIN. This combination implies that stronger triggering mechanisms are required to initiate convection, which in turn would favour the development of fewer but more intense convective systems. Another important finding was the correlation of larger mean helicity values with increased atmospheric temperatures. Helicity values serve as indicators for updraught rotation and, therefore, supercells. Therefore, the simulations demonstrated that in a warmer environment, the likelihood of supercell development is increased, which leads either to more supercell formation, more intense supercells, or a combination of both. The increased likelihood of supercells found by our single case studies agrees well with recent climate simulations of Feldmann et al. (2025). By comparing a current-climate simulation with a pseudo–global warming scenario (+3 K), they found that the future climate simulation shows an average increase of supercell occurrence by 11 %. Furthermore, updraught intensity is increased in warmer environments, which supports the hypothesis of stronger convective cells. The study also identified large changes in precipitation amounts and the spatial distribution of rainfall in response to varying temperatures. As temperatures increased, total precipitation amounts generally rose, with both rain and hail exhibiting greater amounts. The analysis of the 95th percentile and the area that is affected by the 95th percentile both indicated a rise, which heightens the risk of flash floods. Additionally, for two of the three simulated cases, a super-CC scaling rate was observed, which means that the increase in precipitation can only be explained by additional factors beyond the increase in water vapour in the air column. Further analysis of hail characteristics indicates that higher temperatures and lower CCN concentrations, both anticipated in a future climate, lead to an increase in hailstone size, particularly for mean and large hailstones during convective events. This trend is especially concerning given the high damage potential of larger hailstones. The results further indicate that warmer environments foster stronger updraughts, which support the growth of larger hailstones. These larger stones are less affected by melting due to their lower surface-to-mass ratio, while smaller ones are more efficiently lost during descent. This dual process is consistent with previous findings (Raupach et al., 2021) and explains the coherent shift in hail size distributions toward fewer small and more large hailstones under climate change. The analysis of how varying CCN concentrations influence ACI revealed several notable effects. Importantly, the influence of CCN on microphysical processes remains consistent across all temperature regimes. In high CCN environments, the processes of autoconversion and accretion, which are critical for warm rain formation, decrease, explaining the observed decrease in surface rainfall. The previously discussed decrease in hail was then attributed to a reduced riming process, which is the primary mechanism for hail formation. A closer examination of hail dynamics showed that there is more hail within the atmospheric column in environments with higher CCN concentrations. However, the amount of hail decreases at the surface compared to simulations with lower CCN concentrations. This counterintuitive result was explained by the smaller size of hailstones formed in high CCN conditions, which increases melting rates compared to the larger hailstones produced in low CCN environments. The differences in formation processes result in an increased cold-to-warm rain formation ratio in environments with higher CCN concentrations and a decreased ratio in higher temperatures. Moreover, precipitation efficiency was considerably increased in environments with high CCN concentrations. As a result, while fewer hydrometeors were produced in high CCN concentration settings, a larger fraction of them reached the Earth's surface.
Due to the small number of case studies analysed here, no general conclusions can be drawn. Furthermore, our PGW approach, with uniform vertical warming and maintained relative humidity, does not account for possible lapse rate changes (e.g. Brogli et al., 2021), shifts in weather patterns at the synoptic level, or humidity gradients that may develop over longer simulation periods. However, our results, obtained using a sophisticated double-moment microphysics scheme that includes explicit hail, provide valuable insights into the effects of aerosols on mixed-phase clouds in various warming scenarios. The findings suggest that convective storms, particularly supercells, are likely to intensify, resulting in heavier precipitation and larger hailstones. The increasing intensity of precipitation hazards raises the risk of flash floods and poses a greater threat to property, agriculture, and infrastructure.
This study is based on the ICON model version 2.6.6. The ICON model is available to the community under a permissive open source licence (BSD-3C) at https://doi.org/10.35089/wdcc/iconrelease2025.04 (ICON partnership (MPI-M, DWD, DKRZ, KIT, C2SM), 2025).
The nature of the 4-D data generated in running the model experiments requires a large tape storage facility. These data are of the order of 200 TB (terabytes). The model data can be made available by the authors upon request. Global Forecast System (GFS) data is available through https://www.ncei.noaa.gov/products/weather-climate-models/global-forecast (last access: 10 December 2025). The data needed to replicate the figures can be found at https://doi.org/10.5281/zenodo.15830656 (Lucas et al., 2025).
CB developed the project idea and designed the numerical experiments. LL performed the numerical simulations and conducted the analyses. LL wrote the paper with contributions from all co-authors.
The contact author has declared that none of the authors has any competing interests.
Publisher’s note: Copernicus Publications remains neutral with regard to jurisdictional claims made in the text, published maps, institutional affiliations, or any other geographical representation in this paper. While Copernicus Publications makes every effort to include appropriate place names, the final responsibility lies with the authors. Views expressed in the text are those of the authors and do not necessarily reflect the views of the publisher.
The authors thank the German Weather Service (DWD) for providing the ICON model code, the initial and boundary data, and the RADOLAN data. The field campaigns Swabian MOSES 2021 and 2023 were supported by funding from the Helmholtz Association within the framework of MOSES. The authors gratefully acknowledge the computing time made available to them on the high-performance computer HoreKa at the NHR Centre NHR@KIT. This centre is jointly supported by the Federal Ministry of Education and Research and the state governments participating in the NHR (https://www.nhr-verein.de/unsere-partner, last access: 10 December 2025). This work was performed with the help of the Large Scale Data Facility at the Karlsruhe Institute of Technology, funded by the Ministry of Science, Research and the Arts Baden-Württemberg and by the Federal Ministry of Education and Research. The editing process was supported by OpenAI's GPT-4, which was used to suggest revisions for language, structure, and readability. “Grammarly” generative AI (https://app.grammarly.com/, last access: 10 December 2025) was used for the whole article's grammar, spelling, and stylistic check.
The article processing charges for this open-access publication were covered by the Karlsruhe Institute of Technology (KIT).
This paper was edited by Blaž Gasparini and reviewed by Monika Feldmann and one anonymous referee.
Allen, J. T., Giammanco, I. M., Kumjian, M. R., Jurgen Punge, H., Zhang, Q., Groenemeijer, P., Kunz, M., and Ortega, K.: Understanding Hail in the Earth System, Rev. Geophys., 58, e2019RG000665, https://doi.org/10.1029/2019RG000665, 2020. a
Altaratz, O., Koren, I., Remer, L., and Hirsch, E.: Review: Cloud invigoration by aerosols—Coupling between microphysics and dynamics, Atmos. Res., 140-141, 38–60, https://doi.org/10.1016/j.atmosres.2014.01.009, 2014. a, b, c
Ashley, W. S., Haberlie, A. M., and Gensini, V. A.: The future of supercells in the United States, B. Am. Meteorol. Soc., 104, E1–E21, https://doi.org/10.1175/BAMS-D-22-0027.1, 2023. a
Barthlott, C. and Hoose, C.: Aerosol effects on clouds and precipitation over central Europe in different weather regimes, J. Atmos. Sci., 75, 4247–4264, https://doi.org/10.1175/JAS-D-18-0110.1, 2018. a
Barthlott, C., Zarboo, A., Matsunobu, T., and Keil, C.: Impacts of combined microphysical and land-surface uncertainties on convective clouds and precipitation in different weather regimes, Atmos. Chem. Phys., 22, 10841–10860, https://doi.org/10.5194/acp-22-10841-2022, 2022a. a, b
Barthlott, C., Zarboo, A., Matsunobu, T., and Keil, C.: Importance of aerosols and shape of the cloud droplet size distribution for convective clouds and precipitation, Atmos. Chem. Phys., 22, 2153–2172, https://doi.org/10.5194/acp-22-2153-2022, 2022b. a
Barthlott, C., Czajka, B., Kunz, M., Saathoff, H., Zhang, H., Böhmländer, A., Gasch, P., Handwerker, J., Kohler, M., Wilhelm, J., Wieser, A., and Hoose, C.: The impact of aerosols and model grid spacing on a supercell storm from Swabian MOSES 2021, Q. J. Roy. Meteor. Soc., 150, 2005–2027, https://doi.org/10.1002/qj.4687, 2024. a, b
Battaglioli, F., Groenemeijer, P., Púčik, T., Taszarek, M., Ulbrich, U., and Rust, H.: Modeled Multidecadal Trends of Lightning and (Very) Large Hail in Europe and North America (1950–2021), J. Appl. Meteor. Climatol., 62, 1627–1653, https://doi.org/10.1175/JAMC-D-22-0195.1, 2023. a
Bauer, P., Thorpe, A., and Brunet, G.: The quiet revolution of numerical weather prediction, Nature, 525, 47–55, https://doi.org/10.1038/nature14956, 2015. a
Baur, F., Keil, C., and Barthlott, C.: Combined effects of soil moisture and microphysical perturbations on convective clouds and precipitation for a locally forced case over Central Europe, Q. J. Roy. Meteor. Soc., 148, 2132–2146, https://doi.org/10.1002/qj.4295, 2022. a
Brennan, K. P., Sprenger, M., Walser, A., Arpagaus, M., and Wernli, H.: An object-based and Lagrangian view on an intense hailstorm day in Switzerland as represented in COSMO-1E ensemble hindcast simulations, Weather Clim. Dynam., 6, 645–668, https://doi.org/10.5194/wcd-6-645-2025, 2025a. a
Brennan, K. P., Thurnherr, I., Sprenger, M., and Wernli, H.: Insights from hailstorm track analysis in European climate change simulations, Nat. Hazards Earth Syst. Sci., 25, 3693–3712, https://doi.org/10.5194/nhess-25-3693-2025, 2025b. a
Brogli, R., Lund Sørland, S., Kröner, N., and Schär, C.: Future summer warming pattern under climate change is affected by lapse-rate changes, Weather Clim. Dynam., 2, 1093–1110, https://doi.org/10.5194/wcd-2-1093-2021, 2021. a, b
Brogli, R., Heim, C., Mensch, J., Sørland, S. L., and Schär, C.: The pseudo-global-warming (PGW) approach: methodology, software package PGW4ERA5 v1.1, validation, and sensitivity analyses, Geosci. Model Dev., 16, 907–926, https://doi.org/10.5194/gmd-16-907-2023, 2023. a
Buizza, R.: Introduction to the special issue on “25 years of ensemble forecasting”, Q. J. Roy. Meteorol. Soc., 145, 1–11, https://doi.org/10.1002/qj.3370, 2019. a
Chen, W., Cui, H., and Zheng, J.: Prediction of Clausius–Clapeyron scaling of daily precipitation extremes over China, J. Climate, 37, 165–177, https://doi.org/10.1175/JCLI-D-23-0030.1, 2024. a
Chin, M., Diehl, T., Tan, Q., Prospero, J. M., Kahn, R. A., Remer, L. A., Yu, H., Sayer, A. M., Bian, H., Geogdzhayev, I. V., Holben, B. N., Howell, S. G., Huebert, B. J., Hsu, N. C., Kim, D., Kucsera, T. L., Levy, R. C., Mishchenko, M. I., Pan, X., Quinn, P. K., Schuster, G. L., Streets, D. G., Strode, S. A., Torres, O., and Zhao, X.-P.: Multi-decadal aerosol variations from 1980 to 2009: a perspective from observations and a global model, Atmos. Chem. Phys., 14, 3657–3690, https://doi.org/10.5194/acp-14-3657-2014, 2014. a
Costa-Surós, M., Sourdeval, O., Acquistapace, C., Baars, H., Carbajal Henken, C., Genz, C., Hesemann, J., Jimenez, C., König, M., Kretzschmar, J., Madenach, N., Meyer, C. I., Schrödner, R., Seifert, P., Senf, F., Brueck, M., Cioni, G., Engels, J. F., Fieg, K., Gorges, K., Heinze, R., Siligam, P. K., Burkhardt, U., Crewell, S., Hoose, C., Seifert, A., Tegen, I., and Quaas, J.: Detection and attribution of aerosol–cloud interactions in large-domain large-eddy simulations with the ICOsahedral Non-hydrostatic model, Atmos. Chem. Phys., 20, 5657–5678, https://doi.org/10.5194/acp-20-5657-2020, 2020. a
Cui, R., Thurnherr, I., Velasquez, P., Brennan, K. P., Leclair, M., Mazzoleni, A., Schmid, T., Wernli, H., and Schär, C.: A European Hail and Lightning Climatology From an 11-Year Kilometer-Scale Regional Climate Simulation, J. Geophys. Res., 130, e2024JD042828, https://doi.org/10.1029/2024JD042828, 2025. a
Da Silva, N. and Haerter, J.: Super-Clausius–Clapeyron scaling of extreme precipitation explained by shift from stratiform to convective rain type, Nat. Geosci., 18, 382–388, https://doi.org/10.1038/s41561-025-01686-4, 2025. a
Fan, J., Wang, Y., Rosenfeld, D., and Liu, X.: Review of aerosol–cloud interactions: Mechanisms, significance, and challenges, J. Atmos. Sci., 73, 4221–4252, https://doi.org/10.1175/JAS-D-16-0037.1, 2016. a
Fan, J., Leung, L. R., Rosenfeld, D., and DeMott, P. J.: Effects of cloud condensation nuclei and ice nucleating particles on precipitation processes and supercooled liquid in mixed-phase orographic clouds, Atmos. Chem. Phys., 17, 1017–1035, https://doi.org/10.5194/acp-17-1017-2017, 2017. a, b
Fan, J., Rosenfeld, D., Zhang, Y., Giangrande, S. E., Li, Z., Machado, L. A. T., Martin, S. T., Yang, Y., Wang, J., Artaxo, P., Barbosa, H. M. J., Braga, R. C., Comstock, J. M., Feng, Z., Gao, W., Gomes, H. B., Mei, F., Pöhlker, C., Pöhlker, M. L., Pöschl, U., and De Souza, R. A. F.: Substantial Convection and Precipitation Enhancements by Ultrafineaerosol Particles, Science, 359, 411–418, https://doi.org/10.1126/science.aan8461, 2018. a
Fan, J., Zhang, Y., Wang, J., Jeong, J.-H., Chen, X., Zhang, S., Lin, Y., Feng, Z., and Adams-Selin, R.: Contrasting responses of hailstorms to anthropogenic climate change in different synoptic weather systems, Earth's Future, 10, e2022EF002768, https://doi.org/10.1029/2022EF002768, 2022. a
Feldmann, M., Blanc, M., Brennan, K. P., Thurnherr, I., Velasquez, P., Martius, O., and Schär, C.: European supercell thunderstorms – A prevalent current threat and an increasing future hazard, Science Advances, 11, eadx0513, https://doi.org/10.1126/sciadv.adx0513, 2025. a, b
Feng, Z., Chen, X., and Leung, L. R.: How Might the May 2015 Flood in the US Southern Great Plains Induced by Clustered MCSs Unfold in the Future?, J. Geophys. Res.-Atmos., 129, e2023JD039605, https://doi.org/10.1029/2023JD039605, 2024. a
Fowler, H. J., Lenderink, G., Prein, A. F., Westra, S., Allan, R. P., Ban, N., Barbero, R., Berg, P., Blenkinsop, S., Do, H. X., Guerreiro, S., Haerter, J. O., Kendon, E. J., Lewis, E., Schaer, C., Sharma, A., Villarini, G., Wasko, C., and Zhang, X.: Anthropogenic intensification of short-duration rainfall extremes, Nature Reviews Earth & Environment, 2, 107–122, https://doi.org/10.1038/s43017-020-00128-6, 2021. a, b, c
Genz, C., Schrödner, R., Heinold, B., Henning, S., Baars, H., Spindler, G., and Tegen, I.: Estimation of cloud condensation nuclei number concentrations and comparison to in situ and lidar observations during the HOPE experiments, Atmos. Chem. Phys., 20, 8787–8806, https://doi.org/10.5194/acp-20-8787-2020, 2020. a
Haerter, J. O. and Berg, P.: Unexpected rise in extreme precipitation caused by a shift in rain type?, Nature Geoscience, 2, 372–373, https://doi.org/10.1038/ngeo523, 2009. a
Hande, L. B., Engler, C., Hoose, C., and Tegen, I.: Seasonal variability of Saharan desert dust and ice nucleating particles over Europe, Atmos. Chem. Phys., 15, 4389–4397, https://doi.org/10.5194/acp-15-4389-2015, 2015. a, b
Hande, L. B., Engler, C., Hoose, C., and Tegen, I.: Parameterizing cloud condensation nuclei concentrations during HOPE, Atmos. Chem. Phys., 16, 12059–12079, https://doi.org/10.5194/acp-16-12059-2016, 2016. a
Handwerker, J., Barthlott, C., Bauckholt, M., Geppert, G., Hühn, E., Nallasamy, N. D., Dick, G., Dietrich, P., Güntner, A., Keller, J., Kunz, M., Landmark, S., Mohannazadeh, M., Morsy, M., Najafi, H., Oertel, A., Rakovec, O., Reich, H., Reich, M., Samaniego, L., Schrön, M., Schütze, C., Steinert, T., Vorogushyn, S., Weber, U., and Wieser, A.: From initiation of convective storms to their impact – The concept of the Swabian MOSES 2023 campaign, Front. Earth Sci., 13, https://doi.org/10.3389/feart.2025.1555755, 2025. a
Hardwick Jones, R., Westra, S., and Sharma, A.: Observed relationships between extreme sub-daily precipitation, surface temperature, and relative humidity, Geophys. Res. Lett., 37, https://doi.org/10.1029/2010GL045081, 2010. a
Harvey, B., Cook, P., Shaffrey, L., and Schiemann, R.: The response of the northern hemisphere storm tracks and jet streams to climate change in the CMIP3, CMIP5, and CMIP6 climate models, J. Geophys. Res.-Atmos., 125, e2020JD032701, https://doi.org/10.1029/2020JD032701, 2020. a
Heikenfeld, M., Marinescu, P. J., Christensen, M., Watson-Parris, D., Senf, F., van den Heever, S. C., and Stier, P.: tobac 1.2: towards a flexible framework for tracking and analysis of clouds in diverse datasets, Geosci. Model Dev., 12, 4551–4570, https://doi.org/10.5194/gmd-12-4551-2019, 2019. a, b
Heise, E., Ritter, B., and Schrodin, E.: Operational implementation of the multilayer soil model TERRA, Technical Report 9, 19 pp., https://doi.org/10.5676/DWD_pub/nwv/cosmo-tr_9, 2006. a
Hirt, M., Craig, G. C., Schäfer, S. A., Savre, J., and Heinze, R.: Cold-pool-driven convective initiation: Using causal graph analysis to determine what convection-permitting models are missing, Q. J. Roy. Meteor. Soc., 146, 2205–2227, https://doi.org/10.1002/qj.3788, 2020. a, b, c, d
Hoeppe, P.: Trends in weather related disasters–Consequences for insurers and society, Weather and Climate Extremes, 11, 70–79, https://doi.org/10.1016/j.wace.2015.10.002, 2016. a
Hogan, R. J. and Bozzo, A.: A Flexible and Efficient Radiation Scheme for the ECMWF Model, Journal of Advances in Modeling Earth Systems, 10, 1990–2008, https://doi.org/10.1029/2018MS001364, 2018. a
Huang, Y., Xue, M., Hu, X.-M., Martin, E., Novoa, H. M., McPherson, R. A., Liu, C., Chen, M., Hong, Y., Perez, A., et al.: Increasing frequency and precipitation intensity of convective storms in the Peruvian Central Andes: Projections from convection-permitting regional climate simulations, Q. J. Roy. Meteor. Soc., https://doi.org/10.1002/qj.4820, 2024. a, b, c
ICON partnership (MPI-M, DWD, DKRZ, KIT, C2SM): ICON release 2025.04, World Data Center for Climate (WDCC) at DKRZ [code], https://doi.org/10.35089/wdcc/iconrelease2025.04, 2025. a
Igel, A. L. and van den Heever, S. C.: Invigoration or enervation of convective clouds by aerosols?, Geophys. Res. Lett., 48, e2021GL093804, https://doi.org/10.1029/2021GL093804, 2021. a, b
Kain, J. S., Weiss, S. J., Bright, D. R., Baldwin, M. E., Levit, J. J., Carbin, G. W., Schwartz, C. S., Weisman, M. L., Droegemeier, K. K., Weber, D. B., and Thomas, K. W.: Some Practical Considerations Regarding Horizontal Resolution in the First Generation of Operational Convection-Allowing NWP, Weather Forecasting, 23, 931–952, https://doi.org/10.1175/WAF2007106.1, 2008. a
Kärcher, B. and Lohmann, U.: A parameterization of cirrus cloud formation: Homogeneous freezing of supercooled aerosols, J. Geophys. Res.-Atmos., 107, https://doi.org/10.1029/2001JD000470, 2002. a
Kärcher, B., Hendricks, J., and Lohmann, U.: Physically based parameterization of cirrus cloud formation for use in global atmospheric models, J. Geophys. Res.-Atmos., 111, https://doi.org/10.1029/2005JD006219, 2006. a
Khain, A., Beheng, K., Heymsfield, A., Korolev, A., Krichak, S., Levin, Z., Pinsky, M., Phillips, V., Prabhakaran, T., Teller, A., van den Heever, S. C., and Yano, J.-I.: Representation of microphysical processes in cloud-resolving models: Spectral (bin) microphysics versus bulk parameterization, Rev. Geophys., 53, 247–322, https://doi.org/10.1002/2014RG000468, 2015. a
Kim, M. H., Lee, J., and Lee, S.-J.: Hail: Mechanisms, Monitoring, Forecasting, Damages, Financial Compensation Systems, and Prevention, Atmosphere, 14, 1642, https://doi.org/10.3390/atmos14111642, 2023. a
Kirshbaum, D. J., Adler, B., Kalthoff, N., Barthlott, C., and Serafin, S.: Moist orographic convection: Physical mechanisms and links to surface-exchange processes, Atmosphere, 9, 80, https://doi.org/10.3390/atmos9030080, 2018. a
Kopp, J., Schröer, K., Schwierz, C., Hering, A., Germann, U., and Martius, O.: The summer 2021 Switzerland hailstorms: weather situation, major impacts and unique observational data, Weather, 78, 184–191, https://doi.org/10.1002/wea.4306, 2023. a
Kröner, N., Kotlarski, S., Fischer, E., Lüthi, D., Zubler, E., and Schär, C.: Separating climate change signals into thermodynamic, lapse-rate and circulation effects: theory and application to the European summer climate, Climate Dynamics, 48, 3425–3440, https://doi.org/10.1007/s00382-016-3276-3, 2017. a, b
Kunz, M. and Puskeiler, M.: High-resolution assessment of the hail hazard over complex terrain from radar and insurance data, Meteorol. Z., 19, 427, https://doi.org/10.1127/0941-2948/2010/0452, 2010. a
Kunz, M., Abbas, S. S., Bauckholt, M., Böhmländer, A., Feuerle, T., Gasch, P., Glaser, C., Groß, J., Hajnsek, I., Handwerker, J., Hase, F., Khordakova, D., Knippertz, P., Kohler, M., Lange, D., Latt, M., Laube, J., Martin, L., Mauder, M., Möhler, O., Mohr, S., Reitter, R. W., Rettenmeier, A., Rolf, C., Saathoff, H., Schrön, M., Schütze, C., Spahr, S., Späth, F., Vogel, F., Völksch, I., Weber, U., Wieser, A., Wilhelm, J., Zhang, H., and Dietrich, P.: Swabian MOSES 2021: An interdisciplinary field campaign for investigating convective storms and their event chains, Front. Earth Sci., 10, 999593, https://doi.org/10.3389/feart.2022.999593, 2022. a, b, c
Leibensperger, E. M., Mickley, L. J., Jacob, D. J., Chen, W.-T., Seinfeld, J. H., Nenes, A., Adams, P. J., Streets, D. G., Kumar, N., and Rind, D.: Climatic effects of 1950–2050 changes in US anthropogenic aerosols – Part 1: Aerosol trends and radiative forcing, Atmos. Chem. Phys., 12, 3333–3348, https://doi.org/10.5194/acp-12-3333-2012, 2012. a
Lenderink, G. and Van Meijgaard, E.: Increase in hourly precipitation extremes beyond expectations from temperature changes, Nature Geoscience, 1, 511–514, https://doi.org/10.1038/ngeo262, 2008. a
Lenderink, G., Barbero, R., Loriaux, J., and Fowler, H.: Super-Clausius–Clapeyron scaling of extreme hourly convective precipitation and its relation to large-scale atmospheric conditions, J. Climate, 30, 6037–6052, https://doi.org/10.1175/JCLI-D-16-0808.1, 2017. a
Leuenberger, D., Koller, M., Fuhrer, O., and Schär, C.: A generalization of the SLEVE vertical coordinate, Mon. Weather Rev., 138, 3683–3689, https://doi.org/10.1175/2010MWR3307.1, 2010. a
Lin, Z., Nie, J., Wang, J., Chen, Y., and Meng, Z.: Responses of mesoscale convective system to global warming: A study on the Henan 2021 record-breaking rainfall event, J. Geophys. Res.-Atmos., 129, e2023JD039473, https://doi.org/10.1029/2023JD039473, 2024. a
Lucas, L., Barthlott, C., Hoose, C., and Knippertz, P.: Aerosol effects on convective storms under pseudo-global warming conditions: insights from case studies in Germany, Zenodo [data set], https://doi.org/10.5281/zenodo.15830656, 2025. a
Magnusson, L. and Källén, E.: Factors influencing skill improvements in the ECMWF forecasting system, Mon. Weather Rev., 141, 3142–3153, https://doi.org/10.1175/MWR-D-12-00318.1, 2013. a
Mallinson, H., Lasher-Trapp, S., Trapp, J., Woods, M., and Orendorf, S.: Hailfall in a Possible Future Climate Using a Pseudo–Global Warming Approach: Hail Characteristics and Mesoscale Influences, J. Climate, 37, 527–549, https://doi.org/10.1175/JCLI-D-23-0181.1, 2024. a, b, c, d
Markowski, P. and Richardson, Y.: Mesoscale meteorology in midlatitudes, John Wiley & Sons, ISBN 978-0470742136, 2010. a, b
Martinkova, M. and Kysely, J.: Overview of observed Clausius-Clapeyron scaling of extreme precipitation in midlatitudes, Atmosphere, 11, 786, https://doi.org/10.3390/atmos11080786, 2020. a
Priestley, M. D. K. and Catto, J. L.: Future changes in the extratropical storm tracks and cyclone intensity, wind speed, and structure, Weather Clim. Dynam., 3, 337–360, https://doi.org/10.5194/wcd-3-337-2022, 2022. a
Púčik, T., Castellano, C., Groenemeijer, P., Kühne, T., Rädler, A. T., Antonescu, B., and Faust, E.: Large hail incidence and its economic and societal impacts across Europe, Mon. Weather Rev., 147, 3901–3916, https://doi.org/10.1175/MWR-D-19-0204.1, 2019. a
Puskeiler, M., Kunz, M., and Schmidberger, M.: Hail statistics for Germany derived from single-polarization radar data, Atmos. Res., 178, 459–470, https://doi.org/10.1016/j.atmosres.2016.04.014, 2016. a
Rädler, A. T., Groenemeijer, P., Faust, E., and Sausen, R.: Detecting severe weather trends using an additive regressive convective hazard model (AR-CHaMo), Journal of Applied Meteorology and Climatology, 57, 569–587, https://doi.org/10.1175/JAMC-D-17-0132.1, 2018. a, b
Raschendorfer, M.: The new turbulence parameterization of LM, COSMO Newsletter 1, 89–97, 115 pp., http://www.cosmo-model.org (last access: 5 December 2025), 2001. a
Rasmussen, K. L., Prein, A. F., Rasmussen, R. M., Ikeda, K., and Liu, C.: Changes in the convective population and thermodynamic environments in convection-permitting regional climate simulations over the United States, Climate Dynamics, 55, 383–408, https://doi.org/10.1007/s00382-017-4000-7, 2020. a, b
Raupach, T. H., Martius, O., Allen, J. T., Kunz, M., Lasher-Trapp, S., Mohr, S., Rasmussen, K. L., Trapp, R. J., and Zhang, Q.: The effects of climate change on hailstorms, Nature Reviews Earth & Environment, 2, 213–226, https://doi.org/10.1038/s43017-020-00133-9, 2021. a, b, c
Risser, M. D. and Wehner, M. F.: Attributable human-induced changes in the likelihood and magnitude of the observed extreme precipitation during Hurricane Harvey, Geophys. Res. Lett., 44, 12–457, https://doi.org/10.1002/2017GL075888, 2017. a
Rosenfeld, D., Lohmann, U., Raga, G. B., O'Dowd, C. D., Kulmala, M., Fuzzi, S., Reissell, A., and Andreae, M. O.: Flood or drought: how do aerosols affect precipitation?, Science, 321, 1309–1313, https://doi.org/10.1126/science.1160606, 2008. a, b
Schär, C., Frei, C., Lüthi, D., and Davies, H. C.: Surrogate climate-change scenarios for regional climate models, Geophys. Res. Lett., 23, 669–672, https://doi.org/10.1029/96GL00265, 1996. a
Schär, C., Leuenberger, D., Fuhrer, O., Lüthi, D., and Girard, C.: A new terrain-following vertical coordinate formulation for atmospheric prediction models, Mon. Weather Rev., 130, 2459–2480, https://doi.org/10.1175/1520-0493(2002)130<2459:ANTFVC>2.0.CO;2, 2002. a
Schmid, T., Portmann, R., Villiger, L., Schröer, K., and Bresch, D. N.: An open-source radar-based hail damage model for buildings and cars, Nat. Hazards Earth Syst. Sci., 24, 847–872, https://doi.org/10.5194/nhess-24-847-2024, 2024. a
Segal, Y. and Khain, A.: Dependence of droplet concentration on aerosol conditions in different cloud types: application to droplet concentration parameterization of aerosol conditions, J. Geophys. Res., 111, D15240, https://doi.org/10.1029/2005JD006561, 2006. a, b, c
Seifert, A. and Beheng, K. D.: A two-moment cloud microphysics parameterization for mixed-phase clouds. Part 1: Model description, Meteorol. Atmos. Phys., 92, 45–66, https://doi.org/10.1007/s00703-005-0112-4, 2006. a, b, c
Seifert, A., Köhler, C., and Beheng, K. D.: Aerosol-cloud-precipitation effects over Germany as simulated by a convective-scale numerical weather prediction model, Atmos. Chem. Phys., 12, 709–725, https://doi.org/10.5194/acp-12-709-2012, 2012. a
Semie, A. G. and Bony, S.: Relationship between precipitation extremes and convective organization inferred from satellite observations, Geophys. Res. Lett., 47, e2019GL086927, https://doi.org/10.1029/2019GL086927, 2020. a
Smith, S. J., van Aardenne, J., Klimont, Z., Andres, R. J., Volke, A., and Delgado Arias, S.: Anthropogenic sulfur dioxide emissions: 1850–2005, Atmos. Chem. Phys., 11, 1101–1116, https://doi.org/10.5194/acp-11-1101-2011, 2011. a
Sokolowsky, G. A., Freeman, S. W., Jones, W. K., Kukulies, J., Senf, F., Marinescu, P. J., Heikenfeld, M., Brunner, K. N., Bruning, E. C., Collis, S. M., Jackson, R. C., Leung, G. R., Pfeifer, N., Raut, B. A., Saleeby, S. M., Stier, P., and van den Heever, S. C.: tobac v1.5: introducing fast 3D tracking, splits and mergers, and other enhancements for identifying and analysing meteorological phenomena, Geosci. Model Dev., 17, 5309–5330, https://doi.org/10.5194/gmd-17-5309-2024, 2024. a
Tahara, R., Hiraga, Y., and Kazama, S.: Climate change effects on the localized heavy rainfall event in northern Japan in 2022: Uncertainties in a pseudo-global warming approach, Atmos. Res., 314, 107780, https://doi.org/10.1016/j.atmosres.2024.107780, 2025. a
Tao, W.-K., Li, X., Khain, A., Matsui, T., Lang, S., and Simpson, J.: Role of atmospheric aerosol concentration on deep convective precipitation: Cloud-resolving model simulations, J. Geophys. Res.-Atmos., 112, https://doi.org/10.1029/2007JD008728, 2007. a
Taszarek, M., Allen, J., Púčik, T., Groenemeijer, P., Czernecki, B., Kolendowicz, L., Lagouvardos, K., Kotroni, V., and Schulz, W.: A climatology of thunderstorms across Europe from a synthesis of multiple data sources, J. Climate, 32, 1813–1837, https://doi.org/10.1175/JCLI-D-18-0372.1, 2019. a
Thomas, J., Barrett, A., and Hoose, C.: Temperature and cloud condensation nuclei (CCN) sensitivity of orographic precipitation enhanced by a mixed-phase seeder–feeder mechanism: a case study for the 2015 Cumbria flood, Atmos. Chem. Phys., 23, 1987–2002, https://doi.org/10.5194/acp-23-1987-2023, 2023. a
Thompson, R. L., Mead, C. M., and Edwards, R.: Effective storm-relative helicity and bulk shear in supercell thunderstorm environments, Weather Forecasting, 22, 102–115, https://doi.org/10.1175/WAF969.1, 2007. a
Thurnherr, I., Cui, R., Velasquez, P., Wernli, H., and Schär, C.: The Effect of 3 °C Global Warming on Hail Over Europe, Geophys. Res. Lett., 52, e2025GL114811, https://doi.org/10.1029/2025GL114811, 2025. a
Trapp, R. J., Hoogewind, K. A., and Lasher-Trapp, S.: Future changes in hail occurrence in the United States determined through convection-permitting dynamical downscaling, J. Climate, 32, 5493–5509, https://doi.org/10.1175/JCLI-D-18-0740.1, 2019. a
van den Heever, S. C., Stephens, G. L., and Wood, N. B.: Aerosol indirect effects on tropical convection characteristics under conditions of radiative-convective equilibrium, J. Atmos. Sci., 68, 699–718, https://doi.org/10.1175/2010JAS3603.1, 2011. a
van Oldenborgh, G. J., Krikken, F., Lewis, S., Leach, N. J., Lehner, F., Saunders, K. R., van Weele, M., Haustein, K., Li, S., Wallom, D., Sparrow, S., Arrighi, J., Singh, R. K., van Aalst, M. K., Philip, S. Y., Vautard, R., and Otto, F. E. L.: Attribution of the Australian bushfire risk to anthropogenic climate change, Nat. Hazards Earth Syst. Sci., 21, 941–960, https://doi.org/10.5194/nhess-21-941-2021, 2021. a
Wang, Y., Yussouf, N., Kerr, C. A., Stratman, D. R., and Matilla, B. C.: An experimental 1-km Warn-on-Forecast System for hazardous weather events, Mon. Weather Rev., 150, 3081–3102, https://doi.org/10.1175/MWR-D-22-0094.1, 2022. a
Wapler, K.: Mesocyclonic and non-mesocyclonic convective storms in Germany: Storm characteristics and life-cycle, Atmos. Res., 248, 105186, https://doi.org/10.1016/j.atmosres.2020.105186, 2021. a
Watson-Parris, D. and Smith, C. J.: Large uncertainty in future warming due to aerosol forcing, Nature Climate Change, 12, 1111–1113, https://doi.org/10.1038/s41558-022-01516-0, 2022. a
Weisman, M. L. and Rotunno, R.: The use of vertical wind shear versus helicity in interpreting supercell dynamics, J. Atmos. Sci., 57, 1452–1472, https://doi.org/10.1175/1520-0469(2000)057<1452:TUOVWS>2.0.CO;2, 2000. a
Yang, Z., Wang, J., Qian, Y., Chakraborty, T., Xue, P., Pringle, W. J., Huang, C., Kayastha, M. B., Huang, H., Li, J., and Hetland, R.: Summer convective precipitation changes over the Great Lakes region under a warming scenario, J. Geophys. Res.-Atmos., 129, e2024JD041011, https://doi.org/10.1029/2024JD041011, 2024. a, b, c
Yau, M. K. and Rogers, R. R.: A short course in cloud physics, Elsevier, ISBN 9780750632157, 1996. a
Yli-Juuti, T., Mielonen, T., Heikkinen, L., Arola, A., Ehn, M., Isokääntä, S., Keskinen, H.-M., Kulmala, M., Laakso, A., Lipponen, A., et al.: Significance of the organic aerosol driven climate feedback in the boreal area, Nature Communications, 12, 5637, https://doi.org/10.1038/s41467-021-25850-7, 2021. a
Zängl, G., Reinert, D., Rípodas, P., and Baldauf, M.: The ICON (ICOsahedral Non-hydrostatic) modelling framework of DWD and MPI-M: Description of the non-hydrostatic dynamical core, Q. J. Roy. Meteor. Soc., 141, 563–579, https://doi.org/10.1002/qj.2378, 2015. a