the Creative Commons Attribution 4.0 License.
the Creative Commons Attribution 4.0 License.
 | 18 Dec 2025
Why is height-dependent mixing observed in stratocumulus clouds?
Steven Krueger
Yangang Liu
Recent aircraft measurements in stratocumulus clouds suggest that entrainment mixing is inhomogeneous (IM) near cloud top and homogeneous (HM) within the cloud. However, this proposed height-dependence of mixing transition is uncertain because of artifacts involved in the aircraft measurements. In this study, we use the Explicit Mixing Parcel Model to simulate mixing scenarios in stratocumulus clouds and reconstruct the virtual aircraft measurements to investigate the mixing signature. Results show that, from the aircraft-measurement perspective, the mixing signature always exhibits IM characteristic near cloud top and HM characteristic within cloud, independent of the types of the local entrainment-mixing process. The appearance of the vertical IM-to-HM transition is essentially a collective behavior of multiple parcels sampled at the same height, experiencing distinct entrainment-mixing-evaporation histories. This bulk view of mixing process, which is widely used for aircraft measurements, could lead to misinterpretations of the true mixing mechanism occurring in clouds. Our result underscores the limitations of using aircraft measurements to identify the entrainment-mixing mechanism at the process level.
- Article
(3840 KB) - Full-text XML
- BibTeX
- EndNote


Entrainment-mixing is a critical cloud process and plays important roles in simulating precipitation formation, radiative properties and macroscopic structures (Lasher-Trapp et al., 2005; Baker et al., 1980; Lehmann et al., 2009; Magaritz-Ronen et al., 2014; Chosson et al., 2007). In the stratocumulus, entrainment-mixing is initiated near cloud top where the dry, warm free-troposphere air is partially mixed with the cloudy air and then entrained (Wood, 2012). After entrainment, cloud droplets start to evaporate in a subsaturated environment along with the mixing process. Depending on the efficiency of mixing and evaporation, two mixing scenarios are generally considered: homogeneous mixing (HM) and inhomogeneous mixing (IM) (Latham and Reed, 1977; Baker et al., 1980). For HM, turbulent mixing is much faster than droplet evaporation. Under the extreme condition, the cloudy air is mixed immediately with the entrained air such that all cloud droplets are exposed to the same sub-saturation environment, resulting in reduced droplet size and unchanged number concentration. For the IM, turbulent mixing is slower than evaporation. Under the IM condition, cloud droplets adjacent to the dry entrained air are quickly evaporated while leaving the remaining droplets unaffected.
Over the recent decades, a consensus has emerged from aircraft observations across multiple field campaigns that stratocumulus clouds tend to exhibit IM signature near the cloud top and a HM signature in the mid-levels (Yum et al., 2015; Yeom et al., 2021; Desai et al., 2021; Wang et al., 2009; Gao et al., 2021). One hypothesis to explain this behavior is the “vertical circulation” concept which is proposed by Wang et al. (2009), further refined by Yum et al. (2015) and detailed in Yeom et al. (2021). Specifically, after entrainment occurs near cloud top, the cloud parcel starts to descend. The droplets in the diluted descending parcels evaporate and reduce the particle sizes. Therefore, if the mid-level cloud is horizontally sampled by the aircraft, droplets are likely to be evaporated in the diluted regions than those in the undiluted regions, leading to the HM signature in the middle of cloud. Yeom et al. (2023) further conducted experiments in the cloud chamber by injecting dry air into the well-mixed cloud to mimic the entrainment–mixing process. Result shows that cloud microphysical responses to entrainment and mixing are locally inhomogeneous and globally homogeneous, implying that the global versus local sampling of clouds can lead to contradictory mixing results. These studies provide critical insights to reevaluate the applicability of using aircraft measurements for HM/IM mixing classification.
Conventionally, cloud microphysical properties (e.g., droplet number and size) measured by aircraft flying along a horizontal path are used to calculate the mixing metrics (see Sect. 2.2) for IM/HM classification. However, this aircraft-based perspective is known with several issues: (1) the global mean cloud properties are not representative of the cloud structures at small scales. For instance, Allwayin et al. (2024) utilizes holographic measurements showing that droplet size distributions are more narrow at small scales than those at whole-cloud averages. (2) If the mixing in each small sampling is inhomogeneous, then an average of several samplings may lead to apparent homogeneous mixing (Burnet and Brenguier, 2007); (3) the aircraft flying along a path at the same height measures a collection of mixed air parcels with different entrainment-mixing stages, this collected behavior from various mixing parcels may not represent the original mixing process in each individual parcel (Yeom et al., 2023). In this study, we revisit the applicability of using aircraft measurements for mixing identification. We design a simulation framework based on the Explicit Mixing Parcel Model (EMPM) to emulate the aircraft measurements in the Stratocumulus (Sc). We show that, using aircraft measurements, the mixing behavior in Sc is always identified as IM near cloud top and HM within clouds, regardless of the local mixing scenario within individual parcels.
The layout of this paper is organized as follows: Sect. 2 introduces the EMPM model, including the adapted assumptions and the experiment set up. The mixing metrics used for HM/IM identification applied in this study are introduced. In Sect. 3, the EMPM simulations are analyzed from two perspectives: bulk and local. We show that, based on the same simulation output, the mixing process in clouds may exhibit differently from the two perspectives; this discrepancy is the key to understanding the limitations of aircraft measurements. In Sect. 3, we also conducted an additional isobaric mixing experiment to isolate the mixing and adiabatic warming process which are coexisting in previous experiments. In Sect. 4, we explain the phenomenon of the IM-HM transition in Sc and discuss the insights on future mixing studies. Finally, a conclusion constitutes Sect. 5.
2.1 Experiment Design
The EMPM was developed by Krueger et al. (1997) to simulate the evolution of cloud thermodynamic properties influenced by turbulent mixing in a rising cloudy parcel. The EMPM can resolve fine-scale variability in the 1D domain down to the smallest turbulent scales (about 1 mm) and calculate the growth/evaporation of individual cloud droplet based on each droplet's local environment (Su et al., 1998). One unique characteristic of the EMPM is applying the linear eddy model (Kerstein, 1991) to simulate turbulent deformation and molecular diffusion separately as an explicit representation of the turbulent mixing process. Specifically, turbulent deformation is represented by a sequence of discrete rearrangement events along the 1D domain, where the scalar field is randomly rearranged using a “triplet map” approach detailed in Krueger et al. (1997). Molecular diffusion is calculated with the 1D diffusion equation. With the capabilities of resolving fine-scale variations and explicitly simulating turbulent mixing, the EMPM is recognized as a unique and extensively used tool for entrainment and mixing studies (Lu et al., 2013; Tölle and Krueger, 2014).
To emulate the aircraft measurements using the EMPM, three assumptions are made in this study: (1) entrainment occurs at cloud top; (2) after each entrainment event, the parcel undergoing mixing descends from cloud top; (3) the virtual aircraft samples sufficient cloudy parcels along a path at the same height, and those cloudy parcels experience various degrees of entrainment near the cloud top. The first and second assumptions are satisfied for stratocumulus where the turbulent eddies and evaporative cooling drives entrainment at cloud top (Wood, 2012). The third assumption is proposed to mimic the aircraft measurements in real stratocumulus clouds.
The simulation design is illustrated in Fig. 1a. We consider a virtual aircraft that flies at a typical speed of 100 m s−1 within the cloud, measuring droplet properties at 5 Hz along the leg. Over 2 s interval, the aircraft traverses 200 m, consisting of 10 in-situ samples, each 20 m in length. In the EMPM, each in-situ sample is configured as a one-dimensional domain with a length of 20 m and the width/depth of 1 mm, resulting in a total volume of 20 cm3 (right panel of Fig. 1a). The detailed model configuration is shown in Table 1. The initial droplet number concentration is set as 80 cm−3, consisting of monodisperse haze particles of radius 0.216 µm. The simulation begins with adiabatic lifting of the parcel at a constant velocity of 1 m s−1 until it reaches the cloud top. The parcel then encounters entrainment, during which subsaturated air replaces a segment of the cloudy parcel of equal size. The fraction of subsaturated entrained air relative to the domain size is referred as the entrainment fraction (EF). For instance, Fig. 1a illustrates an entrainment event with EF of 0.5, indicating that 50 % of the cloudy parcel, which is effectively 10 m, is replaced by the entrained subsaturated air. We assume that the entrained dry air is Cloud Condensation Nuclei (CCN) free thus no CCN is entrained into clouds. After entrainment, the parcel descends adiabatically at a velocity of −1 m s−1. As the parcel descends, the cloudy air and the entrained air undergo finite-rate mixing, during which droplets encounter the subsaturated air and partially or completely evaporate. The number and size of droplets in the domain are updated at each time step (1 s) until all the droplets are completely evaporated.
Figure 1Illustration of experiment set up: (a) the left panel illustrates aircraft measurements at cloud top. During 2 s, the aircraft traverse 200 m, acquiring 10 samples. Each sample corresponds to a 20 m cloud parcel, which is simulated by the EMPM. The sampled cloud parcels exhibit varying entrainment fractions as indicated by the shading. Lighter (sparser) shading corresponds to samples with higher entrainment fractions. The right panel illustrates the simulated parcel experiencing three stages: ① rising, ② entrainment and ③ sinking. (b) Illustration of the local and bulk-based perspective for simulations analysis: the local perspective tracks the change of properties with time after the entrainment events; the bulk perspective collects multiple parcels with various EF at a given time. t1 represents the entrainment moment, tn represents an arbitrary time step after entrainment.
For each experiment, a total of ten EMPM simulations is conducted with the same initial setting but with various EFs from 0 to 0.9, representing multiple entrainment events occurring at the cloud top. Combining all the simulation results produces the collective output illustrated in Fig. 1b. In this study, we will analyze the output from two perspectives: “bulk” and “local”. The bulk-based perspective emulates the aircraft measurements in clouds, where multiple parcels are sampled at the same height with each one experiencing distinct entrainment-mixing histories. The local-based perspective tracks the evolution of cloud microphysical properties in individual parcel after entrainment, representing the “true” mixing process within the parcel.
Figure 2The idealized (a) temperature and (b) mixing ratio profiles based on the sounding observation at 05:30 UTC on 30 June 2017 during the ACE-ENA field campaign.
To drive the simulations, the idealized thermodynamical profile (Fig. 2) is constructed from the observations on 30 June 2017 during the Aerosol and Cloud Experiments in the Eastern North Atlantic (ACE-ENA) field campaign (Wang et al., 2022). It is noted that a strong inversion layer exists at 950 m, defining the cloud top height in Table 1. For the Control simulation, the Eddy Dissipation Rate (EDR) is adapted from the in-situ observation as 0.0025 m2 s−3, representing a typical Sc environment. The thermodynamics of the entrained air is estimated as the parcel at 10 m above cloud top experiencing adiabatic descent to cloud top. Particularly, the entrained air temperature and water vapor is estimated as 285.77 K and 8.6 g kg−1. In addition to the control case, four sensitivity simulations were conducted to evaluate the robustness of the experimental design. The Dry Entrained Air experiment represents the scenario in which the entrained air is drier. Specifically, the model setup is the same as the control one except the entrained air property is using the parcel at 20 m above cloud top experiencing adiabatic descent to cloud top. The selection of the distance of the entrained parcel from cloud top is arbitrary and does not affect the conclusions of this study. The Enhanced Turbulence experiment simulates stronger turbulent environment with EDR set to 0.01 m2 s−3. The CCN entrained Air experiment allows the entrained air containing dry aerosols entrained from free atmosphere. The properties and concentrations of the entrained aerosols are identical to those initially specified within the parcel. Finally, the Reduced Velocity experiment represents parcels subjected to a smaller vertical velocity than in the control case. A complete summary of the model configurations for these sensitivity experiments is provided in Table 1.
2.2 Entrainment Mixing Metrics
With the aircraft measurements, the mixing process is characterized by overlaying the cloud properties on the mixing diagram and analyzing their collective behaviors (Burnet and Brenguier, 2007; Lehmann et al., 2009; Yum et al., 2015). In this study, the simulation result is displayed in mixing diagrams similar to those used in the aircraft-measurement studies. In addition, we adapt the homogeneous mixing degree (ψ) to identify the mixing process from the local-based perspective. The mixing diagram and the associated metrics are introduced in the following.
2.2.1 n-r3 Mixing Diagram
The n-r3 mixing diagram is commonly applied to characterize the mixing process in clouds. In the diagram, the horizontal and vertical axes represent the normalized number concentration (n) and the average of the third moment of droplet radius (r3). The measurements are normalized by their theoretical values assuming the cloud parcel ascends adiabatically. For extreme IM, droplet number is further reduced while the size remains constant, therefore the measurements are horizontally aligned. For extreme HM, droplet number remains unchanged after dilution, while the size is reduced due to evaporation. In reality, the mixing can be between the two extreme mixing types, and thus both droplet number and size may be reduced in the diagram.
2.2.2 LWC-τphase mixing diagram
LWC-τphase mixing diagram was proposed by Yeom et al. (2021) with x-coordinates as the logarithm of liquid water content (L) and y-coordinates as the logarithm of phase relaxation time (τphase). L is calculated as:
where n and r represent the number concentration and droplet radius, and ρL is the density of liquid water.
The phase relaxation time (τphase) characterizes how rapidly an equilibrium vapor saturation is reached by evaporation of a population of droplets (Lehmann et al., 2009; Jeffery and Reisner, 2006). For the EMPM simulation output, τphase is calculated following the method applied in Tölle and Krueger (2014):
where N and Rv represent the domain-mean droplet number and radius estimated at the time immediately following the entrainment event. Dν is the molecular diffusivity of water vapor and is taken as 0.256 cm2 s−1. a is the accommodation length taken as 2 µm, which is introduced for analytic convenience (Jeffery and Reisner, 2006).
To interpret the L-τphase mixing diagram, linear regression is performed between the logarithm of L and τphase dataset and the corresponding slope is used for mixing classification: the slope of −1 represents extreme IM, while the HM should asymptote to the line with slope of .
2.2.3 Homogeneous mixing degree
Based on the n-r3 mixing diagram, Lu et al. (2013) proposed the homogeneous mixing degree following the calculation:
where rv and rav represent the volume-mean radius and the adiabatic radius of droplets, n is the number concentration, na is the adiabatic number concentration, nh is the number concentration immediately following the entrainment event but prior to evaporation and accounts for the dilution by entrainment; The parameter β effectively calculates the angle, with unit of radian, from the extremely IM line (detailed illustration is shown in Fig. 1 in Lu et al., 2013).
β is commonly normalized by to represent the homogeneous mixing degree (ψ):
ψ ranges from 0 to 1, with larger value indicating higher degree of HM. Since ψ is estimated upon each parcel instead of a collective datapoints, we apply ψ to characterize the local mixing process within the parcel.
3.1 Cloud Properties from the EMPM simulation
The simulated domain-averaged cloud properties under various entrainment events are shown in Fig. 3. When the parcel ascends adiabatically, the LWC linearly increases from cloud base (i.e. 745 m) to cloud top with the maximum value of 0.42 g m−3 (red line in Fig. 3a). The domain-averaged cloud droplet radius increased to 10.7 µm (red line in Fig. 3b). Correspondingly, a total of 1600 droplets is activated at cloud base and the number remain unchanged towards cloud top. Considering the EMPM domain of 20 cm3, the number concentration within the undiluted ascending parcel is 80 cm−3. As introduced in Sect. 2.1, the parcel descent immediately after reaching cloud top. When no entrainment occurs at the cloud top, the simulated cloud properties within the descending parcel is shown as the blue line in Fig. 3. It is noticed that LWC and the droplet radius do not follow the trajectory of the ascending parcel but with slightly enhanced value. This enhanced radius/LWC is caused by the hysteresis effect manifested as the time-lag adjustment of the parcel supersaturation responding to the change of dynamics (Yang et al., 2018). Specifically, as the parcel starts moving downward as a consequence of the changed velocity from 1 to −1 m s−1, the supersaturation within the parcel remains positive with value of 0.47 % (red line in Fig. 3d). Consequently, the droplet continues to grow until the supersaturation is removed. It is shown that the supersaturation turns to negative at the height of 943 m, which is 7 m down from cloud top. The extra growth over this 7 m distance led to a larger LWC and radius in the downward branch (Fig. 3a, c).
Figure 3For the control experiment, domain-averaged cloud properties as function of height: (a) LWC, (b) radius, (c) droplet number, (d) supersaturation. The red line represents the ascending parcel, while the blue, purple and black lines represent the descending parcel with entrainment fraction of 0, 0. 2 and 0.4 respectively. In (d) only the ascending parcel and the descending parcel with EF of 0.4 is shown.
For the descending parcels with various entrainment events, LWC and droplet number reduce instantaneously at cloud top (Fig. 3a, c) due to the replacement by entrained air. Meanwhile, the domain-mean radius remains constant at cloud top (Fig. 3b) as the evaporation-mixing process has not yet begun. As the parcel descends, LWC, droplet radius and number decrease due to evaporation. The extent of the reduction depends on the entrainment fraction. For strong entrainment event, the mixed parcel is much drier thus experiencing stronger evaporation, leading to lower LWC, smaller radius, and fewer droplets. Under large EF, droplets within the parcel are completely evaporated at a higher altitude. For instance, for the EF of 0.4 (black line in Fig. 3), droplets are evaporated at 862 m, which is 88 m below the cloud top (Fig. 3c).
3.2 Entrainment Mixing Behavior within Clouds
3.2.1 Bulk Perspective
The normalized standard deviation of water vapor is plotted to illustrate the temporal evolution of the mixing process in the Control experiment (Fig. 4a). The standard deviation of water vapor (δqv) is calculated at each time step within the one-dimensional domain (20 m in length with a 1 mm grid spacing) and normalized by its value at 1 s after entrainment. The evolution of δqv reflects the characteristic mixing timescale (Tölle and Krueger, 2014). As shown in Fig. 4a, δqv peaks after entrainment and decreases over time as mixing between entrained and cloudy air proceeds. Parcels with smaller EF exhibit shorter mixing times than those with larger EF; for example, parcel with EF = 0.1 reaches equilibrium after roughly 20 s, whereas the one with EF = 0.7 requires about 100 s to homogenize water vapor within the domain.
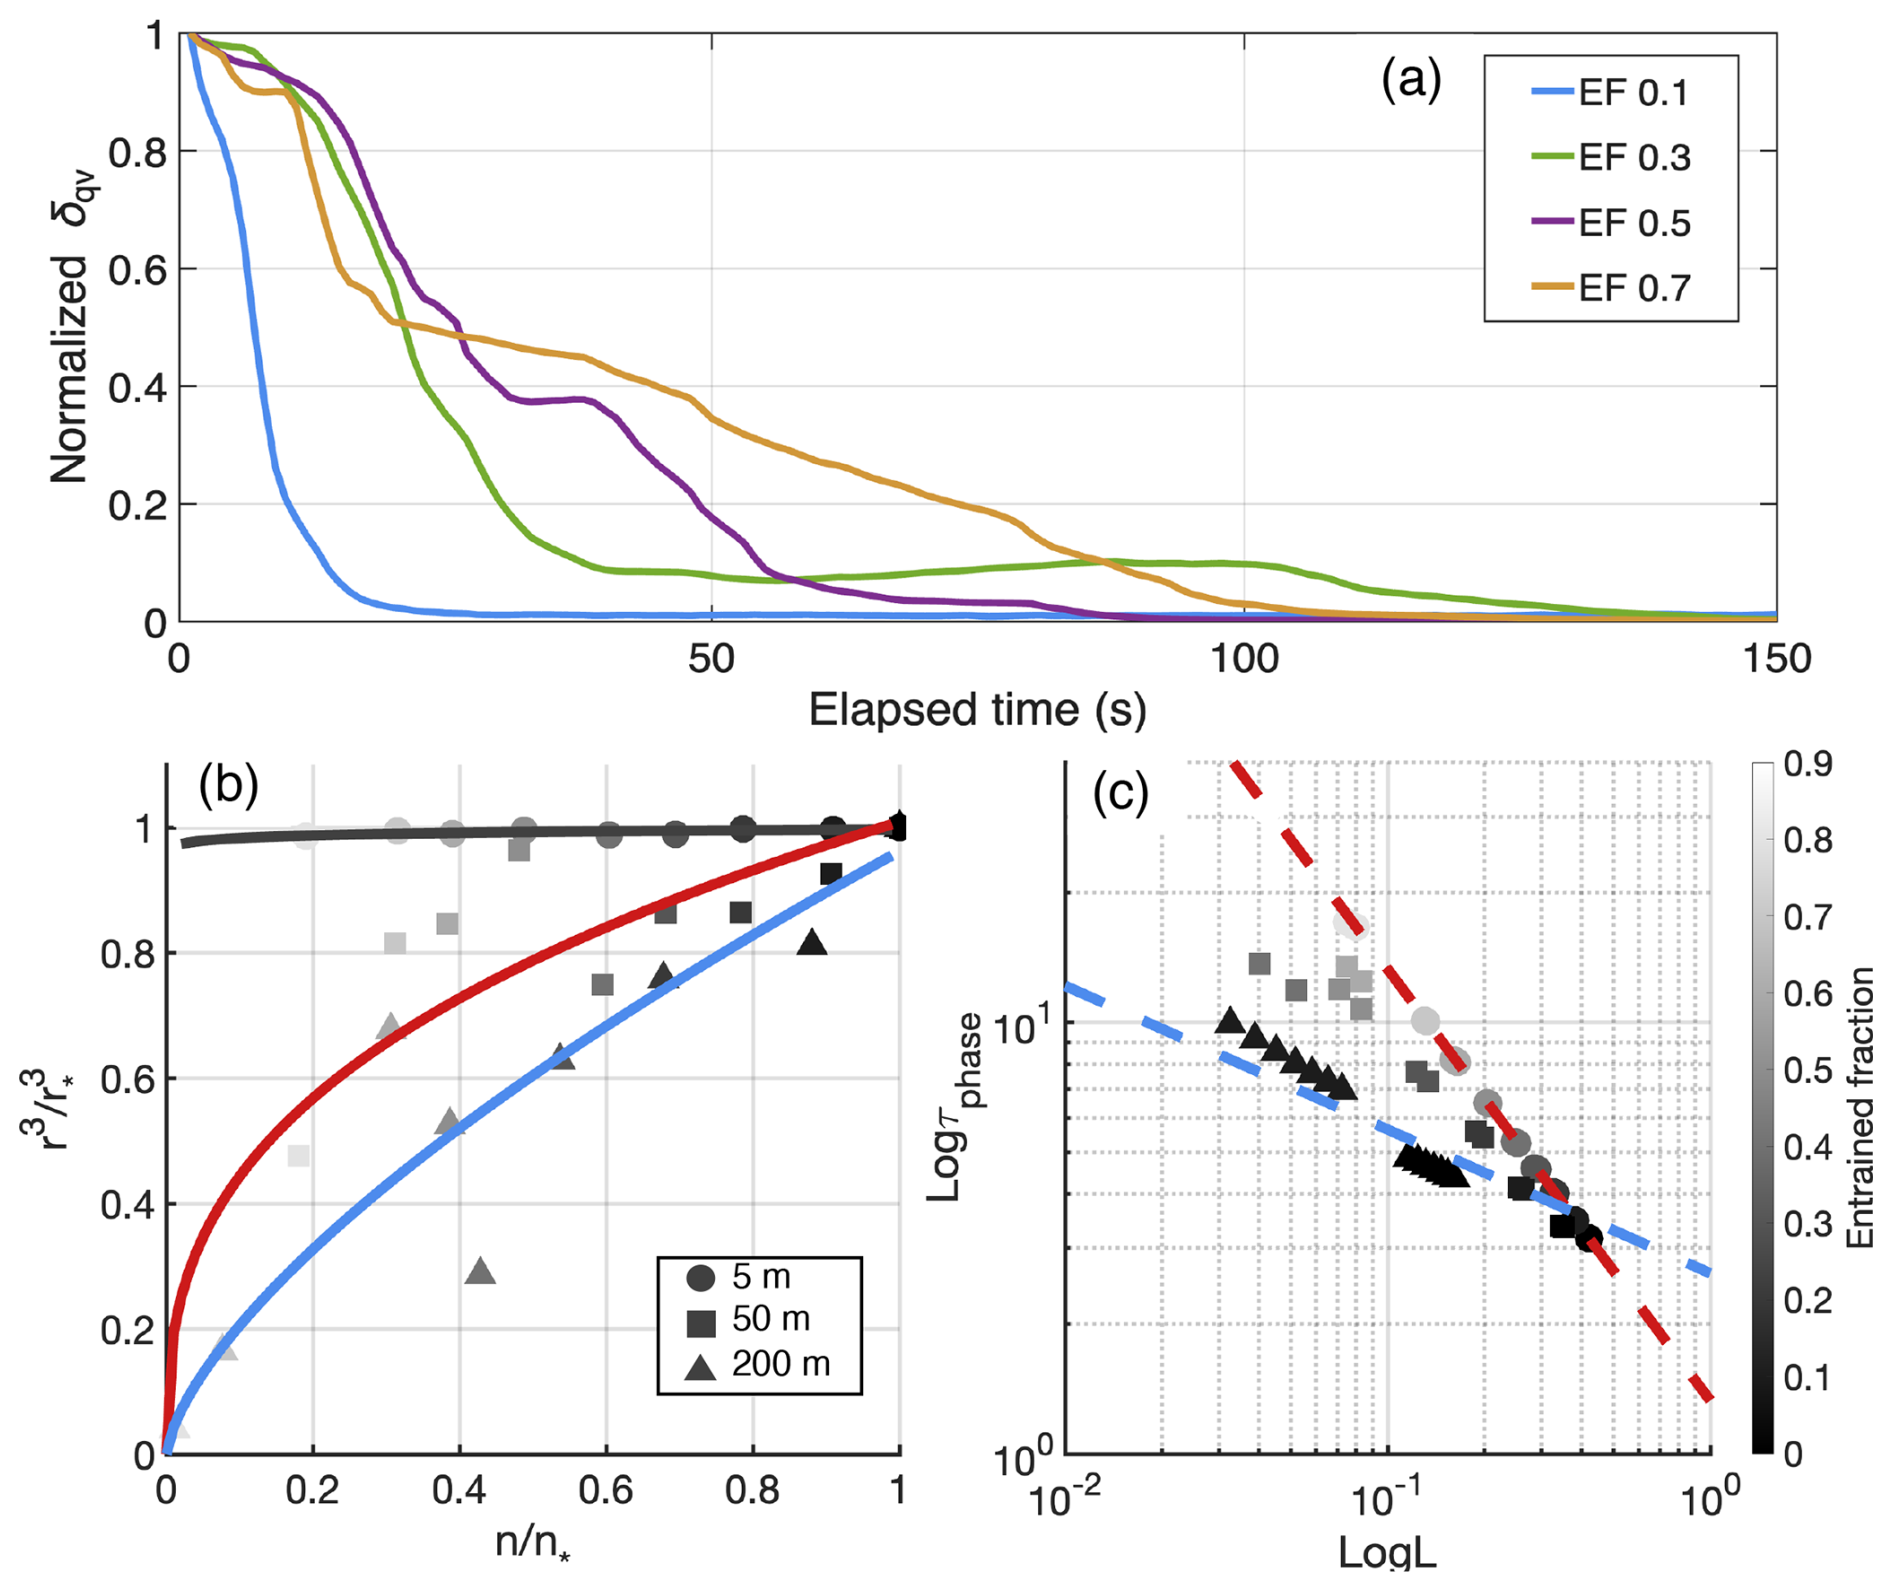
Figure 4(a) Normalized standard deviation of water vapor (δqv) in the parcel after entrainment for the control experiment. The blue, green, purple and yellow line represents the parcel with EF of 0.1, 0.3, 0.5 and 0.7. (b, c) Mixing diagrams for control experiment: the left panel (b) represents the n-r3 mixing diagram where the circle, square and triangle represents simulations at 5, 50 and 200 m from cloud top. The black (IM-like), red (HM-like) and blue (HM-like) lines represent the polynomial fitting of the parcels at each height level. (c) The right panel indicates the L-τphase mixing diagram, where the circle, square and triangle represents simulations at three heights as indicated in (b). The red, blue dashed line represents the IM and HM reference line with slope of −1 and .
In the Control configuration, the parcel descends immediately after entrainment at a constant velocity of −1 m s−1, allowing elapsed time to be directly related to distance below the cloud top. Accordingly, three representative height levels: 5, 50, and 200 m below the cloud top, are selected to characterize three mixing stages. In this study, the “near–cloud-top region” is defined as the layer within 10 m below the cloud-top height (950 m). We then use two mixing diagrams to analyze the EMPM simulations from the aircraft-based perspective. In the n-r3 mixing-diagram (Fig. 4b), droplet number and r3 are normalized by the value in the descending parcel without entrainment occurring (blue line in Fig. 3b, c). For the control experiment (Fig. 4b), the collective behavior of the 10 simulations with different EFs shows reduced droplet number but unchanged radius at 5m below cloud top (circles in Fig. 4b). The reduced number is caused by the entrainment when a given fraction of the domain is instantaneously replaced by the droplet-free air. At 5 m below cloud top, droplets have not yet experienced strong evaporation because only 5 s has elapsed since the entrainment event. To better visualize the mixing signature at different heights, polynomial lines are fitted based on the normalized n-r3 diagram. The fitted line at 5 m below cloud top is horizontally aligned reasonably well with the normalized r3=1 (black line in Fig. 4b), exhibiting a typical IM signature. This IM phenomenon is echoed in the L-τphase mixing diagram: the slope of the linear regression of the datasets at 5 m below cloud top is −0.81 (circles in Fig. 4b), which is close to the IM reference line with the slop of −1.
As the parcels descend deeper into the cloud, those with different EFs exhibit distinct evaporation histories, leading to contrasting mixing signatures. Taking the control experiment at 50 m below cloud top (squares in Fig. 4b) as an example, the normalized r3 is reduced to 0.48 for the parcel with EF equals 0.8, while the normalized r3 is 0.92 for the parcel with EF equals 0.1. As a result, the collected behavior of all the parcels at this level exhibit HM signatures (red line in Fig. 4b) with reduced droplet numbers and radii. It is further noted that the HM signature is more prominent deeper into the cloud (i.e., further away from the cloud top). Comparing the fitted lines from two height levels (red and blue lines in Fig. 4b), parcels at 200 m below cloud top show greater reduction of radius compared to the parcels at 50 m below cloud top. This transition of the mixing signatures is more evident in the L-τphase mixing diagram (Fig. 4c). As the distance from the cloud top increases, the collective datapoints rotate counterclockwise from the IM (red line) to the HM (blue line) reference line. Specifically, for heights at 5 m (circles), 50 m (squares) and 200 m (triangles) from cloud top, the slopes of the linear regression are −0.81, −0.32 and −0.28, exhibiting a stronger HM degree deeper into cloud.
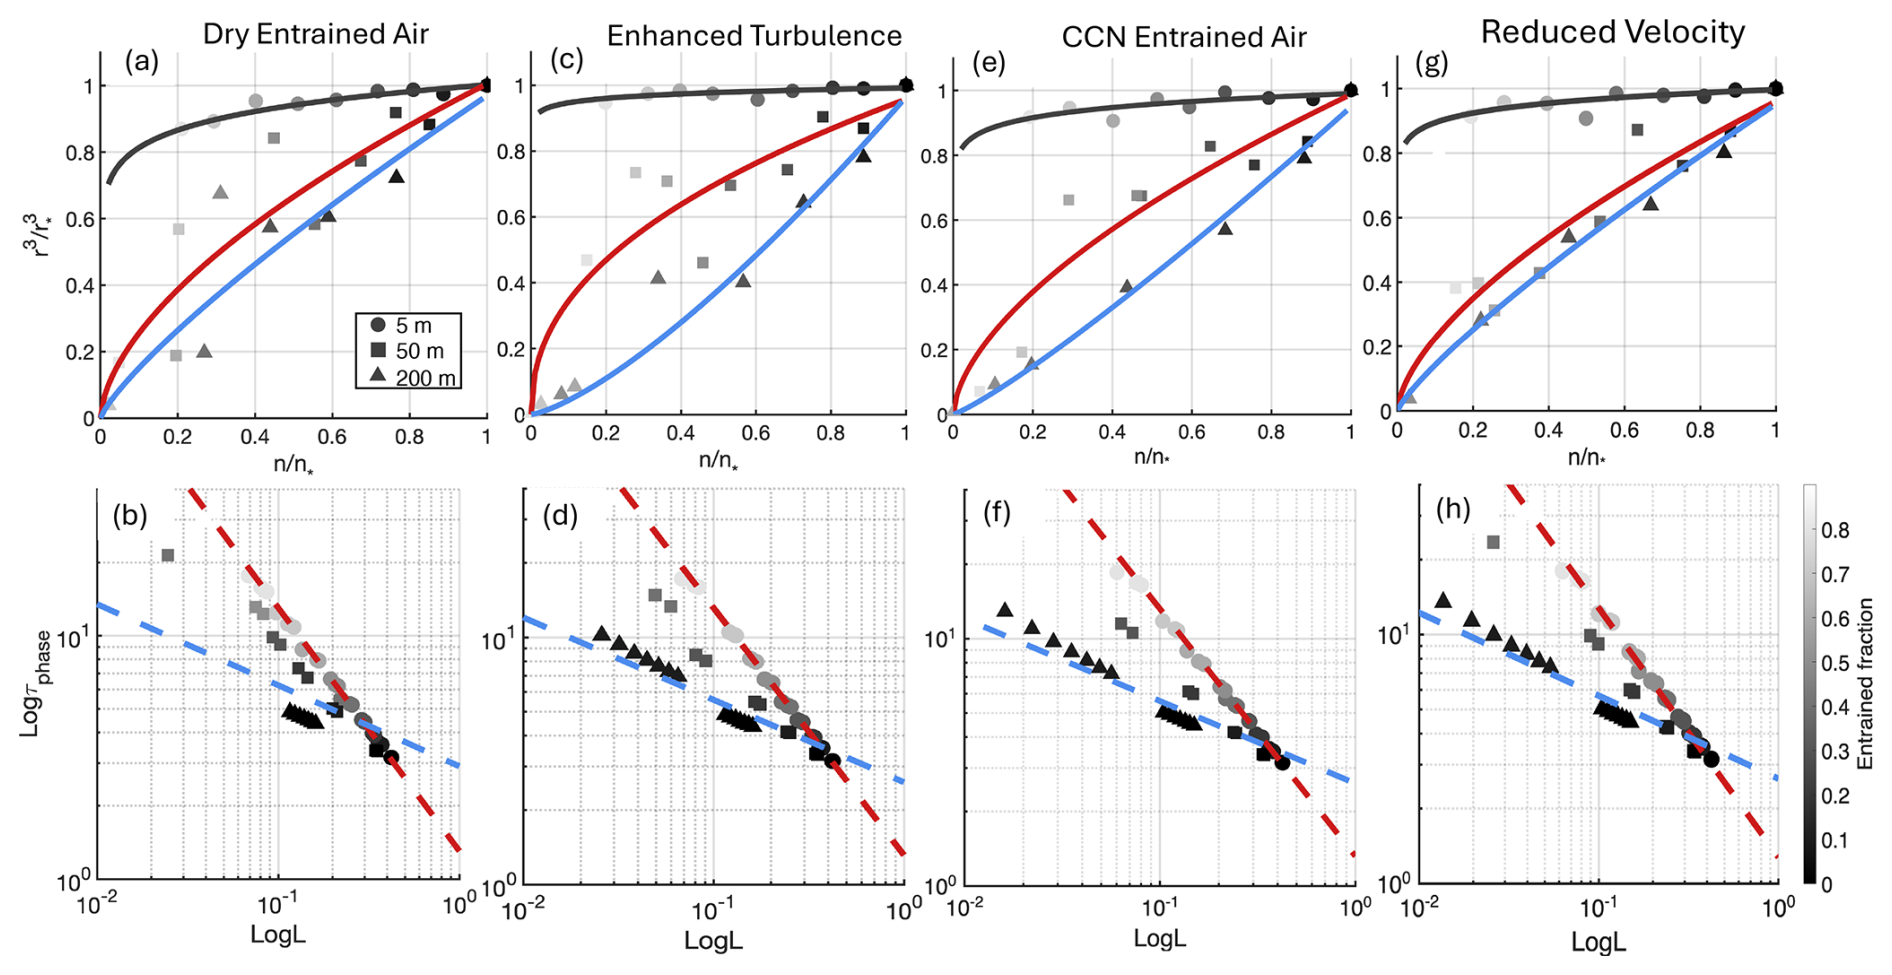
Figure 5Same as Fig. 4, but for the four sensitivity experiments: (a)–(b) correspond to the Dry-Entrained-Air experiment; (c)–(d) to the Enhanced-Turbulence experiment; (e)–(f) to the CCN-Entrained-Air experiment; and (g)–(h) to the Reduced-Velocity experiment.
The four sensitivity experiments (Fig. 5) lead to similar conclusions as the Control one with slightly different behavior. Figure 5a shows that when the entrained air is drier, the mixed parcel experiences stronger evaporation thus exhibiting a small degree of IM signature near cloud top. Particularly, the normalized r3 at 5 m below cloud top decreases by 17 % with an EF of 0.9, causing the fitted line to bend downward toward smaller radii in the large EF regime (black line in Fig. 5a). However, it is still clear that the mixing behavior of all the parcels at cloud top is predominantly IM with significant reduction of droplet number and a small reduction of radius. This IM-dominated signature is also identified in the L-τphase mixing diagram (Fig. 5b) in which parcels at cloud top (circles) align well with the IM reference line (red dashed line). In the Enhanced Turbulence experiment (Fig. 5c, d), the mixing signature is similar to the Control one (Fig. 4) near cloud top but shows differences deeper into the cloud. For a given normalized n, the Enhanced Turbulence experiment is characterized by a greater reduction of radius compared to the Control one. For instance, at 200 m from cloud top, where the normalized n equals 0.6, the normalized r3 for the Control and Enhanced Turbulence experiments are 0.72 and 0.48, respectively. This large reduction of droplet size is expected as strong turbulence favors efficient mixing and enhance the HM signature. In the CCN-Entrained-Air experiment (Fig. 5e, f), the normalized r3 values for each normalized number concentration are smaller than those in the control case, indicating a more pronounced reduction in droplet size. This feature reflects a stronger HM tendency under CCN entrainment, consistent with previous findings that activation of entrained CCN broadens the droplet size distribution toward smaller droplets and amplifies the characteristics of homogeneous mixing (Lim and Hoffmann, 2023; Luo et al., 2022). In the Reduced-Velocity experiment, the mixing diagram (Fig. 5g) shows a stronger HM characteristics at 5 m below cloud top, accompanied by a greater reduction in droplet radius. This arises because the slower descent velocity allows droplets to remain longer near the cloud top compared to the control one, thereby experiencing longer mixing-evaporation time. An interesting feature of this case is that the fitted lines at the two sampled heights (red and blue line in Fig. 5g) are closely aligned, suggesting small evolution of droplet properties with depth from 50 to 200 m. This behavior indicates that the environment has nearly reached a homogeneous mixing state, as the reduced descent rate effectively extends the available mixing-evaporation time, allowing the system to equilibrate more rapidly toward HM conditions.
Overall, despite variations in the thermodynamic and dynamic properties of the entrained air, all simulations consistently exhibit an IM signature at the cloud top and a transition toward HM within the cloud, with an increasing degree of HM deeper into the cloud layer. These model-based results align well with aircraft observations in stratocumulus (Yum et al., 2015; Yeom et al., 2021), providing a robust basis for more detailed analysis presented in the following section.
3.2.2 Local Perspective
In this section the EMPM simulations in Sect. 3.2.1 are interpreted from the local-based perspective as introduced in Fig. 1. Specifically, instead of analyzing parcels with different EFs at given height, we evaluate the mixing process of each parcel by tracking its history. Figure 6a shows the local mixing history for four parcels with EF of 0.1, 0.3, 0.5, and 0.7. The parcels initially follow a near-vertical path (i.e., indicating a reduction in droplet size with minimal change in number concentration) near the cloud top, then gradually tilt toward the smaller number regime. These features show HM near cloud top and the mixing more tends to inhomogeneous deeper into cloud. The strongest HM signature is observed for the parcel with EF = 0.1 (blue symbols), where at 50 m below the cloud top, the normalized r3 decreases by 18 %, while the normalized number decreases by only 1.5 %.
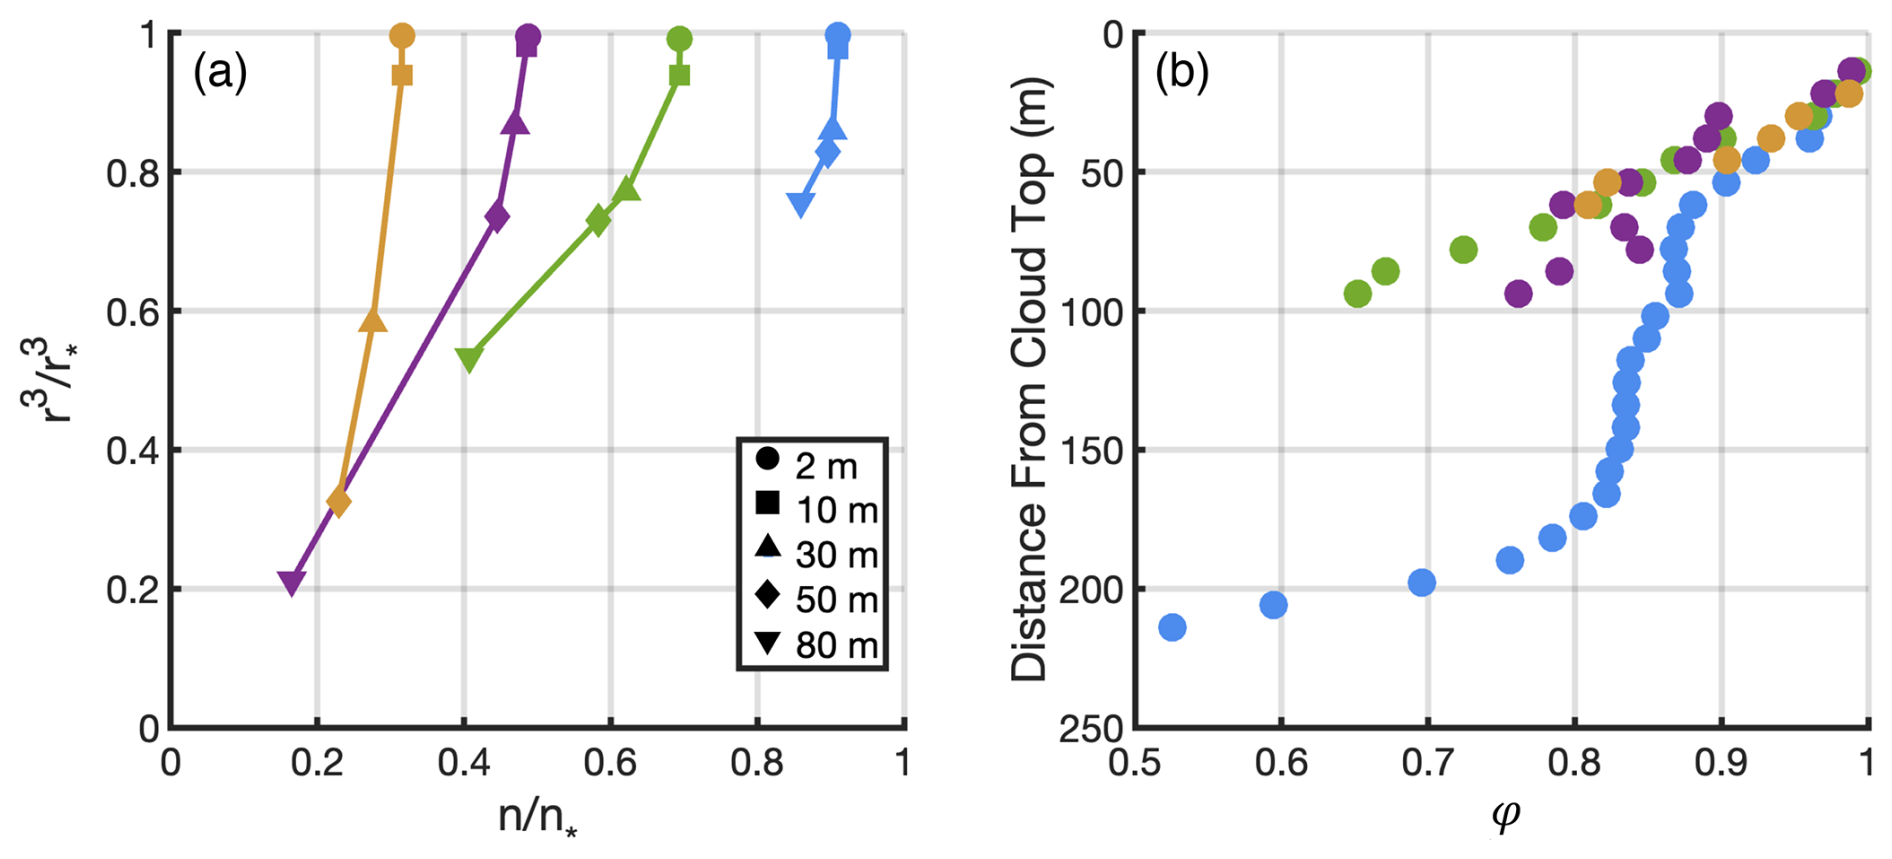
Figure 6(a) n-r3 mixing diagram from the parcel-based perspective for the control experiment. The circle, square, triangle, diamond and the reverse-triangle indicate the height of 2, 10, 30, 50 and 80 m from cloud top. The blue, green, purple and yellow represents the parcel with EF of 0.1, 0.3, 0.5 and 0.7. (b) The homogeneous mixing degree (ψ) as a function of distance from cloud top, different color represents parcel with different EF as indicated in (a).
To quantitatively describe the mixing process in each parcel, we adapt the homogeneous mixing degree ψ proposed by Lu et al. (2013). As introduced in Sect. 2.2, ψ is evaluated based on the n-r3 mixing diagram by calculating the relative changes of droplet size and number after each mixing event. Since estimating ψ only requires the change of cloud microphysics within each parcel, it is suitable to illustrate the mixing process from the local perspective. For the four selected parcels, ψ consistently decreases from cloud top to base (Fig. 6b). As ψ = 1 indicates extremely HM, the large ψ at Fig. 6b indicates strong HM at cloud top. Deeper into the cloud, ψ decreases, indicating a weakening of HM and an increasing influence of IM. This behavior holds true for the four EF experiments. Parcel with EF 0.1 has the largest ψ throughout the cloud and exhibits the most pronounced HM signature. Parcel with EF of 0.3 and 0.5 have ψ decreasing from 1 to 0.65 and 0.76 at 100 m below cloud top.
The HM–IM transition observed from the local perspective appears to contradict the mixing behavior suggested by the bulk perspective. We propose that this inconsistency arises from the differing analytical perspectives. The local perspective indicated in Fig. 6 follows the continuous evolution of individual parcel, revealing the “true” mixing processes. While the bulk perspective captures a “snapshot” of an ensemble of parcels, each with distinct entrainment and mixing histories. At cloud top, the entrained air is configurated to replace the cloudy air and instantaneously reduce the droplet number. Immediately following entrainment, parcels with large EF experience larger reductions of droplet number, while evaporation is not yet active enough to reduce droplet size. Thus, a collection of multiple parcels with different entrainment events generates an IM signature. As the parcel, as simulated within the model domain, descends deeper into the cloud, mixing with dry air continues and evaporation becomes efficient, leading to a reduction in droplet size. As a result, parcels with larger EF experiencing stronger evaporation and this results in a more pronounced decrease in droplet size and number. Consequently, a collection of parcels with different EFs tends to exhibit a HM signature deeper into the cloud.
Based on this reasoning, we further propose that from the bulk perspective, mixing is always manifested as IM near cloud top and HM towards cloud base, regardless of the mixing process exhibited from local perspective. To testify this hypothesis, we conduct a strict IM experiment with the same configuration as the Control experiment but setting an extremely low EDR value of 10−14 m2 s−3. This nonrealistic EDR value results in low mixing efficiency in the EMPM simulation where 100 steps of diffusion (e.g. evaporation) are performed per turbulent mixing step. As a comparison, for the “Turbulent” experiment where EDR is 0.01 m2 s−3, the EMPM performs 100 mixing steps per diffusion step. Thus, the conducted IM experiment ensures strict IM scenario with evaporation much faster than the turbulent mixing.
The mixing process of the strict IM experiment from the local perspective is shown in Fig. 7. In the n-r3 mixing diagram, the parcel experiencing greater reduction of number compared with radius. Take the simulation with EF of 0.1 (blue symbol in Fig. 7a) for example, from 2 to 150 m from cloud top, droplet number is reduced by 6 % while the normalized r3 is only reduced by 0.8 %. The evolution of ψ within clouds (Fig. 7b) indicate an IM-HM transition from cloud top to base. Specifically, ψ increase from 0 to approximately 0.4 through the clouds, suggesting strong IM feature near cloud top and an increase degree of HM at lower levels. The negative β near cloud top is caused by the growth of droplet after entrainment, which may be caused by the remaining supersaturated environment at cloud top as discussed in Fig. 3d.
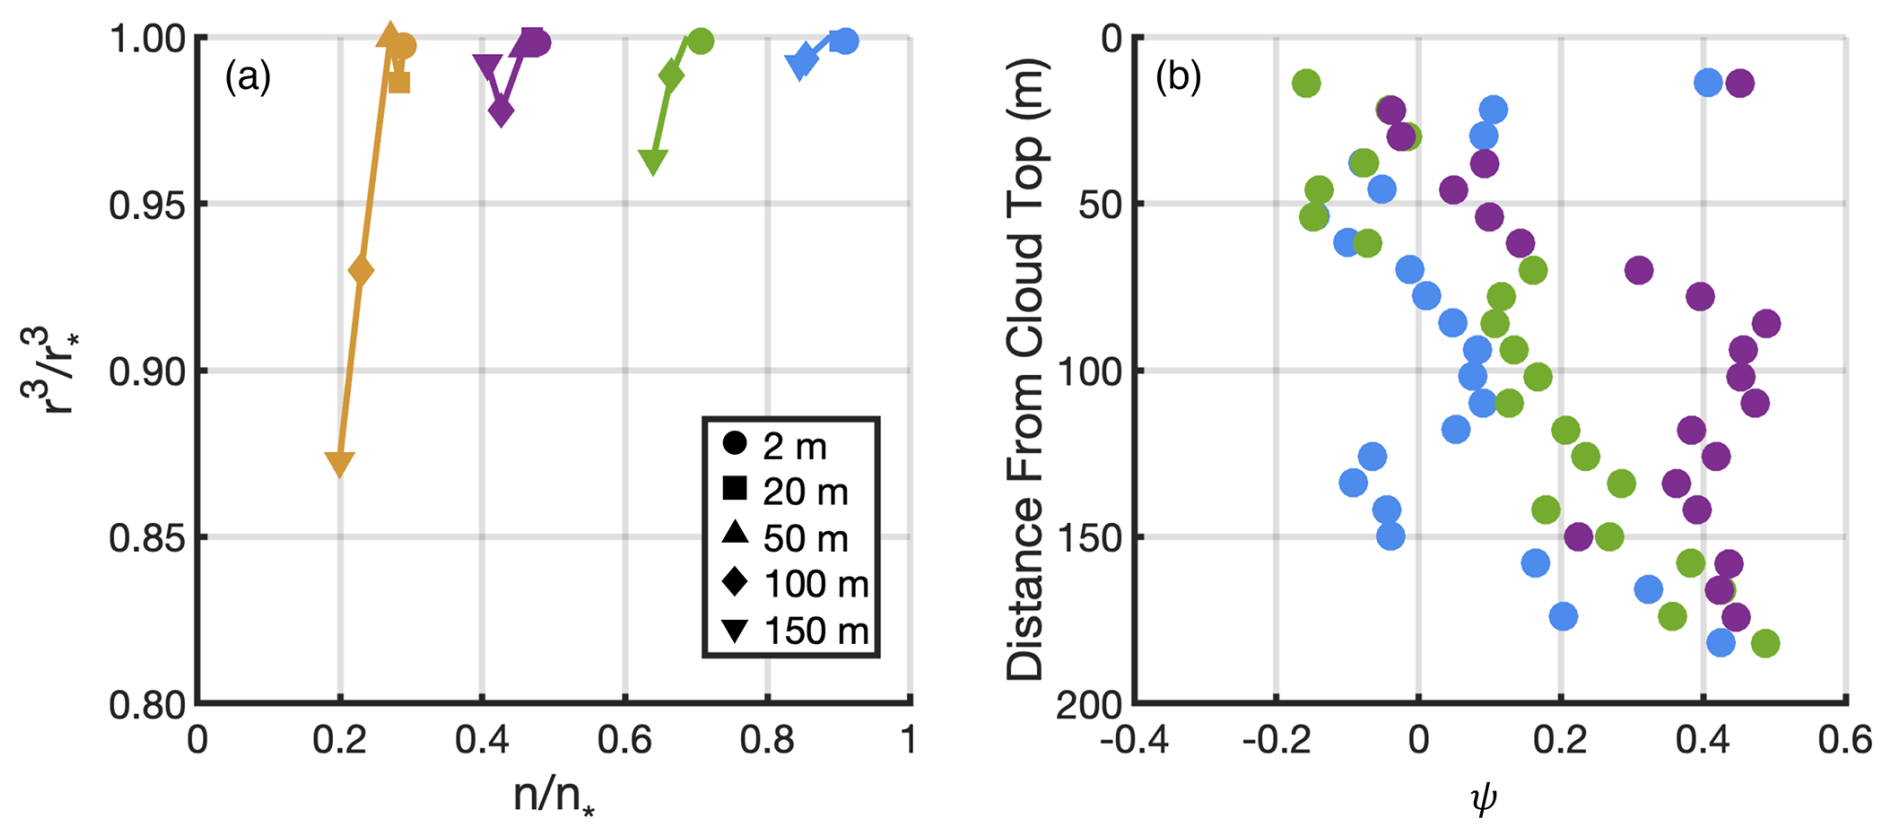
Figure 7(a) n-r3 mixing diagram from the parcel-based perspective for the strict IM experiment. The circle, square, triangle, diamond and the reverse-triangle indicate the parcel at height of 2, 20, 50, 100 and 150 m from cloud top. The blue, green, purple and yellow represents parcel with EF of 0.1, 0.3, 0.5 and 0.7. (b) The homogeneous mixing degree (ψ) as a function height for the strict IM experiment. The blue, green, purple color represents parcel with EF of 0.1, 0.3, 0.5.
Although strong IM signature is identified for each parcel, the collective behavior of multiple parcels still exhibits IM near cloud top and HM within cloud. At 2 m below cloud top, parcels with various EFs are aligned horizontally (circles in Fig. 7a) and is manifested as IM signature. At 150 m below the cloud top, stronger entrainment events lead to greater reductions in droplet radius. For the parcel with EF = 0.7 (yellow symbols), the normalized r3 decreases by 13 %, whereas for the parcel with EF = 0.1, the reduction is only 0.8 %. As a result, the collective behavior of the parcels at 150 m below cloud top (inverted triangles in Fig. 6a) reveals HM signature. It is noticeable that the reduction of droplet size in Fig. 7a is significantly smaller than the control experiment as shown in Fig. 6a. This difference is expected as the turbulent mixing is strongly inhibited in Fig. 7a, thus the entrained dry air cannot efficiently mix with cloudy air, which eventually inhibits evaporation of droplets. Nevertheless, results in Figs. 6 and 7 demonstrate that, from the bulk perspective, mixing behavior consistently exhibits IM at cloud top, with an increasing signature of HM deeper within the cloud, regardless of the local mixing processes occurring in individual parcels.
Finally, it is noted that this study primarily aims to explain the IM–HM transition within cloud as observed from the bulk perspective. We do not attempt to draw conclusions about the local (e.g. parcel-based) mixing state within cloud. The local mixing behavior can vary depending on the model configuration and analysis approach, and it is strongly influenced by the timescale over which droplet properties (i.e. size and number) adjust following entrainment. For instance, in real cloud parcels may briefly dwell near the cloud top before descending, and the inferred local mixing characteristics therefore depend on this residence time. A longer dwell time near cloud top would permit greater vapor–droplet interaction at cloud top, potentially altering the local mixing signature with depth. A detailed investigation of these time-dependent local mixing processes is beyond the scope of this study.
3.3 Isobaric-Mixing Experiment
In previous sections, we have reconstructed the mixing behavior in Sc using EMPM simulations which is consistent with the aircraft-based measurements. However, the non-isobaric mixing process in previous experiments may lead to ambiguity for mixing interpretation. Specifically, when droplets evaporate in a descending parcel, the subsaturated environment can be caused by adiabatic warming and non-isobaric mixing. To isolate these two effects, we conduct an isobaric mixing experiment. The experiment setup is the same as the control one except after entrainment event near cloud top, the parcel velocity is set to 0 m s−1. This setting ensures the parcel only experiencing isobaric mixing after the entrainment at cloud top.
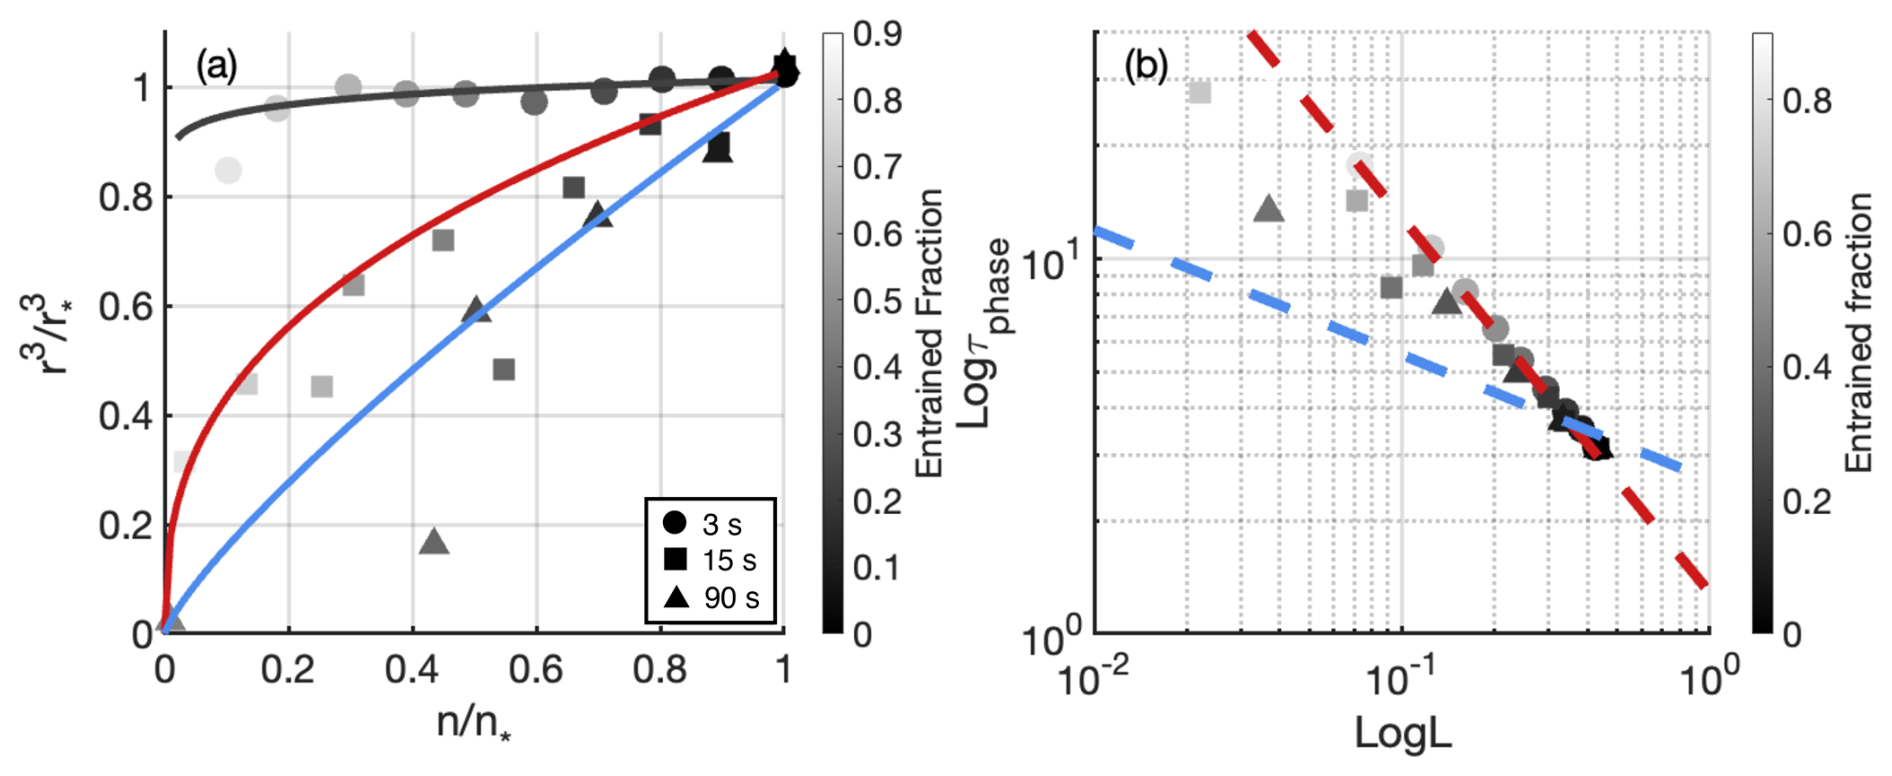
Figure 8(a) n-r3 mixing diagram from the bulk perspective for the isobaric mixing experiment: The circle, square and triangle represent the elapsed time of 3, 15 and 90 s after entrainment. The black (IM-like), red (HM-like) and blue (HM-like) lines represent the polynomial fitting for the parcels at 3, 15 and 90 s, respectively. (b) L-τphase mixing diagram for the isobaric mixing experiment. The circle, square and triangle represents the elapsed time at 3, 15 and 90 s after entrainment. The red, blue dashed line represents the IM and HM reference line with slope of −1 and .
Figure 8 shows the mixing diagrams at three elapsed times after the entrainment event. At 3 s, parcels with different EFs are closely aligned with the line of normalized r3=1. Correspondingly, the slope of the fitted line in the L-τphase diagram is −0.81 (Circle in Fig. 8b). These two features suggest IM at the beginning of mixing process. At 15 s, HM signature is identified with parcels of large EF experiencing greater reduction of radii and number (red line in Fig. 8a). At 90 s, stronger reduction of droplets size and number indicating a more prominent HM signature (blue line in Fig. 8a). The L-τphase diagram echoes the stronger HM feature as mixing continuing with the fitted slope increases from −0.56 to −0.42 from 15 to 90 s.
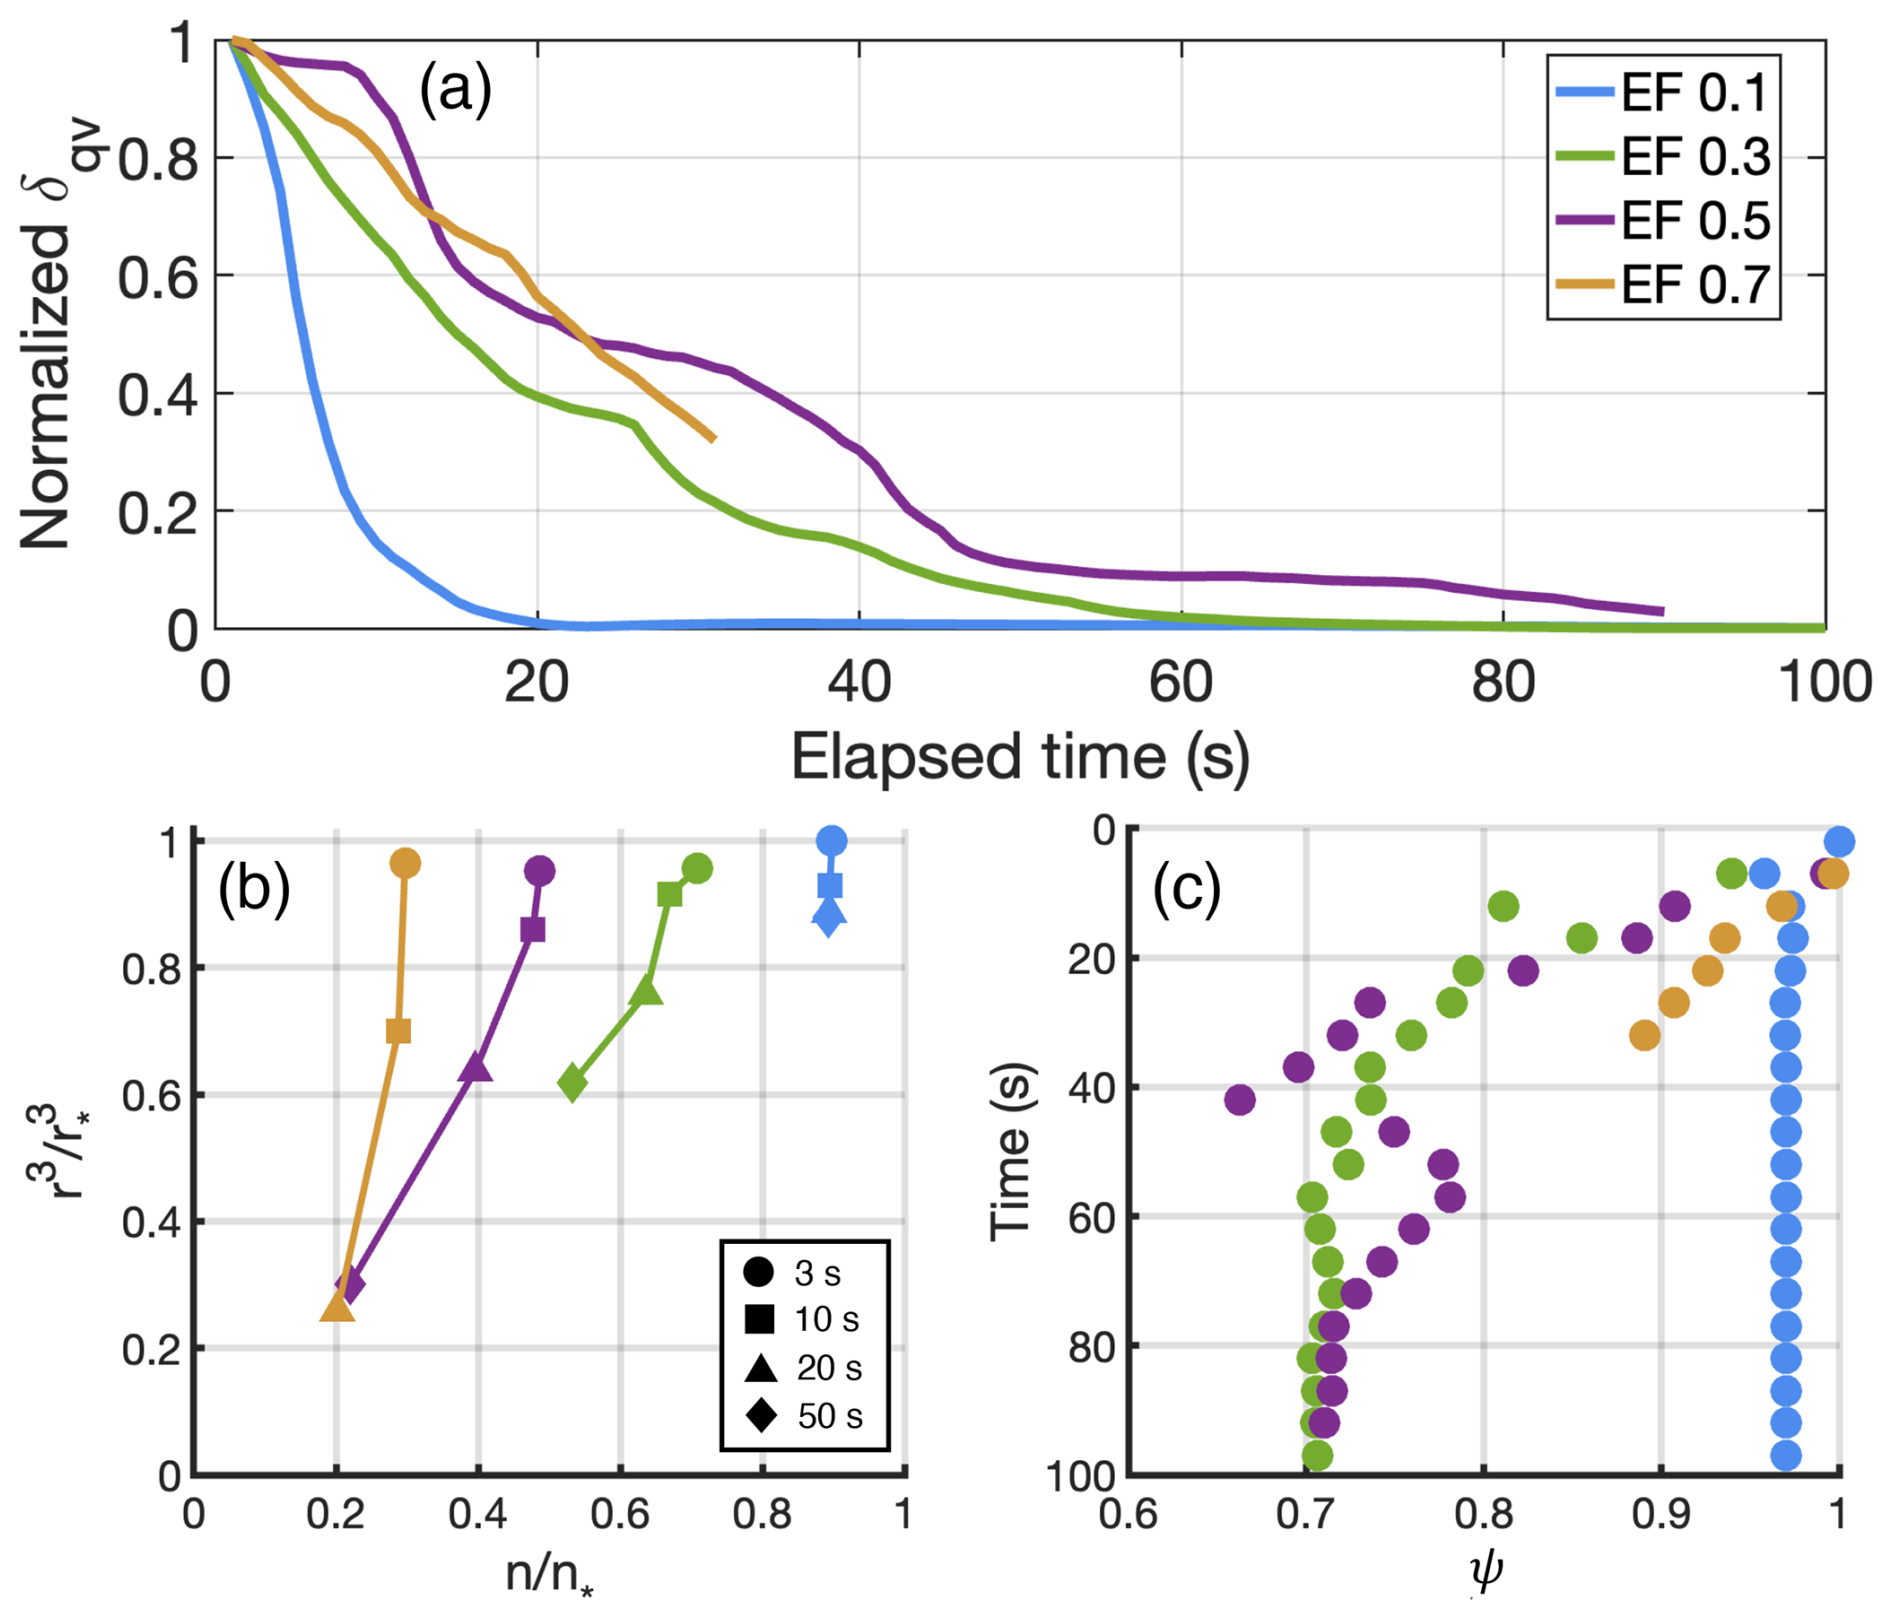
Figure 9(a) Normalized standard deviation of water vapor (δqv) in the parcel after entrainment for the isobaric mixing experiment. The blue, green, purple and yellow line represents the parcel with EF of 0.1, 0.3, 0.5 and 0.7. (b) n-r3 mixing diagram for the isobaric mixing experiment. The blue, green, purple and yellow symbol represents parcel with EF of 0.1, 0.3, 0.5 and 0.7. The circle, square, triangle and diamond indicate the parcel at elapsed time of 3, 10, 20, 50 s after entrainment. (c) The homogeneous mixing degree (ψ) as a function of elapsed time for the isobaric mixing experiment. Different color represents parcel with different EF indicated in (b).
To better illustrate the mixing process as a function of time, the normalized standard deviation of water vapor is plotted for the isobaric-mixing experiment (Fig. 9a). In Fig. 9a, δqv is maximum after the entrainment. As time goes by, qv decreases as mixing occurs between the entrained air and cloudy air. Parcels with the small EF experience a short mixing time compared with those with large EF. For instance, the parcel with EF 0.3 needs 60 s to reach the equilibrium state (green line in Fig. 9a) while the one with EF 0.1 needs only 20 s (blue line in Fig. 9a) to homogenize water vaper within the domain.
The parcel-based mixing behavior for four parcels is shown in Fig. 9b. Tracking individual parcels, it is clearly shown that the parcel experiencing HM has a greater reduction of radii compared to number. The most extreme case is for the parcel with EF of 0.1 (blue symbols in Fig. 9b): during the mixing process the normalized r3 decreases by 17 % while the normalized number barely changes. Correspondingly, the ψ parameter decreases from 1 to 0.97 from 0 to 12 s, indicating extreme HM. Parcels with large EF exhibit IM signatures after a greater duration of mixing. For instance, ψ for the parcels with EF of 0.3 and 0.5 decrease from 1 to 0.7 at 80 s after entrainment, suggesting the IM signature is enhanced as the mixing proceeds.
In a nutshell, the isobaric mixing experiment exhibits similar results as shown in the previous experiments. The collective mixing behavior of multiple parcels exhibits IM at the beginning of mixing and HM at later time. The elapsed time in the isobaric mixing experiment is equivalent to the distance from cloud top for the non-isobaric mixing experiments. The true mixing process as indicated from the local-based perspective, on the other hand, may be completely different from the collective mixing behavior. This isobaric mixing experiment reinforces the conclusion that the IM-HM transition from the bulk perspective results from the sampling strategy in clouds rather than true mixing process in the parcel.
Using multiple EMPM simulations, we successfully reproduce the commonly aircraft-observed result with IM near cloud top and HM within cloud. We further explain this phenomenon in Fig. 10. The aircraft measurements include multiple cloud parcels experiencing different entrainment-mixing histories. In Sc, entrainment occurs at the cloud top where a horizontal fraction of cloudy air is replaced by the free atmosphere. If the entrained air is cloud droplet-free, the entrainment event instantaneously reduces droplet number. Parcels experiencing strong entrainment have greater reductions of droplet number. The moment after entrainment, the dry air has not yet mixed with cloudy air, which is required to generate strong evaporation, thus the domain-averaged size remains constant. A collection of multiple parcels at cloud top are aligned along a horizontal line indicating the IM signature. As the parcel descends into cloud, mixing and evaporation occur collectively to reduce droplet size and number. Parcels with strong entrainment at the cloud top are associated with large entrainment fraction, resulting in a drier environment compared to parcels with smaller EF. Deeper into the cloud, parcels with large EF experience stronger evaporation, leading to a greater reduction in both droplet size and number. The collective view of parcels with different EFs in the n-r3 mixing diagram exhibits HM signature.
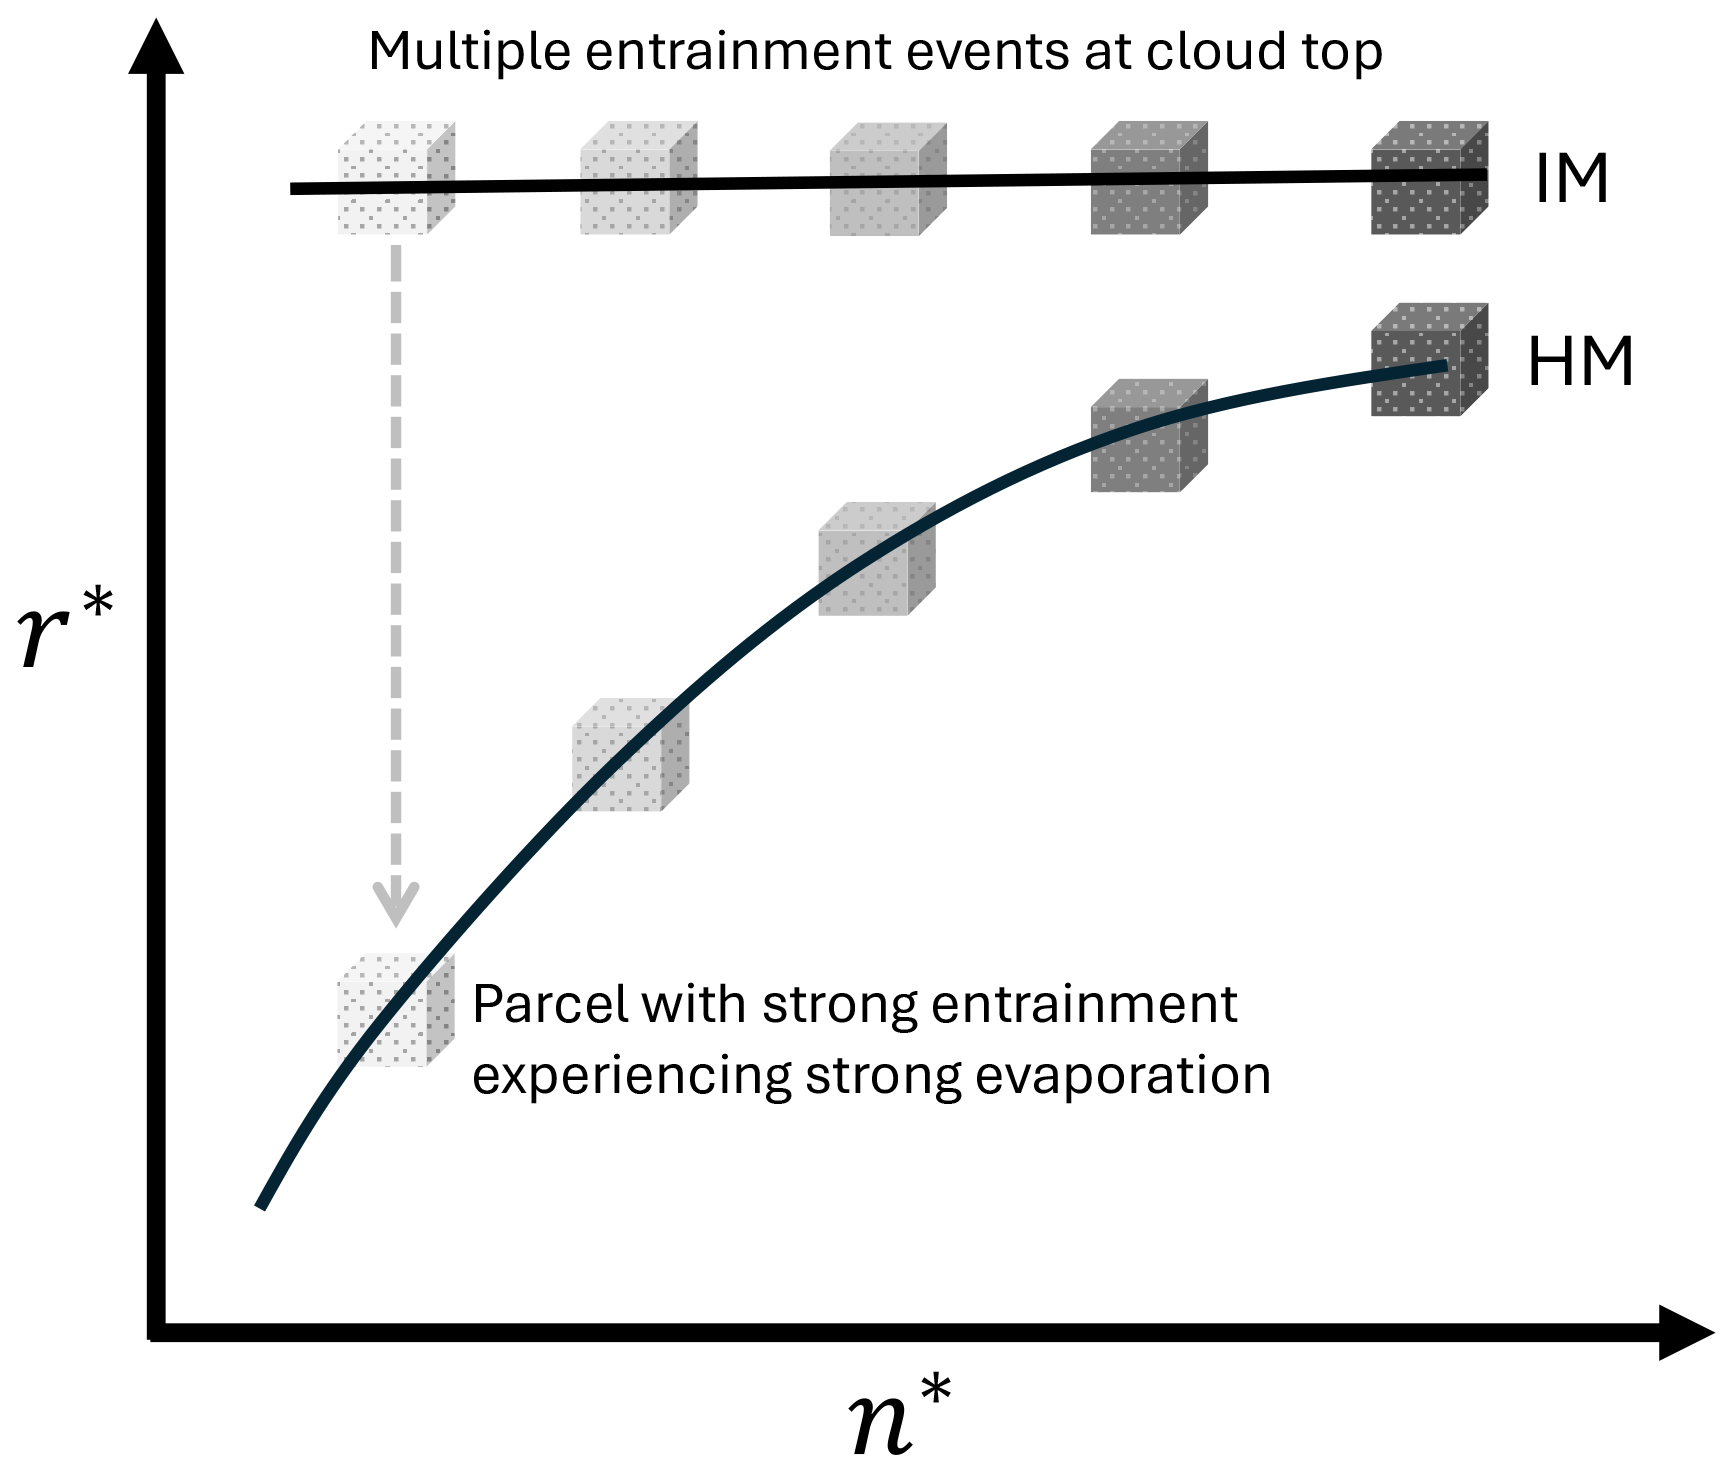
Figure 10Illustration of the IM-HM transition within Sc from the bulk perspective. Parcels with darker (lighter) shading corresponds to samples with lower (higher) entrainment fractions. The horizontal black line represents the IM behavior occurring near cloud top, the curved line represents the HM behavior occurring within cloud.
This explanation is essentially consistent with the “vertical circulation” hypothesis as discussed in previous studies (Yum et al., 2015; Wang et al., 2009; Yeom et al., 2021). In this study we use the EMPM simulations for a thoughtful demonstration and aim to raise the awareness of this modeling approach for investigating entrainment-mixing processes. Particularly, the aircraft measurements should be interpreted with caution especially when multiple samples along the aircraft traverse are overlapped in the mixing diagram. The collective behavior of different samples at given altitude may exhibit a result which does not represent the true mixing mechanism of each sample. For the similar reason, the Large Eddy Simulation (LES) output should also be analyzed with caution. Collecting cloud properties along multiple grids at a given height in the model generates pseudo “aircraft-based measurements”, which may also lead to misinterpretation of the mixing process. Lagrangian-based models, with the capability of tracking the history of each parcel, should serve as a more suitable tool for mixing investigations (Hoffmann and Feingold, 2019; Lim and Hoffmann, 2024). From the observational perspective, while the Lagrangian-based tracking approach is not applicable, alternative measurement methods developed in recent decades is helpful to mitigate the mixing artifacts generated from the aircraft measurements. For instance, the Cloudkite platform deployed at the kite-stabilized balloons (Schröder, 2023) and the holographic imaging technique (Beals et al., 2015) can provide high spatio-temporally resolved measurements down to cm-scales. Such fine-resolution observations capture the local cloud mixing state more representatively, offering deeper insights into the entrainment mixing processes within clouds.
In this study, we conduct EMPM simulations to understand the entrainment-mixing process observed from aircraft measurements in stratocumulus cloud. A collective of experiments are conducted with different thermodynamic and turbulence environments. Each experiment consists of ten simulations, with each simulation representing a 20 m parcel undergoing various entrainment degree at cloud top and distinct mixing history. The overall entrainment-mixing process for the simulations is analyzed from two views: the bulk-based and local perspective. The bulk perspective resembles the aircraft measurements in clouds and is illustrated by two commonly used mixing diagrams. The local perspective reflects the true mixing behavior in each parcel and is quantified by the homogeneous mixing degree (ψ) developed by Lu et al. (2013).
From the bulk perspective, the simulated mixing is identified as IM near cloud top and HM within cloud, which is consistent with the aircraft measurements in real clouds. However, this vertical progression primarily arises from the collective view of multiple parcels experiencing different mixing stages, in which strong evaporation in some parcels juxtapose with weak evaporation in others. This bulk view obscures the parcel's actual mixing process and leads to the appearance of a systematic IM-HM transition within cloud, even in cases where the underlying local mixing within each parcel could be substantially different. It is suggested that future mixing investigations in clouds should carefully re-examine the aircraft-based interpretation and consider incorporating Lagrangian approaches.
It is noted that the purpose of this study is to urge caution when interpreting aircraft measurements and LES simulations in entrainment–mixing research. This study does not aim to conclude the entrainment mixing behaviors in clouds. To advance the understanding of mixing processes in real clouds, emerging measurement technologies, such as the holographic detectors and tethered platforms, offer critical insights to observe mixing at the parcel scale. Additionally, for illustrative purposes, this study employs an idealized mixing framework in which each parcel evolves independently, with no mixing between parcels with differing entrainment histories. While a more sophisticated mixing scheme could better approximate observational realities, such complexity falls outside the scope of the present work.
The EMPM codes used in this study is available upon request from the authors. The sonding profiles used in this study are accessed via https://adc.arm.gov/discovery/#/results/datastream::enasondewnpnC1.b1 (last access: 16 December 2025).
ZZ designed the methodology and carried out the analysis. FY contributed to the study design. SK provided guidance on the use of the EMPM. YL assisted with the interpretation of results. ZZ drafted the manuscript, with all co-authors contributing to revisions and editing.
The contact author has declared that none of the authors has any competing interests.
Publisher's note: Copernicus Publications remains neutral with regard to jurisdictional claims made in the text, published maps, institutional affiliations, or any other geographical representation in this paper. The authors bear the ultimate responsibility for providing appropriate place names. Views expressed in the text are those of the authors and do not necessarily reflect the views of the publisher.
Zeen Zhu, Fan Yang, and Yangang Liu were funded by the Department of Energy (DOE) as part of the Atmospheric System Research (ASR) program under Contract DE-SC0012704. Steven Krueger was supported by NSF grant AGS-2133229.
This paper was edited by Tak Yamaguchi and reviewed by two anonymous referees.
Allwayin, N., Larsen, M. L., Glienke, S., and Shaw, R. A.: Locally narrow droplet size distributions are ubiquitous in stratocumulus clouds, Science, 384, 528–532, 2024.
Baker, M., Corbin, R., and Latham, J.: The influence of entrainment on the evolution of cloud droplet spectra: I. A model of inhomogeneous mixing, Quarterly Journal of the Royal Meteorological Society, 106, 581–598, 1980.
Beals, M. A., Fugal, J. P., Shaw, R. A., Lu, J., Spuler, S. M., and Stith, J. L.: Holographic measurements of inhomogeneous cloud mixing at the centimeter scale, Science, 350, 87–90, 2015.
Burnet, F. and Brenguier, J.-L.: Observational study of the entrainment-mixing process in warm convective clouds, Journal of the Atmospheric Sciences, 64, 1995–2011, 2007.
Chosson, F., Brenguier, J.-L., and Schüller, L.: Entrainment-mixing and radiative transfer simulation in boundary layer clouds, Journal of the Atmospheric Sciences, 64, 2670–2682, 2007.
Desai, N., Liu, Y., Glienke, S., Shaw, R. A., Lu, C., Wang, J., and Gao, S.: Vertical variation of turbulent entrainment mixing processes in marine stratocumulus clouds using high-resolution digital holography, Journal of Geophysical Research: Atmospheres, 126, e2020JD033527, https://doi.org/10.1029/2020JD033527, 2021.
Gao, S., Lu, C., Liu, Y., Yum, S. S., Zhu, J., Zhu, L., Desai, N., Ma, Y., and Wu, S.: Comprehensive quantification of height dependence of entrainment mixing between stratiform cloud top and environment, Atmospheric Chemistry and Physics, 21, 11225–11241, https://doi.org/10.5194/acp-21-11225-2021, 2021.
Hoffmann, F. and Feingold, G.: Entrainment and mixing in stratocumulus: Effects of a new explicit subgrid-scale scheme for large-eddy simulations with particle-based microphysics, Journal of the Atmospheric Sciences, 76, 1955–1973, 2019.
Jeffery, C. A. and Reisner, J. M.: A study of cloud mixing and evolution using PDF methods. Part I: Cloud front propagation and evaporation, Journal of the Atmospheric Sciences, 63, 2848–2864, 2006.
Kerstein, A. R.: Linear-eddy modelling of turbulent transport. Part 6. Microstructure of diffusive scalar mixing fields, Journal of Fluid Mechanics, 231, 361–394, 1991.
Krueger, S. K., Su, C.-W., and McMurtry, P. A.: Modeling entrainment and finescale mixing in cumulus clouds, Journal of the Atmospheric Sciences, 54, 2697–2712, 1997.
Lasher-Trapp, S. G., Cooper, W. A., and Blyth, A. M.: Broadening of droplet size distributions from entrainment and mixing in a cumulus cloud, Quarterly Journal of the Royal Meteorological Society, 131, 195–220, 2005.
Latham, J. and Reed, R.: Laboratory studies of the effects of mixing on the evolution of cloud droplet spectra, Quarterly Journal of the Royal Meteorological Society, 103, 297–306, 1977.
Lehmann, K., Siebert, H., and Shaw, R. A.: Homogeneous and inhomogeneous mixing in cumulus clouds: Dependence on local turbulence structure, Journal of the Atmospheric Sciences, 66, 3641–3659, 2009.
Lim, J. S. and Hoffmann, F.: Between broadening and narrowing: How mixing affects the width of the droplet size distribution, Journal of Geophysical Research: Atmospheres, 128, e2022JD037900, https://doi.org/10.1029/2022JD037900, 2023.
Lim, J. S. and Hoffmann, F.: Life cycle evolution of mixing in shallow cumulus clouds, Journal of Geophysical Research: Atmospheres, 129, e2023JD040393, https://doi.org/10.1029/2023JD040393, 2024.
Lu, C., Liu, Y., Niu, S., Krueger, S., and Wagner, T.: Exploring parameterization for turbulent entrainment-mixing processes in clouds, Journal of Geophysical Research: Atmospheres, 118, 185–194, 2013.
Luo, S., Lu, C., Liu, Y., Li, Y., Gao, W., Qiu, Y., Xu, X., Li, J., Zhu, L., and Wang, Y.: Relationships between cloud droplet spectral relative dispersion and entrainment rate and their impacting factors, Advances in Atmospheric Sciences, 39, 2087–2106, 2022.
Magaritz-Ronen, L., Pinsky, M., and Khain, A.: Effects of turbulent mixing on the structure and macroscopic properties of stratocumulus clouds demonstrated by a Lagrangian trajectory model, Journal of the Atmospheric Sciences, 71, 1843–1862, 2014.
Schröder, M.: Cloud Microphysics Investigations with the Cloudkite Laboratory, PhD thesis, Georg-August-Universität Göttingen, Göttingen, https://doi.org/10.53846/goediss-9830, 2023.
Su, C.-W., Krueger, S. K., McMurtry, P. A., and Austin, P. H.: Linear eddy modeling of droplet spectral evolution during entrainment and mixing in cumulus clouds, Atmospheric Research, 47, 41–58, 1998.
Tölle, M. H. and Krueger, S. K.: Effects of entrainment and mixing on droplet size distributions in warm cumulus clouds, Journal of Advances in Modeling Earth Systems, 6, 281–299, 2014.
Wang, J., Daum, P. H., Yum, S. S., Liu, Y., Senum, G. I., Lu, M. L., Seinfeld, J. H., and Jonsson, H.: Observations of marine stratocumulus microphysics and implications for processes controlling droplet spectra: Results from the Marine Stratus/Stratocumulus Experiment, Journal of Geophysical Research: Atmospheres, 114, https://doi.org/10.1029/2008JD011035, 2009.
Wang, J., Wood, R., Jensen, M. P., Chiu, J. C., Liu, Y., Lamer, K., Desai, N., Giangrande, S. E., Knopf, D. A., and Kollias, P.: Aerosol and cloud experiments in the Eastern North Atlantic (ACE-ENA), Bulletin of the American Meteorological Society, 103, E619–E641, 2022.
Wood, R.: Stratocumulus Clouds, Monthly Weather Review, 140, 2373–2423, https://doi.org/10.1175/mwr-d-11-00121.1, 2012.
Yang, F., Kollias, P., Shaw, R. A., and Vogelmann, A. M.: Cloud droplet size distribution broadening during diffusional growth: ripening amplified by deactivation and reactivation, Atmospheric Chemistry and Physics, 18, 7313–7328, https://doi.org/10.5194/acp-18-7313-2018, 2018.
Yeom, J. M., Yum, S. S., Shaw, R. A., La, I., Wang, J., Lu, C., Liu, Y., Mei, F., Schmid, B., and Matthews, A.: Vertical variations of cloud microphysical relationships in marine stratocumulus clouds observed during the ACE-ENA campaign, Journal of Geophysical Research: Atmospheres, 126, e2021JD034700, https://doi.org/10.1029/2021JD034700, 2021.
Yeom, J. M., Helman, I., Prabhakaran, P., Anderson, J. C., Yang, F., Shaw, R. A., and Cantrell, W.: Cloud microphysical response to entrainment and mixing is locally inhomogeneous and globally homogeneous: Evidence from the lab, Proceedings of the National Academy of Sciences, 120, e2307354120, https://doi.org/10.1073/pnas.2307354120, 2023.
Yum, S. S., Wang, J., Liu, Y., Senum, G., Springston, S., McGraw, R., and Yeom, J. M.: Cloud microphysical relationships and their implication on entrainment and mixing mechanism for the stratocumulus clouds measured during the VOCALS project, Journal of Geophysical Research: Atmospheres, 120, 5047–5069, 2015.