the Creative Commons Attribution 4.0 License.
the Creative Commons Attribution 4.0 License.
 | 12 Dec 2025
Ammonia exchange flux over a tropical dry deciduous forest in the dry season in Thailand
Mao Xu
Phuvasa Chanonmuang
Hiroyuki Sase
Atsuyuki Sorimachi
Syuichi Itahashi
Kazuhide Matsuda
Ammonia (NH3) is a significant contributor to total nitrogen deposition in East Asia. However, process-based observations that specifically focus on the air–surface exchange of NH3 remain limited in this region, especially in Southeast Asia. To clarify the bi-directional exchange process of NH3 under tropical climatic conditions, we present the first observations of NH3 exchange flux over a tropical dry deciduous forest in Thailand during two periods with different canopy and meteorological conditions in the dry season using the aerodynamic gradient method. NH3 concentrations exhibited strong positive correlations with air temperature and negative correlations with wind speed during the leafy period. However, there was no clear correlation between concentrations and meteorological elements during the leafless period. Measured NH3 fluxes fell within the ranges presented in recent studies, with a weighted mean and standard deviation of 0.148 ± 0.240 µg m−2 s−1, and consistently larger during daytime. During the dry season, the tropical dry deciduous forest acted as an emission source of NH3. Across both observation periods, NH3 emissions were governed by air temperature, relative humidity, friction velocity, and solar radiation. While no clear difference in fluxes magnitude was observed between the leafy (0.140 ± 0.240 µg m−2 s−1) and the leafless (0.158 ± 0.239 µg m−2 s−1) periods, the main source of NH3 emission in the tropical dry deciduous forest probably shifted dynamically from stomata to leaf litter due to the changes in meteorological, canopy, and forest floor conditions.
- Article
(8357 KB) - Full-text XML
- BibTeX
- EndNote


Nitrogen is an essential element for humans and has significantly benefited agriculture and manufacturing (Hayashi et al., 2021). However, the excessive use of nitrogen places a heavy burden on the environment, causing climate change, air and water pollution, acidification, eutrophication, and biodiversity loss through atmospheric deposition (Kuriyama and Hayashi, 2025; Nishina et al., 2017). Concerns about nitrogen-related issues are growing on a global scale, as evidenced by the adoption of a resolution on “sustainable nitrogen management” in the Fifth session of the United Nations Environment Assembly in 2022 (Nishina et al., 2025). The world is currently under pressure to develop plans to reduce nitrogen emissions, but outside of Western countries, where reports on nitrogen assessment (EPA, 2011; Sutton et al., 2011) have already been published, there is limited knowledge about nitrogen dynamics and assessments needed for its management (Rudek et al., 2017).
East Asia is one of the regions at high risk of nitrogen pollution and is a hotspot for nitrogen deposition (Rubin et al., 2023; Nishina et al., 2021). In this region, the Acid Deposition Monitoring Network in East Asia (EANET), an intergovernmental network that began full-scale operation in January 2001, is currently monitoring air concentrations and atmospheric deposition of pollutants at 65 sites in 13 countries (EANET, 2024). To date, estimations of nitrogen deposition on a national scale have been conducted mainly in Japan (Chatani et al., 2025; Yamaga et al., 2021; Ban et al., 2016; Endo et al., 2011) and China (Chen et al., 2023; Zhou et al., 2023; Wen et al., 2020) using data from the EANET and/or the nitrogen monitoring network in China. These studies have revealed that the dry deposition of NH3, which is the main reduced form of nitrogen, has increased significantly among total nitrogen depositions, following dramatic changes in nitrogen oxides emissions in recent years. Nitrogen oxides emissions in Asia peaked in the early 2010s and have been declining since then (Kurokawa and Ohara, 2020). The model-based approach may contain uncertainties; therefore, process-based observations were conducted at several sites to verify model performance and improve the accuracy of the deposition estimates. Observational data on the main components contributing to nitrogen deposition, including NH3, have been gathered from Japanese forests (Xu et al., 2024; Wu et al., 2024; Xu et al., 2023, 2021; Xu and Matsuda, 2020; Nakahara et al., 2019; Hayashi et al., 2011) and agricultural fields (Xu et al., 2022; Hayashi et al., 2017, 2012) located in temperate and cool temperate zones, and NH3 flux observations are now being carried out in Chinese agricultural fields (Wang et al., 2021).
Despite evidence that forests in Southeast Asian countries are exposed to high nitrogen deposition (Ban et al., 2022) and that deposition amounts often exceed the critical load for eutrophication (Yamashita et al., 2022), national-scale estimates of nitrogen deposition remain limited in many of these countries (Beachley et al., 2024). Moreover, process-based observations have only been conducted for sulfur compounds, ozone, and elemental carbon at some forest sites in Thailand (Chanonmuang et al., 2015; Khoomsab et al., 2014; Matsuda et al., 2012, 2006, 2005), whereas studies specifically focusing on nitrogen deposition are comparatively limited. Understanding the behavior of major nitrogen compounds, particularly the air-surface exchange of NH3, in tropical climates which differ significantly from those of Japan and China is essential for improving the accuracy of deposition estimates in East Asia through model advancement. This will also help address key scientific questions related to nitrogen cycle in diverse regions. Against this backdrop, we performed the world's first observation of NH3 exchange flux over a tropical dry deciduous forest in Thailand. Measurements were taken during two periods in the dry season, which differed in environmental conditions: (i) rising air temperatures as the season progressed and (ii) substantial leaf fall, which significantly altered canopy and forest floor conditions. As shown in Saylor et al. (2025) who summarized previous studies until recently, the behavior of NH3 depends on many factors (e.g. NH3 concentration, canopy condition, the presence of source, meteorological, and soil elements) and varies from one study site to another, making it difficult to generalize the exchange process. Therefore, our first step was to understand the characteristics of the exchange process in tropical deciduous forests by measuring NH3 fluxes and meteorological elements and clarifying their relationships.
2.1 Site description
We conducted the observation in the forest of Sakaerat Environmental Research Station (SERS), Nakhon Ratchasima Province, Thailand (14°30′ N, 101°55′ E), as shown in Fig. 1. SERS is the core area of the Sakaerat Biosphere Reserve, which was the first biosphere reserve in Thailand recognized for its rich biodiversity of flora and fauna. According to the Köppen climate classification, SERS is classified as a tropical savanna, with annual mean air temperature of 24.9 °C and annual rainfall of 1472 mm during the 3 years from 2020 to 2022 (Fig. 2). SERS is characterized by high temperatures throughout the year and distinct wet (April to October) and dry (November to March) seasons (Matsuda et al., 2012). From December to February, the dry season is especially pronounced, with a monthly rainfall of less than 50 mm (Sase et al., 2017, 2012). The forest of SERS consists of dry evergreen and dry deciduous forests (DDF) (Murata et al., 2009). We used a 38 m walk-up observation tower installed in the DDF located near the northeastern edge of the SERS. The DDF is almost flat and sparse, and Dipterocarps such as Shorea obtusa and Shorea siamensis dominate in the area around the tower (Murata et al., 2011), with a canopy height (h) of about 20 m. Leaf area index (LAI) was measured at 4 locations within approximately 50 m of the observation tower by a plant canopy analyzer (LI-COR, LAI-2200) at the beginning of the observation period (15 December 2023). The measured LAI was in the range from 2.5 to 4.2 with a mean and standard deviation of 3.1 ± 0.7. Although the eastern side of SERS is mainly covered by agricultural fields and residential areas, the observation tower is located at least 400 m away from these areas. Further details regarding the topography and seasonal variations in leaf conditions of the DDF are described in Matsuda et al. (2012).
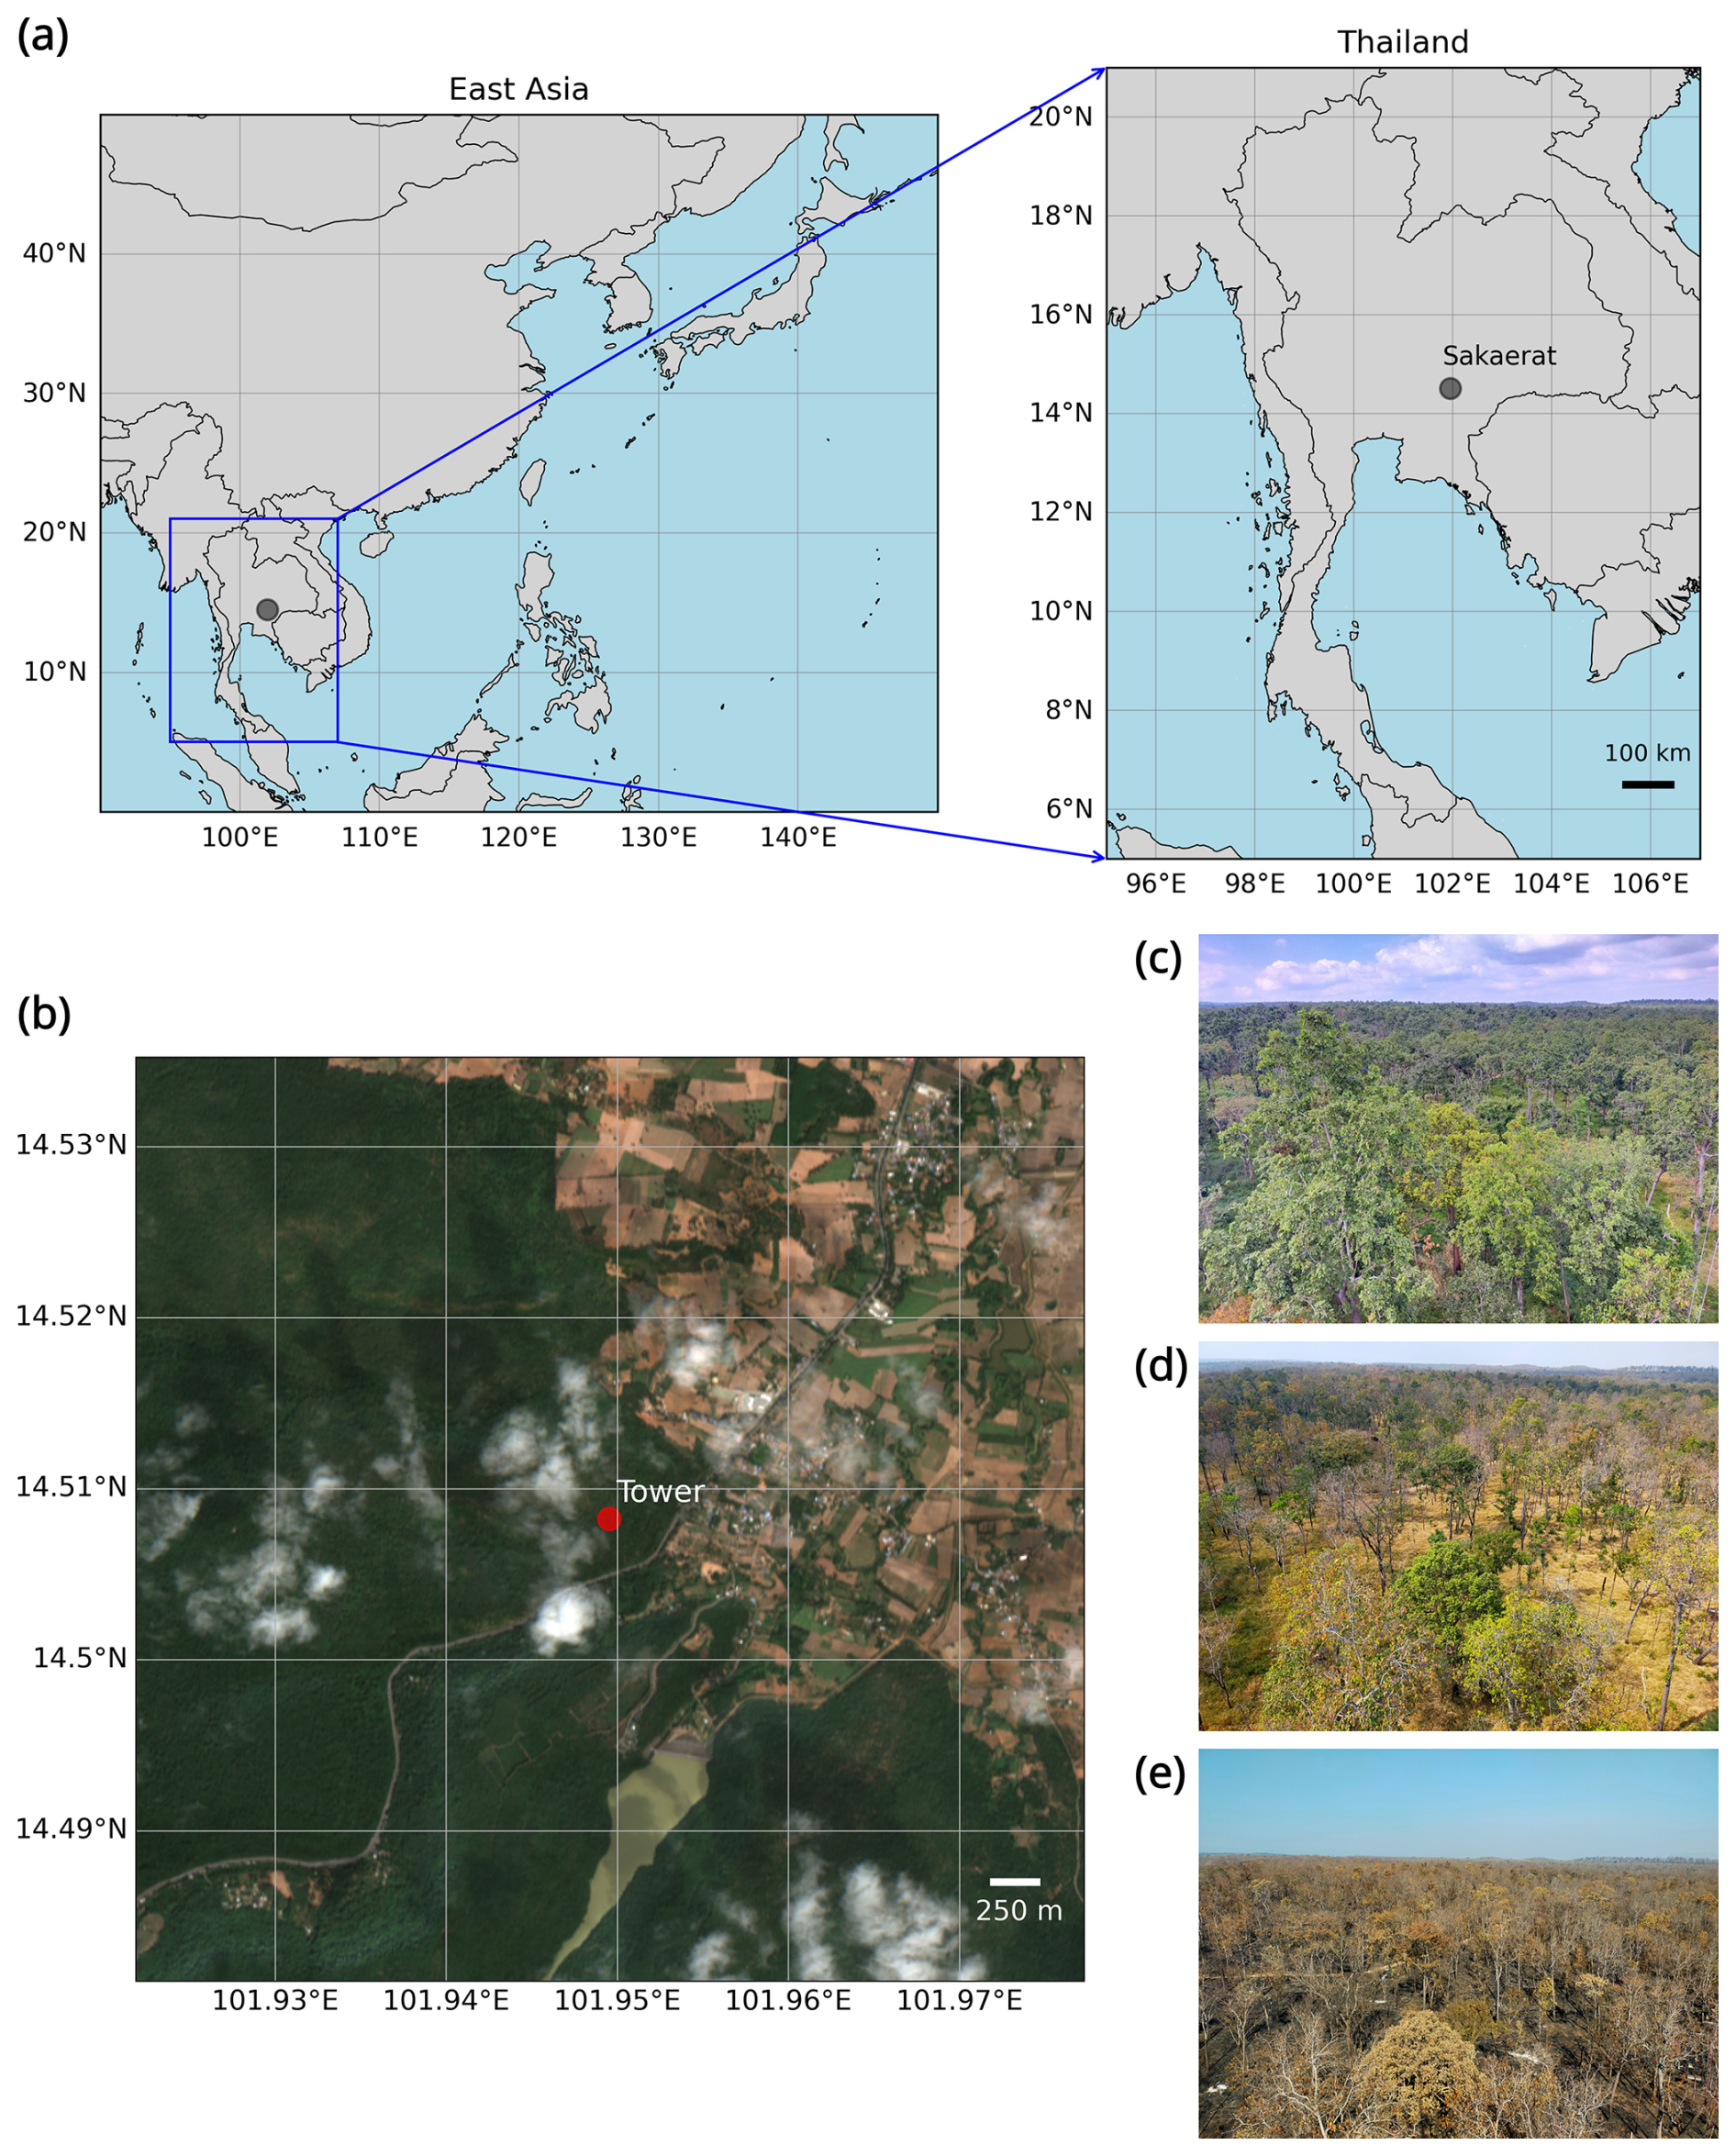
Figure 1(a) Location and (b) surrounding environment of the observation site (gray circle) and tower (red circle) in the Sakaerat Environmental Research Station. Satellite imagery (6 km × 6 km) was retrieved from the dataset of Sentinel-2 Surface Reflectance Harmonized (COPERNICUS/S2_SR_HARMONIZED) via © Google Earth Engine. The data was filtered for the observation point, and date from 15 to 31 December 2023, with a cloud cover percentage of less than 20 % was shown. (c–e) Photos of canopy condition at the begging of the leafy period (c) and the leafless period (d), and the end of the campaign (e). All the photos were taken from the same direction facing north.
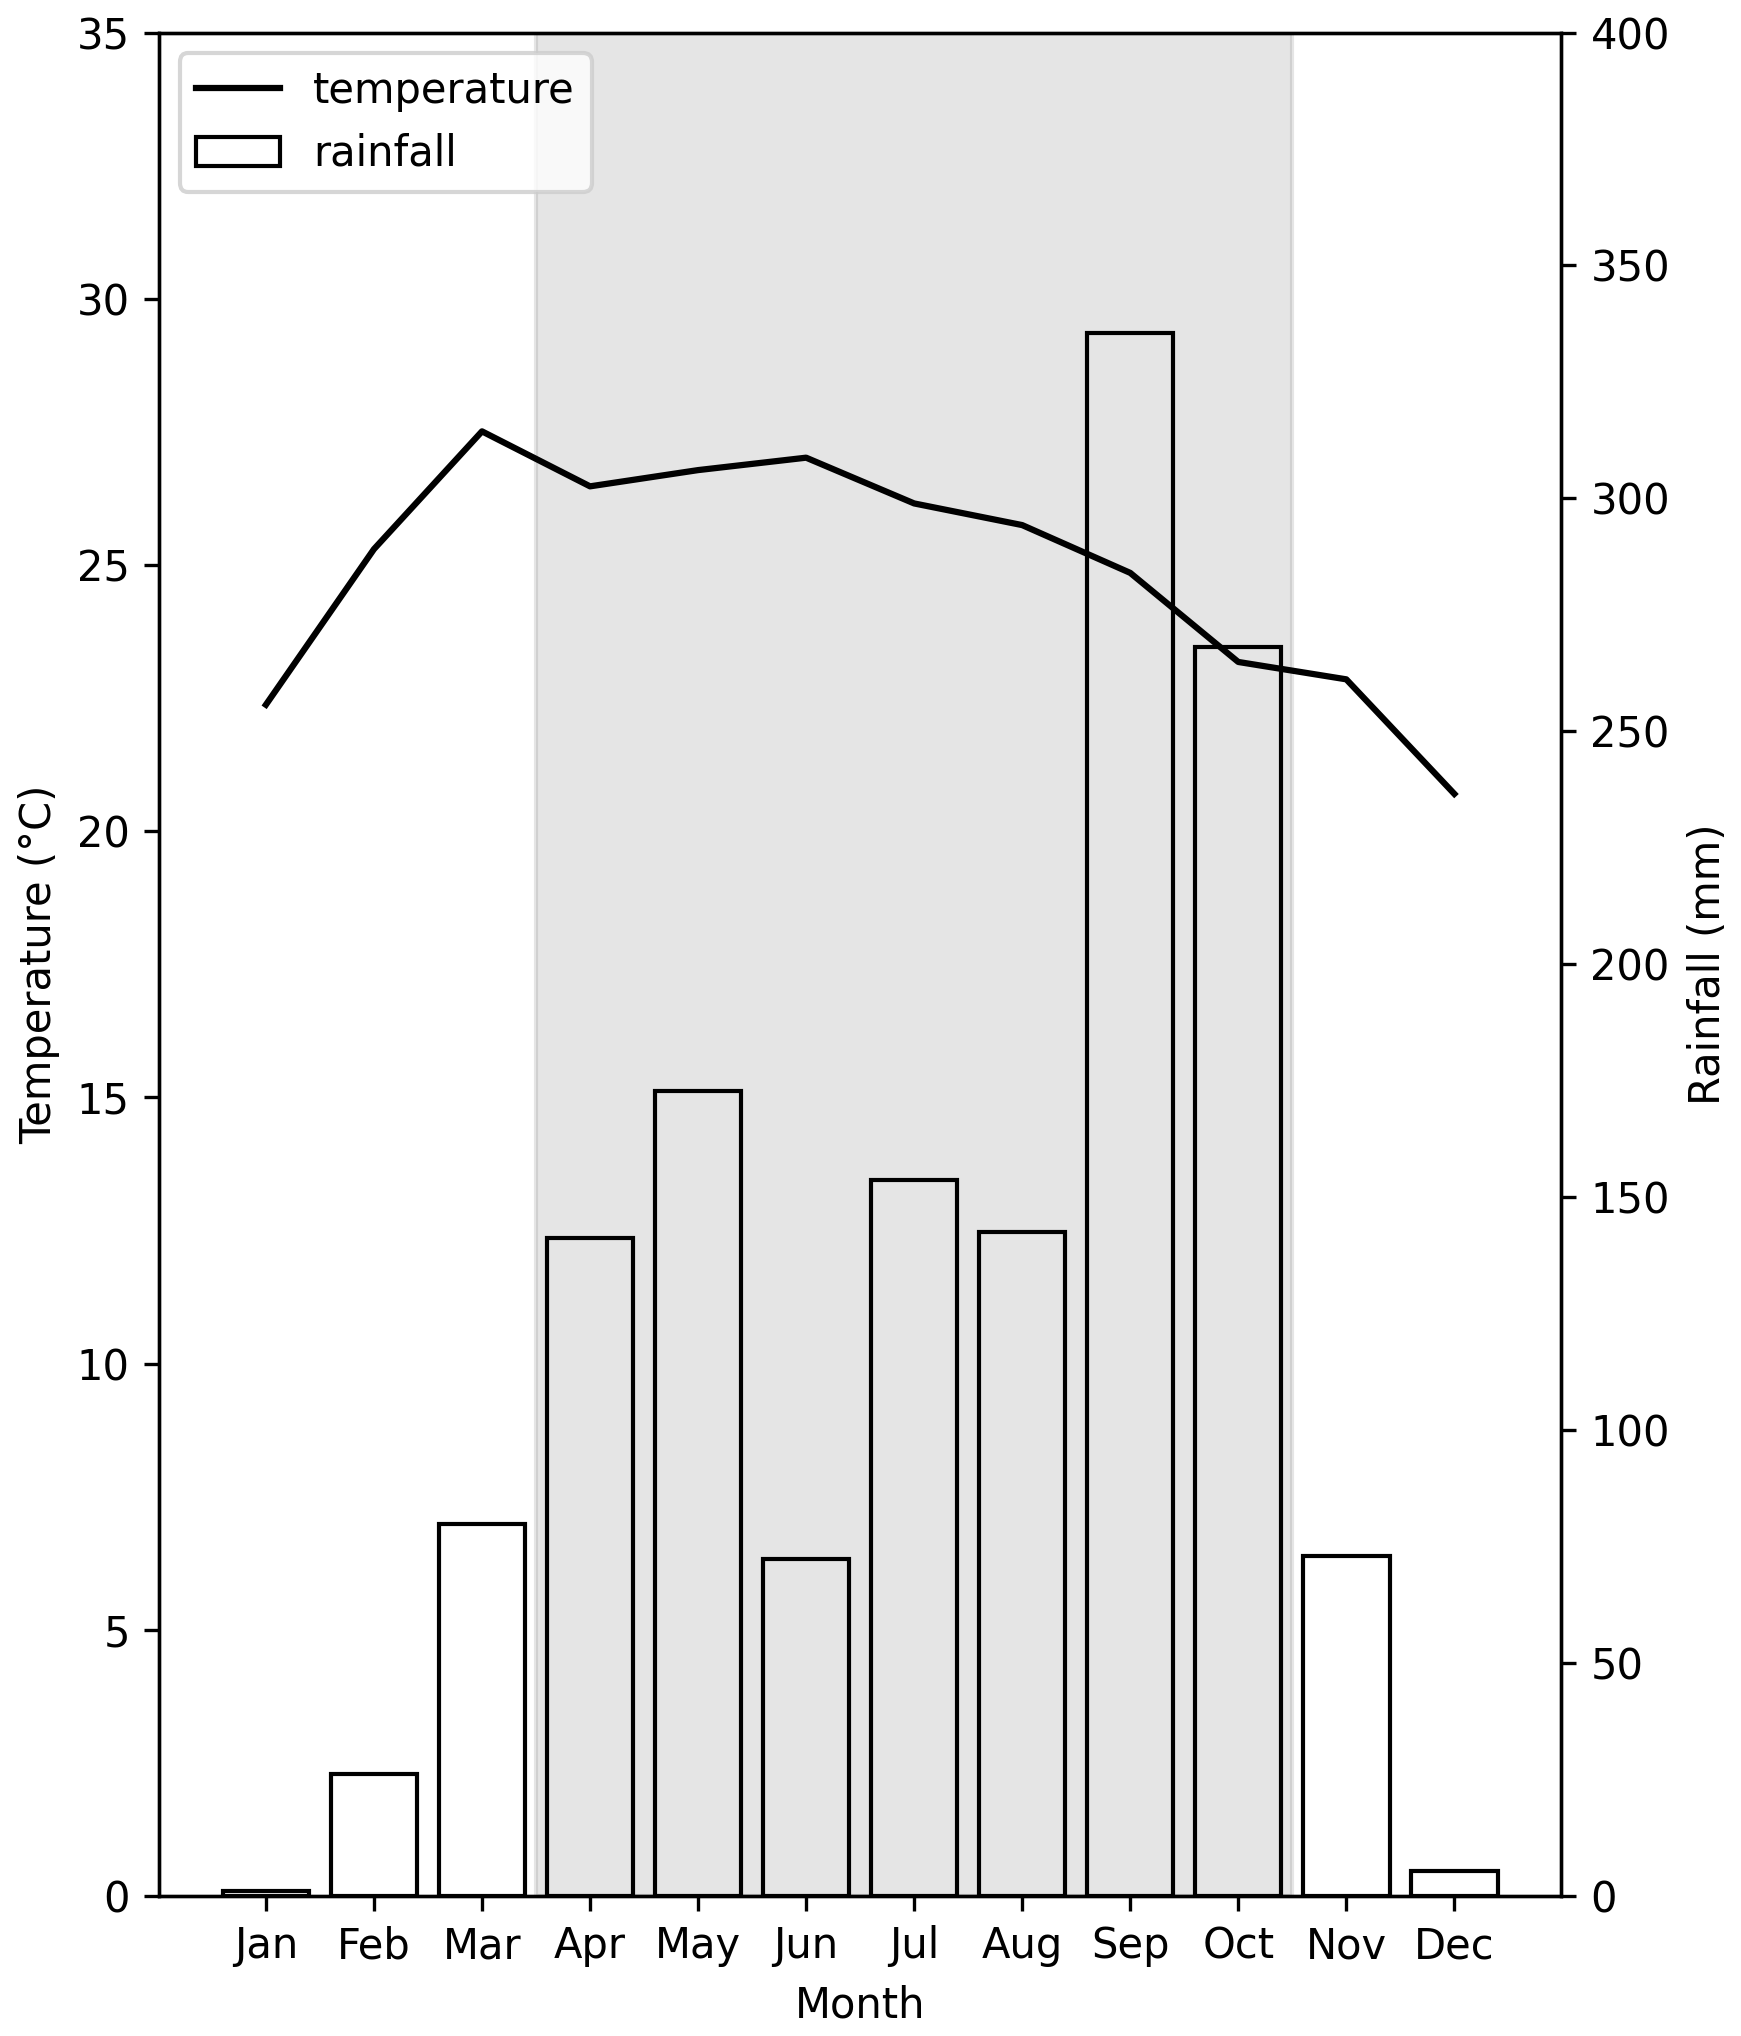
Figure 2Variations in monthly mean air temperature (line) and rainfall (bar) at the weather station of Sakaerat Environmental Research Station based on the meteorological data recorded from January 2020 to December 2022. Gray hatch indicates the wet season (from April to October).
2.2 Flux measurements for ammonia using aerodynamic gradient method
We measured NH3 fluxes using the aerodynamic gradient method (AGM), which is a globally recognized method for determining trace gas fluxes (Melman et al., 2025; Xu et al., 2023), over the DDF of SERS. The observations were conducted under different canopy conditions: one during the leafy period and the other during the leafless period (Fig. 1). The observation periods were from 15 to 30 December 2023 (hereinafter referred to “leafy period”), and from 22 January to 6 February 2024 (“leafless period”). To avoid duplication, we briefly describe the AGM theory. Using the AGM, the flux (F) can be calculated by multiplying the turbulent diffusivity by the vertical gradient of concentration according to Fick's law:
where D is the transfer velocity, and ΔC is the concentration difference between two heights of z1 and z2 (z2 > z1) above the canopy (Matsuda et al., 2010). We obtained transfer velocity (m s−1) as follow:
where k is the von Karman constant (0.41), u∗ is the friction velocity, d is the displacement height, Ψh is the integrated stability correction for heat, and L is the Monin–Obukhov length, respectively (Matsuda et al., 2010). u∗ and L were derived from micrometeorological elements (e.g. horizontal and vertical wind speed, virtual temperature) recorded by a 3D sonic anemometer (YOUNG, 81000) installed at the height of 31.5 m at the observation tower. d was determined following Xu et al. (2023) and Matsuda et al. (2010). Matsuda et al. (2012) derived seasonal d for the DDF of SERS from the relationship between u∗ and wind speed, and the relationship between and LAI; 0.7 for the leafy season and 0.6 for the transitional season, respectively. We also determined d from the relationship between u∗ and wind speed, and the values obtained were the same as those of Matsuda et al. (2012); 0.7 for the leafy period and 0.6 for the leafless period, respectively. We calculated 10 min values of transfer velocity and subsequently averaged them over the sampling time for NH3 concentration. The 10 min interval was chosen to maximize data availability while considering the trade-off between flux underestimation and random error (Vickers and Mahrt, 1997).
We derived ΔC from the NH3 concentration measured at heights of 34 m (z2) and 26 m (z1) at the observation tower using the filter-pack holders (Tokyo Dylec Corporation, NILU filter folder NL-O) which consist of four stages. This system is the same as that used by Xu et al. (2023). NH3 was collected at the last stage of the filter-pack holder by using a phosphoric acid impregnated cellulose filter with a flow rate of 20 L min−1. We continuously collected two daytime samples, denoted as D1 and D2, corresponding to 09:00–13:00 and 13:00–17:00 LT (local time), respectively, and one nighttime sample, denoted as N, corresponding to 17:00–09:00 LT for 15 d each in the leafy and leafless periods. After sampling, the ammonium ions in each cellulose filter were extracted into deionized water (10 mL) using an ultrasonic method, and were analyzed using two ion chromatographs (Dionex, ICS-1100 and Shimadzu Corp., HIC-ESP) for quality control. The NH3 concentrations obtained were almost the same; however, those of ICS-1100 tended to be slightly higher. Since the HIC-ESP had a better calibration curve for ammonium ions than the ICS-1100, its analytical results were adopted. We also performed laboratory (n = 5) and travel (n = 5) blank tests. We subtracted the median value of travel blanks when calculating NH3 concentrations because the ammonium content was higher in the travel blanks than in the laboratory blanks.
The AGM based on the Monin-Obukhov similarity theory (MOST) is valid only within the inertial sublayer (Melman et al., 2024). In this study, NH3 concentrations were measured at 34 and 26 m above a canopy with a height of 20 m, suggesting that both measurement heights were likely within the roughness sublayer (RSL). Since MOST will not hold within the RSL, a correction for measured fluxes is necessary. Possible underestimation of measured flux is discussed in Sect. 3.5. Additionally, we also address other sources of uncertainty in the measured flux.
2.3 Meteorological measurements
We recorded wind speed, wind direction, and other elements to calculate the transfer velocity using a 3D sonic anemometer (YOUNG, 81000) installed at 31.5 m at the observation tower. The 3D sonic anemometer recorded meteorological elements at a frequency of 10 Hz, and the data logger processed the data into 10 min statistics, including mean values and covariances. We also recorded the air temperature and relative humidity at 34 and 26 m at the observation tower using a thermometer (T&D Corp., TR-73 U). Instantaneous values were recorded at 10 min intervals. Observations of meteorological elements were also conducted by SERS in a vacant lot approximately 1.2 km west of the observation tower, and we used 1 h values of solar radiation and rainfall recorded at this weather station. Rainfall did not occur during the observation period.
2.4 Satellite-derived leaf area index
Since LAI was measured only once at the beginning of the observation period, we used the satellite-derived LAI to represent the temporal variation at the DDF of SERS. The satellite-derived LAI from December 2023 to February 2024 at the observation tower were obtained from the dataset of MCD15A3H, which is a product of the Moderate Resolution Imaging Spectroradiometer onboard the Terra and Aqua satellites (Myneni et al., 2015). The LAI values, 4 d composite data with a spatial resolution of 500 m, were obtained from the combined observations of both satellites. Based on the quality control of MCD15A3H, all data during the period were evaluated as best result possible with highest confidence.
3.1 Variations in ammonia concentration
The temporal variations in NH3 concentrations at 34 and 26 m during the observation period are shown in Fig. 3. Of the 90 samples we collected, two samples were missing owing to the problems in the electrical system and eight samples overlapped with the forest fire period described later in the leafless period; approximately 89 % of the total samples were valid. All valid samples exceeded the limit of quantification (10 times the standard deviation of travel blanks). Variations in the NH3 concentrations were clearly different between the leafy and leafless periods. In the leafy period, NH3 concentration at 34 m ranged from 1.06 to 5.25 µg m−3, and gradually decreased toward the middle of the period and then increased again. The NH3 concentration at 26 m exhibited a similar variation to that at 34 m. The weighted means with standard deviations of NH3 concentration by sampling time at 34 and 26 m were 2.69 ± 0.93 and 2.88 ± 0.95 µg m−3, respectively.
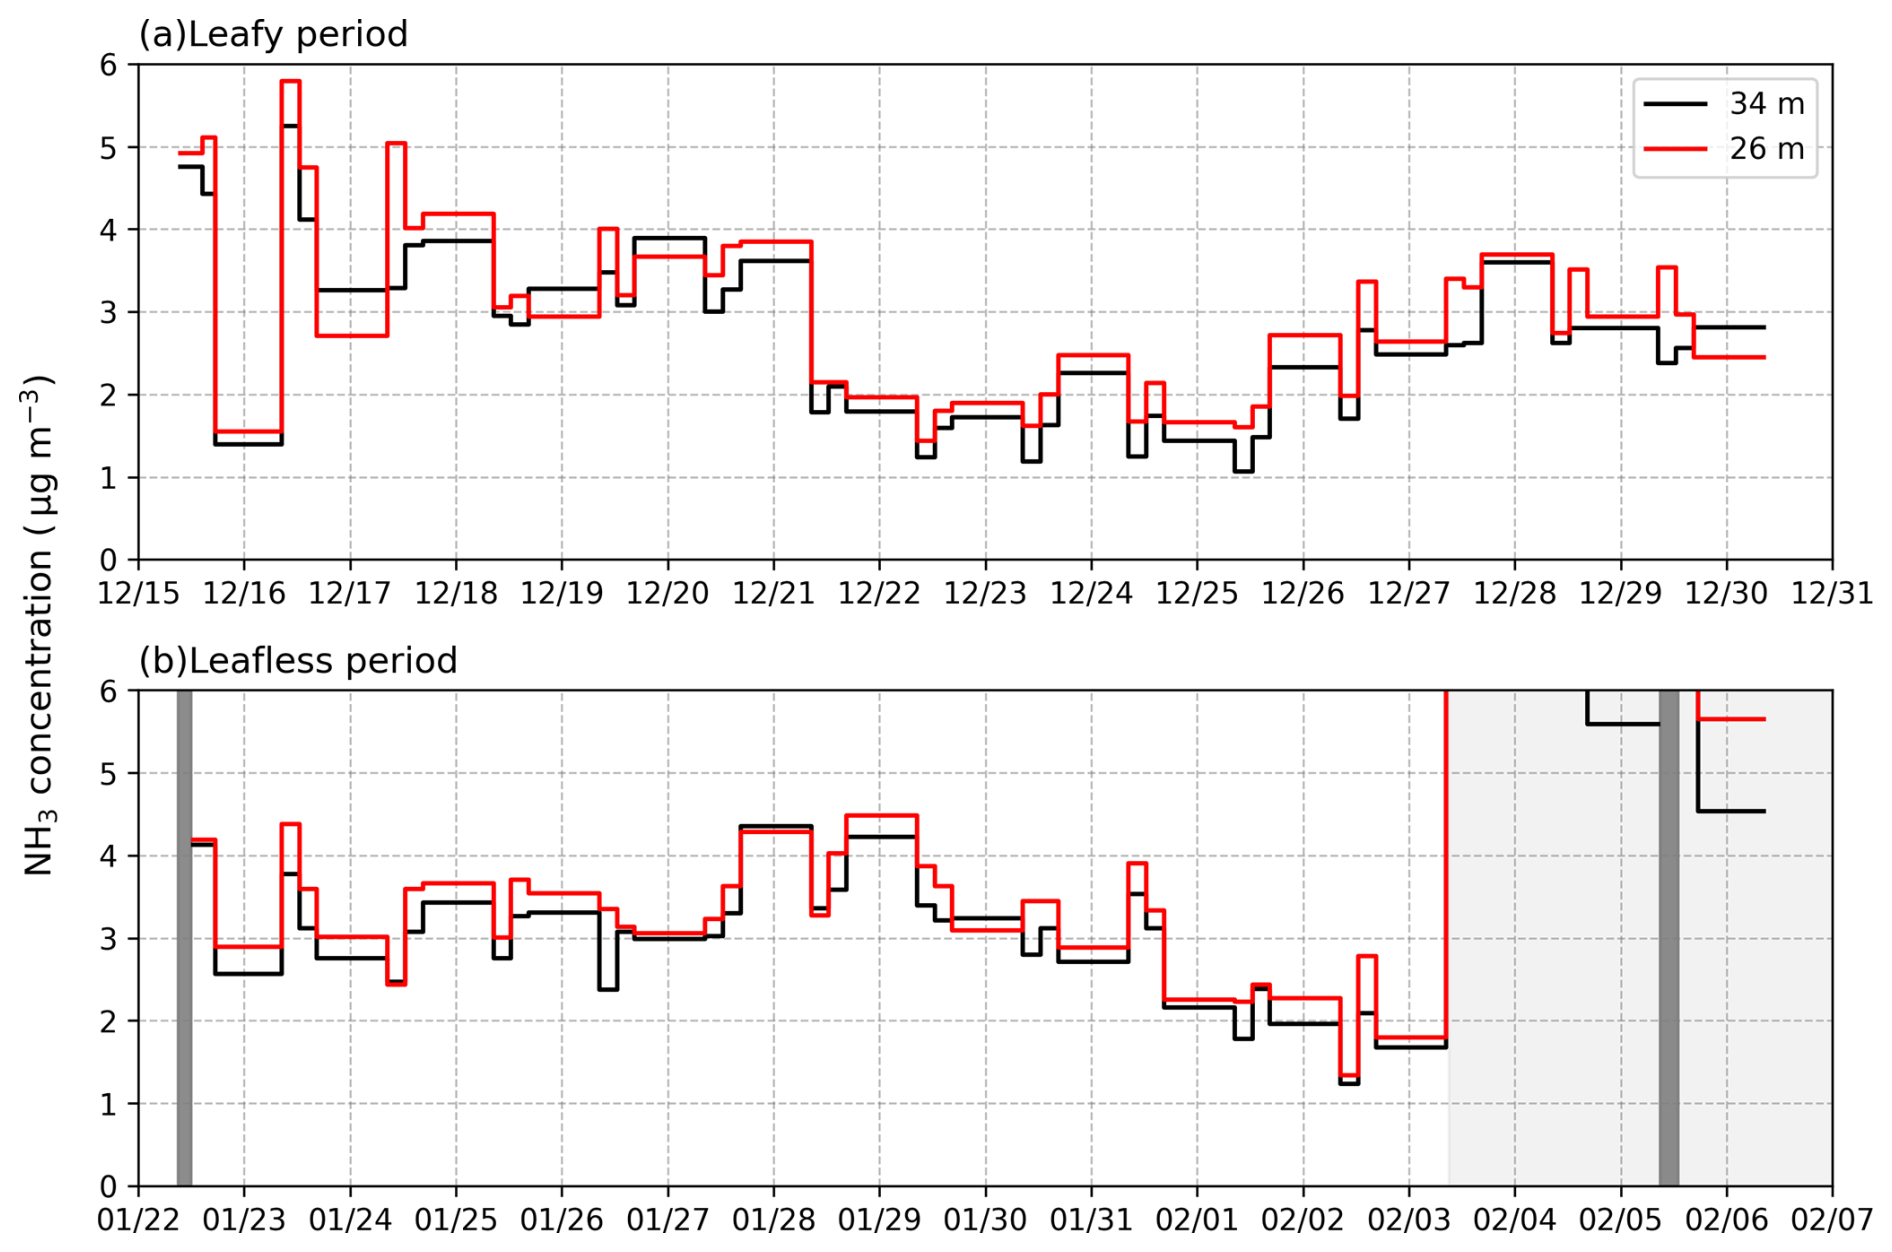
Figure 3Temporal variations in NH3 concentration at 34 m (black line) and 26 m (red line) during (a) the leafy and (b) leafless periods. The length of line indicates the duration of sampling. Gray hatches indicate missing data, and light gray hatch indicates the high concentration period during and after the forest fire around the observation tower. Data during the forest fire periods was not included in the analysis of this study. The range of concentration for the leafless period is aligned for the figure visibility.
In the leafless period, a large-scale forest fire occurred around the observation tower from the morning of 3 February. According to Ishida et al. (2023), forest fires frequently occur during the late dry season (from January to March) in the DDF of SERS. During the forest fire period, NH3 concentrations peaked at D2 on 3 February (106.81 µg m−3 at 26 m) and then drastically decreased to below 10 µg m−3 after 3 February. Because this period was far from typical conditions, we excluded the data from subsequent analysis. Data from the forest fire period will be presented in a follow-up study. Excluding samples during the forest fire, NH3 concentration at 34 m ranged from 1.24 to 4.36 µg m−3. The concentrations at 34 m did not change until the middle of the period and decreased to below 2 µg m−3 before the period of the forest fire. As in the leafy period, the concentration at 26 m showed a similar variation to that at 34 m. The weighted means and standard deviations of NH3 concentration by sampling time at 34 and 26 m were 2.96 ± 0.75 and 3.17 ± 0.75 µg m−3, respectively. The mean concentration was slightly higher at both measurement heights during the leafless period.
In both periods, the concentrations at 26 m tended to be higher than those at 34 m, particularly during the daytime. The differences in the concentration were on average 0.51 µg m−3 at D1 (from 09:00 to 13:00) and 0.41 µg m−3 at D2 (from 13:00 to 17:00) in the leafy period, and were on average 0.36 µg m−3 at D1 and 0.33 µg m−3 at D2 in the leafless period. Although the concentration variations differed between the two observation periods, a consistent tendency of higher concentrations was observed at 26 m than at 34 m during the daytime. These results suggest the possibility of daytime NH3 emissions from the DDF. However, this tendency was not pronounced at nighttime in either period, and there were also cases where the concentration at 34 m was higher than that at 26 m.
Approximately 7 km southwest of our observation site, EANET had a monitoring site at the Sakaerat Silvicultural Research Station (SRS). At the SRS, NH3 concentrations were measured at 10 d intervals using the filter-pack method from 2006 until its closure in 2020 (EANET, 2021). Although there are several missing data, which is inevitable in such long-term monitoring, the annual mean concentration of NH3 over the 5-years from 2015 to 2019 ranged from 2.5 to 4.1 µg m−3. The mean concentration obtained during the observation period was within this range, suggesting that our observations had a certain degree of reliability. In addition, the NH3 concentration levels at the SERS site were relatively high compared to those at various forest sites reported in papers published after the 2010s (Melman et al, 2025; Walker et al., 2023; Xu et al., 2023; Ramsay et al., 2020).
3.2 Factors controlling ammonia concentration
The hourly variations in the meteorological elements during the observation period are shown in Fig. 4. Like the variations in NH3 concentration, the air temperature showed a clear difference between the leafy and leafless periods. During the leafy period, the temperature followed the same trend as the NH3 concentration. It decreased towards the middle of the period, and then increased again. In the leafless period, there was a gradual increase in temperature after 24 January. The ranges and means with standard deviations of temperatures at 34 m were from 12.6 to 32.2 °C and 22.7 ± 4.2 °C in the leafy period, and were from 16.5 to 35.5 °C and 25.6 ± 3.9 °C in the leafless period, respectively. There was no obvious variation in the relative humidity. The ranges and means with standard deviations of relative humidity at 34 m were from 40.2 % to 90 % and 63.7 ± 12.4 % in the leafy period, and were from 31.3 % to 87.5 % and 61.0 ± 12.7 % in the leafless period, respectively. The wind speed showed an inverse variation with temperature in the leafy period and showed an increase at the end of the leafless period. The ranges and means with standard deviations of wind speed at 31.5 m were from 0.4 to 5.2 m s−1 and 2.5 ± 0.9 m s−1 in the leafy period, and were from 0.5 to 5.5 m s−1 and 2.4 ± 0.9 m s−1 in the leafless period, respectively. During the leafy period, the main wind direction was northeasterly, with intermittent southwesterly winds occurring at nighttime. On the other hand, during the leafless period, the daytime wind direction shifted from northeasterly to southwesterly from 1 February. At nighttime, wind direction was mainly southwesterly except for 4 d between the beginning and middle of this period. The windrose during the observation period is shown in Fig. A1. Generally, the prevailing wind in Thailand during the dry season is known to be northeasterly due to the northeast monsoon from China and Mongolia (Aman et al., 2025). In addition, this northeast monsoon typically transits to the southwest monsoon from mid-February until the late May (Amnuaylojaroen et al., 2020). The shift in main wind direction at SERS during the leafless period was possibly associated with this seasonal transition in monsoon. Solar radiation showed similar variations and cumulative values between the leafy and leafless periods. On most days, solar radiation peaked around noon and reached approximately 700 W m−2. The differences in the variations in temperature, wind speed and wind direction were thought to be related to the differences in the concentration variations between the leafy and leafless periods. Statistical summary of meteorological conditions is shown in Table A1.
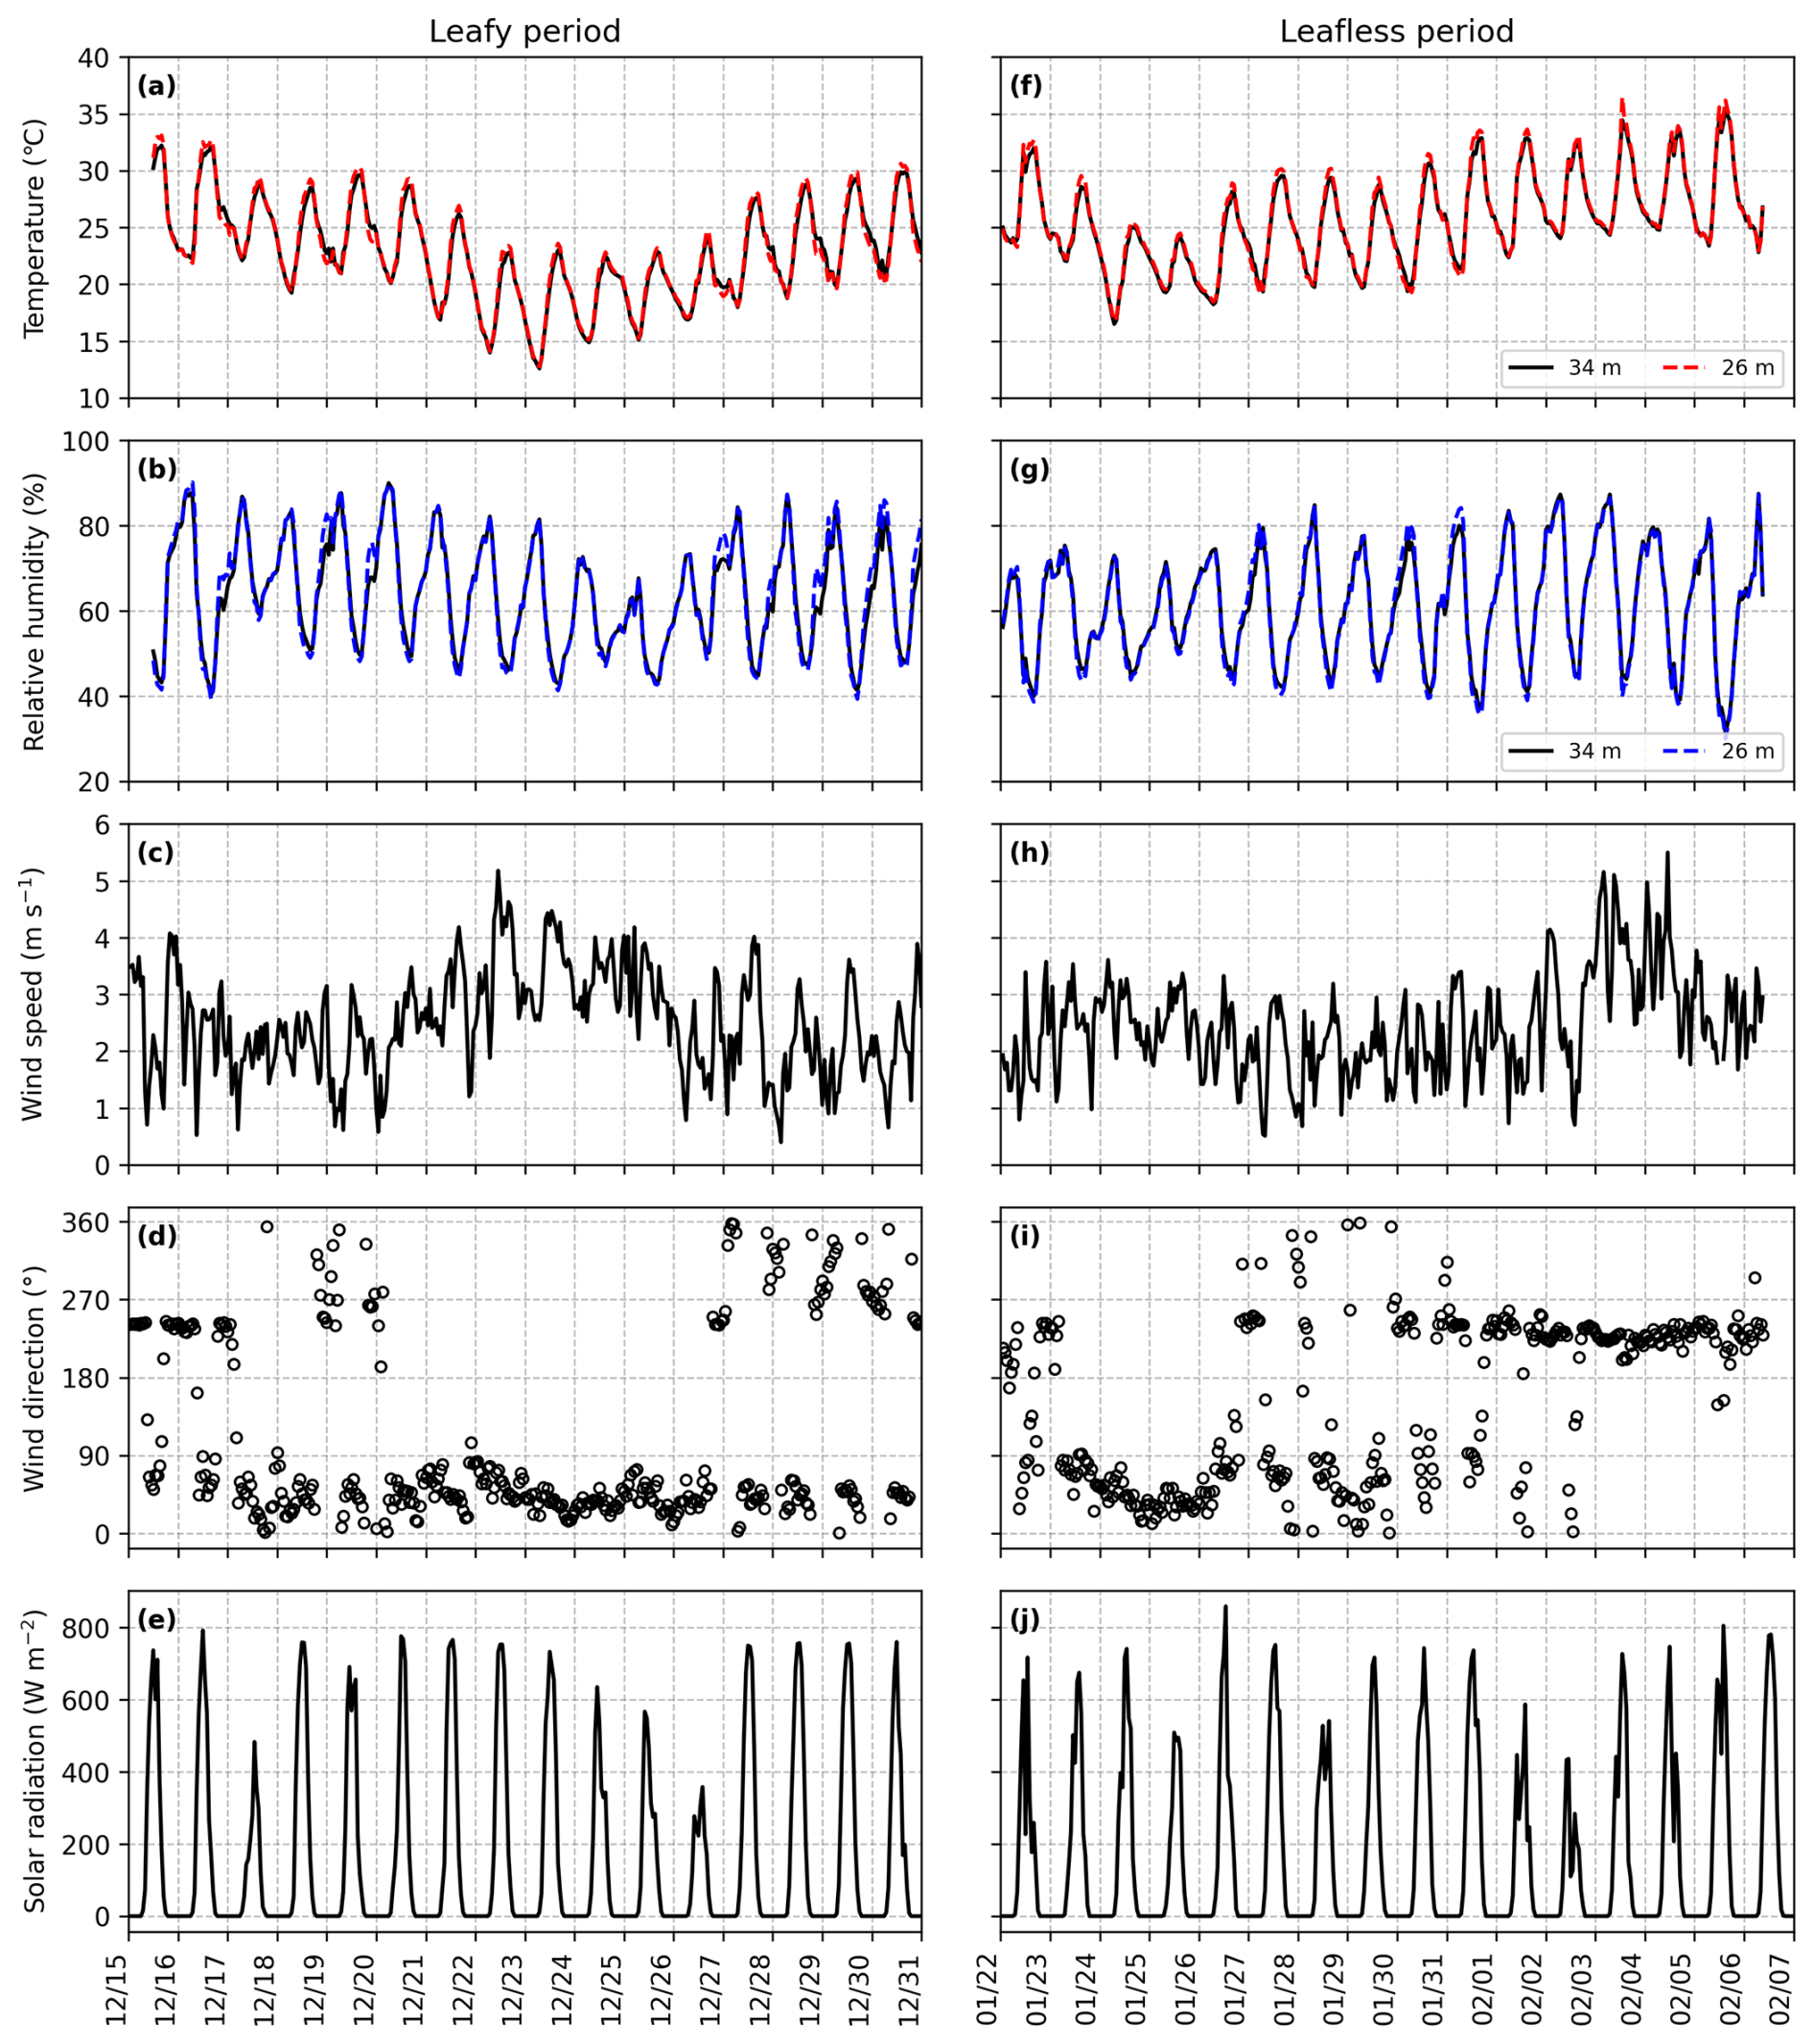
Figure 4Hourly variations in air temperature, relative humidity, wind speed, wind direction, and solar radiation during the leafy (a–e) and laeafless (f–j) periods. Air temperature and relative humidity were recorded at 34 m (solid line) and 26 m (dashed line), wind speed and wind direction were recorded at 31.5 m of the observation tower, and radiation was recorded above the ground, respectively.
The relationships between the NH3 concentration and air temperature, relative humidity, and wind speed during the leafy period are shown in Fig. 5. The relationships between the concentrations at 34 and 26 m and meteorological elements were roughly the same. NH3 concentrations showed significant strong positive correlations with temperature during the D1 and D2; the correlation coefficients at 34 m were 0.97 and 0.89, respectively. In the 1-year vertical profile measurements at a Japanese deciduous forest using the denuder method, Xu et al. (2024) revealed that NH3 concentrations near the forest floor showed strong positive correlations with temperature on a weekly basis during the leafy period (LAI = 2.3–4.1). Osada (2020) measured hourly NH3 concentrations using a semi-continuous microflow analytical system in a Japanese urban area and found that daily NH3 concentrations have a strong relationship with the magnitude of temperature and may be affected by different processes during the daytime and nighttime. Our observations revealed that daytime NH3 concentrations were strongly controlled by temperature in the tropical DDF of Thailand, even at the shorter timescale of 4 h. Furthermore, the weaker correlation at nighttime (R = 0.60 at 34 m and R = 0.44 at 26 m) also indicates that the process controlling concentrations might change between daytime and nighttime. NH3 concentrations also showed significant negative correlations with wind speed during each sampling time; the correlation coefficients at 34 m were −0.75 (D1), −0.73 (D2), and −0.76 (N), respectively. This means that NH3 over the forest was dispersed when the wind speed was high and remained when the wind speed was low. While relative humidity ranged widely from 40 % to 80 %, no conspicuous correlation was found with NH3 concentration, suggesting that it was not the main factor controlling NH3 concentration in the DDF.
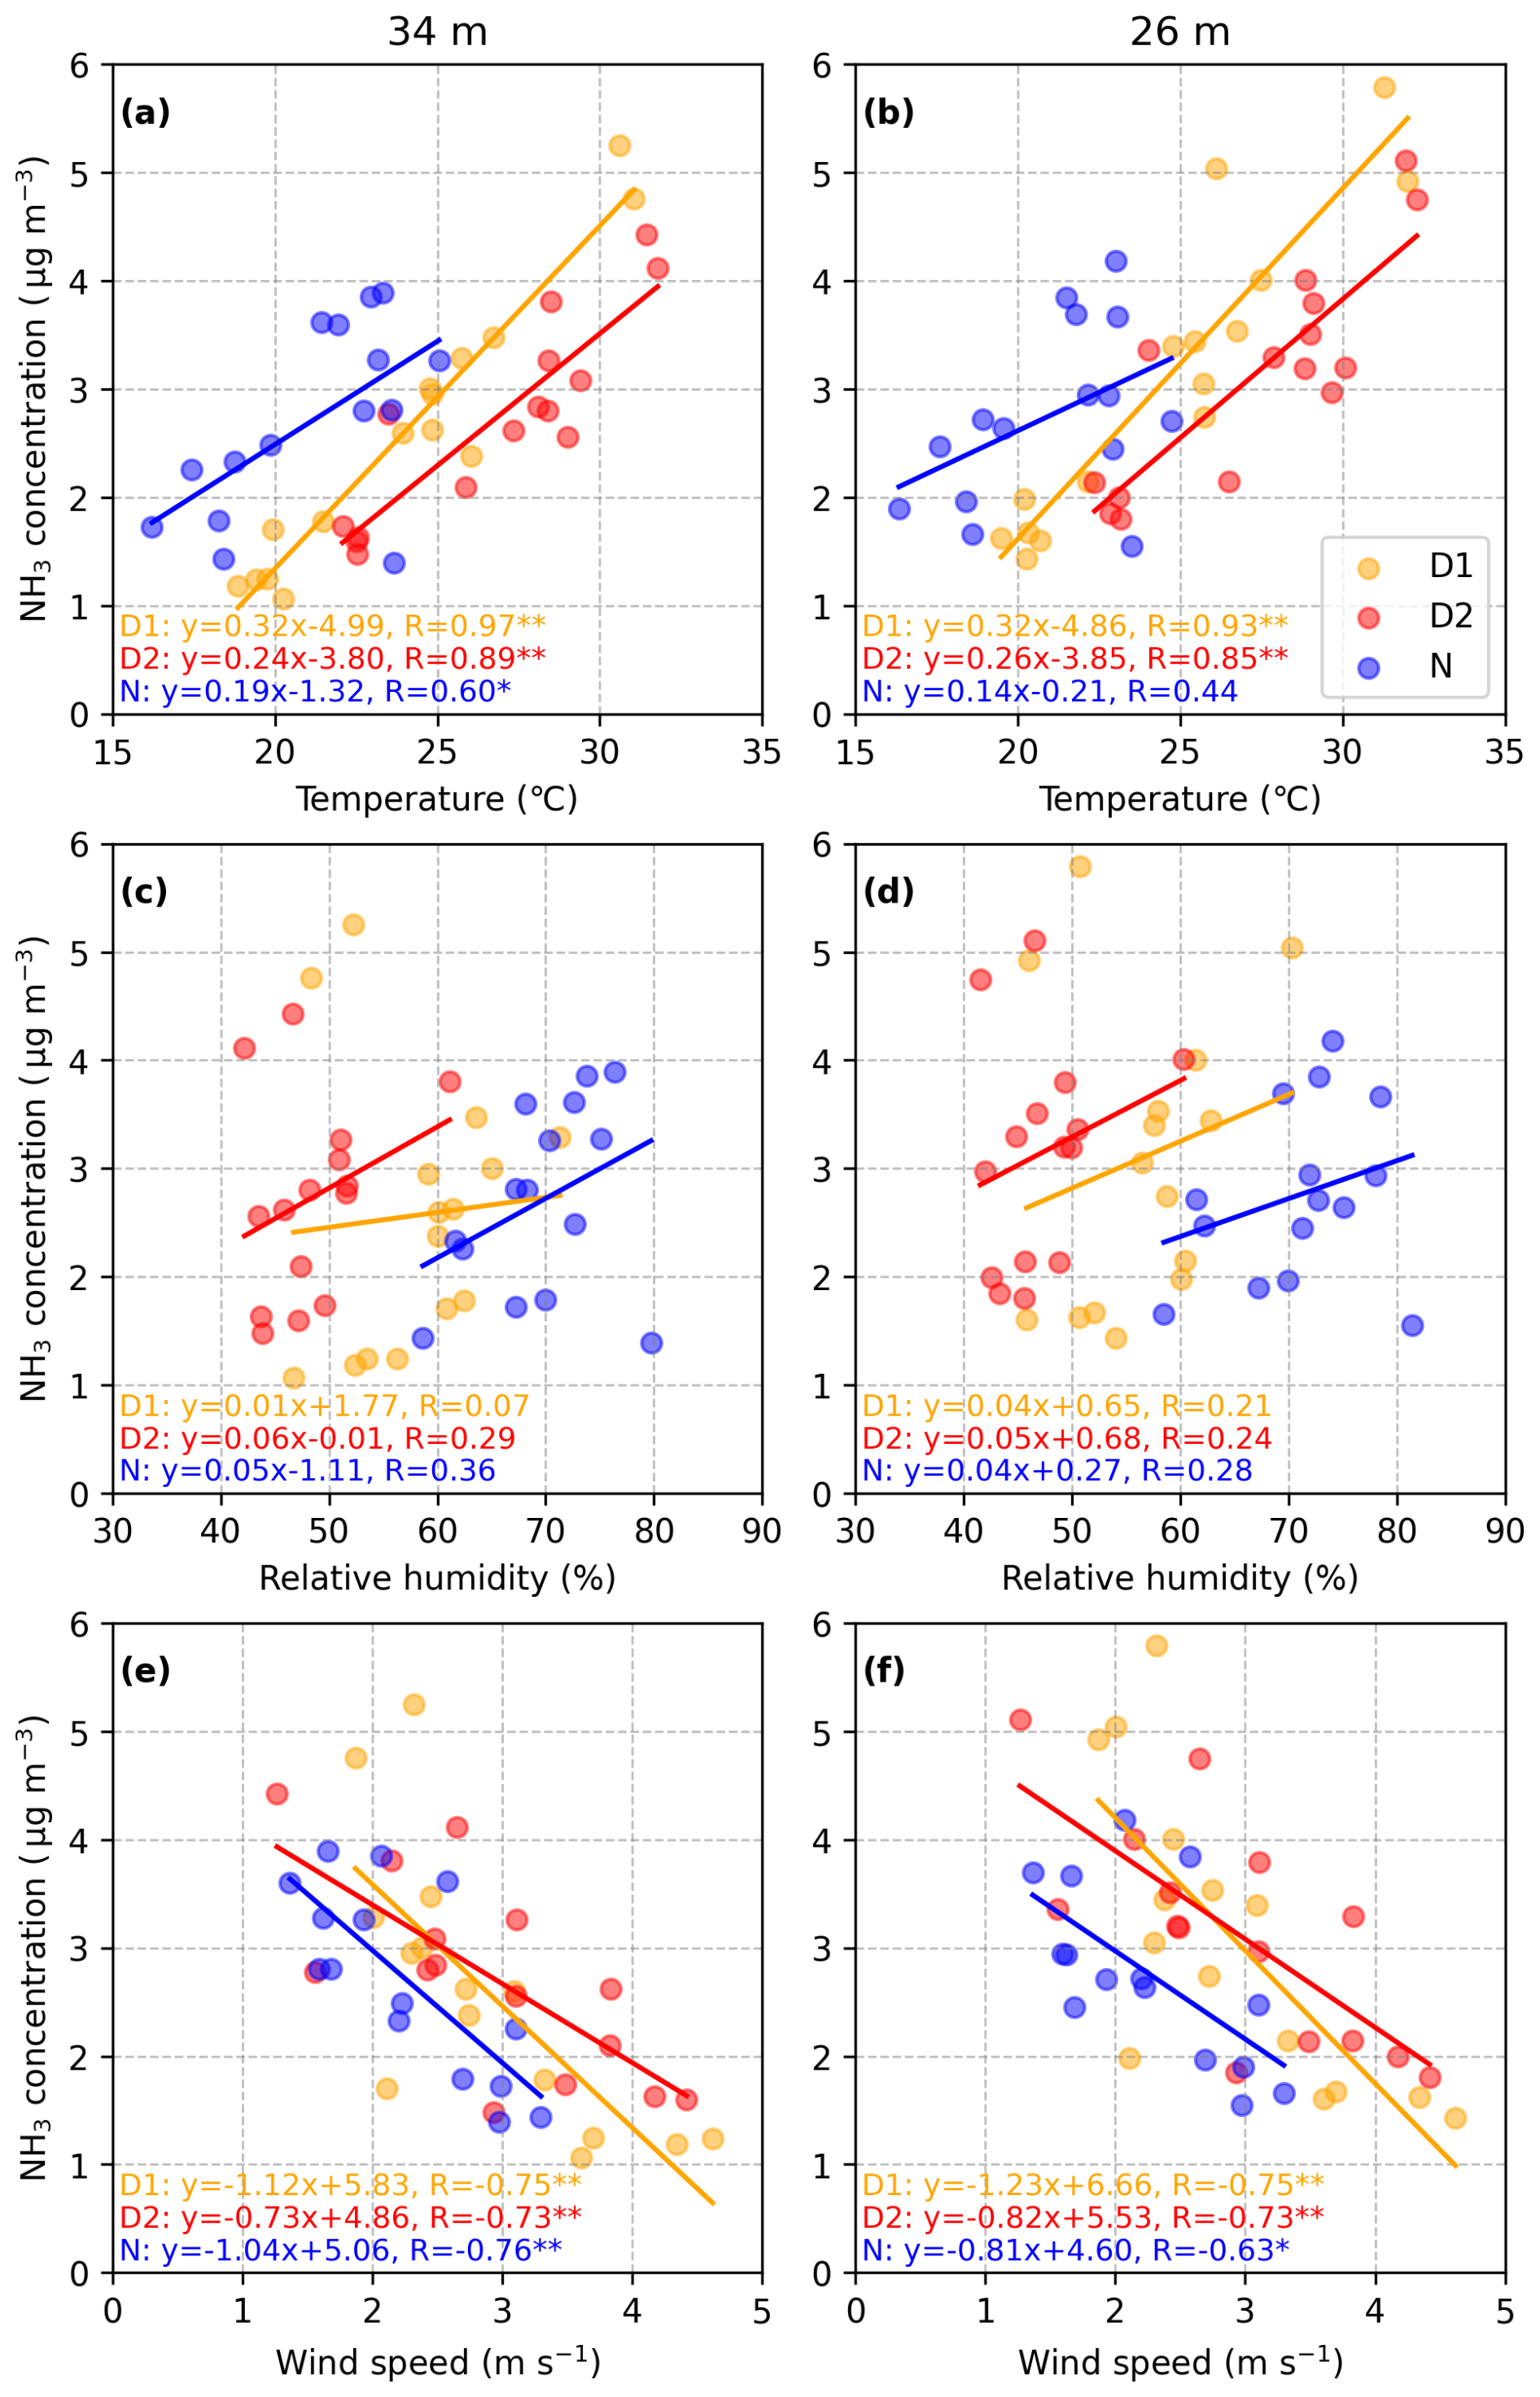
Figure 5Relationship between NH3 concentration at each height (34 m: (a), (c), (e); 26 m: (b), (d), (f)) and air temperature, relative humidity, and wind speed during the leafy period. ∗ and indicate significance levels of p < 0.05 and p < 0.01, respectively. 10 min values of meteorological elements were averaged over the sampling time of concentration measurement.
On the other hand, there was no clear correlation between the concentrations at 34 and 26 m and the meteorological elements during each sampling time in the leafless period (Fig. 6), as can be seen in the leafy period (Fig. 5). Surprisingly, there seemed to be an opposite relationship, indicating that the concentration decreases with an increase in temperature at nighttime. This was possibly due to the change in wind direction (from northeast to southwest) in the leafless period, as mentioned above. The transition in monsoon from northeast to southwest typically induces higher temperature throughout Thailand, particularly in the northern and northeastern regions. During this period, the southwesterly wind might have brought a different air mass with low NH3 concentrations. The combination of increase in air temperature and low NH3 concentration at the end of the leafless period led to the negative correlations. In fact, the opposite relationship disappeared after excluding data from 1 February onward, and concentrations at 34 and 26 m showed a positive correlation with temperature during D1 (R = 0.57, 0.59). Moreover, the opposite nighttime relationship, which showed a decrease in concentration associated with increases in temperature and relative humidity, was less noticeable.
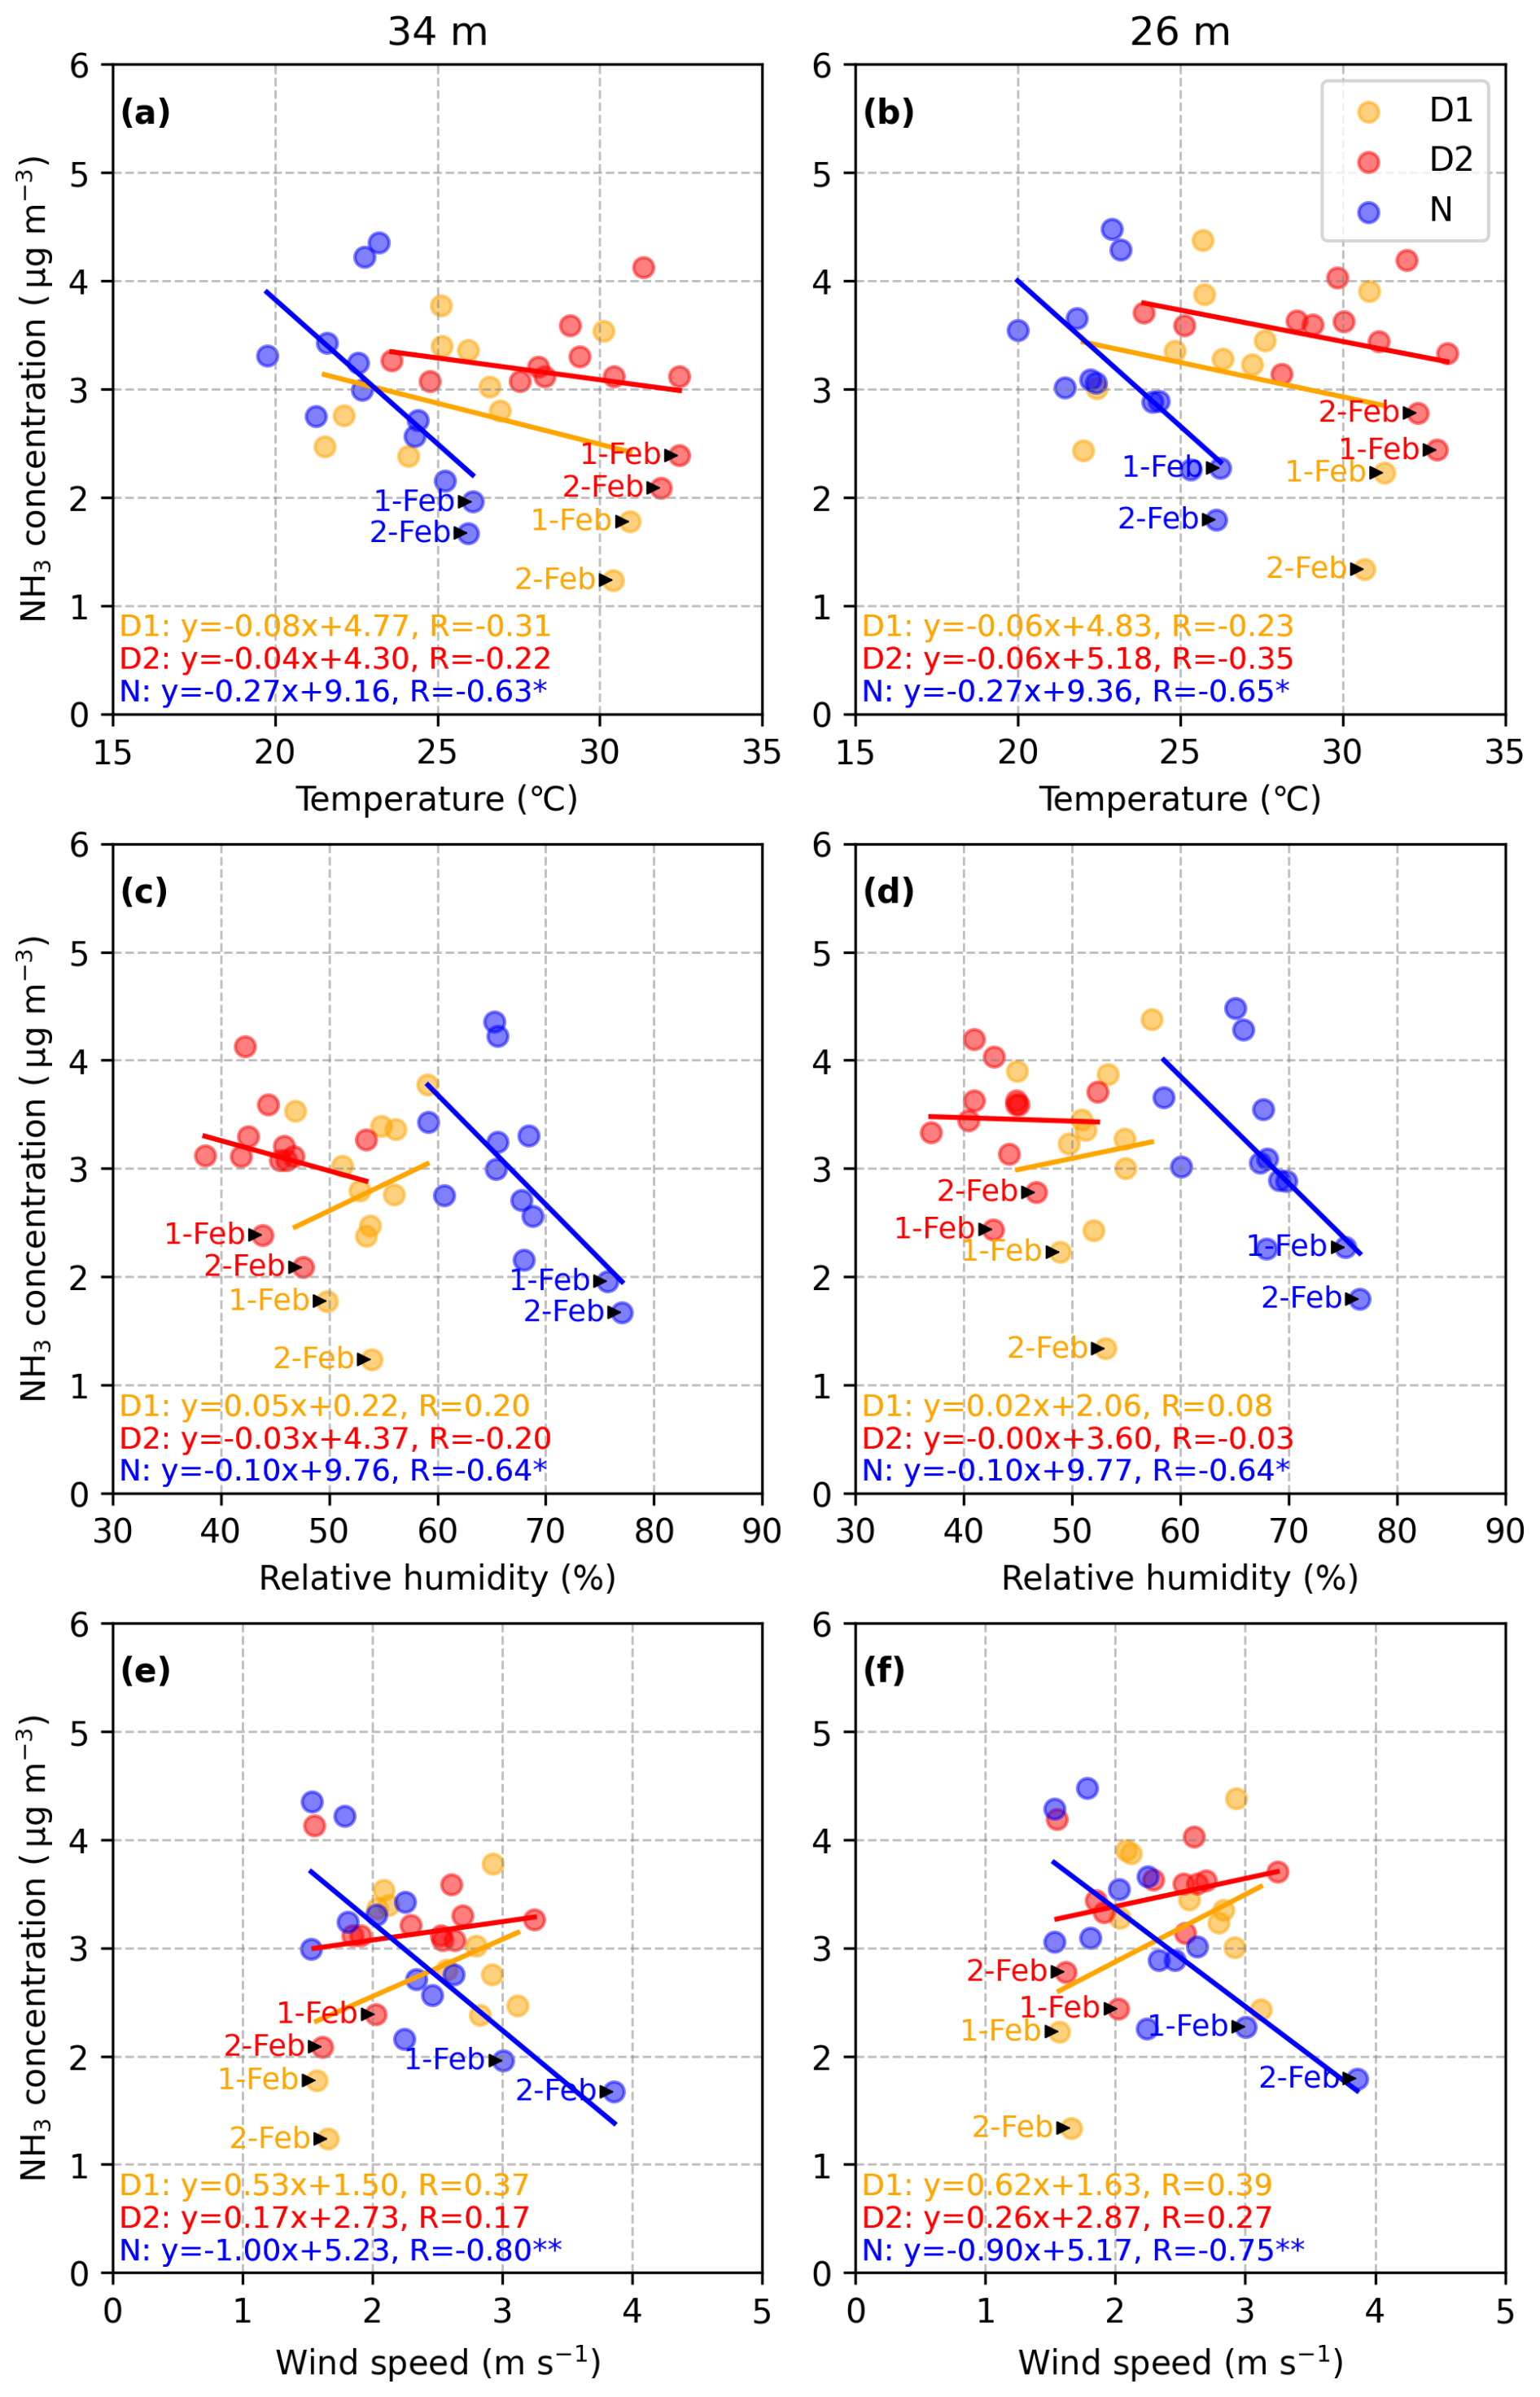
Figure 6Relationship between NH3 concentration at each height (34 m: (a), (c), (e); 26 m: (b), (d), (f)) and air temperature, relative humidity, and wind speed during the leafless period. ∗ and indicate significance levels of p < 0.05 and p < 0.01, respectively.
In addition to the change in wind direction, leaf fall occurred in the DDF of SERS from the end of the leafy period to the end of the leafless period (Fig. 1). The satellite-derived LAI at the observation tower is shown in Fig. A2. The satellite-derived LAI was approximately 3 at the beginning of the leafy period, which is close to the observed mean value by a plant canopy analyzer around the observation tower. The LAI was halved just before the beginning of the leafless period and was less than 1 at the end of the campaign. In addition, as can be seen from satellite images (Fig. A3) taken during the observation period, defoliation progressed not only around the tower but also throughout the entire DDF of SERS in approximately 20 d from 1 to 21 January 2024. Considering that the concentrations at 34 m in the leafy period had correlations with air temperature (R = 0.70) and wind speed (R = −0.69) in total, the concentrations in the leafless period were probably governed by different processes. These processes may have been driven by structural changes in the forest due to substantial leaf fall, rather than by changes in meteorological conditions alone. Similarly, Xu et al. (2024) found that the strong correlation between NH3 concentration and temperature observed during the leafy period was no longer observed during the leafless period (LAI < 1.5), also suggesting that concentration may be controlled by factors other than temperature during the leafless period.
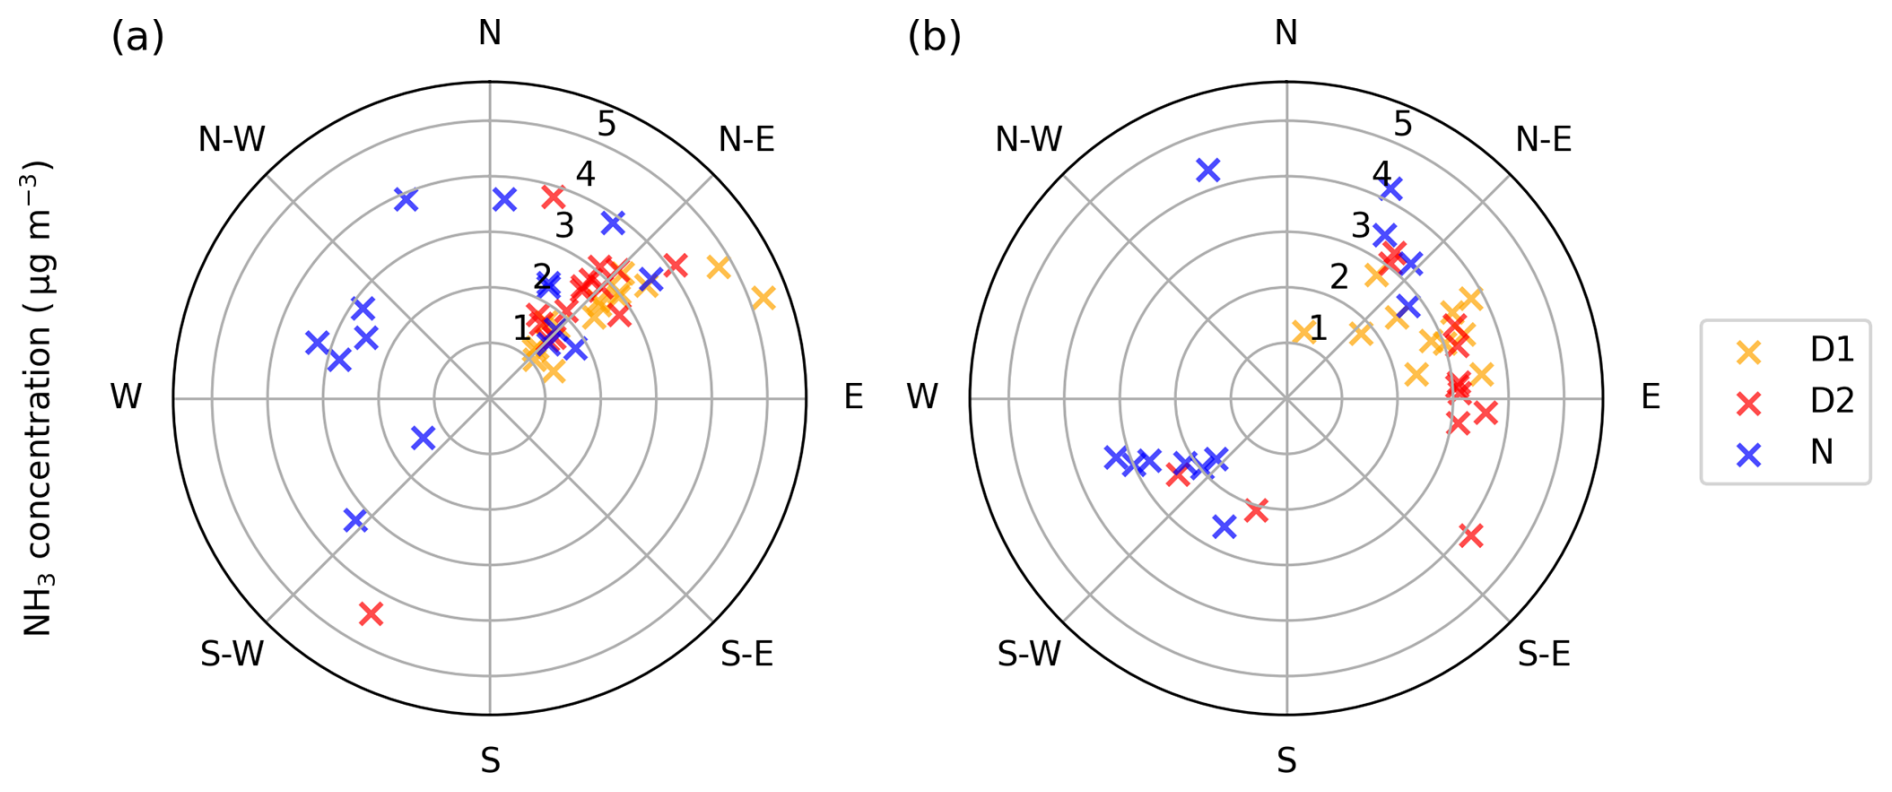
Figure 7The distribution of NH3 concentration at 34 m relative to the main wind direction at each sampling time during the leafy (a) and leafless (b) periods.
The distribution of NH3 concentration relative to the main wind direction at each sampling time is shown in Fig. 7. Because the eastern side of the SERS is mainly covered by agricultural fields and residential areas (Fig. 1), there were concerns about the potential influence of anthropogenic sources on the variation in NH3 concentration. Although the number of samples with wind directions other than east was limited, there was no noticeable difference in concentration levels compared to samples with an easterly wind. It is likely that there was little influence from anthropogenic sources because NH3 concentrations were not particularly high when the main wind direction was from the east, regardless of the observation period. Moreover, the fact that NH3 concentrations at 26 m were often higher than those at 34 m further supports the idea that variations in NH3 concentrations were not influenced by the presence of agricultural fields or residential areas.
In this study, we mainly focused on the relationship between NH3 concentrations and near-surface meteorological elements and canopy conditions. In addition to these factors, Schulte et al. (2021) demonstrated that larger-scale processes, such as boundary layer dynamics and advection, can also influence the diurnal variation in NH3 concentrations in a grassland. Future studies focused on such processes at SERS would be valuable for further understanding the dynamics of NH3 concentration under tropical climate.
3.3 Ammonia fluxes and sources in the tropical dry deciduous forest
Prior to flux determination, we examined the diurnal variation in transfer velocity and its relationship with meteorological factors (Fig. 8). Focusing on diurnal variations, the transfer velocity tended to increase from 08:00, peak around noon, and then decrease after 17:00, regardless of the observation period. Our daytime sampling fell within this time window and successfully captured large daytime turbulence. Although the transfer velocity at nighttime was notably lower than that during the daytime, it remained above approximately 0.10 m s−1. The transfer velocity increased curvilinearly with increasing kinematic heat flux and u∗, regardless of the observation period. The kinematic heat flux tended to be larger in the leafless period, whereas the level of u∗ was almost the same, suggesting that the difference in the magnitude of the transfer velocity between each observation period was due to the difference in the kinematic heat flux, which is a parameter characterizing the turbulent transport of heat.
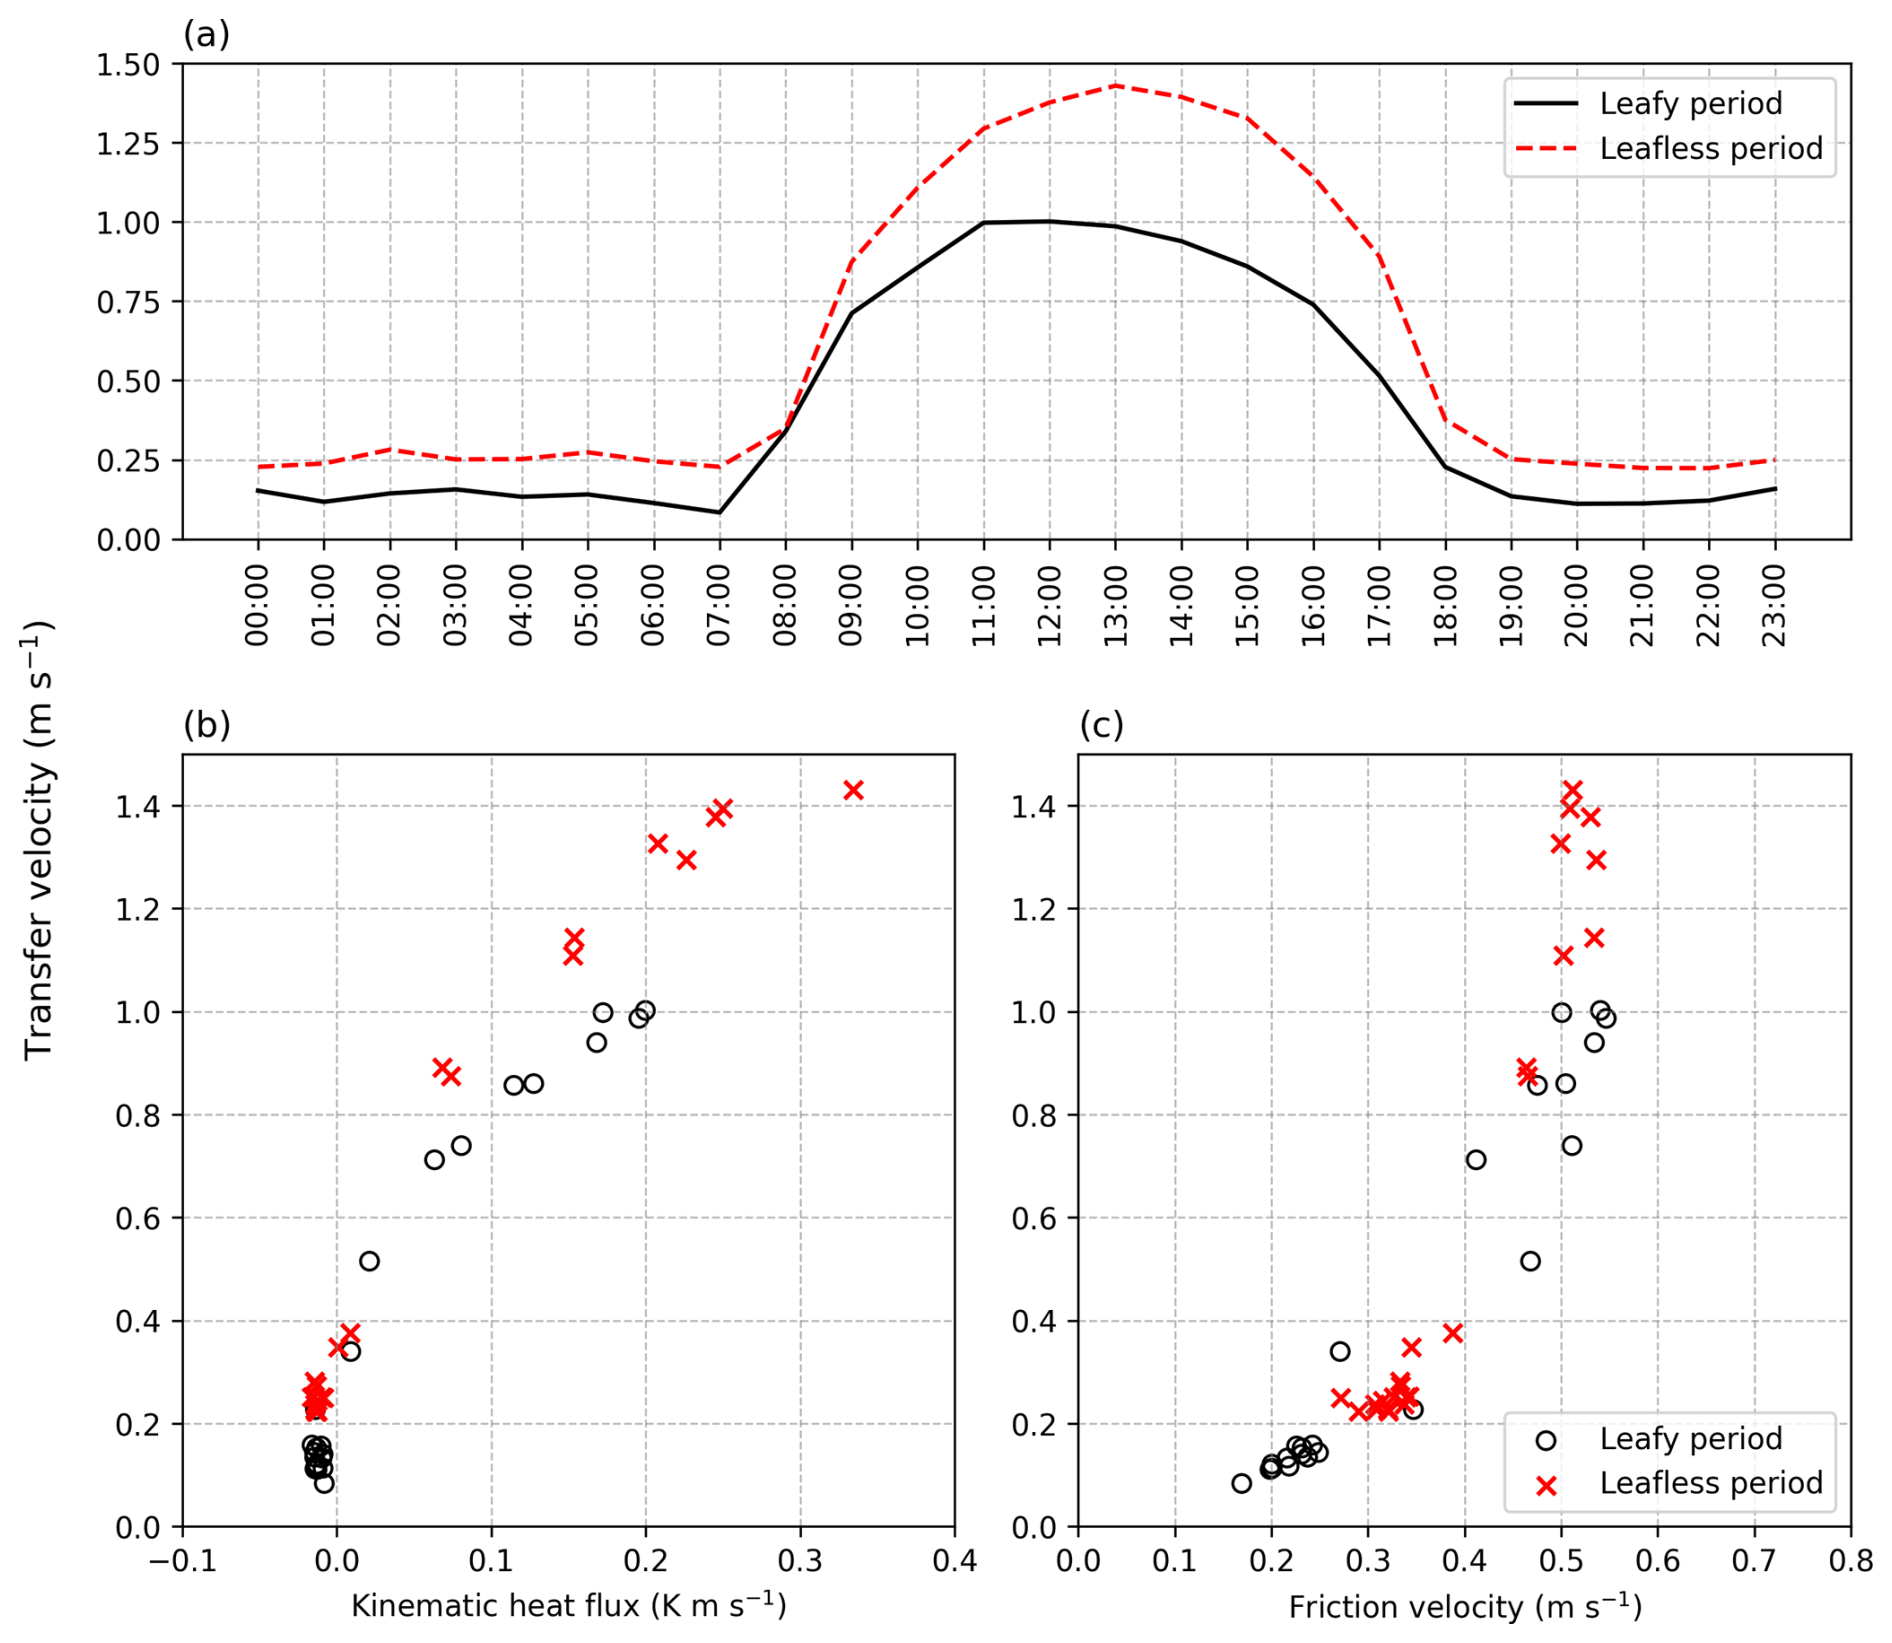
Figure 8Diurnal variation in the transfer velocity (a) and the relationship between transfer velocity with kinematic heat flux (b) and friction velocity (c) during the leafy (solid line and circles) and leafless (dashed line and crosses) periods. The 1 h ensemble mean values for each observation period are shown.
For flux determination, it is crucial to obtain accurate ΔC, because it determines the direction and magnitude of fluxes, while transfer velocity only determines the magnitude. The transfer velocity was calculated using meteorological elements such as u∗, which exhibit general diurnal and seasonal variations (e.g. higher during the daytime due to enhanced turbulence, and lower at nighttime due to stable condition). On the other hand, ΔC is calculated from the concentrations that are determined at multiple heights by multiple processes (i.g. installation of air sampler, collection of the sample, pre-processing for analysis, analysis using ion chromatograph). Therefore, we performed a paired t-test on the obtained concentrations at 34 and 26 m to confirm whether a consistent concentration gradient exists between the two heights, because NH3 concentrations are not only subject to uncertainties in measurement but also strongly influenced by site-specific environmental and meteorological conditions. As a result, ΔC was significant (p < 0.01) for the whole observation period, as well as for the leafy and leafless periods. For the whole observation period, ΔC was also significant for D1 (p < 0.01), D2 (p < 0.01), and N (p < 0.05) samples. Although the paired t-test does not directly evaluate the uncertainty of each sample, it supports that significant vertical gradients existed between the two heights above the DDF. For each sample, we estimated the random error of ΔC by propagating the analytical error of the ion chromatograph and the standard error of travel blank, which were used to calculate concentrations. As a result, the random error of ΔC was estimated in the range from 0.05 to 0.26 µg m−3. Approximately 83 % of the samples (n = 66/80) had ΔC exceeded the random errors. There was no bias in the random error of ΔC between the leafy and leafless periods.
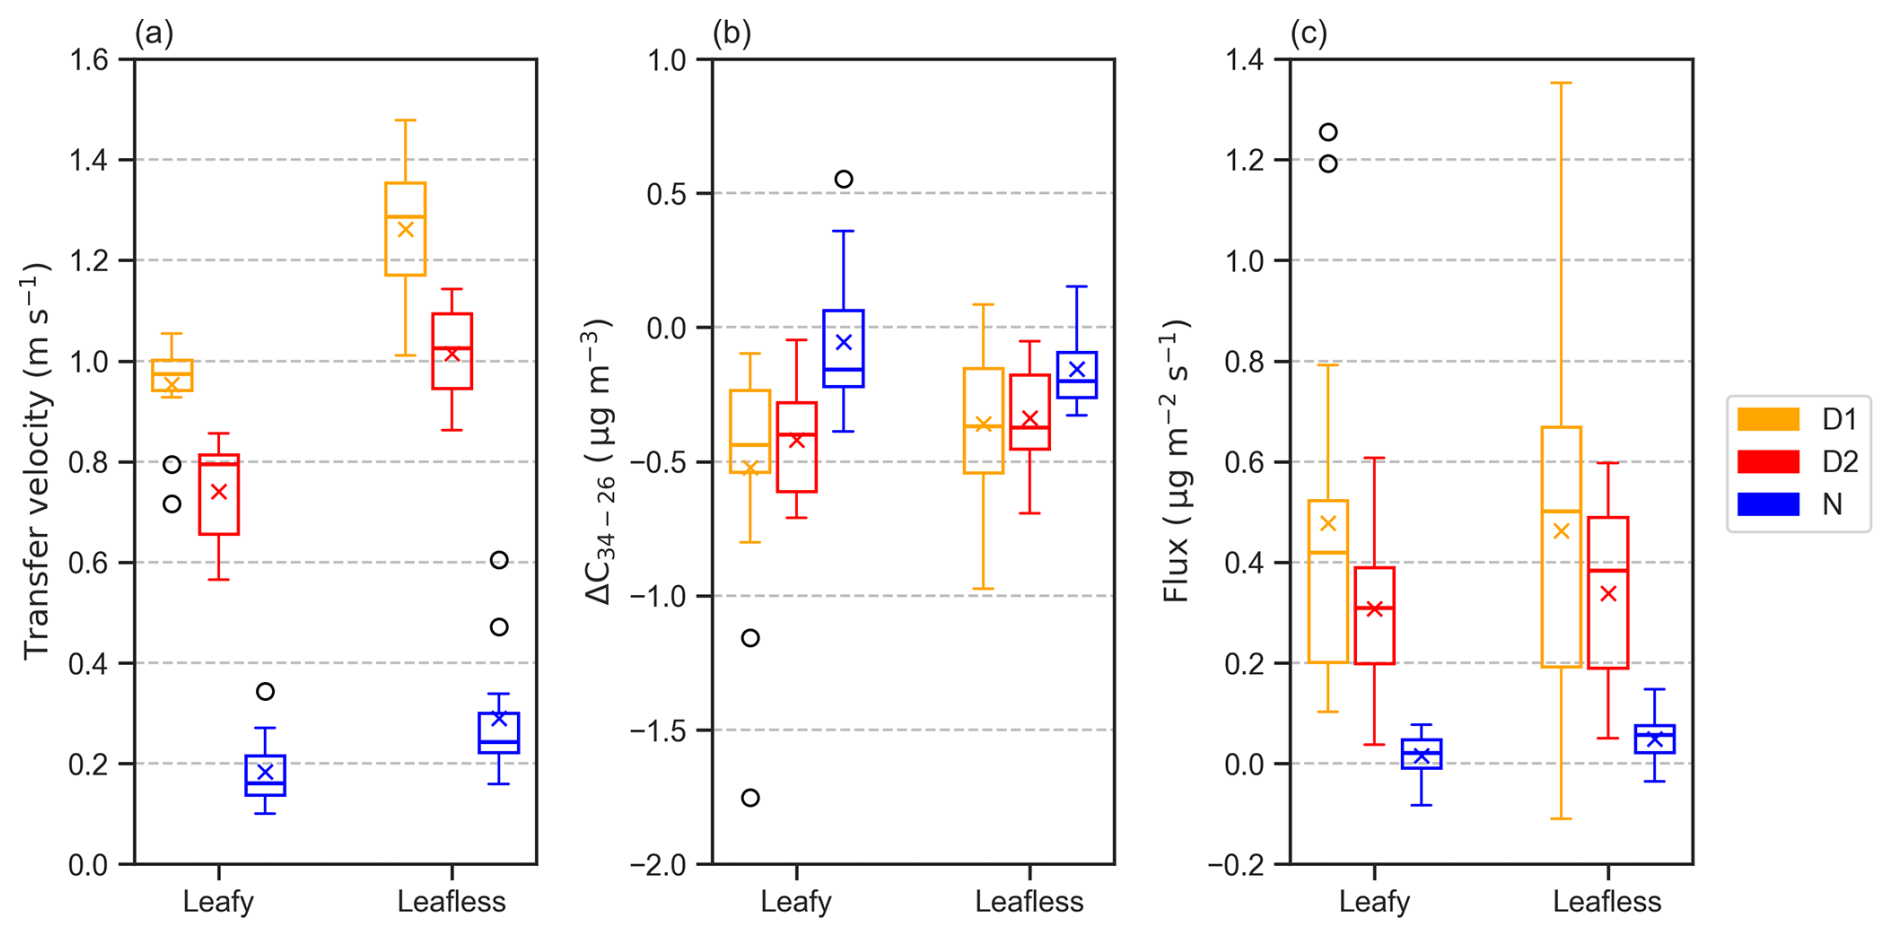
Figure 9Distribution of transfer velocity (a), NH3 concentration difference between 34 and 26 m (b), and NH3 flux (c) at each sampling time during the leafy and leafless periods. Positive value of flux indicates emission and negative value indicate deposition. The range of boxes represent the interquartile range (IQR), with the median indicated by middle lines. Whiskers extend to 1.5 times IQR. Crosses indicate the mean values, and circles indicate samples exceeded 1.5 times IQR for each sampling time.
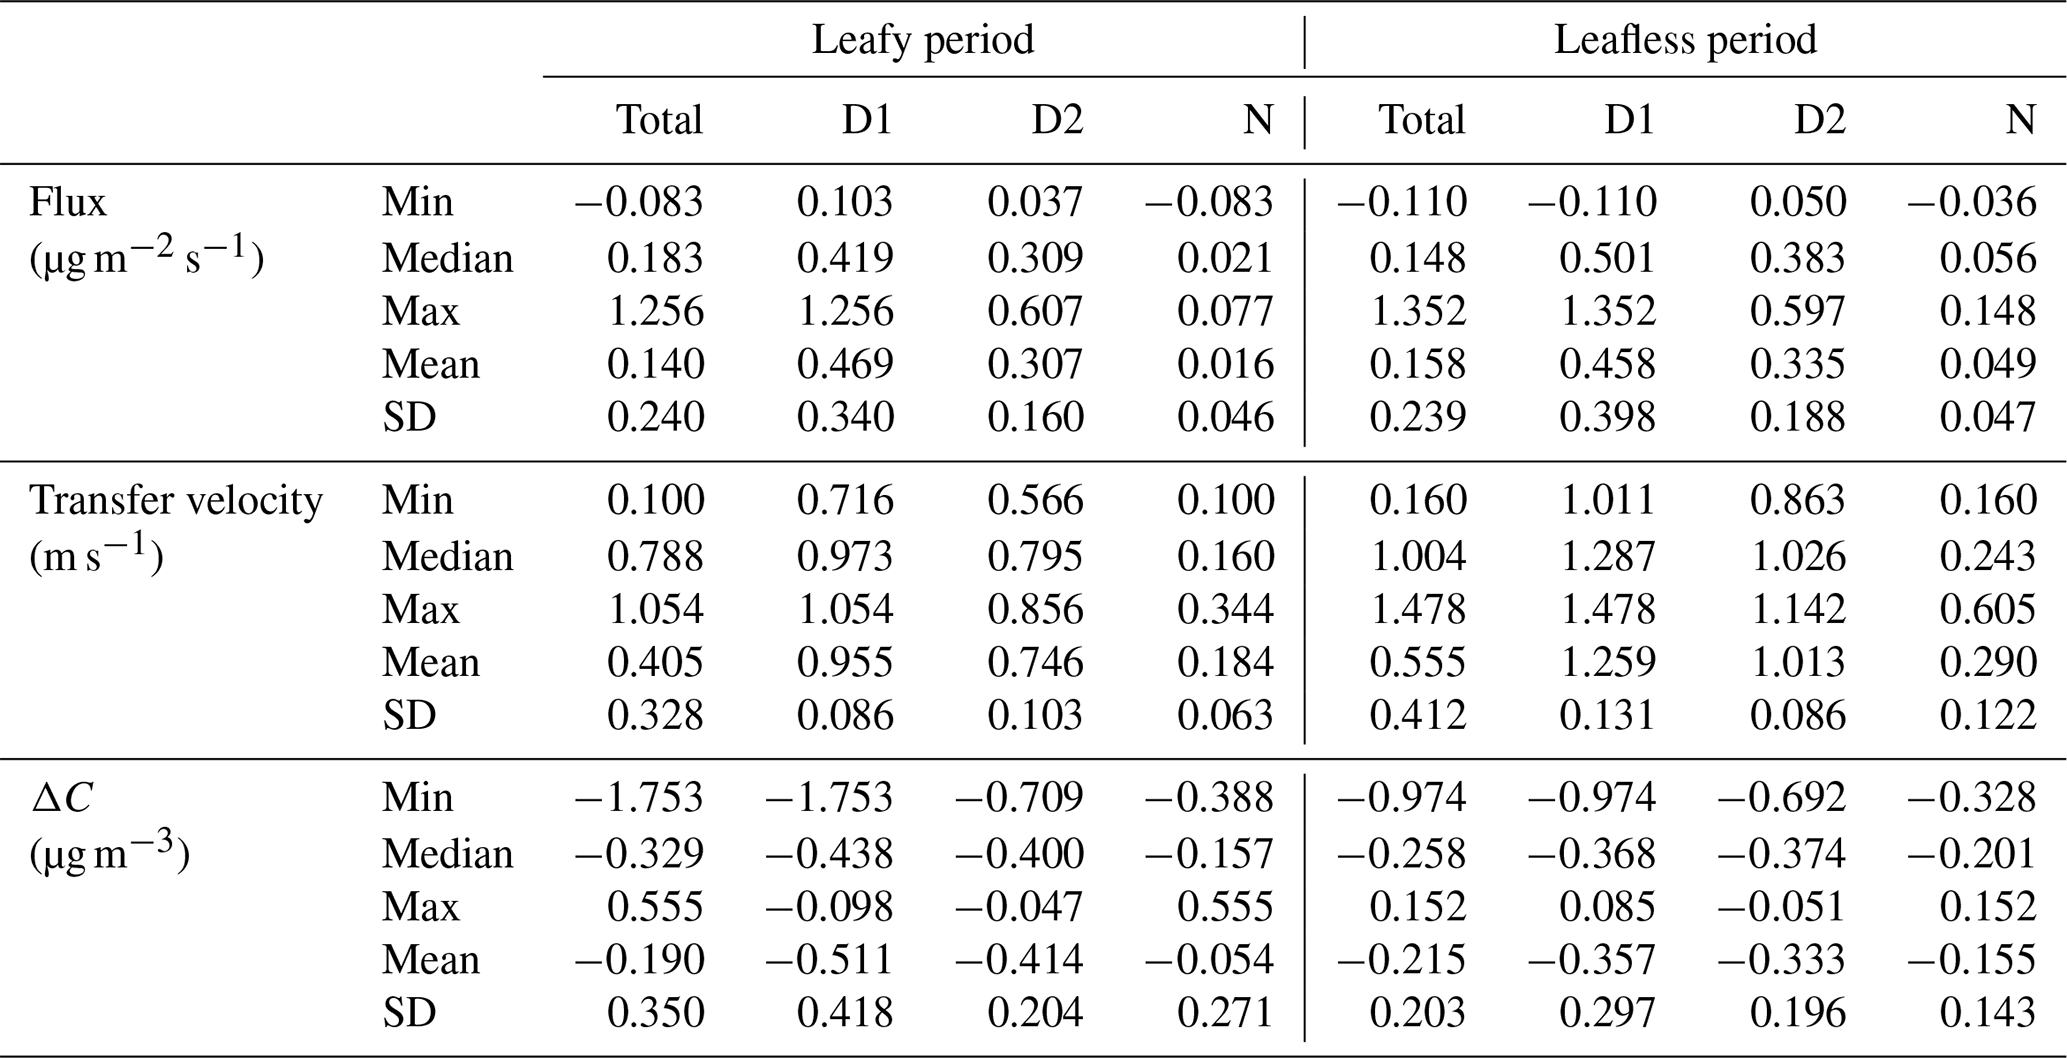
Figure 9 shows the distribution of transfer velocity, ΔC, and NH3 flux at each sampling time during the leafy and leafless periods. The mean and median values for each item during the daytime and nighttime were almost the same. Transfer velocity was in the range from 0.10 to 1.48 m s−1, and tended to be higher during the daytime and in the leafless period. The weighted means and standard deviations of transfer velocity by sampling time were 0.40 ± 0.33 and 0.56 ± 0.41 m s−1 during the leafy and leafless periods, respectively. The weighted mean value of the transfer velocity during D1 was approximately four times higher than that during N. ΔC was in the range from −1.75 to 0.56 µg m−3, and there was little difference between observation periods except for some variations during the leafy period. The weighted means and standard deviations of ΔC by sampling time were −0.19 ± 0.35 and −0.21 ± 0.20 µg m−3 during the leafy and leafless periods, respectively. In contrast to the little difference between leafy and leafless periods, ΔC showed a large diurnal variation. Although the difference was smaller compared to that of transfer velocity, the absolute values of mean and median ΔC at daytime were larger than those at nighttime. Flux was in the range from −0.110 to 1.352 µg m−2 s−1, and the absolute values had a clear trend to be larger at daytime reflecting the characteristics of transfer velocity and ΔC. However, no clear difference was observed between the two periods as the transfer velocity. The weighted means and standard deviations of flux by sampling time were 0.140 ± 0.240 and 0.158 ± 0.239 µg m−2 s−1 during the leafy and leafless periods, respectively. As described in Sect. 3.2, there were significant changes in some meteorological elements and canopy conditions between the leafy and leafless periods. However, regardless of the observation period, NH3 showed consistent pattern of air-forest exchange, with large emissions at the daytime, and small emissions and depositions at nighttime. The weighted mean and standard deviation of NH3 flux for the entire observation period was 0.148 ± 0.240 µg m−2 s−1, indicating that the tropical DDF of SERS acted as a source of NH3 during the dry season. Statistical summary of transfer velocity, ΔC, and NH3 flux is shown in Table A2.
Compared to the fluxes shown in recent studies over forest sites, those obtained in this study fell within these ranges, but the mean values were the largest. NH3 fluxes over a Brazilian Amazon forest measured by Ramsay et al. (2020) using AGM ranged from −30.2 to 9.5 ng m−2 s−1 with mean and standard deviation of 2.83 ± 0.94 ng m−2 s−1. Xu et al. (2023) measured NH3 fluxes using AGM over a Japanese deciduous forest, and fluxes ranged from −0.256 to 0.335 µg m−2 s−1 with mean and standard deviation of 0.057 ± 0.120 µg m−2 s−1 during summer. More recently, Melman et al. (2025) measured NH3 flux also using AGM over a Dutch coniferous forest, and showed range from −1.9 to 1.4 µg m−2 s−1 with mean of −0.050 µg m−2 s−1. However, it should be noted that the measurement devices, errors, seasons, times, NH3 concentrations, meteorological conditions, and statistical methods used in these studies were substantially different, and a direct comparison is only a rough guide. Therefore, we investigated the characteristics of seasonal and diurnal variations in NH3 fluxes. 1-month of hourly measurements by Ramsay et al. (2020) indicated NH3 emissions were likely to occur in the afternoon (from 14:00 to 16:00). Xu et al. (2023) showed seasonal and diurnal differences in fluxes, with the largest emissions occurring during the summer and daytime (from 08:00 to 17:00). 2-year measurements by Melman et al. (2025) characterized seasonal and diurnal NH3 exchange: emissions around noon in summer and deposition in spring, autumn, and winter. Although the time periods of NH3 emissions varied in these studies, emissions consistently occurred during the daytime in the warm season. Therefore, it can be said that our results are plausible.
Same with previous studies, those mentioned above speculated that daytime NH3 emissions were mainly derived from the stomata of plants. However, Ramsey et al. (2020) and Melman et al. (2025) did not measure stomatal conductance (gs), a parameter indicating the degree of stomatal opening or ease of gas flow. Husted and Schjoerring (1996) obtained a linear relationship between NH3 flux and leaf conductance in oilseed rape (Brassica napus) under controlled environmental conditions. Gessler et al. (2000) also found that NH3 fluxes depend linearly on water vapor conductance, which is also an index of stomatal opening, in mature beech trees (Fagus sylvatica) at a German field site using a dynamic chamber technique. In the deciduous forest site studied by Xu et al. (2023), Tanaka et al. (2023) estimated gs for the dominant species around the observation tower (Quercus serrata). gs in August 2020 peaked during 09:00 to 16:00, and remained almost plateau during this time. The daytime observations of Xu et al. (2023) were conducted during 08:00 to 17:00, which coincided with this period of consistently large gs, and fluxes correlated strongly with solar radiation, which is also a meteorological element that strongly controls gs. Pitman (1996) showed gs for six species including a dominant species (Hopea ferrea) in a dry evergreen forest of SERS and found that the peaks of gs typically occurred between 09:00 and 12:00. This also coincides with the sampling time of D1 (09:00–13:00) in this study, when the largest emissions were observed. The differences in the timing of daytime NH3 emissions in these studies may reflect the differences in gs. Igarashi et al. (2015) measured gs in teak (Tectona grandis Linn. f.) in a typical tropical deciduous forest located in northern Thailand over 6 years and found that gs had a hysteretic relationship with the LAI. They also revealed that gs tended to be largest when LAI is between 2.5 and 3.0, and tended to be smaller as LAI decrease during the dry season. Because the mean LAI at the DDF of SERS at the beginning of the leafy period was approximately 3.1, it is likely that gas exchange between the leaf stomata and the atmosphere was most active during this period. However, as can be seen from the decrease in LAI (Fig. A2), it was difficult to consider that emissions were mainly from the stomata during the leafless period when leaf fall progressed. However, the fluxes in the leafless period were at the same level as those in the leafy period, and indicating there must have been an alternative source of emissions to the leaf stomata (Fig. 9).
Based on previous findings summarized by Flechard et al. (2013), soil and leaf litter were the most likely emission sources in the leafless period. Ueda et al. (2017) specified the soil in the DDF as Ultisols, which are usually acidic, poor nutrient, and have a low content of organic matter. According to Tammadid et al. (2024), the soil pH in the DDF of SERS was in the range from 4.44 to 4.73, with a mean value of 4.54 (acidic). Xu et al. (2024) analyzed soil (Andosols) at the same forest site as Xu et al. (2023) and Tanaka et al. (2023), and found that the possibility of emissions from acidic soil (pH = 5.4) was extremely low. Moreover, no ammonium ions were detected in the soil in the measurements. The same is probably true for the soil in the DDF of SERS, which has an even lower pH and poorer nutrient than Andosols. In addition to soil analysis, Tammadid et al. (2024) revealed the litterfall production was highest in January (about 1.5 t dry matter ha−1) and lowest in December in the DDF of SERS. During this period, the LAI in the DDF usually decreases considerably and is accompanied by leaf fall (Matsuda et al., 2012). Hansen et al. (2013) measured NH3 flux using the relaxed eddy accumulation method (REA) over a deciduous forest in Denmark and found a shift in the direction of flux from deposition to emission, with a simultaneous decrease in LAI. Their analysis, using a bi-directional exchange model, also indicated that litter is one of the main sources of NH3 emissions. A vertical profile measurement using the denuder sampling technique by Xu et al. (2024) at the same forest site as that of Xu et al. (2023) also revealed large NH3 emissions from the forest floor immediately after leaf fall. LAI during the emission period decreased by about half from 2.5 to 1.3 in 1 month in Xu et al. (2024), which is very close to the LAI change in the DDF of SERS. While previous studies suggest that emissions from the decomposition of leaf litter are likely to occur under humid conditions (Hansen et al., 2013), the leaching of inorganic compounds from leaf litter is a rather unique process under the highly dry conditions of forests in Thailand. For example, Yamashita et al. (2011) conducted vertical flux measurements of inorganic nitrogen using ion exchange resin and buried bag methods in a dry evergreen forest of SERS and found that leaching of inorganic nitrogen from the leaf litter into the soil was substantially larger than atmospheric nitrogen deposition and that leaf litter served as the primary source of ammonium in the forest. It is possible that a portion of the NH3 produced during leaf litter decomposition is emitted into the atmosphere as the dry season and leaf fall progressed. In Hansen et al. (2013), flux measurements were conducted under conditions where both air and soil temperatures were below 10 °C, raising concerns regarding whether leaf litter decomposition could proceed under these low-temperature conditions. In contrast, the air temperature at SERS was higher throughout the observation period, suggesting more favorable conditions for decomposition. This evidence supports the idea that the source of NH3 emissions in the DDF of the SERS shifted dynamically from stomata in the leafy period (December) to leaf litter in the leafless period (from January to February). As we only performed flux measurements in this time, it is further emphasized that it is necessary to measure plant physiological parameters such as stomatal conductance, as well as leaf litter production and emission potential in the future.
3.4 Factors controlling ammonia fluxes
Unlike the NH3 concentration and transfer velocity, no clear correlation was found between the NH3 flux and the meteorological elements, regardless of the observation period. This is thought to be due to the large variability in the flux and/or the complexity of the flux determination. Therefore, we divided air temperature, relative humidity, u∗, and solar radiation into several categories according to their ranges and focused on the flux distribution in each category (Fig. 10). As shown in Fig. 10, the ranges of temperature and relative humidity were slightly different because there were differences in the variation between the leafy and leafless periods. Regardless of the observation period, NH3 fluxes clearly showed trends according to the ranges of these meteorological elements: larger emissions when the temperature and the u∗ were higher and the integrated solar radiation was larger. And fluxes shifted toward deposition as the relative humidity increased.
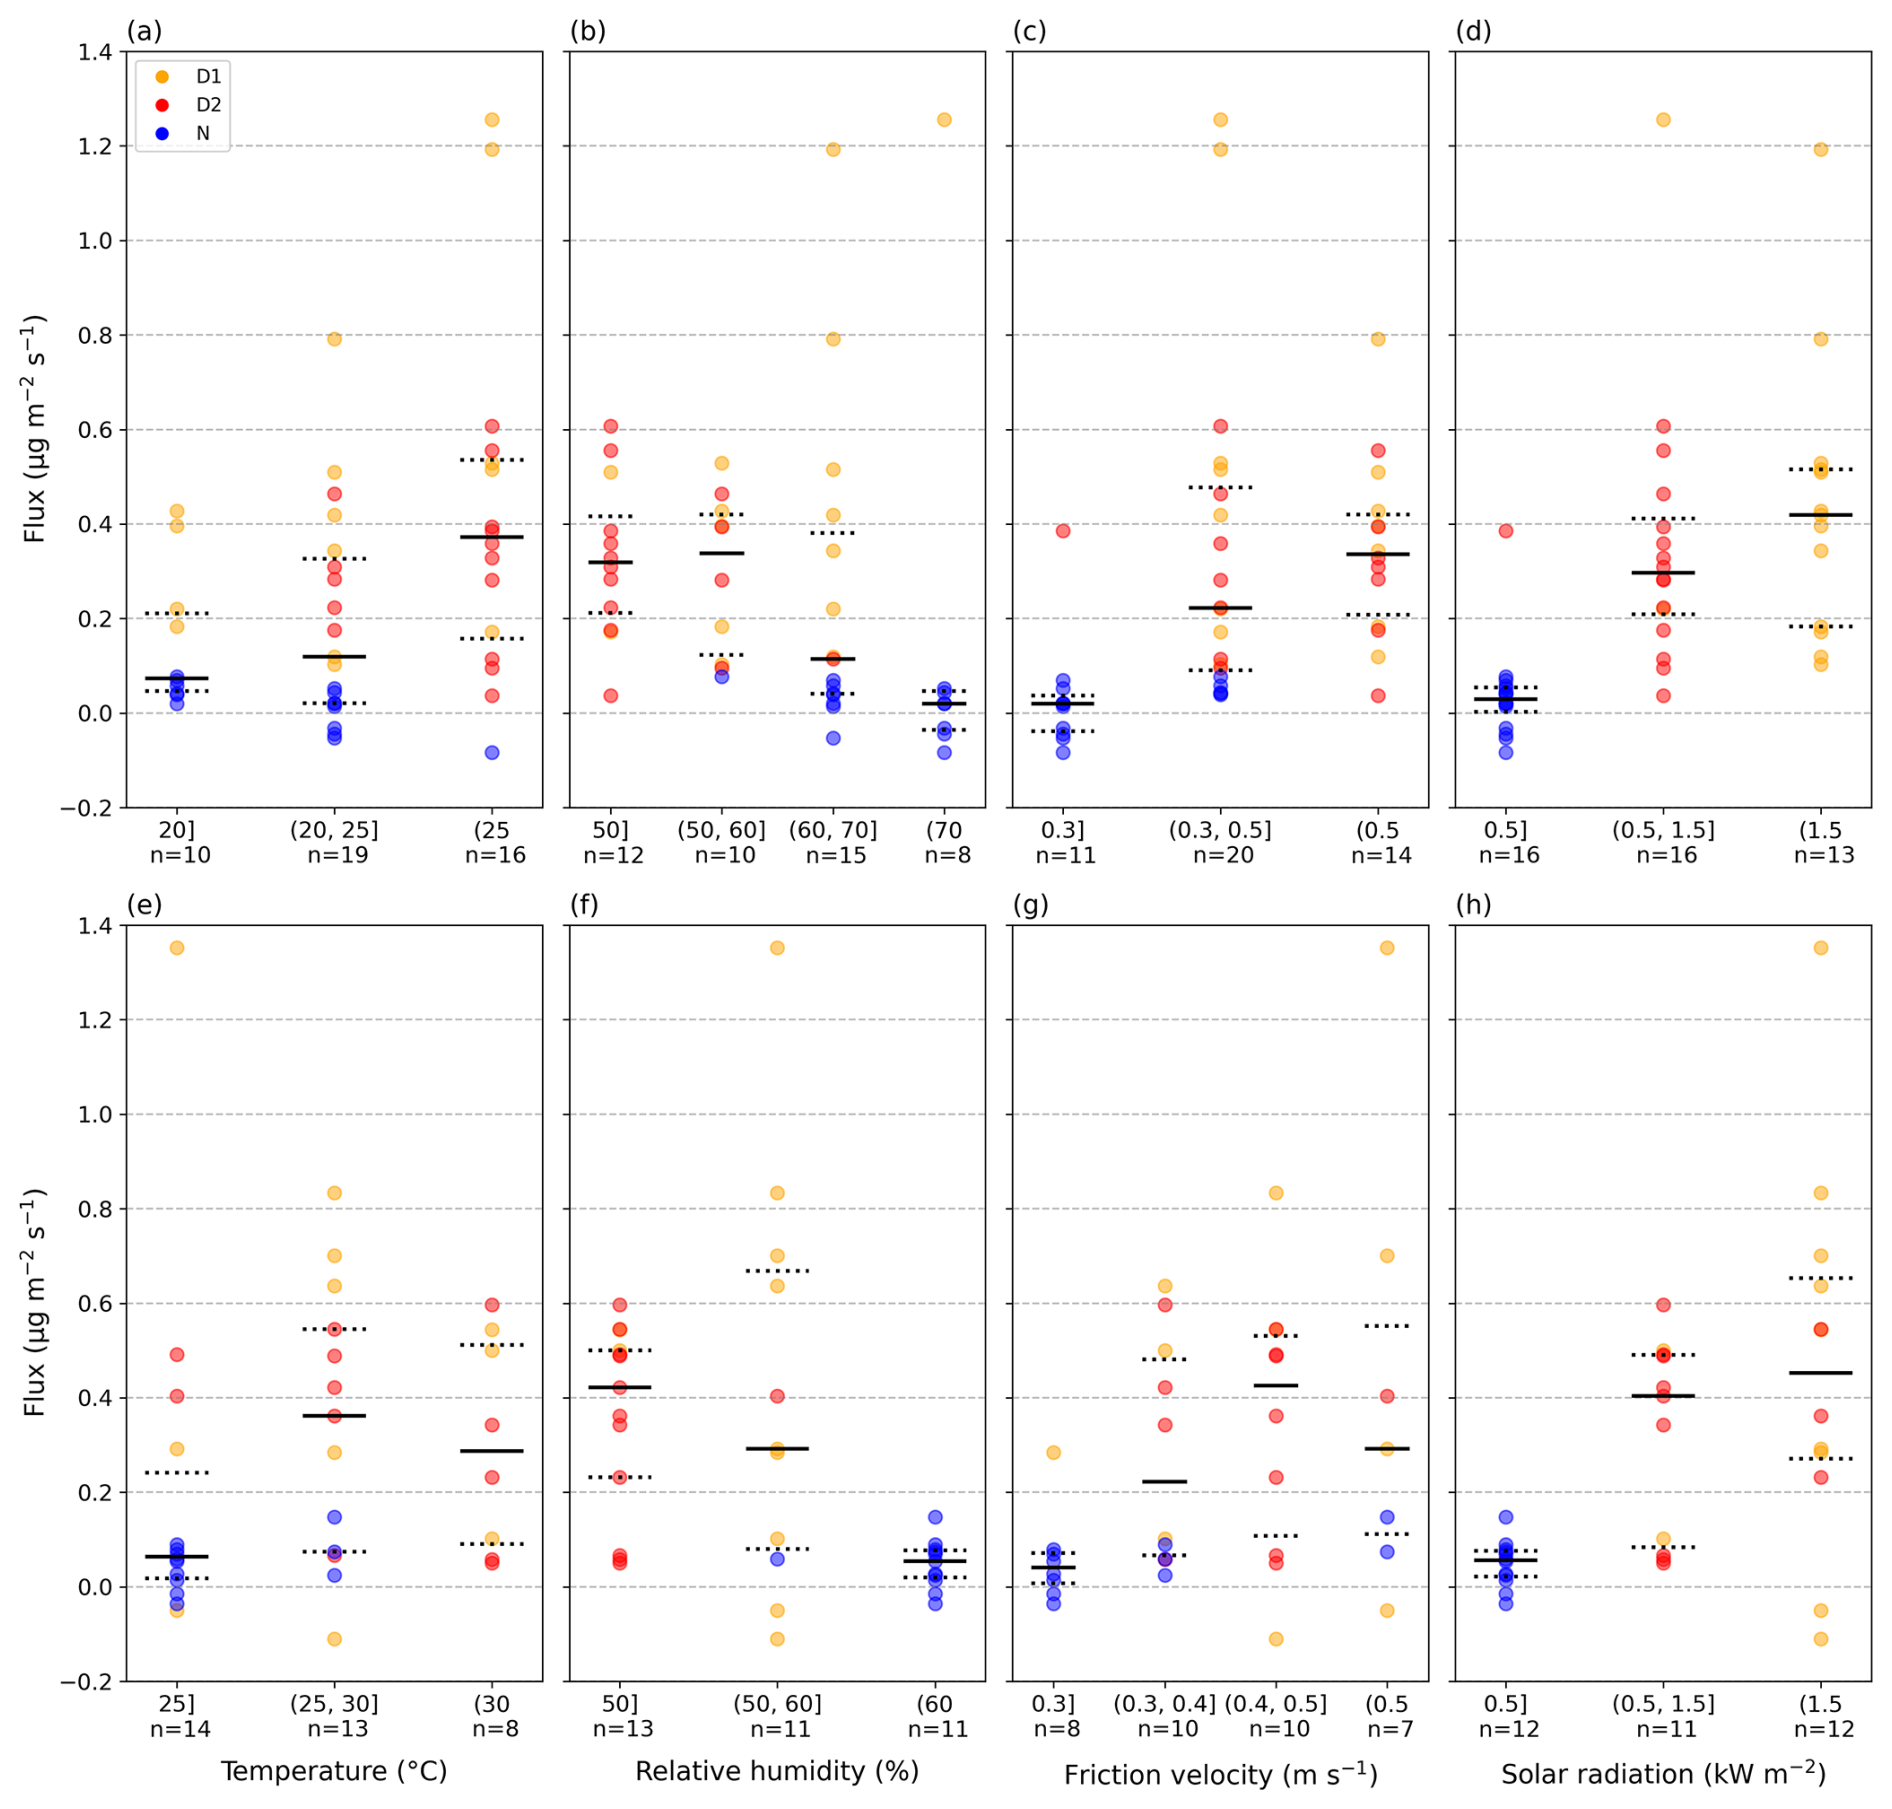
Figure 10Distribution of NH3 flux according to the range of air temperature (a, e), relative humidity (b, f), friction velocity (c, g), and solar radiation (d, h) at each sampling time (D1: orange, D2: red, N: blue) during the leafy (a–d) and leafless (e- h) periods. Solid line indicates median value and dashed lines indicate the 75th (top) and 25th (bottom) percentiles. Solar radiation was the integrated values of 1 h values during each sampling time.
Observations and bi-directional exchange models have demonstrated that temperature is the most important factor controlling NH3 emissions (Flechard et al., 2013; Zhang et al., 2010). However, to the best of our knowledge, only a few field studies have clearly demonstrated the relationship between flux and temperature in forest sites. While no direct correlation could be found in Xu et al (2023), emissions tended to occur when the air temperature near the canopy was larger than 27 °C. They also found emissions likely to occur under dry conditions; relative humidity below 70 %. Several field studies have also pointed to humidity and surface wetness as factors controlling flux (Ramsay et al., 2021; Hansen et al., 2013). Neirynck et al. (2005) measured the NH3 flux over a mixed suburban forest in Belgium and suggested that a wetted canopy may be a more efficient sink than a dry canopy. Regardless of the observation period, NH3 emission showed a sharp increase when the temperature exceeded 25 °C and relative humidity fell below 60 %, which is consistent with previous findings. Although further verification is needed at other observation sites, it is possible that the tropical dry deciduous forest exists in environments where emissions are more likely to occur during the dry season. At the same forest site as Xu et al. (2023), observations using the REA method have shown that u∗ strongly controls HNO3 emissions (Xu et al., 2021). This study confirmed large NH3 fluxes with increase in u∗, indicating that the emission was enhanced by turbulence. During both the leafy and leafless periods, emissions are likely to occur with increase in air temperature and integrated solar radiation. However, based on the previous discussion, the roles of temperature and solar radiation may have differed during these periods. During the leafy period, when leaves were still abundant, solar radiation contributed to the opening of leaf stomata, which might indirectly facilitate emissions from leaves with increasing temperature. On the other hand, in the leafless period when there were fewer or no leaves and leaf litter was abundant, the forest floor was warmed by direct sunlight. Warm condition probably promoted the decomposition of leaf litter, resulting in continuous NH3 emissions. In the leafy period, the median flux increased stepwise in response to the amount of integrated solar radiation. In contrast, the change in median flux from the second bin to third bin was smaller in the leafless period. These results may also be due to the different roles of solar radiation during the observation periods.
3.5 Uncertainties
Due to several limitations of the measurement set-up, the measured fluxes contain the following uncertainties. (i) The measured flux using AGM could be underestimated within the RSL due to the increasing eddy diffusivity. To evaluate this uncertainty on measured flux, we applied a correction factor (α) to the flux calculation following Melman et al. (2024). α was tentatively set at 0.75 following Matsuda et al. (2010) because our instrumental set-up did not allow us to directly evaluate the effect. The value of 0.75 is a first order of estimate, selected arbitrarily based on the measurement height above the canopy. As a result, an underestimation of approximately 32 % was found for both the leafy (from 0.140 to 0.185 µg m−2 s−1) and leafless (from 0.158 to 0.208 µg m−2 s−1) periods. However, it should be noted that α is not only height-dependent, but also affected by canopy structure (Melman et al., 2024). Moreover, the effect of the RSL on the measured flux could be different between leafy and leafless conditions. Shapkalijevski et al. (2016) found that turbulent exchange coefficient of momentum, heat, and moisture within the RSL increase under leafless canopy conditions. Therefore, the difference in the measured fluxes between the two periods should be interpreted with caution. Deriving an appropriate α value at SERS remains a future challenge.
(ii) The long observation intervals of ΔC introduces two uncertainties: (ii-a) The cross-term between transfer velocity and ΔC was neglected in the flux calculation and this may lead deviations from the real flux as suggested by the Schmidt paradox (Moene and van Dam, 2014). Rutledge-Jonker et al. (2023) have reported that omitting the cross-term can lead to an underestimation of measured flux up to approximately 15 %. Addressing this issue is also a future challenge for our study. (ii-b) Concentration measurements under different stability regimes introduce additional uncertain. During the daytime (D1 and D2), the effects of mixed stability were negligible because unstable conditions generally dominated. Although we are unable to quantify the potential effects on nighttime flux, this uncertainty does not alter our overall conclusion that NH3 emissions predominantly occur during the daytime.
Finally, (iii) the use of AGM possibly leads to larger measurement errors than more direct measurement methods, such as the REA and eddy covariance methods, because this method assumes steady-state conditions and derives flux from the difference in concentrations measured at two heights. Although the number of studies is limited, several high-time resolution flux observations using AGM over forests have shown levels of measurement error in NH3 fluxes. Wolff et al. (2010) obtained a median flux error of approximately 50 % for a German spruce forest. A median error of 33 % was calculated for the study of Ramsay et al. (2020). Melman et al. (2025) reported a median random error of approximately 50 %, indicating that the random error varies depending on season and sometime can be up to about 175 %. The fluxes measured in this study are in the range of −0.110 to 1.352 µg m−2 s−1, which probably includes some measurement errors. Manual measurements, such as those in this study, have limitations in terms of time resolution for flux measurements and the number of samples that can be obtained during a campaign. It is also technically difficult to show measurement error statistically by parallel measurement, as in previous studies (Ramsay et al., 2020; Wolff et al., 2010). Therefore, we estimated the random error of measured flux (σF) following the approach of Melman et al. (2025). σF was calculated by propagating uncertainties in the u∗, ΔC, and the integrated stability correction function. As a result, a median random error of approximately 42 % was estimated. The random error did not show a large bias for the daytime and nighttime samples, with median values of 39 % for D1, 41 % for D2, and 45 % for N, respectively. Consistent with the results of Wolff et al. (2010), σF was primarily governed by the random error in ΔC. In this study, multiple analyses were performed for each sample using two ion chromatographs, demonstrating the importance of such quality control measures in determining fluxes. Even if there was a measurement error of approximately 42 % or more as reported in previous studies, the direction of the daytime NH3 flux tended to show upward throughout the observation period. Therefore, the conclusion that the tropical DDF acts as a net source of NH3 during the dry season remains robust.
In addition, the fluxes obtained in this study may have included outliers. Regardless of the observation period, all values that appeared to be outliers were obtained at sampling time of D1 (Fig. 9). This result cannot be easily interpreted as a coincidence. In agricultural fields, specific large emission events can be observed after fertilization, which are unthinkable at the forest site. Based on the findings published in recent years, the dynamic exchange mechanism at the canopy and/or ground surfaces could be a reasonable factor causing abnormally large NH3 emissions. According to Saylor et al. (2025), dew at surfaces may have a significant impact on NH3 bi-directional exchange; dew formation induces NH3 dissolution in moisture (absorption), and dew evaporation due to drying of the surface causes the re-emission of NH3 to the atmosphere. Field measurements across different surfaces have shown peaks in NH3 concentrations in the morning with a decrease in relative humidity, confirming this process (Wentworth et al., 2016). Although dew formation may seem unlikely in the DDF during the dry season, the meteorological conditions necessary for dew formation are frequently met during the nighttime. These include a sharp decrease in air temperature, lower wind speed, and an increase in relative humidity. Even in the absence of dew, the formation of a thin water film on the surfaces may play a similar role in the absorption and re-emission of NH3. The nighttime fluxes on 16 December and 29 January were the few cases that showed deposition during the observation period; fluxes were −0.083 and −0.036 µg m−2 s−1, respectively. Relative humidity at 34 m increased from the night of 16 December until 07:30 of 17 December and dropped from 87 % to 63 % until 12:40. Same variation was also observed from the night of 29 January to the noon of 30 January; relative humidity dropped from 82 % to 46 %. Temperature also increased up to about 29 °C during both periods. The daytime fluxes (D1) on 17 December and 30 January showed large emissions; fluxes were 1.256 and 0.834 µg m−2 s−1, respectively. This result led us to believe that the dynamic mechanism described above may indeed be real. On the other hand, there were samples like 26 January (D1) which showed a large emission of 1.352 µg m−2 s−1 even though no deposition occurred at the night before. In addition to dew formation, changes in dew pH may affect bi-directional exchange because the equilibrium between gaseous-phase and liquid-phase NH3 also depends on pH. For example, acidic dew is thought to promote the deposition of NH3 and suppress the deposition of other acid gases (Wentworth et al., 2016). The pH of the dew on the surface is more complex and probably depends on the amount and chemistry of the previously deposited substances. Because our observations alone cannot allow for further discussion about this mechanism, we should use bi-directional exchange models considering the dynamic exchange on surfaces (Sutton et al., 1998) to verify this hypothesis as the next step.
In this study, we conducted NH3 flux measurements in a tropical DDF in Thailand for the first time. The measured fluxes showed comparable level between the leafy and leafless periods and were larger than those reported in previous studies at forest sites. However, uncertainties that we were unable to fully evaluate remain as discussed in Sect. 3.5, and the values of flux should therefore be interpreted with caution. Despite these uncertainties, the direction of the flux (emission) appears robust, and we found that the characteristics of NH3 concentration and flux were generally consistent with those of previous studies. On the other hand, we hypothesize that NH3 concentrations are controlled by meteorological elements (e.g. air temperature, wind speed, wind direction) as well as by changes in canopy structure accompanied by defoliation. Specifically, the dominant NH3 emission source may shift dynamically from leaf stomata to leaf litter in response to changes in canopy and forest floor. The emissions were also controlled by meteorological elements (e.g. air temperature, relative humidity, u∗, solar radiation). Notably, during the observation period (December 2023 to February 2024), the monthly mean air temperatures were 1.2 to 1.8 °C higher than the monthly mean values over the 3-year from 2020 to 2022. In addition, the total annual rainfall in 2023 was 550 mm lower than the 3-year mean. These warmer and drier conditions may have suppressed NH3 deposition during the dry season. Observations under representative environmental conditions during both the dry and wet seasons are scheduled to be conducted in future studies. To draw a conclusion, measuring meteorological elements, concentrations, and fluxes alone is insufficient. Future studies must incorporate measurements of plant physiological parameters such as stomatal conductance, capturing surface wetness and dew formation, in addition to the analysis of leaf litter and soil parameters.
Improving the measurement accuracy using more advanced techniques is also a crucial next step, and we are currently addressing this challenge by installing an REA system (Xu et al., 2022, 2021) at the DDF of SERS. Moreover, high temporal resolution is an essential issue that must be addressed in future studies. Furthermore, the applicability of bi-directional exchange models in the tropical DDF is planned to be quantitatively evaluated as the next step, and model inter-comparison, as in Jongenelen et al. (2025), should also be conducted. Although some recent studies tend to rely heavily on sensitivity analyses of NH3 emission potentials of leaf stomata and soil and related resistances, it is scientifically more appropriate to improve and refine models based on onsite information and conditions. The NH3 bi-directional exchange processes and emission sources can be accurately characterized only through such integrative approaches. In recent years, there have been studies that treat the bi-directional exchange of NH3 in regional scale chemical transport models (Fu et al., 2015; Bash et al., 2013). A global scale estimate of NH3 deposition considering bi-directional exchange was also conducted using a satellite-based technique (Liu et al., 2020). Detailed assessments of atmospheric deposition processes have also been conducted from point models to regional models, such as in AQMEII4 project (Galmarini et al., 2021). This study presents a valuable dataset for verifying the results of these latest studies and contributes to the further improvement of the models.
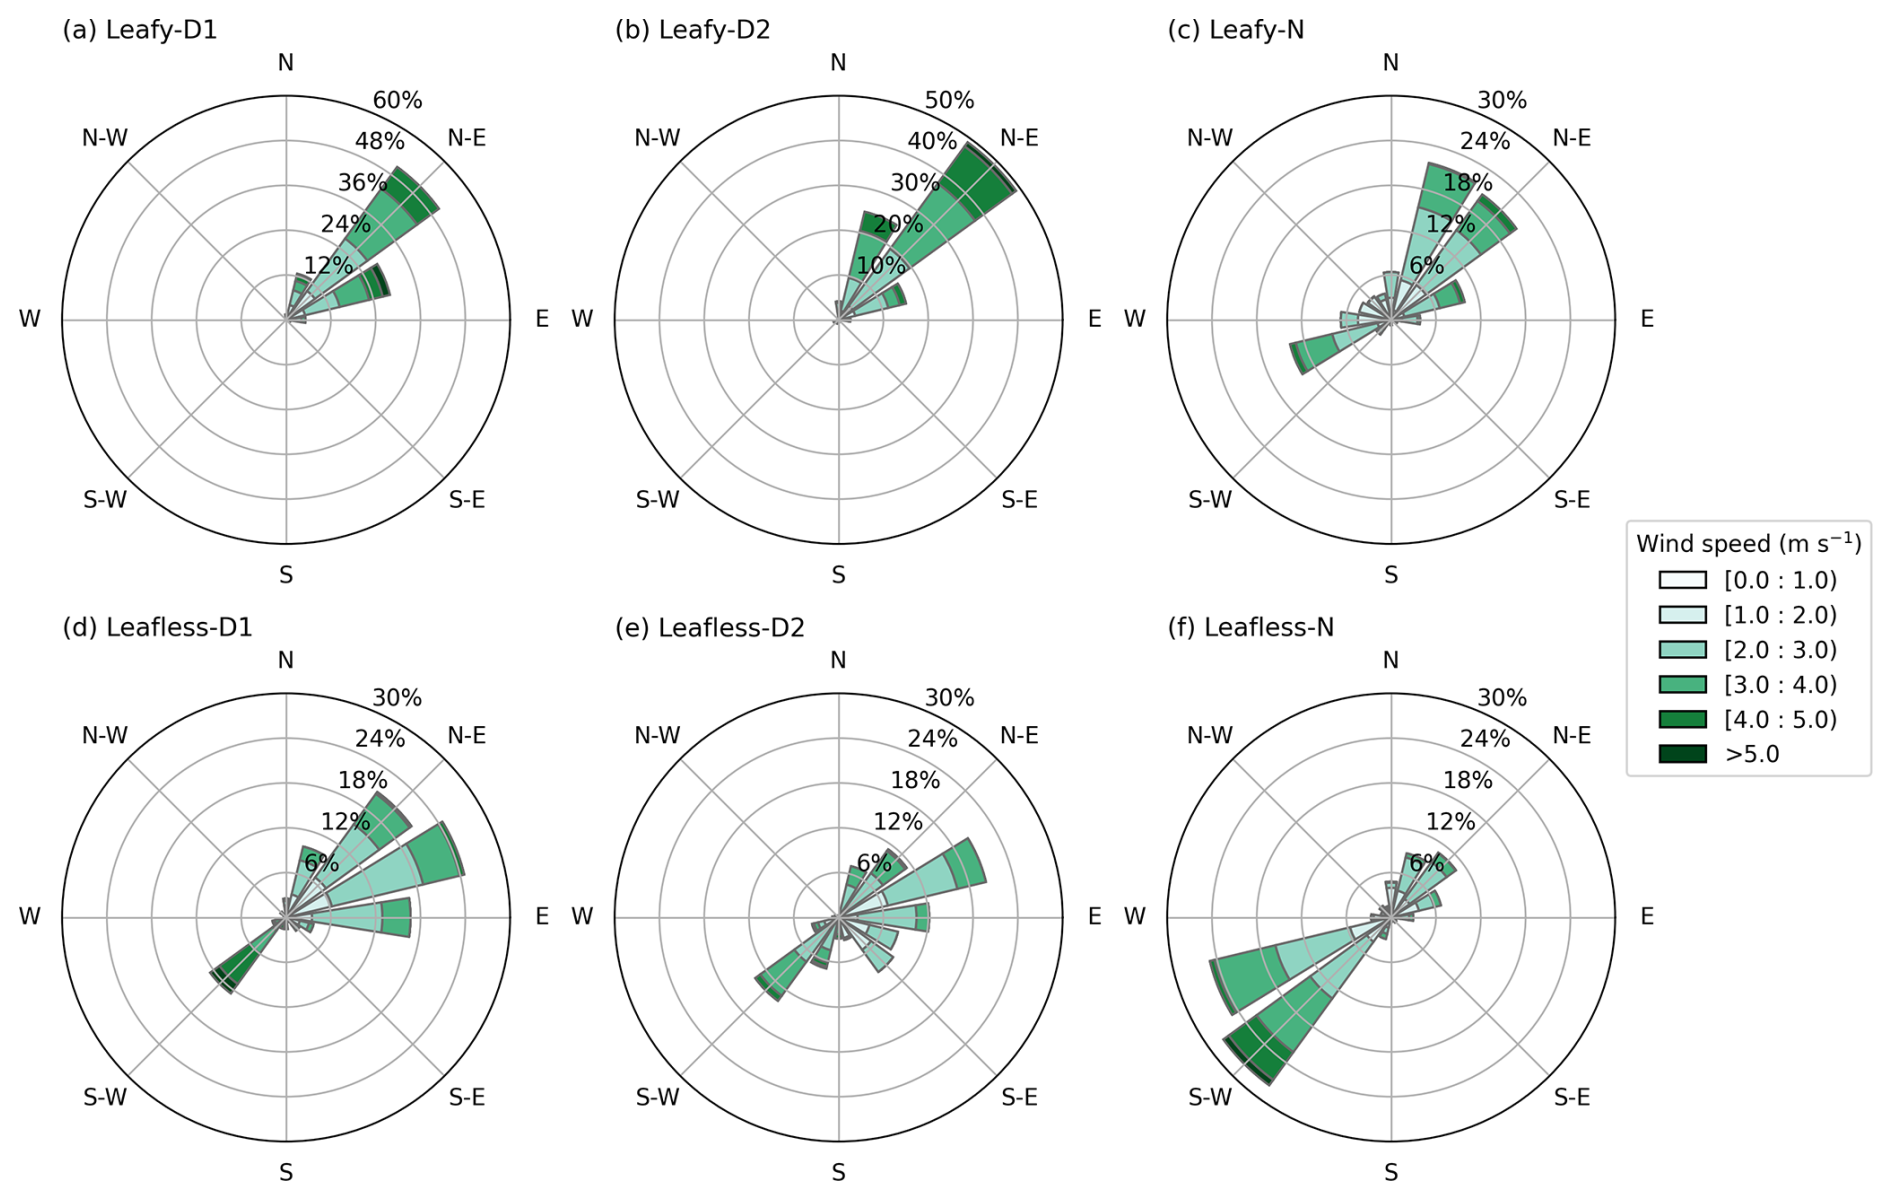
Figure A1Windrose at sampling time of D1 (a, d), D2 (b, e), and N (c, f) during the leafy (a–c) and the leafless (d–f) periods.
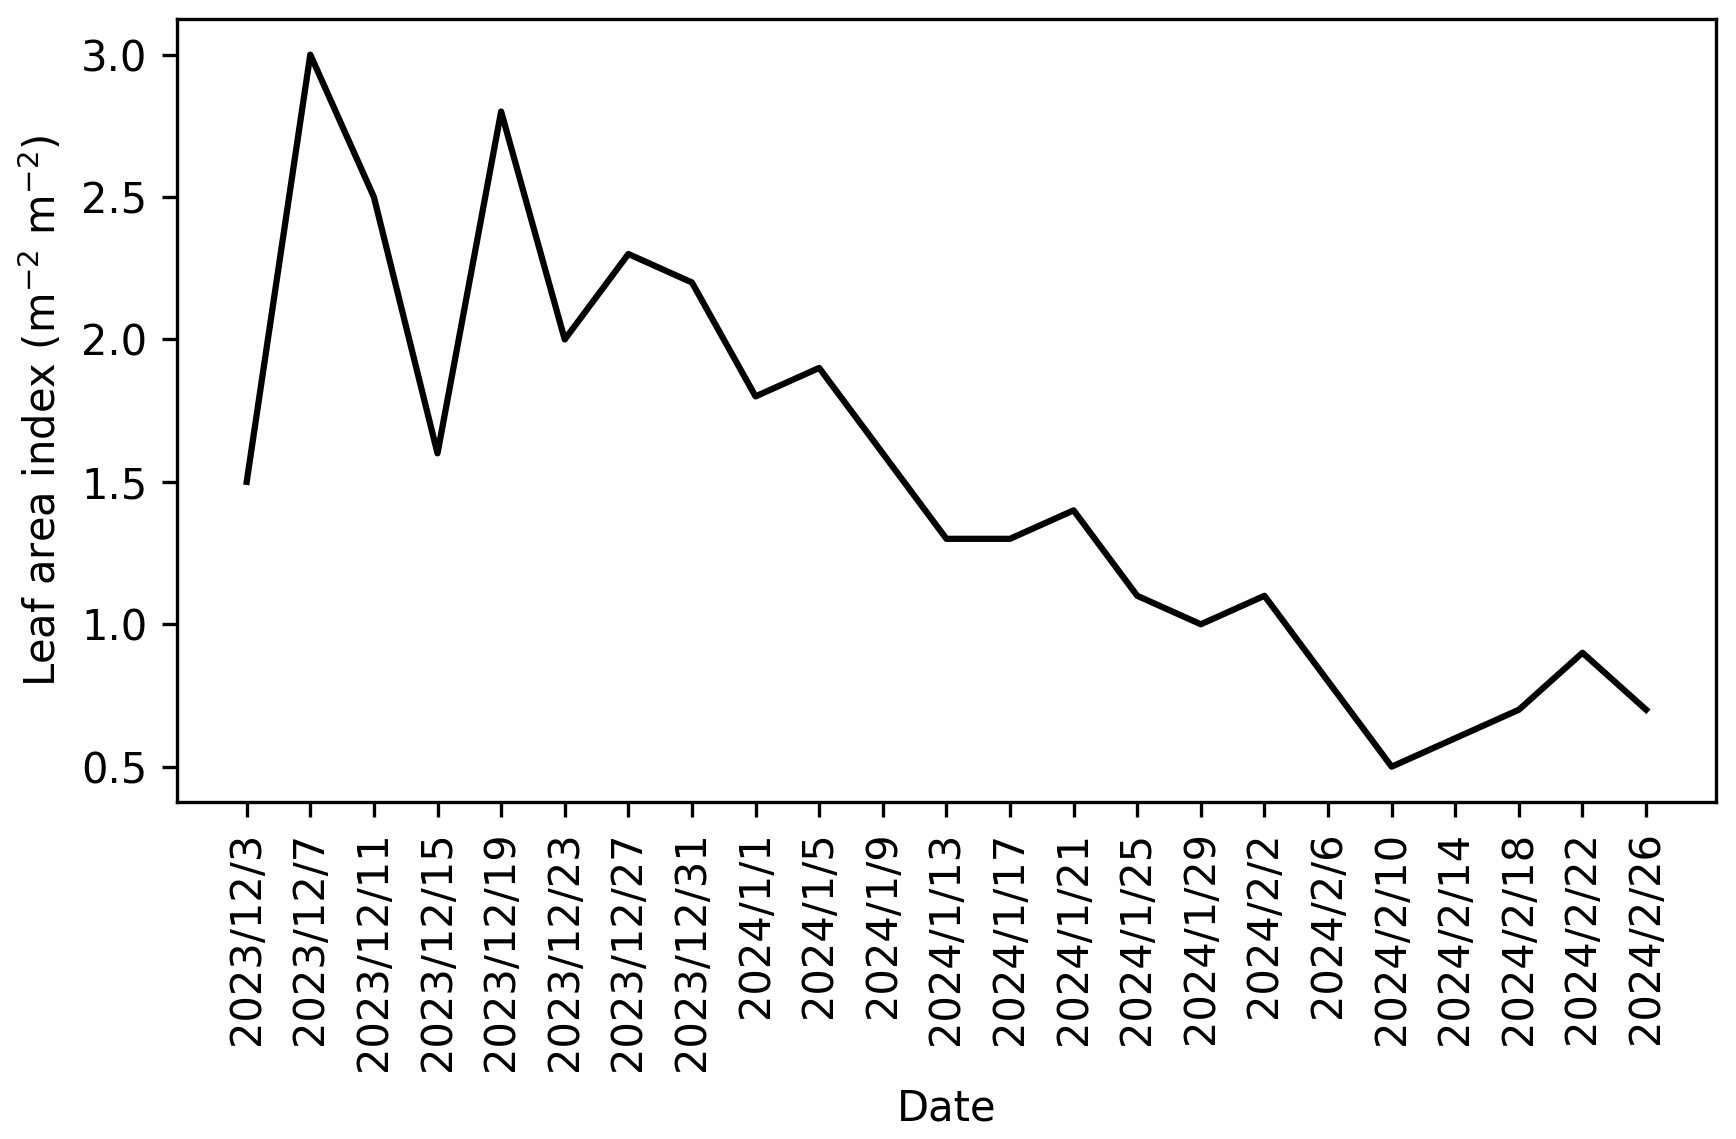
Figure A2Variation in the satellite-derived LAI at the observation tower. The dataset of MCD15A3H, which is the product of the Moderate Resolution Imaging Spectroradiometer mounted at the satellite Terra and Aqua was used.
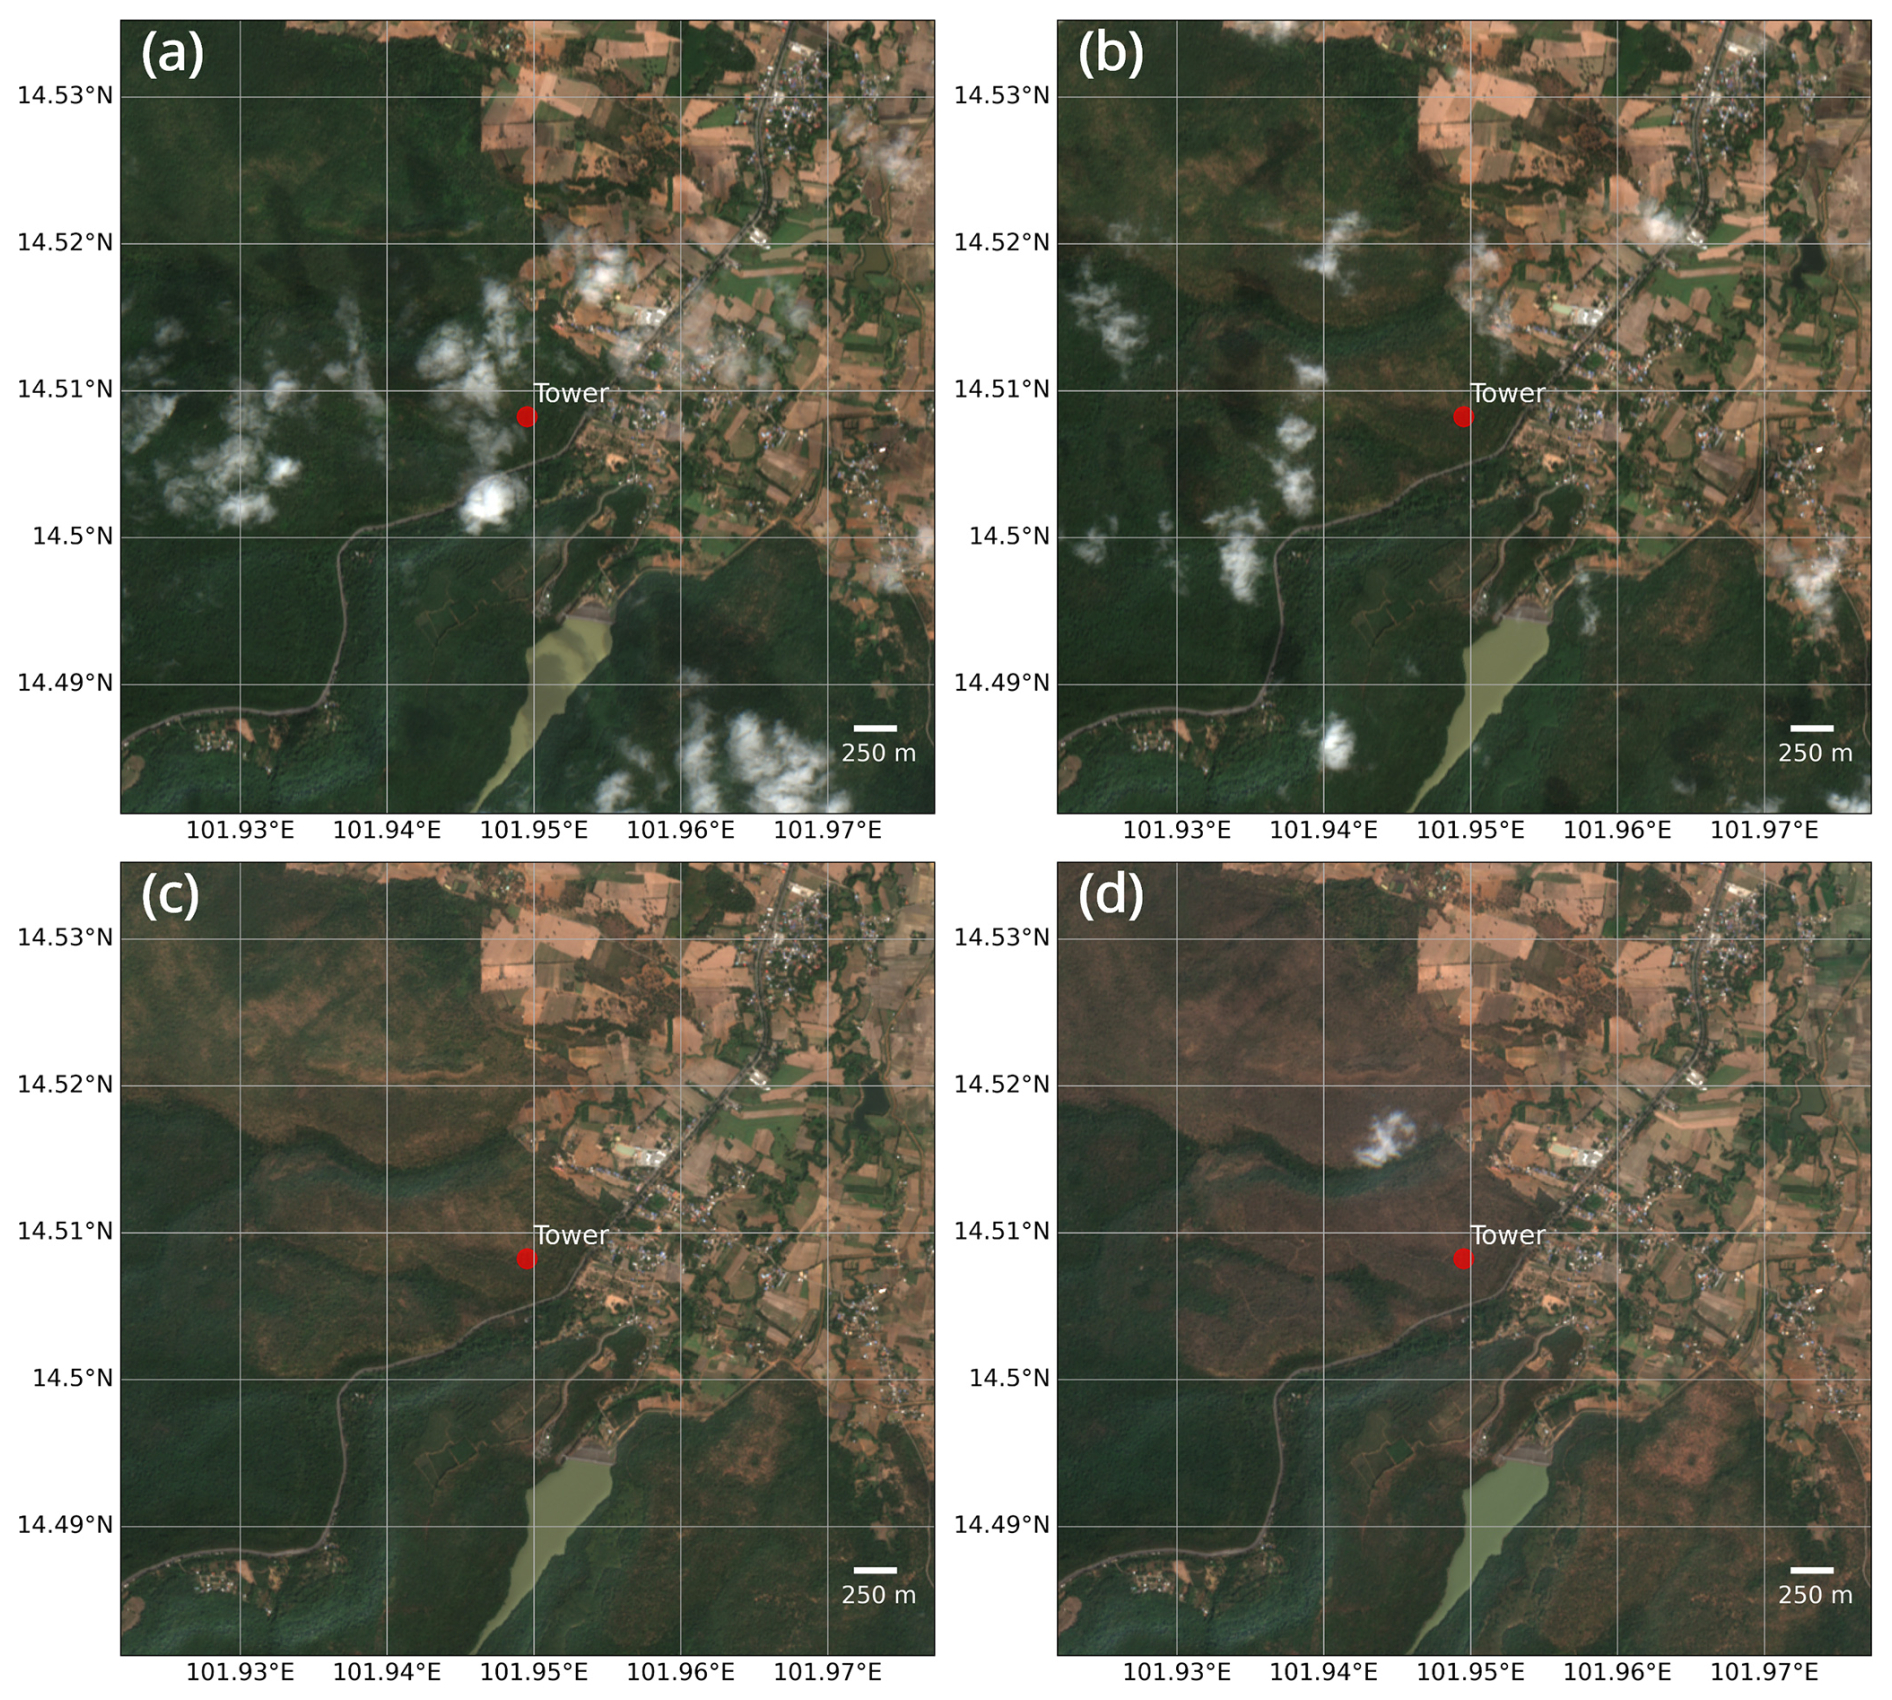
Figure A3Satellite imagery (6 km × 6 km) of the observation site during four periods: (a) 15–31 December 2023; (b) 1–10 January 2024; (c) 11–21 January 2024; and (d) 22 January–7 February 2024. The images were retrieved from the dataset of Sentinel-2 Surface Reflectance Harmonized (COPERNICUS/S2_SR_HARMONIZED) via © Google Earth Engine. For each period, imagery was filtered for the observation site, and scenes with cloud cover below 20 % were selected.
Table A1Summary of meteorological conditions during the two observation periods. Air temperature and relative humidity were recorded at 34 m at the observation tower.
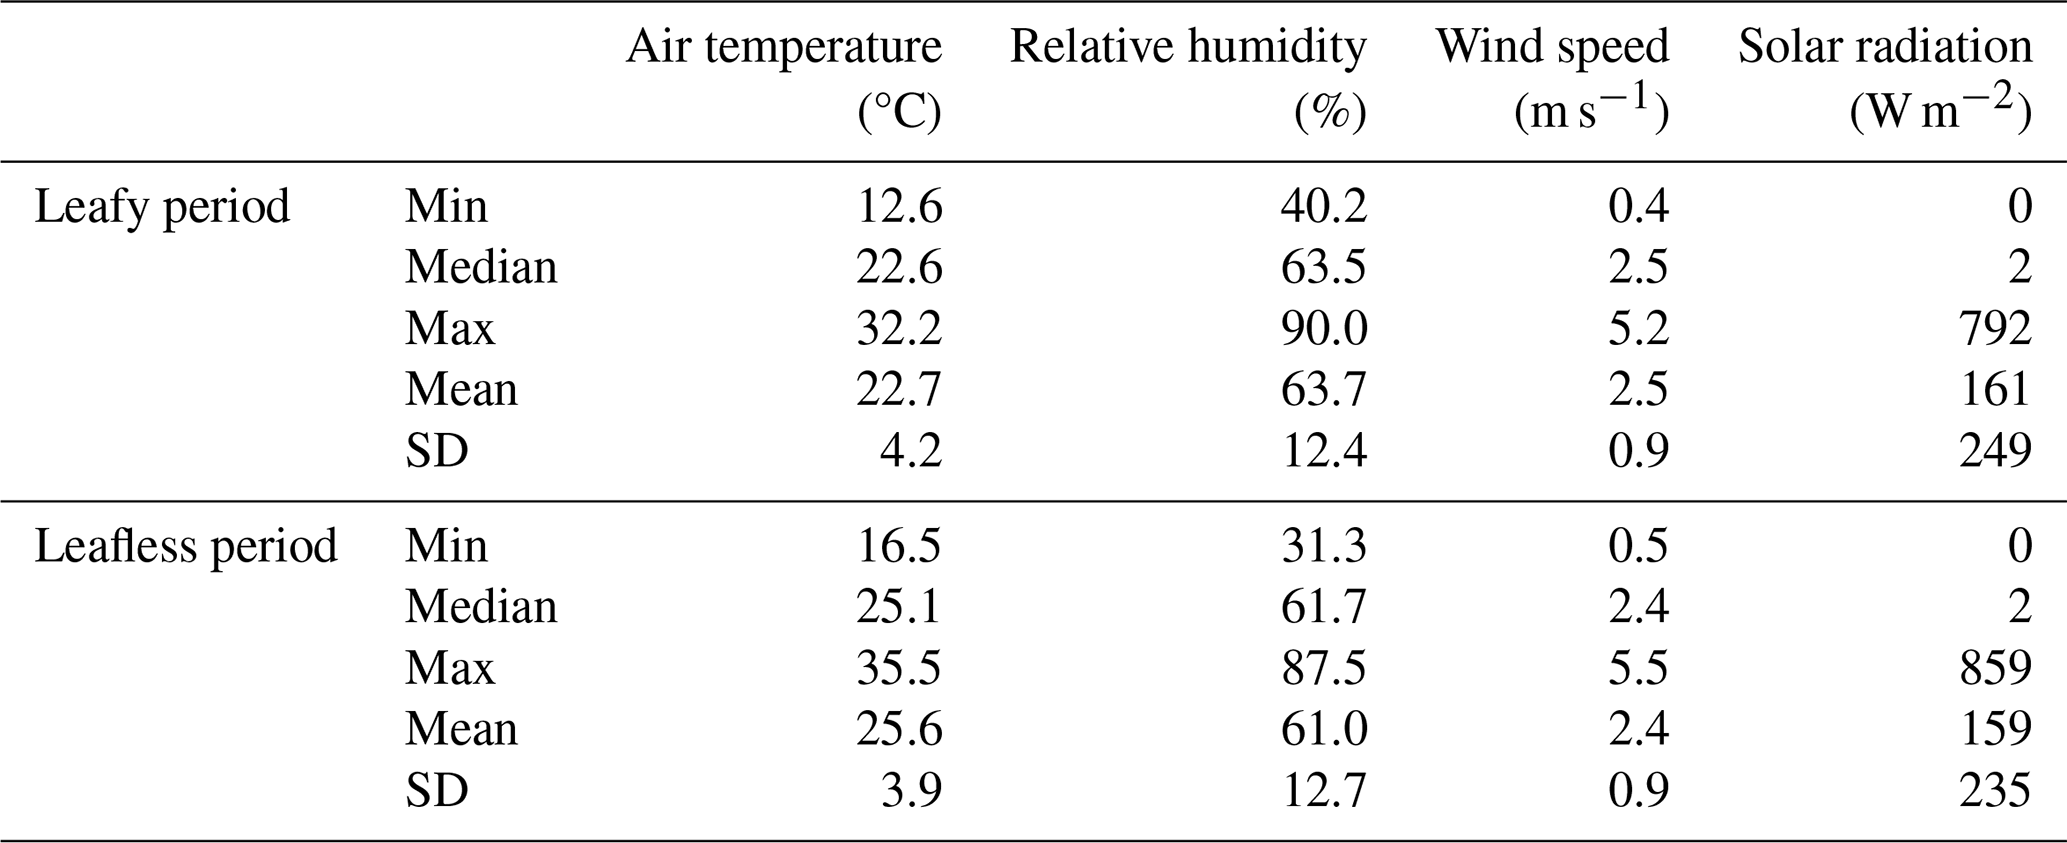
Table A2Summary of transfer velocity, ΔC, and NH3 flux during the two observation periods. Mean and standard deviation were weighted by sampling time.
The dataset of flux measurements in this study are available from the corresponding author on reasonable request.
MX: conceptualization, methodology, formal analysis, visualization, investigation, writing (original draft). PC: resources, investigation, writing (review and editing). HS: investigation, writing (review and editing). AS: writing (review and editing). SI: software, writing (review and editing). KM: conceptualization, investigation, supervision, project administration, funding acquisition.
The contact author has declared that none of the authors has any competing interests.
Publisher's note: Copernicus Publications remains neutral with regard to jurisdictional claims made in the text, published maps, institutional affiliations, or any other geographical representation in this paper. The authors bear the ultimate responsibility for providing appropriate place names. Views expressed in the text are those of the authors and do not necessarily reflect the views of the publisher.
We gratefully acknowledge the support of Surachit Waengsothorn (Thailand Institute of Scientific and Technological Research), Kanoktip Somsiri (Thailand Institute of Scientific and Technological Research), and all members of the Sakaerat Environmental Research Station.
This work was supported by JSPS KAKENHI (Grant Numbers 23KK0190) and the project “Research on biodiversity and ecosystem conservation taking into account synergies and trade-offs of ecosystem services” (Shinsuke Koike's team) of Institute of Global Innovation Research, Tokyo University of Agriculture and Technology.
This work was supported by JSPS KAKENHI (grant no. 23KK0190).
This paper was edited by Leiming Zhang and reviewed by two anonymous referees.
Aman, N., Panyametheekul, S., Pawarmart, I., Sudhibrabha, S., and Manomaiphiboon, K.: A visibility-based historical PM2.5 estimation for four decades (1981–2022) using machine learning in Thailand: Trends, meteorological normalization, and influencing factors using SHAP analysis, Aerosol Air Qual. Res., 25, 4, https://doi.org/10.1007/s44408-025-00007-z, 2025.
Amnuaylojaroen, T., Inkom, J., Janta, R., and Surapipith, V.: Long range transport of Southeast Asian PM2.5 pollution to northern Thailand during high biomass burning episodes, Sustainability, 12, 10049, https://doi.org/10.3390/su122310049, 2020.
Ban, S., Matsuda, K., Sato, K., and Ohizumi, T.: Long-term assessment of nitrogen deposition at remote EANET sites in Japan, Atmos. Environ., 146, 70–78, https://doi.org/10.1016/j.atmosenv.2016.04.015, 2016.
Ban, S., Matsuda, K., and Ohizumi, T.: A method estimating dry deposition for assessment of nitrogen load on forests in East Asia, Water Air Soil Pollut., 233, 417, https://doi.org/10.1007/s11270-022-05874-5, 2022.
Bash, J. O., Cooter, E. J., Dennis, R. L., Walker, J. T., and Pleim, J. E.: Evaluation of a regional air-quality model with bidirectional NH3 exchange coupled to an agroecosystem model, Biogeosciences, 10, 1635–1645, https://doi.org/10.5194/bg-10-1635-2013, 2013.
Beachley, G. M., Fenn, M. E., Du, E., de Vries, W., Bauters, M., Bell, M. D., Kulshrestha, U. C., Schmitz, A., and Walker, J. T.: Monitoring nitrogen deposition in global forests, in: Atmospheric Nitrogen Deposition to Global Forests, edited by: Du, E. and de Vries, W., Elsevier, Amsterdam, Netherland, 17–38, https://doi.org/10.1016/B978-0-323-91140-5.00019-1, 2024.
Chanonmuang, P., Khummongkol, P., and Matsuda, K.: Dry deposition of SO2 over dry dipterocarp forest, Thailand, Sains Malays., 44, 317–323, https://doi.org/10.17576/jsm-2015-4403-02, 2015.
Chatani, S., Shimadera, H., Kitayama, K., and Nishina, K.: Numerical analysis of factors causing long-term trends and annual variations of sulfur and nitrogen deposition amount in Japan from 2000 to 2020, Asian J. Atmos. Environ., 19, 2, https://doi.org/10.1007/s44273-025-00052-5, 2025.
Chen, S., Chen, B., Wang, S., Sun, L., Shi, H., Liu, Z., Wang, Q., Li, H., Zhu, T., Li, D., Xia, Y., Zhao, Z., Wang, L., and Wang, L.: Spatiotemporal variations of atmospheric nitrogen deposition in China during 2008–2020, Atmos. Environ., 315, 120120, https://doi.org/10.1016/j.atmosenv.2023.120120, 2023.
EANET: Data Report 2020, https://monitoring.eanet.asia/document/public/download?cd=262 (last access: 19 May 2025), 2021.
EANET: Data Report 2023, https://monitoring.eanet.asia/document/public/download?cd=299 (last access: 19 May 2025), 2024.
Endo, T., Yagoh, H., Sato, K., Matsuda, K., Hayashi, K., Noguchi, I., and Sawada, K.: Regional characteristics of dry deposition of sulfur and nitrogen compounds at EANET sites in Japan from 2003 to 2008, Atmos. Environ., 45, 1259–1267, https://doi.org/10.1016/j.atmosenv.2010.12.003, 2011.
EPA: Reactive Nitrogen in the United States: An Analysis of Inputs, Flows, Consequences, and Management Options: A Report of the EP A Science Advisory Board, https://nepis.epa.gov/Exe/ZyPDF.cgi/P100DD0K.PDF?Dockey=P100DD0K.PDF (last access: 19 May 2025), 2011.
Flechard, C. R., Massad, R.-S., Loubet, B., Personne, E., Simpson, D., Bash, J. O., Cooter, E. J., Nemitz, E., and Sutton, M. A.: Advances in understanding, models and parameterizations of biosphere-atmosphere ammonia exchange, Biogeosciences, 10, 5183–5225, https://doi.org/10.5194/bg-10-5183-2013, 2013.
Fu, X., Wang, S. X., Ran, L. M., Pleim, J. E., Cooter, E., Bash, J. O., Benson, V., and Hao, J. M.: Estimating NH3 emissions from agricultural fertilizer application in China using the bi-directional CMAQ model coupled to an agro-ecosystem model, Atmos. Chem. Phys., 15, 6637–6649, https://doi.org/10.5194/acp-15-6637-2015, 2015.
Galmarini, S., Makar, P., Clifton, O. E., Hogrefe, C., Bash, J. O., Bellasio, R., Bianconi, R., Bieser, J., Butler, T., Ducker, J., Flemming, J., Hodzic, A., Holmes, C. D., Kioutsioukis, I., Kranenburg, R., Lupascu, A., Perez-Camanyo, J. L., Pleim, J., Ryu, Y.-H., San Jose, R., Schwede, D., Silva, S., and Wolke, R.: Technical note: AQMEII4 Activity 1: evaluation of wet and dry deposition schemes as an integral part of regional-scale air quality models, Atmos. Chem. Phys., 21, 15663–15697, https://doi.org/10.5194/acp-21-15663-2021, 2021.
Gessler, A., Rienks, M., and Rennenberg, H.: NH3 and NO2 fluxes between beech trees and the atmosphere – correlation with climatic and physiological parameters, New Phytol., 147, 539–560, https://doi.org/10.1046/j.1469-8137.2000.00712.x, 2000.
Hansen, K., Sørensen, L. L., Hertel, O., Geels, C., Skjøth, C. A., Jensen, B., and Boegh, E.: Ammonia emissions from deciduous forest after leaf fall, Biogeosciences, 10, 4577–4589, https://doi.org/10.5194/bg-10-4577-2013, 2013.
Hayashi, K., Matsuda, K., Takahashi, A., and Nakaya, K.: Atmosphere–forest exchange of ammoniacal nitrogen in a subalpine deciduous forest in central Japan during a summer week, Asian J. Atmos. Environ., 5, 134–143, https://doi.org/10.5572/ajae.2011.5.2.134, 2011.
Hayashi, K., Ono, K., Tokida, T., Takimoto, T., Mano, M., Miyata, A., and Matsuda, K.: Atmosphere–rice paddy exchanges of inorganic particles and relevant gases during a week in winter and a week in summer, J. Agric. Meteorol., 68, 55–68, https://doi.org/10.2480/agrmet.68.1.8, 2012.
Hayashi, K., Ono, K., Matsuda, K., Tokida, T., and Hasegawa, T.: Characteristics of atmosphere–rice paddy exchange of gaseous and particulate reactive nitrogen in terms of nitrogen input to a single-cropping rice paddy area in central Japan, Asian J. Atmos. Environ., 11, 202–216, https://doi.org/10.5572/ajae.2017.11.3.202, 2017.
Hayashi, K., Shibata, H., Oita, A., Nishina, K., Ito, A., Katagiri, K., Shindo, J., and Winiwarter, W.: Nitrogen budgets in Japan from 2000 to 2015: Decreasing trend of nitrogen loss to the environment and the challenge to further reduce nitrogen waste, Environ. Pollut., 286, 117559, https://doi.org/10.1016/j.envpol.2021.117559, 2021.
Husted, S. and Schjoerring, J. K.: Ammonia flux between oilseed rape plants and the atmosphere in response to changes in leaf temperature, light intensity, and air humidity (interactions with leaf conductance and apoplastic NH4+ and H+ concentrations), Plant Physiol., 112, 67–74, https://doi.org/10.1104/pp.112.1.67, 1996.
Igarashi, Y., Kumagai, T., Yoshifuji, N., Sato, T., Tanaka, N., Tanaka, K., Suzuki, M., and Tantasirin, C.: Environmental control of canopy stomatal conductance in a tropical deciduous forest in northern Thailand, Agr. For. Meteorol., 202, 1–10, https://doi.org/10.1016/j.agrformet.2014.11.013, 2015.
Ishida, A., Yamaji, K., Nakano, T., Ladpala, P., Popradit, A., Yoshimura, K., Saiki, S., Maeda, T., Yoshimura, J., Koyama, K., Diloksumpun, S., and Marod, D.: Comparative physiology of canopy tree leaves in evergreen and deciduous forests in lowland Thailand, Sci. Data, 10, 601, https://doi.org/10.1038/s41597-023-02468-6, 2023.
Jongenelen, T., van Zanten, M., Dammers, E., Wichink Kruit, R., Hensen, A., Geers, L., and Erisman, J. W.: Validation and uncertainty quantification of three state-of-the-art ammonia surface exchange schemes using NH3 flux measurements in a dune ecosystem, Atmos. Chem. Phys., 25, 4943–4963, https://doi.org/10.5194/acp-25-4943-2025, 2025.
Khoomsab, K., Khummongkol, P., and Matsuda, K.: Trends in sulfate dry deposition over mixed dipterocarp forest in Thailand using relaxed eddy accumulation method, Sains Malaysiana, 43, 369–375, 2014.
Kuriyama, K. and Hayashi, K.: Sustainable agriculture and the nitrogen issue, in: Economics of Sustainable Agriculture, edited by: Kuriyama, K., Global Environmental Studies, Springer, Singapore, https://doi.org/10.1007/978-981-96-3502-3_1, 2025.
Kurokawa, J. and Ohara, T.: Long-term historical trends in air pollutant emissions in Asia: Regional Emission inventory in ASia (REAS) version 3, Atmos. Chem. Phys., 20, 12761–12793, https://doi.org/10.5194/acp-20-12761-2020, 2020.
Liu, L., Zhang, X., Xu, W., Liu, X., Wei, J., Wang, Z., and Yang, Y.: Global estimates of dry ammonia deposition inferred from space measurements, Sci. Total Environ., 730, 139189, https://doi.org/10.1016/j.scitotenv.2020.139189, 2020.
Matsuda, K., Watanabe, I., Wingpud, V., Theramongkol, P., Khummongkol, P., Wangwongwatana, S., and Totsuka, T.: Ozone dry deposition above a tropical forest in the dry season in northern Thailand, Atmos. Environ., 39, 2571–2577, https://doi.org/10.1016/j.atmosenv.2005.01.011, 2005.
Matsuda, K., Watanabe, I., Wingpud, V., Theramongkol, P., and Ohizumi, T.: Deposition velocity of O3 and SO2 in the dry and wet season above a tropical forest in northern Thailand, Atmos. Environ., 40, 7557–7564, https://doi.org/10.1016/j.atmosenv.2006.07.003, 2006.
Matsuda, K., Fujimura, Y., Hayashi, K., Takahashi, A., and Nakaya, K.: Deposition velocity of PM2.5 sulfate in the summer above a deciduous forest in central Japan, Atmos. Environ., 44, 4582–4587, https://doi.org/10.1016/j.atmosenv.2010.08.015, 2010.
Matsuda, K., Sase, H., Murao, N., Fukazawa, T., Khoomsub, K., Chanonmuang, P., Visaratana, T., and Khummongkol, P.: Dry and wet deposition of elemental carbon on a tropical forest in Thailand, Atmos. Environ., 54, 282–287, https://doi.org/10.1016/j.atmosenv.2012.02.022, 2012.
Melman, E. A., Rutledge-Jonker, S., Braam, M., Frumau, K. F. A., Moene, A. F., Shapkalijevski, M., Vilà-Guerau de Arellano, J., and van Zanten, M. C.: Increasing complexity in Aerodynamic Gradient flux calculations inside the roughness sublayer applied on a two-year dataset, Agric. For. Meteorol., 355, 110107, https://doi.org/10.1016/j.agrformet.2024.110107, 2024.
Melman, E. A., Rutledge-Jonker, S., Frumau, K. F. A., Hensen, A., van Pul, W. A. J., Stolk, A. P., Wichink Kruit, R. J., and van Zanten, M. C.: Measurements and model results of a two-year dataset of ammonia exchange over a coniferous forest in the Netherlands, Atmos. Environ., 344, 120976, https://doi.org/10.1016/j.atmosenv.2024.120976, 2025.
Moene, A. F. and van Dam, J. C.: Transport in the atmosphere–vegetation–soil continuum, Cambridge University Press, Cambridge, https://doi.org/10.1017/CBO9781139043137, 2014.
Murata, N., Ohta, S., Ishida, A., Kanzaki, M., Wachirinrat, C., Artchawakom, T., and Sase, H.: Comparison of soil depths between evergreen and deciduous forests as a determinant of their distribution, Northeast Thailand, J. For. Res., 14, 212–220, https://doi.org/10.1007/s10310-009-0127-7, 2009.
Murata, N., Ohta, S., Ishida, A., Kanzaki, M., Wachirinrat, C., Artchawakom, T., and Sase, H.: Soil depth and soil water regime in a catchment where tropical dry evergreen and deciduous forests coexist, J. For. Res., 17, 37–44, https://doi.org/10.1007/s10310-010-0248-z, 2011.
Myneni, R., Knyazikhin, Y., and Park, T.: MCD15A3H MODIS/Terra+Aqua Leaf Area Index/FPAR 4-day L4 Global 500 m SIN Grid V006, NASA EOSDIS Land Processes DAAC [data set], https://doi.org/10.5067/MODIS/MCD15A3H.006, 2015.
Nakahara, S., Takagi, K., Sorimachi, A., Katata, G., and Matsuda, K.: Enhancement of dry deposition of PM2.5 nitrate in a cool temperate forest, Atmos. Environ., 212, 136–141, https://doi.org/10.1016/j.atmosenv.2019.05.053, 2019.
Neirynck, J., Kowalski, A. S., Carrara, A., and Ceulemans, R.: Driving forces for ammonia fluxes over mixed forest subjected to high deposition loads, Atmos. Environ., 39, 5013–5024, https://doi.org/10.1016/j.atmosenv.2005.05.027, 2005.
Nishina, K., Watanabe, M., Koshikawa, M. K., Takamatsu, T., Morino, Y., Nagashima, T., Soma, K., and Hayashi, S.: Varying sensitivity of mountainous streamwater base-flow NO concentrations to N deposition in the northern suburbs of Tokyo, Sci. Rep., 7, 7701, https://doi.org/10.1038/s41598-017-08111-w, 2017.
Nishina, K., Ito, A., Zhou, F., Yan, X., Hayashi, S., and Winiwarter, W.: Historical trends of riverine nitrogen loading from land to the East China Sea: a model-based evaluation, Environ. Res. Commun., 3, 085005, https://doi.org/10.1088/2515-7620/ac1ce8, 2021.
Nishina, K., Hayashi, K., Oita, A., Asada, K., Hayakawa, A., Okadera, T., Onodera, T., Hanaoka, T., Tsuchiya, K., Kobayashi, K., and Koga, N.: Feasibility assessment of Japan's fertilizer reduction target: A meta-analysis and its implications for nitrogen waste, J. Environ. Manage., 373, 123362, https://doi.org/10.1016/j.jenvman.2024.123362, 2025.
Osada, K.: Measurement report: Short-term variation in ammonia concentrations in an urban area increased by mist evaporation and emissions from a forest canopy with bird droppings, Atmos. Chem. Phys., 20, 11941–11954, https://doi.org/10.5194/acp-20-11941-2020, 2020.
Pitman, J. I.: Ecophysiology of tropical dry evergreen forest, Thailand: Measured and modelled stomatal conductance of Hopea ferrea, a dominant canopy emergent, J. Appl. Ecol., 33, 1366–1378, https://doi.org/10.2307/2404777, 1996.
Ramsay, R., Di Marco, C. F., Sörgel, M., Heal, M. R., Carbone, S., Artaxo, P., de Araùjo, A. C., Sá, M., Pöhlker, C., Lavric, J., Andreae, M. O., and Nemitz, E.: Concentrations and biosphere–atmosphere fluxes of inorganic trace gases and associated ionic aerosol counterparts over the Amazon rainforest, Atmos. Chem. Phys., 20, 15551–15584, https://doi.org/10.5194/acp-20-15551-2020, 2020.
Ramsay, R., Di Marco, C. F., Heal, M. R., Sörgel, M., Artaxo, P., Andreae, M. O., and Nemitz, E.: Measurement and modelling of the dynamics of NH3 surface–atmosphere exchange over the Amazonian rainforest, Biogeosciences, 18, 2809–2825, https://doi.org/10.5194/bg-18-2809-2021, 2021.
Rubin, H. J., Fu, J. S., Dentener, F., Li, R., Huang, K., and Fu, H.: Global nitrogen and sulfur deposition mapping using a measurement–model fusion approach, Atmos. Chem. Phys., 23, 7091–7102, https://doi.org/10.5194/acp-23-7091-2023, 2023.
Rudek, J., Aneja, V. P., and Abrol, Y. P.: Concepts for considerations in the design of an Indian integrated nitrogen assessment, in: The Indian Nitrogen Assessment, edited by: Abrol, Y. P., Adhya, T. K., Aneja, V. P., Raghuram, N., Pathak, H., Kulshrestha, U., Sharma, C., and Singh, B., Elsevier, Amsterdam, 29–43, https://doi.org/10.1016/B978-0-12-811836-8.00003-3, 2017.
Rutledge-Jonker, S., Braam, M., Hoogerbrugge, R., Wichink Kruit, R., Nemitz, E., Twigg, M., Moene, A., Stolk, A., and van Pul, A.: Ammonia deposition measured with Conditional Time-Averaged Gradient (COTAG) systems in the Netherlands: methodological advances and results for 2012–2020, Rijksinstituut voor Volksgezondheid en Milieu, Bilthoven, https://doi.org/10.21945/RIVM-2022-0202, 2023.
Sase, H., Matsuda, K., Visaratana, T., Garivait, H., Yamashita, N., Kietvuttinon, B., Hongthong, B., Luangjame, J., Khummongkol, P., Shindo, J., Endo, T., Sato, K., Uchiyama, S., Miyazawa, M., Nakata, M., and Lenggoro, I. W.: Deposition process of sulfate and elemental carbon in Japanese and Thai forests, Asian J. Atmos. Environ., 6, 246–258, https://doi.org/10.5572/ajae.2012.6.4.246, 2012.
Sase, H., Yamashita, N., Luangjame, J., Garivait, H., Kietvuttinon, B., Visaratana, T., Kamisako, M., Kobayashi, R., Ohta, S., Shindo, J., Hayashi, K., Toda, H., and Matsuda, K.: Alkalinization and acidification of stream water with changes in atmospheric deposition in a tropical dry evergreen forest of northeastern Thailand, Hydrol. Process., 31, 836–846, https://doi.org/10.1002/hyp.11062, 2017.
Saylor, R. D., Walker, J. T., Wu, Z., Chen, X., Schwede, D. B., Oishi, A. C., and Lichiheb, N.: Dynamic ammonia exchange within a mixed deciduous forest canopy in the Southern Appalachians, Ecol. Model., 501, 111007, https://doi.org/10.1016/j.ecolmodel.2024.111007, 2025.
Schulte, R. B., van Zanten, M. C., Rutledge-Jonker, S., Swart, D. P. J., Wichink Kruit, R. J., Krol, M. C., van Pul, W. A. J., and Vilà-Guerau de Arellano, J.: Unraveling the diurnal atmospheric ammonia budget of a prototypical convective boundary layer, Atmos. Environ., 249, 118153, https://doi.org/10.1016/j.atmosenv.2020.118153, 2021.
Shapkalijevski, M., Moene, A. F., Ouwersloot, H. G., Patton, E. G., and Vilà-Guerau de Arellano, J.: Influence of canopy seasonal changes on turbulence parameterization within the roughness sublayer over an orchard canopy, Appl. Meteor. Climatol., 55, 1391–1407, https://doi.org/10.1175/JAMC-D-15-0205.1, 2016.
Sutton, M. A., Burkhard, J. K., Guerin, D., Nemitz, E., and Fowler, D.: Development of resistance models to describe measurements of bi-directional ammonia surface–atmosphere exchange, Atmos. Environ., 32, 473–480, https://doi.org/10.1016/S1352-2310(97)00164-7, 1998.
Sutton, M. A., Howard, C. M., Erisman, J. W., Billen, G., Bleeker, A., Grennfelt, P., van Grinsven, H., and Grizzetti, B. (Eds.): The European nitrogen assessment – sources, effects and policy perspectives, Cambridge Univ. Press, Cambridge, https://doi.org/10.1017/CBO9780511976988, 2011.
Tammadid, W., Sangkachai, B., Chanonmuang, P., Chidthaisong, A., and Hanpattanakit, P.: Comparison and environmental controls of soil respiration in primary and secondary dry dipterocarp forests in Thailand, Front. For. Glob. Change, 7, 1294942, https://doi.org/10.3389/ffgc.2024.1294942, 2024.
Tanaka, R., Chiu, C.-W., Gomi, T., Matsuda, K., Izuta, T., and Watanabe, M.: Stomatal ozone uptake of a Quercus serrata stand based on sap flow measurements with calibrated thermal dissipation sensors, Sci. Total Environ., 888, 164005, https://doi.org/10.1016/j.scitotenv.2023.164005, 2023.
Ueda, M. U., Kachina, P., Marod, D., Nakashizuka, T., and Kurokawa, H.: Soil properties and gross nitrogen dynamics in old growth and secondary forest in four types of tropical forest in Thailand, For. Ecol. Manage., 398, 130–139, https://doi.org/10.1016/j.foreco.2017.05.010, 2017.
Vickers, D. and Mahrt, L.: Quality control and flux sampling problems for tower and aircraft Data, J. Atmos. Oceanic Technol., 14, 512–526, https://doi.org/10.1175/1520-0426(1997)014<0512:QCAFSP>2.0.CO;2, 1997.
Walker, J. T., Chen, X., Wu, Z., Schwede, D., Daly, R., Djurkovic, A., Oishi, A. C., Edgerton, E., Bash, J., Knoepp, J., Puchalski, M., Iiames, J., and Miniat, C. F.: Atmospheric deposition of reactive nitrogen to a deciduous forest in the southern Appalachian Mountains, Biogeosciences, 20, 971–995, https://doi.org/10.5194/bg-20-971-2023, 2023.
Wang, K., Kang, P., Lu, Y., Zheng, X., Liu, M., Lin, T.-J., Butterbach-Bahl, K., and Wang, Y.: An open-path ammonia analyzer for eddy covariance flux measurement, Agric. For. Meteorol., 308–309, 108570, https://doi.org/10.1016/j.agrformet.2021.108570, 2021.
Wen, Z., Xu, W., Li, Q., Han, M., Tang, A., Zhang, Y., Luo, X., Shen, J., Wang, W., Li, K., Pan, Y., Zhang, L., Li, W., Collett, J. L., Zhong, B., Wang, X., Goulding, K. W. T., Zhang, F., and Liu, X.: Changes of nitrogen deposition in China from 1980 to 2018, Environ. Int., 144, 106022, https://doi.org/10.1016/j.envint.2020.106022, 2020.
Wentworth, G. R., Murphy, J. G., Benedict, K. B., Bangs, E. J., and Collett Jr., J. L.: The role of dew as a night-time reservoir and morning source for atmospheric ammonia, Atmos. Chem. Phys., 16, 7435–7449, https://doi.org/10.5194/acp-16-7435-2016, 2016.
Wolff, V., Trebs, I., Ammann, C., and Meixner, F. X.: Aerodynamic gradient measurements of the NH3-HNO3-NH4NO3 triad using a wet chemical instrument: an analysis of precision requirements and flux errors, Atmos. Meas. Tech., 3, 187–208, https://doi.org/10.5194/amt-3-187-2010, 2010.
Wu, Z., Xu, M., Sorimachi, A., Sase, H., Watanabe, M., and Matsuda, K.: Dry deposition of nitric acid gas by long-term measurement above and below a forest canopy, Asian J. Atmos. Environ., 18, 11, https://doi.org/10.1007/s44273-024-00034-z, 2024.
Xu, M. and Matsuda, K.: Dry deposition of PM2.5 nitrate in a forest according to vertical profile measurements, Asian J. Atmos. Environ., 14, 367–377, https://doi.org/10.5572/ajae.2020.14.4.367, 2020.
Xu, M., Kasahara, K., Sorimachi, A., and Matsuda, K.: Nitric acid dry deposition associated with equilibrium shift of ammonium nitrate above a forest by long-term measurement using relaxed eddy accumulation, Atmos. Environ., 256, 118454, https://doi.org/10.1016/j.atmosenv.2021.118454, 2021.
Xu, M., Umehara, M., Sase, H., and Matsuda, K.: Ammonia fluxes over an agricultural field in growing and fallow periods using relaxed eddy accumulation, Atmos. Environ., 284, 119195, https://doi.org/10.1016/j.atmosenv.2022.119195, 2022.
Xu, M., Chanonmuang, P., and Matsuda, K.: Vertical profile and flux measurements of ammonia in a deciduous forest in Japan towards improvement of bi-directional exchange model, Atmos. Environ., 315, 120144, https://doi.org/10.1016/j.atmosenv.2023.120144, 2023.
Xu, M., Matsumoto, R., Chanonmuang, P., and Matsuda, K.: Vertical profile measurements for ammonia in a Japanese deciduous forest using denuder sampling technique: ammonia emissions near the forest floor, Asian J. Atmos. Environ., 18, 21, https://doi.org/10.1007/s44273-024-00042-z, 2024.
Yamaga, S., Ban, S., Xu, M., Sakurai, T., Itahashi, S., and Matsuda, K.: Trends of sulfur and nitrogen deposition from 2003 to 2017 in Japanese remote areas, Environ. Pollut., 289, 117842, https://doi.org/10.1016/j.envpol.2021.117842, 2021.
Yamashita, N., Ohta, S., Sase, H., Kievuttinon, B., Luangjame, J., Visaratana, T., and Garivait, H.: Seasonal changes in multi-scale spatial structure of soil pH and related parameters along a tropical dry evergreen forest slope, Geoderma, 165, 31–39, https://doi.org/10.1016/j.geoderma.2011.06.020, 2011.
Yamashita, N., Sase, H., and Kurokawa, J.: Assessing critical loads and exceedances for acidification and eutrophication in the forests of East and Southeast Asia: A comparison with EANET monitoring data, Sci. Total Environ., 851, 158054, https://doi.org/10.1016/j.scitotenv.2022.158054, 2022.
Zhang, L., Wright, L. P., and Asman, W. A. H.: Bi-directional air-surface exchange of atmospheric ammonia: A review of measurements and a development of a big-leaf model for applications in regional-scale air-quality models, J. Geophys. Res. Atmos., 115, D20310, https://doi.org/10.1029/2009JD013589, 2010.
Zhou, K., Xu, W., Zhang, L., Ma, M., Liu, X., and Zhao, Y.: Estimating nitrogen and sulfur deposition across China during 2005 to 2020 based on multiple statistical models, Atmos. Chem. Phys., 23, 8531–8551, https://doi.org/10.5194/acp-23-8531-2023, 2023.