the Creative Commons Attribution 4.0 License.
the Creative Commons Attribution 4.0 License.
 | 09 Dec 2025
Stratospheric hydration and ice microphysics of a convective overshoot observed during the TPEx campaign over Sweden
Patrick Konjari
Martina Krämer
Armin Afchine
Nicole Spelten
Irene Bartolome Garcia
Annette Miltenberger
Nicolas Emig
Philipp Joppe
Johannes Schneider
Andreas Petzold
Heiko Bozem
Peter Hoor
This study examines the cloud microphysical properties and trace gas signatures associated with a convective overshooting event observed during the TPEx (TropoPause composition gradients and mixing Experiment) campaign in June 2024 over Sweden. While recent studies have predominantly focused on convective overshootings in sub(tropical) air masses, this particular event took place during a cold air outbreak characterized by low tropopause altitudes of 9 km. The measurements by the microphysical cloud spectrometer reveal that ice particles were transported into the lower stratosphere, with detections extending up to 1.5 km above the tropopause. At this altitude, a pronounced stratospheric ozone concentration of approximately 600 ppbv and a notable tropospheric water vapor concentration of up to 60 ppmv (+30 ppmv) were recorded, the latter being twice as high as background levels at the same height. This substantial injection of tropospheric air and ice particles was linked to gravity wave breaking, and subsequently irreversible mixing near the overshooting top. Forward trajectories indicate that the impact of the overshoot on the lower stratosphere, especially regarding the observed hydration, is relatively short-lived with a life time of several days (at 330 K) to weeks (at 345 K).
- Article
(11751 KB) - Full-text XML
- BibTeX
- EndNote


Convection plays an important role in transporting air masses from lower altitudes into the upper troposphere (UT), sometimes even penetrating the tropopause and injecting tropospheric air into the lower stratosphere (LS). This phenomenon is known as overshooting convection (OC). It is the fastest mechanism for mixing air between the troposphere and stratosphere – a process referred to as stratosphere-troposphere exchange (STE) – and can result in the irreversible transfer of air masses between the two layers. Various studies have concluded that OC significantly influences the chemical composition of the stratosphere and occurs not only in the tropics but also in the mid-latitudes (e.g., Cooney et al., 2018; Homeyer et al., 2024; Jensen et al., 2024). However, the global frequency of OC, as well as the associated dynamical transport processes and their impact on LS composition, remain poorly understood. This highlights the importance of further studying these events to gain deeper insights into the nature of OC and its potential influence on the global climate.
Convective overshoots in particular lead to the injection of water vapor (H2Ogas) and ice into the stratosphere. Their influence on the H2Ogas budget is especially important due to the sensitivity of the UT/LS region to changes in H2Ogas; even small variations in UT/LS H2Ogas have been found to substantially alter the Earth radiative budget (Riese et al., 2012; Banerjee et al., 2019; Gettelman et al., 2011). Previous studies have mostly focused on convective hydration in the tropics, with particular emphasis on the Asian Monsoon (Rolf et al., 2017; Khaykin et al., 2022; Konopka et al., 2022, 2023). However, several studies indicate that convection in the extratropics may also play a significant role in STE, particularly in moistening the extratropical transition layer (exTL) (Homeyer et al., 2014; Smith et al., 2017; Gordon et al., 2024; Sayres et al., 2024), with most case studies centered on convective systems over the US. For example, based on in-situ measurements over the US Midwest, Homeyer et al. (2023) observed an increase in H2Ogas of up to 26 % (1.2 ppmv) at 19.25 km altitude (potential temperature: 463 K) originating from a fresh overshoot. Using both in-situ and satellite (MLS) data, Jensen et al. (2024) found that high anomalies of H2Ogas (>8 ppmv) above the cold-point tropopause occur predominantly in the extratropics – particularly over North America – and almost never in the tropics, not even during the Asian monsoon season.
Despite the high frequency of strong H2Ogas anomalies over North America, it remains to be assessed how these events influence the stratospheric H2Ogas budget over the long term (i.e., several months or more). Wang et al. (2023) used a high-resolution numerical weather prediction model to investigate the lifetime of such H2Ogas plumes. Water injected into the stratospheric overworld – defined by potential temperatures (Θ) greater than 380 K, a threshold chosen because the 380 K is the lowest isentropic surface lying entirely above the tropopause globally, throughout all seasons, thereby marking the lower boundary of the permanently stratospheric air mass – was mostly retained in the stratosphere. In contrast, in the LS, about 50 % of the H2O mass was returned to the UT, driven by convectively induced perturbations, several hours after the overshoot (Wang et al., 2023). Cooney et al. (2018) analyzed radar reflectivity data over the US and estimated that 45 % of overshooting events reached the stratospheric overworld. Based on in situ measurements, Sayres et al. (2024) showed that convection increased the water vapor mixing ratio in parts of the North American Monsoon Anticyclone by as much as 40 % at 380 K in the summer season.
Concerning the convective impact on the global stratospheric H2O budget, the studies by Ueyama et al. (2023) and Dauhut and Hohenegger (2022) estimate it to be in the range of 10 %. However, this estimate is subject to considerable uncertainty, as these studies primarily account for tropical convection while largely neglecting extratropical events. Another major contributor to this uncertainty is the sensitivity of simulations to the choice of convective and microphysical parameterizations (Lu et al., 2018; Pandey et al., 2022). For this reason, in-situ measurements are critically important, as they provide essential data for improving the representation of these key processes. This, in turn, helps to better resolve convection and the associated stratosphere-troposphere exchange (STE), ultimately leading to more accurate assessments of the global impact of overshoots on stratospheric composition. Due to the considerable challenges involved in measuring within or near active convective systems, however, in-situ data on overshoots remain scarce. Most of the existing measurements were taken in the vicinity of convective cores rather than within the cores themselves.
In order to assess the global distribution of OC, satellite data are essential. Liu et al. (2020) used satellite observations from the Global Precipitation Measurement Mission (Hou et al., 2014) to map the global distribution of convection reaching the tropopause within the ±65° latitude band. Despite limitations related to satellite resolution, such data provide valuable insights into the global occurrence of these events. Their results indicate that OC occurs frequently not only in mid-latitudes but also in high-latitude regions over N. America, N. Europe, and boreal Asia. Although these events generally do not penetrate as deeply into the stratosphere (Liu et al., 2020), their occurrence in these regions is notable.
An example of a mid-latitude overshoot outside the US was described by Khordakova et al. (2022), who analyzed balloon-borne measurements from a convective system over Germany. They reported significant increases in stratospheric H2Ogas – for instance, up to 12 (+7) ppmv at Θ=365 K – during two overshoot events. This highlights the need for further studies to investigate the influence of overshooting convection over Europe and other extratropical regions outside North America.
Our measurements during the TPEx (TropoPause composition gradients and mixing Experiment) campaign in May and June 2024 provide new evidence of a convective overshoot over southern Sweden (59° N). This event occurred significantly further north than any previously documented case with direct in-situ evidence. What makes this case particularly noteworthy is that it was associated with a polar air mass outbreak, occurring in the absence of subtropical air throughout the troposphere. Nevertheless, convection-driven mixing into the stratosphere was clearly observed, including the presence of ice particles several kilometers above the tropopause.
We analyze this case using in-situ measurements of trace gases (water vapor, ozone, nitrous oxide), cloud microphysical properties, and aerosol distributions, in combination with ECMWF ERA5 reanalysis data and satellite observations of H2Ogas from the Microwave Limb Sounder (MLS) and model simulations by the ICON (ICOsahedral Nonhydrostatic) modeling framework. Additionally, model output from CLaMS (Chemical Lagrangian Model of the Stratosphere) is used to investigate the transport of air masses injected into the LS and the involved ice microphysical processes. The instruments and models used are described in Sect. 2. The results are presented in Sect. 3, and Sects. 4 and 5 provides a discussion and conclusion of the findings, respectively.
2.1 In-situ measurements
During the TPEx campaign, various in-situ instruments onboard a Learjet measured the chemical and microphysical characteristics of the convective overshoot. This includes trace gas measurements (water vapor, ozone, nitrous oxide) and particle size distributions in the ice and aerosol range. The instruments are summarized in Table 1.
Zöger et al. (1999)Meyer et al. (2015)Neis et al. (2015)Johnson et al. (2014)Müller et al. (2015)Krämer et al. (2016)Bundke et al. (2015)Moore et al. (2021)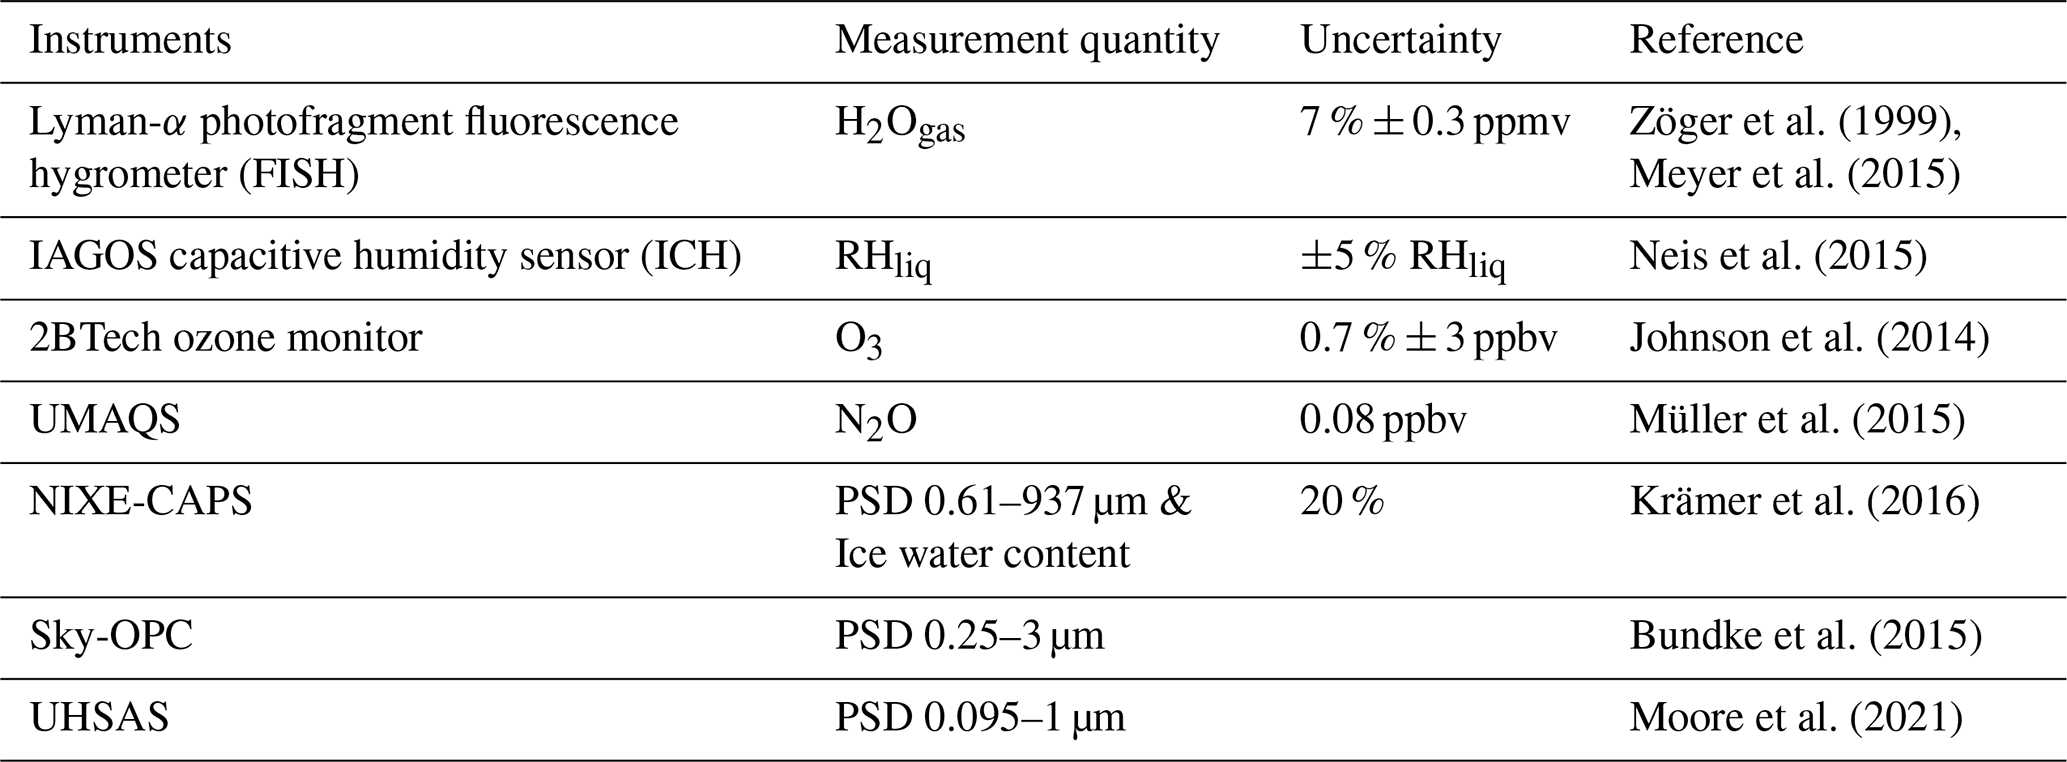
2.1.1 Particle size distribution
In this study, we use particle size distributions (PSD) measured by three different instruments that cover distinct size ranges within the aerosol and ice particle domains. The Novel Ice Experiment (NIXE Krämer et al., 2016) instrument is a modified version of the Cloud, Aerosol and Precipitation Spectrometer (CAPS) (called NIXE-CAPS). It measures particles from 0.61 to 937 µm, thereby encompassing the full ice particle size range (>3 µm). In the UT/LS, the upper size limit of 937 µm is typically only reached during convective events with strong updrafts; otherwise, NIXE-CAPS covers the entire typical range of cirrus ice particle sizes.
To complement the NIXE-CAPS measurements, the lower size range of the aerosol spectrum is covered by the optical particle counter (Sky-OPC; Bundke et al., 2015) and the Ultra-High-Sensitivity Aerosol Spectrometer (UHSAS; Cai et al., 2008; Kupc et al., 2018), which provide particle PSD in the 0.25–3 µm and 0.095–1000 nm ranges, respectively. Both instruments operate based on the light scattering properties of aerosols. The UHSAS uses a Nd3+:YLiF4 solid-state laser emitting at 1054 nm, while the Sky-OPC employs a Class 3B laser diode emitting at 655 nm. The two instruments and their configuration during TPEx are described in detail in (Joppe et al., 2025) and Bozem et al. (2025).
Because the NIXE-CAPS PSD has limited significance in the aerosol size range (i.e., <3 µm), Sky-OPC data are used for particles down to its lower detection limit of 0.25 µm, and UHSAS measurements are applied below that threshold. In the overlapping particle size range covered by both the Sky-OPC and UHSAS, the measurements show good agreement (Bozem et al., 2025).
2.1.2 Trace gas measurements
This study analyzes measurements of water vapor (H2Ogas), ozone (O3), and nitrous oxide (N2O). H2Ogas is of particular interest in this convective case due to the substantial upward transport of H2Ogas during such events. N2O and O3 serve as tracers to differentiate between tropospheric and stratospheric air masses: N2O remains nearly constant in the troposphere (approximately 340 ppbv in this case) but decreases in the stratosphere, whereas O3 exhibits the opposite behavior, with typical concentrations around the tropopause near 100 ppbv (Zahn et al., 2004). The combined use of stratospheric and tropospheric tracers enables the identification of flight segments influenced by stratosphere-troposphere exchange (STE) processes.
The H2Ogas mixing ratio is measured using the Fast In-situ Stratospheric Hygrometer (FISH; Zöger et al., 1999).The instrument detects low H2Ogas concentrations typical of the UT/LS with an accuracy of 6 %–8 % in the range of 1 to 1000 ppmv (Meyer et al., 2015). Measurements are provided with a frequency of 1 s.
In addition to the H2Ogas measurements by FISH, a IAGOS capacitive humidity sensor (ICH Neis et al., 2015) was installed onboard, which provides measurements of relative humidity with respect to liquid (RHliq). Measurements are provided every second. However, at low temperatures in the UT/LS, the sensor's response time can extend to several tens of seconds.
The ICH is equipped with a platinum resistance sensor (Pt100), allowing simultaneous measurement of ambient temperature alongside humidity. The overall uncertainty of the ambient air temperature is ±0.5 K, which includes the error of Pt100 itself and the error resulting from the data processing (Berkes et al., 2017; Petzold et al., 2020). The temperature data were used for converting relative humidity into H2Ogas mixing ratios and for calculating potential temperature.
FISH H2Ogas measurements from this specific flight suffered from an offset due to a contamination, which was corrected using the ICH. While FISH provides higher temporal resolution and is more effective in capturing rapid fluctuations and filaments of H2Ogas, the ICH supports this by ensuring measurement accuracy through offset adjustment. Rolf et al. (2023) has demonstrated that both instruments usually exhibit good agreement in principle in this H2Ogas range.
N2O is measured using the Quantum Cascade Laser-based spectrometer UMAQS (Müller et al., 2015). N2O concentrations are derived from its absorption feature at 1006 cm−1, with measurements provided at a frequency of 1 Hz and an uncertainty of 0.08 ppbv.
O3 is measured using a 2B Technologies ozone monitor (Johnson et al., 2014; Bozem et al., 2025), which exploits ozone's strong absorption at approximately 254 nm. Ambient air is pumped into a detection cell where a low-pressure mercury lamp emits ultraviolet light; a photodiode measures the transmitted light intensity. With its measurement range from 1 ppbv to 100 ppmv, the instrument can capture both high stratospheric (>100 ppbv) as well as lower tropospheric concentrations, with an uncertainty of 0.7 % + 3 ppbv.
2.2 Satellite measurements by the microwave limb sounder and Meteosat second generation
In this study data from the Microwave Limb Sounder (MLS) launched on NASA's Aura Mission in 2004 (Schoeberl et al., 2006) are utilized. Water vapor Level 1.5 data (Version 5) are taken from Goddard Spaceflight Center DAAC (http://mls.jpl.nasa.gov, last access: 3 December 2025).
MLS scans the microwave emission from the earth atmosphere at its limb, from surface height to 90 km. With its near-polar and sun-synchronous orbit, MLS covers the region from 82° S to 82° N. The resolution is 200 to 300 km horizontally and 2.5 km (in 316–215 hPa) vertically. The accuracy between 316 and 147 hPa is better than 25 %. The precision decreases in regions with increasing water vapor gradients, due to resolution limitations. Read et al. (2007) found a precision of 65 % at 316 hPa, and 25 % at 147 hPa. For the characterization of the sampled and overflown convective system, Level 1.5 reflectivity observations by MSG (Meteosat Second Generation) SEVIRI (Spinning Enhanced Visible Infra-Red Imager) at 10.8 µm (SEVIRI channel 9) are utilized (Bedka, 2011). The data were downloaded from the Eumetsat data platform (https://data.eumetsat.int, last access: 3 December 2025).
2.3 Model data
2.3.1 ECMWF ERA5 reanalysis
The ERA5 reanalysis dataset (Hersbach et al., 2020), provided by the European Centre for Medium-Range Weather Forecasts (ECMWF), offers hourly meteorological parameters from 1959 to the present. These data are available at a horizontal resolution of approximately 30 km, with 137 vertical model levels extending up to an altitude corresponding to 0.1 hPa. In this study, hourly ERA5 data are used at a longitude-latitude resolution of 0.25°. Along the aircraft flight path, the relative position to the first and, when applicable, second WMO thermal tropopause, as well as the equivalent latitude calculated from potential vorticity fields, are interpolated using the CLaMS model toolset (described in Sect. 2.3.3).
2.3.2 ICON
We use the ICOsahedral Nonhydrostatic (ICON) modeling framework (version 2024.7, https://www.icon-model.org/, last access: 3 December 2025) to place the in situ measurements in a larger context. The simulation starts on the 12 June 2024 at 00:00 UTC and finishes at 15:00 UTC of the same day, covering the initiation of the convection and its development to the mature stage.
ICON allows nested simulations, i.e., a global domain with embedded domains of higher spatial resolution (nests) that can be coupled in both directions, so called two-way nesting. This means that the coarser parent nest provides the boundary forcing to the higher resolution child nest and the solution of the child nest is nudged into to the parent simulation every time step (Zängl et al., 2022). The set up of the simulation includes a global domain (R03B07 grid with effective grid spacing of 13 km) and two nests centered in the region of the observations. The two nests expand from 0–24° E (2–22° E) and 50–66° N (52–64° N). Thereby, the simulation domain includes part of the flight path and covers the region where convection was observed. The innermost domain has a horizontal resolution of ≈3.3 km (R03B09) with a vertical resolution of 150 m between ≈2 and 14 km with a progressively decreasing vertical resolution up to model top at 40 km.
In the global domain and in the first nest, deep convection is parameterized using the Tiedtke-Bechtold convection scheme (Tiedtke, 1989; Bechtold et al., 2008). For the second nest, only shallow convection is parameterized with deep convection being the result of the model dynamics. Non-orographic gravity wave drag, sub-grid scale orographic drag (Lott and Miller, 1997; Orr et al., 2010) and turbulence are parameterized using the standard ICON schemes in all domains. Radiation is treated with the ecRad radiation scheme (Hogan and Bozzo, 2018; implementation in ICON: Rieger et al., 2019). The simulation represents cloud processes with the double-moment scheme by Seifert and Beheng (2006). Recently, Lüttmer et al. (2024) extended their microphysics scheme by additional hydrometer classes, that allow for the differentiation of ice particles generated by different formation processes (e.g. immersion freezing, homogeneous freezing, secondary ice production). This set up allows for a first analysis on the studied convective case and motivates a future higher resolution simulation to analyze the structure and development of the overshoot in further detail.
2.3.3 CLaMS
The Chemical Lagrangian Model of the Stratosphere (CLaMS) is a global, three-dimensional chemical transport model (CTM) (McKenna et al., 2002). The CLaMS trajectory module is based on Lagrangian parcel tracking driven by ERA5 wind and diabatic tendencies for the vertical movement. For the calculation of ice microphysical properties a double moment bulk microphysics scheme (Spichtinger and Gierens, 2009) is utilized along the trajectories which includes schemes for homogeneous and heterogeneous ice nucleation, depositional growth and sublimation, aggregation and sedimentation.
3.1 Synoptic situation during the flight
The overshoot area lies within a strong trough that is bringing cold air masses of polar origin to the UT and LS, as indicated by the magenta arrow in Fig. 1a. As a result, air masses at 360 K are already located deep within the stratosphere, with PV values ranging from 3 to 5 PVU (potential vorticity units), and lapse-rate tropopause heights of approximately 300 hPa (around 9 km), as shown in the vertical profile over the overshoot region in Fig. 1b.
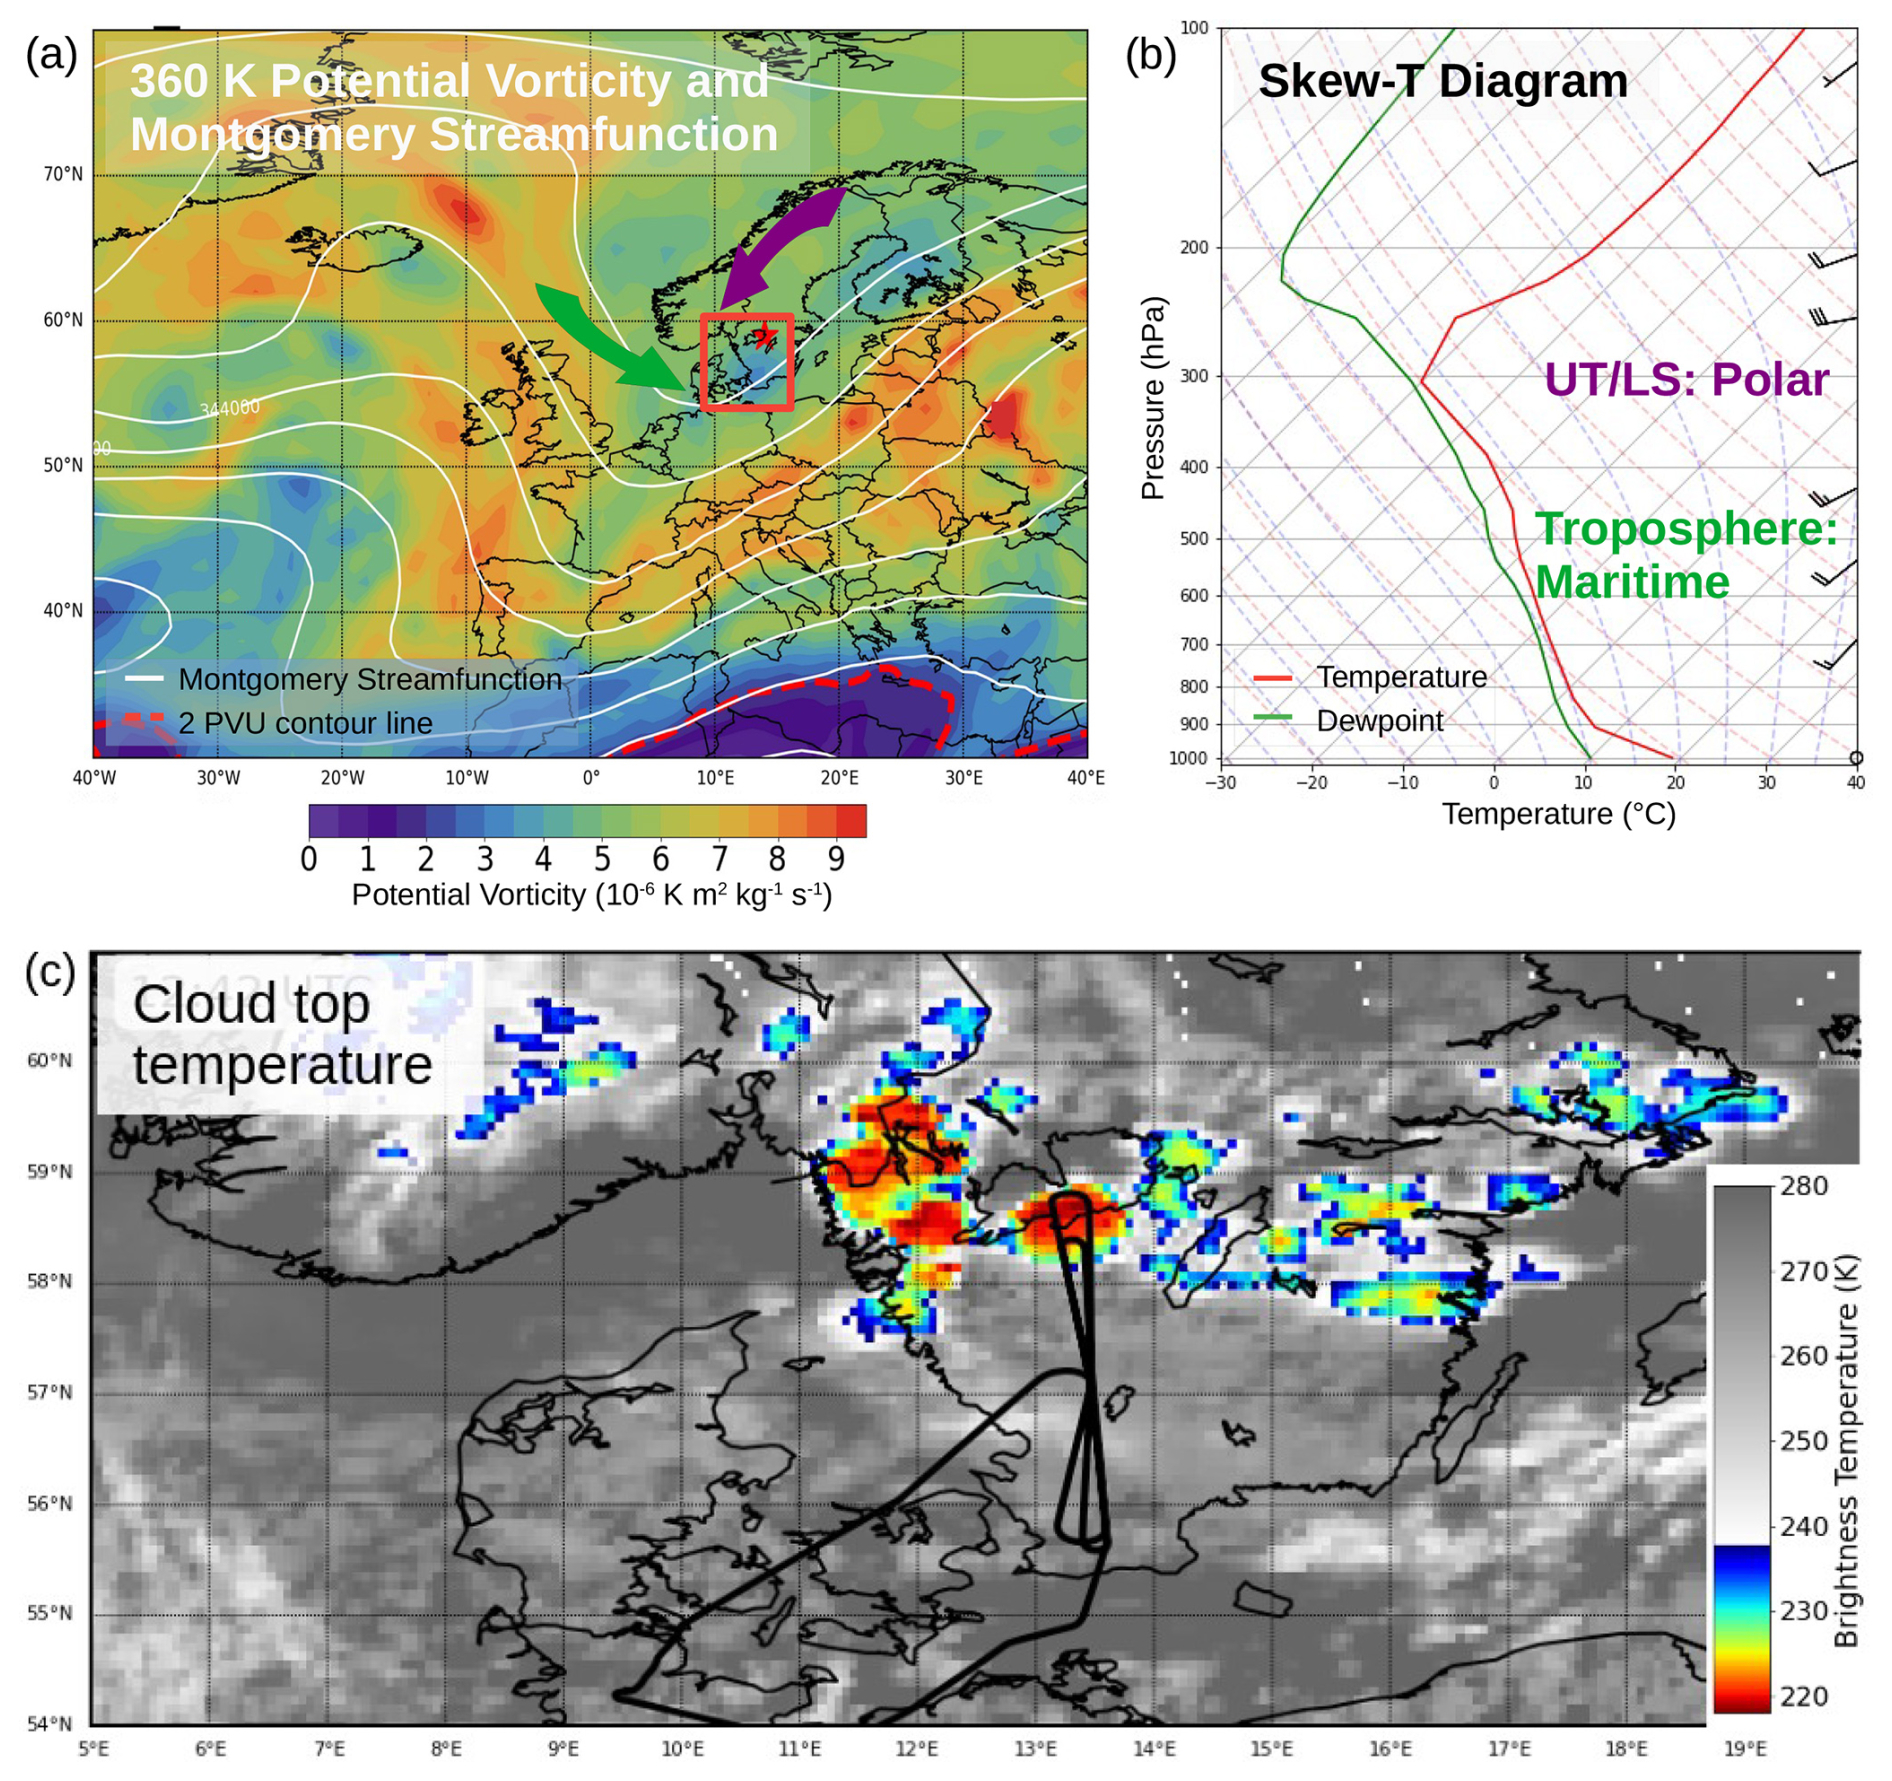
Figure 1Synoptic overview for 12 June 2024. (a) ERA5 potential vorticity and Montgomery Streamfunction at 360 K potential temperature level. The red box indicates the area of the research flight, and the red star the location of the convective overshoot. (b) For the location of the convective overshoot, Skew-T diagram from ERA5 data. (c) SEVIRI 10.8 µm brightness temperature at 12:30 UTC. The flight path is indicated by the black line.
The tropospheric air masses can be traced back to the Atlantic sector (40–50° N), with moist conditions due to warm conveyor belt uplift and subsequent outflow into the overshoot region. Compared to the colder polar air masses in the UT/LS region, these relatively milder tropospheric air masses, combined with a superadiabatic lapse rate near the surface, create favorable conditions for convective instability in the overshoot area.
The flight path is shown in Fig. 1c (black line), and the flight path as a function of potential temperature is presented in Fig. 2a. The overshooting convection occurred at the northernmost part of the flight path, between 58 and 59° N. Figure 2b displays the convective system, which had a multi-cellular structure, as seen in the SEVIRI 10.8 µm cloud-top brightness temperatures in Fig. 1c. Over the area of convection, the aircraft flew at four pressure levels: 330, 295, 245, and 210 hPa – thus covering the UT (PV < 2 PVU; see Fig. 2a), the tropopause region, and parts of the LS, where PV values reached up to 9 PVU.
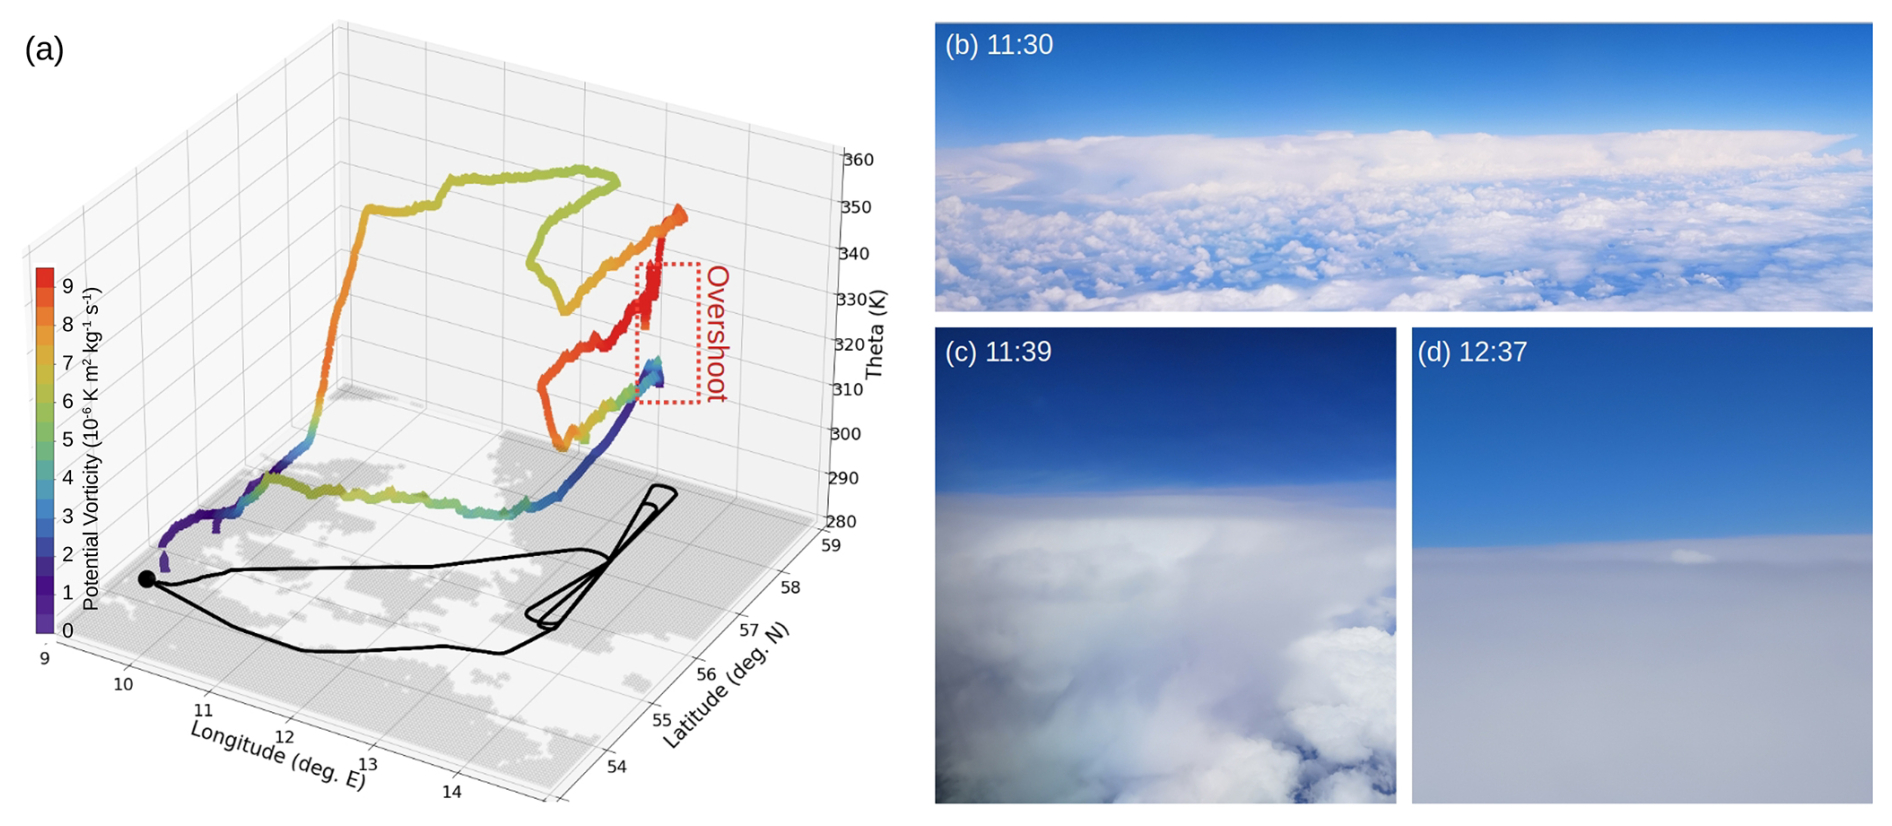
Figure 2F04 flight track. (a) Flight path and corresponding ERA5 potential vorticity; (b–d) images taken from the aircraft, with (b) showing the convective system from the distance, (c) the anvil cirrus of a cell from close up, and (d) overshooting convection penetrating the anvil cirrus.
3.2 Cloud, aerosol and trace gas in-situ measurements of the overshoot
The measurements along the flight track are summarized in Fig. 3, together with interpolated ERA5 data. The aircraft first flew through the convection from 11:40 to 11:55 UTC, at two flight levels (330 and 295 hPa; referred to as lvl1 and lvl2, respectively), and then again at two higher levels (245 and 210 hPa; referred to as lvl3 and lvl4) from 12:40 to 13:00 UTC (greyish areas in Fig. 3). For these two periods, Fig. 4 shows a more detailed evolution of the quantities within the convection.
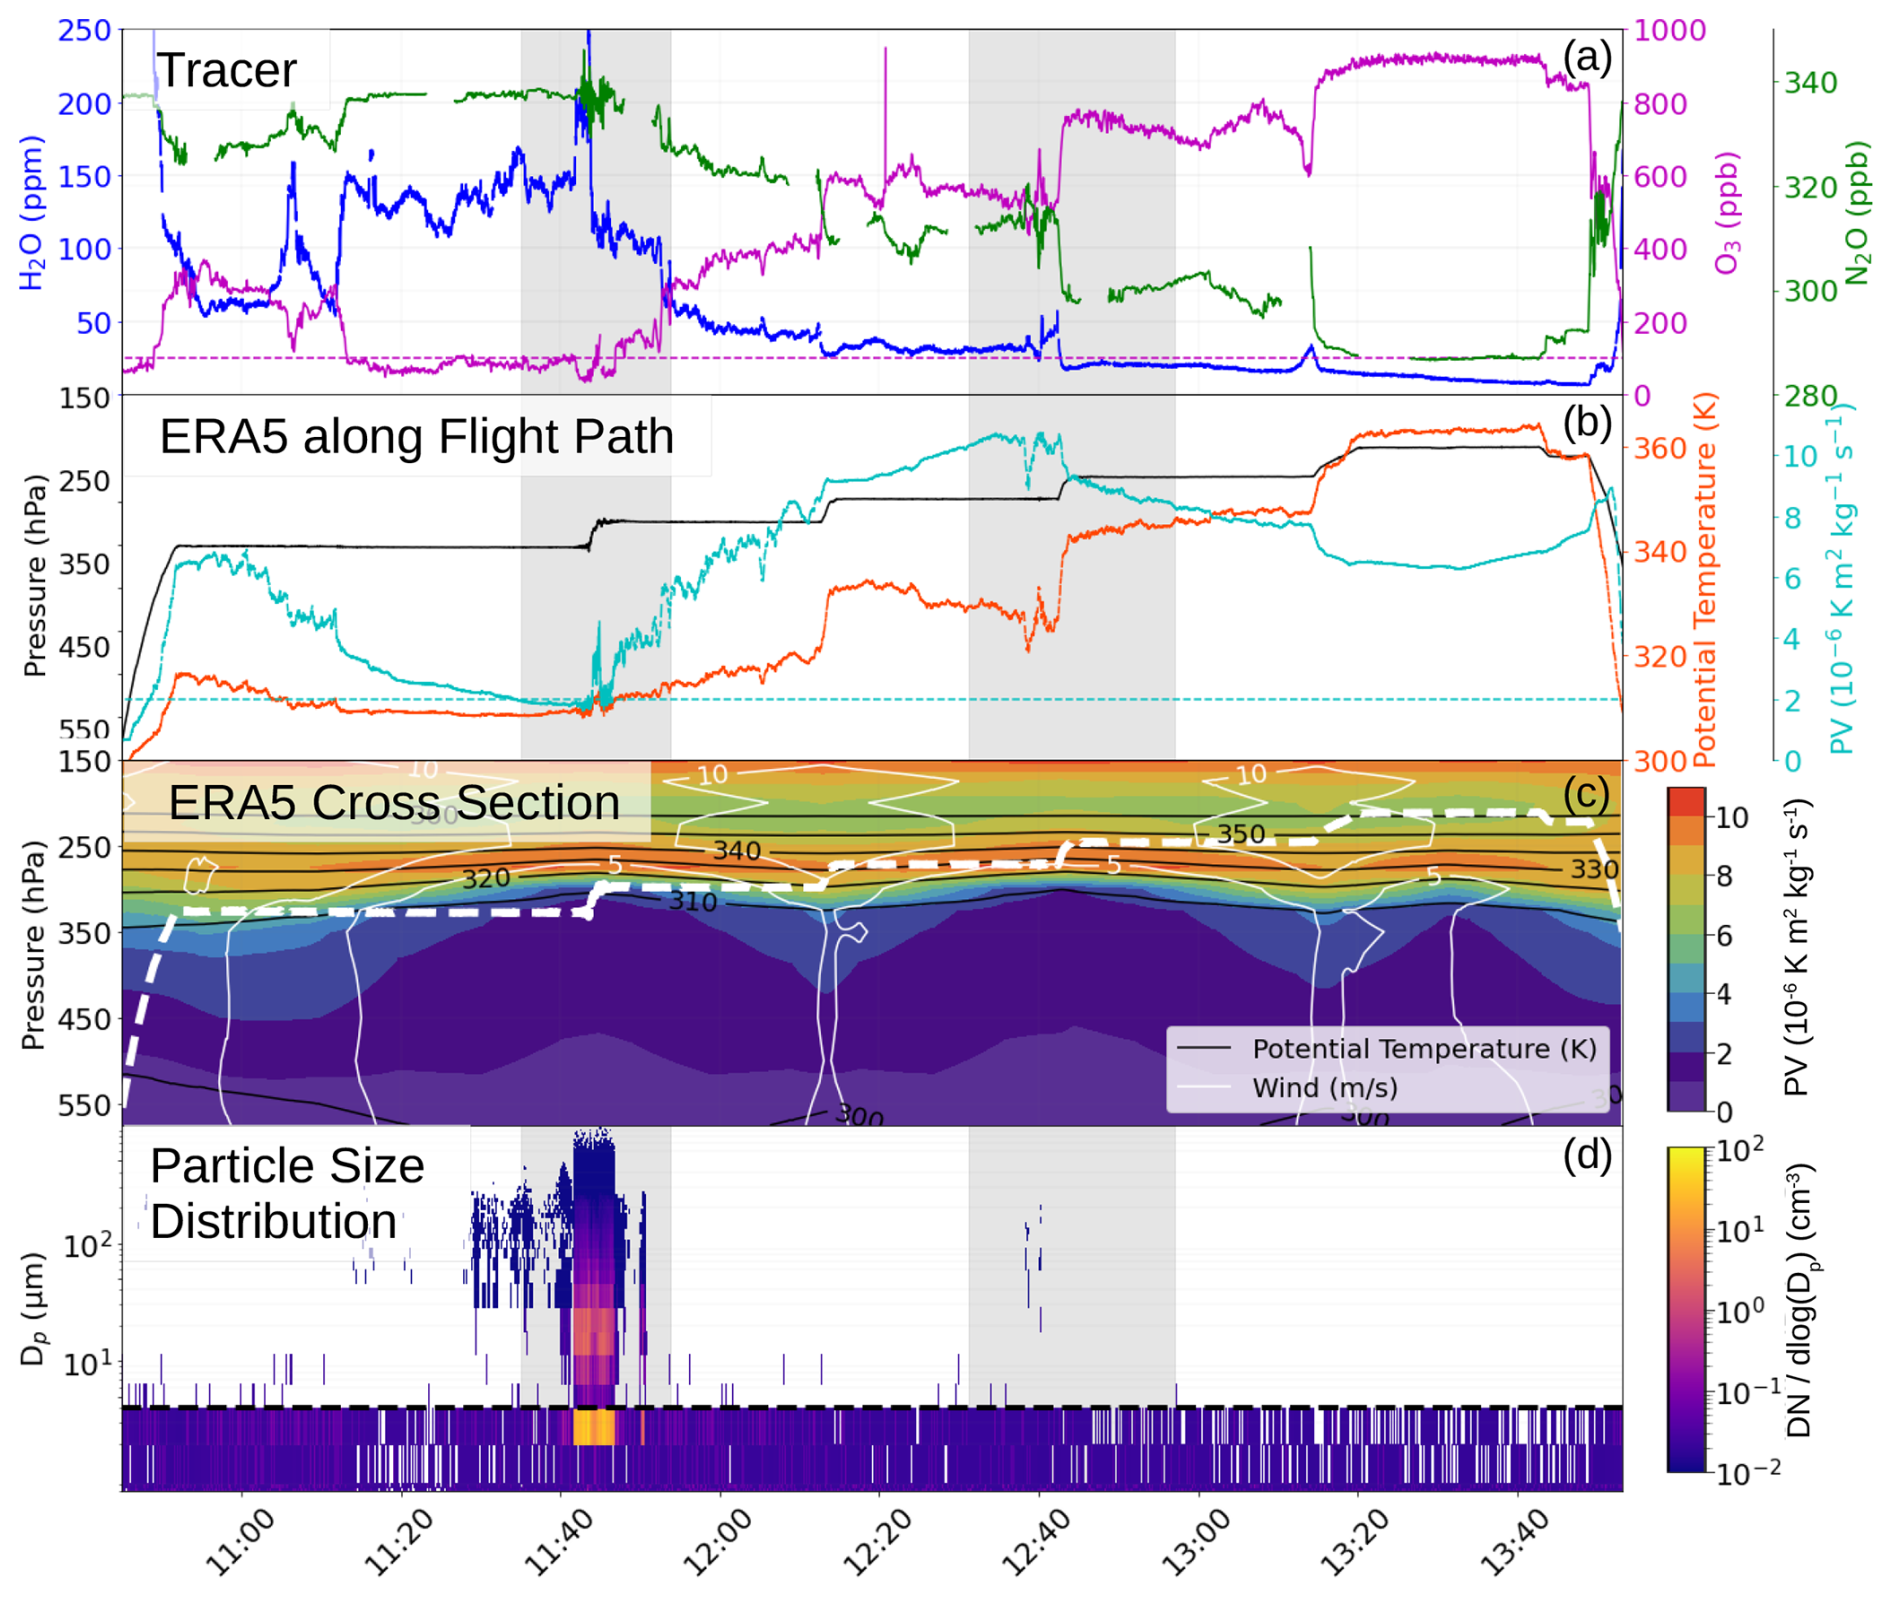
Figure 3In-situ measurement overview. During the 12 June 2024 flight, trace gas measurements; in dashed magenta 100 ppbv the O3 line (a), pressure, potential temperature and potential vorticity (ERA5); blue dashed line indicates the 2 PVU level (b), potential vorticity cross section and flight path (white dashed) (c), and measurements of the particle size distribution by NIXE-CAPS (3–937 µm), Sky-OPC (0.25–3 µm) and UHSAS (0.095–0.22 µm). The grey areas indicate the area north of 57° N, influenced by the convection.
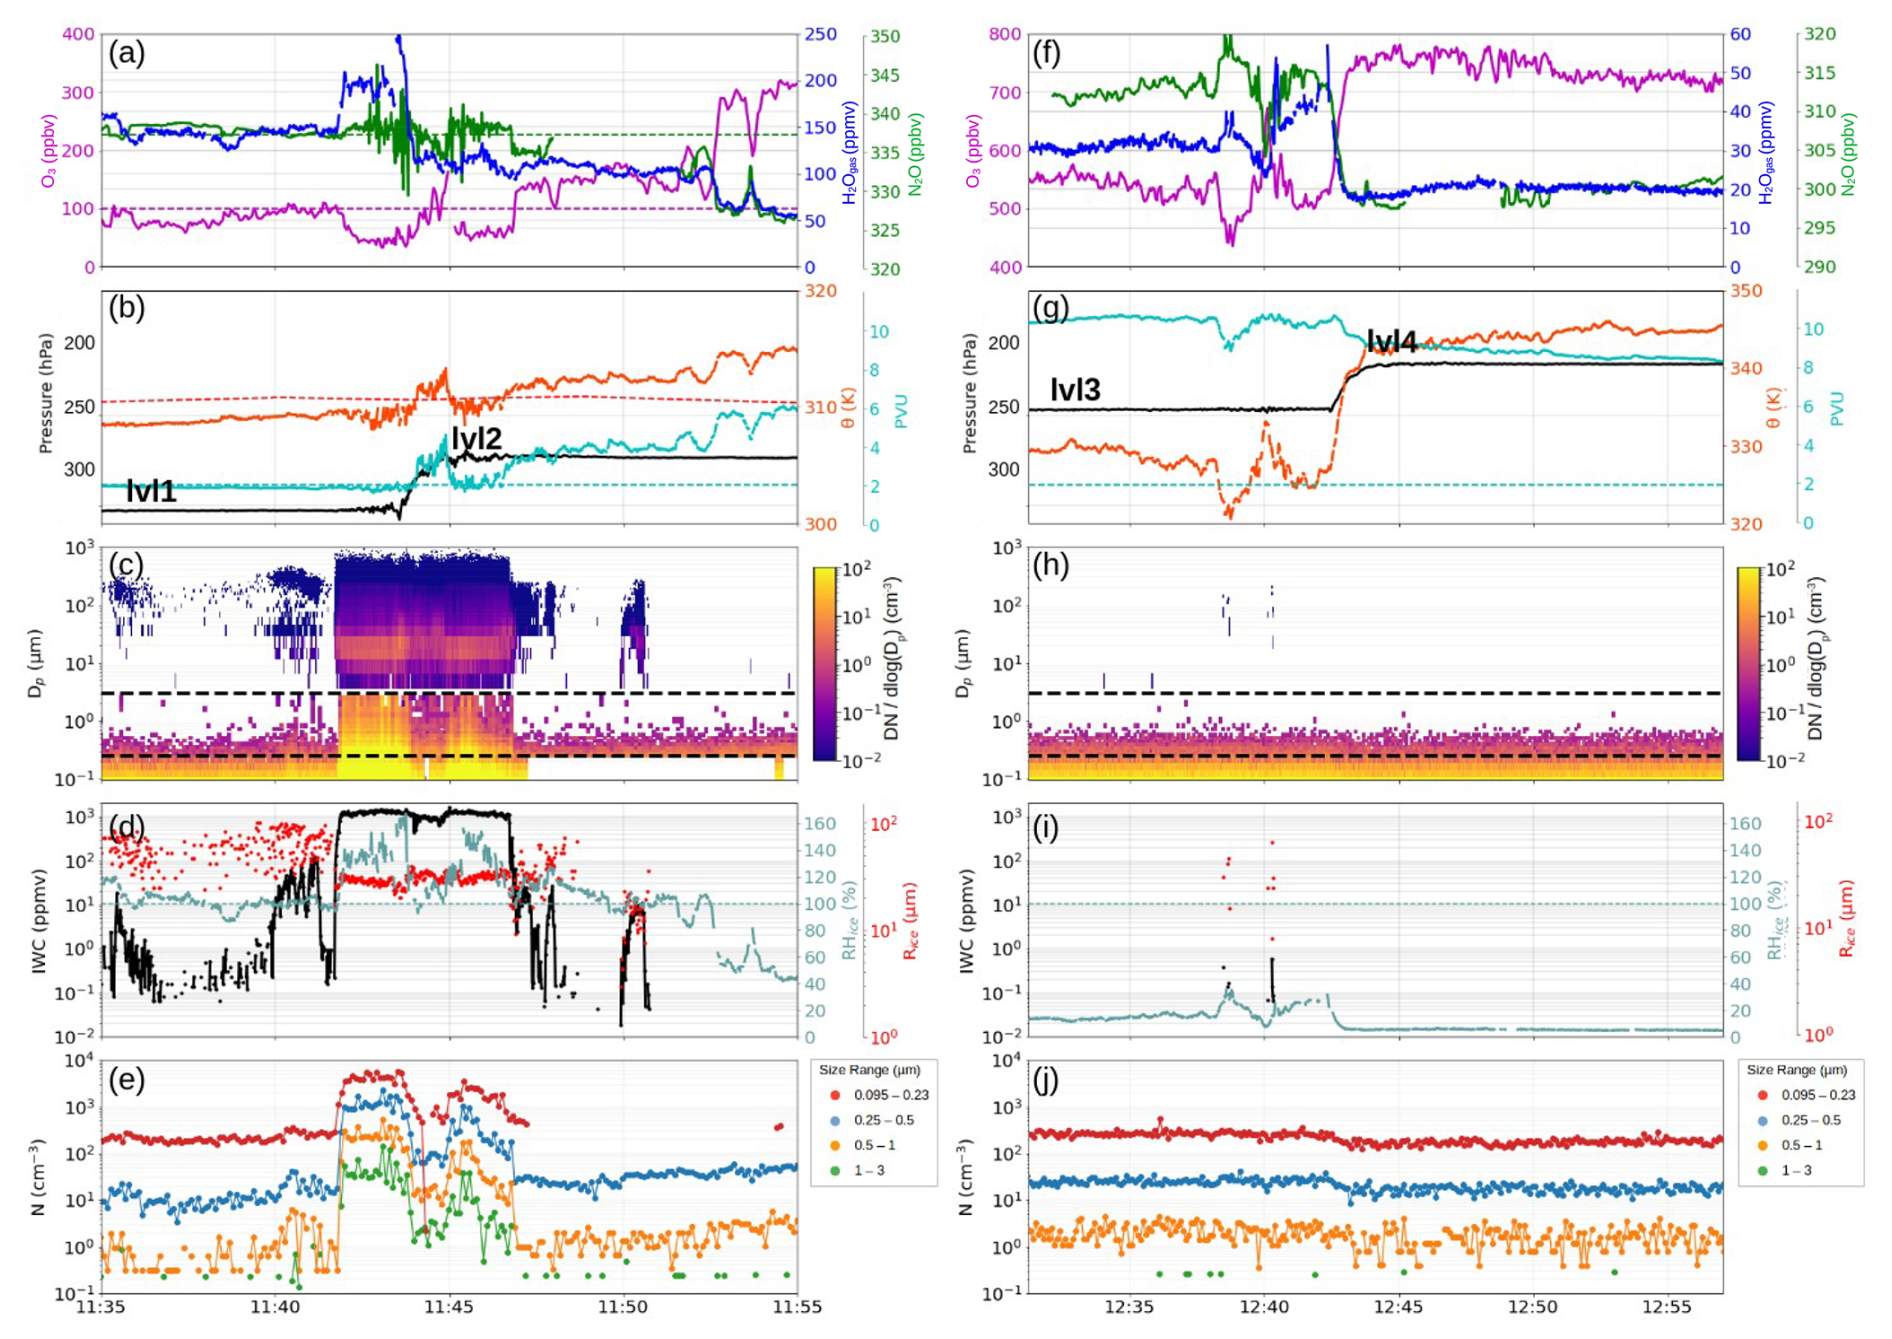
Figure 4Zoom into the in-situ measurements marked as gray areas in Fig. 3. (a)–(c) and (f)–(h) show the trace gas measurements, thermodynamic variables, and the particle size distributions, respectively. In (d, i), ice microphysical properties (IWC and Rice, as well as RHice are provided. The total number of particles for three aerosol size ranges is shown in (e, j).
Around 11:40 UTC, the aircraft flew through the anvil cirrus situated just at the tropopause (see also Fig. 2c), which is characterized by the presence of large ice particles, up to 500 µm in size. The occurrence of such large particles suggests that the ice particles have a liquid origin, meaning they consist of droplets that froze after being transported upwards (Krämer et al., 2020). The aerosol concentration slightly increases across all size ranges (Fig. 4e), while the concentrations of the trace gases remain relatively unchanged. O3 and N2O levels indicate that the flight is at or near tropopause height, with O3 values ranging from 90 to 105 ppbv and N2O at 337 ppbv. The high H2Ogas concentration, around 150 ppmv, can be attributed to the relatively high tropopause temperature of approximately −55 °C and the origin of the air mass, which comes from previously uplifted air over the Atlantic in a warm conveyor belt (see Sect. 3.1).
As the aircraft enters the convective core, the ice water content (IWC) increased to approximately 1000 ppmv. The highest IWC values peak at around 1450 ppmv. The air was strongly supersaturated, with relative humidity with respect to ice (RHice) ranging from 120 % to 160 %. The cloud contains a large number of small particles, as well as very large particles up to the upper detection limit of 0.9 mm. The high particle concentrations are a result of the freezing of previously liquid particles (large particles) but may also stem from additional homogeneous freezing (small particles) after the consumption of all heterogeneous ice nucleation particles, combined with high updrafts and the resulting high supersaturation (Krämer et al., 2016). The significant aerosol transport is evident from the size distributions, with total number concentrations increasing by a factor of 102 (<0.25 µm) to 103 (>0.25 µm).
H2Ogas increases to around 200 ppmv, with a peak near 250 ppmv. O3 values are around 50 ppbv, compared to approximately 100 ppbv (magenta dashed line) before entering the convection. N2O predominantly shows tropospheric values; however, strong fluctuations suggest possible mixing of stratospheric air from above.
As the aircraft ascends to lvl2 (295 hPa) at 11:45 UTC, O3 and N2O show strong, anti-correlated fluctuations (50–140 and 331–341 ppbv, respectively). These signatures of UT and LS O3 and N2O together with the high IWc of 1000 ppmv are indicative of strong STE. H2Ogas is still very high, with 100–120 ppmv and a corresponding ice supersaturation around 120 %. The potential temperature shows only a small increase, except for a local peak when the flight level changes. This can also be seen from Fig. 5a, where IWC along the flight track is shown as a function of potential temperature. In general, Θ gradients are lower within the convection (>58.5°) than outside, and in some segments at lvl2, Θ is even lower than at lvl1, i.e. static instability occurs (). Previous studies found that the occurrence of static instability within or close to an overshoot is related to gravity wave breaking (e.g., Sang et al., 2018; Qu et al., 2020; Wang, 2007), which leads to cross-isentropic transport of air from the overshoot to higher regions. However, it cannot be determined with certainty whether gravity wave breaking occurred, as additional information on the vertical structure (e.g., of Θ) or vertical wind speed measurements would be required, which were not available during this campaign.
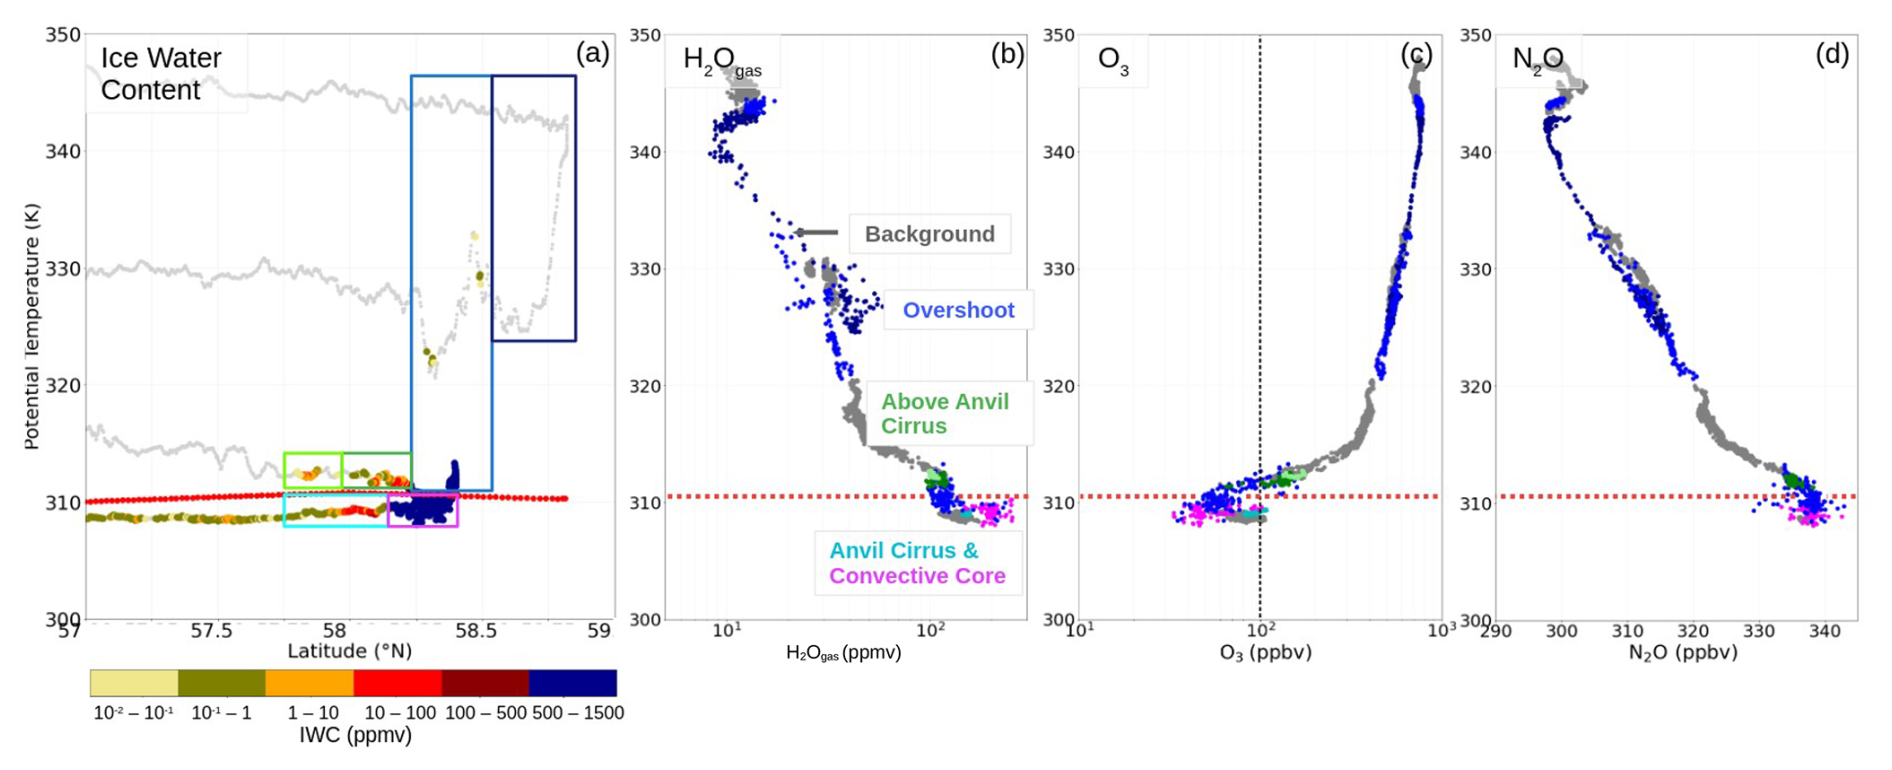
Figure 5Observations versus potential temperature. (a) IWC, (b) H2Ogas, (c) O3, and (d) N2O along the flight track, as function of latitude and potential temperature. The colored boxes in (a) and corresponding labels in (b) denote different filaments of convectively influenced air encountered along the flight path. The red dotted line marks the lapse rate tropopause, and the black dotted line in (c) the 100 ppbv O3 threshold.
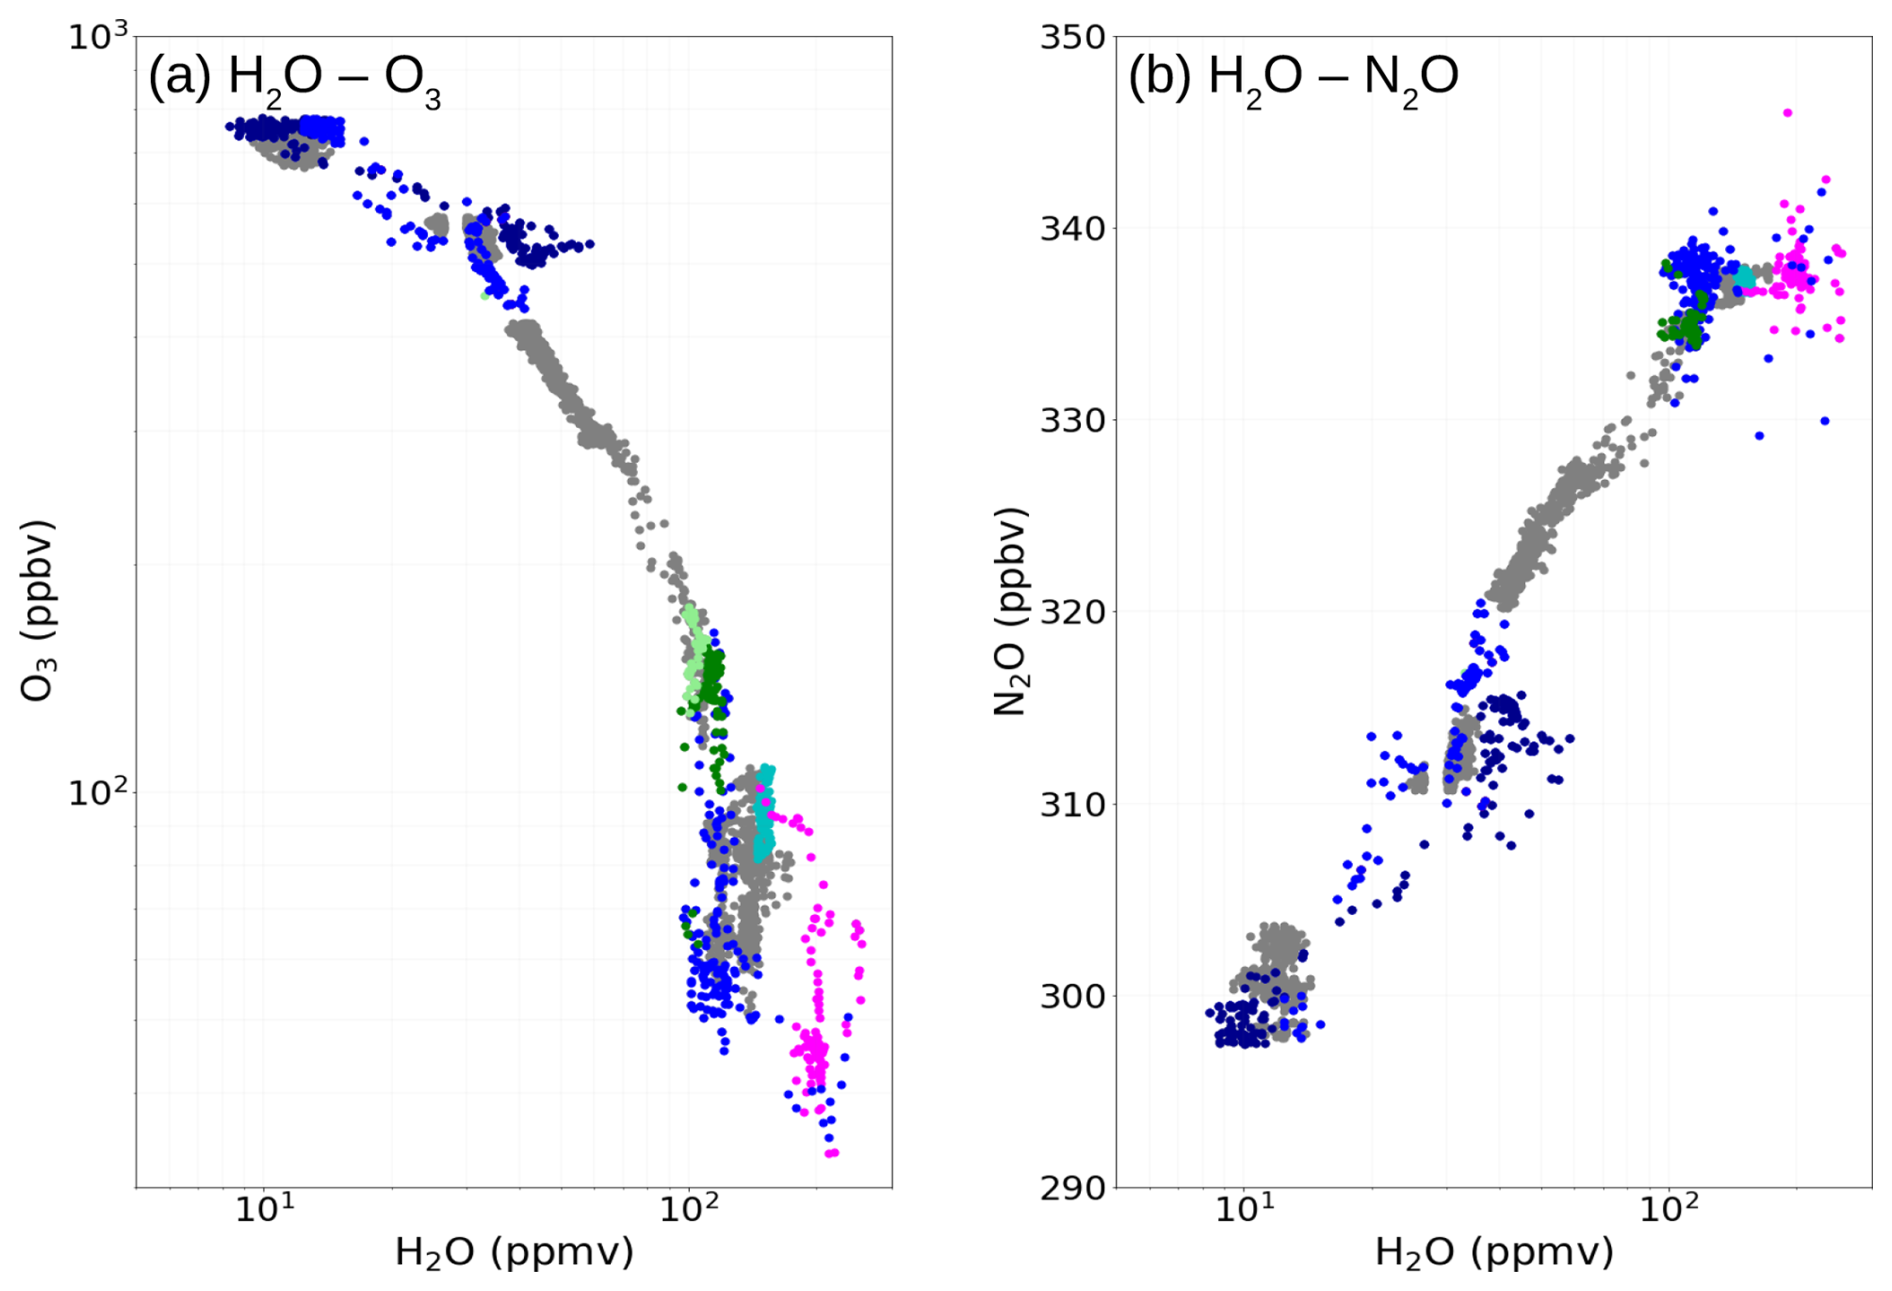
Figure 6Tracer–tracer correlation. The correlations are shown for H2Ogas with O3 (a) and N2O (b). The different colors marks the regimes defined in Fig. 5.
As the aircraft leaves the convective core at 11:47 UTC, O3 increases to 140–150 ppbv while N2O decreases to 335 ppbv which indicates that this segment is located slightly above the tropopause level. At the same time, ice particles are still present but concentrations and IWC are very low compared to the convective core (IWC of 10−1 to 101 ppmv). The occurrence of ice particles above the overshoot top is referred to as above-anvil cirrus and is a distinct feature that often occurs during OC events. These features were found to occur through the injection of ice particles related to gravity wave breaking at or close to the overshooting top (Homeyer et al., 2024).
H2Ogas stays at about the same amount (≈100 ppmv) as before, with RHice of ∼120 %. The PSD is now characterized by particles in the size range of 30–120 µm. The largest particles likely sedimented or did not reach this level. The small particles might be missing, because small ice particles grow in supersaturation to sizes larger than roughly 20 µm. If no new ice particles are nucleated (i.e., RHice remains below the heterogeneous/homogeneous freezing thresholds), the size range below ∼20 µm is depleted. This state is referred to as “matured cirrus” (Krämer et al., 2025). However, it is also possible that the missing of the small particles in the PSD is a result of a detection limit of the NIXE-CAPS for small particles if occurring in small concentrations.
At around 11:53 UTC, the air becomes significantly drier (H2Ogas≈60–70 ppmv), which occurs alongside a slight increase in potential temperature, associated with a temperature rise from 219 K (11:45 UTC) to 224 K. The lower observed temperature within the filament influenced by the overshoot is likely explained by diabatic cooling due to ice particle sublimation. This diabatic effect accounts for the stronger tropospheric trace gas signature within the overshoot at the same pressure level and is generally recognized as a process by which air masses injected into the stratosphere can partly be transformed back into the troposphere (Homeyer et al., 2024). Furthermore, radiative cooling near the cloud top could have contributed to the observed temperature decrease.
After about 1 h, at around 12:35 UTC, the area of convection is sampled again (see Fig. 2a), now at lvl3 (235 hPa). Here, the trace gas measurements indicate that the aircraft is situated in air masses with strong stratospheric influence. O3 values around 550 ppbv and N2O values around 315 ppbv are strongly indicative of stratospheric character, and H2Ogas is around 30 ppmv. At 12:40 UTC, while flying through the overshoot, the trace gas measurements show strong fluctuations (O3: 450–650 ppbv; H2Ogas: 20–60 ppmv). At the same time, filaments containing ice particles are observed, with low IWC of 10−1 to 1 ppmv. The air is strongly subsaturated (RHice: 20 %–40 %), indicating that the ice particles must have been transported to this location and did not form there.
The trace gas fluctuations correlate with strong variations in potential temperature, which result from temperature fluctuations of several degrees, while pressure remains nearly constant. Such pronounced fluctuations are explained by intense transport of momentum and energy from the overshoot, typically caused by wave activity. This could potentially lead to cross-isentropic transport of air from the overshoot to higher regions, through breaking of the wave (e.g., Sang et al., 2018; Qu et al., 2020).
In order to assess potential cross-isentropic mixing of air, Fig. 5b–d shows the trace gas measurements as a function of Θ. Measurements corresponding to different regimes in Fig. 5a are marked with dots in the respective box colours. Measurements outside these boxes are assumed to represent background conditions not notably influenced by the convection (greyish). The corresponding tracer–tracer (H2Ogas–O3 and H2Ogas–N2O) correlations are shown in Fig. 6a and b, respectively.
For lvl3 and lvl4 (corresponding to Θ of ≈325 and 345 K, respectively), measurements are available on the respective potential temperature levels both within and outside the convection, allowing for an estimate of the influence of cross-isentropic transport on local composition. For O3 and N2O, the observed fluctuations can be attributed to variations in the potential temperature field. In contrast, H2Ogas reveals filaments of both anomalously moist and drier air masses. Notably, air masses associated with ice particle occurrence (58.25–58.5° N; blue in Fig. 5) are even drier than the background, suggesting that turbulent downward mixing from higher layers may contribute to this dry anomaly.
Examining N2O, values are also lower than background in this segment – similar to the >58.5° N filament (dark blue), where H2Ogas shows values of up to 60 ppmv, representing a moisture enhancement of about 30 ppmv compared to the background. Overall, the N2O signature indicates potential net downward transport throughout the entire overshoot regime at lvl3, as covered by the measurements. This observation aligns with the findings of several studied (Gordon and Homeyer, 2022; Dauhut et al., 2018; Frey et al., 2015), who, based on large eddy simulations, showed that drier and warmer air from above intrudes after the collapse of the cold overshoot. This intrusion then facilitates further cross-isentropic mixing between overshoot-related air masses and those originating above, and facilitates sublimation of ice as the airmass is typically drier. However, any indication of gravity wave breaking cannot be confirmed, as this would also produce stronger fluctuations in tracers other than H2Ogas.
The enhanced H2Ogas observed in parts of the dark blue segment can thus be explained by the injection of ice followed by sublimation-driven moistening – implying that ice, rather than air mass transport, serves as the primary moisture source through the overshoot. Consequently, the potential temperature in the dark blue filament is several degrees lower due to diabatic cooling than in filaments encountered before the overshoot (<58° N). This diabatic descend was found to be a prominent feature associated with OC (Homeyer et al., 2024), and could additionally explain deeper stratospheric trace gas signature in parts of the overshoot regime.
At the next higher level (lvl4), corresponding to 345 K, no significant small-scale fluctuations in potential temperature or trace gas concentrations are observed. On a larger scale, however, H2Ogas increases from 8 ppmv (dark blue box) to 15 ppmv (light blue box), while O3 remains constant (no valid N2O measurements are available at this time). This increase in H2Ogas may still be linked to the influence of the convection.
At around 13:15 UTC another filament shows a strong H2Ogas increase, reaching up to 30 ppmv at 345 K. This filament is located several hundred kilometres away from the overshoot and lies opposite to the direction of the overshoot's forward transport. Back-trajectories indicate that the filament originated over the Atlantic and, prior to that, in polar regions. Thus, it is unlikely to have formed by convective injection from the observed overshoot; a more plausible explanation is alternative transport such as turbulence associated with a warm conveyor belt (WCB) uplift over the Atlantic or the influence of strong vertical wind shear near the jet.
3.3 Stratospheric moistening from model and satellite perspective
To gain deeper insight into the mixing processes during convection and to validate the simulation against in-situ measurements, we examine the high-resolution simulation (Δx≈3.3 km) performed with ICON, with the model setting described in Sect. 2.3.2. Furthermore, ERA5 reanalysis and MLS satellite data are used in the analysis.
For ICON, Fig. 7 illustrates the model results for H2Ogas and IWC as horizontal maps at three pressure levels. Examining the structure of the simulated convective system at 290 hPa (Fig. 7f), we find very good agreement with the position of the convective cells and the brightness temperature satellite images shown in Fig. 2c. At 290 hPa, the edges of the convective cells extend slightly above the thermal tropopause, as indicated by the magenta solid line marking the tropopause level, while the centers of the cells remain within the upper troposphere. This structure is similar to the observed convection, where at constant pressure, the center of the convective cell remained tropospheric, while the anvil cirrus extended into air masses with stratospheric character.
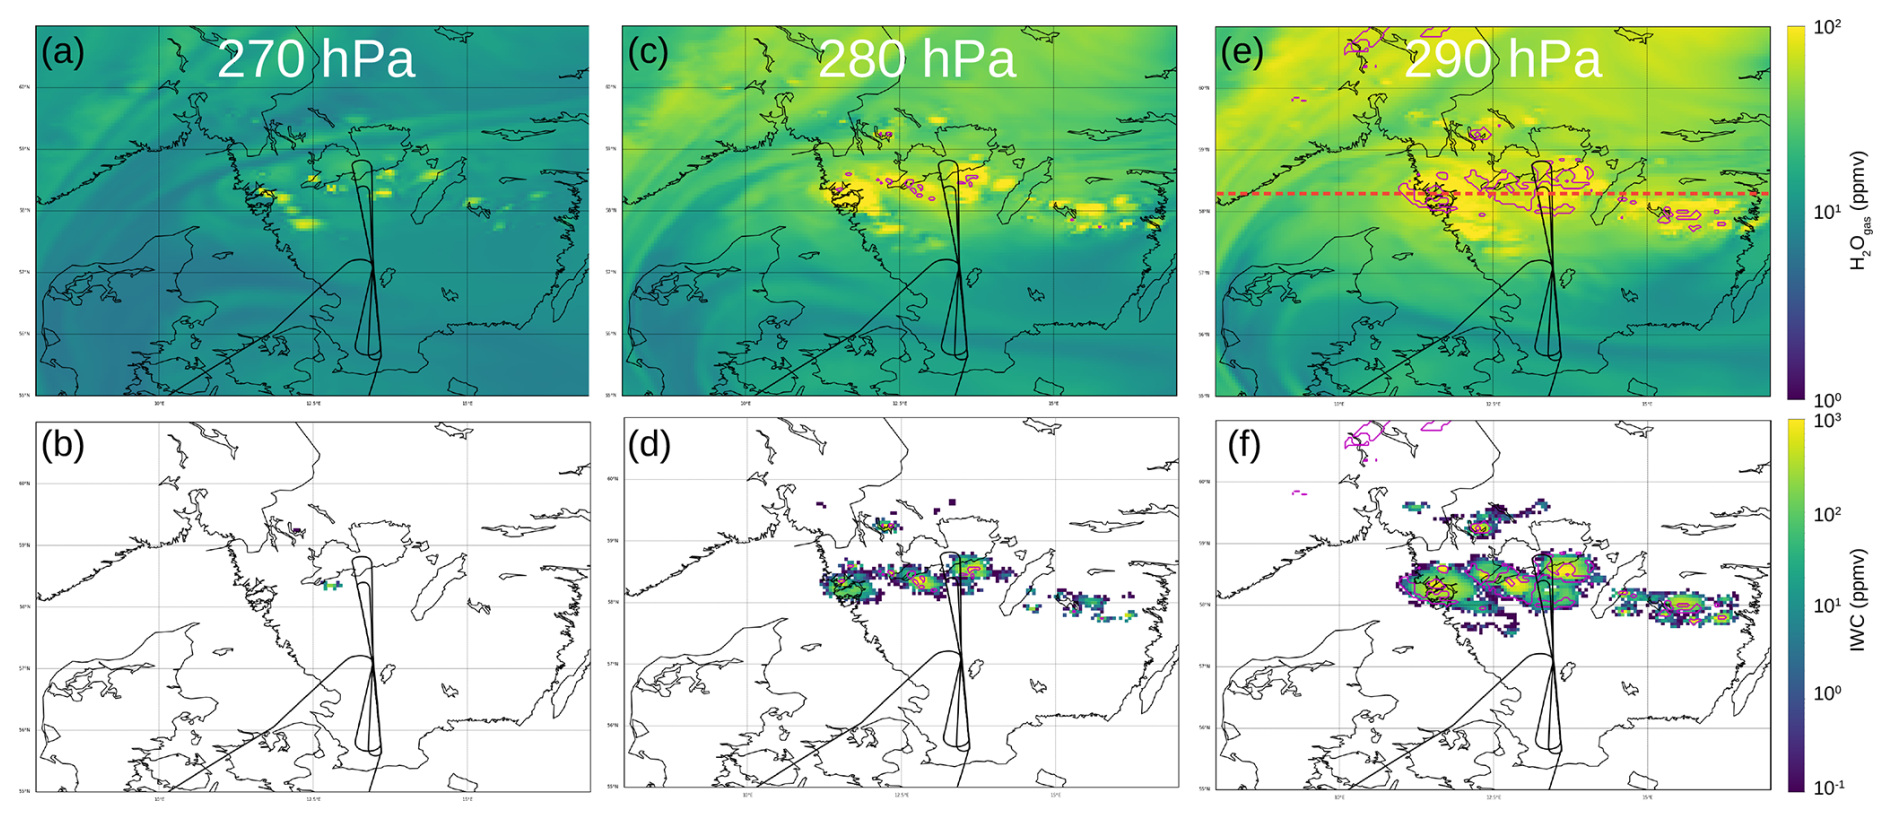
Figure 7ICON simulations. H2Ogas (a, c, e) and IWC (b, d, f) on three different pressure levels are shown. The flight path is shown as black solid line. Magenta circled areas indicate regions below the thermal tropopause, all other areas are located above tropopause. The red dashed line marks the location of the cross section shown in Fig. A1.
The upward displacement of the tropopause within the convective region is more clearly visible in the cross-section along the line of active convection in Fig. A1 shown as red dashed line. Here, the highest tropopause levels are located above regions of strongest convective activity, with updrafts exceeding 4 m s−1. The H2Ogas profile (Fig. A1c) reveals intrusions of H2Ogas into the lower stratosphere at the edges of the convective cells. At 11.5° E, for instance, an intrusion is observed in a region of partly negative (indicative of convective instability), suggesting strong energy and momentum fluxes associated with gravity wave breaking (see Sect. 3.2). Another intrusion at 13.5° E originates from a cell located farther south and is also marked by a filament exhibiting convective instability (not shown).
Direct intrusions from overshooting convection cannot be identified in this simulation, as the resolution is insufficient to resolve such features. However, previous studies have shown that the dominant pathway for mixing occurs at larger scales via wave breaking (Wang et al., 2023; Qu et al., 2020). Qu et al. (2020) compared Global Environmental Multiscale (GEM) model simulations at different resolutions and found that simulations with 2.5 and 1 km resolution captured gravity wave breaking-induced mixing well, whereas the 10 km simulation failed to resolve this pathway. The clear indications of gravity wave breaking in the ICON simulation suggest that this process is still resolved even in the 3.3 km simulation, rather that the moistening and ice particle presence in the LS is the result of numerical diffusion.
To assess the representativeness of the ICON simulated stratospheric moistening, the data are compared with the in-situ measurements. Furthermore, we compare the in-situ measurements to MLS data. Figure 8a shows MLS data at 260 hPa along with the pressure at the thermal tropopause derived from ERA5. Around 12:00 UTC, the MLS orbit intersects the convective region, located west of the overshoot observed by the research aircraft. In the figure, the magenta line highlights areas where the tropopause is reached – or possibly penetrated – based on ERA5 tropopause data and SEVIRI 10.8 µm brightness temperatures. However, keep in mind that the ERA5 tropopause level might be underestimated directly at the convective core as indicated in Fig. A1.
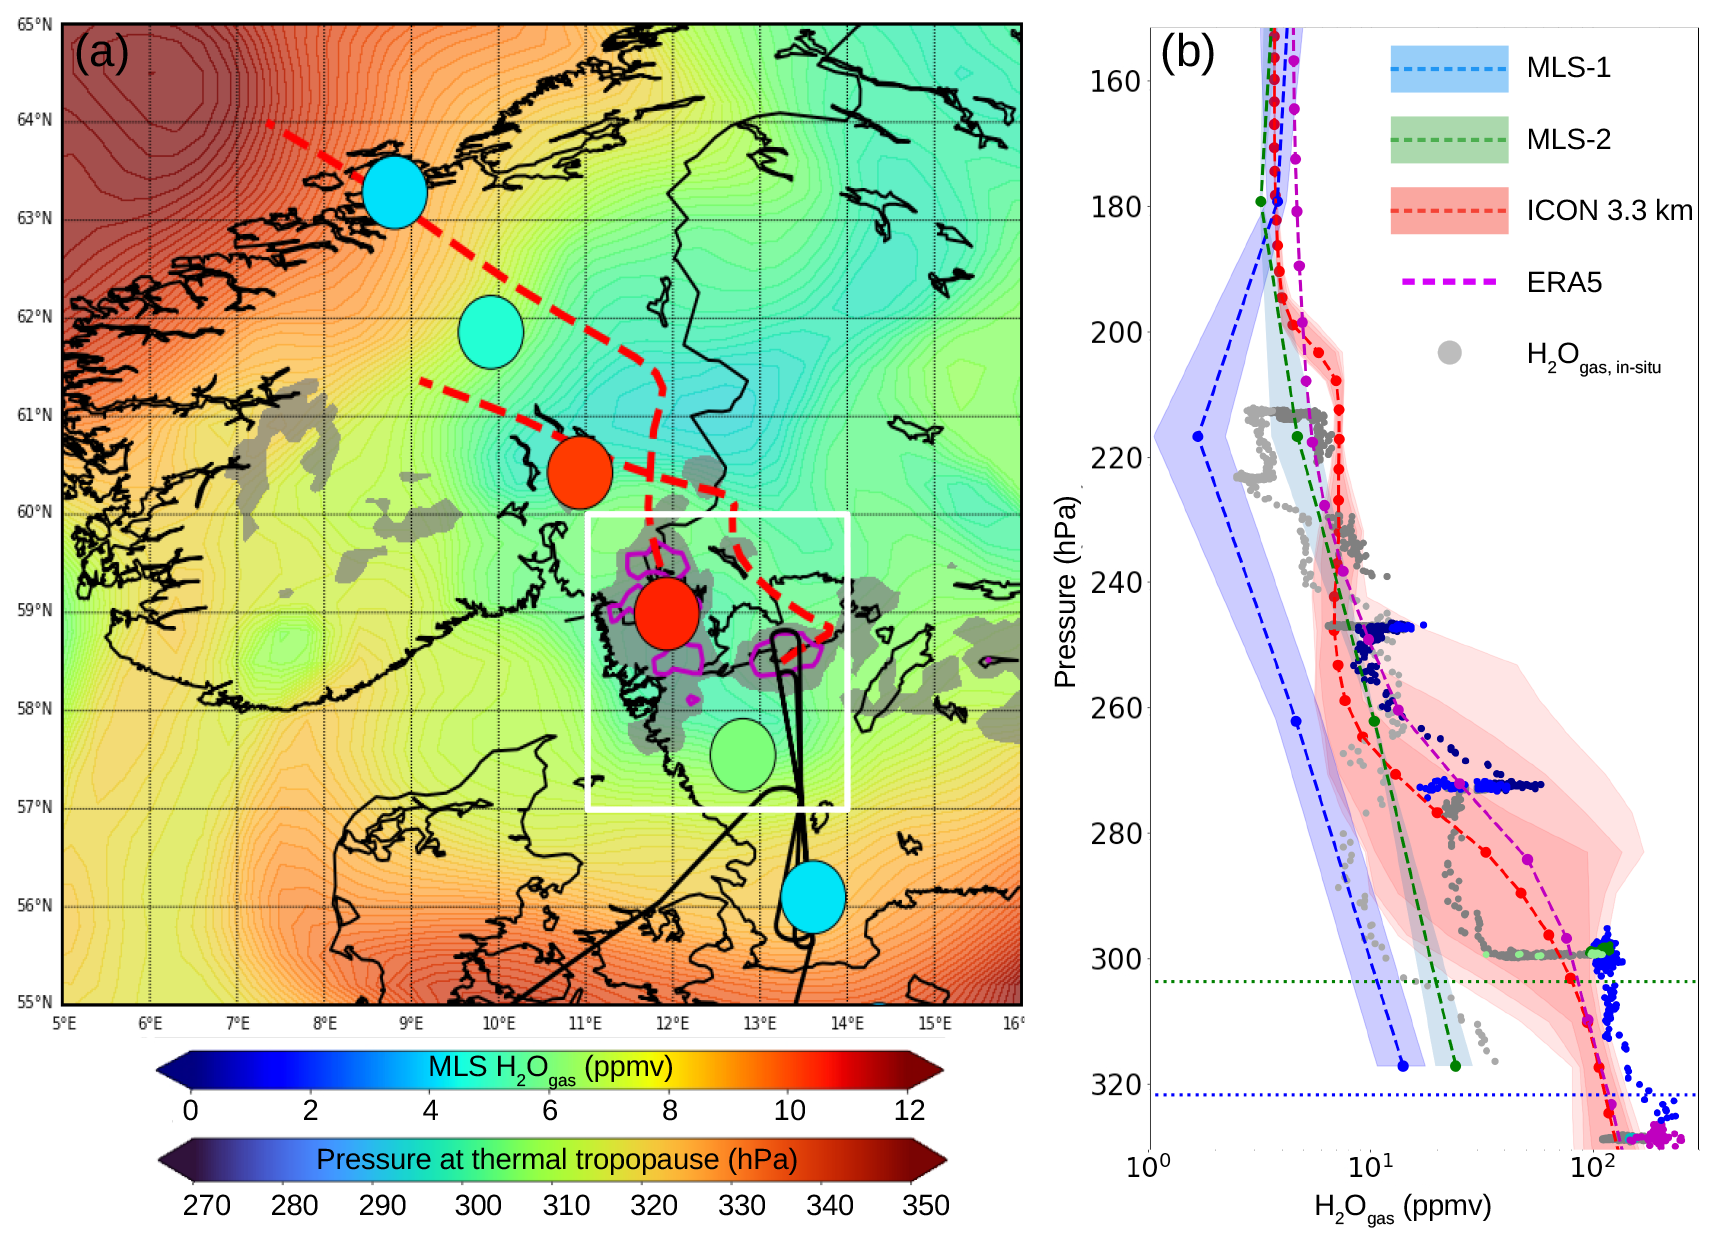
Figure 8Comparison of in-situ measurements with MLS, ERA5 and ICON. (a) MLS observations (circles) of water vapor at the 260 hPa level, taken around 12:00 UTC on the day of the convection event. The thermal tropopause pressure from ERA5 reanalysis are indicated by the background color. Red dashed lines represent 24 h forward trajectories. Grey shaded areas indicate where cloud-top temperatures were below −40 °C during the MLS overpass. Magenta contours mark cloud tops that reached or potentially exceeded the tropopause. (b) Vertical pressure profiles of water vapor from multiple sources (gray in-situ, green and orange MLS, blue ICON and red ERA5). Two MLS averaged profiles are shown: one for the region between 59 and 61° N close to the convection (MLS-2), and another for four profiles located to the north and south of this zone (MLS-1); corresponding mean tropopause levels are indicated by the dotted lines. The dashed line and the shaded area indicate the median and range of MLS observation, respectively. For the ICON model, averaged over the white box region shown in (a), the median profile (dashed line) is plotted along with confidence intervals (shaded) representing the 5 %–95 %, 1 %–99 %, and 0.1 %–99.9 % ranges. ERA5 mean profile is shown for the same area as for ICON. In-situ measurements are also included, with different colors corresponding to specific areas defined in Fig. 5.
Vertical MLS profiles are shown in Fig. 8b. The light green shading (MLS-2) represents the range of H2Ogas from the two profiles at 59 and 60.5° N close to the convection, while the orange shading (MLS-1) shows the range from four profiles farther north and south. Dotted lines indicate the corresponding mean tropopause levels for each group. The ICON 3.3 km simulation profile is shown for several confidence intervals, 5 %–95 %, 1 %–99 %, and 0.1 %–99.9 %, covering the area highlighted in Fig. 8a (white box). In-situ measurements are displayed as colored dots, corresponding to regimes defined in Fig. 5.
In the convective region, MLS H2Ogas increases from approximately 5 to 11 ppmv. However, this increase coincides with a slight decrease in tropopause pressure, suggesting greater tropospheric influence at 260 hPa. Comparing in-situ measurements outside the convective region (dark grey; >13° E) with the MLS-2 profiles reveals reasonable agreement at 260 and 215 hPa. These measurements are taken up to 200 km from the convection, with weak and opposing mean winds (<10 m s−1), and the convection had only just begun 1 h prior. Thus, it is unlikely that these distant air masses had already been affected by convective outflow.
In contrast, in-situ measurements taken at <13° E (light grey) are more consistent with the MLS-1 profile. This suggests that differences between the MLS profiles may not necessarily be driven by convective influence alone. At the tropopause, the MLS profiles are significantly drier than the in-situ measurements. This underestimation arises because MLS cannot resolve the sharp vertical and horizontal gradients of H2Ogas in this region. Additionally, its microwave signal is unable to detect the anomalously moist air within and beneath clouds, which are strongly influenced by convection.
When comparing the ICON simulation to the in-situ measurements, the simulation appears to have a dry bias in the UT. We theorized that the simulation underrepresents high supersaturation levels associated with convection – possibly due to model limitations, such as insufficient resolution. The range of the simulation confidence intervals captures the range of the in-situ data inside and outside convectively influenced air. Notably, at 280 hPa, some of the moist range exceed values found in the UT. This could be attributed to ice particle sublimation in subsaturated air, as well as higher saturation vapor pressures at elevated temperatures similar to that observed in the in-situ measurements. At higher levels, moist filaments observed at 270 and 250 hPa fall within the upper range of the simulation, particularly into the 99.9th percentile.
For ERA5, Fig. 8b (red line) shows the mean profile averaged over the same region as for ICON (Fig. 8a, white box). Percentiles are not shown for ERA5 due to its relatively coarse resolution of 0.3°. Compared to ICON, ERA5 exhibits significantly higher moisture levels in the LS, suggesting stronger convection-induced stratospheric hydration. Additionally, ERA5 has much higher IWCs above the tropopause (not shown). Unlike ICON, which explicitly simulates convection, ERA5 represents convective effects using a parameterization scheme. The higher moisture levels in ERA5 may thus be attributed to numerical diffusion effects resulting from resolution limitations or from the convection parametrization which might be too strong. Further investigation is needed to determine whether ERA5 systematically overestimates convection-related moistening, and how this might affect the overall H2Ogas distribution in the LS.
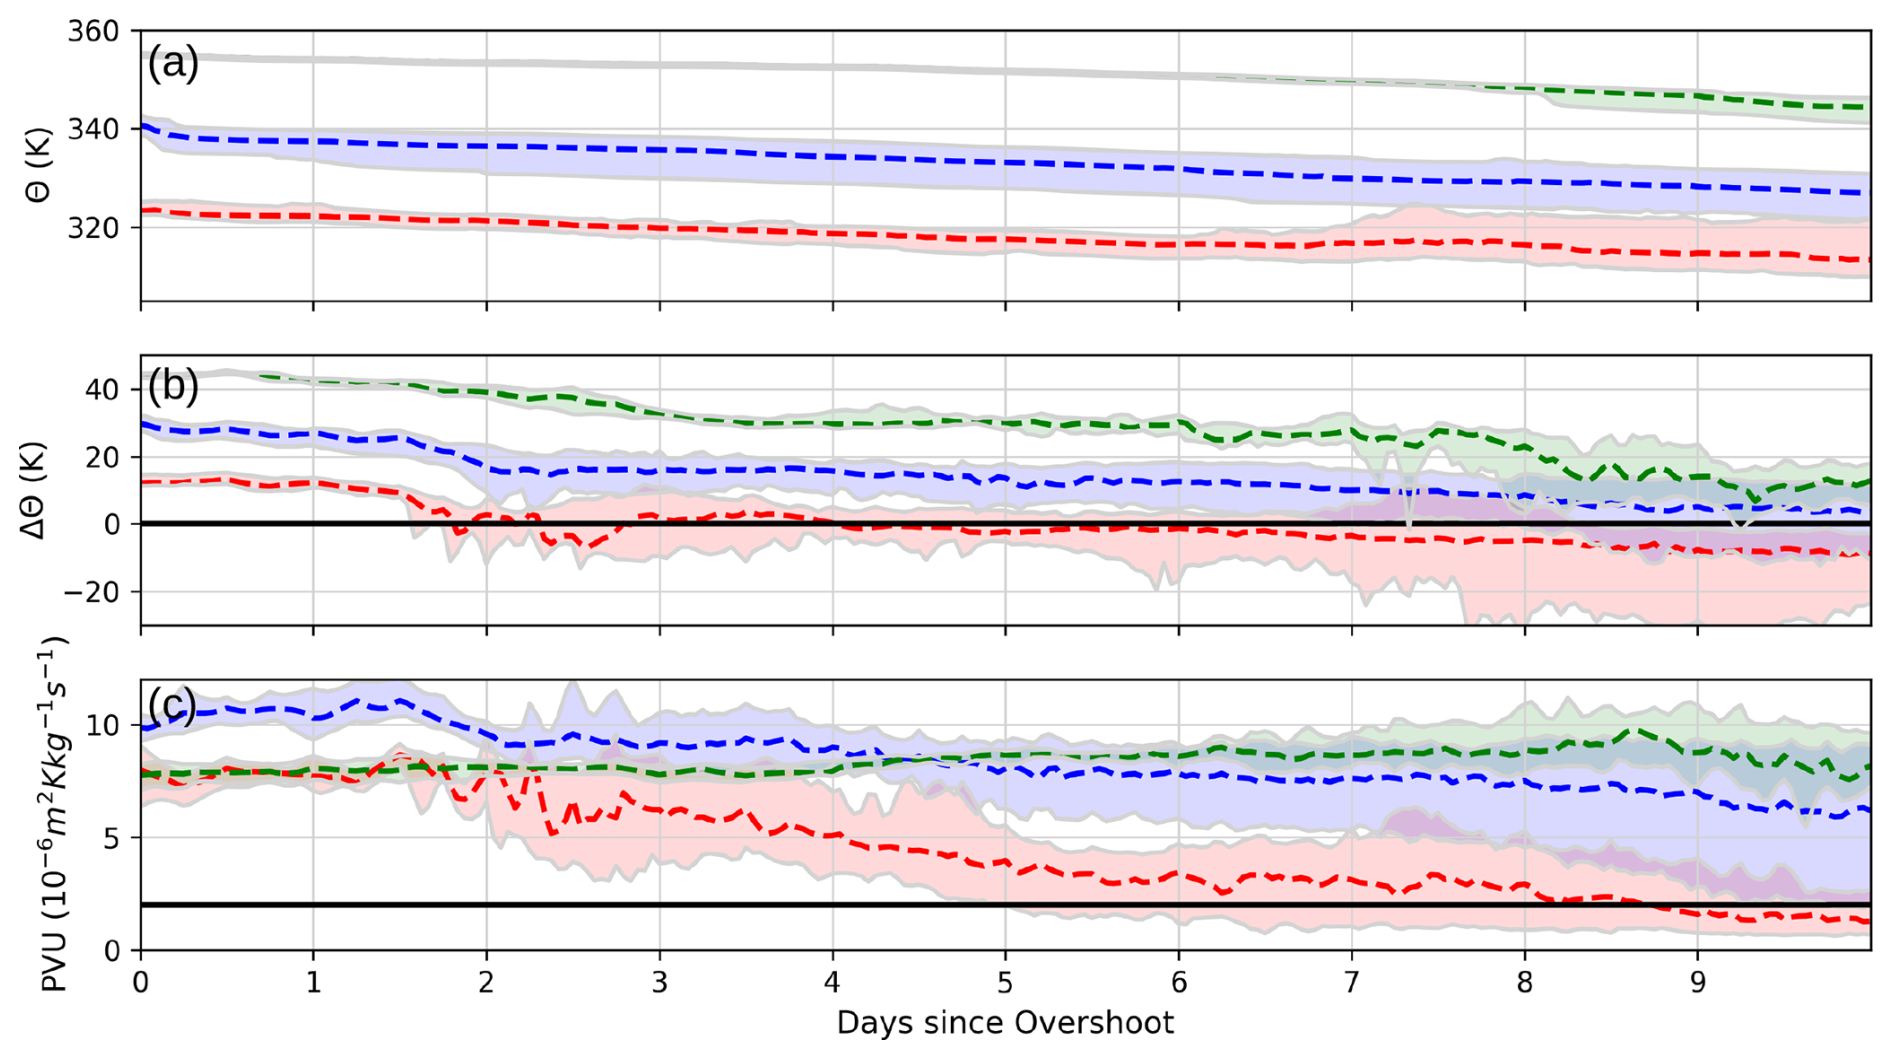
Figure 9Forward trajectories. For three different Θ levels, an ensemble of forward trajectories originating in the area of overshooting occurrence (58–59° N, 11–14° E) is calculated using CLaMS. For the median (dashed lines) and the 10 %–90 % percentile (shaded), the plots show the evolution in coordinates of Θ (a), Θ difference to thermal tropopause (b) and PVU (c). The 2 PVU level in (c) is indicated by the black line.
3.4 CLaMS trajectory and ice model simulations
Lagrangian trajectories are calculated forward for different height levels within the area of convection (58–60° N, 11–14° E), where satellite data indicate convection exceeding the tropopause level (Fig. 8a). At three different height levels, corresponding to Θ of 325, 340 and 355 K, an ensemble of trajectories is calculated. The results are shown in Fig. 9 for 3 different height levels, with the temporal evolution of median and 10 %–90 % percentile (dashed line and shaded area, respectively) of Θ (Fig. 9a), and Θ difference to the thermal tropopause (Fig. 9b) and PV (Fig. 9c).
At 325 K, where a strong moistening was observed, the trajectory median reaches the thermal tropopause level after 2 d. After 9 d, the median PV decreases to below 2 PVU and 90 % of the trajectories are situated below the thermal tropopause. This descent results from a diabatic cooling rate of 1–1.5 K d−1. At 340 K, where a slight H2Ogas increase was still detected in the observations, the median stays above the thermal tropopause even after 10 d (median PV then 6 PVU) but also here some of the trajectories become tropospheric after this time. At both the 325 and 340 K level, the trajectories stay in the mid- to high-latitudes after 10 d with a tendency of a northward shift.
During the observation of the overshoot at around 12:40 UTC, the flight went over ongoing convection, with an visible overshoot observed during the overflight (Fig. 22d). The PSD shows relatively large particles (up to 200 µm), suggesting that smaller ones may have already sublimated under the very subsaturated conditions (∼40 % RHice). The microphysical simulation indicates that injected ice crystals sublimate within about three minutes after being fully entrained into the lower stratosphere by the overshooting convection. Sedimentation plays a negligible role due to their short lifetime in such dry conditions.
Overall, it is indicated that the injected H2Ogas has a rather short life time in the lowermost stratosphere of a few days to weeks. This is in agreement with previous studies that indicated that extratropical overshoots not reaching the stratospheric overworld mostly do not have a long term effect (e.g., Wang et al., 2023; Homeyer and Bowman, 2021). This overshoot case can therefore be categorized as a short term influence of (sub)-polar LMS as a result of large temperature differences between still cold polar regions and heated subtropical regions to the south during late spring/early summer, and the consequent effect on cross-isentropic mixing.
Trajectory analysis indicates that the impact of convection on the LS is relatively short-lived. Filaments influenced by overshooting convection remained in the LS for several days (at 330 K) to a few weeks (at 345 K). However, it remains crucial to assess the broader influence of such events on LS air masses at higher latitudes during the transition from winter to summer, and to quantify their contribution to the seasonal cycle of extratropical LS H2Ogas in the northern mid- to high latitudes, particularly during spring and summer (Konjari et al., 2025; Zahn et al., 2014).
Over the United States, overshooting convection is most frequent in May and June (Homeyer and Bowman, 2021). Phoenix and Homeyer (2021) found that springtime convection results in a more substantial moistening of the LS – about 24 % – compared to summer convection, which contributes only to a 7 %–11 % increase. This enhanced moistening is attributed to higher tropopause temperatures in spring, which allow for higher saturation mixing ratios. Although the TPEx flight occurred later in the year and farther north, the synoptic conditions during the event were more characteristic of US springtime, including high saturation mixing ratios (∼100 ppmv) – about 10 times greater than those observed during low (sub-)tropical cold point temperatures (Phoenix and Homeyer, 2021).
Additionally, the tropopause height during the TPEx event (9.5 km) was even lower than in most springtime overshooting convection cases in the simulations by Phoenix and Homeyer (2021), where the most frequent tropopause heights range from 12 to 14 km. This raises the possibility that the overshooting convection observed during the TPEx flight may be underrepresented in those model simulations, or that the synoptic setup during TPEx differs significantly from typical US overshooting events, located farther south. In the US, strong springtime convection is often driven by sharp contrasts between cold Canadian air masses and warm, moist air from the Gulf of Mexico (Neiman and Wakimoto, 1999), which are associated with higher tropopause altitudes. Compared to the TPEx case, these more extreme air mass contrasts in the US may contribute to an even greater potential for overshooting convection.
Satellite observations, however, suggest that overshooting convection, while not always reaching high stratospheric levels, also occurs with similar frequency over boreal Siberia and Canada at 60° N, comparable to major convection regions like the US Midwest (Liu et al., 2020). Further research is needed to identify the conditions under which such high-latitude overshooting events occur – potentially by analyzing reanalysis data and satellite-derived cloud top information. The present analysis provides the motivation for additional efforts to improve our understanding of the role of extratropical convection in the stratospheric H2Ogas budget, particularly in regions such as Europe and the high latitudes, where the impact of overshooting convection has received very little attention to date.
This case study from the TPEx (TropoPause composition gradients and mixing Experiment) campaign, conducted in June 2024 over southern Sweden (59° N), demonstrates that overshooting convection can occur even in the absence of warm, subtropical air masses – specifically during cold air outbreaks in the boreal late spring to early summer. Stratospheric hydration was observed up to 2 km above the thermal tropopause (corresponding to a potential temperature of 345 K), with ice particles detected up to 1.5 km above the tropopause (330 K). While there is clear evidence of enhanced water vapor in the gas phase (e.g., anomalies of +30 ppmv at 1.5 km above the tropopause), the O3 and N2O profiles do not suggest upward transport of moist tropospheric air into the LS. On the contrary, both tracers indicate the presence of air masses originating from deeper in the stratosphere. This suggests that the observed stratospheric hydration results primarily from the vertical transport and subsequent sublimation of ice particles, rather than from direct injection of moist air. This conclusion is further supported by a local decrease in potential temperature in the filaments enriched with H2Ogas, consistent with latent cooling due to particle sublimation.
Satellite observations from MLS and model simulations with ICON indicate substantial moistening over the convective region. To further evaluate how well models capture convection-driven stratosphere-troposphere exchange (STE), future simulations at higher spatial resolutions are planned. The observed ice microphysical data provide valuable insight into the conditions within the convective system, including the distribution of ice particles and total ice water content. The ice microphysical properties observed during the convective event are summarized in Fig. A2. These observations, together with trace gas observations, are crucial for validating model performance and improving the parameterization of convection in numerical models, including the improved representation of overshooting convection and its influence on the chemical composition of the upper troposphere and lower stratosphere, particularly with regard to water vapor.
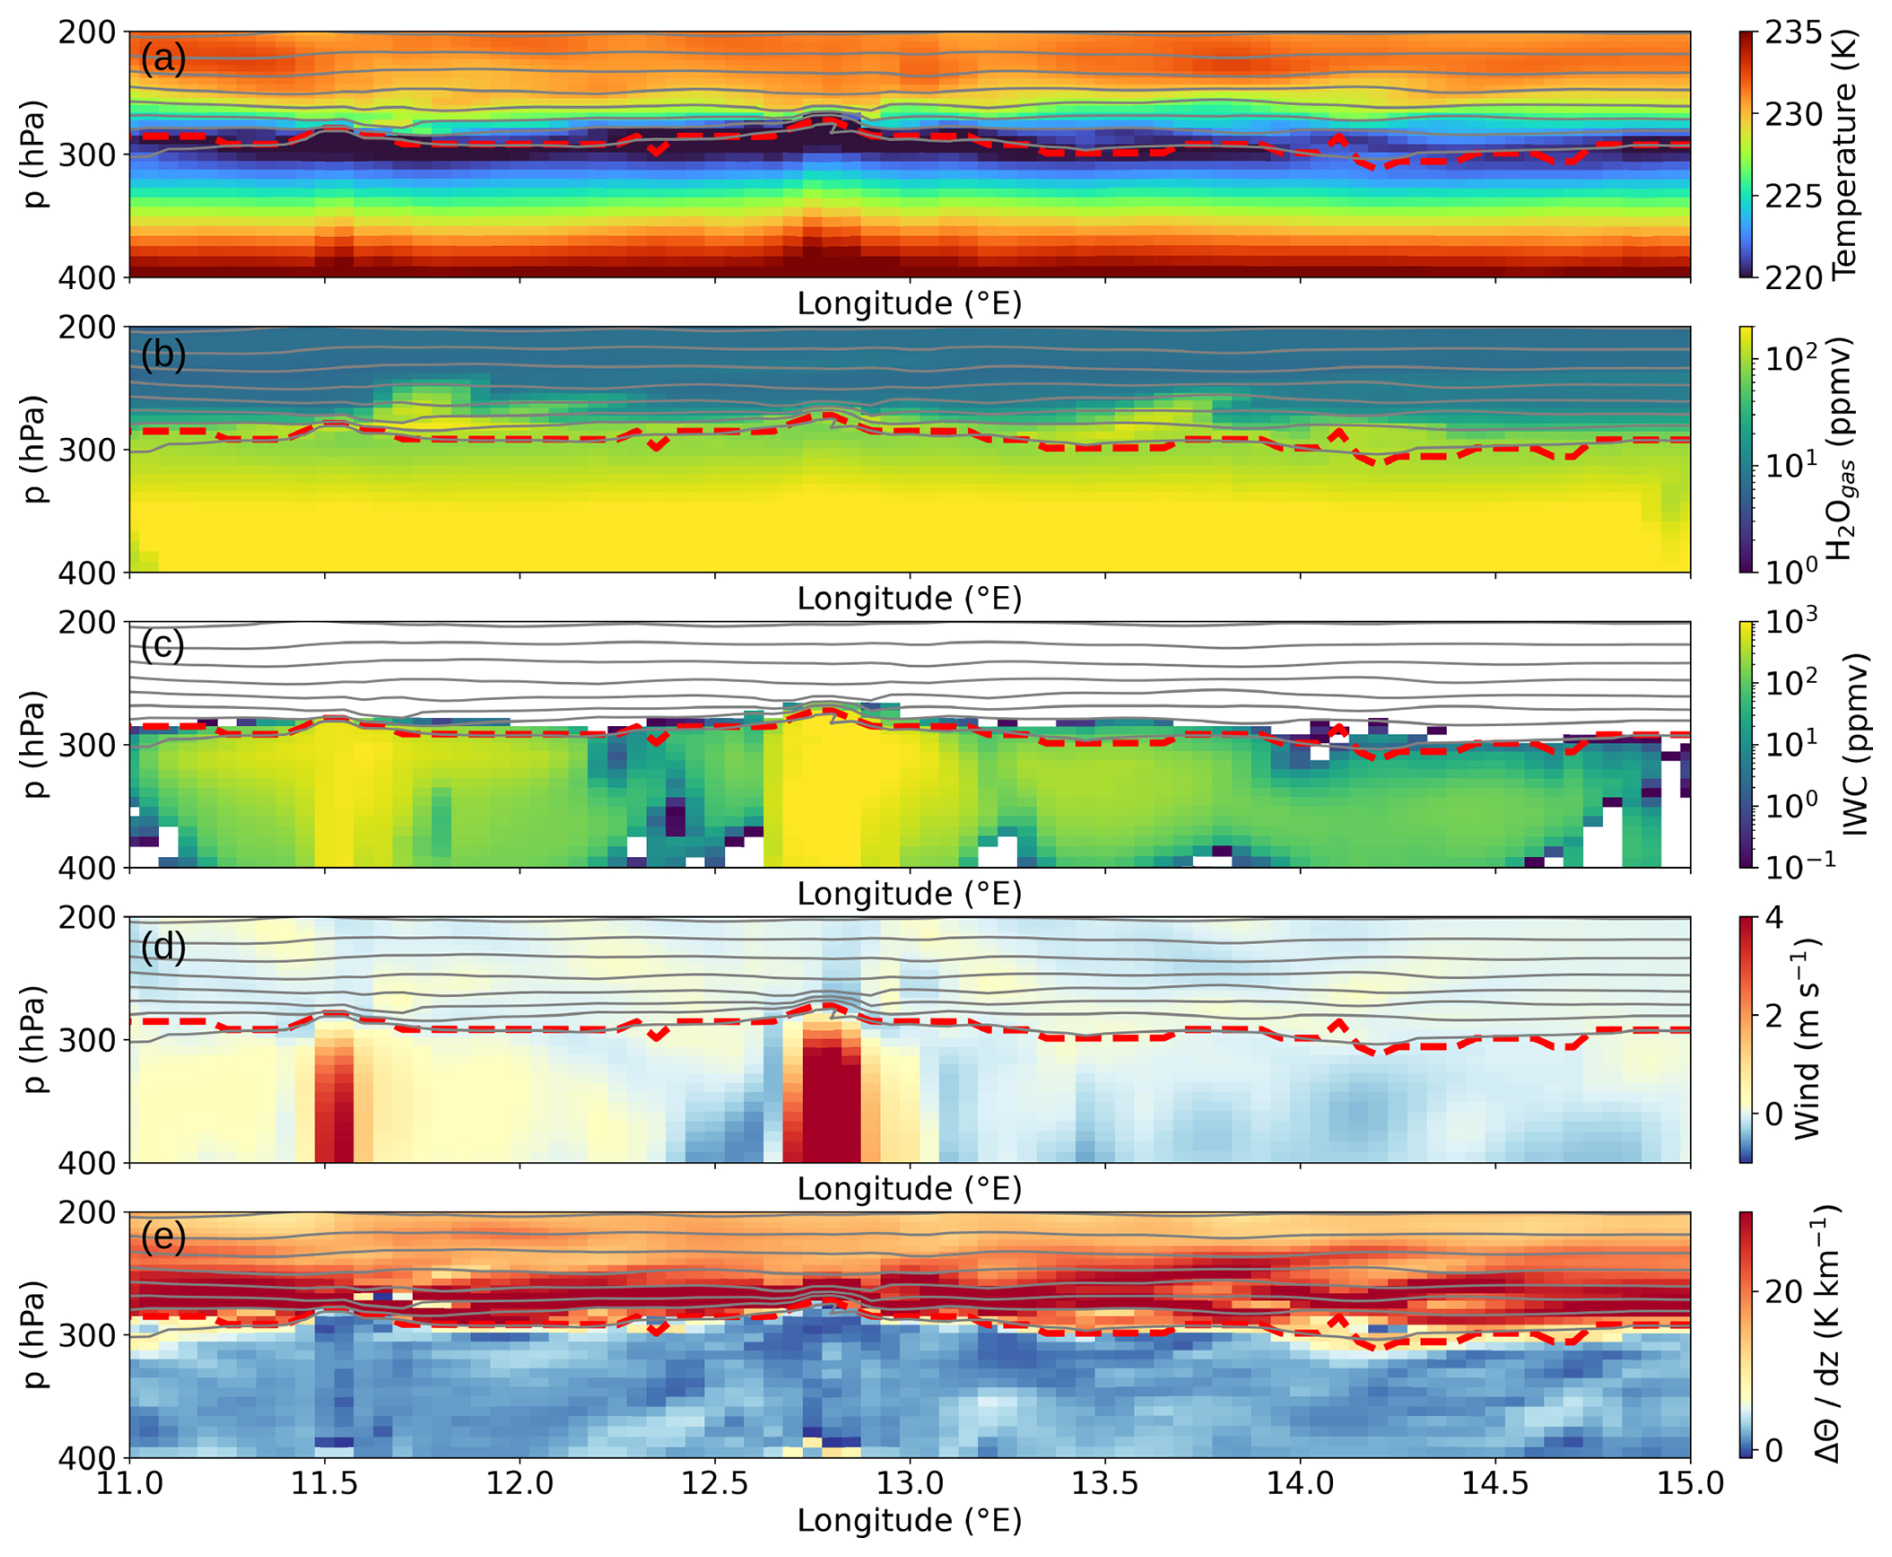
Figure A1ICON cross-section. Longitudinal cross section (along 58.3° E) through the area of convection. Temperature (a), H2Ogas (b), IWC (c), vertical wind (d), and potential temperature tendency (ΔΘ) (e) are displayed. The thermal tropopause derived from the ICON temperature profiles is indicated by the red dashed line, the grey lines indicate different levels of same potential temperature.
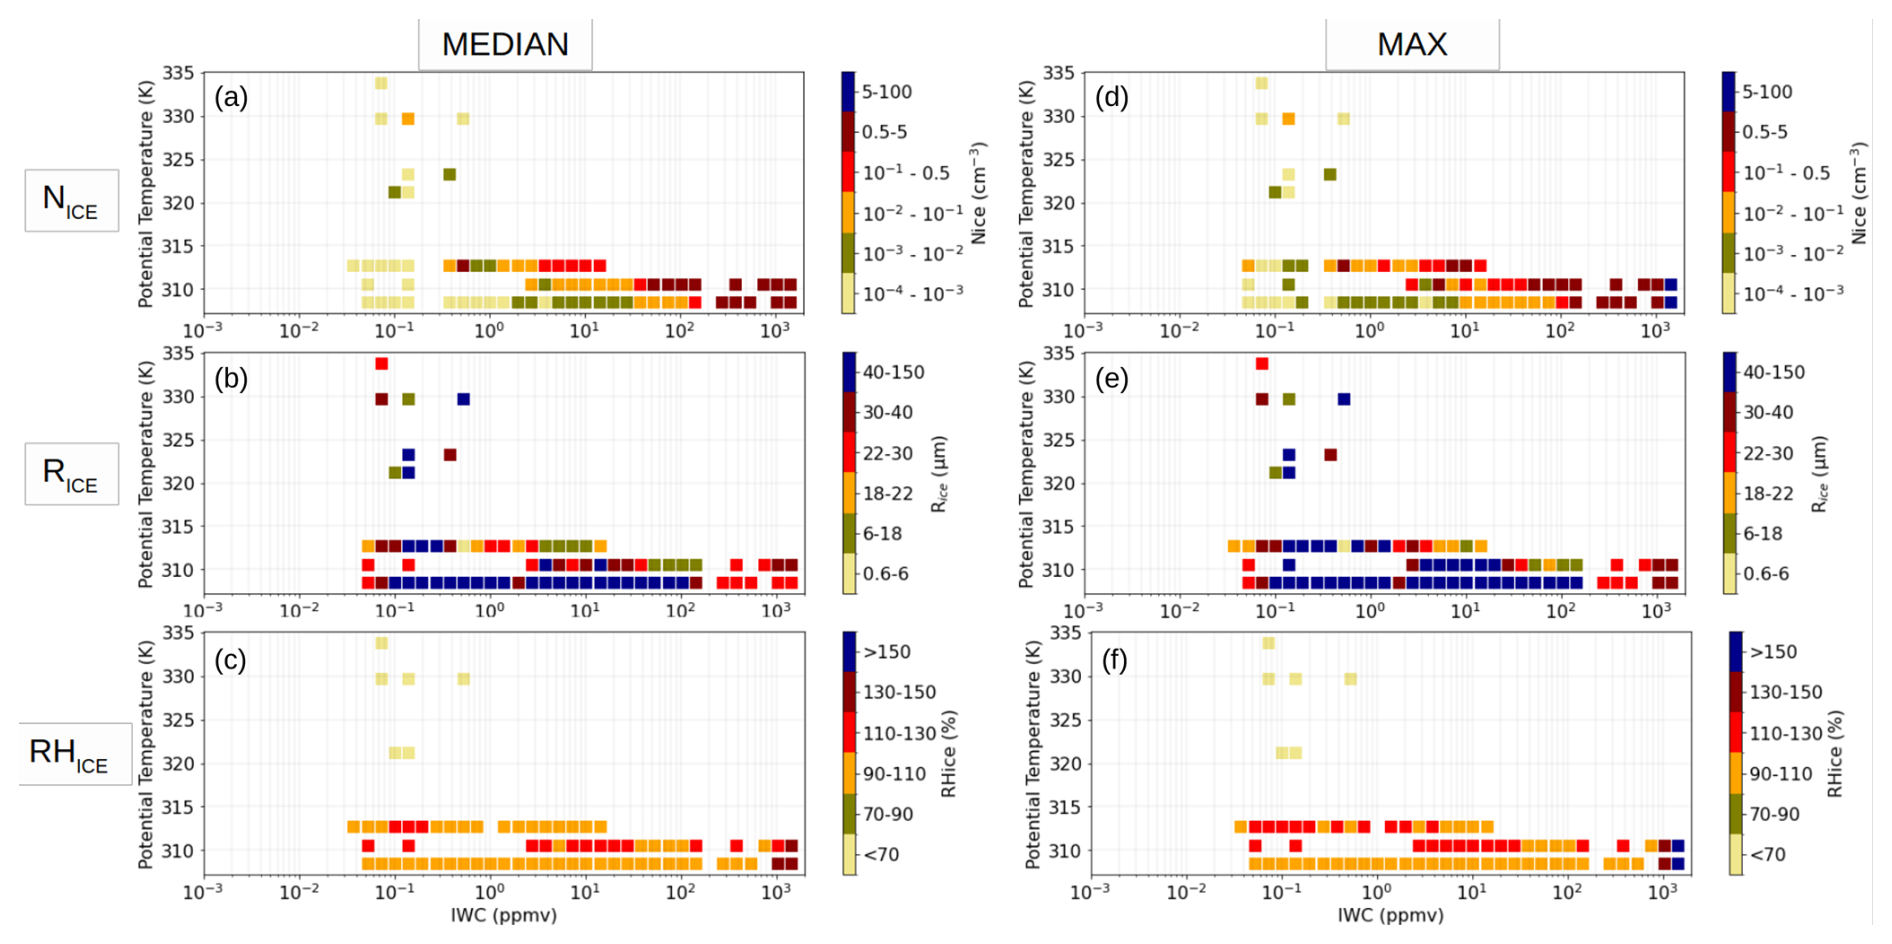
Figure A2Summary of the ice microphysical properties. The median (a–c) and maximum values (d–f) of ice number concentration (Nice; a and d), effective radius (Rice; b and e) and relative humidity w.r.t. ice (RHice; c and f) are shown as a function of IWC and potential temperature.
The measurement data and trajectory data along the flight path is published on Zenodo at https://doi.org/10.5281/zenodo.15371527 (Lachnitt, 2025).
PK analysed the data, and wrote the manuscript. CR, AA and NS were responsible for the FISH and NIXE-CAPS measurements and helped analyzing the data. IBG and AM provided the ICON simulation and helped with the interpretation of the results. JS and PJ provided for the UHSAS and Sky-OPC data. NE and PH provided the ozone and nitrous oxide measurements. YL and AP are responsible for the ICH measurements. HB and PH coordinated the TPEx campaign.
At least one of the (co-)authors is a member of the editorial board of Atmospheric Chemistry and Physics. The peer-review process was guided by an independent editor, and the authors also have no other competing interests to declare.
Publisher's note: Copernicus Publications remains neutral with regard to jurisdictional claims made in the text, published maps, institutional affiliations, or any other geographical representation in this paper. While Copernicus Publications makes every effort to include appropriate place names, the final responsibility lies with the authors. Views expressed in the text are those of the authors and do not necessarily reflect the views of the publisher.
This article is part of the special issue “The tropopause region in a changing atmosphere (TPChange) (ACP/AMT/GMD/WCD inter-journal SI)”. It is not associated with a conference.
The study was funded by the Deutsche Forschungsgemeinschaft (DFG, German Research Foundation) – TRR 301 – Project-ID 428312742. Parts of this research were conducted using the supercomputer MOGON-NHR and/or advisory services offered by Johannes Gutenberg University Mainz (https://hpc.uni-mainz.de/, last access: 3 December 2025), which is a member of the AHRP (Alliance for High Performance Computing in Rhineland Palatinate, https://www.ahrp.info/, last access: 3 December 2025) and the Gauss Alliance e.V. The ICON modelling was funded by the Deutsche Forschungsgemeinschaft (DFG, German Research Foundation) – within the GLACIATE project (530241293).
The authors gratefully acknowledge the computing time granted on the supercomputer MOGON-NHR at Johannes Gutenberg University Mainz (https://hpc.uni-mainz.de/, last access: 3 December 2025). The authors acknowledge the team of enviscope GmbH and GFD GmbH for the opportunity to carry out the campaign and the technical support during the campaign.
The article processing charges for this open-access publication were covered by the Forschungszentrum Jülich.
This paper was edited by Aurélien Podglajen and reviewed by three anonymous referees.
Banerjee, A., Chiodo, G., Previdi, M., Ponater, M., and Polvani, L. M.: Stratospheric water vapor: An important climate feedback, Clim. Dynam., 53, 1697–1710, https://doi.org/10.1007/s00382-019-04721-4, 2019. a
Bechtold, P., Köhler, M., Jung, T., Doblas-Reyes, F., Leutbecher, M., Rodwell, M. J., Vitart, F., and Balsamo, G.: Advances in simulating atmospheric variability with the ECMWF model: From synoptic to decadal time-scales, Q. J. Roy. Meteorol. Soc., 134, 1337–1351, https://doi.org/10.1002/qj.289, 2008. a
Bedka, K. M.: Overshooting cloud top detections using MSG SEVIRI Infrared brightness temperatures and their relationship to severe weather over Europe, Atmos. Res., 99, 175–189, https://doi.org/10.1016/j.atmosres.2010.10.001, 2011. a
Berkes, F., Neis, P., Schultz, M. G., Bundke, U., Rohs, S., Smit, H. G. J., Wahner, A., Konopka, P., Boulanger, D., Nédélec, P., Thouret, V., and Petzold, A.: In situ temperature measurements in the upper troposphere and lowermost stratosphere from 2 decades of IAGOS long-term routine observation, Atmos. Chem. Phys., 17, 12495–12508, https://doi.org/10.5194/acp-17-12495-2017, 2017. a
Bozem, H., Joppe, P., Li, Y., Emig, N., Afchine, A., Breuninger, A., Curtius, J., Hofmann, S., Ismayil, S., Kandler, K., Kunkel, D., Kutschka, A., Lachnitt, H.-C., Petzold, A., Richter, S., Röschenthaler, T., Rolf, C., Schneider, L., Schneider, J., Vogel, A., and Hoor, P.: The TropoPause Composition TOwed Sensor Shuttle (TPC-TOSS): a new airborne dual platform approach for atmospheric composition measurements at the tropopause, Atmos. Meas. Tech., 18, 6545–6568, https://doi.org/10.5194/amt-18-6545-2025, 2025. a
Bundke, U., Berg, M., Houben, N., Ibrahim, A., Fiebig, M., Tettich, F., Klaus, C., Franke, H., and Petzold, A.: The IAGOS-CORE aerosol package: Instrument design, operation and performance for continuous measurement aboard in-service aircraft, Tellus B, 67, 28339, https://doi.org/10.3402/tellusb.v67.28339, 2015. a, b
Cai, Y., Montague, D. C., Mooiweer-Bryan, W., and Deshler, T.: Performance characteristics of the ultra high sensitivity aerosol spectrometer for particles between 55 and 800 nm: Laboratory and field studies, J. Aerosol Sci., 39, 759–769, https://doi.org/10.1016/j.jaerosci.2008.04.007, 2008. a
Cooney, J. W., Bowman, K. P., Homeyer, C. R., and Fenske, T. M.: Ten Year Analysis of Tropopause-Overshooting Convection Using GridRad Data, J. Geophys. Res.-Atmos., 123, 329–343, https://doi.org/10.1002/2017JD027718, 2018. a, b
Dauhut, T. and Hohenegger, C.: The Contribution of Convection to the Stratospheric Water Vapor Budget, J. Geophys. Res.-Atmos., 127, e2021JD036295, https://doi.org/10.1029/2021JD036295, 2022. a
Dauhut, T., Chaboureau, J.-P., Haynes, P. H., and Lane, T. P.: The Mechanisms Leading to a Stratospheric Hydration by Overshooting Convection, J. Atmos. Sci., 75, 4387–4403, https://doi.org/10.1175/JAS-D-18-0176.1, 2018. a
Frey, W., Schofield, R., Hoor, P., Kunkel, D., Ravegnani, F., Ulanovsky, A., Viciani, S., D'Amato, F., and Lane, T. P.: The impact of overshooting deep convection on local transport and mixing in the tropical upper troposphere/lower stratosphere (UTLS), Atmos. Chem. Phys., 15, 6467–6486, https://doi.org/10.5194/acp-15-6467-2015, 2015. a
Gettelman, A., Hoor, P., Pan, L. L., Randel, W. J., Hegglin, M. I., and Birner, T.: The extratropical upper troposphere and lower stratosphere, Rev. Geophys., 49, https://doi.org/10.1029/2011RG000355, 2011. a
Gordon, A. E. and Homeyer, C. R.: Sensitivities of Cross‐Tropopause Transport in Midlatitude Overshooting Convection to the Lower Stratosphere Environment, J. Geophys. Res.-Atmos., 127, e2022JD036713, https://doi.org/10.1029/2022JD036713, 2022. a
Gordon, A. E., Homeyer, C. R., Smith, J. B., Ueyama, R., Dean-Day, J., Atlas, E., Smith, K., Pittman, J. V., Sayres, D., Wilmouth, D., Pandey, A., St. Clair, J. M., Hanisco, T. F., Hare, J., Hannun, R. A., Wofsy, S. C., Daube, B., and Donnelly, S.: Airborne observations of upper troposphere and lower stratosphere composition change in active convection producing above-anvil cirrus plumes, Atmos. Chem. Phys., 24, 7591–7612, https://doi.org/10.5194/acp-24-7591-2024, 2024. a
Hersbach, H., Bell, B., Berrisford, P., Hirahara, S., Horányi, A., Muñoz-Sabater, J., Nicolas, J., Peubey, C., Radu, R., Schepers, D., Simmons, A., Soci, C., Abdalla, S., Abellan, X., Balsamo, G., Bechtold, P., Biavati, G., Bidlot, J., Bonavita, M., De Chiara, G., Dahlgren, P., Dee, D., Diamantakis, M., Dragani, R., Flemming, J., Forbes, R., Fuentes, M., Geer, A., Haimberger, L., Healy, S., Hogan, R. J., Hólm, E. A., Janisková, M., Keeley, S., Laloyaux, P., Lopez, P., Radnoti, G., Rosnay, P. D., Rozum, I., Vamborg, F., Villaume, S., and Thépaut, J.-N.: The ERA5 global reanalysis, Q. J. Roy. Meteorol. Soc., 146, 1999–2049, https://doi.org/10.1002/qj.3803, 2020. a
Hogan, R. J. and Bozzo, A.: A Flexible and Efficient Radiation Scheme for the ECMWF Model, J. Adv. Model. Earth Syst., 10, 1990–2008, https://doi.org/10.1029/2018MS001364, 2018. a
Homeyer, C. R. and Bowman, K. P.: A 22-Year Evaluation of Convection Reaching the Stratosphere Over the United States, J. Geophys. Res.-Atmos., 126, e2021JD034808, https://doi.org/10.1029/2021JD034808, 2021. a, b
Homeyer, C. R., Pan, L. L., Dorsi, S. W., Avallone, L. M., Weinheimer, A. J., O'Brien, A. S., DiGangi, J. P., Zondlo, M. A., Ryerson, T. B., Diskin, G. S., and Campos, T. L.: Convective transport of water vapor into the lower stratosphere observed during double‐tropopause events, J. Geophys. Res.-Atmos., 119, 10941–10958, https://doi.org/10.1002/2014JD021485, 2014. a
Homeyer, C. R., Bowman, K. P., Smith, J. B., Ueyama, R., Dean-Day, J., Atlas, E., Smith, K., Pittman, J. V., Sayres, D., Wilmouth, D., Pandey, A., St. Clair, J. M., Hanisco, T. F., Hare, J., Hannun, R. A., Wofsy, S. C., Daube, B., and Donnelly, S.: Extreme Altitudes of Stratospheric Hydration by Midlatitude Tropopause-Overshooting Convection, Geophys. Res. Lett., 50, e2023GL104914, https://doi.org/10.1029/2023GL104914, 2023. a
Homeyer, C. R., Gordon, A. E., Smith, J. B., Ueyama, R., Wilmouth, D. M., Sayres, D. S., Hare, J., Pandey, A., Hanisco, T. F., Dean-Day, J. M., Hannun, R., and Clair, J. M. S.: Stratospheric Hydration Processes in Tropopause‐Overshooting Convection Revealed by Tracer‐Tracer Correlations From the DCOTSS Field Campaign, J. Geophys. Res.-Atmos., 129, e2024JD041340, https://doi.org/10.1029/2024JD041340, 2024. a, b, c, d
Hou, A. Y., Kakar, R. K., Neeck, S., Azarbarzin, A. A., Kummerow, C. D., Kojima, M., Oki, R., Nakamura, K., and Iguchi, T.: The Global Precipitation Measurement Mission, B. Am. Meteorol. Soc., 95, 701–722, https://doi.org/10.1175/BAMS-D-13-00164.1, 2014. a
Jensen, E., Pfister, L., Park, M., and Ryoo, J.: Convective impact on the global lower stratospheric water vapor budget, J. Geophys. Res.-Atmos., 129, e2023JD038765, https://doi.org/10.1029/2023JD038765, 2024. a, b
Johnson, T., Capel, J., and Ollison, W.: Measurement of microenvironmental ozone concentrations in Durham, North Carolina, using a 2B Technologies 205 Federal Equivalent Method monitor and an interference-free 2B Technologies 211 monitor, J. Air Waste Manage. Assoc., 64, 360–371, https://doi.org/10.1080/10962247.2013.839968, 2014. a, b
Joppe, P., Schneider, J., Wilsch, J., Bozem, H., Breuninger, A., Curtius, J., Ebert, M., Emig, N., Hoor, P., Ismayil, S., Kandler, K., Kunkel, D., Kurth, I., Lachnitt, H.-C., Li, Y., Miltenberger, A., Richter, S., Rolf, C., Schneider, L., Schwenk, C., Spelten, N., Vogel, A. L., Cheng, Y., and Borrmann, S.: Transport of Biomass Burning Aerosol into the Extratropical Tropopause Region over Europe via Warm Conveyor Belt Uplift, Atmos. Chem. Phys., 25, 15077–15103, https://doi.org/10.5194/acp-25-15077-2025, 2025. a
Khaykin, S., Afchine, A., Borrmann, S., Bucci, S., Cairo, F., Dragoneas, A., Frey, W., Krämer, M., Mahnke, C., Molleker, S., Rolf, C., Spelten, N., Viciani, S., and Voigt, C.: Persistence of moist plumes from overshooting convection in the Asian monsoon anticyclone, Atmos. Chem. Phys., 22, 3169–3188, https://doi.org/10.5194/acp-22-3169-2022, 2022. a
Khordakova, D., Rolf, C., Grooß, J.-U., Müller, R. D., Konopka, P., Wieser, A., Krämer, M., and Riese, M.: A case study on the impact of severe convective storms on the water vapor mixing ratio in the lower mid-latitude stratosphere observed in 2019 over Europe, Atmos. Chem. Phys., 22, 1059–1079, https://doi.org/10.5194/acp-22-1059-2022, 2022. a
Konjari, P., Rolf, C., Hegglin, M. I., Rohs, S., Li, Y., Zahn, A., Bönisch, H., Nédélec, P., Krämer, M., and Petzold, A.: Technical note: Water vapour climatologies in the extra-tropical upper troposphere and lower stratosphere derived from a synthesis of passenger and research aircraft measurements, Atmos. Chem. Phys., 25, 4269–4289, https://doi.org/10.5194/acp-25-4269-2025, 2025. a
Konopka, P., Tao, M., Ploeger, F., Hurst, D. F., Santee, M. L., Wright, J. S., and Riese, M.: Stratospheric Moistening After 2000, Geophys. Res. Lett., 49, e2021GL097609, https://doi.org/10.1029/2021GL097609, 2022. a
Konopka, P., Rolf, C., von Hobe, M., Khaykin, S. M., Clouser, B., Moyer, E., Ravegnani, F., D'Amato, F., Viciani, S., Spelten, N., Afchine, A., Krämer, M., Stroh, F., and Ploeger, F.: The dehydration carousel of stratospheric water vapor in the Asian summer monsoon anticyclone, Atmos. Chem. Phys., 23, 12935–12947, https://doi.org/10.5194/acp-23-12935-2023, 2023. a
Krämer, M., Rolf, C., Luebke, A., Afchine, A., Spelten, N., Costa, A., Meyer, J., Zöger, M., Smith, J., Herman, R. L., Buchholz, B., Ebert, V., Baumgardner, D., Borrmann, S., Klingebiel, M., and Avallone, L.: A microphysics guide to cirrus clouds – Part 1: Cirrus types, Atmos. Chem. Phys., 16, 3463–3483, https://doi.org/10.5194/acp-16-3463-2016, 2016. a, b, c
Krämer, M., Rolf, C., Spelten, N., Afchine, A., Fahey, D., Jensen, E., Khaykin, S., Kuhn, T., Lawson, P., Lykov, A., Pan, L. L., Riese, M., Rollins, A., Stroh, F., Thornberry, T., Wolf, V., Woods, S., Spichtinger, P., Quaas, J., and Sourdeval, O.: A microphysics guide to cirrus – Part 2: Climatologies of clouds and humidity from observations, Atmos. Chem. Phys., 20, 12569–12608, https://doi.org/10.5194/acp-20-12569-2020, 2020. a
Krämer, M., Spelten, N., Rolf, C., and Spang, R.: A microphysics guide to cirrus – Part 3: Occurrence patterns of cloud particles, Atmos. Chem. Phys., 25, 13563–13583, https://doi.org/10.5194/acp-25-13563-2025, 2025. a
Kupc, A., Williamson, C., Wagner, N. L., Richardson, M., and Brock, C. A.: Modification, calibration, and performance of the Ultra‐High Sensitivity Aerosol Spectrometer for particle size distribution and volatility measurements during the Atmospheric Tomography Mission (ATom) airborne campaign, Atmos. Meas. Tech., 11, 369–383, https://doi.org/10.5194/amt-11-369-2018, 2018. a
Liu, N., Liu, C., and Hayden, L.: Climatology and Detection of Overshooting Convection From 4 Years of GPM Precipitation Radar and Passive Microwave Observations, J. Geophys. Res.-Atmos., 125, e2019JD032003, https://doi.org/10.1029/2019JD032003, 2020. a, b, c
Lott, F. and Miller, M. J.: A new subgrid-scale orographic drag parametrization: Its formulation and testing, Q. J. Roy. Meteorol. Soc., 123, 101–127, https://doi.org/10.1002/qj.49712353704, 1997. a
Lu, C., Sun, C., Liu, Y., Zhang, G. J., Lin, Y., Gao, W., Niu, S., Yin, Y., Qiu, Y., and Jin, L.: Observational relationship between entrainment rate and environmental relative humidity and implications for convection parameterization, Geophys. Res. Lett., 45, 13495–13503, https://doi.org/10.1029/2018GL080264, 2018. a
Lüttmer, T., Spichtinger, P., and Seifert, A.: Investigating ice formation pathways using a novel two-moment multi-class cloud microphysics scheme, Atmos. Chem. Phys., 25, 4505–4529, https://doi.org/10.5194/acp-25-4505-2025, 2025. a
McKenna, D. S., Konopka, P., Grooß, J.-U., Günther, G., Müller, R., Spang, R., Offermann, D., and Orsolini, Y.: A new Chemical Lagrangian Model of the Stratosphere (CLaMS) 1. Formulation of advection and mixing, J. Geophys. Res.-Atmos., 107, ACH 15-1–ACH 15-15, https://doi.org/10.1029/2000JD000114, 2002. a
Meyer, J., Rolf, C., Schiller, C., Rohs, S., Spelten, N., Afchine, A., Zöger, M., Sitnikov, N., Thornberry, T. D., Rollins, A. W., Bozóki, Z., Tátrai, D., Ebert, V., Kühnreich, B., Mackrodt, P., Möhler, O., Saathoff, H., Rosenlof, K. H., and Krämer, M.: Two decades of water vapor measurements with the FISH fluorescence hygrometer: a review, Atmos. Chem. Phys., 15, 8521–8538, https://doi.org/10.5194/acp-15-8521-2015, 2015. a, b
Moore, R. H., Brock, C. A., Murphy, D. M., Cziczo, D. J., Froyd, K. D., Kupc, A., Williamson, C. J., Campuzano-Jost, P., Jimenez, J. L., Wagner, N. L., Gordon, T. D., and Schwarz, J. P.: Sizing response of the Ultra-High Sensitivity Aerosol Spectrometer (UHSAS) and Laser Aerosol Spectrometer (LAS) to changes in submicron aerosol composition and refractive index, Atmos. Meas. Tech., 14, 4517–4531, https://doi.org/10.5194/amt-14-4517-2021, 2021. a
Müller, S., Hoor, P., Berkes, F., Bozem, H., Klingebiel, M., Reutter, P., Smit, H. G. J., Wendisch, M., Spichtinger, P., and Borrmann, S.: In situ detection of stratosphere–troposphere exchange of cirrus particles in the midlatitudes, Geophys. Res. Lett., 42, 949–955, https://doi.org/10.1002/2014GL062556, 2015. a, b
Neiman, P. J. and Wakimoto, R. M.: The Interaction of a Pacific Cold Front with Shallow Air Masses East of the Rocky Mountains, Mon. Weather Rev., 127, 2102–2127, https://doi.org/10.1175/1520-0493(1999)127<2102:TIOAPC>2.0.CO;2, 1999. a
Neis, P., Smit, H., Rohs, S., Bundke, U., Krämer, M., Spelten, N., Ebert, V., Buchholz, B., Thomas, K., and Petzold, A.: Quality assessment of MOZAIC and IAGOS capacitive hygrometers: Insights from airborne field studies, Tellus B, 67, https://doi.org/10.3402/tellusb.v67.28320, 2015. a, b
Orr, A., Bechtold, P., Scinocca, J., Ern, M., and Janiskova, M.: Improved Middle Atmosphere Climate and Forecasts in the ECMWF Model through a Nonorographic Gravity Wave Drag Parameterization, J. Climate, 23, 5905–5926, https://doi.org/10.1175/2010JCLI3490.1, 2010. a
Pandey, S., Jensen, E. J., Homeyer, C. R., Diskin, G. S., Thornberry, T. D., Rollins, A. W., Sayres, D. S., Hintsa, E. J., Smith, J. B., Selkirk, H. B., Avery, M. A., Jensen, M. P., Lawson, R. P., Toon, O. B., and Bui, T. P.: Characteristics of Convective Overshooting and Its Impact on the Lower Stratosphere Composition During the DCOTSS Field Campaign, J. Geophys. Res.-Atmos., 127, e2022JD037053, https://doi.org/10.1029/2022JD037053, 2022. a
Petzold, A., Neis, P., Rütimann, M., Rohs, S., Berkes, F., Smit, H. G. J., Krämer, M., Spelten, N., Spichtinger, P., Nédélec, P., and Wahner, A.: Ice-supersaturated air masses in the northern mid-latitudes from regular in situ observations by passenger aircraft: vertical distribution, seasonality and tropospheric fingerprint, Atmos. Chem. Phys., 20, 8157–8179, https://doi.org/10.5194/acp-20-8157-2020, 2020. a
Phoenix, D. B. and Homeyer, C. R.: Simulated Impacts of Tropopause-Overshooting Convection on the Chemical Composition of the Upper Troposphere and Lower Stratosphere, J. Geophys. Res.-Atmos., 126, e2021JD034568, https://doi.org/10.1029/2021JD034568, 2021. a, b, c
Qu, Z., Huang, Y., Vaillancourt, P., Cole, J., Milbrandt, J.-A., Yau, M.-K., Walker, K., and de Grandpre, J.: Simulation of convective moistening of the extratropical lower stratosphere using a numerical weather prediction model, Atmos. Chem. Phys., 20, 2143–2159, https://doi.org/10.5194/acp-20-2143-2020, 2020. a, b, c, d
Read, W. G., Livesey, N. J., Froidevaux, L., Lambert, A., Santee, M. L., Schwartz, M. J., Millán, L. F., Jarnot, R. F., Wagner, P. A., Hurst, D. F., Walker, K. A., Sheese, P. E., and Nedoluha, G. E.: Validation of the Aura Microwave Limb Sounder middle atmosphere water vapor and nitrous oxide measurements, J. Geophys. Res.-Atmos., 112, D24S37, https://doi.org/10.1029/2007JD008724, 2007. a
Rieger, D., Köhler, M., Hogan, R., Schäfer, A., Seifert, A., de Lozar, A., and Zängl, G.: ecRad in ICON – Details on the Implementation and First Results, Reports on ICON 4, Deutscher Wetterdienst, https://doi.org/10.5676/DWD_pub/nwv/icon_004, 2019. a
Riese, M., Ploeger, F., Rap, A., Vogel, B., Konopka, P., Dameris, M., and Forster, P.: Impact of uncertainties in atmospheric mixing on simulated UTLS composition and related radiative effects, J. Geophys. Res., 117, D16305, https://doi.org/10.1029/2012JD017751, 2012. a
Rolf, C., Spelten, N., Afchine, A., Borrmann, S., Cairo, F., Dragoneas, A., Frey, W., Krãmer, M., Mahnke, C., Molleker, S., Riese, M., Viciani, S., and Voigt, C.: Transport of pollution and water vapour by the Asian Summer Monsoon, Atmos. Chem. Phys., 17, 11075–11095, https://doi.org/10.5194/acp-17-11075-2017, 2017. a
Rolf, C., Rohs, S., Smit, H., Krämer, M., Bozóki, Z., Hofmann, S., Franke, H., Maser, R., Hoor, P., and Petzold, A.: Evaluation of compact hygrometers for continuous airborne measurements, Meteorol. Z., https://doi.org/10.1127/metz/2023/1187, 2023. a
Sang, W., Huang, Q., Tian, W., Wright, J. S., Zhang, J., Tian, H., Luo, J., Hu, D., and Han, Y.: A Large Eddy Model Study on the Effect of Overshooting Convection on Lower Stratospheric Water Vapor, J. Geophys. Res.-Atmos., 123, 10023–10036, https://doi.org/10.1029/2017JD028069, 2018. a, b
Sayres, D. S., Smith, J. B., Wilmouth, D. M., Pandey, A., Homeyer, C. R., Bowman, K. P., and Anderson, J. G.: Using the NAMA as a Natural Integrator to Quantify the Convective Contribution to Lower Stratospheric Water Vapor Over North America, J. Geophys. Res.-Atmos., 129, e2024JD041641, https://doi.org/10.1029/2024JD041641, 2024. a, b
Schoeberl, M. R., Douglass, A. R., Jackman, C. H., Waters, J. W., Livesey, N. J., Read, W. G., Froidevaux, L., Lambert, A., Santee, M. L., Schwartz, M. J., Millán, L. F., Jarnot, R. F., Wagner, P. A., Hurst, D. F., Walker, K. A., Sheese, P. E., and Nedoluha, G. E.: Overview of the EOS Aura Mission, IEEE T. Geosci. Remote, 44, 1066–1074, https://doi.org/10.1029/2018GL080264, 2006. a
Seifert, A. and Beheng, K.: A tow-moment cloud microphysics parameterization for mixed-phase clouds. Part 1: Model description, Meteorol. Atmos. Phys., 92, 45–66, https://doi.org/10.1007/s00703-005-0112-4, 2006. a
Smith, J. B., Wilmouth, D. M., Bedka, K. M., Bowman, K. P., Homeyer, C. R., Dykema, J. A., Sargent, M. R., Clapp, C. E., Leroy, S. S., Sayres, D. S., Dean-Day, J. M., Paul Bui, T., and Anderson, J. G.: A case study of convectively sourced water vapor observed in the overworld stratosphere over the United States, J. Geophys. Res.-Atmos., 122, 9529–9554, https://doi.org/10.1002/2017JD026831, 2017. a
Spichtinger, P. and Gierens, K. M.: Modelling of cirrus clouds – Part 1a: Model description and validation, Atmos. Chem. Phys., 9, 685–706, https://doi.org/10.5194/acp-9-685-2009, 2009. a
Tiedtke, M.: A Comprehensive Mass Flux Scheme for Cumulus Parameterization in Large-Scale Models, Mon. Weather Rev., 117, 1779 – 1800, https://doi.org/10.1175/1520-0493(1989)117<1779:ACMFSF>2.0.CO;2, 1989. a
Ueyama, R., Schoeberl, M., Jensen, E., Pfister, L., Park, M., and Ryoo, J.-M.: Convective Impact on the Global Lower Stratospheric Water Vapor Budget, J. Geophys. Res.-Atmos., 128, e2022JD037135, https://doi.org/10.1029/2022JD037135, 2023. a
Wang, P. K.: The thermodynamic structure atop a penetrating convective thunderstorm, Atmos. Res., 83, 254–262, https://doi.org/10.1016/j.atmosres.2005.08.010, 2007. a
Wang, Y., Liu, X., Smith, J. A., Zhang, L., and Chen, H.: Convectively Transported Water Vapor Plumes in the Midlatitude Lower Stratosphere, J. Geophys. Res.-Atmos., 128, e2022JD037699, https://doi.org/10.1029/2022JD037699, 2023. a, b, c, d
Zahn, A., Brenninkmeijer, C. A. M., and van Velthoven, P. F. J.: Passenger aircraft project CARIBIC 1997–2002, Part I: the extratropical chemical tropopause, Atmos. Chem. Phys. Discuss., 4, 1091–1117, https://doi.org/10.5194/acpd-4-1091-2004, 2004. a
Zahn, A., Christner, E., Velthoven, P., Rauthe‐Schöch, A., and Brenninkmeijer, C.: Processes controlling water vapor in the upper troposphere/lowermost stratosphere: An analysis of 8 years of monthly measurements by the IAGOS-CARIBIC observatory: CARIBIC H2O in the UT/LMS, J. Geophys. Res.-Atmos., 119, https://doi.org/10.1002/2014JD021687, 2014. a
Zängl, G., Reinert, D., and Prill, F.: Grid refinement in ICON v2.6.4, Geosci. Model Dev., 15, 7153–7176, https://doi.org/10.5194/gmd-15-7153-2022, 2022. a
Zöger, M., Engel, A., McKenna, D. S., Schiller, C., Schmidt, U., and Woyke, T.: Balloon-borne in situ measurements of stratospheric H2O, CH4, and H2 t midlatitudes, J. Geophys. Res.-Atmos., 104, 1817–1825, https://doi.org/10.1029/1998JD100024, 1999. a, b