the Creative Commons Attribution 4.0 License.
the Creative Commons Attribution 4.0 License.
 | 08 Dec 2025
Drone-based vertical profiling of particulate matter size distribution and carbonaceous aerosols: urban vs. rural environment
Kajal Julaha
Vladimír Ždímal
Saliou Mbengue
David Brus
The study presents drone-based measurements to investigate the seasonal vertical variability of equivalent black carbon (eBC) mass and particle number concentrations (PNC) at a rural and urban site in the Czech Republic. Vertical profiles of eBC were measured using a micro-aethalometer, while PNC was measured using an optical particle counter. Drone-based eBC measurements closely matched reference aethalometers placed at both ground level and at 230 m of a tower when using a humidity control mechanism. Without dryer, eBC mass concentration was overestimated by 276 % in summer and 285 % in winter, but uncertainties were reduced to under 10 % with drying. These findings highlight the importance of humidity control for accurate aerosol measurements, especially for eBC. The study also revealed a decrease in eBC and PNC with height at the rural site during both summer and winter, with seasonal differences in the altitude where this decrease began. Elevated eBC concentrations in winter were due to increased atmospheric stability and combustion-related fine particles. At the urban site, concentrations in summer were uniform with height (4 to 100 m above ground level (a.g.l.)) but gradually decreased with height during winter. Furthermore, the study investigated changes in the vertical distribution of eBC and PNC during a high pollution event at the urban site, influenced by long-range transport. Our findings confirm the effectiveness of drones in capturing vertical variations of air pollutants, offering results on the dynamics between local emissions, atmospheric stability, and long-range transport and suggesting the necessity of measuring vertical concentration profiles to support air quality management strategies.
- Article
(7256 KB) - Full-text XML
-
Supplement
(4324 KB) - BibTeX
- EndNote


Black Carbon (BC) aerosols, one of the substantial contributors to climate change and adverse health effects, are primarily emitted into our atmosphere through incomplete combustion of fossil fuels and biomass (Bond et al., 2013; Ramanathan and Carmichael, 2008). BC absorbs efficiently solar radiation and contributes to atmospheric warming (Moteki, 2023; Myhre et al., 2013). Aged BC can act as cloud condensation nuclei (CCN) and affect climate through its indirect effects by altering cloud properties and their formation processes (Wang et al., 2018c). The radiative properties of BC depend on its vertical profiles (Samset et al., 2013). For example, BC in the free troposphere can enhance its radiative forcing by trapping energy emitted from the lower cloud layers (Schwarz et al., 2006). The vertical distribution of BC also impacts the evolution of the planetary boundary layer (PBL). BC in the upper PBL exhibits light absorption efficiency, heating the surrounding atmosphere and enhancing atmospheric stability, leading to extreme haze pollution events (Ding et al., 2016).
Modeling-based studies on BC vertical distribution are limited (Chen et al., 2022). Uncertainties in these models mainly arise from assumptions about the vertical distribution of BC aerosols, highlighting the need to measure the vertical distribution of BC on a regional scale, from areas influenced by direct emissions from the ground to those characterized by long-range transport (Ramana et al., 2010). These measurements can also help validate satellite observations and improve the representation of BC vertical profiles in climate models, leading to a more accurate assessment of BC radiative forcing (Li et al., 2013; Samset et al., 2013).
The BC vertical distribution can be measured by various platforms, such as meteorological balloons, towers, aircraft, and unmanned aerial vehicles (UAVs). Meteorological tethered balloons provide highly resolved data and detailed information close to the ground, capable of measuring aerosol concentrations up to the free atmosphere (Babu et al., 2011; Ferrero et al., 2019; Renard et al., 2020; Cappelletti et al., 2022). Meteorological towers offer a unique opportunity for continuous long-term monitoring of aerosols at different heights (Chi et al., 2013; Xie et al., 2019; Sun et al., 2020; Liang et al., 2022). Compared to towers, aircraft and UAVs can access higher altitudes, with some aircraft capable of carrying heavier payloads, allowing them to transport more sophisticated instruments for detailed aerosol measurements. These platforms offer greater spatial coverage and flexibility, making them suitable for comprehensive atmospheric studies (Brady et al., 2016; Corrigan et al., 2008; Villa et al., 2016; Wu et al., 2021; Schulz et al., 2019). Drones have recently gained popularity among all the other methods because of their cost effectiveness, flexibility, and mobility due to their lightweight design (Barbieri et al., 2019; de Boer et al., 2020). Several studies have used drones to study vertical measurements of BC and particle number concentrations (PNC). For example, Liu et al. (2020) conducted vertical measurements of fine particulate matter (PM) and BC using a DJI Matrice 600 drone equipped with a battery-operated light-scattering laser photometer and a micro-aethalometer. Their study revealed different vertical patterns for PM2.5 and BC, suggesting different sources for each. Similarly, Zhu et al. (2019) used a hexacopter with a customized scanning mobility particle sizer, an optical particle counter, and a meteorology sensor to study the vertical variability of particle number size distribution (PNSD) near the ground to up to 300 m. The study showed that PNC with size > 0.3 µm decreased with height during the evening. Brus et al. (2021) investigated the vertical profile of PNCs and gases in the San Luis Valley, Colorado, and highlighted their interaction with meteorological conditions and boundary layer processes. Studies on the vertical distribution of BC aerosols in Central Europe are very limited. In Poland, Chilinski et al. (2016) examined the vertical distribution of BC in a valley for 3 d using UAV. In Germany, Samad et al. (2020) investigated the vertical profiles of PM, BC, and ultrafine particles in Stuttgart using a tethered balloon, and Harm-Altstädter et al. (2024) used a fixed-wing drone for vertical measurement of aerosol concentration, including eBC, near a civil airport.
The studies about the vertical distributions of BC aerosols in the Czech Republic are limited to a tall tower in a rural area (Mbengue et al., 2023), and no measurements in urban areas have been done. To date, no drone-based measurement of BC has been conducted in the Czech Republic. This study combines mobile (drone-based) and fixed (tall tower and building) observational platforms to measure the vertical distribution of BC aerosols and PNC at two different sites representing an urban and a rural location to isolate the respective roles of local emissions, meteorology, and long-range transport in shaping vertical aerosol distributions. It further estimates the measurement uncertainties and dependence of the results on the humidity. In this study, we address this gap by developing and testing a lightweight, drone-mountable silica-gel dryer that enables humidity-controlled eBC measurements.
2.1 Measurement sites
2.1.1 Rural background site
The National Atmospheric Observatory Košetice (NAOK, 49°35′ N, 15°05′ E; 534 m a.s.l.) in the Bohemian Moravian Highlands in the Czech Republic (Fig. 1) represents a central European background site. Located approximately 75 km southeast of Prague, the observatory is situated in a rural area. The observatory is equipped with instruments to measure gaseous pollutants, atmospheric aerosols, and meteorological parameters. It includes a 250 m tall atmospheric tower which provides a unique opportunity to study atmospheric parameters at different elevations (Dvorská et al., 2015). NAOK is part of the Aerosol, Clouds, and Trace Gases Research Infrastructure Network (ACTRIS ERIC) and several other research projects and monitoring programs (Mbengue et al., 2023).
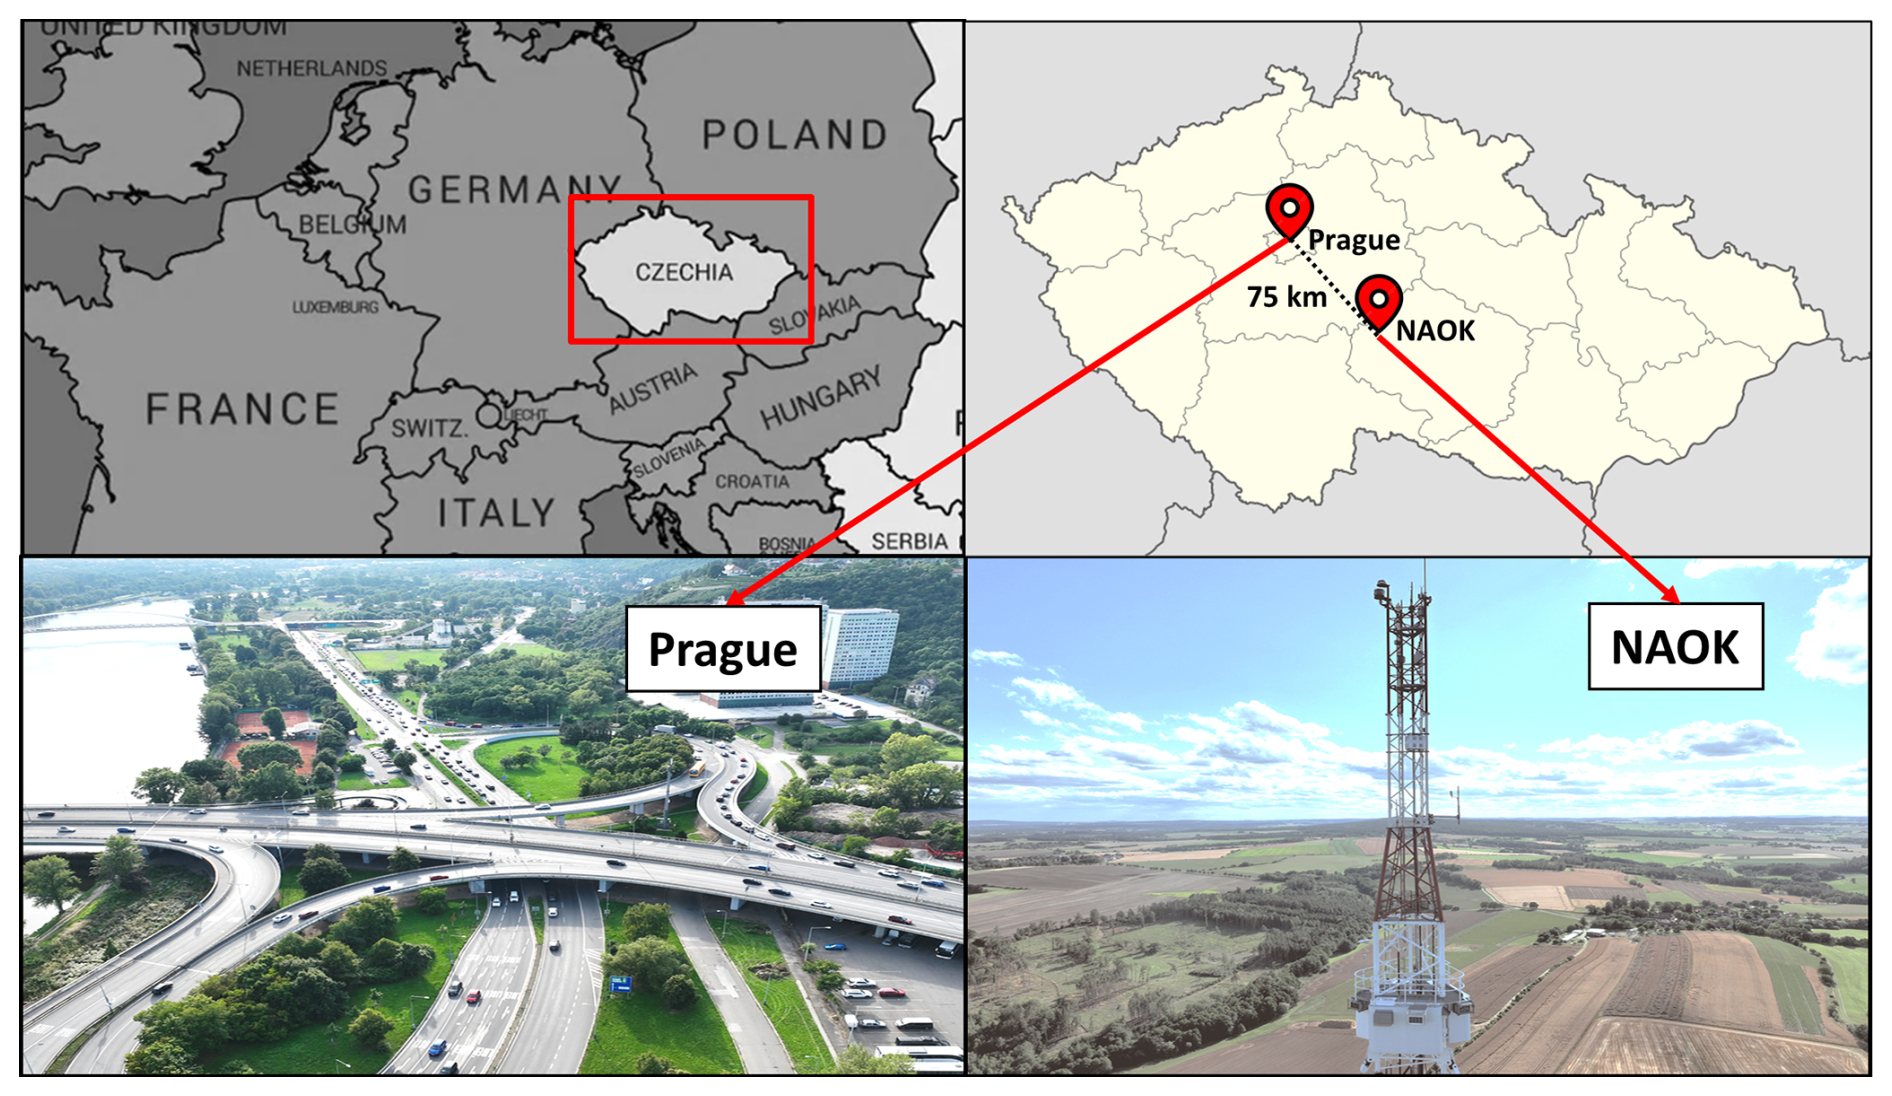
Figure 1Geographical location of rural background (NAOK) and urban (Prague) sites in the Czech Republic. Source: top left: Country map of Czechia adapted from mapchart.net, top right: regional map of Prague–NAOK adapted from Czech Republic location map.svg by Lencer, 2008, via Wikimedia Commons (CC BY-SA 3.0), and bottom: photographs of Prague and NAOK site – taken by the author Kajal Julaha during measurement campaigns.
NAOK is influenced by regional and long-range transported air masses, mainly associated with the western and southeastern directions (Mbengue et al., 2021; Vodička et al., 2015). A primary highway in the Czech Republic (D1: 36 000 cars d−1, CSD, 2020) is situated approximately 6 km to the north and northeast of the observatory (Mbengue et al., 2023).
2.1.2 Urban site
The Faculty of Mathematics and Physics (50°6.89′ N, 14°26.95′ E; 185 m a.s.l.) at Charles University in Prague represents an urban site situated 75 km away from NAOK (Fig. 1). The faculty has multiple campus locations throughout Prague, with its Troja campus near the Vltava River serving as the site for this study. The main building of the Troja campus is an 11-story building, almost 50 m high. The campus is located in a river valley surrounded by hills with an elevation of 50 m above ground level (a.g.l.). The Department of Atmospheric Physics (DAP) is also on this campus. The DAP monitors particulate matter (PM1, PM2.5, and PM10), gases (NO2, O3, and CO), and meteorology (temperature, relative humidity (RH), pressure, wind speed, and rainfall), with measurements taken at ground level (2 m), 10 m, and 50 m (Ramatheerthan et al., 2024).
The site is located near the Blanka tunnel exit and is impacted by fresh traffic emissions. The Blanka tunnel, more than 6 km long, is the longest road tunnel in the Czech Republic. The average traffic density of this tunnel is 80 000 to 90 000 cars d−1 (Metrostav, 2024). It was constructed to minimize the environmental impacts of traffic. However, its opening significantly increased the traffic at some locations, leading to substantial changes in the urban geochemistry of Prague (Mizera et al., 2022).
2.2 Instrumentation
2.2.1 eBC measurements
The micro-Aethalometer AE51 (AethLabs San Francisco, CA) (Fig. 2a) provides real-time equivalent BC (eBC) concentration using an 880 nm light source (Petzold et al., 2013). AE51 operates on a principle similar to other aethalometers, such as AE31 (Aerosol Magee Scientific, Berkeley, CA). The AE51 measures the light attenuation through a filter (T60 Teflon-coated glass fiber) loaded with particles and converts the attenuation into an eBC mass concentration using a predefined mass attenuation coefficient (12.5 m2 g−1) (Alas et al., 2020). The time resolution of 10 s and flow rate of 150 mL min−1 were used in this study. The filter was replaced when attenuation, a dimensionless measure of optical absorbance, reached 80 to minimize the filter loading effect. This threshold has been recommended to reduce measurement bias due to increasing filter loading (Good et al., 2017; Lee, 2019; Miyakawa et al., 2020). Recent studies (Alas et al., 2020; Masey et al., 2020) have shown that uncorrected AE51 readings closely match reference instruments in low-concentration environments. Therefore, no correction method was used for the eBC values in the present study.
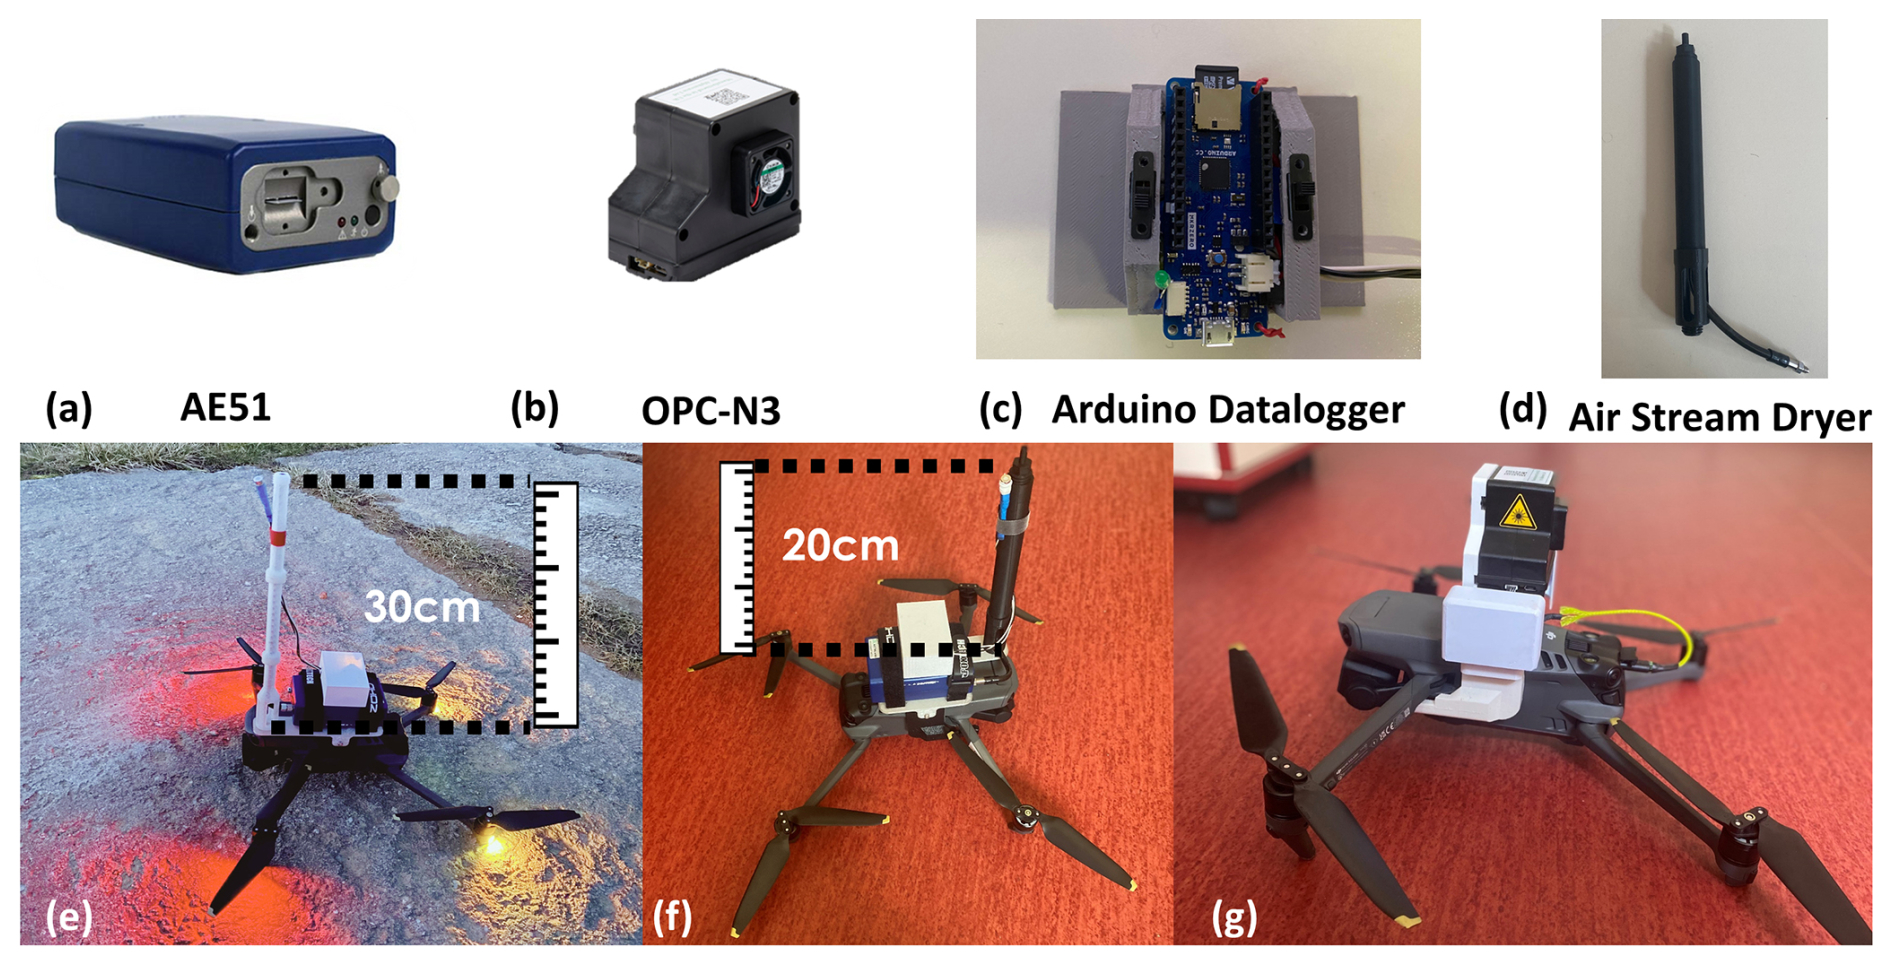
Figure 2Measurement setup: (a) micro-Aethalometer AE51, (b) optical particle counter (OPC) N3, (c) Arduino datalogger, (d) Air Stream Dryer, (e) micro-Aethalometer AE51 with a temperature and RH datalogger without a dryer, (f) micro-Aethalometer AE51 with a temperature and RH datalogger with a dryer, and (g) consumer drone backpack with an optical particle counter with a custom mount on the drone.
To reduce short-term noise, AE51 data were averaged over 1 min intervals. If the resulting mean eBC was negative, the measurement point was excluded from further analysis. The fraction of excluded data was below 2 % for all periods except the NAOK summer, where it reached a maximum of 10 % at altitudes above 100 m.
2.2.2 Air stream Dryer
A 20 cm-long homemade silica gel dryer (Fig. 2d) was used in front of the AE51 (Fig. 2f) to control the humidity for accurate eBC mass concentration measurements. The dryer consists of 2 coaxial cylinders of 1.62 and 0.65 cm diameters, with silica gel in the space between them. The silica gel effectively removes moisture from the aerosols as axial airflow passes through the dryer. The silica gel used in the dryer was spherical bead-type (Carl Roth, P077.1, “Perfform”), which is mechanically robust and non-dusting, minimizing any risk of particle shedding under vibration. Additionally, the dryer was sealed with stainless-steel mesh (inner cylinder) at both ends to prevent the possible release of silica fragments during operation. The inner cylinder (diameter 6.6 mm and length 13.5 cm), of stainless steel woven mesh screen with a 0.25 mm × 0.25 mm square hole aperture (80 opening per inch, 0.05 mm wire, ∼ 65 % open area), was chosen for its smooth surface and minimal particle loss, while the outer parts were fabricated with PLA (Polylactic Acid) using a 3D printer (MK4S, Prusa Research), with a total weight of 50 g. Particle loss was evaluated using the Particle loss calculator (von der Weiden et al., 2009) and found to be ≤ 1 % for PM2.5-sized particles at the AE51's flow rate of 150 mL min−1 (Table S2 in the Supplement). The performance of the dryer was tested in laboratory conditions by passing air with 100 % RH through the setup at the AE51's flow rate of 150 mL min−1. The dryer effectively reduced the RH to below 40 %, and maintained that level for up to 3 d, ensuring reliable drying under operational flow (Fig. S1 in the Supplement). The silica-gel beads were replaced every morning before measurements began. The flow and leakage tests were also carried out to describe the dryer's performance at 150 mL min−1. The flow rate was monitored before and after the dryer using a mass flow meter. For the leak test, the dryer inlet was connected to a HEPA filter, and the outlet was connected to a Condensation Particle Counter (CPC) to monitor any particle breakthrough. Particle concentrations measured by the CPC were found to be negligible, confirming the air-tight integrity of the dryer assembly.
2.2.3 Particle number concentration measurements
The air quality measurements backpack (Yugen Oy, Finland) for a consumer-grade drone with an Optical particle Counter (OPC-N3, Alphasense) (Fig. 2b) was used to measure PNC in the polystyrene latex (PSL) equivalent size range from 0.35 to 40 µm. The OPC detects the light scattered by particles in the sample air stream illuminated by a laser beam (∼ 658 nm) and translates the signal into particle count and size (Hagan and Kroll, 2020). The OPC-N3 reports an internal airflow estimate based on a low-power internal fan performance, not corrected for external wind. The OPC's inlet was horizontally mounted and exposed to wind during drone flights so that it faced oncoming airflow. While this minimized directional variability, strong horizontal winds could still affect the internal airflow stability of the OPC-N3 (Table S2). To mitigate this, all measurements were averaged over 1 min intervals, which helps reduce short-term fluctuations. Due to OPC's horizontal inlet design and a low power built-in ventilator, equipping a dryer would result in an excessively high pressure drop (manufacturer's maximum allowable pressure drop ≤ 40 Pa), making the measurement highly unreliable (Bezantakos et al., 2020) and thus the OPC-N3 was operated without a dryer. Since OPC-N3 sampled air without drying, the measured particle sizes and number concentrations may therefore be affected by hygroscopic growth under high relative humidity conditions. However, the instrument's internal T is slightly elevated due to electronics heat emission, reducing the humidity of the sampled air. Analysis of the internal RH logs revealed that no data exceeded 80 % RH, and most measurements were taken under relatively dry conditions (RH < 40 % in 60 %–90 % of cases, depending on the season and height). Therefore, hygroscopic growth effects were expected to be minor. Similar limitations and evaluation strategies (flagged RH > 80 %) have been documented in previous UAV-based OPC studies (Brus et al., 2025; Chacón-Mateos et al., 2022; Nurowska et al., 2023; Nurowska and Markowicz, 2023).
The backpack with OPC uses a Raspberry Pi zero microcomputer as a data logger and was mounted on the top of the drone (Fig. 2g). The backpack also contains two meteorological sensors BME 280 (Bosch Sensortec GmbH) and SHT85 (Senserion AG) positioned on opposite side of the backpack (see their comparison in the next section) and a redundant to drone own GPS module for the recording of drone position (Brus et al., 2025). The backpack housing was 3D-printed using white polyethylene terephthalate glycol (PETG) filament, which provides structural support and helps reflect solar radiation to minimize thermal influence on the sensors. The dual-sensor configuration also reduces bias caused by asymmetric solar heating, which can lead to small temperature differences (up to a few degrees) under clear-sky conditions, while remaining negligible under overcast skies. Temperature and RH readings from both sensors were compared against tower-based temperature and RH data while flying on the drone at different heights to evaluate the feasibility and reliability of using the drone-based setup for vertical profiling of temperature and RH validate sensor accuracy and data reliability (Figs. S2–S5).
The total particle number concentration (N), in particles per cubic meter (# m−3), was calculated from the raw OPC data as:
where C is the total particle count, F is the flow rate in cm3 s−1, and t is the sampling time in seconds. The OPC operates at a total flow rate of 5.5 L min−1 and a sample flow rate of 0.28 L min−1. The measurement interval of 1 s was used to account for the high temporal variability of particles' concentrations.
2.2.4 Temperature and RH
For OPC, sensor SHT85 was used to measure ambient temperature (T) and RH, while with AE51, an Arduino (MKR Zero) datalogger (HYT939p, Innovative Sensor Technology IST AG) (Fig. 2c) was used for T and RH measurements. Although HYT939p has a slower nominal response time (≈ 2–3 s), potential lag effects were negligible because the drone hovered for approximately 5 min at each altitude and data were averaged over 1 min intervals. The HYT939P showed close agreement with tower-based T/RH measurements (see Figs. S6, S7 and Table S3), confirming its suitability for UAV-based profiling. The Arduino MKR zero microcontroller processes sensor data using a 32-bit SAMD21 processor and stores it on an SD card. It is programmed via the Arduino IDE to read inputs, perform tasks, and save data. The Arduino datalogger with HYT939p sensor was developed after the first summer campaigns at both sites and, therefore, was used only during winter campaigns. For the summer campaign, meteorological variables from the tower at the same height as the drone hover at NAOK were used, and in Prague, meteorological data from the ground and top of the building, i.e., 50 m, were used.
UAV-based T and RH measurements showed strong agreement with tower observations (R2 = 0.85–0.99 for T and 0.50–0.96 for RH; RMSE = 0.3–2.4 °C and 5 %–8 %, respectively, Figs. S2–S7). Among the sensors, the HYT939p exhibited the most stable performance and the smallest bias, while the SHT85 and BME showed largest scatter (Fig. S8 and Table S3). On average, UAV readings were ∼ 0.3 °C warmer and ∼ 7 % drier than the tower reference. The moderate reduction in correlation above 150 m, primarily due to fewer data points and a response lag at 230 m, reflects the known limitations of compact airborne sensors (Brus et al., 2025). These uncertainties, however, remain within acceptable limits for UAV-based meteorological measurements, as demonstrated in previous intercomparison studies (Barbieri et al., 2019).
2.2.5 Drone-based sampling
The instruments were installed on the Mavic 3 Classic drone (DJI Techology Co., Ltd.) (https://www.dji.com/cz/mavic-3-classic/specs, last access: 10 March 2025). The instrument's combined weight was too high to be carried by the drone; thus, the instruments were set up separately and measured each alternating hour under similar meteorological conditions.
With the micro-Aethalometer AE51, two different types of inlets were used: a 30 cm high inlet without a dryer and a 20 cm high inlet with a diffusion-based silica gel dryer, while no inlet was used with a drone backpack (Fig. 2). In the dryer-equipped setup, in contrast to the non-dryer configuration using a single bend (Fig. 2e), an additional 90° bend in the inlet tubing was necessary to accommodate the dryer housing (Fig. 2f). Based on an equivalent pipe length (EPL) of 0.15 m per 90° bend (radius < 5 cm; Wang et al., 2002), the EPL increased from 42 cm (without dryer) to 49 cm (with dryer). The AE51's sampling height and mounting position remained unchanged, and this small difference in EPL is negligible for submicron aerosols at 0.15 L min−1 (von der Weiden et al., 2009).
Particle losses within the AE51 inlet system were estimated using the Particle Loss Calculator (von der Weiden et al., 2009) for all measurement configurations and wind speeds (Table S2). For a 30 cm high inlet without dryer, total transmission efficiency for particles ≤ 2.5 µm corresponded to losses ≤ 9 %, while for the 20 cm dryer inlet, losses were ≤ 1 %. Whole-inlet losses were evaluated for both AE51 configurations (with and without dryer) to assess the effect of wind speed on sampling accuracy. For the AE51 without dryer, concentration changes for PM2.5 remained minimal (< 10 % overestimation) up to 4 m s−1 but increased at higher wind speeds, reaching about 22 % overestimation for PM1 at 6 m s−1. When the dryer was attached, the sampling efficiency also decreased with wind speed, with overestimation increasing from ∼ 5 % at 2 m s−1 for PM1 to ∼ 50 % at 6 m s−1 for PM2.5.
Only sampling losses were calculated for OPC and OPS, as no inlet extension was used. For OPS, sampling loss was minimal (10 % overestimation) for PM2.5 fraction up to wind speed of 6 m s−1, but PM10 showed an underestimation of 100 % up to 6 m s−1. For OPC, sampling effects were less severe (50 % overestimation up to 6 m s−1) for PM1, but for PM2.5, overestimation ranged from 60 % to 125 % at 4 m s−1 and 6 m s−1, respectively. For PM10 particles, overestimation was as high as 750 % at 6 m s−1.
During the flights, the drone climbed vertically from the ground to 230 and 100 m a.g.l. at a constant speed of 1 m s−1 along the tower at NAOK and the Prague building, respectively (the maximum altitude was limited to 100 m in Prague due to flight height restrictions). The drone hovered at different heights (4, 50, 100, 150, and 230 m at NAOK and 4, 50, and 100 m in Prague) for at least 3–5 min and then ascended in the same vertical direction. To reduce short-term noise, the raw data were averaged into 1 min intervals, yielding 3–5 values per altitude per flight. Although continuous measurements were recorded during each ascent flight, only hovering measurements at different heights were used in this study. This approach reduces the influence of rotor-induced turbulence and enables more stable sampling conditions. While ascent and hovering show a 3 %–6 % error in particle concentration, the descending flights were excluded due to the propellers-induced airflow increasing apparent particle concentrations by up to 40 %–60 % (Hedworth et al., 2022).
Flights were conducted for at least 4 to 5 d during a week, depending on the weather conditions. Across the full campaign (approximately 15–20 flights), these 1 min averages were grouped by altitude, and the resulting distributions were used for comparisons with reference instruments (e.g., AE33) and visualized at each height level.
To compare OPC-N3 (0.35–37 µm measurement size range) with the OPS (0.3–10 µm size range), size-bin harmonization was applied. For each 1 min average, OPC binned number concentrations were linearly interpolated in log 10(Dp) space from OPC mid-bin diameters onto the OPS bin grid over the overlapping size range of 0.35–10 µm (Weltje and Roberson, 2012). For all other analyses and plots, no bin harmonization was applied and data are presented in the full size ranges.
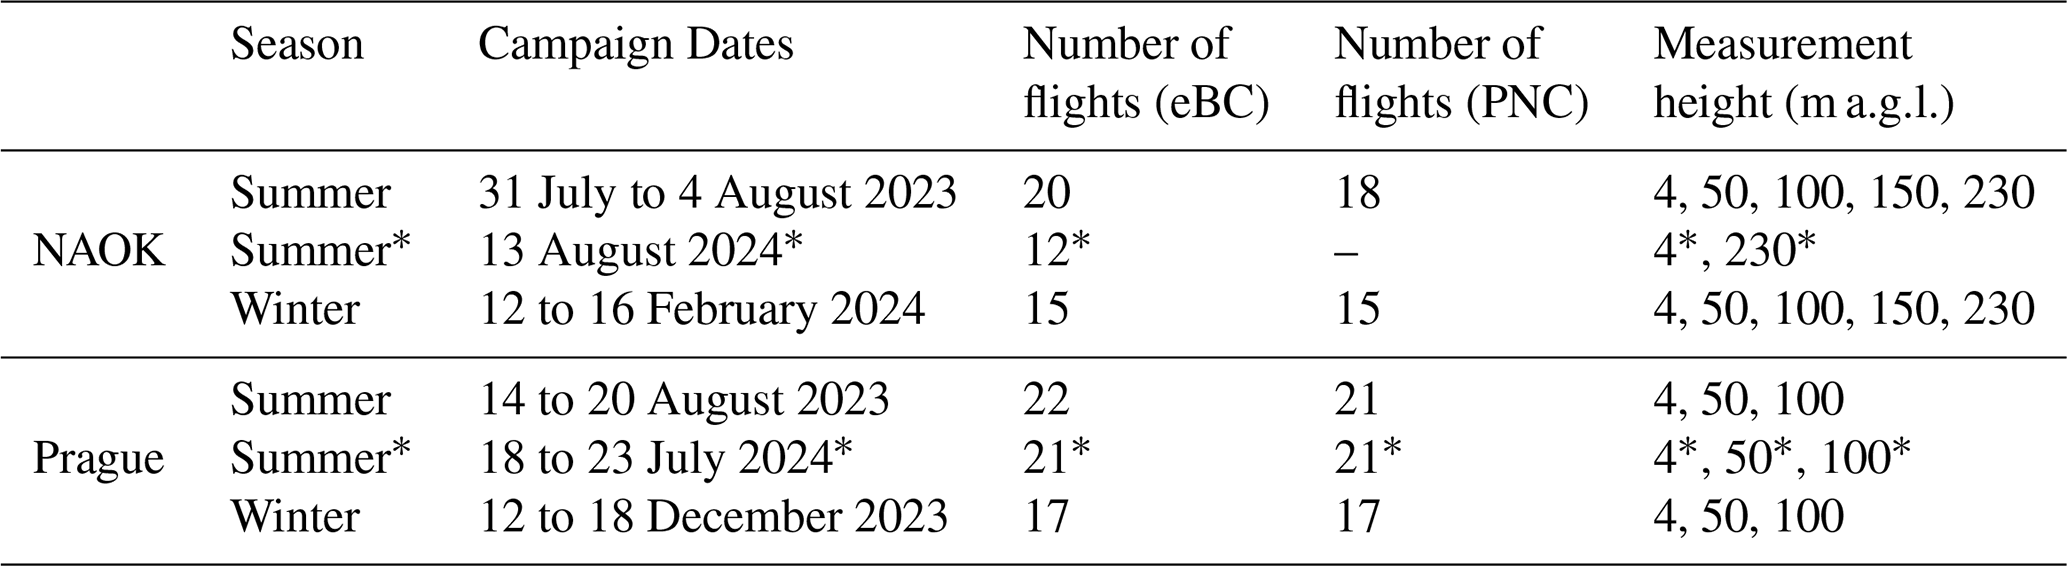
The summer campaign took place at NAOK from July and August 2023, and the winter campaign in February 2024 (Table 1). Additionally, a test to evaluate the dryer's performance was conducted on 13 August 2024. The dryer-on intercomparison at NAOK was performed on a single day. In Prague, measurements were performed during two summer campaigns and one winter campaign across 2023 and 2024. The urban measurements were taken without a dryer in August 2023, and in December 2023, while a dryer was used for eBC measurements in July 2024 (Table 1). Measurements for each campaign began at 06:00 UTC (08:00 CEST) and continued until 18:00 UTC (20:00 CEST) during the summer, and from 07:00 UTC (08:00 CET) to 16:00 UTC (17:00 CET) during the winter, due to shorter daylight hours. The number of flights for eBC and PNC at each height is summarized in Table 1.
Table 1Overview of campaign schedule and total number of flights for eBC and PNC measurements. Campaigns with a dryer are indicated with an asterisk.
2.2.6 Additional variables
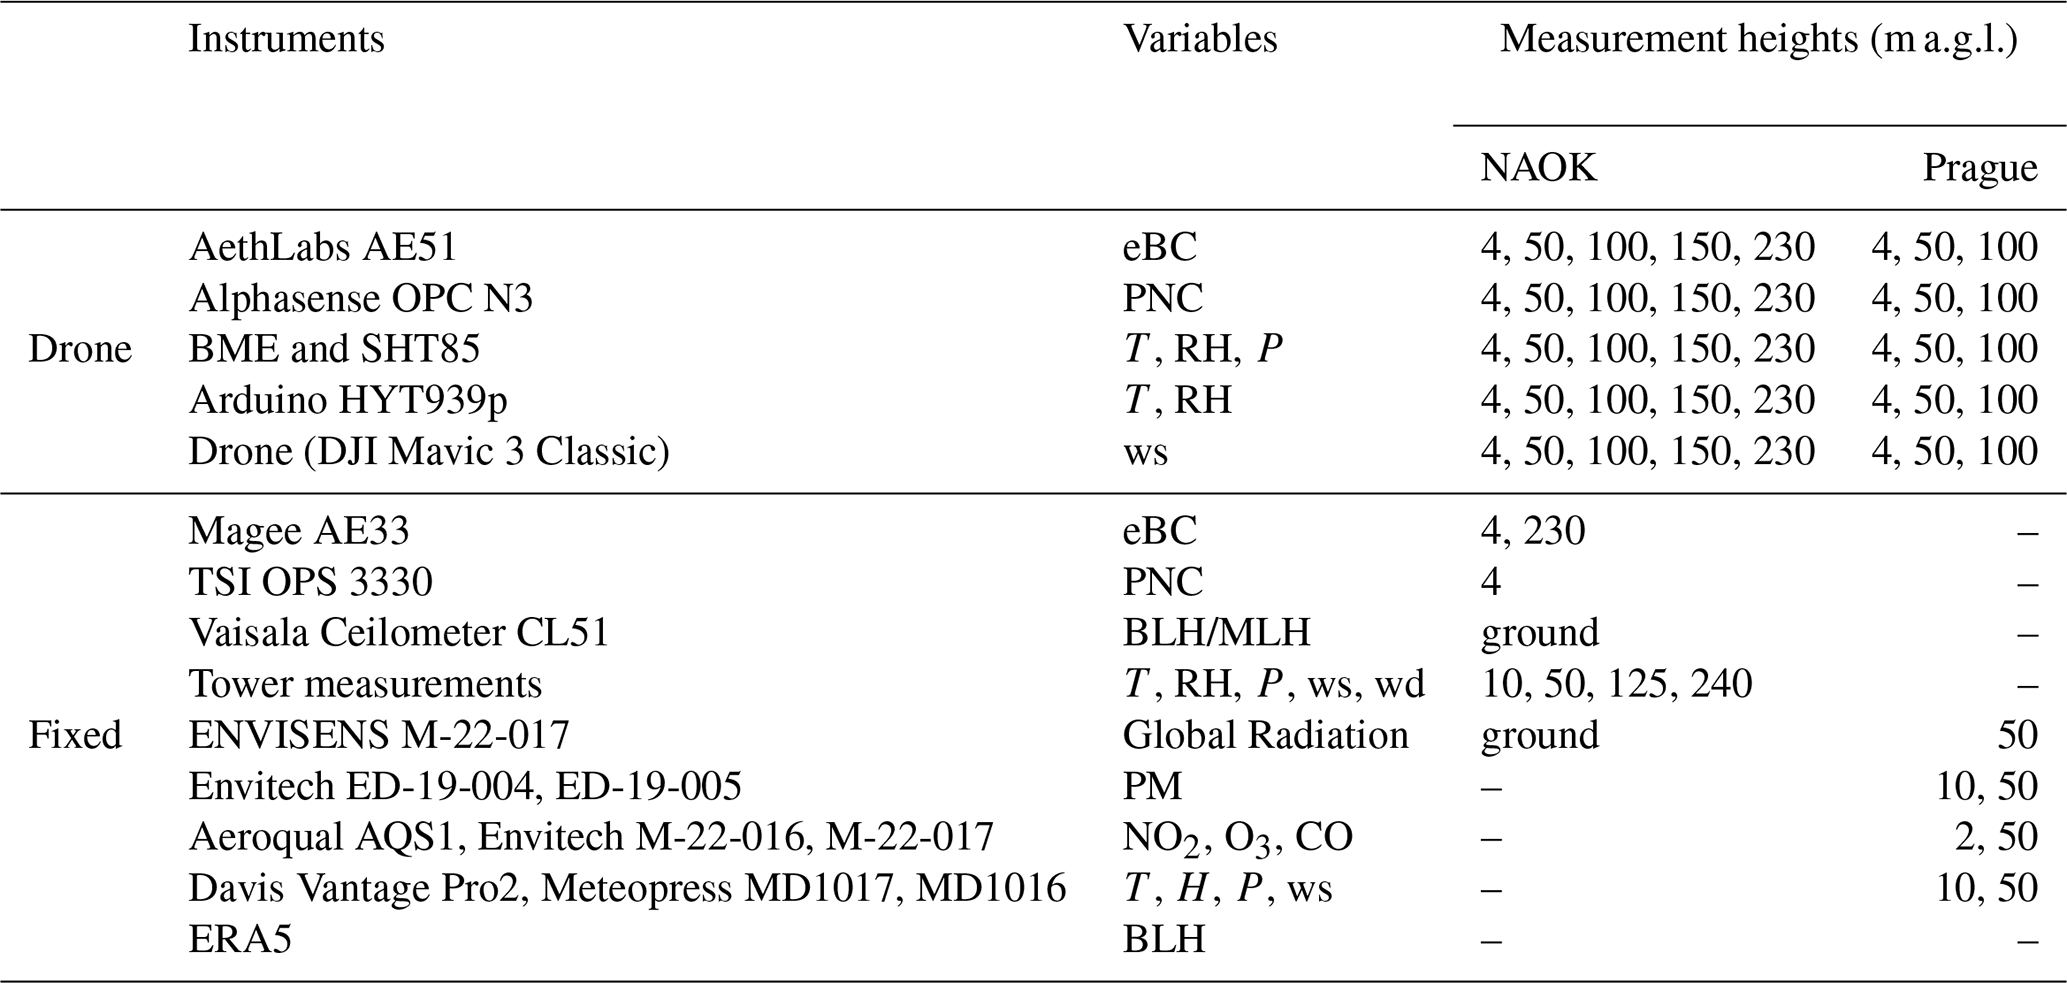
At NAOK, two aethalometers AE33 were available as reference instruments: one at the ground with a PM10 sampling inlet (Leckel GmbH) at 4 m a.g.l. and the other installed at the top of the tower, i.e., at 230 m with the same sampling head as on the ground. The data from these aethalometers were compared with the drone-based measurements while the drone hovered at corresponding heights. The AE33 at the ground uses a Nafion dryer (custom-made, TROPOS, Leipzig, Germany) to remove moisture from the sample stream, whereas AE33 at 230 m was connected to a Nafion dryer but was not supplied with dry air during the summer of 2023 and winter campaigns. An Optical Particle Sizer (OPS) (model 3330, TSI Inc., USA), without any dryer to ensure similar measurement conditions, was placed at 4 m for comparison with the measurement from OPC on the drone. In addition, temperature, RH, global radiation, wind speed and direction, and gaseous concentrations were obtained from standard measurements at multiple tower heights (50, 125, and 240 m) and ground level (4 m) (Dvorská et al., 2015), and ceilometer CL51 (Vaisala, Finland) was used for every hour boundary layer height (BLH) information (Julaha et al., 2025) at NAOK.
In Prague, long-term measurements alongside the building include data on temperature, RH, wind speed, gaseous concentrations, and particulate matter concentrations, monitored at ground level, 10 m, and at the top of a 50 m high building (Table 2) (Ramatheerthan et al., 2024). Since ground-based ceilometer measurements for the BLH were not available at the site, boundary layer height predictions were obtained from ERA5, a fifth-generation ECMWF (European Centre for Medium Weather Forecasting) reanalysis model produced by the Copernicus Climate Change Service (C3S). The hourly boundary layer height was obtained for the duration of campaigns (Hersbach et al., 2023). The consistency between ERA5-derived and ceilometer-observed BLH values was previously assessed (Julaha et al., 2025), showing good agreement at NAOK. Consequently, ERA5 data were considered reliable for estimating BLH at the urban site.
Normality was evaluated using the Shapiro–Wilk test (p < 0.05). Since the data were non-normally distributed, the Kruskal–Wallis test was used to determine significant differences in eBC (and PNC) concentrations between sampling heights. Sample sizes (N) are shown on boxplots. All groups had N ≥ 10, satisfying the minimum requirement (N > 5) for reliable Kruskal–Wallis testing of small, non-normal datasets (Sheskin, 2003).
The percentage difference (PD) was calculated to evaluate variability across measurements for comparing data across different heights and conditions:
where Xref is concentration from reference device and Xdrone is concentration from device on drone. The same approach was taken also for calculating the difference between heights.
The wind shear between the heights was calculated as the difference in wind speed (ΔWS) divided by the difference in altitude (Δz):
given in m s−1 per 100 m.
3.1 Intercomparison and effect of RH on eBC and PNC measurements
To assess the reliability of drone-based aerosol observations, eBC and PNC measured while hovering the drone were compared with the observations from the reference devices from the NAOK tower at 4 and 230 m for both the summer and winter campaigns. Because the reference instruments were available only at the NAOK site, the validation of drone-based measurements based on 15 d of measurements was performed exclusively there, providing basis for assessing instrument performance under real ambient conditions.
The AE51 on the drone overestimated the median reference eBC mass concentration by approximately 276 % at 4 m and by 99 % at 230 m during summer, with absolute differences of 0.32 and 0.15 µg m−3, respectively. The smaller overestimation at the 230 m can be due to similar measurement conditions as both AE33 at 230 m and the AE51 on the drone were operating without any dryer (except Nafion without dry air in front of the AE33, which may have partially influenced the moisture content of the sampled air). The higher difference at 4 m during the summer is likely due to high RH affecting the eBC measurements; while a Nafion dryer was installed in front of the AE33 on the ground, the AE51 on the drone without a dryer was strongly influenced. This was further confirmed when the RH dropped below 40 % on 3 August 2023, and eBC mass concentrations from AE51 on the drone were comparable with the reference devices at both 4 and 230 m, as indicated by Kruskal–Wallis (KW) test showing no significant difference (p > 0.05) (Fig. S9).
During the winter campaign, median drone-based measurements using AE51 overestimated eBC mass concentrations by 285 % (0.7 µg m−3) at 4 m and by 150 % (0.4 µg m−3) at 230 m compared to the reference AE33 observations (Fig. 3). This can be attributed again to the influence of humidity – at 4 m, the AE33 was operated with a dryer, and the temperature gradient between inside the measurement container and the external environment at 230 m likely contributed to some drying effects as the sample travelled from the colder outdoor to the warmer indoor environment.
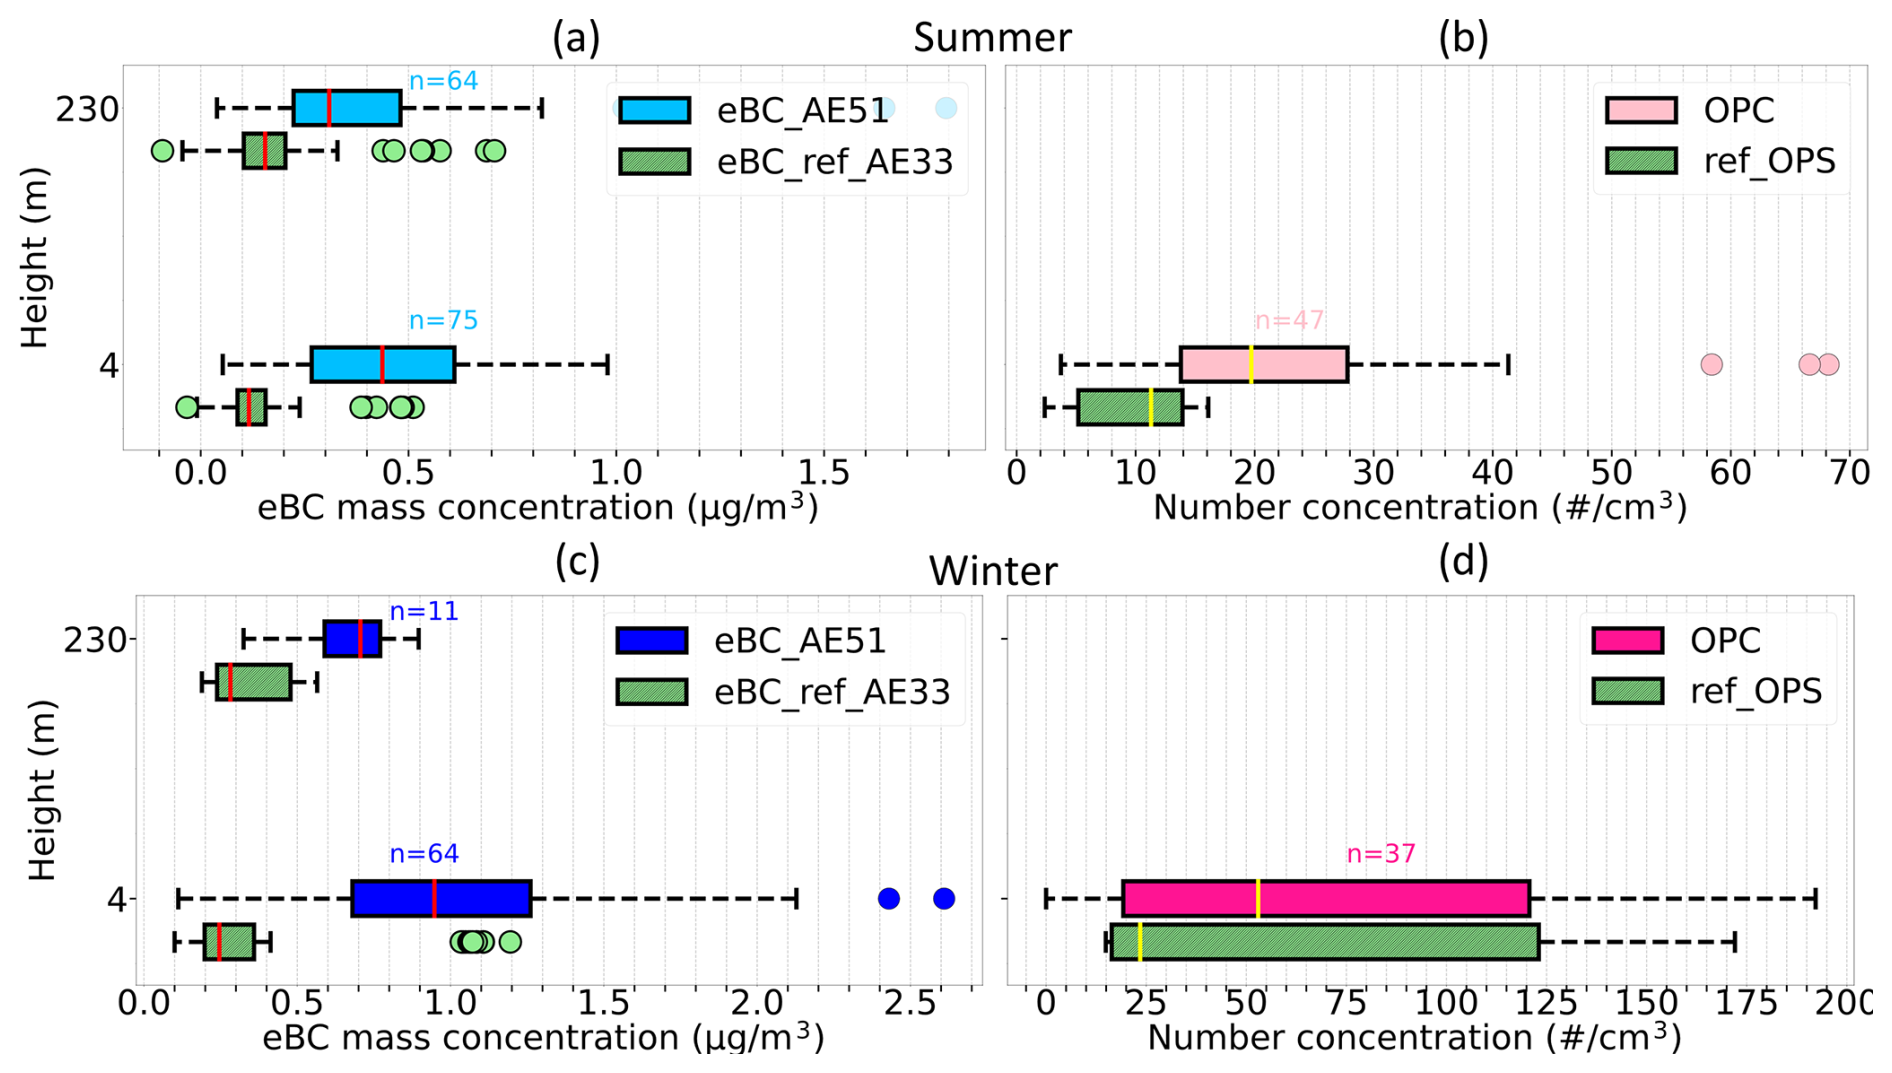
Figure 3Boxplots of (a) eBC mass concentration and (b) PNC from drone vs. reference devices in the 0.35–10 µm size range from the tower at 4 and 230 m during the summer 2023 campaign at NAOK; (c, d) the same for winter 2024. Boxes show median and IQR; whiskers extend to 1.5 × IQR; points beyond are outliers. n = number of points (1 min means) per altitude.
The PNC from OPC on the drone also showed overestimation compared to the OPS reference observations by 75 % (8 # cm−3) and 129 % (30 # cm−3) during summer and winter, respectively. The comparison was made using the same size bins, with the interpolation applied to align the bins between the two instruments. Both the OPC and OPS measurements were conducted without a dryer for both seasons, thus measuring aerosol PNC at ambient RH. The observed difference can be attributed to different sampling orientations: OPC inlet sampled horizontally against the wind, while OPS had a vertical inlet, causing different influence on sampling in both instruments. For OPS, the sampling showed overestimation within 10 % for PM2.5 up to wind speed of 6 m s−1. In contrast, for OPC, overestimation jumped to 60 % and 125 % for PM2.5 at wind speeds of 4 and 6 m s−1, respectively. As a result, OPC tends to report higher particle concentration than the OPS, which contributes to the discrepancies observed in the PNC values. Furthermore, the absence of drying likely enhanced apparent particle sizes during high-RH periods; however, internal OPC-N3 RH records indicate that all measurements were performed at RH < 80 %. The slightly elevated internal temperature of the OPC reduces in-flow humidity, thereby suppressing hygroscopic particle growth. Consequently, humidity-related artefacts were limited and do not affect the interpretation of relative vertical and seasonal variability.
To address the effect of RH on eBC concentrations from drone measurements, a homemade silica gel dryer was installed on the drone. A test to evaluate the dryer's performance was conducted on 13 August 2024, a typical summer day with a temperature of 28 °C, RH varying from 50 % to 90 %, and a wind speed of 2–3 m s−1. Additionally, the aethalometer on the top of the tower at NAOK was equipped with a nafion dryer to ensure consistent comparison between the two AE33 at different levels and between AE33 and AE51 under varying RH levels throughout the day. The eBC measurements were done with and without the dryer at the drone and compared to the AE33 eBC concentrations at the tower (both with Nafion dryers).
During this particular summer day, the AE51 on the drone without the dryer overestimated eBC mass concentrations by 29 % (0.09 µg m−3) at 4 m and by 53 % (0.22 µg m−3) at 230 m compared to the reference AE33 (Fig. 4a). After installing the silica gel dryer on the drone, the eBC measurements were closely aligned with the reference observations, with the difference reduced to under 10 % (0.01 µg m−3 at 4 m and 0.02 µg m−3 at 230 m) at both heights (Fig. 4b). This highlights the significant role of the dryer in minimizing the humidity impacts and enhancing the accuracy of eBC mass concentration measurements from the micro-aethalometer AE51. These findings further confirm the reliability of the drone platform and its effectiveness in providing eBC measurements that compare well with long-term tower observations. The AE51, like other single-spot aethalometers, can respond to light-scattering aerosols. This effect was minimized by using a dryer and verified by the close agreement with AE33 data, so any positive bias from non-absorbing particles was considered negligible.
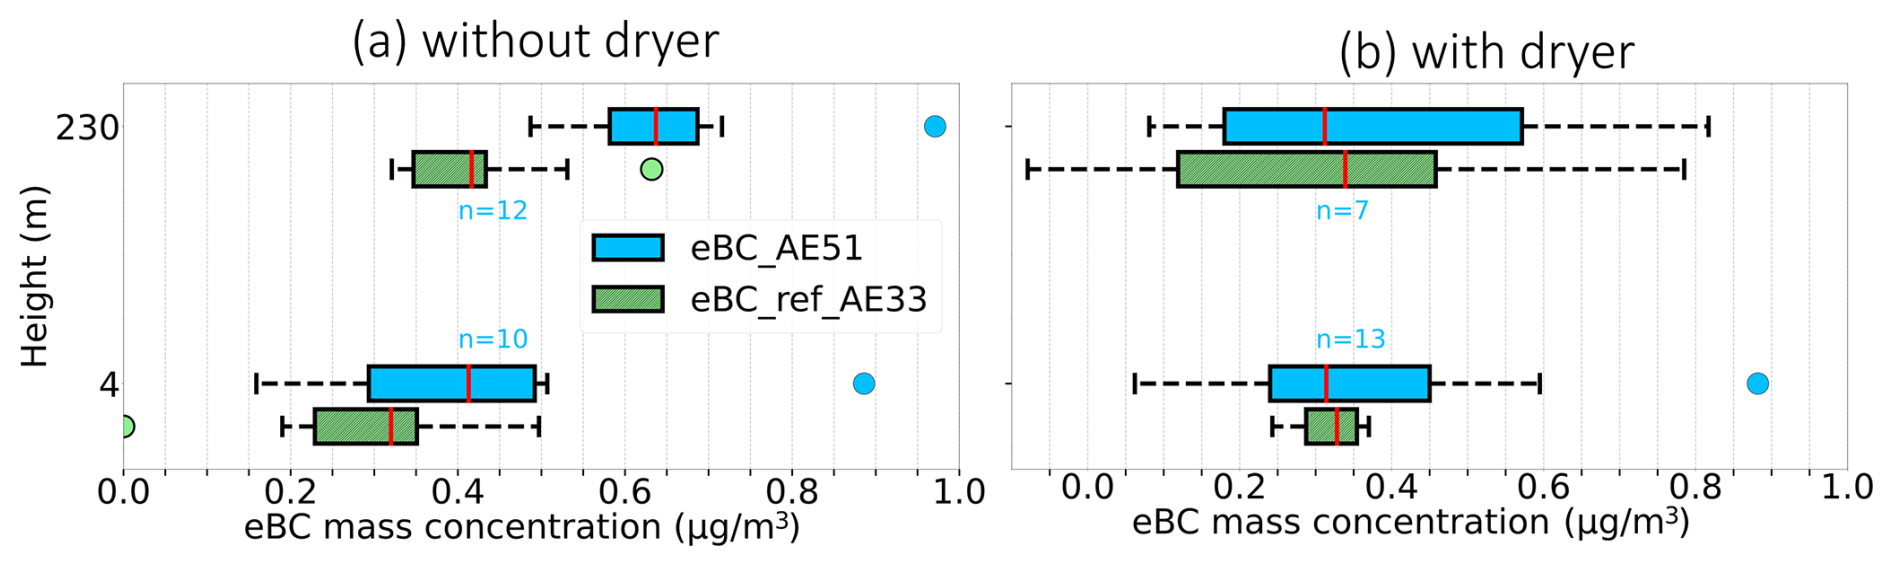
Figure 4Boxplots of eBC mass concentration from drone and reference devices on the tower at NAOK during a summer day (13 August 2024) at 4 and 230 m (a) without the dryer and (b) with the dryer. Boxes show median and IQR; whiskers extend to 1.5 × IQR; points beyond are outliers. n = number of points (1 min means) per altitude.
The strong overestimation of eBC by the AE51 under high relative humidity is consistent with hygroscopic growth of scattering aerosols, which increases apparent light attenuation (Cai et al., 2013). Water uptake by soluble particles can amplify both scattering and absorption on the AE51's filter, artificially inflating the reported eBC. This bias is especially problematic in mobile measurements, where the RH fluctuates rapidly. By installing a silica-gel dryer to maintain RH below ∼ 40 %, the humidity-induced artifact was eliminated, and AE51 readings aligned well with reference AE33 measurements.
3.2 Aerosol vertical profile at the rural site
Vertical profiles of eBC mass concentrations without the silica gel dryer and PNC were measured while hovering the drone at different heights (4, 50, 100, 150, and 230 m) during the summer 2023 and winter 2024 at NAOK simultaneously with the reference instruments (Fig. 5). During summer, eBC mass concentration remained relatively uniform up to the height of 50 m, followed by a decrease of 32 % (0.13 µg m−3) between 50 and 100 m. Conversely, PNC dropped by 30 % (6 # cm−3) between 4 and 50 m. In winter, eBC mass concentration stayed constant up to 100 m and decreased by 18 % (0.16 µg m−3) between 100 and 150 m. PNCs were constant from the ground to 50 m but decreased by 39 % (24 # cm−3) between 50 and 100 m. The significance of the increase or decrease in eBC mass concentration and PNC was tested by the Kruskal–Wallis (KW) test (p < 0.05). When plotted using native (non-interpolated) bins, the OPC-N3 and OPS show closer agreement (see Fig. 5).
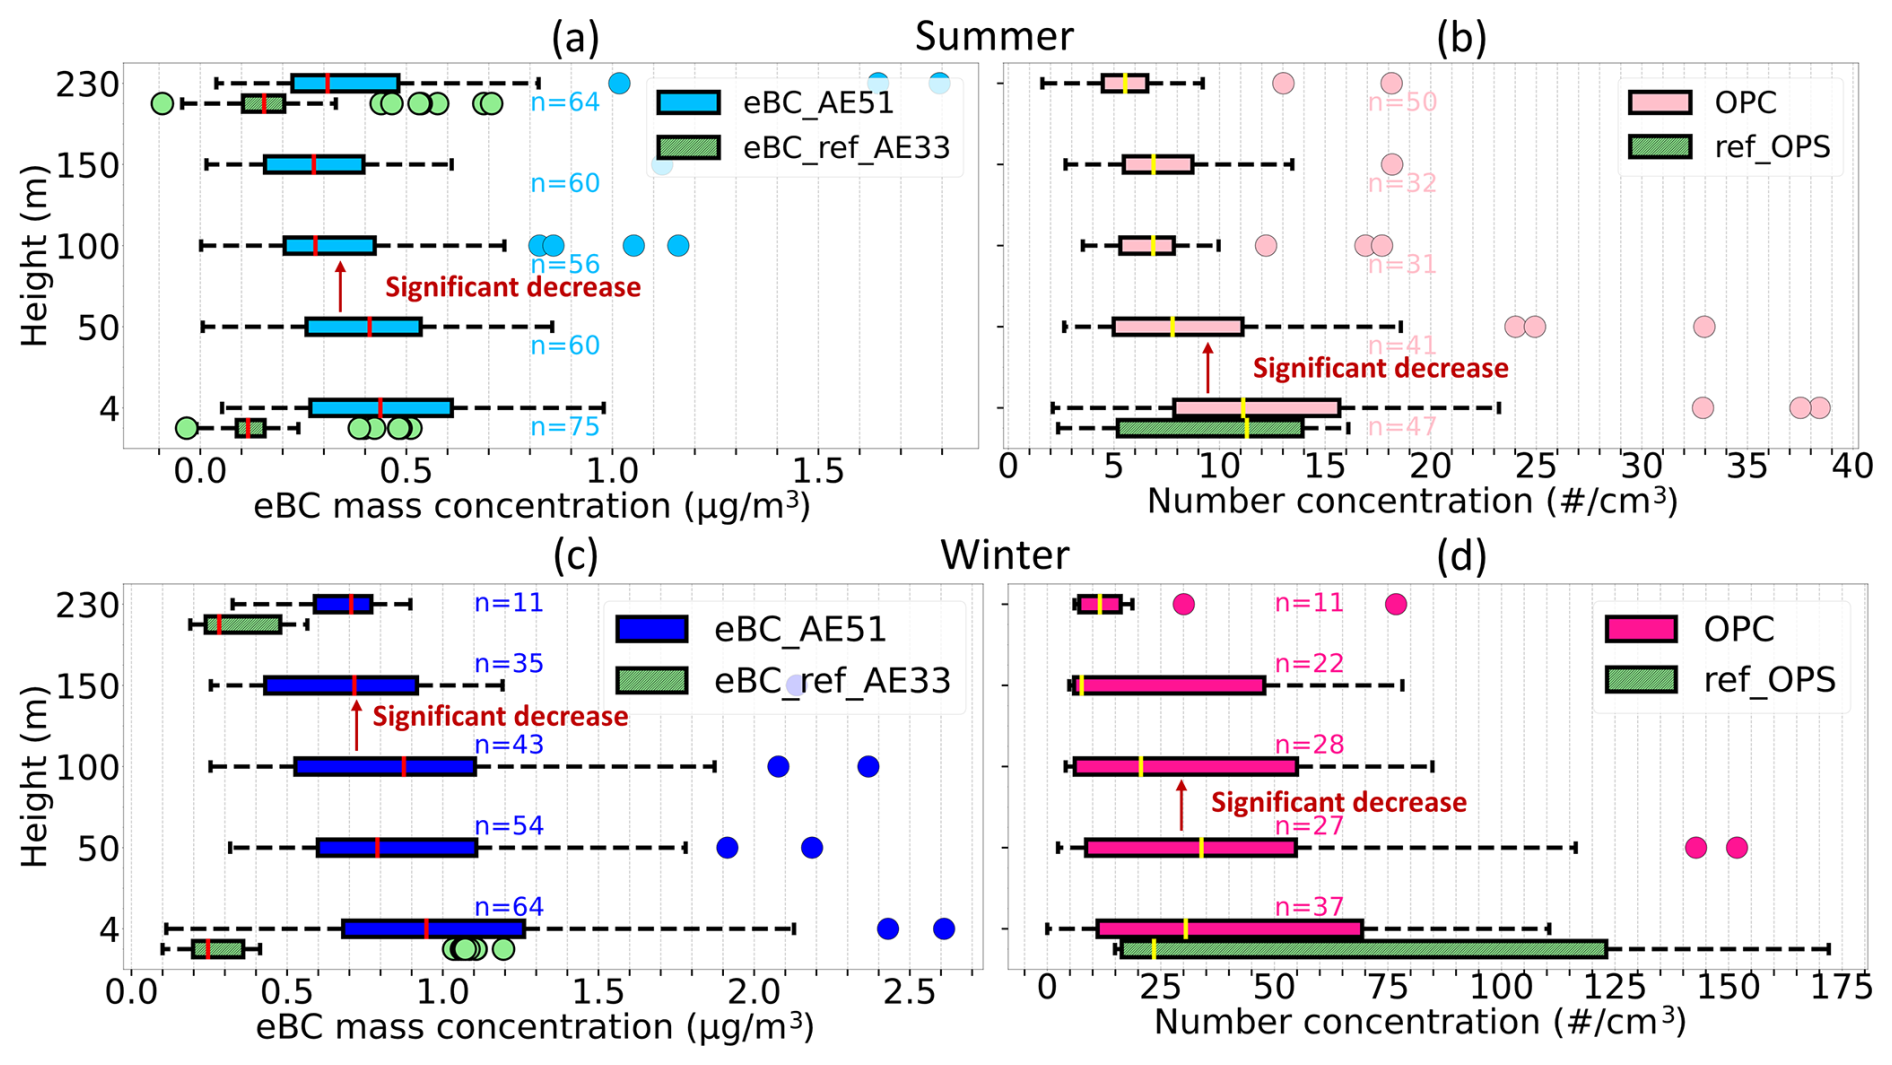
Figure 5Boxplots of (a) eBC mass concentration and (b) PNC from the drone (full size range used) while hovering at different altitudes during summer 2023 at NAOK; (c) eBC mass concentration and (d) PNC from the drone while hovering at different altitudes during winter 2024 at NAOK. Boxes show median and IQR; whiskers extend to 1.5 × IQR; points beyond are outliers. n = number of points (1 min means) per altitude.
The general decrease of both eBC and PNC with height indicates that surface sources dominate aerosol loading at this rural site and that vertical mixing was insufficient to fully homogenize the boundary layer. Similar vertical gradients have been observed in background and rural settings, where limited turbulence allows combustion-derived fine particles to accumulate near the ground, resulting in declining concentrations aloft (Harm-Altstädter et al., 2024; Samad et al., 2020).
Simultaneously, the vertical gradient of temperature and RH were examined during the winter campaign to explain the vertical changes in eBC and PNC. The eBC, PNC, temperature, and RH comparison revealed no significant temperature variation from the ground to 50 m for both eBC mass and PNC (Fig. 6). The nearly uniform (isothermal) temperature profile (ΔT ≈ 0.05 °C between 4 and 50 m) indicates very weak vertical temperature gradients and limited turbulent exchange, which can promote accumulation of eBC and PNC near the surface. Such near-isothermal conditions correspond to a shallow, stable mixed boundary layer, typical of winter mornings in mid-latitude regions, when solar heating is too weak to drive convective turbulence and mix the surface air upward (Steeneveld, 2014). Previous studies reported similar near-surface accumulation of pollutants under weak or isothermal temperature (Marucci and Carpentieri, 2019; Wang et al., 2018b).
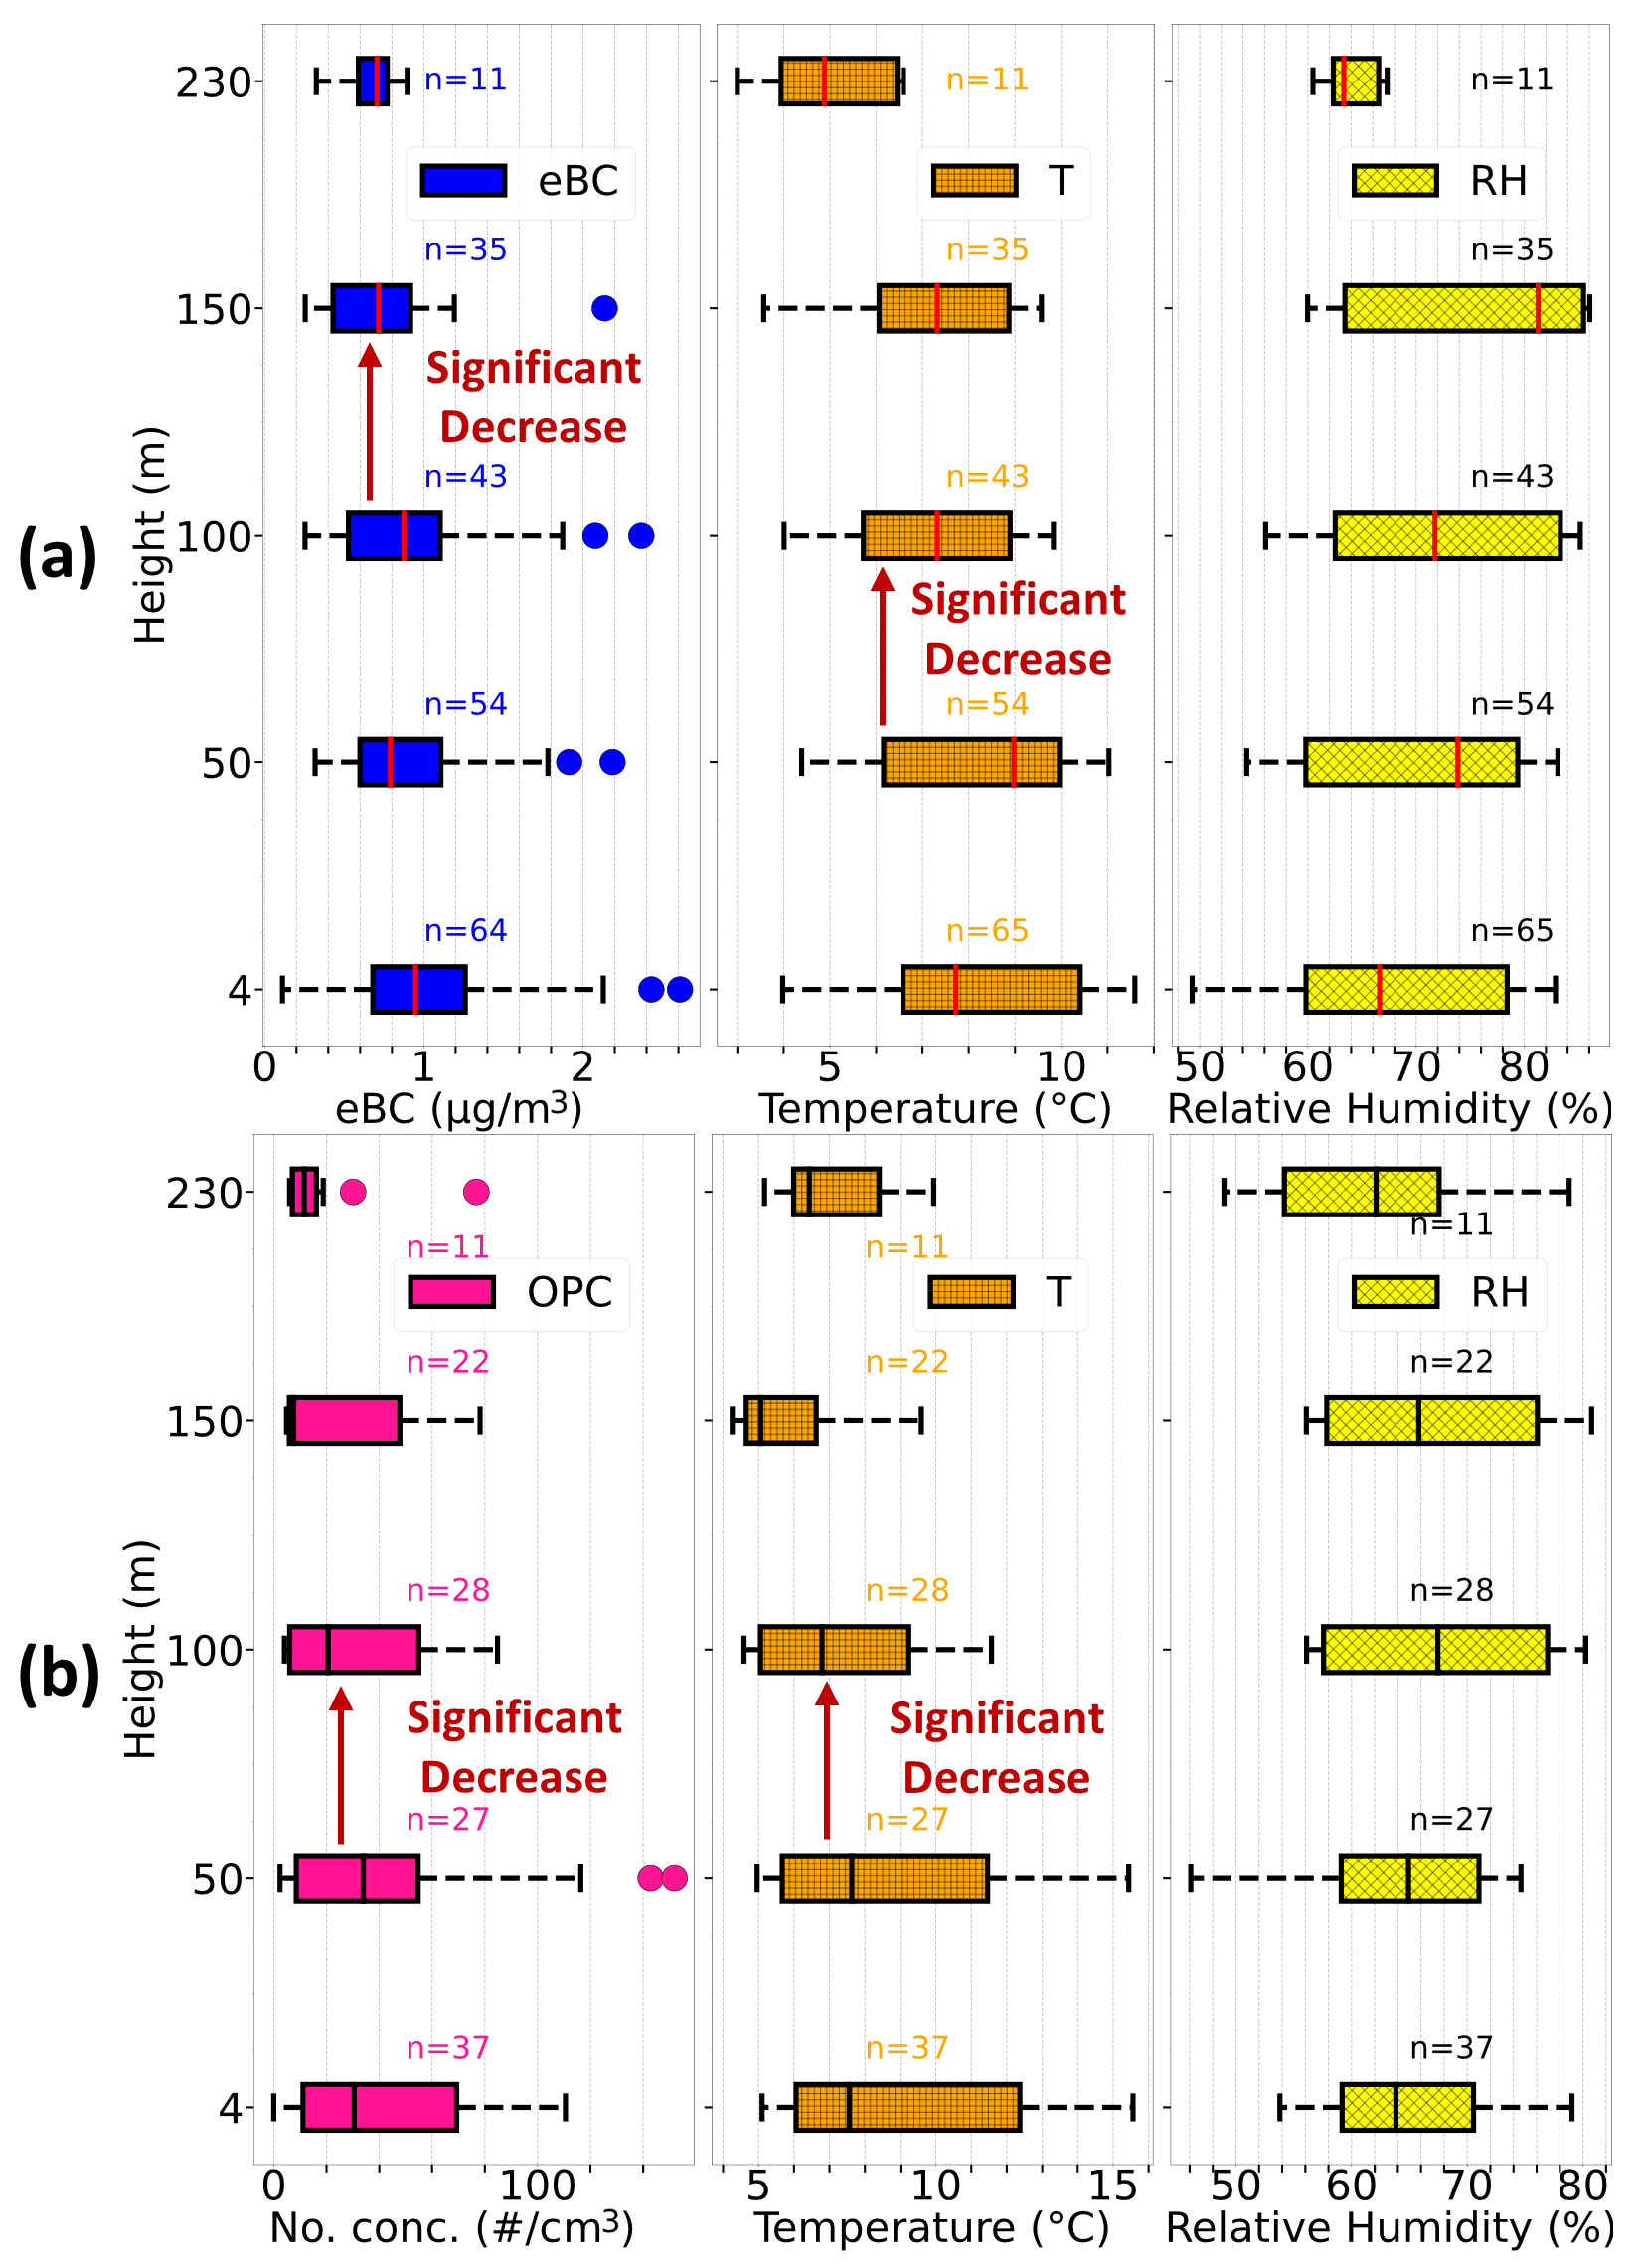
Figure 6Boxplots of (a) vertical distribution of eBC mass concentration from AE51 without dryer, temperature, and RH, and (b) vertical distribution of PNC from OPC, temperature, and RH on the drone at rural site NAOK during winter 2024 . Boxes show median and IQR; whiskers extend to 1.5 × IQR; points beyond are outliers. n = number of points (1 min means) per altitude.
The temperature started to decrease with height above 50 m, and the PNCs decreased, while eBC mass concentrations remained constant up to 100 m despite the temperature changes. This vertical pattern is similar to the summer measurements, where eBC mass was uniform up to 50 m, and PNC decreased from the ground. This difference between eBC and PNC with altitude likely reflects particle size and lifetime differences: eBC, mostly sub-micron, has lower deposition velocities and longer residence times, while larger or semi-volatile particles dominating PNC are more prone to settling and condensation losses. Deposition velocity increases markedly with particle size (Donateo et al., 2023), making dry deposition a key driver of size-dependent vertical gradients. This indicates that differences in particle size may have brought the observed changes in PNC compared to the unaffected eBC mass concentrations. The consistency across seasons suggests that eBC is well mixed within the lower mixed layer, while PNC is governed more by local production and removal processes such as coagulation and hygroscopic growth.
Further, the decrease in eBC mass concentration with height was more pronounced in summer (32 %) compared to winter (18 %) at NAOK. On the contrary, PNC decreased with height more during winter (39 %) than in summer (30 %). These contrasting patterns reflect the role of meteorology and emissions: in summer, deeper boundary layers and convective mixing disperse eBC more aloft, whereas in winter, shallow mixing retains it near the surface. The steep winter decline of PNC likely arises because heating emissions emit coarser or semi-volatile particles that are efficiently lost with height, but in summer, new particle formation produces many fine particles that distribute more uniformly (Gao et al., 2012; Kulmala et al., 2004). While vertical mixing influences the vertical distribution of particles, the behavior of eBC vertical distributions reflects the combination of particle size and atmospheric stability rather than primarily depending on vertical mixing alone (Wang et al., 2018b). Our results suggest that at least two aerosol populations of different sizes and sources were measured during the year, thus with different vertical behaviors. This was confirmed by comparison to reference AE33 data from the tower; in winter, biomass/wood burning contributed 48 % and 44 % of eBC measured at 4 and 230 m, respectively, leading to a higher absorption Ångström exponent (AAE) of 1.6 and 1.5, respectively, while in summer, fossil fuel combustion (AAE of 1.19 and 1.24, respectively) was the main source of eBC at NAOK, and biomass burning contributing to 18 % and 22 % of eBC, respectively.
3.3 Aerosol vertical profiles at the urban site
At the urban site, eBC mass concentration and PNC measurements were conducted up to 100 m during summer in 2 different years – 2023 and 2024. The eBC mass concentrations were measured without the dryer from 14 August to 20 August 2023, and with the dryer from 18 to 23 July 2024. During both summers, eBC mass concentration and PNC were uniform up to the height of 100 m (Fig. 7). This consistency can be attributed to several factors. The high number of traffic emission sources at the site contributes to high and relatively stable eBC concentrations in the lower atmosphere, similar to the results of Liu et al. (2023). Also, enhanced thermal convection and the urban heat island effect facilitate effective vertical mixing (Battaglia et al., 2017). Furthermore, wind shear above 2.0 m s−1 per 100 m between all the heights (4–50 and 50–100 m) during both years supports the vertical transport of pollutants. The combination of convective and mechanical turbulence facilitates the rapid vertical redistribution of aerosols, resulting in a uniform eBC and PNC profile despite strong surface emissions. The presence of local sources in the city is further supported by Czech Hydrometeorological Institute (CHMI) ground-based PM10 observations from nearby Karlín (traffic site) and Kobylisy (urban background) stations, which show higher concentrations and distinct diurnal peaks consistent with local traffic and resuspension activity (Fig. S10).
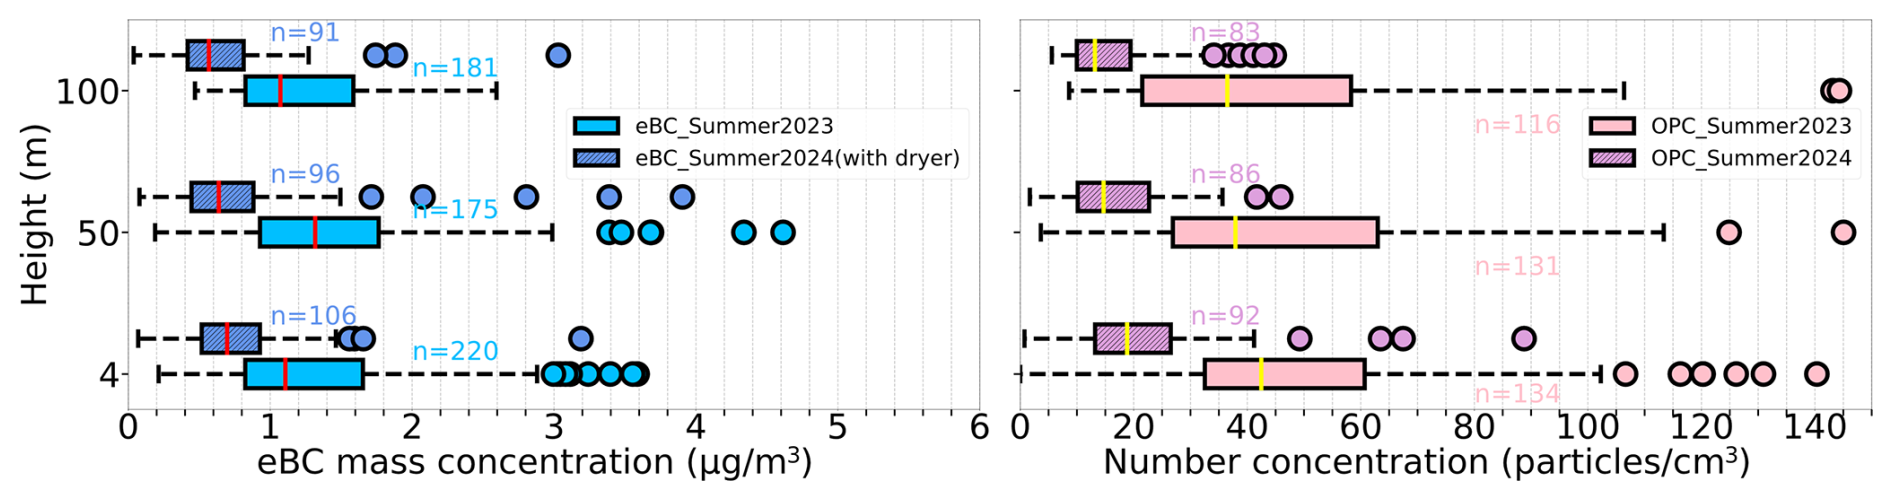
Figure 7Boxplots of (left) eBC concentration from AE51 without a dryer (summer 2023) vs. with a dryer (summer 2024) and (right) PNC from OPC at the urban site Prague during summer 2023 and 2024. Boxes show median and IQR; whiskers extend to 1.5 × IQR; points beyond are outliers. n = number of points (1 min means) per altitude.
The deeper and thermally driven convective boundary layer during summer further increased turbulence, and vertical mixing helped to distribute the particles more evenly within the lower atmospheric layers, thereby homogenizing the particle concentrations. The agreement between summer campaigns with and without the dryer also confirms that under low-to-moderate RH conditions (< 50 %), humidity effects on eBC were minimal in the well-mixed daytime atmosphere. The lower eBC and PNC concentrations observed in summer 2024 compared with summer 2023 can be attributed to meteorology, measurement configuration, and emission changes. Firstly, during 2024, the wind speed (Fig. S11) and boundary layer height (Fig. S12) were higher, thereby enhancing ventilation and dilution of surface emissions. Secondly, a dryer was used with AE51 during the summer of 2024, thereby reducing the humidity-related overestimation that had affected the summer 2023 measurements. And finally, higher pollutant concentrations were measured in 2023 compared to 2024 in Prague, both by ground-level and 50 m PM data directly at the Prague site (Fig. S13), and also at a nearby (2.3 km of the measurement site) CHMI national air quality network station Prague–Karlín station (Fig. S14). This independent observation supports the UAV findings and confirms that the interannual difference primarily reflects meteorological variability and reduced local emissions in 2024.
During the winter campaign at Prague from 12 to 18 December 2023, a significant reduction in both eBC mass concentration and PNC with increasing altitude was observed (Fig. 8), contrasting with the summer pattern. Specifically, eBC mass concentration decreased with height up to 100 m, while PNC dropped to 50 m from the ground and remained constant between 50 and 100 m. This behavior is primarily influenced by the combination of strong emission sources in urban environments (Fig. S10), as described previously, and the weak vertical temperature gradient (ΔT ≈ 0.06 °C between 4 and 50 m), which does not support vertical mixing. During winter, reduced solar heating and long nocturnal cooling produce a shallow, near-isothermal boundary layer which suppresses turbulence and confines pollutants near the surface (Marucci and Carpentieri, 2019; Wang et al., 2018a). The resulting weak turbulent diffusion, rather than a distinct temperature inversion, explains the accumulation of eBC and PNC within the lowest tens of meters. The relatively smaller wind shear (1.1 m s−1 per 100 m between 50 and 100 m) further suppresses vertical mixing, trapping pollutants near the surface (Fig. S11). As a result, pollution remains confined closer to the emission sources, leading to higher concentrations near the ground and a more pronounced decrease with height (Kotthaus et al., 2023). Additionally, the urban heat island effect intensifies during stable conditions, causing temperature contrast between urban and rural areas, further reducing the vertical dispersion of pollutants (Haeffelin et al., 2024).
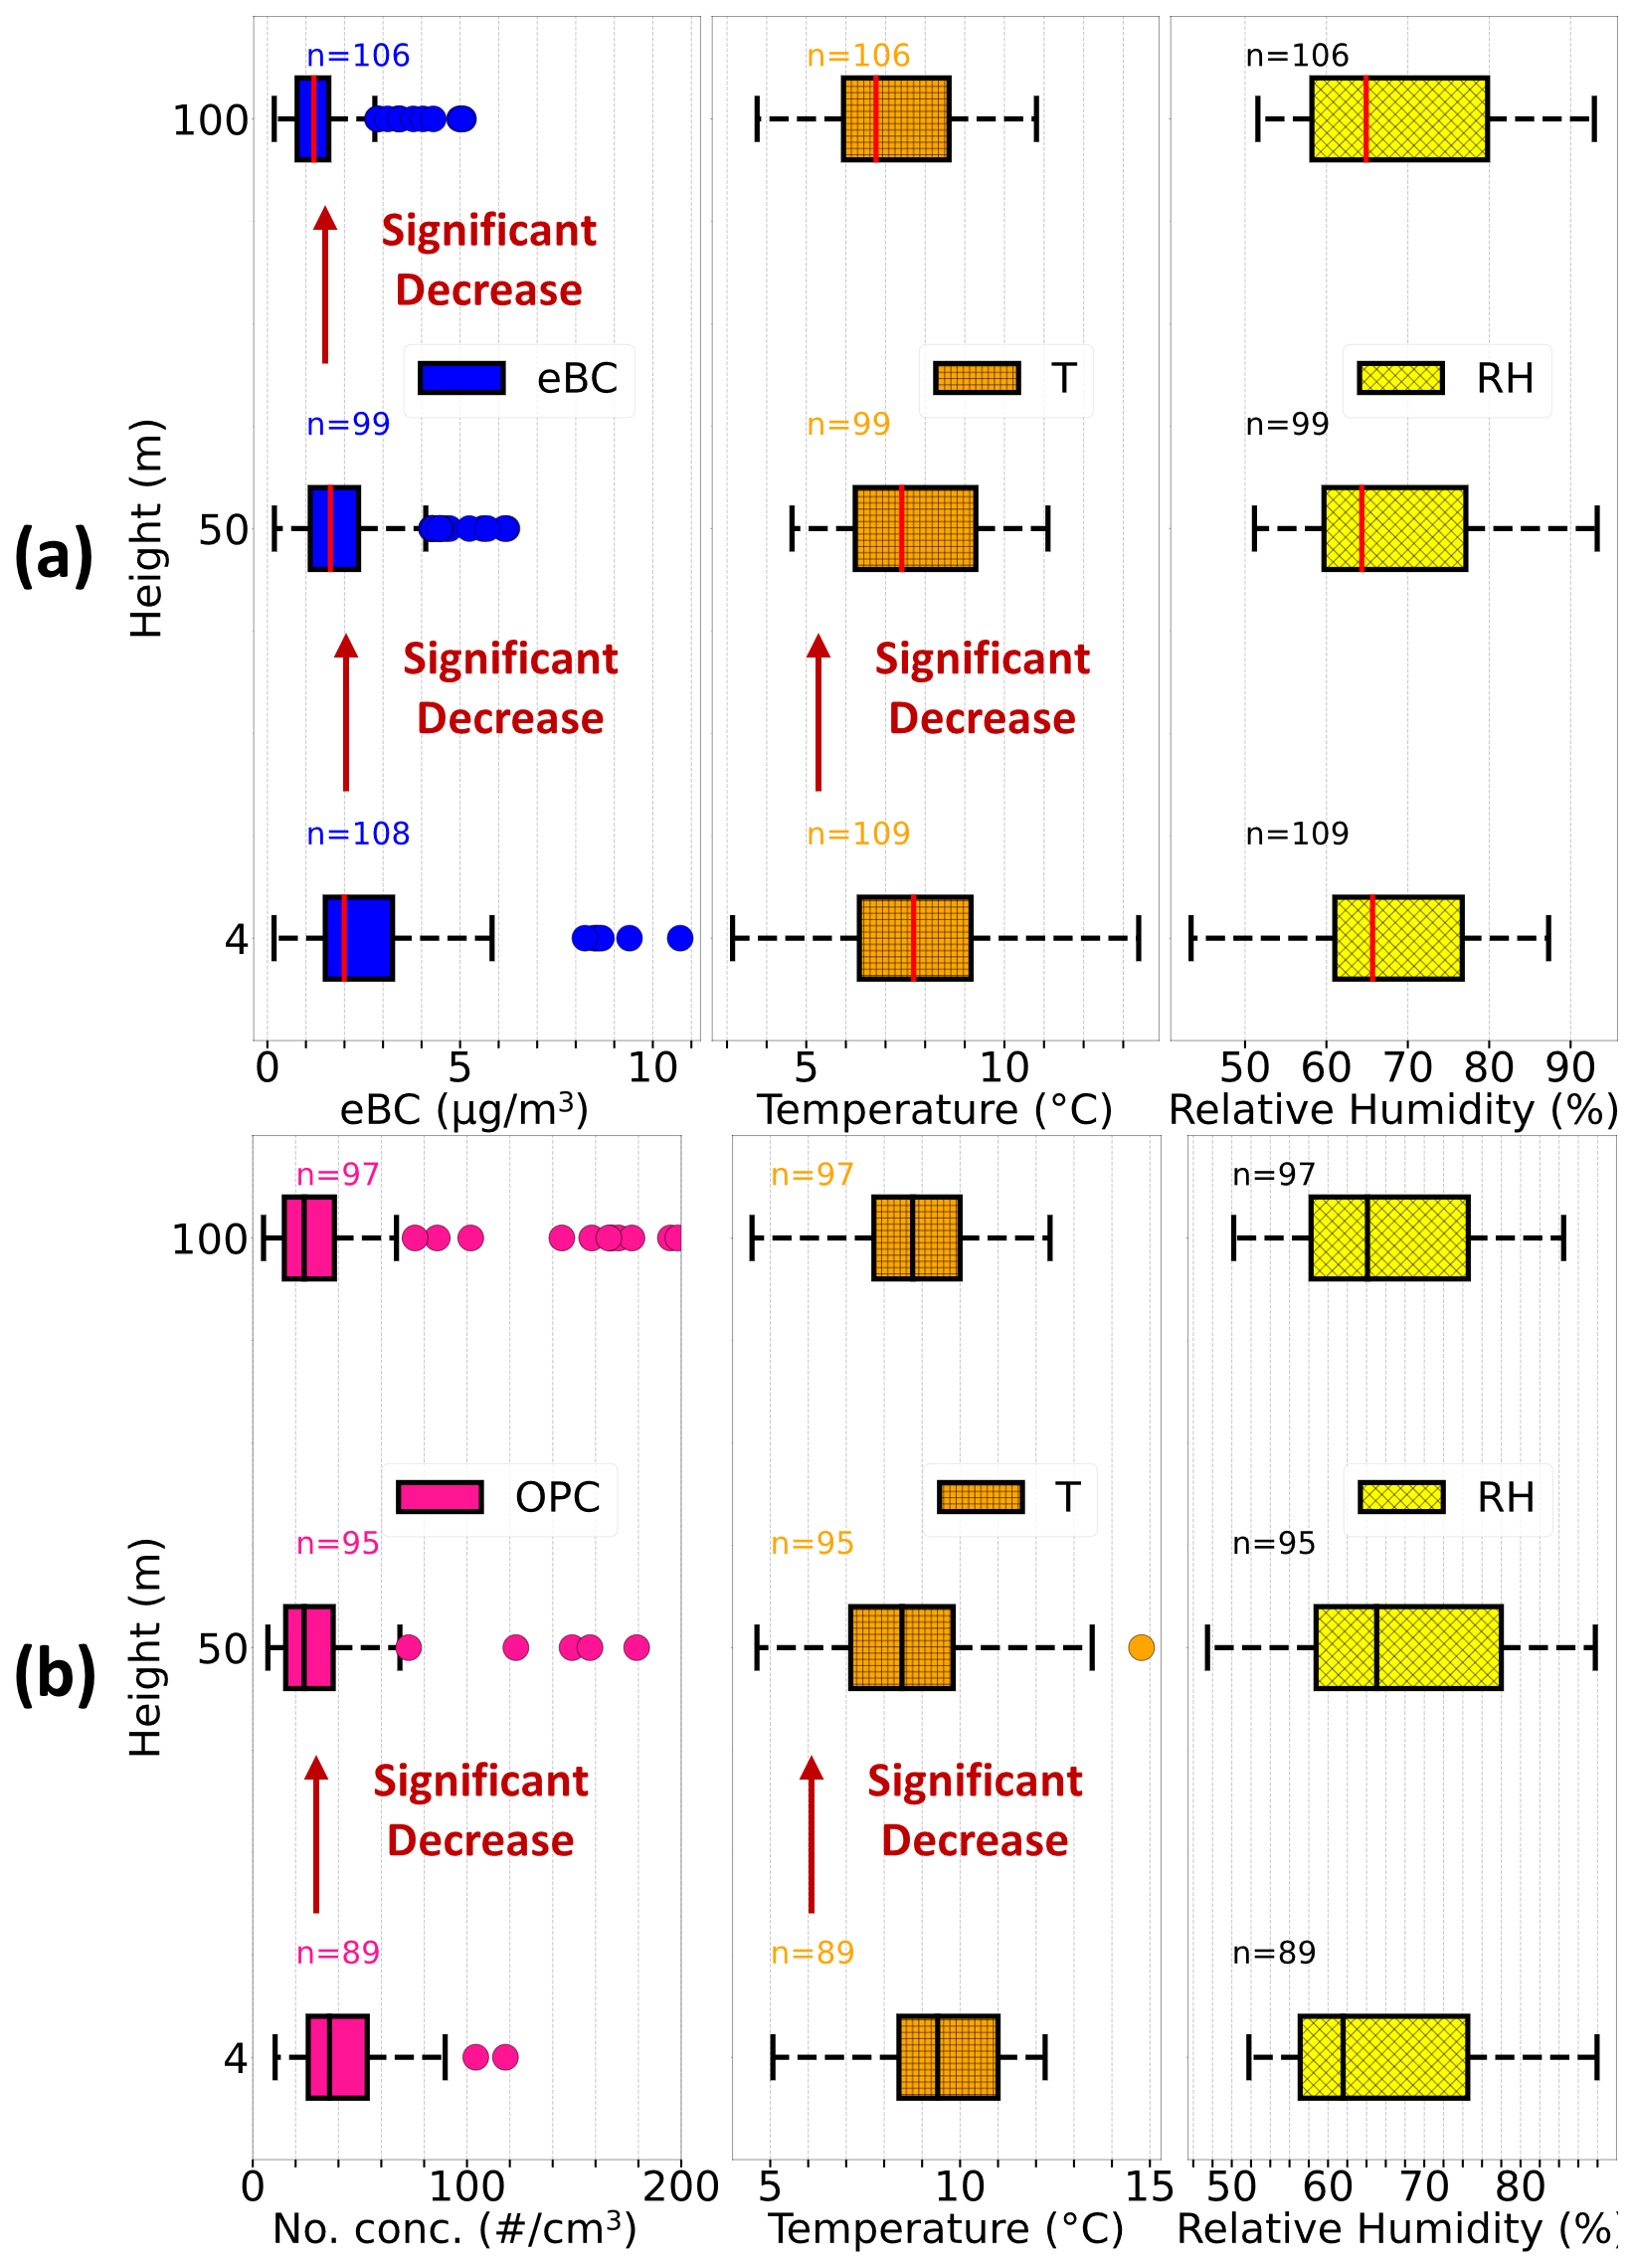
Figure 8Boxplots of (a) eBC mass concentration from AE51 without dryer vs. Temperature vs. RH, and (b) PNC from OPC vs. Temperature vs. RH on the drone at Prague from 12 to 18 December 2023. Boxes show median and IQR; whiskers extend to 1.5 × IQR; points beyond are outliers. n = number of points (1 min means) per altitude.
Several outliers (extremely high levels) were detected in the eBC mass and PNC. During summer, the outliers can be linked to increased turbulences and daytime convective activities tend to flatten vertical gradients within the mixed layer, yet they can increase temporal variability at a fixed location by intermittently transporting near-surface plumes (e.g., traffic, cooking, construction) to the sampling height. Therefore, these outliers are episodic plume encounters rather than persistent stratification. Fewer outliers were observed at NAOK for eBC and PNC during winter, but more pronounced outliers were present in winter measurements at Prague. This high concentration was due to an elevated winter pollution event between 13 and 14 December 2023. This event was marked by a sharp rise in PM levels, as confirmed by low visibility signals from the drone at 100 m and ongoing PM measurements at the site (Fig. S16). The vertical variation and other characteristics of this pollution episode were thus further studied to get a better understanding of the influence of such an event on air quality.
3.4 Vertical variation during an elevated winter pollution event in Prague
An increase in eBC mass concentration and PNC characterized Prague's winter pollution event in December 2023. The event started on 13 December at 13:00 UTC and lasted until the morning of 14 December 2023. This concentration increase was primarily attributed to a low and stable boundary layer reaching 105 m a.g.l. (Fig. S16). The vertical variation of eBC and PNC, along with the size distribution, was assessed to evaluate the changes 1 d before (i.e. 12 December) and comprised 5 vertical profiles of eBC and 4 profiles of PNC. During the event, 3 profiles for both eBC and PNC were measured, all showing a substantial increase in concentrations at all heights (4, 50, and 100 m) compared to the period before the pollution episode (Fig. S17).
The highest increase in eBC concentrations during the event was observed at 100 m, with a 192 % (2.5 µg m−3) increase in median eBC levels compared to that before the event. Though less pronounced, the increase in eBC concentration was also seen at 50 and 4 m, with 130 % (1.5 µg m−3) and 56 % (1.7 µg m−3) increase, respectively. The observed increase in eBC concentration at 100 m, just at the PBL height, suggests that while ground-level emission had some impact, local atmospheric conditions allowed for some degree of vertical transport of eBC from the above layer, likely influenced by long-distance transported particles. This is supported by the back trajectory analyses, showing a change in trajectories from southwest to west at the beginning of the event, associated with transport of continental air masses from higher altitudes (Fig. S18). The drone measurements not only support the measurements at the building (Fig. S15), showing higher PM2.5 and PM10 concentrations at 50 m compared to 10 m results, but also provide measurements at 100 m, confirming the largest enhancement in eBC concentration during the event above the building compared to the ground and 50 m. Such vertical layering is consistent with many winter haze cases where polluted residual-layer air overlies a shallow, stagnant boundary layer, yielding dual source contributions – local near-surface emissions plus advected/aged aerosol aloft (Sun et al., 2016).
In contrast, PNC showed the highest increase at 4 and 50 m in comparison to the day before the pollution event, where PNC increased by 840 % (238 particles cm−3) and 860 % (151 # cm−3), respectively, with a less pronounced increase at 100 m (460 %, 137 # cm−3). This suggests that some particles, most likely generated from ground sources, remained concentrated near the surface due to the limited vertical dispersion during the pollution episode. Prior to the event, eBC concentrations exhibited a significant decrease (by 73 %) from the ground up to 100 m, and PNC decreased by 38 % between 4 and 50 m. However, the trend was notably altered during the event, with no significant change in both eBC and PNC with the height, indicating that daytime mixing has weakened, allowing accumulation of pollutants throughout the shallow boundary layer.
The particle number size distributions at various heights reveal additional information (Fig. 9). At 4m, the concentration of particles smaller than 3 µm increased significantly during the event compared to the distribution before the event, highlighting the production and accumulation of small particles near the ground. These particles likely stem from incomplete combustion and secondary formation under stagnant conditions, where condensation of semi-volatile vapors and coagulation processes enhance fine particle numbers (Gani et al., 2019; Zheng et al., 2023). In contrast, at 50 and 100 m, concentrations of all particles were increased during the event, up to sizes of 10 µm. With the height, mainly the concentration of intermodal fraction, i.e., in sizes between 2.5 and 10 µm, increased in concentrations, potentially indicating contribution from longer distance transported aerosol and mixing processes that redistribute particles vertically. Before the event, particles up to 4 µm in diameter were observed near the ground due to winter stable atmospheric conditions (Gani et al., 2019), which restricted vertical mixing and limited dispersion of pollutants. During the event, a substantial increase in larger particles was observed at 100 m (and partly also at 50 m), while almost no change was observed at the ground level concentrations, remaining below 0.1 # cm−3, suggesting contributions from long-range transport disconnected from the ground. A significant increase in PM mass was also observed across all heights (4, 50, and 100 m) (Fig. S19). PM1 and PM2.5 dominated the mass concentrations across all heights during the event, while PM10 saw the largest increase at 100 m, again suggesting contributions from coarse particles and vertical mixing.
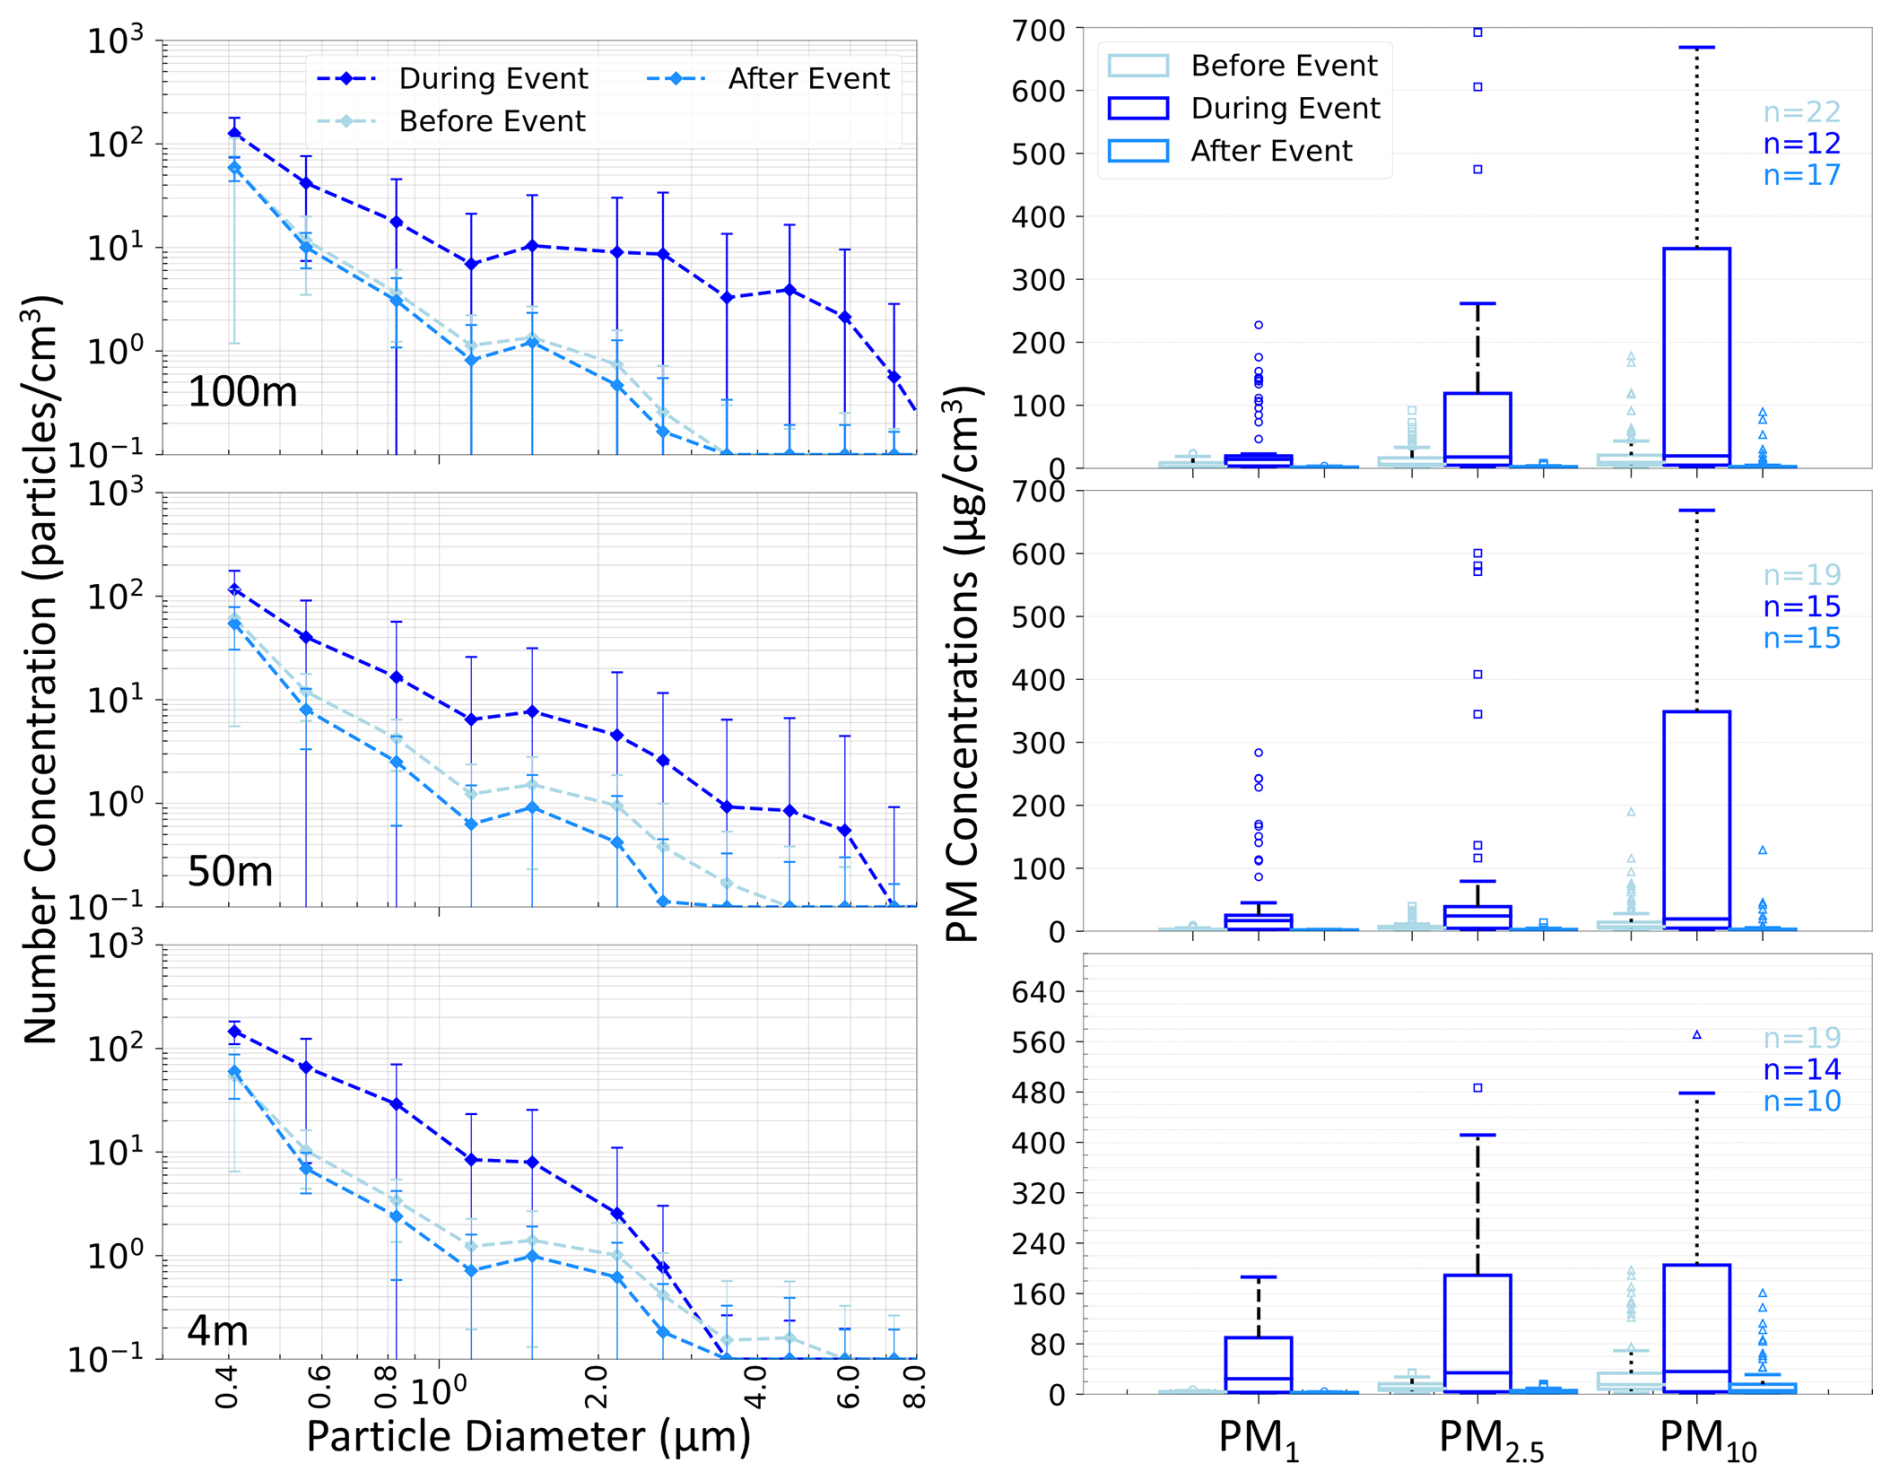
Figure 9Mean particle number concentration dependence on particle size from OPC on the drone at different heights before, during, and after an elevated winter 2023 pollution event in Prague. n = number of points (1 min means) per altitude.
3.5 Seasonal contrast
The vertical profiles of eBC mass concentration and PNCs during the summer and winter campaigns were compared, revealing significant differences in the seasonal vertical patterns between the two stations.
At NAOK in winter, a 100 % (0.45 µg m−3) higher eBC mass concentration up to 50 m was found compared to summer (Fig. 10a). This difference can be attributed to more stable atmospheric conditions (isothermic to temperature inversion) hindering vertical mixing and to an increased number of sources during winter. At 100 m, the difference between winter and summer eBC mass concentration surged to 200 % (0.5 µg m−3), as in summer, a decrease in eBC concentrations was observed above 50 m, while it was observed from 100 m in winter. The upward shift of the gradient during winter indicates a shallower mixed layer that traps pollutants within the lowest 100 m. Such seasonal layering of black-carbon aerosols has also been observed in at NAOK (Mbengue et al., 2020). In contrast, during the winter campaign at Prague, eBC mass concertation was 80 % (0.88 µg m−3) higher at the ground level compared to summer, but the difference decreased to 24 % (0.32 µg m−3) at 50 m (Fig. 10b). No significant difference in eBC mass concentrations in summer and winter was found at 100 m, indicating effective dispersion at this altitude at Prague, likely influenced by local factors such as the surrounding plateau, which alters airflow patterns and enhances the mixing of pollutants above the top of the valley. This suggests that while surface emissions dominate near ground level, mechanical turbulence generated by buildings and local topography enhances mixing aloft, mitigating vertical gradients
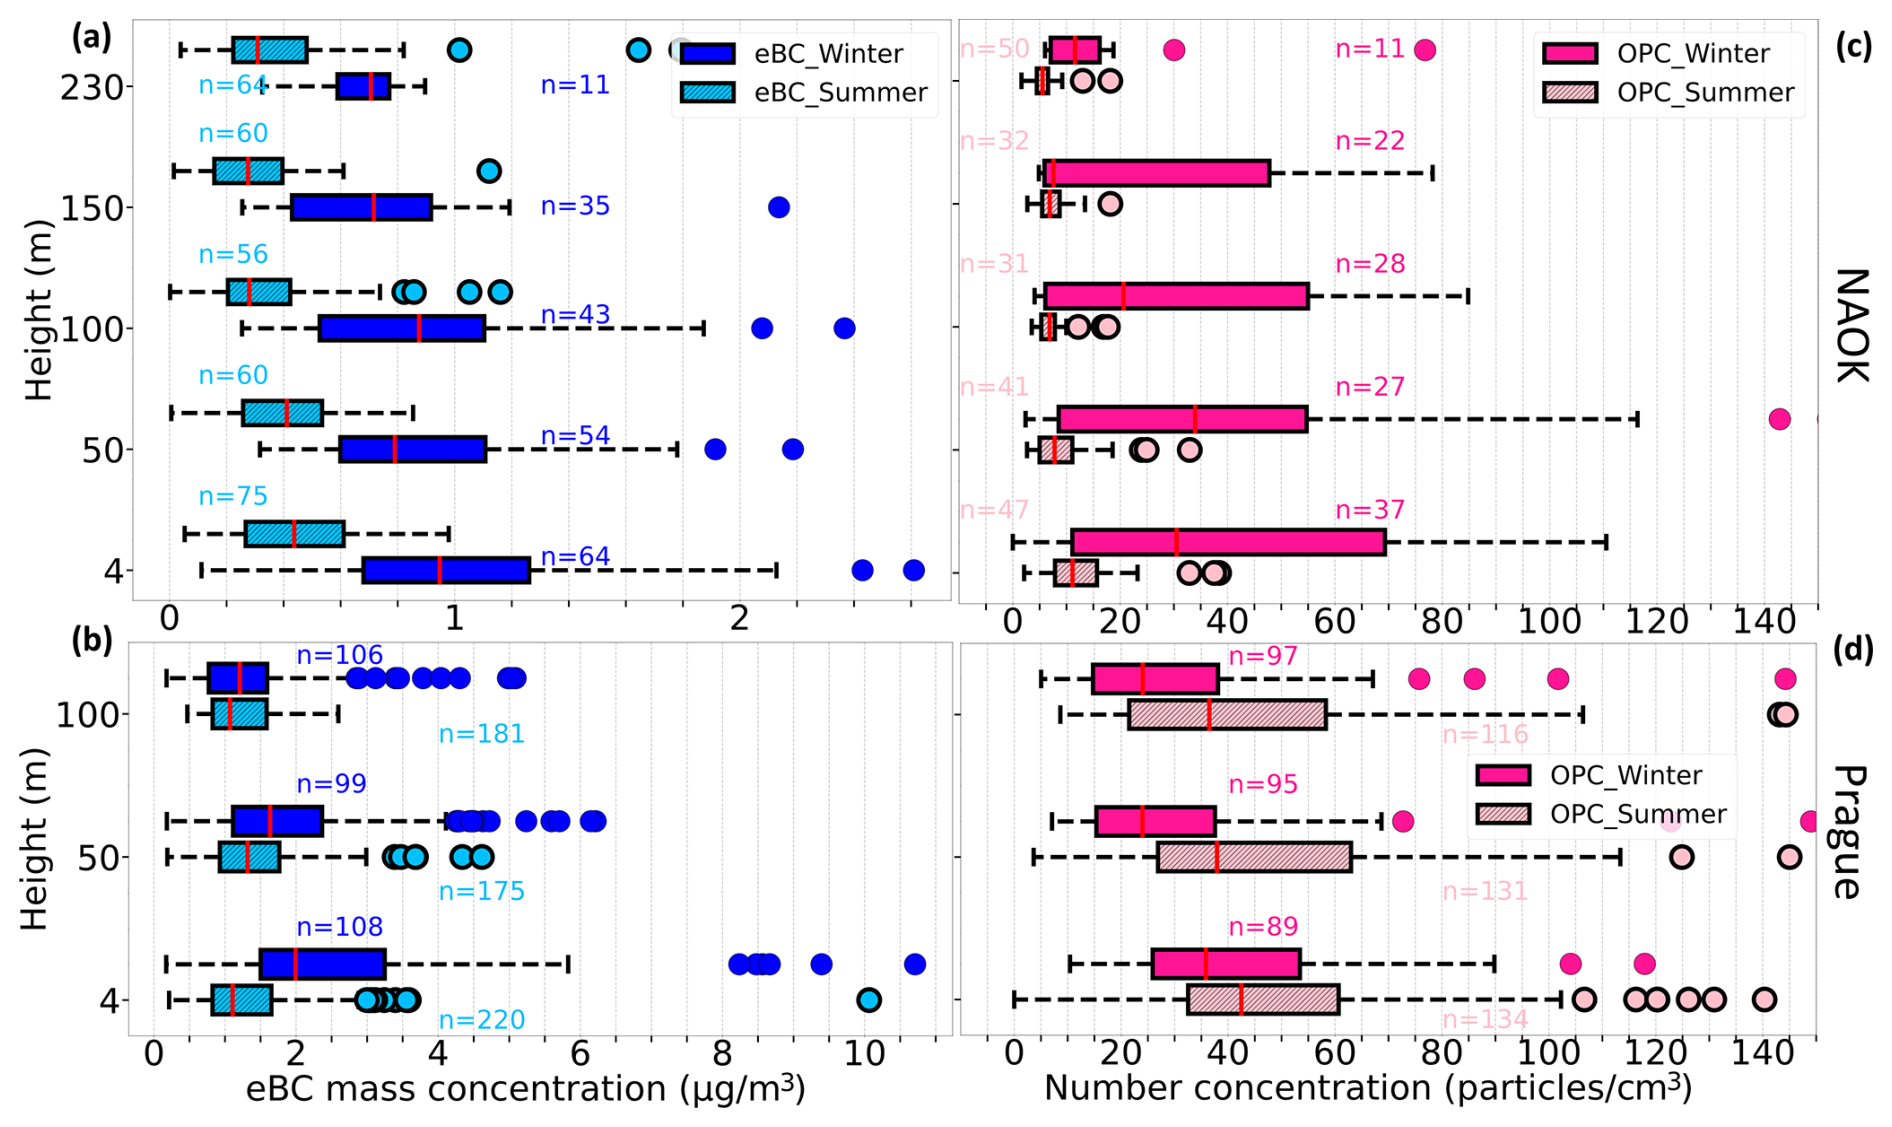
Figure 10Boxplots of eBC mass concentration from AE51 and PNC from OPC on the drone during summer 2023 and winter 2024 at (a, c) NAOK and summer 2023 and winter 2023 at (b, d) Prague. Boxes show median and IQR; whiskers extend to 1.5 × IQR; points beyond are outliers. n = number of points (1 min means) per altitude.
For PNC at NAOK, a 200 % (19 # cm−3) increase was observed at ground level during winter compared to summer, which extended to 336 % (26 # cm−3) at 50 m and 200 % (148 # cm−3) at 100 m (Fig. 10c). However, at 150 m, the winter-summer difference was indistinguishable (differed only by 1 # cm−3) during the campaign, suggesting that particles disperse horizontally more rapidly than vertically at this altitude, likely due to atmospheric stability restricting vertical movements during winter. This is further supported by wind shear values between 100 and 150 m, which were 1.6 m s−1 per 100 m during summer, indicating higher turbulence and stronger vertical mixing. In contrast, winter exhibited lower wind shear (0.5 m s−1 per 100 m), signaling reduced turbulence and weaker vertical mixing (Fig. S11), favoring horizontal dispersion over vertical transport.
In contrast, in Prague, the PNC behaved differently i.e., higher concentration was measured in summer compared to winter. The particle concentrations decreased with the height more during winter compared to summer (Fig. 10d), with only a small difference at the ground level (15 %) (7 # cm−3) and a higher difference at 50 and 100 m (36 %, i.e. 10 # cm−3 and 34 %, i.e. 12 # cm−3 respectively).
To understand these patterns further, particle size distribution was examined for the summer and winter campaigns at NAOK and Prague (Fig. 11). It is important to note that the size distribution analysis excluded the high pollution event for Prague to avoid skewed results. At the NAOK site, both seasons showed a general decline in concentration as particle size increased; with winter concentrations consistently higher across all sizes (up to 3 µm), likely due to limited vertical mixing and increased combustion. As a result, in winter, the PNC over 1 # cm−3 were observed up to 1 µm at all heights, while in summer, the concentrations decreased below 1 # cm−3 for particles larger than 500 nm.
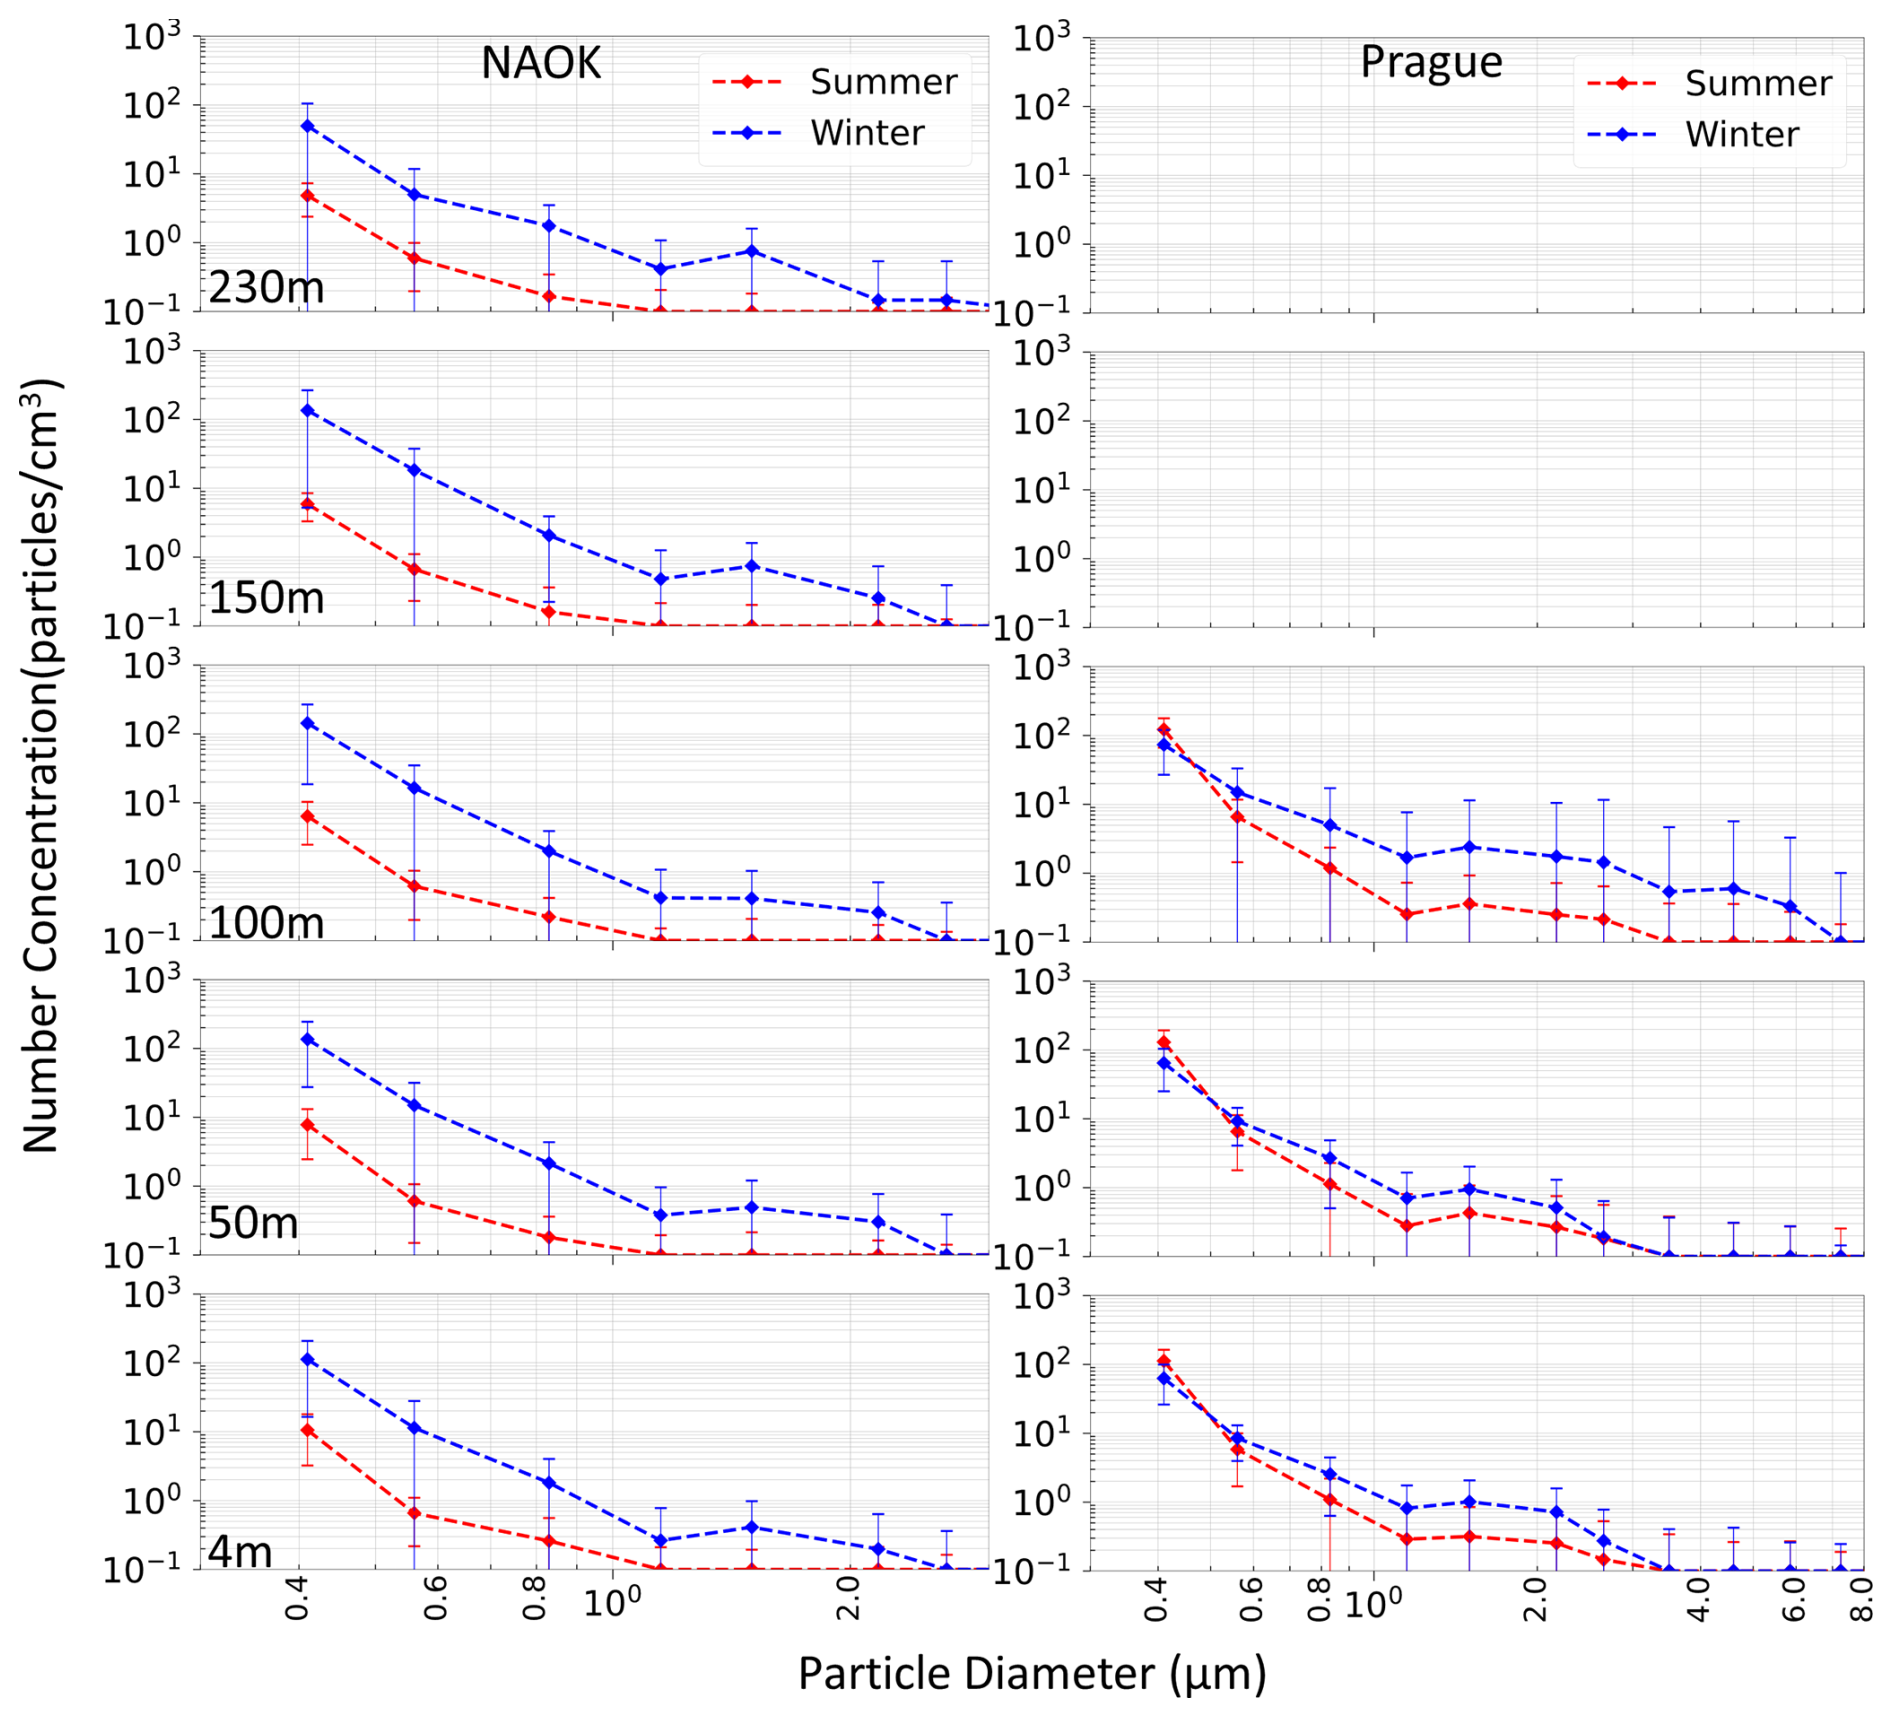
Figure 11Log–Log plot of the variation of mean particle number concentration with particle size from OPC on the drone at different heights during summer 2023 and winter 2024 at NAOK (left) and summer 2023 and winter 2023 at Prague (right).
At the urban site, Prague, the size distribution analysis showed a significant increase in the average particle count for particles with sizes between 0.5 and 3 µm during the winter month (December 2023) compared to the summer month (August 2023) across all heights. Despite this increase, PNC was higher in summer than in winter (Fig. 10d), due to higher summer concentrations in the smallest size bin, < 0.5 µm (Fig. 11). Although based on the limited number of flights and counts < 1 # cm−3 for particles over 1 µm (Fig. 11), this finding is consistent with ground-based observations from the national network (Fig. S20), also showing higher concentrations of PM10 in August 2023 than in December 2023.
OPC-N3 due to its detection limit of ∼ 0.3 µm cannot directly capture new particle formation events and the subsequent growth that may be the reason for the increase in concentrations. The photochemistry-related origin of the summer aerosol in the smallest measurable bins is however supported by the higher concentration of nitrogen dioxide (NO2) during the summer (Fig. S21), combined with increased sunlight (Fig. S22), both of which promote the photochemical production of secondary particles (Gao et al., 2012; Kulmala et al., 2004).
The larger particles (2.5–8 µm) showed a more significant increase during winter in Prague, particularly at 100 m, further suggesting contributions from regional or long-range transported sources.
This study presents a campaign-based analysis of vertical measurements of eBC mass concentration and PNC using drone-based profiling at a rural (NAOK) and an urban (Prague) site in the Czech Republic during different seasons. A comparison of drone-deployed instruments with reference measurements at various heights of fixed observational platforms (tall tower and building) was performed under various RH conditions and RH control strategies.
The results show the effectiveness of drones for vertical profiling, offering results comparable to reference instruments at various heights between 0 and 230 m and suggesting the applicability of drone eBC and PNC measurements also in higher altitudes. When mounted on a drone, eBC mass concentrations from AE51 with dryer were comparable at the ground and 230 m with the reference devices. Without the dryer, the eBC mass concentration was overestimated by 276 % and 285 % compared to the reference devices on the ground during summer and winter, respectively, attributed to higher ambient RH levels. In comparison, results differ by less than 10 % from the reference when using a dryer. Thus, drying significantly reduces measurement discrepancies, highlighting the importance of drying in minimizing the impact of RH, particularly for eBC measurements. While the dryer study demonstrates close agreement on a single day, a multi-day validation with the dryer installed remains a priority for future work, as our findings emphasize the necessity of a drying system even on drone-based measurement platforms.
At the rural site (NAOK), eBC mass concentration and PNC decreased with height during both seasons, though the height at which the decrease began was higher in winter than in summer. eBC mass concentrations were uniformly distributed up to the first 50 m in summer and up to 100 m in winter. PNC decreased with height from the ground in summer, while it remained uniform up to 50 m in winter, probably due to weak vertical temperature gradients (ΔT ≈ 0.05 °C) and limited turbulent mixing during this season, which also led to higher concentrations of both eBC and PNC compared to summer. The higher concentrations during winter at NAOK were primarily driven by fine particles (PM1) associated with combustion sources such as residential heating. However, our results suggest that at least two aerosol populations of different sizes and sources were measured during the year, thus with different vertical behaviors.
Conversely, at the urban site (Prague), both eBC and PNC were more uniform across altitudes in summer, facilitated by local emission sources (supported by local air-quality data) and enhanced vertical mixing driven by the urban heat island effect. eBC mass concentration and PNC in winter decrease with height, reflecting limited vertical mixing due to near-isothermal conditions (ΔT ≈ 0.06 °C) and weak wind shear. PNC was higher in summer, likely due to increased secondary particle formation driven by elevated levels of gaseous precursors and photochemical reactions. These seasonal differences emphasize the interplay between emission strength, boundary-layer dynamics, and secondary formation processes in shaping vertical aerosol patterns.
During a winter high pollution event in Prague, both eBC and PNC concentrations increased, with long-range transport contributing to high eBC mass at 100 m, while PNC remained concentrated near the surface. The largest enhancement aloft coincided with the estimated boundary-layer top, suggesting entrainment of aged, transported aerosols above a shallow mixing layer, while near-surface PNC reflected trapped local emissions. These emphasize the dynamic interaction of local emissions, atmospheric stability, and long-range transport aerosols in shaping vertical concentration profiles, undecipherable by only ground-based measurements. Using drone-based measurements to capture vertical variation in air quality offers valuable insights into pollutant dynamics.
While the measurements presented here offer new insights into the vertical variability of eBC and PNC at rural and urban sites, they represent short-term case studies under specific meteorological and seasonal conditions. Therefore, the observed vertical structures and seasonal contrasts should be interpreted as site-specific patterns rather than generalized tendencies. Nonetheless, the study demonstrates the capability of UAV-based systems to capture vertical pollutant gradients with high spatial resolution, highlighting their potential for complementing long-term monitoring and model validation efforts.
The dataset including drone measured data and from reference devices and meteorological instruments, covering both rural and urban sites across different seasons is available at https://doi.org/10.17632/snbp6w49v9.1 (Julaha, 2025).
The supplement related to this article is available online at https://doi.org/10.5194/acp-25-17933-2025-supplement.
KJ, DB, and NZ designed the experiments. KJ carried out all the experiments. KJ was also responsible for conceptualization, methodology, validation, formal analysis, investigation, data curation, visualization, and writing of the original draft. DB contributed to methodology and writing – review and editing. NZ was responsible for validation, supervision, and writing – review and editing. SM was responsible for data curation and contributed to writing – review and editing. VZ contributed to writing – review and editing, funding acquisition, and resources.
The contact author has declared that none of the authors has any competing interests.
Publisher’s note: Copernicus Publications remains neutral with regard to jurisdictional claims made in the text, published maps, institutional affiliations, or any other geographical representation in this paper. While Copernicus Publications makes every effort to include appropriate place names, the final responsibility lies with the authors. Views expressed in the text are those of the authors and do not necessarily reflect the views of the publisher.
We gratefully acknowledge the financial support provided by the National Research Infrastructure Support Project - ACTRIS Participation of the Czech Republic (ACTRIS-CZ LM2023030) and CzeCOS (LM2023048), funded by the Ministry of Education, Youth and Sports of the Czech Republic, and the Czech Science Foundation under grant 24-10768S, ICPF Internal Grant Agency (grant no. 028001) and Charles University Grant Agency (grant no. 98124). We also thank colleagues from the Košetice observatory and Department of Atmospheric Physics, Prague, for providing the meteorological data. Special Thanks to our technicians, Petr Roztočil and Rohit, for preparing the Arduino datalogger and Airstream Dryer.
This research has been supported by the Ministerstvo Školství, Mládeže a Tělovýchovy (grant nos. LM2023030 and LM2023048), the Grantová Agentura České Republiky (grant no. 24-10768S), and the Grantová Agentura, Univerzita Karlova (grant no. 98124).
This paper was edited by Samara Carbone and reviewed by two anonymous referees.
Alas, H. D. C., Müller, T., Weinhold, K., Pfeifer, S., Glojek, K., Gregorič, A., Močnik, G., Drinovec, L., Costabile, F., Ristorini, M., and Wiedensohler, A.: Performance of microAethalometers: Real-world Field Intercomparisons from Multiple Mobile Measurement Campaigns in Different Atmospheric Environments, Aerosol Air Qual. Res., 20, 2640–2653, https://doi.org/10.4209/aaqr.2020.03.0113, 2020.
Babu, S. S., Moorthy, K. K., Manchanda, R. K., Sinha, P. R., Satheesh, S. K., Vajja, D. P., Srinivasan, S., and Kumar, V. H. A.: Free tropospheric black carbon aerosol measurements using high altitude balloon: Do BC layers build “their own homes” up in the atmosphere?, Geophys. Res. Lett., 38, L08803, https://doi.org/10.1029/2011GL046654, 2011.
Barbieri, L., Kral, S. T., Bailey, S. C. C., Frazier, A. E., Jacob, J. D., Reuder, J., Brus, D., Chilson, P. B., Crick, C., Detweiler, C., Doddi, A., Elston, J., Foroutan, H., González-Rocha, J., Greene, B. R., Guzman, M. I., Houston, A. L., Islam, A., Kemppinen, O., Lawrence, D., Pillar-Little, E. A., Ross, S. D., Sama, M. P., Schmale, D. G., Schuyler, T. J., Shankar, A., Smith, S. W., Waugh, S., Dixon, C., Borenstein, S., and de Boer, G.: Intercomparison of Small Unmanned Aircraft System (sUAS) Measurements for Atmospheric Science during the LAPSE-RATE Campaign, Sensors, 19, 2179, https://doi.org/10.3390/s19092179, 2019.
Battaglia, M. A., Douglas, S., and Hennigan, C. J.: Effect of the Urban Heat Island on Aerosol pH, Environ. Sci. Technol., 51, 13095–13103, https://doi.org/10.1021/acs.est.7b02786, 2017.
Bezantakos, S., Costi, M., Barmpounis, K., Antoniou, P., Vouterakos, P., Keleshis, C., Sciare, J., and Biskos, G.: Qualification of the Alphasense optical particle counter for inline air quality monitoring, Aerosol Sci. Tech., 55, 361–370, 2020.
Bond, T. C., Doherty, S. J., Fahey, D. W., Forster, P. M., Berntsen, T., DeAngelo, B. J., Flanner, M. G., Ghan, S., Kärcher, B., and Koch, D.: Bounding the role of black carbon in the climate system: A scientific assessment, J. Geophys. Res.-Atmos., 118, 5380–5552, 2013.
Brady, J. M., Stokes, M. D., Bonnardel, J., and Bertram, T. H.: Characterization of a Quadrotor Unmanned Aircraft System for Aerosol-Particle-Concentration Measurements, Environ. Sci. Technol., 50, 1376–1383, https://doi.org/10.1021/acs.est.5b05320, 2016.
Brus, D., Gustafsson, J., Vakkari, V., Kemppinen, O., de Boer, G., and Hirsikko, A.: Measurement report: Properties of aerosol and gases in the vertical profile during the LAPSE-RATE campaign, Atmos. Chem. Phys., 21, 517–533, https://doi.org/10.5194/acp-21-517-2021, 2021.
Brus, D., Le, V., Kuula, J., and Doulgeris, K.: Data collected by a drone backpack for air quality and atmospheric state measurements during Pallas Cloud Experiment 2022 (PaCE2022), Earth Syst. Sci. Data, 17, 5209–5219, https://doi.org/10.5194/essd-17-5209-2025, 2025.
Cai, J., Yan, B., Kinney, P. L., Perzanowski, M. S., Jung, K.-H., Li, T., Xiu, G., Zhang, D., Olivo, C., and Ross, J.: Optimization approaches to ameliorate humidity and vibration related issues using the microAeth black carbon monitor for personal exposure measurement, Aerosol Sci. Tech., 47, 1196–1204, 2013.
Cappelletti, D., Petroselli, C., Mateos, D., Herreras, M., Ferrero, L., Losi, N., Gregorič, A., Frangipani, C., La Porta, G., and Lonardi, M.: Vertical profiles of black carbon and nanoparticles pollutants measured by a tethered balloon in Longyearbyen (Svalbard islands), Atmos. Environ., 290, 119373, https://doi.org/10.1016/j.atmosenv.2022.119373, 2022.
Chacón-Mateos, M., Laquai, B., Vogt, U., and Stubenrauch, C.: Evaluation of a low-cost dryer for a low-cost optical particle counter, Atmos. Meas. Tech., 15, 7395–7410, https://doi.org/10.5194/amt-15-7395-2022, 2022.
Chen, D., Liao, H., Yang, Y., Chen, L., Zhao, D., and Ding, D.: Simulated impacts of vertical distributions of black carbon aerosol on meteorology and PM2.5 concentrations in Beijing during severe haze events, Atmos. Chem. Phys., 22, 1825–1844, https://doi.org/10.5194/acp-22-1825-2022, 2022.
Chi, X., Winderlich, J., Mayer, J.-C., Panov, A. V., Heimann, M., Birmili, W., Heintzenberg, J., Cheng, Y., and Andreae, M. O.: Long-term measurements of aerosol and carbon monoxide at the ZOTTO tall tower to characterize polluted and pristine air in the Siberian taiga, Atmos. Chem. Phys., 13, 12271–12298, https://doi.org/10.5194/acp-13-12271-2013, 2013.
Chilinski, M. T., Markowicz, K. M., and Markowicz, J.: Observation of vertical variability of black carbon concentration in lower troposphere on campaigns in Poland, Atmos. Environ., 137, 155–170, https://doi.org/10.1016/j.atmosenv.2016.04.020, 2016.
Corrigan, C. E., Roberts, G. C., Ramana, M. V., Kim, D., and Ramanathan, V.: Capturing vertical profiles of aerosols and black carbon over the Indian Ocean using autonomous unmanned aerial vehicles, Atmos. Chem. Phys., 8, 737–747, https://doi.org/10.5194/acp-8-737-2008, 2008.
CSD: https://www.rsd.cz/silnice-a-dalnice/scitani-dopravy (last access: 11 December 2024), 2020.
de Boer, G., Diehl, C., Jacob, J., Houston, A., Smith, S. W., Chilson, P., Schmale, D. G., Intrieri, J., Pinto, J., Elston, J., Brus, D., Kemppinen, O., Clark, A., Lawrence, D., Bailey, S. C. C., Sama, M. P., Frazier, A., Crick, C., Natalie, V., Pillar-Little, E., Klein, P., Waugh, S., Lundquist, J. K., Barbieri, L., Kral, S. T., Jensen, A. A., Dixon, C., Borenstein, S., Hesselius, D., Human, K., Hall, P., Argrow, B., Thornberry, T., Wright, R., and Kelly, J. T.: Development of Community, Capabilities, and Understanding through Unmanned Aircraft-Based Atmospheric Research: The LAPSE-RATE Campaign, B. Am. Meteorol. Soc., 101, E684–E699, https://doi.org/10.1175/BAMS-D-19-0050.1, 2020.
Ding, A. J., Huang, X., Nie, W., Sun, J. N., Kerminen, V. -M., Petäjä, T., Su, H., Cheng, Y. F., Yang, X. -Q., Wang, M. H., Chi, X. G., Wang, J. P., Virkkula, A., Guo, W. D., Yuan, J., Wang, S. Y., Zhang, R. J., Wu, Y. F., Song, Y., Zhu, T., Zilitinkevich, S., Kulmala, M., and Fu, C. B.: Enhanced haze pollution by black carbon in megacities in China, Geophys. Res. Lett., 43, 2873–2879, https://doi.org/10.1002/2016GL067745, 2016.
Donateo, A., Pappaccogli, G., Famulari, D., Mazzola, M., Scoto, F., and Decesari, S.: Characterization of size-segregated particles' turbulent flux and deposition velocity by eddy correlation method at an Arctic site, Atmos. Chem. Phys., 23, 7425–7445, https://doi.org/10.5194/acp-23-7425-2023, 2023.
Dvorská, A., Sedlák, P., Schwarz, J., Fusek, M., Hanuš, V., Vodička, P., and Trusina, J.: Atmospheric station Křešín u Pacova, Czech Republic – a Central European research infrastructure for studying greenhouse gases, aerosols and air quality, Adv. Sci. Res., 12, 79–83, 2015.
Ferrero, L., Ritter, C., Cappelletti, D., Moroni, B., Močnik, G., Mazzola, M., Lupi, A., Becagli, S., Traversi, R., and Cataldi, M.: Aerosol optical properties in the Arctic: The role of aerosol chemistry and dust composition in a closure experiment between Lidar and tethered balloon vertical profiles, Sci. Total Environ., 686, 452–467, 2019.
Gani, S., Bhandari, S., Seraj, S., Wang, D. S., Patel, K., Soni, P., Arub, Z., Habib, G., Hildebrandt Ruiz, L., and Apte, J. S.: Submicron aerosol composition in the world's most polluted megacity: the Delhi Aerosol Supersite study, Atmos. Chem. Phys., 19, 6843–6859, https://doi.org/10.5194/acp-19-6843-2019, 2019.
Gao, J., Chai, F., Wang, T., Wang, S., and Wang, W.: Particle number size distribution and new particle formation: New characteristics during the special pollution control period in Beijing, J. Environ. Sci., 24, 14–21, https://doi.org/10.1016/S1001-0742(11)60725-0, 2012.
Good, N., Mölter, A., Peel, J. L., and Volckens, J.: An accurate filter loading correction is essential for assessing personal exposure to black carbon using an Aethalometer, J. Expo. Sci. Env. Epid., 27, 409–416, https://doi.org/10.1038/jes.2016.71, 2017.
Haeffelin, M., Ribaud, J.-F., Kotthaus, S., Dupont, J.-C., Lemonsu, A., and Masson, V.: Effect of nocturnal urban boundary layer stability and mixing on temperature contrasts between built-up environments and urban parks, EGU General Assembly 2024, Vienna, Austria, 14–19 Apr 2024, EGU24-19030, https://doi.org/10.5194/egusphere-egu24-19030, 2024.
Hagan, D. H. and Kroll, J. H.: Assessing the accuracy of low-cost optical particle sensors using a physics-based approach, Atmos. Meas. Tech., 13, 6343–6355, https://doi.org/10.5194/amt-13-6343-2020, 2020.
Harm-Altstädter, B., Voß, A., Aust, S., Bärfuss, K., Bretschneider, L., Merkel, M., Pätzold, F., Schlerf, A., Weinhold, K., Wiedensohler, A., Winkler, U., and Lampert, A.: First study using a fixed-wing drone for systematic measurements of aerosol vertical distribution close to a civil airport, Frontiers in Environmental Science, 12, 1376980, https://doi.org/10.3389/fenvs.2024.1376980, 2024.
Hedworth, H., Page, J., Sohl, J., and Saad, T.: Investigating errors observed during UAV-based vertical measurements using computational fluid dynamics, Drones, 6, 253, https://doi.org/10.3390/drones6090253, 2022.
Hersbach, H., Bell, B., Berrisford, P., Biavati, G., Horányi, A., Muñoz-Sabater, J., Nicolas, J., Peubey, C., Radu, R., Rozum, I., Schepers, D., Simmons, A., Soci, C., Dee, D. and Thépaut, J.-N.: ERA5 hourly data on single levels from 1940 to present, Copernicus Climate Change Service (C3S) Climate Data Store (CDS) [data set], https://doi.org/10.24381/cds.adbb2d47, 2023.
Julaha, K.: “Drone_rural_urban”, V1, Mendeley Data [data set], https://doi.org/10.17632/snbp6w49v91, 2025.
Julaha, K., Ždímal, V., Holubová Šmejkalová, A., Komínková, K., and Zíková, N.: Boundary layer and mixing layer height: Models vs. Ground-based measurements intercomparison, Atmos. Res., 315, 107897, https://doi.org/10.1016/j.atmosres.2024.107897, 2025.
Kotthaus, S., Haeffelin, M., Céspedes, J., Van Hove, M., Drouin, M.-A., Dupont, J.-C., and Foret, G.: Urban atmosphere dynamics for air quality applications: Atmospheric boundary layer height and wind profiles from ground-based remote sensing networks, EGU General Assembly 2023, Vienna, Austria, 23–28 Apr 2023, EGU23-13154, https://doi.org/10.5194/egusphere-egu23-13154, 2023.
Kulmala, M., Vehkamäki, H., Petäjä, T., Dal Maso, M., Lauri, A., Kerminen, V.-M., Birmili, W., and McMurry, P. H.: Formation and growth rates of ultrafine atmospheric particles: a review of observations, J. Aerosol Sci., 35, 143–176, https://doi.org/10.1016/j.jaerosci.2003.10.003, 2004.
Lee, J.: Performance test of microaeth® AE51 at concentrations lower than 2 µg m−3 in indoor laboratory, Applied Sciences, 9, 2766, https://doi.org/10.3390/app9132766, 2019.
Lencer: Czech Republic location map (equirectangular projection), own work using United States National Imagery and Mapping Agency data, Wikimedia Commons, https://commons.wikimedia.org/wiki/File:Czech_Republic_location_map.svg (last access: 26 November 2025), 24 July 2008.
Li, J., Von Salzen, K., Peng, Y., Zhang, H., and Liang, X.: Evaluation of black carbon semi-direct radiative effect in a climate model, J. Geophys. Res.-Atmos., 118, 4715–4728, https://doi.org/10.1002/jgrd.50327, 2013.
Liang, Y., Wu, C., Wu, D., Liu, B., Li, Y. J., Sun, J., Yang, H., Mao, X., Tan, J., and Xia, R.: Vertical distributions of atmospheric black carbon in dry and wet seasons observed at a 356-m meteorological tower in Shenzhen, South China, Sci. Total Environ., 853, 158657, https://doi.org/10.1016/j.scitotenv.2022.158657, 2022.
Liu, B., Wu, C., Ma, N., Chen, Q., Li, Y., Ye, J., Martin, S. T., and Li, Y. J.: Vertical profiling of fine particulate matter and black carbon by using unmanned aerial vehicle in Macau, China, Sci. Total Environ., 709, 136109, https://doi.org/10.1016/j.scitotenv.2019.136109, 2020.
Liu, H., Pan, X., Lei, S., Zhang, Y., Du, A., Yao, W., Tang, G., Wang, T., Xin, J., Li, J., Sun, Y., Cao, J., and Wang, Z.: Vertical distribution of black carbon and its mixing state in the urban boundary layer in summer, Atmos. Chem. Phys., 23, 7225–7239, https://doi.org/10.5194/acp-23-7225-2023, 2023.
Marucci, D. and Carpentieri, M.: Effect of local and upwind stratification on flow and dispersion inside and above a bi-dimensional street canyon, Build. Environ., 156, 74–88, 2019.
Masey, N., Ezani, E., Gillespie, J., Sutherland, F., Lin, C., Hamilton, S., Heal, M. R., and Beverland, I. J.: Consistency of urban background black carbon concentration measurements by portable AE51 and reference AE22 aethalometers: Effect of corrections for filter loading, Aerosol Air Qual. Res., 20, 329–340, 2020.
Mbengue, S., Serfozo, N., Schwarz, J., Ziková, N., Holubová, S. A., and Holoubek, I.: Characterization of Equivalent Black Carbon at a regional background site in Central Europe: Variability and source apportionment?, Environ. Pollut., 260, 113771, https://doi.org/10.1016/j.envpol.2019.113771, 2020.
Mbengue, S., Zikova, N., Schwarz, J., Vodička, P., Šmejkalová, A. H., and Holoubek, I.: Mass absorption cross-section and absorption enhancement from long term black and elemental carbon measurements: A rural background station in Central Europe, Sci. Total Environ., 794, 148365, https://doi.org/10.1016/j.scitotenv.2021.148365, 2021.
Mbengue, S., Vodička, P., Komínková, K., Zíková, N., Schwarz, J., Prokeš, R., Suchánková, L., Julaha, K., Ondráček, J., and Holoubek, I.: Different approaches to explore the impact of COVID-19 lockdowns on carbonaceous aerosols at a European rural background site, Sci. Total Environ., 892, 164527, https://doi.org/10.1016/j.scitotenv.2023.164527, 2023.
Metrostav: https://www.metrostav.cz/en/segments/tunnelling/references/28-blanka-tunnel-complex, last access: 11 December 2024.
Miyakawa, T., Mordovskoi, P., and Kanaya, Y.: Evaluation of black carbon mass concentrations using a miniaturized aethalometer: Intercomparison with a continuous soot monitoring system (COSMOS) and a single-particle soot photometer (SP2), Aerosol Sci. Tech., 54, 811–825, 2020.
Mizera, J., Havelcová, M., Machovič, V., Borecká, L., and Vöröš, D.: Neutron Activation Analysis in Urban Geochemistry: Impact of Traffic Intensification after Opening the Blanka Tunnel Complex in Prague, Minerals, 12, 281, https://doi.org/10.3390/min12030281, 2022.
Moteki, N.: Climate-relevant properties of black carbon aerosols revealed by in situ measurements: a review, Prog. Earth Planet. Sci., 10, 12, https://doi.org/10.1186/s40645-023-00544-4, 2023.
Myhre, G., Myhre, C. E. L., Samset, B. H., and Storelvmo, T.: Aerosols and their relation to global climate and climate sensitivity, Nature Education Knowledge, 4, 7, https://www.nature.com/scitable/knowledge/library/aerosols-and-their-relation-to-global-climate-102215345/ (last access: 10 March 2025), 2013.
Nurowska, K. and Markowicz, K. M.: Determination of hygroscopic aerosol growth based on the OPC-N3 counter, Atmosphere, 15, 61, https://doi.org/10.3390/atmos15010061, 2023.
Nurowska, K., Mohammadi, M., Malinowski, S., and Markowicz, K.: Applicability of the low-cost OPC-N3 optical particle counter for microphysical measurements of fog, Atmos. Meas. Tech., 16, 2415–2430, https://doi.org/10.5194/amt-16-2415-2023, 2023.
Petzold, A., Ogren, J. A., Fiebig, M., Laj, P., Li, S.-M., Baltensperger, U., Holzer-Popp, T., Kinne, S., Pappalardo, G., Sugimoto, N., Wehrli, C., Wiedensohler, A., and Zhang, X.-Y.: Recommendations for reporting ”black carbon” measurements, Atmos. Chem. Phys., 13, 8365–8379, https://doi.org/10.5194/acp-13-8365-2013, 2013.
Ramana, M., Ramanathan, V., Feng, Y., Yoon, S., Kim, S., Carmichael, G., and Schauer, J.: Warming influenced by the ratio of black carbon to sulphate and the black-carbon source, Nat. Geosci., 3, 542–545, 2010.
Ramanathan, V. and Carmichael, G.: Global and regional climate changes due to black carbon, Nat. Geosci., 1, 221–227, 2008.
Ramatheerthan, S. K., Peiker, J., Crespo, N. M., and Kozubek, M.: Monitoring Extreme Meteorological and Pollution Events in Prague: A Station Data Based Analysis, WDS'24 Proceedings of Contributed Papers – Physics, edited by: Šafránková, J. and Pavlů, J., 9–18, ISBN 978-80-7378-520-8, 2024.
Renard, J.-B., Michoud, V., and Giacomoni, J.: Vertical profiles of pollution particle concentrations in the boundary layer above Paris (France) from the optical aerosol counter LOAC onboard a touristic balloon, Sensors, 20, 1111, https://doi.org/10.3390/s20041111, 2020.
Samad, A., Vogt, U., Panta, A., and Uprety, D.: Vertical distribution of particulate matter, black carbon and ultra-fine particles in Stuttgart, Germany, Atmos. Pollut. Res., 11, 1441–1450, https://doi.org/10.1016/j.apr.2020.05.017, 2020.
Samset, B. H., Myhre, G., Schulz, M., Balkanski, Y., Bauer, S., Berntsen, T. K., Bian, H., Bellouin, N., Diehl, T., Easter, R. C., Ghan, S. J., Iversen, T., Kinne, S., Kirkevåg, A., Lamarque, J.-F., Lin, G., Liu, X., Penner, J. E., Seland, Ø., Skeie, R. B., Stier, P., Takemura, T., Tsigaridis, K., and Zhang, K.: Black carbon vertical profiles strongly affect its radiative forcing uncertainty, Atmos. Chem. Phys., 13, 2423–2434, https://doi.org/10.5194/acp-13-2423-2013, 2013.
Schulz, H., Zanatta, M., Bozem, H., Leaitch, W. R., Herber, A. B., Burkart, J., Willis, M. D., Kunkel, D., Hoor, P. M., Abbatt, J. P. D., and Gerdes, R.: High Arctic aircraft measurements characterising black carbon vertical variability in spring and summer, Atmos. Chem. Phys., 19, 2361–2384, https://doi.org/10.5194/acp-19-2361-2019, 2019.
Schwarz, J. P., Gao, R. S., Fahey, D. W., Thomson, D. S., Watts, L. A., Wilson, J. C., Reeves, J. M., Darbeheshti, M., Baumgardner, D. G., Kok, G. L., Chung, S. H., Schulz, M., Hendricks, J., Lauer, A., Kärcher, B., Slowik, J. G., Rosenlof, K. H., Thompson, T. L., Langford, A. O., Loewenstein, M., and Aikin, K. C.: Single-particle measurements of midlatitude black carbon and light-scattering aerosols from the boundary layer to the lower stratosphere, J. Geophys. Res., 111, 2006JD007076, https://doi.org/10.1029/2006JD007076, 2006.
Sheskin, D. J.: Handbook of parametric and nonparametric statistical procedures, Chapman and Hall/CRC, ISBN 978-04-2918-619-6, https://doi.org/10.1201/9780429186196, 2003.
Steeneveld, G.-J.: Current challenges in understanding and forecasting stable boundary layers over land and ice, Frontiers in Environmental Science, 2, 41, https://doi.org/10.3389/fenvs.2014.00041, 2014.
Sun, T., Wu, C., Wu, D., Liu, B., Sun, J. Y., Mao, X., Yang, H., Deng, T., Song, L., Li, M., Li, Y. J., and Zhou, Z.: Time-resolved black carbon aerosol vertical distribution measurements using a 356-m meteorological tower in Shenzhen, Theor. Appl. Climatol., 140, 1263–1276, https://doi.org/10.1007/s00704-020-03168-6, 2020.
Sun, Y., Chen, C., Zhang, Y., Xu, W., Zhou, L., Cheng, X., Zheng, H., Ji, D., Li, J., and Tang, X.: Rapid formation and evolution of an extreme haze episode in Northern China during winter 2015, Scientific Reports, 6, 27151, https://doi.org/10.1038/srep27151, 2016.
Villa, T. F., Salimi, F., Morton, K., Morawska, L., and Gonzalez, F.: Development and validation of a UAV based system for air pollution measurements, Sensors, 16, 2202, https://doi.org/10.3390/s16122202, 2016.
Vodička, P., Schwarz, J., Cusack, M., and Ždímal, V.: Detailed comparison of OC/EC aerosol at an urban and a rural Czech background site during summer and winter, Sci. Total Environ., 518, 424–433, 2015.
von der Weiden, S.-L., Drewnick, F., and Borrmann, S.: Particle Loss Calculator – a new software tool for the assessment of the performance of aerosol inlet systems, Atmos. Meas. Tech., 2, 479–494, https://doi.org/10.5194/amt-2-479-2009, 2009.
Wang, H., Sun, Z., Li, H., Gao, Y., Wu, J., and Cheng, T.: Vertical-distribution characteristics of atmospheric aerosols under different thermodynamic conditions in Beijing, Aerosol Air Qual. Res., 18, 2775–2787, 2018a.
Wang, J., Flagan, R. C., and Seinfeld, J. H.: Diffusional losses in particle sampling systems containing bends and elbows, J. Aerosol Sci., 33, 843–857, 2002.
Wang, Q., Sun, Y., Xu, W., Du, W., Zhou, L., Tang, G., Chen, C., Cheng, X., Zhao, X., Ji, D., Han, T., Wang, Z., Li, J., and Wang, Z.: Vertically resolved characteristics of air pollution during two severe winter haze episodes in urban Beijing, China, Atmos. Chem. Phys., 18, 2495–2509, https://doi.org/10.5194/acp-18-2495-2018, 2018b.
Wang, Y., Vogel, J. M., Lin, Y., Pan, B., Hu, J., Liu, Y., Dong, X., Jiang, J. H., Yung, Y. L., and Zhang, R.: Aerosol microphysical and radiative effects on continental cloud ensembles, Adv. Atmos. Sci., 35, 234–247, 2018c.
Weltje, G. J. and Roberson, S.: Numerical methods for integrating particle-size frequency distributions, Comput. Geosci., 44, 156–167, https://doi.org/10.1016/j.cageo.2011.09.020, 2012.
Wu, C., Liu, B., Wu, D., Yang, H., Mao, X., Tan, J., Liang, Y., Sun, J. Y., Xia, R., and Sun, J.: Vertical profiling of black carbon and ozone using a multicopter unmanned aerial vehicle (UAV) in urban Shenzhen of South China, Sci. Total Environ., 801, 149689, https://doi.org/10.1016/j.scitotenv.2021.149689, 2021.
Xie, C., Xu, W., Wang, J., Wang, Q., Liu, D., Tang, G., Chen, P., Du, W., Zhao, J., Zhang, Y., Zhou, W., Han, T., Bian, Q., Li, J., Fu, P., Wang, Z., Ge, X., Allan, J., Coe, H., and Sun, Y.: Vertical characterization of aerosol optical properties and brown carbon in winter in urban Beijing, China, Atmos. Chem. Phys., 19, 165–179, https://doi.org/10.5194/acp-19-165-2019, 2019.
Zheng, Y., Miao, R., Zhang, Q., Li, Y., Cheng, X., Liao, K., Koenig, T. K., Ge, Y., Tang, L., and Shang, D.: Secondary formation of submicron and supermicron organic and inorganic aerosols in a highly polluted urban area, J. Geophys. Res.-Atmos., 128, e2022JD037865, https://doi.org/10.1029/2022JD037865, 2023.
Zhu, Y., Wu, Z., Park, Y., Fan, X., Bai, D., Zong, P., Qin, B., Cai, X., and Ahn, K.-H.: Measurements of atmospheric aerosol vertical distribution above North China Plain using hexacopter, Sci. Total Environ., 665, 1095–1102, https://doi.org/10.1016/j.scitotenv.2019.02.100, 2019.