the Creative Commons Attribution 4.0 License.
the Creative Commons Attribution 4.0 License.
 | 10 Feb 2025
Post-return stroke VHF electromagnetic activity in north-western Mediterranean cloud-to-ground lightning flashes
Ivana Kolmašová
Eric Defer
Ondřej Santolík
Stéphane Pédeboy
We investigate properties of the electromagnetic activity following the first lightning return stroke (RS), using concurrent observations from the SLAVIA (Shielded Loop Antenna with a Versatile Integrated Amplifier) sensor, the SAETTA (Suivi de l'Activité Electrique Tridimensionnelle Totale de l'Atmosphère) Lightning Mapping Array (LMA) and the METEORAGE LF (low-frequency) network in the Corsica region. From the data collected between September and December 2015, we selected 66 negative cloud-to-ground (−CG) and 26 positive cloud-to-ground (+CG) lightning flashes in the north-western Mediterranean region. In the SAETTA data, we observe a decrease in the very high frequency (VHF) radiation rate and the VHF power, as recorded within a typical 80 µs time window at the LMA stations, immediately after the RS pulse in 59 −CG flashes. Contrastingly, we show that all examined +CG flashes exhibit a rapid increase in the VHF radiation rate and the VHF power immediately after the RS. We suggest a possible explanation of this phenomenon by considering the step-like propagation of a negative part of the bidirectional leader starting at the top end of the positive lightning channel inside the thundercloud, emitting electromagnetic radiation across a broad frequency spectrum.
- Article
(4104 KB) - Full-text XML
- BibTeX
- EndNote


During the development of lightning flashes, electromagnetic signals are emitted across a wide spectrum of frequencies, detectable by ground-based electric and magnetic antennas. The initial stage of cloud-to-ground (CG) flashes is called a preliminary breakdown (PB) stage (e.g. Clarence and Malan, 1957; Marshall et al., 2014; Karunarathne et al., 2020). Within this stage, numerous discharges are initiated in the thundercloud and one of them evolves into a bidirectional leader (e.g. Montanyà et al., 2015). In broadband electromagnetic recordings (units of kilohertz to tens of megahertz), the PB stage is identifiable as a sequence of bipolar pulses, typically with the same polarity as the upcoming return stroke (RS) (Rakov and Uman, 2003; Kolmašová et al., 2014). However, a study by Wu et al. (2018) showed a few cases of positive (+CG) flashes starting with PB pulses with opposite polarity. In the case of negative cloud-to-ground (−CG) flashes, the negative part of the bidirectional leader channel extends toward the ground, ionizing the air and forming a conductive path for the upcoming RS. This specific phase is referred to as the stepped-leader stage, during which the lightning channel expands in a stepped manner and, thus, generates intense very high frequency (VHF) radiation (Rakov, 2003). In the case of +CG flashes, the downward-moving segment is mostly the positive one, while the negative part is moving in the opposite direction (Li et al., 2020; Wu et al., 2018). Positive leaders usually do not radiate in the VHF band at all or not as strongly as the negative leaders (Rakov and Uman, 2003; Shao et al., 1999).
As the ionized channel of the leader gets closer to the ground, an upward discharge may be initiated; upon the connection of this upward discharge with the downward leader, a conductive path between the thundercloud and the ground is established, and the first RS occurs. In the case of −CG flashes, negative charge from the cloud begins to move towards the ground in the newly formed channel, leading to the electric current reaching magnitudes of up to hundreds of kiloamperes (Rakov and Uman, 2003). In the case of +CG flashes, the scenario is reversed, with negative charge ascending from the ground towards the cloud during the leader phase. For −CG lightning flashes, a study by Le Vine and Krider (1977) showed that the first RS exhibited robust radiation in the VHF range. The peak of VHF radiation at frequencies of 3, 139 and 295 MHz occurred 10–30 µs after the initiation of the RS peak identified in the wideband (300 Hz–2 MHz) electric field waveform. The aforementioned authors suggested that the VHF radiation might be attributed to the effects of branches in the first stroke. Lapierre et al. (2014) addressed the issue of post-RS very high frequency radiation by examining the growth of positive leaders following the RS in −CG flashes, and they explored its relationship with the continuing current (CC). Their research revealed that the positive leader propagates at a constant velocity before, during and after the CC phase. However, they did not find a clear correlation between the positive leader growth and the presence of the CC. In a subsequent study, Lapierre et al. (2017) reanalysed a seven-stroke −CG flash combining both Lightning Mapping Array (LMA) data and supplementary broadband interferometric data (INTF). The detailed mapping of the lightning flash highlighted the absence of negative in-cloud leaders following the RSs, while showing radiation from positive leaders, due to the interferometer's relatively good ability to map the propagation of positive leaders. Their findings along with those from Stock et al. (2017) and Shao et al. (1995) show that negative leader growth typically ceases immediately following a −CG RS. However, as the RS's potential wave reaches the top end of the lightning channel in the cloud, it often triggers a burst of positive breakdown at the end of positive leader tips.
One of the sparse studies on electromagnetic radiation of +CG flashes is a study conducted by Shao et al. (1999). Their investigation primarily focused on the cloud-to-ground leaders preceding the RS, but they also showed the VHF activity following two +CG and −CG first RSs. A robust radiation in the VHF power spectrum immediately after the first RS in +CG flashes (Fig. 1 in Shao et al., 1999), contrasting with the absent or minimal radiation in −CG flashes, was recorded (Fig. 2 in Shao et al., 1999), but this phenomenon was not described by the authors. A strong radiation following the RSs in +CG flashes was also shown in Wu et al. (2018, 2022), who used a Fast Antenna Lightning Mapping Array (FALMA) and its 2D mapping results. A presence of numerous located sources during the time after the RS is shown in their studies for several flashes, with a suggestion of a fast negative leader propagating in the cloud being the source of this radiation. However, information about processes immediately following the RS (within the first 1–5 ms) is missing because of the absence of 2D-located sources during this temporal window. Tang et al. (2023) contributed to this topic by describing the post-RS behaviour of a +CG flash detected in China. They used interferometric measurements to study the spatial and temporal development of the flash, focusing on the detection of radiating VHF sources. After the RS, they identified two negative breakdown processes initiated at different branches of previously established but extinguished negative channels, supporting the bidirectional concept of lightning discharge. Another study investigating post-RS VHF radiation in a multi-stroke +CG flash is the work by Urbani et al. (2022). Following the RS and a subsequent RS, they observed a burst of VHF activity, which they suggested was associated with the CC phase. Urbani et al. (2022) also proposed that the RS brings ground potential to the channel, introducing the negative charge along the in-cloud leader channels. In their study, which was mainly focused on the relationship between CC phase and in-cloud leader growth in +CG flashes, Lapierre et al. (2017) observed that the RS triggers an increase in the negative leader growth, with respect to both number and speed, in +CG flashes. This phase is marked by strong VHF radiation from negative in-cloud leaders immediately following the +CG RS. The authors conclude that, as negative leaders conduct significantly more current than positive leaders, the channel remains conductive during +CC phase, allowing the +CC flow to directly influence the growth rate of these negative in-cloud leaders. In contrast, for −CG flashes, the relatively low currents in positive leaders cause the channel to lose its conductivity very quickly (Lapierre et al., 2014, 2017; Stock et al., 2017), disconnecting it from the main channel, which is connected to the ground. As the in-cloud positive leader continues to grow, electric potential is built up until a step-like increase in the electrostatic field, called K-event (Rakov et al., 1992), occurs, re-ionizing the channel. Despite these findings, there is still room for further exploration into understanding the post-RS dynamics of both +CG and −CG flashes.
The primary objective of this study is to gain a complex understanding of the electromagnetic activity occurring immediately after the first RS and to explore the distinctions between −CG and +CG lightning flashes. Integrating data from multiple sources allows us to obtain a more extensive understanding of the processes occurring within the thundercloud after the first RS, compared with previous works, and to shed more light on the properties of the less frequently occurring +CG flashes.
We use broadband magnetic field measurement data obtained from the SLAVIA (Shielded Loop Antenna with a Versatile Integrated Amplifier) sensor, a magnetic loop that detects the east–west horizontal component of the time derivative of the magnetic field fluctuations in a frequency range from 5 kHz to 37 MHz. The antenna has a cosine-shaped sensitivity pattern and is connected to the radio receiver originally designed for the TARANIS spacecraft, sampling at a frequency of 80 MHz. The system operates in a triggered mode: 208 ms long waveform snapshots including a history of 52 ms are recorded when obtaining a trigger. The trigger is activated when the absolute value of the time derivative of the magnetic field exceeds a predefined threshold. Subsequently, these waveforms are numerically integrated, resulting in comprehensive representations of magnetic field evolution over time (Kolmašová et al., 2018, 2020). The precise timing of the sensor's clock is obtained via a GPS receiver, accurate up to 1 µs. During the year 2015, the sensor was located at Ersa station on the island of Corsica (altitude: 550 m; coordinates: 42.97° N, 9.38° E); the location is shown in Fig. 1.
Narrowband VHF radiation emitted by lightning discharges is obtained from the SAETTA (Suivi de l'Activité Electrique Tridimensionnelle Totale de l'Atmosphère) Lightning Mapping Array (LMA) network (Coquillat et al., 2019). This network consists of 12 stations that are strategically positioned across the island of Corsica (see station locations in Fig. 1). Each station features an electric field antenna, capable of detecting VHF radiation in the 60–66 MHz frequency range, sampled at 25 MHz. Individual stations store the time of arrival and the power of the strongest VHF radiation peak detected within individual consecutive 80 µs time intervals. Additionally, the total count of VHF sources surpassing a specified power threshold during each typical 80 µs interval, hereafter referred to as the VHF radiation rate, is recorded, with a maximum count of 2000 (i.e. sampling is performed with a cadence of 40 ns; sampling frequency is 25 MHz) (Rison et al., 1999; Kolmašová et al., 2018). The reception threshold is set for each station individually, being determined by the local noise floor. SAETTA is capable of 3D localization of the VHF radiation sources, employing the time-of-arrival method from successful detections by at least six individual LMA stations (Rison et al., 1999). As a result of this procedure, SAETTA provides 3D-located sources and estimations of their power. In this work, we only use sources obtained with a reduced chi-square value not greater than one. Each LMA station is equipped with a GPS receiver that provides a time assignment accurate to 1 µs. The raw VHF signal recorded at each of the 12 LMA stations and the reconstructed VHF sources are used to document the studied flashes.
Supplementary data on 2D locations, polarities and peak currents for analysed CG discharges were supplied by the French lightning location system METEORAGE. This system, using LS7002 sensors coupled to a Total Lightning Processor (TLP), has a detection efficiency of 94 % for CG lightning strokes, a median location accuracy of 120 m (Pédeboy and Toullec, 2016) and an estimated peak current amplitude accuracy of around 18 % (Schulz et al., 2016). In addition to CG discharges, METEORAGE detects the most powerful intracloud (IC) pulses corresponding to the vertical channel joining opposite charge areas in the cloud. The mean detection efficiency for IC flashes (flashes where at least one cloud pulse is detected) is estimated to be 56 % (Pédeboy et al., 2018).
First, we conducted a visual examination of 1 ms plots of broadband magnetic field waveforms from 1728 triggered intervals, each with a duration of 208 ms, recorded by the SLAVIA sensor between September and December 2015. This data set contained 661 CG flashes. For further analysis, we then selected all CG flashes with both distinguishable PB pulses (defined as a train of at least five bipolar pulses with a peak-to-peak amplitude of at least 1 nT, appearing within 1 ms) and the first RS pulse in the SLAVIA waveforms that were simultaneously detected by the LMA and METEORAGE. The presence of the PB pulses is required to ensure that the RS pulse is the first RS and not a subsequent RS pulse in a multi-stroke flash. This selection procedure resulted in 66 −CG and 26 +CG flashes.
In our investigation, we explored the relationship between broadband magnetic field waveforms and peaks in radiated VHF power detected by individual SAETTA stations. For all lightning flashes, we used their RS location according to METEORAGE to correct the time of the measurements for the propagation delay between the signal detection by individual SAETTA stations and their detection by the SLAVIA sensor.
The map of all 66 −CG and 26 +CG analysed flashes with their corresponding first RS polarities and RS peak current values (IRS) is shown in Fig. 1a. Most of the flashes occurred in the vicinity of the SLAVIA sensor, in the northern part of the island, and above the sea or along the coastline (same as in Coquillat et al., 2019). This pattern is also influenced by an increased capability of the SLAVIA sensor to detect closer flashes and the topography of Corsica, where the presence of inland high mountains makes it more difficult for the SLAVIA sensor and some of the LMA stations to detect lightning occurring in the mountainous area or on the other side of the island. For −CG flashes, the RS peak current ranged from –6.3 to –260.0 kA, with a mean value of –63.9 kA and a median value of –54.3 kA. In the case of +CG flashes, the RS peak current ranged from 8.5 to 157.3 kA, with a mean value of 87.0 kA and a median value of 89.5 kA. Histograms of the first RS peak currents for all −CG and +CG flashes are plotted in Fig. 1b and c, respectively. Furthermore, for all studied flashes, the initial polarity of PB pulses was the same as the polarity of the upcoming first RSs.
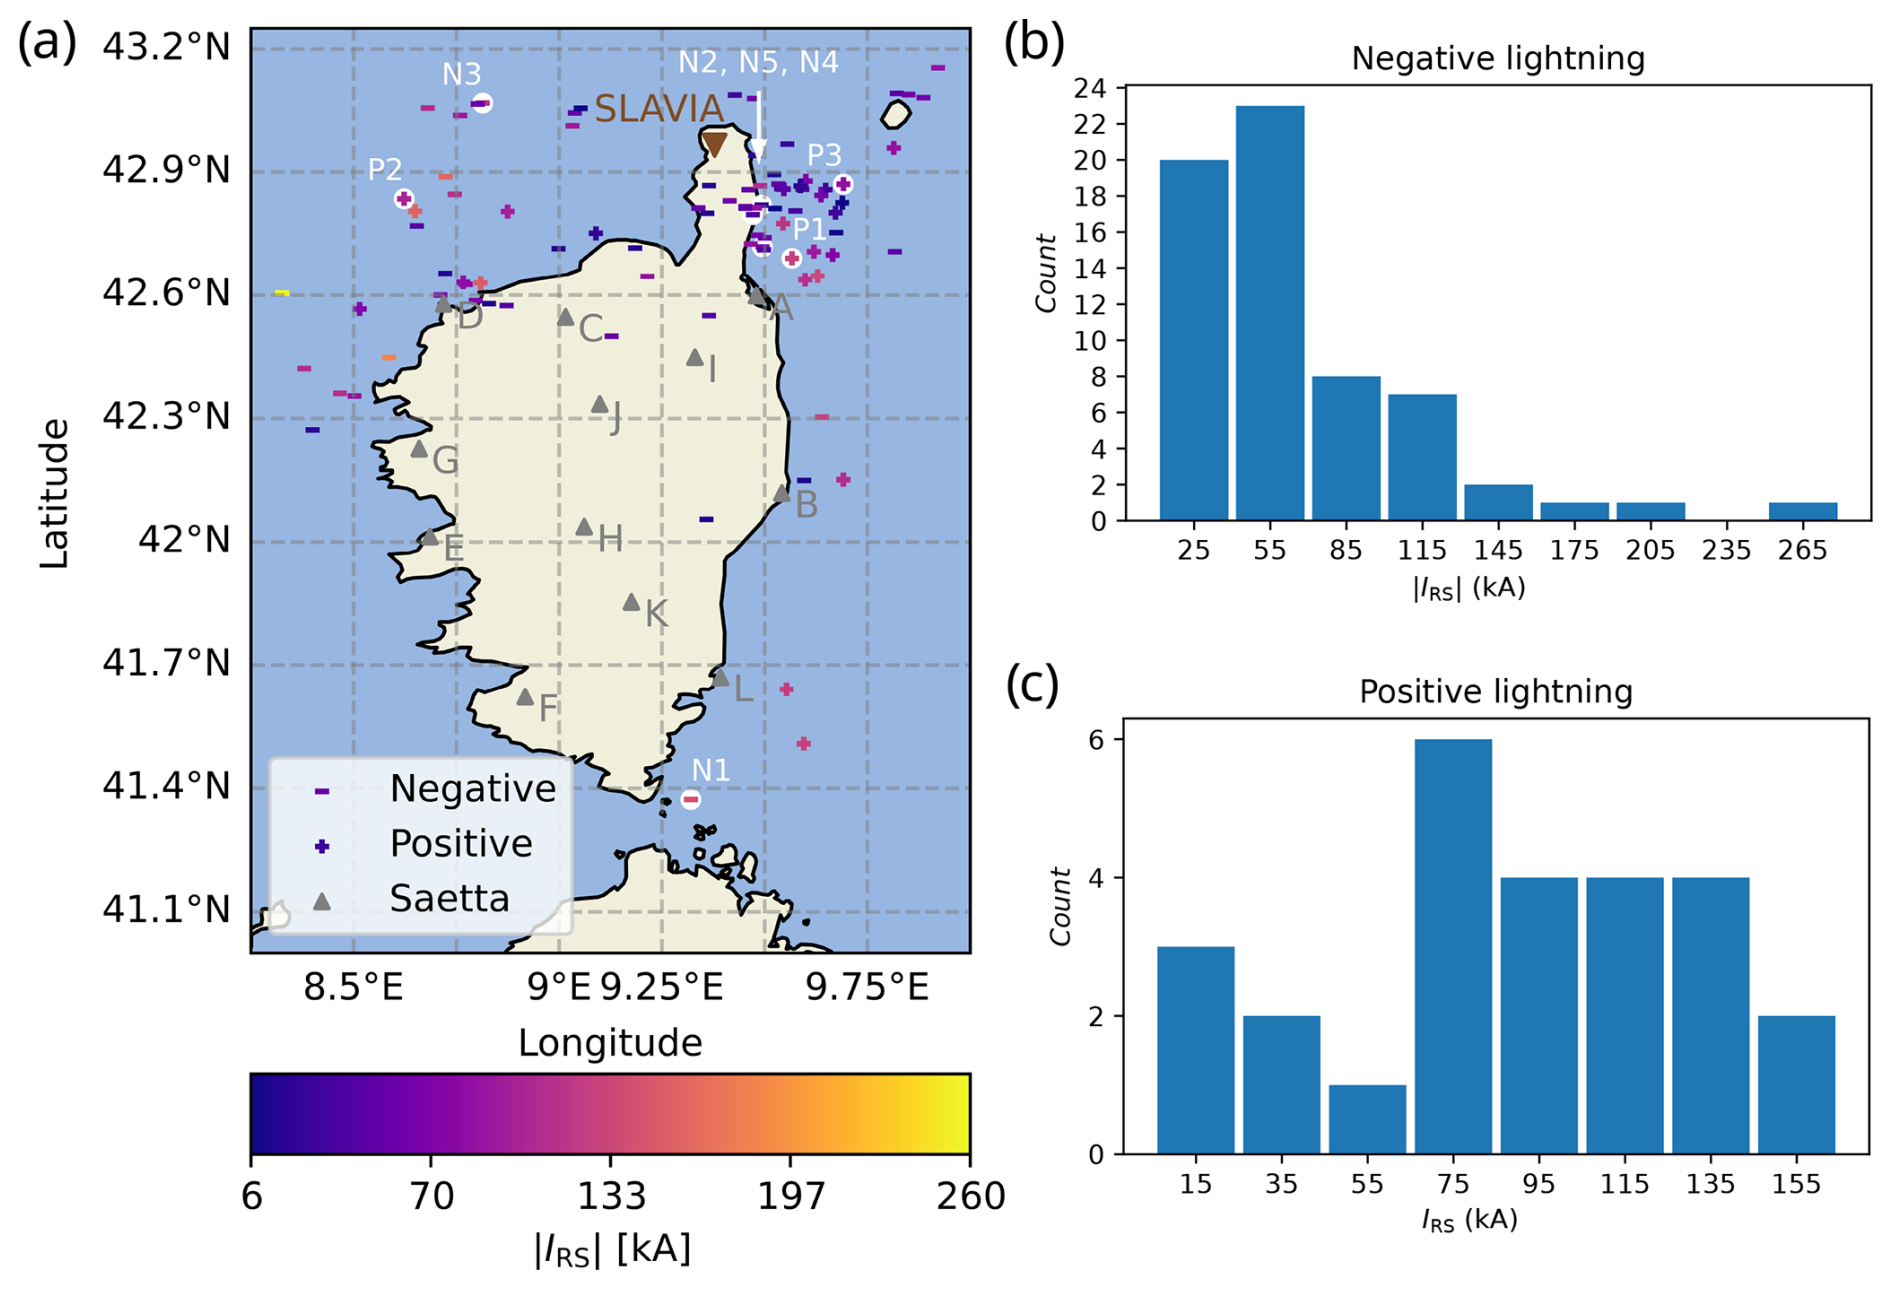
Figure 1(a) Map of all first return strokes (RSs) used in this study, as located by METEORAGE. The −CG strokes are marked with “−”, whereas +CG strokes are marked with “+”. The colour corresponds to the absolute value of the first RS peak current (IRS) for each flash. The SAETTA stations are labelled using grey triangles and their corresponding letter identifiers, while the SLAVIA sensor is marked using a brown upside-down triangle. The cartographic outline denotes the island of Corsica and the northern part of Sardinia. Panel (b) presents a histogram of the absolute value of the first RS peak current () for all 66 −CG flashes. Panel (c) presents a histogram of IRS for all 26 +CG flashes.
4.1 Negative (−CG) flashes
4.1.1 Decrease in VHF radiation after an RS
In the measurements of the majority (59 out of 66) of −CG flashes, as recorded independently by separate LMA stations, we observed a rapid decrease in the VHF radiation rate and the power of VHF radiation sources following the first RS pulse peak. Specifically, both of these quantities consistently reached a local peak within 2–30 µs after the wideband RS pulse peak, with the mean and median values of the VHF power peaks recorded by the nearest LMA stations being –41.3 and –40.7 dBm, respectively. The obtained mean and median VHF power peak values are similar to the individual VHF power peak values detected during the initiation phase of −CG flashes or inverted IC flashes at the SAETTA stations closest to the discharge, as reported in Figs. 3 and 4 in Kolmašovaá et al. (2018). Within a duration shorter than 300µs, the counts decreased below 1500 VHF samples above the threshold (note that the LMA sampling cadence is 40 ns) detected in an 80 µs LMA interval. Unless there was following IC activity, such as a preparative process for a subsequent RS, the counts continued to decrease afterwards and (in another 400 µs) reached a low value ranging from 1 to 500 samples above the threshold per 80 µs.
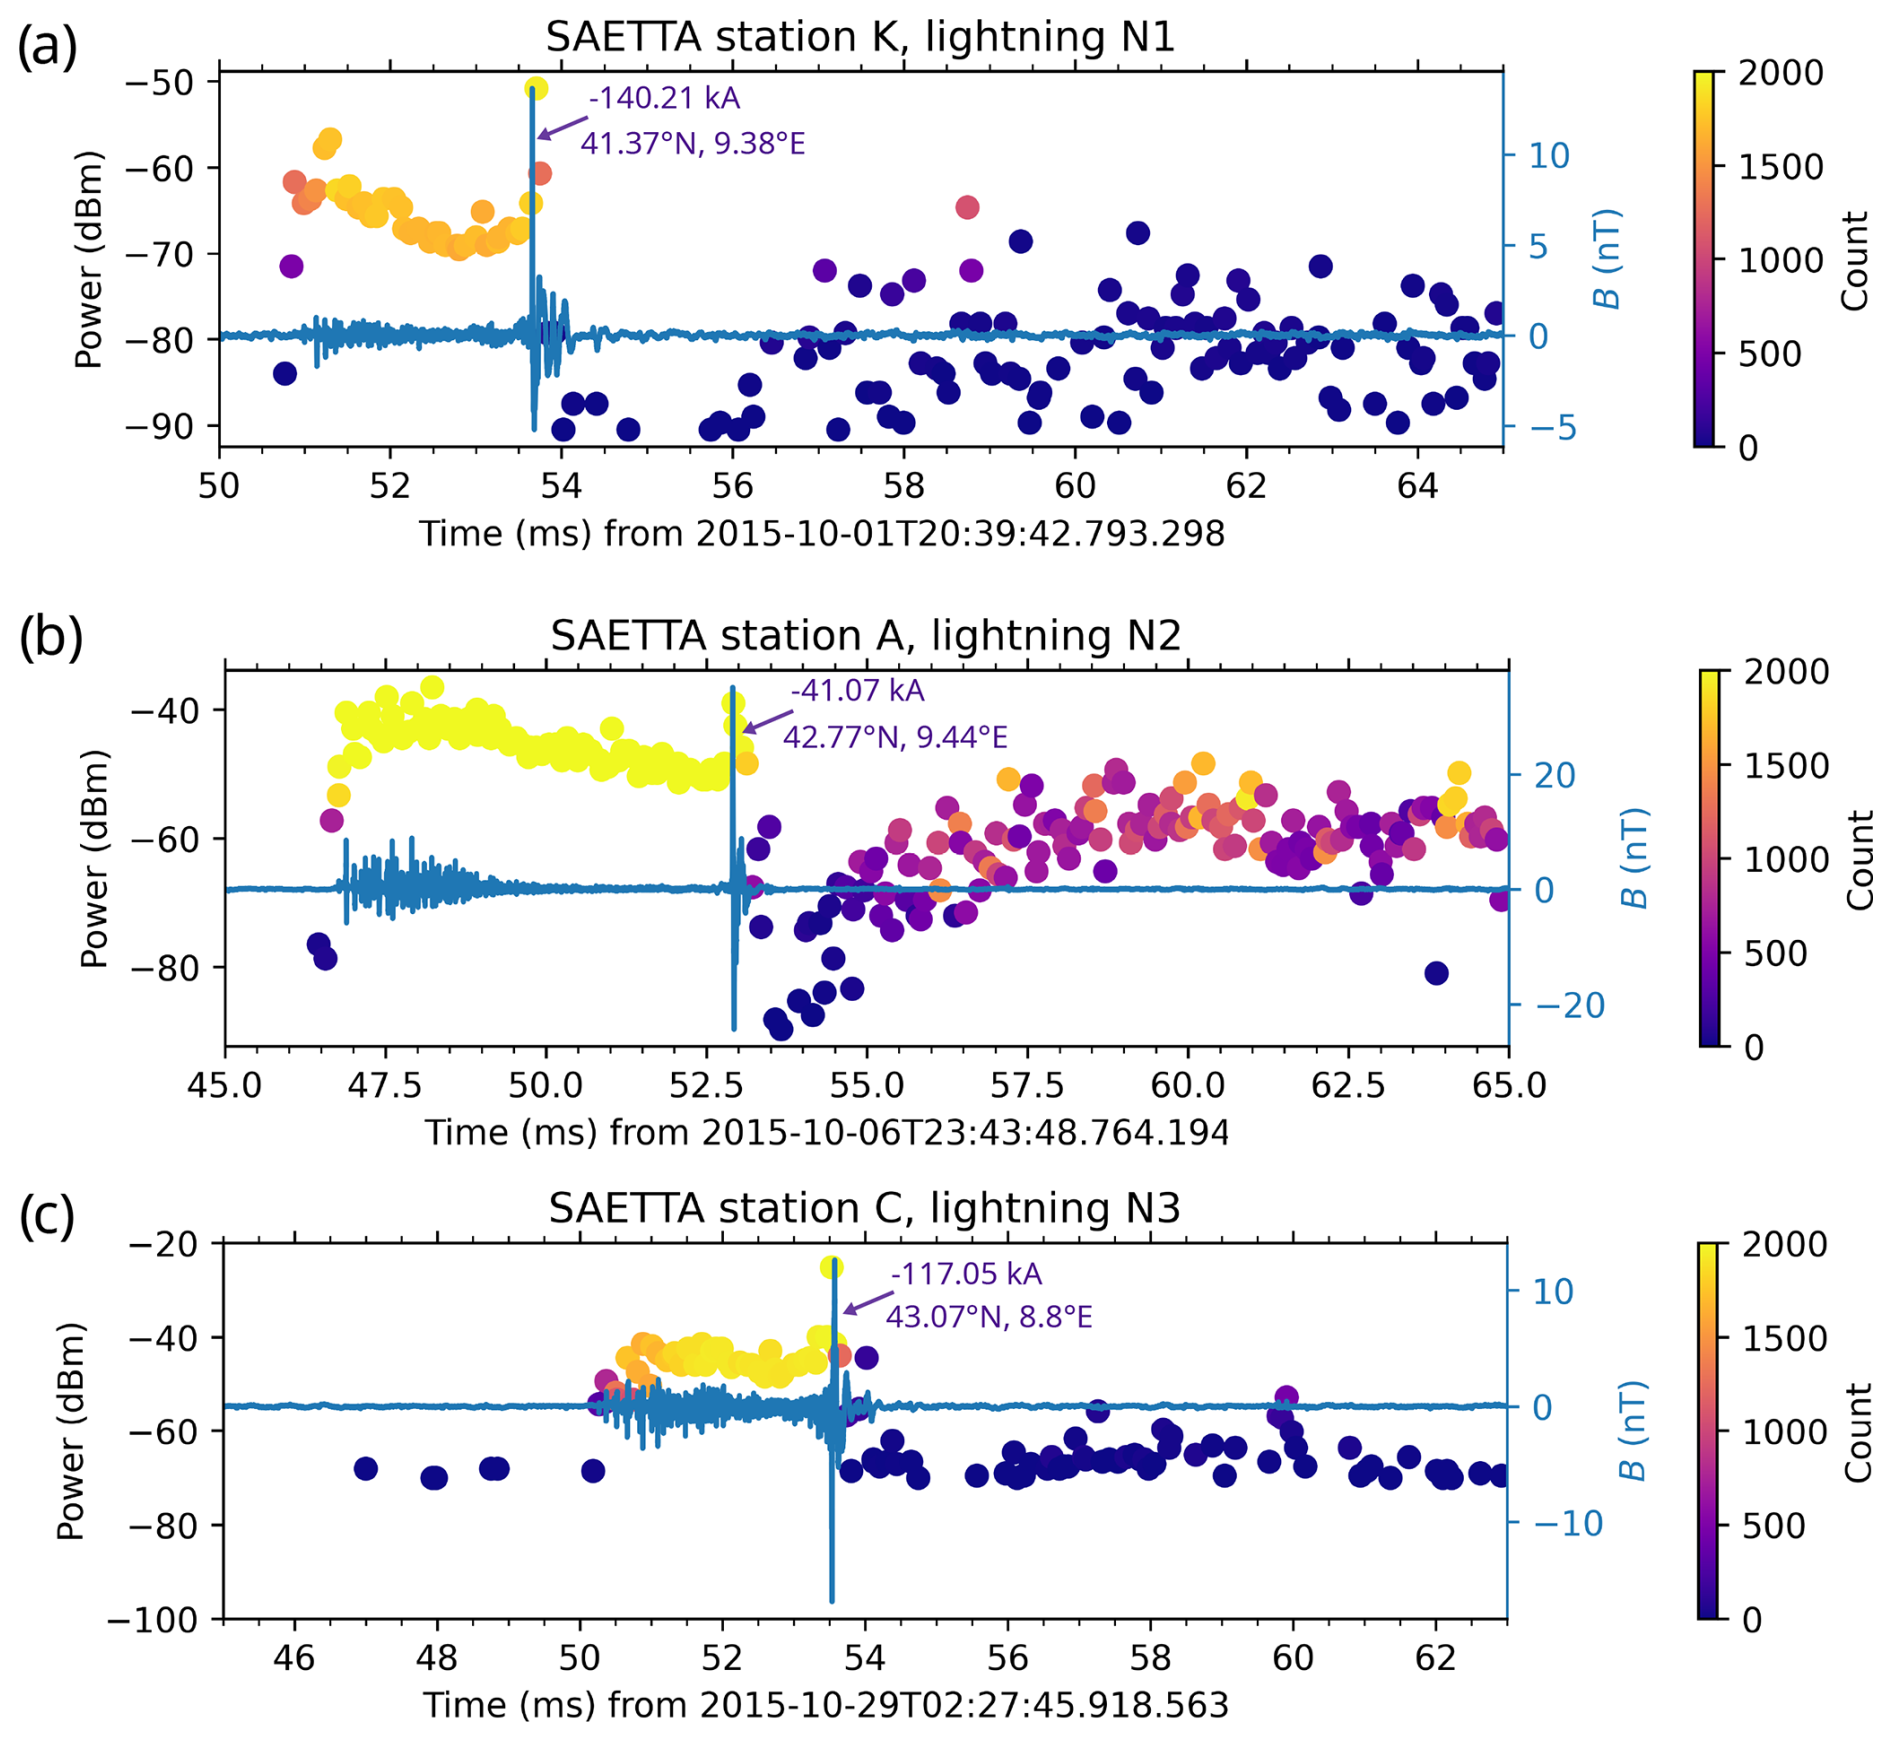
Figure 2Time evolution of the magnetic field as sensed by SLAVIA (blue waveforms) and VHF radiation amplitude measured at one LMA station around the time of the first RS of three different −CG flashes. The colours of the dots (dark-blue–red–yellow colour scale) are proportional to the VHF radiation rate expressed in counts per 80 µs LMA time window. The geo-locations and peak current, as reported by METEORAGE, are indicated at the time of each RS. The first RS distance from the SLAVIA sensor is shown for (a) lightning N1, 177.6 km; (b) lightning N2, 21.9 km; and (c) lightning N3, 48.7 km.
Examples of three −CG strokes detected by the SLAVIA sensor and the sources of VHF radiation detected by one of the LMA stations closest to the RS strike point (as reported by METEORAGE) are plotted in Fig. 2 as typical representatives of the observed behaviour. Each point marker symbolizes the strongest VHF source detected by a selected LMA station within an 80 µs LMA time interval. The colour of the marker corresponds to the VHF radiation rate detected within this specific time window. Each panel in Fig. 2 represents the early stage of one selected −CG flash, along with information about its RS peak current and the location of the RS strike point, as reported by METEORAGE. Lightning N2 plotted in Fig. 2b is a single-stroke flash, whereas lightning N1 (Fig. 2a) and N3 (Fig. 2b) are multi-stroke flashes with one subsequent RS and two subsequent RSs, respectively. The first RS strokes are highlighted in Fig. 1a, while their distances from the SLAVIA sensor are indicated in the caption of Fig. 2. The panels consistently show visible PB pulses followed by the RS pulse, as captured by the SLAVIA sensor (blue waveform). Across all three flashes shown in Fig. 2, there is a significant sudden increase in the VHF radiation rate and the power of VHF radiation sources coinciding (within 250 µs) with the onset of the broadband PB pulses. This phenomenon serves as a reliable indicator of flash initiation (Kolmašová et al., 2018), as there is either an absence or a minimal presence of VHF radiation (typically perceived as environmental noise) prior to the PB pulses (Fig. 2). At the time of the RS peak, both the VHF radiation rate and power of detected VHF sources exhibit a peak followed by a rapid decrease. In these examples, the decrease is nearly immediate, with fewer than 500 detections within the 80 µs LMA time interval. This observed behaviour is consistent across 59 −CG flashes. Furthermore, it is noteworthy that, in the time span from the lightning initiation to the occurrence of the first RS in lightning flashes N2 and N3 (Fig. 2b and c), the VHF radiation rate reaches its maximum (2000 counts at 80 µs) at the closest LMA station, meaning that every sample obtained with a cadence of 40 ns exceeded the threshold, revealing that there is almost continuous impulsive VHF radiation mainly from downward, negative stepped leaders.
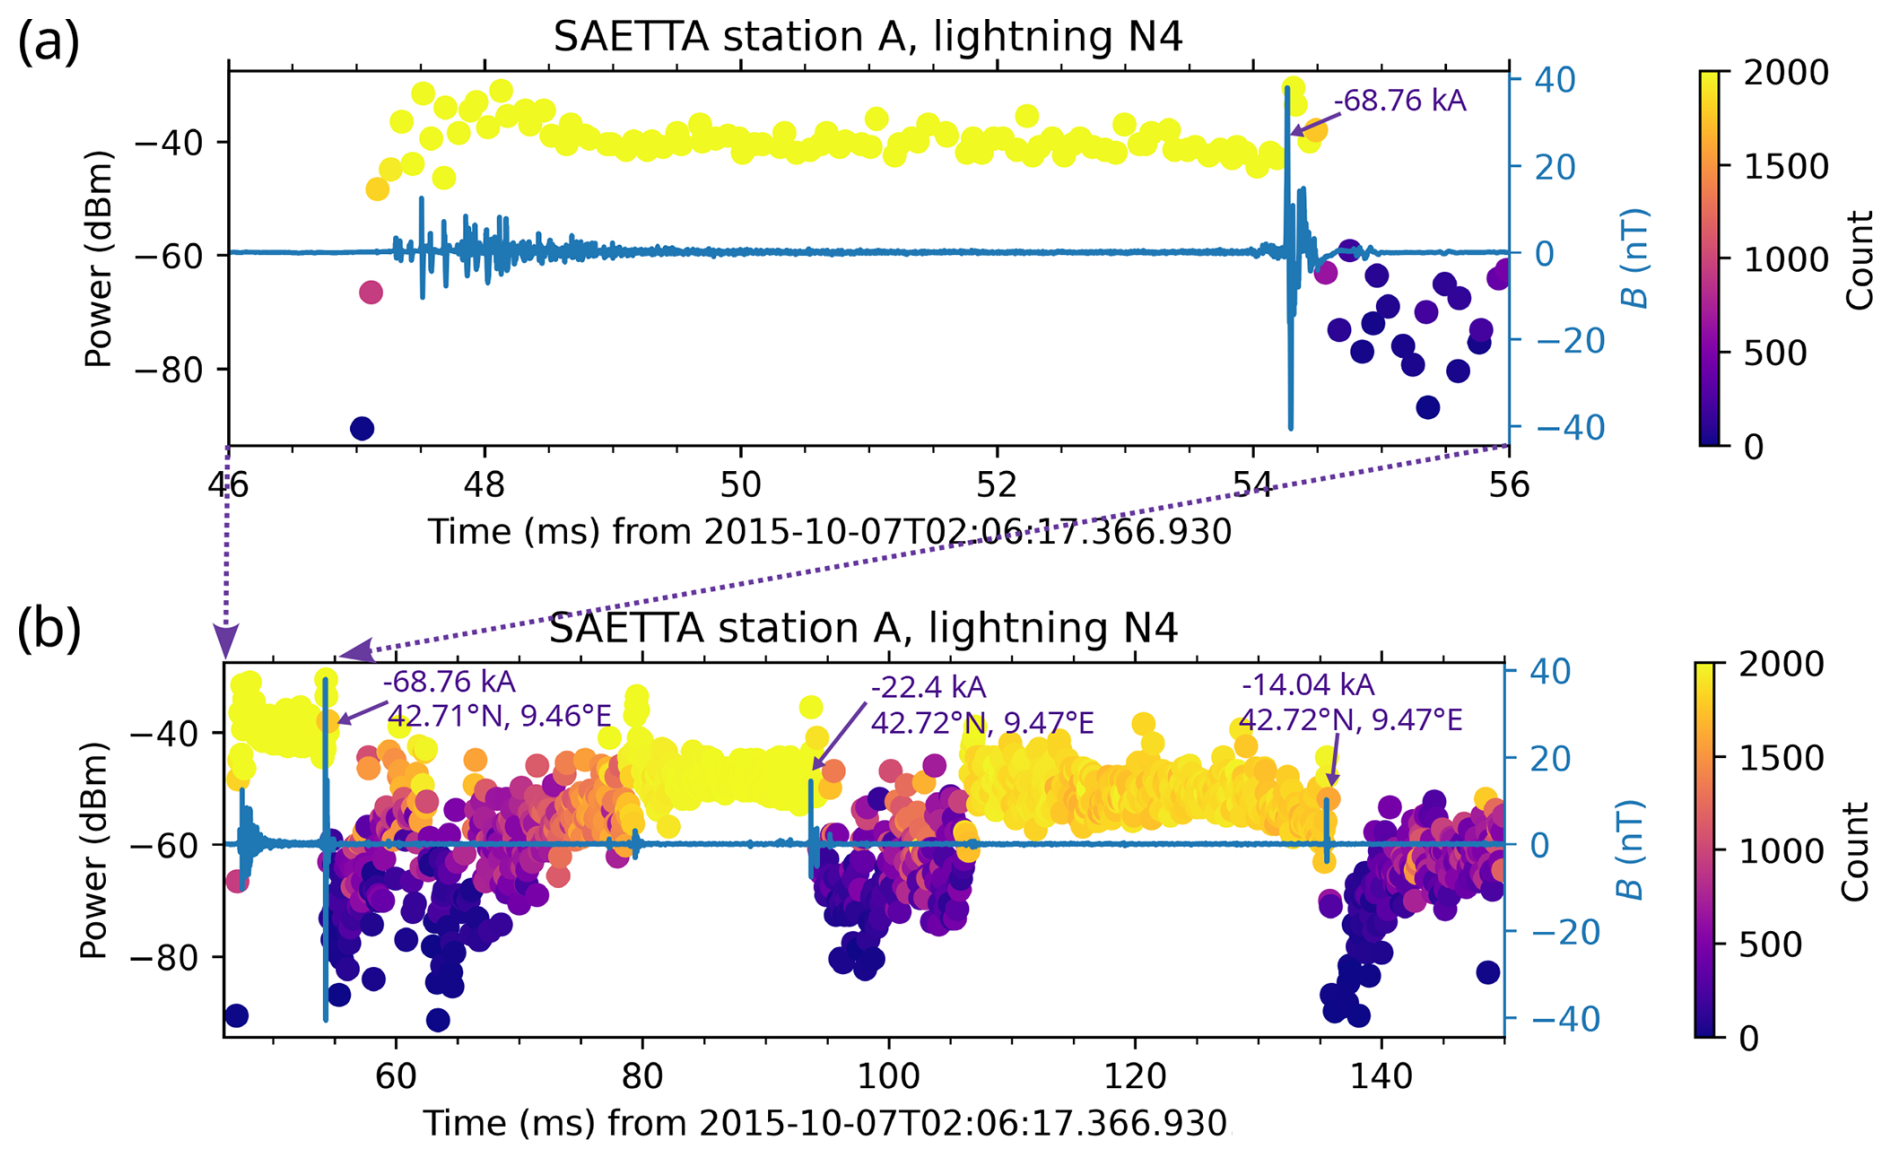
Figure 3Same as Fig. 2 but for a multi-stroke −CG flash as shown during (a) the early stage of the flash, with the PB pulses and the first RS, and (b) the whole flash as detected by SLAVIA and METEORAGE. The distance from the SLAVIA sensor is shown for (a) the first RS, 28.9 km; (b) the second (first subsequent) RS, 28.3 km; and (c) the third (second subsequent) RS, 28.3 km.
In flashes containing multiple RSs, we observed a significant increase in both the power and count of VHF radiation preceding subsequent RSs, lasting for durations ranging from a few milliseconds to several tens of milliseconds. Figure 3 shows a typical example of a −CG flash with several RSs clearly captured by both SLAVIA and LMA. Figure 3a shows the detail of PB pulses and the first RS. Analogous to the examples portrayed in Fig. 2, there is a sudden increase in both the counts and power of VHF radiation sources coinciding with the initiation of PB pulses. Furthermore, a local peak in the power of detected VHF sources is evident at the time of the first RS, followed by a rapid decrease in the VHF radiation rate to below 500 sources. Figure 3b illustrates the entire flash with two additional subsequent RSs (no other RSs were visible in the 208 ms long SLAVIA waveform, nor were further RSs detected by METEORAGE). Notably, there is a significant increase in the VHF radiation rate and power of VHF sources detected by the closest LMA station A approximately 15 ms prior to the magnetic field pulse emitted by the first subsequent negative RS (of −22.4 kA). During this interval, the number of counts within each 80 µs time interval reached nearly 2000, a trend sustained until the occurrence of the subsequent RS pulse peak. At the time of the first subsequent RS, a peak in VHF source power is noticeable again, followed by a rapid decrease in both the VHF radiation rate and power. Later on, approximately 28 ms prior to the second subsequent RS pulse, another increase in VHF radiation rate and power is observed, persisting until the occurrence of the second subsequent RS. After the second subsequent RS, there is once again a decline in VHF radiation as recorded by the closest LMA station.
4.1.2 Anomalous cases with strong VHF radiation after an RS
In our observations, a deviation from the typical VHF radiation pattern was identified in seven −CG flashes. In these cases, intense VHF radiation lasted for more than 2 ms after the wideband RS pulse peak. Among these seven −CG flashes, in six cases, the amplitude of the largest PB pulse peak exceeded the amplitude of the RS pulse peak – indicating a strong, lower positive charge region in the thundercloud, potentially weakening the RS (Nag and Rakov, 2009; Iudin et al., 2017; Tan et al., 2018; Kolmašová et al., 2020). In addition, in three of these six cases, noticeable IC pulses were observed in the SLAVIA waveforms immediately following the RS pulse peak. In one of these cases, a relatively strong pulse appeared among these IC pulses. According to METEORAGE, this pulse was emitted by a negative RS stroke; nevertheless, the pulse did not exhibit a typical RS shape, and we consider it to be a pulse belonging to an IC discharge. In the other three cases, increased electromagnetic activity was evident in the raw SLAVIA data, signifying IC activity at higher frequencies. In the remaining one anomalous −CG flash, where the amplitude of the largest PB pulse peak did not exceed that of the RS pulse peak, increased electromagnetic activity was observed in the raw SLAVIA data.
As an example, Fig. 4 shows a −CG flash exhibiting VHF radiation characteristics divergent from the typical pattern observed in the 59 −CG flashes analysed in this study. In Fig. 4a, the SLAVIA magnetic field waveform is depicted alongside the VHF radiation sources detected by the LMA station closest to the RS strike point, station A. The peak amplitude of the largest PB pulse peak exceeds that of the RS pulse. Consistent with the observed pattern in other −CG flashes, increases in both the VHF radiation rate and the power of VHF radiation sources are observed concurrently with the onset of PB pulses. While a local peak in VHF source power is observed at the time of the RS pulse peak, there is no significant decrease in the VHF radiation rate or the VHF source power after the RS. The increased radiation persists until the end of the SLAVIA waveform capture (for over 150 ms after the RS pulse), accompanied by visible IC activity in the SLAVIA waveform, seen as a sequence of irregular pulses. Notably, no subsequent RSs were identified in the SLAVIA data nor reported by METEORAGE for this flash. Figure 4b presents the flash alongside all 3D-located VHF sources provided by the LMA (depicted as coloured dots) during the same 35 ms period. Despite continuous impulsive VHF radiation detected at LMA station A and VHF radiation detected at five other stations (although not continuous) during the 25 ms post-RS interval, only six VHF sources were reconstructed in 3D, whereas no 3D-located sources were reconstructed prior to the RS.
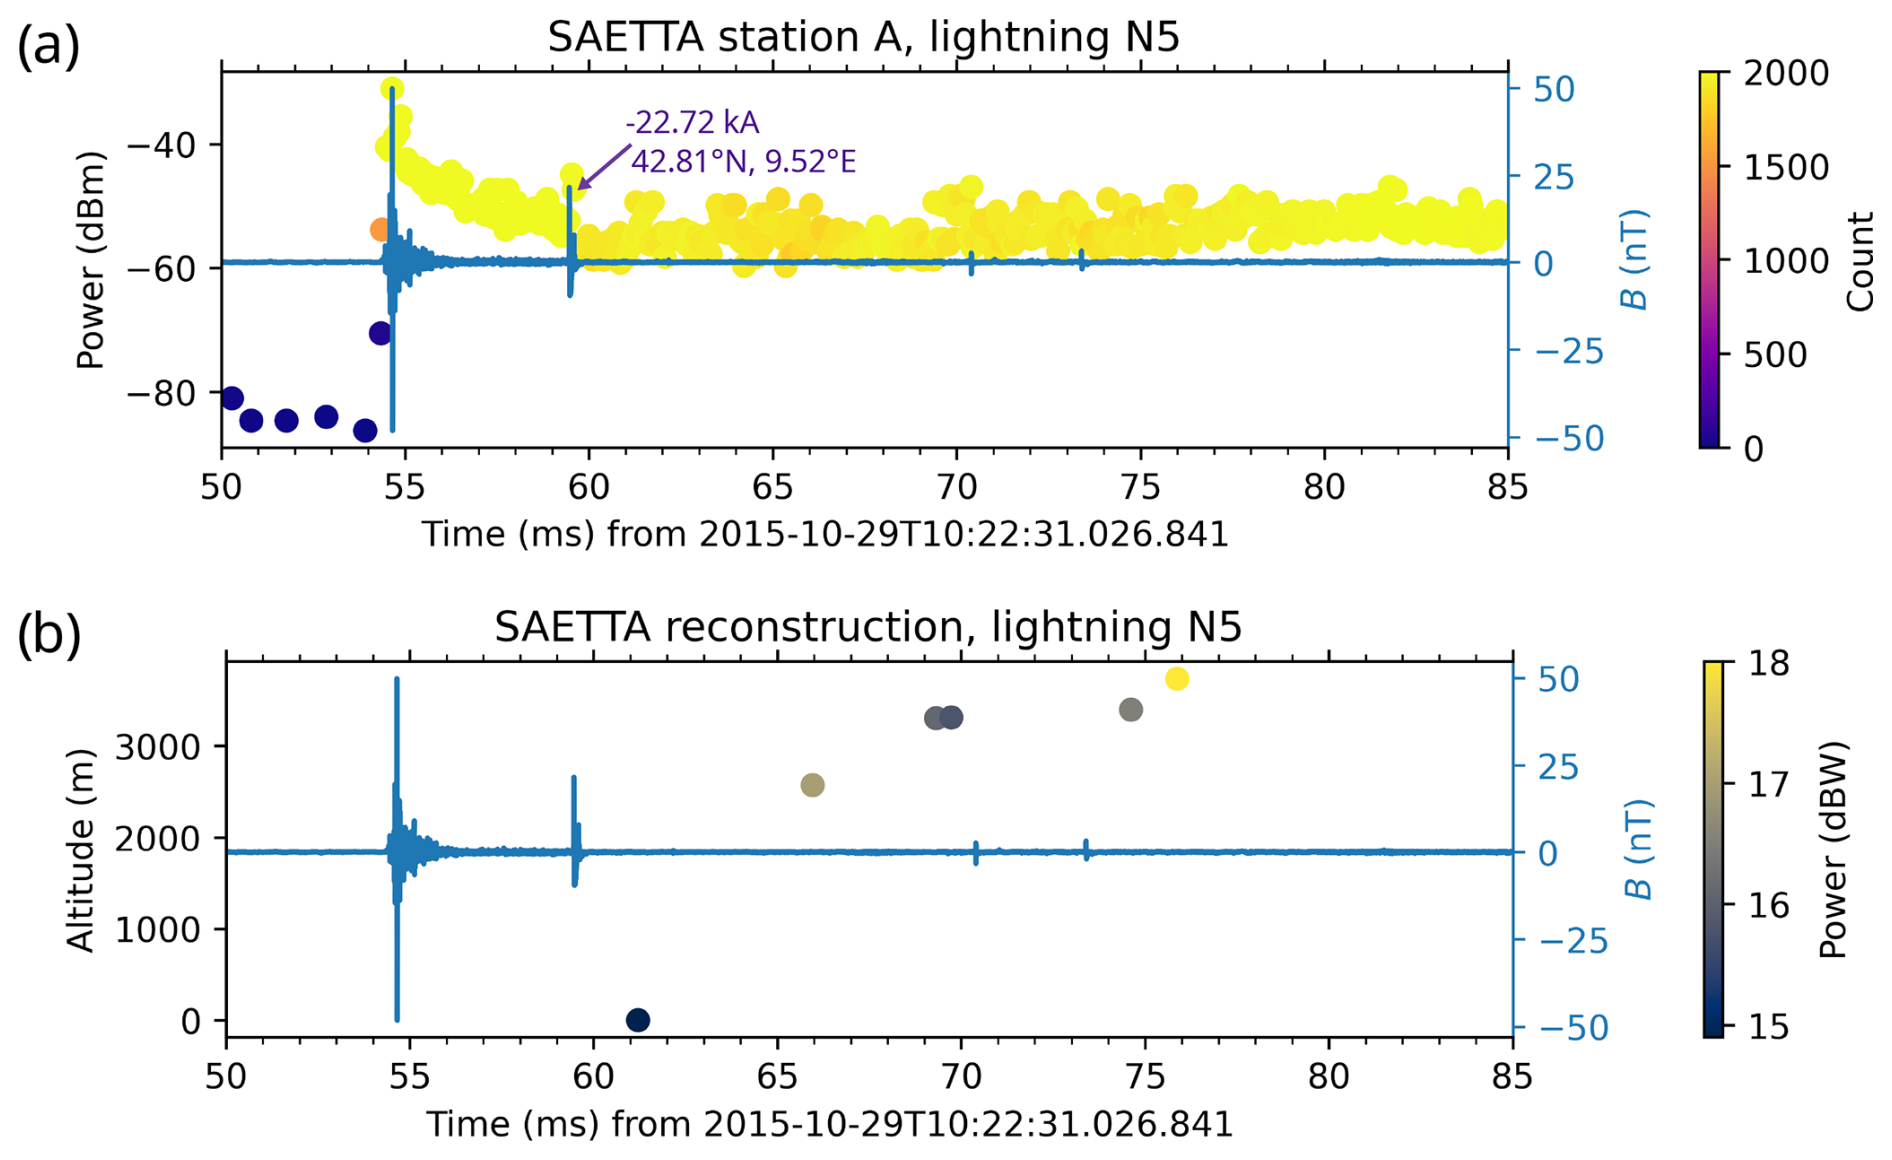
Figure 4Panel (a) is the same as Fig. 2. Panel (b) shows a time–altitude plot of the VHF sources reconstructed during the same 35 ms period. The colours of the dots (dark-blue–red–yellow colour scale) are proportional to the VHF radiation power measured per 80 µs LMA time window. The first RS distance from the SLAVIA sensor is 20.9 km.
The absence of 3D-located sources during periods of high VHF radiation rates detected by individual LMA stations is a common characteristic observed across all analysed flashes. Due to the lack of 3D-located sources, precise tracking of the spatial development of the flash becomes nearly impossible, thereby preventing the accurate determination of the locations of IC channels emitting radiation in the time after the RS, which is similar to the findings of Kolmašová et al. (2018) in their study of pre-stroke processes.
4.2 Positive (+CG) flashes
In the LMA records of all 26 analysed +CG flashes, an increase in VHF radiation was detected following the RS pulse, as illustrated in the selected examples shown in Fig. 5. Specifically, the VHF power consistently reached its local peak within 1–34 µs after the wideband RS pulse peak. The mean and median values of the VHF power peaks recorded by nearest LMA stations were –32.6 and –31.6 dBm, respectively. Subsequently, strong VHF radiation with respect to both counts and power persisted for tens to hundreds of milliseconds and was then followed by a slow decrease. The occurrence of strong VHF radiation implies a rapid stepwise expansion of in-cloud lightning channels in the aftermath of the first RS pulse.
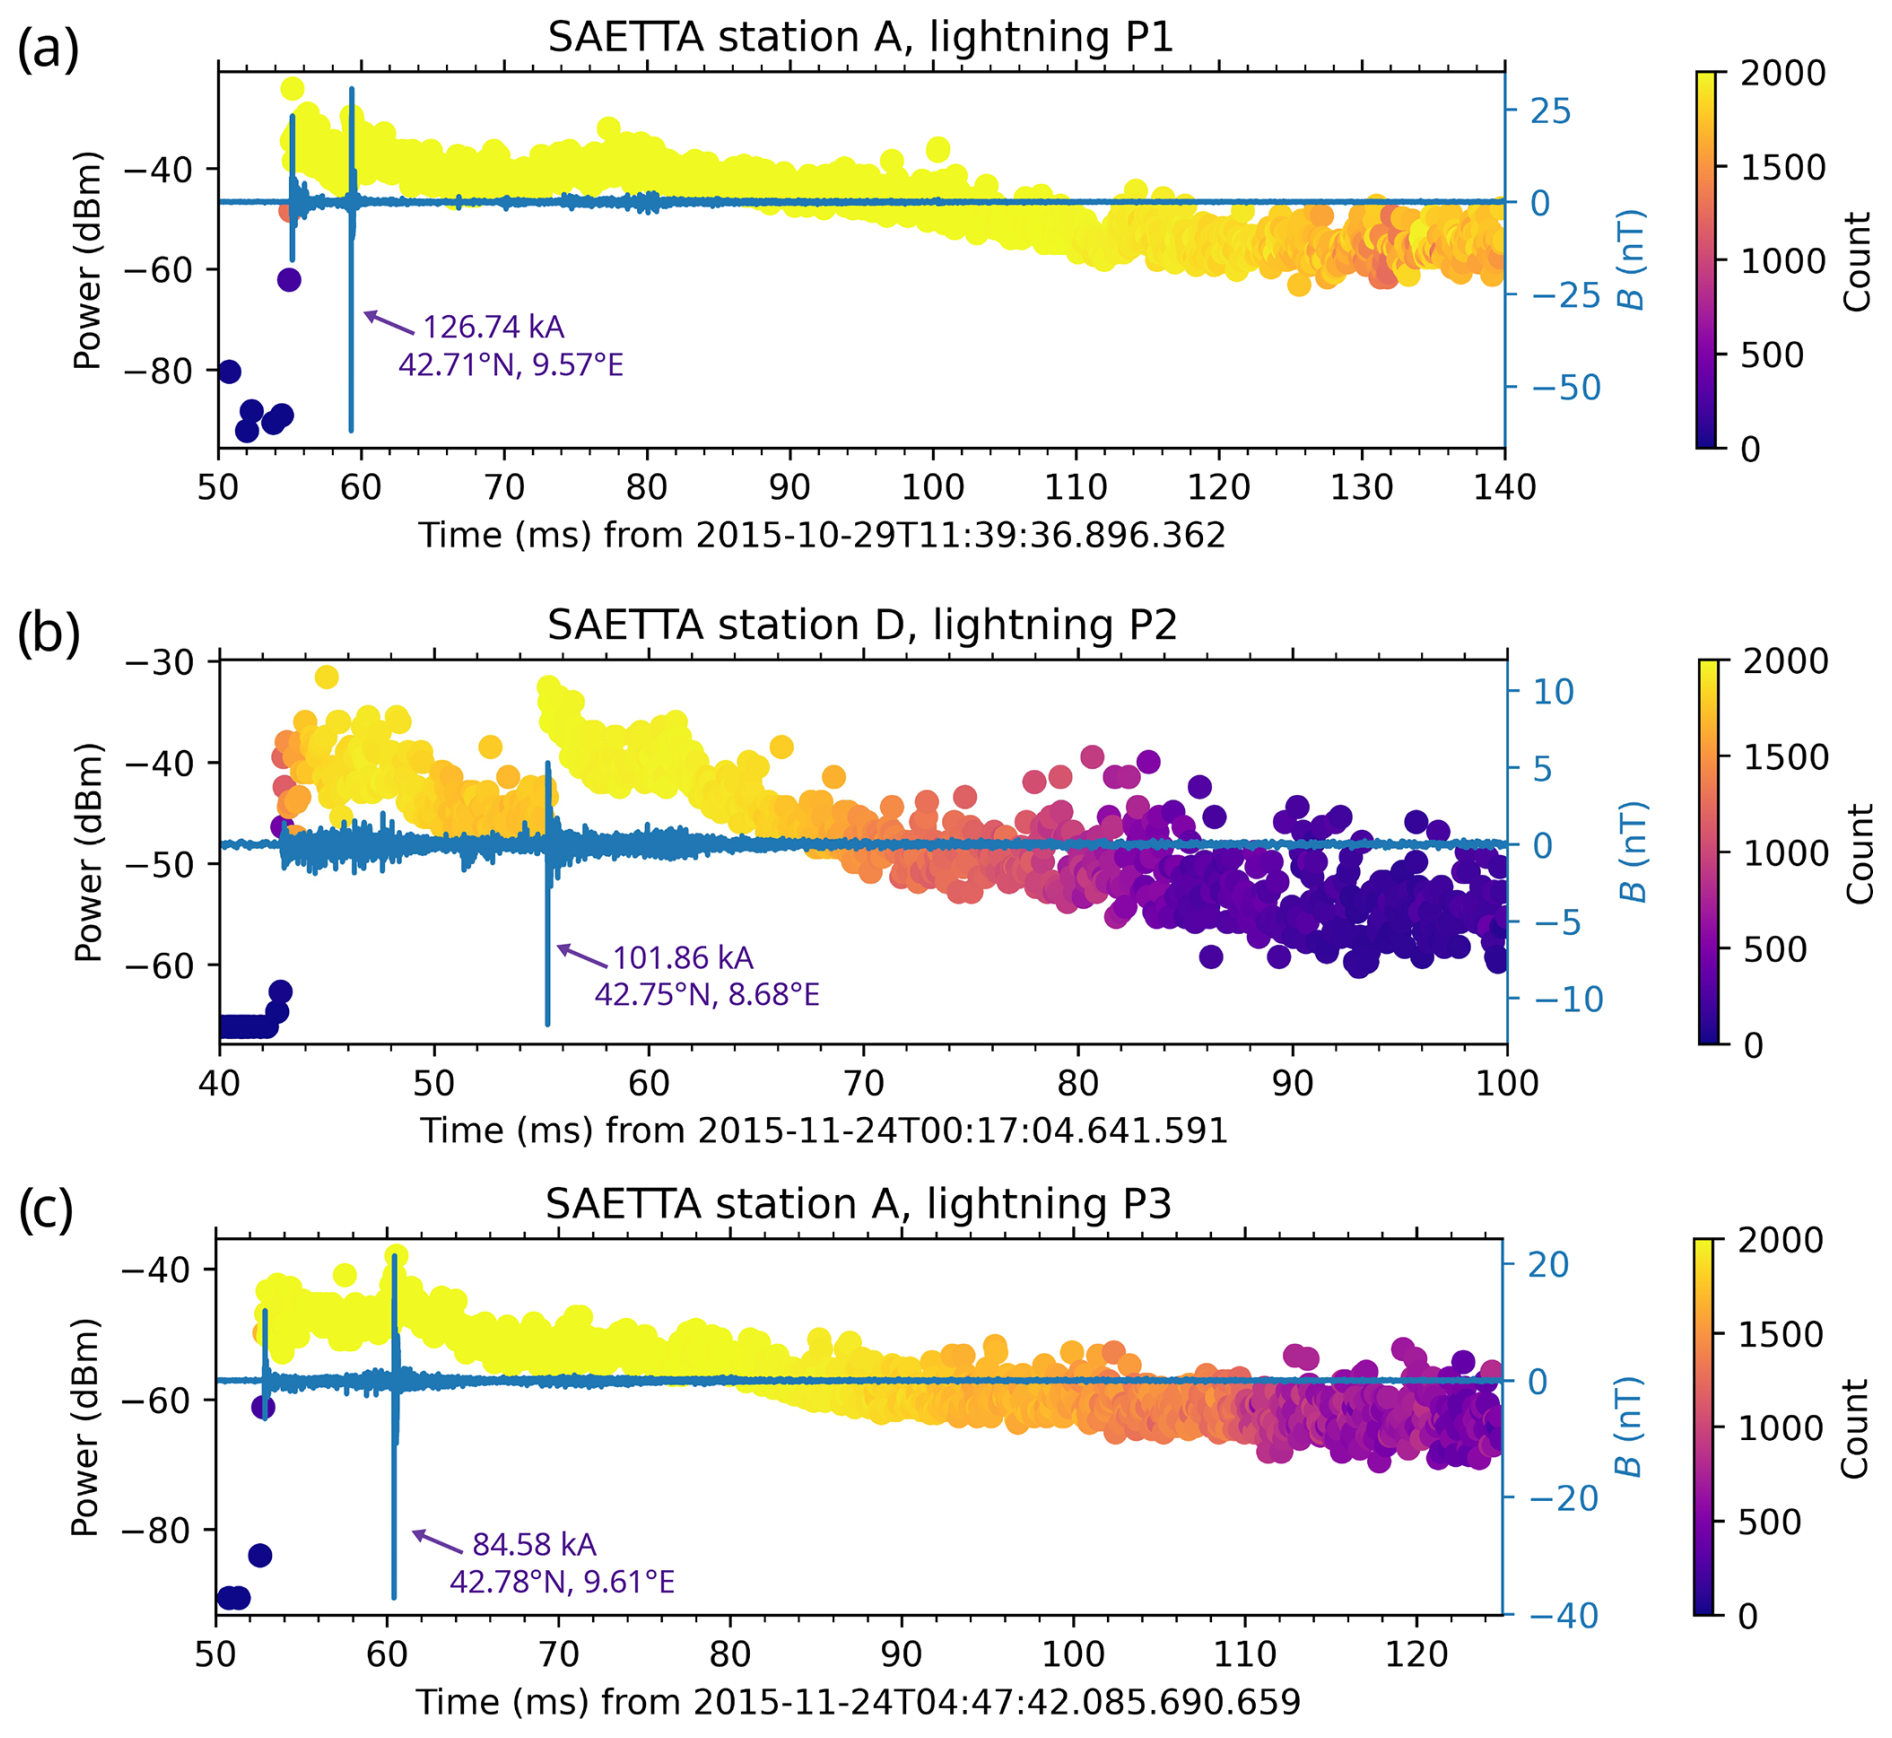
Figure 5Same as Fig. 2 but for three different +CG flashes. The RS distance from the SLAVIA sensor is shown for (a) lightning P1, 32.2 km; (b) lightning P2, 61.4 km; and (c) lightning P3, 27.9 km.
As an example (and similarly to Fig. 2), each panel of Fig. 5 shows one single-stroke +CG flash with its RS peak current and the location of RS strike point. All panels show visible PB pulses followed by the RS pulse, as detected by the SLAVIA sensor (blue waveform). Analogous to the −CG flashes illustrated in Figs. 2, 3 and 4, each +CG flash in Fig. 5 exhibits an abrupt increase in both the counts and power of VHF radiation sources coinciding with the beginning of PB pulses. This pattern is consistent across all studied −CG and +CG flashes, signifying the initiation of the flash, while negligible or weak VHF radiation, often identified as noise, is observed prior to the PB pulses. Additionally, a local peak in the power of detected VHF sources is observed at the time of the RS peak, a characteristic also shared by all analysed −CG and +CG flashes.
Contrary to the behaviour observed in −CG flashes (see Fig. 2), all +CG flashes depicted in Fig. 5 exhibit robust VHF radiation (with respect to both counts and power) following the RS. For instance, in the +CG flash depicted in Fig. 5a, the maximum count of 2000 VHF sources, which only slowly decreased to 1500 counts, endured for over 60 ms after the RS. Similarly, this phenomenon persisted for 10 ms in the flash depicted in Fig. 5b, whereas it endured for more than 30 ms in the case of the flash shown in Fig. 5c. This indicates nearly continuous impulsive VHF radiation following the RS. The slow decrease in the power and counts of VHF radiation sources detected by individual LMA stations continued afterwards.
We were not able to track the detailed spatial propagation of the studied flashes, as SAETTA provides only a limited number of 3D-located sources, especially during the stages of high VHF radiation. For the flash depicted in Fig. 5a (lightning flash P1), SAETTA did not provide any 3D-located sources throughout the entirety of the high VHF radiation phase. However, for the flashes depicted in Fig. 5b and c (lightning flashes P2 and P3, respectively), SAETTA successfully located 20 and 32 respective VHF sources (not shown in Fig. 5) from the initiation of the flash until the end of the strong VHF radiation phase (when counts decreased to 1500 in the 80 µs LMA time interval).
In Fig. 6, we present the 3D-located VHF sources during the high VHF radiation phase for lightning flash P3, illustrated in Fig. 5c. Figure 6a shows the SLAVIA magnetic field waveform and the time evolution of the altitude of the reconstructed VHF sources, colour-coded by time. Figure 6b and c show the spatial evolution of the flash as well as the rainfall data. The 5 min rainfall data emanate from the Météo-France radar 5 min precipitation amount composite (https://doi.org/10.25326/357, French national center for Atmospheric data and services AERIS, 2023). The RS was detected 180 s after the start of the 5 min radar time window.
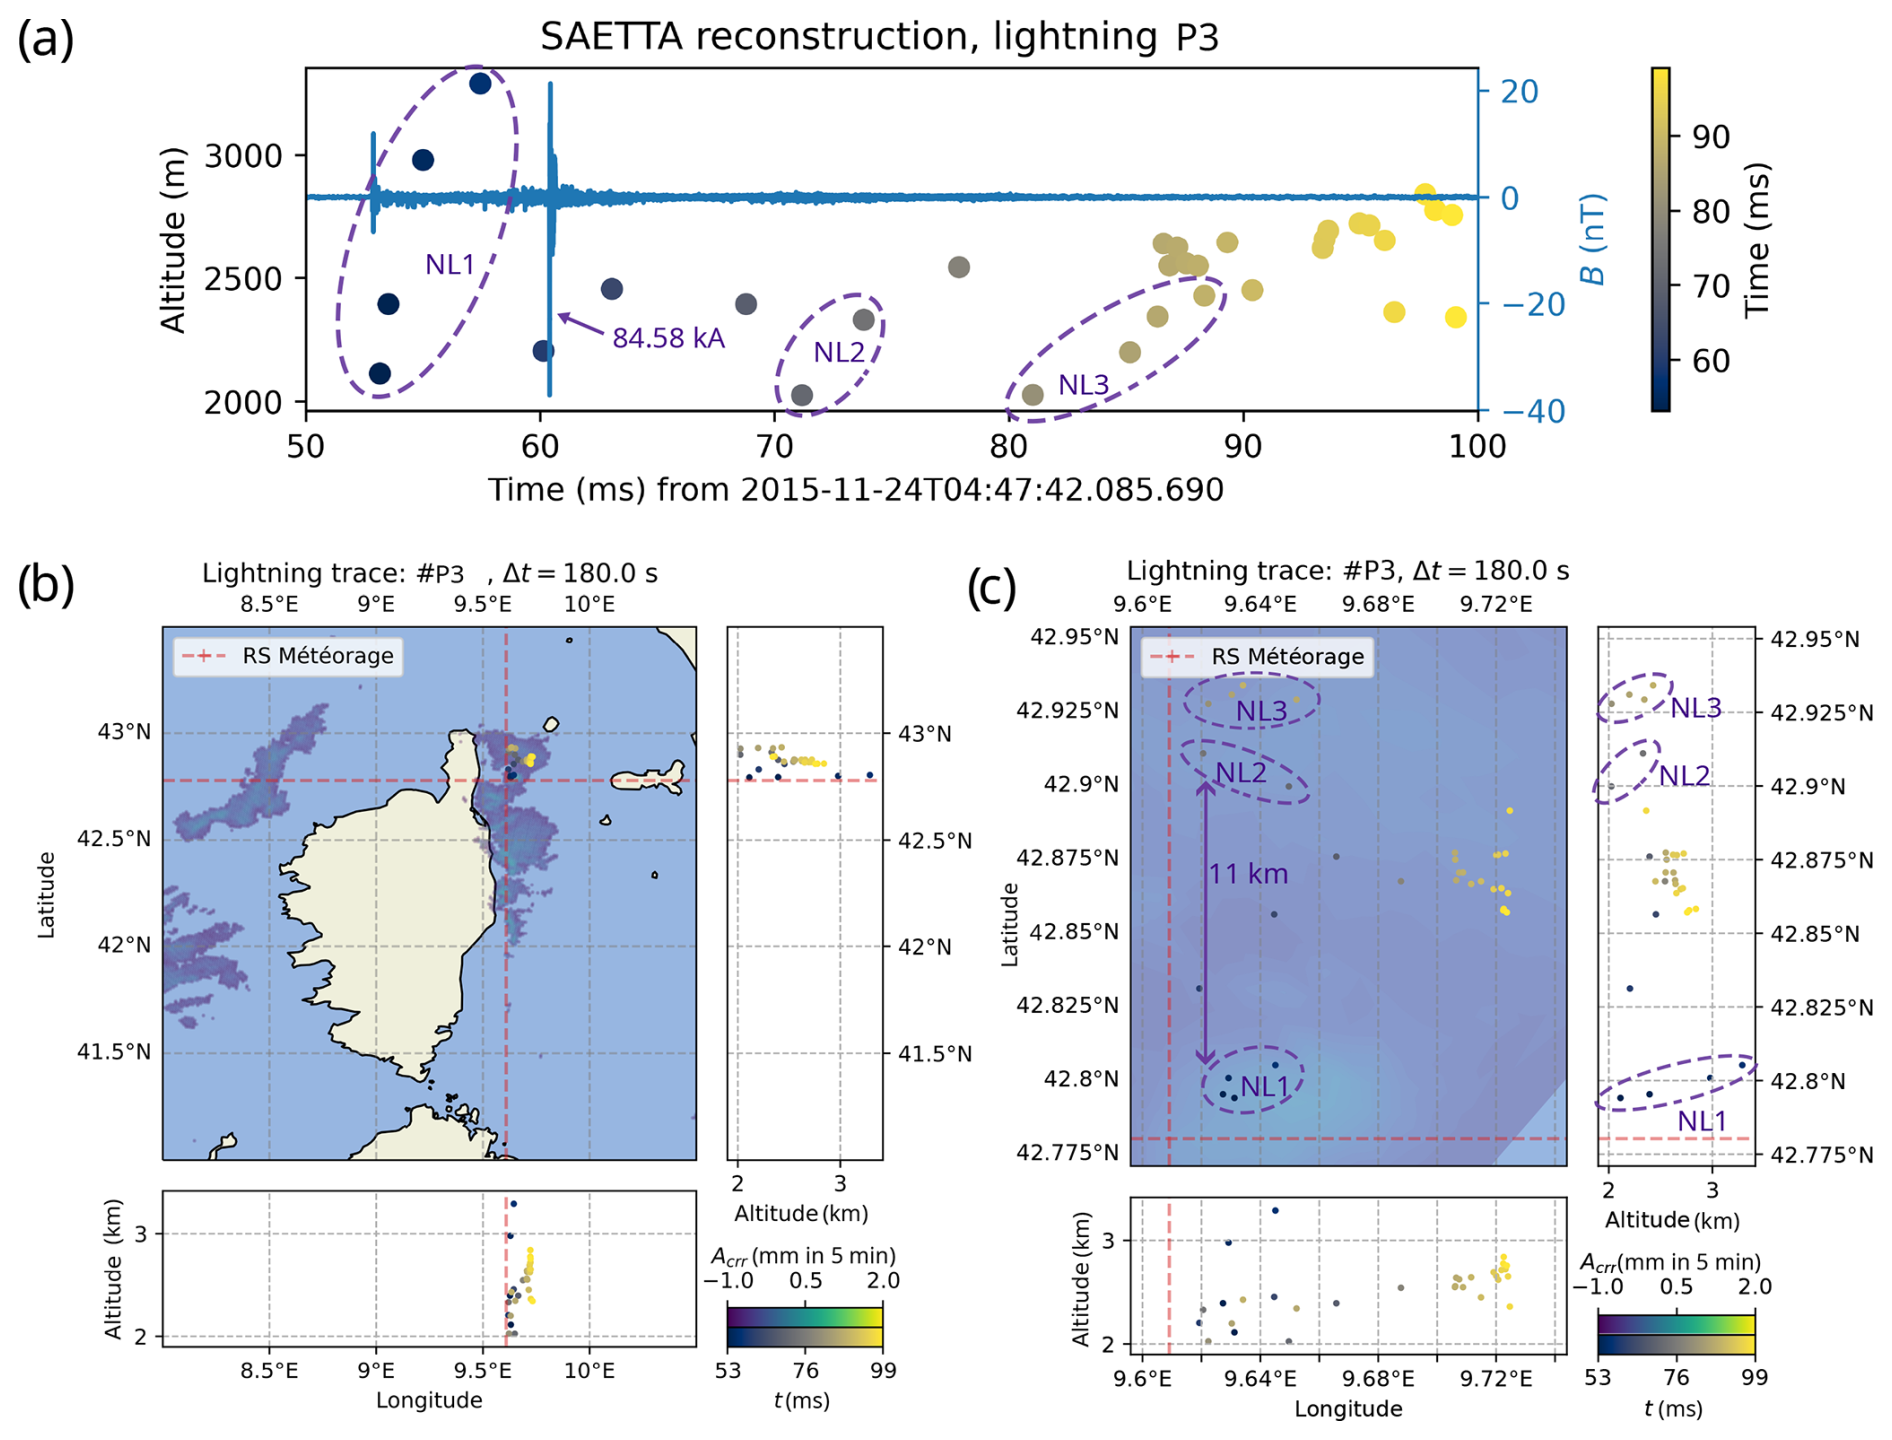
Figure 6The +CG flash from Fig. 5c (lightning flash P3) detected by the SLAVIA sensor (blue waveforms) with the 3D-located VHF radiation sources, provided by SAETTA (dots on the black–yellow colour scale): (a) time–altitude development; (b) map of Corsica island with the rainfall radar data as well as the 3D-located VHF sources and the 2D location of the RS strike point; and (c) a close-up view of the 3D-located VHF sources with the rainfall data.
As seen in Fig. 6, the VHF sources were reconstructed at rather low altitude (between 2 and 3 km). An upward development is observed during the PB stage (designated as segment NL1), suggestive of an upward-moving negative leader. Afterwards, following the RS, multiple sources are detected at lower altitudes (ranging from 2 to 2.5 km), with two distinct upward-moving groups of VHF sources (designated as segments NL2 and NL3), originating around the altitude of lightning initiation. Notably, as seen on the close-up map in Fig. 6c, groups NL2 and NL3 are situated approximately 11 km away from the point of lightning initiation. Analysis of the 3D distribution of the VHF sources during the 4 min prior to the studied flash, also including the studied flash, mainly revealed that lightning branches quickly propagated horizontally at a height of 2.5 km within a rather extended 15 km × 15 km cloud region reaching about 11 km distance from the lightning initiation. Even though VHF radiation was detected by seven stations (five of them detected almost continuous impulsive VHF radiation), information regarding the flash's development after the RS is unavailable. These leaders probably emitted such strong VHF radiation, as evidenced in Fig. 5c, that it potentially overwhelmed SAETTA's 3D-reconstruction capabilities. It is important to acknowledge that accurate tracking of the flash development using SAETTA data is hindered by the insufficient number of 3D-located VHF sources. From Figs. 6b and c, it is also evident that the flash occurred within one of the areas of higher accumulated precipitation, which is a typical observation for all of the studied flashes.
We analysed 26 +CG and 66 −CG flashes, focusing on the properties of VHF radiation just after their first RS. We found distinct behavioural patterns depending on the flash polarity: we observed a rapid decrease in the VHF source counts and VHF power immediately after the RS pulse peak in 59 (89 %) of −CG flashes, while we observed strong VHF radiation lasting tens to hundreds of milliseconds after the wideband RS pulse peak in all inspected +CG flashes.
Based on our experimental evidence and current understanding of characteristics of CG flashes, we can conclude the following:
- a.
Strong VHF activity after the RS in +CG flashes shows that the negative component of the bidirectional leader is recharged and that the negative in-cloud leaders propagate in stepped manner within the positive charge region. Our findings support the conclusion of Lapierre et al. (2017), who found that, in +CG flashes, the RS triggers an immediate and significant growth of negative leaders in the cloud. This behaviour is schematically depicted in Fig. 7 (blue discharges, flash b).
- b1.
For −CG flashes, the situation is reversed; the in-cloud part of the bidirectional leader that gets recharged is the positive leader (see Fig. 7 – red discharge, flash a). The in-cloud positive leaders propagate within the negative charge centre, with smooth, continuous VHF emission from their leader tips, which is hardly mapped in detail by LMA (Lapierre et al., 2014), although it can be detected by interferometers in some cases (Pu et al., 2021; Stock et al., 2023). However, as the positive leaders advance, they emit weak but impulsive radiation known as “needle” emissions, which LMAs and interferometers can mostly detect and map (Hare et al., 2019, 2021; Pu and Cummer, 2019; Edens et al., 2012; Van der Velde and Montanyà, 2013). Unfortunately, due to SAETTA's limitations (the Corsica mountainous relief and the availability of LMA stations for the analysed days), we lack sufficient 3D data on in-cloud leader propagation. This prevents us from clearly distinguishing between radiation from negative in-cloud leaders and needle activity from positive in-cloud leaders. Data from individual stations across the 59 −CG flashes in our study showed an absence of VHF radiation immediately following RSs. The absence began within 100–700 µs after the RS and then persisted for at least another 500 µs, often extending to several tens of milliseconds. This further suggests a lack of nearby negative leaders and that even close sensors generally failed to record needle activity from positive leaders during this period.
- b2.
Anomalous cases, in which strong VHF radiation persisted for more than 2 ms after the negative RS pulse peak, can largely be explained by unique conditions associated with these specific flashes. For cases in which the amplitude of the biggest PB pulse peak exceeds that of the RS pulse peak, we suggest the presence of a strong, lower positive change region in the thundercloud, which partially neutralized and, thus, weakened the RS, leaving a part of the originally downward-moving stepped leader to propagate above the lower positive charge region inside the thundercloud (Iudin et al., 2017; Kolmašová et al., 2020, 2022). For one case in which the amplitude of the biggest PB pulse was not larger than the amplitude of the RS pulse and no subsequent RS was detected, however, we observed an increased electromagnetic activity in the raw (non-integrated) SLAVIA data. We can tentatively explain the strong VHF radiation by close IC activity, possibly unrelated to the flash, radiating at higher frequencies than can be seen in the SLAVIA integrated waveforms. However, as no VHF sources were reconstructed in 3D during times of intense VHF radiation, it remains uncertain whether the sustained VHF radiation could indicate significant needle activity from recharged in-cloud positive leaders in some of these anomalous cases. Additionally, using rainfall radar data, we attempted to determine whether the size of the rainfall area is related to the duration of the strong VHF radiation following the negative RSs. Our investigation aimed to identify if larger rainfall areas are associated with prolonged durations of VHF radiation, potentially clarifying the occurrence of the seven anomalous −CG cases displaying robust VHF radiation after the RS. However, our analysis did not reveal any significant connection between these two factors.
The behaviour of positive and negative in-cloud leaders after −CG and +CG RSs differs significantly: in −CGs, the RS potential wave reaching the positive leader tips leads to a recharge of the in-cloud positive leaders without forming new conducting channels (Stock et al., 2017), whereas the RS potential wave in +CGs reaching a negative leader tip tends to produce dramatic channel structuring (Lapierre et al., 2017). The smooth, continuous emission from positive leader tips, although present, is generally not mapped or sometimes even undetectable by the LMA due to its low VHF radiation intensity. The simplified model given in Fig. 7 illustrates the hypothesized post-RS behaviour of +CG and −CG flashes, acknowledging that the actual charge distribution is much more complex and that the number and positioning of charge centres can vary significantly (Stolzenburg and Marshall, 2008).
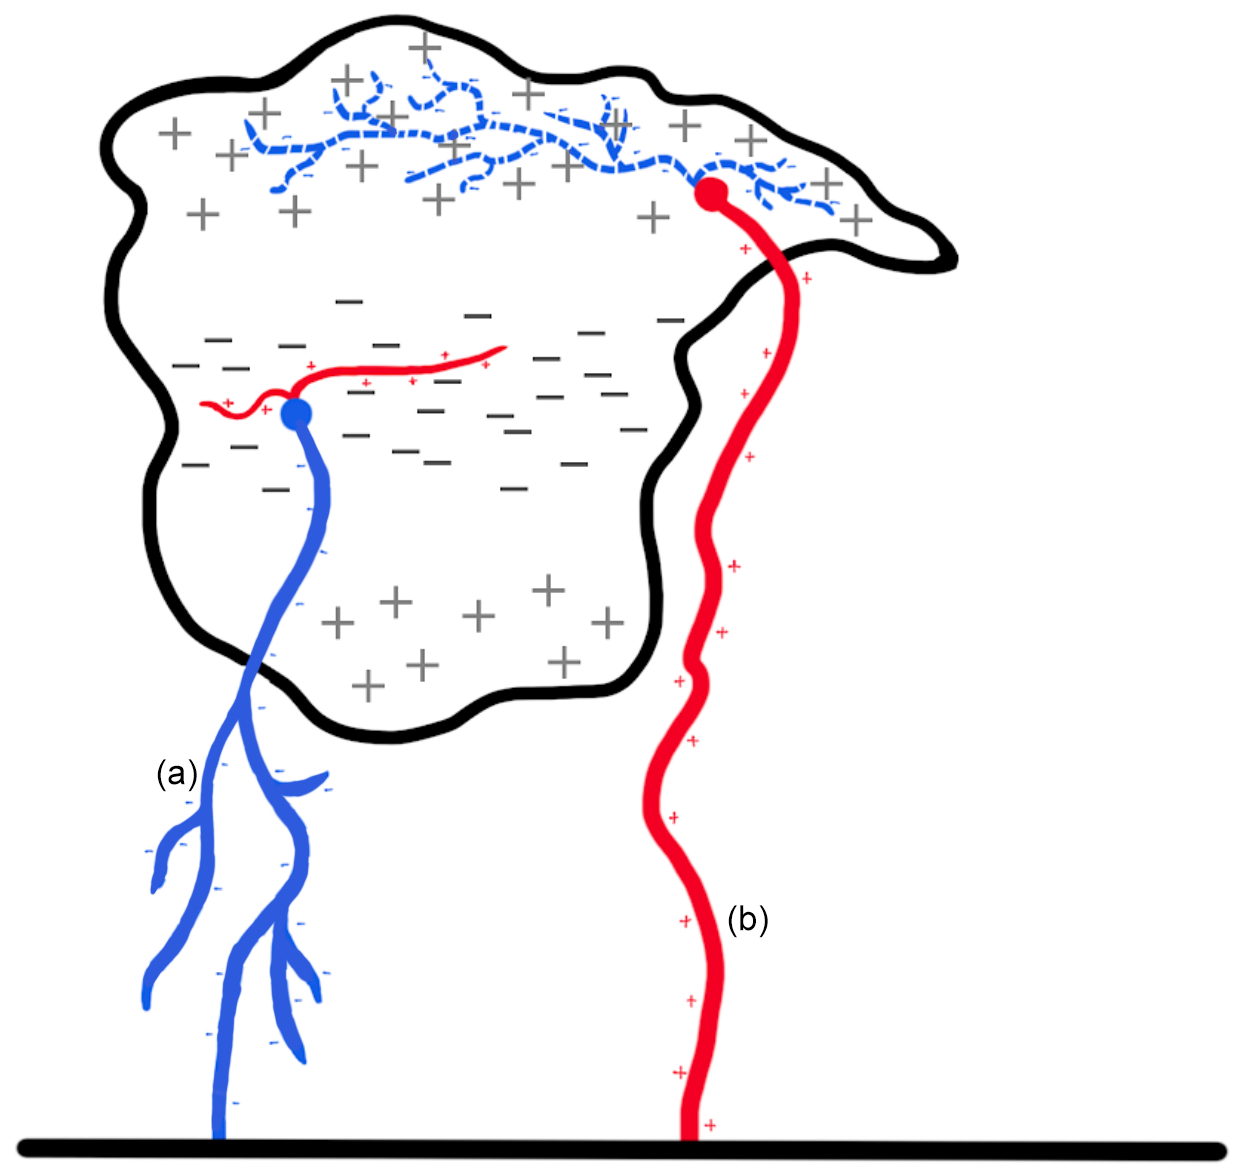
Figure 7Simple illustration of lightning processes close to the first RS: (a) negative RS with positive leaders propagating in cloud; (b) positive RS with negative leaders in cloud.
A similar hypothesis with respect to lightning propagation after an RS was previously indicated by Shao et al. (1999), but it was not investigated in detail. Moreover, Wu et al. (2018, 2022) and Lapierre et al. (2017) suggested an identical physical mechanism behind the +CG flashes studied therein, which aligns with both the hypothesis proposed by Shao et al. (1999) and our own findings. Here, we complement these studies by analysing post-RS VHF processes using a larger data set, with a clear distinction between oppositely charged flashes, using the LMA data from individual stations. Further data, particularly with precise 3D VHF source localization using interferometric data, as demonstrated by Lapierre et al. (2017) or Tang et al. (2023), will be essential to validate the proposed hypothesis. Furthermore, observations from diverse geographic regions with varying lightning/storm climatology and across different seasons are crucial to determine whether this hypothesis applies universally to all +CG and −CG flashes.
SLAVIA and METEORAGE data, including SAETTA data from individual stations, are available from https://doi.org/10.17632/8dr67bw4mz.2 (Kolínská, 2024). The 3D-located SAETTA data containing the time and spatial locations of VHF sources (L1 data) are available from https://doi.org/10.25326/236 (de Guibert and Coquillat, 2021). The rainfall data are available from the Météo-France radar database, maintained by the French national centre for atmospheric data and services (AERIS; https://doi.org/10.25326/357, French national center for Atmospheric data and services AERIS, 2023).
IK and AK designed the study. AK, IK and ED interpreted the results. AK performed the data analysis and wrote the paper. All authors reviewed and edited the manuscript.
The contact author has declared that none of the authors has any competing interests.
Publisher's note: Copernicus Publications remains neutral with regard to jurisdictional claims made in the text, published maps, institutional affiliations, or any other geographical representation in this paper. While Copernicus Publications makes every effort to include appropriate place names, the final responsibility lies with the authors.
The work of Andrea Kolínská was supported by GAUK (grant no. GAUK198223), Ivana Kolmašová and Ondřej Santolík acknowledge support from GACR (grant no.: 23-06430S), and Eric Defer was supported by the CNES SOLID project. This research was supported by the Johannes Amos Comenius Programme (P JAC), project No. CZ.02.01.01/00/22_008/0004605, Natural and anthropogenic georisks. We thank the people and institutions involved in the Plateforme Corse d'Observations Atmosphériques (PCOA, https://corsica.obs-mip.fr/, last access: 6 February 2025) for their efforts in setting up and maintaining the SAETTA network and Ersa station. Andrea Kolínská wishes to thank Aleš Podolník for useful discussions and assistance with data processing. The authors would also like to thank the reviewers, Michael Stock and Dylan Goldberg, for their valuable feedback and insightful comments, which have improved the quality of this paper.
This research has been supported by the Grantová Agentura, Univerzita Karlova (grant no. GAUK198223); the Grantová Agentura České Republiky (grant no. 23-06430S); and the Ministerstvo Školství, Mládeže a Tělovýchovy (grant no. CZ.02.01.01/00/22_008/0004605).
This paper was edited by Greg McFarquhar and reviewed by Michael Stock and Dylan Goldberg.
Clarence, N. D. and Malan, D. J.: Preliminary discharge processes in lightning flashes to ground, Q. J. Roy. Meteor. Soc., 83, 161–172, 1957.
Coquillat, S., Defer, E., de Guibert, P., Lambert, D., Pinty, J.-P., Pont, V., Prieur, S., Thomas, R. J., Krehbiel, P. R., and Rison, W.: SAETTA: high-resolution 3-D mapping of the total lightning activity in the Mediterranean Basin over Corsica, with a focus on a mesoscale convective system event, Atmos. Meas. Tech., 12, 5765–5790, https://doi.org/10.5194/amt-12-5765-2019, 2019.
de Guibert, P. and Coquillat, S.: L1 SAETTA science data, Aeris [data set], https://doi.org/10.25326/236, 2021.
Edens, H. E., Eack, K. B., Eastvedt, E. M., Trueblood, J. J., Winn, W. P., Krehbiel, P. R., Aulich, G. D., Hunyady, S. J., Murray, W. C., Rison, W., Behnke, S. A., and Thomas, R. J.: VHF lightning mapping observations of a triggered lightning flash, Geophys. Res. Lett., 39, L19807, https://doi.org/10.1029/2012GL053666, 2012.
French national center for Atmospheric data and services AERIS: Meteo France, radar 5 min Precipitation Amount Composite, https://doi.org/10.25326/357, 2023.
Hare, B. M., Scholten, O., Dwyer, J., Trinh, T. N. G., Buitink, S., ter Veen, S., Bonardi, A., Corstanje, A., Falcke, H., Hörandel, J. R., Huege, T., Mitra, P., Mulrey, K., Nelles, A., Rachen, J. P., Rossetto, L., Schellart, P. Winchen, T., Anderson, J., Avruch, I. M., Bentum, M. J., Blaauw, R., Broderick, J. W., Brouw, W. N., Brüggen, M., Butcher, H. R., Ciardi, B., Fallows, R. A., de Geus, E., Duscha, S., Eislöffel, J., Garrett, M. A., Grießmeier, J. M., Gunst, A. W., van Haarlem, M. P., Hessels, J. W. T., Hoeft, M., van der Horst, A. J., Iacobelli, M., Koopmans, L. V. E., Krankowski, A., Maat, P., Norden, M. J., Paas, H., Pandey-Pommier, M., Pandey, V. N., Pekal, R., Pizzo, R., Reich, W., Rothkaehl, H., Röttgering, H. J. A., Rowlinson, A., Schwarz, D. J., Shulevski, A., Sluman, J., Smirnov, O., Soida, M., Tagger, M., Toribio, M. C., van Ardenne, A., Wijers, R. A. M. J., van Weeren, R. J., Wucknitz, O., Zarka, P., and Zucca, P.: Needle-like structures discovered on positively charged lightning branches, Nature, 568, 360–363, https://doi.org/10.1038/s41586-019-1086-6, 2019.
Hare, B. M., Scholten, O., Dwyer, J., Strepka, C., Buitink, S., Corstanje, A., Falcke, H., Horandel, J. R., Huege, T., Krampah, G. K., Mitra, P., Mulrey, K., Nelles, A., Pandya, H., Rachen, J. P., Thoudam, S., Trinh, T. N. G., ter Veer, S., and Winchen, T.: Needle Propagation and Twinkling Characteristics, J. Geophys. Res.-Atmos., 126, e2020JD034252, https://doi.org/10.1029/2020JD034252, 2021.
Iudin, D. I., Rakov, V. A., Mareev, E. A., Iudin, F. D., Syssoev, A. A., and Davydenko, S. S.: Advanced numerical model of lightning development: Application to studying the role of LPCR in determining lightning type, J. Geophys. Res.-Atmos., 122, 6416–6430, https://doi.org/10.1002/2016JD026261, 2017.
Karunarathne, N., Marshall, T. C., Karunarathne, S., and Stolzenburg, M.: Studying sequences of initial breakdown pulses in cloud-to-ground lightning flashes, J. Geophys. Res.-Atmos., 125, e2019JD032104, https://doi.org/10.1029/2019JD032104, 2020.
Kolínská, A.: Post-Return Stroke VHF Electromagnetic Activity in North-Western Mediterranean Cloud-to-Ground Lightning Flashes, V2, Mendeley Data [data set], https://doi.org/10.17632/8dr67bw4mz.2, 2024.
Kolmašová, I., Santolík, O., Farges, T., Risøn, W., Lán, R., and Uhlíř, L.: Properties of the unusually short pulse sequences occurring prior to the first strokes of negative cloud-to-ground lightning flashes, Geophys. Res. Lett., 41, 5316–5324, https://doi.org/10.1002/2014GL060913, 2014.
Kolmašová, I., Santolík, O., Defer, E., Rison, W., Coquillat, S., Pedeboy, S., Lán, R., Uhlíř, L., Lambert, D., Pinty, J.-P., Prieur, S., and Pont, V.: Lightning initiation: Strong pulses of VHF radiation accompany preliminary breakdown, Sci. Rep.-UK, 8, 3650, https://doi.org/10.1038/s41598-018-21972-z, 2018.
Kolmašová, I., Santolík, O., Defer, E., Kašpar, P., Kolínská, A., Pédeboy, S., and Coquillat, S.: Two propagation scenarios of isolated breakdown lightning processes in failed negative cloud-to-ground flashes, Geophys. Res. Lett., 47, e2020GL090593, https://doi.org/10.1029/2020GL090593, 2020.
Kolmašová, I., Soula, S., Santolík, O., Farges, T., Bousquet, O., Diendorfer, G., Lán, R., and Uhlíř, L.: A frontal thunderstorm with several multi-cell lines found to produce energetic preliminary breakdown, J. Geophys. Res.-Atmos., 127, e2021JD035780, https://doi.org/10.1029/2021JD035780, 2022.
Lapierre, J. L., Sonnenfeld, R. G., Edens, H. E., and Stock, M.: On the relationship between continuing current and positive leader growth, J. Geophys. Res.-Atmos., 119, 12479–12488, https://doi.org/10.1002/2014jd022080, 2014.
Lapierre, J. L., Sonnenfeld, R. G., Stock, M., Krehbiel, P. R., Edens, H. E., and Jensen, D.: Expanding on the relationship between continuing current and in-cloud leader growth, J. Geophys. Res.-Atmos., 122, 4150–4164, https://doi.org/10.1002/2016JD026189, 2017.
Le Vine, D. M. and Krider, E. P.: The temporal structure of HF and VHF radiations during Florida lightning return strokes, Geophys. Res. Lett., 4, 13–16, https://doi.org/10.1029/GL004i001p00013, 1977.
Li, S., Qiu, S., Shi, L., and Li, Y.: Broadband VHF observations of two natural positive cloud-to-ground lightning flashes, Geophys. Res. Lett., 47, e2019GL086915, 2020.
Marshall, T., Schulz, W., Karunarathna, N., Karunarathne, S., Stolzenburg, M., Vergeiner, C., and Warner, T.: On the percentage of lightning flashes that begin with initial breakdown pulses, J. Geophys. Res.-Atmos., 119, 445–460, https://doi.org/10.1002/2013JD020854, 2014.
Montanyà, J., van der Velde, O., and Williams, E.: The start of lightning: Evidence of bidirectional lightning initiation, Sci. Rep.-UK, 5, 15180, https://doi.org/10.1038/srep15180, 2015.
Nag, A. and Rakov, V. A.: Some inferences on the role of lower positive charge region in facilitating different types of lightning, Geophys. Res. Lett., 36, L05815, https://doi.org/10.1029/2008GL036783, 2009.
Pédeboy, S. and Toullec, M.: Impact study of the “Millau Bridge” on the local lightning occurrence, in: ILPS 2016 – International Lightning Protection Symposium: Conference proceedings, 21–22 April 2016, Porto, Portugal, https://www.researchgate.net/publication/303703093_Impact_study_of_the_Millau_Bridge_on_the_local_lightning_occurence (last access: 6 February 2025), 2016.
Pédeboy, S., Barnéoud, P., Defer, E., and Coquillat, S.: Analysis of the Intra-Cloud lightning activity detected with Low Frequency Lightning Locating Systems, in: International Lightning Detection Conference, 12–15 March 2018, Ft. Lauderdale, Florida, USA, https://api.semanticscholar.org/CorpusID:189802547 (last access: 6 February 2025), 2018.
Pu, Y. and Cummer, S. A.: Needles and Lightning Leader Dynamics Imaged with 100–200 MHz Broadband VHF Interferometry, Geophys. Res. Lett., 46, 13556–13563, https://doi.org/10.1029/2019GL085635, 2019.
Pu, Y., Cummer, S. A., and Liu, N.: VHF Radio Spectrum of a Positive Leader and Implications for Electric Fields, Geophys. Res. Lett., 48, e2021GL093145, https://doi.org/10.1029/2021GL093145, 2021.
Rakov, V. A.: A Review of Positive and Bipolar Lightning Discharges, B. Am. Meteorol. Soc., 84, 767–776, https://doi.org/10.1175/BAMS-84-6-767, 2003.
Rakov, V. A. and Uman, M. A.: Lightning: physics and effects, Cambridge University Press, New York, ISBN 0521583276, 2003.
Rakov, V. A., Thottappillil, R., and Uman, M. A.: Electric field pulses in K and M changes of lightning ground flashes, J. Geophys. Res.-Atmos., 97, 9935–9950, https://doi.org/10.1029/92JD00797, 1992.
Rison, W., Thomas, R. J., Krehbiel, P. R., Hamlin, T., and Harlin, J. A.: GPS-based three-dimensional lightning mapping system: Initial observations in central New Mexico, Geophys. Res. Lett., 26, 3573–3576, https://doi.org/10.1029/1999GL010856, 1999.
Schulz, W., Diendorfer, G., Pedeboy, S., and Poelman, D. R.: The European lightning location system EUCLID – Part 1: Performance analysis and validation, Nat. Hazards Earth Syst. Sci., 16, 595–605, https://doi.org/10.5194/nhess-16-595-2016, 2016.
Shao, X. M., Krehbiel, P. R., Thomas, R. J., and Risøn, W.: Radio interferometric observations of cloud-to-ground lightning phenomena in Florida, J. Geophys. Res.-Atmos., 100, 2749–2783, https://doi.org/10.1029/94JD01943, 1995.
Shao, X. M., Rhodes, C. T., and Holden, D. N.: RF radiation observations of positive cloud-to-ground flashes, J. Geophys. Res.-Atmos., 104, 9601–9608, https://doi.org/10.1029/1999JD900036, 1999.
Stock, M., Krehbiel, P. R, Lapierre, J., Wu, T., Stanley, M. A., and Edens, H. E.: Fast positive breakdown in lightning, J. Geophys. Res.-Atmos., 122, 8135–8152, https://doi.org/10.1002/2016JD025909, 2017.
Stock, M., Tilles, J., Taylor, G., Dowell, J., and Liu, N.: Lightning Interferometry with the Long Wavelength Array, Remote Sens.-Basel, 15, 14, https://doi.org/10.3390/rs15143657, 2023.
Stolzenburg, M. and Marshall, T. C.: Charge structure and dynamics in thunderstorms, Space Sci. Rev., 137, 355–372, https://doi.org/10.1007/s11214-008-9338-z, 2008.
Tan, Y., Zheng, T., and Shi, Z.: Improved lightning model: Application to discuss the characteristics of upward lightning, Atmos. Res., 217, 63–72, https://doi.org/10.1016/j.atmosres.2018.10.011, 2018.
Tang, G., Jiang, R., Sun, Z., Liu, M., Zhang, H., Li, F., Wang, Y., Yuan, S., and Zhang, T.: Characteristics of negative breakdowns in extinguished channels of a positive cloud-to-ground flash, Atmos. Res., 293, 106895, https://doi.org/10.1016/j.atmosres.2023.106895, 2023.
Urbani, M., Montanyà, J., Velde, O. A., Arcanjo, M., and López, J. A.: Multi-stroke positive cloud-to-ground lightning sharing the same channel observed with a VHF broadband interferometer, Geophys. Res. Lett., 49, e2021GL097272, https://doi.org/10.1029/2021GL097272, 2022.
Van der Velde, O. A. and Montanyà, J.: Asymmetries in bidirectional leader development of lightning flashes, J. Geophys. Res.-Atmos., 118, 24, https://doi.org/10.1002/2013JD020257, 2013.
Wu, T., Wang, D., and Takagi, N.: Locating preliminary breakdown pulses in positive cloud-to-ground lightning, J. Geophys. Res.-Atmos., 123, 7989–7998, https://doi.org/10.1029/2018JD028716, 2018.
Wu, T., Wang, D., and Takagi, N.: On the intensity of first return strokes in positive cloud-to-ground lightning in winter, J. Geophys. Res.-Atmos., 127, e2022JD037282, https://doi.org/10.1029/2022JD037282, 2022.