the Creative Commons Attribution 4.0 License.
the Creative Commons Attribution 4.0 License.
 | 02 Dec 2025
Understanding mesoscale convective processes over the Congo Basin using the Model for Prediction Across Scales-Atmosphere (MPAS-A)
Rong Fu
Kelly Núñez Ocasio
Robert Nystrom
Cenlin He
Jiaying Zhang
Xianan Jiang
Joao Teixeira
The Congo Basin in Central Africa is one of three convective centers in the tropics, characterized by a high proportion of precipitation produced by mesoscale convective systems (MCSs). However, process-level understanding of these systems and their relationship to environmental factors over the Congo Basin remains unclear, largely due to scarce in-situ observations. This study employs the Model for Prediction Across Scales–Atmosphere (MPAS-A), a global cloud-resolving model, to investigate MCSs in this region. Compared to satellite-observed brightness temperature (Tb), MPAS-A realistically simulates key MCS features, allowing a detailed comparison between two mesoscale convective complex (MCC) cases: one over the southern mountainous region (MCC-south) and the other over the northern lowland forests (MCC-north). MCC-south is larger, longer-lived, and moves a longer distance than MCC-north. Our analysis shows that MCC-south is supported by higher convective energy and more favorable vertical wind shear. The shear extends up to 400 km ahead of the convection center, exhibits a strong association with Tb variability, and is well balanced by a moderately strong cold pool. In contrast, MCC-north features weaker, localized shear near the center and a stronger cold pool. The African Easterly Jet helps maintain the shear in both cases, but an overly strong jet may suppress low-level westerlies and weaken convection. These results show how latitude and topography modulate environmental influences on Congo Basin MCS developments. The findings underscore the value of global cloud-resolving models for understanding convective systems and their impacts on weather extremes and societal risks in data-sparse regions.
- Article
(14704 KB) - Full-text XML
- BibTeX
- EndNote


The tropical rainforest rainfall is critical in regulating global weather and climate patterns, sustaining more than 50 % of the global biospecies, and providing resources for local communities and the broader global ecosystem. Rainfall in tropical rainforests is primarily driven by convective processes, with mesoscale convection systems (MCSs) playing a major role (e.g., Trismidianto et al., 2017; Rehbein et al., 2019; Andrews et al., 2024). MCSs are large, organized clusters of thunderstorms that produce significant rainfall and severe weather, persisting for several hours when they develop and mature through the aggregation of cumulonimbus clouds (Houze, 2004, 2018).
Recent studies have advanced the understanding of MCSs, including their classification, dynamics, and links to large-scale circulations and atmospheric chemistry (e.g., Zuluaga and Houze, 2013; Peters and Schumacher, 2016; Clavner et al., 2018; Houze, 2018; Schumacher and Rasmussen, 2020; Chakraborty et al., 2023), but challenges remain in understanding the physical mechanisms that control MCS characteristics, such as their lifetimes, geographic variation and evolution across land surfaces influenced by varying atmospheric dynamics (Houze, 2018). In the midlatitudes, MCS research has focused on their strong seasonality, role in severe weather, and interactions with low-level jets, frontal systems, and extratropical cyclones (e.g., Kunkel et al., 2012; Smith et al., 2012; Rasmussen et al., 2016; Feng et al., 2019). In the tropics, MCSs are commonly observed in regions such as the Indo-Pacific warm pool, the Amazon, and tropical Africa, with numerous studies examining their interactions with the Madden-Julian Oscillation (MJO), monsoons, and tropical cyclones (e.g., Laing and Fritsch, 1997; Lee et al., 2008; Barnes and Houze, 2013; Sullivan et al., 2019; Chen et al., 2022).
In tropical Africa, MCSs are linked to African easterly waves and can contribute to tropical cyclone genesis through favorable West African Monsoon conditions and proper phasing between convective heating and the wave's vorticity center (e.g., Sultan et al., 2003; Hopsch et al., 2010; Núñez Ocasio et al., 2020a, 2020b, 2021; Mayta et al., 2025). The Congo Basin, located in Central Africa, occupies only 10 % of Africa's landmass, but supplies 30 % of the continent's water resources by housing the world's second-largest river by discharge volume (the Congo River) (Brummett et al., 2009; N'kaya et al., 2022). It houses one of the three core regions of convection in the tropics (the other two locate over the Maritime Continent and the Amazon Basin) and the world's second-largest rainforest (Washington et al., 2013). The Congo Basin experiences some of the world's most intense thunderstorms, often associated with MCSs, which contribute to over 80 % of the region's total rainfall – significantly higher than in other tropical regions (e.g., Mohr et al., 1999; Nicholson, 2022; Andrews et al., 2024). In recent years, extreme rainfall-driven runoff anomalies have intensified river flood hazards across the Congo Basin, causing major economic losses and around 2000 deaths annually from river-related incidents (CICOS, 2012; Tshimanga et al., 2016; Schumann et al., 2022). Thus, studying MCSs and rainfall in this region is crucial for agriculture, river navigation, economic stability, and overall human well-being in central sub-Saharan Africa (Tshimanga et al., 2022).
Previous studies have widely evaluated the observed characteristics, including temporal frequency, spatial variability, and moving tracks of equatorial African or Congo Basin MCSs, as well as their connections to rainfall, lightning, and environmental factors (e.g., Laing and Fritsch, 1993; Nguyen and Duvel, 2008; Jackson et al., 2009; Laing et al., 2011; Hartman, 2020; Mba et al., 2022; Nicholson, 2022; Kigotsi et al., 2022; Solimine et al., 2022; Andrews et al., 2024). The seasonality of Congo Basin MCS occurrence indicates that MCS activity and associated rainfall migrate periodically across the equator, occurring southward in boreal winter and northward in boreal summer (Jackson et al., 2009; Andrews et al., 2024). Although the migration is often linked to the Intertropical Convergence Zone, recent studies suggest that rainfall and MCS activity over the Congo Basin involve more complex processes, as heavy rainfall may occur without the typical low-level convergence (Yang et al., 2015; Nicholson, 2018). MCSs in the Congo Basin typically exhibit westward propagation, with a substantial number originating along the lee side of the high terrain of the Great Rift Valley (Jackson et al., 2009; Laing et al., 2011; Hartman, 2020). This westward propagation is influenced by moderate low-level shear associated with the African Easterly Jet (AEJ), as well as the modulation of convectively coupled Kelvin waves and the MJO (Nguyen and Duvel, 2008; Jackson et al., 2009; Laing et al., 2011).
However, due to sparse in-situ observations (Nicholson et al., 2018; Tshimanga et al., 2022) and the low-resolution of reanalysis data (0.25° over Central Africa), the relationship between Congo Basin MCSs and environmental factors (e.g., vertical shear) has largely been explored from a climate perspective, with limited quantitative analyses based on MCS moving tracks. Quantitative, process-level understanding of Congo Basin MCSs and their relationships with environmental factors – particularly those based on MCS tracks from a weather perspective – remains limited. Such weather timescale studies necessitate model simulations capable of resolving mesoscale circulations (Laing et al., 2011).
Although Congo Basin rainfall has been simulated by regional and global models (e.g., Washington et al., 2013; Aloysius et al., 2016; Creese and Washington, 2016, 2018; Creese et al., 2019; Fotso-Kamga et al., 2020), few studies have utilized models, especially high-resolution cloud-resolving models, to simulate individual Congo Basin MCSs. Such models are essential for accurately representing mesoscale convective processes. One of the studies focusing on Congo Basin MCSs using a high-resolution cloud-resolving model was conducted by Raghavendra et al. (2022), who utilized the Weather Research and Forecasting (WRF) at 4 km with convection-permitting setup and perturbed topography with varying heights for November 2014. Their study showed that brightness temperature (Tb) is well simulated in the control run, indicating the capability of WRF at a high resolution in simulating a key feature of MCSs over the Congo Basin. The important relationships between tropical MCSs/rainfall and topography have been documented in their study and others (e.g., Hamilton et al., 2017, 2020). However, Congo Basin MCSs have not been explicitly identified, tracked, or classified using a tracking algorithm, and the quantitative influences of key environmental factors on their developments along the track have not been examined in previous studies.
In the past decade, global cloud-resolving models have been developed, such as the Model for Prediction Across Scales–Atmosphere (MPAS-A) (Skamarock et al., 2012). MPAS-A incorporates physics schemes from WRF but offer the option of using a variable-resolution global Voronoi mesh, which can avoid nesting techniques or usual pole-related grid transformations and improves computational performance over traditional regional cloud-resolving models. Recently, both global and regional configurations of MPAS-A have been applied to the African and Atlantic regions during the genesis of Hurricane Helene (2006) (Núñez Ocasio and Rios-Berrios, 2023; Núñez Ocasio and Dougherty, 2024; Núñez Ocasio et al., 2024). For example, MPAS-A has been used to examine the role of moisture in the AEJ and monsoon dynamics, rainfall shifts, easterly wave–MCS interactions related to tropical cyclogenesis, and the impacts of a warmer, moister climate on these multiscale tropical systems (Núñez Ocasio and Dougherty, 2024).
Therefore, we take the advantage of the cloud-resolving capability and global Voronoi mesh offered by MPAS-A to gain the process-level understanding of Congo Basin MCSs and their connections to environmental factors. From November 2023 to January 2024, the Democratic Republic of the Congo and Congo-Brazzaville experienced their worst flooding during the past 60 years (Davies, 2024; Joachim et al., 2024). We apply satellite observations and MPAS-A to analyze MCSs from 21 to 25 November 2023. We then apply the Tracking Algorithm for Mesoscale Convective Systems (TAMS; Núñez Ocasio et al., 2020b; Núñez Ocasio and Moon, 2024) to objectively identify, track, and classify MCSs over the Congo Basin. TAMS offers capabilities comparable to other tracking methods but stands out due to its unique tracking approach, MCS classification scheme, and consideration of background flow. Once MCS tracks are obtained, we focus on long-lasting (over 15 h) MCS events and use MPAS-A to quantify the role of key environmental factors in MCS developments. The remainder of the paper is organized as follows. Data and methodology are described in Sect. 2. Section 3.1 discusses Congo Basin rainfall and MCS statistics. Section 3.2 evaluates model's ability to simulate mesoscale convective processes. The role of vertical wind shear and the AEJ is discussed in Sect. 3.3. A summary and additional discussion are provided in Sect. 4.
2.1 Data
We use hourly data to examine Congo Basin MCSs for the period of 21–25 November 2023. The National Centers for Environmental Prediction (NCEP)/Climate Prediction Center (CPC) L3 Half Hourly 4km Global Merged infrared (IR) Tb data (Janowiak et al., 2017) is used to detect MCSs. This Tb data has been widely used in tracking MCSs, especially over tropical regions (e.g., Feng et al., 2021, 2023a, 2025; Chen et al., 2023; Prein et al., 2024; Muetzelfeldt et al., 2025). Due to the sparsity of gauge networks over the Congo Basin in recent decades (Nicholson et al., 2018), we will mainly use satellite precipitation data. Since MCS detection requires high-resolution, sub-daily data, we analyze precipitation associated with identified MCSs using half-hourly precipitation data from the CPC Morphing Technique (CMORPH) Climate Data Record (CDR) with an 8 km horizontal resolution (Xie et al., 2019) and the Global Precipitation Measurement (GPM) Integrated Multi-satellite Retrievals (IMERG) Final Precipitation with a 0.1° horizontal resolution (Huffman et al., 2023).
In addition to hourly data, daily precipitation data are used to analyze daily and monthly precipitation over the Congo Basin. These datasets include CMORPH CDR (0.25° horizontal resolution, 1998–2024) (Xie et al., 2019), GPM IMERG Final Precipitation (0.1° horizontal resolution, 2001–2024) (Huffman et al., 2023), and the CPC Global Unified Gauge-Based Analysis of Daily Precipitation (0.5° horizontal resolution, 1979–2024) (Chen et al., 2008). Additionally, daily runoff data are obtained from the Global Land Data Assimilation System (GLDAS) Catchment Land Surface Model L4 (0.25° horizontal resolution, 2004–2024) (Li et al., 2020).
2.2 Model configuration and simulations
MPAS-A is a global cloud-resolving model representing a new category of atmospheric models and is a participant in DYAMOND, the first intercomparison project of such models (Stevens et al., 2019). It solves non-hydrostatic equations using kilometer-scale global meshes and simulates deep convection explicitly (Skamarock et al., 2012; Satoh et al., 2019). In this study, we use MPAS-A version 8 modified to output variables at 27 isobaric levels (Núñez Ocasio et al., 2024). We use a variable-resolution, 60–3 km global mesh, and the Congo Basin is roughly within the 3 km domain (Fig. 1a). The model uses 55 vertical levels up to ∼ 30 km height.
The model physics follows the standard mesoscale-reference suite incorporating the new scale-aware Tiedtke convection scheme, which is newly added to MPAS-A version 8 and suitable for a convection-permitting mesh with grid spacing below 10 km (Wang, 2022). The scale-aware Tiedtke scheme effectively reduces deep convection by decreasing the convective portion of total surface precipitation, and also ensures smooth handling of convection across mesh transition zones when applied to a variable mesh in MPAS-A (Wang, 2022). The other schemes of the physics suite include the WSM6 microphysics scheme (Hong and Lim, 2006), the Noah land surface scheme (Niu et al., 2011), the YSU boundary layer scheme (Hong et al., 2006), the Monin-Obukhov surface layer scheme (Jiménez et al., 2012), the RRTMG shortwave and longwave radiation scheme (Iacono et al., 2008), and the Xu-Randall subgrid cloud fraction scheme (Xu and Randall, 1996).
We use the European Centre for Medium-Range Weather Forecasts (ECMWF) fifth-generation reanalysis (ERA5; Hersbach et al., 2020), including a complete set of atmospheric pressure level and surface variables, to initialize model simulations. The experiments begin at 12:00 Coordinated Universal Time (UTC) on 21 November 2023, running for four days, with the first six hours discarded for spin-up. The model produces hourly outputs at 27 isobaric levels. In addition to the primary simulation discussed above, we have conducted additional simulations to ensure that our conclusions were not influenced by model stochasticity. In the sensitivity tests, random perturbations were added to the 1000 hPa potential temperature field following a Gaussian distribution with a standard deviation of 0.6 K, as in Núñez Ocasio et al. (2024). Since the results of the sensitivity tests closely resemble those of the unperturbed simulation, we present only the model simulation without random perturbations in this study.
2.3 MCS tracking
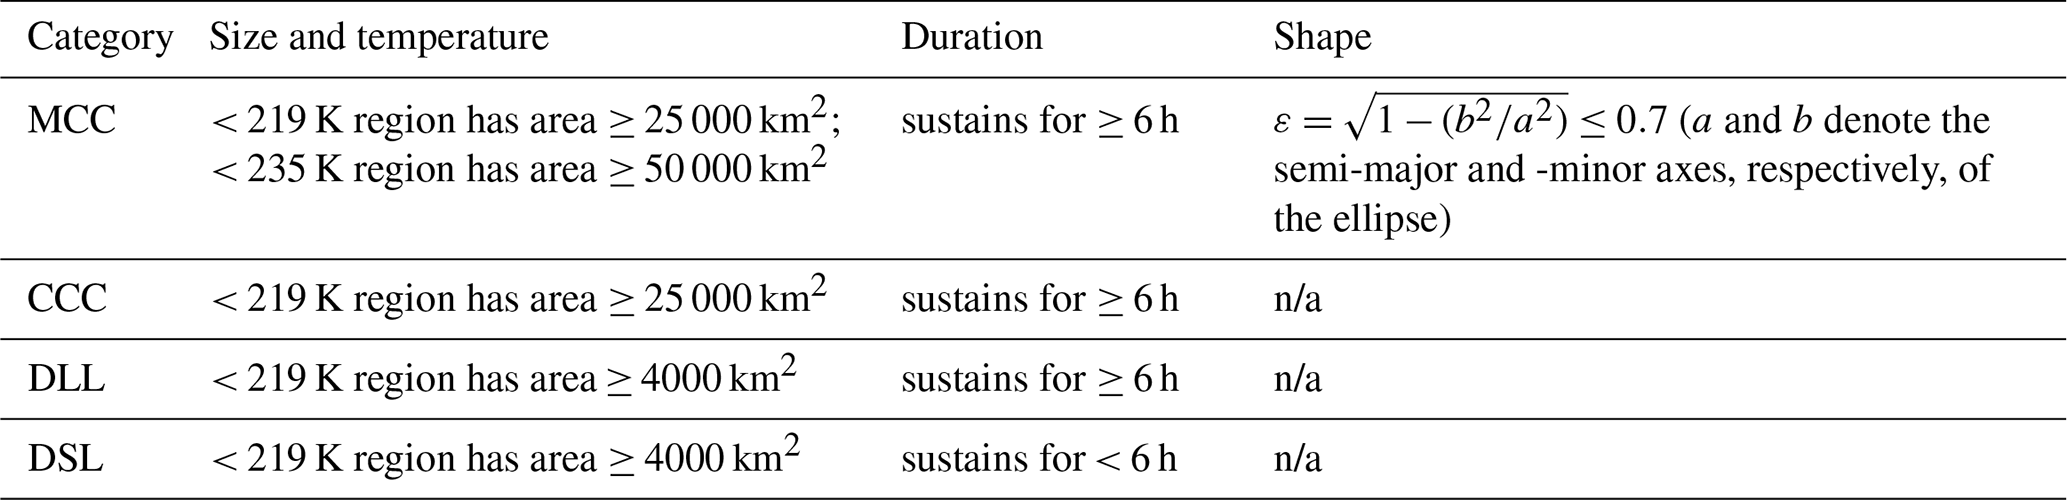
The Congo Basin MCS tracking is conducted objectively using the latest version of TAMS, an open-source, Python-based package for tracking and classifying MCSs (Núñez Ocasio and Moon, 2024). Following the MCS tracking algorithm described in Núñez Ocasio et al. (2020b) and Núñez Ocasio and Moon (2024), hourly Tb contours are used to identify cloud elements (CEs), selecting < 235 K regions that contain embedded < 219 K areas of at least 4000 km2. In MPAS-A, Tb is derived from the model's outgoing longwave radiation output following the method of Yang and Slingo (2001). MCS tracks are determined by linking CEs from the current time step to those from the previous step based on maximum CE polygon overlap. Once an MCS is identified and tracked, its complete trajectory is analyzed, allowing its entire lifespan to be assigned to a single classification. Table 1 shows the MCS classification criteria adopted from Núñez Ocasio and Moon (2024) for use in TAMS, which includes four categories: mesoscale convective complex (MCC), convective cloud cluster (CCC), disorganized long-lived (DLL), and disorganized short-lived (DSL). Other studies (e.g., Maddox, 1980; Evans and Shemo, 1996; Tsakraklides and Evans, 2003; Núñez Ocasio et al., 2020b) have similar criteria to classify MCS. TAMS outputs include the latitude and longitude centroids of < 219 and < 235 K regions for each MCS at every time step, along with additional statistics such as area, duration, and mean precipitation for each identified MCS.
3.1 Congo Basin rainfall and MCS statistics
The Congo Basin spans a vast area across Central Africa, with elevation varying significantly. It primarily consists of lowlands in the west, central, and northern regions, surrounded by higher elevations in the south and east (Fig. 1b). It is home to a complex river system, dominated by the Congo River, the second largest in the world by discharge. The seasonal cycle of Congo Basin domain-averaged precipitation exhibits a biannual pattern, with the first peak occurring in March–April and the second in October–November (Fig. 1c). The satellite data generally show a higher daily precipitation rate compared to gauge-based data, a discrepancy that has been widely studied in comparisons with gauging station networks (e.g., Hughes, 2006). This biannual cycle is recognized as a key characteristic of Congo Basin rainfall (e.g., Washington et al., 2013; Pokam et al., 2014; Dyer et al., 2017), though it is more pronounced south of the equator (Nicholson, 2022).

Figure 1(a) Illustration of the 60–3 km global variable resolution mesh. Contours represent resolution from 3 to 40 km. The pink box represents the Congo Basin (10° S–5° N, 15–30° E), which roughly has the resolution of 3 km. (b) The elevation (m) of the Congo Basin (within the dashed box). Blue lines indicate rivers. (c) Climatology of the monthly mean basin-averaged precipitation (mm d−1) for three observed datasets. The climatological period for each dataset corresponds to its available data range, as detailed in Sect. 2.1.
Between November 2023 and January 2024, the Democratic Republic of the Congo and Congo-Brazzaville experienced their worst flooding in the past 60 years (Davies, 2024; Joachim et al., 2024). Figure 2a shows daily runoff in November 2023 (bars) compared with the climatological daily mean (gray line) and the climatological mean ±1 standard deviation (dashed blue lines). Extreme runoff anomalies, reaching up to 50 % above the climatological mean, occurred during 21–25 November, with values exceeding one standard deviation between 23–25 November. All three rainfall datasets also exhibit consecutive days of positive precipitation anomalies, especially in GPM IMERG and CPC gauge-based data (Fig. 2b–d). GPM IMERG shows three consecutive days above +1 standard deviation. In addition to the precipitation anomalies observed during 21–25 November, the preceding dry conditions – particularly the near- or below- −1 standard deviation of precipitation prior to 15 November, as indicated by CMORPH CDR – may also contribute to the extreme flooding. The antecedent dry conditions would have reduced soil moisture retention capacity, leading to increased runoff during subsequent heavy rainfall events. Such conditions could enhance flood risks, even when the precipitation event itself is not exceptionally intense (e.g., Barendrecht et al., 2024). Since MCSs account for approximately 80 % of the total rainfall in the Congo Basin (e.g., Mohr et al., 1999; Nicholson, 2022; Andrews et al., 2024), this study focuses on the period 21–25 November 2023, to improve the process-level understanding of MCSs in this region.

Figure 2(a) Daily mean basin-averaged runoff (kg m−2 d−1) from GLDAS for 2023 (bars), along with climatological mean (solid gray line) and the climatological mean ±1 standard deviation (dashed blue lines) for the period 1–30 November. The period analyzed in this study is within the turquoise box. (b–d) Same as (a), but for precipitation (mm d−1) from three observational datasets. The climatological period for each dataset corresponds to its available data range, as detailed in Sect. 2.1.
Following the method in Sect. 2, we apply TAMS to objectively identify, track, and classify MCSs. Figure 3a displays all identified MCSs that passed through the Congo Basin during the study period in observations. For simplicity, only the initial and final locations are shown. Consistent with previous studies (Jackson et al., 2009; Laing et al., 2011; Hartman, 2020), most MCSs propagate westward, with a substantial number originating in the lee side of the high terrain of the Great Rift Valley. Following the strictest criteria in Table 1, MCCs with an elliptical shape () generally initiate in the eastern portion of the basin and propagate the longest distance; one MCC case even moves from the eastern boundary to the western boundary. CCCs have the second-longest moving distances, slightly longer than DLLs. By definition, DSLs are localized, with the shortest moving distances, and they can occur over most areas of the basin.

Figure 3Initial (circles) and final (triangles) locations of each detected MCS during 21–25 November 2023, based on (a) observations and (b) MPAS-A simulations. The four categories of MCS are represented by different colors. Dashed lines indicate the connection between initial and final locations but do not represent the actual MCS tracks. Shading represents elevation (m). The MCC cases analyzed in this study are marked. Violin plots of (c) duration (hours) and (d) mean precipitation (from CMORPH; mm h−1) within the 219 K contours for each MCS category in observations and MPAS-A simulations. The width of the violin plot indicates probability distribution.
3.2 Model's ability to simulate MCSs
In this section, we evaluate how well MPAS-A simulates MCSs by conducting simulations for 21–25 November 2023, as described in Sect. 2. We do not expect the model to capture every individual MCS track in MPAS-A; instead, our goal is to assess whether long-duration or long-track MCS events and the overall MCS statistics are realistically represented. The model successfully simulates the general westward propagation of MCSs, but the number of MCC cases is lower than in observations (Fig. 3b). Notably, the long-track MCC case over the southern basin (referred to as MCC-south) is well captured in terms of spatial location. Figure 3c–d compares MCS characteristics between observations and model simulations. The MCS duration is well simulated, particularly for DSL, DLL, and CCC (Fig. 3c). MCCs typically last over 15 h, with one observed case lasting 27 h. The two simulated MCCs last 15 and 20 h, respectively, consistent with observations. Compared to observations, the model exhibits higher rainfall magnitudes for all four categories (Fig. 3d), consistent with previous studies (e.g., Raghavendra et al., 2022; Feng et al., 2023b) comparing rainfall between observations and WRF, which form the basis of MPAS-A's physics schemes (Skamarock et al., 2012). These differences may arise from uncertainties in both the model simulations and the observational data.
We compare the spatial distribution of the observed MCC-south case with that from MPAS-A simulations. The observed Tb shows that MCC-south originates from the Great Rift Valley (Fig. 4a), propagates westward during the late afternoon and evening (local time UTC +01:00 or +02:00, Fig. 4b–c), and weakens in the following morning (Fig. 4d). The mean area of the observed MCC-south (averaged across all time steps) is 6.7 × 10⁵ km2, covering nearly 30 % of the Congo Basin, and the mean area enclosed by the 219 K contours is 3.2 × 10⁵ km2, approximately half of the total MCC area. The simulated MCC-south originates from the Great Rift Valley, though slightly farther south, and propagates westward across the Congo Basin (Fig. 4e–h). While the simulated Tb is more scattered and the mean MCC area is 12 % smaller than observed, the model still successfully captures the timing and general location of MCC-south.

Figure 4(a–d) MCC-south tracking of Tb (K) every 6 h (in UTC) from NCEP/CPC data in observations. The black line represents the MCC track, and the open circle denotes its initiation location. (e)–(h) Same as (a)–(d), but for MPAS-A simulations. Note that the MCC-south in MPAS-A simulations ends at 03:00 UTC on 21 November.
To better understand the evolution of Tb and associated rainfall, we present the Hovmöller diagram along the MCC track. Figure 5a illustrates the observed Tb evolution for MCC-south, which originates near 29° E, featuring three centers (Tb < 210 K) along its path, excluding the one east of 30° E, as it does not belong to MCC-south. The simulated Tb evolution shares a similar pattern with observations, but during the initial stage, Tb magnitudes are smaller, and the Tb pattern appears more scattered (Fig. 5b). The simulated MCC strengthens (Tb decreases) significantly during the mid-stage of MCC-south (around 16:00:00Z), warranting further analyses to investigate the underlying mechanisms. While rainfall from the two observations generally aligns with Tb from NCEP/CPC data, CMORPH shows lower rainfall in the early–mid stages and higher rainfall in the later stage (Fig. 5c). Consistent with Fig. 3d, the simulated rainfall magnitudes exceed those in observations (Fig. 5d). The high rainfall magnitudes in cloud-resolving models have also been observed in previous studies (e.g., Raghavendra et al., 2022; Feng et al., 2023b). Despite these differences, the results above suggest that MPAS-A shows promise in simulating long-lived, long-track MCC over the Congo Basin.

Figure 5Hovmöller diagram for (a) 6–7.5° S averaged Tb (K) from NCEP/CPC data and (b) 8–9° S averaged Tb from MPAS-A simulations, along the track of MCC-south. The black dashed line represents the MCC track. (c)–(d) Same as (a)–(b), but for precipitation (mm h−1). In (c), both CMORPH CDR (shading) and GPM IMERG (contours; contour values: 1, 2, and 5 mm h−1) precipitation are shown.
Next, we utilize the model to further understand mesoscale convective processes by comparing two representative MCC cases, MCC-south and another MCC case over the northern basin, referred to as MCC-north (Fig. 3b). MCC-north originates during the evening over the northeastern boundary of the Congo Basin, where the elevation ranges from approximately 700 to 1000 m (Fig. 6a). The system then propagates westward through midnight (Fig. 6b) and weakens over lowlands, where elevations drop to 400–700 m or lower, by early morning (Fig. 6c). The mean area of the simulated MCC-north is about 22 % of that of MCC-south, with a shorter lifecycle of 15 h compared to 20 h for MCC-south. Additionally, its moving distance is approximately 35 % of that of MCC-south. Overall, MCC-north is smaller in size, shorter in duration, and less extensive in movement compared to MCC-south. Figure 6d–e presents the Hovmöller diagrams of Tb and rainfall along the MCC-north track. MCC-north intensifies rapidly after its initiation, characterized by low Tb centers and rainfall exceeding 10 mm h−1 during its early stage (before 19:00:00Z). Contrary to MCC-south, the simulated MCC-north weakens (Tb increases) significantly from the mid-stage (around 21:00:00Z) (Fig. 6d). We investigate the mechanisms responsible for such difference in Sect. 3.3.

Figure 6(a)–(c) Same as Fig. 4, but for MCC-north from MPAS-A simulations. (d)–(e) Same as Fig. 5, but for 1.5–2.5° N averaged fields for MCC-north.
Figure 7a–b shows convective available potential energy (CAPE), which reflects atmospheric instability and the potential for convection, and convective inhibition (CIN), which represents the energy barrier that must be overcome for convection to initiate, for the two MCC cases. For MCC-south, large CAPE values, as high as 2000 J kg−1, consistently preceding the track and accompanied by CIN values below 50 J kg−1, create favorable conditions for convection development. For MCC-north, CAPE is significantly lower, with CAPE values dropping below 1200 J kg−1, and CIN also increases, during the mid-stage (around 21:00:00Z). In addition, we examine the vertical profile of atmospheric energy. Following Hobbs and Wallace (2006), moist static energy (MSE), which represents total energy of an air parcel, is expressed as:
where Lv is latent heat of vaporization, q is specific humidity, cp is specific heat capacity at constant pressure, T is air temperature, and Φ is geopotential. Figure 7c shows that MSE decreases with height for both MCC cases, indicating a convectively unstable environment favorable for MCC developments. MCC-south exhibits higher MSE from 850 hPa to the mid-troposphere, suggesting greater potential for convection and stronger moist updrafts.

Figure 7(a) Hovmöller diagram for 8–9° S averaged CAPE (contours; J kg−1; the light and dark red contours represent 1200 and 2000 J kg−1, respectively) and CIN (shading; J kg−1) for MCC-south from MPAS-A simulations. The blue dashed line represents the MCC track. (b) Same as (a), but for 1.5–2.5° N averaged fields for MCC-north. (c) The mean MSE (103 J kg−1) for all timesteps along the track of MCC-north (blue line) and MCC-south (red line) from MPAS-A simulations. Shading represents the spread of the minimum and maximum values of MSE for all timesteps along the track.
3.3 The role of vertical wind shear and African Easterly Jet
In this section, we examine dynamic factors driving the different evolutions of the two MCC cases. Although previous studies have explored the relationship between MCSs over the Congo Basin or equatorial Africa and dynamic factors such as vertical wind shear and AEJ (Nguyen and Duvel, 2008; Jackson et al., 2009; Laing et al., 2011), they primarily relied on low-resolution reanalysis data from a climate perspective without quantitative analyses based on MCS tracks. Weather-focused investigations, such as quantifying the influence of these dynamic factors on MCS developments along its track, require cloud-resolving model simulations (Laing et al., 2011).
During the mid-stage (16:00:00Z) of MCC-south, its convection, linked to low-tropospheric convergence (blue shading) and updrafts (red contours), is concentrated over elevated terrain (Fig. 8a), with a cold pool region behind it (Fig. 9a). Westerly mountain-valley breezes ahead of the MCC lift moisture-rich air from the lower troposphere, providing abundant latent energy to fuel the system. As the MCC propagates into the valley, convergence intensifies from the surface to the mid-troposphere, accompanied by enhanced vertical wind shear between the lower and mid-troposphere ahead of the center (Fig. 8b) and a narrow cold pool region trailing the MCC center (Fig. 9b). The vertical wind shear ahead of the MCC-south track is generally easterly. For MCC-north, however, the system reaches the lowland forest region during its mid-stage (21:00:00Z), where the lower troposphere is dominated by divergence (orange shading), inhibiting the upward transport of low-level moisture to the mid-troposphere (Fig. 8c). The cold pool behind the MCC center extends broadly in the zonal direction (from 26 to 29° E, ∼ 300 km), with temperatures dropping by up to 4 K (291 K vs. 295 K) (Fig. 9c).

Figure 8(a–b) The 8–9° S averaged zonal (vectors; m s−1) and vertical (contours; m s−1; contour values: −0.1 (blue) and 0.1 m s−1 (red)) velocities and horizontal divergence (shading; s−1) for MCC-south from MPAS-A simulations. The orange triangle indicates the center of the MCC. (c)–(d), Same as (a)–(b), but for 1.5–2.5° N averaged fields for MCC-north.

Figure 9(a)–(d) Same as Fig. 8, but for air temperature (shading; K) and vertical velocity (contours; m s−1; contour values: −0.1 (blue) and 0.1 m s−1 (red)).
Compared to MCC-south, lower-level westerly winds are absent ahead of the MCC-north, resulting in generally weaker easterly wind shear (Fig. 8c–d); the cold pool is generally stronger and extends broader zonally in MCC-north (Fig. 9c–d). According to Rotunno et al. (1988), that is RKW theory, the weaker vertical wind shear may result from an overly strong cold pool, characterized by greater intensity and broader horizontal extent in this case, causing the convective system to tilt upshear and limiting MCC developments (e.g., Schumacher and Rasmussen, 2020; Kirshbaum et al., 2025). In contrast, MCC-south features a more favorable balance between vertical wind shear and cold pool strength, approaching the “optimal state” for MCC developments during the mid-stage.
We further quantify how vertical wind shear influences MCC evolution by using a simple linear regression model (e.g., Zhao and Zhang, 2022; Zhao and Fu, 2022):
where Tb is brightness temperature at the MCC center, ∇Ux is vertical zonal wind shear (U600−U875 for MCC-south and U600−U900 for MCC-north) with the longitudinal distance (x; i.e., degree) relative to the MCC center, and α and β are regression coefficients. We calculate coefficient of determination (, where RSS is sum of squares of residuals and TSS is total sum of squares) to assess how much of the variance in Tb can be linked to wind shear.
Figure 10a shows that vertical wind shear located approximately 1.5 to 4° ahead of the MCC-south center corresponds to 35 %–65 % of the total variance in Tb, with the highest values around 2° W of the MCC center. This result suggests that vertical wind shear ahead of the MCC-south center plays a key role in modulating convection, corresponding up to 65 % of the Tb variance, and that this favorable environment may promote the formation of a gust front ahead of the MCC center (Schumacher and Rasmussen, 2020). Strong convection (Tb < 220 K) is associated with easterly wind shear exceeding 10 m s−1 (Fig. 10b). In contrast, for MCC-north, the wind shear that significantly links to Tb variance (∼ 60 %) is confined near the center of the MCC, with a sharp decline beyond 1° W of the center (Fig. 10c), indicating that the generation of convective cells is primarily close to the cold pool. During several timesteps along the track, MCC-north exhibits weak or even westerly shear (positive values), despite persistent easterly flow in the mid-troposphere along the MCC track (Fig. 10d). This suggests that the lower troposphere experiences relatively stronger easterly winds than the mid-level.
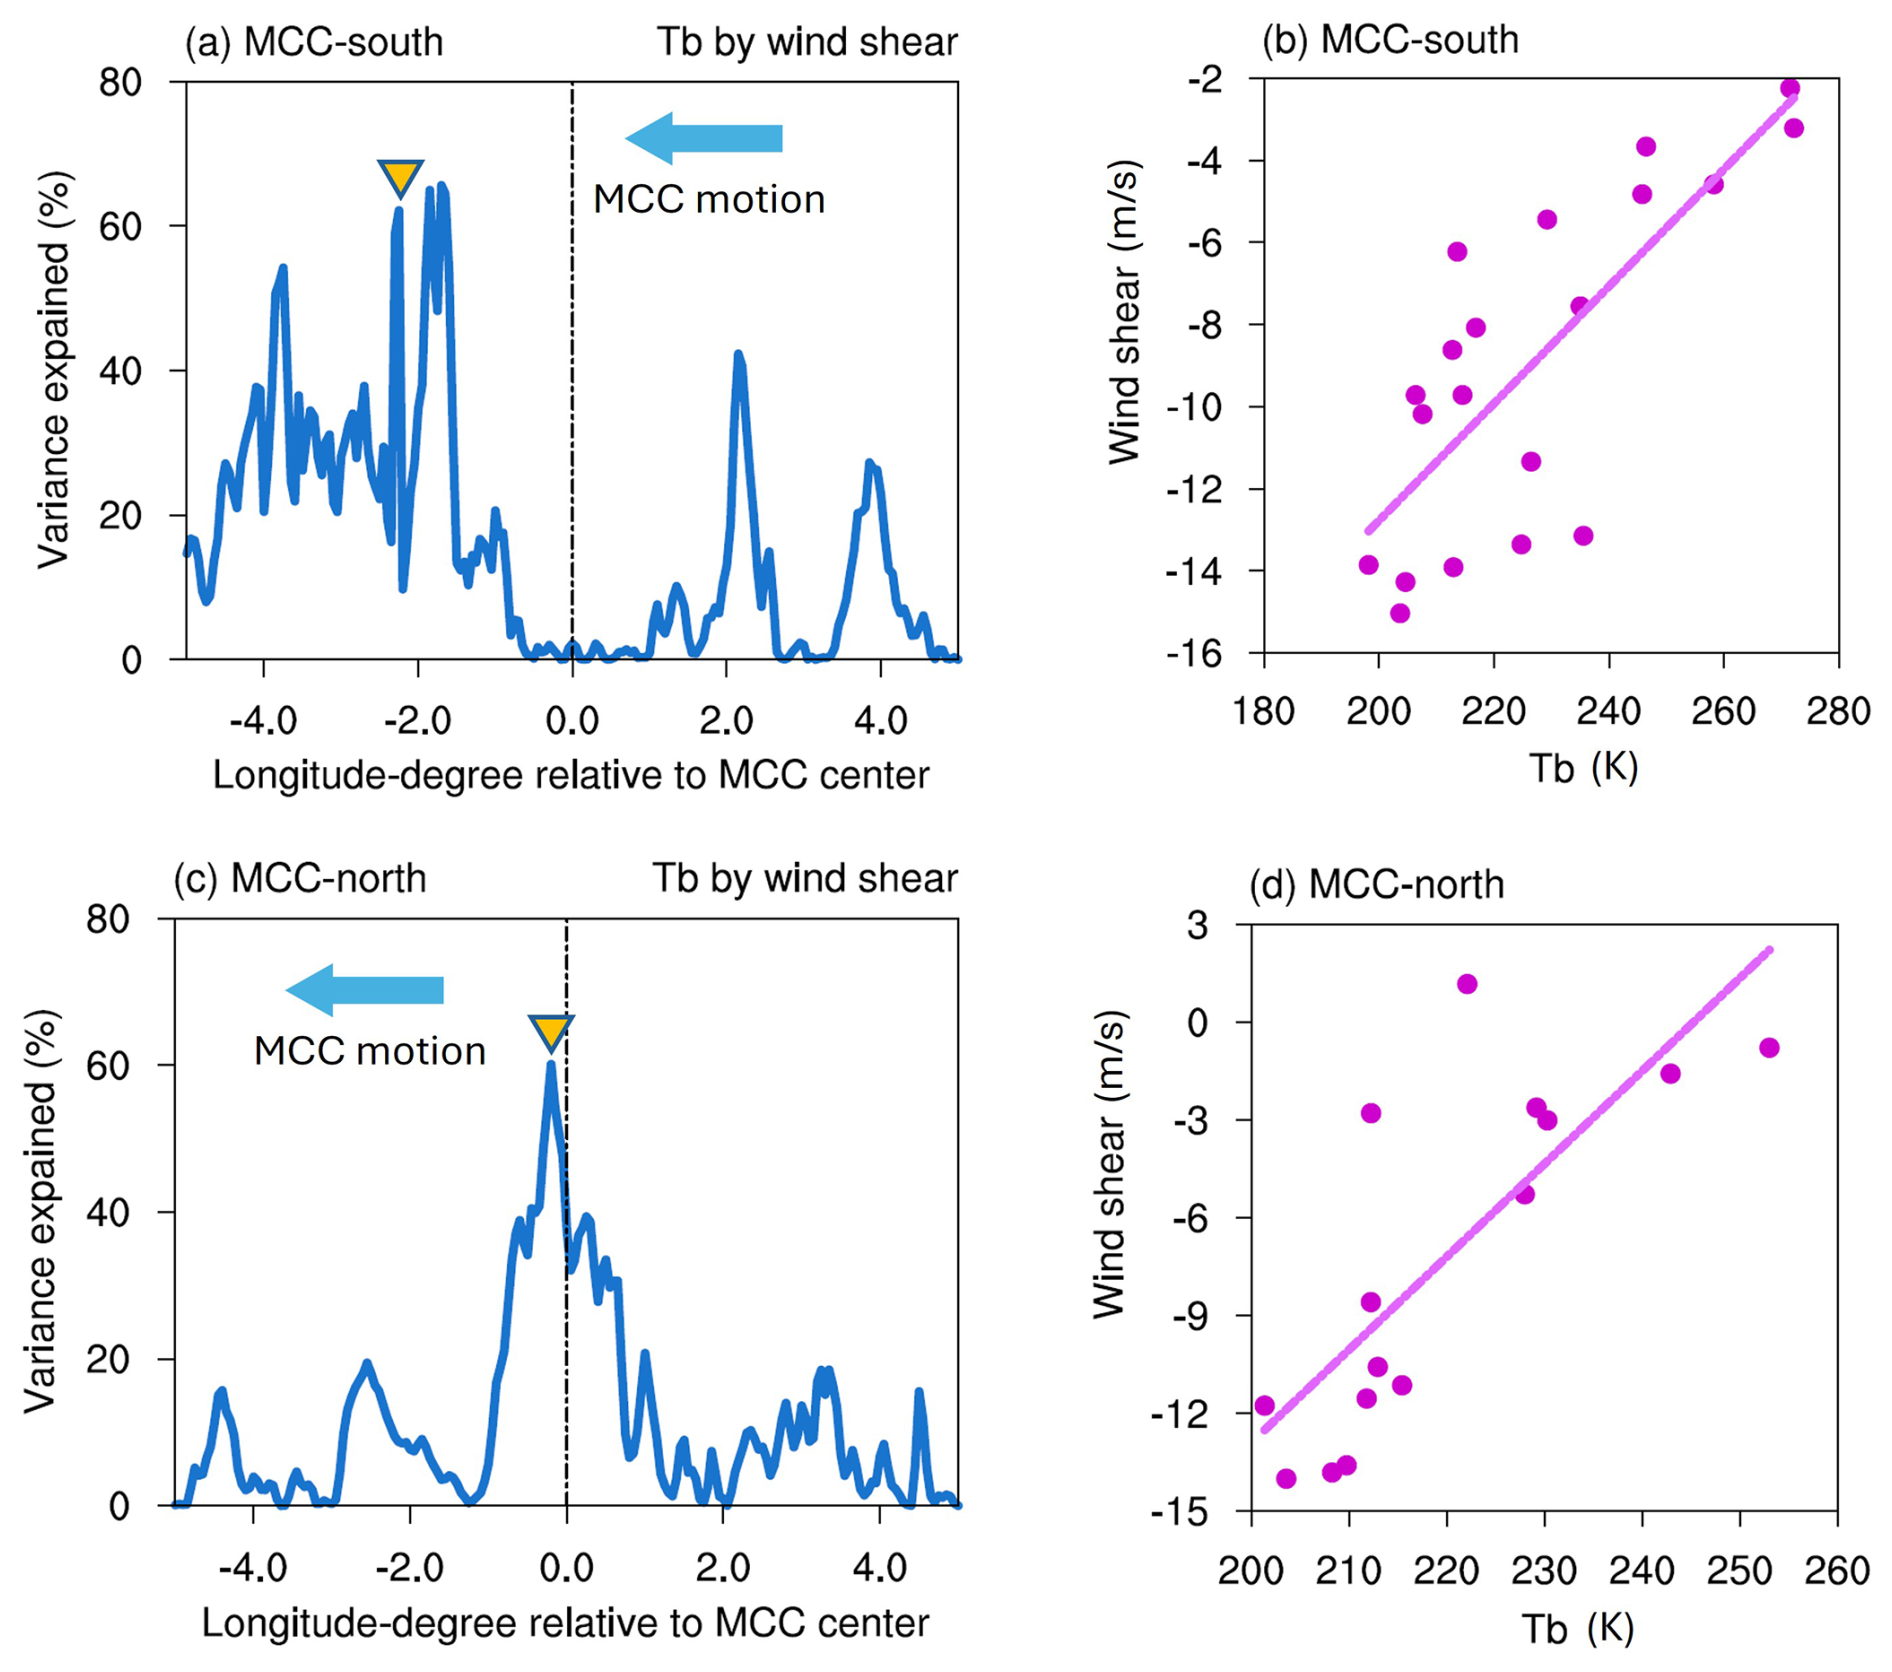
Figure 10(a) Percentage of variance (i.e., R2 × 100 %) in Tb along the MCC-south track that can be linked to vertical wind shear, shown as a function of longitude ahead and behind the MCC-south track center. The yellow triangle indicates the longitude used in (b). (b) The scatter plot for Tb (K) and wind shear (m s−1) at the longitude ahead of MCC-south track (marked by the triangle in a) for all timesteps along the track. The solid line represents the linear fit. (c)–(d) Same as (a)–(b), but for MCC-north.
Therefore, compared to MCC-north, the longer duration and longer track of MCC-south are likely associated with a more favorable pre-existing wind shear structure extending up to ∼ 400 km ahead of the system. According to the RKW theory, which relates the balance between cold-pool outflow and vertical wind shear to convective organization (e.g., Rotunno et al., 1988; Schumacher and Rasmussen, 2020; Kirshbaum et al., 2025), this shear environment can achieve an “optimal” balance with the cold pool, effectively interacting with its outflow to lift warm, moist air, sustain updrafts, and promote the continued development and forward propagation of the MCC. These differences between the two MCC cases highlight the role of latitude and topography in modulating the impacts of environmental factors on MCS developments.
Finally, we investigate the linkage between the AEJ and the vertical wind shear associated with the two MCC cases. The AEJ system, consisting of both a northern and a southern branch (AEJ-N and AEJ-S), can promote mid-tropospheric moisture convergence within the right entrance region of the jet, thereby enhancing rainfall (Uccellini and Johnson, 1979; Jackson et al., 2009). Figure 11a shows zonal winds at 650 hPa averaged over the study period. The AEJ centers are typically identified by zonal wind speeds exceeding 6 m s−1, and their approximate locations in this figure are consistent with previous studies (e.g., Jackson et al., 2009). MCC-north and MCC-south are located near the AEJ-N and AEJ-S, respectively. We define AEJ-N and AEJ-S indices as the domain-averaged zonal winds within the yellow boxes and calculate their correlations with vertical wind shear along MCC tracks. The strength of AEJ-N and AEJ-S is strongly positively correlated (correlation > 0.7) with the vertical shear associated with MCC-north and MCC-south, respectively, based on the temporal evolution of the MCCs throughout their lifecycles (not shown). This suggests that the AEJ helps establish the wind shear conditions necessary for MCC developments. This is consistent with previous studies emphasizing the AEJ's role in shear propagation over the West African monsoon region (Núñez Ocasio et al., 2020a). However, AEJ-N is notably stronger than AEJ-S (Fig. 11b vs. 11c) and is associated with weaker low-level westerlies (lighter pink shading), which may lead to overall weaker convection in MCC-north.

Figure 11(a) Zonal winds at 650 hPa (shading; m s−1) averaged over 21–25 November 2023, from MPAS-A simulations. The blue contours (−6 m s−1) indicate the typical threshold used to define the AEJ. The two yellow boxes represent the approximate locations of the AEJ-N and AEJ-S. The red lines represent the full tracks of the two MCC cases, and the open circles denote their initiation locations. (b–c) The 0–5° N and 5–10° S averaged zonal wind (m s−1) averaged over 21–25 November 2023. The red boxes indicate the spatial extent during the lifespans of the two MCC cases.
This study investigates mesoscale convective processes over the Congo Basin using MPAS-A. MCSs are objectively identified, tracked, and classified using the TAMS algorithm for the period of 21–25 November 2023, during which severe flooding was observed across the region. The model captures key MCS characteristics, including their general westward propagation and typical lifespans, although it produces higher rainfall magnitudes, consistent with previous studies (e.g., Raghavendra et al., 2022; Feng et al., 2023b). Among the identified MCSs, one long-lived and long-track MCC is well represented in terms of its timing and location, demonstrating the model's capability to simulate MCS in the Congo Basin.
Two MCC cases – one over the southern mountainous region (MCC-south) and the other over the northern lowland forests (MCC-north) – are compared to examine the distinct environmental factors influencing MCC developments. Overall, MCC-south is larger in size, longer in duration, and moves over a longer distance than MCC-north. These differences are accompanied by higher CAPE and greater low- to mid-level MSE in MCC-south. The contrasting behavior is particularly evident during the mid-stage of each system: MCC-south shows enhanced convection associated with strong lower- to mid-level convergence and sustained updrafts, whereas MCC-north exhibits decreased convection, linked to low-level divergence. These differences reflect the role of vertical wind shear in MCC developments and its potential balance with the cold pool. MCC-south is associated with a more favorable pre-existing shear structure extending up to ∼ 400 km ahead of the system, which exhibits a strong association with Tb variability, along with a moderate cold pool that provides a supportive environment for MCC developments according to RKW theory. In contrast, MCC-north is primarily influenced by wind shear near the system center and a stronger cold pool characterized by a temperature drop of up to 4 K and a zonal extent of ∼ 300 km, both of which may inhibit MCC developments. Finally, while AEJ supports favorable shear (correlation > 0.7), an intensified jet may suppress low-level westerlies and weaken convection.
Compared to previous studies that examined the relationship between Congo Basin MCSs and environmental factors without quantitative investigations based on MCS tracks (e.g., Laing and Fritsch, 1993; Nguyen and Duvel, 2008; Jackson et al., 2009; Laing et al., 2011; Hartman, 2020; Mba et al., 2022; Nicholson, 2022; Kigotsi et al., 2022; Solimine et al., 2022; Andrews et al., 2024), this study provides a process-level view of the initiation, development, and propagation of MCSs in relation to environmental conditions closely tied to MCS tracks, underscoring the importance of convection-permitting simulations. In contrast to Raghavendra et al. (2022), who employed WRF to study MCSs in the Congo Basin, this study objectively identifies, tracks, and classifies MCSs using an automated algorithm, ensuring all analyses are based on well-captured MCS tracks. Furthermore, the roles of vertical wind shear and the AEJ in MCS developments are investigated.
This study has demonstrated the capability of MPAS-A with refined high-resolution mesh in addressing a major knowledge gap in understanding MCSs and associated rainfall over the Congo Basin, an important region for global terrestrial water and ecosystems, where populations are among the most vulnerable globally. The insights gained have the potential to inform broader applications in other regions, particularly those lacking dense gauge networks. Ultimately, this work advocates for the use of state-of-the-art global cloud-resolving models to advance our understanding of MCSs, given their significant role in driving weather extremes and associated hazards with direct implications for socio-economic stability and human well-being.
One caveat of this study is the relatively short simulation period and the limited number of MCS categories, particularly MCCs, which are represented by only two cases. We focus on the period from 21–25 November in 2023 because of the extreme runoff anomalies observed over the Congo Basin during this time. Although the ensemble simulations are not shown here, we performed additional experiments to ensure that our conclusions are not affected by model stochasticity (Sect. 2.2). Because the results from the sensitivity tests closely resemble those of the unperturbed simulation, only the latter is presented in this study. Nevertheless, this caveat should be noted: while the results appear robust for the short analyzed period, the results from other MCS events or longer simulation periods may behave differently. As a follow-up of this study, we will examine additional MCS cases over a much longer simulation period and perform multiple ensemble simulations using initial conditions from the Global Ensemble Forecast System (GEFS). We will also explicitly examine the influence of large-scale atmospheric dynamic fields and land surface conditions (especially the role of land–atmosphere interaction) on MCSs over the Congo Basin through numerical experiments by MPAS-A (e.g., Koster et al., 2004; Imamovic et al., 2017; Núñez Ocasio et al., 2024). In addition, we will conduct spatial–temporal, process-based research by incorporating future climate states and perturbing MPAS-A to better understand orographic, dynamic, and thermodynamic processes, as well as diurnal cycles (e.g., Alber et al., 2021).
All the data used in this study are freely available online. The links to the data are provided in the reference. The modified MPAS version 8 to output isobaric variables following MPAS developers can be found at https://doi.org/10.5281/zenodo.13696552 (Duda et al., 2024; Núñez Ocasio et al., 2025). The latest version of TAMS is in https://doi.org/10.5281/zenodo.15353123 (Moon and Núñez Ocasio, 2025). The code and MPAS's outputs have been uploaded in https://doi.org/10.5281/zenodo.15758254 (Zhao, 2025).
SZ designed and performed observational analyses and model experiments and prepared the manuscript. RF designed the concepts and analyses of the manuscript. KNO, RN, CH, and JZ provide feedback and advice on MCS tracking, model experimental designs, and technical issues. XJ, JT, and other authors revised the manuscript and provided helpful comments.
The contact author has declared that none of the authors has any competing interests.
Publisher's note: Copernicus Publications remains neutral with regard to jurisdictional claims made in the text, published maps, institutional affiliations, or any other geographical representation in this paper. While Copernicus Publications makes every effort to include appropriate place names, the final responsibility lies with the authors. Views expressed in the text are those of the authors and do not necessarily reflect the views of the publisher.
We thank the editor and two anonymous reviewers for their insightful comments. This study is mainly supported by the U.S. National Science Foundation (Award AGS-2404970, AGS-1917781, and AGS-1916619). Computing and data storage resources, including the Derecho supercomputer, were provided by the Computational and Information Systems Lab at the National Center for Atmospheric Research. Part of this research was carried out at the Jet Propulsion Laboratory, California Institute of Technology, under a contract with the National Aeronautics and Space Administration.
This research has been financially supported by the Directorate for Geosciences, Division of Atmospheric and Geospace Sciences (grant nos. AGS-2404970 and AGS-1917781).
This paper was edited by Blaž Gasparini and reviewed by two anonymous referees.
Alber, K., Zhou, L., and Raghavendra, A.: A shift in the diurnal timing and intensity of deep convection over the Congo Basin during the past 40 years, Atmospheric Research, 264, 105869, https://doi.org/10.1016/j.atmosres.2021.105869, 2021.
Aloysius, N. R., Sheffield, J., Saiers, J. E., Li, H., and Wood, E. F.: Evaluation of historical and future simulations of precipitation and temperature in central Africa from CMIP5 climate models, Journal Geophysical Research: Atmospheres, 121, 130–152, https://doi.org/10.1002/2015JD023656, 2016.
Andrews, P. C., Cook, K. H., and Vizy, E. K.: Mesoscale convective systems in the Congo Basin: seasonality, regionality, and diurnal cycles, Climate Dynamics, 62, 609–630, https://doi.org/10.1007/s00382-023-06903-7, 2024.
Barendrecht, M. H., Matanó, A., Mendoza, H., Weesie, R., Rohse, M., Koehler, J., de Ruiter, M., Garcia, M., Mazzoleni, M., Aerts, J. C. J. H., Ward, P. J., Di Baldassarre, G., Day, R., and Van Loon, A. F.: Exploring drought-to-flood interactions and dynamics: A global case review, WIREs Water, 11, e1726, https://doi.org/10.1002/wat2.1726, 2024.
Barnes, H. C. and Houze, R. A.: The precipitating cloud population of the Madden-Julian Oscillation over the Indian and west Pacific Oceans, Journal of Geophysical Research: Atmospheres, 118, 6996–7023, https://doi.org/10.1002/jgrd.50375, 2013.
Brummett, R., Tanania, C., Pandi, A., Ladel, J., Munzini, Y., and Russell, A.: Ressources en eau et biens et services liés à l'écosystème forestier, in: Les forêts du Bassin du Congo, edited by: Wasseige, C., Devers, D., de Marcen, P., Eba'a Atyi, R., Nasi, R., and Mayaux, P., Office des publications de l'Union européenne, Luxembourg, https://doi.org/10.2788/32456, 2009.
Chakraborty, S., Sullivan, S. C., and Feng, Z.: An Overview of Mesoscale Convective Systems: Global Climatology, Satellite Observations, and Modeling Strategies, in: Clouds and Their Climatic Impacts, edited by: Sullivan, S. C. and Hoose, C., https://doi.org/10.1002/9781119700357.ch9, 2023.
Chen, M., Shi, W., Xie, P., Silva, V. B. S., Kousky, V. E., and Higgins, R. W.: Assessing objective techniques for gauge-based analyses of global daily precipitation, Journal of Geophysical Research Atmospheres, 113, https://doi.org/10.1029/2007JD009132, 2008.
Chen, X., Leung, L. R., Feng, Z., and Song, F.: Crucial Role of Mesoscale Convective Systems in the Vertical Mass, Water, and Energy Transports of the South Asian Summer Monsoon, Journal of Climate, 35, 91–108, https://doi.org/10.1175/JCLI-D-21-0124.1, 2022.
Chen, X., Leung, L. R., Feng, Z., and Yang, Q.: Environmental controls on MCS lifetime rainfall over tropical oceans, Geophysical Research Letters, 50, e2023GL103267, https://doi.org/10.1029/2023GL103267, 2023.
CICOS: Cahiers des statistiques sur les incidents et accidents et sur les flux de marchandises de 2011–2012, https://www.cicos.int/actualites/flux-des-marchandises-et-accidents-fluviaux-dans-lespace-cicos-vers-des-statistiques-plus-fiables/ (last access: 20 November 2025), 2012.
Clavner, M., Cotton, W. R., van den Heever, S. C., Saleeby, S. M., and Pierce, J. R.: The response of a simulated mesoscale convective system to increased aerosol pollution: Part I: Precipitation intensity, distribution, and efficiency, Atmospheric Research, 199, 193–208, https://doi.org/10.1016/j.atmosres.2017.08.010, 2018.
Creese, A. and Washington, R.: Using qflux to constrain modeled Congo Basin rainfall in the CMIP5 ensemble, Journal of Geophysical Research: Atmospheres, 121, 13415–13442, https://doi.org/10.1002/2016jd025596, 2016.
Creese, A. and Washington, R.: A process-based assessment of CMIP5 rainfall in The Congo Basin: the September–November rainy season, Journal of Climate, 31, 7417–7439, https://doi.org/10.1175/JCLI-D-17-0818.1, 2018.
Creese, A., Washington, R., and Munday, C.: The plausibility of September-October-November Congo Basin rainfall change in coupled climate models, Journal of Geophysical Research: Atmospheres, 124, 5822–5846, https://doi.org/10.1029/2018JD029847, 2019.
Davies, R.: Flooding in the Democratic Republic of the Congo and Congo-Brazzaville, January 2024, Copernicus, https://global-flood.emergency.copernicus.eu/news/159-flooding-in-the-democratic-republic-of-the-congo-and-congo-brazzaville-january-2024/ (last access: 20 November 2025), 2024.
Duda, M., Jacobsen, D., Petersen, M., Hoffman, M., Turner, A. K., Asay-Davis, X., Ringler, T., Van Roeke, L., Curry, M., Lipscomb, W., Price, S., skamaroc, Jeffery, N., Heinzeller, D., Woodring, J., Wolfram, P. J., maltrud, Saenz, J., Dickerson, G. D., Nick, weiwangncar, mperego, Mametjanov, A., Werner, K., Wolfe, J., Jones, P., Foucar, J., Larofeticus, and Ha11, S.: knubez/MPAS-Model: MPAS v8.0.1-isolevels, Zenodo [code], https://doi.org/10.5281/zenodo.13696552, 2024
Dyer, E. L. E., Jones, D. B. A., Nusbaumer, J., Li, H., Collins, O., Vettoretti, G., and Noone, D.: Congo Basin precipitation: Assessing seasonality, regional interactions, and sources of moisture, Journal of Geophysical Research: Atmospheres, 122, 6882–6898, https://doi.org/10.1002/2016JD026240, 2017.
Evans, J. L. and Shemo, R. E.: A Procedure for Automated Satellite-Based Identification and Climatology Development of Various Classes of Organized Convection, Journal of Applied Meteorology and Climatology, 35, 638-652, https://doi.org/10.1175/1520-0450(1996)035<0638:APFASB>2.0.CO;2, 1996.
Feng, Z., Houze, R. A., Jr., Leung, L. R., Song, F., Hardin, J. C., Wang, J., Gustafson Jr., W. I., and Homeyer, C. R.: Spatiotemporal Characteristics and Large-Scale Environments of Mesoscale Convective Systems East of the Rocky Mountains, Journal of Climate, 32, 7303-7328, https://doi.org/10.1175/JCLI-D-19-0137.1, 2019.
Feng, Z., Leung, L. R., Liu, N., Wang, J., Houze, R. A., Li, J., Hardin, J. C., Chen D., and Guo, J.: A global high-resolution mesoscale convective system database using satellite-derived cloud tops, surface precipitation, and tracking, Journal of Geophysical Research: Atmospheres, 126, https://doi.org/10.1029/2020JD034202, 2021.
Feng, Z., Leung, L. R., Hardin, J., Terai, C. R., Song, F., and Caldwell, P.: Mesoscale convective systems in DYAMOND global convection-permitting simulations, Geophysical Research Letters, 50, e2022GL102603, https://doi.org/10.1029/2022gl102603, 2023a.
Feng, Z., Hardin, J., Barnes, H. C., Li, J., Leung, L. R., Varble, A., and Zhang, Z.: PyFLEXTRKR: a flexible feature tracking Python software for convective cloud analysis, Geosci. Model Dev., 16, 2753–2776, https://doi.org/10.5194/gmd-16-2753-2023, 2023b.
Feng, Z., Prein, A. F., Kukulies, J., Fiolleau, T., Jones, W. K., Maybee, B., Moon, Z. L., Núñez Ocasio, K. M., Dong, W., Molina, M. J., Albright, M. G., Rajagopal, M., Robledo, V., Song, J., Song, F., Leung, L. R., Varble, A. C., Klein, C., Roca, R., Feng, R., and Mejia, J. F.: Mesoscale convective systems tracking method intercomparison (MCSMIP): Application to DYAMOND global km-scale simulations, Journal of Geophysical Research: Atmospheres, 130, e2024JD042204, https://doi.org/10.1029/2024JD042204, 2025.
Fotso-Kamga, G., Fotso-Nguemo, T. C., Diallo, I., Yepdo, Z. D., Pokam, W. M., Vondou, D. A., and Lenouo, A.: An evaluation of COSMO-CLM regional climate model in simulating precipitation over Central Africa, International Journal of Climatology, 40, 2891–2912, https://doi.org/10.1002/joc.6372, 2020.
Hamilton, H. L., Young, G. S., Evans, J. L., Fuentes, J. D., and Núñez Ocasio, K. M.: The relationship between the Guinea Highlands and the West African offshore rainfall maximum, Geophys. Res. Lett., 44, 1158–1166, https://doi.org/10.1002/2016GL071170, 2017.
Hamilton, H. L., Núñez Ocasio, K. M., Evans, J. L., Young, G. S., and Fuentes, J. D.: Topographic influence on the African Easterly Jet and African Easterly Wave energetics, Journal of Geophysical Research: Atmospheres, 125, e2019JD032138, https://doi.org/10.1029/2019JD032138, 2020.
Hartman, A. T.: Tracking mesoscale convective systems in central equatorial Africa, International Journal of Climatology, 41, 469–482, https://doi.org/10.1002/joc.6632, 2020.
Hersbach, H., Bell, B., Berrisford, P., Hirahara, S., Horányi, A., Muñoz-Sabater, J., Nicolas, J., Peubey, C., Radu, R., Schepers, D., Simmons, A., Soci, C., Abdalla, S., Abellan, X., Balsamo, G., Bechtold, P., Biavati, G., Bidlot, J., Bonavita, M., De Chiara, G., Dahlgren, P., Dee, D., Diamantakis, M., Dragani, R., Flemming, J., Forbes, R., Fuentes, M., Geer, A., Haimberger, L., Healy, S., Hogan, R. J., Hólm, E., Janisková, M., Keeley, S., Laloyaux, P., Lopez, P., Lupu, C., Radnoti, G., de Rosnay, P., Rozum, I., Vamborg, F., Villaume, S., and Thépaut, J.-N.: The ERA5 global reanalysis, Quarterly Journal of the Royal Meteorological Society, 146, 1999–2049, https://doi.org/10.1002/qj.3803, 2020.
Hobbs, P. V. and J. M. Wallace: Atmospheric Science: An Introductory Survey, 2nd edn., Academic Press, 86 pp., ISBN 0-12-732951-X, 2006.
Hong, S. Y. and Lim, J.: The WRF single-moment 6-class microphysics scheme (WSM6), Journal of the Korean Meteorological Society, 42, 129–151, 2006.
Hong, S., Noh, Y., and Dudhia, J.: A New Vertical Diffusion Package with an Explicit Treatment of Entrainment Processes, Monthly Weather Review, 134, 2318–2341, https://doi.org/10.1175/MWR3199.1, 2006.
Hopsch, S. B., Thorncroft, C. D., and Tyle, K. R.: Analysis of African Easterly Wave Structures and Their Role in Influencing Tropical Cyclogenesis, Monthly Weather Review, 138, 1399–1419, https://doi.org/10.1175/2009MWR2760.1, 2010.
Houze, R. A.: Mesoscale convective systems, Reviews of Geophysics, 42, RG4003, https://doi.org/10.1029/2004RG000150, 2004.
Houze, R. A.: 100 years of research on mesoscale convective systems, Meteorological Monographs, 59, 17.1–17.54, https://doi.org/10.1175/amsmonographs-d-18-0001.1, 2018.
Huffman, G. J., Stocker, E. F., Bolvin, D. T., Nelkin, E. J., and Tan, J.: GPM IMERG Final Precipitation L3 Half Hourly 0.1 degree x 0.1 degree V07, Greenbelt, MD, Goddard Earth Sciences Data and Information Services Center (GES DISC) [data set], https://doi.org/10.5067/GPM/IMERG/3B-HH/07, 2023.
Hughes, D. A.: Comparison of satellite rainfall data with observations from gauging station networks, Journal of Hydrology, 327, 399–410, https://doi.org/10.1016/j.jhydrol.2005.11.041, 2006.
Iacono, M. J., Delamere, J. S., Mlawer, E. J., Shephard, M. W., Clough, S. A., and Collins, W. D.: Radiative forcing by long-lived greenhouse gases: Calculations with the AER radiative transfer models, Journal of Geophysical Research, 113, D13103, https://doi.org/10.1029/2008JD009944, 2008.
Imamovic, A., Schlemmer, L., and Schär, C.: Collective impacts of orography and soil moisture on the soil moisture-precipitation feedback, Geophysical Research Letters, 44, 11682–11691, https://doi.org/10.1002/2017GL075657, 2017
Jackson, B., Nicholson, S. E., and Klotter, D.: Mesoscale Convective Systems over Western Equatorial Africa and Their Relationship to Large-Scale Circulation, Monthly Weather Review, 137, 1272–1294, https://doi.org/10.1175/2008MWR2525.1, 2009.
Janowiak, J., Joyce, B., and Xie, P.: NCEP/CPC L3 Half Hourly 4km Global (60S–60N) Merged IR V1, Edited by Andrey Savtchenko, Greenbelt, MD, Goddard Earth Sciences Data and Information Services Center (GES DISC) [data set], https://doi.org/10.5067/P4HZB9N27EKU, 2017.
Jiménez, P. A., Dudhia, J., González-Rouco, J. F., Navarro, J., Montávez, J. P., and García-Bustamante, E.: A Revised Scheme for the WRF Surface Layer Formulation, Monthly Weather Review, 140, 898–918, https://doi.org/10.1175/MWR-D-11-00056.1, 2012.
Joachim, E. I., Vanel, A. R., and Youssif, G. T.: Climate Change and Urban Risks: Understanding and Analysing the Vulnerability of the City Of Brazzaville in the Republic Of Congo to Flooding in 2023, Pakistan Journal of Life and Social Sciences, 22, 8907–8918, https://doi.org/10.57239/PJLSS-2024-22.2.00673, 2024.
Kigotsi, J. K., Soula, S., Kazadi, A. B. M., and Zana, A. N.: Contribution to the study of thunderstorms in the Congo Basin: Analysis of periods with intense activity, Atmospheric Research, 269, 106013, https://doi.org/10.1016/j.atmosres.2021.106013, 2022.
Kirshbaum, D. J., Sindhu, K. D., and Turner, D. D.: An Observational Evaluation of RKW Theory over the U.S. Southern Great Plains, Journal of the Atmospheric Sciences, 82, 1341–1360, https://doi.org/10.1175/JAS-D-24-0185.1, 2025.
Koster, R. D., Dirmeyer, P., Guo, Z., Bonan, G., Chan, E., Cox, P., Gordon, C. T., Kanae, S., Kowalczyk, E., Lawrence, D., Liu, P., Lu, C.-H., Malyshec, S., McAvaney, B., Mitchell, K., Mocko, D., Oki, T., Oleson, K., Pitman, A., Sud, Y. C., Taylor, C. M., Verseghy, D., Vasic, R., Xue, Y., and Yamada, T.: Regions of Strong Coupling Between Soil Moisture and Precipitation, Science, 305, 1138–1140, https://doi.org/10.1126/science.1100217, 2004.
Kunkel, K. E., Easterling, D. R., Kristovich, D. A. R., Gleason, B., Stoecker, L., and Smith, R.: Meteorological Causes of the Secular Variations in Observed Extreme Precipitation Events for the Conterminous United States, Journal of Hydrometeorology, 13, 1131–1141, https://doi.org/10.1175/JHM-D-11-0108.1, 2012.
Laing, A. G. and Fritsch, J. M.: Mesoscale Convective Complexes in Africa, Monthly Weather Review, 121.8, 2254–2263, https://doi.org/10.1175/1520-0493(1993)121<2254:MCCIA>2.0.CO;2, 1993.
Laing, A. G. and Fritsch, J. M.: The global population of mesoscale convective complexes, Quarterly Journal of the Royal Meteorological Society, 123, 389–405, https://doi.org/10.1002/qj.49712353807, 1997.
Laing, A. G., Carbone, R. E., and Levizzani, V. : Cycles and propagation of deep convection over equatorial Africa, Monthly Weather Review, 139, 2832–2853, https://doi.org/10.1175/2011mwr3500.1, 2011.
Lee, C., Cheung, K. K. W., Hui, J. S. N., and Elsberry, R. L.: Mesoscale Features Associated with Tropical Cyclone Formations in the Western North Pacific, Monthly Weather Review, 136, 2006–2022, https://doi.org/10.1175/2007MWR2267.1, 2008.
Li, B., Beaudoing, H., and Rodell, M.: NASA/GSFC/HSL: GLDAS Catchment Land Surface Model L4 daily 0.25 x 0.25 degree GRACE-DA1 V2.2, Greenbelt, Maryland, USA, Goddard Earth Sciences Data and Information Services Center (GES DISC) [data set], https://doi.org/10.5067/TXBMLX370XX8, 2020.
Maddox, R. A.: Meoscale convective complexes, Bulletin of the American Meteorological Society, 61, 1374–1400, https://doi.org/10.1175/1520-0477(1980)061<1374:MCC>2.0.CO;2, 1980.
Mayta, V. C., Adames Corraliza, Á. F., Torres Maldonado, K., Luo, H., and Núñez Ocasio, K. M.: Thermodynamic Processes Governing the Evolution of Developing and Strong Nondeveloping African Easterly Waves, Journal of the Atmospheric Sciences, 82, 1161–1174, https://doi.org/10.1175/JAS-D-24-0125.1, 2025.
Mba, W. P., Vondou, D. A., and Kamsu-Tamo, P. H.: Central African Climate, in: Congo Basin Hydrology, Climate, and Biogeochemistry, edited by: Tshimanga, R. M., N'kaya, G. D. M., and Alsdorf, D., https://doi.org/10.1002/9781119657002.ch2, 2022.
Mohr, K. I., Famiglietti, J. S., and Zipser, E. J.: The contribution to tropical rainfall with respect to convective system type, size, and intensity estimated from the 85-GHz ice-scattering signature, Journal of Applied Meteorology, 38, 596–606, https://doi.org/10.1175/1520-0450(1999)038<0596:TCTTRW>2.0.CO;2, 1999.
Moon, Z. and Núñez Ocasio, K. M.: knubez/TAMS: v0.1.7, Zenodo [code], https://doi.org/10.5281/zenodo.15353123, 2025.
Muetzelfeldt, M. R., Plant, R. S., Christensen, H. M., Zhang, Z., Woollings, T., Feng, Z., and Li, P.: Environmental Conditions Affecting Global Mesoscale Convective System Occurrence, Journal of the Atmospheric Sciences, 82, 391–407, https://doi.org/10.1175/JAS-D-24-0058.1, 2025.
Nguyen, H. and Duvel, J. P.: Synoptic wave perturbations and convective systems over equatorial Africa, Journal of Climate, 21, 6372–6388, https://doi.org/10.1175/2008JCLI2409.1, 2008.
Nicholson, S. E.: The ITCZ and the seasonal cycle over equatorial Africa, Bulletin of the American Meteorological Society, 99, 337–348, https://doi.org/10.1175/BAMS-D-16-0287.1, 2018.
Nicholson, S. E.: The Rainfall and Convective Regime over Equatorial Africa, with Emphasis on the Congo Basin, American Geophysical Union (AGU), 25–48, https://doi.org/10.1002/9781119657002.CH3, 2022.
Nicholson, S. E., Klotter, D., Dezfuli, A. K., and Zhou, L.: New Rainfall Datasets for the Congo Basin and Surrounding Regions, Journal of Hydrometeorology, 19, 1379–1396, https://doi.org/10.1175/JHM-D-18-0015.1, 2018.
Niu, G.-Y., Yang, Z.-L., Mitchell, K. E., Chen, F., Ek, M. B., Barlage, M., Kumar, A., Manning, K., Niyogi, D., Rosero, E., Tewari, M., and Xia, Y.: The community Noah land surface model with multiparameterization options (Noah-MP): 1. Model description and evaluation with local-scale measurements, Journal of Geophysical Research, 116, D12109, https://doi.org/10.1029/2010JD015139, 2011.
N'kaya, G. D. M., Laraque, A., Paturel, J.-E., Guzanga, G. G., Mahé, G., and Tshimanga, R. M.: A New Look at Hydrology in the Congo Basin, Based on the Study of Multi-Decadal Time Series, in: Congo Basin Hydrology, Climate, and Biogeochemistry, edited by: Tshimanga, R. M., N'kaya, G. D. M., and Alsdorf, D., https://doi.org/10.1002/9781119657002.ch8, 2022.
Núñez Ocasio, K. M. and Dougherty, E. M.: The effect of pseudo-global warming on the weather-climate system of Africa in a convection-permitting model, Geophysical Research Letters, 51, e2024GL112341, https://doi.org/10.1029/2024GL112341, 2024.
Núñez Ocasio, K. M. and Moon, Z. L.: TAMS: a tracking, classifying, and variable-assigning algorithm for mesoscale convective systems in simulated and satellite-derived datasets, Geosci. Model Dev., 17, 6035–6049, https://doi.org/10.5194/gmd-17-6035-2024, 2024.
Núñez Ocasio, K. M. and Rios-Berrios, R.: African easterly wave evolution and tropical cyclogenesis in a pre-Helene (2006) hindcast using the Model for Prediction Across Scales-Atmosphere (MPAS-A).,Journal of Advances in Modeling Earth Systems, 15, e2022MS003181, https://doi.org/10.1029/2022MS003181, 2023.
Núñez Ocasio, K. M., Evans, J. L., and Young, G. S.: A wave-relative framework analysis of AEW–MCS interactions leading to tropical cyclogenesis, Monthly Weather Review, 148, 4657–4671, https://doi.org/10.1175/MWR-D-20-0152.1, 2020a.
Núñez Ocasio, K. M., Evans, J. L., and Young, G. S.: Tracking Mesoscale Convective Systems that are Potential Candidates for Tropical Cyclogenesis, Monthly Weather Review, 148, 655–669, https://doi.org/10.1175/MWR-D-19-0070.1, 2020b.
Núñez Ocasio, K. M., Brammer, A., Evans, J. L., Young, G. S., and Moon, Z. L.: Favorable monsoon environment over eastern Africa for subsequent tropical cyclogenesis of African easterly waves, Journal of the Atmospheric Sciences, 78, 2911–2925, https://doi.org/10.1175/JAS-D-20-0339.1, 2021.
Núñez Ocasio, K. M., Davis, C. A., Moon, Z. L., and Lawton, Q. A.: Moisture dependence of an african easterly wave within the west african monsoon system, Journal of Advances in Modeling Earth Systems, 16, e2023MS004070, https://doi.org/10.1029/2023MS004070, 2024.
Núñez Ocasio, K. M., Dougherty, E. M., Moon, Z. L., and Davis, C. A.: Response of African easterly waves to a warming climate: A convection-permitting approach, Journal of Advances in Modeling Earth Systems, 17, e2025MS005146, https://doi.org/10.1029/2025MS005146, 2025.
Peters, J. M. and Schumacher, R. S.: Dynamics governing a simulated mesoscale convective system with a training convective line, Journal of the Atmospheric Sciences, 73, 2643–2664, https://doi.org/10.1175/JAS-D-15-0199.1, 2016.
Pokam, W. M., Bain, C. L., Chadwick, R. S., Graham, R., Sonwa, D. J., and Kamga, F. M.: Identification of Processes Driving Low-Level Westerlies in West Equatorial Africa, Journal of Climate, 27, 4245–4262, https://doi.org/10.1175/JCLI-D-13-00490.1, 2014.
Prein, A. F., Feng, Z., Fiolleau, T., Moon, Z. L., Núñez Ocasio, K. M., Kukulies, J., Roca, R., Varble, A. C., Rehbein, A., Liu, C., Ikeda, K., Mu, Y., and Rasmussen, R. M.: Km-scale simulations of mesoscale convective systems over South America – A feature tracker intercomparison, Journal of Geophysical Research: Atmospheres, 129, e2023JD040254, https://doi.org/10.1029/2023JD040254, 2024.
Raghavendra, A., Xia, G., Zhou, L., and Jiang, Y.: Orographic enhancement of rainfall over the Congo Basin, Atmospheric Science Letters, 23, e1079, https://doi.org/10.1002/asl.1079, 2022.
Rasmussen, K. L., Chaplin, M. M. , Zuluaga, M. D., and Houze Jr., R. A.,: Contribution of Extreme Convective Storms to Rainfall in South America, Journal of Hydrometeorology, 17, 353–367, https://doi.org/10.1175/JHM-D-15-0067.1, 2016.
Rehbein, A., Ambrizzi, T., Mechoso, C. R., Espinosa, S. A. I., and Myers, T. A.: Mesoscale convective systems over the Amazon basin: The GoAmazon2014/5 program, International Journal of Climatology, 39, 5599–5618, https://doi.org/10.1002/joc.6173, 2019.
Rotunno, R., Klemp, J. B., and Weisman, M. L.: A Theory for Strong, Long-Lived Squall Lines, Journal of Atmospheric Sciences, 45, 463–485, https://doi.org/10.1175/1520-0469(1988)045<0463:ATFSLL>2.0.CO;2, 1988.
Satoh, M., Stevens, B., Judt, F., Khairoutdinov, M., Lin, S.-J., Putman, W. M., and Duben, P.: Global cloud-resolving models, Current Climate Change Reports, 5, 172–184, https://doi.org/10.1007/s40641-019-00131-0, 2019.
Schumacher, R. S. and Rasmussen, K. L.: The formation, character and changing nature of mesoscale convective systems, Nature Reviews Earth & Environment, 1, 300–314, https://doi.org/10.1038/s43017-020-0057-7, 2020.
Schumann, G. J.-P., Moller, D. K., Croneborg-Jones, L., and Andreadis, K. M.: Reviewing Applications of Remote Sensing Techniques to Hydrologic Research in Sub-Saharan Africa, with a Special Focus on the Congo Basin, in: Congo Basin Hydrology, Climate, and Biogeochemistry, edited by: Tshimanga, R. M., N'kaya, G. D. M., and Alsdorf, D., https://doi.org/10.1002/9781119657002.ch16, 2022.
Skamarock, W. C., Klemp, J. B., Duda, M. G., Fowler, L. D., Park, S., and Ringler, T. D.: A Multiscale Nonhydrostatic Atmospheric Model Using Centroidal Voronoi Tesselations and C-Grid Staggering, Monthly Weather Review, 140, 3090–3105, https://doi.org/10.1175/MWR-D-11-00215.1, 2012.
Smith, B. T., Thompson, R. L., Grams, J. S., Broyles, C., and Brooks, H. E.: Convective Modes for Significant Severe Thunderstorms in the Contiguous United States. Part I: Storm Classification and Climatology, Weather and Forecasting, 27, 1114–1135, https://doi.org/10.1175/WAF-D-11-00115.1, 2012.
Solimine, S. L., Zhou, L., Raghavendra, A., and Cai, Y.: Relationships between intense convection, lightning, and rainfall over the interior Congo Basin using TRMM data, Atmospheric Research, 273, 106164, https://doi.org/10.1016/j.atmosres.2022.106164, 2022.
Stevens, B., Satoh, M., Auger, L., Biercamp, J., Bretherton, C. S., Chen, X., Düben, P., Judt, F., Khairoutdinov, M., Klocke, D., Kodama, C., Kornblueh, L., Lin, S.-J., Neumann, P., Putman, W. M., Röber, N., Shibuya, R., Vanniere, B., Vidale, P. L., Wedi, N., and Zhou, L.: DYAMOND: The DYnamics of the Atmospheric general circulation Modeled On Non-hydrostatic Domains, Prog. Earth Planet. Sci., 6, 61, https://doi.org/10.1186/s40645-019-0304-z, 2019.
Sullivan, S. C., Schiro, K. A., Stubenrauch, C., and Gentine, P.: The response of tropical organized convection to El Niño warming, Journal of Geophysical Research: Atmospheres, 124, 8481–8500, https://doi.org/10.1029/2019JD031026, 2019.
Sultan, B., Janicot, S., and Diedhiou, A.: The West African monsoon dynamics. Part I: Documentation of intraseasonal variability, Journal of Climate, 16, 3389–3406, https://doi.org/10.1175/1520-0442(2003)016<3389:TWAMDP>2.0.CO;2, 2003.
Trismidianto, Yulihastin, E., Satyawardhana, H., Nugroho, J. T., and Ishida, S.: The contribution of the mesoscale convective complexes (MCCs) to total rainfall over indonesian maritime continent, Earth and Environmental Science, 54, 012027, https://doi.org/10.1088/1755-1315/54/1/012027, 2017.
Tsakraklides, G. and Evans, J. L.: Global and Regional Diurnal Variations of Organized Convection, Journal of Climate, 16, 1562–1572, https://doi.org/10.1175/1520-0442(2003)016<1562:GARDVO>2.0.CO;2, 2003.
Tshimanga, R. M., Tshitenge, J. M., Kabuya, P., Alsdorf, D., Mahe, G., Kibukusa, G., and Lukanda V.: A regional perceptive of flood forecasting and disaster management systems for the Congo River Basin, in: Flood Forecasting: A Global Perspective, edited by: Adams, T. E. and Pagano, T. C., Elsevier, ISBN 978-0-12-801884-2, 2016.
Tshimanga, R. M., N'kaya, G. D. M., Laraque, A., Nicholson, S. E., Onema, J.-M. K., Lumbuenamo, R., and Alsdorf, D.: Congo Basin Research, in: Congo Basin Hydrology, Climate, and Biogeochemistry, edited by: Tshimanga, R. M., N'kayam G. D. M., and Alsdorf, D., https://doi.org/10.1002/9781119657002.ch1, 2022.
Uccellini, L. W. and Johnson, D. R.: The Coupling of Upper and Lower Tropospheric Jet Streaks and Implications for the Development of Severe Convective Storms, Monthly Weather Review, 107, 682–703, https://doi.org/10.1175/1520-0493(1979)107<0682:TCOUAL>2.0.CO;2, 1979.
Wang, W.: Forecasting Convection with a “Scale-Aware” Tiedtke Cumulus Parameterization Scheme at Kilometer Scales, Weather and Forecasting, 37, 1491–1507, https://doi.org/10.1175/WAF-D-21-0179.1, 2022.
Washington, R., James, R., Pearce, H., Pokam, W. M., and Moufouma-Okia, W.: Congo basin rainfall climatology: Can we believe the climate models?, Philosophical Transactions of the Royal Society B: Biological Sciences, 368, https://doi.org/10.1098/rstb.2012.0296, 2013.
Xie, P., Joyce, R., Wu, S., Yoo, S.-H., Yarosh, Y., Sun, F., Lin, R., and NOAA CDR Program: NOAA Climate Data Record (CDR) of CPC Morphing Technique (CMORPH) High Resolution Global Precipitation Estimates, Version 1, NOAA National Centers for Environmental Information [data set], https://doi.org/10.25921/w9va-q159, 2019.
Xu, K.-M. and Randall, D. A.: A Semiempirical cloudiness parameterization for use in climate models, Journal of the Atmospheric Sciences, 53, 3084–3102, 1996.
Yang, G. and Slingo, J.: The Diurnal Cycle in the Tropics, Monthly Weather Review, 129, 784–801, https://doi.org/10.1175/1520-0493(2001)129<0784:TDCITT>2.0.CO;2, 2001.
Yang, W., Seager, R., Cane, M. A., and Lyon, B.: The annual cycle of East African precipitation, Journal of Climate, 28, 2385–2404, https://doi.org/10.1175/JCLI-D-14-00484.1, 2015.
Zhao, S.: Code and Data for “Understanding mesoscale convective processes over the Congo Basin using the Model for Prediction Across Scales-Atmosphere (MPAS-A)”, Zenodo [code and data set], https://doi.org/10.5281/zenodo.15758254, 2025.
Zhao, S. and Fu, R.: The influence of convectively coupled Kelvin waves on Atlantic Niños, Journal of Geophysical Research: Atmospheres, 127, e2021JD036241, https://doi.org/10.1029/2021JD036241, 2022.
Zhao, S. and Zhang, J.: Causal effect of the tropical Pacific sea surface temperature on the upper Colorado River basin spring precipitation, Climate Dynamics, 58, 941–959, https://doi.org/10.1007/s00382-021-05944-0, 2022.
Zuluaga, M. D. and Houze, R. A.: Evolution of the population of precipitating convective systems over the equatorial Indian Ocean in active phases of the Madden-Julian Oscillation, Journal of the Atmospheric Sciences, 70, 2713–2725, https://doi.org/10.1175/JAS-D-12-0311.1, 2013.