the Creative Commons Attribution 4.0 License.
the Creative Commons Attribution 4.0 License.
 | 27 Nov 2025
Uncertainties in fertilizer-induced emissions of soil nitrogen oxide and the associated impacts on ground-level ozone and methane
Yan Wang
Hanqin Tian
Sian Kou-Giesbrecht
Nicolas Vuichard
Sönke Zaehle
Natural and agricultural soils are important sources of nitrogen oxides (NOx), accounting for about 10 %–20 % of the global NOx emissions. The increased application of nitrogen (N) fertilizer in agriculture has strongly enhanced the N availability of soils in the last several decades, leading to higher soil NOx emissions. However, the magnitude of the N fertilizer-induced soil NOx emissions remains poorly constrained due to limited field observations, resulting in divergent estimates. Here we integrate the results from meta-analyses of field manipulation experiments, emission inventories, atmospheric chemistry modelling and terrestrial biosphere modelling to investigate these uncertainties and the associated impacts on ground-level ozone and methane. The estimated present-day global soil NOx emissions induced by N fertilizer application vary substantially (0.84–2.2 Tg N yr−1) among different approaches with different spatial patterns. Simulations with the 3-D global chemical transport model GEOS-Chem demonstrate that N fertilization enhances global surface ozone concentrations during summertime in agricultural hotspots, such as North America, western Europe and eastern and southern Asia by 0.1 to 3.3 ppbv (0.2 %–7.0 %). Our results show that such spreads in soil NOx emissions also affect atmospheric methane concentrations, reducing the global mean by 6.7 (0.4 %) ppbv to 16.6 (0.9 %) ppbv as an indirect consequence of enhanced N fertilizer application. These results highlight the urgent need to improve the predictive understanding of soil NOx emission responses to fertilizer N inputs and its representation in atmospheric chemistry modelling.
- Article
(5593 KB) - Full-text XML
-
Supplement
(1770 KB) - BibTeX
- EndNote


Nitrogen oxides (NOx= NO + NO2), as one of the most important reactive atmospheric components, strongly affect the atmospheric oxidation capacity and further influence air quality (Gong et al., 2020; Zhai et al., 2021; Goldberg et al., 2022; Zhao et al., 2023), radiative forcing (Erisman et al., 2011; Pinder et al., 2012; Gong et al., 2024), as well as carbon (C) storage in terrestrial and marine ecosystems (Fowler et al., 2013; Fleischer et al., 2019; Rubin et al., 2023). The major source of present-day atmospheric NOx is fossil fuel combustion (Martin et al., 2003; Hoesly et al., 2018), but several non-fossil-fuel sources, including emissions from soils, lightning and wildfire (Zhang et al., 2003), contribute around 30 % of the global total NOx emissions (Delmas et al., 1997; Weng et al., 2020). However, these non-fossil-fuel sources have been widely regarded as “natural” sources, where the perturbation by anthropogenic activities as well as the associated potentially significant effects on the N cycle are often overlooked. Meanwhile, strict clean-air actions have been applied in many countries in the past decades to sharply reduce the fossil-fuel sources of NOx (Jiang et al., 2022). As a result, non-fossil sources of NOx will be increasingly important for future clean air policies.
One of the most important non-fossil-fuel anthropogenic sources of NOx is through agricultural activities, which have been estimated to enhance soil NOx emissions by around 5 %–30 % (Wang et al., 2022; Gong et al., 2024). To assess the soil NOx emissions induced by N fertilizer application (hereafter, SNOx-Fer), the most straightforward and widely-used method is applying the emission factor (EF), which indicates the proportion of N from fertilizer application emitted as NOx. The Intergovernmental Panel on Climate Change (IPCC) methodology recommended a constant EF value of 1.1 % with an uncertainty range of 0.06 % to 2.18 % (Buendia et al., 2019). Other studies recommend slightly smaller uncertainty ranges (0.47 % to 1.61 %) based on different meta-analysis datasets (Stehfest and Bouwman, 2006; Liu et al., 2017; Skiba et al., 2021; Wang et al., 2022). This large uncertainty range results from the dependency of the response of soil NOx emissions on intricate soil biogeochemical processes, and it varies with crop types, soil texture, fertilizer types and application rate (Wang et al., 2022). To date, limited field experiments are available to constrain this uncertainty range.
Some studies have suggested using non-linear EF to take account of the observations that the EFs of soil reactive nitrogen gases tend to increase with increasing fertilizer application (Shcherbak et al., 2014; Jiang et al., 2017). Such an approach assumes that plants and soil microbes should have priority in accessing soil available N for their metabolic activities, while the excessive inorganic N can be used by nitrifiers and denitrifiers and loses as the gas form. Such a non-linear EF approach is more ecologically reasonable but there remain large uncertainties in assessing soil NOx due to the limited available field data. For example, Wang et al. (2024) examined the non-linear EF of soil NOx based on a global meta-analysis and found a much lower EF (around 0 %–0.7 %) than the IPCC-recommended linear EF (1.1 %) within the range of normal agricultural crop N fertilizer loading (around 0–600 kg N ha−1 yr−1).
In many of the atmospheric chemical transport models (CTMs), SNOx-Fer is represented by the agriculture sector of NOx emission from an anthropogenic emission inventory (e.g. Emissions Database for Global Atmospheric Research (EDGAR) or Community Emissions Data System (CEDS)), which in general apply the linear EF method to estimate the agricultural NOx emissions (Hoesly et al., 2018; Janssens-Maenhout et al., 2019; Hutchings et al., 2023) with the caveats described above. Furthermore, some advanced CTMs, e.g. the GEOS-Chem model, parametrize soil NOx emissions as a function of N availability as well as soil temperature and soil moisture (Steinkamp and Lawrence, 2011; Hudman et al., 2012). The currently widely used soil NOx scheme, known as the Berkeley-Dalhousie Soil NOx Parameterization (BDSNP), could dynamically simulate the spatiotemporal variations of soil NOx emissions, however, the responses of soil NOx to N fertilizer application are not fully examined (See the detailed parameterization in Sect. 2).
Recently, another approach to modelling SNOx-Fer has emerged with the development of global, process-based terrestrial biosphere models (TBMs) with fully-coupled C and N cycles (Zaehle and Friend, 2010; Tian et al., 2019). Driven by data of N inputs (synthetic N fertilizer, N manure application and N deposition), CO2 concentrations and climate, these TBMs could simulate the coupled cycles of C and N in the terrestrial biosphere, mimic the competition on the available N between plants and microbes and calculate the rates of nitrification and denitrification (Zaehle and Dalmonech, 2011), which are the two microbial processes that determine the rates of soil NOx emissions. Even though TBMs provide a more ecologically-mechanistic description of the terrestrial N cycles, large uncertainties remain among different TBMs due to the varying parameterization and modelling schemes in biome N use strategies, mineralization of organic N, nitrification and denitrification processes (Kou-Giesbrecht et al., 2023), which lead to varied responses of soil NOx to the increased N fertilizer inputs (Gong et al., 2024).
In this study, we attempt to comprehensively quantify the uncertainties in current SNOx-Fer estimates by integrating results from meta-analyses, emission inventories, as well as CTMs and TBMs. We use this understanding to assess the associated effects of SNOx-Fer uncertainties on global O3 and CH4 concentrations. Section 2 will introduce the N synthetic fertilizer and manure input data and the approaches used to estimate SNOx-Fer. Section 3 will introduce the CTM used in this study and the configuration of sensitivity experiments. Section 4 will first show the variations of SNOx-Fer among different approaches as well as the seasonal dynamics, and then analyze the associated uncertainties in global O3 and CH4 simulations. Finally, the conclusion and discussions of this study will be given in Sect. 5.
2.1 Linear and Non-linear EFs and the global fertilizer N dataset
We first implement the most traditional method with a constant EF value to estimate the effects of N fertilizer application on soil NOx emissions, where the value of 1.1 % (1.1 % of N in the fertilizer will be emitted as NOx; named EFlinear hereafter) based on the most up-to-date IPCC methodology is adopted (Buendia et al., 2019). Furthermore, based on the latest meta-analysis dataset developed by Wang et al. (2024), a non-linear EF method (EFnon-linear) to describe the variations of soil NOx emissions with different N fertilizer loadings is also applied:
where the EFnon-linear (%) is the non-linear EF and FertilizerN is the loading of fertilizer N application (kg N ha−1). The detailed derivation of this formula is presented in Wang et al. (2024), which follows a comparable method as presented by Shcherbak et al. (2014).
We used the dataset of History of anthropogenic Nitrogen inputs (HaNi) (Tian et al., 2022) for the global rate of synthetic fertilizer and manure application, in order to estimate SNOx-Fer with both the linear and non-linear EF methods. The HaNi dataset includes grid-level annual loadings of (1) NH-N synthetic fertilizer applied to cropland, (2) NO-N synthetic fertilizer applied to cropland, (3) NH-N synthetic fertilizer applied to pasture, (4) NO-N synthetic fertilizer applied to pasture, (5) manure NH-N application on cropland, (6) manure NO-N application on pasture, (7) manure NH-N deposition on pasture, and (8) manure NO-N deposition on rangeland. We use a global map of land use class distribution (Hurtt et al., 2020) (Fig. S1 in the Supplement) to convert the unit of N loading in HaNi from g N grid−1 to kg N (ha pasture)−1, kg N (ha rangeland)−1 or kg N (ha cropland−1). The annual N inputs from the HaNi dataset, which are summed by all N forms of synthetic fertilizer and manure, are evenly applied in the months of the growing season, while the rates of N inputs are set as zero during the non-growing season. We define the growing season as monthly-mean 2 m temperature greater than 5 °C (based on the MERRA2 reanalyzed dataset, see below Sect. 3) and the grid-level monthly-mean leaf area index (LAI) larger than 0.5 (based on the MODIS remote sensing dataset post-processed by Yuan et al. (2011) and updated for the use of GEOS-Chem, http://geoschemdata.wustl.edu/ExtData/HEMCO/Yuan_XLAI/v2021-06/, last access: 24 November 2025). Finally, the rates of synthetic fertilizer and manure N inputs in units of kg N (ha pasture/rangeland/cropland)−1 month−1 are utilized to estimate global SNOx-Fer with both the linear and non-linear EF approaches (Fig. S2).
2.2 The emissions inventory CEDS
We use the CEDS (Hoesly et al., 2018) for assessing the fertilizer-induced soil NOx emissions in the emission inventories. CEDS is one of the most state-of-the-art emission inventories that comprehensively assesses the sources of dominant air pollutants from the pre-industrial period to the present day, which has been used as the standard emission inventory to drive CMIP6 models. The agricultural NOx emission in CEDS is fromEDGAR 4.3.1 (https://edgar.jrc.ec.europa.eu/, last access: 24 November 2025), where the old IPCC methodology (Eggleston et al., 2006) is used with a constant EF value of 0.7 % (0.7 % of N in the fertilizer will be emitted as NOx) (Janssens-Maenhout et al., 2019).
2.3 The BDSNP scheme
The BDSNP scheme in CTMs was firstly developed by Yienger and Levy (1995), and then updated by Hudman et al. (2012). The emission of soil NOx (Snox) is described as:
where f(T), g(θ) and P(ldry) indicate the effects of temperature, soil moisture and rain pulsing. Aw,biome is the wet biome-dependent emission (the baseline emission) from Steinkamp and Lawrence (2011). Navail is the soil available N mass in the top 10 cm (ng N m−2), which is calculated by:
where the initial soil available N mass Navail(0) is prescribed. FertilizerN is the rate of fertilizer N application, which is set to zero outside the growing season. τ indicates the decay rate and is chosen as 4 months based on the measurements within the top 10 cm of soil (Matson et al., 1998; Cheng et al., 2004; Russell et al., 2011). However, it should be noted that the magnitude of global SNOx-Fer (i.e. the ) is scaled by the factor in Eq. (2) to meet 1.8 Tg N yr−1 before the canopy reduction, which is the value obtained in a previous meta-analysis study based on the fertilizer N input dataset in the 2000s (Stehfest and Bouwman, 2006). As a result, the default BDSNP scheme in GEOS-Chem actually fails to capture the year-to-year variations of soil NOx emissions with the changing soil N availability. However, as the BDSNP scheme is still widely used by the community of atmospheric chemistry modelling (e.g. Lu et al., 2021; Wang et al., 2022; Huber et al., 2023), here we add another sensitivity experiment by scaling the Navail in Eq. (3) following the interannual variations of the HaNi fertilizer loadings:
where FertilizerHaNi(ijyr) represents the total N fertilizer loadings in the HaNi dataset at the grid of i latitude and j longitude in the yr year. With this modification, we could further examine how SNOx-Fer responds to the N fertilizer enhancement in the GEOS-Chem BDSNP scheme.
2.4 The TBM ensemble
Simulated soil NOx emissions were provided by three TBMs (CLASSIC, OCN and ORCHIDEE) with fully-coupled C and N cycles included in the global nitrogen/N2O model inter-comparison project phase 2 (NMIP2) (Tian et al., 2024). For each TBM model, anthropogenic fertilizer applications are estimated by the HaNi dataset (Tian et al., 2022), where the fertilizer types (NH and NO; synthetic fertilizer and manure) are explicitly distinguished in the model. The SNOx-Fer can be isolated by summing up the differences between sensitivity experiments SH1 and SH2 (the synthetic fertilizer contribution) and the differences between sensitivity experiments SH1 and SH3 (the manure contribution) (Table S1 in the Supplement). It should be noted that the CLASSIC model did not isolate synthetic fertilizer and manure and thus only conducted one sensitivity experiment. The model ensemble mean is utilized to smooth the large discrepancies among different TBMs (Fig. S3) due to the varied terrestrial N-cycle representations, in particular, the varied nitrification and denitrification rates.
The GEOS-Chem model is a frequently used state-of-the-art CTM with fully coupled NOx–Ox–hydrocarbon–aerosol chemistry mechanism (Bey et al., 2001; Park et al., 2004). Here we applied version 12.0.0 to run the global simulation with a horizontal resolution of 2° latitude ×2.5° longitude. The simulations are driven by the Version two of modern era retrospective-analysis for research and application (MERRA2) reanalyzed meteorological dataset. The photolysis rates were computed by the Fast-JX scheme (Park et al., 2004). The atmospheric gas-phase chemistry is independently developed referring to the kinetics and products based on JPL recommendations (Bates et al., 2024) and solved by the Kinetic Pre-Processor (KPP) (Henze et al., 2007). Aerosol thermodynamic equilibrium is calculated by the ISORROPIA II package (Fountoukis and Nenes, 2007). In particular, the default soil NOx emissions are simulated by the BDSNP scheme as introduced above.
In order to examine the uncertainties in SNOx-Fer and the associated effects on global surface O3 concentrations, we first ran a reference simulation in 2019 (named Zero) with zero SNOx-Fer to exclude the influence of fertilizer application on soil NOx. Then eleven different experiments were performed by representing SNOx-Fer with CEDS agricultural NOx emissions (named CEDS), the default GEOS-Chem BDSNP scheme (Eqs. 2–3, named BDSNP_coarse), the BDSNP scaled by the interannually varied HaNi N fertilizer loadings (Eq. 4, named BDSNP_coarse_scaled), the default GEOS-Chem BDSNP but with fine resolution of 0.5°×0.625° (named BDSNP_fine), the TBM-simulated SNOx-Fer of each model as well as the ensemble mean (named NMIP2-OCN, NMIP2-CLASSIC, NMIP2-ORCHIDEE and NMIP2, respectively), the linear EF (EF =1.1 %) method (named Linear) and the non-linear EF (Eq. 1) method (named Nonlinear), respectively. In particular, the BDSNP_fine is simulated offline, i.e., the atmospheric chemical and transport processes are not accounted due to the inconsistency of resolutions with the GEOS-Chem runs. All of the sensitivity experiments are driven by the meteorological field in 2019 with 6-month spin up, where the anthropogenic emissions of all other tracers also keep at the 2019 level following the CEDS inventory. Table 1 summarizes the eleven sensitivity experiments in GEOS-Chem.
In order to further examine the seasonality of SNOx-Fer and the associated impacts on ground-level O3 in agricultural hotspot regions, we investigate how different SNOx-Fer approaches distribute the annual fertilizer seasonally (Table 1). The HaNi dataset, as well as the equivalently up-to-date fertilizer dataset (Adalibieke et al., 2023), only provide annual fertilizer application rates given the lack of specific information to distribute N fertilization seasonally. The CEDS, BDSNP and NMIP2 model approaches have their own specific monthly distribution, while the monthly distribution of fertilizer application in the linear and nonlinear EF is arbitrarily assumed to be even during the growing season. Here, we added two additional GEOS-Chem sensitivity experiments for the linear and non-linear approach, named Linear_7525 and Nonlinear_7525, which apply the seasonal pattern of the BDSNP scheme (Hudman et al., 2012), assuming that 75 % of the annual fertilizer is applied in the first month of the growing season and the remaining 25 % evenly applied in the rest of the growing months.
Table 1Summary of the sensitivity experiments in GEOS-Chem and the methods used by different SNOx-Fer estimating approaches to distribute the annual N fertilizer into monthly.
Because the default GEOS-Chem simulations used above do not account for interactive CH4 chemistry, we further conducted ten more sensitivity experiments with the special “CH4 run” in GEOS-Chem (East et al., 2024; Fu et al., 2024) to assess variations in the atmospheric CH4 concentrations induced by the uncertain SNOx-Fer. The special CH4 run takes CH4 as the sole atmospheric transport tracer with various prescribed CH4 sources (summarized in Table S2), while the CH4 sinks include the tropospheric reactions with hydroxyl radical (OH) and chlorine, stratospheric loss and soil uptake. The global monthly mean OH concentrations archived from the ten sensitivity experiments (Table 1, except for the BDSNP_fine) are applied in the CH4 simulation to assess the SNOx-Fer effect on CH4 lifetime through perturbing atmospheric oxidation capacity. As a result, there are ten more associated sensitivity experiments with the CH4 run that correspond to the default GEOS-Chem simulations in Table 1 (except for the BDSNP_fine experiment). Each CH4 simulation ran for 15 years by repeating the meteorological forcings in 2019 to reach a semi-equilibrium with the prescribed emissions and OH concentrations. The last year of the simulation was utilized to analyze the influences of soil NOx on CH4 induced by N fertilizer application. The simulated global surface CH4 concentrations driven by varied OH levels from different sensitivity experiments are shown in Fig. S5.
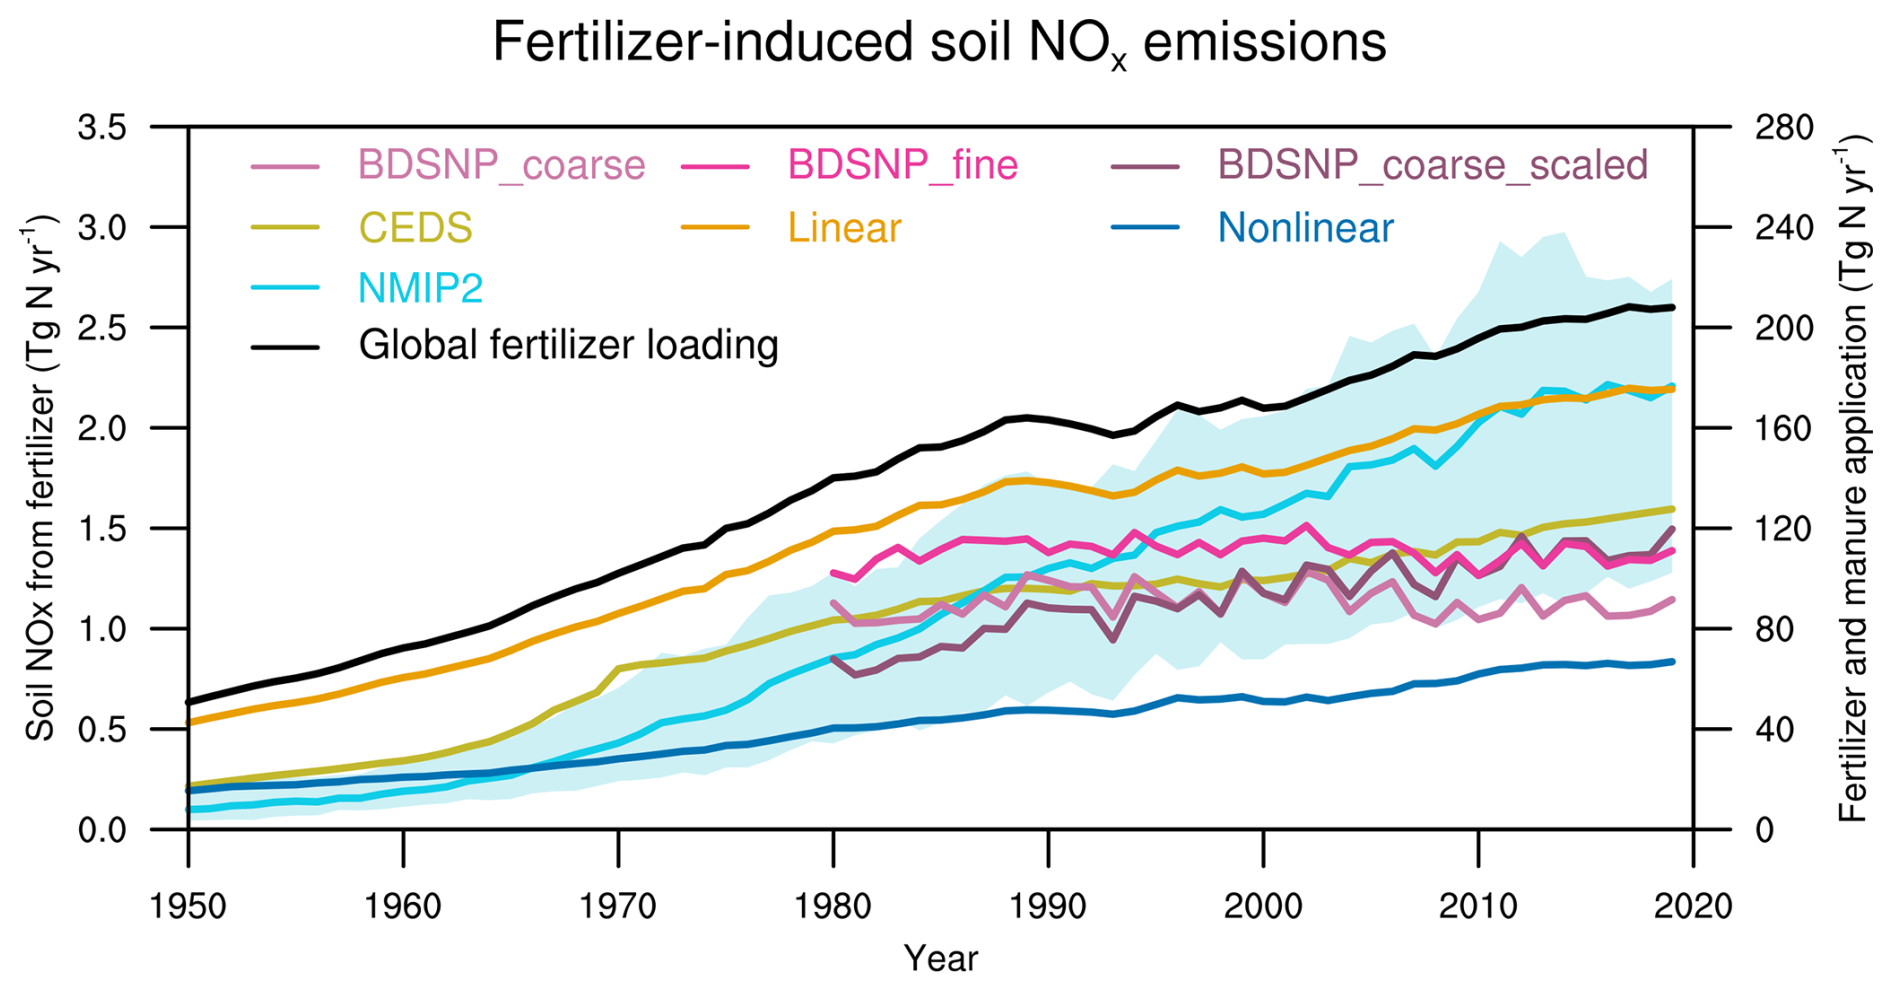
Figure 1Global estimates of N fertilizer-induced soil NOx emissions by different approaches. The black line (right Y axis) indicates global annual-mean N synthetic fertilizer and manure inputs over 1950–2019 assessed from the HaNi dataset. The remaining lines (left Y axis) indicate the N fertilizer-induced soil NOx emissions over 1950–2019 estimated by different approaches, including the emission inventory (CEDS), linear and non-linear EF, the widely-used CTM parameterization with coarse resolution (2°×2.5°, BDSNP_coarse), fine resolution (0.5°×0.625°, BDSNP_fine) and interannually varied N availability (BNDSP_coarse_scaled), and the TBM ensembles (NMIP2). The light cyan shadows indicate the spread across three different TBMs in NMIP2.
4.1 Varied SNOx-Fer among different approaches
Figure 1 shows the historical time series of global SNOx-Fer over 1950–2019 estimated by different approaches, mainly driven by the substantial increases in global N fertilizer application. Almost all approaches except BDSNP showed enhancements in soil NOx emissions but with largely varied magnitudes from 0.6 to 2.1 Tg yr−1 over 1950–2019. The default BDSNP scheme in GEOS-Chem, which scales soil NOx emissions with time-variant temperature and soil moisture, but assumes constant N availability (see Methods), estimates relatively stable soil NOx emissions over 1980–2019. The annually-varied BDSNP scheme scaled by the HaNi N input dataset shows an increase in SNOx-Fer from 0.8 Tg N yr−1 in 1980 to 1.5 Tg N yr−1 in 2019, while the sharpest increase in the soil NOx emission is simulated by the TBM ensemble, mainly induced by the high estimates of the CLASSIC and ORCHIDEE models (Fig. S3). Soil NOx estimated by the non-linear EF approach shows a substantially weaker response to fertilizer inputs relative to other estimating approaches.
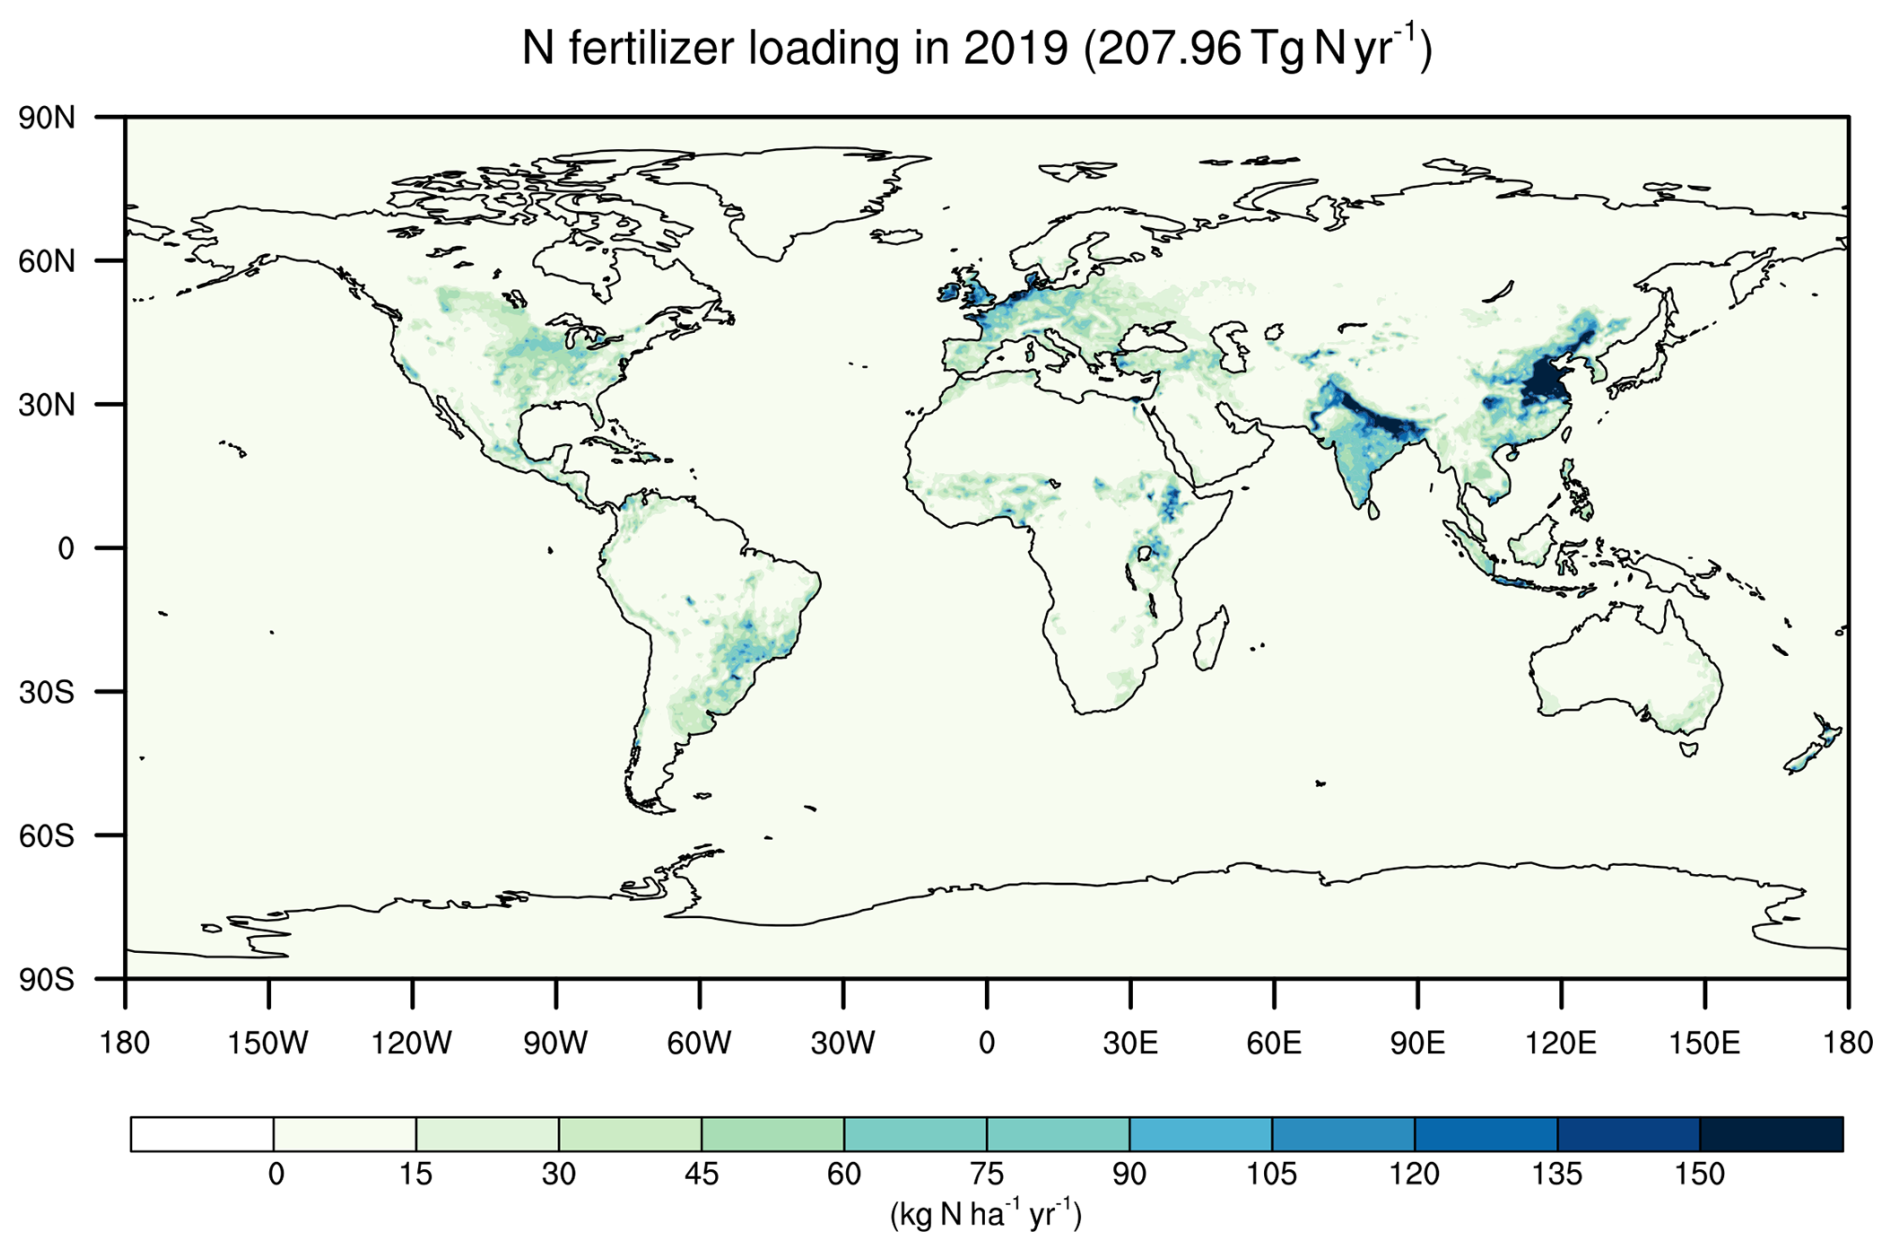
Figure 2The global spatial patterns of N synthetic fertilizer and manure application in 2019 from the HaNi dataset.
Figure 3 shows the global spatial patterns of SNOx-Fer among different approaches. Each approach shows consistent spatial patterns aligned with the distribution of N synthetic fertilizer and manure inputs (Fig. 2), where eastern U.S., western Europe, eastern and southern Asia are the hotspots with high soil NOx emissions. Notably, even though the TBM ensemble (NMIP2) and the Linear EF approach estimate similar global total SNOx-Fer, the spatial distributions of both estimates vary strongly. The SNOx-Fer estimates from the NMIP2 ensemble are higher in agricultural hotspots (Table 2), but lower in regions with less synthetic fertilizer application, e.g. in parts of the Africa and South America (Fig. 3d and e), relative to the Linear EF approach. It is because plants and microbes have high priority to assess additional N in N-limited regions, which leads less N loss as the gas forms. However, in N-saturated regions, the applied N fertilizer is excessive for the living biomes, yielding a higher sensitivity of soil NOx emissions to N fertilizer application (Du and de Vries, 2025). Such N dynamics have been included in the C-N fully-coupled TBMs, but are not represented by the linear EF approach.
Table 2The annual soil NOx emissions (Gg N yr−1) induced by N fertilizer in 2019 in the eastern U.S., western Europe, eastern Asia, southern Asia and the global estimates by different approaches. The ranges in NMIP2 indicate the highest and lowest values among three TBMs (CLASSIC, ORCHIDEE and OCN).
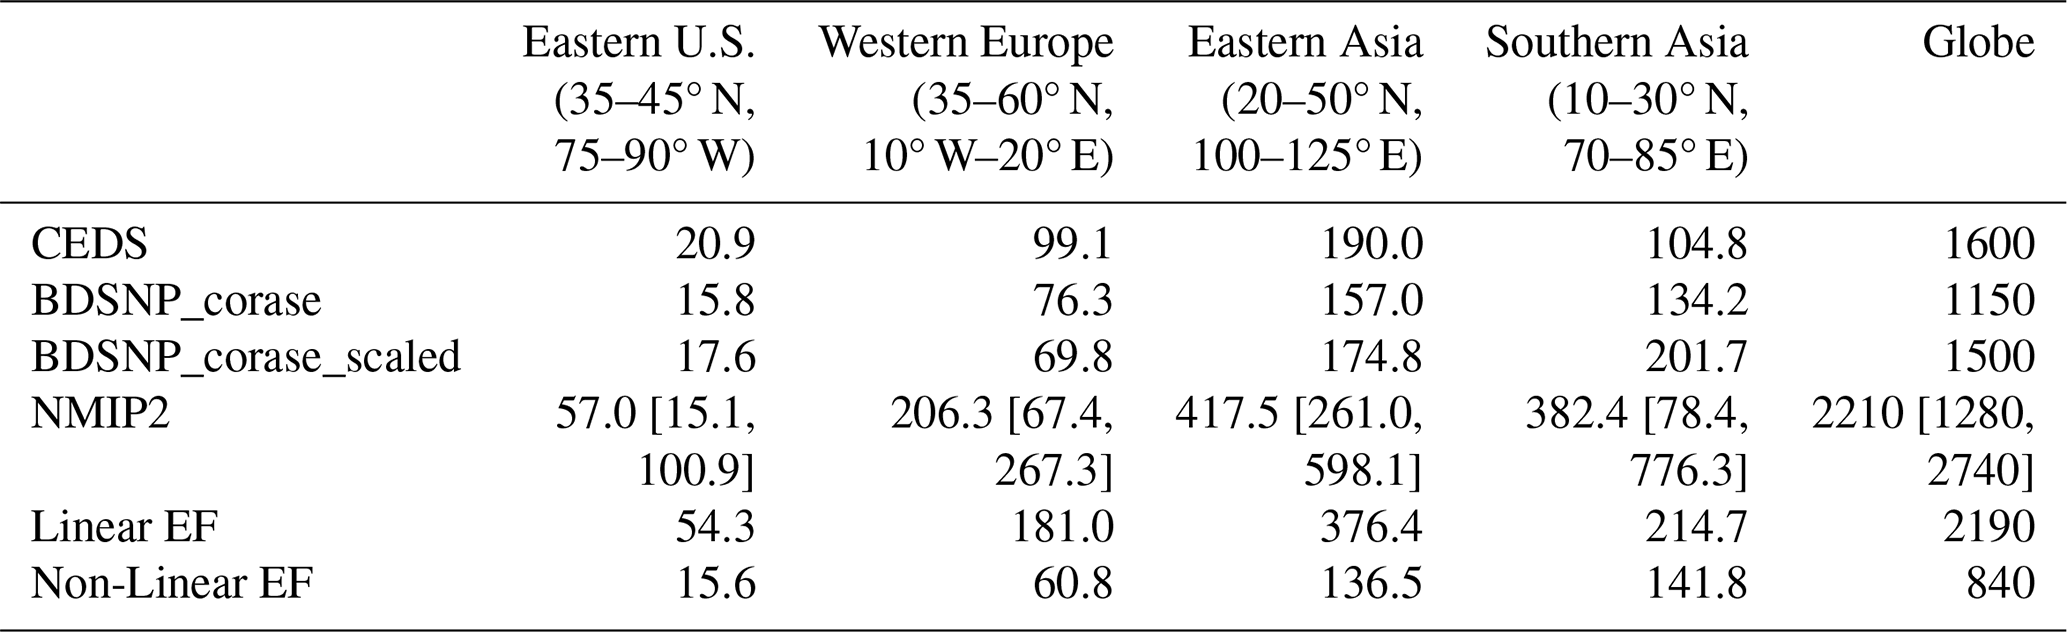
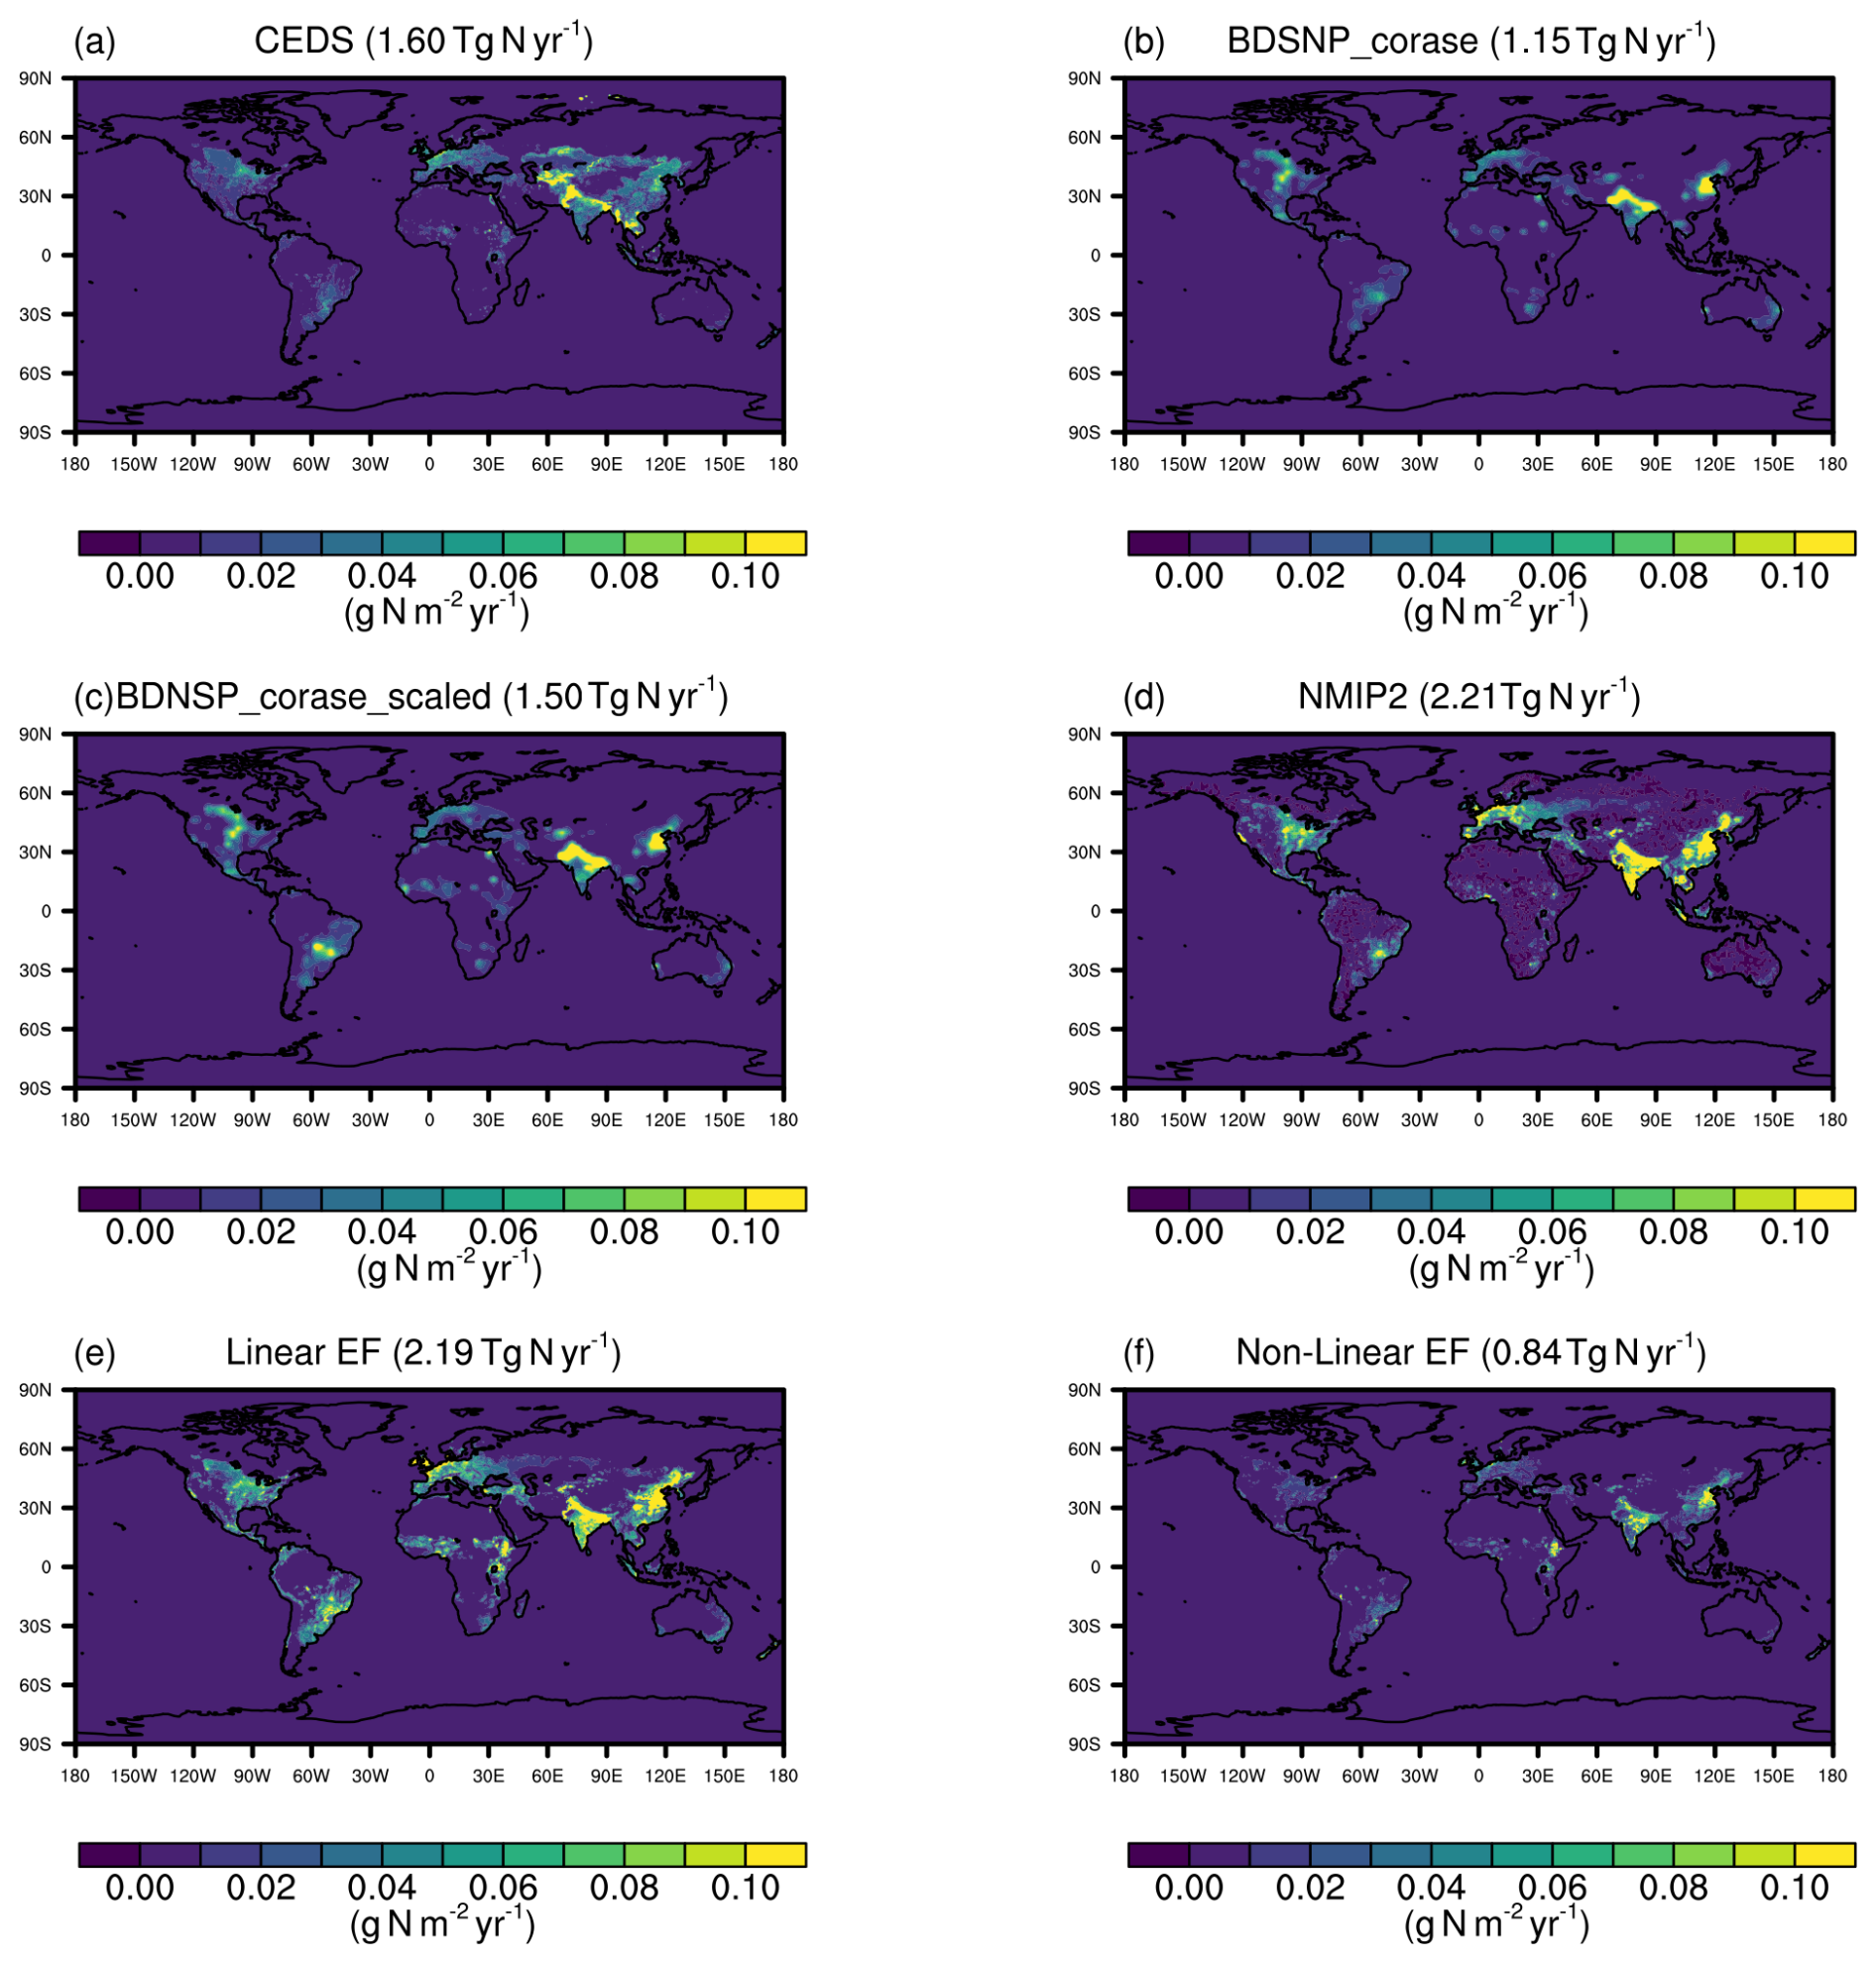
Figure 3The N-fertilization-induced soil NOx emissions estimated by different approaches in 2019. (a–f) The soil NOx emissions induced by N fertilizer estimated by the CEDS agricultural sector, the default BDSNP scheme in GEOS-Chem with coarse resolution (2°×2.5°), the coarse-resolution BDSNP scheme in GEOS-Chem by interannually scaling the N availability using the HaNi dataset, the NMIP2 ensemble, the linear EF and non-linear EF, respectively. The global total budget of each estimate is given in the subtitles.
4.2 The seasonal cycle of SNOx-Fer and the associated impact on O3 concentrations
Figure 4 shows the seasonality of SNOx-Fer in four agricultural hotspot regions among different SNOx-Fer estimating methods. In the temperate regions like Eastern U.S., Western Europe and Eastern Asia, the TBM ensemble NMIP2 shows very strong seasonal variations, which peaks during May to July in Eastern U.S., April to June in Western Europe and May to August in Eastern Asia, respectively. The seasonality of the linear and nonlinear EF methods is strongly dependent on the assumption of fertilizer application time (Table 1), where the monthly SNOx-Fer emissions are at similar levels during the growing season for the Linear and Nonlinear experiments, but peak in a pronounced manner in the northern-hemispheric springtime (around February to April) in the Linear_7525 and Nonlinear_7525 cases. Although the BDSNP applies the same assumption of fertilizer application time as Linear_7525 and Nonlinear_7525, the SNOx-Fer in BDSNP peaks much later (September to October in Eastern U.S., June to August in Western Europe and May to June in Eastern Asia). This arises because the EF methods estimate SNOx-Fer instantaneously in response to the fertilizer application, but the BDSNP scheme cumulates N fertilizer with a 4-month time window (Eq. 3). It is also very important the BDSNP includes the regulation of soil temperature and moisture on SNOx-Fer, both of which also have strong seasonality, but the EF methods do not. Furthermore, in the tropical regions of southern Asia, the NMIP2, Linear_7525 and Nonlinear_7525 experiments estimate the peak SNOx-Fer in the beginning of the year, while the SNOx-Fer of BDSNP reaches its highest in May due to the N cumulation assumption (Fig. 4d). The remainning methods, including the emissions inventory CEDS, the Linear and Nonlinear EF method, show very weak seasonality of SNOx-Fer in Southern Asia.
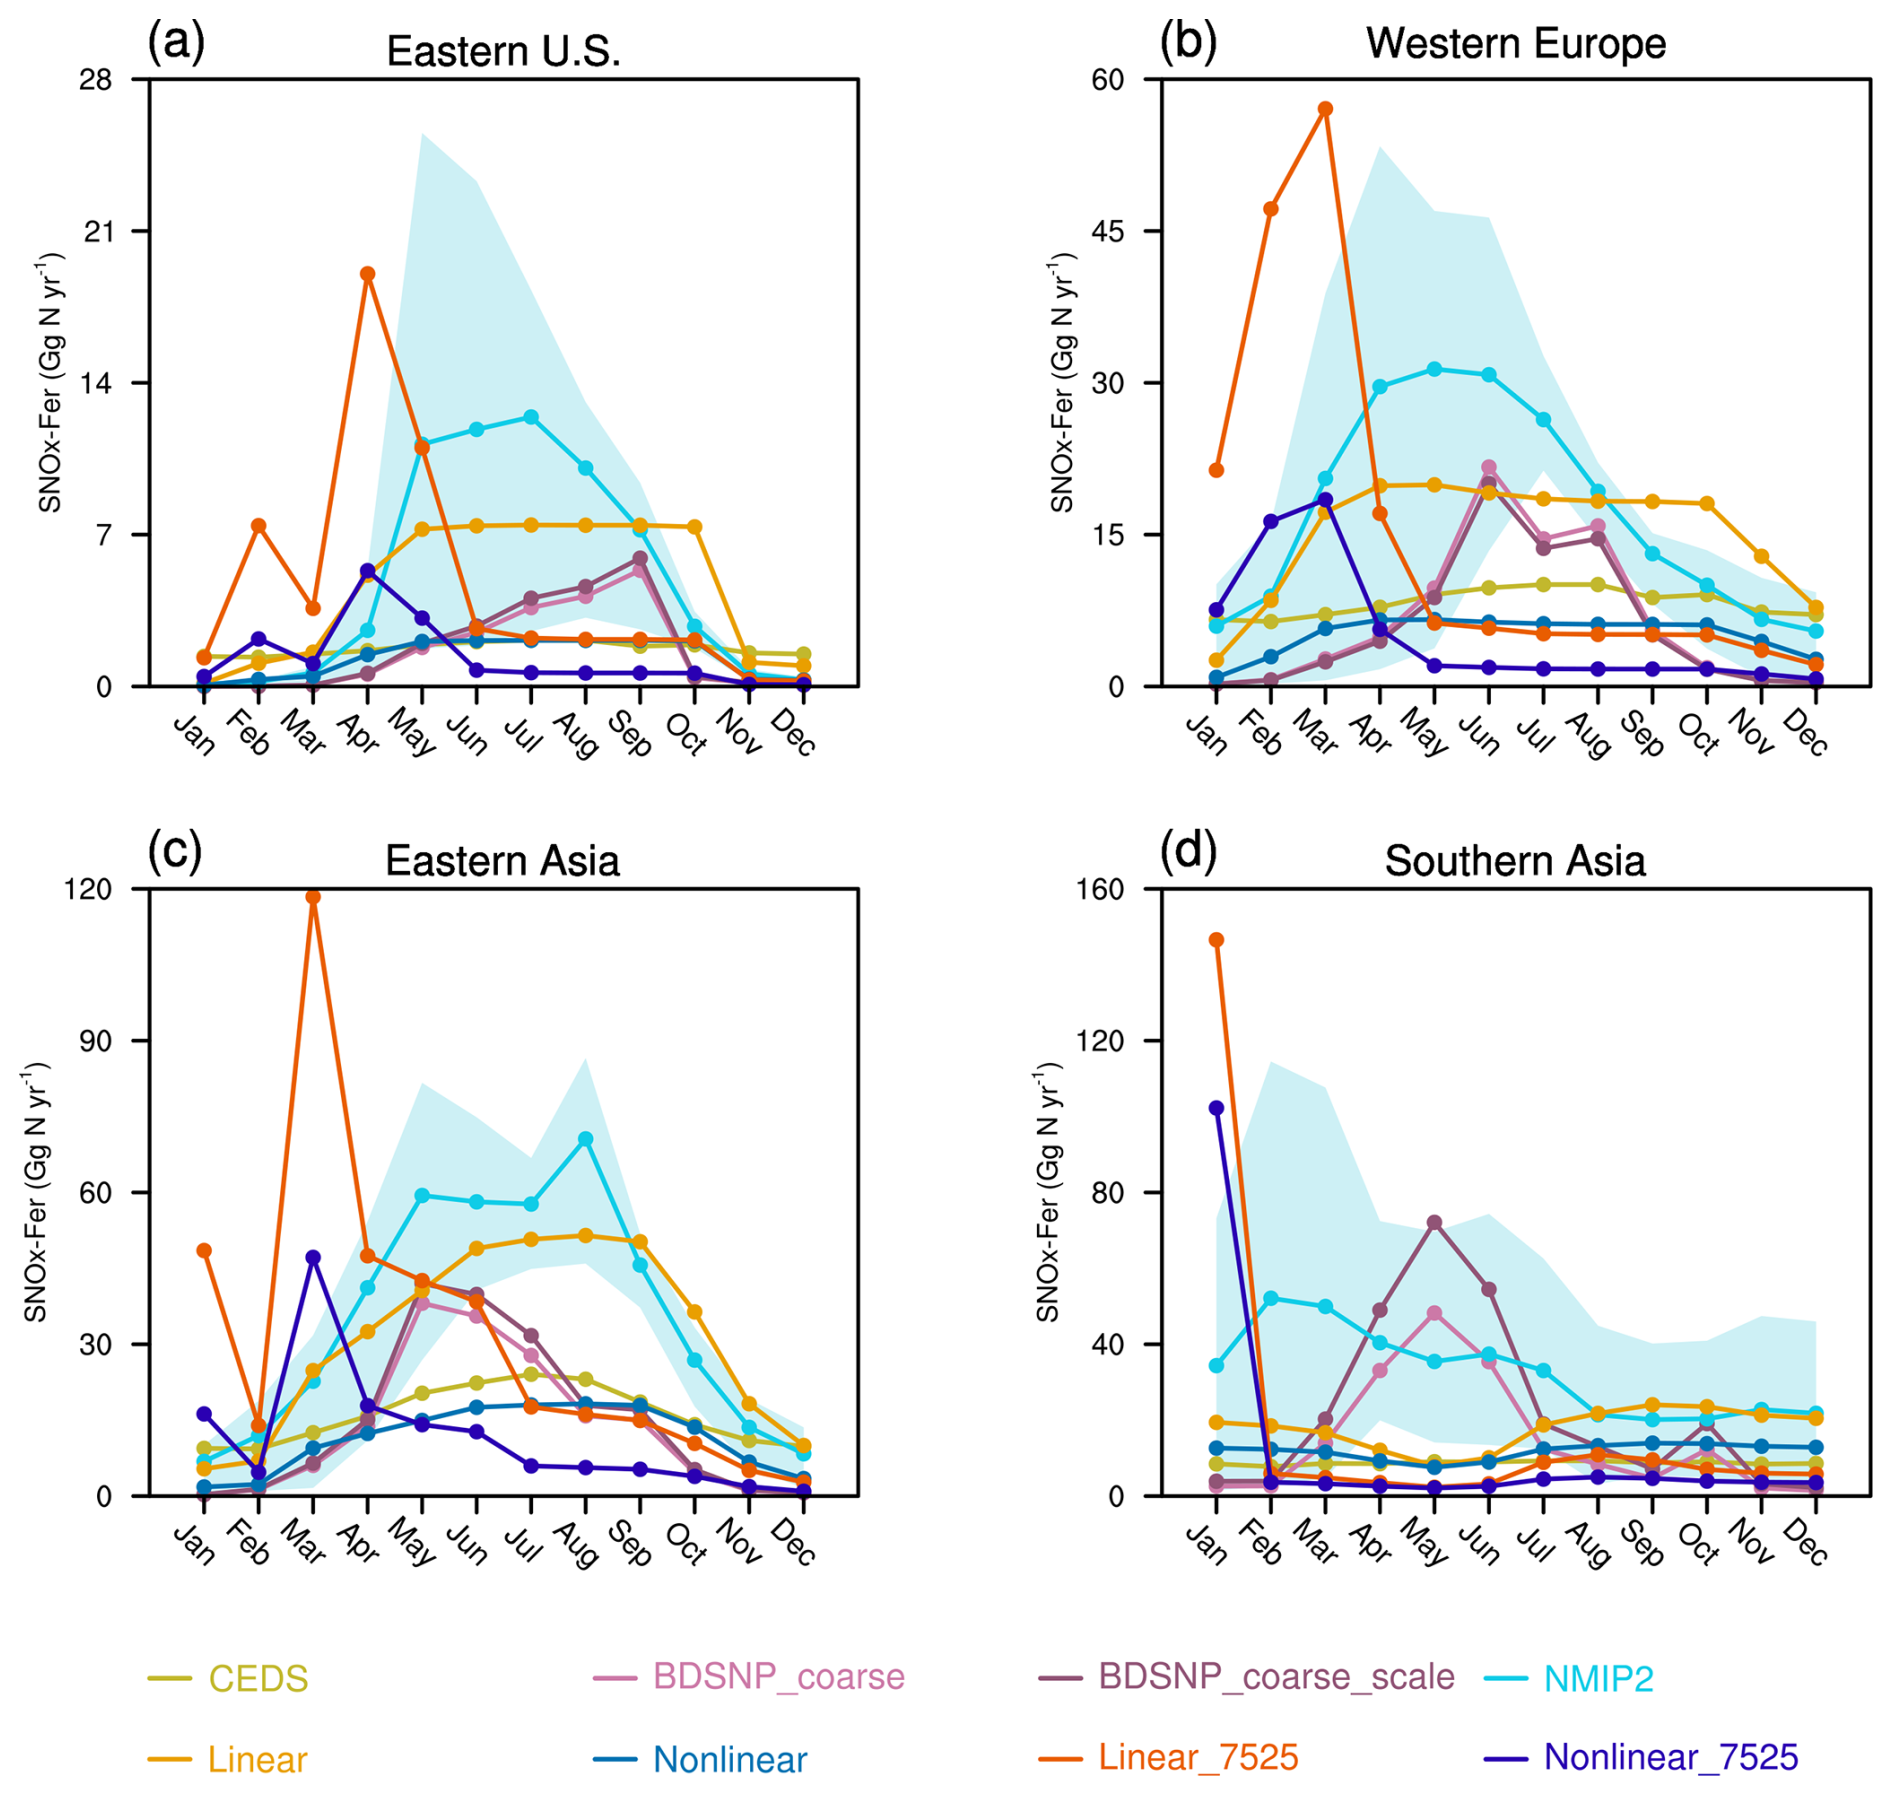
Figure 4The monthly regional SNOx-Fer (Gg N yr−1) in (a) eastern U.S., (b) western Europe, (c) eastern Asia and (d) southern Asia with different SNOx-Fer estimating approaches. The cyan-blue shades indicate the spread among three different TBM models (CLASSIC, OCN and ORCHIDEE) in the NMIP2 ensemble.
The seasonality of ground-level monthly MDA8 O3 changes in response to the SNOx-Fer in general aligns with the monthly variations of SNOx-Fer among different estimating approaches (Fig. 5). The strongest enhancement of regional MDA8 O3 occurs during the northern-hemispheric summertime (June–August) for most of the estimating approaches in three temperate regions, when the absolute O3 concentrations also reaches their highest. However, it should be noted that spring-peak SNOx-Fer in the Linear_7525 and the Nonlinear_7525 cases does not lead to high O3 enhancement in both western Europe and eastern Asia (Fig. 5b and c). The weak sensitivity of O3 to NOx during springtime is likely the result of the seasonal variations in other emissions (e.g. biogenic volatile organic compounds (BVOCs)), which alter the chemical sensitivity regime. The responses of O3 to SNOx-Fer could also depend on the region (e.g. O3 enhancement also peaks during spring in Linear_7525 in Eastern U.S., Fig. 5a), spatial simulation resolution or different modelling chemical mechanisms. The O3 enhancement in southern Asia is generally similar during northern-hemispheric spring and summer time for all of the SNOx-Fer estimating approaches (Fig. 5d), except for the BDSNP scheme, which simulates significantly higher O3 enhancement during May to July relative to February to April.
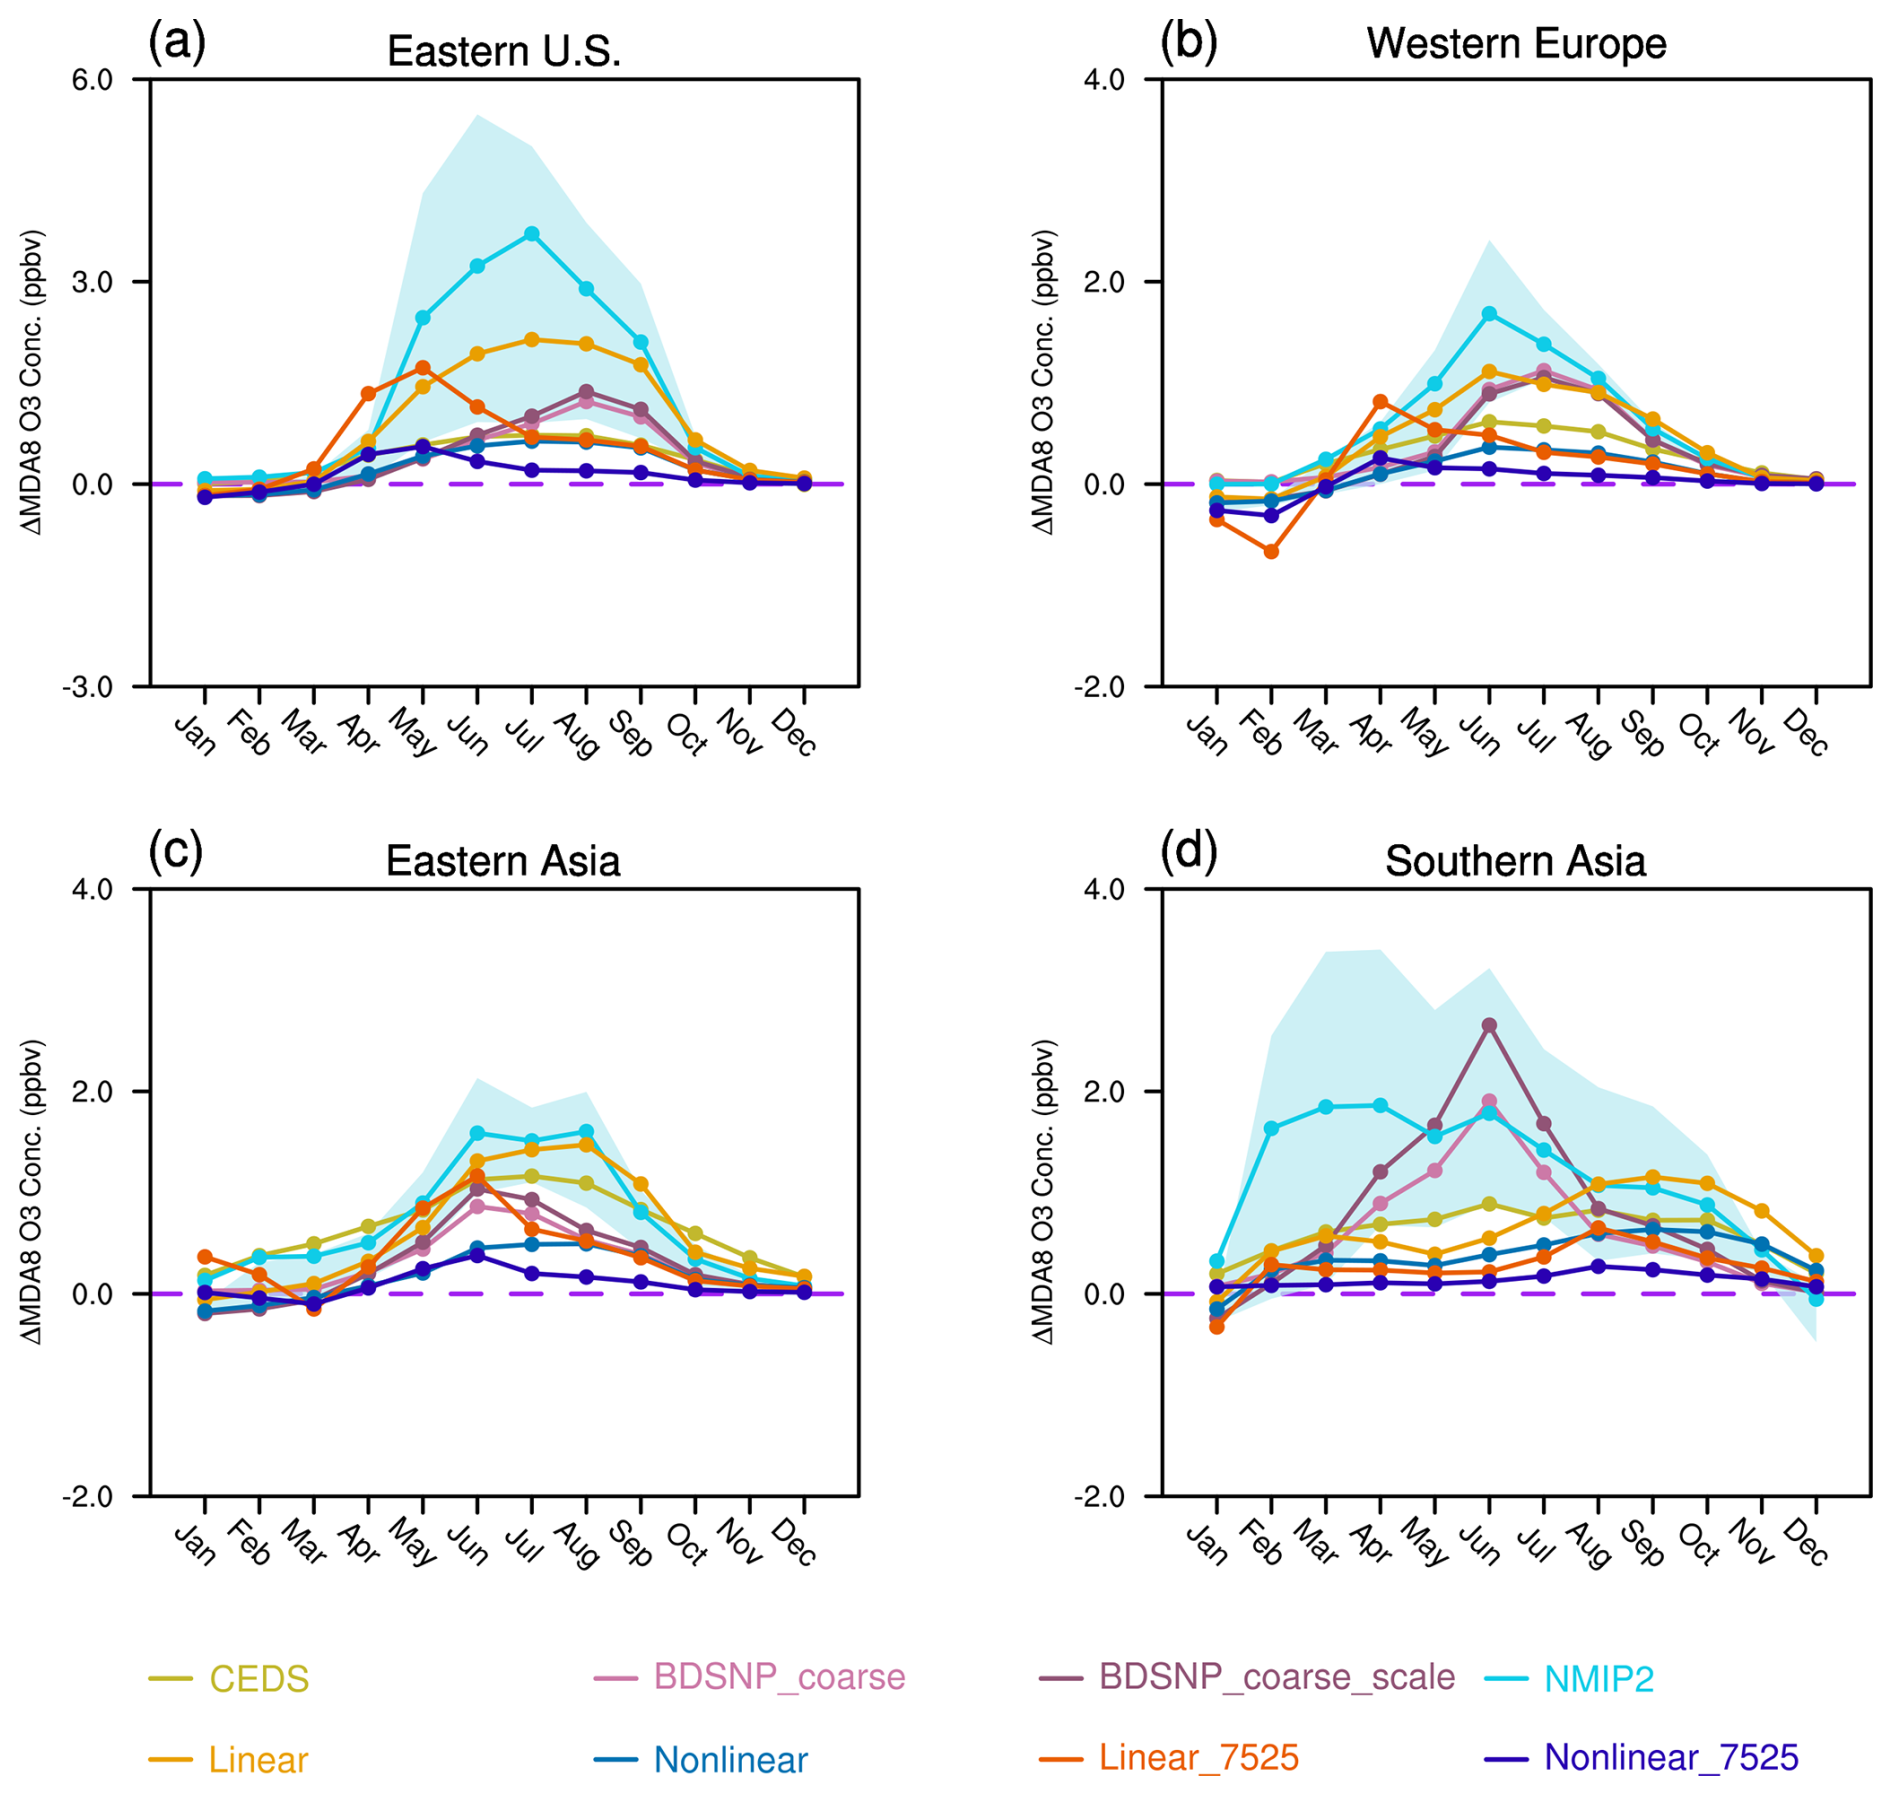
Figure 5Regionally-averaged monthly MDA8 O3 changes (ppbv) induced by SNOx-Fer in (a) eastern U.S., (b) western Europe, (c) eastern Asia and (d) southern Asia with different SNOx-Fer estimating approaches. The cyan-blue shades indicate the spread among three different TBM models (CLASSIC, OCN and ORCHIDEE) in the NMIP2 ensemble.
4.3 Impacts of SNOx-Fer on surface O3 concentrations
We next examine how the different SNOx-Fer estimates influence the surface O3 concentrations globally. Since soil NOx emissions typically peak during the summer period (Fig. 4), when O3 pollution tends to be most severe, we focus our analysis on the surface maximum daily 8 h averaged (MDA8) O3 concentrations averaged over the northern hemisphere summer (June, July and August) based on the sensitivity experiments in Table 1. Figure 6 shows that the N fertilizer application enhanced the globally-averaged surface summertime O3 MDA8 concentrations by 0.04–0.30 ppbv in 2019. In agricultural regions, the enhancement of O3 concentrations due to SNOx-Fer reaches 0.1–3.3 ppbv (0.2 %–7.0 %). Figure 6 also highlights important differences in the spatial effect of NOx on O3, consistent with the regional effects on SNOx-Fer (Table 2), that the NMIP2 estimate of SNOx-Fer shows stronger contributions to the O3 concentrations than the linear EF approach in agricultural regions. The non-linear EF method leads to the lowest O3 enhancement, although both non-linear EF and TBMs estimate increasing soil NOx emissions with soil N availability.
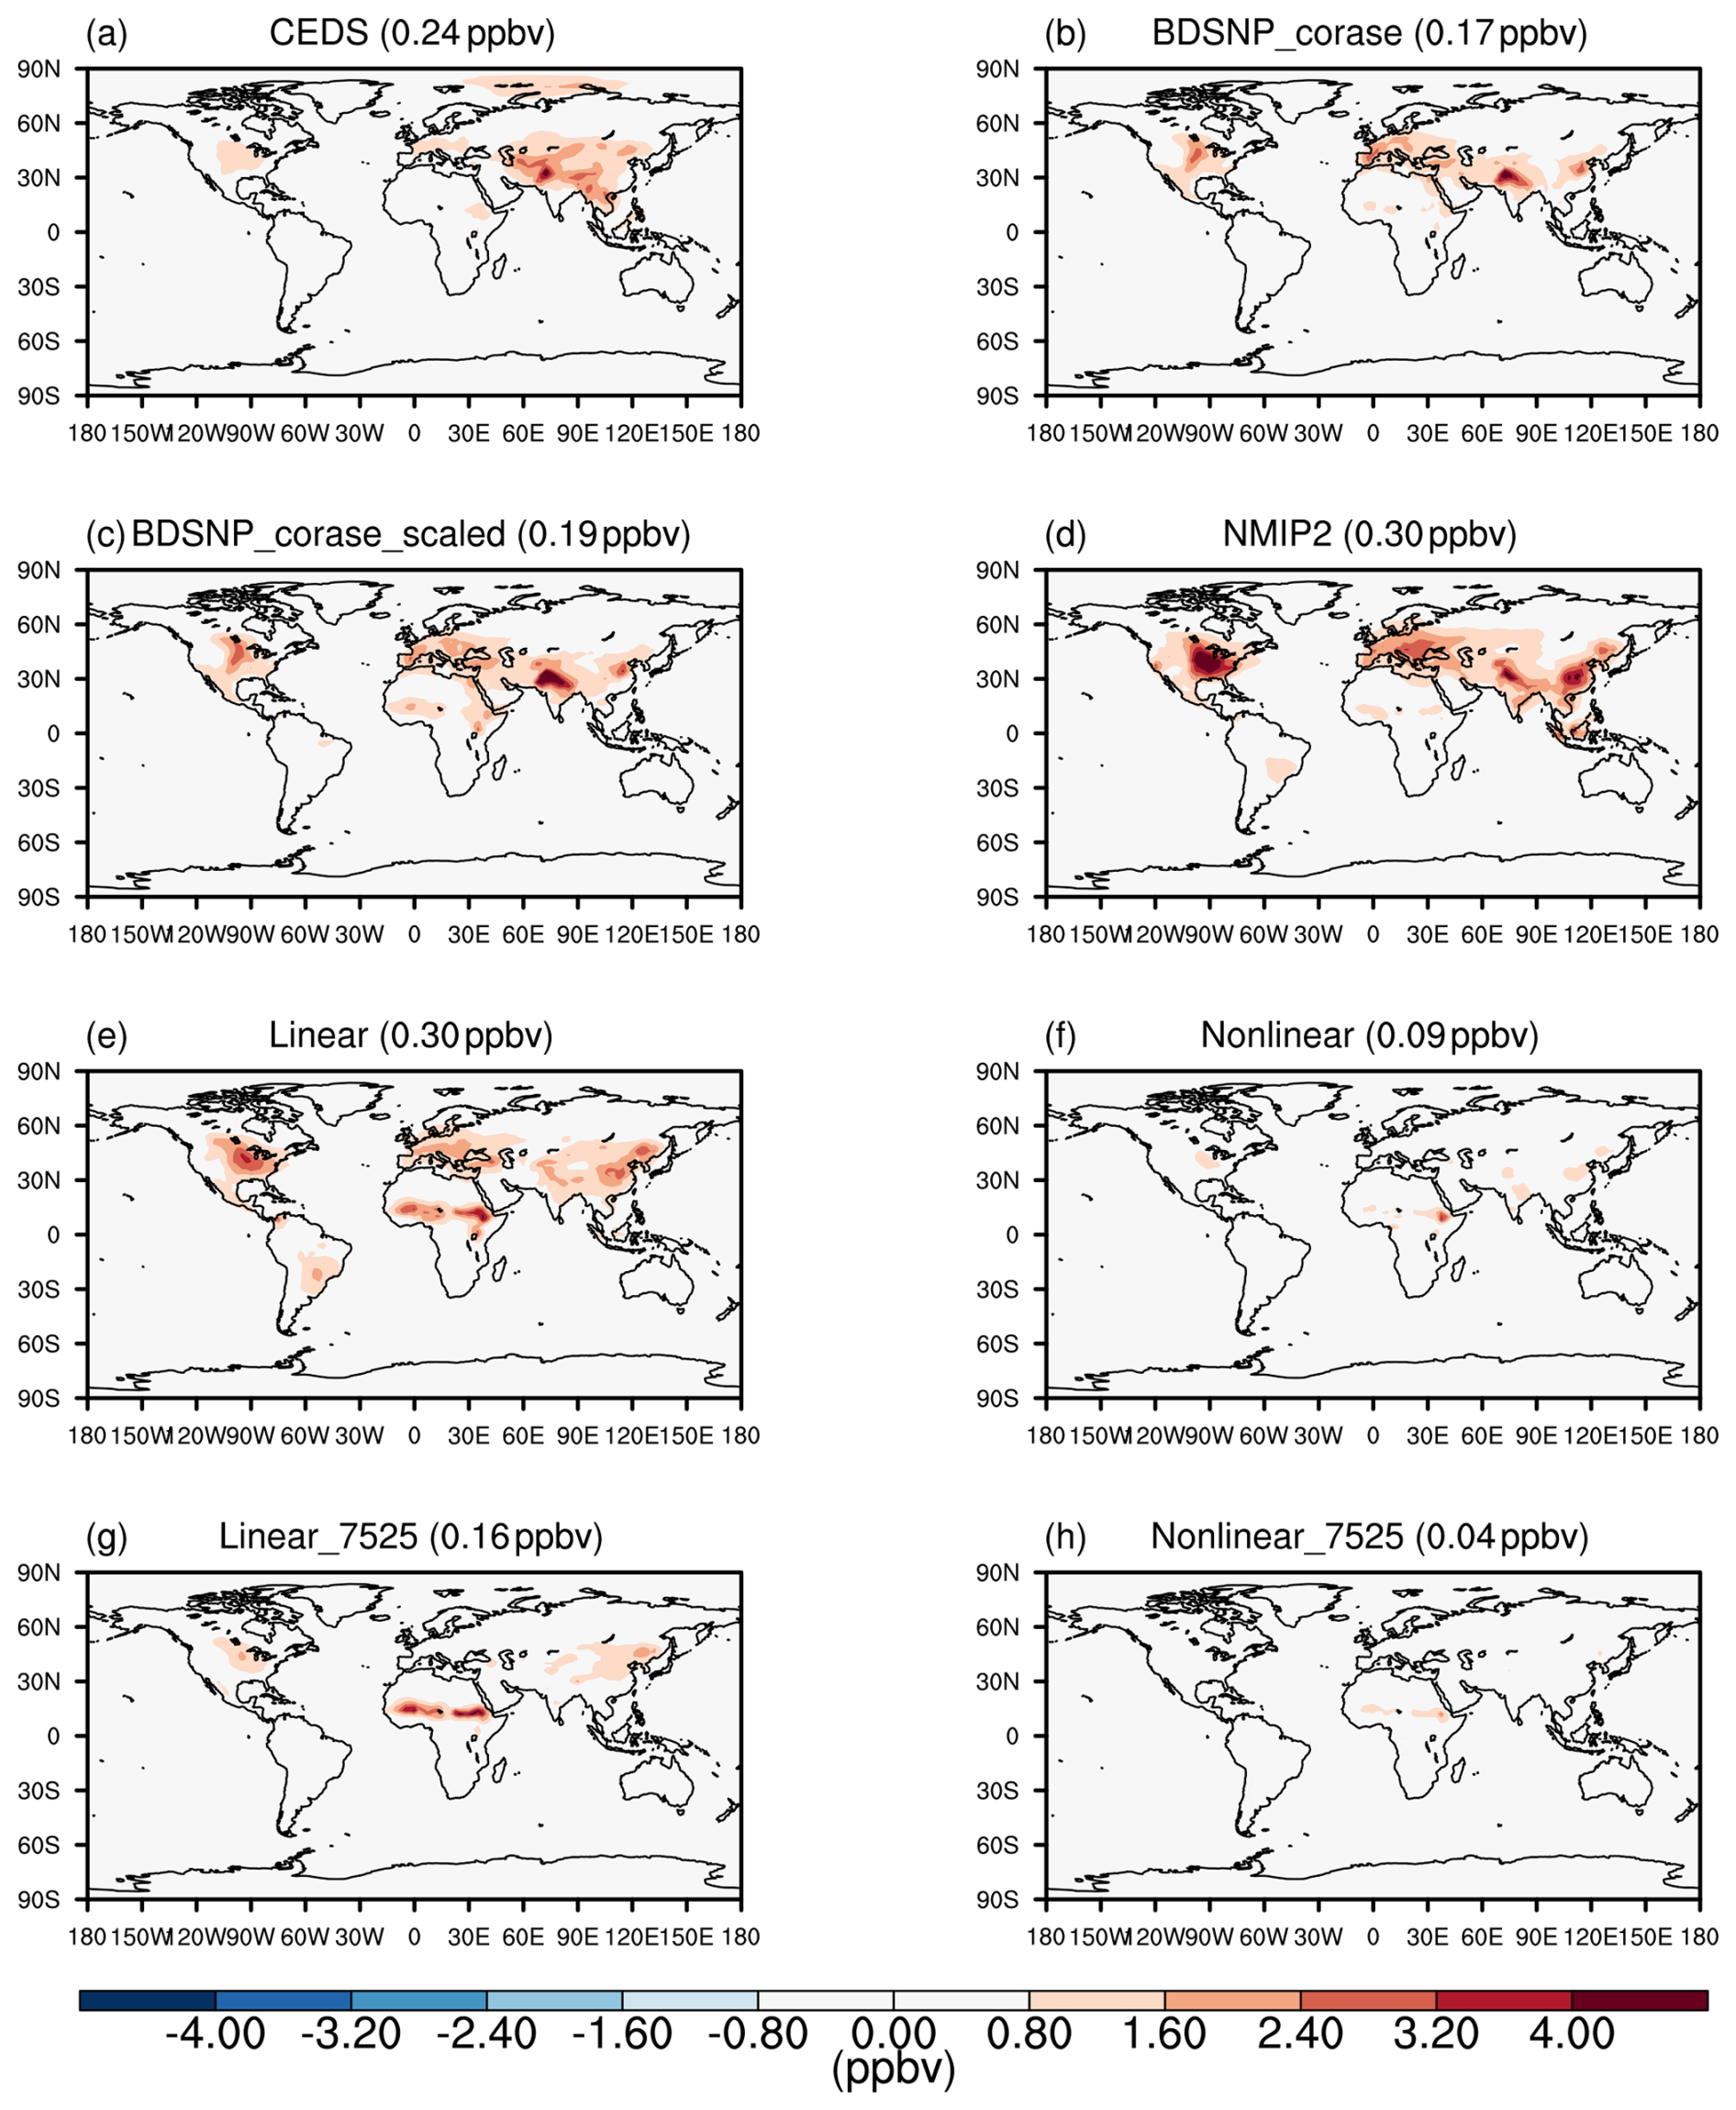
Figure 6Global simulated changes in surface MDA8 O3 concentrations induced by different estimating approaches of SNOx-Fer averaged over June, July and August in 2019. The differences are calculated between corresponding sensitivity experiments in Table 1 and the Zero experiment. The numbers in each subtitle are changes in the globally averaged summertime MDA8 O3 concentrations induced by SNOx-Fer.
4.4 The impacts of SNOx-Fer uncertainties on global CH4 estimates
Figure 7 shows that N fertilizer-induced soil NOx led to the reduction of globally averaged CH4 concentrations ranging from 6.7 ppbv (0.4 %) to 16.6 ppbv (0.9 %) in 2019 by increasing atmospheric OH concentrations (Fig. S5), spatially aligned with the distributions of SNOx-Fer among different estimating approaches (Fig. 3). Because CH4 has a significantly longer atmospheric lifetime than either OH or NOx, the spatial differences in the impacts of SNOx-Fer on CH4 concentrations are insignificant (Fig. S4). As a result, we only focus on the globally averaged changes in CH4 concentrations. The magnitude of this estimate is consistent with the recent estimate of around 17.4 ppbv by Gong et al. (2024), which relies on the same NMIP2 dataset and a simpler CH4 box model to calculate the impacts of NOx emissions on the atmospheric lifetime of CH4. This result highlights an important but indirect role of SNOx-Fer on atmospheric CH4 concentrations, which is an often-overlooked aspect for the global CH4 budget. However, the uncertainty range in our estimates clearly suggests the need to further improve our understanding of soil N biogeochemical processes to better predict global OH reactivity and to better constrain global CH4 budget.
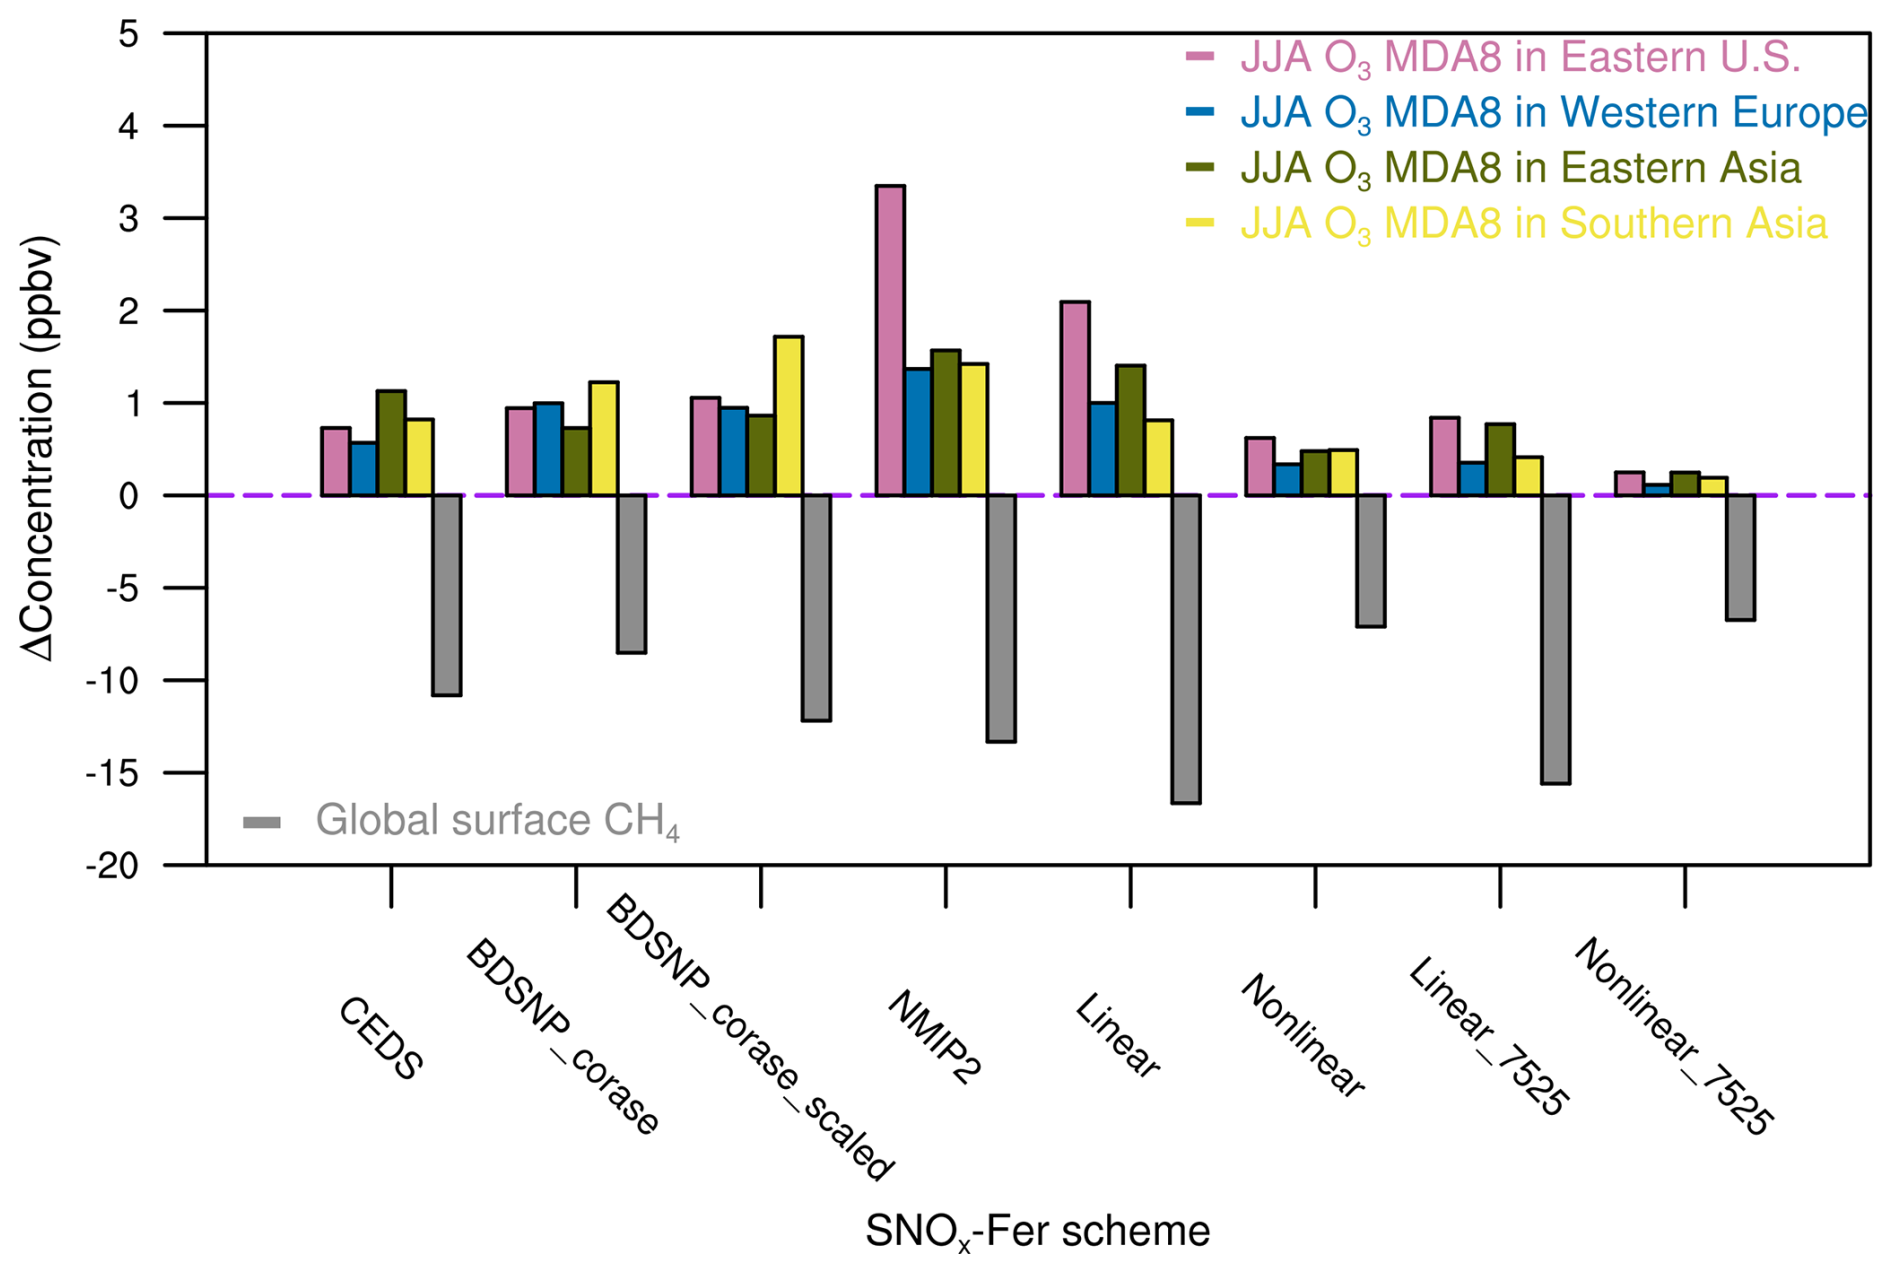
Figure 7Changes in summertime averaged surface MDA8 O3 concentrations (positive Y axis) and global surface CH4 concentrations (negative Y axis) induced by SNOx-Fer uncertainties. The regional MDA8 O3 concentrations are averaged over eastern U.S. (35–45° N, 75–90° W), western Europe (35–60° N, 10° W–20° E), eastern Asia (20–50° N, 100–125° E) and southern Asia (10–30° N, 70–85° E).
In this study, we integrated knowledge from meta-analyses (Buendia et al., 2019; Wang et al., 2024), the emission inventory, parameterizations in CTMs and the TBM ensembles to better quantify the uncertainties in N fertilizer-induced soil NOx emissions and the associated impacts on global O3 and CH4 concentrations. Our results showed a large variation in the global soil NOx emissions associated with N fertilizer, ranging from 0.84 to 2.2 Tg N yr−1 in 2019. This range of responses leads to an enhancement in summertime surface MDA8 O3 concentrations of 0.1 to 3.3 ppbv (0.2 %–7.0 %) in agricultural hotspot regions. The O3 enhancement is highest in eastern U.S., while it is not only determined by the SNOx-Fer emissions, but also the diverging sensitivities of O3 to NOx depending on different chemical regimes in GEOS-Chem (Fig. S6). The varied SNOx-Fer estimates also lead to a reduction in global CH4 concentrations of 6.7 ppbv (0.4 %) to 16.6 ppbv (0.9 %). These changes highlight a significant role of agricultural N use and soil N biogeochemical processes in affecting regional O3 concentrations as well as controlling global greenhouse gases. In particular, with the worldwide reduction in fossil-fuel NOx emissions associated with clean-air actions (Jiang et al., 2022), control of agricultural soil NOx emissions becomes increasingly important to improve air quality and alleviate the associated public health risks.
However, challenges remain in the accurate assessment of N fertilizer-induced soil NOx emissions. On the one hand, the overall uncertainties of SNOx-Fer may still be underestimated. The EF-approach with fixed EF fails to adequately reflect the complexity in soil biogeochemical processes, which is reflected by the large ranges of EFs from 0.06 % to 2.18 % in a recent meta-analysis (Buendia et al., 2019). While the non-linear EF method represents an advance over the linear EF approach, as the effects of soil N saturation levels on soil N gas emissions are considered and therefore the approach yields relatively good performance in predicting soil N2O or NH3 emissions compared to observations (Shcherbak et al., 2014; Jiang et al., 2017), the limited availability of observations to constrain these responses and their limited spatiotemporal representativeness reduce the reliability of this approach. Most of the experimental data in Wang et al. (2024) are collected over China in the past ten years and thus may not be representative of other agricultural regions. Furthermore, 22 out of 55 data points are from vegetable cropping systems and orchard fields, where frequent irrigation may enhance soil moisture and thus inhibit the production of NOx via nitrification. Last but not least, other factors, such as soil texture, pH, soil organic carbon and fertilizer types, may also affect the response of soil NOx emissions to the loading of N fertilizer application, which are omitted by either the linear EF or non-linear EF approach. As a result, more representative crop experiments with a gradient series of N addition are necessary to better constrain the soil NOx response to N fertilizer application.
For the modelling of SNOx-Fer, on the one hand, recent developments of the parameterization of BDSNP in CTMs focused more on the soil NOx responses to changing temperature or soil moisture (e.g. Wang et al., 2021; Huber et al., 2023), while the accuracy of the soil N availability has been less investigated. Even with the scaled N fertilizer loadings to interannually vary the N availability, BDSNP still showed a weaker increasing trend of SNOx-Fer in response to the N fertilizer enhancement relative to the empirical EF methods and the TBM simulations of NMIP2 in the past decades (Fig. 1). Nevertheless, it should be noted that the BDSNP scheme is also sensitive to the spatial resolution, where the coarse resolution may miss small-scale hotspots and thus underestimate the global SNOx-Fer, as the BDSNP_fine experiment shows in Fig. 1. On the other hand, terrestrial N availability is a key concept in the development of TBMs, as the process-based TBMs need a detailed description of the N cycle to understand nutrient limitation levels and associated C-N coupling. Nevertheless, the soil NOx emissions have been overlooked by the ecological modelling community because the low emissions may not be important for the terrestrial N cycle, resulting in a limited number of TBMs that include soil NOx emissions as well as large inter-model variations (Fig. S3). To further reduce the uncertainties in soil NOx emission estimates, the advantages of TBMs on representing soil N availability can be introduced into CTMs to better examine the effects of agricultural activities on atmospheric chemistry, but at the same time, the terrestrial N cycle needs to be further developed in TBMs to reduce inter-model variations and to better predict soil emissions of reactive N gases (not only NOx but also N2O and NH3).
The seasonality of SNOx-Fer and the associated impacts on surface O3 concentrations are also important but poorly constrained. The most difficult challenge is to precisely estimate the monthly (or even daily) N fertilizer loadings on the global scale. Because the N fertilizer data underlying the gridded products is derived from the annual statistics by the Food and Agricultural Organization (FAO) (https://www.fao.org/faostat/en/#data, last access: 24 November 2025), the HaNi dataset applied in this study, as well as the equivalently up-to-date fertilizer dataset (Adalibieke et al., 2023), only provides gridded, annual fertilizer application rates. In the EF approaches, the growing season is determined only by temperature and greenness in this study, which could result in a mismatch with the real crop or pasture calendar, especially ignoring the multiple-harvest crops per year. A refined calendar could further improve the prediction of SNOx-Fer seasonality. Furthermore, the NOx-VOCs-O3 chemical sensitivity regimes could be determined not only by soil NOx emissions, but also by other anthropogenic and biogenic emissions of NOx and VOCs, as well as the climate seasonal variations. Therefore, the seasonal cycles of the enhancement of O3 concentrations may not strictly follow the variations in SNOx-Fer, as our Linear_75 sensitivity experiment implies in Western Europe and Eastern Asia (Fig. 5b and c).
The impacts of the changes in short-lived air pollutants on the global CH4 budget have attracted increasing attention in recent years (Peng et al., 2022; Zhao et al., 2025), where NOx is one of the most important drivers. However, it should be noted that the sensitivity of CH4 lifetime to NOx emissions varies substantially among atmospheric chemistry models from −25 % to −46 % in response to the total NOx changes from the pre-industrial to present-day period (Thornhill et al., 2021). Because few studies investigated how NOx from agricultural sources affects CH4, it is difficult to assess if the overall impacts of SNOx-Fer on CH4 presented in this study based on the GEOS-Chem model are underestimated or overestimated, even though certain uncertainties are expected. Nevertheless, our results indicate that SNOx-Fer could be an uncertain but important source in calculating future changes of the global CH4 budget, the importance of which could increase with future continuing reduction in fossil-fuel NOx emissions (Rao et al., 2017)
Beyond the uncertainties remaining in different SNOx-Fer estimating approaches, an important but also difficult question is how to better evaluate the performances of each method, especially at the regional and global scales. The first-hand meta-data collected from the field experiments is actually not an independent source, as it has been used to establish both of the linear and nonlinear EF methods. More importantly, most of the field experiments are manipulation experiments with artificial fertilizer gradients, which may not fully represent the real-world spatiotemporally varied SNOx-Fer. Furthermore, we use O3 data from the national or continental air quality observational networks to evaluate simulated O3 concentrations as a potential consistency check of the SNOx-Fer (Fig. S7). However, the uncertainties in SNOx-Fer are expected to be far less important relative to the uncertainties in the nonlinearity of atmospheric chemistry, emissions of BVOCs or the deposition processes, which together determine the biases between observational and simulated O3 concentrations. As a result, it is inappropriate to determine the best SNOx-Fer estimate as the one with the best statistical metrics in O3 simulation. Moreover, most of the sites that monitor air pollutants are located in the urban regions, where the industrial impacts are far more important than the agricultural sources. A real-time O3 observational network in the cropland or pasture would be crucial to advance the understandings in SNOx-Fer and the associated impacts on air quality. Last but not least, the top-down retrievals of NOx emissions based on satellite NO2 products could also have the potential to better constrain SNOx-Fer, while gaps remain in how to precisely isolate the soil NOx emissions (Bertram et al., 2005; Lin et al., 2024) and even the fertilizer contributions from the total NOx sources. Synergizing spatiotemporally detailed fertilizer management datasets with the top-down NOx retrievals with ultra-high resolutions, where the atmospheric NOx can be assumed to be dominantly affected by the soil sources in agricultural regions, could be one possible solution. However, more work is needed to integrate such big data in the future.
To summarize, with a comprehensive investigation of different approaches to describe SNOx-Fer, our results reveal the uncertainties in quantifying SNOx-Fer and the associated important implications in simulating regional air quality and the global greenhouse gas CH4. However, the limited number of field experiments impedes accurate assessments of the soil NOx responses to N fertilizer application as well as improving its representation in both CTMs and TBMs, resulting in large uncertainties in estimates of N fertilizer-induced soil NOx emissions. We thus highlight the essential necessity to integrate knowledge between agricultural data, atmospheric chemistry modelling and soil biogeochemistry to better represent soil NOx emissions in models and improve our understanding of the associated effects on air quality and the global CH4 budget.
The GEOS-Chem source code can be assessed at https://github.com/geoschem/geos-chem (last access: 24 November 2025). The CEDS inventory used in GEOS-Chem can be downloaded from http://geoschemdata.wustl.edu/ExtData/HEMCO/CEDS/ (last access: 24 November 2025). The NMIP2 model outputs can be downloaded through the open-accessed data in Gong et al. (2024).
The supplement related to this article is available online at https://doi.org/10.5194/acp-25-17009-2025-supplement.
C.G. designed the study. C.G. performed the GEOS-Chem simulations and data analysis. Y.W. helps the non-linear EF analysis. H.T. led the NMIP2 projects. S.K, N.V., and S.Z. together contributed to the simulation of terrestrial biosphere models in NMIP2. C.G. wrote the manuscript. All of the authors contributed to reviewing or editing the manuscript.
The contact author has declared that none of the authors has any competing interests.
Publisher’s note: Copernicus Publications remains neutral with regard to jurisdictional claims made in the text, published maps, institutional affiliations, or any other geographical representation in this paper. While Copernicus Publications makes every effort to include appropriate place names, the final responsibility lies with the authors. Views expressed in the text are those of the authors and do not necessarily reflect the views of the publisher.
This research has been supported by the H2020 European Research Council (grant no. 101003536).
The article processing charges for this open-access publication were covered by the Max Planck Society.
This paper was edited by Rebecca Garland and reviewed by three anonymous referees.
Adalibieke, W., Cui, X. Q., Cai, H. W., You, L. Z., and Zhou, F.: Global crop-specific nitrogen fertilization dataset in 1961–2020, Scientific Data, 10, https://doi.org/10.1038/s41597-023-02526-z, 2023.
Bates, K. H., Evans, M. J., Henderson, B. H., and Jacob, D. J.: Impacts of updated reaction kinetics on the global GEOS-Chem simulation of atmospheric chemistry, Geosci. Model Dev., 17, 1511–1524, https://doi.org/10.5194/gmd-17-1511-2024, 2024.
Bertram, T. H., Heckel, A., Richter, A., Burrows, J. P., and Cohen, R. C.: Satellite measurements of daily variations in soil NOx emissions, Geophysical Research Letters, 32, L24812, https://doi.org/10.1029/2005gl024640, 2005.
Bey, I., Jacob, D. J., Yantosca, R. M., Logan, J. A., Field, B. D., Fiore, A. M., Li, Q. B., Liu, H. G. Y., Mickley, L. J., and Schultz, M. G.: Global modeling of tropospheric chemistry with assimilated meteorology: Model description and evaluation, Journal of Geophysical Research-Atmospheres, 106, 23073–23095, https://doi.org/10.1029/2001jd000807, 2001.
Buendia, E. C., Tanabe, K., Kranjc, A., Baasansuren, J., Fukuda, M., Ngarize, S., Osako, A., Pyrozhenko, Y., Shermanau, P., and Federici, S.: Refinement To the 2006 Ipcc Guidelines for National Greenhouse Gas Inventories, IPCC, Geneva, Switzerland, https://www.ipcc-nggip.iges.or.jp/public/2019rf/pdf/0_Overview/19R_V0_00_Cover_Foreword_Preface_Dedication.pdf (last access: 26 November 2025), 2019.
Cheng, W. G., Tsuruta, H., Chen, G. X., and Yagi, K.: N2O and NO production in various Chinese agricultural soils by nitrification, Soil Biology & Biochemistry, 36, 953–963, https://doi.org/10.1016/j.soilbio.2004.02.012, 2004.
Delmas, R., Serca, D., and Jambert, C.: Global inventory of NOx sources, Nutrient Cycling in Agroecosystems, 48, 51–60, https://doi.org/10.1023/a:1009793806086, 1997.
Du, E. Z. and de Vries, W.: Links Between Nitrogen Limitation and Saturation in Terrestrial Ecosystems, Global Change Biology, 31, https://doi.org/10.1111/gcb.70271, 2025.
East, J. D., Jacob, D. J., Balasus, N., Bloom, A. A., Bruhwiler, L., Chen, Z. C., Kaplan, J. O., Mickley, L. J., Mooring, T. A., Penn, E., Poulter, B., Sulprizio, M. P., Worden, J. R., Yantosca, R. M., and Zhang, Z.: Interpreting the Seasonality of Atmospheric Methane, Geophysical Research Letters, 51, https://doi.org/10.1029/2024gl108494, 2024.
Eggleston, H., Buendia, L., Miwa, K., Ngara, T., and Tanabe, K.: 2006 IPCC guidelines for national greenhouse gas inventories, Institute for Global Environmental Strategies (IGES), https://www.ipcc.ch/report/2006-ipcc-guidelines-for-national-greenhouse-gas-inventories/ (last access: 26 November 2025), 2006.
Erisman, J. W., Galloway, J., Seitzinger, S., Bleeker, A., and Butterbach-Bahl, K.: Reactive nitrogen in the environment and its effect on climate change, Current Opinion in Environmental Sustainability, 3, 281–290, https://doi.org/10.1016/j.cosust.2011.08.012, 2011.
Fleischer, K., Dolman, A. J., van der Molen, M. K., Rebel, K. T., Erisman, J. W., Wassen, M. J., Pak, B., Lu, X. J., Rammig, A., and Wang, Y. P.: Nitrogen Deposition Maintains a Positive Effect on Terrestrial Carbon Sequestration in the 21st Century Despite Growing Phosphorus Limitation at Regional Scales, Global Biogeochemical Cycles, 33, 810–824, https://doi.org/10.1029/2018gb005952, 2019.
Fountoukis, C. and Nenes, A.: ISORROPIA II: a computationally efficient thermodynamic equilibrium model for K+–Ca2+–Mg2+–NH–Na+–SO–NO–Cl−–H2O aerosols, Atmos. Chem. Phys., 7, 4639–4659, https://doi.org/10.5194/acp-7-4639-2007, 2007.
Fowler, D., Coyle, M., Skiba, U., Sutton, M. A., Cape, J. N., Reis, S., Sheppard, L. J., Jenkins, A., Grizzetti, B., Galloway, J. N., Vitousek, P., Leach, A., Bouwman, A. F., Butterbach-Bahl, K., Dentener, F., Stevenson, D., Amann, M., and Voss, M.: The global nitrogen cycle in the twenty-first century, Philosophical Transactions of the Royal Society B-Biological Sciences, 368, https://doi.org/10.1098/rstb.2013.0164, 2013.
Fu, B., Li, J. Y., Jiang, Y. Y., Chen, Z. W., and Li, B. A.: Clean air policy makes methane harder to control due to longer lifetime, One Earth, 7, https://doi.org/10.1016/j.oneear.2024.06.010, 2024.
Goldberg, D. L., Harkey, M., de Foy, B., Judd, L., Johnson, J., Yarwood, G., and Holloway, T.: Evaluating NOx emissions and their effect on O3 production in Texas using TROPOMI NO2 and HCHO, Atmos. Chem. Phys., 22, 10875–10900, https://doi.org/10.5194/acp-22-10875-2022, 2022.
Gong, C., Liao, H., Zhang, L., Yue, X., Dang, R. J., and Yang, Y.: Persistent ozone pollution episodes in North China exacerbated by regional transport, Environmental Pollution, 265, https://doi.org/10.1016/j.envpol.2020.115056, 2020.
Gong, C., Tian, H., Liao, H., Pan, N., Pan, S., Ito, A., Jain, A. K., Kou-Giesbrecht, S., Joos, F., Sun, Q., Shi, H., Vuichard, N., Zhu, Q., Peng, C., Maggi, F., Tang, F. H. M., and Zaehle, S.: Global net climate effects of anthropogenic reactive nitrogen, Nature, https://doi.org/10.1038/s41586-024-07714-4, 2024.
Henze, D. K., Hakami, A., and Seinfeld, J. H.: Development of the adjoint of GEOS-Chem, Atmos. Chem. Phys., 7, 2413–2433, https://doi.org/10.5194/acp-7-2413-2007, 2007.
Hoesly, R. M., Smith, S. J., Feng, L., Klimont, Z., Janssens-Maenhout, G., Pitkanen, T., Seibert, J. J., Vu, L., Andres, R. J., Bolt, R. M., Bond, T. C., Dawidowski, L., Kholod, N., Kurokawa, J.-I., Li, M., Liu, L., Lu, Z., Moura, M. C. P., O'Rourke, P. R., and Zhang, Q.: Historical (1750–2014) anthropogenic emissions of reactive gases and aerosols from the Community Emissions Data System (CEDS), Geosci. Model Dev., 11, 369–408, https://doi.org/10.5194/gmd-11-369-2018, 2018.
Huber, D. E., Steiner, A. L., and Kort, E. A.: Sensitivity of Modeled Soil NOx Emissions to Soil Moisture, Journal of Geophysical Research-Atmospheres, 128, https://doi.org/10.1029/2022jd037611, 2023.
Hudman, R. C., Moore, N. E., Mebust, A. K., Martin, R. V., Russell, A. R., Valin, L. C., and Cohen, R. C.: Steps towards a mechanistic model of global soil nitric oxide emissions: implementation and space based-constraints, Atmos. Chem. Phys., 12, 7779–7795, https://doi.org/10.5194/acp-12-7779-2012, 2012.
Hurtt, G. C., Chini, L., Sahajpal, R., Frolking, S., Bodirsky, B. L., Calvin, K., Doelman, J. C., Fisk, J., Fujimori, S., Klein Goldewijk, K., Hasegawa, T., Havlik, P., Heinimann, A., Humpenöder, F., Jungclaus, J., Kaplan, J. O., Kennedy, J., Krisztin, T., Lawrence, D., Lawrence, P., Ma, L., Mertz, O., Pongratz, J., Popp, A., Poulter, B., Riahi, K., Shevliakova, E., Stehfest, E., Thornton, P., Tubiello, F. N., van Vuuren, D. P., and Zhang, X.: Harmonization of global land use change and management for the period 850–2100 (LUH2) for CMIP6, Geosci. Model Dev., 13, 5425–5464, https://doi.org/10.5194/gmd-13-5425-2020, 2020.
Hutchings, N., Webb, J., and Amon, B.: EMEP/EEA air pollutant emissions inventory guidebook 2023: 3.D Crop production and agricultural soils, European Environment Agency, https://www.eea.europa.eu/en/analysis/publications/emep-eea-guidebook-2023 (last access: 26 November 2025), 2023.
Janssens-Maenhout, G., Crippa, M., Guizzardi, D., Muntean, M., Schaaf, E., Dentener, F., Bergamaschi, P., Pagliari, V., Olivier, J. G. J., Peters, J. A. H. W., van Aardenne, J. A., Monni, S., Doering, U., Petrescu, A. M. R., Solazzo, E., and Oreggioni, G. D.: EDGAR v4.3.2 Global Atlas of the three major greenhouse gas emissions for the period 1970–2012, Earth Syst. Sci. Data, 11, 959–1002, https://doi.org/10.5194/essd-11-959-2019, 2019.
Jiang, Y., Deng, A. X., Bloszies, S., Huang, S., and Zhang, W. J.: Nonlinear response of soil ammonia emissions to fertilizer nitrogen, Biology and Fertility of Soils, 53, 269–274, https://doi.org/10.1007/s00374-017-1175-3, 2017.
Jiang, Z., Zhu, R., Miyazaki, K., McDonald, B. C., Klimont, Z., Zheng, B., Boersma, K. F., Zhang, Q., Worden, H., Worden, J. R., Henze, D. K., Jones, D. B. A., van der Gon, H., and Eskes, H.: Decadal Variabilities in Tropospheric Nitrogen Oxides Over United States, Europe, and China, Journal of Geophysical Research-Atmospheres, 127, https://doi.org/10.1029/2021jd035872, 2022.
Kou-Giesbrecht, S., Arora, V. K., Seiler, C., Arneth, A., Falk, S., Jain, A. K., Joos, F., Kennedy, D., Knauer, J., Sitch, S., O'Sullivan, M., Pan, N., Sun, Q., Tian, H., Vuichard, N., and Zaehle, S.: Evaluating nitrogen cycling in terrestrial biosphere models: a disconnect between the carbon and nitrogen cycles, Earth Syst. Dynam., 14, 767–795, https://doi.org/10.5194/esd-14-767-2023, 2023.
Lin, X. J., Ronald, V., de Laat, J., Huijnen, V., Mijling, B., Ding, J. Y., Eskes, H., Douros, J., Liu, M. Y., Zhang, X., and Liu, Z.: European Soil NOx Emissions Derived From Satellite NO2 Observations, Journal of Geophysical Research-Atmospheres, 129, https://doi.org/10.1029/2024jd041492, 2024.
Liu, S. W., Lin, F., Wu, S., Ji, C., Sun, Y., Jin, Y. G., Li, S. Q., Li, Z. F., and Zou, J. W.: A meta-analysis of fertilizer-induced soil NO and combined NO+N2O emissions, Global Change Biology, 23, 2520–2532, https://doi.org/10.1111/gcb.13485, 2017.
Lu, X., Ye, X. P., Zhou, M., Zhao, Y. H., Weng, H. J., Kong, H., Li, K., Gao, M., Zheng, B., Lin, J. T., Zhou, F., Zhang, Q., Wu, D. M., Zhang, L., and Zhang, Y. H.: The underappreciated role of agricultural soil nitrogen oxide emissions in ozone pollution regulation in North China, Nature Communications, 12, https://doi.org/10.1038/s41467-021-25147-9, 2021.
Martin, R. V., Jacob, D. J., Chance, K., Kurosu, T. P., Palmer, P. I., and Evans, M. J.: Global inventory of nitrogen oxide emissions constrained by space-based observations of NO2-, Journal of Geophysical Research-Atmospheres, 108, 4537, https://doi.org/10.1029/2003jd003453, 2003.
Matson, P. A., Naylor, R., and Ortiz-Monasterio, I.: Integration of environmental, agronomic, and economic aspects of fertilizer management, Science, 280, 112–115, https://doi.org/10.1126/science.280.5360.112, 1998.
Park, R. J., Jacob, D. J., Field, B. D., Yantosca, R. M., and Chin, M.: Natural and transboundary pollution influences on sulfate-nitrate-ammonium aerosols in the United States: Implications for policy, Journal of Geophysical Research-Atmospheres, 109, https://doi.org/10.1029/2003jd004473, 2004.
Peng, S. S., Lin, X., Thompson, R. L., Xi, Y., Liu, G., Hauglustaine, D., Lan, X., Poulter, B., Ramonet, M., Saunois, M., Yin, Y., Zhang, Z., Zheng, B., and Ciais, P.: Wetland emission and atmospheric sink changes explain methane growth in 2020, Nature, 612, 477, https://doi.org/10.1038/s41586-022-05447-w, 2022.
Pinder, R. W., Davidson, E. A., Goodale, C. L., Greaver, T. L., Herrick, J. D., and Liu, L. L.: Climate change impacts of US reactive nitrogen, Proceedings of the National Academy of Sciences of the United States of America, 109, 7671–7675, https://doi.org/10.1073/pnas.1114243109, 2012.
Rao, S., Klimont, Z., Smith, S. J., Van Dingenen, R., Dentener, F., Bouwman, L., Riahi, K., Amann, M., Bodirsky, B. L., van Vuuren, D. P., Reis, L. A., Calvin, K., Drouet, L., Fricko, O., Fujimori, S., Gernaat, D., Havlik, P., Harmsen, M., Hasegawa, T., Heyes, C., Hilaire, J., Luderer, G., Masui, T., Stehfest, E., Strefler, J., van der Sluis, S., and Tavoni, M.: Future air pollution in the Shared Socio-economic Pathways, Global Environmental Change-Human and Policy Dimensions, 42, 346–358, https://doi.org/10.1016/j.gloenvcha.2016.05.012, 2017.
Rubin, H. J., Fu, J. S., Dentener, F., Li, R., Huang, K., and Fu, H.: Global nitrogen and sulfur deposition mapping using a measurement–model fusion approach, Atmos. Chem. Phys., 23, 7091–7102, https://doi.org/10.5194/acp-23-7091-2023, 2023.
Russell, A. R., Perring, A. E., Valin, L. C., Bucsela, E. J., Browne, E. C., Wooldridge, P. J., and Cohen, R. C.: A high spatial resolution retrieval of NO2 column densities from OMI: method and evaluation, Atmos. Chem. Phys., 11, 8543–8554, https://doi.org/10.5194/acp-11-8543-2011, 2011.
Shcherbak, I., Millar, N., and Robertson, G. P.: Global metaanalysis of the nonlinear response of soil nitrous oxide (N2O) emissions to fertilizer nitrogen, Proceedings of the National Academy of Sciences of the United States of America, 111, 9199–9204, https://doi.org/10.1073/pnas.1322434111, 2014.
Skiba, U., Medinets, S., Cardenas, L. M., Carnell, E. J., Hutchings, N., and Amon, B.: Assessing the contribution of soil NOx emissions to European atmospheric pollution, Environmental Research Letters, 16, https://doi.org/10.1088/1748-9326/abd2f2, 2021.
Stehfest, E. and Bouwman, L.: N2O and NO emission from agricultural fields and soils under natural vegetation: summarizing available measurement data and modeling of global annual emissions, Nutrient Cycling in Agroecosystems, 74, 207–228, https://doi.org/10.1007/s10705-006-9000-7, 2006.
Steinkamp, J. and Lawrence, M. G.: Improvement and evaluation of simulated global biogenic soil NO emissions in an AC-GCM, Atmos. Chem. Phys., 11, 6063–6082, https://doi.org/10.5194/acp-11-6063-2011, 2011.
Thornhill, G. D., Collins, W. J., Kramer, R. J., Olivié, D., Skeie, R. B., O'Connor, F. M., Abraham, N. L., Checa-Garcia, R., Bauer, S. E., Deushi, M., Emmons, L. K., Forster, P. M., Horowitz, L. W., Johnson, B., Keeble, J., Lamarque, J.-F., Michou, M., Mills, M. J., Mulcahy, J. P., Myhre, G., Nabat, P., Naik, V., Oshima, N., Schulz, M., Smith, C. J., Takemura, T., Tilmes, S., Wu, T., Zeng, G., and Zhang, J.: Effective radiative forcing from emissions of reactive gases and aerosols – a multi-model comparison, Atmos. Chem. Phys., 21, 853–874, https://doi.org/10.5194/acp-21-853-2021, 2021.
Tian, H., Pan, N., Thompson, R. L., Canadell, J. G., Suntharalingam, P., Regnier, P., Davidson, E. A., Prather, M., Ciais, P., Muntean, M., Pan, S., Winiwarter, W., Zaehle, S., Zhou, F., Jackson, R. B., Bange, H. W., Berthet, S., Bian, Z., Bianchi, D., Bouwman, A. F., Buitenhuis, E. T., Dutton, G., Hu, M., Ito, A., Jain, A. K., Jeltsch-Thömmes, A., Joos, F., Kou-Giesbrecht, S., Krummel, P. B., Lan, X., Landolfi, A., Lauerwald, R., Li, Y., Lu, C., Maavara, T., Manizza, M., Millet, D. B., Mühle, J., Patra, P. K., Peters, G. P., Qin, X., Raymond, P., Resplandy, L., Rosentreter, J. A., Shi, H., Sun, Q., Tonina, D., Tubiello, F. N., van der Werf, G. R., Vuichard, N., Wang, J., Wells, K. C., Western, L. M., Wilson, C., Yang, J., Yao, Y., You, Y., and Zhu, Q.: Global nitrous oxide budget (1980–2020), Earth Syst. Sci. Data, 16, 2543–2604, https://doi.org/10.5194/essd-16-2543-2024, 2024.
Tian, H., Bian, Z., Shi, H., Qin, X., Pan, N., Lu, C., Pan, S., Tubiello, F. N., Chang, J., Conchedda, G., Liu, J., Mueller, N., Nishina, K., Xu, R., Yang, J., You, L., and Zhang, B.: History of anthropogenic Nitrogen inputs (HaNi) to the terrestrial biosphere: a 5 arcmin resolution annual dataset from 1860 to 2019, Earth Syst. Sci. Data, 14, 4551–4568, https://doi.org/10.5194/essd-14-4551-2022, 2022.
Tian, H. Q., Yang, J., Xu, R. T., Lu, C. Q., Canadell, J. G., Davidson, E. A., Jackson, R. B., Arneth, A., Chang, J. F., Ciais, P., Gerber, S., Ito, A., Joos, F., Lienert, S., Messina, P., Olin, S., Pan, S. F., Peng, C. H., Saikawa, E., Thompson, R. L., Vuichard, N., Winiwarter, W., Zaehle, S., and Zhang, B. W.: Global soil nitrous oxide emissions since the preindustrial era estimated by an ensemble of terrestrial biosphere models: Magnitude, attribution, and uncertainty, Global Change Biology, 25, 640–659, https://doi.org/10.1111/gcb.14514, 2019.
Wang, Y., Yao, Z. S., Zheng, X. H., Subramaniam, L., and Butterbach-Bahl, K.: A synthesis of nitric oxide emissions across global fertilized croplands from crop-specific emission factors, Global Change Biology, 28, 4395–4408, https://doi.org/10.1111/gcb.16193, 2022.
Wang, Y., Ge, C., Garcia, L. C., Jenerette, G. D., Oikawa, P. Y., and Wang, J.: Improved modelling of soil NOx emissions in a high temperature agricultural region: role of background emissions on NO2 trend over the US, Environmental Research Letters, 16, https://doi.org/10.1088/1748-9326/ac16a3, 2021.
Wang, Y., Yao, Z. S., Pan, Z. L., Guo, H. J., Chen, Y. C., Cai, Y. J., and Zheng, X. H.: Nonlinear response of soil nitric oxide emissions to fertilizer nitrogen across croplands, Biology and Fertility of Soils, 60, 483–492, https://doi.org/10.1007/s00374-024-01818-9, 2024.
Weng, H. J., Lin, J. T., Martin, R., Millet, D. B., Jaegle, L., Ridley, D., Keller, C., Li, C., Du, M. X., and Meng, J.: Global high-resolution emissions of soil NOx, sea salt aerosols, and biogenic volatile organic compounds, Scientific Data, 7, https://doi.org/10.1038/s41597-020-0488-5, 2020.
Yienger, J. J. and Levy, H.: Empirical-model of global soil-biogenic nox emissions, Journal of Geophysical Research-Atmospheres, 100, 11447–11464, https://doi.org/10.1029/95jd00370, 1995.
Yuan, H., Dai, Y. J., Xiao, Z. Q., Ji, D. Y., and Shangguan, W.: Reprocessing the MODIS Leaf Area Index products for land surface and climate modelling, Remote Sensing of Environment, 115, 1171–1187, https://doi.org/10.1016/j.rse.2011.01.001, 2011.
Zaehle, S. and Dalmonech, D.: Carbon-nitrogen interactions on land at global scales: current understanding in modelling climate biosphere feedbacks, Current Opinion in Environmental Sustainability, 3, 311–320, https://doi.org/10.1016/j.cosust.2011.08.008, 2011.
Zaehle, S. and Friend, A. D.: Carbon and nitrogen cycle dynamics in the O-CN land surface model: 1. Model description, site-scale evaluation, and sensitivity to parameter estimates, Global Biogeochemical Cycles, 24, https://doi.org/10.1029/2009gb003521, 2010.
Zhai, S. X., Jacob, D. J., Wang, X., Liu, Z. R., Wen, T. X., Shah, V., Li, K., Moch, J. M., Bates, K. H., Song, S. J., Shen, L., Zhang, Y. Z., Luo, G., Yu, F. Q., Sun, Y. L., Wang, L. T., Qi, M. Y., Tao, J., Gui, K., Xu, H. H., Zhang, Q., Zhao, T. L., Wang, Y. S., Lee, H. C., Choi, H., and Liao, H.: Control of particulate nitrate air pollution in China, Nature Geoscience, 14, 389, https://doi.org/10.1038/s41561-021-00726-z, 2021.
Zhang, R. Y., Tie, X. X., and Bond, D. W.: Impacts of anthropogenic and natural NOx sources over the US on tropospheric chemistry, Proceedings of the National Academy of Sciences of the United States of America, 100, 1505–1509, https://doi.org/10.1073/pnas.252763799, 2003.
Zhao, Y., Saunois, M., Bousquet, P., Lin, X., Hegglin, M. I., Canadell, J. G., Jackson, R. B., and Zheng, B.: Reconciling the bottom-up and top-down estimates of the methane chemical sink using multiple observations, Atmos. Chem. Phys., 23, 789–807, https://doi.org/10.5194/acp-23-789-2023, 2023.
Zhao, Y. H., Zheng, B., Saunois, M., Ciais, P., Hegglin, M. I., Lu, S. M., Li, Y. F., and Bousquet, P.: Air pollution modulates trends and variability of the global methane budget, Nature, 642, https://doi.org/10.1038/s41586-025-09004-z, 2025.