the Creative Commons Attribution 4.0 License.
the Creative Commons Attribution 4.0 License.
 | 27 Nov 2025
Unexpectedly persistent PM2.5 pollution in the Pearl River Delta, South China, in the 2015–2017 cold seasons: the dominant role of meteorological changes during the El Niño-to-La Niña transition over emission reduction
Xuesong Wang
Yu Yan
Xipeng Jin
Ling-Yan He
Xiao-Feng Huang
Xuhui Cai
Jin Shen
Zimu Peng
Teng Xiao
Mihalis Vrekoussis
Maria Kanakidou
Guy P. Brasseur
Nikos Daskalakis
Limin Zeng
Yuanhang Zhang
Effective air quality management requires a comprehensive understanding of how meteorological variability and emission changes shape multiannual changes in regional PM2.5 pollution. During the cold seasons of 2015–2017, persistent PM2.5 pollution occurred in the Pearl River Delta (PRD), South China, despite rapid emission reductions. This study systematically investigated the interconnections between climate variability, meteorology, PM2.5 levels, source contributions and budgets during these periods, aiming to uncover the detailed impacts of meteorological and emission changes on PM2.5 pollution. We found that drastic meteorological changes, closely linked to a transition from strong El Niño (2015) to weak/moderate La Niña (2017), were the main drivers of the three-year PM2.5 changes. Strengthened northerly winds and reduced humidity enhanced cross-regional PM2.5 transport into the PRD while concurrently suppressing local PM2.5 production and accumulation. WRF/CMAQ simulations indicate that transport (non-local) contributions to PM2.5 in the PRD increased from 70 % in 2015 to 74 % in 2016 and 78 % in 2017. While the transport of secondary inorganic PM2.5 components overall intensified, their responses to meteorological and emission changes varied: Variations in sulfate were more sensitive to emission reductions outside the PRD, whereas those for nitrate were primarily driven by meteorological shifts. Simulated PM2.5 mass budgets further support the increasing dominance of transport, especially via advections. Our findings underscore the potentially crucial role of meteorological variability in driving multiannual PM2.5 pollution changes in the PRD and other regions strongly impacted by cross-regional transport, emphasizing the necessity for regionally coordinated emission control strategies to effectively mitigate PM2.5 pollution.
- Article
(17801 KB) - Full-text XML
-
Supplement
(2486 KB) - BibTeX
- EndNote


Ambient fine particulate matter, or PM2.5, is a major air pollutant impacting global air quality (Cheng et al., 2016; Fowler et al., 2020). It can be directly emitted from anthropogenic and natural sources or chemically produced from its precursors such as SO2, NOx (NO+NO2), NH3 and volatile organic compounds (VOCs) (Hallquist et al., 2009; Zhang et al., 2015; Wang et al., 2023a; Ye et al., 2023). In addition, cross-regional transport often plays a significant role in regional PM2.5 pollution (Qu et al., 2024). Exposure to PM2.5 poses serious health risks, contributing to pulmonary and cardiovascular diseases as well as excess mortality (Feng et al., 2016a; Pozzer et al., 2023). Apte et al. (2018) estimated that global ambient PM2.5 pollution reduces human life expectancy by approximately one year. To alleviate the detrimental health effects of PM2.5, World Health Organization (2021) recommends a guideline annual mean concentration limit of 5 µg m−3. However, over 90 % of the global population currently experiences PM2.5 levels exceeding this guideline, underscoring the urgency of PM2.5 control (Pai et al., 2022). To develop effective mitigation strategies over PM2.5 pollution, it is essential to comprehensively understand its multiannual changes in the past and the detailed influences of both meteorological and emission changes.
China has faced severe PM2.5 pollution in the cold seasons (autumn and winter) for decades (Wang et al., 2015). Notably, several extreme PM2.5 pollution episodes occurred in January 2013 in North China, with hourly PM2.5 concentrations even exceeding 1000 µg m−3 (Wang et al., 2014; Yang et al., 2015), drawing widespread public concern. In response, the Air Pollution Prevention and Control Action Plan was implemented from 2013 to 2017, aiming to alleviate PM2.5 pollution across the country (Lu et al., 2020a). The implementation of the Action Plan proved effective, which led to a rapid reduction in SO2, NOx and primary PM2.5 emissions by 70 %, 27 % and 33 %, respectively (Ministry of Ecology and Environment of the People's Republic of China, 2014, 2021a; Zheng et al., 2018). Consequently, PM2.5 concentrations declined significantly during 2013–2017 in many densely populated regions of China, including the North China Plain (∼ 40 %), the Yangtze River Delta (∼ 34 %) and the Pearl River Delta (∼ 28 %) (Lu et al., 2020a; Wang et al., 2020a; Zhang et al., 2022). Attribution studies suggest that emission reductions contributed to over 70 % of the observed PM2.5 declines during this period (Cheng et al., 2019a; Ding et al., 2019; Zhang et al., 2019; Chen et al., 2020a; Dong et al., 2020; Zhang et al., 2020; Bae et al., 2021; Jiang et al., 2022).
On the other hand, changes in meteorological conditions can also significantly influence the severity of PM2.5 pollution (Jacob and Winner, 2009; Chen et al., 2020b). Over multiple years, meteorological changes can serve as a considerable driver for the variability in PM2.5 pollution, and in some cases, may even surpass the effect of emission changes (Jiang et al., 2022). A typical example is the unexpected severer PM2.5 pollution in North China during the COVID-19 lockdown period than in previous years, despite substantial reductions in anthropogenic emissions (Le et al., 2020). This was mainly attributed to unfavorable meteorological conditions, including elevated humidity and enhanced atmospheric stagnation. However, detailed mechanisms by which meteorological changes contribute to multiannual changes in PM2.5 pollution remain insufficiently explained in many studies. These year-to-year meteorological variations within a region are likely determined by larger-scale annual/decadal climate variations. As summarized in Table 1, studies have acknowledged the connections between typical annual/decadal climate variations, such as El Niño-Southern Oscillation (ENSO), Arctic Oscillation (AO) and Pacific Decadal Oscillation (PDO), and cold-season PM2.5 pollution in both North and South China (Mao, 2019; Sherman et al., 2019). These climate variations create disparities in the intensity and pattern of PM2.5 transport, as well as the conditions for local chemical production, accumulation and deposition of PM2.5, thereby resulting in the fluctuating contributions of cross-regional transport and local emissions to PM2.5 levels (Wang, et al., 2020b; Yin et al., 2021). By integrating analyses of annual/decadal climate variations with meteorological conditions in the target region, a more comprehensive understanding of the role of meteorological changes in driving multiannual PM2.5 changes can be achieved.
Table 1Summary of effects of annual/decadal climate variations on cold-season PM2.5 pollution in China.
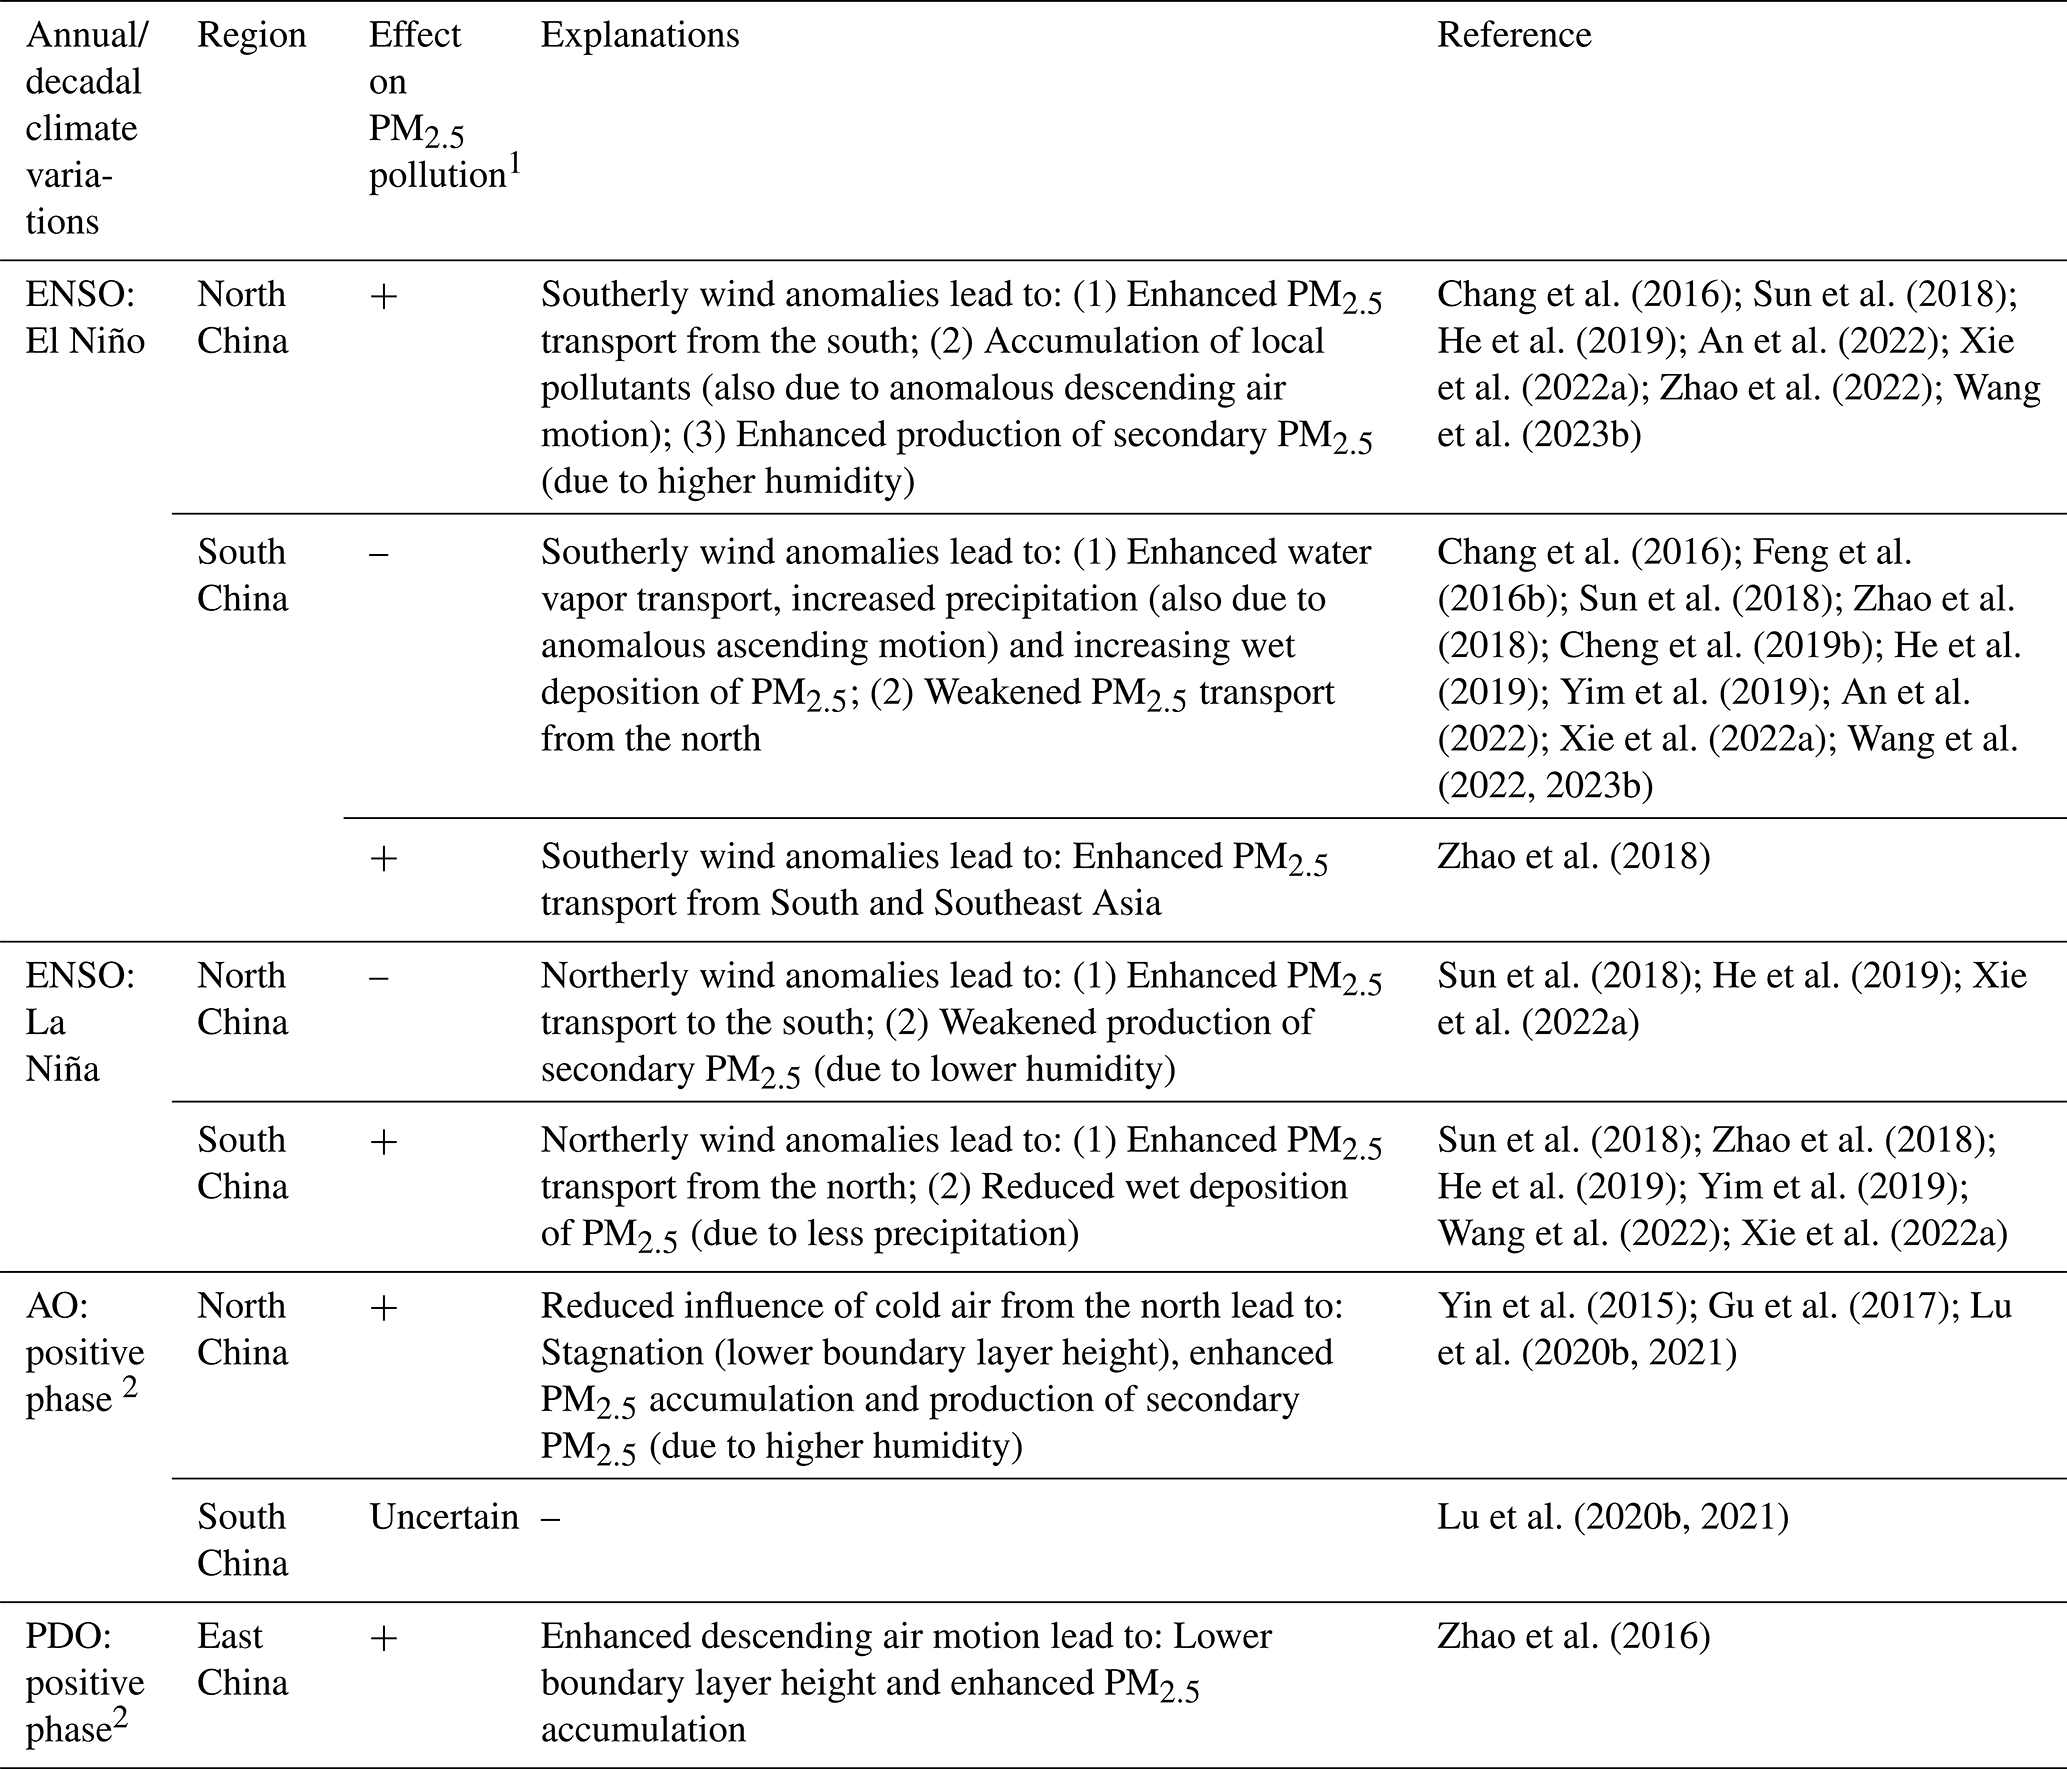
1 “+” indicates that the factor leads to severer PM2.5 pollution, increased PM2.5 pollution/haze days or reduced visibility, and “–” indicates that the factor leads to less severe PM2.5 pollution, reduced PM2.5 pollution/haze days or increased visibility. 2 The effects of negative phase of AO and PDO are opposite to these of their positive phase, thus are not listed.
This study focuses on PM2.5 pollution in the Pearl River Delta (PRD), a densely populated metropolitan region in South China. Due to effective local emission reduction, PM2.5 levels in the PRD have declined rapidly since the mid-2000s (Lin et al., 2018; Yan et al., 2020), with the annual mean PM2.5 concentration dropping to 31 µg m−3 in 2018 (Zhai et al., 2019). Although this is lower than those in other major regions of China (e.g., 55 µg m−3 in the North China Plain and 40 µg m−3 in the Yangtze River Delta in 2018; Zhai et al., 2019), further efforts are still required to meet the World Health Organization (2021) guideline of 5 µg m−3. However, continued PM2.5 pollution mitigation in the PRD faces growing challenges. One of them is the dominance of secondary components in PM2.5, particularly, secondary inorganic components including particulate sulfate (pSO4), nitrate (pNO3) and ammonium (pNH4) (collectively denoted as SNA) which accounts for over 40 % in PM2.5 (Huang et al., 2018; Yan et al., 2020; Chow et al., 2022). Besides, PM2.5 pollution in the PRD is markedly influenced by cross-regional transport, with contributions generally exceeding 60 % (Qu et al., 2024). It has even stronger influences on SNA components, with the contributions exceeding 60 % for pSO4 and 80 % for pNO3 in winter (Ying et al., 2014; Li et al., 2019). The substantial impact of cross-regional transport is linked to the PRD's location downwind of the prevailing northerly winds and intensive pollutant emissions widely distributed across East China. While emission reduction may continue to drive long-term PM2.5 declines, meteorology may play a crucial role in year-to-year changes in PM2.5 pollution here, given its strong influence on secondary PM2.5 production and cross-regional transport (Chen et al., 2020b).
During the cold seasons of 2015–2017, PM2.5 concentrations in the PRD unexpectedly persisted, or even showed a slight increase, despite rapid emission reductions in both the PRD and its upwind regions of East China (details in Sect. 3). Zhai et al. (2019) attributed these changes primarily to meteorological variations. Based on the environmental meteorology indices quantified by Gong et al. (2021), meteorological conditions in the PRD underwent drastic shifts over the three years, transiting from extremely unfavorable for PM2.5 pollution in 2015 to highly favorable in 2017. These shifts were likely linked to rapid changes in climate state, particularly the transition from a strong El Niño in 2015 to a weak/moderate La Niña in 2017 (details in Sect. 3). However, it remains unclear how meteorological changes influenced PM2.5-related processes and contributed to worsened PM2.5 pollution in the PRD, as well as how they interacted with emission reduction within and outside of the PRD. To address this, we analyzed meteorological changes in the three cold seasons and their potential effects on PM2.5 pollution in the PRD, as presented in Sect. 3. Furthermore, we applied the WRF/CMAQ chemical transport model to simulate PM2.5 pollution during representative months of each year, aiming to thoroughly assess the variations in the regional source contributions (local vs. transport (non-local)) and processes (e.g., cross-regional transport, emission process, chemical production and dry deposition) of PM2.5 in the PRD and identify the respective roles of meteorological and emission changes in shaping three-year variations in PM2.5 pollution. Detailed results are discussed in Sect. 4. This study aims to reveal the combined effects of drastic meteorological shifts and rapid emission reduction on PM2.5 changes over these three years, providing valuable insights into the extent to which meteorology and emissions can drive multiannual PM2.5 variations, and supporting future air quality improvement in the region.
2.1 Datasets
To examine the state of climate variations and meteorological conditions during the 2015–2017 cold seasons and investigate their potential connections with persistent PM2.5 pollution in the PRD, this study applied several datasets, as outlined below:
-
Climatic indices: Three climatic indices were utilized for this study, including the Niño-3.4 sea surface temperature (SST) index (3-monthly; Rayner et al., 2003), the AO index (3-monthly; Thompson and Wallace, 1998) and the PDO index (Zhang et al., 1997). These indices are provided by the U.S. National Oceanic and Atmospheric Administration (NOAA) Climate Prediction Center (https://www.ncei.noaa.gov/access/monitoring/products/, last access: 18 January 2021), aiming to represent the monthly state of ENSO, AO and PDO, respectively. A Niño-3.4 SST index above 0.5 °C indicates an El Niño state, while the value below −0.5 °C indicates a La Niña state. The intensity of El Niño or La Niña can be further determined by the magnitude of the index, as shown in Fig. 3b. For the AO and PDO indices, positive (negative) values correspond to positive (negative) phases.
-
Meteorological variables: To compare meteorological conditions influencing PM2.5 pollution in the PRD across the three cold seasons, observations at five World Meteorological Organization (WMO) sites in the PRD (locations shown in Fig. 1; https://gdex.ucar.edu/datasets/d461000/, last access: 5 February 2021) and the ERA-Interim reanalysis product (https://climatedataguide.ucar.edu/climate-data/era-interim, last access: 21 January 2021; Dee et al., 2011; Berrisford et al., 2011) were used here. The selected meteorological variables for comparison include near-ground air temperature, relative humidity and wind speed from the WMO observations, as well as wind speeds at 10 m (in both x- and y-directions) and precipitation from ERA-Interim.
-
PM2.5 concentrations: To thoroughly understand three-year changes in PM2.5 pollution in the PRD, this study used PM2.5 monitoring data in the nine cities of the PRD (including Guangzhou, Shenzhen, Jiangmen, Zhuhai, Foshan, Dongguan, Zhaoqing, Huizhou and Zhongshan; Fig. 1), released by the China National Environmental Monitoring Centre (downloaded from https://quotsoft.net/air/; last access: 18 December 2018).
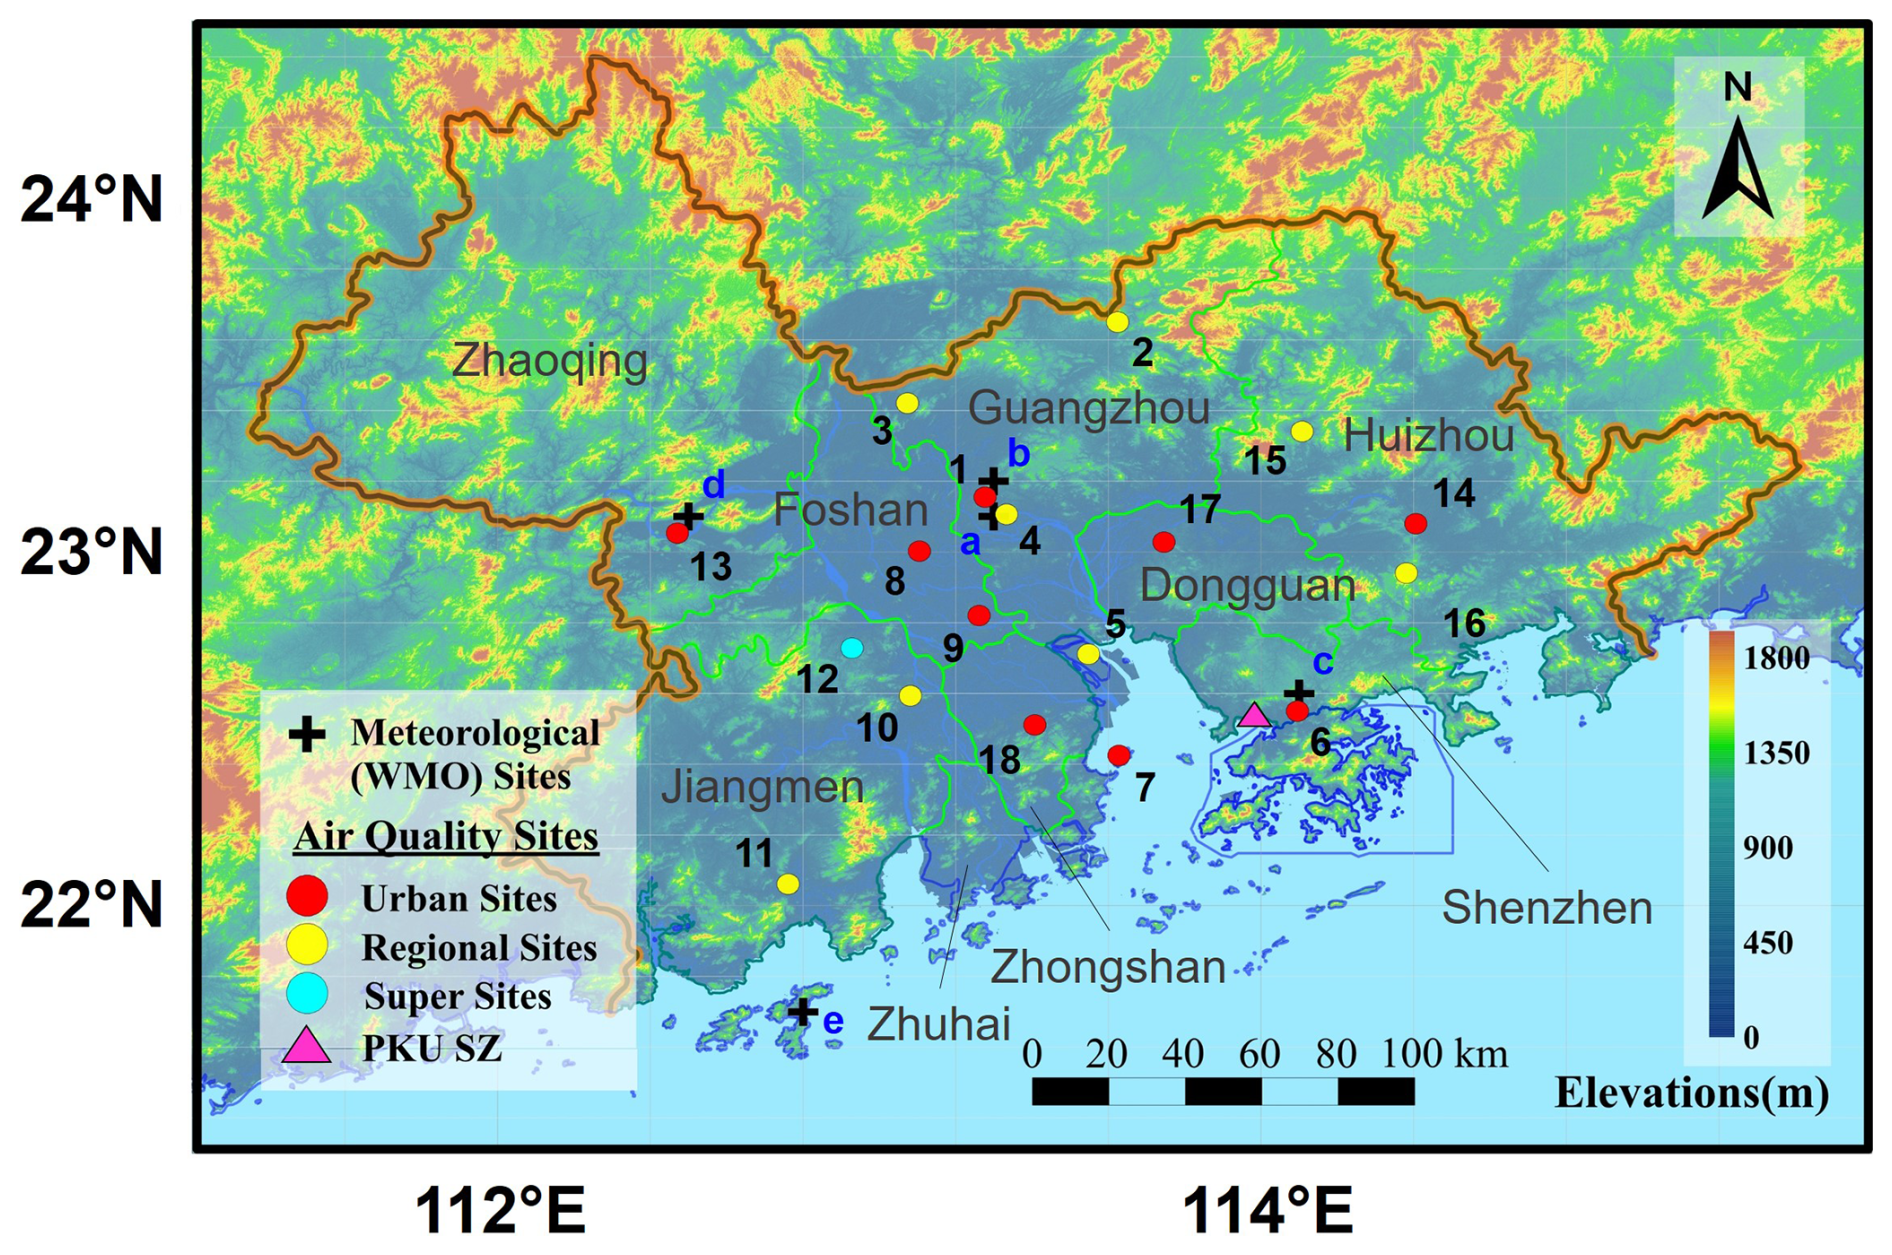
Figure 1Locations of meteorological (WMO) sites and air quality sites within the PRD. Meteorological (WMO) sites (marked in black crosses, indexes denoted in blue): a. Guangzhou; b. Baiyun Airport; c. Shenzhen; d. Gaoyao (Zhaoqing); e. Shangchuan Island. Air quality sites within the Guangdong-Hong Kong-Macao regional air quality monitoring network (urban, regional and super sites are indicated by red, yellow and cyan dots, respectively): 1. Luhu; 2. Tianhu; 3. Zhudong; 4. Modiesha; 5. Wanqingsha; 6. Liyuan; 7. Tangjia; 8. Huijingcheng; 9. Jinjuju; 10. Donghu; 11. Duanfen; 12. Heshan Supersite; 13. Chengzhongzizhan; 14. Xiapu; 15. Xijiao; 16. Jinguowan; 17. Nanchengyuanling; 18. Zimaling. The location of PKU-SZ is denoted as a pink triangle. The orange line indicates the boundary of the PRD region.
In this study, a cold season is defined as the period from October to January of the next year, which are the months when PM2.5 generally reaches its highest levels of the year in the PRD (Jiang et al., 2018). The cold season spanning from October of the year i to January of the year i+1 is referred to as “the i cold season” in the discussions. A PM2.5 polluted day is identified when the daily-mean PM2.5 concentration exceeds 35 µg m−3, the Grade-I PM2.5 threshold of the Chinese National Ambient Air Quality Standard, in at least six out of nine cities in the PRD.
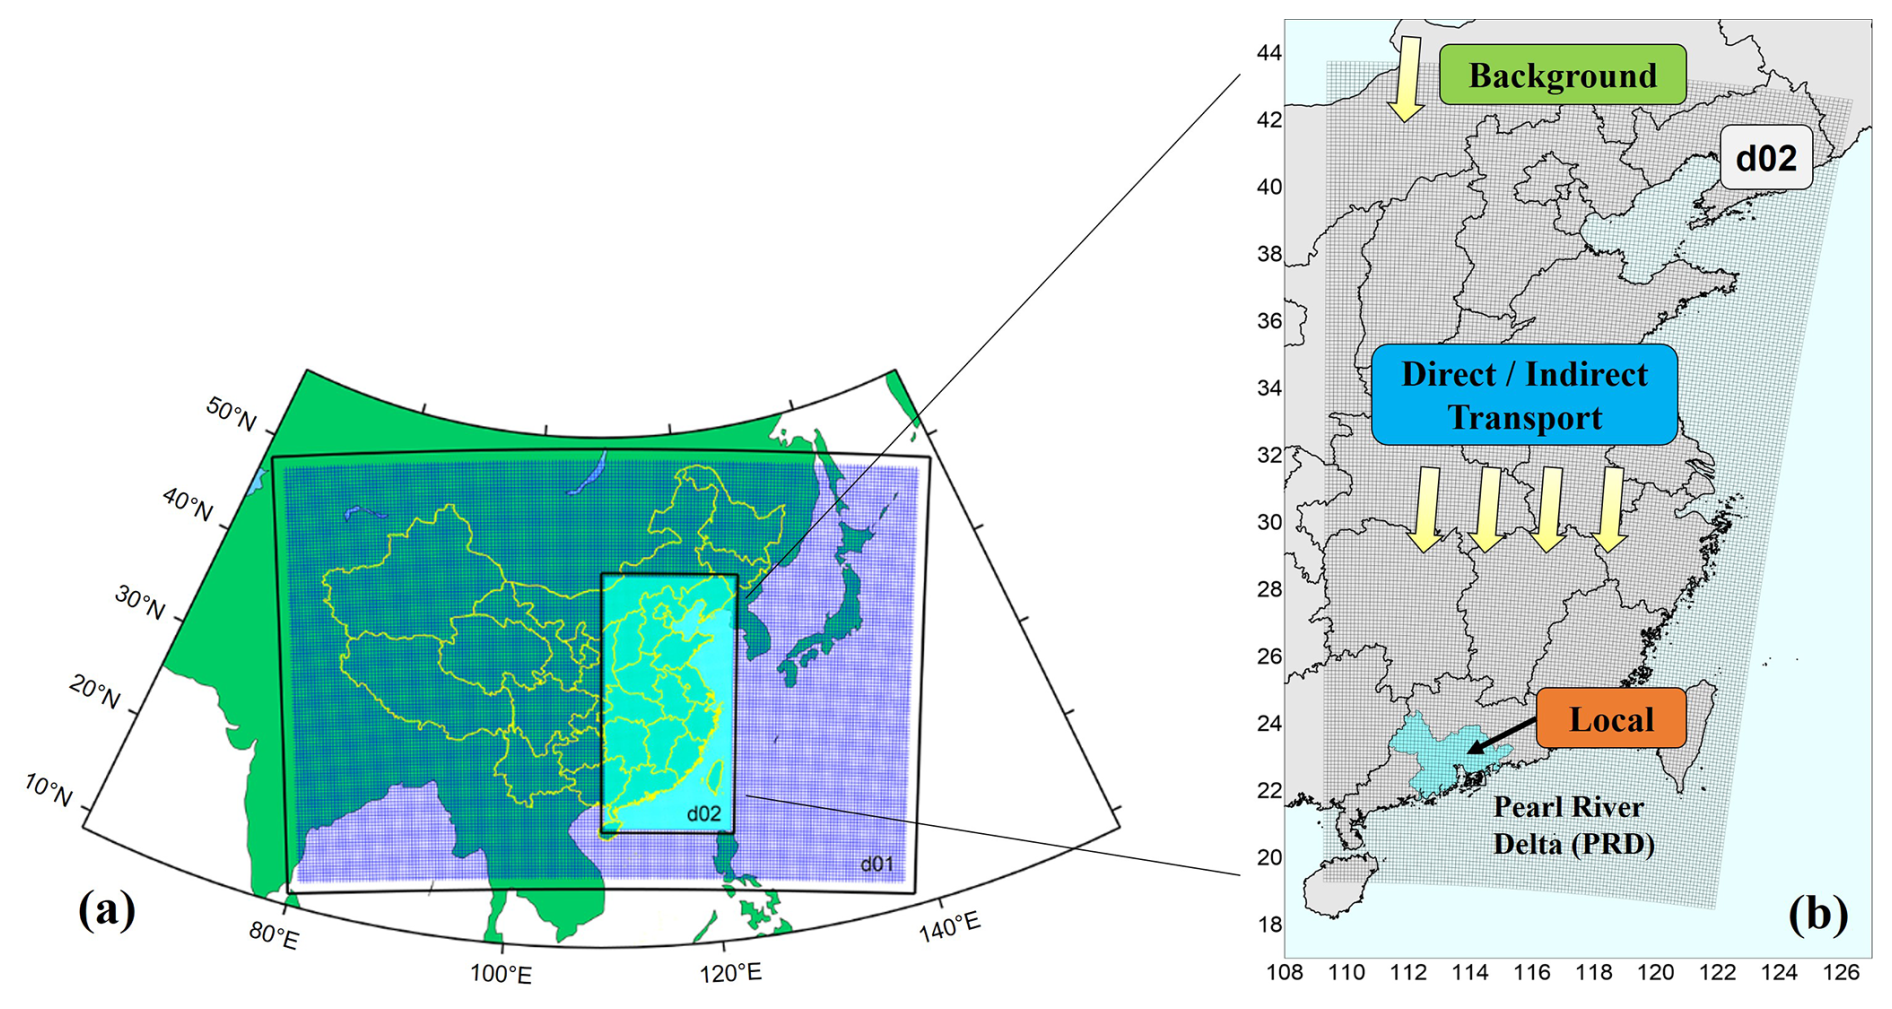
Figure 2(a) The two-nested simulation domains, denoted as d01 and d02. The black boxes indicate the WRF simulation domains, which are slightly larger than the corresponding CMAQ domains, as represented by nested areas. Both WRF and CMAQ are applied to d01 and d02. (b) PM2.5 source contributions to be identified in this study.
2.2 Model Setups
The CMAQ model (version 5.0.2, available at https://doi.org/10.5281/zenodo.1079898, US EPA Office of Research and Development, 2014), a widely used regional chemical transport model, was applied to investigate multiannual changes in PM2.5 pollution in the PRD and their driving factors. Two nested one-way simulation domains were set for this study, as displayed in Fig. 2a. The second simulation domain (hereafter marked as “d02”) encompasses most of East China, enabling the analysis of both local processes and cross-regional transport contributing to PM2.5 pollution in the PRD. Thus the simulation results from d02 were used for further analyses. Meteorological fields were derived from the results of the Weather Research and Forecasting (WRF) model (version 3.2, available at https://doi.org/10.5065/D68S4MVH, Skamarock et al., 2008). Chemical initial and boundary conditions for the outer domain were extracted from the outputs of the Model for Ozone and Related chemical Tracers, version 4 (MOZART-4; downloaded from https://www.acom.ucar.edu/wrf-chem/mozart.shtml, last access: 4 December 2019). SAPRC07 (Carter, 2010) and AERO6 were separately set as the mechanisms of gas-phase chemistry and aerosol process. Additional details on the model setup are available in Qu et al. (2021a, 2023), where the same WRF/CMAQ modeling system has been applied.
A series of emission inventories were utilized in this study. Anthropogenic emissions for the simulations were derived from multiple sources, including the local inventory for the PRD (provided by the Guangdong Environmental Monitoring Centre), the MEIC inventory for mainland China (version 1.3, with province-level SO2 and NOx emissions adjusted based on official emission statistics from Ministry of Ecology and Environment of the People's Republic of China 2017, 2021a, b; Li et al., 2017a, Zheng et al. 2018), the MIX inventory for Asian areas outside of China (version 1.1; Li et al., 2017b), and East Asian shipping emissions quantified by the SEIM model (Liu et al., 2016). Specifically, anthropogenic emission inventories corresponding to the years 2015–2017 were applied in the simulations to capture rapid emission reductions in East China (Fig. S1 in the Supplement) and their influence on PM2.5 pollution during the study period. Biomass burning emissions were derived from the Fire INventory from NCAR (FINN, version 1.5; Wiedinmyer et al., 2011). Biogenic emissions were estimated using the Model of Emissions of Gases and Aerosols from Nature (MEGAN, version 2.10; Guenther et al., 2012).
We selected October and December of 2015–2017 as representative months in autumn and winter for the simulations, with ten days before each month as the spin-up period. Given that this study focuses on the causes of PM2.5 pollution in the PRD, we restricted our analysis and comparisons to the simulation results on the PM2.5 polluted days of six selected months (Table S1 in the Supplement).
To ensure the validity of the simulation results, we evaluated the model's performance using multiple observational datasets. First, meteorological variables derived from the WRF output, including air temperature, absolute humidity, wind speed and direction, were compared against measurements at 226 WMO sites within the d02 (locations shown in Fig. S2a). The modeled concentrations of PM2.5 and some of its precursors (O3, NO2, SO2) were validated against observations at 18 sites within the Guangdong-Hong Kong-Macao regional air quality monitoring network (locations shown in Fig. 1). The model's performance in simulating PM2.5 levels in the upwind regions of the PRD was also assessed based on PM2.5 observations in 15 representative cities of East China (locations shown in Fig. S2b), sourced from the China National Environmental Monitoring Centre. Additionally, daily concentrations of pSO4, pNO3, pNH4, organic carbon (OC) and elemental carbon (EC), measured through filter sampling (once every two days) on the campus of Shenzhen Graduate School, Peking University (hereafter the site name is abbreviated as “PKU-SZ”; location marked in pink triangle in Fig. 1) were utilized to evaluate the model's capacity in simulating cold-season PM2.5 components and their interannual changes (details of the measurement can be found in Su et al., 2020). The statistical metrics used in model validation are summarized in Table S2. By comparing these metrics with benchmarks recommended by Emery et al. (2001), Emery et al. (2017), Huang et al. (2021) and Zhai et al. (2024), it can be determined whether the simulation results were acceptable for subsequent analysis.
2.3 Identification of regional source contributions to PM2.5
The factor separation method (FSM) was employed to quantify various regional source contributions to PM2.5 and its SNA components (pSO4, pNO3 and pNH4) concentrations in the PRD. This approach enables a detailed assessment of how much local and external emissions contribute to PM2.5 pollution while also identifying their interactive effects, thus it has been applied in many previous studies (Chen et al., 2014; Uranishi et al., 2018; Qu et al., 2021b; Sun et al., 2022; Xu et al., 2023). As illustrated in Fig. 2b, this study identified four types of regional source contributions:
-
Local contribution (Flocal): Contribution of PM2.5 and precursors emissions originating from all anthropogenic and biogenic emission sectors within the PRD (referred to as “local emissions”);
-
Direct transport contribution (Fdirect): Contribution of PM2.5 transport, either directly emitted or produced from emissions originating from all anthropogenic and biogenic sectors outside of the PRD but within the d02 (referred to as “outer emissions”), into the region;
-
Indirect transport contribution (Findirect): Contribution of the process by which PM2.5 precursors contributed by outer emissions are transported into the PRD and then react with other locally emitted precursors to produce secondary PM2.5;
-
Background contribution (Fbg): Contribution from sources outside the d02, estimated as the contributions of chemical boundary conditions used in the d02 simulations.
The contributions from non-local sources, including direct transport, indirect transport, and background contributions, are collectively referred to as “transport contributions” in the discussions. Specifically, outer emissions contribute to PM2.5 pollution in the PRD through both direct and indirect effects of cross-regional transport (referred to as direct and indirect transport). PM2.5 is transported into the targeted region as PM2.5 itself in the process of direct transport, but in the form of PM2.5 precursors in the process of indirect transport. The contributions of indirect transport represent the interactive effects between local and outer emissions. Currently, these contributions can only be identified by the FSM approach, whereas other source apportionment methods (e.g., top-down or bottom-up Brute Force Method and the tagging method; Clappier et al., 2017) typically classify or separate them into either local or external contributions, highlighting the advantage of this method for our study.
To identify the regional source contributions to PM2.5, four simulation cases with local and/or outer emissions open or zeroed out are established, which include (the simulated pollutant concentration in each case is denoted in the bracket):
-
Base case (f0): Pollutant emissions across the entire d02, encompassing both the PRD and outside regions, are considered in simulations;
-
PRD-zero case (fPRD-zero): Pollutant emissions within the PRD (local emissions) are zeroed out;
-
PRDout-zero case (fPRDout-zero): Pollutant emissions in regions outside of the PRD (outer emissions) are zeroed out;
-
All-zero case (fall-zero): All pollutant emissions within the d02 are zeroed out.
The simulated population-weighted pollutant concentration is used for further source apportionment calculation and analysis. As it better indicates the effect of air pollutants on human health, this metric is widely used in air quality assessment studies (e.g., Li et al., 2017c). The population-weighted concentration (fpop-weighted) is calculated as follows:
where fi is the simulated pollutant concentration in the grid cell i; pi is the population density within the grid cell i; Ai indicates the area of the administrative PRD region within the grid cell i; N is the total number of grid cells within the simulation domain. Gridded population density data for the year 2015 were obtained from the GPWv4 dataset (https://www.earthdata.nasa.gov/data/catalog/sedac-ciesin-sedac-gpwv4-popdens-4.0, last access: 14 September 2017; Doxsey-Whitfield et al., 2015) and applied in the above calculation.
The simulated pollutant concentrations in the four cases can be viewed as the sum of different contributions, that is, all four contributions in the base case, direct transport and background contributions in the PRD-zero case, local and background contributions in the PRDout-zero case, as well as only background contribution in the all-zero case. Therefore, four types of contributions to PM2.5 concentrations can be quantified using the following equations:
2.4 Attribution of PM2.5 changes to meteorology, local and outer emissions
Three base scenarios and four sensitivity scenarios were designed for the d02 simulations in this study, as listed in Table 2. Three base scenarios, named Base15, Base16 and Base17, aim to separately reproduce PM2.5 pollution in the PRD during the cold seasons of 2015–2017, incorporating the corresponding meteorological fields, local and outer emissions for each year. Four sensitivity scenarios (L16O15M15, L16O16M15, L16O16M17 and L16O17M17, with “L”, “O” and “M” representing local emissions, outer emissions, and meteorology, respectively, and the numbers after these letters indicating the years these factors follow) were setup with selected inputs fixed at 2016 levels while others remained at 2015 or 2017 levels. The impact of meteorological, local or outside emission changes during the cold seasons of 2015-2016 or 2016-2017 is identified based on the simulation results from the above seven scenarios. The contribution of a specific factor x (meteorology, local and outer emission, separately denoted as Meteo, Emis_L and Emis_O) to PM2.5 change during the period of y (15/16, from 2015 to 2016; 16/17, from 2016 to 2017), Sx,y, can be estimated as the difference in simulated PM2.5 concentrations between two scenarios where only that factor differs. For instance, to assess the impact of local emission reduction on changes in PM2.5 or its components during the cold seasons of 2015–2016 (), the simulated pollutant concentrations from the scenarios Base15 and L16O15M15 (marked as CBase15 and CL16O15M15, respectively) will be used, as local emissions are the only input differing between these scenarios (Table 2). is estimated as:
Similarly, when the simulated concentration of PM2.5 or its components in the scenario i is denoted as Ci, other contributions can be calculated as follows:
Similar methods have been widely applied to attribute multiannual PM2.5 changes to meteorological and emission changes (Jiang et al., 2022). Here, by separately identifying the contributions of local and outer emissions, their varied influence on PM2.5 pollution changes in the PRD can be revealed. It should be noted that following the same calculations outlined in Eqs. (6)–(11), we can also attribute changes in regional source contributions of PM2.5 and its components, as described in the last section, to meteorological, local and outer emission changes.
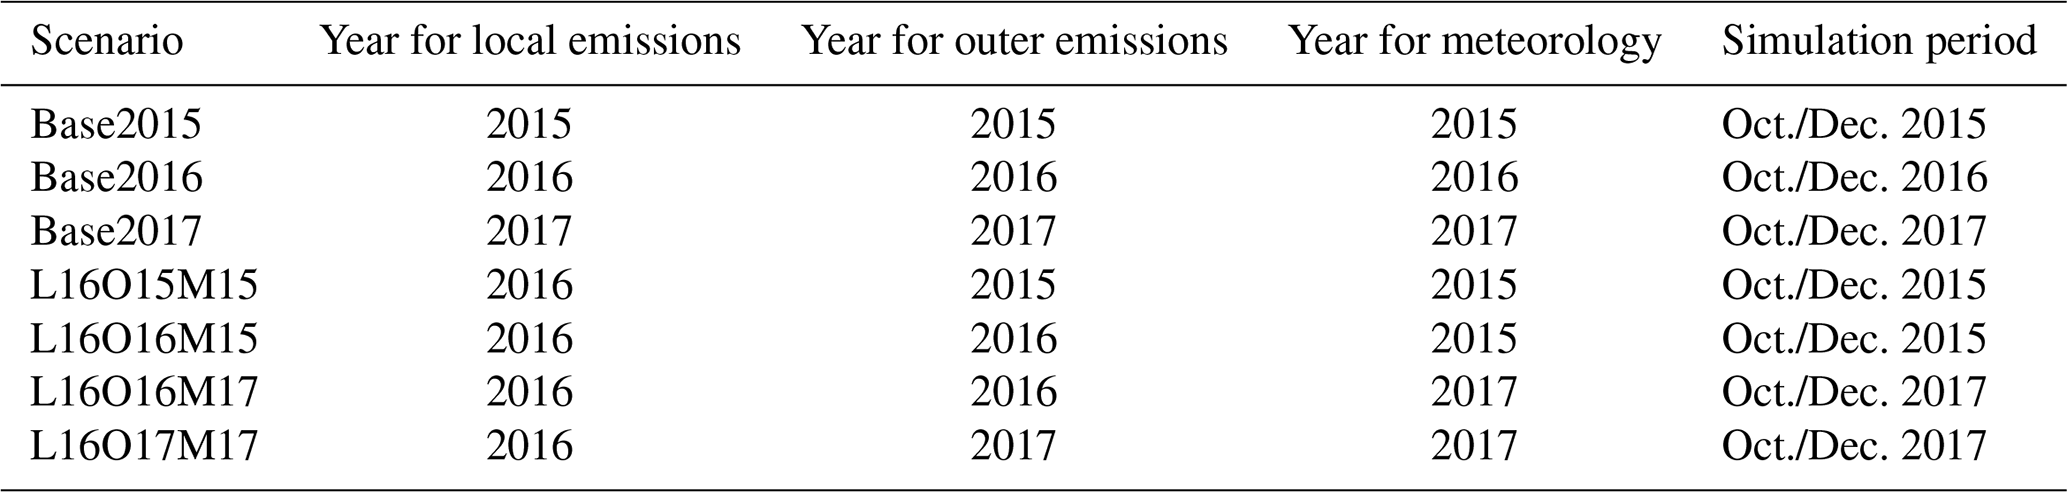
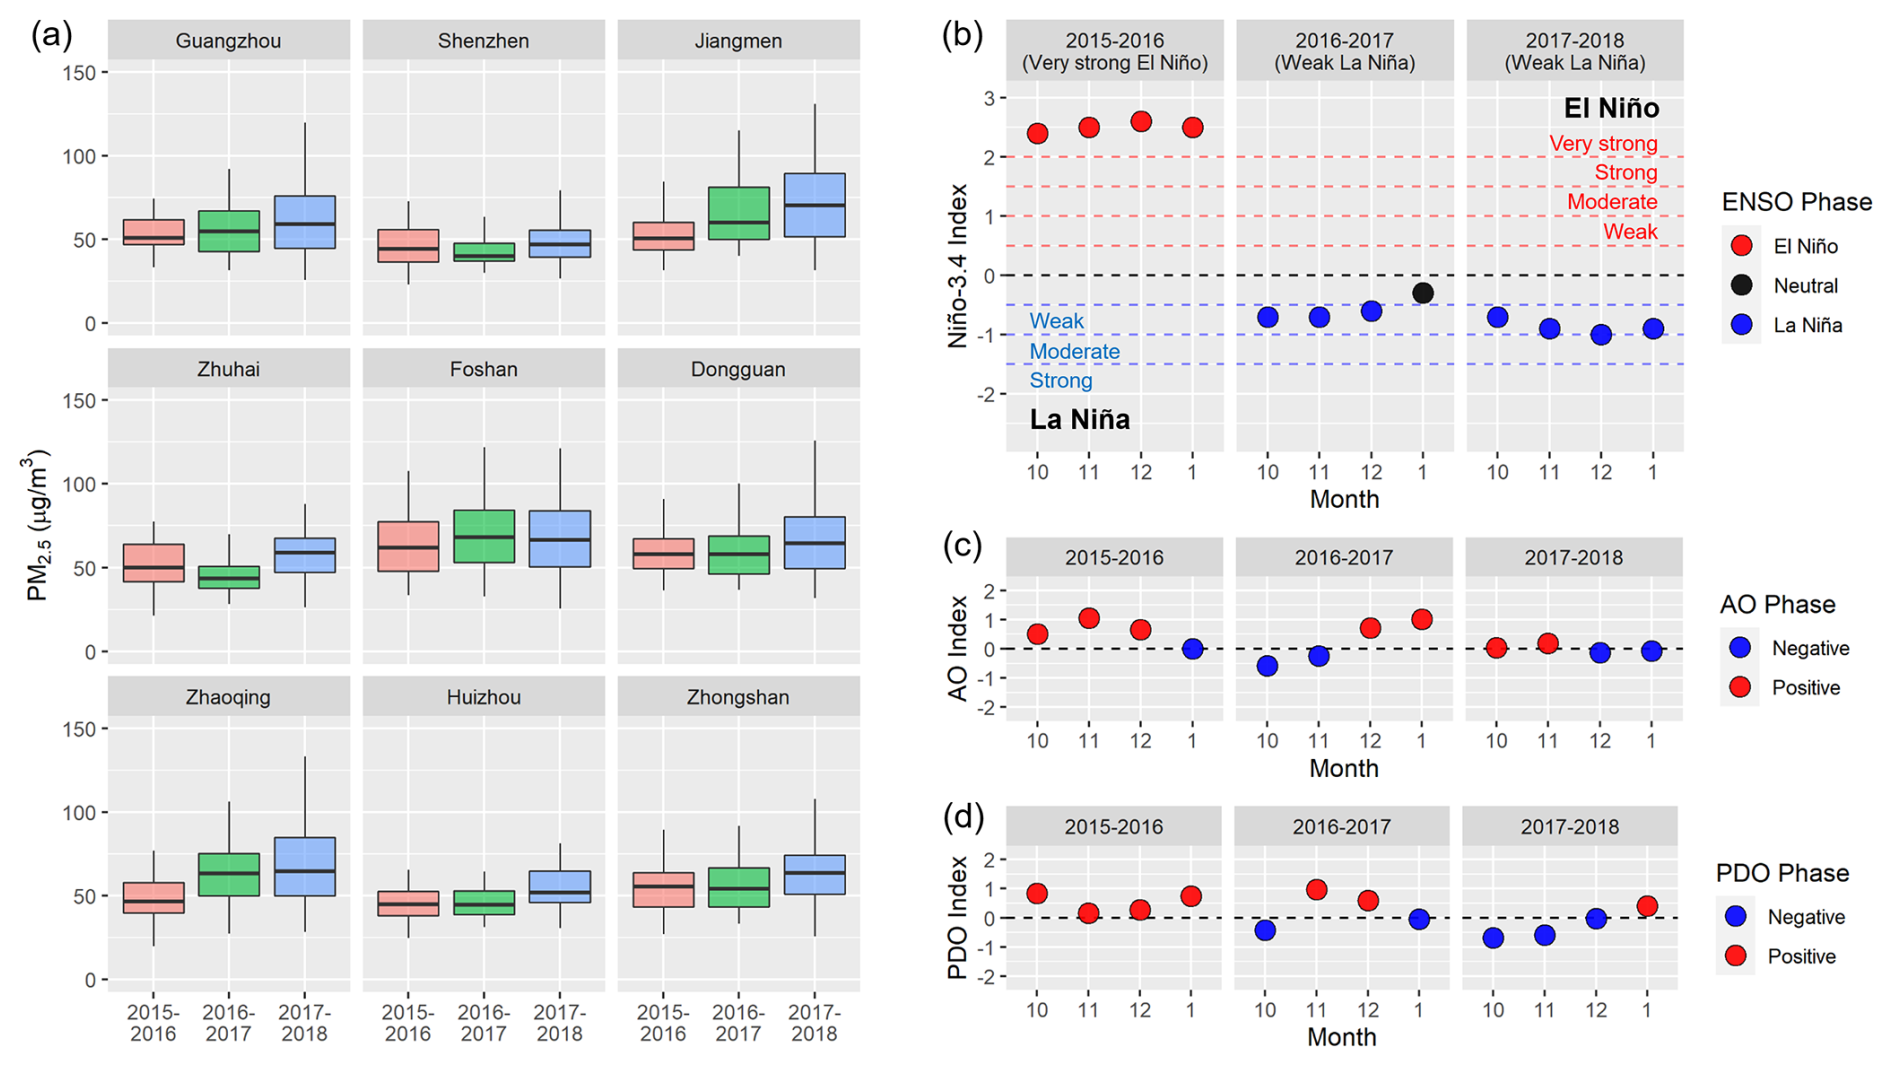
Figure 3Comparison of (a) polluted-day daily-mean PM2.5 concentrations in the nine cities of the PRD, (b) Niño-3.4 index, (c) AO index, and (d) PDO index during the cold seasons of 2015–2017.
2.5 Budget analysis
We implemented the budget calculation tool developed by Qu et al. (2023) to quantify the mass budget of PM2.5 within the atmospheric boundary layer (ABL) of the PRD, which describes the contributions of various PM2.5-related processes to hourly variations in total PM2.5 mass. PM2.5-related processes considered in the budget include:
-
Horizontal transport, classified as the process crossing the north, south, west and east borders of the PRD (displayed in Fig. S3);
-
Vertical exchange through the top of ABL, driven by the temporal variations in ABL height and advective transport (perpendicular to both the ABL top and its slope); these two processes are denoted as ABLex-H and ABLex-A, respectively, in the discussions;
-
Cloud process, including wet deposition, aqueous reactions, in- and below-cloud mixing (Liu et al., 2011);
-
Emission (process);
-
Aerosol process, such as gas-particle partitioning, nucleation and coagulation (Liu et al., 2011); and
-
Dry deposition.
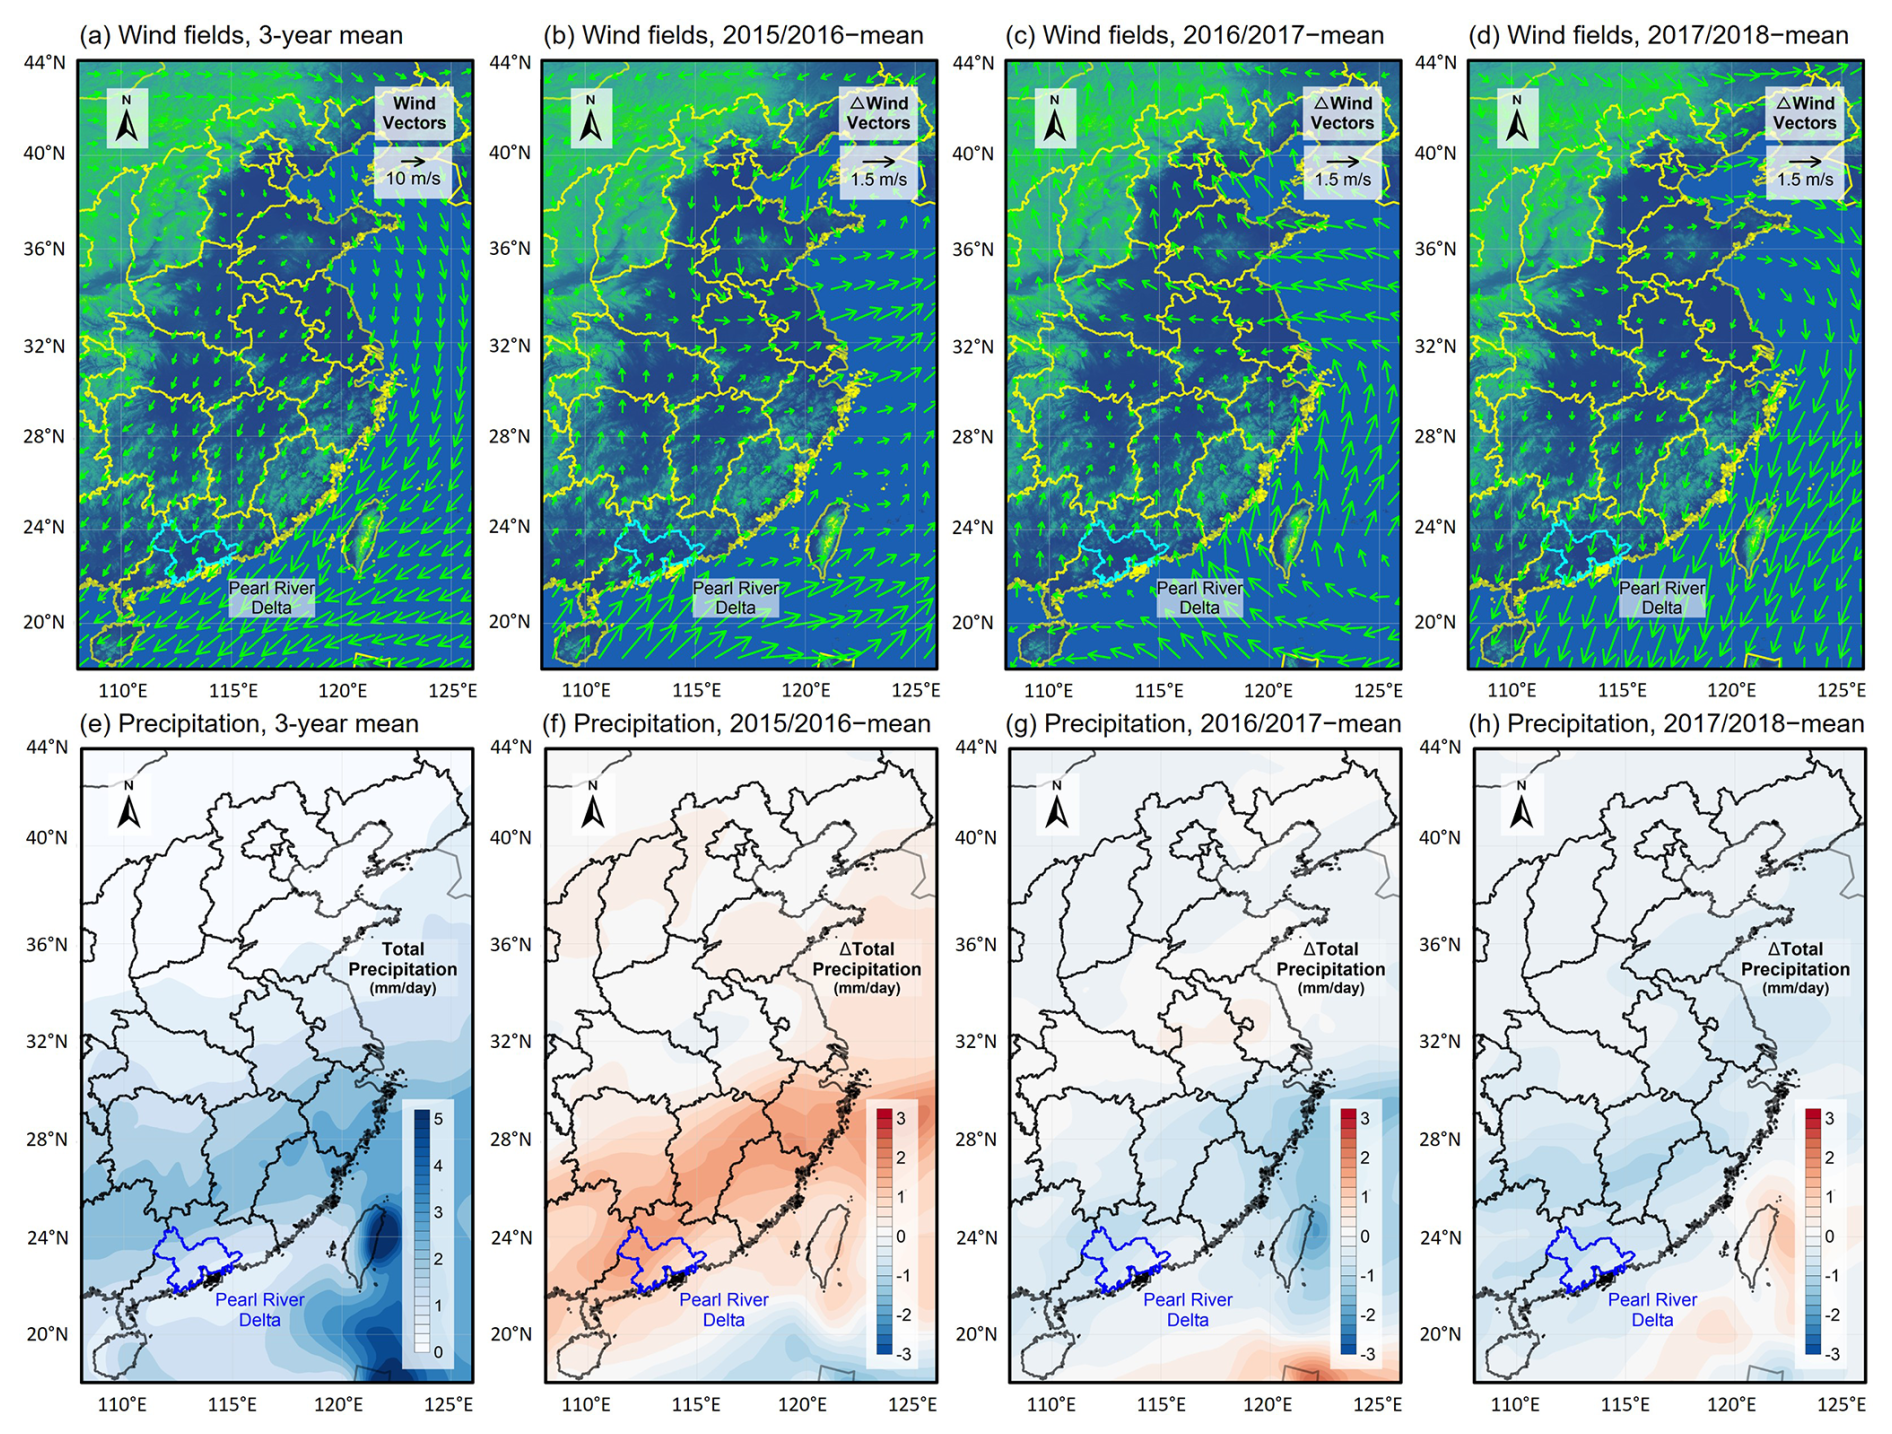
Figure 4Mean wind field (a), precipitation (e) in East China during the three cold seasons and the difference between wind field (b–d), precipitation (f–h) in each cold season (2015: b, f; 2016: c, g; 2017: d, h) with the corresponding mean results. Data source: ECWMF ERA-Interim re-analysis.
The budget calculations were performed based on multiple gridded hourly simulation results, including meteorological variables from WRF, PM2.5 concentrations from CMAQ and PM2.5 processes contributions derived from CMAQ's Integrated Process Rate (IPR) module. By comparing PM2.5 mass budgets in the three base scenarios and the L16O16M15, L16O16M17 sensitivity scenarios, we aim to understand on the regional scale, how meteorological and emission changes influence PM2.5-related processes and, ultimately, the severity of PM2.5 pollution in the PRD. More details on the methodology of budget calculation are available in Qu et al. (2023).
A comprehensive understanding of the three-year PM2.5 changes across different PRD cities is necessary before further analysis. Among the three cold seasons, the 2015 cold season featured with the lowest cold-season mean PM2.5 concentrations in nearly all cities, ranging from 30 µg m−3 in Huizhou to 43 µg m−3 in Foshan (Fig. S4). This was due to a higher proportion of clean days with extremely low PM2.5 concentrations (<15 µg m−3) in this year (∼ 44 % in the PRD, compared to ∼ 32 % in the other years; Fig. S5). In Jiangmen, Foshan and Zhaoqing, PM2.5 concentrations increased in the 2016 cold season and remained stable or slightly declined in the 2017 cold season. For the other cities, PM2.5 levels exhibited a continuous rise, reaching 38–51 µg m−3 in 2017. Based on the definition of PM2.5 polluted days in Sect. 2.1 (daily PM2.5>35 µg m−3 in at least six out of nine PRD cities), the number of polluted days increased from 47 in the 2015 cold season to 66 in both the 2016 and 2017 cold seasons. The comparison of PM2.5 concentrations on these polluted days (Fig. 3a) reveals that PM2.5 pollution in 2015 was not necessarily less severe than in 2016, especially in populated coastal cities such as Shenzhen and Zhuhai. In 2017, the highest polluted-day PM2.5 concentrations of the three cold seasons were observed in nearly all cities. These results suggest that despite rapid emission reductions driven by mitigation measures, PM2.5 pollution in the PRD did not consistently alleviate but instead persisted, highlighting the potentially critical role of meteorology in shaping the three-year changes in PM2.5 pollution.
Simultaneously, the climate state underwent significant changes during the cold seasons of 2015–2017, particularly with respect to ENSO, the most prominent annual/decadal fluctuation in the global climate system (Timmermann et al., 2018). As indicated by the Niño-3.4 index (Fig. 3b), a very strong El Niño occurred in the 2015 cold season, while a weak-to-moderate La Niña developed in the 2017 cold season. The 2016 cold season represents a transitional phase influenced by weak La Niña or neutral conditions. Persistent PM2.5 pollution in the PRD coincided with the El Niño-to-La Niña transition across the three cold seasons, aligning with the general effects of ENSO summarized in Table 1. Although PM2.5 pollution in the PRD is less sensitive to the AO and PDO phases (Mao, 2019), these oscillations can affect PM2.5 accumulation in North China as well as its southward transport. As shown in Fig. 3c–d, AO and PDO were predominantly in the positive phases during the 2015 cold season and in the negative phases during the 2017 cold season. Based on previous studies (Table 1), the changes in the AO and PDO states potentially restrained PM2.5 accumulation in North China and enhanced PM2.5 transport to the PRD.
The transition in climate state led to marked changes in meteorological conditions across the three cold seasons, which, in turn, affected PM2.5-related processes in the PRD. While northerly winds prevailed in all three cold seasons due to the East Asian winter monsoon (Fig. 4a), distinct wind anomalies were found around the PRD. During the 2015 cold season, a southerly wind anomaly induced by the strong El Niño was observed (Fig. 4b), which facilitates the transport of water vapor from the oceans. This contributed to notably higher precipitation in South China compared to other years (Fig. 4f). The increased precipitation and enhanced wet deposition of PM2.5 explain why PM2.5 pollution in the PRD was overall less severe during the 2015 cold season. RH within the PRD was also higher in 2015 (Table 3), especially on the polluted days. It created favorable conditions for the local production of secondary PM2.5, particularly inorganic components such as nitrate (Chen et al., 2020b; Ding et al., 2021; Yang et al., 2022; Zhai et al., 2023). Simultaneously, the southerly wind anomaly reduced the speed of prevailing northerly winds (Table 3), potentially enhancing the accumulation of locally-emitted or produced PM2.5 within the PRD. In contrast, during the 2017 cold season, the northerly wind anomaly (Fig. 4d) strengthened the transport of PM2.5 and its precursors from more polluted North and Central China to the PRD. This enhanced PM2.5 transport was likely driven by the combined effects of La Niña along with the negative phases of AO and PDO. As a result, PM2.5 pollution in the PRD even intensified in 2017, despite notable emission reductions both locally and in upwind regions. These linkages between climate transitions, regional meteorological anomalies and PM2.5 pollution changes in the PRD during the cold seasons of 2015–2017 are generally consistent with previous findings (Zhai et al., 2016; Chang et al., 2016; Wang et al., 2019; Xie et al., 2022a).
From the above analyses, we conclude that changes in meteorological conditions, which likely resulted from drastic shifts in climate state (El Niño-to-La Niña transition), tended to suppress local PM2.5 production and accumulation but enhance PM2.5 transport to the PRD during the 2015–2017 cold seasons. Through the WRF/CMAQ simulations, more quantified evidence of meteorological influence on regional source contributions and processes of PM2.5 in the PRD will be provided, while also considering the effects of emission changes. Relative results are presented in the following section.
Table 3Comparisons between meteorological variables in the 2015–2017 cold seasons at five WMO sites within the PRD. The lowest temperatures, wind speeds and the highest relative humidity among the three cold seasons at each site are marked in bold.
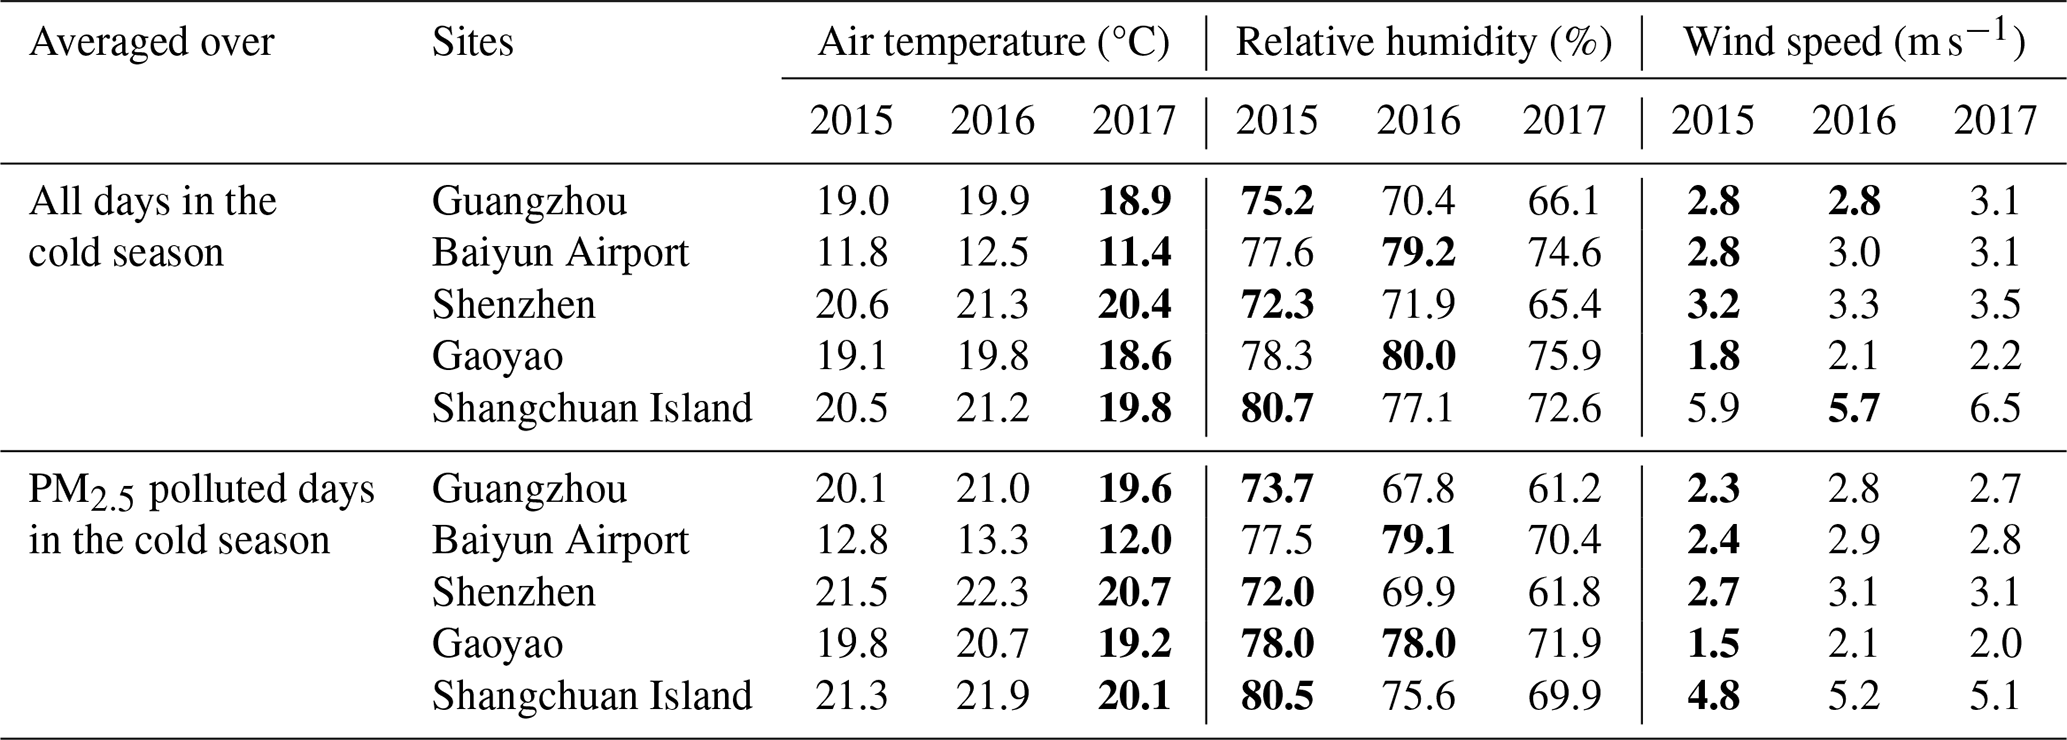
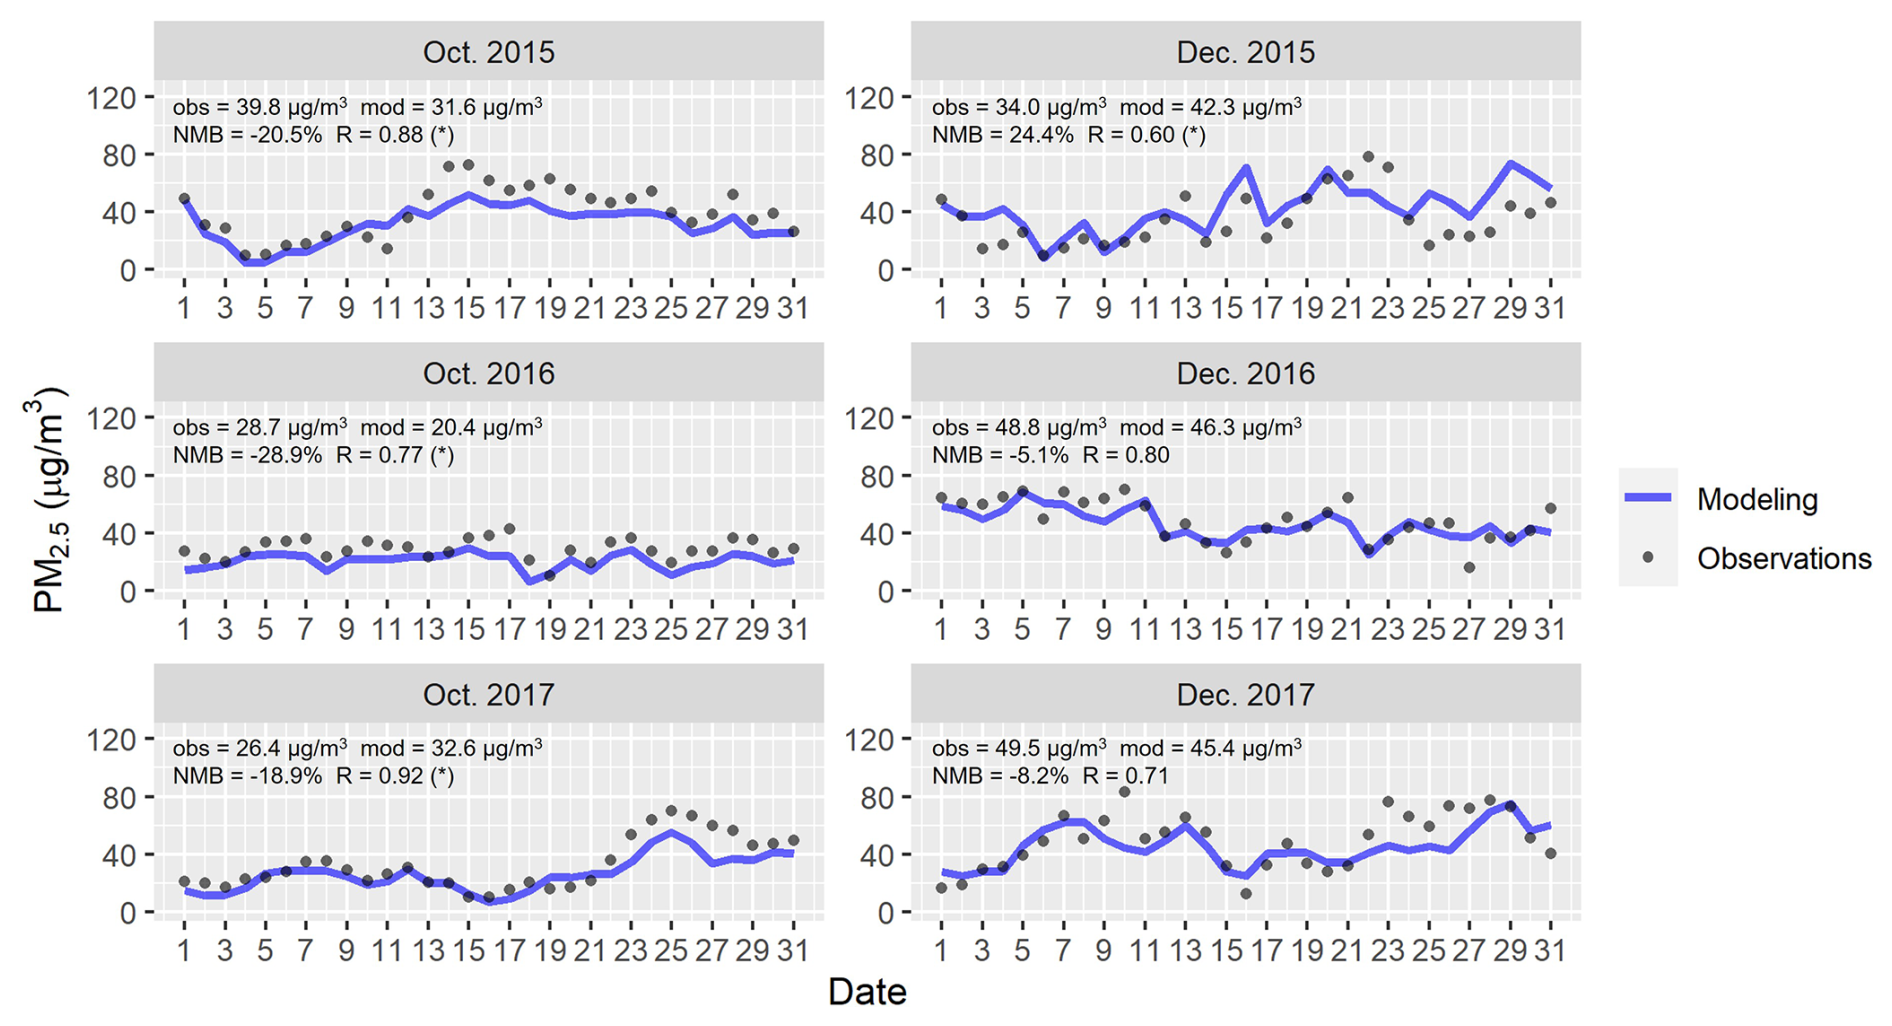
Figure 5Comparisons between daily PM2.5 concentrations from observations and model results in the PRD. “obs” and “mod” separately represent the mean observed and modeled PM2.5 concentrations over the month. NMB, normalized mean bias; R, correlation coefficient. “(*)” indicates that the p value is less than 0.05 for the comparisons.
4.1 Evaluation of model performance
Before analysis, a comprehensive evaluation was conducted to validate the simulation results from the WRF/CMAQ model, of which the details are outlined as follows:
-
(1) Meteorological variables: A series of statistical metrics were quantified to assess the model's performance in simulating air temperature, absolute humidity, wind speed and direction, based on meteorological measurements at WMO sites. As summarized in Table S3, most of these metrics over the six months meet the benchmarks recommended by Emery et al. (2001), suggesting a satisfying performance in meteorological simulations. More detailed discussions can be found in Text. S1 of the Supplement.
-
(2) PM2.5 and precursors (O3, NO2, SO2) concentrations in the PRD: As shown in Fig. 5, the model well captured PM2.5 concentrations and their temporal variations in the PRD during the study period. Across the six representative months, normalized mean bias (NMB) remained within ±30 %, and correlation coefficient (R) consistently exceeded 0.6, overall meeting the performance benchmarks recommended for PM2.5 simulations by Emery et al. (2017). Comparisons between modeled and observed maximum daily 8 h average (MDA8) O3 concentrations, daily mean NO2 and SO2 concentrations (Fig. S6) further indicate the model's acceptable performance in simulating these species with low bias and high correlation (Zhai et al., 2024). However, some discrepancies remain, notably the overestimation of MDA8 O3 in winter and the underestimation of SO2 in December 2017, underscoring areas for further improvement in simulation accuracy.
-
(3) PM2.5 concentrations in the upwind regions of the PRD: Figure S7 displayed the comparison between observed and modeled PM2.5 concentrations in the representative upwind cities. It indicates that the model reproduced the levels of PM2.5 in the upwind regions of the PRD, with acceptable overestimations ranging from 5 % to 33 % across different months. High correlation coefficients (0.68–0.82) suggest that the spatiotemporal variations of PM2.5 were well captured by the model. This satisfying performance in simulating PM2.5 pollution in the upwind regions reinforces the confidence in the model's capacity to precisely describe the contribution of cross-regional transport to PM2.5 pollution in the PRD.
-
(4) Concentrations of PM2.5 components at the PKU-SZ site: Based on the analysis results of filter-sampled PM2.5 at the PKU-SZ site, we evaluated the model's capacity in simulating different PM2.5 components (Fig. 6). The results indicate that PM2.5 concentrations at this site were slightly underestimated by 4.7 %, while their fluctuations during the three cold seasons were well reproduced. Both observations and model results confirm the dominance of SNA components (pSO4, pNO3 and pNH4) in PM2.5. However, the significant underestimation of OC (by 46.1 %) led to lower simulated proportions of organic components (OC and EC) in PM2.5 compared to observations, despite the overestimation of EC (by 47.6 %). This limitation is one of the reasons that relative analyses in this study (Sect. 4.2–4.3) focus on SNA components, which exhibit comparatively lower uncertainties in the simulations.
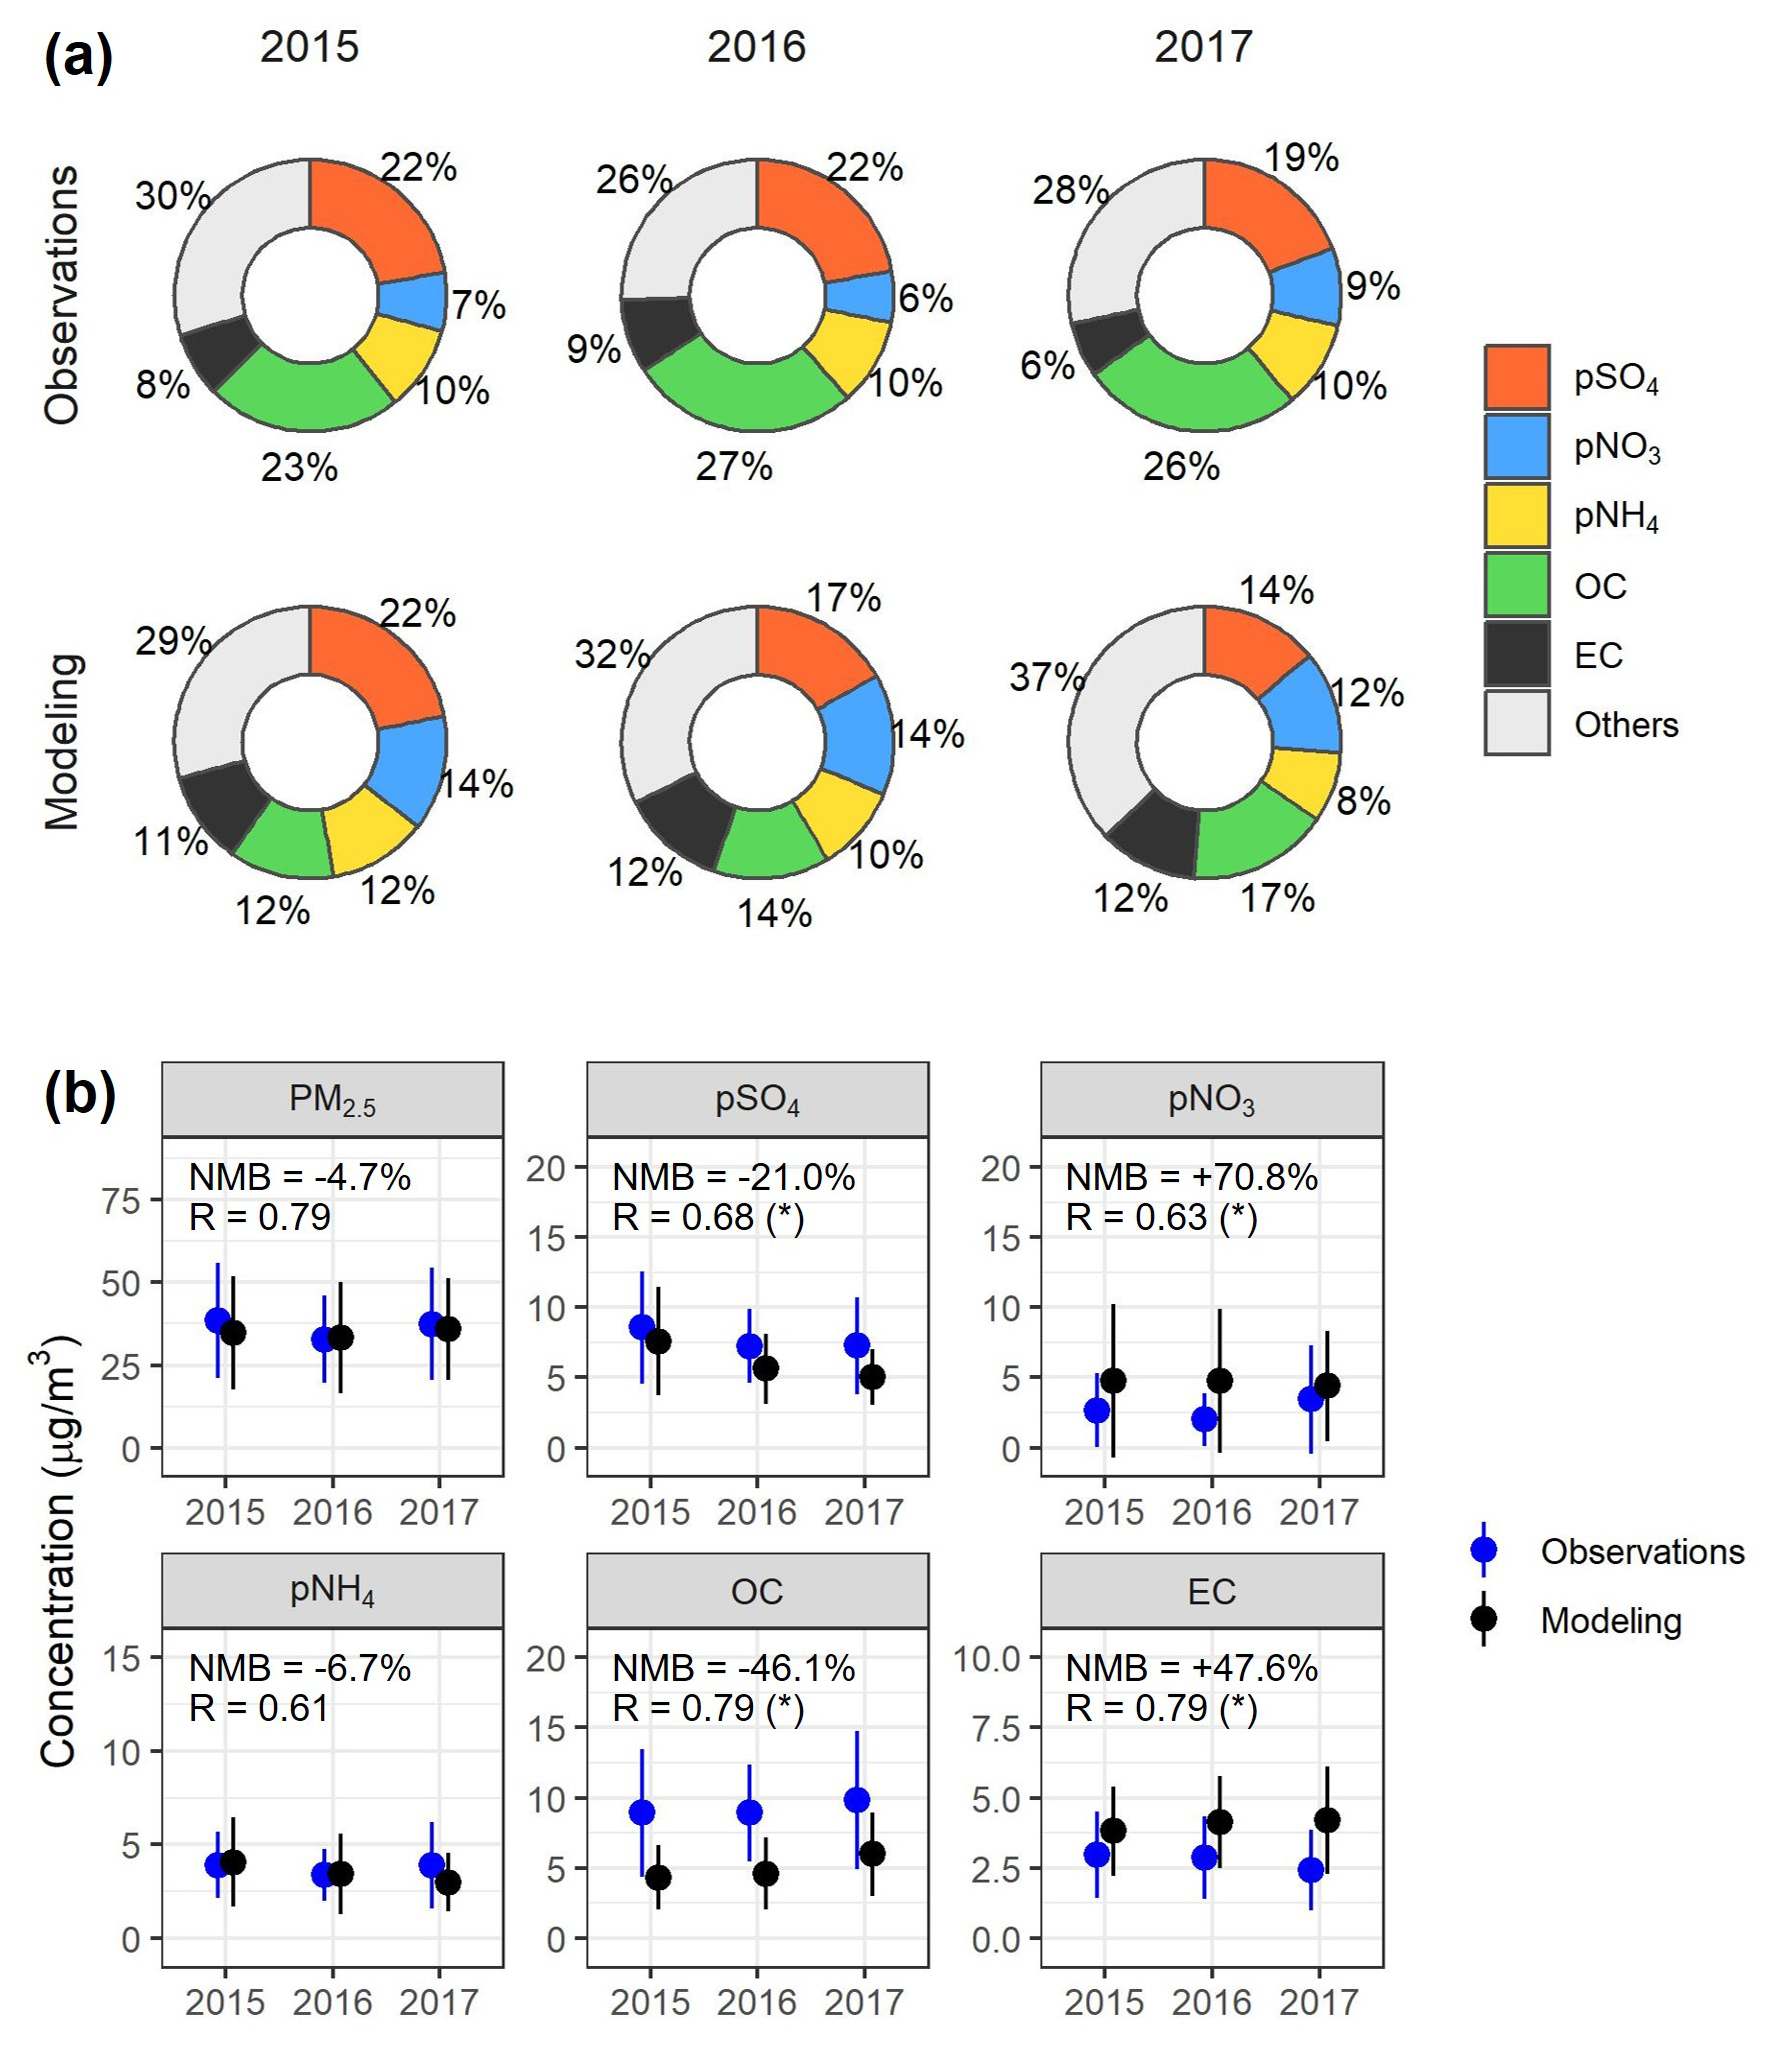
Figure 6Comparisons between PM2.5 compositions from observations and model results at the PKU-SZ site: (a) proportions of various components, including particulate sulfate (pSO4), nitrate (pNO3), ammonium (pNH4), organic carbon (OC), elemental carbon (EC) and others, in PM2.5; (b) daily concentrations of PM2.5 and its various components. NMB, normalized mean bias; R, correlation coefficient. “(*)” indicates that the p value is less than 0.05 for the comparisons.
Further comparisons reveal that pSO4 and pNH4 were underestimated by 21.0 % and 6.7 %, respectively, aligning with the benchmarks recommended by Emery et al. (2017) and Huang et al. (2021). In contrast, pNO3 was overestimated by 70.8 %, slightly exceeding the benchmark values (70 %, 60 %) from the same studies. The overestimation of pNO3 is a well-recognized challenge in chemical transport models (Miao et al., 2020; Xie et al., 2022b; Norman et al., 2025), potentially arising from biases in the gas (HNO3)-particle (pNO3) partition, pSO4 underestimation or the absence of chemical reactions such as pNO3 photolysis. In addition, observational uncertainties, particularly the evaporation loss of pNO3 during filter-sampling (Chow et al., 2005; Liu et al., 2015), may also contribute to the above discrepancy. However, when restricting the comparisons to days with observed daily pNO3 concentrations above 3 µg m−3, the model's overestimation decreases to 35.6 %, indicating more reliable performance during polluted conditions. Thus, the model results for pNO3 remain suitable for further analysis focusing on PM2.5 polluted days.
Overall, the model demonstrated acceptable performance in simulating meteorological variables and pollutant concentrations with low biases and high correlations. While some disparities remain in the simulation of PM2.5 components, statistic metrics from relative evaluations generally meet recommended benchmarks, supporting the model's reliability for further analysis.
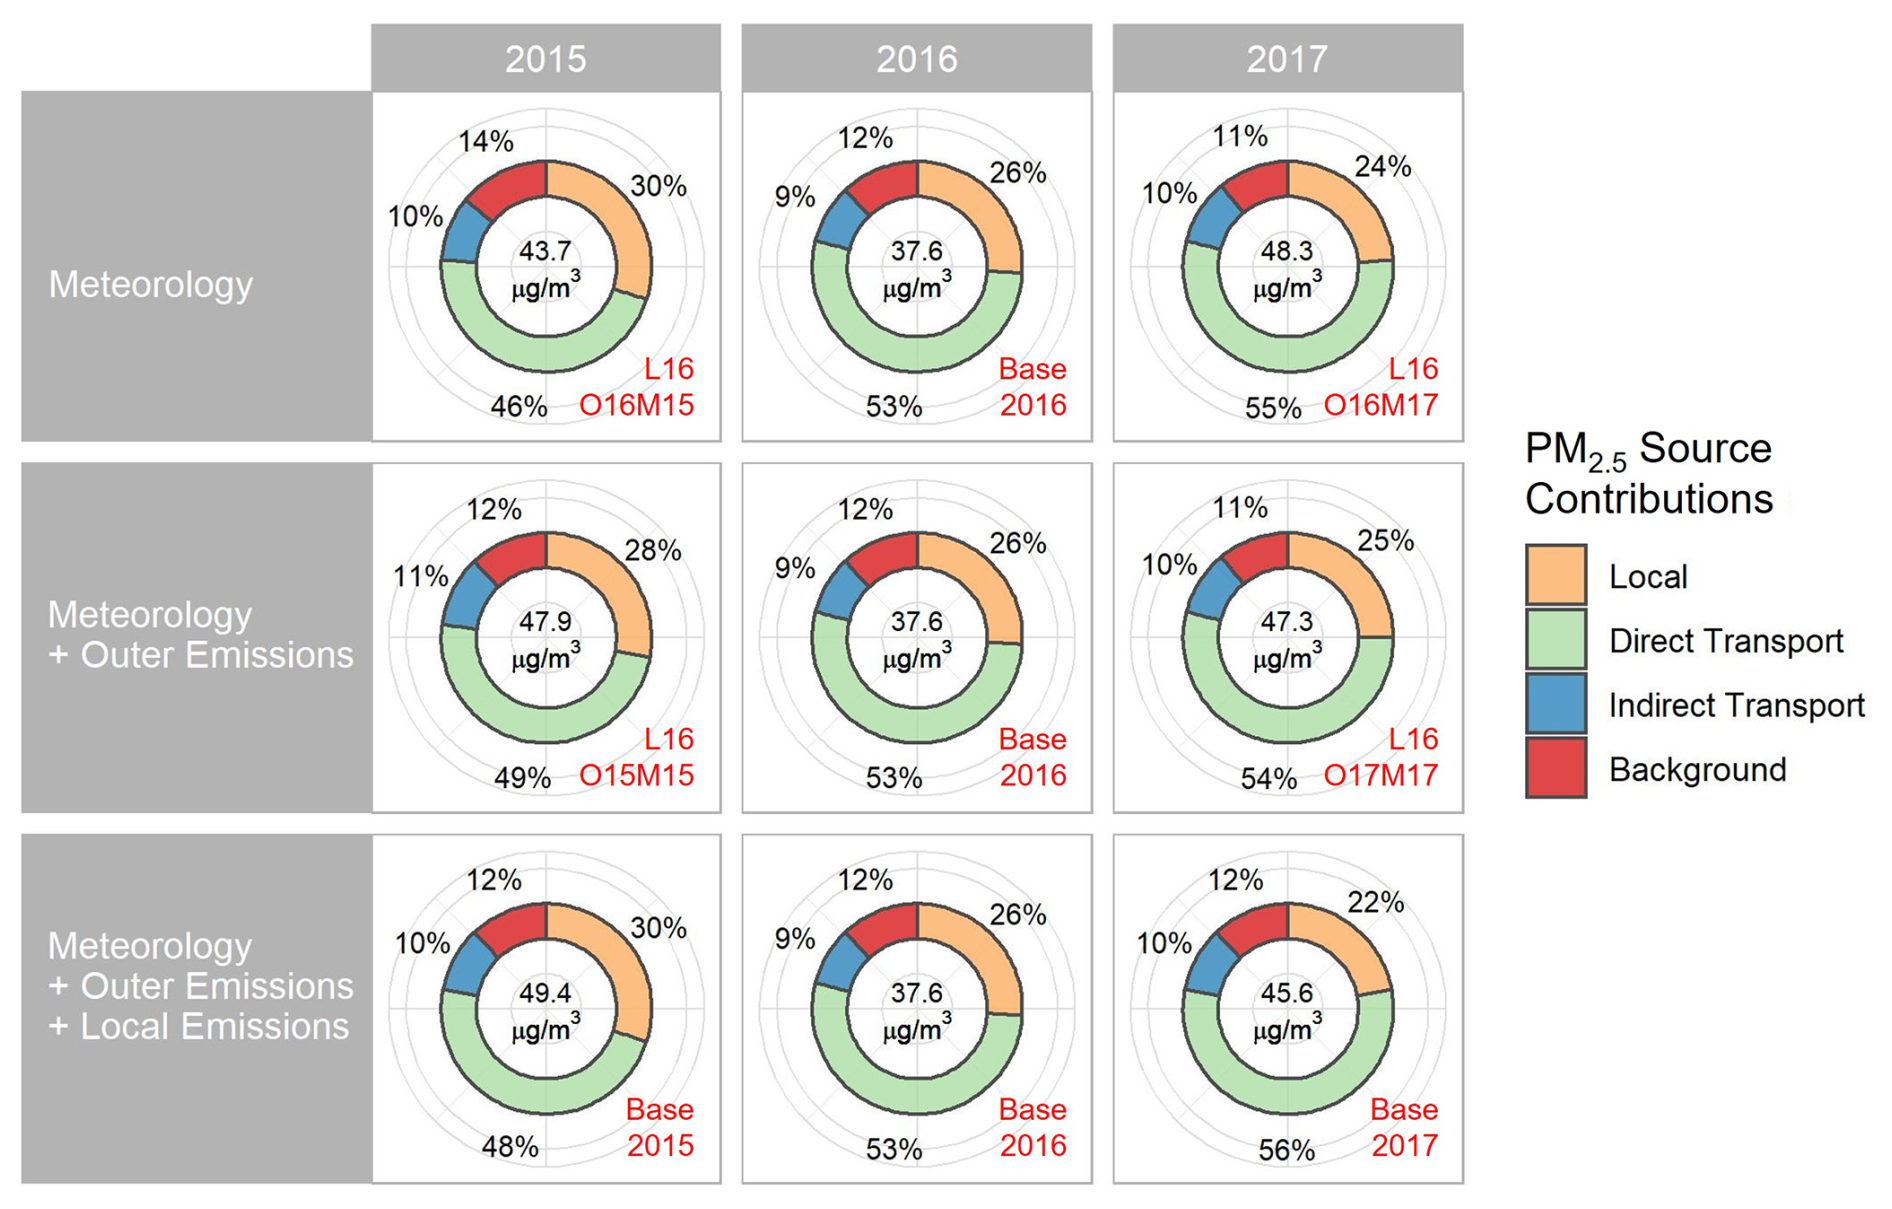
Figure 7Comparisons of regional source contributions to population-weighted PM2.5 concentrations on the PM2.5 polluted days in the PRD. The scenario corresponding to each result is noted in red.
4.2 Changes in the regional source contributions to PM2.5
Figure 7 illustrates regional source contributions to population-weighted mean PM2.5 concentrations in the PRD on the polluted days of the three cold seasons. The figure presents results from three base scenarios and four sensitivity scenarios, aiming to demonstrate the effect of changes in meteorology, local and outer emissions on the PM2.5 regional source contributions. For the 2016 cold season, the results are derived from the simulation of the Base2016 scenario. For the other two cold seasons, the differing inputs relative to the Base2016 scenario are specified in the left column.
An overview of the results from various scenarios reveals the significant impact of cross-regional transport on PM2.5 pollution in the PRD. Transport contribution or the contribution from non-local sources, including direct transport, indirect transport and background contributions, accounted for 70 %–80 % of PM2.5 within the region. Among these, direct transport contributions are the largest, accounting for nearly half of PM2.5. Indirect transport and background contributions were comparable, each accounting for 9 %–14 % in PM2.5. In contrast, local emissions contributed to 20 %–30 % of PM2.5. The above regional source contributions to PM2.5 overall align with previous PM2.5 source apportionment studies in the PRD (Qu et al., 2024).
Comparisons of PM2.5 regional source contributions across the three cold seasons reveal how meteorological and emission changes led to differing causes of PM2.5 pollution in the PRD. The first row of Fig. 7 isolates the effects of meteorological changes by applying meteorological fields for each year while keeping both local and outer emissions fixed at the 2016 levels. The results show clear shifts in source contributions: Local contributions to PM2.5 declined from 30 % in 2015 to 26 % in 2016 and further to 24 % in 2017, while transport contributions increased – particularly direct transport, of which the contributions rose from 46 % in 2015 to 53 % in 2016 and 55 % in 2017. These changes align with the findings in Sect. 3 that meteorological changes suppressed local PM2.5 production and accumulation while enhancing cross-regional PM2.5 transport. When reductions in outer emissions are incorporated into the simulations, decreases in the amount of PM2.5 transported into the PRD and thus direct transport contributions to PM2.5 are expected. However, results from the second row of Fig. 7, which reflect the combined effects of meteorological and outer emission changes, show that changes in local and transport contributions to PM2.5 remain in the same direction but are less pronounced. This suggests that while outer emission reductions had a mitigating effect, they were insufficient to offset the meteorology-driven enhancement of PM2.5 transport. Finally, when local emission reductions are also included, comparisons among the three base scenarios (the third row in Fig. 7) show more pronounced changes in source contributions to PM2.5. Specifically, transport contributions rose continuously from 70 % in 2015 to 84 % in 2016 and 88 % in 2017. These results indicate that the increases in direct transport contributions and declines in local contributions were primarily driven by meteorological and local emission changes, whereas the effect of outer emission reductions on PM2.5 pollution in the PRD was relatively limited.
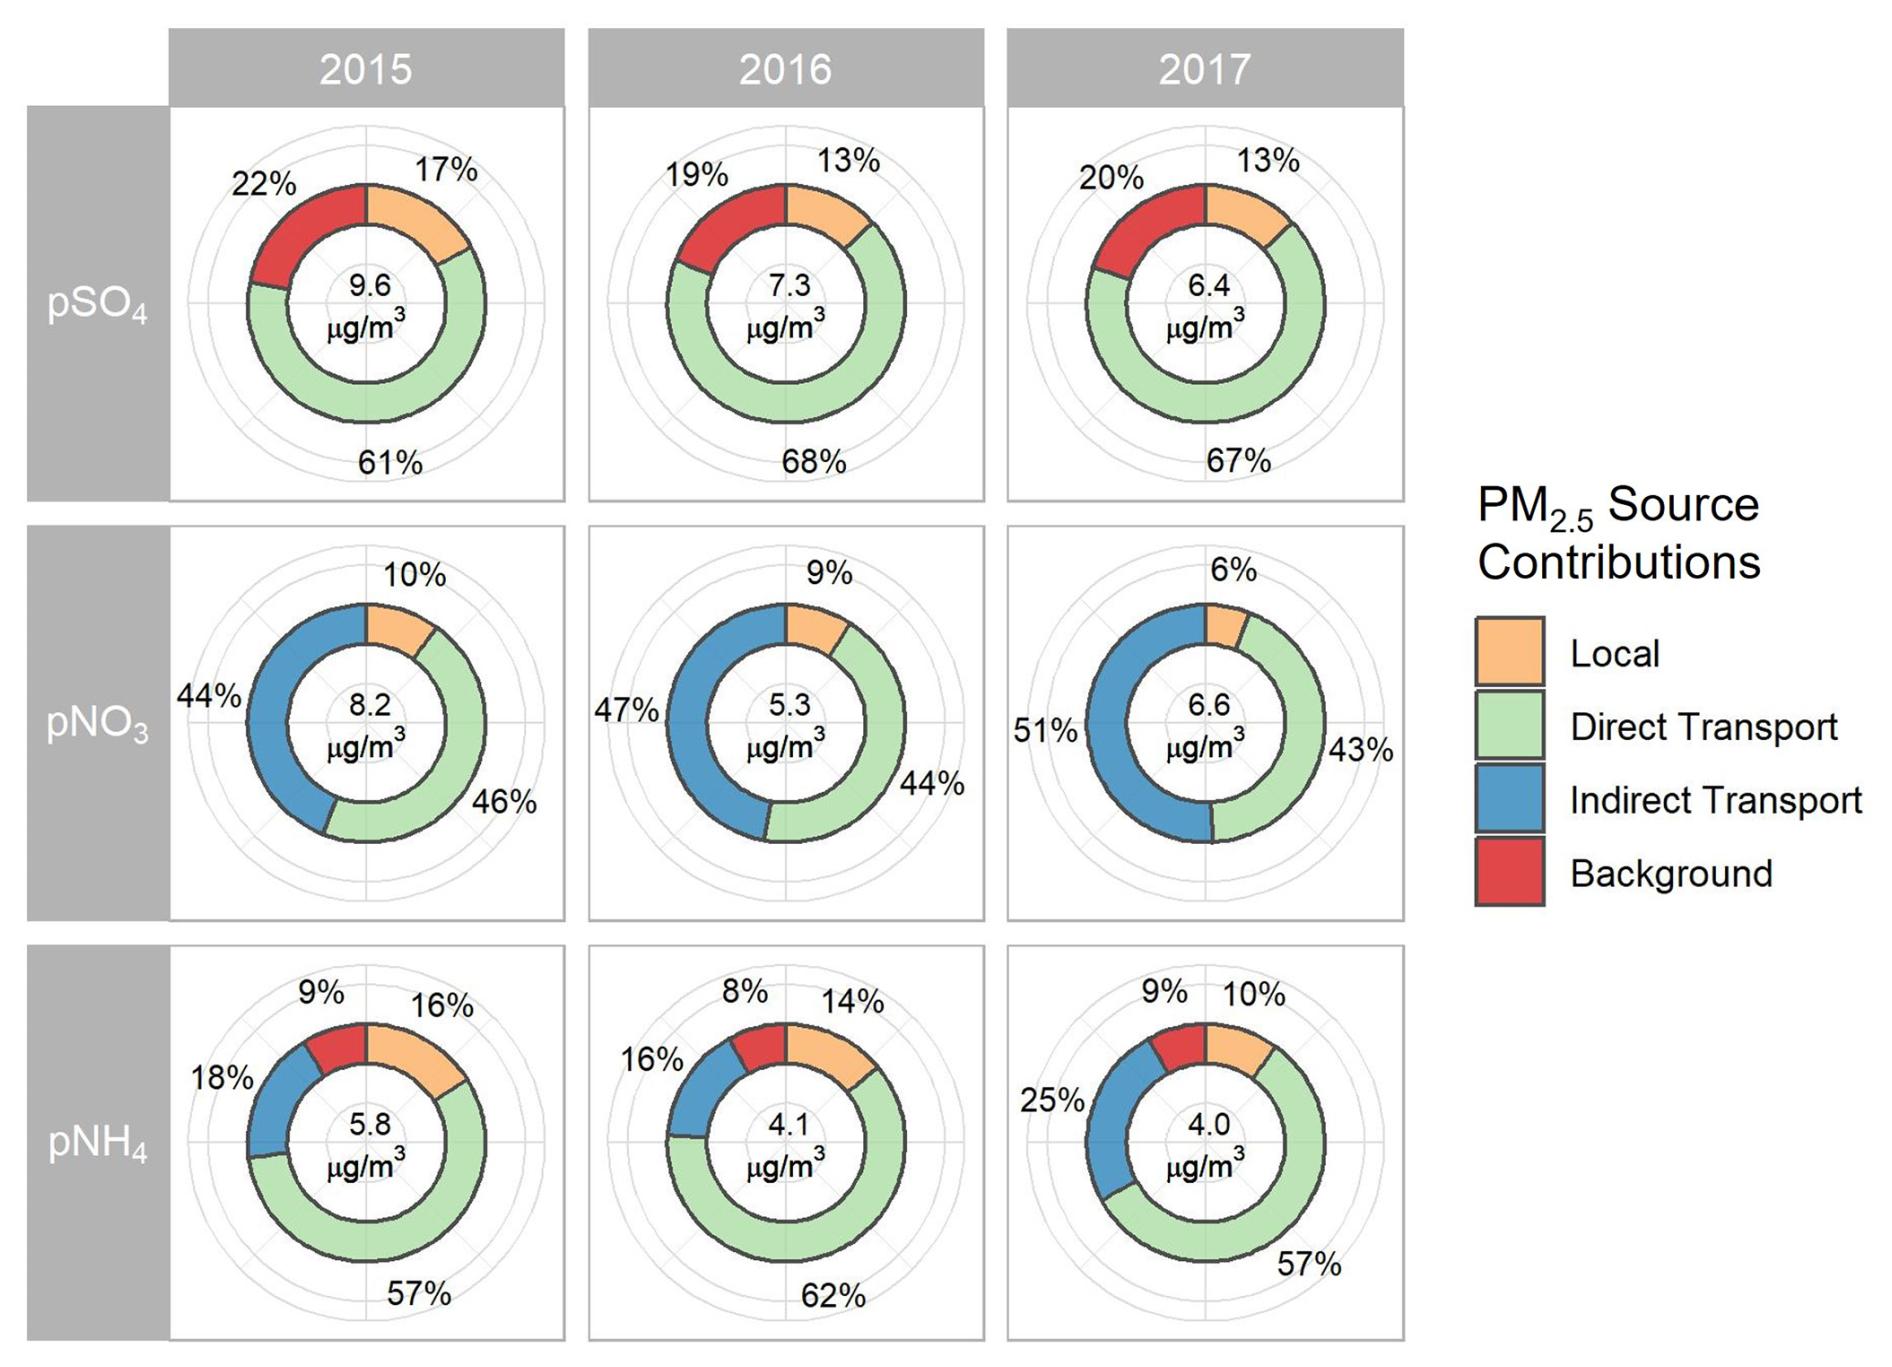
Figure 8Comparisons of regional source contributions to population-weighted mean particulate sulfate (pSO4), nitrate (pNO3) and ammonium (pNH4) concentrations on the PM2.5 polluted days in the PRD. The scenarios corresponding to the results in 2015–2017 cold seasons are Base2015, Base2016 and Base2017, respectively.
We also identified the regional source contributions of SNA components in PM2.5, of which the results from the three base scenarios are presented in Fig. 8. Direct transport is also the dominant contributor to all three components, accounting for 61 %–68 % of pSO4, 43 %–46 % of pNO3 and 57 %–62 % of pNH4. Additionally, indirect transport played a significant role in pNO3, contributing 44 %–51 %, highlighting the importance of transported precursors in pNO3 production. Background contribution to pSO4 was also notable, accounting for ∼ 20 %. For pNH4, background contributions (8 %–9 %) and indirect transport (16 %–25 %) were both considerable, potentially indicating the effects of pSO4 and pNO3 transport in the form of (NH4)2SO4 and NH4NO3. The substantial influence of cross-regional transport on SNA, particularly pNO3, is consistent with previous PRD-based studies (Ying et al., 2014; Li et al., 2019). In contrast, local contributions were relatively low, accounting for only 13 %–17 % of pSO4, 6 %–10 % of pNO3 as well as 10 %–16 % of pNH4. Comparisons of SNA regional source contributions across the three cold seasons suggest an overall increase in transport contributions and a decrease in local contributions. Figures S8–S10 illustrate the comparisons between regional source contributions for each SNA components across all scenarios. Similar to PM2.5, these changes were primarily driven by meteorological and local emission changes. However, for pSO4, the effect of reduced outer emissions outweighed meteorological influences, even leading to an overall increase in local contributions over the three cold seasons assuming local emissions remained unchanged (through comparisons between the results from the scenarios L16O15M15, Base2016 and L16O17M17, or the second row in Fig. S8).
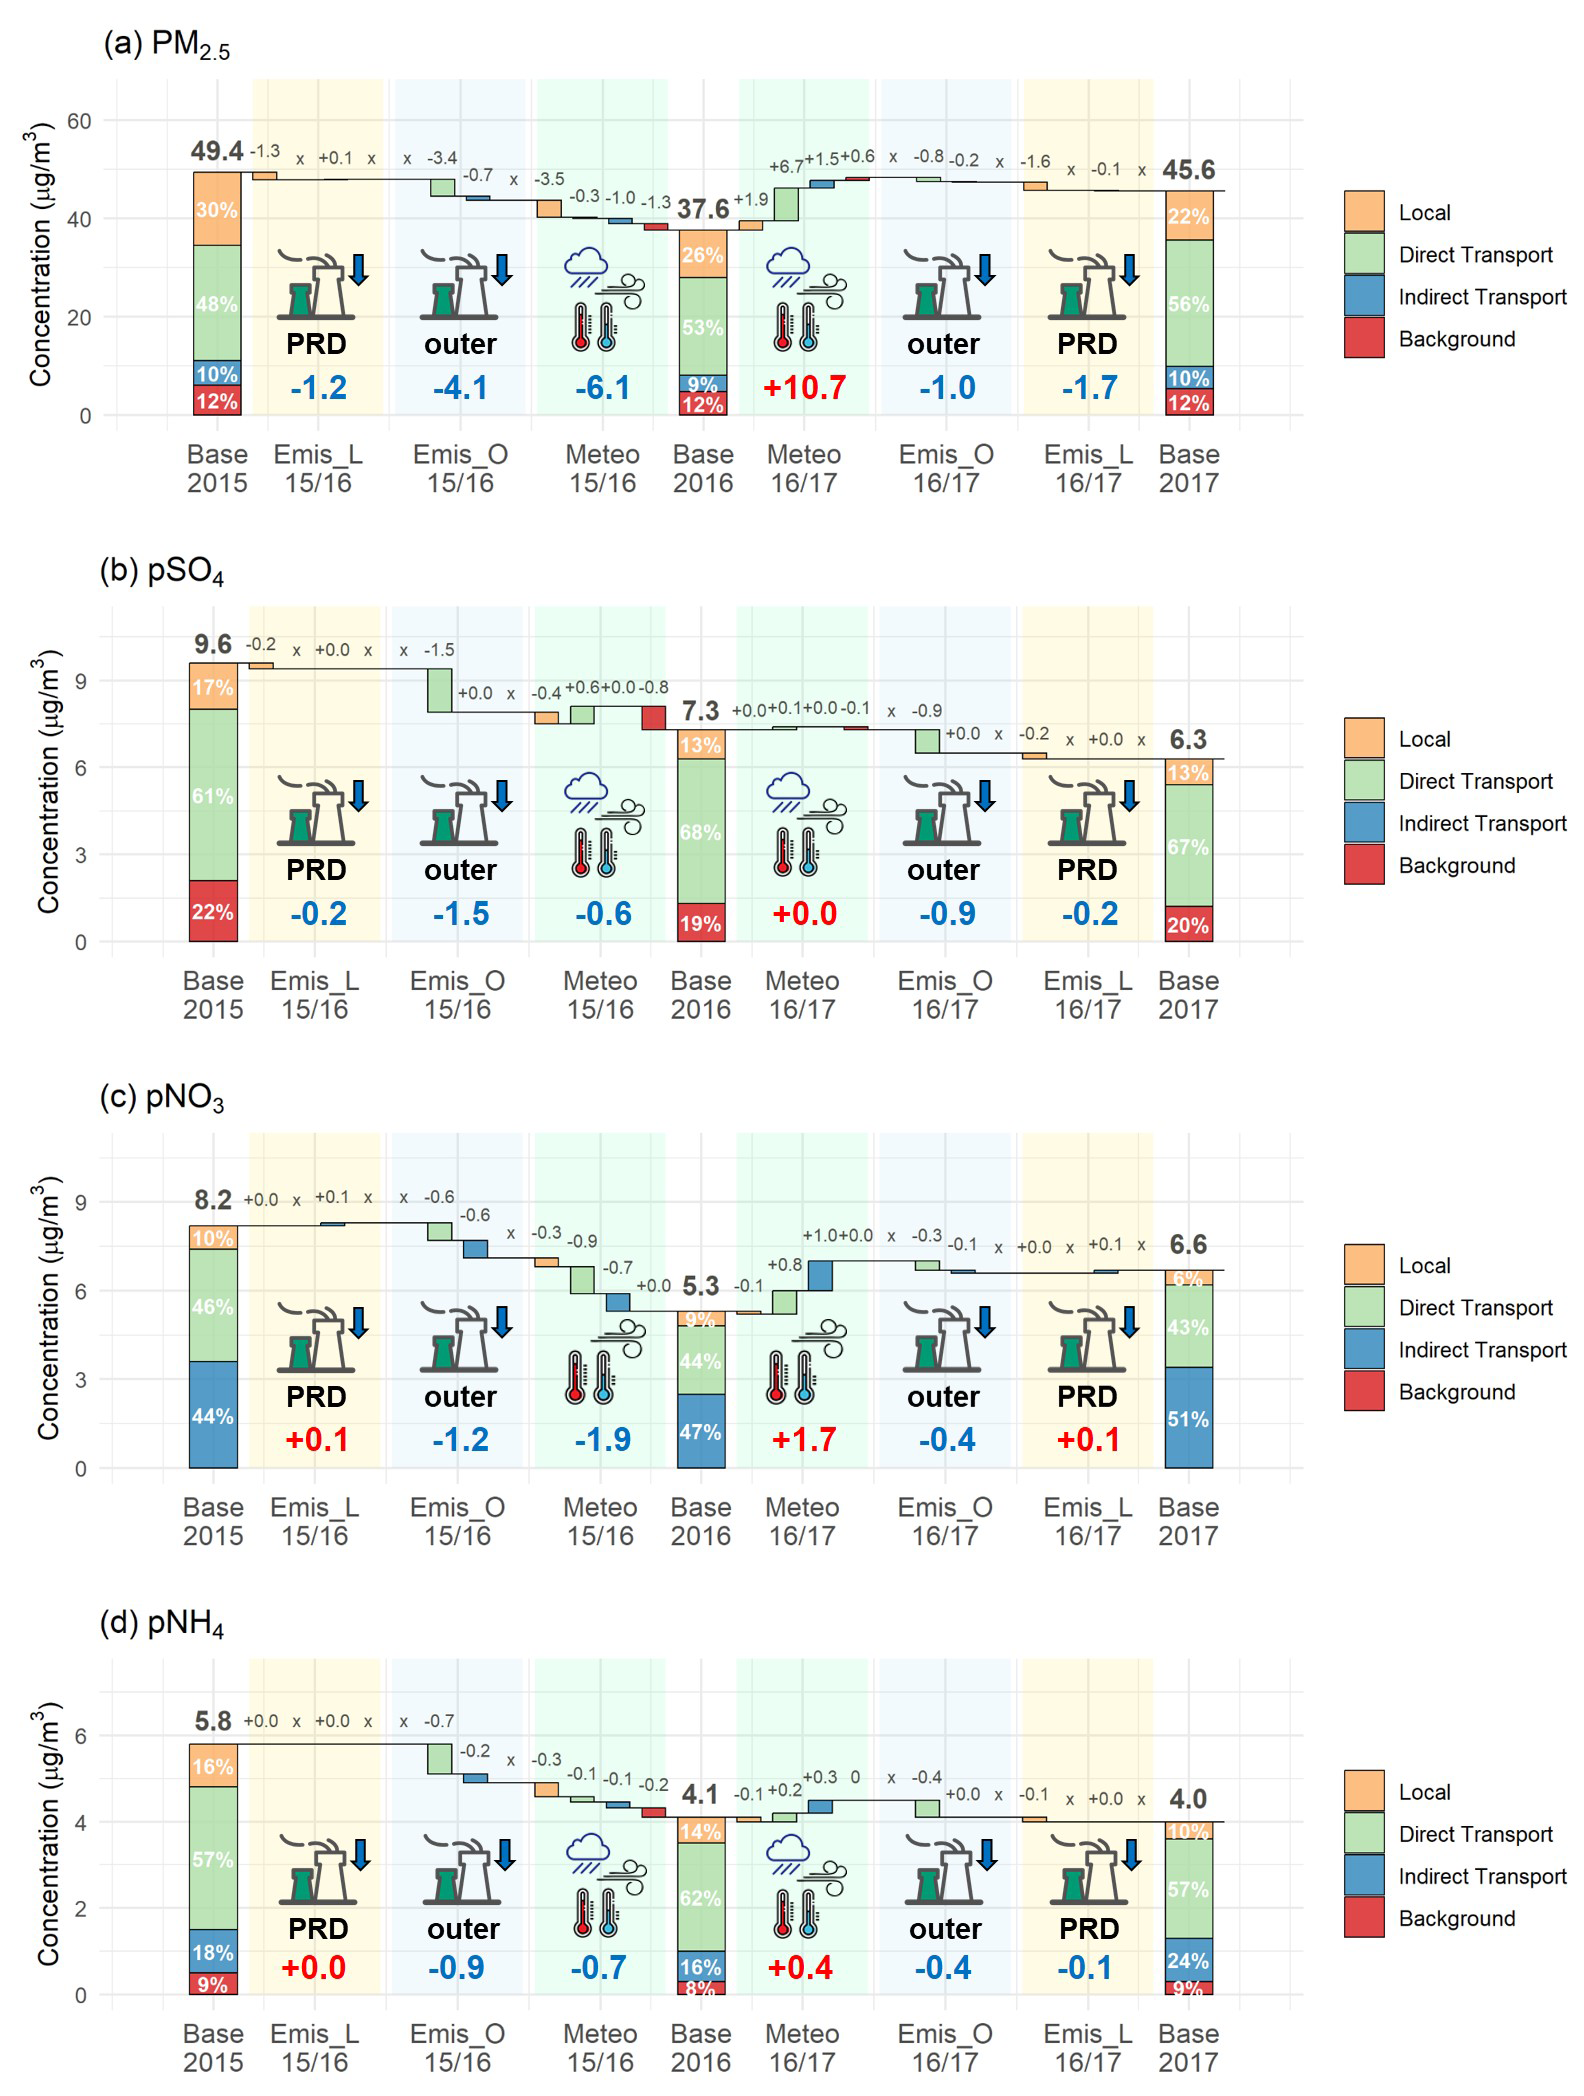
Figure 9Contributions of local emissions (Emis_L), outer emissions (Emis_O) and meteorology (Meteo) to the changes in the concentrations (noted in bold; increases noted in red, and decreases noted in blue) and regional source contributions of PM2.5 (a), sulfate (b), nitrate (c) and ammonium (d) in the PRD during the cold seasons of 2015–2017. The values represent population-weighted mean concentrations on PM2.5 polluted days during October and December of each year (unit: µg m−3). The symbol “x” denotes that the specific source contribution is not expected to change, as the corresponding input remained unchanged in the simulations.
4.3 Influence of meteorological and emission changes on PM2.5 and SNA in the PRD
The analysis in the last section demonstrates how meteorological and emission variations led to changes in the regional source contributions of PM2.5 and SNA in the PRD. Here, we further quantify the contributions of meteorological, local and outer emission changes to the variations in PM2.5 and SNA concentrations in the PRD over the three cold seasons, as illustrated in Fig. 9.
Simulated population-weighted mean PM2.5 concentrations in the PRD declined from 49.4 µg m−3 in 2015 to 37.6 µg m−3 in 2016, before rising to 45.6 µg m−3 in 2017 (Fig. 9a). As expected, reductions in local and outer emissions lowered local and direct transport contributions to PM2.5, respectively, leading to overall decreases in PM2.5 concentrations during both 2015–2016 (by 1.2 and 4.1 µg m−3, respectively) and 2016–2017 (by 1.7 and 1.0 µg m−3, respectively). However, these effects were less pronounced compared to the impact of drastic meteorological changes. During the 2015–2016 cold seasons, meteorological changes contributed to a 6.1 µg m−3 decrease in PM2.5, amplifying the effect of emission reduction. This was primarily due to reduced local contributions to PM2.5, reflecting less favorable conditions for local PM2.5 production and accumulation. In contrast, during the 2016–2017 cold seasons, meteorological changes resulted in a notable 10.7 µg m−3 increase in PM2.5, significantly counteracting the effects of emission reduction. The main change in PM2.5 source contributions due to meteorological changes was a rise in direct transport contributions, aligning with stronger cross-regional PM2.5 transport under more favorable wind conditions associated with the La Niña event in 2017. Our findings highlight the substantial role that meteorological variability can play in driving multiannual PM2.5 pollution changes, underscoring the need to account for meteorological influences when establishing air quality management targets.
The three-year variations in SNA and their responses to meteorological and emissions changes exhibited distinct characteristics compared to PM2.5 (Fig. 9b–d):
-
pSO4: Its concentration showed a consistent decline throughout the study period, dropping from 9.6 µg m−3 in 2015 to 7.3 µg m−3 in 2016 and 6.3 µg m−3 in 2017. This was mainly driven by reduction in outer emissions, which significantly lowered the amount of pSO4 transported into the PRD. Unlike PM2.5, which was strongly affected by meteorological changes, pSO4 exhibited a relatively limited response to them. This may be attributed to the high proportion of pSO4 originating from cross-regional transport (80 %–90 %) compared to local contribution (10 %–20 %). The transport patterns remained generally consistent (Fig. 4a), resulting in insignificant changes in pSO4 contributed by transport. Although locally produced pSO4 can be influenced by local meteorological conditions, its small contribution makes the responses of the overall pSO4 level to local meteorological changes less notable.
-
pNO3: pNO3 concentrations followed a similar change pattern as PM2.5, decreasing from 8.2 to 5.3 µg m−3 during the first two cold seasons but rising to 6.6 µg m−3 in 2017. Also, these changes were largely driven by varying meteorological conditions, which influenced all major pNO3 source contributions, resulting in their declines during 2015–2016 and increases during 2016–2017. More analyses of the meteorological influences on pNO3 will be presented in the next section. While reductions in outer emissions lowered direct and indirect transport contributions to pNO3, an unexpected effect was observed with local emissions reductions, which led to slightly higher indirect transport contributions and, thereby, increased pNO3 concentrations by ∼ 0.1 µg m−3. Previous research (Qu et al., 2021b) suggests that indirect transport of pNO3 in the PRD is closely linked to N2O5 hydrolysis that involves locally emitted NOx, NH3 and transported O3 as reactants. The slight increase in pNO3 may therefore be attributed to the enhancement of this reaction due to lower local NOx emissions and NO levels, or increased NH4NO3 formation replacing (NH4)2SO4 due to reduced local SO2 emissions.
-
pNH4: The changes in pNH4 concentrations and their responses to meteorological and emission changes fell between those of pSO4 and pNO3. Specifically, under the effect of meteorological changes, variations in pNH4 amount (Δn(pNH4)) can be largely explained by changes in pSO4 and pNO3 amounts (Δn(pSO4), Δn(pNO3)), nearly following the relationship:
It suggests that pNH4 variation was predominantly determined by changes in pSO4 and pNO3 in an NH3-rich environment, indicated by AdjGR (the ratio between free NH3 (NH3+pNO3) and total nitrate (pNO3+HNO3); Pinder et al., 2008) values exceeding 1 (Table S4). pNH4 concentrations declined from 5.8 µg m−3 in 2015 to 4.1 µg m−3 in 2016 but remained stable at 4.0 µg m−3 in 2017. The influences of meteorological and emission changes on pNH4 were comparable (−0.7 µg m−3 vs. −0.9 µg m−3 during 2015–2016; +0.4 µg m−3 vs. −0.5 µg m−3 during 2016–2017). However, while both factors contributed to pNH4 reductions in the first two cold seasons, the effects of emission reductions counteracted meteorological influence in 2017, leading to a negligible net change.
4.4 Analyses of PM2.5 mass budget
While comparison of PM2.5 regional source contributions offers an overview of the meteorological and emission influence on the three-year PM2.5 changes in the PRD, further evidence is required to understand the changes in specific PM2.5-related processes. This can be achieved through a detailed analysis of PM2.5 mass budget over the three cold seasons. To ensure the validity of this budget analysis, within a unit time, the sum of quantified contributions from individual processes (denoted as si to represent the contribution of the process i to the pollutant mass) should equal the total mass variation of the targeted pollutant (denoted as m), or mathematically expressed as:
Figure S11 displays comparisons of the hourly net contributions of all PM2.5-related processes to PM2.5 mass (∑si) against the mass changes directly calculated from model output ( across five scenarios (Base2015, Base2016, Base2017, L16O16M15 and L16O16M17). The scatter plots show slopes close to 1 and correlation coefficients exceeding 0.9, confirming the accuracy of quantified budget results. Thus, they can be confidently used for further investigation.
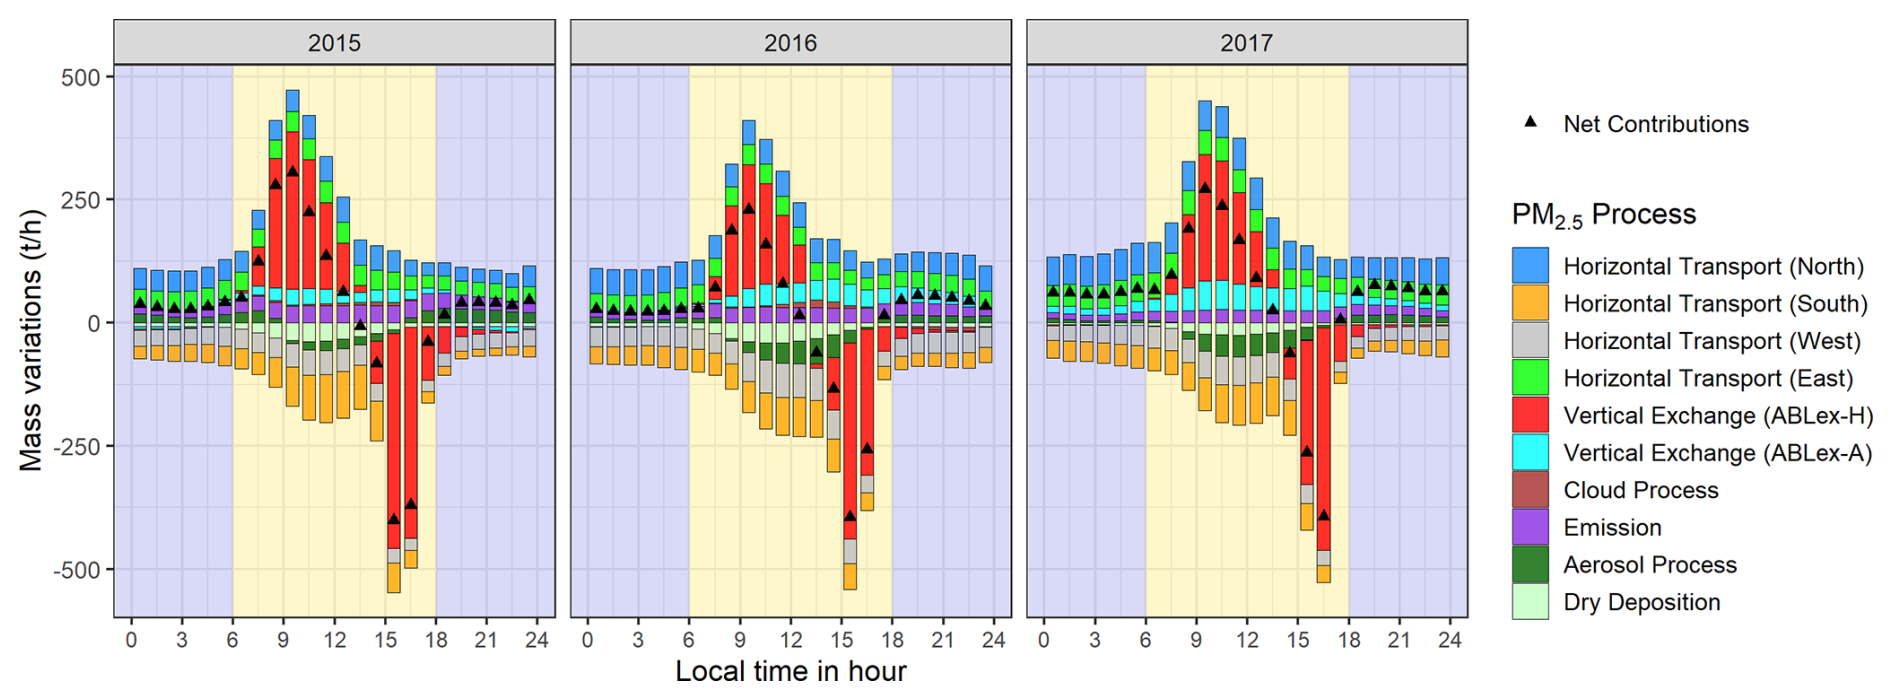
Figure 10Mean diurnal variations of PM2.5 mass budget on the polluted days of 2015–2017 cold seasons within the ABL of the PRD. Backgrounds in yellow and dark blue indicate daytime and nighttime periods, respectively.
Figure 10 displays the mean diurnal variations of PM2.5 mass budgets in the PRD across the three cold seasons, based on the results of the three base scenarios. The total mass of PM2.5, represented by black triangles in Fig. 10, features with similar diurnal variations: a rapid increase in the morning (06:00–14:00 local time), a sharp decline in the afternoon (14:00–18:00) and relatively stable levels at night (18:00–06:00 of the following day). These variations were primarily driven by vertical exchange, especially ABLex-H. It indicates that ABL development after sunrise led to pollutant transport into the ABL, while after noontime, pollutants were detrained above the ABL top along with the collapse of ABL (Jin et al., 2022). Horizontal transport also notably influenced PM2.5 mass variations throughout the day. Results indicate that PM2.5 was transported into the PRD through its north and east borders (contributing positively to the mass budgets) and exported out of the region through the south and west borders (contributing negatively), which is consistent with the prevailing wind patterns in the PRD during cold seasons (Fig. 4a). Other local processes, including cloud process, emission, aerosol process and dry deposition, had relatively limited impacts on PM2.5 mass budget. While the emission process contributed to mass increases and dry deposition led to mass reductions, the effects of aerosol process exhibited distinct characteristics: It increased PM2.5 mass at night but reduced it during the day, mainly indicating the day-night difference in the gas-particle partitioning of volatile PM2.5 components such as pNO3. PM2.5 mass budget for the three cold seasons but with emissions fixed at 2016 levels are displayed in Fig. S12 (based on the L16O16M15, Base2016 and L16O16M17 scenarios), which indicate similar patterns of variations for PM2.5 budget.
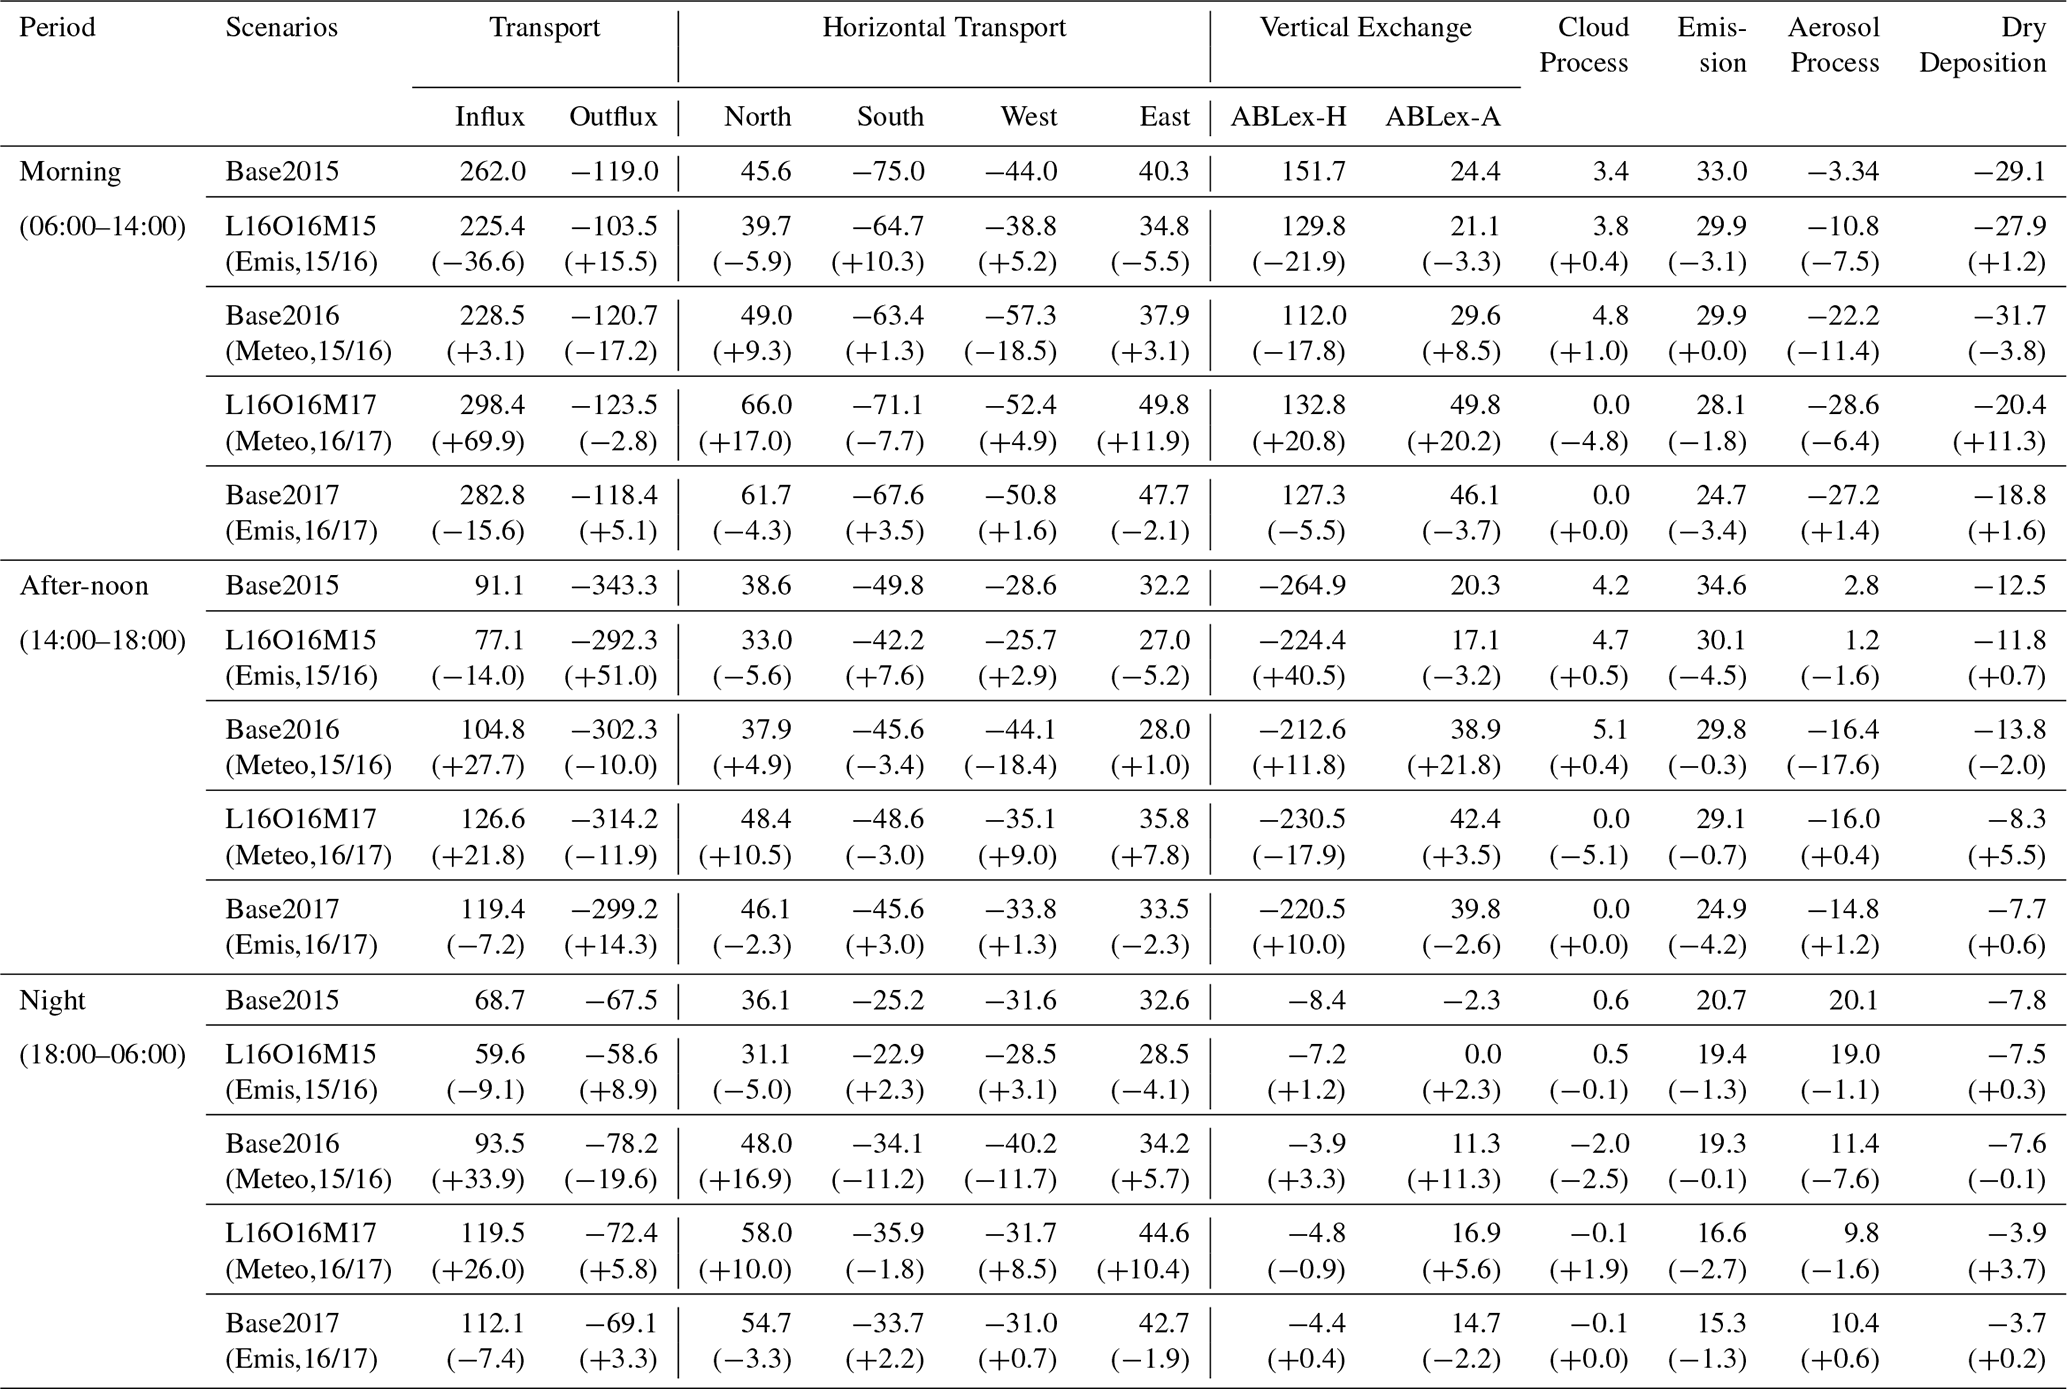
Table 4 lists the detailed values of budget items in PM2.5 mass budget for the morning, afternoon and night in the five scenarios. To assess the influence of meteorological and emission changes on PM2.5-related processes, their contributions during the periods of 2015–2016 and 2016–2017 are also quantified using the same methodology described in Sect. 2.4, expect that the contributions of local and outer emissions are combined in the following discussions.
Comparisons indicate that transport, as the dominant process in PM2.5 mass budget, exhibited more significant variations than other processes such as emission and aerosol process. Overall, at different times of the day, both the total PM2.5 flux transported into and out of the PRD (hereafter referred to as PM2.5 influx and outflux, respectively) increased across the three cold seasons when emissions were fixed at the 2016 level. For instance, the morning PM2.5 influxes rose from 225.4 t h−1 in 2015 and 228.5 t h−1 in 2016 to 298.4 t h−1 in 2017, while the afternoon PM2.5 outfluxes increased from −292.3 t h−1 in 2015 to −302.2 and −314.2 t h−1 in 2016 and 2017, respectively. This further underscores the role of meteorological changes in driving the three-year variations in PM2.5 pollution, as they enhanced PM2.5 transport while simultaneously weakening PM2.5 accumulation. Changes in emissions had contrasting effects, resulting in higher PM2.5 fluxes in the 2015 cold season and lower fluxes in the 2017 cold season. This introduces complexity in the variations of transport contributions to PM2.5 mass in the three cold seasons. While emission reduction led to lower fluxes from various transport processes, meteorological changes induced more intricate variations in specific fluxes. Contributions from advection processes, including horizontal transport and ABLex-A, generally followed similar increasing trends as for total transport influxes and outfluxes. However, the morning influxes and afternoon outfluxes of ABLex-H did not show a continuous decrease over the three years. Instead, their values were relatively higher in both the 2015 and 2017 cold seasons (151.7 and 132.8 t h−1 for morning influxes, and −264.9 and −220.5 t h−1 for afternoon outfluxes) compared with those in 2016 (112.0 and −212.6 t h−1). In 2017, this was driven by an increase in PM2.5 transported from upwind regions and subsequently exchanged into or out of the ABL, aligning with the meteorological effects in this year. In contrast, the elevated contributions of ABLex-H in 2015 were likely due to locally accumulated PM2.5 being entrained back into the region and detrained into the residual layer.
The contributions of other processes to PM2.5 exhibit diversified variations, indicating complex responses of these processes to meteorological and emission changes. Overall, meteorological changes played a more important role in driving these variations. They resulted in a reduction in the contribution of aerosol process (stronger negative contributions during the daytime and weaker positive contributions at night), which is likely associated with the enhanced partitioning of pNO3 into gas-phase HNO3. ε(pNO3), the proportion of pNO3 in the sum of pNO3 and gas-phase HNO3, decreased significantly across the three cold seasons (from 70.6 % in 2015 to 67.7 % in 2016 and 61.7 % in 2017; Table S4), suggesting a greater tendency for pNO3 to shift into the gas phase. It can be primarily attributed to meteorological changes over the three years, namely, higher temperature in 2016 and reduced RH in 2017 (Table 3). Additionally, we found a notable decrease in dry deposition fluxes in the 2017 cold season under meteorological changes. This can be explained by the relatively higher wind speeds that year (Table 3), which are unfavorable for PM2.5 dry deposition (Wu et al., 2018). As for emission reduction, its effects were mainly reflected in decreased contributions from the emission process, along with reduced dry deposition fluxes of PM2.5.
To summarize, PM2.5 mass budget indicates an overall increase in PM2.5 transport fluxes over the three years, consistent with the effects of meteorological changes. This increase is more notable for advection processes, including horizontal transport and ABLex-A. In contrast, local accumulation may have contributed to the elevated vertical exchange (ABLex-H) fluxes of PM2.5 in the 2015 cold season. While emission reduction was linked to lower contributions from the emission process and dry deposition, meteorological changes introduced more complex variations in other processes, particularly aerosol process and dry deposition. Specifically, higher temperature and lower RH likely enhanced the partitioning of pNO3 into gas-phase HNO3, resulting in reduced contributions of aerosol process across the three cold seasons; In addition, reduced dry deposition of PM2.5 can be attributed to increasing wind speeds. Overall, PM2.5 mass budgets provide further evidence over the impacts of meteorological and emission changes on multi-year PM2.5 pollution trends, but it also reveals the complex responses of different PM2.5-related processes to these changes.
The drastic changes in meteorological conditions in the PRD, coupled with rapid emission reductions in East China during the 2015–2017 cold seasons, provided a unique opportunity to comprehensively assess their combined impacts on regional PM2.5 pollution. Despite significant emission reductions, observations in the PRD indicate that PM2.5 pollution persisted during the study period, highlighting the dominant role of meteorological variations in driving three-year PM2.5 changes. This was closely linked to large-scale climate fluctuations, particularly the transition from a strong El Niño in 2015 to a weak/moderate La Niña in 2017, which intensified northerly winds, reduced precipitation and lowered humidity near the PRD. As a result, cross-regional PM2.5 transport from more polluted North and Central China to the PRD was enhanced, whereas local PM2.5 production and accumulation were weakened. Overall, our findings align with previous studies on the effects of ENSO on PM2.5 pollution in South China (Table 1).
Table 4The items in PM2.5 mass budgets from various scenarios (unit: t h−1). The differences with the corresponding values in the previous rows are also shown in the brackets. “Emis” and “Meteo” separately indicate the contributions of emission and meteorological changes on the budget items.
The WRF/CMAQ model was utilized to simulate regional source contributions and budgets of PM2.5 across the three cold seasons, aiming to provide quantitative evidence to support the above conclusions. We found that transport (non-local) contributions to PM2.5 increased from 70 % in 2015 to 74 % in 2016 and 78 % in 2017, with the most evident rise occurring in the contributions of direct transport, the primary contributor to PM2.5 in the PRD. Simultaneously, contributions from local emissions declined continuously. Although the composition of regional source contributions to SNA components varied, the transport and local contributions generally followed similar changes as those of PM2.5 in the three cold seasons. Sensitivity simulations further revealed the effects of meteorological and emission changes on the three-year PM2.5 variations. While emission reductions in the PRD and its upwind regions led to declining PM2.5 separately related to local and direct transport contributions, meteorological changes were the dominant driver of the three-year fluctuations in PM2.5 pollution – It facilitated a PM2.5 decline from 2015 to 2016 (−4.1 µg m−3, on regional average) by reducing local contributions but drove a PM2.5 increase from 2016 to 2017 (+10.7 µg m−3) mainly by enhancing direct transport. The effects of meteorological and emission changes on SNA components varied. Emission reduction, particularly outside the PRD, led to consistent decreases in pSO4 concentrations in the three cold seasons, whereas the influence of meteorological changes was overall limited due to the high transport (and low local) contribution to pSO4. In contrast, the three-year changes in pNO3 concentrations were largely controlled by meteorological variations, likely associated with the varied partitioning between particle-phase pNO3 and gas-phase HNO3 under changes in local temperature and humidity. Meanwhile, pNH4 variations were closely linked to those of both pSO4 and pNO3. Analyses of PM2.5 mass budget within the ABL of the PRD further confirmed the increasing contributions of transport, especially advective processes, under changing meteorological conditions. At the same time, contributions from the emission process and aerosol process declined. While these results reinforce our overall conclusions, they also underscore more complex responses of specific PM2.5-related processes to meteorological and emission changes.
The identification of regional source contributions to PM2.5 highlights the substantial influence of cross-regional transport on PM2.5 pollution in the PRD. This study also suggests the critical role of transport processes, including horizontal transport and vertical exchange, in PM2.5 mass budget. During the 2015–2017 cold seasons, drastic meteorological changes notably enhanced transport contributions to PM2.5 concentrations and mass budget, resulting in persistent PM2.5 pollution in the PRD despite rapid emission reductions. In regions where PM2.5 pollution is strongly affected by cross-regional transport, meteorological variability can drive multiannual changes in PM2.5 pollution by modulating PM2.5 transport, potentially masking the benefits of emission control measures. For instance, although emission reduction results in the decrease of PM2.5 concentrations in the PRD from 48.3 µg m−3 (the L16O16M17 scenario) to 45.6 µg m−3 (the Base2017 scenario) in the 2017 cold seasons, unfavorable meteorological conditions still ensured higher PM2.5 levels than those in 2016 (37.6 µg m−3, the Base2016 scenario) (Figs. 7, 9a). Thus, the meteorological impact should be considered when assessing air quality improvement efforts. Also, to mitigate PM2.5 pollution and protect public health in these regions, while continued local emission reductions remain essential in the long term, a broader, regionally coordinated mitigation strategy is crucial to address transported PM2.5, particularly under meteorological conditions that favor pollutant transport.
While this study provides valuable insights, certain limitations remain. Specifically, it is required to further improve the simulation of PM2.5 components, especially pNO3, OC and EC, by incorporating more precise emission inventories, refined PM2.5 speciation in emissions and enhanced OC chemistry modules in the model. Achieving better simulation performance will enable more robust quantification of meteorological and emission impacts on PM2.5 and its components, particularly OC. Nevertheless, this study offers a systematic analysis of climate states, meteorological conditions, PM2.5 pollution, and its regional source contributions and budgets in the PRD across the three cold seasons, revealing their intricate interconnections. We elucidated the dominant role of meteorology in shaping the three-year PM2.5 variations in the PRD, and explained how climate variability influenced meteorology, how meteorology affected PM2.5-related processes, as well as how these effects were reflected in the regional source contributions and budgets of PM2.5. Extending similar analyses to other regions will be essential for deepening out understanding of meteorology-driven PM2.5 variations and optimizing emission reduction strategies. Although meteorological variability can drive multi-annual changes in regional PM2.5 pollution, sustained emission reductions remain the most fundamental and effective means to achieve long-term air quality improvement.
The main datasets used in this study are as follows:
-
climatic indices – Niño-3.4 SST index (3-monthly; Rayner et al., 2003), the AO index (3-monthly; Thompson and Wallace, 1998) and the PDO index (Zhang et al., 1997), provided by the U.S. NOAA Climate Prediction Center (https://www.ncei.noaa.gov/access/monitoring/products/, last access: 18 January 2021);
-
meteorological observations – WMO datasets (https://gdex.ucar.edu/datasets/d461000/, last access: 5 February 2021);
-
ERA-Interim meteorological reanalysis (https://climatedataguide.ucar.edu/climate-data/era-interim, last access: 21 January 2021; Dee et al., 2011; Berrisford et al., 2011);
-
PM2.5 observations in China – released by the China National Environmental Monitoring Centre (https://quotsoft.net/air/, last access: 18 December 2018);
-
WRF meteorological model, version 3.2 (https://doi.org/10.5065/D68S4MVH, last access: 13 July 2023; Skamarock et al., 2008);
-
CMAQ chemical transport model, version 5.0.2 (https://doi.org/10.5281/zenodo.1079898, last access: 13 July 2023; US EPA Office of Research and Development, 2014);
-
chemical initial and boundary conditions for CMAQ simulations – derived from MOZART-4 simulations (https://www.acom.ucar.edu/wrf-chem/mozart.shtml, last access: 4 December 2019);
-
MEIC emission inventory for mainland China, version 1.3 (http://meicmodel.org/?page_id=560, last access: 10 August 2021; Li et al., 2017a, Zheng et al., 2018);
-
MIX emission inventory for Asia, version 1.1 (http://meicmodel.org.cn/?page_id=87&lang=en, last access: 31 March 2019; Li et al., 2017b);
-
East Asian shipping emissions (http://meicmodel.org.cn/?page_id=1916&lang=en, last access: 19 April 2019; Liu et al., 2016);
-
FINN biomass burning emission inventory, version 1.5 (https://www.acom.ucar.edu/Data/fire/, last access: 25 June 2019; Wiedinmyer et al., 2011);
-
MEGAN model to quantify biogenic emissions (https://bai.ess.uci.edu/megan/data-and-code, last access: 3 May 2017; Guenther et al., 2012);
-
GPWv4 global population density dataset (for the year 2015; https://www.earthdata.nasa.gov/data/catalog/sedac-ciesin-sedac-gpwv4-popdens-4.0, last access: 14 September 2017; Doxsey-Whitfield et al., 2015).
Other observational data within the Pearl River Delta are available from the corresponding author upon request.
The supplement related to this article is available online at https://doi.org/10.5194/acp-25-16983-2025-supplement.
KQ, XW and YZ designed the study. KQ, XW, YY, ZP and TX did the simulations using the WRF/CMAQ model. LH, XH, JS, LZ and YZ provided observational results for model validation. XW, YY, XJ, XC and YZ provided support for the quantification of regional PM2.5 mass budget. KQ did the other analyses. KQ, XW, MV, MK, GB, ND and YZ wrote and/or revised this paper, with critical feedbacks from all other authors.
At least one of the (co-)authors is a member of the editorial board of Atmospheric Chemistry and Physics. The peer-review process was guided by an independent editor, and the authors also have no other competing interests to declare.
Publisher’s note: Copernicus Publications remains neutral with regard to jurisdictional claims made in the text, published maps, institutional affiliations, or any other geographical representation in this paper. While Copernicus Publications makes every effort to include appropriate place names, the final responsibility lies with the authors. Views expressed in the text are those of the authors and do not necessarily reflect the views of the publisher.
This study was supported by the National Key Research and Development Program of China (grant nos. 2023YFC3708601 and 2018YFC0213204), the National Science and Technology Pillar Program of China (grant no. 2014BAC21B01), the Deutsche Forschungsgemeinschaft (DFG, German Research Foundation) under Germany's Excellence Strategy (University Allowance, EXC 2077, University of Bremen) and co-funded DFG-NSFC Sino-German Air-Changes project (grant no. 448720203).
The article processing charges for this open-access publication were covered by the University of Bremen.
This paper was edited by Tuukka Petäjä and reviewed by two anonymous referees.
An, X., Wang, F., Sheng, L., and Li, C.: Pattern of wintertime southern rainfall and northern pollution over eastern China: The role of the strong eastern Pacific El Niño, J. Clim., 35, 7259–7273, https://doi.org/10.1175/JCLI-D-21-0662.1, 2022.
Apte, J.S., Brauer, M., Cohen, A.J., Ezzati, M., and Arden, C.: Ambient PM2.5 reduces global and regional life expectancy, Environ. Sci. Technol. Lett., 5, 546–551, https://doi.org/10.1021/acs.estlett.8b00360, 2018.
Bae, M., Kim, B.-U., Kim, H.C., Kim, J., and Kim, S.: Role of emissions and meteorology in the recent PM2.5 changes in China and South Korea from 2015 to 2018, Environ. Pollut., 270, 116233, https://doi.org/10.1016/j.envpol.2020.116233, 2021.
Berrisford, P., Dee, D., Poli, P., Brugge, R., Fielding, K., Fuentes, M., Kallberg, P., Kobayashi, S., Uppala, S., and Simmons, A.: The ERA-Interim archive Version 2.0, ERA report series, 1, 1–16, 2011.
Carter, W. P. L.: Development of the SAPRC-07 chemical mechanism, Atmos. Environ., 44, 5324–5335, https://doi.org/10.1016/j.atmosenv.2010.01.026, 2010.
Chang, L., Xu, J., Tie, X., and Wu, J.: Impact of the 2015 El Niño event on winter air quality in China, Sci. Rep.-UK, 6, 34275, https://doi.org/10.1038/srep34275, 2016.
Chen, L., Zhu, J., Liao, H., Yang, Y., and Yue, X.: Meteorological influences on PM2.5 and O3 trends and associated health burden since China's clean air actions, Sci. Total Environ., 744, 140837, https://doi.org/10.1016/j.scitotenv.2020.140837, 2020a.
Chen, T. F., Chang, K. H., and Tsai, C. Y.: Modeling direct and indirect effect of long range transport on atmospheric PM2.5 levels, Atmos. Environ., 89, 1–9, https://doi.org/10.1016/j.atmosenv.2014.01.065, 2014.
Chen, Z., Chen, D., Zhao, C., Kwan, M.-P., Cai, J., Zhuang, Y., Zhao, B., Wang, X., Chen, B., Yang, J., Li, R., He, B., Gao, B., Wang, K., and Xu, B.: Influence of meteorological conditions on PM2.5 concentrations across China: A review of methodology and mechanism, Environ. Int., 139, 105558, https://doi.org/10.1016/j.envint.2020.105558, 2020b.
Cheng, J., Su, J., Cui, T., Li, X., Dong, X., Sun, F., Yang, Y., Tong, D., Zheng, Y., Li, Y., Li, J., Zhang, Q., and He, K.: Dominant role of emission reduction in PM2.5 air quality improvement in Beijing during 2013–2017: a model-based decomposition analysis, Atmos. Chem. Phys., 19, 6125–6146, https://doi.org/10.5194/acp-19-6125-2019, 2019a.
Cheng, X., Boiyo, R., Zhao, T., Xu, X., Gong, S., Xie, X., and Shang, K.: Climate modulation of Niño3.4 SST-anomalies on air quality change in southern China: Application to seasonal forecast of haze pollution, Atmos. Res., 225, 157–164, https://doi.org/10.1016/j.atmosres.2019.04.002, 2019b.
Cheng, Z., Luo, L., Wang, S., Wang, Y., Sharma, S., Shimadera, H., Wang, X., Bressi, M., Miranda, R. M., Jiang, J., Zhou, W., Fajardo, O., Yan, N., and Hao, J.: Status and characteristics of ambient PM2.5 pollution in global megacities, Environ. Int., 89–90, 212–221, https://doi.org/10.1016/j.envint.2016.02.003, 2016.
Chow, J. C., Watson, J. G., Lowenthal, D. H., and Magliano, K. L.: Loss of PM2.5 nitrate from filter samples in central California, J. Air Waste Manage. Assoc., 55, 1158–1168, https://doi.org/10.1080/10473289.2005.10464704, 2005.
Chow, W. S., Liao, K., Huang, X. H. H., Leung, K. F., Lau, A. K. H., and Yu, J. Z.: Measurement report: The 10-year trend of PM2.5 major components and source tracers from 2008 to 2017 in an urban site of Hong Kong, China, Atmos. Chem. Phys., 22, 11557–11577, https://doi.org/10.5194/acp-22-11557-2022, 2022.
Clappier, A., Belis, C. A., Pernigotti, D., and Thunis, P.: Source apportionment and sensitivity analysis: two methodologies with two different purposes, Geosci. Model Dev., 10, 4245–4256, https://doi.org/10.5194/gmd-10-4245-2017, 2017.
Dee, D. P., Uppala, S. M., Simmons, A. J., Berrisford, P., Poli, P., Kobayashi, S., Andrae, U., Balmaseda, M. A., Balsamo, G., Bauer, P., Bechtold, P., Beijaars, A.C.M., van de Berg, L., Bidiot, J., Bormann, N., Delsol, C., Dragani, R., Fuentes, M., Geer, A.J., Haimberger, L., Healy, S.B., Hersbach, H., Hólm, E.V., Isaksen, L., Isaksen, L., Kållberg, P., Köhler, M., Matricardi, M., McNally, A.P., Monge-Sanz, B.M., Morcrette, J.-J., Park, B.-K., Peubey, C., de Rosnay, P., Tavolato, Thépaut, J.-N., and Vitart, F.: The ERA-Interim reanalysis: Configuration and performance of the data assimilation system, Q. J. Roy. Meteor. Soc., 137, 553–597, https://doi.org/10.1002/qj.828, 2011.
Ding, D., Xing, J., Wang, S., Liu, K., and Hao, J.: Estimated contributions of emissions controls, meteorological factors, population growth, and changes in baseline mortality to reductions in ambient PM2.5 and PM2.5-related mortality in China, 2013–2017, Environ. Health Perspect., 127, 067009, https://doi.org/10.1289/EHP4157, 2019.
Ding, J., Dai, Q., Zhang, Y., Xu, J., Huangfu, Y., and Feng, Y.: Air humidity affects secondary aerosol formation in different pathways, Sci. Total Environ., 759, 143540, https://doi.org/10.1016/j.scitotenv.2020.143540, 2021.
Dong, Z., Wang, S., Xing, J., Chang, X., Ding, D., and Zheng, H.: Regional transport in Beijing-Tianjin-Hebei region and its changes during 2014–2017: The impacts of meteorology and emission reduction, Sci. Total Environ., 737, 139792, https://doi.org/10.1016/j.scitotenv.2020.139792, 2020.
Doxsey-Whitfield, E., MacManus, K., Adamo, S. B., Pistolesi, L., Squires, J., Borkovska, O., and Baptista, S. R.: Taking advantage of the improved availability of census data: a first look at the gridded population of the world, version 4, Papers in Applied Geography, 1, 226–234, https://doi.org/10.1080/23754931.2015.1014272, 2015.
Emery, C., Tai, E., and Yarwood, G.: Enhanced Meteorological Modeling and Performance Evaluation for Two Texas Ozone Episodes, Prepared for the Texas Natural Resource Conservation Commission, technical report, Environ International Corporation, Novato, CA, 2001.
Emery, C., Liu, Z., Russell, A. G., Odman, M. T., Yarwood, G., and Kumar, N.: Recommendations on statistics and benchmarks to assess photochemical model performance, J. Air Waste Manag., 67, 582–598, https://doi.org/10.1080/10962247.2016.1265027, 2017.
Feng, J., Li, J.-P., Zhu, J.-L., and Liao, H.: Influences of El Niño Modoki event 1994/1995 on aerosol concentrations over southern China, J. Geophys. Res.-Atmos., 121, 1637–1651, https://doi.org/10.1002/2015JD023659, 2016b.
Feng, S., Gao, D., Liao, F., Zhou, F., and Wang, X.: The health effects of ambient PM2.5 and potential mechanisms, Ecotoxicol. Environ. Saf., 128, 67–74, https://doi.org/10.1016/j.ecoenv.2016.01.030, 2016a.
Fowler, D., Brimblecombe, P., Burrows, J., Heal, M. R., Grennfelt, P., Stevenson, D. S., Jowett, A., Nemitz, E., Coyle, M., Lui, X., Chang, Y., Fuller, G. W., Sutton, M. A., Klimont, Z., Unsworth, M. H., and Vieno, M.: A chronology of global air quality, Philos. T. Roy. Soc. A, 378, 20190314, https://doi.org/10.1098/rsta.2019.0314, 2020.
Gong, S., Liu, H., Zhang, B., He, J., Zhang, H., Wang, Y., Wang, S., Zhang, L., and Wang, J.: Assessment of meteorology vs. control measures in the China fine particular matter trend from 2013 to 2019 by an environmental meteorology index, Atmos. Chem. Phys., 21, 2999–3013, https://doi.org/10.5194/acp-21-2999-2021, 2021.
Gu, Y., Shi, X., and Sun, J.: Possible influence of Arctic Oscillation on winter visibility over Eastern China, J. Geosci. Environ. Prot., 5, 56–62, https://doi.org/10.4236/gep.2017.58006, 2017.
Guenther, A. B., Jiang, X., Heald, C. L., Sakulyanontvittaya, T., Duhl, T., Emmons, L. K., and Wang, X.: The Model of Emissions of Gases and Aerosols from Nature version 2.1 (MEGAN2.1): an extended and updated framework for modeling biogenic emissions, Geosci. Model Dev., 5, 1471–1492, https://doi.org/10.5194/gmd-5-1471-2012, 2012 (code available at: https://bai.ess.uci.edu/megan/data-and-code, last access: 10 July 2023).
Hallquist, M., Wenger, J. C., Baltensperger, U., Rudich, Y., Simpson, D., Claeys, M., Dommen, J., Donahue, N. M., George, C., Goldstein, A. H., Hamilton, J. F., Herrmann, H., Hoffmann, T., Iinuma, Y., Jang, M., Jenkin, M. E., Jimenez, J. L., Kiendler-Scharr, A., Maenhaut, W., McFiggans, G., Mentel, Th. F., Monod, A., Prévôt, A. S. H., Seinfeld, J. H., Surratt, J. D., Szmigielski, R., and Wildt, J.: The formation, properties and impact of secondary organic aerosol: current and emerging issues, Atmos. Chem. Phys., 9, 5155–5236, https://doi.org/10.5194/acp-9-5155-2009, 2009.
He, C., Liu, R., Wang, X., Liu, S. C., Zhou, T., and Liao, W.: How does El Niño-Southern Oscillation modulate the interannual variability of winter haze days over eastern China?, Sci. Total Environ., 651, 1892–1902, https://doi.org/10.1016/j.scitotenv.2018.10.100, 2019.
Huang, L., Zhu, Y., Zhai, H., Xue, S., Zhu, T., Shao, Y., Liu, Z., Emery, C., Yarwood, G., Wang, Y., Fu, J., Zhang, K., and Li, L.: Recommendations on benchmarks for numerical air quality model applications in China – Part 1: PM2.5 and chemical species, Atmos. Chem. Phys., 21, 2725–2743, https://doi.org/10.5194/acp-21-2725-2021, 2021.
Huang, X.-F., Zou, B.-B., He, L.-Y., Hu, M., Prévôt, A. S. H., and Zhang, Y.-H.: Exploration of PM2.5 sources on the regional scale in the Pearl River Delta based on ME-2 modeling, Atmos. Chem. Phys., 18, 11563–11580, https://doi.org/10.5194/acp-18-11563-2018, 2018.
Jacob, D. J. and Winner, D. A.: Effect of climate change on air quality, Atmos. Environ., 43, 51–63, https://doi.org/10.1016/j.atmosenv.2008.09.051, 2009.
Jiang, C., Gong, J., Sun, J., and Chen, X.: Spatial-temporal evolution of PM2.5 distribution in Pearl River Delta Region in 2013–2016 (in Chinese), Ecology and Environmental Sciences, 27, 1698–1705, https://doi.org/10.16258/j.cnki.1674-5906.2018.09.016, 2018.
Jiang, Y., Wang, S., Jia, X., Zhao, B., Li, S., Chang, X., Zhang, S., and Dong, Z.: Ambient fine particulate matter and ozone pollution in China: synergy in anthropogenic emissions and atmospheric processes, Environ. Res. Lett., 17, https://doi.org/10.1088/1748-9326/aca16a, 2022.
Jin, X., Cai, X., Huang, Q., Wang, X., Song, Y., Kang, L., and Zhang, H.: PM2.5 exchange between atmospheric boundary layer and free troposphere in North China plain and its long-range transport effects, J. Geophys. Res. Atmos., 127, e2022JD037410, https://doi.org/10.1029/2022JD037410, 2022.
Le, T., Wang, Y., Liu, L., Yang, J., Yung, Y. L., Li, G., and Seinfeld, J. H.: Unexpected Air Pollution with Marked Emission Reductions during the COVID-19 Outbreak in China, Science, 369, eabb7431, https://doi.org/10.1126/science.abb7431, 2020.
Li, C., Martin, R. V., Van Donkelaar, A., Boys, B. L., Hammer, M. S., Xu, J. W., Marais, E. A., Reff, A., Strum, M., Ridley, D. A., Crippa, M., Brauer, M., and Zhang, Q.: Trends in Chemical Composition of Global and Regional Population-Weighted Fine Particulate Matter Estimated for 25 Years, Environ. Sci. Tech., 51, 11185–11195, https://doi.org/10.1021/acs.est.7b02530, 2017c.
Li, M., Zhang, Q., Kurokawa, J.-I., Woo, J.-H., He, K., Lu, Z., Ohara, T., Song, Y., Streets, D. G., Carmichael, G. R., Cheng, Y., Hong, C., Huo, H., Jiang, X., Kang, S., Liu, F., Su, H., and Zheng, B.: MIX: a mosaic Asian anthropogenic emission inventory under the international collaboration framework of the MICS-Asia and HTAP, Atmos. Chem. Phys., 17, 935–963, https://doi.org/10.5194/acp-17-935-2017, 2017b (data available at: http://meicmodel.org.cn/?page_id=87, last access: 21 August 2024).
Li, M., Liu, H., Geng, G., Hong, C., Liu, F., Song, Y., Tong, D., Zheng, B., Cui, H., Man, H., Zhang, Q., and He, K.: Anthropogenic emission inventories in China: a review, Natl. Sci. Rev., 4, 834–866, https://doi.org/10.1093/nsr/nwx150, 2017a (data available at: http://meicmodel.org/?page_id=560, last access: 10 July 2023).
Li, R., Mei, X., Wei, L. F., Han, X., Zhang, M. G., and Jing, Y. Y.: Study on the contribution of transport to PM2.5 in typical regions of China using the regional air quality model RAMS-CMAQ, Atmos. Environ., 214, 116856, https://doi.org/10.1016/j.atmosenv.2019.116856, 2019.
Lin, C. Q., Li, Y., Lau, A., Li, C. C., and Fung, J. C. H.: 15-year PM2.5 trends in the Pearl River Delta region and Hong Kong from satellite observation, Aerosol Air Qual. Res., 18, 2355–2362, https://doi.org/10.4209/aaqr.2017.11.0437, 2018.
Liu, C.-N., Lin, S.-F., Tsai, C.-J., Wu, Y.-C., and Chen, C.-F.: Theoretical model for the evaporation loss of PM2.5 during filter sampling, Atmos. Environ., 109, 79–86, 2015.
Liu, H., Fu, M. L., Jin, X. X., Shang, Y., Shindell, D., Faluvegi, G., Shindell, C., and He, K. B.: Health and climate impacts of ocean-going vessels in East Asia, Nat. Clim. Chang., 6, 1037–1041, https://doi.org/10.1038/nclimate3083, 2016.
Liu, P., Zhang, Y., Yu, S., and Schere, K. L.: Use of a process analysis tool for diagnostic study on fine particulate matter predictions in the U.S. – Part II: Analyses and sensitivity simulations, Atmos. Pollut. Res., 2, 61–71, https://doi.org/10.5094/APR.2011.008, 2011.
Lu, S., Gong, S., Chen, J., He, J., Zhang, L., and Mo, J.: Impact of Arctic Oscillation anomalies on winter PM2.5 in China via a numerical simulation, Sci. Total Environ., 779, 146390, https://doi.org/10.1016/j.scitotenv.2021.146390, 2021.
Lu, S., He, J., Gong, S., and Zhang, L.: Influence of Arctic Oscillation abnormalities on spatio-temporal haze distributions in China, Atmos. Environ., 223, 117282, https://doi.org/10.1016/j.atmosenv.2020.117282, 2020b.
Lu, X., Zhang, S., Xing, J., Wang, Y., Chen, W., Ding, D., Wu, Y., Wang, S., Duan, L., and Hao, J.: Progress of air pollution control in China and its challenges and opportunities in the ecological civilization era, Engineering, 6, 1423–1431, https://doi.org/10.1016/j.eng.2020.03.014, 2020a.
Mao, L.: Long-term Characteristics and Formation Mechanisms of Winter Haze Pollution in Major Polluted Regions of China, PhD thesis, College of Environmental Sciences and Engineering, Peking University, China, 2019.
Miao, R., Chen, Q., Zheng, Y., Cheng, X., Sun, Y., Palmer, P. I., Shrivastava, M., Guo, J., Zhang, Q., Liu, Y., Tan, Z., Ma, X., Chen, S., Zeng, L., Lu, K., and Zhang, Y.: Model bias in simulating major chemical components of PM2.5 in China, Atmos. Chem. Phys., 20, 12265–12284, https://doi.org/10.5194/acp-20-12265-2020, 2020.
Ministry of Ecology and Environment of the People's Republic of China: Annual statistic report on environment in China (2013), https://www.mee.gov.cn/hjzl/sthjzk/sthjtjnb/201605/U020160604811096703781.pdf (last access: 12 February 2025), 2014.
Ministry of Ecology and Environment of the People's Republic of China: Annual statistic report on environment in China (2015), https://www.mee.gov.cn/hjzl/sthjzk/sthjtjnb/201702/P020170223595802837498.pdf (last access: 19 February 2025), 2017.
Ministry of Ecology and Environment of the People's Republic of China: Annual statistic report on ecology and environment in China (2016), https://www.mee.gov.cn/hjzl/sthjzk/sthjtjnb/202108/W020210827612079506430.pdf (last access: 19 February 2025), 2021b.
Ministry of Ecology and Environment of the People's Republic of China: Annual statistic report on ecology and environment in China (2017), https://www.mee.gov.cn/hjzl/sthjzk/sthjtjnb/202108/W020210827611766065827.pdf (last access: 12 February 2025), 2021a.
Norman, O. G., Heald, C. L., Bililign, S., Campuzano-Jost, P., Coe, H., Fiddler, M. N., Green, J. R., Jimenez, J. L., Kaiser, K., Liao, J., Middlebrook, A. M., Nault, B. A., Nowak, J. B., Schneider, J., and Welti, A.: Exploring the processes controlling secondary inorganic aerosol: evaluating the global GEOS-Chem simulation using a suite of aircraft campaigns, Atmos. Chem. Phys., 25, 771–795, https://doi.org/10.5194/acp-25-771-2025, 2025.
Pai, S. J., Carter, T. S., Heald, C. L., and Kroll, J. H.: Updated World health organization air quality guidelines highlight the importance of non-anthropogenic PM2.5, Environ. Sci. Technol. Lett., 9, 501–506, https://doi.org/10.1021/acs.estlett.2c00203, 2022.
Pinder, R. W., Dennis, R. L., and Bhave, P. V.: Observable indicators of the sensitivity of PM2.5 nitrate to emission reductions – Part I: Derivation of the adjusted gas ratio and applicability at regulatory-relevant time scales, Atmos. Environ., 42, 1275–1286, https://doi.org/10.1016/j.atmosenv.2007.10.039, 2008.
Pozzer, A., Anenberg, S. C., Dey, S., Haines, A., Lelieveld, J., and Chowdhury, S.: Mortality attributable to ambient air pollution: a review of global estimates, GeoHealth, 7, e2022GH000711, https://doi.org/10.1029/2022GH000711, 2023.
Qu, K., Wang, X., Cai, X., Yan, Y., Jin, X., Vrekoussis, M., Kanakidou, M., Brasseur, G. P., Shen, J., Xiao, T., Zeng, L., and Zhang, Y.: Rethinking the role of transport and photochemistry in regional ozone pollution: insights from ozone concentration and mass budgets, Atmos. Chem. Phys., 23, 7653–7671, https://doi.org/10.5194/acp-23-7653-2023, 2023.
Qu, K., Wang, X., Xiao, T., Shen, J., Lin, T., Chen, D., He, L., Huang, X., Zeng, L., Lu, K., Ou, Y., and Zhang, Y.: Cross-regional transport of PM2.5 nitrate in the Pearl River Delta, China: Contributions and mechanisms, Sci. Total Environ., 753, 142439, https://doi.org/10.1016/j.scitotenv.2020.142439, 2021b.
Qu, K., Wang, X., Yan, Y., Shen, J., Xiao, T., Dong, H., Zeng, L., and Zhang, Y.: A comparative study to reveal the influence of typhoons on the transport, production and accumulation of O3 in the Pearl River Delta, China, Atmos. Chem. Phys., 21, 11593–11612, https://doi.org/10.5194/acp-21-11593-2021, 2021a.
Qu, K., Yan, Y., Wang, X., Jin, X., Vrekoussis, M., Kanakidou, M., Brasseur, G. P., Lin, T., Xiao, T., Cai, X., Zeng, L., and Zhang, Y.: The effect of cross-regional transport on ozone and particulate matter pollution in China: A review of methodology and current knowledge, Sci. Total Environ., 947, 174196, https://doi.org/10.1016/j.scitotenv.2024.174196, 2024.
Rayner, N. A., Parker, D. E., Horton, E. B., Folland, C. K., Alexander, L. V., Rowell, D. P., Kent, E. C., and Kaplan, A.: Global analyses of sea surface temperature, sea ice, and night marine air temperature since the late nineteenth century, J. Geophys. Res., 108, 4407, https://doi.org/10.1029/2002JD002670, 2003.
Sherman, P., Gao, M., Song, S., Ohiomoba, P., Archibald, A., and McElroy, M.: The influence of dynamics and emissions changes on China's wintertime haze, J. Appl. Meteorol. Climatol., 58, 1603–1611, https://doi.org/10.1175/JAMC-D-19-0035.1, 2019.
Skamarock, W. C., Klemp, J. B., Dudhia, J., Gill, D. O., Barker, D. M., Duda, M., Huang, X. Y., Wang, W., and Powers, J. G.: A Description of the Advanced Research WRF Version 3, National Center for Atmospheric Research NCAR/TN-475+STR [code], https://doi.org/10.5065/D68S4MVH, 2008.
Su, C., Sun, Y., Cao, L., Wang, C., Huang, X., and He, L.: Source apportionment of PM2.5 in Shenzhen based on receptor model with SOA tracer (in Chinese), China Environ. Sci., 40, 5124–5132, https://doi.org/10.19674/j.cnki.issn1000-6923.2020.0564, 2020.
Sun, J., Li, H., Zhang, W., Li, T., Zhao, W., Zuo, Z., Guo, S., Wu, D., and Fan, S.: Modulation of the ENSO on Winter Aerosol Pollution in the Eastern Region of China, J. Geophys. Res.-Atmos., 123, 11952–11969, https://doi.org/10.1029/2018jd028534, 2018.
Sun, J., Qin, M., Xie, X., Fu, W., Qin, Y., Sheng, L., Li, L., Li, J., Sulaymon, I. D., Jiang, L., Huang, L., Yu, X., and Hu, J.: Seasonal modeling analysis of nitrate formation pathways in Yangtze River Delta region, China, Atmos. Chem. Phys., 22, 12629–12646, https://doi.org/10.5194/acp-22-12629-2022, 2022.
Timmermann, A., An, S. I., Kug, J. S., Jin, F. F., Cai, W., Capotondi, A., Cobb, K. M., Lengaigne, M., McPhaden, M. J., Stuecker, M. F., Stein, K., Wittenberg, A. T., Yun, K. S., Bayr, T., Chen, H. C., Chikamoto, Y., Dewitte, B., Dommenget, D., Grothe, P., Guilyardi, E., Ham, Y. G., Hayashi, M., Ineson, S., Kang, D., Kim, S., Kim, W. M., Lee, J. Y., Li, T., Luo, J. J., McGregor, S., Planton, Y., Power, S., Rashid, H., Ren, H. L., Santoso, A., Takahashi, K., Todd, A., Wang, G., Wang, G., Xie, R., Yang, W. H., Yeh, S. W., Yoon, J., Zeller, E., and Zhang, X.: El Niño–Southern Oscillation complexity, Nature, 559, 535–545, https://doi.org/10.1038/s41586-018-0252-6, 2018.
Thompson, D. W. and Wallace, J. M.: The Arctic Oscillation signature in the wintertime geopotential height and temperature fields, Geophys. Res. Lett., 25, 1297–1300, https://doi.org/10.1029/98GL00950, 1998.
Uranishi, K., Shimadera, H., Saiki, S., Matsuo, T., and Kondo, A.: Source apportionment of nitrate aerosol concentration in Japan in fiscal year 2010 using an air quality model (in Japanese), Japan Society for J. Japan Soc. Atmos. Environ./Taiki Kankyo Gakkaishi, 53, 88–99, https://doi.org/10.11298/taiki.53.88, 2018.
US EPA Office of Research and Development: CMAQv5.0.2 (5.0.2), Zenodo [code], https://doi.org/10.5281/zenodo.1079898, 2014.
Wang, H., Lu, K., Tan, Z., Chen, X., Liu, Y., and Zhang, Y.: Formation mechanism and control strategy for particulate nitrate in China, J. Environ. Sci., 123, 476–486, https://doi.org/10.1016/j.jes.2022.09.019, 2023a.
Wang, J., Liu, Y., Ding, Y., Wu, P., Zhu, Z., Xu, Y., Li, Q., Zhang, Y., He, J., Wang, J. X. L., and Qi, L.: Impacts of climate anomalies on the interannual and interdecadal variability of autumn and winter haze in North China: A review, Int. J. Climatol., 40, 4309–4325, https://doi.org/10.1002/joc.6471, 2020b.
Wang, S., Li, G., Gong, Z., Du, L., Zhou, Q., Meng, X., Xie, S., and Zhou, L: Spatial distribution, seasonal variation and regionalization of PM2.5 concentrations in China, Sci. China Chem., 58, 1435–1443, https://doi.org/10.1007/s11426-015-5468-9, 2015.
Wang, S. S., Li, S. W., Xing, J., Yang, J., Dong, J. X., Qin, Y., and Sahu, S. K.: Evaluation of the influence of El Niño-Southern Oscillation on air quality in southern China from long-term historical observations, Front. Environ. Sci. Eng., 16, 26, https://doi.org/10.1007/s11783-021-1460-0, 2022.
Wang, X., Qin, J., Zhong, S., Yang, Y., Lu, Q., and Yu, L.: The differential impact of 2015–2020 El Niño and El Niño Modoki on warm- and cold-season PM2.5 concentration and distribution across China, Atmos. Environ., 305, 119806, https://doi.org/10.1016/j.atmosenv.2023.119816, 2023b.
Wang, X., Zhong, S., Bian, X., and Yu, L.: Impact of 2015–2016 El niño and 2017–2018 La niña on PM2.5 concentrations across China, Atmos. Environ., 208, 61–73, https://doi.org/10.1016/j.atmosenv.2019.03.035, 2019.
Wang, Y., Gao, W., Wang, S., Song, T., Gong, Z., Ji, D., Wang, L., Liu, Z., Tang, G., Huo, Y., Tian, S., Li, J., Li, M., Yang, Y., Chu, B., Petäjä, T., Kerminen, V.-M., He, H., Hao, J., Kulmala, M., Wang, Y., and Zhang, Y.: Contrasting trends of PM2.5 and surface-ozone concentrations in China from 2013 to 2017, Natl. Sci. Rev., 7, 1331–1339, https://doi.org/10.1093/nsr/nwaa032, 2020a.
Wang, Y. S., Yao, L., Wang, L. L., Liu, Z. R., Ji, D. S., Tang, G. Q., Zhang, J. K., Sun, Y., Hu, B., and Xin, J. Y.: Mechanism for the formation of the January 2013 heavy haze pollution episode over central and eastern China, Sci. China-Earth Sci., 57, 14–25, https://doi.org/10.1007/s11430-013-4773-4, 2014.
Wiedinmyer, C., Akagi, S. K., Yokelson, R. J., Emmons, L. K., Al-Saadi, J. A., Orlando, J. J., and Soja, A. J.: The Fire INventory from NCAR (FINN): a high resolution global model to estimate the emissions from open burning, Geosci. Model Dev., 4, 625–641, https://doi.org/10.5194/gmd-4-625-2011, 2011.
World Health Organization: WHO Global Air Quality Guidelines: Particulate Matter (PM2.5 and PM10), Ozone, Nitrogen Dioxide, Sulfur Dioxide and Carbon Monoxide, ISBN 978-92-4-003422-8, 2021.
Wu, Y., Liu, J., Zhai, J., Cong, L., Wang, Y., Ma, W., Zhang, Z., and Li, C.: Comparison of dry and wet deposition of particulate matter in near-surface waters during summer, PloS one, 13, e0199241, https://doi.org/10.1371/journal.pone.0199241, 2018.
Xie, B., Yang, Y., Wang, P., and Liao, H.: Impacts of ENSO on wintertime PM2.5 pollution over China during 2014–2021, Atmos. Ocean. Sci. Lett., 15, 100189, https://doi.org/10.1016/j.aosl.2022.100189, 2022a.
Xie, X., Hu, J., Qin, M., Guo, S., Hu, M., Wang, H., Lou, S., Li, J., Sun, J., Li, X., Sheng, L., Zhu, J., Chen, G., Yin, J., Fu, W., Huang, C., and Zhang, Y.: Modeling particulate nitrate in China: Current findings and future directions, Environ. Int., 166, 107369, https://doi.org/10.1016/j.envint.2022.107369, 2022b.
Xu, J.-W., Lin, J., Luo, G., Adeniran, J., and Kong, H.: Foreign emissions exacerbate PM2.5 pollution in China through nitrate chemistry, Atmos. Chem. Phys., 23, 4149–4163, https://doi.org/10.5194/acp-23-4149-2023, 2023.
Yan, F., Chen, W., Jia, S., Zhong, B., Yang, L., Mao, J., Chang, M., Shao, M., Yuan, B., Situ, S., Wang, X., Chen, D., and Wang, X.: Stabilization for the secondary species contribution to PM2.5 in the Pearl River Delta (PRD) over the past decade, China: A meta-analysis, Atmos. Environ., 242, 117817, https://doi.org/10.1016/j.atmosenv.2020.117817, 2020.
Yang, S., Yuan, B., Peng, Y., Huang, S., Chen, W., Hu, W., Pei, C., Zhou, J., Parrish, D. D., Wang, W., He, X., Cheng, C., Li, X.-B., Yang, X., Song, Y., Wang, H., Qi, J., Wang, B., Wang, C., Wang, C., Wang, Z., Li, T., Zheng, E., Wang, S., Wu, C., Cai, M., Ye, C., Song, W., Cheng, P., Chen, D., Wang, X., Zhang, Z., Wang, X., Zheng, J., and Shao, M.: The formation and mitigation of nitrate pollution: comparison between urban and suburban environments, Atmos. Chem. Phys., 22, 4539–4556, https://doi.org/10.5194/acp-22-4539-2022, 2022.
Yang, Y., Liu, X., Qu, Y., Wang, J., An, J., Zhang, Y., and Zhang, F.: Formation mechanism of continuous extreme haze episodes in the megacity Beijing, China, in January 2013, Atmos. Res., 155, 192–203, https://doi.org/10.1016/j.atmosres.2014.11.023, 2015.
Ye, C., Lu, K. D., Song, H., Mu, Y. J., Chen, J. M., and Zhang, Y. H.: A critical review of sulfate aerosol formation mechanisms during winter polluted periods, J. Environ. Sci., 123, 387–399, https://doi.org/10.1016/j.jes.2022.07.011, 2023.
Yim, S. H. L., Hou, X., Guo, J., and Yang, Y.: Contribution of local emissions and transboundary air pollution to air quality in Hong Kong during El niño-Southern Oscillation and heatwaves, Atmos. Res., 218, 50–58, https://doi.org/10.1016/j.atmosres.2018.10.021, 2019.
Yin, Z., Wang, H., and Yuan, D.: Interdecadal increase of haze in winter over North China and the Huang-huai Area and the weakening of the East Asia Winter Monsoon, Kexue Tongbao/Chinese Sci. Bull., 60, 1395–1400, https://doi.org/10.1360/N972014-01348, 2015.
Yin, Z. C., Zhou, B. T., Chen, H. P., and Li, Y. Y.: Synergetic impacts of precursory climate drivers on interannual-decadal variations in haze pollution in North China: A review, Sci. Total Environ., 755, 143017, https://doi.org/10.1016/j.scitotenv.2020.143017, 2021.
Ying, Q., Wu, L., and Zhang, H.: Local and inter-regional contributions to PM2.5 nitrate and sulfate in China, Atmos. Environ., 94, 582–592, https://doi.org/10.1016/j.atmosenv.2014.05.078, 2014.
Zhai, H., Huang, L., Emery, C., Zhang, X., Wang, Y., Yarwood, G., Fu, J. S., and Li, L.: Recommendations on benchmarks for photochemical air quality model applications in China – NO2, SO2, CO and PM10, Atmos. Environ., 319, 120290, https://doi.org/10.1016/j.atmosenv.2023.120290, 2024.
Zhai, P. M., Yu, R., Guo, Y. J., Li, Q. X., Ren, X. J., Wang, Y. Q., Xu, W. H., Liu, Y. J., and Ding, Y. H.: The strong El Niño of 2015/16 and its dominant impacts on global and China's climate, J. Meteorol. Res., 30, 283–297, https://doi.org/10.1007/s13351-016-6101-3, 2016.
Zhai, S., Jacob, D. J., Wang, X., Shen, L., Li, K., Zhang, Y., Gui, K., Zhao, T., and Liao, H.: Fine particulate matter (PM2.5) trends in China, 2013–2018: separating contributions from anthropogenic emissions and meteorology, Atmos. Chem. Phys., 19, 11031–11041, https://doi.org/10.5194/acp-19-11031-2019, 2019.
Zhai, T., Lu, K., Wang, H., Lou, S., Chen, X., Hu, R., and Zhang, Y.: Elucidate the formation mechanism of particulate nitrate based on direct radical observations in the Yangtze River Delta summer 2019, Atmos. Chem. Phys., 23, 2379–2391, https://doi.org/10.5194/acp-23-2379-2023, 2023.
Zhang, L. L., Zhao, N., Zhang, W. H., and Wilson, J. P.: Changes in long-term PM2.5 pollution in the urban and suburban areas of China's three largest urban agglomerations from 2000 to 2020, Remote Sens., 14, 1716, https://doi.org/10.3390/rs14071716, 2022.
Zhang, Q., Zheng, Y., Tong, D., Shao, M., Wang, S., Zhang, Y., Xu, X., Wang, J., He, H., Liu, W., Ding, Y., Lei, Y., Li, J., Wang, Z., Zhang, X., Wang, Y., Cheng, J., Liu, Y., Shi, Q., Yan, L., Geng, G., Hong, C., Li, M., Liu, F., Zheng, B., Cao, J., Ding, A., Gao, J., Fu, Q., Huo, J., Liu, B., Liu, Z., Yang, F., He, K., and Hao, J.: Drivers of improved PM2.5 air quality in China from 2013 to 2017, P. Natl. Acad. Sci. USA, 116, 24463–24469, https://doi.org/10.1073/pnas.1907956116, 2019.
Zhang, R. Y., Wang, G. H., Guo, S., Zamora, M. L., Ying, Q., Lin, Y., Wang, W. G., Hu, M., and Wang, Y.: Formation of urban fine particulate matter, Chem. Rev., 115, 3803e3855, https://doi.org/10.1021/acs.chemrev.5b00067, 2015.
Zhang, W., Wang, H., Zhang, X., Peng, Y., Zhong, J., Wang, Y., and Zhao, Y.: Evaluating the contributions of changed meteorological conditions and emission to substantial reductions of PM2.5 concentration from winter 2016 to 2017 in Central and Eastern China, Sci. Total Environ., 716, 136892, https://doi.org/10.1016/j.scitotenv.2020.136892, 2020.
Zhang, Y., Wallace, J. M., and Battisti, D. S.: ENSO-like interdecadal variability: 1900–93, J. Climate, 10, 1004–1020, 1997.
Zhao, S., Li, J. P., and Sun, C.: Decadal variability in the occurrence of wintertime haze in central eastern China tied to the Pacific decadal oscillation, Sci. Rep., 6, 27424, https://doi.org/10.1038/srep27424, 2016.
Zhao, S., Zhang, H., and Xie, B.: The effects of El Niño–Southern Oscillation on the winter haze pollution of China, Atmos. Chem. Phys., 18, 1863–1877, https://doi.org/10.5194/acp-18-1863-2018, 2018.
Zhao, W., Chen, S., Zhang, H., Wang, J., Chen, W., Wu, R., Xing, W., Wang, Z., Hu, P., Paio, J., and Ma, T.: Distinct Impacts of ENSO on Haze Pollution in the Beijing–Tianjin–Hebei Region between Early and Late Winters, J. Climate, 35, 687–704, https://doi.org/10.1175/JCLI-D-21-0459.1, 2022.
Zheng, B., Tong, D., Li, M., Liu, F., Hong, C., Geng, G., Li, H., Li, X., Peng, L., Qi, J., Yan, L., Zhang, Y., Zhao, H., Zheng, Y., He, K., and Zhang, Q.: Trends in China's anthropogenic emissions since 2010 as the consequence of clean air actions, Atmos. Chem. Phys., 18, 14095–14111, https://doi.org/10.5194/acp-18-14095-2018, 2018.
- Abstract
- Introduction
- Method
- Results: Changes in PM2.5 pollution and meteorological conditions during the 2015–2017 cold seasons
- Results: Regional source contributions and budgets of PM2.5 across the three cold seasons
- Conclusions
- Data availability
- Author contributions
- Competing interests
- Disclaimer
- Financial support
- Review statement
- References
- Supplement