the Creative Commons Attribution 4.0 License.
the Creative Commons Attribution 4.0 License.
The transport history of African biomass burning aerosols arriving in the remote Southeast Atlantic and their impacts on cloud properties
Huihui Wu
Fanny Peers
Jonathan W. Taylor
Chenjie Yu
Steven J. Abel
Paul A. Barrett
Jamie Trembath
Keith Bower
Jim M. Haywood
African biomass burning (BB) aerosols transported over the southeast Atlantic (SEA) strongly influence cloud properties but remain a major source of uncertainty in regional climate assessment. This study characterizes vertical profiles of thermodynamic conditions, aerosol properties, and cloud microphysics around Ascension Island during an aircraft campaign (August–September 2017). Backward-dispersion simulations evidence that observed pollution originated from long-range transported African BB plumes. In BB-polluted marine boundary layers (MBL), aerosol number concentrations (Na) were substantially elevated relative to the clean MBL, driving increased cloud droplet number concentrations (Nd) and reduced cloud effective radii (Re). Cloud-layer mean Nd correlated strongly with aerosols below the cloud (sub-Na) but weakly with free-tropospheric (FT) aerosols. Enhanced sub-Na was due to BB aerosols entrained from the FT into the MBL along long-range transport and/or locally. Droplet activation fractions were similar in clean and moderately BB-polluted (sub-Na < 700 cm−3) clouds, while a weaker Nd–Na correlation was observed in more polluted clouds. Region-specific Nd–Na parameterizations are necessary for representing BB aerosol-cloud interactions over the remote SEA. A robust inverse Nd–Re relationship was observed, regardless of BB influence. By coupling backward simulations with satellite retrievals, this study indicates that FT-to-MBL entrainment of African BB aerosols over the SEA occurs several days before arrival at Ascension Island, predominantly west of 0° E for examined cases. These findings provide unique observational constraints for representing aerosol-cloud interactions and vertical transport of African BB aerosols in climate models, offering improved assessments of African BB impacts over the SEA.
- Article
(3953 KB) - Full-text XML
-
Supplement
(2458 KB) - BibTeX
- EndNote
Every year from July to October, seasonal wildfires across central and southern Africa account for about one-third of global carbon emissions from biomass burning (BB) (Roberts et al., 2009). The emitted smoke is frequently transported westward over the southeast Atlantic (SEA), where it often resides in the free troposphere (FT) and may entrain into the marine boundary layer (MBL) during its subsiding transport (Painemal et al., 2014; Adebiyi and Zuidema, 2016; Das et al., 2017). These transported BB aerosols exert complex radiative effects by absorbing and reflecting solar radiation, and by interacting with one of the world's largest semi-permanent stratocumulus cloud decks over the SEA. The SEA region is climatically important, due to the significant net cooling effect of these stratocumulus clouds through their strong reflection of solar radiation but small positive longwave radiative effect (Wood, 2012).
Most previous studies have focused on assessing the direct effect (solar absorption and scattering by BB aerosols) and the semi-direct effect (cloud adjustments in response to the direct radiative effect) of transported African BB aerosols. It is reported that these transported BB aerosols can induce a considerable warming direct radiative effect over the SEA during the fire season (monthly mean = ∼ 15–35 W m−2) (De Graaf et al., 2014; Zuidema et al., 2018). The semi-direct effect can either reduce or enhance cloud coverage depending on the relative vertical locations of BB aerosols and cloud layers (Boucher et al., 2013). BB aerosols above clouds can strengthen the cloud-top temperature inversion and stabilize the low atmosphere, which weakens entrainment and preserves cloud cover over the SEA (Deaconu et al., 2019; Herbert et al., 2020). Conversely, in the smoky MBL, BB aerosol heating induced by absorbing solar radiation tends to reduce the relative humidity below the cloud, thereby decreasing the cloud cover (Zhang and Zuidema, 2019). Modeling studies suggest that BB aerosols exert an overall negative semi-direct radiative forcing (cooling) over the SEA during the fire season (Wilcox, 2012; Gordon et al., 2018).
In contrast, the effect of BB aerosols on clouds by acting as cloud condensation nuclei (CCN) (known as the indirect effect) has received less attention compared with their direct and semi-direct effects over the SEA. Contrary to earlier assumptions that BB aerosols are well separated from the cloud deck, recent observations have demonstrated that BB aerosols can be in direct contact with the underlying clouds over the SEA (Painemal et al., 2014; Gupta et al., 2021). Recent modeling studies show that BB aerosols can increase cloud droplet number concentrations (Nd) and reduce droplet sizes, which may enhance cloud lifetime and coverage by reducing drizzle formation (Gordon et al., 2018; Lu et al., 2018). The overall indirect effect of BB aerosols is suggested to enhance the cloud brightness over the SEA and cause a strong cooling effect. Notably, some studies indicate that the indirect effect may dominate the overall aerosol radiative forcing of BB aerosols over the SEA (Lu et al., 2018). Therefore, accurate quantification of cloud responses to BB aerosols is vital for assessments of BB aerosol-cloud-radiation interactions over the SEA.
However, quantifying the cloud response to BB aerosols over the SEA remains uncertain due to observational limitations. Satellite-based observations have been widely used to examine the vertical distance between the smoke layer base and the cloud top, which plays a role in understanding the impact of BB aerosol layers on cloud properties (Costantino and Bréon, 2010, 2013; Painemal et al., 2014). When cloud and aerosol layers nearly overlap, empirical relationships between cloud properties (e.g. Nd or effective radius, Re) and CCN (or aerosol number concentration) were estimated to quantify the cloud response to BB aerosols. In contrast, clouds and BB aerosols are considered uncorrelated when smoke and clouds are vertically well separated. However, satellites tend to overestimate the base of the smoke layer and imply an unrealistic separation between BB aerosols and underlying clouds. This is because absorbing BB aerosols attenuate the lidar beam, thereby the satellite is not able to detect the lower portions of BB aerosol layers (Rajapakshe et al., 2017). Satellites are also unable to resolve the exact amounts of BB aerosols activated in the clouds, which directly impacts the magnitude of the indirect effect. More accurate in-situ measurements of aerosol-cloud relationship are needed to quantify the response of clouds to BB aerosols in this region.
Another uncertainty in assessing BB aerosol-cloud interactions over the SEA arises from model biases in simulating the vertical distribution of transported BB aerosols. Many simulations using Earth System models show that smoke layers descend too rapidly as they advect away from the African coast, thus the smoke layer heights were underestimated over the SEA (Das et al., 2017; Gordon et al., 2018; Shinozuka et al., 2020). The underestimated smoke layer heights would lead to an underestimation of above-cloud aerosols and an overestimation of MBL aerosols on the eastern side of the SEA (Shinozuka et al., 2020). The misrepresentation of aerosol vertical distribution would cause a significant diversity in simulated climate forcing over the SEA, as the radiative effects of aerosols are dependent on their vertical distribution and locations with respect to clouds (Samset et al., 2013). This unrealistically rapid descent of BB aerosol layers may be attributed to an overestimated subsidence in the model-simulated large-scale vertical velocities. Thus, the entrainment process of elevated FT smoke into the MBL is poorly represented in models, despite its importance in determining the MBL BB aerosols in transport regions over the SEA (Johnson and Haywood, 2023). Improved representation of vertical transport and entrainment, potentially aided by higher-resolution meteorological fields, is crucial for simulating BB aerosol-cloud interactions (Das et al., 2017).
To address the aforementioned issues, aircraft in-situ measurements are essential to provide unique constraints on the vertical distribution of transported African BB aerosols over the SEA for climate models. Aircraft observations with continuous vertical sampling are also the most reliable source for accurately characterizing the correlations between aerosols and clouds. This study presents airborne observations of BB aerosols and clouds collected during the CLARIFY campaign (Cloud-Aerosol-Radiation Interactions and Forcing; August–September 2017), which was based around Ascension Island (7.96° S, 14.35° W) (Haywood et al., 2021). The CLARIFY campaign addresses a key observational gap over the remote SEA, contributing to a more comprehensive understanding of BB aerosol vertical distributions and interactions with clouds across the SEA. When integrated with complementary campaigns such as ORACLES (ObseRvations of Aerosols above CLouds and their intEractionS), which primarily focused on regions westward of the African continent and eastward of 0° E (Redemann et al., 2021), the CLARIFY campaign provides an integrated wide-scale assessment of BB aerosol transport and its impact on cloud microphysics over the SEA. Observations from these collaborative projects have indicated that the physicochemical properties of BB aerosols continuously evolve during weeklong transport, influenced by aging, cloud processing, and MBL environments, implying different CCN activity after long-range transport (Wu et al., 2020; Dobracki et al., 2023). Additionally, CLARIFY observations have shown that there is often a complex vertical structure of BB aerosol relative to cloud layers, as well as vertical variability of aerosol chemical composition and size distributions (Wu et al., 2020; Haywood et al., 2021). These complexities underscore the significance of investigating the mechanisms by which long-range transported BB aerosols modulate cloud microphysics over the remote SEA.
In this study, we first present the pollution conditions over Ascension Island and trace the origins of air masses using backward-dispersion simulations (Sect. 3.1). We then characterize the vertical profiles of thermodynamic variables, aerosol properties, and cloud microphysics over Ascension Island (Sect. 3.2). While the region is influenced by the transition from stratocumulus to cumulus clouds, associated with increasing sea surface temperatures (Gordon et al., 2018), this study focuses on assessing the effects of BB aerosols on stratocumulus cloud microphysics (Sect. 3.3). More details of cloud types (stratocumulus or cumulus clouds) collected during the CLARIFY are provided in Sect. 3.2. Finally, we integrate air parcel analysis with satellite observations (Spinning Enhanced Visible and Infrared Imager, SEVIRI), to identify the efficient entrainment regions where FT air parcels from Africa are likely to enter the MBL over the SEA and to demonstrate their impacts on cloud properties along transport (Sect. 3.4).
The CLARIFY campaign was conducted using the UK FAAM (Facility for Airborne Atmospheric Measurements) BAe-146 Atmospheric Research Aircraft and characterized the aerosol-cloud system centered around Ascension Island (7.96° S, 14.35° W) in the remote SEA. A total of 28 scientific flights (designated flight labels from C028 to C055) took place between 16 August and 7 September 2017. The aircraft was equipped with a range of instruments to derive aerosol and cloud properties, as well as meteorological variables (e.g. ambient temperature (T, K), potential temperature (θ, K), and total water mixing ratio (qt, g kg−1, the total mass of vapor, liquid, and ice forms of water per unit mass of dry air)). Figure S1 in the Supplement shows the typical flight patterns on example flights. Each flight consisted of a series of straight and level runs at varying altitudes and vertical profiles to characterize aerosols. On cloudy days, saw-tooth and stepped profiles were made to characterize cloud microphysics from cloud base to top. Tracks of flights used in this study are shown in Fig. 1. Transit flights (C040 and C041, predominately at high altitudes) and flights with mainly limited cloud samplings (C028, C030, C034, C035, and C043) are not included in this study. Specific events (pocket of open cell, C052 to C054) have been comprehensively characterized in Abel et al. (2020), which are also excluded from this study. The main aerosol and cloud measurements used in this study are briefly described below. A more detailed overview of the project is provided by Haywood et al. (2021).
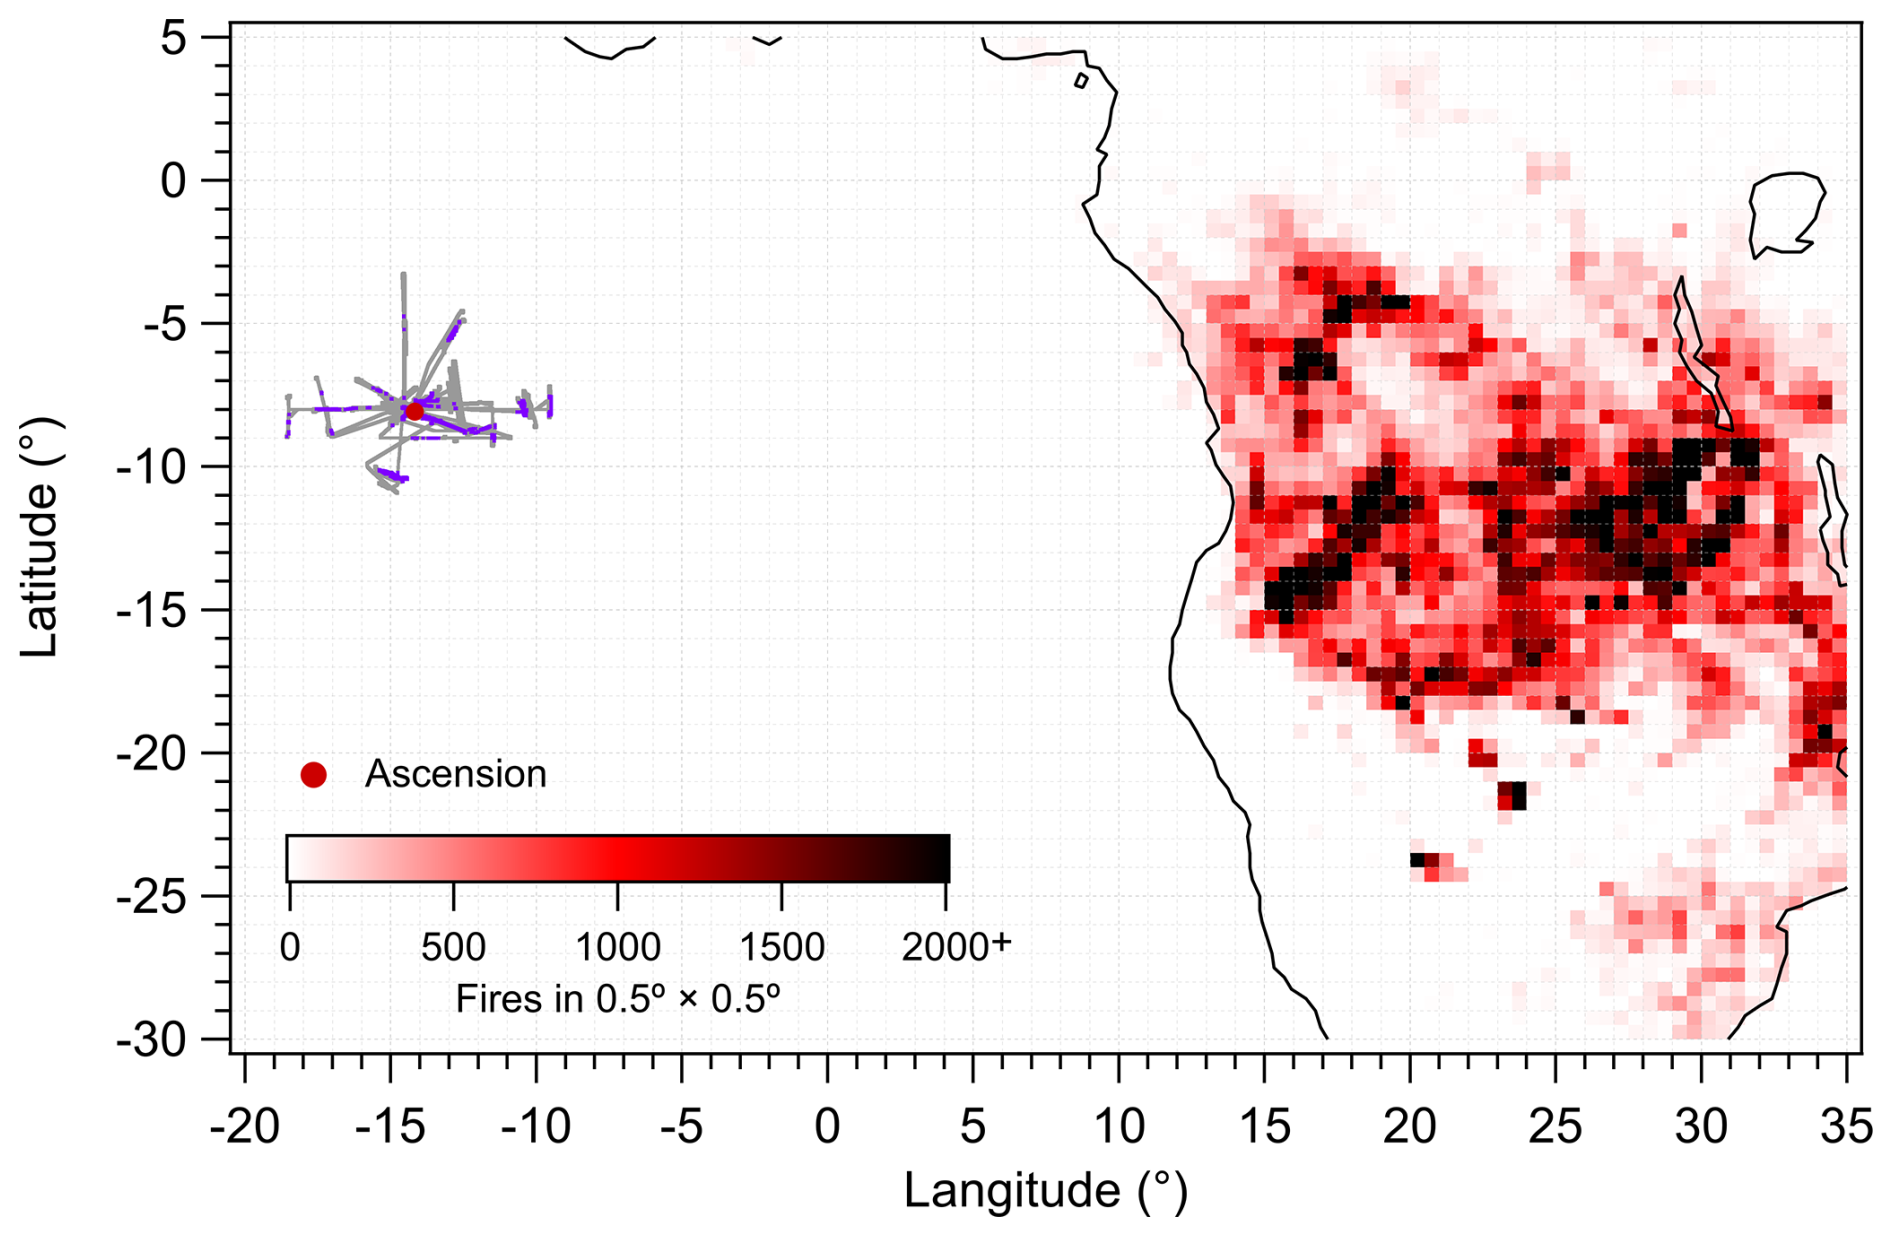
Figure 1Tracks of the CLARIFY flights used in this study, cloud sampling periods during tracks are highlighted in purple colour. Fire density maps are counted over the African continent, showing 0.5° × 0.5° bins of the numbers of MODIS-detected fires during the campaign period.
2.1 Aerosol and cloud measurements
Aerosol size distributions were measured at 1 Hz resolution via two wing-mounted Passive Cavity Aerosol Spectrometer Probes (PCASP), which resolved number concentrations in 30 diameter bins between 0.1 and 3 µm. The two PCASPs were size-calibrated using di-ethyl-hexylsebacate (DEHS) and polystyrene latex spheres (PSL) with known size and refractive index (Rosenberg et al., 2012). A refractive index of 1.54−0.027i was assumed for ambient aerosol to determine the bin sizes by using Mie scattering theory. The refractive index was obtained by the method reported by Peers et al. (2019), where the aerosol model is tuned using the refractive index to best represent the PCASP measurements. Aerosol number concentration in the size range of 0.1–3 µm (Na) was obtained by integrating the PCASP distribution. The lognormal fitted count median diameter (CMD) was also calculated from the PCASP aerosol size distribution. A model 3786-LP water-filled condensation particle counter (CPC, TSI Inc.) on board can detect aerosol particles in a size range of 3 nm to 1 µm at 1 Hz resolution (Hering et al., 2005), and it can provide total submicron aerosol number concentration (CN3, > 3 nm) at an accuracy of ±12 %. The CPC used in this study is water-based and may undercount hydrophobic particles, particularly soot-rich BB aerosols (Keller et al., 2013). However, most of the sampled BB plumes have undergone week-long transport. Aging processes may have reduced the hydrophobicity of BB organics due to their oxidation and internal mixing with secondary species such as sulfates (Pósfai et al., 2003). Therefore, undercounting is expected to be minimal for the conditions of this study. The CCN number concentrations were measured at 1 Hz resolution by a Droplet Measurement Technologies (DMT) dual-column CCN counter (Roberts and Nenes, 2005). The CCN data was analyzed when measured at a supersaturation (SS) of ∼ 0.2 %. The relative uncertainty in the supersaturation measurements is ±10 %, and the uncertainty associated with the flow calibration and counting efficiency of the particle counter is typically ∼ 6 % (Trembath, 2013). These aerosol instruments covered the typical size range of BB aerosols in this region, primarily within the submicron range (Barrett et al., 2022).
Cloud droplet number size distributions were measured at 1 Hz resolution using a Cloud Droplet Probe (CDP). The CDP is a forward-scattering optical particle counter which can detect particles in 30 diameter bins between 2 and 52 µm. The operation and calibration of the CDP follow procedures described in Lance et al. (2010). A 10-point glass bead calibration spanning the instrument's detection range was performed before each flight day. The nominal bead size was corrected for the differences between the refractive indices of glass and water, and the water-corrected size was used to calibrate the instrument's sizing response (Barrett et al., 2022). From the CDP's cloud droplet spectrum, three key cloud microphysical parameters were derived: Nd, Re, and liquid water content (LWC). The Nd was calculated by integrating the droplet size distribution, as described by Eq. (1).
where n(ri) is the droplet number concentration in a particular size bin, and ri is the middle radius for each of the size bins.
The Re was calculated based on the Eq. (2).
The LWC was calculated based on the Eq. (3), assuming spherical droplets and a liquid water density (ρwater) of 1 g cm−3.
An LWC value over 0.01 g m−3 for 1 Hz measurements was used to define the low threshold for the presence of cloud (Heymsfield and McFarquhar, 2001). To eliminate the inclusion of optically thin clouds, a threshold of Nd > 5 cm−3 and bulk LWC > 0.02 g m−3 was used to perform statistical cloud sample analysis. The duration of efficient cloud sampling in each flight using these criteria is listed in Table S1, with corresponding cloud sampling periods highlighted in Fig. 1. Of relevance to this work are the saw-tooths and stepped profiles to characterize cloud regions. A vertical profile that sampled a continuous cloud layer was used to determine the cloud base height as the lowest altitude with Nd > 5 cm−3 and bulk LWC > 0.02 g m−3, and the cloud-top height was identified as the highest altitude satisfying these criteria. The liquid water path (LWP) was also integrated from each profile sampled.
Aerosol concentrations measured aboard the FAAM BAe-146 were corrected for ram air compression at inlet speed using the volumetric correction as described in previous studies (Trembath, 2013). Airborne aerosol and cloud measurements reported here were corrected to the standard temperature and pressure condition (273.15 K and 1013.25 hPa). It is noted that the PCASP, CPC and CCN measurements inside clouds are unreliable and thus in-cloud (LWC > 0.01 g m−3) data was removed.
We also obtained the above-cloud aerosol optical thickness (AOT), cloud optical thickness (COT), Re and cloud-top height (CTH) across the SEA region (30° S–0° N; 20° W–15° E), which was also retrieved from the SEVIRI sensor aboard the geostationary Meteosat-10 satellite, following Peers et al. (2019, 2021). The Nd was calculated assuming an adiabatic-like vertical stratification (Painemal et al., 2012):
It is noted that only data from liquid clouds in the MBL (cloud top height less than 3000 m) are included in this analysis. SEVIRI aerosol and cloud retrievals are available for the period of 16–31 August 2017. Observations were collected daily between 06:12 and 17:57 UTC, with a time resolution of 15 min.
2.2 NAME description
To investigate the sources and transport pathways of airmasses arriving at Ascension Island, we performed backward-dispersion simulations using the UK Met Office's Numerical Atmospheric Modelling Environment (NAME) (Jones et al., 2007). NAME was chosen as an appropriate model for this study because it uses high-resolution meteorological fields (∼ 10 km × 10 km). It can predict transport over distances ranging from a few kilometers to the whole globe, and it has been used successfully in similar studies (e.g. Panagi et al., 2020).
Backward-dispersion simulations were performed at 3 h intervals throughout the campaign period. In each simulation, a certain amount of hypothetical tracer particles (hereafter referred to as “air parcels”) (∼ 2.7 × 10⁻⁷ g m−3) were released from a 2° × 2° grid box centered around the Ascension Island observation site (7.96° S, 14.35° W). To distinguish source origins of MBL and FT airmasses over Ascension Island, tracer particles were released within the MBL (341 ± 300 m) and FT (2.5–4 km) altitude ranges separately. The transport of released tracer particles was tracked backward over the past 7 d in the NAME, driven by the three-dimensional gridded (3D) meteorological fields from the UK Met Office's Unified Model (Brown et al., 2012). The meteorological fields have a high resolution of 0.14° longitude by 0.1° latitude and 59 vertical levels up to ∼ 29 km. The model output integrated horizontal footprints, representing original air parcels passing through horizontal grids over the past 7 d before arriving at the release area (see results in Sect. 3.1). These footprints indicate horizontal contributions of historical airmasses. The footprints are expressed in units of mass concentration (g m−3), based on the predetermined quantity of released air parcels.
We also employed three case studies (see Sect. 3.4 for details of cases), to further investigate vertical distributions and the transport of original air parcels for MBL airmasses over Ascension Island. For these cases, the model output instantaneous 3D air parcel footprints every 3h during the 7 d backward dispersion simulations. The 3D meteorological parameters, e.g. θ, relative humidity, and water mixing ratios, were also output for estimating the capping inversion height (zi). Over the SEA, there is typically a strong thermodynamic capping inversion that inhibits turbulent mixing between the boundary layer (BL) and overlying FT air (Abel et al., 2020). However, the BL depth in NAME is determined to be the height of the surface mixed layer to which BL turbulence extends (Lock et al., 2020). When getting to Ascension Island, the zi is typically higher than the BL depth employed in NAME, as the upper MBL tends to be decoupled from the surface mixed layer (Abel et al., 2020). Here, we estimated the zi over the SEA, using the outputs of 3D meteorological parameters. The zi over the SEA was quantified as the height at which the vertical gradient of liquid water potential temperature (θl) is the largest, and there is also a steep decrease in humidity (Jones et al., 2011). The θl was estimated following Eq. (5).
Where θ is the potential temperature, L is the latent heat of vaporization for water (2.5 × 10⁶ J kg−1), cp is the specific heat of dry air at constant pressure (1005 J kg−1 K−1), ql is the liquid water mixing ratio (g kg−1).
For the three case studies, we analyzed the instantaneous 3D air parcel footprints in two approaches (see results in Sect. 3.4). First, vertical layers of instantaneous 3D footprints were integrated across the horizontal domain to derive column-integrated horizontal footprints. Instead of using the BL depth in NAME, the estimated zi was employed to divide the column-integrated horizontal footprints into the FT and BL separately, distinguishing original air parcels as either from the FT or BL. This enabled an assessment of the relative contributions of original air parcels from FT and BL sources. Second, horizontal grids were integrated within each vertical layer for instantaneous 3D footprints, to derive vertical distributions of original air parcels as a function of time (at 3 h intervals) along the backward simulations. This provides insights into the vertical transport and entrainment pathways of African BB plumes.
3.1 BB pollution conditions and source analysis
Figure 2a shows complex vertical distributions of aerosol number concentrations (Na, 0.1–3 µm) from PCASP measurements for the CLARIFY flights (C028 to C051), alongside the estimated zi. The zi estimates were derived from airborne measurements of θ and ql, using Eq. (5). Following established criteria used in previous CLARIFY studies, the presence of BB-pollution was defined using thresholds of carbon monoxide (CO) above 83 ppb and black carbon (BC) above 0.1 µg m−3 (Wu et al., 2020; Haywood et al., 2021). Clean BL air masses were selected when CO < 66 ppbv (53 µg m−3), which corresponds to the lowest 5th percentile of all CO data collected in the MBL (Wu et al., 2020). Figure S2 presents vertical distributions of CO (Fig. S2a) and BC (Fig. S2b) for the CLARIFY flights (C028 to C051). Table S1 summarizes the BB pollution conditions in the FT and MBL, for the 17 flights used in this study. During the CLARIFY campaign, BB pollution events were observed at different times to be solely in the MBL, or solely in the FT, or in both layers. Concurrent surface observations of CO and BC on Ascension Island (Fig. S2) presented the same trend of MBL BB pollution as observed during the CLARIFY campaign (Zuidema et al., 2018). Based on these observed BB pollution conditions over Ascension island, three periods were identified: Period 1 from 16 to 20 August, BB aerosols were observed to exist predominantly in the MBL, and the FT was mainly clean; Period 2 from 21 to 25 August, the MBL became considerably clean, while the BB pollution existed predominantly in the FT; Period 3 from 26 August to 5 September, the MBL was BB-polluted again, and the BB aerosols were observed in both the MBL and FT.
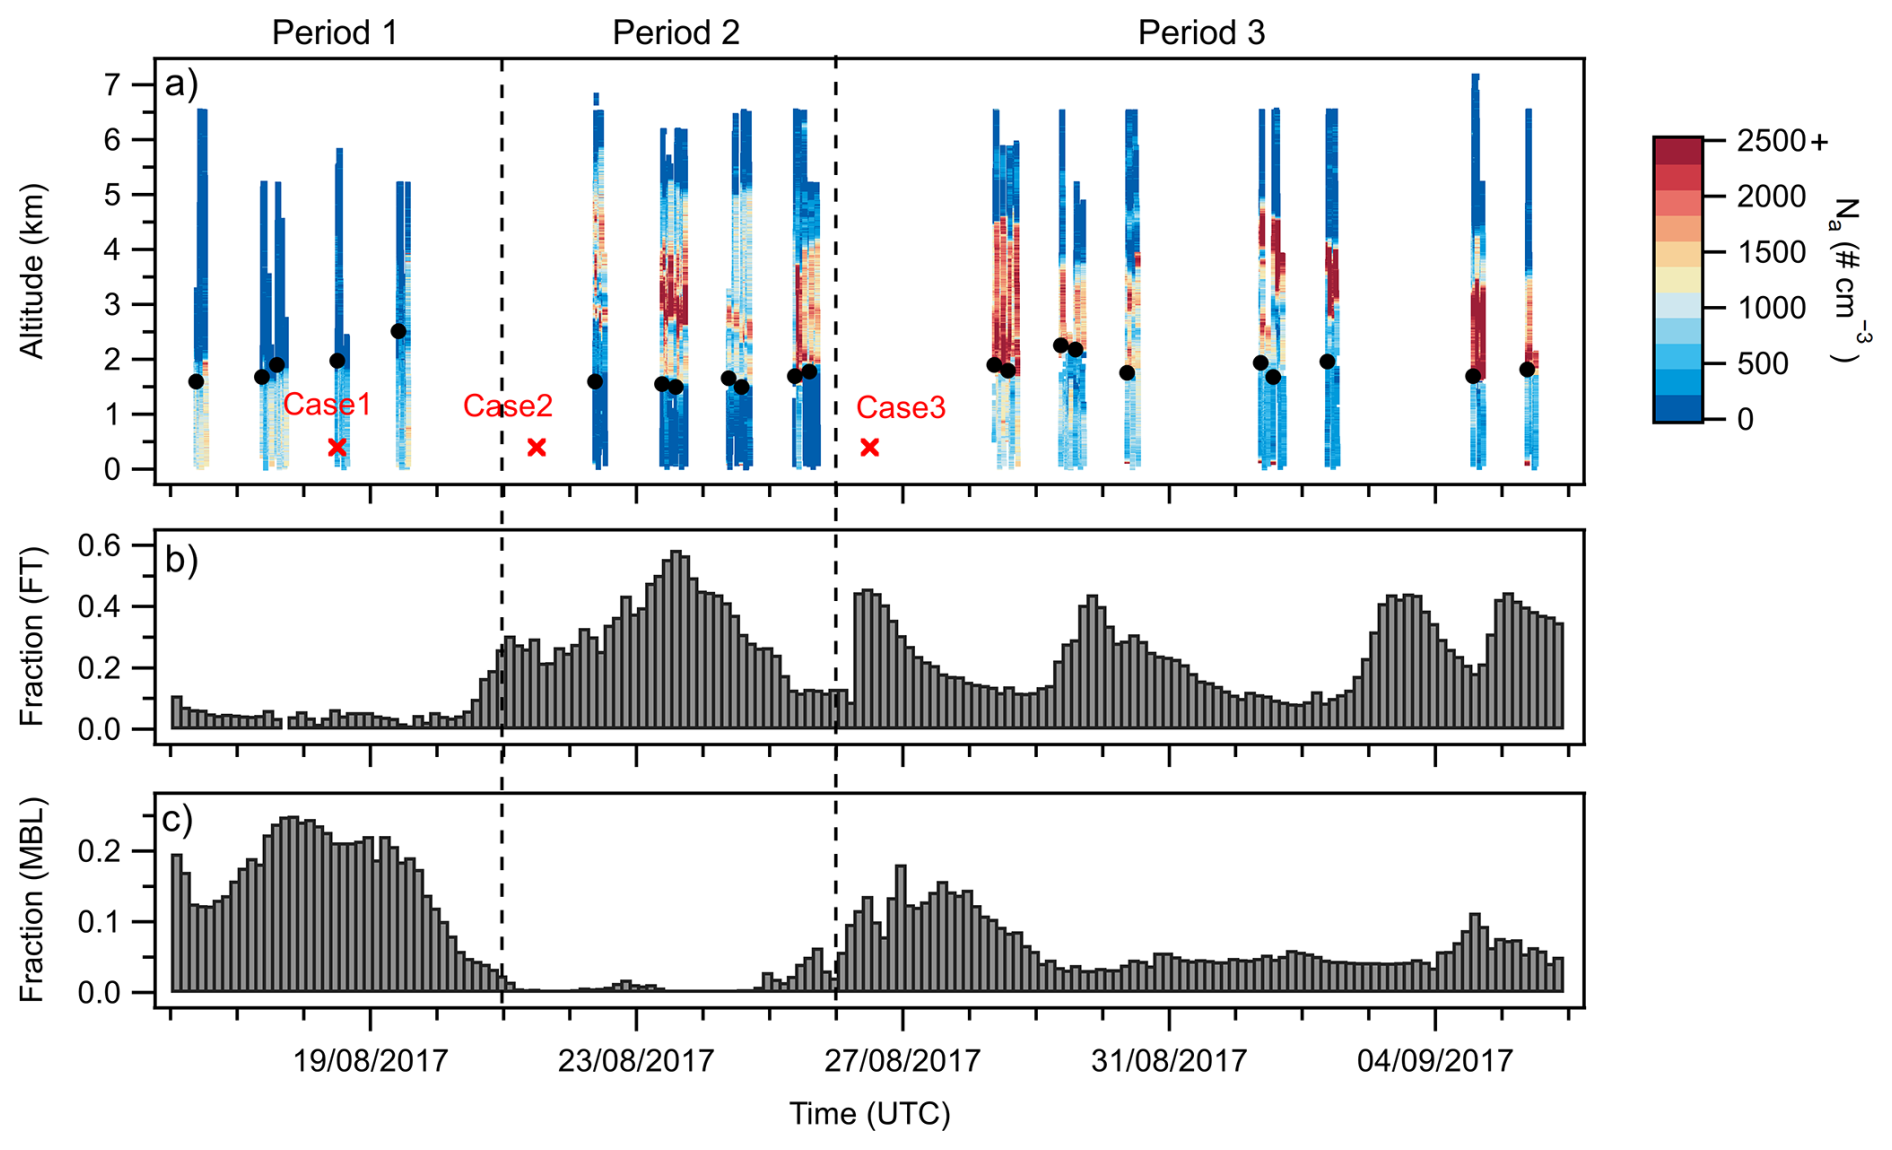
Figure 2(a) Vertical distributions of aerosol number concentrations (Na, 0.1–3 µm) from PCASP measurements for the CLARIFY flights (C028 to C051), alongside the estimated zi from each flight (black circles). The red markers represent the release times for three NAME example cases in Sect. 3.4. (b, c) Fractional contributions of airmass from the African continent (20° S–5° N, 9–35° E) to Ascension Island area throughout the campaign period, differentiating between (b) FT and (c) MBL simulations.
NAME backward-dispersion fields can represent the horizontal footprint of air parcels transported over the past 7 d before arriving at the sampling area over Ascension Island. For the flights employed in this study, example backward-dispersion fields corresponding to release times within the flight sampling period are presented, distinguishing between FT (Fig. S3) and MBL (Fig. S4) simulations. FT dispersion simulations (Fig. S3) indicate that most FT air parcels over Ascension Island originated from westerly flow across the SEA and African continent. Compared to clean FT cases from Period 1, polluted FT cases from Periods 2 and 3 show a substantially greater influence from African continental airmasses. MBL dispersion simulations (Fig. S4) suggest that MBL air parcels over Ascension Island mainly arose from clean oceanic flow that transported from the southeast to northwest over the SEA. Polluted MBL cases from Periods 1 and 3 also show contributions of westerly flow originated from the African continent, while negligible continental influence in clean MBL cases from Period 2. To assess the contributions of polluted airmass originating from the African continent to the Ascension Island area, we calculated the fractional contributions of original airmass over the African domain (20° S–5° N, 9–35° E) based on the outputs of 3-hourly NAME backward-dispersion fields. This continental domain is closely associated with BB pollutions identified in satellite wildfire observations (Fig. 1). The resulting analysis provides a quantitative indication of BB plume influence on the Ascension Island area throughout the campaign period, as shown in Fig. 2b (FT simulations) and Fig. 2c (MBL simulations). The temporal evolution of continental contributions aligns well with the observed FT and MBL pollution patterns over Ascension Island. NAME simulations evidence that the FT and MBL pollutions observed during the campaign were attributable to long-range transport of African continental airmass which brought BB plumes.
3.2 Vertical profiles of thermodynamics, aerosol and cloud
Here, we characterize the vertical profiles of thermodynamics, aerosol and cloud properties during the campaign. Figure 3 shows the vertical profiles of θl (Fig. 3a) and qt (Fig. 3b) for the flights used in this study, which are colored by three periods. It is suggested that the zi is an important parameter for understanding the BL structure. The height scale was normalized by the zi, to exclude the variation of zi and compare the MBL structure on different days. During CLARIFY, we observed similar vertical structures of thermodynamic parameters between flights. The MBL generally showed a well-mixed layer with near-constant θl and qt between the sea surface and the lifting condensation level (LCL, the height at which the relative humidity of an air parcel reaches 100 % when lifted adiabatically), which is at an altitude of ∼ 300 to 800 m ( = ∼ 0.2–0.5). Above the LCL, there was another layer that extended to the base of the inversion. During 6 flight cases (marked as type-d in Table S1), profiles above the LCL exhibited near-constant θl and qt, indicating a fairly well-mixed upper layer and the presence of a decoupled stratocumulus deck. By contrast, in the remaining cases, the upper layer above the LCL was conditionally unstable, suggesting the presence of a stratocumulus-over-cumulus MBL (marked as type-e in Table S1) or a cumulus-capped MBL (marked as type-f in Table S1) structure. The BL decoupling parameters αq and αθ, were also calculated from the respective profiles following Eqs. (6) and (7), respectively, which represent the relative differences of the qt and θl between the surface and the upper part of the BL (Zheng et al., 2011).
Where and are θl and qt at the level 50 m above the inversion height, and are at the level 50 m below the inversion height, θl(0) and qt(0) are at the lowest measured level near sea surface. It is suggested that a value of αq over ∼ 0.3 indicates a decoupled BL. The average values of αq and αθ in this study were calculated to be 0.35 ± 0.11 and 0.32 ± 0.09, respectively, and the upper part of the MBL was clearly drier than the lower surface layer, suggesting a generally decoupled MBL over Ascension Island area during CLARIFY. The strong inversion layer occurred at the top of the MBL (0.9 < < 1.0), with the average θl increase of approximately 4–9 K across BL top (Fig. 3a) and a sharp decrease in humidity (qt) (Fig. 3b). Above the inversion layer, the air was much drier compared to the MBL and is regarded as being in the FT. Figure 3b shows that FT humidity was generally higher on days with the presence of FT BB plumes (Periods 2 and 3, red and black profiles) compared to clean FT cases (Period 1, blue profiles). This pattern is consistent with previous studies, suggesting a positive correlation between BB plume strength and atmospheric water vapor content in the FT over the SEA (Pistone et al., 2021). The covariation between plume strength and humidity is attributed to the mixing between the moist, smoky continental boundary layer and the dry, clean FT. Consequently, humid BB plumes above the boundary layer can be advected to the SEA, enhancing FT humidity in the presence of transported smoke plumes (Pistone et al., 2021).
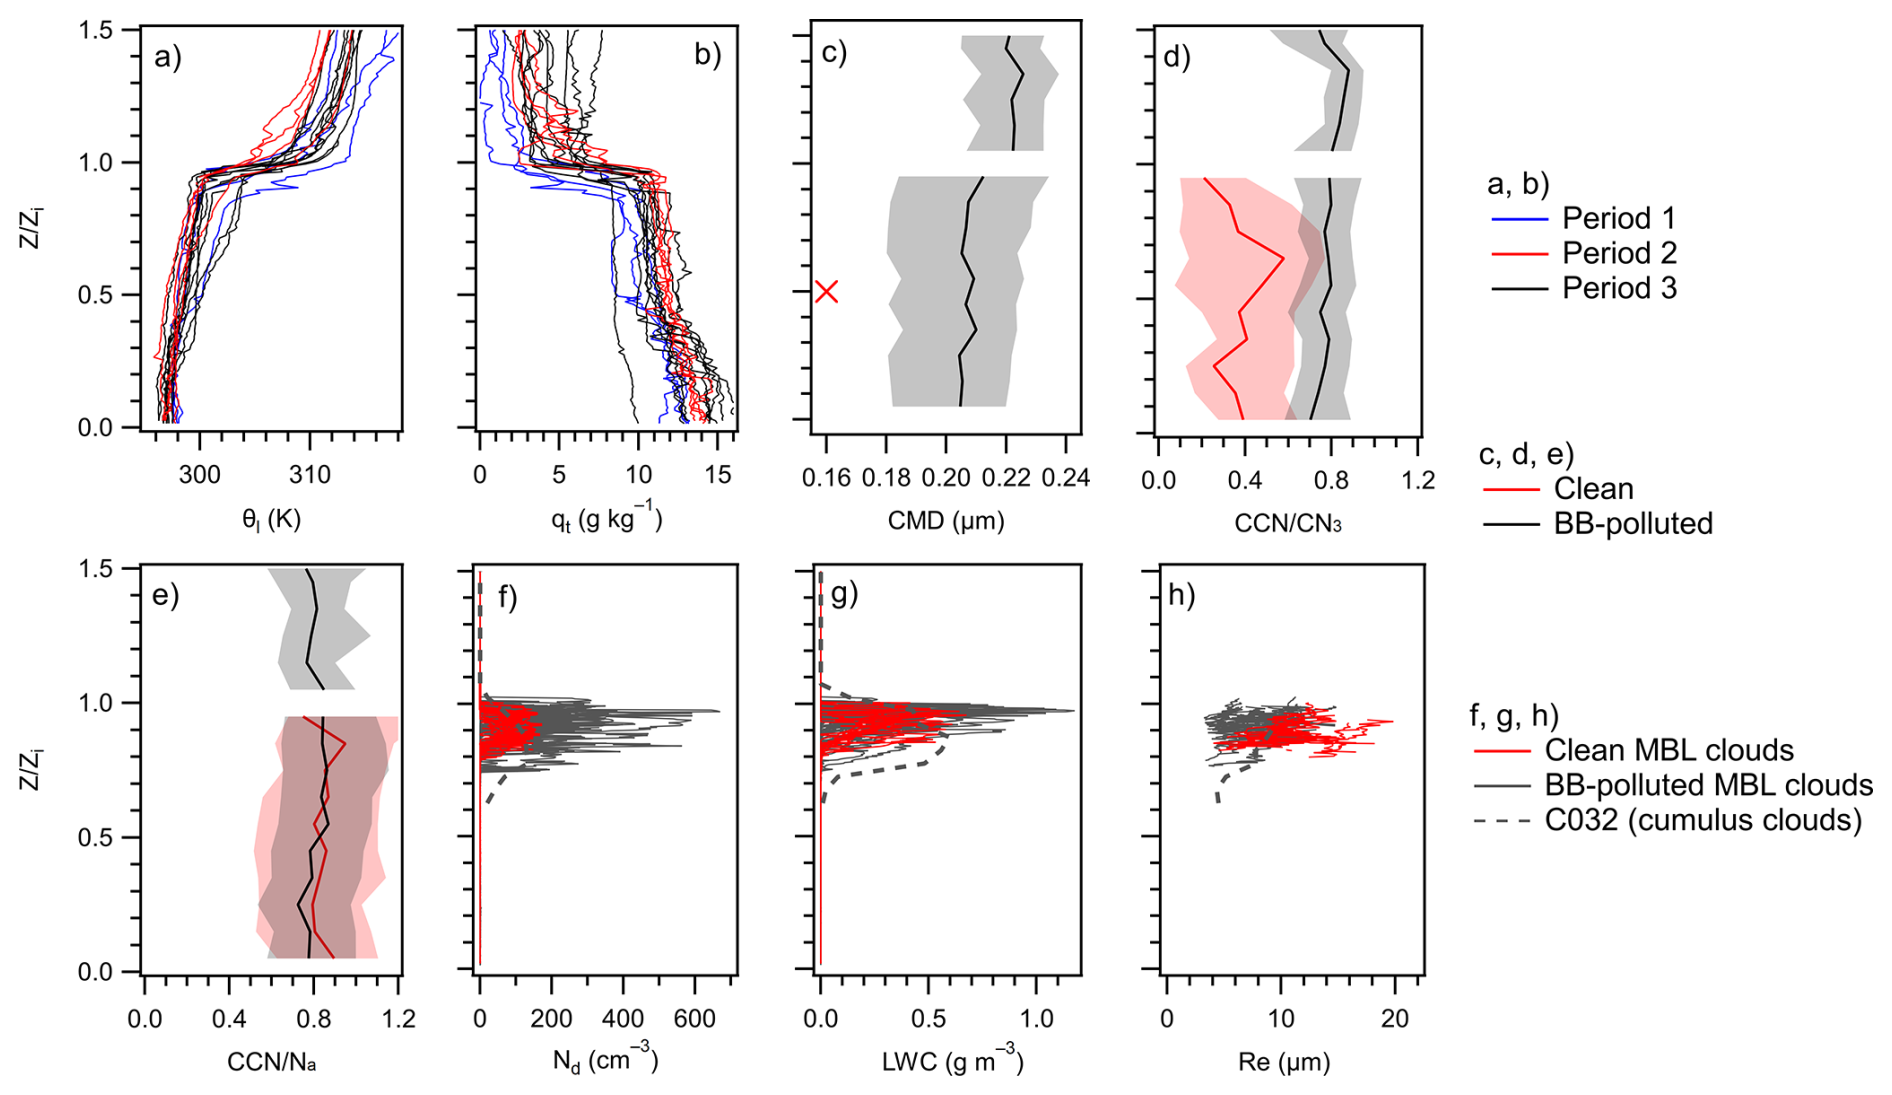
Figure 3(a, b) Average vertical profiles of (a) liquid water potential temperature (θl, K) and (b) total water mixing ratio (qt) for each flight used in this study. Blue, red and black lines represent measurements from Periods 1, 2 and 3, respectively. (c–e) Summarized profiles of (c) aerosol count median diameter (CMD, µm) derived from the PCASP and (d, e) the ratios of CCN number concentration (at SS = 0.2 %) to CN3 from the CPC (CCN CN3) and Na from the PCASP (CCN Na) under BB-polluted (black) and clean (red) conditions. Solid lines and shades represent median values and ranges from 10 to 90 percentiles. The red cross marker in panel (c) represents the average CMD in accumulation mode from aerosol measurements within the clean MBL. (f–h) Vertical profiles of 1 Hz, (f) cloud droplet number concentration (Nd, cm−3), (g) liquid water content (LWC, g m−3), and (h) cloud effective radius (Re, µm) in sampled continuous cloud profiles. Red lines represent cloud profiles in the clean MBL, and grey lines represent cloud profiles in the BB-polluted MBL. It is noted that average vertical profiles of cloud properties from flight C032 are also provided in panels (f)–(h) (grey dashed lines). The y-axis uses a height scale normalized by inversion height (zi).
In this study, vertical profiles of aerosol properties (CMD, CCN CN3 and CCN Na ratios) were summarized under clean (red line and shades in Fig. 3c–e) and BB-polluted (black line and shades in Fig. 3c–e) conditions separately. MBL analysis included both the clean and BB-polluted conditions. However, due to background aerosols in the clean FT during Period 1 being mainly below instrumental detection limits, the FT analysis (CMD, CCN CN3, and CCN Na ratios) was restricted to BB-polluted conditions. Figure 3c shows that the CMD of aerosols in the BB-polluted MBL was 10 %–15 % lower than in the FT BB plumes, which is probably attributable to some processes occurring in the MBL such as mixing with marine emitted small particles (e.g. marine sulfate) and aerosol removal by drizzle (Wu et al., 2020). Vertical profiles of submicron aerosol chemical compositions under BB-polluted condition during CLARIFY were previously characterized by Wu et al. (2020), as show in Fig. S5. BB-polluted MBL had higher average sulfate mass fractions (∼ 26 %) than the FT BB plumes (∼ 11 %) around Ascension Island, due to the mixing with marine sulfate. The corresponding profiles of CCN CN3 (Fig. 3d) and CCN Na (Fig. 3e) ratios under the BB-polluted condition were fairly constant with altitude, suggesting that vertical variations of aerosol size and chemical composition did not apparently affect the BB aerosol ability to act as CCN. In this study, the sampled African BB aerosols have undergone week-long transport and are defined as highly aged African BB aerosols (Wu et al., 2020). Compared to freshly emitted African BB aerosols, these highly aged BB aerosols exhibited larger particle sizes, enhanced fractions of inorganics and the loss of organics after atmospheric aging such as chemical oxidation and cloud processing (Wu et al., 2020; Dobracki et al., 2023). Due to atmospheric aging, the CCN activation fractions of these highly aged African BB aerosols (CCN Na = 0.82 ± 0.17, at SS = 0.2 %) are generally higher than fresher BB aerosols sampled over the African continent (CCN Na = 0.68, at SS = 0.3 %) (Ross et al., 2003), but are comparable to transatlantic African BB aerosols observed over Amazon area during the dry season (the average ratio of CCN to aerosol concentrations in a range of 20 nm to 1 µm is 0.83 ± 0.06 at SS = 0.5 %) (Holanda et al., 2020).
In the clean MBL, Wu et al. (2020) presented an average aerosol size distribution, with a CMD of ∼ 30 nm in the Aitken mode and a CMD of ∼ 160 nm in the accumulation mode (red marker in Fig. 3c). The aerosol sizes in the clean MBL were smaller than in the BB-polluted MBL during CLARIFY. The average ratio of Na CN3 in the clean MBL was calculated to be 0.40 ± 0.26, also suggesting that the majority of submicron aerosols detected by the CPC (3 nm to 1 µm) in the clean MBL were Aitken mode particles (< 0.1 µm). The submicron aerosols from marine emissions in the clean MBL were previously reported to be dominated by sulfate (∼ 60 %) and organic (∼ 24 %) (Wu et al., 2020). Although the clean MBL aerosols contained enhanced fractions of sulfate with high hygroscopicity, the average CCN Na (0.83 ± 0.20) was close to those in the BB-polluted MBL (0.82 ± 0.17), suggesting that the CCN activated fractions of accumulation-mode aerosols were similar between the clean and BB-polluted MBL conditions. Under both clean and BB-polluted conditions, the CCN CN3 ratios remained consistently below unity, whereas CCN Na occasionally exceeded unity, implying that a subset of Aitken mode particles (< 0.1 µm) contributed to CCN.
Figure 3f–h show the vertical profiles of cloud properties (Nd, LWC and Re), using a height scale normalized by zi. In this study, we focus on sawtooth profiles that contain a continuous cloud layer from the cloud base to the cloud top. In Flight C032 with cumulus clouds, stepped profiles and SLRs were carried out. The average vertical profiles of cloud properties from flight C032 are also provided in Fig. 3f–h (grey dashed lines). It should be noted that there were broken cumulus clouds sampled below the continuous stratocumulus cloud layer on some days, which are not included in this study. In total, there are 31 and 12 sufficient profiles sampled in the BB-polluted and clean MBL, respectively. The profiles of Nd (Fig. 3f) remain fairly constant, with few cases in the BB-polluted MBL (e.g. profiles in flights C029 and C038) presenting an increase near cloud top. The profiles of LWC (Fig. 3g) generally increased with height from the cloud base and then decreased near the top of the MBL due to droplet evaporation. The profiles of in-cloud Re (Nd > 5 cm−3 and bulk LWC > 0.02 g m−3) generally presented enhanced values from the cloud base to the top (Fig. 3h). SEVIRI-retrieved Nd and Re were averaged along the cloud sampling tracks of the CLARIFY flights. For comparison, cloud-top-layer (uppermost 50 m) Nd and Re were summarized from CDP measurements. As shown in Fig. 4, SEVIRI retrievals and CDP measurements show overall good agreement around Ascension Island. The agreement for Re is weaker in low-Nd cases, since the CDP detects cloud droplets below 50 µm and larger droplets beyond its detection range may lead to discrepancies (Abel et al., 2020). In-situ and SEVIRI observations consistently indicate higher Nd and smaller Re values in the BB-polluted MBL compared with the clean MBL.
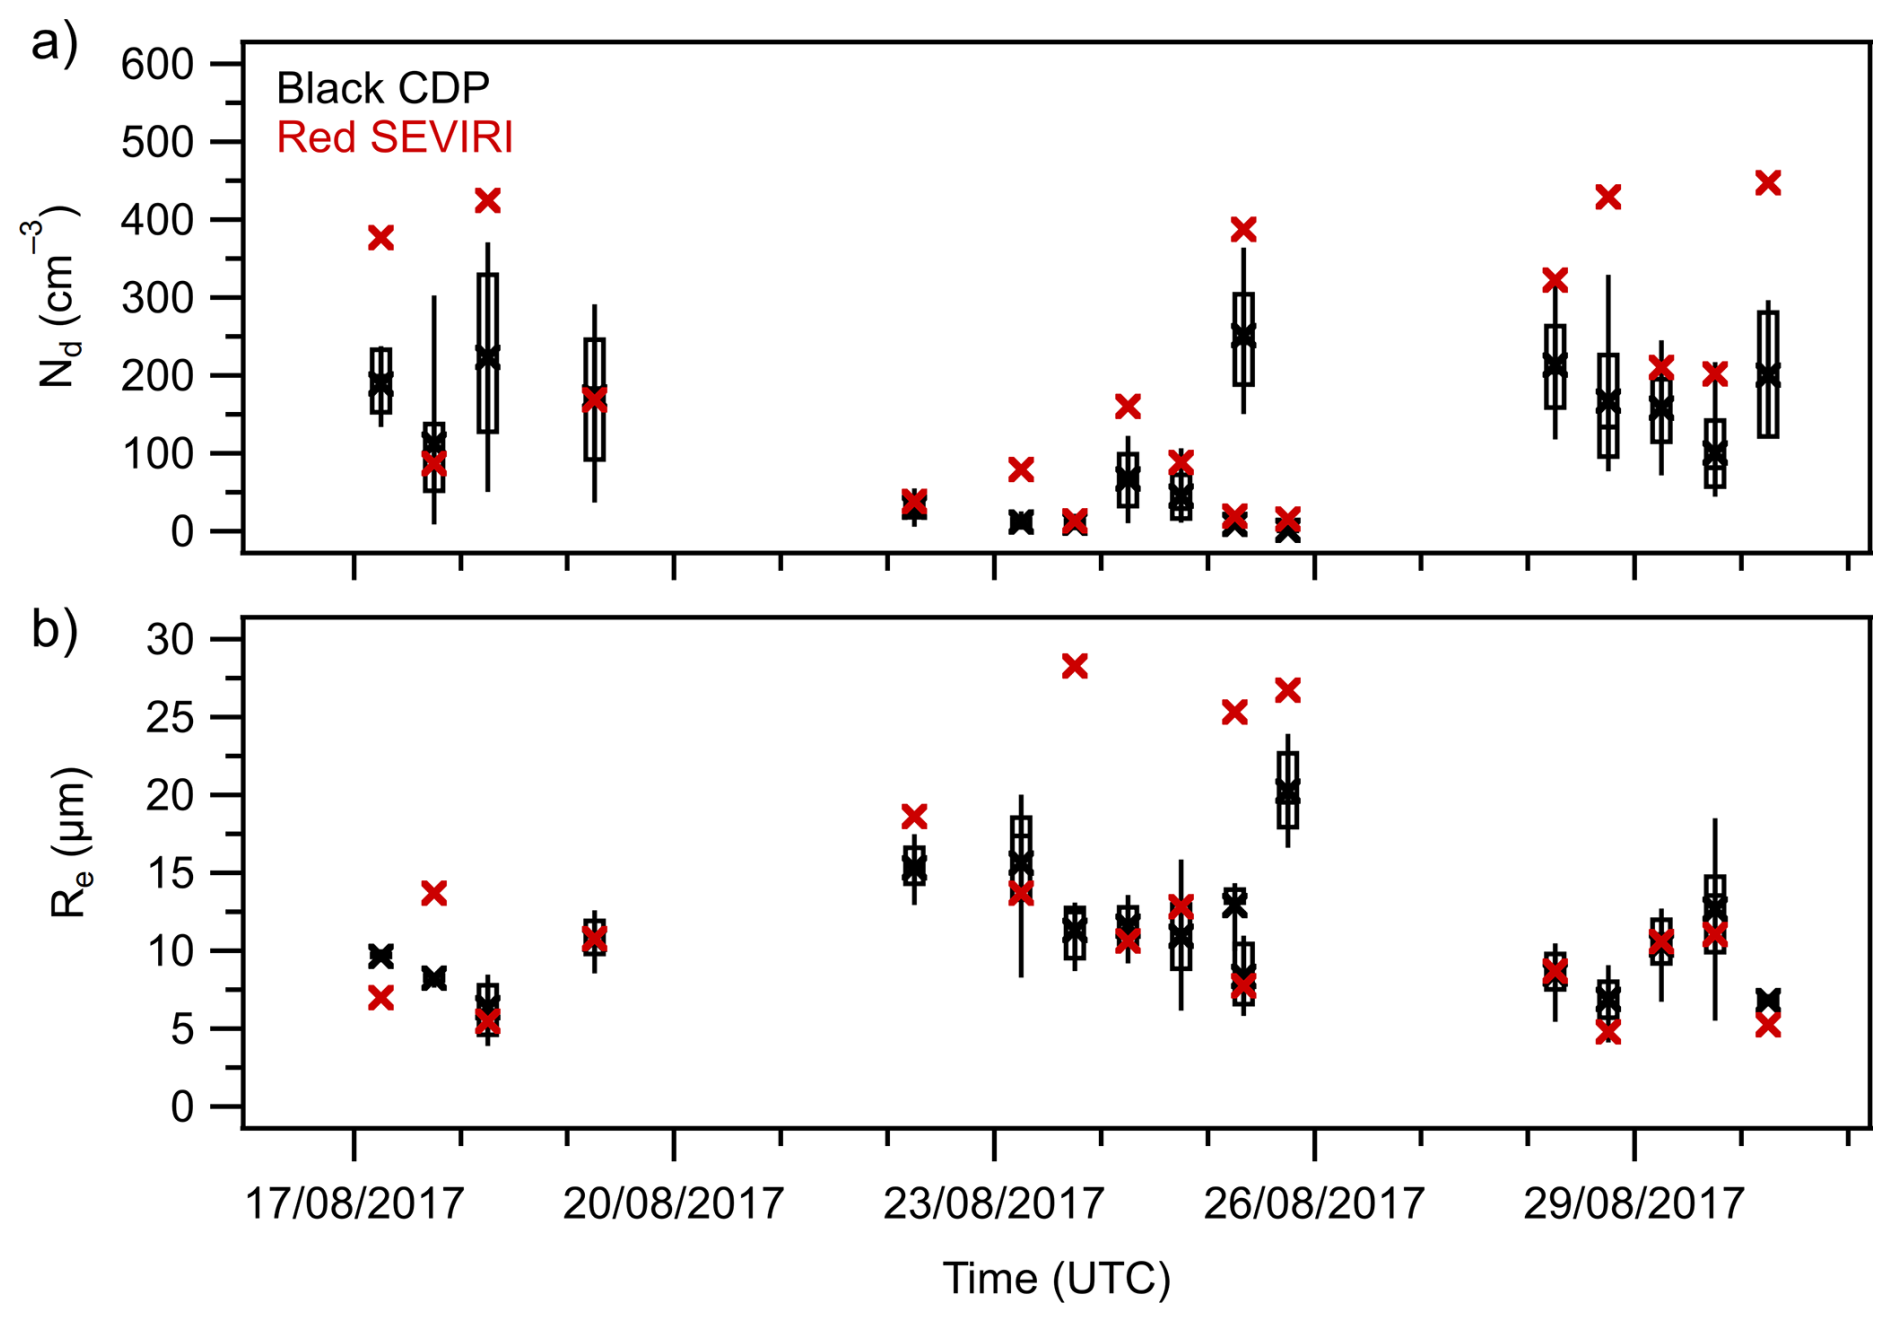
Figure 4Average SEVIRI-retrieved (a) Nd and (b) Re along the cloud sampling tracks of some CLARIFY flights (C028 to C046), and comparison the corresponding cloud-top-layer Nd and Re from CDP measurements. Red markers show average values from SEVIRI. Black markers, boxes and whiskers represent averge, 10, 25, 50, 75 and 90 percentiles from CDP measurements.
3.3 Aerosol-cloud interaction around Ascension
In this section, we examine the relationship between aerosols and cloud microphysics over Ascension Island in the remote SEA. Here, we use Na as the metric instead of CCN concentrations to establish the aerosol impact on cloud microphysics, since CCN concentrations depend on cloud supersaturations. In this study, we focus on aerosols in the size above 0.1 µm that behaved as the dominant CCN (as discussed in Sect. 3.2) and impacted cloud microphysics.
3.3.1 Aerosol-Nd relationship
Previous studies suggest two main mechanisms for the activation of aerosols into cloud droplets that typically occur: (1) via updrafts carrying aerosols to the cloud base (cloud base activation) or (2) via entrainment through turbulent mixing at the cloud top (cloud-top activation) (e.g. Hoffmann et al., 2015; Slawinska et al., 2012). Here, we analyzed the cloud-layer mean Nd, Na below the cloud (sub-Na) and above the cloud (above-Na), to examine the relative importance for both activation mechanisms. In each profile with a continuous cloud layer, we averaged the Na within 200 m above the cloud top to obtain the above-Na, and within 200 m below the cloud base to obtain the sub-Na. Figure 5 shows the relationship between cloud-layer mean Nd and Na concentrations for all the analyzed profiles, in terms of sub-Na (Fig. 5a) and above-Na (Fig. 5b), respectively. The Nd exhibited a strongly positive correlation with sub-Na, with a Pearson correlation coefficient (r) of 0.89 (p < 0.01, statistically significant) for all analyzed profiles. The positive correlation between Nd and sub-Na was stronger (r = 0.93, p < 0.01) in the clean or moderately BB-polluted clouds (sub-Na < 700 cm−3), while a weaker correlation was observed in more polluted clouds (sub-Na > 700 cm−3). In contrast, the overall correlation between Nd and above-Na was weak but statistically significant when considering all analyzed profiles (r = 0.41, p < 0.01). For polluted FT cases (circle markers in Fig. 5b), the Nd exhibited a fairly positive correlation with above-Na (r = 0.74, p < 0.01) when above-Na was < 2000 cm−3, while the correlation became weaker when above-Na was > 2000 cm−3. These results suggest that the influence of above-Na on cloud properties was weaker than sub-Na at the place/time of observation, indicating that cloud base activation of Na played a considerably greater role as compared to cloud-top activation of Na through entrainment. Particularly, the cloud base activation of Na could play a dominant role, on observation days characterized by a clean FT but BB-polluted MBL (triangle markers in Fig. 5).
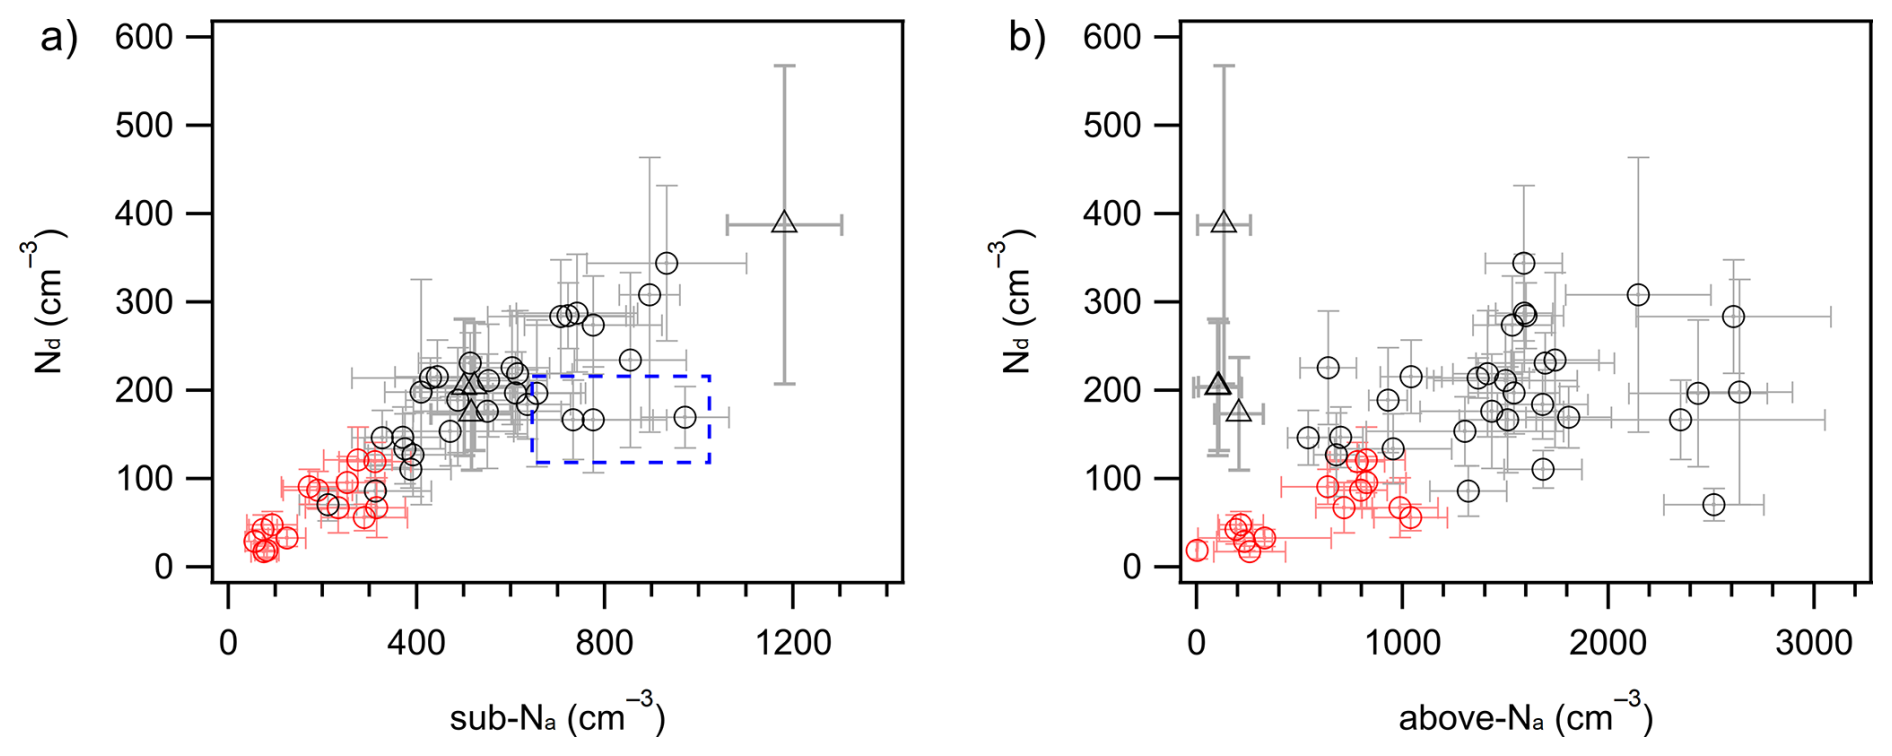
Figure 5Relationships between cloud-layer mean Nd and Na for all profiles, in terms of (a) sub-Na and (b) above-Na. The markers and error bars represent the average values and standard deviation for each profile. Black triangle and circle markers are from the BB-polluted MBL in Periods 1 and 3, respectively, and red circle markers are from the clean MBL in Period 2. The blue dashed box represents the contact profiles that outline the central relationship between Nd and sub-Na and had average LWC aLWC values close to 1.
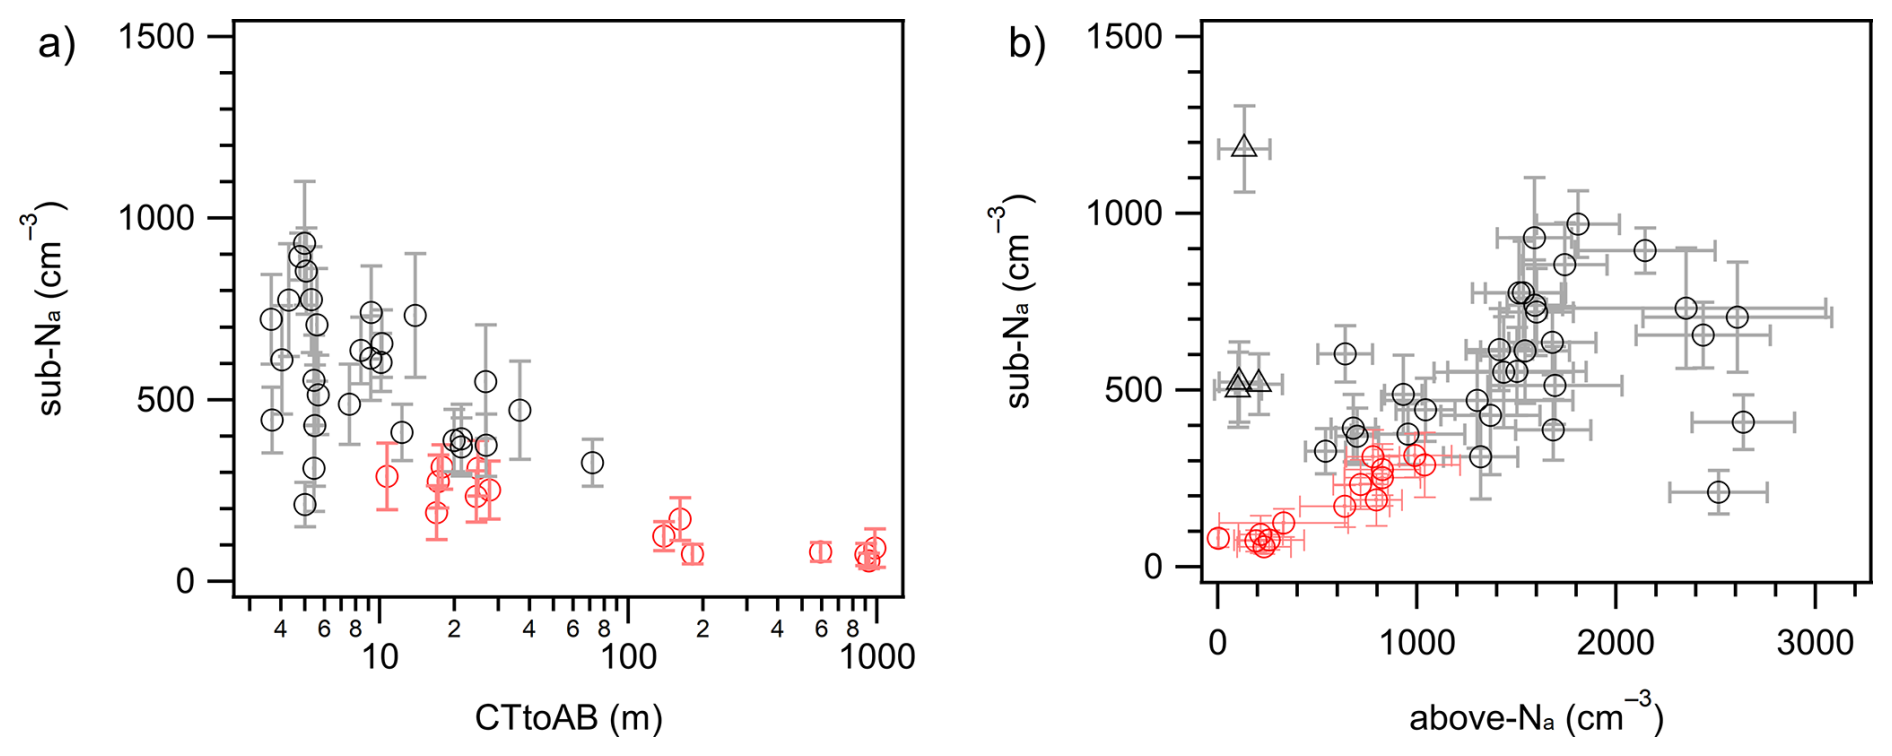
Figure 6Relationships (a) between sub-Na and the distance from the top of the MBL cloud layers to the bottom of the FT BB layers (Cloud Top to Aerosol Base, CTtoAB); (b) between sub-Na and above-Na. The markers and error bars represent the average values and standard deviation for each profile. Black triangle and circle markers are from the BB-polluted MBL in Periods 1 and 3, respectively, and red circle markers are from the clean MBL in Period 2.
Previous studies similarly reported a higher positive correlation between Nd and below-cloud aerosols than above-cloud aerosols, e.g. over the SEA BB-polluted region near African western offshore (Diamond et al., 2018) and over the Pacific BB-polluted region (Mardi et al., 2019). The disconnectedness between Nd and above-Na is partly due to the gap between FT aerosol layers and the cloud layer (Mardi et al., 2019). The bottom of the FT BB layer was defined as the lowest altitude of the plume where observed Na exceeded 500 cm−3 (Gupta et al., 2021). The distance from the top of the MBL cloud layers to the bottom of the FT BB layers is referred to as Cloud Top to Aerosol Base (CTtoAB). Figure 6a shows the relationship between sub-Na and the CTtoAB. An overall negative correlation was observed between sub-Na and CTtoAB. Separated profiles (CTtoAB > 100 m) all occurred within the clean MBL, with a low range of sub-Na (56–125 cm−3) (Fig. 6a). The large gap observed on these days separated the elevated BB layers from the cloud layer and hence weakened the effects of above-Na on cloud microphysical properties. Figure 6b shows the relationship between sub-Na and above-Na for all analyzed profiles. When contact profiles (CTtoAB < 100 m) occurred within the clean MBL, they presented higher sub-Na (172–315 cm−3) than separated profiles (56–125 cm−3) within the clean MBL. Example vertical structures of Na, LWC, and θl in separate and contact profiles within the clean MBL are shown in Fig. S6. In the separate profile (Fig. S6a), Na remained low and fairly constant throughout the entire MBL column, whereas in the contact profile (Fig. S6b), Na was slightly elevated below the cloud compared to the surface well-mixed layer. These results suggest that the proximity of FT BB plumes to the cloud top allows them to impact the sub-cloud Na budget at the place of observation. Similar results have also been reported in other SEA studies near the western offshore of Africa (Gupta et al., 2021, 2022). The interconnectedness between sub-cloud and above-cloud regions for these contact profiles is attributed to the entrainment process of BB aerosols from the cloud top to below the cloud at the place of observation, as suggested in previous studies (Diamond et al., 2018). Most contact profiles (34 out of 42) occurred within the BB-polluted MBL, which had a broad range of sub-Na (212–1183 cm−3). For these contact profiles within the BB-polluted MBL, the increase in sub-Na is not only related to the entrainment process at the place of observation, but also previously entrained African BB aerosols from above-cloud to below-cloud regions over the SEA during long-range transport (Haywood et al., 2021). It should be noted that the entrainment process is time-dependent and relies on factors such as the entrainment rate and the time duration since the aerosol and cloud layer have come into contact (Diamond et al., 2018), which would prevent an instantaneous correlation and consequently lead to the weak correlation between Nd and above-Na at the place/time of observation. It is also important to highlight observation days that exhibited a clean FT but a BB-polluted MBL (triangle markers in Figs. 5b and 6b). The increase in amounts of MBL BB aerosols on these days would be predominantly due to previously entrained African BB aerosols along the long-range transport. This suggests that previously entrained BB aerosols during long-range transport are more likely to impact the sub-cloud Na budget than the entrainment of local FT layers at the place of observation, further resulting in a weak correlation between Nd and above-Na.
During CLARIFY, the BB-polluted MBL had substantially enhanced sub-Na (212–1183 cm−3, black markers in Fig. 5a) compared to the clean MBL (56–315 cm−3, red markers in Fig. 5a). The main contributor to the sub-Na in the clean MBL was local marine emissions. The increase in the sub-Na is hypothesized to be the entrained BB aerosols from above-cloud to below-cloud regions during long-range transport or/and at the place of observation. More details on the long-range transport and entrainment processes of African BB aerosols are discussed in Sect. 3.4. The enhanced values and broader range of sub-Na in the BB-polluted MBL led to substantially higher and more variable Nd values as compared to the clean MBL (Fig. 5a), showing that transported BB aerosols promote droplet activation and cloud formation in this region. The relationship between Nd and sub-Na follows a similar pattern in clean or moderately BB-polluted clouds (sub-Na < 700 cm−3). The weaker correlation between Nd and sub-Na under more polluted conditions (sub-Na > 700 cm−3) may be partly due to the variability in the MBL updraft velocity. ORACLES Observations near African west coast suggests that in a more polluted MBL, defined as the velocity-limited regime, cloud droplet formation is more sensitive to fluctuations in updraft velocity than to fluctuations in aerosol concentration (Kacarab et al., 2020). When a high concentration of aerosols or CCN is present, there is a strong competition between them for water vapor. The increase in updraft velocity may augment supersaturation levels, thereby playing a more important role in driving droplet formation than the increase in aerosol concentration under polluted conditions (Kacarab et al., 2020). Additionally, differences in the strength of cloud-top entrainment processes may contribute to observed bias in the response of Nd to sub-Na. Adiabatic LWC (aLWC) was calculated for each cloud profile, and the ratio of LWC to aLWC (LWC aLWC) was averaged over the cloud layer to assess the extent of cloud-top entrainment mixing or/and the presence of drizzle (Gupta et al., 2021). When contact profiles had average LWC aLWC values close to 1, this suggests near-adiabatic profiles with negligible mixing between cloudy and non-cloudy air. In contrast, other contact profiles had lower average LWC aLWC values (0.34–0.83), indicating greater entrainment mixing of aerosols from above-cloud into the cloud layer at the place of observation. Notably, some of the near-adiabatic profiles (blue dashed box highlighted in Fig. 5a) displayed lower droplet activation fractions at similar sub-Na levels, compared to other profiles. Although cloud-top entrainment of warmer, drier FT air could cause cloud droplet evaporation, our observations suggest that contact profiles with greater entrainment of BB-polluted FT air generally promoted additional droplet activation and enhanced Nd, compared to near-adiabatic profiles.
For applications in remote sensing retrievals and climate models, parameterizations of Nd based on Na have been suggested using various schemes, e.g. linear regression (Hegg et al., 2012) or exponential power law (Twohy et al., 2013) depending on in-situ measurements. We quantified the Nd response to sub-Na by a frequently used power law relationship (Nd ∼ ). The exponent β can be thought of as the fractional increase in Nd in response to the fractional increase in Na (> 0.1 µm) (McComiskey and Feingold, 2008). For all BB-polluted MBL profiles, analysis using bootstrap resampling yielded median values (95 % confidence interval) of α = 3.18 (0.56–13.44) and β = 0.71 (0.42–0.92). For all clean MBL profiles, the values were α = 2.17 (0.22–7.32) and β = 0.74 (0.42–1.03). It should be noted that the data from clean MBL profiles exhibit small-scale variation, which may limit the robustness of the derived power law relationship. Since droplet activation displayed similar behavior in clean and moderately BB-polluted clouds (sub-Na < 700 cm−3) (Fig. 5a), a strong linear correlation (r2 = 0.87) was observed between log(Nd) and log(sub-Na). Data in this aerosol-limited droplet activation regime (sub-Na < 700 cm−3), yielded α = 0.64 (0.20–1.28) and β = 0.93 (0.79–1.04), which we recommend as representative parameters for application in future studies. Our observations suggest a small difference in the response of Nd to Na between BB-polluted and clean MBL profiles. This is likely due to their comparable CCN activation abilities of accumulation-mode aerosols under two MBL conditions (as discussed in Sect. 3.2). In contrast, a previous study reported higher droplet activation fractions for the cleaner MBL compared to the BB-polluted MBL over the Pacific Ocean (Mardi et al., 2019). The discrepancy likely stems from differences in their droplet activation behaviors of transported BB aerosols between the studies. The β value for BB-polluted MBL cases in this study (0.71 (0.42–0.92)) is in a higher range than that reported for BB-polluted areas off the California coast of North America (0.26 (0.15–0.42)) in Mardi et al. (2019). A key factor contributing to the different droplet activation behaviors of transported BB aerosols, may be the variability in aerosol chemical composition and CCN activity, which depends on source combustion conditions and aging process (Wu et al., 2020; Farley et al., 2025). Submicron BB aerosols from western U.S. wildfires have been reported to be dominated by organic (∼ 90 %) with minimal inorganic content (< 2 %) from near-source to regional scales (0.5 h to several days) (Farley et al., 2025). In contrast, highly aged African BB aerosols were reported to contain ∼ 35 % inorganic mass (Wu et al., 2020). This implies that highly aged African BB aerosols are more hygroscopic, as inorganics typically have higher hygroscopicity than organics on a global scale (Pöhlker et al., 2023). Additionally, transported BB aerosols from western U.S. wildfires presented similar accumulation-mode aerosol size distributions to this study (Laing et al., 2016). Consequently, the CCN activation ability of transported African BB aerosols in this study is broadly higher than that reported for aged BB aerosols from Western/Northern American wildfires (CCN CN = 0.11–0.62, at SS = 0.2 %–0.5 %) (Pratt et al., 2011; Zheng et al., 2020), leading to the observed differences in their Na–Nd relationship between these studies. Overall, these results highlight regional variability in the sensitivity of droplet formation to aerosol concentration in different BB-polluted environments, emphasizing the need for region-specific parameterizations of Nd based on Na when simulating regional radiative forcing.
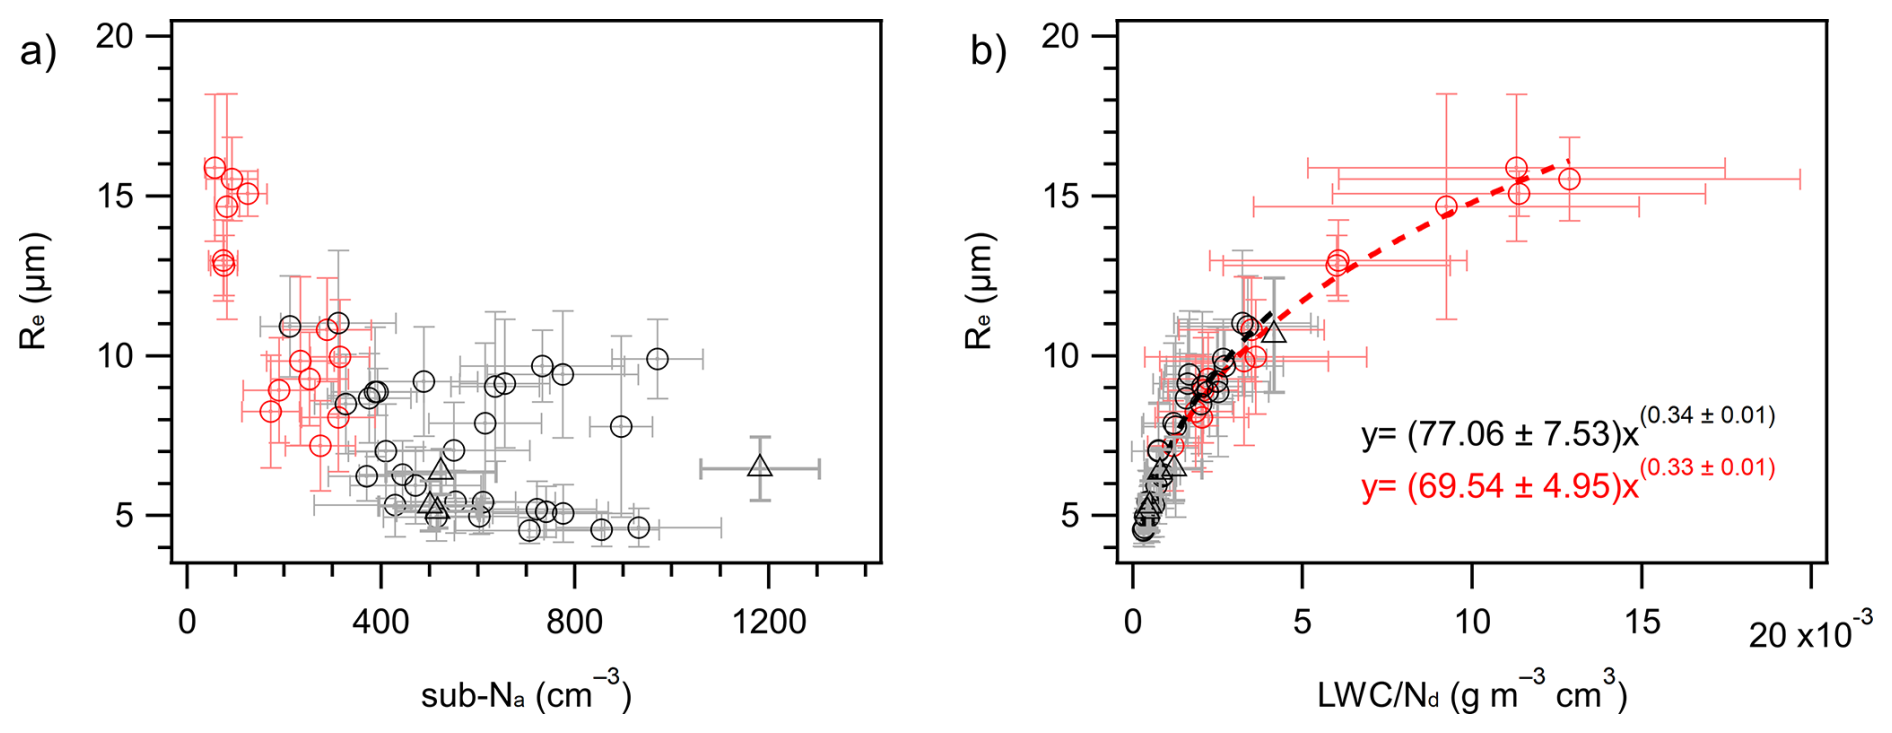
Figure 7(a) Relationship between cloud-layer mean Re and sub-Na for all analyzed profiles. (b) Relationship between cloud-layer mean Re and the average ratio of LWC Nd for all analyzed profiles. The markers and error bars represent the average values and standard deviation for each profile. Black triangle and circle markers are from the BB-polluted MBL in Periods 1 and 3, respectively, and red circle markers are from the clean MBL in Period 2.
3.3.2 Re relationship with Na and Nd
The Re is one of the key variables that determine the radiative properties of liquid water clouds, and the parameterization of Re in climate models is critical for assessing global radiative forcing. Figure 7a shows the relationship between cloud-layer mean Re and sub-Na for all the analyzed profiles, and Fig. S7a is for cloud-top-layer Re and sub-Na. LWP values integrated from the analyzed cloud profiles were in a larger range for the BB-polluted MBL (11.1–161.3 g m−2) than the clean MBL (25.1–63.0 g m−2). Although the LWP is indicated to be generally higher in the BB-polluted MBL than the clean MBL, the intrusion of BB aerosols led to a significantly smaller range of Re as compared to the clean MBL, consistent with the Twomey effect (Twomey, 1977). The relationship between Re and sub-Na (Fig. 7a) shows a weaker correlation than that between Nd and sub-Na (Fig. 5a), likely due to the influence of additional atmospheric factors such as the MBL thermodynamic structure, cloud depth, cloud-top entrainment process, etc (Wood, 2012; Herbert et al., 2020). In Figs. 7a and S7a, there are some profiles displaying smaller fractional decrease in Re in response to the fractional increase in Na (> 0.1 µm) compared to the other profiles. These profiles were mainly observed on days with larger temperature differences between the surface and upper layers of the MBL relative to the other profiles, potentially supporting stronger updrafts and thereby the development of thicker cloud layers and larger cloud droplets (Wood, 2012). A generally positive relationship between the cloud-top-layer Re and cloud-layer depth is shown in Fig. S7b. Cloud-top entrainment processes may also explain the variability in the response of Re to sub-Na, since the mixing of warm and dry FT air into the clouds would reduce LWC and limit condensational growth, thereby constraining the droplet size (Wood, 2012). Figure S7c shows the relationship between cloud-layer mean Re and average LWC aLWC ratio for all the analyzed profiles. Cloud layers with negligible entrainment mixing (average LWC aLWC values, ∼ 1) present generally larger Re values compared to those with greater entrainment mixing (lower average LWC aLWC, < 0.83). Herbert et al. (2020) conducted large-eddy simulations and reported diurnal cycles of cloud thickness and LWP over the SEA, with both reaching their maximum at dawn and minimum shortly after midday. Thus, variations in the observation times of the day, which ranged from 09:00 to 16:00 UTC during the campaign, may also contribute to the observed variability in the response of Re to sub-Na.
Various studies have generated a power law parameterization between Re and specific cloud water content (the ratio of LWC Nd) (Re ∼ a (LWC Nd)b), for use in climate models. Figure 7b shows the relationship between cloud-layer mean Re versus the average ratio of LWC Nd for all analyzed profiles. BB-polluted and clean MBL profiles yielded similar exponent (b) values of (0.34 ± 0.01) and (0.33 ± 0.01), respectively, which are close to the exponent (∼ 0.33) validated in previous BB aerosol-cloud studies such as in Amazon (e.g. Reid et al., 1999). Previous studies have reported a theoretical exponent of b = for adiabatic clouds, where droplet growth is dominated by condensation without entrainment (Burnet and Brenguier, 2007). In this study, the estimated ratios of LWC aLWC (∼ 0.3–1, Fig. S7c) suggest the occurrence of entrainment mixing, nevertheless, the empirical b values near or slightly exceed ∼ . This indicates that entrainment processes were likely dominated by homogeneous mixing, which could proportionally reduce LWC and Nd and thus preserve b ∼ , particularly in clean cases (Burnet and Brenguier, 2007). In BB-polluted cases, entrainment of aerosol-rich air may also supply additional CCN, increasing Nd disproportionately to LWC reduction. This entrainment of additional CCN could yield cases with b > in this study. A key issue in the use of (Re ∼ a (LWC Nd)b) is the speciation of the pre-factor “a” (Liu and Daum, 2000), which is also similar for the BB-polluted (77.06 ± 7.53) and clean MBL profiles (69.54 ± 4.95). When combined, all the data in this study from clean and BB-polluted MBL profiles yielded a = 68.54 ± 3.05 and b = 0.33 ± 0.01. Field observations from this and previous work have tested similar power law schemes, suggesting that the parametrizations of Re ∼ a (LWC Nd) may exhibit consistent skill for varying degrees of BB pollution influence.
3.4 Vertical transport history of observed MBL pollutants
3.4.1 Entrainment area
In previous sections, NAME dispersion simulations evidence that both FT and MBL pollutions observed over Ascension Island were attributable to the long-range transport of African BB aerosols (Sect. 3.1). Observational results around Ascension Island also highlight strong impacts of these transported BB aerosols on cloud properties over the remote SEA (Sect. 3.2 and 3.3). In this section, we further employed instantaneous 3D air parcel footprints from NAME dispersion simulations to examine vertical transport history of air parcels from Africa to the remote SEA, which is under-constrained in current models. Here, we focus on the three cases studies (Cases 1 to 3), with release times indicated by red markers in Fig. 2a. These cases illustrate distinct and representative transport pathways of original air parcels for three periods. Case 1 released tracers in the middle of Period 1 (12:00 UTC, 18 August). Cases 2 and 3 released tracers near the start of Periods 2 (12:00 UTC, 21 August) and 3 (12:00 UTC, 26 August), respectively, coinciding with shifts in MBL pollution conditions observed over Ascension Island. Case 2 is a reference clean-MBL case for comparison with BB-polluted MBL cases (Cases 1 and 3). For the three NAME cases, we employed estimated zi to divide the column-integrated horizontal footprints (Fig. 8a–c) into the FT (Fig. 8d–f) and BL (Fig. 8g–i) footprints separately, distinguishing original air parcels as either from the FT or BL. Figure 8 indicates that airmasses arriving at Ascension Island area could originate from both FT and BL during long-range transport. Original BL air parcels (Fig. 8g–i) were consistently transported from the southeast to northwest over the SEA and arose from a fairly clean oceanic region. It is the difference of original FT air parcels that contributed to BB pollution conditions. BB-polluted MBL cases (Cases 1 and 3, Fig. 8d and f) received original FT air parcels mostly from the African continent (20° S–0° N), which could bring BB plumes from seasonal wildfires, while the clean MBL case (Case 2, Fig. 8e) mainly received clean oceanic air.
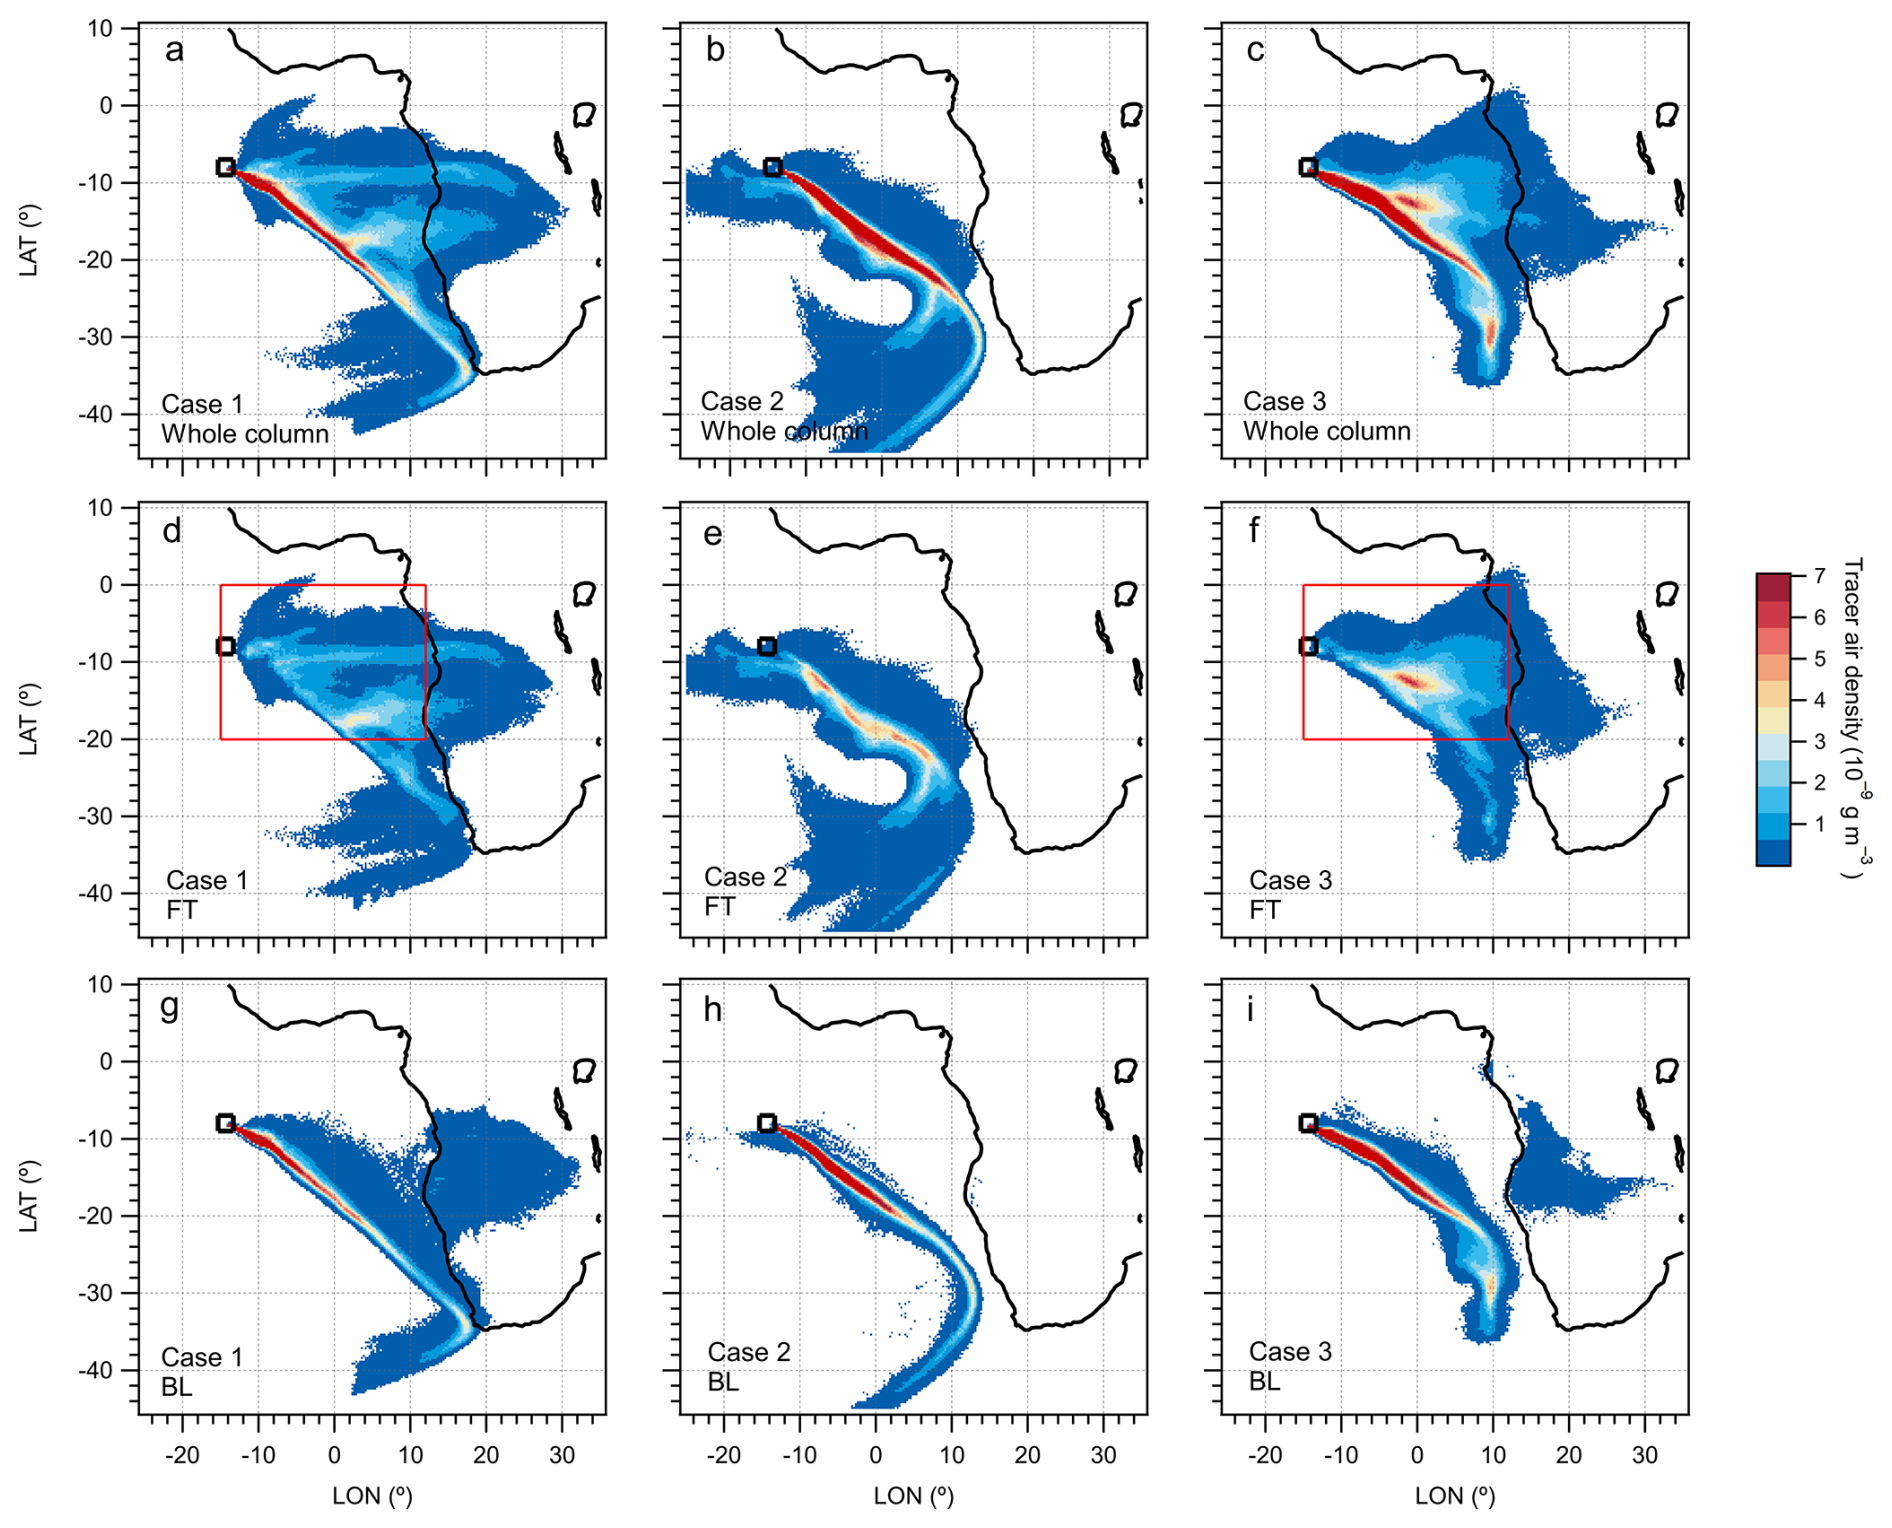
Figure 8The 7 d backward-dispersion of three cases, based on the output of 3D air parcel footprints from NAME simulations. Panels (a)–(c) are column-integrated horizontal footprints for (a) Case 1, (b) Case 2 and (c) Case 3. Panels (d)–(f) are dispersion results attributed to FT for (d) Case 1, (e) Case 2 and (f) Case 3. Panels (g)–(i) are dispersion results attributed to BL for (g) Case 1, (h) Case 2 and (i) Case 3. All plots are shown in the same colour scale. The black boxes represent the release locations of Ascension Island. The red boxes in panels (d) and (f) represent the horizontal grids (covering the area of 20° S–0° N, 15° W–12° E) used for integrating within each vertical layer to derive the vertical distribution of dispersed air parcels in Fig. 9.
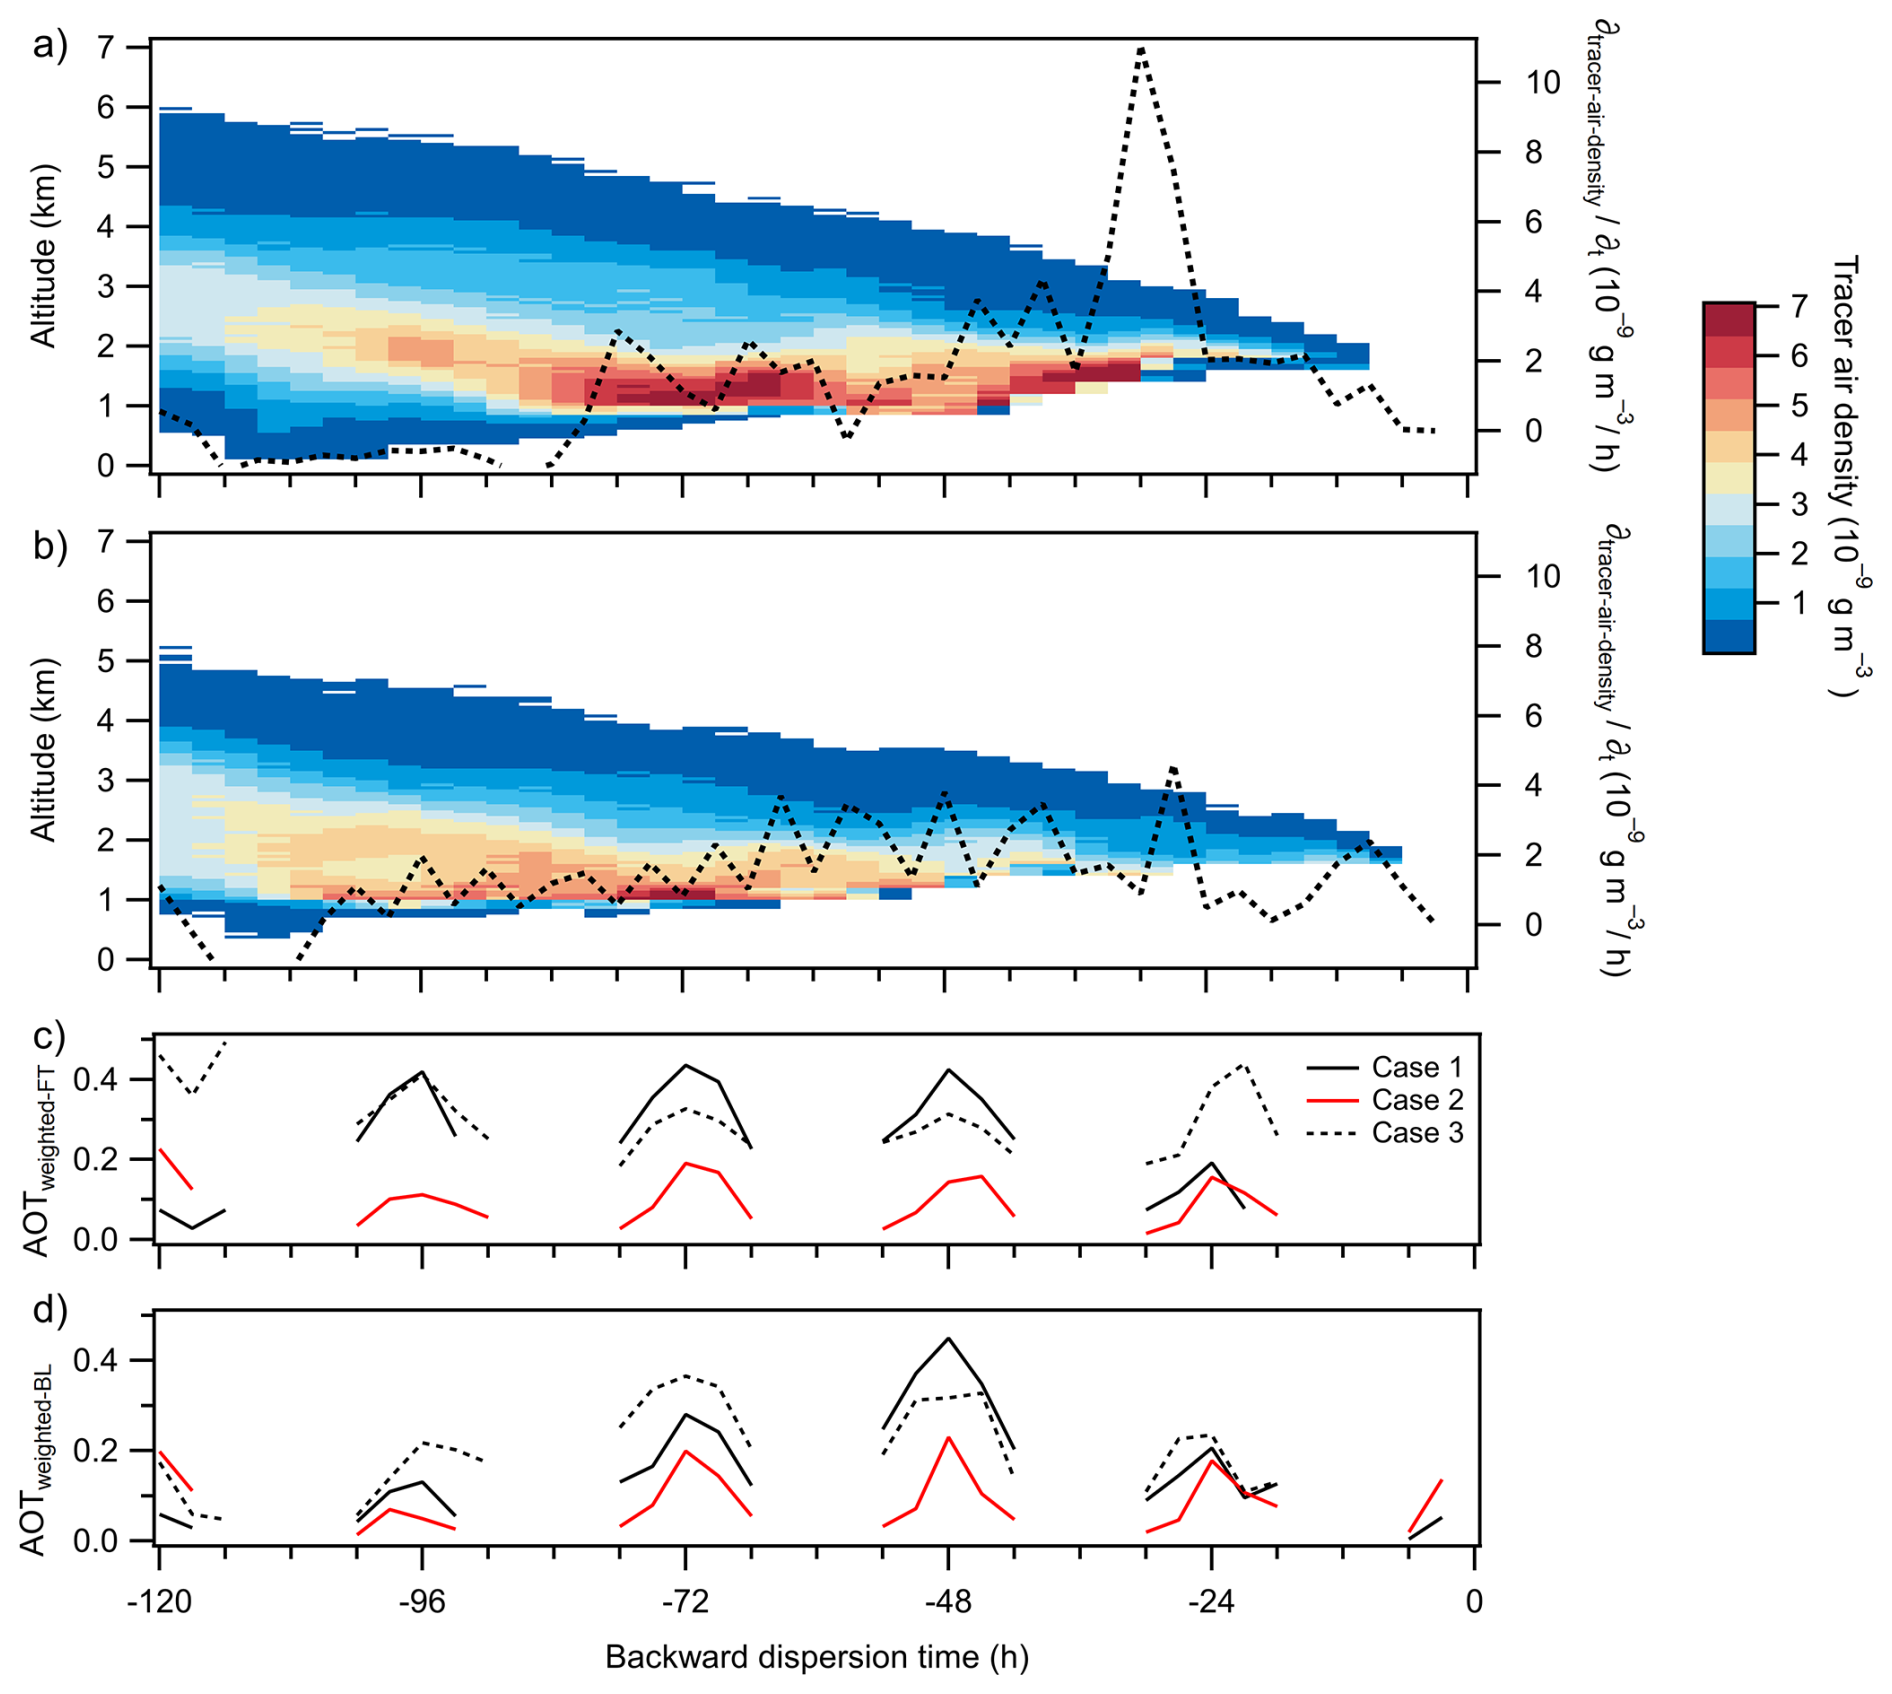
Figure 9(a–b) Time series of the vertical distributions of air parcels dispersed into the FT region (covering the horizontal area of 20° S–0° N, 15° W–12° E, see red box in Fig. 8), in terms of backward dispersion time from 3 to 120 h. The right axis (dashed black lines) are the corresponding 3-hourly exchange rates of air parcels dispersed between the FT and MBL, calculated by dividing the increase in dispersed FT air parcels by the dispersion time along backward simulations. Panel (a) is for Case 1 and panel (b) is for Case 3. (c–d) The air-density-weighted AOT co-located with (c) FT and (d) BL footptints along the backward-simulation time, for three cases.
For BB-polluted MBL cases (Cases 1 and 3), the instantaneous horizontal fields (midday-step footprint in Figs. S8 and S9) show that FT air parcels from the African continent moved westward toward the SEA region. To arrive in the MBL over Ascension Island, there should be African air parcels entraining from the FT into the MBL over the SEA. We co-located NAME transport pathways with SEVIRI retrievals, to identify the efficient entrainment regions where FT air parcels from Africa are likely to enter the MBL over the SEA. First, we analyzed the vertical distributions of air parcels that were dispersed into the FT region (covering the horizontal area of 20° S–0° N, 15° W–12° E) along the backward-simulation time, for two BB-polluted MBL cases (Fig. 9). The corresponding exchange rates (black dashed lines in Fig. 9) and the cumulative exchange amounts (black dashed lines in Fig. S10) of FT air parcels along the backward-simulation time were also calculated, to indicate the mixing conditions of African air parcels from the FT into the MBL over the SEA. These results suggest that FT air parcels from African sources spanning a wide range of altitudes were generally descending over the SEA before reaching the release area, and the MBL was deepening further offshore, which has been also identified in previous work (e.g. Das et al., 2017). FT air parcels can be entrained into the MBL when meeting the BL top. FT air parcels are suggested to be mostly mixed into the MBL in the last ∼ 2 d for Case 1 (Figs. 9a and S10a) and in the last ∼ 3 d for Case 3 (Figs. 9b and S10b) before arriving at Ascension Island. The mixing rates of FT air parcels into the MBL are suggested to vary between two BB-polluted MBL cases. There is a marked maximum in the exchange rate of FT air parcels for Case 1, whereas Case 3 shows a steadier and continuous mixing. For a given zi and FT particle concentration, the rate of increase in MBL particle concentration is suggested to be dependent on the entrainment rate (ωe) (Wood and Bretherton, 2004; Diamond et al., 2018). The discrepancy between two cases suggests that entrainment rates in Case 1 were generally higher than Case 3, accounting for the stronger mixing in Case 1. Overall, NAME results of BB-polluted MBL cases indicate that efficient mixing of FT air parcels into the MBL would occur multiple days over the SEA during their westward movement from the African continent to the Ascension Island area. Combining the instantaneous fields (Figs. S8 and S9), the main area where the efficient mixing occurred is suggested to be located west of 0° E for examined cases.
To confirm FT BB pollution conditions along the simulated transport pathways, we performed a statistical analysis of the SEVIRI-retrieved above-cloud AOT (hereafter referred to as AOT) co-located with NAME horizontal footprints, at 3-hourly backward step. Examples of the co-location relationship between AOT and NAME instantaneous horizontal footprints are shown in Fig. S11. The parts of the scene that are co-located with the contemporaneous horizontal footprints from NAME simulations are highlighted. The air-density-weighted AOT (AOTweighted) was calculated for the co-located areas following Eq. (8).
Where N is the total number of horizontal air parcel grids for co-located areas, Massi is air parcel concentration (g m−3) in each grid, represents fractional air parcel concentration in each grid relative to the total air parcel density, AOTi is the SEVIRI-retrieved above-cloud AOT co-located with each air parcel grid. It is noted that the air-density-weighted Nd, Re and CTH (Sect. 3.4.2) were also calculated following Eq. (8), with AOT replaced by the corresponding SEVIRI-retrieved parameters. Figure 9c and d show the AOTweighted along the FT and BL air parcel transport pathways, respectively, for the three case studies. High AOTweighted values show the co-located and co-temporaneous abundance of African BB aerosols within the FT column above the cloud layer along the simulated transport pathway. For BB-polluted MBL cases (Cases 1 and 3), the AOT co-located with FT air parcels (black lines in Fig. 9c) remained mostly high during the periods of efficient mixing indicated by the NAME simulations. This indicates that FT BB aerosols existed over the efficient mixing area and so could be entrained from the FT into the MBL if the bottom of FT BB layer is near the cloud top. Along BL transport from southeast to northwest over the SEA, the AOT co-located with BL air parcels (black lines in Fig. 9d) was enhanced when approaching the region of efficient mixing of FT air parcels (west of 0° E). This further indicates that once FT BB aerosols could entrain into the MBL over efficient mixing periods, they could be subsequently advected by the MBL south-easterly winds toward Ascension Island area. Since the above-cloud AOT is a column integrated abundance and the aerosol layer may be vertically separated from the cloud top, this analysis does not unequivocally demonstrate entrainment of BB aerosols at these locations. Nevertheless, it is a necessary condition that elevated FT aerosol abundance is co-located with regions of efficient entrainment for the MBL to receive inputs of BB aerosols. Meteorological analysis of the SEA in August 2017 supports the connection between FT BB layers and the cloud top (Ryoo et al., 2022). The low-level easterly jet in early and late August allowed the transport of African BB plumes in the low FT and thus the possibility of BB aerosols entrainment into the MBL in efficient mixing area. In comparison, the AOT in the clean-MBL case (Case 2) was continuously low along both FT and BL transport (red lines in Fig. 9c and d), demonstrating a negligible contribution of BB pollution to the MBL over Ascension Island. This is due to a strong mid-level easterly jet in mid-August (Ryoo et al., 2022), leading to a disconnection between FT BB layers and the BL top, thereby suppressing the entrainment of African BB aerosols into the MBL.
Based on NAME simulations and AOT along the simulated transport, the occurrence of BB-polluted MBL over Ascension Island is suggested to be related to two factors. Firstly, African BB plumes aloft need to be transported to the efficient mixing areas (west of 0° E) identified in this study. Furthermore, the transported BB plumes can be entrained into the MBL in efficient mixing areas over the SEA, which depends on the altitude of the African easterly jet and the distances between BB layers and the BL top. The significance of the efficient mixing areas identified in this study lies in the potential for the entrained BB aerosols in these regions to be transported by MBL south-easterly winds to the vicinity of Ascension Island.
3.4.2 Cloud fields along transport
Here, we extend the analysis of SEVIRI-retrieved cloud properties (Nd and Re) along the simulated BL transport from southeast to northwest over the SEA, before arrival at Ascension Island. Comparisons between BB-polluted and clean MBL cases demonstrate the impacts of entrained BB aerosols on a broad cloud field. Similar to the AOT, examples of the co-location relationships between Nd or Re and NAME instantaneous horizontal footprints at a given time step are shown in Fig. S11. The air-density-weighted Nd and Re were calculated for co-located areas along the BL transport, at 3-hourly backward step. Figure 10 shows the evolution of air-density-weighted Nd (Fig. 10a) and Re (Fig. 10b) along the BL transport, for three cases. In the clean MBL case (Case 2), the Nd was consistently low throughout the passage of BL air parcels over the SEA, while the Re generally increased. The evolution of clouds over the SEA is related to meteorological factors such as the evolution of CTH (Painemal et al., 2014). The air-density-weighted CTH was calculated along the BL transport, at 3-hourly backward step (Fig. 10c). In Case 2 (red line in Fig. 10c), the CTH shows an increasing trend along the southeast to northwest transport path over the SEA. Concurrent MBL deepening and enhanced CTH could promote condensational growth, yielding larger droplets at the cloud top (Painemal et al., 2014). This agrees with the observed overall increase in Re along the BL transport. However, as the MBL continues to deepen and the entrainment of dry FT air strengthens, LWC may decrease, explaining the subsequent decline in Re observed from −24 h (Wood, 2012; Ryoo et al., 2022). Moreover, the deeper MBL tends to be decoupled, and the decoupled MBL is likely associated with an increased occurrence of drizzle due to the presence of larger droplets (Jones et al., 2011). The occurrence of drizzle and associated deposition may result in reduced Nd, corresponding to the observed slightly reduction in the vicinity of Ascension Island. For BB-polluted MBL cases (Cases 1 and 3), the Nd (black lines in Fig. 10a) was largely enhanced when FT air parcels from the African continent were suggested to efficiently entrain into the MBL during ∼ 2–3 d prior to arrival at Ascension Island. Although the deepened MBL (black lines in Fig. 10c) with accompanying processes of condensational growth should promote increasing Re (as in the clean MBL case), the Re (black lines in Fig. 10b) was similar along the BL transport. This suggests that the enhanced Nd from entrained BB aerosols promoted a reduction in cloud droplet size, which offsets the growth effects from the deepened MBL. Comparisons between BB-polluted and clean MBL cases show that BB aerosol entrainment would lead to significantly enhanced Nd but reduced Re, modifying cloud fields in broad efficient mixing areas that persist through the SEA region. This modification of cloud properties, which is co-located with the efficient entrainment areas, further supports NAME analysis of the mixing history of African air parcels. Additionally, the modification of the cloud fields by high BB aerosol loadings, imply the important indirect radiative effects of transported African BB aerosols over the SEA. Future studies that integrate aerosol–cloud interaction parameterizations developed in this study will be conducted to improve the assessment of aerosol indirect radiative effects in this region.
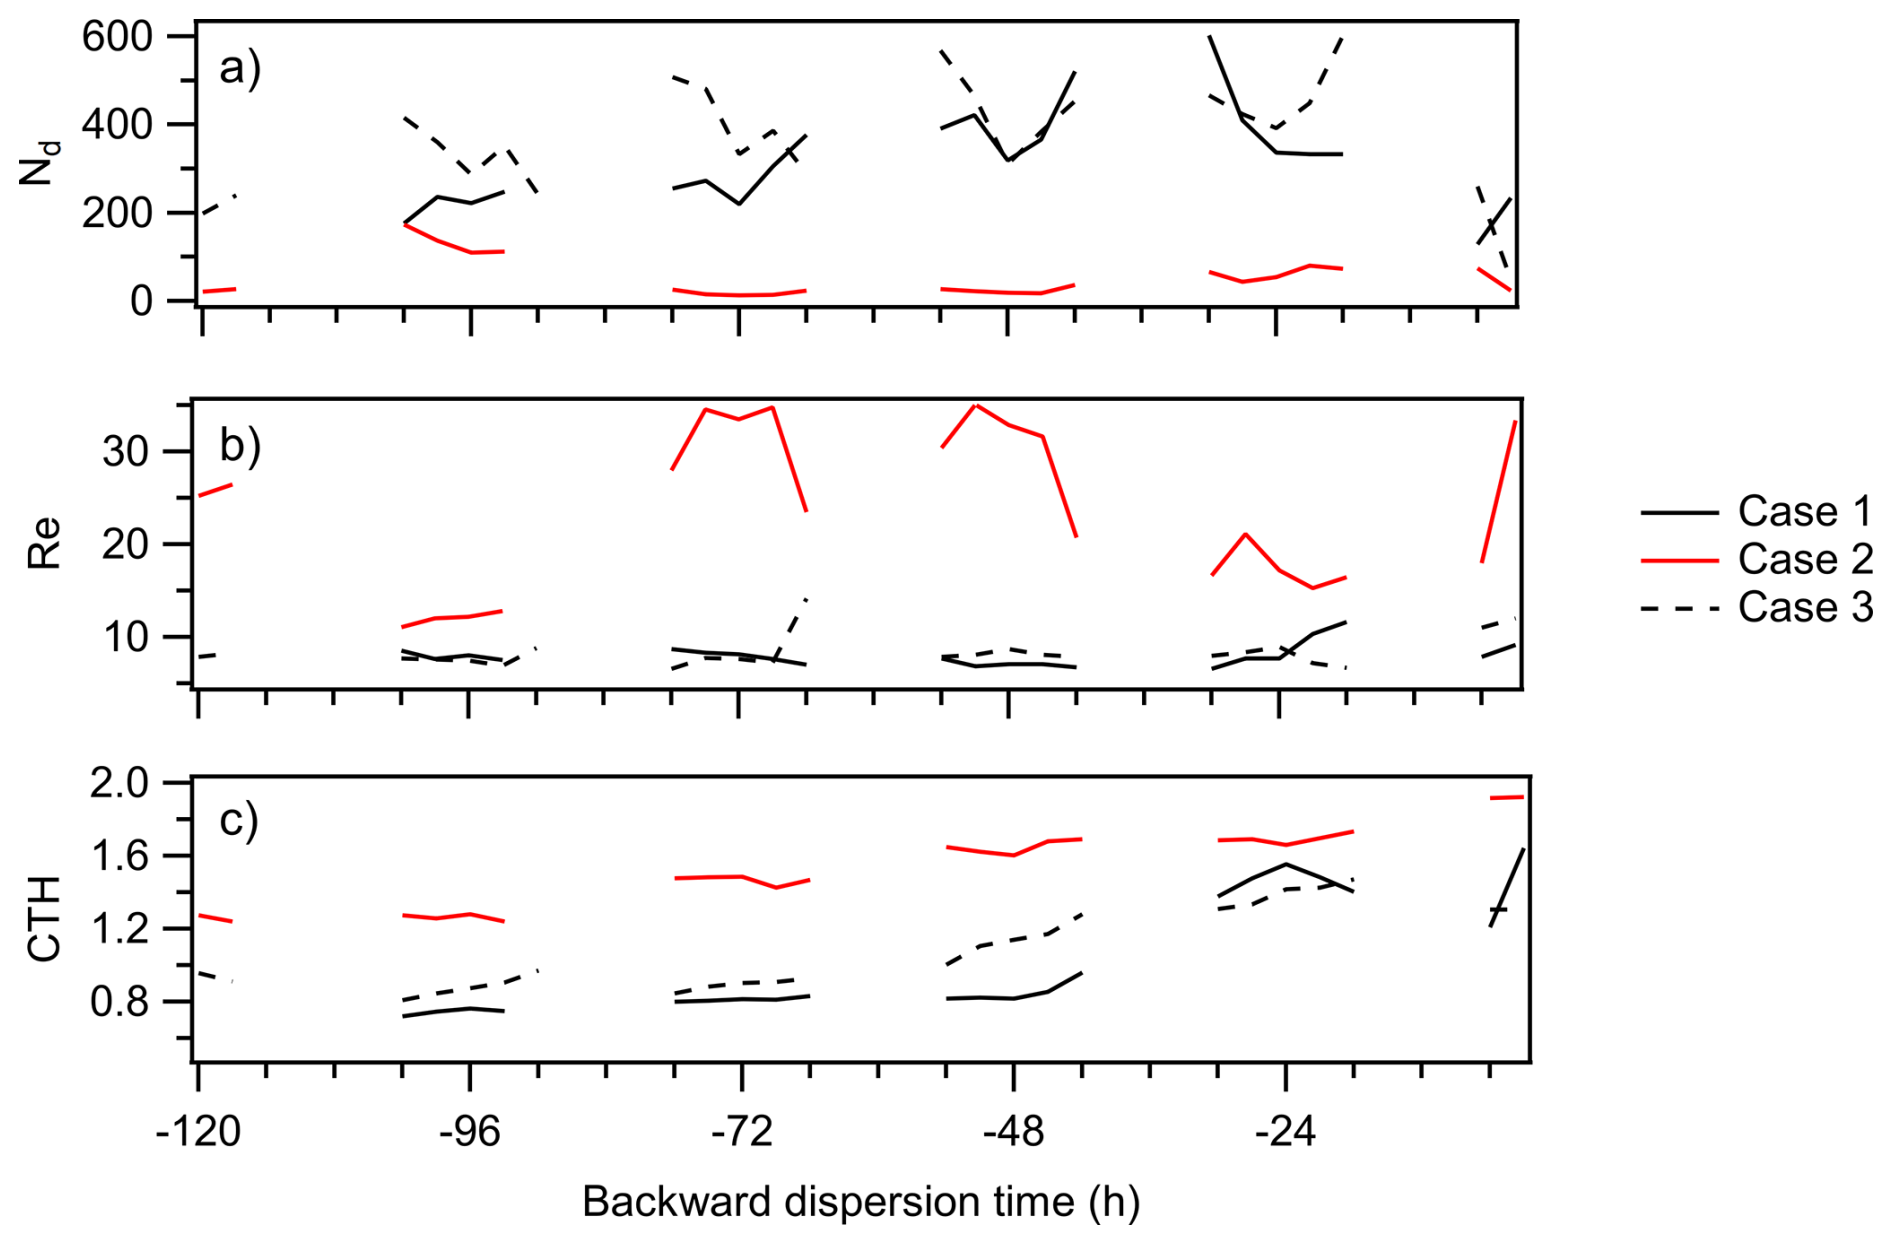
Figure 10The air-density-weighted (a) Nd, (b) Re, (c) CTH from SEVIRI, which are co-located with BL air parcels along the backward-simulation time, for three cases.
By coupling NAME simulations with SEVIRI retrievals (aerosol and cloud fields) along the simulated transport path, we have been able to identify the efficient entrainment areas where African FT air parcels mix into the MBL before reaching Ascension Island. Efficient FT-to-MBL entrainment of African BB aerosols may occur multiple days prior to arrival at Ascension Island and mainly in a region of west of ∼ 0° E over the SEA for the examined cases. Previous model studies have highlighted uncertainty in accurately simulating the vertical distribution of transported African BB aerosols over the SEA and their subsequent climate effects (Das et al., 2017; Shinozuka et al., 2020). These studies emphasized that the transported BB aerosols are predicted to descend to unrealistically low altitudes as they move westward off the African coast. One potential explanation for this sudden subsidence over the SEA is the inadequate representation of a “self-lofting” process in models, where absorption-induced heating from BB aerosols can lift the associated plume layer to higher altitudes (Johnson and Haywood, 2023). The insufficient simulation of this self-lofting process is likely due to the large underestimation of the single scattering albedo (SSA) and subsequent absorption of transported BB aerosols in Earth system models (Mallet et al., 2021). Another potential explanation for the misrepresentation of vertical transport and hence vertical distribution of BB aerosols is related to the resolution of models, as small-scale processes such as turbulence and self-lofting are not explicitly resolved in coarse-resolution models (Das et al., 2017). To improve the simulation of vertical distributions of African BB aerosols over the remote SEA, it is essential to reduce model biases in aerosol properties (e.g. SSA) and vertical processes. Improving the representation of these processes is complex as reducing bias in one property may lead to greater biases in another. The identified efficient entrainment areas in this study could provide further constraints for testing and refining predictions related to BB aerosol transport and vertical distributions over the SEA. Furthermore, the indicated transport and mixing history from NAME simulations are supported by the evolution of aerosol/cloud fields from SEVIRI retrievals, suggesting that high-resolution meteorological fields from the Unified Model could provide a reasonable simulation of the plume descent, which could be employed in future regional model simulations.
In this study, we have characterized the vertical profiles of aerosol and cloud properties around Ascension Island in the remote SEA during the CLARIFY-2017 aircraft campaign and investigated the response of clouds to observed aerosols. We conducted backward-dispersion simulations using the UK Met Office's NAME, which evidences that observed pollutions around Ascension Island originated from long-range transported African BB plumes.
During the campaign, the BB-polluted MBL had substantially enhanced Na compared to the clean MBL around Ascension Island. This resulted in increased Nd and LWC values but reduced Re within BB-polluted clouds compared to clean clouds. A stronger correlation was observed between the cloud layer-mean Nd and sub-cloud aerosol properties (sub-Na), while the Nd was only weakly associated with smoke immediately above the cloud. This suggests that the cloud base activation of sub-cloud Na was more important in determining Nd values than the cloud-top activation of Na at the place/time of observation. The observed increase in the sub-Na is a result of entrained BB aerosols from above-cloud to below-cloud regions along long-range transport or/and the place of observation. We explored possible simplifications to establish relationships between Nd and sub-Na or Re from in-situ measurements. Similar droplet activation patterns (Nd ∼ sub-Na) were observed in the clean and moderately BB-polluted (sub-Na < 700 cm−3) clouds, likely due to the comparable CCN ability of MBL aerosols under the two conditions. However, a weaker Nd-Na correlation was noted in more BB-polluted clouds (sub-Na > 700 cm−3), possibly influenced by additional atmospheric factors such as the cloud-top entrainment and updraft velocity variations. Comparisons between this study and other BB regions indicate that the droplet formation sensitivity to aerosol concentration is varying across different BB-polluted areas, likely due to the variations in CCN ability of BB aerosols. Thus, region-specific parameterizations of Nd based on Na are necessary for accurately simulating regional radiative forcing. The relationship between Nd and Re remained consistent regardless of the levels of BB influence. This study extends previous aerosol-cloud interaction field studies to a wider region over the SEA, which provides important aerosol and cloud parameterizations in climate models for benefiting the assessment of the impacts of transported BB aerosols on clouds and their subsequent climate effects over the remote SEA. Furthermore, the disconnectedness between cloud properties and the above-cloud aerosol layer indicates that satellite-based observations of aerosol-cloud interaction in this region may be subject to large uncertainty, as they are unable to resolve the aerosol properties within and below the cloud layer. This underscores the importance of airborne in-situ measurements in this region to provide direct observations of aerosol-cloud interaction.
NAME simulations allow a discrimination of air parcels in different layers, and this has been used to derive the FT-to-MBL entrainment of African air parcels over the SEA. NAME analysis coupled with SEVIRI-retrievals (aerosol and cloud fields) along the simulated transport suggests that efficient entrainment of African BB smoke from the FT into the MBL occurred multiple days before arrival at Ascension Island, which is mainly in the region to the west of 0° E for examined cases. One significance of the efficient mixing areas identified in this study lies in the potential for the entrained BB aerosols to be further transported by MBL south-easterly winds to the vicinity of Ascension Island. The analysis of SEVIRI-retrieved cloud fields along the simulated transport path also indicates significant modifications in cloud droplet concentrations and sizes within the broad efficient mixing areas of African BB smoke. The efficient entrainment areas identified in this study can provide an important constraint for refining the transport processes and vertical distributions of African BB aerosols over the SEA. More case studies should be conducted to validate this methodology and examine entrainment patterns across different months and years, ultimately to characterize a climatological area for entrainment over the SEA.
Airborne dataset is available from the Centre for Environmental Data Analysis http://catalogue.ceda.ac.uk/uuid/38ab7089781a4560b067dd6c20af3769 (Facility for Airborne Atmospheric Measurements et al., 2017). Airborne data is also available from https://doi.org/10.5281/zenodo.17225248 (Wu et al, 2025).
The supplement related to this article is available online at https://doi.org/10.5194/acp-25-16589-2025-supplement.
HC and JH designed the research; JWT, SJA, PB, JT and KB performed field experiments; HW, JWT and JT prepared in-situ datasets; FP provided the SEVIRI dataset; HW and CY performed NAME analysis; HW analyzed combined datasets and led the manuscript writing.
The contact author has declared that none of the authors has any competing interests.
Publisher's note: Copernicus Publications remains neutral with regard to jurisdictional claims made in the text, published maps, institutional affiliations, or any other geographical representation in this paper. While Copernicus Publications makes every effort to include appropriate place names, the final responsibility lies with the authors. Views expressed in the text are those of the authors and do not necessarily reflect the views of the publisher.
This article is part of the special issue “New observations and related modelling studies of the aerosol–cloud–climate system in the Southeast Atlantic and southern Africa regions (ACP/AMT inter-journal SI)”. It is not associated with a conference.
The staff of Airtask, Avalon Engineering and FAAM are thanked for their thoroughly professional work, before, during and after the deployment. The NAME group in the UK Met Office are thanked for their instructions on backward simulations.
This research has been supported by the UK Natural Environment Research Council (grant no. NE/L013584/1, Cloud–Aerosol–Radiation Interactions and Forcing for Year 2017, CLARIFY) and the HORIZON EUROPE European Research Council (grant no. 101137680, Cloud–aERosol inTeractions & their impActs IN The earth sYstem, CERTAINTY).
This paper was edited by Armin Sorooshian and reviewed by Cassidy Soloff and two anonymous referees.
Abel, S. J., Barrett, P. A., Zuidema, P., Zhang, J., Christensen, M., Peers, F., Taylor, J. W., Crawford, I., Bower, K. N., and Flynn, M.: Open cells exhibit weaker entrainment of free-tropospheric biomass burning aerosol into the south-east Atlantic boundary layer, Atmos. Chem. Phys., 20, 4059–4084, https://doi.org/10.5194/acp-20-4059-2020, 2020.
Adebiyi, A. and Zuidema, P.: The Role of the Southern African Easterly Jet in Modifying the Southeast Atlantic Aerosol and Cloud Environments, Q. J. Roy. Meteor. Soc., 142, 697, 1574–1589, https://doi.org/10.1002/qj.2765, 2016.
Barrett, P. A., Abel, S. J., Coe, H., Crawford, I., Dobracki, A., Haywood, J., Howell, S., Jones, A., Langridge, J., McFarquhar, G. M., Nott, G. J., Price, H., Redemann, J., Shinozuka, Y., Szpek, K., Taylor, J. W., Wood, R., Wu, H., Zuidema, P., Bauguitte, S., Bennett, R., Bower, K., Chen, H., Cochrane, S., Cotterell, M., Davies, N., Delene, D., Flynn, C., Freedman, A., Freitag, S., Gupta, S., Noone, D., Onasch, T. B., Podolske, J., Poellot, M. R., Schmidt, S., Springston, S., Sedlacek III, A. J., Trembath, J., Vance, A., Zawadowicz, M. A., and Zhang, J.: Intercomparison of airborne and surface-based measurements during the CLARIFY, ORACLES and LASIC field experiments, Atmos. Meas. Tech., 15, 6329–6371, https://doi.org/10.5194/amt-15-6329-2022, 2022.
Boucher, O., Randall, D., Artaxo, P., Bretherton, C., Feingold, G., Forster, P., Kerminen, V.-M., Kondo, Y., Liao, H., Lohmann, U., Rasch, P., Satheesh, S. K., Sherwood, S., Stevens, B., and Zhang, X. Y.: Clouds and aerosols, in: Climate Change 2013: The Physical Science Basis. Contribution of Working Group I to the Fifth Assessment Report of the Intergovernmental Panel on Climate Change, edited by: Stocker, T. F., Qin, D., Plattner, G.-K., Tignor, M., Allen, S. K., Doschung, J., Nauels, A., Xia, Y., Bex, V., and Midgley, P. M.: Cambridge University Press, Cambridge, United Kingdom and New York USA, 571–657, https://doi.org/10.1017/CBO9781107415324.016, 2013.
Brown, A., Milton, S., Cullen, M., Golding, B., Mitchell, J., and Shelly, A.: Unified Modeling and Prediction of Weather and Climate: A 25-Year Journey, B. Am. Meteorol. Soc., 93, 1865–1877, https://doi.org/10.1175/bams-d-12-00018.1, 2012.
Burnet, F. and Brenguier, J.-L.: Observational Study of the Entrainment-Mixing Process in Warm Convective Clouds, J. Atmos. Sci., 64, 1995–2011, https://doi.org/10.1175/JAS3928.1, 2007.
Costantino, L. and Bréon, F.-M.: Analysis of aerosol-cloud interaction from multi-sensor satellite observations, Geophys. Res. Lett., 37, L11801, https://doi.org/10.1029/2009gl041828, 2010.
Costantino, L. and Bréon, F.-M.: Aerosol indirect effect on warm clouds over South-East Atlantic, from co-located MODIS and CALIPSO observations, Atmos. Chem. Phys., 13, 69–88, https://doi.org/10.5194/acp-13-69-2013, 2013.
Das, S., Harshvardhan, H., Bian, H., Chin, M., Curci, G., Protonotariou, A. P., Mielonen, T., Zhang, K., Wang, H., and Liu, X.: Biomass burning aerosol transport and vertical distribution over the South African-Atlantic region, J. Geophys. Res.-Atmos., 122, 6391–6415, https://doi.org/10.1002/2016jd026421, 2017.
Deaconu, L. T., Ferlay, N., Waquet, F., Peers, F., Thieuleux, F., and Goloub, P.: Satellite inference of water vapour and above-cloud aerosol combined effect on radiative budget and cloud-top processes in the southeastern Atlantic Ocean, Atmos. Chem. Phys., 19, 11613–11634, https://doi.org/10.5194/acp-19-11613-2019, 2019.
De Graaf, M., Bellouin, N., Tilstra, L. G., Haywood, J., and Stammes, P.: Aerosol direct radiative effect of smoke over clouds over the southeast Atlantic Ocean from 2006 to 2009, Geophys. Res. Lett., 41, 7723–7730, https://doi.org/10.1002/2014GL061103, 2014.
Diamond, M. S., Dobracki, A., Freitag, S., Small Griswold, J. D., Heikkila, A., Howell, S. G., Kacarab, M. E., Podolske, J. R., Saide, P. E., and Wood, R.: Time-dependent entrainment of smoke presents an observational challenge for assessing aerosol–cloud interactions over the southeast Atlantic Ocean, Atmos. Chem. Phys., 18, 14623–14636, https://doi.org/10.5194/acp-18-14623-2018, 2018.
Dobracki, A., Zuidema, P., Howell, S. G., Saide, P., Freitag, S., Aiken, A. C., Burton, S. P., Sedlacek III, A. J., Redemann, J., and Wood, R.: An attribution of the low single-scattering albedo of biomass burning aerosol over the southeastern Atlantic, Atmos. Chem. Phys., 23, 4775–4799, https://doi.org/10.5194/acp-23-4775-2023, 2023.
Facility for Airborne Atmospheric Measurements, Natural Environment Research Council, and Met Office: CLARIFY: in-situ airborne observations by the FAAM BAE-146 aircraft, Centre for Environmental Data Analysis [data set], http://catalogue.ceda.ac.uk/uuid/38ab7089781a4560b067dd6c20af3769 (last access: 19 November 2025), 2017.
Farley, R., Zhou, S., Collier, S., Jiang, W., Onasch, T. B., Shilling, J. E., Kleinman, L., Sedlacek III, A. J., and Zhang, Q.: Chemical Evolution of Biomass Burning Aerosols across Wildfire Plumes in the Western US: From Near-Source to Regional Scales, ACS Es&t Air., 2, 677–691, https://doi.org/10.1021/acsestair.5c00002, 2025.
Gordon, H., Field, P. R., Abel, S. J., Dalvi, M., Grosvenor, D. P., Hill, A. A., Johnson, B. T., Miltenberger, A. K., Yoshioka, M., and Carslaw, K. S.: Large simulated radiative effects of smoke in the south-east Atlantic, Atmos. Chem. Phys., 18, 15261–15289, https://doi.org/10.5194/acp-18-15261-2018, 2018.
Gupta, S., McFarquhar, G. M., O'Brien, J. R., Delene, D. J., Poellot, M. R., Dobracki, A., Podolske, J. R., Redemann, J., LeBlanc, S. E., Segal-Rozenhaimer, M., and Pistone, K.: Impact of the variability in vertical separation between biomass burning aerosols and marine stratocumulus on cloud microphysical properties over the Southeast Atlantic, Atmos. Chem. Phys., 21, 4615–4635, https://doi.org/10.5194/acp-21-4615-2021, 2021.
Gupta, S., McFarquhar, G. M., O'Brien, J. R., Poellot, M. R., Delene, D. J., Miller, R. M., and Small Griswold, J. D.: Factors affecting precipitation formation and precipitation susceptibility of marine stratocumulus with variable above- and below-cloud aerosol concentrations over the Southeast Atlantic, Atmos. Chem. Phys., 22, 2769–2793, https://doi.org/10.5194/acp-22-2769-2022, 2022.
Haywood, J. M., Abel, S. J., Barrett, P. A., Bellouin, N., Blyth, A., Bower, K. N., Brooks, M., Carslaw, K., Che, H., Coe, H., Cotterell, M. I., Crawford, I., Cui, Z., Davies, N., Dingley, B., Field, P., Formenti, P., Gordon, H., de Graaf, M., Herbert, R., Johnson, B., Jones, A. C., Langridge, J. M., Malavelle, F., Partridge, D. G., Peers, F., Redemann, J., Stier, P., Szpek, K., Taylor, J. W., Watson-Parris, D., Wood, R., Wu, H., and Zuidema, P.: The CLoud–Aerosol–Radiation Interaction and Forcing: Year 2017 (CLARIFY-2017) measurement campaign, Atmos. Chem. Phys., 21, 1049–1084, https://doi.org/10.5194/acp-21-1049-2021, 2021.
Hegg, D. A., Covert, D. S., Jonsson, H. H., and Woods, R. K.: A simple relationship between cloud drop number concentration and precursor aerosol concentration for the regions of Earth's large marine stratocumulus decks, Atmos. Chem. Phys., 12, 1229–1238, https://doi.org/10.5194/acp-12-1229-2012, 2012.
Herbert, R. J., Bellouin, N., Highwood, E. J., and Hill, A. A.: Diurnal cycle of the semi-direct effect from a persistent absorbing aerosol layer over marine stratocumulus in large-eddy simulations, Atmos. Chem. Phys., 20, 1317–1340, https://doi.org/10.5194/acp-20-1317-2020, 2020.
Hering, S. V., Stolzenburg, M. R., Quant, F. R., Oberreit, D. R., and Keady, P. B.: A Laminar-Flow, Water-Based Condensation Particle Counter (WCPC), Aerosol Sci. Tech., 39, 659–672, https://doi.org/10.1080/02786820500182123, 2005.
Heymsfield, A. J. and McFarquhar, G. M.: Microphysics of INDOEX clean and polluted trade wind cumulus clouds, J. Geophys. Res., 106, 28653–28673, 2001.
Hoffmann, F., Raasch, S., and Noh, Y.: Entrainment of aerosols and their activation in a shallow cumulus cloud studied with a coupled LCM–LES approach, Atmos. Res., 156, 43–57, https://doi.org/10.1016/j.atmosres.2014.12.008, 2015.
Holanda, B. A., Pöhlker, M. L., Walter, D., Saturno, J., Sörgel, M., Ditas, J., Ditas, F., Schulz, C., Franco, M. A., Wang, Q., Donth, T., Artaxo, P., Barbosa, H. M. J., Borrmann, S., Braga, R., Brito, J., Cheng, Y., Dollner, M., Kaiser, J. W., Klimach, T., Knote, C., Krüger, O. O., Fütterer, D., Lavrič, J. V., Ma, N., Machado, L. A. T., Ming, J., Morais, F. G., Paulsen, H., Sauer, D., Schlager, H., Schneider, J., Su, H., Weinzierl, B., Walser, A., Wendisch, M., Ziereis, H., Zöger, M., Pöschl, U., Andreae, M. O., and Pöhlker, C.: Influx of African biomass burning aerosol during the Amazonian dry season through layered transatlantic transport of black carbon-rich smoke, Atmos. Chem. Phys., 20, 4757–4785, https://doi.org/10.5194/acp-20-4757-2020, 2020.
Johnson, B. T. and Haywood, J. M.: Assessing the Impact of Self-Lofting on Increasing the Altitude of Black Carbon in a Global Climate Model, J. Geophys. Res.-Atmos., 128, e2022JD038039, https://doi.org/10.1029/2022JD038039, 2023.
Jones, A., Thomson, D., Hort, M., and Devenish, B.: The UK Met Office's next-generation atmospheric dispersion model, NAME III, Air Pollut. Model. Appl. XVII, 17, 580–589, https://doi.org/10.1007/978-0-387-68854-1_62, 2007.
Jones, C. R., Bretherton, C. S., and Leon, D.: Coupled vs. decoupled boundary layers in VOCALS-REx, Atmos. Chem. Phys., 11, 7143–7153, https://doi.org/10.5194/acp-11-7143-2011, 2011.
Kacarab, M., Thornhill, K. L., Dobracki, A., Howell, S. G., O'Brien, J. R., Freitag, S., Poellot, M. R., Wood, R., Zuidema, P., Redemann, J., and Nenes, A.: Biomass burning aerosol as a modulator of the droplet number in the southeast Atlantic region, Atmos. Chem. Phys., 20, 3029–3040, https://doi.org/10.5194/acp-20-3029-2020, 2020.
Keller, A., Tritscher, T., and Burtscher, H.: Performance of water-based CPC 3788 for particles from a propane-flame soot-generator operated with rich fuel/air mixtures, J. Aerosol Sci, 60, 67–72, https://doi.org/10.1016/j.jaerosci.2013.02.005, 2013.
Laing, J. R., Jaffe, D. A., and Hee, J. R.: Physical and optical properties of aged biomass burning aerosol from wildfires in Siberia and the Western USA at the Mt. Bachelor Observatory, Atmos. Chem. Phys., 16, 15185–15197, https://doi.org/10.5194/acp-16-15185-2016, 2016.
Lance, S., Brock, C. A., Rogers, D., and Gordon, J. A.: Water droplet calibration of the Cloud Droplet Probe (CDP) and in-flight performance in liquid, ice and mixed-phase clouds during ARCPAC, Atmos. Meas. Tech., 3, 1683–1706, https://doi.org/10.5194/amt-3-1683-2010, 2010.
Liu, Y. and Daum, P. H.: Spectral dispersion of cloud droplet size distributions and the parameterization of cloud droplet effective radius, Geophys. Res. Lett., 27, 1903–1906, https://doi.org/10.1029/1999GL011011, 2000.
Lock, A., Edwards, J. and Boutle, I.: Unified Model Documentation Paper 024, The Parametrization of Boundary Layer Processes, Version 11.7, Met Office, https://code.metoffice.gov.uk/doc/um (last access: 20 June 2024), 2020.
Lu, Zh., Liu, X., Zhang, Z., Zhao, C., Meyer, K., Rajapakshe, C., Wu, C., Yang, Z., and Penner, J. E.: Biomass smoke from southern Africa can significantly enhance the brightness of stratocumulus over the southeastern Atlantic Ocean, P. Natl. Acad. Sci. USA, 115, 2924–2929, https://doi.org/10.1073/pnas.1713703115, 2018.
Mallet, M., Nabat, P., Johnson, B., Michou, M., Haywood, J. M., Chen, C., and Dubovik, O.: Climate models generally underrepresent the warming by Central Africa biomass-burning aerosols over the Southeast Atlantic, Sci. Adv., 7, eabg9998, 685 https://doi.org/10.1126/sciadv.abg9998, 2021.
Mardi, A. H., Dadashazar, H., MacDonald, A. B., Crosbie, E., Coggon, M. M., Aghdam, M. A., Woods, R. K., Jonsson, H. H., Flagan, R. C., Seinfeld, J. H., and Sorooshian, A.: Effects of Biomass Burning on Stratocumulus Droplet Characteristics, Drizzle Rate, and Composition, J. Geophys. Res.-Atmos., 124, 12301–12318, https://doi.org/10.1029/2019jd031159, 2019.
McComiskey, A. and Feingold, G.: Quantifying error in the radiative forcing of the first aerosol indirect effect, Geophys. Res. Lett., 35, L02810, https://doi.org/10.1029/2007GL032667, 2008.
Painemal, D., Minnis, P., Ayers, J. K., and O'Neill, L.: GOES-10 microphysical retrievals in marine warm clouds: multi-instrument validation and daytime cycle over the southeast Pacific, J. Geophys. Res.-Atmos., 117, D19212, https://doi.org/10.1029/2012jd017822, 2012.
Painemal, D., Kato, S., and Minnis, P.: Boundary layer regulation in the southeast Atlantic cloud microphysics during the biomass burning season as seen by the A-train satellite constellation, J. Geophys. Res.-Atmos., 119, 11288–11302, https://doi.org/10.1002/2014JD022182, 2014.
Panagi, M., Fleming, Z. L., Monks, P. S., Ashfold, M. J., Wild, O., Hollaway, M., Zhang, Q., Squires, F. A., and Vande Hey, J. D.: Investigating the regional contributions to air pollution in Beijing: a dispersion modelling study using CO as a tracer, Atmos. Chem. Phys., 20, 2825–2838, https://doi.org/10.5194/acp-20-2825-2020, 2020.
Peers, F., Francis, P., Fox, C., Abel, S. J., Szpek, K., Cotterell, M. I., Davies, N. W., Langridge, J. M., Meyer, K. G., Platnick, S. E., and Haywood, J. M.: Observation of absorbing aerosols above clouds over the south-east Atlantic Ocean from the geostationary satellite SEVIRI – Part 1: Method description and sensitivity, Atmos. Chem. Phys., 19, 9595–9611, https://doi.org/10.5194/acp-19-9595-2019, 2019.
Peers, F., Francis, P., Abel, S. J., Barrett, P. A., Bower, K. N., Cotterell, M. I., Crawford, I., Davies, N. W., Fox, C., Fox, S., Langridge, J. M., Meyer, K. G., Platnick, S. E., Szpek, K., and Haywood, J. M.: Observation of absorbing aerosols above clouds over the south-east Atlantic Ocean from the geostationary satellite SEVIRI – Part 2: Comparison with MODIS and aircraft measurements from the CLARIFY-2017 field campaign, Atmos. Chem. Phys., 21, 3235–3254, https://doi.org/10.5194/acp-21-3235-2021, 2021.
Pistone, K., Zuidema, P., Wood, R., Diamond, M., da Silva, A. M., Ferrada, G., Saide, P. E., Ueyama, R., Ryoo, J.-M., Pfister, L., Podolske, J., Noone, D., Bennett, R., Stith, E., Carmichael, G., Redemann, J., Flynn, C., LeBlanc, S., Segal-Rozenhaimer, M., and Shinozuka, Y.: Exploring the elevated water vapor signal associated with the free tropospheric biomass burning plume over the southeast Atlantic Ocean, Atmos. Chem. Phys., 21, 9643–9668, https://doi.org/10.5194/acp-21-9643-2021, 2021.
Pöhlker, M. L., Pöhlker, C., Quaas, J., Mülmenstädt, J., Pozzer, A., Andreae, M. O., Artaxo, P., Block, K., Coe, H., Ervens, B., Gallimore, P., Gaston, C. J., Gunthe, S. S., Henning, S., Herrmann, H., Krüger, O. O., McFiggans, G., Poulain, L., Raj, S. S., Reyes-Villegas, E., Royer, H. M., Walter, D., Wang, Y., and Pöschl, U.: Global organic and inorganic aerosol hygroscopicity and its effect on radiative forcing, Nat. Commun., 14, 6139, https://doi.org/10.1038/s41467-023-41695-8, 2023.
Pósfai, M., Simonics, R., Li, J., Hobbs, P. V., and Buseck, P. R.: Individual aerosol particles from biomass burning in southern Africa: 1. Compositions and size distributions of carbonaceous particles, J. Geophys. Res., 108, 8483, https://doi.org/10.1029/2002jd002291, 2003.
Pratt, K. A., Murphy, S. M., Subramanian, R., DeMott, P. J., Kok, G. L., Campos, T., Rogers, D. C., Prenni, A. J., Heymsfield, A. J., Seinfeld, J. H., and Prather, K. A.: Flight-based chemical characterization of biomass burning aerosols within two prescribed burn smoke plumes, Atmos. Chem. Phys., 11, 12549–12565, https://doi.org/10.5194/acp-11-12549-2011, 2011.
Rajapakshe, C., Zhang, Z., Yorks, J. E., Yu, H., Tan, Q., Meyer, K., Platnick, S., and Winker, D. M.: Seasonally transported aerosol layers over southeast Atlantic are closer to underlying clouds than previously reported, Geophys. Res. Lett., 44, 5818–5825, https://doi.org/10.1002/2017gl073559, 2017.
Redemann, J., Wood, R., Zuidema, P., Doherty, S. J., Luna, B., LeBlanc, S. E., Diamond, M. S., Shinozuka, Y., Chang, I. Y., Ueyama, R., Pfister, L., Ryoo, J.-M., Dobracki, A. N., da Silva, A. M., Longo, K. M., Kacenelenbogen, M. S., Flynn, C. J., Pistone, K., Knox, N. M., Piketh, S. J., Haywood, J. M., Formenti, P., Mallet, M., Stier, P., Ackerman, A. S., Bauer, S. E., Fridlind, A. M., Carmichael, G. R., Saide, P. E., Ferrada, G. A., Howell, S. G., Freitag, S., Cairns, B., Holben, B. N., Knobelspiesse, K. D., Tanelli, S., L'Ecuyer, T. S., Dzambo, A. M., Sy, O. O., McFarquhar, G. M., Poellot, M. R., Gupta, S., O'Brien, J. R., Nenes, A., Kacarab, M., Wong, J. P. S., Small-Griswold, J. D., Thornhill, K. L., Noone, D., Podolske, J. R., Schmidt, K. S., Pilewskie, P., Chen, H., Cochrane, S. P., Sedlacek, A. J., Lang, T. J., Stith, E., Segal-Rozenhaimer, M., Ferrare, R. A., Burton, S. P., Hostetler, C. A., Diner, D. J., Seidel, F. C., Platnick, S. E., Myers, J. S., Meyer, K. G., Spangenberg, D. A., Maring, H., and Gao, L.: An overview of the ORACLES (ObseRvations of Aerosols above CLouds and their intEractionS) project: aerosol–cloud–radiation interactions in the southeast Atlantic basin, Atmos. Chem. Phys., 21, 1507–1563, https://doi.org/10.5194/acp-21-1507-2021, 2021.
Reid, J. S., Hobbs, P. V., Rangno, A. L., and Hegg, D. A.: Relationships between cloud droplet effective radius, liquid water content and droplet concentration for warm clouds in Brazil embedded in biomass smoke, J. Geophys. Res., 104, 6145–6153, https://doi.org/10.1029/1998JD200119, 1999.
Roberts, G., Wooster, M. J., and Lagoudakis, E.: Annual and diurnal african biomass burning temporal dynamics, Biogeosciences, 6, 849–866, https://doi.org/10.5194/bg-6-849-2009, 2009.
Roberts, G. C. and Nenes, A.: A Continuous-Flow Streamwise Thermal-Gradient CCN Chamber for Atmospheric Measurements, Aerosol Sci. Tech., 39, 206–221, https://doi.org/10.1080/027868290913988, 2005.
Rosenberg, P. D., Dean, A. R., Williams, P. I., Dorsey, J. R., Minikin, A., Pickering, M. A., and Petzold, A.: Particle sizing calibration with refractive index correction for light scattering optical particle counters and impacts upon PCASP and CDP data collected during the Fennec campaign, Atmos. Meas. Tech., 5, 1147–1163, https://doi.org/10.5194/amt-5-1147-2012, 2012.
Ross, K. E., Piketh, S. J., Bruintjes, R. T., Burger, R. P., Swap, R. J., and Annegarn, H. J.: Spatial and seasonal variations in CCN distributions and the aerosol-CCN relationship over southern Africa, J. Geophys. Res., 108, 8481, https://doi.org/10.1029/2002JD002384, 2003.
Ryoo, J.-M., Pfister, L., Ueyama, R., Zuidema, P., Wood, R., Chang, I., and Redemann, J.: A meteorological overview of the ORACLES (ObseRvations of Aerosols above CLouds and their intEractionS) campaign over the southeastern Atlantic during 2016–2018: Part 2 – Daily and synoptic characteristics, Atmos. Chem. Phys., 22, 14209–14241, https://doi.org/10.5194/acp-22-14209-2022, 2022.
Samset, B. H., Myhre, G., Schulz, M., Balkanski, Y., Bauer, S., Berntsen, T. K., Bian, H., Bellouin, N., Diehl, T., Easter, R. C., Ghan, S. J., Iversen, T., Kinne, S., Kirkevåg, A., Lamarque, J.-F., Lin, G., Liu, X., Penner, J. E., Seland, Ø., Skeie, R. B., Stier, P., Takemura, T., Tsigaridis, K., and Zhang, K.: Black carbon vertical profiles strongly affect its radiative forcing uncertainty, Atmos. Chem. Phys., 13, 2423–2434, https://doi.org/10.5194/acp-13-2423-2013, 2013.
Shinozuka, Y., Saide, P. E., Ferrada, G. A., Burton, S. P., Ferrare, R., Doherty, S. J., Gordon, H., Longo, K., Mallet, M., Feng, Y., Wang, Q., Cheng, Y., Dobracki, A., Freitag, S., Howell, S. G., LeBlanc, S., Flynn, C., Segal-Rosenhaimer, M., Pistone, K., Podolske, J. R., Stith, E. J., Bennett, J. R., Carmichael, G. R., da Silva, A., Govindaraju, R., Leung, R., Zhang, Y., Pfister, L., Ryoo, J.-M., Redemann, J., Wood, R., and Zuidema, P.: Modeling the smoky troposphere of the southeast Atlantic: a comparison to ORACLES airborne observations from September of 2016, Atmos. Chem. Phys., 20, 11491–11526, https://doi.org/10.5194/acp-20-11491-2020, 2020.
Slawinska, J., Grabowski, W. W., Pawlowska, H., and Morrison, H.: Droplet activation and mixing in large-eddy simulation of a shallow cumulus field, J. Atmos. Sci., 69, 444–462, https://doi.org/10.1175/JAS-D-11-054.1, 2012.
Trembath, J.: Airborne CCN measurements, PhD thesis, University of Manchester, https://research.manchester.ac.uk/en/studentTheses/airborne-ccn-measurements (last access: 19 November 2025), 2013.
Twohy, C. H., Anderson, J. R., Toohey, D. W., Andrejczuk, M., Adams, A., Lytle, M., George, R. C., Wood, R., Saide, P., Spak, S., Zuidema, P., and Leon, D.: Impacts of aerosol particles on the microphysical and radiative properties of stratocumulus clouds over the southeast Pacific Ocean, Atmos. Chem. Phys., 13, 2541–2562, https://doi.org/10.5194/acp-13-2541-2013, 2013.
Twomey, S.: The Influence of Pollution on the Shortwave Albedo of Clouds, J. Atmos. Sci., 34, 1149–1152, https://doi.org/10.1175/1520-0469(1977)034<1149:TIOPOT>2.0.CO;2, 1977.
Wilcox, E. M.: Direct and semi-direct radiative forcing of smoke aerosols over clouds, Atmos. Chem. Phys., 12, 139–149, https://doi.org/10.5194/acp-12-139-2012, 2012.
Wood, R.: Stratocumulus clouds, Mon. Weather Rev., 140, 2373–2423, https://doi.org/10.1175/MWR-D-11-00121.1, 2012.
Wood, R. and Bretherton, C. S.: Boundary Layer Depth, Entrainment, and Decoupling in the Cloud-Capped Subtropical and Tropical Marine Boundary Layer, J. Climate, 17, 3576–3588, https://doi.org/10.1175/1520-0442(2004)017<3576:BLDEAD>2.0.CO;2, 2004.
Wu, H., Taylor, J. W., Szpek, K., Langridge, J. M., Williams, P. I., Flynn, M., Allan, J. D., Abel, S. J., Pitt, J., Cotterell, M. I., Fox, C., Davies, N. W., Haywood, J., and Coe, H.: Vertical variability of the properties of highly aged biomass burning aerosol transported over the southeast Atlantic during CLARIFY-2017, Atmos. Chem. Phys., 20, 12697–12719, https://doi.org/10.5194/acp-20-12697-2020, 2020.
Wu, H., Coe, H., and Facility for Airborne Atmospheric Measurements: CLARIFY: in-situ airborne observations by the FAAM BAE-146 aircraft, Zenodo [data set], https://doi.org/10.5281/zenodo.17225248, 2025.
Zhang, J. and Zuidema, P.: The diurnal cycle of the smoky marine boundary layer observed during August in the remote southeast Atlantic, Atmos. Chem. Phys., 19, 14493–14516, https://doi.org/10.5194/acp-19-14493-2019, 2019.
Zheng, G., Sedlacek, A. J., Aiken, A. C., Feng, Y., Watson, T. B., Raveh-Rubin, S., Uin, J., Lewis, E. R., and Wang, J.: Long-range transported North American wildfire aerosols observed in marine boundary layer of eastern North Atlantic, Environ. Int., 139, 105680, https://doi.org/10.1016/j.envint.2020.105680, 2020.
Zheng, X., Albrecht, B., Jonsson, H. H., Khelif, D., Feingold, G., Minnis, P., Ayers, K., Chuang, P., Donaher, S., Rossiter, D., Ghate, V., Ruiz-Plancarte, J., and Sun-Mack, S.: Observations of the boundary layer, cloud, and aerosol variability in the southeast Pacific near-coastal marine stratocumulus during VOCALS-REx, Atmos. Chem. Phys., 11, 9943–9959, https://doi.org/10.5194/acp-11-9943-2011, 2011.
Zuidema, P., Sedlacek III, A. J., Flynn, C., Springston, S., Delgadillo, R., Zhang, J., Aiken, A. C., Koontz, A., and Muradyan, P.: The Ascension Island Boundary Layer in the Remote Southeast Atlantic is Often Smoky, Geophys. Res. Lett., 45, 4456–4465, https://doi.org/10.1002/2017GL076926, 2018.