the Creative Commons Attribution 4.0 License.
the Creative Commons Attribution 4.0 License.
 | 20 Nov 2025
Black carbon aerosols in China: spatial-temporal variations and lessons from long-term atmospheric observations
Huang Zheng
Shaofei Kong
Deping Ding
Marjan Savadkoohi
Congbo Song
Mingming Zheng
Roy M. Harrison
Black carbon (BC) significantly influences climate, air quality, and public health, and long-term observations are essential for understanding its adverse effects. While previous studies have primarily focused on spatiotemporal variations, deeper insights from such datasets remain uncovered. Using 13 years (2008–2020) of continuous measurements of equivalent black carbon (eBC) in China, this study reported the spatial-temporal variations of eBC and its sources, including solid fuel (eBCsf) and liquid fuel combustion (eBClf). The results showed that eBC and its sources exhibited higher concentrations in eastern and northern China compared to western and southern China. Seasonal variations of eBC and eBCsf generally showed lower values during summer and higher values during winter at most stations. Long-term trends indicated that eBC and eBClf decreased most rapidly at urban stations, while eBCsf declined faster at rural stations. Comparisons of eBC concentrations and trends between this study and global observations revealed higher eBC levels but lower reduction rates in China. These long-term observations showed that the model simulations performed well in simulating spatial distribution but poorly in capturing inter-annual variations. The weather-normalized eBC concentrations showed potential for adjusting emission estimates. The normalized results also suggested that emission control was the dominant driver of the BC reduction. This decrease was primarily driven by reductions from solid fuel combustion at rural and background stations. This study provides insights for reducing uncertainties in black carbon emission inventories and improving model performance in simulating surface concentrations.
- Article
(12223 KB) - Full-text XML
-
Supplement
(6239 KB) - BibTeX
- EndNote


Despite being a small fraction of the aerosol chemical composition (Bond et al., 2013; Huang et al., 2014; Tao et al., 2017), black carbon (BC) is important for climate, air pollution, and human health. Globally, BC can cause up to +0.41 W m−2 effective radiative forcing (Szopa et al., 2021). At the regional scale, BC aerosol can suppress the deepening of the planetary boundary layer, thereby enhancing haze pollution (Ding et al., 2016; Wang et al., 2018) and radiative forcing (Peng et al., 2016). Personal exposure to BC can cause adverse health effects, such as carcinogenic risks and elevated blood pressure, and BC can reach the fetal side of the human placenta (Mordukhovich et al., 2009; Bové et al., 2019; Lin et al., 2019). As a short-lived climate forcer, the atmospheric lifetime of BC is about 5.5 d ± 35 % (median ± 1 standard deviation, hereafter), according to an ensemble of 14 models (Gliß et al., 2021). Therefore, the study of BC aerosol is important to reduce its adverse impacts.
To better understand the climate, environmental, and health effects of BC, it is important to model its atmospheric abundance. Although Chemistry Transport Models (CTMs) can capture the spatial-temporal variations of BC, their simulation accuracy is often poor, and there are discrepancies among different simulations. For instance, 17 global models overestimated the abundance of BC, with the ratio of simulated to observed values ranging from 0.5 to 10 in Europe (Koch et al., 2009). Similarly, Ikeda et al. (2022) evaluated the performance of six BC emission inventories and found an overestimation of modeled BC concentrations by a factor of 1.24 to 2.16 in China. In contrast, some simulations underestimated the annual mean BC levels in China, with normalized mean bias ranging from −83 % to −22 % (Mao et al., 2016). The high uncertainties in the simulation of BC arise from the emission inventory and physical mechanisms. One method to constrain the model results is to use long-term observation datasets to evaluate the emission inventory, transport, and removal processes (Bond et al., 2013; Wang et al., 2014; Alvarado et al., 2016; He et al., 2016; Evangeliou et al., 2018). For instance, Evangeliou et al. (2018) coupled BC observations with a top-down method to constrain emissions, and the posterior simulated BC concentrations showed better agreement with observations. Choi et al. (2020b) utilized long-term observations of BC to CO ratios to validate the regional emission inventory in Asia. They found that emissions in East and South Korea were overestimated, while emissions in North Korea were underestimated. Using long-term observations of BC and CO from 2009 to 2015 at Fukue Island, Kanaya et al. (2016) constrained the wet removal rate of BC and proposed a stretched exponential decay equation to describe the wet removal rate. Based on BC observations from 2010 to 2016 at three representative background sites in East Asia, Choi et al. (2020a) estimated the average transport efficiency of BC to be 0.73, which was lower than the mean rate of 0.91 from the FLEXible PARTicle Lagrangian transport model (FLEXPART, version 10.4).
Long-term observation of BC aerosol also contributes to a better understanding of the effectiveness of air quality management (Chen et al., 2016; Font and Fuller, 2016; Fuller and Font, 2019). For instance, a decreasing trend in BC from 2010 to 2014 in London was attributed to the application of diesel particle filters (Font and Fuller, 2016). Long-term observation of BC at 16 sites from 2009 to 2018 in Germany showed the greatest decreases at roadside and urban background sites, implying strong evidence of reduced traffic emissions in urban areas (Sun et al., 2020). The decreasing trend of BC at traffic sites in the Helsinki metropolitan area suggested the success of vehicle exhaust particle mitigation (Luoma et al., 2021). In China, similar conclusions were drawn. For instance, a 38 % reduction in BC concentration was observed in Beijing between 2005 and 2013, primarily due to the relocation of industries and a decrease in coal and coke consumption (Chen et al., 2016). Continuous observations of BC in Beijing from 2012 to 2020 revealed a 71 % reduction, with the largest decrease occurring at night. This suggests that pollution control measures implemented since 2013 have effectively reduced primary emissions (Sun et al., 2022). The long-term trend of BC in Wuhan suggested a positive role for pollution control measures across China in reducing BC at the observational site (Zheng et al., 2020). Continuous observation of BC at Mt. Waliguan showed a decreasing rate of 2 % yr−1 from 2008 to 2017, reflecting the reduction of BC emissions in China (Dai et al., 2021).
As summarized above, long-term observation of BC is important for improving CTM simulations and evaluating the effectiveness of air pollution control measures on air pollutants. Long-term surface observations of BC aerosol have been widely reported (Hirdman et al., 2010; Boreddy et al., 2018; Kutzner et al., 2018). For instance, the earliest continuous in situ observation of BC was launched at 150 urban and rural stations in 1962 in the United Kingdom (Novakov and Hansen, 2004). Compared to long-term observations at a single or a small number of stations, a monitoring network consisting of many stations can provide more information about the spatial-temporal variations of air pollutants. However, long-term in situ observation networks are few. At present, the worldwide monitoring networks include the World Meteorological Organization Global Atmosphere Watch (WMO-GAW) (Bond et al., 2013), European Monitoring and Evaluation Programme (EMEP) (Yttri et al., 2007), German Ultrafine Aerosol Network (GUAN) (Birmili et al., 2016), UK Black Carbon Network (Singh et al., 2018), National Air Pollution Monitoring Network (NABEL) in Switzerland (Grange et al., 2020), Interagency Monitoring of Protected Visual Environments network (IMPROVE) in the US (Malm et al., 1994), Canadian Aerosol Baseline Measurement (CABM) (Chan et al., 2019), Aerosol Radiative Forcing over India Network (ARFINET) in India (Manoj et al., 2019), and China Black Carbon Observational Network (CBNET) (Zhang et al., 2019b). Research from these observational networks is mainly focused on the spatial-temporal variations of BC (Birmili et al., 2016; Manoj et al., 2019; Zhang et al., 2019b; Savadkoohi et al., 2023). More valuable information from long-term observations, however, remains untapped.
Therefore, this study presents a comprehensive BC dataset collected from CBNET covering the period from 2008 to 2020. Spatial-temporal characteristics, sources, and long-term trends of BC are reported. The information behind the results is explored with a focus on three questions: (1) What can we learn from the comparison between BC ground observations and CTM simulations? (2) Can the inter-annual variations of BC be used as an indicator of BC emissions? (3) Which factors dominated the variations of BC in China during the past 13 years? By analyzing the data from continuous measurements of BC in China, this study is expected to provide insights into reducing the uncertainties in BC emissions and simulations from CTMs.
2.1 Observation sites
The CBNET, established in 2006, is a part of the China Atmosphere Watch Network (CAWNET). There are 68 stations across China, and the number of stations has increased recently. In this study, 48 sites with observations during 2008–2020 were selected (Fig. S1). According to the land type and surrounding environment, these 48 sites can be divided into baseline (N=7), urban (N=23), and rural (N=18) stations (Guo et al., 2020; Zhang et al., 2008, 2019b). The rural stations are situated around 50–100 km distant from local sources or nearby major cities, and they are positioned at a moderate height above the local elevation of the area. For the urban stations, the sampling heights are deliberately set to be 50–100 m higher than the average elevation of the city. Baseline stations are established in areas remote from strong emission sources and human activities to monitor the long-range transport of BC aerosols and their natural emissions. For instance, the Lin'an (LA) baseline station is situated at an altitude of 139 m a.s.l. in Zhejiang province, positioned approximately 150 km northeast of Shanghai and 50 km west of Hangzhou city. This strategic placement aims to collect samples that represent the entire region rather than just the immediate local surroundings (Zhang et al., 2008). More details about the selected stations can be found in Table S1.
2.2 Instruments and data prepossessing
The instruments used at each monitoring site are provided in Table S1 in the Supplement. The BC mass concentration was measured by filter-based absorption Aethalometers. Most stations utilized the AE31 to measure BC throughout the entire period (i.e., 2008–2020), and some stations used both the AE31 and AE33 (Table S1). Details about the principles, operations, and algorithms of AE31 and AE33 can be found elsewhere (Drinovec et al., 2015; Rajesh and Ramachandran, 2018). Briefly, ambient aerosol is drawn through a cyclone with a cut-off size of 2.5 µm at a flow rate of 2–5 L min−1 and deposited on a quartz fiber tape (AE31) or tetrafluoroethylene-coated glass filter (AE33). Changes in attenuation before and after sampling are measured and converted into aerosol absorption coefficients (babs), then into mass concentrations using the pre-defined mass attenuation cross-section (for AE31) or mass absorption cross-sections (for AE33) at 7 channels (370, 470, 520, 590, 660, 880, 950 nm). It should be noted that we adopted the acronym MAC throughout this paper to collectively denote both the mass attenuation cross-section and mass absorption cross-section. The BC mass concentration reported by the Aethalometer is referred to as equivalent black carbon (eBC) (Petzold et al., 2013; Savadkoohi et al., 2024). However, due to multiple scattering and loading effects, the reported eBC mass concentration differs from that in ambient air. To correct the loading and multiple scattering effects, the parameterization scheme developed by Weingartner et al. (2003) was used for babs reported by AE31. For AE33, the filter loading effect is compensated by a new real-time loading effect compensation algorithm, and the multiple-scattering effect is corrected by a multiple-scattering enhancement correction (C0) (Drinovec et al., 2015). The C0 values differ between AE31 (C0=2.14) and AE33 (C0=1.39) due to differences in tape materials (quartz fiber for AE31 and tetrafluoroethylene-coated glass filter for AE33). Another factor that influences eBC mass concentration is the MAC, which is determined by particle size, the mixing state of aerosol components, and the morphology of BC particles(Bond and Bergstrom, 2006; Bond et al., 2013; Yuan et al., 2021), and it shows spatial-temporal variations (Pandolfi et al., 2014; Zanatta et al., 2016; Grange et al., 2020; Guo et al., 2020; Savadkoohi et al., 2024). Therefore, using the nominal MAC from default settings (e.g., 16.6 m2 g−1 for AE31 and 7.77 m2 g−1 for AE33 at 880 nm) without considering MAC spatial-temporal variability can result in misleading eBC estimations (Savadkoohi et al., 2024). To minimize the impact of MAC on eBC mass concentration, station-specific MAC values (Table S1) from previous studies (Zhang et al., 2008; Guo et al., 2020; Zheng et al., 2021), which utilized synchronous measurements of babs and elemental carbon (EC) to derive MAC values, were used.
Before data analysis, the raw data (5 min for AE31 and 1 min for AE33) acquired from the Aethalometers was checked and the outliers were removed according to the following procedures: (1) negative values of attenuation at time t and the next observation time (e.g., t+5 min) were removed at all 7 wavelengths; (2) the observations which failed to comply with the principle that the light absorption decreases with increasing wavelength were removed and hourly mean values of remaining observations were calculated; (3) the outliers of the hourly time series during the entire observation period were removed using the seasonal decomposition algorithm (Dancho and Vaughan, 2023). It should be noted that our method to process the negative value differed from the manufacturer's protocol, which recommends retaining negative values and applying smoothing techniques to exclude anomalous data points. In our method, the negative values were directly removed. This is because the Aethalometer employs the time-differential method to measure the optical attenuation (ATN) at the sampling point and subsequently converts ATN into BC mass concentration. The time-differential method implies that if the difference between the ATN in the current observation period (ATNt) and that of the previous observation period (e.g., ATNt−5 min) is negative, the calculated BC mass concentration for period t will be negative. Furthermore, the difference between the ATN in the next observation period (e.g., ATNt+5 min) and that at time t (ATNt) will be overestimated, consequently resulting in an overestimation of the BC concentration at time t+5 min. The absorption Ångström exponent of aerosol was calculated using the power law fitting between babs and wavelengths at seven wavelengths and reported as AAE370–950. Observations with a p-value for fitting higher than 0.001 were considered as outliers and excluded from further analysis.
After data quality control, the data availability in each station of each year was calculated (Fig. S2). To get robust spatial-temporal variations of BC, the stations with annual data records exceeding 50 % were used. The 50 % threshold was selected to maximize the inclusion of monitoring stations while ensuring the collected data effectively captures the temporal variations of BC. To ensure data robustness, systematic screening criteria were applied: (1) long-term trend analysis required stations with more than 8 years of eBC observations, each year maintaining >50 % data availability; (2) spatial-temporal pattern analysis included stations with more than 2 years of valid observations during 2015 and 2017, where annual data completeness exceeded 50 %. According to these rules, 34 and 25 stations were selected for spatial-temporal and long-term trend analysis, respectively (Fig. 1). It should be noted that data from other stations with data availability higher than 50 % were also used (e.g., Sect. 4.1 for validation of the BC model simulations).
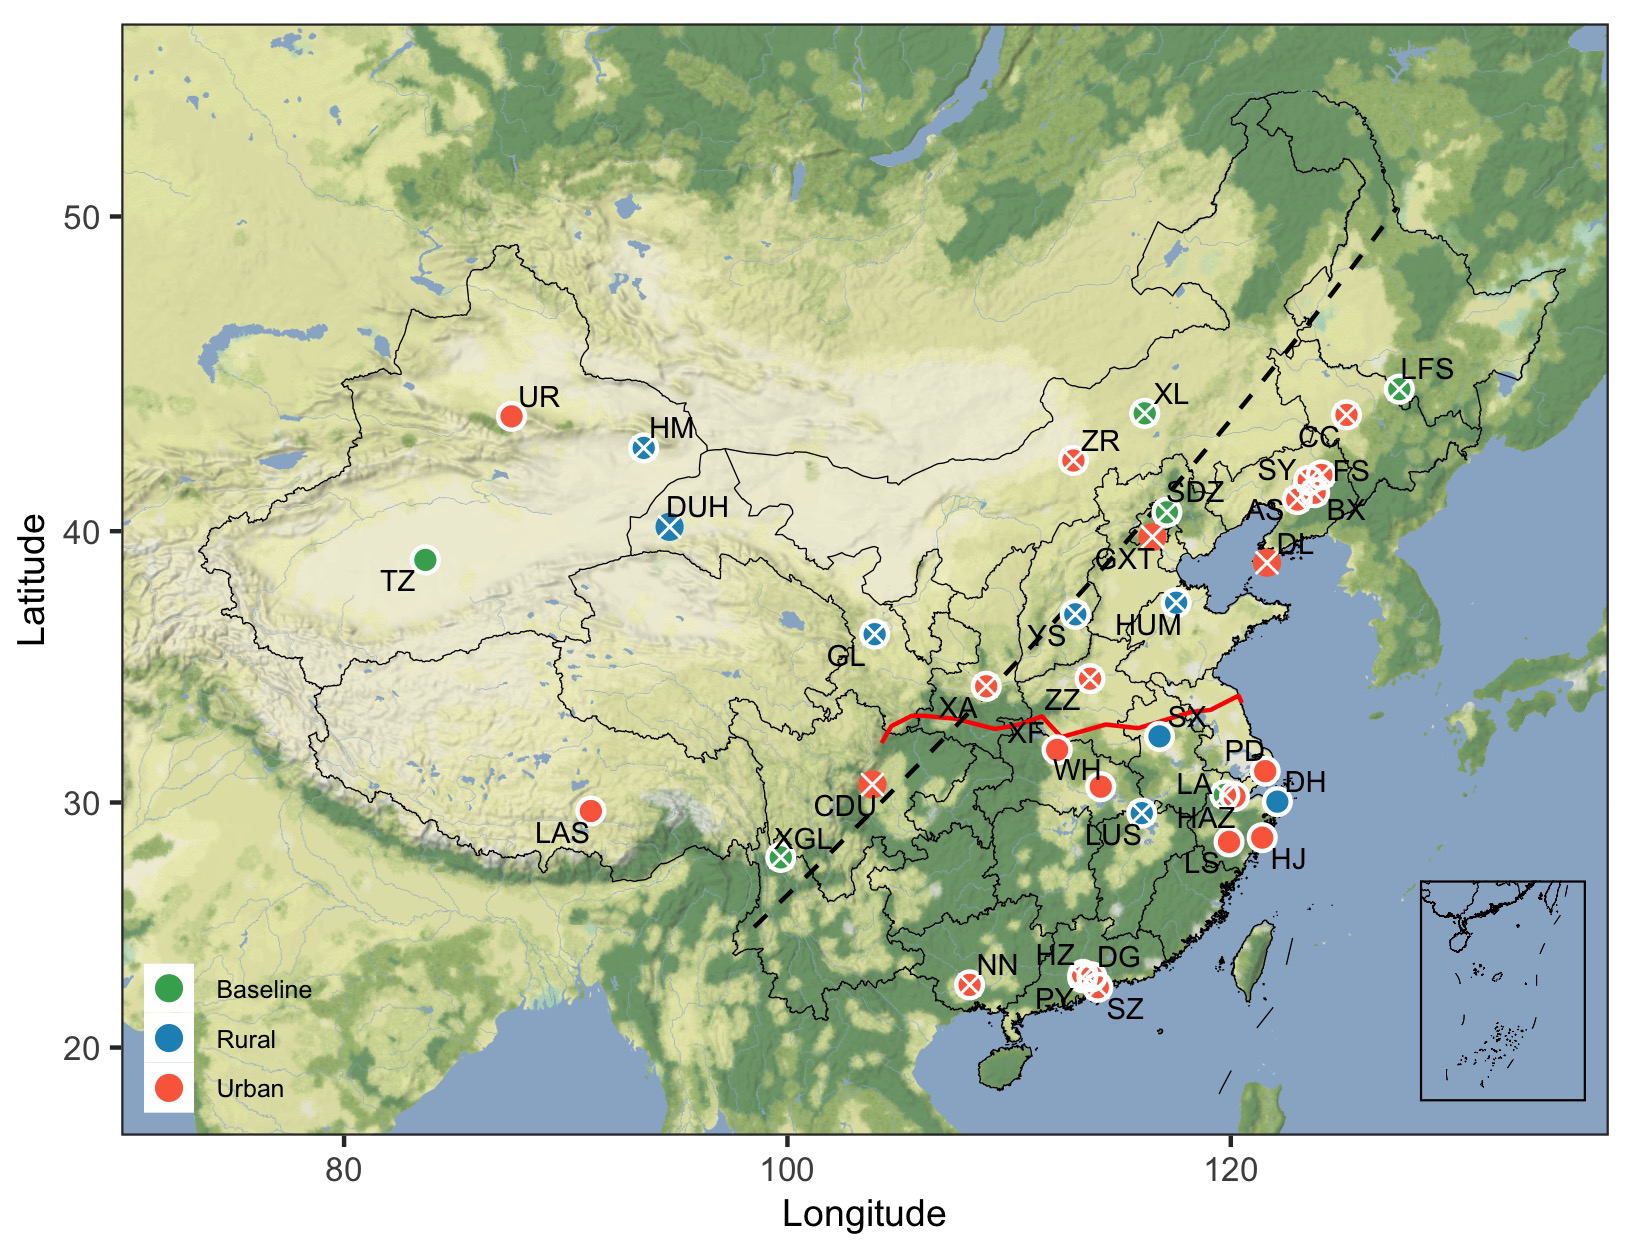
Figure 1Spatial distribution of ground-level black carbon monitoring stations. The dots with white circular frame and white crosses represent the stations used for spatial-temporal variation analysis between 2015 and 2017 (N=34) and long-term analysis from 2008 to 2020 (N=25), respectively. The colors of the dots indicate different types of stations. The black diagonal line represents the “Hu-Line”, which separates China into eastern and western parts. The red polyline represents the “Qinling-Huaihe Line”, which separates China into northern and southern parts. The full names of acronyms can be found in Table S1.
2.3 Aethalometer model and eBC source apportionment
BC is formed via the combustion processes of carbonaceous matter and is mainly from residential, power, industrial, and transport sectors (Bond et al., 2013; Li et al., 2017; McDuffie et al., 2020). To apportion the sources of BC, an Aethalometer model using aerosol absorption measurements at two wavelengths was developed by Sandradewi et al. (2008). The Aethalometer model operates on the assumption that light-absorbing aerosols originate predominantly from two source types (Sandradewi et al., 2008), e.g., liquid fuel combustion and solid fuel combustion, which are characterized by distinct Absorption Ångström Exponent (AAE) values. Aerosols derived from solid fuel combustion (AAEsf) generally exhibit higher and more variable AAE values compared to those from liquid fuel combustion (AAElf). The elevated AAEsf values are attributed to the presence of significant amounts of organic carbon species, which absorb strongly in the ultraviolet and lower visible wavelength ranges (Sandradewi et al., 2008). In contrast, the lower AAElf values result from the dominant contribution of BC, which absorbs light broadly across the visible spectrum. These source-specific AAE characteristics are consistent with laboratory combustion experiments, which also report higher AAE values for solid fuel emissions and lower values for liquid fuel emissions (Olson et al., 2015). Consequently, measured ambient AAE values can serve as an indicator of dominant BC sources, e.g., lower AAE values are typically associated with environments strongly influenced by liquid fuel combustion, such as road tunnels (Blanco-Alegre et al., 2020).
This method has been widely used in eBC source apportionment (Harrison et al., 2012; Zheng et al., 2019, 2020, 2021; Savadkoohi et al., 2023), and the results of this method are generally consistent with other methods, e.g., receptor models (Favez et al., 2010; Herich et al., 2011; Liu et al., 2014). In this study, eBC was apportioned into solid fuel combustion (eBCsf) and liquid fossil fuel combustion (eBClf) rather than biomass burning (eBCbb) and fossil fuel combustion (eBCff) as reported by previous studies conducted in China (Zheng et al., 2020; Wang et al., 2023; Xu et al., 2024; Fan et al., 2025). The rationale for differentiating eBC into solid fuel (e.g., coal and biomass) combustion and liquid fossil fuel combustion (e.g., vehicle emissions) was based on the following reasons. (1) Bottom-up BC emission inventories showed that BC from coal, solid bio-fuel, and liquid fossil combustion contributed 28.6 %, 19.6 %, and 28.0 %, respectively, to total emissions (Fig. S3a). The discrepancy between the fraction of solid fuel combustion emissions and the attribution of eBC to eBCsf results (48.2 % vs. 48.2 ± 7.14 %) was smaller than that between biomass burning emissions and the attribution of eBC to eBCbb results (19.6 % vs. 48.2 ± 7.14 %). (2) Based on experimental measurements of the AAE conducted on various aerosol types (Fig. S3b), the discrepancy between AAE values for aerosols from biomass burning and coal combustion (1.76 ± 0.40 vs. 1.47 ± 0.13) was smaller than that between liquid fossil fuel and solid fossil fuel combustion (1.00 ± 0.04 vs. 1.47 ± 0.13). Given these two reasons, eBC was apportioned into eBCsf and eBClf in this study.
The two key issues of using the Aethalometer model are the selection of the wavelengths and the AAE for aerosol from liquid fossil fuel combustion and solid fuel combustion. According to Zotter et al. (2017), wavelength of 470 nm as a near-ultraviolet wavelength is recommended while the choice between 950 and 880 nm in the near-infrared is less critical. Following previous studies (Sandradewi et al., 2008; Zotter et al., 2017), wavelengths of 470 and 950 nm were chosen in this study. The selection of AAElf and AAEsf, however, is more complicated. The AAE is used to describe the wavelength dependence of aerosol absorption. Although the aerosol AAE is impacted by particle size (Gyawali et al., 2009; Liu et al., 2018), chemical composition (Flowers et al., 2010; You et al., 2016), and morphology (Liu et al., 2008; Li et al., 2016), it can act as a proxy of aerosol composition (Yang et al., 2009; Russell et al., 2010). As summarized in previous studies (Helin et al., 2021; Zheng et al., 2021), aerosol from liquid fossil fuel combustion has an AAE value of ∼ 1.0, while aerosol from solid fuel combustion is characterized by a higher AAE value. Different methods were used to constrain the optimal AAE combinations, and it showed spatial heterogeneity (Fuller et al., 2014; Becerril-Valle et al., 2017; Zotter et al., 2017; Helin et al., 2018; Mousavi et al., 2019; Zheng et al., 2021). Due to the lack of auxiliary measurements (e.g., radiocarbon, levoglucosan, and potassium) to constrain the station-specific AAE combination, the measured aerosol AAE frequency distribution (Tobler et al., 2021; Rovira et al., 2025; Navarro-Barboza et al., 2025; Savadkoohi et al., 2025) was used to select the station-specific AAElf and AAEsf values here. Specifically, the AAElf and AAEsf were determined as the 1st and 99th percentiles of aerosol AAE, respectively. It should be noted that aerosol AAE was determined by power law fitting between light absorptions and wavelengths, and the fittings with the determinate coefficient (r2) less than 0.99 were excluded (Savadkoohi et al., 2025). By this method, the station-specific AAE values for the Aethalometer model were determined (Table S2). Compared to the default AAE values (AAElf= 1.0, AAEsf= 2.0), applying station-specific AAE values resulted in a mean change of 22.3 ± 8.10 % in the fractions of eBCsf and eBClf across most stations (Table S2). The source apportionment using station-specific AAE values better matched the proportions of BC from different fuel types in China (Fig. S3a). Validation against dual-carbon isotope data from previous studies (Fang et al., 2018; Ni et al., 2018) supports the use of station-specific AAE values. As shown in Fig. S4a, compared to results using default AAE values, the eBCsf fraction calculated with station-specific AAE values showed a stronger Pearson correlation (r= 0.37 vs. 0.20) with the solid-fuel combustion fraction (coal + biomass) determined by dual-carbon isotopes. Seasonal patterns of eBCsf derived from the Aethalometer model were consistent with those from carbon isotope analysis (Fig. S4b). Therefore, station-specific AAE values were adopted for BC source apportionment in this study.
While using station-specific AAE values derived from percentiles improved agreement with dual-carbon isotope results, the Aethalometer model still has several uncertainties. These include sensitivity to wavelength selection, the choice between fixed and variable AAE values, measurement noise, interference from non-BC absorbing components, source-specific variability, and limitations in temporal resolution (Zheng et al., 2021; Savadkoohi et al., 2025). The percentile-based approach is especially sensitive to sources with high brown carbon content (such as coal combustion) and complex source mixtures (Savadkoohi et al., 2025). Due to the unknown of the “real” BC source apportionment results, the accuracy of the Aethalometer model was assessed through error propagation (Martinsson et al., 2017; Zheng et al., 2020). The primary sources of uncertainty considered were the absorption coefficient and the AAE values. The uncertainty of babs was reported as 5 % (Hansen, 2005) and this value was adopted for this study. For the uncertainty of AAE values, their uncertainties were defined as the difference between the values derived from the percentile method and the isotope-constrained values from Zotter et al. (2017), e.g., 0.90 for AAElf and 1.68 for AAEwb. This approach was justified as the mean optimal AAElf and AAEsf values obtained here (0.90 ± 0.05 and 1.70 ± 0.23, respectively) were closely aligned with the literature values. The error propagation analysis revealed station-specific relative uncertainties in the range of 19.8 %–53.8 % for eBCsf and 23.7 %–54.0 % for eBClf (Table S3). The reported uncertainties here were comparable to previous studies, e.g., 41 % for fossil fuel combustion and 42 % for wood burning estimated by Martinsson et al. (2017). Despite the relatively high estimated uncertainty, the spatial and temporal patterns of BC sources resolved from the Aethalometer model were believed reliable here.
2.4 Weather normalization of eBC and its sources
To normalize the impact of meteorological conditions on variations in eBC and its sources, a machine learning method (Grange et al., 2018) was used in this study. According to previous research (Zheng et al., 2023b), the random forest (RF) model with hyperparameters tuned during model training and temporal variables excluded in weather normalization can reduce the bias in long-term trends of air pollutants. We adopted these recommendations to normalize the impact of weather on BC and its sources at each station. The entire observation dataset was divided into two parts: 70 % was used to train the model, and the remaining 30 % was used to evaluate model performance. The variables used to train the model included meteorological conditions, temporal variables, and a transport indicator. Specifically, temperature at 2 m (t2m), surface pressure (sp), wind components at 10 m (u10, v10), relative humidity (rh), accumulated precipitation along the trajectory (apt), boundary layer height (blh), surface downward solar radiation (ssr), and total cloud cover (tcc) were used. The temporal variables included Unix time (number of seconds since 1 January 1970) as a linear trend term, Julian day (day of the year) as the seasonal term, and day of the week. The transport indicator was the cluster category of air masses reaching the observational site, calculated by the Hybrid Single-Particle Lagrangian Integrated Trajectory (HYSPLIT) (Stein et al., 2015). Three key hyperparameters, including the number of trees (ntree), the number of variables that may split at each node (mtry), and the minimum size of terminal nodes (min.node.size), were tuned by random search with 5-fold cross-validation after 100 evaluations. The search space was 100–1000, 1–13, and 1–13 for ntree, mtry, and min.node.size, respectively. After tuning, the optimal parameter combination (Table S4) with the lowest root mean square error (RMSE) was used to train the RF model. Although the differences in statistical metrics between the RF model with tuned and untuned parameters were not significant (Fig. S5), the tuned model increased the Pearson correlation coefficient (r) and index of agreement (IOA), and reduced the RMSE. For instance, the r between observations and modeled eBC increased from 0.64 ± 0.07 (untuned) to 0.66 ± 0.07 (tuned). Therefore, the tuned parameters in Table S4 were used to train the RF model. After training, weather normalization of daily eBC and its sources was achieved by repeatedly resampling predictors and predicting with the trained RF model. For each prediction, the explanatory variables (meteorological conditions) in model training were randomly sampled from the entire dataset without replacement. This predictive process was repeated 1000 times, and the arithmetic mean of these predictions was considered the emission-related concentration (Zheng et al., 2023a, b).
2.5 Auxiliary dataset, data analysis and visualization
The auxiliary datasets used in this study included meteorological reanalysis data, surface BC mass concentrations from CTM simulations, and BC emission inventories. Meteorological conditions were obtained from the fifth generation of the European Centre for Medium-Range Weather Forecasts (ECMWF) reanalysis for global climate and weather (ERA5) (Hersbach et al., 2023). Monthly mean surface BC mass concentrations from 2008 to 2020 were sourced from the Modern-Era Retrospective analysis for Research and Applications, Version 2 (MERRA-2) (Global Modeling And Assimilation Office and Pawson, 2015) and Tracking Air Pollution in China (TAP) (Liu et al., 2022). Additionally, monthly mean BC concentrations from AeroChemMIP, endorsed by the Coupled Model Intercomparison Project 6 (CMIP6), were used in this study. We utilized the historical experiment from CMIP6, which incorporates time-varying emissions of greenhouse gases, aerosols, and ozone, as well as volcanic and solar forcing, spanning the period from 2008 to 2014. Model simulations from the Community Earth System Model 2 (CESM2), Centre National de Recherches Météorologiques (CNRM), Geophysical Fluid Dynamics Laboratory (GFDL), NASA Goddard Institute for Space Studies (GISS), Japan Meteorological Research Institute (MRI), UK Earth System Model (UKESM1) were used here (see Table S5 for details). This dataset provides a comprehensive representation of the key drivers of climate change, allowing assessment of the impacts of both anthropogenic and natural factors on global climate patterns during this period. Yearly BC emission inventories in China were obtained from several datasets, including the Copernicus Atmosphere Monitoring Service (CAMS Granier et al., 2019), Community Emissions Data System (CEDS Hoesly et al., 2018), Emissions Database for Global Atmospheric Research (EDGAR, versions V4.3.2 (Crippa et al., 2018), V5 (Crippa et al., 2019), and V6 Monforti Ferrario et al., 2021), Hemispheric Transport of Air Pollution (HTAP, version V3 Crippa et al., 2023), and the Multi-resolution Emission Inventory model for Climate and air pollution research (MEIC, version 1.4 Geng et al., 2024).
Data analysis was conducted using the R language (R Core Team, 2024). Outlier detection was performed using the “anomalize” package (Dancho and Vaughan, 2023). The “rmweather” (Grange et al., 2018) and “mlr3” (Lang et al., 2019) packages and their extensions were used for weather normalization analysis. Model performance statistics were calculated using “openair” (Carslaw and Ropkins, 2012). Figures in this study were generated using “ggplot2” (Wickham, 2016) and its extensions. Other packages (e.g., “lubridate”, “plyr”) used in this study are available from the Comprehensive R Archive Network (CRAN, https://cran.r-project.org, last access: 3 June 2025).
3.1 Spatial-temporal variations
Table S6 summarizes the statistics of eBC mass concentrations, source apportionment results, and AAE370–950 values at 34 monitoring stations during the study period (2015–2017). The average mass concentrations of eBC, eBClf, and eBCsf, as well as AAE370–950, were 2.05 ± 2.85, 1.08 ± 1.73, 0.97 ± 1.52 µg m−3, and 1.33 ± 0.29, respectively. Fig. 2 shows the spatial distributions of eBC mass concentrations and their source apportionment results between 2015 and 2017. As shown in Fig. 2a, BC from MERRA-2 showed higher levels in the east of the “Hu-Line” compared to those west of the line. As shown in Fig. 2b, ground observations also showed higher levels in eastern China (2.25 ± 2.82 µg m−3) than in western China (1.51 ± 2.86 µg m−3). Similarly, the spatial distribution of eBC observations showed higher levels in northern China (2.19 ± 3.45 µg m−3) than in southern China (1.91 ± 2.05 µg m−3). The eBC concentrations at different types of stations also showed spatial heterogeneity, with the highest values at urban stations (2.67 ± 3.41 µg m−3), which were significantly higher than those at rural (1.25 ± 1.50 µg m−3, p<0.05) and baseline (1.07 ± 1.15 µg m−3, p<0.01) stations. The percentages of solid fuel combustion in eBC ranged from 33.5 ± 24.9 % to 65.2 ± 24.8 %, with the highest mean value at baseline stations (49.9 ± 10.9 %). Regarding the spatial distribution (Fig. 2c), eBCsf in eastern China (49.7 ± 7.43 %) and northern China (50.0 ± 7.25 %) were higher than those in western China (44.4 ± 4.55 %) and southern China (46.5 ± 6.77 %) without statistical differences. As shown in Fig. 2d, the station-specific AAE370–950 values were in the range of 1.11 ± 0.13–1.66 ± 0.40 and the urban stations had the lowest mean values (1.29 ± 0.11) compared to those in baseline stations (1.40 ± 0.09) and rural stations (1.40 ± 0.16). Similar to the spatial distribution of eBCsf, AAE370–950 in northern China (1.43 ± 0.12) was significantly higher (p<0.001) than those in southern China (1.24 ± 0.07) and AAE370–950 in western China (1.44 ± 0.13) was also significantly higher than those in eastern China (1.30 ± 0.12) at 0.01 levels.
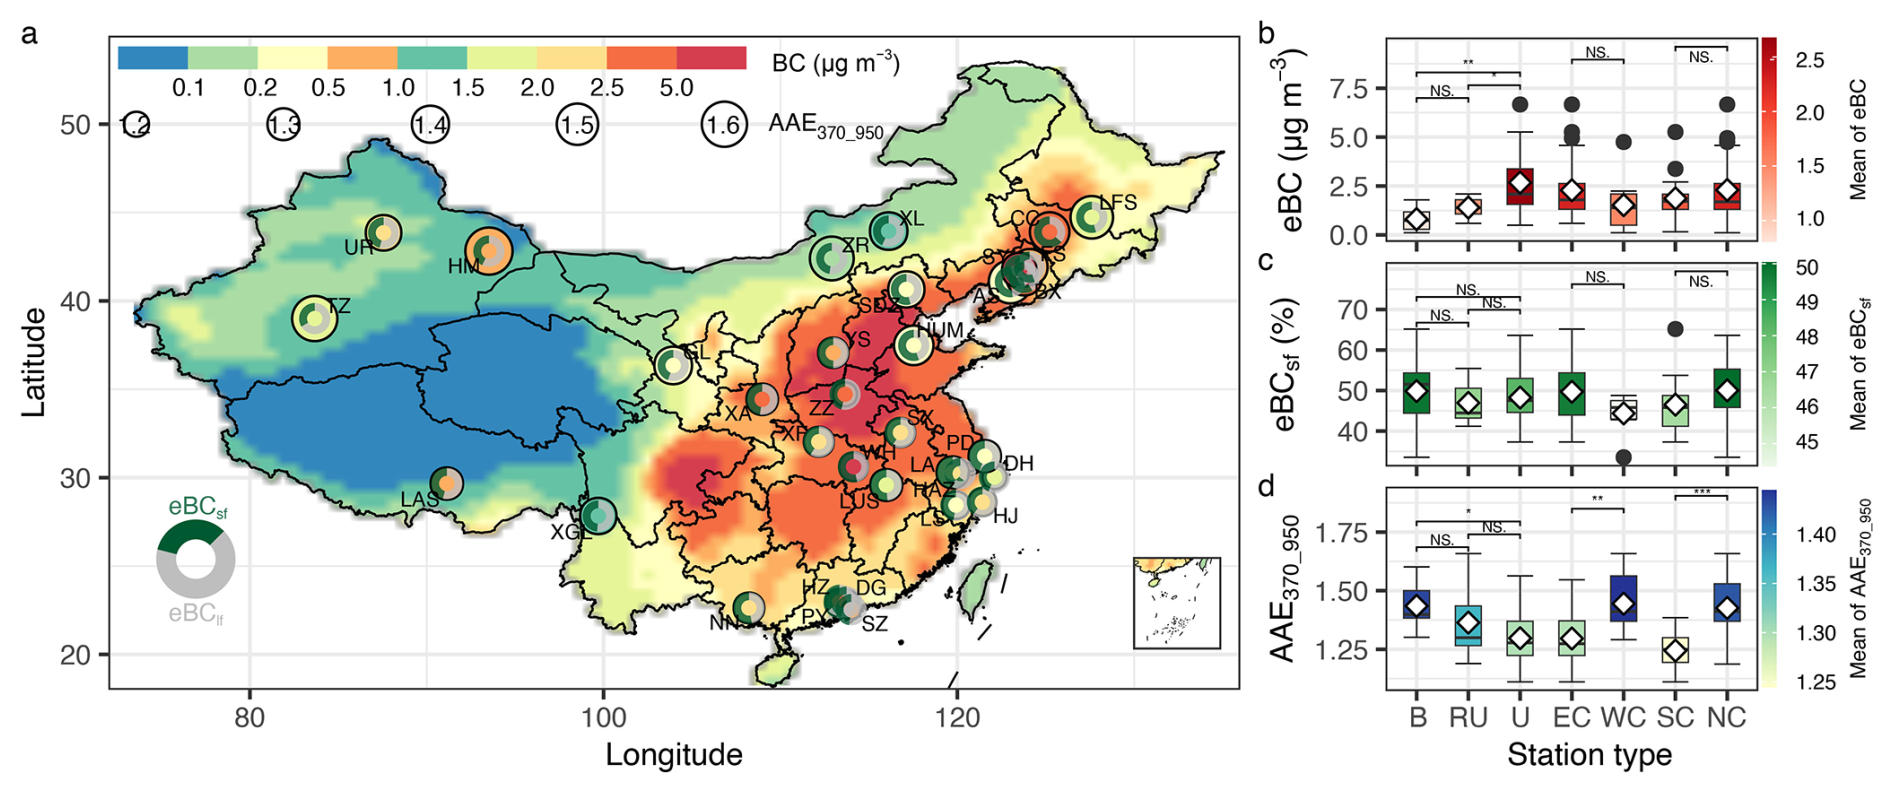
Figure 2Spatial distributions of mean values of BC concentrations, sources of eBC including solid fuel (eBCsf) and liquid fuel (eBClf) combustion, and absorption Ångström exponent between 2015 and 2017 (a), and their box plots (b)–(d) showing station-specific values for different types of stations, including baseline (B), rural (RU), and urban (U), as well as different regions in China: eastern China (EC), western China (WC), southern China (SC), and northern China (NC). The sizes and colors of the dots in panel (a) correspond to the mean values of AAE and eBC, respectively. The donuts in panel (a) represent the source apportionment results of eBC in each station. The data in the filled grid in panel (a) is from MERRA-2. NS, *, , and in panels (b)–(d) indicate differences between two paired groups that are not significant (p>0.05) or significant at the 0.05, 0.01, and 0.001 levels, respectively.
The monthly variations of eBC, eBCsf, and AAE370–950 are shown in Fig. 3. Generally, the lowest values of eBC (1.46 ± 1.72 µg m−3), eBCsf (36.3 ± 24.7 %), and AAE370–950 (1.21 ± 0.28) occurred during summer (JJA), while the highest values were observed during winter (DJF). The higher values in winter were related to unfavorable meteorological conditions that hindered the dispersion of surface BC. Increased demand for heating also contributed to higher BC levels in winter, as evidenced by higher percentages of eBCsf (60.2 ± 22.7 %) and higher AAE370–950 values (1.45 ± 0.26). Some stations (e.g., 58370 and 58448), however, showed the highest eBC mass concentrations during May and July. These anomalously high eBC levels were related to biomass burning during the summer harvest season, as indicated by high eBCsf percentages. Previous studies also showed that these stations or regions were impacted by biomass burning during the summer harvest (Zha et al., 2014; Zhou et al., 2019). Another station with high levels of AAE370–950 during summer was Tazhong (51747), which was largely impacted by dusty weather from March to July (Zhou et al., 2023).

Figure 3Monthly variations of black carbon concentrations (eBC, a, b), the fraction of BC from solid fuel combustion (eBCsf, c, d), and the absorption Ångström exponent calculated by power law fitting at seven wavelengths (AAE370–950, e, f). The filled grids in the left panels represent the scaled monthly values, ranging from 0 to 1 to better show the station-specific monthly variations. Note that the darker the color represents the higher the value.
To investigate the drivers of spatial-temporal variations in BC, we performed a correlation analysis between BC concentrations, emissions, and meteorological parameters. BC emissions from different fuel types were obtained from CEDS-MAPS, which divides sources into solid bio-fuel, coal, liquid fuel plus natural gas, and process emissions (McDuffie et al., 2020). Meteorological data for 2015–2017 were sourced from the ERA5 reanalysis dataset (Hersbach et al., 2023). As shown in Fig. S6, mean BC concentrations during 2015–2017 were positively correlated with emissions at most stations (N=32), with Pearson coefficients of 0.65 for eBC, 0.56 for eBCsf, and 0.58 for eBClf. This significant correlation indicates that the spatial distribution of BC closely follows its emission patterns, which are higher in northern and eastern China (Wang et al., 2012). On a monthly scale, BC concentrations were positively correlated with emissions and negatively correlated with ambient temperature, boundary layer height, and wind speed at most stations (Fig. S6). Elevated BC levels in colder months were attributed to increased heating-related emissions and less favorable dispersion conditions (lower boundary layer height and wind speed) (Zhang et al., 2019b; Xie et al., 2025). Overall, both emission patterns and meteorological factors jointly controlled the spatial-temporal variability of BC in China.
3.2 Long-term trends from 2008 to 2020
Figure 4 shows the time series of eBC, eBClf, and eBCsf from 2008 to 2020. Despite eBC and its sources showing overall decreasing trends from 2008 to 2020, the year with peak values differed among the different types of stations. As shown in Fig. 4a, the annual mean concentrations of eBC and its sources at urban stations increased from 2008 to 2012 and then showed a downward trend to 2020. The inter-annual variations of eBC, eBClf, and eBCsf at rural stations showed peak values in 2009 and then continuously decreased until 2020. At baseline stations, eBC and its sources also showed downward trends with fewer variations compared to those at urban and rural stations. Using the Theil-Sen method, the slopes of eBC and its sources at each station were calculated. As listed in Table S7, most stations showed decreasing trends, while only a few sites (e.g., Yushe in Shanxi province) exhibited an increasing trend. The stations with decreasing trends had a mean slope of −0.17 ± 0.20 µg m−3 yr−1 for eBC, −0.12 ± 0.14 µg m−3 yr−1 for eBClf, and −0.06 ± 0.09 µg m−3 yr−1 for eBCsf, respectively. Regarding the trends in the different types of stations (Fig. 4b), eBC in urban stations (N = 14) showed the fastest decreasing rate with a slope of −0.20 ± 0.23 µg m−3 yr−1, which was quicker than that in rural stations (−0.17 ± 0.21 µg m−3 yr−1, N=6) and baseline stations (−0.10 ± 0.07 µg m−3 yr−1, N=5). Similarly, as shown in Fig. 4d, eBClf also showed the fastest decreasing rates in urban stations (−0.15 ± 0.16 µg m−3 yr−1), followed by rural stations (−0.09 ± 0.12 µg m−3 yr−1) and baseline stations (−0.05 ± 0.04 µg m−3 yr−1). The decreasing rates of eBCsf in baseline (−0.05 ± 0.04 µg m−3 yr−1) and urban stations (−0.06 ± 0.10 µg m−3 yr−1) were larger than those in rural stations (−0.08 ± 0.09 µg m−3 yr−1). The differences in trends of eBC, eBClf, and eBCsf between southern/western China and northern/eastern China showed no statistical significance, but higher decreasing rates were found in southern China and western China (Fig. S7).

Figure 4Annual concentrations of black carbon (a), black carbon from liquid fossil fuel combustion (eBClf, c), and solid fuel combustion (eBCsf, e) from 2008 to 2020 and box plots (b, d, f) of their trends in different types of stations including baseline (B), rural (RU), and urban (U) stations. The solid line in panels (a), (c), and (e) represents the annual mean values, and the filled ribbons represent the 99 % confidence intervals of mean values.
Long-term observational studies across China have widely reported decreases in BC concentrations over various periods. For example, BC concentrations in Beijing declined at an average rate of 0.19 µg m−3 per year between 2013 and 2022 (Xie et al., 2025). Similarly, an annual decrease of 0.10 µg m−3 was observed in Nanjing from 2014 to 2021 (Abulimiti et al., 2025), while a trend of −0.12 µg m−3 yr−1 was recorded at Mt. Lushan from 2008 to 2022 (Liu et al., 2025). These single-site observations consistently highlight the effectiveness of air pollution control policies in reducing BC concentrations. Our study reinforces these findings from a broader spatial perspective, confirming that the observed reduction in BC levels can be attributed to the implementation of national regulatory measures, such as the China Clean Air Action Plan and the Three-Year Action Plan.
3.3 Comparison with global observations
To better understand the levels of eBC and its characteristics in China, the results from this study were compared to those from other regions during the same observational period (2015–2017) on a global scale. Specifically, the observations were sourced from published papers, observation networks, and publicly accessible websites. Data for European countries and the US were obtained from EBAS (https://ebas-data.nilu.no/Default.aspx, last access: 18 July 2025) and the US EPA (https://aqs.epa.gov/aqsweb/airdata/download_files.html, last access: 18 July 2025), respectively. The location, station type, and instruments used in these observations are listed in Table S8. The data processing procedures for these observational datasets are described in Section S1 in the Supplement. Briefly, by harmonizing wavelengths, MAC, and AAE combinations, biases were minimized to ensure reliable comparisons.
Figure 5 shows the global distributions of mass concentrations of eBC, eBCsf percentages, and AAE values from previous studies or observation networks during 2015 and 2017. Despite differences among the sampling inlets and monitoring instruments (Table S8), the mean values of eBC observations in China (2.04 ± 1.53 µg m−3, N=35) were significantly lower than those in India (6.30 ± 4.12 µg m−3, N=23) at the 0.001 levels, but significantly higher than those in the UK (1.22 ± 1.10 µg m−3, N=14, p< 0.05), Spain (1.07 ± 0.98 µg m−3, N=9, p< 0.05), US (0.83 ± 0.63 µg m−3, N=65, p< 0.001), Germany (0.74 ± 0.64 µg m−3, N=13, p< 0.001), and Switzerland (0.61 ± 0.47 µg m−3, N=5, p< 0.001). Regarding BC from solid fuel combustion derived from the Aethalometer model, the results are influenced by the choice of wavelength pair and AAE combination. Other factors such as station type (e.g., background vs. traffic), instruments, and sampling inlets also impact the Aethalometer model results. The comparison here used an AAE combination of 1.0 for AAElf, 2.0 for AAEsf, and the wavelength pair of 370 nm and 880 nm to minimize the influence of AAE combination and wavelength pair selection on source apportionment results. As shown in Fig. 5e, eBCsf had the highest contribution in the US (30.2 ± 12.8 %, N=25), which was higher than that in this study (28.1 ± 10.9 %, N=34). The lowest contribution of eBCsf was found in Spain (13.3 ± 5.51 %, N=3), which was lower than that in China (p< 0.05). Similar to the spatial distribution of eBCsf, AAE also showed the highest value in the US (1.40 ± 0.13, N=26) and the lowest value in Spain (1.21 ± 0.06, N=3). The comparison of eBC trends between this study and other observations from 2008 to 2020 is shown in Fig. 6. Results from 88 stations (34 in this study and 54 from other observations) showed widespread decreasing trends of eBC in most stations (N=83), with mean trends of −4.36 ± 3.06 % yr−1. The slopes for eBC from 2008 to 2020 showed the fastest decreasing trend in the UK (−5.94 ± 2.26 % yr−1, N=12) and the slowest decreasing trend in the US (−2.61 ± 2.04 % yr−1, N=18). The eBC decreasing rates in Germany (−4.93 ± 2.51 % yr−1, N=16) and Switzerland (−5.66 ± 5.44 % yr−1, N=7) were also faster than those in this study for China (−3.98 ± 3.41 % yr−1, N=25).
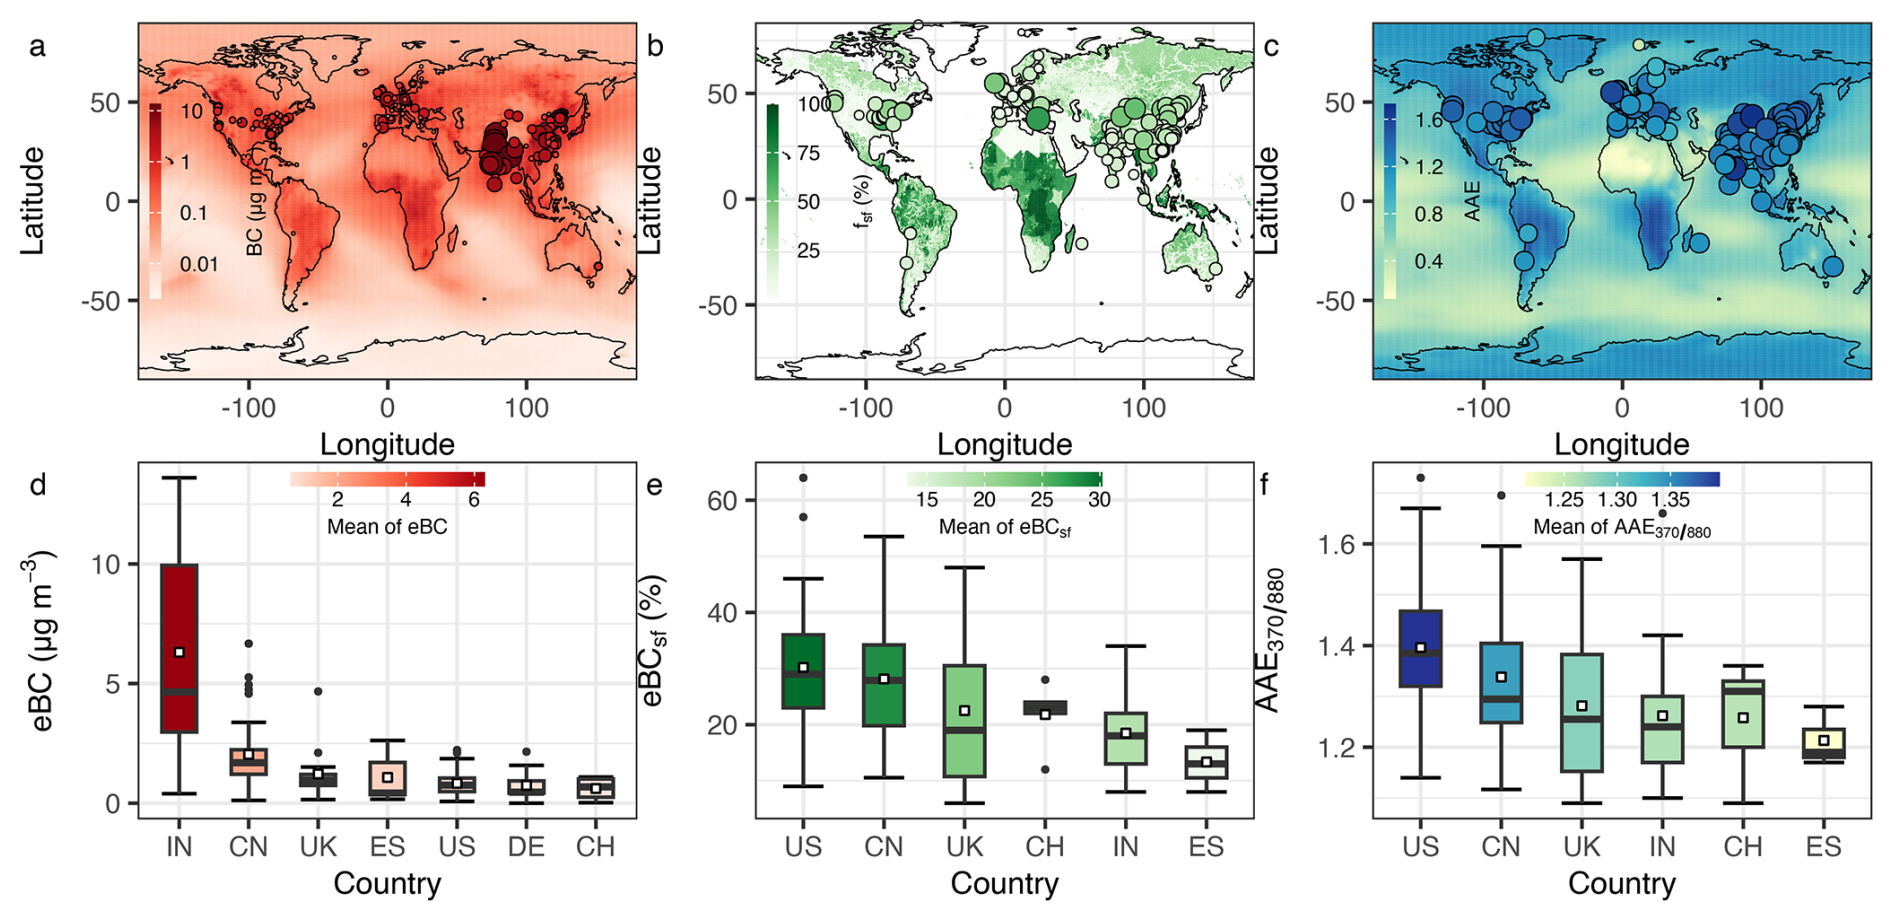
Figure 5Spatial distributions and box plots in black carbon concentrations (a, d), black carbon from solid fuel combustion (b, e), and absorption Ångström exponent (c, f) during 2015–2017. The filled base maps of panels (a) and (c) are from MERRA-2 and the base map of panel (b) is from CEDS-MAPS (McDuffie et al., 2020). The dots in panels (a)–(c) represent the observation values (see Table S8 for details) and the size of each dot is mapped to its value. Panels (d)–(f) are box plots of observations in different countries including India (IN), Switzerland (CH), China (CN), United Kingdom (UK), Spain (ES), Germany (DE), and the United States (US).
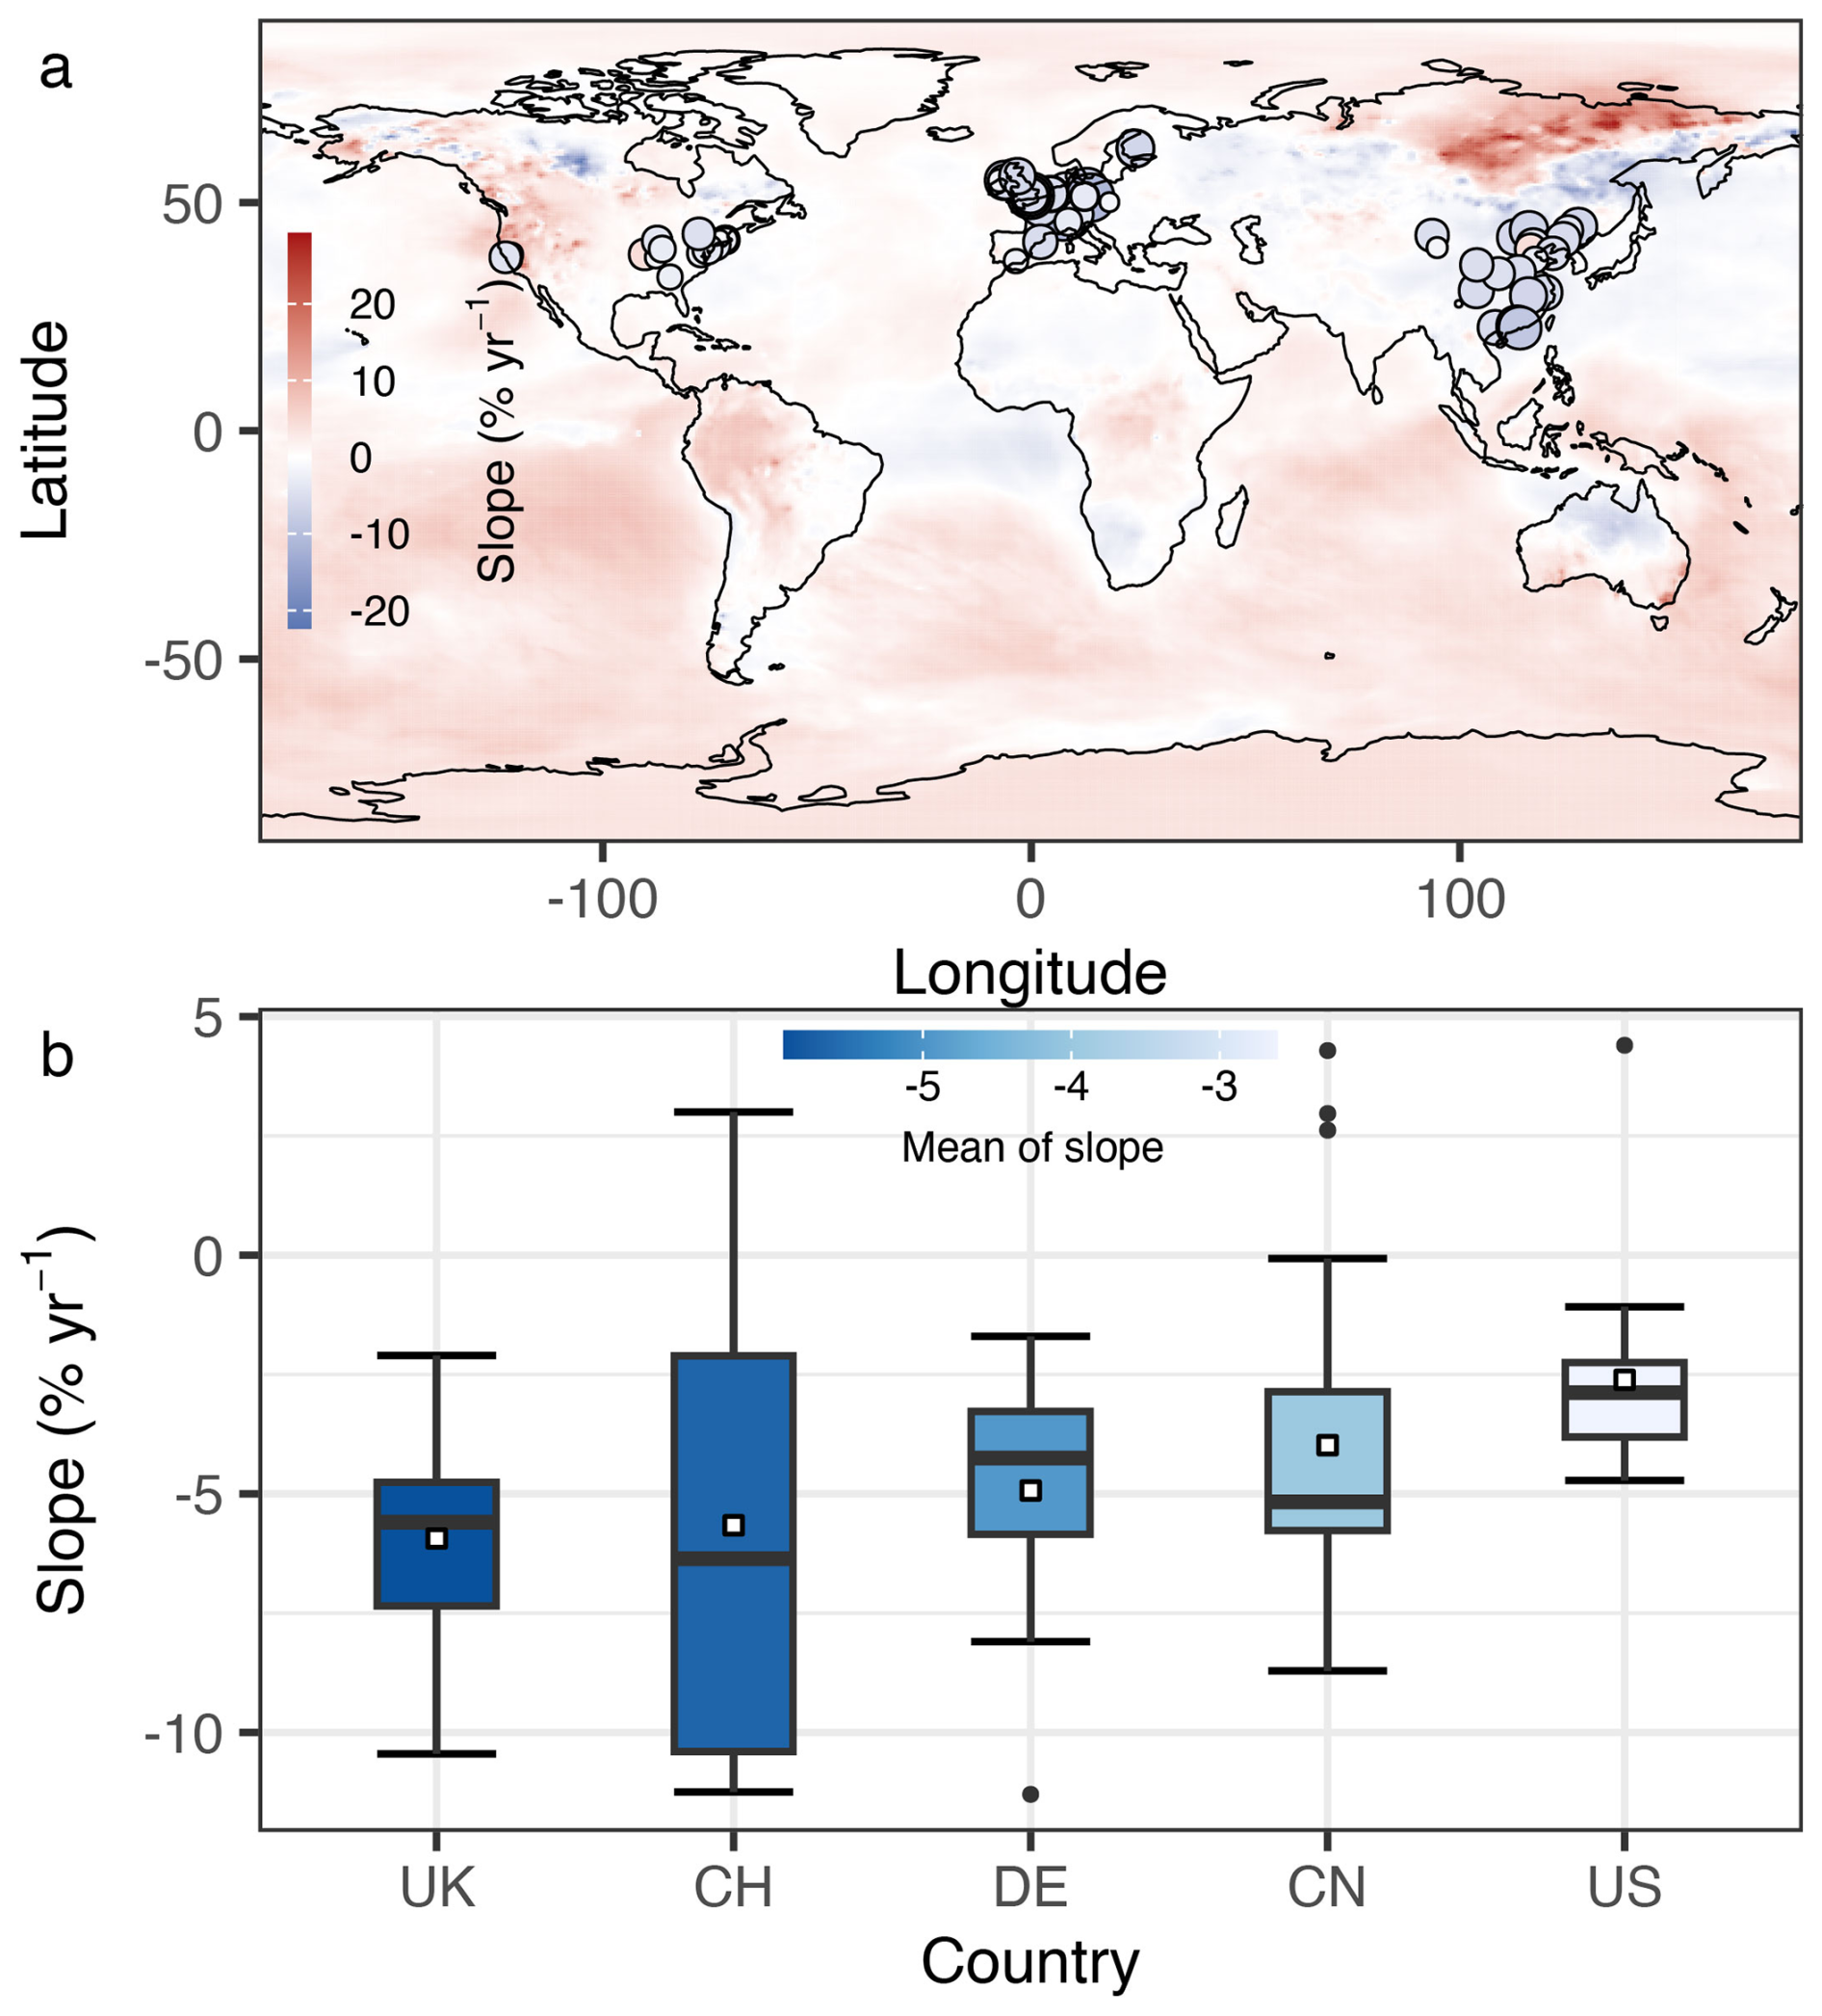
Figure 6Spatial distribution of black carbon concentration trends (a) and box plots of trends in different countries (b) from 2008 to 2020. The size of dots in panel (a) corresponds to the absolute value of slope. The fill color in panel (b) corresponds to the mean slope value in each country. Detailed information about slopes at each station can be found in Table S9.
This international comparison provides a global context for evaluating China's BC concentrations and trends, allowing for direct comparison with both developing countries (e.g., India) and developed countries (e.g., the United States, United Kingdom, Germany, Switzerland). The results highlight that while China achieved reductions in BC concentration, its concentrations still remain higher, and its rates of decline were slower than those observed in developed nations. In these countries, rapid BC reductions have been achieved through the implementation of stringent regulations (Luoma et al., 2021) and the adoption of cleaner technologies (Font and Fuller, 2016). These findings underscore the need for continued policy efforts in China, particularly targeting industrial and residential sources, and support the refinement of emission inventories to further reduce BC emissions.
4.1 Comparison with CTM simulations
Due to the lack of long-term global-scale observations, knowledge of atmospheric BC abundance continues to rely on CTM simulations. Therefore, it is important to evaluate the performance of CTMs in simulating the spatial-temporal variations of BC. Owing to the availability of long-term BC observations in China, the BC simulation results from different models (see Sect. 2.5 for details) were evaluated in this study. Regarding model performance in simulating the spatial distribution of BC, these models showed high values in East China, which were consistent with ground observations (Fig. 7). The r between mean values of simulations and observations from 2008 to 2014 ranged from 0.51 (MRI) to 0.70 (TAP). Compared to the observations, the CTMs underestimated the surface BC mass concentrations by 80.8 % (GISS) to 42.1 % (UKEMS1) in China from 2008 to 2014. The underestimation of surface BC concentrations by CTMs has been widely reported elsewhere (Koch et al., 2009; Fu et al., 2012; Mao et al., 2016; Qi and Wang, 2019). Among the different types of stations, the CTMs showed the highest performance in reproducing the surface BC concentrations at baseline stations (r= 0.83 ± 0.07, slope = 0.88 ± 0.42), followed by urban (r= 0.65 ± 0.10, slope = 0.44 ± 0.26), and rural stations (r= 0.20 ± 0.10, slope = 0.13 ± 0.08). The higher performance of CTMs in simulating BC in urban areas compared to rural areas is related to uncertainty in BC emissions. For instance, BC is mainly from vehicle exhaust in urban areas and is dominated by biomass burning and coal combustion in rural regions. The uncertainty in BC emission factors for gasoline and diesel vehicles is lower than that for biomass burning (Rönkkö et al., 2023). As a result, BC emissions in urban areas show less uncertainty (Zhao et al., 2011; Zhang et al., 2020), and simulations from CTMs produce less deviation from observations in urban areas.
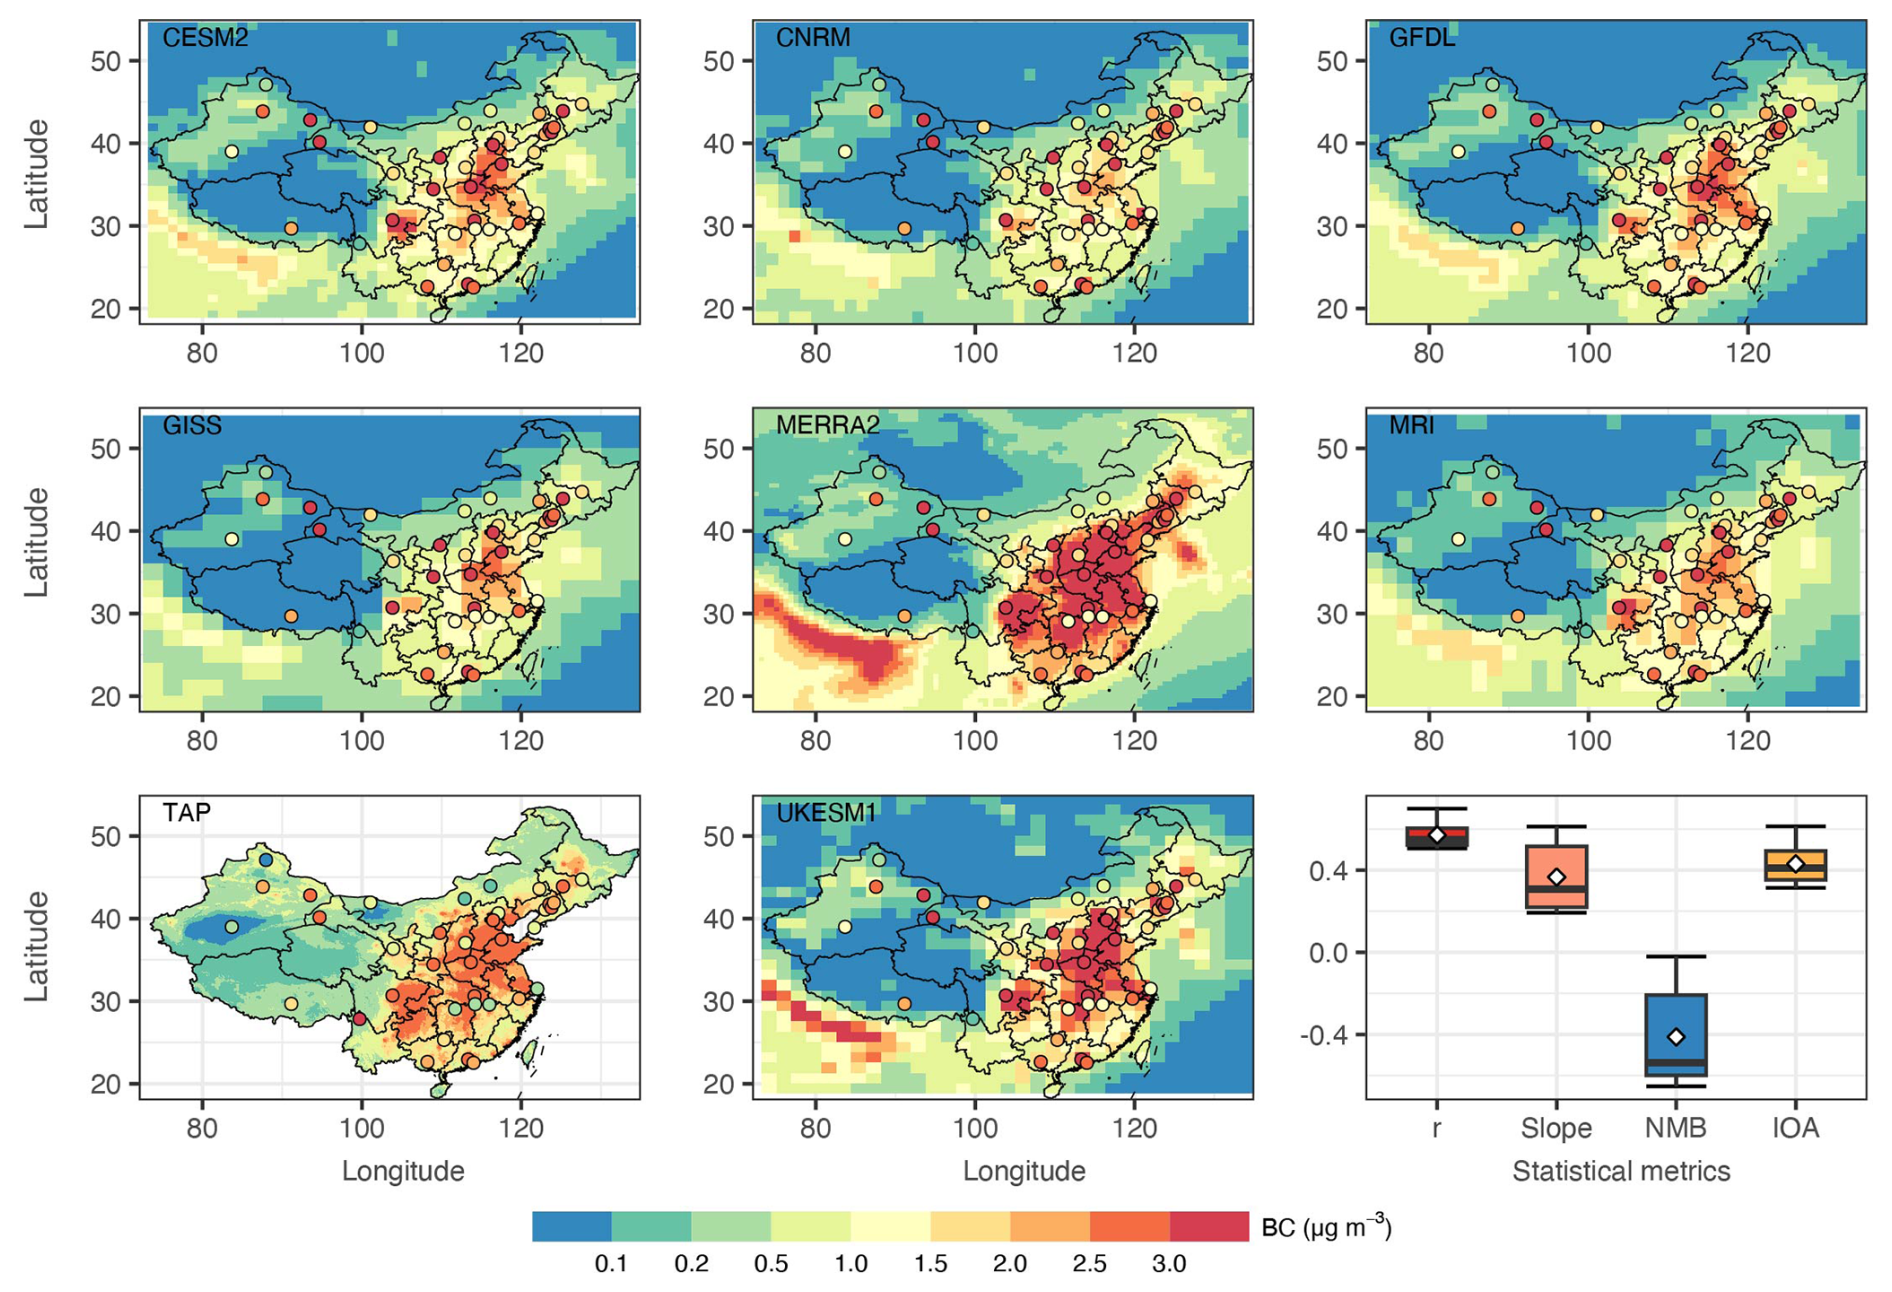
Figure 7Spatial distributions of surface BC observations and simulations from different chemical transport models during 2008–2014 and the statistical metrics of model performance. The NMB and IOA represent normalized mean bias and index of agreement, respectively.
Regarding the temporal variations of BC in China, the simulations from CMIP6, MERRA-2, and TAP showed similar monthly variations, with higher concentrations in winter and lower values in summer (Fig. 8a). The r between CTMs and observations ranged from 0.63 (GISS) to 0.87 (MERRA-2) on a monthly resolution. On the annual scale (Fig. 8b), except for TAP, annual concentrations of BC from CMIP6 historical experiments and MERRA-2 showed increasing trends from 2008 to 2014, while the ground observations and TAP showed decreasing trends in China. Except for TAP and MERRA-2, the correlations between observations and CMIP6 results were negative at the annual scale (Fig. 8d), suggesting these models failed to reproduce the yearly variations of surface BC. The upward trends of BC from CMIP6 historical experiments and MERRA-2 were related to their inter-annual BC emissions, which also showed increasing trends from 2008 to 2014 in China (Fig. S8). Similarly, the downward trends of surface BC concentrations from TAP were also in accordance with their emissions (MEIC), which showed a decreasing trend from 2008 to 2014 (Fig. S8). The opposite BC trends between ground observations and model simulations from CMIP6 in this study were similar to previous studies (Zhang et al., 2019b; Ramachandran et al., 2022). For instance, aerosol optical depth from observations showed a decrease, while CMIP6 simulations showed increasing trends during 2002–2018 in China (Ramachandran et al., 2022). Therefore, caution should be exercised when interpreting the temporal variations of aerosols using simulations from CMIP6.
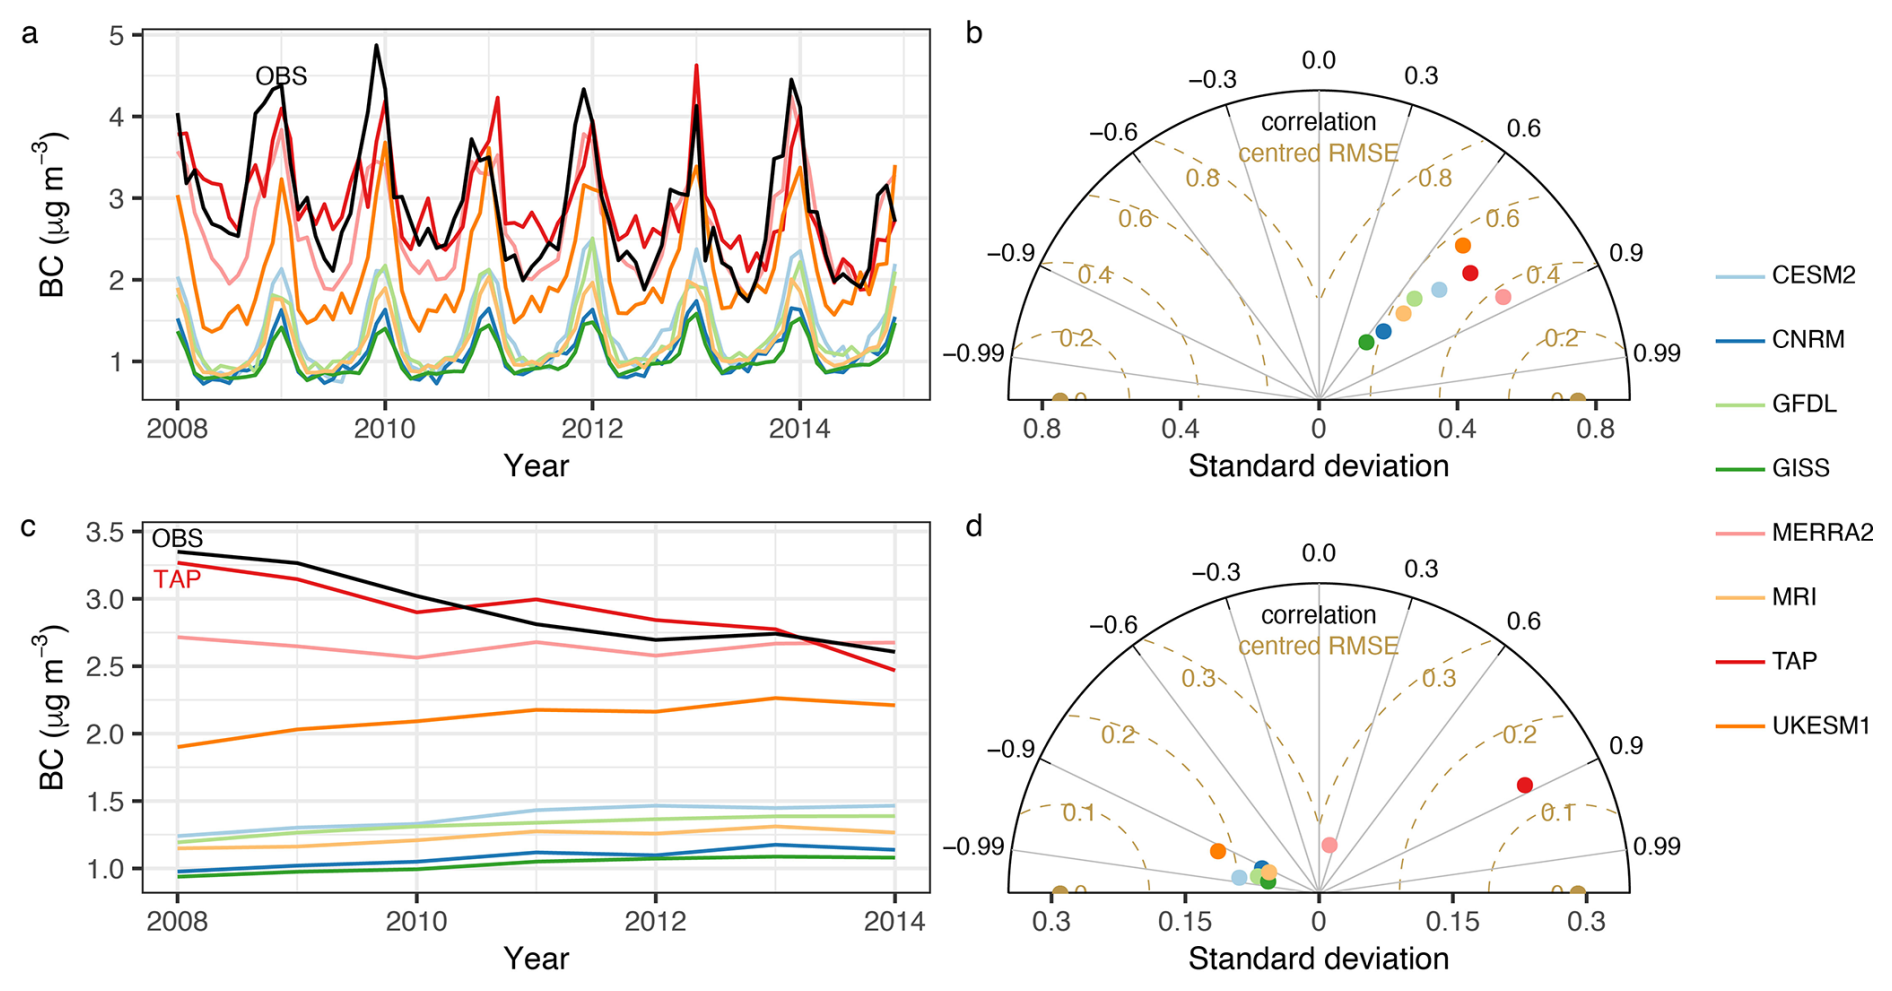
Figure 8Monthly (a) and inter-annual (c) variations of BC observations and surface BC simulations from different chemical transport models during 2008–2014, and their Taylor Diagrams showing model performance at monthly (b) and yearly (d) scales.
Due to the chemical inertness of BC particles, the deviations between observations and simulations arise from uncertainties in two aspects: emissions and deposition (Fan et al., 2018, 2022). The underestimation of BC emissions in China results in lower simulations of BC by CTMs. For instance, BC simulations were underestimated by 35 %–60 % in different seasons using the bottom-up BC emissions in China, while the CTM showed better performance with BC underestimated only by 22 %–9 % using the top-down constrained emissions (1.59 times higher than bottom-up emissions) (Fu et al., 2012). Similarly, the RMSE for annual BC simulation decreased by 31.6% if the BC emissions in China increased by 1.8 times (Wang et al., 2016). Using the MEIC instead of the emissions inventory for the Intergovernmental Panel on Climate Change Fifth Assessment Report (BC emissions increased by 13.4 %), the CTM improved the BC concentrations by 42.6 % (Fan et al., 2018). Despite the increase of BC emissions in CTMs, the models still underestimated the BC concentrations, suggesting an overestimation of BC deposition within CTMs. For instance, a better agreement between observations and simulations was achieved by reducing the BC dry deposition velocity by 50 % (Huang et al., 2010). Similarly, using the lower dry deposition, the CTM simulations resulted in a lower global mean BC dry deposition flux and a higher correlation between simulations and observations (Wu et al., 2018). The observations also suggested an overestimation of the BC aging degree in the CTMs, and sensitive simulations showed that slowing down the BC aging degree in model simulation can reduce the large model bias in the simulation of surface BC concentration over China (Shen et al., 2023).
To identify which factor (uncertainty in emission or deposition) makes a greater contribution to the uncertainty of BC simulation, we used the importance of each variable in RF model building (Sect. 2.4). As shown in Fig. S9, generally, date_unix was the variable with the greatest importance for the prediction of eBC, eBClf, and eBCsf in the RF model. Additionally, Julian day (seasonal term) had the third largest importance for the prediction of eBC and eBClf, while temperature showed higher importance for the prediction of eBCsf. These explanatory variables can serve as proxies for emissions of BC, e.g., more biomass burning during colder months for heating. The explanatory variables related to deposition (e.g., wind speed, precipitation), however, had less importance for prediction. Therefore, emissions were more important than deposition when explaining BC concentrations.
The comparison between the observed BC concentration values and simulations suggests that to improve the model's accuracy, more attention should be given to updating the BC emission inventory. Here, we only discuss how to use BC observation data for updating the BC emission inventory, rather than attempting to complete this task. In practice, the BC emission inventory, observed concentrations, FLEXPART simulations, and Bayesian inversion framework can be integrated to update BC emissions (Evangeliou et al., 2018, 2021; Jia et al., 2021). For instance, Evangeliou et al. (2021) used BC observations, outdated prior BC emissions, and an inversion framework to estimate BC emissions during the COVID-19 lockdown in Europe. Their results showed a 23 % decline in BC emissions during the lockdown compared to the same period in the previous five years (2015–2019). Similarly, Jia et al. (2021) estimated a maximum weekly emission reduction of 70 % in eastern China and 48 % in northern China from 1 January to 10 March 2020. These studies showed improved accuracy of model simulations using posterior BC emissions compared to the prior emission inventory, highlighting the potential to reduce BC simulation uncertainty by incorporating BC observations and prior emissions.
4.2 Weather normalized concentrations: an indicator of BC emissions
Using the weather normalization method, the concentrations of eBC and its two sources (eBClf and eBCsf) were normalized. Compared to the eBC observations, a higher correlation between weather-normalized eBC concentrations and BC emissions was found (Fig. S10), suggesting that the normalized eBC concentration can better reflect emission variations. Therefore, the weather-normalized eBC concentration was used here to discuss its relationship with BC emissions. As shown in Fig. 9a, except for MEIC, BC from other emission inventories showed increasing trends since 2008, reaching peak values in certain years and then decreasing. In contrast, BC emissions from MEIC showed a continuous decrease since 2008, and their inter-annual variation was more consistent with weather-normalized eBC concentrations. In 2010, China began to fight against air pollution, and the Action Plan on the Prevention and Control of Air Pollution and the Three-Year Action Plan were implemented during 2013–2017 and 2018–2020, respectively. As a result of these actions, emission standards and activity levels changed over time. These factors are considered in the MEIC framework, which employs a technology-driven methodology to track China's energy statistics and technological advancements, reflecting shifts in emission characteristics across various sectors, fuels, products, combustion/process technologies, and emission control technologies in recent years (Li et al., 2017; Zheng et al., 2018; Geng et al., 2024). Therefore, the BC emissions from MEIC coincided more closely with weather-normalized concentrations. The BC emissions from other inventories, such as CEDS, are not calibrated; instead, they are derived from default emissions using the Speciated Pollutant Emission Wizard, due to the limited availability of national BC inventory estimates in other countries. The similar reduction rates of surface BC concentrations and emissions (53.6 % vs. 51.9 %) and their similar inter-annual variations from 2008 to 2020 in China also suggest that the normalized BC concentrations can be used as a proxy to scale BC emissions in recent years. Updating bottom-up BC emissions is time-consuming, as it requires collecting activity data (e.g., energy consumption). As summarized in Table S8 and mentioned above, there are several BC observation networks worldwide (e.g., UK, US, Germany, and India); the normalized BC observations can be used to calibrate the total BC emissions in these countries.
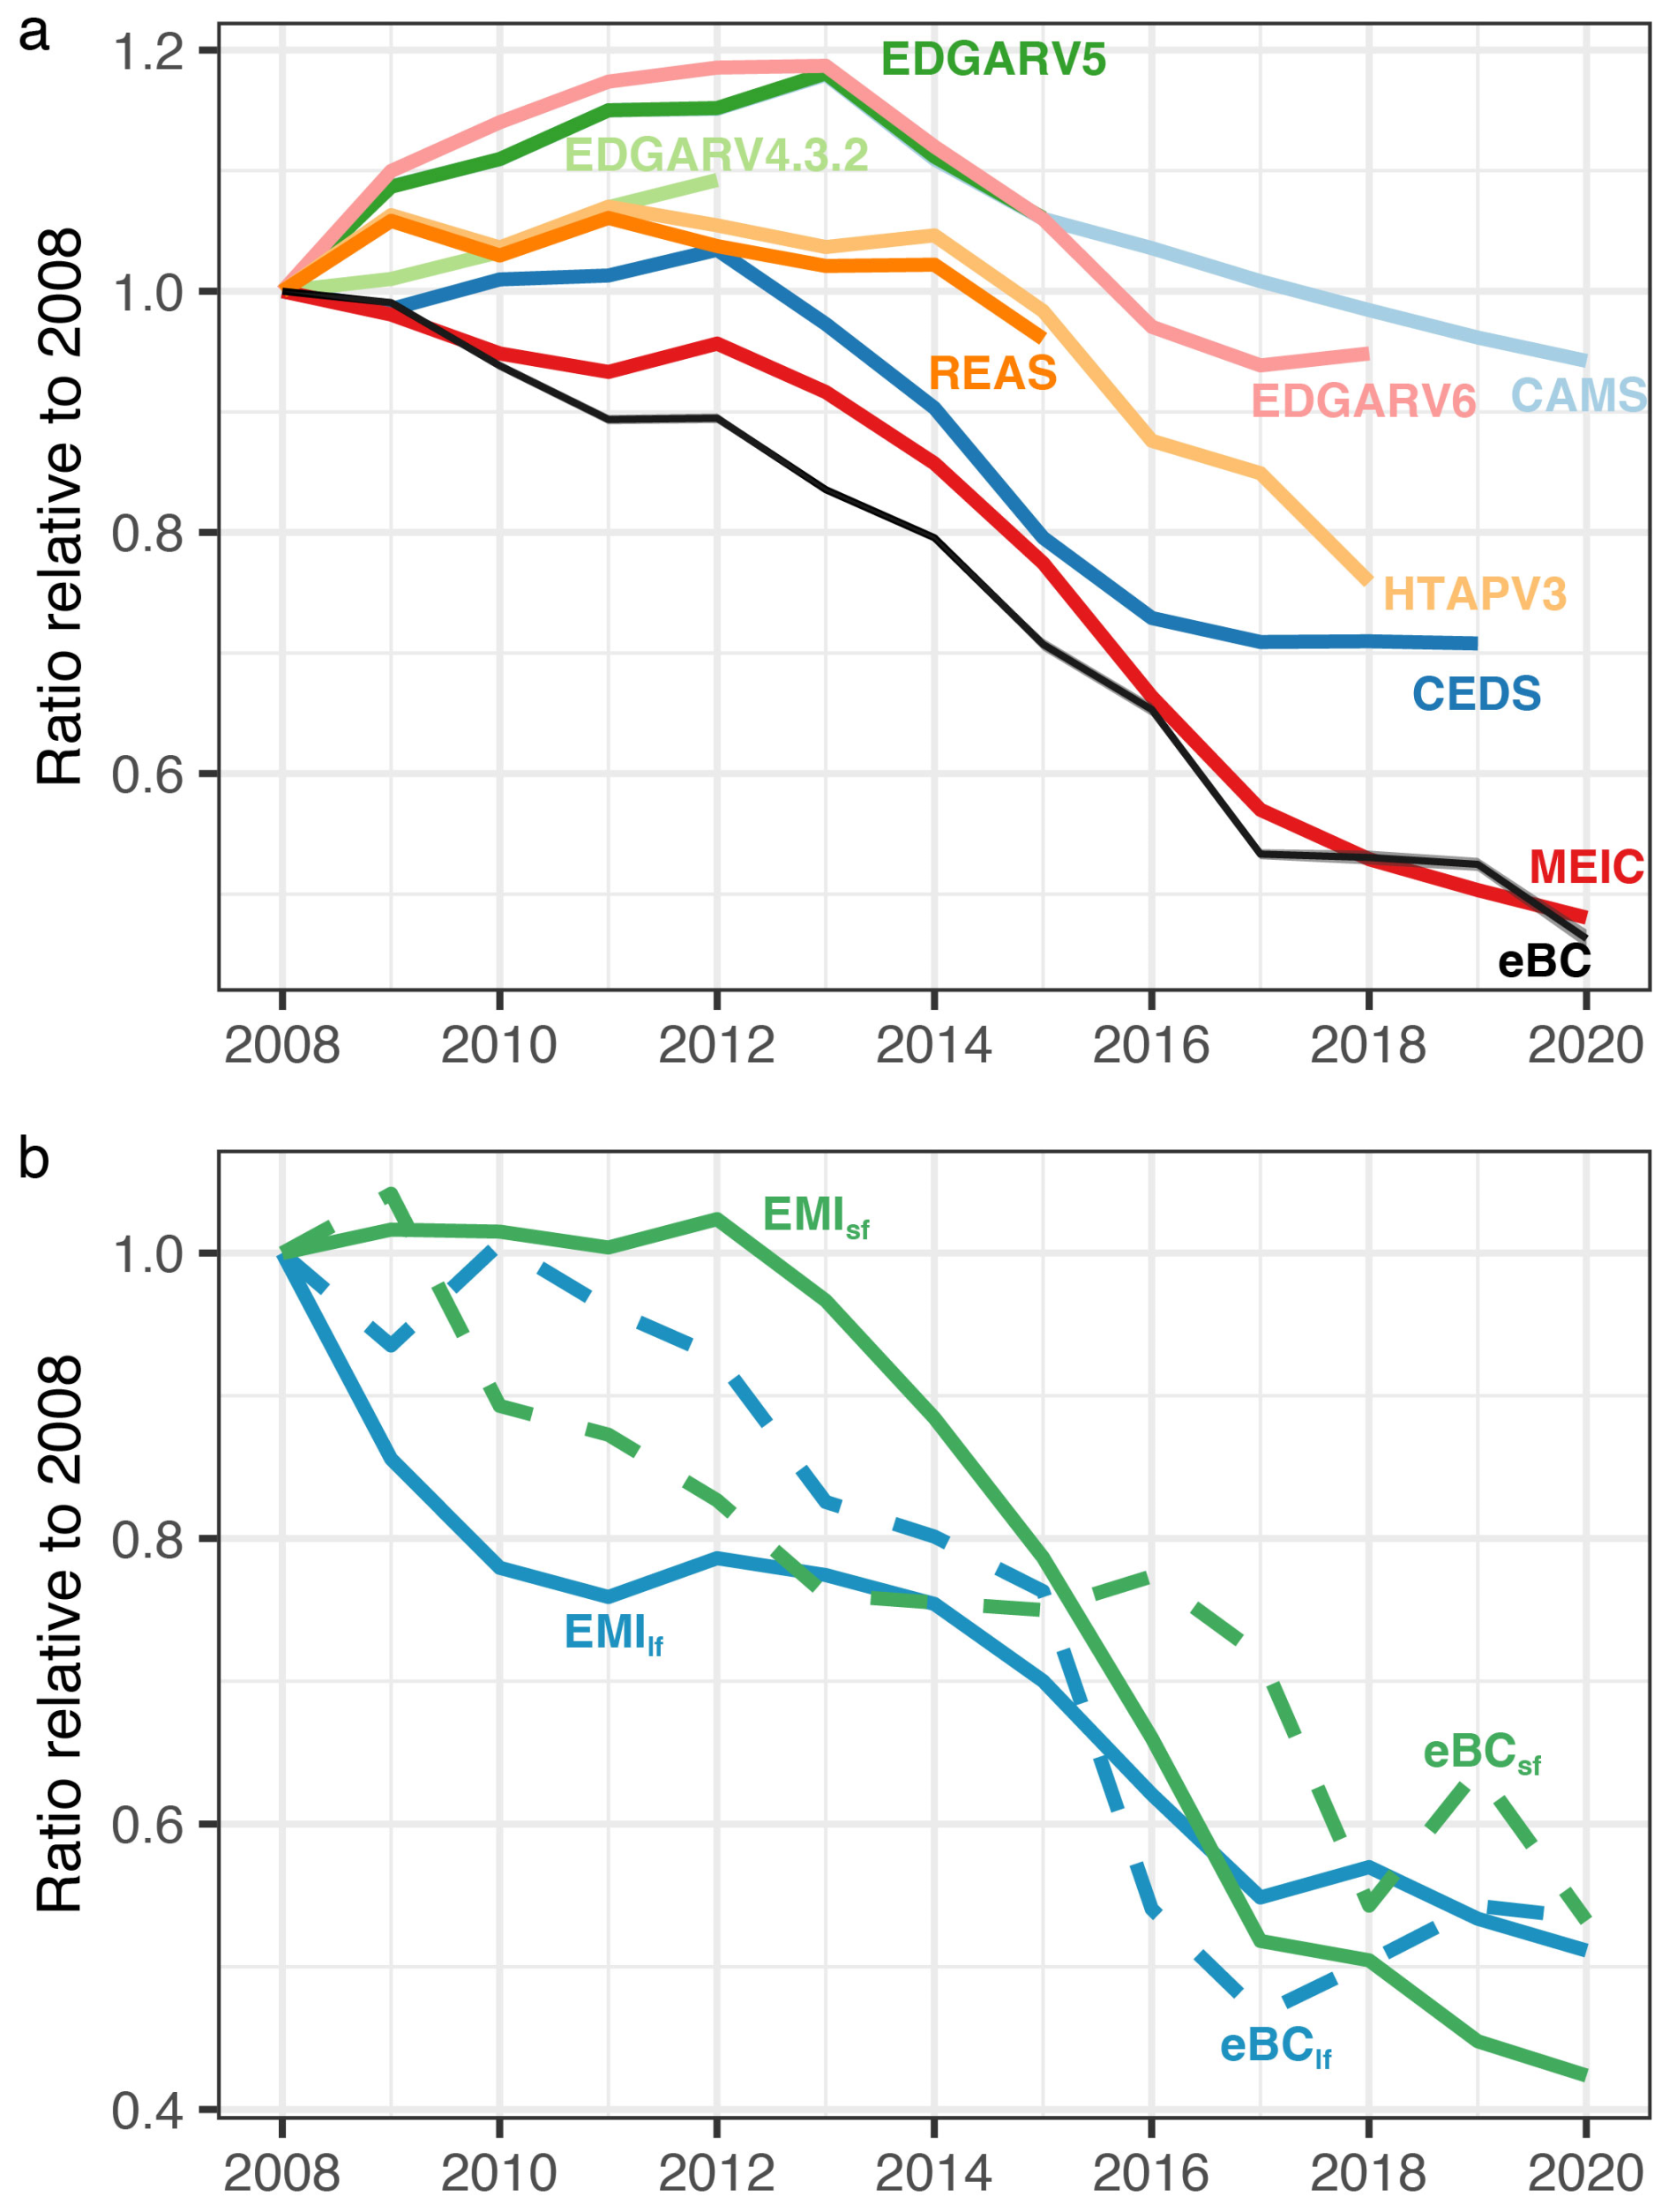
Figure 9The inter-annual variations of black carbon emissions from different emission inventories and observations (eBC) during 2008–2020 (a) and the BC emissions from solid fuel combustion (EMIsf) and liquid fossil fuel combustion (EMIlf) derived from MEIC and the BC sources including solid fuel combustion (eBCsf) and liquid fossil fuel combustion (eBClf) derived from the Aethalometer model (b).
To further explore whether the weather-normalized BC source contributions can be used as an indicator of BC emissions from different fuel types, the BC emissions from MEIC were used here. The sectors in MEIC (industrial, power, residential, and transportation) were further broken down into fossil fuel (liquid fuel + coal) and biomass burning according to (Wang et al., 2012). As shown in Fig. 9b, the variations of eBClf concentrations from the Aethalometer model aligned with their emissions, showing a continuous reduction from 2008 to 2020. In contrast, the inter-annual variation of eBCsf was not in line with its emissions, with a small peak in emissions in 2013, while its concentration continuously decreased since 2008. The higher correlation between eBClf and liquid fuel combustion emissions compared to that between eBCsf and solid fuel emissions (Fig. S11) suggests higher uncertainty in BC emissions from solid fuel combustion, as discussed in Sect. 4.1 and previous studies (Zhao et al., 2013; Zhang et al., 2020). Therefore, to further improve the accuracy in the BC emission inventory, more attention should be paid to the solid fuel combustion sub-sector, e.g., focusing on surveys of activity rates and measurements of local emission factors (Li et al., 2017; Jiang et al., 2024).
Accuracy in sectoral emissions is important to improve the performance of CTMs. Previous studies have demonstrated that uncertainties in BC emission inventory, originating from incomplete activity data, unrepresentative emission factors , and sectoral inconsistencies (Li et al., 2017), will propagate significant biases into chemical transport models. For instance, sectoral uncertainties are pronounced for residential and industrial sources in developing countries due to inconsistent emission factors and activity data. From a modeling perspective, these uncertainties dominate over other processes (e.g., aging, deposition) in near-source regions, while transport and removal uncertainties amplify errors in remote areas (Vignati et al., 2010). Another study showed that BC simulation was overestimated by a factor of 2.22, which can be attributed to the highest domestic emissions during winter in East Asia (Ikeda et al., 2022). Results from a top-down study showed the largest bias in residential and transportation sectors during January and July, and the bias of BC was reduced using the posterior emission inventory compared to the prior emission inventory (Zhao et al., 2019).
4.3 Drivers of black carbon variations in China
Using the weather-normalization method, the contributions of emissions and meteorology to the inter-annual variations of air pollutants can be quantified (Chen et al., 2019; Zheng et al., 2020, 2023b). As shown in Fig. S12, compared to the observations, the emission-related (weather-normalized) concentrations of BC were higher in each year. For instance, the national mean concentrations of emission-related and observed eBC in 2008 were 3.59 and 3.47 µg m−3, respectively, yielding meteorology-related concentrations of −0.12 µg m−3. The negative value of the meteorology-related concentration indicates favorable meteorological conditions for reducing BC concentrations. Similarly, meteorology also contributed to lowering the concentrations of eBClf and eBCsf at different types of stations (Fig. S12). To quantify the contributions of emission and meteorology to the reduction of BC concentrations, the slope between weather-normalized and observational trends was used. Results from Fig. 10a indicate that the reductions of eBC, eBClf, and eBCsf were dominated by emission-related reductions, with relative contributions of 89 %, 87 %, and 62 %, respectively, implying the effectiveness of human efforts in BC emission reduction. These results are consistent with previous studies showing that the inter-annual variations of air pollutants were dominated by emission changes (Chen et al., 2019; Cheng et al., 2019; Zhang et al., 2019a; Zheng et al., 2020, 2024). Compared to eBC and eBClf, eBCsf was more strongly impacted by variations in meteorological conditions, e.g., more coal and biomass were consumed for heating during colder months. To better understand which sources dominated the reduction of BC, the results from the Aethalometer model were used. As shown in Fig. 10b, the slopes of the fittings between eBCsf and eBClf in baseline and rural stations were greater than 1, suggesting the dominant role of BC emission reduction from solid fuel in the decreases of ambient eBC concentrations in these two types of regions. In contrast, the slope between eBCsf and eBClf in urban stations was less than 1, suggesting the dominant role of BC emission reductions from liquid fuel (e.g., vehicle emissions) in the decrease of eBC concentration in urban areas. The control measures related to BC emission reductions include stricter vehicle emission and industrial standards, eliminating outdated industrial capacity, prohibiting agricultural residue burning and scattered coal combustion, and replacing coal with natural gas and electricity (Zheng et al., 2018). The focus of BC mitigation measures, however, differs between rural and urban areas. In urban areas, BC emission reductions are related to stricter vehicle emission standards, improved fuel quality, and eliminating outdated industrial capacity (Xu et al., 2018; Zheng et al., 2018; Wang et al., 2020; Zhang et al., 2021), which result in less BC emissions from liquid fuel. In rural areas, BC emission reductions result from prohibiting agricultural residue burning, household stove upgrading, and energy switching, e.g., from coal to natural gas and electricity (Zhu et al., 2019; Meng et al., 2021; Shen et al., 2022). These measures lead to BC emission reductions from biomass burning and coal combustion. The results here are consistent with the differences in BC emission reduction measures between cities and rural areas, with rapid decreases of eBCsf in rural areas and eBClf in urban regions. Due to the limitation of the Aethalometer model, the BC sources are apportioned into eBCsf and eBClf, while the contributions of solid fossil fuel (e.g., coal) and biomass cannot be further separated from eBCsf (Zheng et al., 2021). To further understand which types of fuels (e.g., biomass, coal, liquid fuel) dominated the BC reductions in China, we used the estimated BC emissions from different fuels derived from MEIC. As shown in Fig. 10c, BC from coal combustion decreased by 0.38 Tg from 2008 to 2020 in China, followed by liquid fuel (0.16 Tg), and biomass burning (0.09 Tg). Therefore, emission reduction from coal combustion dominated the BC reduction in China, with a contribution of 60.3 %.

Figure 10The drivers of BC reduction including contributions from emission variations (a), different sources (b), and fuel types including liquid fossil fuel (LF), coal combustion, and biomass burning (BB) (c) in China.
In line with previous long-term observations of BC conducted in urban areas (Chen et al., 2016; Zheng et al., 2020; Sun et al., 2022; Xie et al., 2025; Abulimiti et al., 2025), these studies identified the predominant driving factor for BC reduction was the reduced emissions from fossil fuel combustion (e.g., coal and petroleum). Representative examples include studies in Wuhan (Zheng et al., 2020), Beijing (Xie et al., 2025), and Nanjing (Abulimiti et al., 2025). Unlike previous studies, this research also analyzed the driving factors behind BC reduction at rural and background sites. The results demonstrate that the decrease in BC concentrations is mainly attributed to reduced emissions from both coal and biomass combustion in rural and baseline areas. Evidence from BC emission data further support these findings. As shown in Fig. S13, BC emissions derived from the MEIC inventory (Geng et al., 2024) for biomass burning, solid fuel combustion, and liquid fuel combustion exhibited widespread reductions across most regions of eastern China between 2008 and 2020. Temporally, emissions from these sources showed consistent decreasing trends from 2008 to 2020 at rural, baseline, and urban stations. For example, BC emissions from rural residential energy consumption in northern China decreased from 0.85 Tg in 2010 to 0.55 Tg in 2020 (Zhang et al., 2023). These findings present novel and previously unreported conclusions based on observational data.
In this study, 13 years of continuous measurements of black carbon aerosol were analyzed from 48 stations in China. Using station-specific AAElf and AAEsf, the sources of eBC were apportioned. The levels, spatial-temporal characteristics, and trends of black carbon aerosol were reported, and the key findings of this unique dataset are listed as follows.
Observations of black carbon aerosols from 2015–2017 showed averages of 2.05 ± 2.85, 1.08 ± 1.73, 0.97 ± 1.52, and 1.33 ± 0.29 for eBC, eBClf, eBCsf, and AAE370–950, respectively, in China. Long-term trends of eBC, eBCsf, and eBClf indicated reductions from 2008 to 2020, with mean slopes of −0.17 ± 0.20 µg m−3 yr−1 for eBC, −0.12 ± 0.14 µg m−3 yr−1 for eBClf, and −0.06 ± 0.09 µg m−3 yr−1 for eBCsf on a national scale. Spatial distributions of eBC and eBCsf were higher in eastern and northern China compared to western and southern regions. Among different types of stations, urban stations exhibited the highest eBC values, while baseline stations had the highest fractions of eBCsf and AAE370–950. The seasonal variations of eBC, eBCsf, and AAE370–950 typically showed the lowest values in summer and the highest in winter. However, some stations recorded abnormally high eBC levels during summer, which were associated with biomass burning and dusty weather events. The spatial-temporal patterns of BC in China can be explained by its emission variations and meteorological conditions. The weather normalized BC concentrations showed that emission reductions were the primary driver, accounting for 89 % of the decrease in eBC, 87 % in eBClf, and 62 % in eBCsf. Urban stations showed the most rapid declines in eBClf, with the ratio of eBClf to eBCsf trends exceeding 1, indicating that reductions in liquid fuel combustion emissions were the main contributor to BC decreases in urban areas. In contrast, rural and baseline stations exhibited the fastest declines in eBCsf, suggesting that emission reductions from solid fuel combustion were the dominant factor in these regions.
This study provides valuable insights from China's long-term observations of BC aerosol, with significant implications for refining emission inventories and reducing model uncertainties. The comparison between observations and simulations revealed that most models failed to capture the inter-annual variation while the simulation with MEIC inventory was capable to reproducing the spatial and temporal variations of BC. Therefore, BC emissions from MEIC is recommended for modeling BC concentrations in China. Furthermore, a systematic model underestimation of BC was found particularly at rural stations, which emphasized the need to refine both emission source strengths and deposition processes to improve model accuracy. This study showed that the weather normalization is a promising technique for refining BC emission inventories, as the weather normalized BC concentrations showed a stronger correlation with the reported BC emissions than raw observations. Further analysis revealed a higher correlation between emissions and concentrations of BC from liquid fuel combustion. To reduce uncertainties in BC emissions, a target effort to improving accuracy of emission from the solid fuel combustion sub-sector is needed, including the collection of accurate BC emission factors from biomass and coal burning, as well as updating activity data in rural areas.
The code and data used to produce all figures are available from the Huang Zheng (zhengh@wust.edu.cn) and corresponding authors under reasonable request. The authors do not have the right to share the ground BC observations dataset; The BC from TAP can be downloaded from http://tapdata.org.cn (last access: 28 July 2023). BC mass concentrations from MERRA-2 can be downloaded from https://disc.gsfc.nasa.gov/datasets (last access: 17 August 2023); Surface BC observations in UK and USA can be accessed via https://uk-air.defra.gov.uk (last access: 6 November 2023) and https://www.epa.gov/outdoor-air-quality-data (last access: 21 August 2023). The light absorption coefficient to calculate BC mass concentration and AAE values are from EBAS (https://ebas-data.nilu.no/Default.aspx (last access: 6 November 2023); Historical simulations of surface BC during 2008–2014 from CMIP6 are available from https://esgf-node.llnl.gov/projects/cmip6/ (last access: 4 November 2023). The BC emission inventory used in this study can be downloaded from https://eccad.aeris-data.fr (last access: 25 September 2023), http://inventory.pku.edu.cn/home (last access: 14 November 2025), and http://meicmodel.org.cn (last access: 10 November 2023). Surface meteorological parameters from ERA5 are available at the Climate Data Store (https://cds.climate.copernicus.eu/datasets/reanalysis-era5-single-levels?tab=overview, last access: 4 October 2023). GDAS1 to drive HYSPLIT is available at https://www.ready.noaa.gov/data/archives/gdas1/ (last access: 29 October 2023).
The supplement related to this article is available online at https://doi.org/10.5194/acp-25-16363-2025-supplement.
HZ conducted the data analysis, data visualization, and wrote the paper. SK designed and edited the paper. DD provided the eBC observations in China and MS processed the pan-European eBC observations. CS, MZ, and RMH reviewed and commented on the paper. All co-authors reviewed and commented on the paper.
The contact author has declared that none of the authors has any competing interests.
Publisher’s note: Copernicus Publications remains neutral with regard to jurisdictional claims made in the text, published maps, institutional affiliations, or any other geographical representation in this paper. While Copernicus Publications makes every effort to include appropriate place names, the final responsibility lies with the authors. Views expressed in the text are those of the authors and do not necessarily reflect the views of the publisher.
We greatly thank the staff from the Chinese Meteorological Administration for maintaining the instruments.
This research has been supported by the National Natural Science Foundation of China (grant nos. 42307147, 42307151, and 41830965), the Ministry of Science and Technology of the People's Republic of China (grant no. 2016YFA0602002), and the European Commission, EU Horizon 2020 Framework Programme (grant no. 101036245).
This paper was edited by Gunnar Myhre and reviewed by two anonymous referees.
Abulimiti, A., Zhang, Y., Yu, M., Hong, Y., Lin, Y.-C., Gul, C., and Cao, F.: Sources and trends of black carbon aerosol in the megacity of Nanjing, eastern China, after the China Clean Action Plan and Three-Year Action Plan, Atmos. Chem. Phys., 25, 6161–6178, https://doi.org/10.5194/acp-25-6161-2025, 2025. a, b, c
Alvarado, M. J., Lonsdale, C. R., Macintyre, H. L., Bian, H., Chin, M., Ridley, D. A., Heald, C. L., Thornhill, K. L., Anderson, B. E., Cubison, M. J., Jimenez, J. L., Kondo, Y., Sahu, L. K., Dibb, J. E., and Wang, C.: Evaluating model parameterizations of submicron aerosol scattering and absorption with in situ data from ARCTAS 2008, Atmos. Chem. Phys., 16, 9435–9455, https://doi.org/10.5194/acp-16-9435-2016, 2016. a
Becerril-Valle, M., Coz, E., Prévôt, A., Močnik, G., Pandis, S., de la Campa, A. S., Alastuey, A., Díaz, E., Pérez, R., and Artíñano, B.: Characterization of atmospheric black carbon and co-pollutants in urban and rural areas of Spain, Atmos. Environ., 169, 36–53, https://doi.org/10.1016/j.atmosenv.2017.09.014, 2017. a
Birmili, W., Weinhold, K., Rasch, F., Sonntag, A., Sun, J., Merkel, M., Wiedensohler, A., Bastian, S., Schladitz, A., Löschau, G., Cyrys, J., Pitz, M., Gu, J., Kusch, T., Flentje, H., Quass, U., Kaminski, H., Kuhlbusch, T. A. J., Meinhardt, F., Schwerin, A., Bath, O., Ries, L., Gerwig, H., Wirtz, K., and Fiebig, M.: Long-term observations of tropospheric particle number size distributions and equivalent black carbon mass concentrations in the German Ultrafine Aerosol Network (GUAN), Earth Syst. Sci. Data, 8, 355–382, https://doi.org/10.5194/essd-8-355-2016, 2016. a, b
Blanco-Alegre, C., Calvo, A., Alves, C., Fialho, P., Nunes, T., Gomes, J., Castro, A., Oduber, F., Coz, E., and Fraile, R.: Aethalometer Measurements in a Road Tunnel: A Step Forward in the Characterization of Black Carbon Emissions from Traffic, Sci. Total Environ., 703, 135483, https://doi.org/10.1016/j.scitotenv.2019.135483, 2020. a
Bond, T. C. and Bergstrom, R. W.: Light absorption by carbonaceous particles: An investigative review, Aerosol Sci. Tech., 40, 27–67, https://doi.org/10.1080/02786820500421521, 2006. a
Bond, T. C., Doherty, S. J., Fahey, D. W., Forster, P. M., Berntsen, T., DeAngelo, B. J., Flanner, M. G., Ghan, S., Kärcher, B., Koch, D., Kinne, S., Kondo, Y., Quinn, P. K., Sarofim, M. C., Schultz, M. G., Schulz, M., Venkataraman, C., Zhang, H., Zhang, S., Bellouin, N., Guttikunda, S. K., Hopke, P. K., Jacobson, M. Z., Kaiser, J. W., Klimont, Z., Lohmann, U., Schwarz, J. P., Shindell, D., Storelyvmo, T., Warren, S. G., and Zender, C. S.: Bounding the role of black carbon in the climate system: A scientific assessment, J. Geophys. Res. Atmos., 118, 5380–5552, https://doi.org/10.1002/jgrd.50171, 2013. a, b, c, d, e
Boreddy, S. K. R., Haque, M. M., and Kawamura, K.: Long-term (2001–2012) trends of carbonaceous aerosols from a remote island in the western North Pacific: an outflow region of Asian pollutants, Atmos. Chem. Phys., 18, 1291–1306, https://doi.org/10.5194/acp-18-1291-2018, 2018. a
Bové, H., Bongaerts, E., Slenders, E., Bijnens, E. M., Saenen, N. D., Gyselaers, W., Van Eyken, P., Plusquin, M., Roeffaers, M. B., Ameloot, M., et al.: Ambient black carbon particles reach the fetal side of human placenta, Nat. Commun., 10, 3866, https://doi.org/10.1038/s41467-019-11654-3, 2019. a
Carslaw, D. C. and Ropkins, K.: openair – An R package for air quality data analysis, Environ. Modell. Softw., 27–28, 52–61, https://doi.org/10.1016/j.envsoft.2011.09.008, 2012. a
Chan, T. W., Huang, L., Banwait, K., Zhang, W., Ernst, D., Wang, X., Watson, J. G., Chow, J. C., Green, M., Czimczik, C. I., Santos, G. M., Sharma, S., and Jones, K.: Inter-comparison of elemental and organic carbon mass measurements from three North American national long-term monitoring networks at a co-located site, Atmos. Meas. Tech., 12, 4543–4560, https://doi.org/10.5194/amt-12-4543-2019, 2019. a
Chen, Y., Schleicher, N., Fricker, M., Cen, K., Liu, X., Kaminski, U., Yu, Y., Wu, X., and Norra, S.: Long-term variation of black carbon and PM2.5 in Beijing, China with respect to meteorological conditions and governmental measures, Environ. Pollut., 212, 269–278, https://doi.org/10.1016/j.envpol.2016.01.008, 2016. a, b, c
Chen, Z., Chen, D., Kwan, M.-P., Chen, B., Gao, B., Zhuang, Y., Li, R., and Xu, B.: The control of anthropogenic emissions contributed to 80 % of the decrease in PM2.5 concentrations in Beijing from 2013 to 2017, Atmos. Chem. Phys., 19, 13519–13533, https://doi.org/10.5194/acp-19-13519-2019, 2019. a, b
Cheng, J., Su, J., Cui, T., Li, X., Dong, X., Sun, F., Yang, Y., Tong, D., Zheng, Y., Li, Y., Li, J., Zhang, Q., and He, K.: Dominant role of emission reduction in PM2.5 air quality improvement in Beijing during 2013–2017: a model-based decomposition analysis, Atmos. Chem. Phys., 19, 6125–6146, https://doi.org/10.5194/acp-19-6125-2019, 2019. a
Choi, Y., Kanaya, Y., Park, S.-M., Matsuki, A., Sadanaga, Y., Kim, S.-W., Uno, I., Pan, X., Lee, M., Kim, H., and Jung, D. H.: Regional variability in black carbon and carbon monoxide ratio from long-term observations over East Asia: assessment of representativeness for black carbon (BC) and carbon monoxide (CO) emission inventories, Atmos. Chem. Phys., 20, 83–98, https://doi.org/10.5194/acp-20-83-2020, 2020a. a
Choi, Y., Kanaya, Y., Takigawa, M., Zhu, C., Park, S.-M., Matsuki, A., Sadanaga, Y., Kim, S.-W., Pan, X., and Pisso, I.: Investigation of the wet removal rate of black carbon in East Asia: validation of a below- and in-cloud wet removal scheme in FLEXible PARTicle (FLEXPART) model v10.4, Atmos. Chem. Phys., 20, 13655–13670, https://doi.org/10.5194/acp-20-13655-2020, 2020b. a
Crippa, M., Guizzardi, D., Muntean, M., Schaaf, E., Dentener, F., van Aardenne, J. A., Monni, S., Doering, U., Olivier, J. G. J., Pagliari, V., and Janssens-Maenhout, G.: Gridded emissions of air pollutants for the period 1970–2012 within EDGAR v4.3.2, Earth Syst. Sci. Data, 10, 1987–2013, https://doi.org/10.5194/essd-10-1987-2018, 2018. a
Crippa, M., Guizzardi, D., Muntean, M., Schaaf, E., and Oreggioni, G.: EDGAR v5.0 Global Air Pollutant Emissions, European Commission, Joint Research Centre (JRC) [data set], http://data.europa.eu/89h/377801af-b094-4943-8fdc-f79a7c0c2d19 (last access: 25 September 2023), 2019. a
Crippa, M., Guizzardi, D., Butler, T., Keating, T., Wu, R., Kaminski, J., Kuenen, J., Kurokawa, J., Chatani, S., Morikawa, T., Pouliot, G., Racine, J., Moran, M. D., Klimont, Z., Manseau, P. M., Mashayekhi, R., Henderson, B. H., Smith, S. J., Suchyta, H., Muntean, M., Solazzo, E., Banja, M., Schaaf, E., Pagani, F., Woo, J.-H., Kim, J., Monforti-Ferrario, F., Pisoni, E., Zhang, J., Niemi, D., Sassi, M., Ansari, T., and Foley, K.: The HTAP_v3 emission mosaic: merging regional and global monthly emissions (2000–2018) to support air quality modelling and policies, Earth Syst. Sci. Data, 15, 2667–2694, https://doi.org/10.5194/essd-15-2667-2023, 2023. a
Dai, M., Zhu, B., Fang, C., Zhou, S., Lu, W., Zhao, D., Ding, D., Pan, C., and Liao, H.: Long-Term Variation and Source Apportionment of Black Carbon at Mt. Waliguan, China, J. Geophys. Res. Atmos., 126, e2021JD035273, https://doi.org/10.1029/2021JD035273, 2021. a
Dancho, M. and Vaughan, D.: anomalize: Tidy Anomaly Detection, r package version 0.2.3, GitHub, https://github.com/business-science/anomalize (last access: 2 November 2023), 2023. a, b
Ding, A., Huang, X., Nie, W., Sun, J. N., Kerminen, V.-M., Petäjä, T., Su, H., Cheng, Y. F., Yang, X.-Q., Wang, M. H., Chi, X. G., Wang, J. P., Virkkula, A., Guo, W. D., Yuan, J., Wang, S. Y., Zhang, R. J., Wu, Y. F., Song, Y., Zhu, T., Zilitinkevich, S., Kulmala, M., and Fu, C. B.: Enhanced haze pollution by black carbon in megacities in China, Geophys. Res. Lett., 43, 2873–2879, https://doi.org/10.1002/2016GL067745, 2016. a
Drinovec, L., Močnik, G., Zotter, P., Prévôt, A. S. H., Ruckstuhl, C., Coz, E., Rupakheti, M., Sciare, J., Müller, T., Wiedensohler, A., and Hansen, A. D. A.: The “dual-spot” Aethalometer: an improved measurement of aerosol black carbon with real-time loading compensation, Atmos. Meas. Tech., 8, 1965–1979, https://doi.org/10.5194/amt-8-1965-2015, 2015. a, b
Evangeliou, N., Thompson, R. L., Eckhardt, S., and Stohl, A.: Top-down estimates of black carbon emissions at high latitudes using an atmospheric transport model and a Bayesian inversion framework, Atmos. Chem. Phys., 18, 15307–15327, https://doi.org/10.5194/acp-18-15307-2018, 2018. a, b, c
Evangeliou, N., Platt, S. M., Eckhardt, S., Lund Myhre, C., Laj, P., Alados-Arboledas, L., Backman, J., Brem, B. T., Fiebig, M., Flentje, H., Marinoni, A., Pandolfi, M., Yus-Dìez, J., Prats, N., Putaud, J. P., Sellegri, K., Sorribas, M., Eleftheriadis, K., Vratolis, S., Wiedensohler, A., and Stohl, A.: Changes in black carbon emissions over Europe due to COVID-19 lockdowns, Atmos. Chem. Phys., 21, 2675–2692, https://doi.org/10.5194/acp-21-2675-2021, 2021. a, b
Fan, T., Liu, X., Ma, P.-L., Zhang, Q., Li, Z., Jiang, Y., Zhang, F., Zhao, C., Yang, X., Wu, F., and Wang, Y.: Emission or atmospheric processes? An attempt to attribute the source of large bias of aerosols in eastern China simulated by global climate models, Atmos. Chem. Phys., 18, 1395–1417, https://doi.org/10.5194/acp-18-1395-2018, 2018. a, b
Fan, T., Liu, X., Wu, C., Zhang, Q., Zhao, C., Yang, X., and Li, Y.: Comparison of the anthropogenic emission inventory for CMIP6 models with a country-level inventory over China and the simulations of the aerosol properties, Adv. Clim. Change Res., 39, 80–96, https://doi.org/10.1007/s00376-021-1119-6, 2022. a
Fan, X., Ye, S., Zheng, H., Han, B., Zhang, G., Zheng, Z., Zhao, X., Kong, S., Wang, X., and Yang, W.: Source apportionment of black carbon using an advanced Aethalometer model in a typical industrial city of China, J. Environ. Sci., 151, 42–53, https://doi.org/10.1016/j.jes.2024.03.036, 2025. a
Fang, W., Du, K., Andersson, A., Xing, Z., Cho, C., Kim, S., Deng, J., and Gustafsson, Ö.: Dual‐isotope constraints on seasonally resolved source fingerprinting of black carbon aerosols in sites of the four emission hot spot regions of China, J. Geophys. Res.-Atmos., 123, https://doi.org/10.1029/2018jd028607, 2018. a
Favez, O., El Haddad, I., Piot, C., Boréave, A., Abidi, E., Marchand, N., Jaffrezo, J.-L., Besombes, J.-L., Personnaz, M.-B., Sciare, J., Wortham, H., George, C., and D'Anna, B.: Inter-comparison of source apportionment models for the estimation of wood burning aerosols during wintertime in an Alpine city (Grenoble, France), Atmos. Chem. Phys., 10, 5295–5314, https://doi.org/10.5194/acp-10-5295-2010, 2010. a
Flowers, B. A., Dubey, M. K., Mazzoleni, C., Stone, E. A., Schauer, J. J., Kim, S.-W., and Yoon, S. C.: Optical-chemical-microphysical relationships and closure studies for mixed carbonaceous aerosols observed at Jeju Island; 3-laser photoacoustic spectrometer, particle sizing, and filter analysis, Atmos. Chem. Phys., 10, 10387–10398, https://doi.org/10.5194/acp-10-10387-2010, 2010. a
Font, A. and Fuller, G. W.: Did policies to abate atmospheric emissions from traffic have a positive effect in London?, Environ. Pollut., 218, 463–474, https://doi.org/10.1016/j.envpol.2016.07.026, 2016. a, b, c
Fu, T.-M., Cao, J. J., Zhang, X. Y., Lee, S. C., Zhang, Q., Han, Y. M., Qu, W. J., Han, Z., Zhang, R., Wang, Y. X., Chen, D., and Henze, D. K.: Carbonaceous aerosols in China: top-down constraints on primary sources and estimation of secondary contribution, Atmos. Chem. Phys., 12, 2725–2746, https://doi.org/10.5194/acp-12-2725-2012, 2012. a, b
Fuller, G. W. and Font, A.: Keeping air pollution policies on track, Science, 365, 322–323, https://doi.org/10.1126/science.aaw9865, 2019. a
Fuller, G. W., Tremper, A. H., Baker, T. D., Yttri, K. E., and Butterfield, D.: Contribution of wood burning to PM10 in London, Atmos. Environ., 87, 87–94, https://doi.org/10.1016/j.atmosenv.2013.12.037, 2014. a
Geng, G., Liu, Y., Liu, Y., Liu, S., Cheng, J., Yan, L., Wu, N., Hu, H., Tong, D., Zheng, B., Yin, Z., He, K., and Zhang, Q.: Efficacy of China’s clean air actions to tackle PM2.5 pollution between 2013 and 2020, Nat. Geosci., 17, 987–994, https://doi.org/10.1038/s41561-024-01540-z, 2024. a, b, c
Gliß, J., Mortier, A., Schulz, M., Andrews, E., Balkanski, Y., Bauer, S. E., Benedictow, A. M. K., Bian, H., Checa-Garcia, R., Chin, M., Ginoux, P., Griesfeller, J. J., Heckel, A., Kipling, Z., Kirkevåg, A., Kokkola, H., Laj, P., Le Sager, P., Lund, M. T., Lund Myhre, C., Matsui, H., Myhre, G., Neubauer, D., van Noije, T., North, P., Olivié, D. J. L., Rémy, S., Sogacheva, L., Takemura, T., Tsigaridis, K., and Tsyro, S. G.: AeroCom phase III multi-model evaluation of the aerosol life cycle and optical properties using ground- and space-based remote sensing as well as surface in situ observations, Atmos. Chem. Phys., 21, 87–128, https://doi.org/10.5194/acp-21-87-2021, 2021. a
Global Modeling And Assimilation Office and Pawson, S.: MERRA-2 tavgM_2d_aer_Nx: 2d,Monthly mean,Time-averaged,Single-Level, Assimilation,Aerosol Diagnostics V5.12.4, NASA Goddard Earth Sciences Data and Information Services Center, https://doi.org/10.5067/FH9A0MLJPC7N, 2015. a
Grange, S. K., Carslaw, D. C., Lewis, A. C., Boleti, E., and Hueglin, C.: Random forest meteorological normalisation models for Swiss PM10 trend analysis, Atmos. Chem. Phys., 18, 6223–6239, https://doi.org/10.5194/acp-18-6223-2018, 2018. a, b
Grange, S. K., Lötscher, H., Fischer, A., Emmenegger, L., and Hueglin, C.: Evaluation of equivalent black carbon source apportionment using observations from Switzerland between 2008 and 2018, Atmos. Meas. Tech., 13, 1867–1885, https://doi.org/10.5194/amt-13-1867-2020, 2020. a, b
Granier, C., Darras, S., Denier van der Gon, H., Doubalova, J., Elguindi, N., Galle, B., Gauss, M., Guevara, M., Jalkanen, J.-P., Kuenen, J., Liousse, C., Quack, B., Simpson, D., and Sindelarova, K.: The Copernicus Atmosphere Monitoring Service global and regional emissions (April 2019 version), Copernicus Atmosphere Monitoring Service (CAMS), https://doi.org/10.24380/D0BN-KX16, 2019. a
Guo, B., Wang, Y., Zhang, X., Che, H., Ming, J., and Yi, Z.: Long-Term variation of black carbon aerosol in China based on revised aethalometer monitoring data, Atmosphere, 11, 684, https://doi.org/10.3390/atmos11070684, 2020. a, b, c
Gyawali, M., Arnott, W. P., Lewis, K., and Moosmüller, H.: In situ aerosol optics in Reno, NV, USA during and after the summer 2008 California wildfires and the influence of absorbing and non-absorbing organic coatings on spectral light absorption, Atmos. Chem. Phys., 9, 8007–8015, https://doi.org/10.5194/acp-9-8007-2009, 2009. a
Hansen, A. D. A.: The Aethalometer, Berkeley, California, USA, https://www.psi.ch/sites/default/files/import/lac/ProjectAddonCatcosOperationsEN/Aethalometer_book_2005.07.02.pdf (last access: 14 November 2025), 2005. a
Harrison, R. M., Beddows, D. C. S., Hu, L., and Yin, J.: Comparison of methods for evaluation of wood smoke and estimation of UK ambient concentrations, Atmos. Chem. Phys., 12, 8271–8283, https://doi.org/10.5194/acp-12-8271-2012, 2012. a
He, C., Li, Q., Liou, K.-N., Qi, L., Tao, S., and Schwarz, J. P.: Microphysics-based black carbon aging in a global CTM: constraints from HIPPO observations and implications for global black carbon budget, Atmos. Chem. Phys., 16, 3077–3098, https://doi.org/10.5194/acp-16-3077-2016, 2016. a
Helin, A., Niemi, J., Virkkula, A., Pirjola, L., Teinila, K., Backman, J., Aurela, M., Saarikoski, S., Ronkko, T., Asmi, E., and Timonen, H.: Characteristics and source apportionment of black carbon in the Helsinki metropolitan area, Finland, Atmos. Environ., 190, 87–98, https://doi.org/10.1016/j.atmosenv.2018.07.022, 2018. a
Helin, A., Virkkula, A., Backman, J., Pirjola, L., Sippula, O., Aakko‐Saksa, P., Väätäinen, S., Mylläri, F., Järvinen, A., Bloss, M., Aurela, M., Jakobi, G., Karjalainen, P., Zimmermann, R., Jokiniemi, J., Saarikoski, S., Tissari, J., Rönkkö, T., Niemi, J. V., and Timonen, H.: Variation of Absorption Ångström Exponent in Aerosols From Different Emission Sources, J. Geophys. Res.-Atmos., 126, https://doi.org/10.1029/2020JD034094, 2021. a
Herich, H., Hueglin, C., and Buchmann, B.: A 2.5 year's source apportionment study of black carbon from wood burning and fossil fuel combustion at urban and rural sites in Switzerland, Atmos. Meas. Tech., 4, 1409–1420, https://doi.org/10.5194/amt-4-1409-2011, 2011. a
Hersbach, H., Bell, B., Berrisford, P., Biavati, G., Horányi, A., Sabater, M., Nicolas, J., Peubey, C., Radu, R., Rozum, I., Schepers, D., Simmons, A., Soci, C., Dee, D., and Thépaut, J.-N.: ERA5 hourly data on single levels from 1940 to present, Copernicus Climate Change Service (C3S) Climate Data Store (CDS) [data set], https://doi.org/10.24381/cds.adbb2d47, 2023. a, b
Hirdman, D., Burkhart, J. F., Sodemann, H., Eckhardt, S., Jefferson, A., Quinn, P. K., Sharma, S., Ström, J., and Stohl, A.: Long-term trends of black carbon and sulphate aerosol in the Arctic: changes in atmospheric transport and source region emissions, Atmos. Chem. Phys., 10, 9351–9368, https://doi.org/10.5194/acp-10-9351-2010, 2010. a
Hoesly, R. M., Smith, S. J., Feng, L., Klimont, Z., Janssens-Maenhout, G., Pitkanen, T., Seibert, J. J., Vu, L., Andres, R. J., Bolt, R. M., Bond, T. C., Dawidowski, L., Kholod, N., Kurokawa, J.-I., Li, M., Liu, L., Lu, Z., Moura, M. C. P., O'Rourke, P. R., and Zhang, Q.: Historical (1750–2014) anthropogenic emissions of reactive gases and aerosols from the Community Emissions Data System (CEDS), Geosci. Model Dev., 11, 369–408, https://doi.org/10.5194/gmd-11-369-2018, 2018. a
Huang, L., Gong, S., Jia, C., and Lavoué, D.: Importance of deposition processes in simulating the seasonality of the Arctic black carbon aerosol, J. Geophys. Res. Atmos., 115, D17207, https://doi.org/10.1029/2009JD013478, 2010. a
Huang, R.-J., Zhang, Y., Bozzetti, C., Ho, K.-F., Cao, J.-J., Han, Y., Daellenbach, K. R., Slowik, J. G., Platt, S. M., Canonaco, F., Zotter, P., Wolf, R., Pieber, S. M., Bruns, E. A., Crippa, M., Ciarelli, G., Piazzalunga, A., Schwikowski, M., Abbaszade, G., Schnelle-Kreis, J., Zimmermann, R., An, Z., Szidat, S., Baltensperger, U., Haddad, I. E., and Prévôt, A. S. H.: High secondary aerosol contribution to particulate pollution during haze events in China, Nature, 514, 218–222, https://doi.org/10.1038/nature13774, 2014. a
Ikeda, K., Tanimoto, H., Kanaya, Y., and Taketani, F.: Evaluation of anthropogenic emissions of black carbon from East Asia in six inventories: constraints from model simulations and surface observations on Fukue Island, Japan, Environ. Sci. Atmos., 2, 416–427, https://doi.org/10.1039/D1EA00051A, 2022. a, b
Jia, M., Evangeliou, N., Eckhardt, S., Huang, X., Gao, J., Ding, A., and Stohl, A.: Black Carbon Emission Reduction Due to COVID‐19 Lockdown in China, Geophys. Res. Lett., 48, https://doi.org/10.1029/2021GL093243, 2021. a, b
Jiang, K., Xing, R., Luo, Z., Huang, W., Yi, F., Men, Y., Zhao, N., Chang, Z., Zhao, J., Pan, B., and Shen, G.: Pollutant emissions from biomass burning: A review on emission characteristics, environmental impacts, and research perspectives, Particuology, 85, 296–309, https://doi.org/10.1016/j.partic.2023.07.012, 2024. a
Kanaya, Y., Pan, X., Miyakawa, T., Komazaki, Y., Taketani, F., Uno, I., and Kondo, Y.: Long-term observations of black carbon mass concentrations at Fukue Island, western Japan, during 2009–2015: constraining wet removal rates and emission strengths from East Asia, Atmos. Chem. Phys., 16, 10689–10705, https://doi.org/10.5194/acp-16-10689-2016, 2016. a
Koch, D., Schulz, M., Kinne, S., McNaughton, C., Spackman, J. R., Balkanski, Y., Bauer, S., Berntsen, T., Bond, T. C., Boucher, O., Chin, M., Clarke, A., De Luca, N., Dentener, F., Diehl, T., Dubovik, O., Easter, R., Fahey, D. W., Feichter, J., Fillmore, D., Freitag, S., Ghan, S., Ginoux, P., Gong, S., Horowitz, L., Iversen, T., Kirkevåg, A., Klimont, Z., Kondo, Y., Krol, M., Liu, X., Miller, R., Montanaro, V., Moteki, N., Myhre, G., Penner, J. E., Perlwitz, J., Pitari, G., Reddy, S., Sahu, L., Sakamoto, H., Schuster, G., Schwarz, J. P., Seland, Ø., Stier, P., Takegawa, N., Takemura, T., Textor, C., van Aardenne, J. A., and Zhao, Y.: Evaluation of black carbon estimations in global aerosol models, Atmos. Chem. Phys., 9, 9001–9026, https://doi.org/10.5194/acp-9-9001-2009, 2009. a, b
Kutzner, R. D., von Schneidemesser, E., Kuik, F., Quedenau, J., Weatherhead, E. C., and Schmale, J.: Long-term monitoring of black carbon across Germany, Atmos. Environ., 185, 41–52, https://doi.org/10.1016/j.atmosenv.2018.04.039, 2018. a
Lang, M., Binder, M., Richter, J., Schratz, P., Pfisterer, F., Coors, S., Au, Q., Casalicchio, G., Kotthoff, L., and Bischl, B.: mlr3: A modern object-oriented machine learning framework in R, J. Open Source Softw., https://doi.org/10.21105/joss.01903, 2019. a
Li, J., Liu, C., Yin, Y., and Kumar, K. R.: Numerical investigation on the Ångström exponent of black carbon aerosol, J. Geophys. Res. Atmos., 121, 3506–3518, https://doi.org/10.1002/2015JD024718, 2016. a
Li, M., Liu, H., Geng, G., Hong, C., Liu, F., Song, Y., Tong, D., Zheng, B., Cui, H., Man, H., et al.: Anthropogenic emission inventories in China: A review, Natl. Sci. Rev., 4, 834–866, https://doi.org/10.1093/nsr/nwx150, 2017. a, b, c, d
Lin, W., Dai, J., Liu, R., Zhai, Y., Yue, D., and Hu, Q.: Integrated assessment of health risk and climate effects of black carbon in the Pearl River Delta region, China, Environ. Res., 176, 108522, https://doi.org/10.1016/j.envres.2019.06.003, 2019. a
Liu, C., Chung, C. E., Yin, Y., and Schnaiter, M.: The absorption Ångström exponent of black carbon: from numerical aspects, Atmos. Chem. Phys., 18, 6259–6273, https://doi.org/10.5194/acp-18-6259-2018, 2018. a
Liu, C., Deng, L., Yan, A., Liu, X., Huang, J., Miao, X., Qian, Y., Zhu, R., Fang, X., and Guo, W.: Comparison of MERRA-2 Black Carbon Aerosols and Ground Observation at a High-Altitude Mountainous Site in Southern China, Atmos. Pollut. Res., 16, 102644, https://doi.org/10.1016/j.apr.2025.102644, 2025. a
Liu, D., Allan, J. D., Young, D. E., Coe, H., Beddows, D., Fleming, Z. L., Flynn, M. J., Gallagher, M. W., Harrison, R. M., Lee, J., Prevot, A. S. H., Taylor, J. W., Yin, J., Williams, P. I., and Zotter, P.: Size distribution, mixing state and source apportionment of black carbon aerosol in London during wintertime, Atmos. Chem. Phys., 14, 10061–10084, https://doi.org/10.5194/acp-14-10061-2014, 2014. a
Liu, L., Mishchenko, M. I., and Arnott, W. P.: A study of radiative properties of fractal soot aggregates using the superposition T-matrix method, J. Quant. Spectrosc. Radiat. Transfer, 109, 2656–2663, https://doi.org/10.1016/j.jqsrt.2008.05.001, 2008. a
Liu, S., Geng, G., Xiao, Q., Zheng, Y., Liu, X., Cheng, J., and Zhang, Q.: Tracking daily concentrations of PM2.5 chemical composition in China since 2000, Environ. Sci. Technol., 56, 16517–16527, https://doi.org/10.1021/acs.est.2c06510, 2022. a
Luoma, K., Niemi, J. V., Aurela, M., Fung, P. L., Helin, A., Hussein, T., Kangas, L., Kousa, A., Rönkkö, T., Timonen, H., Virkkula, A., and Petäjä, T.: Spatiotemporal variation and trends in equivalent black carbon in the Helsinki metropolitan area in Finland, Atmos. Chem. Phys., 21, 1173–1189, https://doi.org/10.5194/acp-21-1173-2021, 2021. a, b
Malm, W. C., Sisler, J. F., Huffman, D., Eldred, R. A., and Cahill, T. A.: Spatial and seasonal trends in particle concentration and optical extinction in the United States, J. Geophys. Res. Atmos., 99, 1347–1370, https://doi.org/10.1029/93JD02916, 1994. a
Manoj, M., Satheesh, S., Moorthy, K. K., Gogoi, M. M., and Babu, S. S.: Decreasing trend in black carbon aerosols over the Indian region, Geophys. Res. Lett., 46, 2903–2910, https://doi.org/10.1029/2018GL081666, 2019. a, b
Mao, Y.-H., Liao, H., Han, Y., and Cao, J.: Impacts of meteorological parameters and emissions on decadal and interannual variations of black carbon in China for 1980–2010, J. Geophys. Res. Atmos., 121, 1822–1843, https://doi.org/10.1002/2015JD024019, 2016. a, b
Martinsson, J., Abdul Azeem, H., Sporre, M. K., Bergström, R., Ahlberg, E., Öström, E., Kristensson, A., Swietlicki, E., and Eriksson Stenström, K.: Carbonaceous aerosol source apportionment using the Aethalometer model – evaluation by radiocarbon and levoglucosan analysis at a rural background site in southern Sweden, Atmos. Chem. Phys., 17, 4265–4281, https://doi.org/10.5194/acp-17-4265-2017, 2017. a, b
McDuffie, E. E., Smith, S. J., O'Rourke, P., Tibrewal, K., Venkataraman, C., Marais, E. A., Zheng, B., Crippa, M., Brauer, M., and Martin, R. V.: A global anthropogenic emission inventory of atmospheric pollutants from sector- and fuel-specific sources (1970–2017): an application of the Community Emissions Data System (CEDS), Earth Syst. Sci. Data, 12, 3413–3442, https://doi.org/10.5194/essd-12-3413-2020, 2020. a, b, c
Meng, W., Shen, G., Shen, H., Chen, Y., Yun, X., Li, J., Ma, J., Liu, J., Cheng, H., Hu, J., Wan, Y., and Tao, S.: Synergistic Health Benefits of Household Stove Upgrading and Energy Switching in Rural China, Environ. Sci. Technol., 55, 14567–14575, https://doi.org/10.1021/acs.est.1c04242, 2021. a
Monforti Ferrario, F., Crippa, M., Guizzardi, D., Muntean, M., Schaaf, E., Lo Vullo, E., Solazzo, E., Olivier, J. G., and Vignati, E.: EDGAR v6.0 Greenhouse Gas Emissions, European Commission, Joint Research Centre (JRC), http://data.europa.eu/89h/97a67d67-c62e-4826-b873-9d972c4f670b (last access: 25 September 2023), 2021. a
Mordukhovich, I., Wilker, E., Suh, H., Wright, R., Sparrow, D., Vokonas, P. S., and Schwartz, J.: Black carbon exposure, oxidative stress genes, and blood pressure in a repeated-measures study, Environ. Health Perspect., 117, 1767–1772, https://doi.org/10.1289/ehp.0900591, 2009. a
Mousavi, A., Sowlat, M. H., Lovett, C., Rauber, M., Szidat, S., Boffi, R., Borgini, A., De Marco, C., Ruprecht, A. A., and Sioutas, C.: Source apportionment of black carbon (BC) from fossil fuel and biomass burning in metropolitan Milan, Italy, Atmos. Environ., 203, 252–261, https://doi.org/10.1016/j.atmosenv.2019.02.009, 2019. a
Navarro-Barboza, H., Rovira, J., Obiso, V., Pozzer, A., Via, M., Alastuey, A., Querol, X., Perez, N., Savadkoohi, M., Chen, G., Yus-Díez, J., Ivancic, M., Rigler, M., Eleftheriadis, K., Vratolis, S., Zografou, O., Gini, M., Chazeau, B., Marchand, N., Prevot, A. S. H., Dallenbach, K., Ehn, M., Luoma, K., Petäjä, T., Tobler, A., Necki, J., Aurela, M., Timonen, H., Niemi, J., Favez, O., Petit, J.-E., Putaud, J.-P., Hueglin, C., Pascal, N., Chauvigné, A., Conil, S., Pandolfi, M., and Jorba, O.: Characterization of brown carbon absorption in different European environments through source contribution analysis, Atmos. Chem. Phys., 25, 2667–2694, https://doi.org/10.5194/acp-25-2667-2025, 2025. a
Ni, H., Huang, R.-J., Cao, J., Liu, W., Zhang, T., Wang, M., Meijer, H. A. J., and Dusek, U.: Source apportionment of carbonaceous aerosols in Xi'an, China: insights from a full year of measurements of radiocarbon and the stable isotope 13C, Atmos. Chem. Phys., 18, 16363–16383, https://doi.org/10.5194/acp-18-16363-2018, 2018. a
Novakov, T. and Hansen, J.: Black carbon emissions in the United Kingdom during the past four decades: an empirical analysis, Atmos. Environ., 38, 4155–4163, https://doi.org/10.1016/j.atmosenv.2004.04.031, 2004. a
Olson, M. R., Victoria Garcia, M., Robinson, M. A., Van Rooy, P., Dietenberger, M. A., Bergin, M., and Schauer, J. J.: Investigation of Black and Brown Carbon Multiple-wavelength-dependent Light Absorption from Biomass and Fossil Fuel Combustion Source Emissions, J. Geophys. Res.-Atmos., 120, 6682–6697, https://doi.org/10.1002/2014JD022970, 2015. a
Pandolfi, M., Ripoll, A., Querol, X., and Alastuey, A.: Climatology of aerosol optical properties and black carbon mass absorption cross section at a remote high-altitude site in the western Mediterranean Basin, Atmos. Chem. Phys., 14, 6443–6460, https://doi.org/10.5194/acp-14-6443-2014, 2014. a
Peng, J., Hu, M., Guo, S., Du, Z., Zheng, J., Shang, D., Levy Zamora, M., Zeng, L., Shao, M., Wu, Y.-S., et al.: Markedly enhanced absorption and direct radiative forcing of black carbon under polluted urban environments, P. Natl. Acad. Sci. USA, 113, 4266–4271, https://doi.org/10.1073/pnas.1602310113, 2016. a
Petzold, A., Ogren, J. A., Fiebig, M., Laj, P., Li, S.-M., Baltensperger, U., Holzer-Popp, T., Kinne, S., Pappalardo, G., Sugimoto, N., Wehrli, C., Wiedensohler, A., and Zhang, X.-Y.: Recommendations for reporting “black carbon” measurements, Atmos. Chem. Phys., 13, 8365–8379, https://doi.org/10.5194/acp-13-8365-2013, 2013. a
Qi, L. and Wang, S.: Fossil fuel combustion and biomass burning sources of global black carbon from GEOS-Chem simulation and carbon isotope measurements, Atmos. Chem. Phys., 19, 11545–11557, https://doi.org/10.5194/acp-19-11545-2019, 2019. a
R Core Team: R: A Language and Environment for Statistical Computing, R Foundation for Statistical Computing, Vienna, Austria, https://www.R-project.org/ (last access: 15 October 2025), 2024. a
Rajesh, T. and Ramachandran, S.: Black carbon aerosol mass concentration, absorption and single scattering albedo from single and dual spot aethalometers: Radiative implications, J. Aerosol Sci., 119, 77–90, https://doi.org/10.1016/j.jaerosci.2018.02.001, 2018. a
Ramachandran, S., Rupakheti, M., and Cherian, R.: Insights into recent aerosol trends over Asia from observations and CMIP6 simulations, Sci. Total Environ., 807, 150756, https://doi.org/10.1016/j.scitotenv.2021.150756, 2022. a, b
Rovira, J., Savadkoohi, M., Chen, G. I., Močnik, G., Aas, W., Alados-Arboledas, L., Artiñano, B., Aurela, M., Backman, J., Banerji, S., Beddows, D., Brem, B., Chazeau, B., Coen, M. C., Colombi, C., Conil, S., Costabile, F., Coz, E., de Brito, J. F., Eleftheriadis, K., Favez, O., Flentje, H., Freney, E., Gregorič, A., Gysel-Beer, M., Harrison, R., Hueglin, C., Hyvärinen, A., Ivančič, M., Kalogridis, A.-C., Keernik, H., Konstantinos, G., Laj, P., Liakakou, E., Lin, C., Listrani, S., Luoma, K., Maasikmets, M., Manninen, H. E., Marchand, N., dos Santos, S. M., Mbengue, S., Mihalopoulos, N., Nicolae, D., Niemi, J. V., Norman, M., Ovadnevaite, J., Petit, J.-E., Platt, S., Prévôt, A. S., Pujadas, M., Putaud, J.-P., Riffault, V., Rigler, M., Rinaldi, M., Schwarz, J., Silvergren, S., Teinemaa, E., Teinilä, K., Timonen, H., Titos, G., Tobler, A., Vasilescu, J., Vratolis, S., Yttri, K. E., Yubero, E., Zíková, N., Alastuey, A., Petäjä, T., Querol, X., Yus-Díez, J., and Pandolfi, M.: A European aerosol phenomenology – 9: Light absorption properties of carbonaceous aerosol particles across surface Europe, Environ. Int., 195, 109185, https://doi.org/10.1016/j.envint.2024.109185, 2025. a
ussell, P. B., Bergstrom, R. W., Shinozuka, Y., Clarke, A. D., DeCarlo, P. F., Jimenez, J. L., Livingston, J. M., Redemann, J., Dubovik, O., and Strawa, A.: Absorption Angstrom Exponent in AERONET and related data as an indicator of aerosol composition, Atmos. Chem. Phys., 10, 1155–1169, https://doi.org/10.5194/acp-10-1155-2010, 2010. a
Rönkkö, T., Saarikoski, S., Kuittinen, N., Karjalainen, P., Keskinen, H., Järvinen, A., Mylläri, F., Aakko-Saksa, P., and Timonen, H.: Review of black carbon emission factors from different anthropogenic sources, Environ. Res. Lett., 18, 033004, https://doi.org/10.1088/1748-9326/acbb1b, 2023. a
Sandradewi, J., Prévôt, A. S. H., Szidat, S., Perron, N., Alfarra, M. R., Lanz, V. A., Weingartner, E., and Baltensperger, U.: Using aerosol light absorption measurements for the quantitative determination of wood burning and traffic emission contributions to particulate matter, Environ. Sci. Technol., 42, 3316–3323, https://doi.org/10.1021/es702253m, 2008. a, b, c, d
Savadkoohi, M., Pandolfi, M., Reche, C., Niemi, J. V., Mooibroek, D., Titos, G., Green, D. C., Tremper, A. H., Hueglin, C., Liakakou, E., Mihalopoulos, N., Stavroulas, I., Artiñano, B., Coz, E., Alados-Arboledas, L., Beddows, D., Riffault, V., De Brito, J. F., Bastian, S., Baudic, A., Colombi, C., Costabile, F., Chazeau, B., Marchand, N., Gómez-Amo, J. L., Estellés, V., Matos, V., Van Der Gaag, E., Gille, G., Luoma, K., Manninen, H. E., Norman, M., Silvergren, S., Petit, J.-E., Putaud, J.-P., Rattigan, O. V., Timonen, H., Tuch, T., Merkel, M., Weinhold, K., Vratolis, S., Vasilescu, J., Favez, O., Harrison, R. M., Laj, P., Wiedensohler, A., Hopke, P. K., Petäjä, T., Alastuey, A., and Querol, X.: The variability of mass concentrations and source apportionment analysis of equivalent black carbon across urban Europe, Environ. Int., 108081, https://doi.org/10.1016/j.envint.2023.108081, 2023. a, b
Savadkoohi, M., Pandolfi, M., Favez, O., Putaud, J.-P., Eleftheriadis, K., Fiebig, M., Hopke, P. K., Laj, P., Wiedensohler, A., Alados-Arboledas, L., Bastian, S., Chazeau, B., María, A. C., Colombi, C., Costabile, F., Green, D. C., Hueglin, C., Liakakou, E., Luoma, K., Listrani, S., Mihalopoulos, N., Marchand, N., Močnik, G., Niemi, J. V., Ondráček, J., Petit, J.-E., Rattigan, O. V., Reche, C., Timonen, H., Titos, G., Tremper, A. H., Vratolis, S., Vodička, P., Funes, E. Y., Zíková, N., Harrison, R. M., Petäjä, T., Alastuey, A., and Querol, X.: Recommendations for reporting equivalent black carbon (eBC) mass concentrations based on long-term pan-european in-situ observations, Environ. Int., 185, 108553, https://doi.org/10.1016/j.envint.2024.108553, 2024. a, b, c
Savadkoohi, M., Gherras, M., Favez, O., Petit, J.-E., Rovira, J., Chen, G. I., Via, M., Platt, S., Aurela, M., Chazeau, B., De Brito, J. F., Riffault, V., Eleftheriadis, K., Flentje, H., Gysel-Beer, M., Hueglin, C., Rigler, M., Gregorič, A., Ivančič, M., Keernik, H., Maasikmets, M., Liakakou, E., Stavroulas, I., Luoma, K., Marchand, N., Mihalopoulos, N., Petäjä, T., Prevot, A. S., Daellenbach, K. R., Vodička, P., Timonen, H., Tobler, A., Vasilescu, J., Dandocsi, A., Mbengue, S., Vratolis, S., Zografou, O., Chauvigné, A., Hopke, P. K., Querol, X., Alastuey, A., and Pandolfi, M.: Addressing the advantages and limitations of using Aethalometer data to determine the optimal absorption Ångström exponents (AAEs) values for eBC source apportionment, Atmos. Environ., 349, 121121, https://doi.org/10.1016/j.atmosenv.2025.121121, 2025. a, b, c, d
Shen, G., Xiong, R., Tian, Y., Luo, Z., Jiangtulu, B., Meng, W., Du, W., Meng, J., Chen, Y., Xue, B., Wang, B., Duan, Y., Duo, J., Fan, F., Huang, L., Ju, T., Liu, F., Li, S., Liu, X., Li, Y., Wang, M., Nan, Y., Pan, B., Pan, Y., Wang, L., Zeng, E., Zhan, C., Chen, Y., Shen, H., Cheng, H., and Tao, S.: Substantial transition to clean household energy mix in rural China, Natl. Sci. Rev., 9, nwac050, https://doi.org/10.1093/nsr/nwac050, 2022. a
Shen, W., Wang, M., Liu, Y., Dong, X., Zhao, D., Yue, M., Tian, P., and Ding, D.: Evaluating BC Aging Processes in the Community Atmosphere Model Version 6 (CAM6), J. Geophys. Res. Atmos., 128, e2022JD037427, https://doi.org/10.1029/2022JD037427, 2023. a
Singh, V., Ravindra, K., Sahu, L., and Sokhi, R.: Trends of atmospheric black carbon concentration over the United Kingdom, Atmos. Environ., 178, 148–157, https://doi.org/10.1016/j.atmosenv.2018.01.030, 2018. a
Stein, A. F., Draxler, R. R., Rolph, G. D., Stunder, B. J. B., Cohen, M. D., and Ngan, F.: NOAA’s HYSPLIT Atmospheric Transport and Dispersion Modeling System, B. Am. Meteorol. Soc., 96, 2059–2077, https://doi.org/10.1175/BAMS-D-14-00110.1, 2015. a
Sun, J., Birmili, W., Hermann, M., Tuch, T., Weinhold, K., Merkel, M., Rasch, F., Müller, T., Schladitz, A., Bastian, S., Löschau, G., Cyrys, J., Gu, J., Flentje, H., Briel, B., Asbach, C., Kaminski, H., Ries, L., Sohmer, R., Gerwig, H., Wirtz, K., Meinhardt, F., Schwerin, A., Bath, O., Ma, N., and Wiedensohler, A.: Decreasing trends of particle number and black carbon mass concentrations at 16 observational sites in Germany from 2009 to 2018, Atmos. Chem. Phys., 20, 7049–7068, https://doi.org/10.5194/acp-20-7049-2020, 2020. a
Sun, J., Wang, Z., Zhou, W., Xie, C., Wu, C., Chen, C., Han, T., Wang, Q., Li, Z., Li, J., Fu, P., Wang, Z., and Sun, Y.: Measurement report: Long-term changes in black carbon and aerosol optical properties from 2012 to 2020 in Beijing, China, Atmos. Chem. Phys., 22, 561–575, https://doi.org/10.5194/acp-22-561-2022, 2022. a, b
Szopa, S., Naik, V., Bhupesh, A., Artaxo, P., Berntsen, T., Collins, W. D., Fuzzi, S., Gallardo, L., Kiendler-Scharr, A., Klimont, Z., Liao, H., Unher, N., and Zanis, P.: Short-lived Climate Forcers, in: Climate Change 2021 – The Physical Science Basis Working Group I Contribution to the Sixth Assessment Report of the Intergovernmental Panel on Climate Change, Cambridge University Press, 817–922, https://doi.org/10.1017/9781009157896.008, 2021. a
Tao, J., Zhang, L., Cao, J., and Zhang, R.: A review of current knowledge concerning PM2.5 chemical composition, aerosol optical properties and their relationships across China, Atmos. Chem. Phys., 17, 9485–9518, https://doi.org/10.5194/acp-17-9485-2017, 2017. a
Tobler, A. K., Skiba, A., Canonaco, F., Močnik, G., Rai, P., Chen, G., Bartyzel, J., Zimnoch, M., Styszko, K., Nęcki, J., Furger, M., Różański, K., Baltensperger, U., Slowik, J. G., and Prevot, A. S. H.: Characterization of non-refractory (NR) PM1 and source apportionment of organic aerosol in Kraków, Poland, Atmos. Chem. Phys., 21, 14893–14906, https://doi.org/10.5194/acp-21-14893-2021, 2021. a
Vignati, E., Karl, M., Krol, M., Wilson, J., Stier, P., and Cavalli, F.: Sources of uncertainties in modelling black carbon at the global scale, Atmos. Chem. Phys., 10, 2595–2611, https://doi.org/10.5194/acp-10-2595-2010, 2010. a
Wang, H., He, X., Liang, X., Choma, E. F., Liu, Y., Shan, L., Zheng, H., Zhang, S., Nielsen, C. P., Wang, S., Wu, Y., and Evans, J. S.: Health benefits of on-road transportation pollution control programs in China, P. Natl. Acad. Sci. USA, 117, 25370–25377, https://doi.org/10.1073/pnas.1921271117, 2020. a
Wang, P., Wang, H., Wang, Y. Q., Zhang, X. Y., Gong, S. L., Xue, M., Zhou, C. H., Liu, H. L., An, X. Q., Niu, T., and Cheng, Y. L.: Inverse modeling of black carbon emissions over China using ensemble data assimilation, Atmos. Chem. Phys., 16, 989–1002, https://doi.org/10.5194/acp-16-989-2016, 2016. a
Wang, R., Tao, S., Wang, W., Liu, J., Shen, H., Shen, G., Wang, B., Liu, X., Li, W., Huang, Y., Zhang, Y., Lu, Y., Chen, H., Chen, Y., Wang, C., Zhu, D., Wang, X., Li, B., Liu, W., and Ma, J.: Black Carbon Emissions in China from 1949 to 2050, Environ. Sci. Technol., 46, 7595–7603, https://doi.org/10.1021/es3003684, 2012. a, b
Wang, X., Heald, C. L., Ridley, D. A., Schwarz, J. P., Spackman, J. R., Perring, A. E., Coe, H., Liu, D., and Clarke, A. D.: Exploiting simultaneous observational constraints on mass and absorption to estimate the global direct radiative forcing of black carbon and brown carbon, Atmos. Chem. Phys., 14, 10989–11010, https://doi.org/10.5194/acp-14-10989-2014, 2014. a
Wang, Y., Ju, Q., Xing, Z., Zhao, J., Guo, S., Li, F., and Du, K.: Observation of black carbon in Northern China in winter of 2018–2020 and its implications for black carbon mitigation, Sci. Total Environ., 877, 162897, https://doi.org/10.1016/j.scitotenv.2023.162897, 2023. a
Wang, Z., Huang, X., and Ding, A.: Dome effect of black carbon and its key influencing factors: a one-dimensional modelling study, Atmos. Chem. Phys., 18, 2821–2834, https://doi.org/10.5194/acp-18-2821-2018, 2018. a
Weingartner, E., Saathoff, H., Schnaiter, M., Streit, N., Bitnar, B., and Baltensperger, U.: Absorption of light by soot particles: determination of the absorption coefficient by means of aethalometers, J. Aerosol Sci., 34, 1445–1463, https://doi.org/10.1016/S0021-8502(03)00359-8, 2003. a
Wickham, H.: ggplot2: Elegant Graphics for Data Analysis, Springer-Verlag New York, ISBN 978-3-319-24277-4, https://ggplot2.tidyverse.org (last access: 15 October 2025), 2016. a
Wu, M., Liu, X., Zhang, L., Wu, C., Lu, Z., Ma, P.-L., Wang, H., Tilmes, S., Mahowald, N., Matsui, H., et al.: Impacts of aerosol dry deposition on black carbon spatial distributions and radiative effects in the Community Atmosphere Model CAM5, J. Adv. Model. Earth Syst., 10, 1150–1171, https://doi.org/10.1029/2017MS001219, 2018. a
Xie, Y., Zeng, L., Hu, S., Wang, T., Du, Z., Tan, T., Xu, N., Chen, S., Mao, J., Xu, F., and Hu, M.: Long-term trends of black carbon levels, sources, and radiative effects from 2013 to 2022 in Beijing, China, Npj Clean Air, 1, 10, https://doi.org/10.1038/s44407-025-00010-z, 2025. a, b, c, d
Xu, B., Fan, M., Lu, X., Zhang, Z., Li, M., Tao, J., Chen, L., and Song, S.: Light absorption properties and source contributions of black and brown carbon in Guangxi, southern China, Atmos. Res., 302, 107317, https://doi.org/10.1016/j.atmosres.2024.107317, 2024. a
Xu, Y., Shen, H., Yun, X., Gao, F., Chen, Y., Li, B., Liu, J., Ma, J., Wang, X., Liu, X., Tian, C., Xing, B., and Tao, S.: Health effects of banning beehive coke ovens and implementation of the ban in China, P. Natl. Acad. Sci. USA, 115, 2693–2698, https://doi.org/10.1073/pnas.1714389115, 2018. a
Yang, M., Howell, S. G., Zhuang, J., and Huebert, B. J.: Attribution of aerosol light absorption to black carbon, brown carbon, and dust in China – interpretations of atmospheric measurements during EAST-AIRE, Atmos. Chem. Phys., 9, 2035–2050, https://doi.org/10.5194/acp-9-2035-2009, 2009. a
You, R., Radney, J. G., Zachariah, M. R., and Zangmeister, C. D.: Measured wavelength-dependent absorption enhancement of internally mixed black carbon with absorbing and nonabsorbing materials, Environ. Sci. Technol., 50, 7982–7990, https://doi.org/10.1021/acs.est.6b01473, 2016. a
Yttri, K. E., Aas, W., Bjerke, A., Cape, J. N., Cavalli, F., Ceburnis, D., Dye, C., Emblico, L., Facchini, M. C., Forster, C., Hanssen, J. E., Hansson, H. C., Jennings, S. G., Maenhaut, W., Putaud, J. P., and Tørseth, K.: Elemental and organic carbon in PM10: a one year measurement campaign within the European Monitoring and Evaluation Programme EMEP, Atmos. Chem. Phys., 7, 5711–5725, https://doi.org/10.5194/acp-7-5711-2007, 2007. a
Yuan, J., Modini, R. L., Zanatta, M., Herber, A. B., Müller, T., Wehner, B., Poulain, L., Tuch, T., Baltensperger, U., and Gysel-Beer, M.: Variability in the mass absorption cross section of black carbon (BC) aerosols is driven by BC internal mixing state at a central European background site (Melpitz, Germany) in winter, Atmos. Chem. Phys., 21, 635–655, https://doi.org/10.5194/acp-21-635-2021, 2021. a
Zanatta, M., Gysel, M., Bukowiecki, N., Müller, T., Weingartner, E., Areskoug, H., Fiebig, M., Yttri, K. E., Mihalopoulos, N., Kouvarakis, G., and others: A European aerosol phenomenology-5: Climatology of black carbon optical properties at 9 regional background sites across Europe, Atmos. Environ., 145, 346–364, https://doi.org/10.1016/j.atmosenv.2016.09.035, 2016. a
Zha, S., Cheng, T., Tao, J., Zhang, R., Chen, J., Zhang, Y., Leng, C., Zhang, D., and Du, J.: Characteristics and relevant remote sources of black carbon aerosol in Shanghai, Atmos. Res., 135, 159–171, https://doi.org/10.1016/j.atmosres.2013.09.002, 2014. a
Zhang, H., Yin, S., Bai, L., Lu, X., Wang, C., Gu, X., and Li, Y.: Establishment and evaluation of anthropogenic black and organic carbon emissions over Central Plain, China, Atmos. Environ., 226, 117406, https://doi.org/10.1016/j.atmosenv.2020.117406, 2020. a, b
Zhang, Q., Zheng, Y., Tong, D., Shao, M., Wang, S., Zhang, Y., Xu, X., Wang, J., He, H., Liu, W., Ding, Y., Lei, Y., Li, J., Wang, Z., Zhang, X., Wang, Y., Cheng, J., Liu, Y., Shi, Q., Yan, L., Geng, G., Hong, C., Li, M., Liu, F., Zheng, B., Cao, J., Ding, A., Gao, J., Fu, Q., Huo, J., Liu, B., Liu, Z., Yang, F., He, K., and Hao, J.: Drivers of improved PM2.5 air quality in China from 2013 to 2017, P. Natl. Acad. Sci. USA, 116, 24463–24469, https://doi.org/10.1073/pnas.1907956116, 2019a. a
Zhang, S., Wu, X., Zheng, X., Wen, Y., and Wu, Y.: Mitigation potential of black carbon emissions from on-road vehicles in China, Environ. Pollut., 278, 116746, https://doi.org/10.1016/j.envpol.2021.116746, 2021. a
Zhang, X. Y., Wang, Y. Q., Zhang, X. C., Guo, W., Niu, T., Gong, S. L., Yin, Y., Zhao, P., Jin, J. L., and Yu, M.: Aerosol monitoring at multiple locations in China: contributions of EC and dust to aerosol light absorption, Tellus B: Chem. Phys. Meteorol., 60, 647–656, https://doi.org/10.1111/j.1600-0889.2008.00359.x, 2008. a, b, c
Zhang, Y., Li, Y., Guo, J., Wang, Y., Chen, D., and Chen, H.: The climatology and trend of black carbon in China from 12-year ground observations, Clim. Dynam., 53, 5881–5892, https://doi.org/10.1007/s00382-019-04903-0, 2019b. a, b, c, d, e
Zhang, Y., Zhi, G., Jin, W., Xu, P., Li, Z., Kong, Y., Zhang, H., Shen, Y., and Hu, J.: Identifying the Fundamental Drives behind the 10-Year Evolution of Northern China's Rural Household Energy and Emission: Implications for 2030 and Beyond, Sci. Total Environ., 865, 161053, https://doi.org/10.1016/j.scitotenv.2022.161053, 2023. a
Zhao, X., Zhao, Y., Chen, D., Li, C., and Zhang, J.: Top-down estimate of black carbon emissions for city clusters using ground observations: a case study in southern Jiangsu, China, Atmos. Chem. Phys., 19, 2095–2113, https://doi.org/10.5194/acp-19-2095-2019, 2019. a
Zhao, Y., Nielsen, C. P., Lei, Y., McElroy, M. B., and Hao, J.: Quantifying the uncertainties of a bottom-up emission inventory of anthropogenic atmospheric pollutants in China, Atmos. Chem. Phys., 11, 2295–2308, https://doi.org/10.5194/acp-11-2295-2011, 2011. a
Zhao, Y., Zhang, J., and Nielsen, C. P.: The effects of recent control policies on trends in emissions of anthropogenic atmospheric pollutants and CO2 in China, Atmos. Chem. Phys., 13, 487–508, https://doi.org/10.5194/acp-13-487-2013, 2013. a
Zheng, B., Tong, D., Li, M., Liu, F., Hong, C., Geng, G., Li, H., Li, X., Peng, L., Qi, J., Yan, L., Zhang, Y., Zhao, H., Zheng, Y., He, K., and Zhang, Q.: Trends in China's anthropogenic emissions since 2010 as the consequence of clean air actions, Atmos. Chem. Phys., 18, 14095–14111, https://doi.org/10.5194/acp-18-14095-2018, 2018. a, b, c
Zheng, H., Kong, S., Wu, F., Cheng, Y., Niu, Z., Zheng, S., Yang, G., Yao, L., Yan, Q., Wu, J., Zheng, M., Chen, N., Xu, K., Yan, Y., Liu, D., Zhao, D., Zhao, T., Bai, Y., Li, S., and Qi, S.: Intra-regional transport of black carbon between the south edge of the North China Plain and central China during winter haze episodes, Atmos. Chem. Phys., 19, 4499–4516, https://doi.org/10.5194/acp-19-4499-2019, 2019. a
Zheng, H., Kong, S., Zheng, M., Yan, Y., and Qi, S.: A 5.5-year observations of black carbon aerosol at a megacity in Central China: Levels, sources, and variation trends, Atmos. Environ., 232, 117581, https://doi.org/10.1016/j.atmosenv.2020.117581, 2020. a, b, c, d, e, f, g, h
Zheng, H., Kong, S., Chen, N., Fan, Z., Zhang, Y., Yao, L., Cheng, Y., Zheng, S., Yan, Y., Liu, D., Zhao, D., Liu, C., Zhao, T., Guo, J., and Qi, S.: A method to dynamically constrain black carbon aerosol sources with online monitored potassium, npj Clim. Atmos. Sci., 4, 43, https://doi.org/10.1038/s41612-021-00200-y, 2021. a, b, c, d, e, f
Zheng, H., Kong, S., He, Y., Song, C., Cheng, Y., Yao, L., Chen, N., and Zhu, B.: Enhanced ozone pollution in the summer of 2022 in China: the roles of meteorology and emission variations, Atmos. Environ., 301, 119701, https://doi.org/10.1016/j.atmosenv.2023.119701, 2023a. a
Zheng, H., Kong, S., Zhai, S., Sun, X., Cheng, Y., Yao, L., Song, C., Zheng, Z., Shi, Z., and Harrison, R. M.: An intercomparison of weather normalization of PM2.5 concentration using traditional statistical methods, machine learning, and chemistry transport models, npj Clim. Atmos. Sci., 6, 214, https://doi.org/10.1038/s41612-023-00536-7, 2023b. a, b, c
Zheng, H., Kong, S., Seo, J., Yan, Y., Cheng, Y., Yao, L., Wang, Y., Zhao, T., and Harrison, R. M.: Achievements and challenges in improving air quality in China: Analysis of the long-term trends from 2014 to 2022, Environ. Int., 183, 108361, https://doi.org/10.1016/j.envint.2023.108361, 2024. a
Zhou, Y., Luo, B., Li, J., Hao, Y., Yang, W., Shi, F., Chen, Y., Simayi, M., and Xie, S.: Characteristics of six criteria air pollutants before, during, and after a severe air pollution episode caused by biomass burning in the southern Sichuan Basin, China, Atmos. Environ., 215, 116840, https://doi.org/10.1016/j.atmosenv.2019.116840, 2019. a
Zhou, Y., Gao, X., and Lei, J.: Characteristics of Dust Weather in the Tarim Basin from 1989 to 2021 and Its Impact on the Atmospheric Environment, Remote Sens., 15, 1804, https://doi.org/10.3390/rs15071804, 2023. a
Zhu, X., Yun, X., Meng, W., Xu, H., Du, W., Shen, G., Cheng, H., Ma, J., and Tao, S.: Stacked Use and Transition Trends of Rural Household Energy in Mainland China, Environ. Sci. Technol., 53, 521–529, https://doi.org/10.1021/acs.est.8b04280, 2019. a
Zotter, P., Herich, H., Gysel, M., El-Haddad, I., Zhang, Y., Močnik, G., Hüglin, C., Baltensperger, U., Szidat, S., and Prévôt, A. S. H.: Evaluation of the absorption Ångström exponents for traffic and wood burning in the Aethalometer-based source apportionment using radiocarbon measurements of ambient aerosol, Atmos. Chem. Phys., 17, 4229–4249, https://doi.org/10.5194/acp-17-4229-2017, 2017. a, b, c, d