the Creative Commons Attribution 4.0 License.
the Creative Commons Attribution 4.0 License.
 | 19 Nov 2025
Seasonal and interannual variability on the chemical composition of the Svalbard surface snowpack
Azzurra Spagnesi
Matteo Feltracco
Federico Scoto
Marco Vecchiato
Massimiliano Vardè
Mauro Mazzola
François Burgay
Federica Bruschi
Clara Jule Marie Hoppe
Allison Bailey
Andrea Gambaro
Carlo Barbante
Andrea Spolaor
The Svalbard Archipelago, highly sensitive to rapid environmental changes, offers an ideal physical laboratory to investigate how environmental drivers can shape the seasonal chemical composition of snow in a warming climate. From 2018 to 2021, sampling campaigns at the Gruvebadet Snow Research Site in Ny-Ålesund, in the North-West of the Svalbard Archipelago, captured the interannual variability in ionic and elemental impurities within surface snow, reflecting seasonal differences in atmospheric and oceanic conditions. Notably, warmer conditions prevailed in 2018–2019 and 2020–2021, contrasting with the relatively colder season of 2019–2020. Our findings suggest that impurity concentrations in the 2019–2020 colder season are impacted by enhanced sea spray aerosol production, likely driven by a larger extent of sea ice, and drier, windy conditions. This phenomenon was particularly evident in March 2020, when extensive sea ice was present in Kongsfjorden and around Spitsbergen due to an exceptionally strong, cold stratospheric polar vortex and unusual Arctic Oscillation (AO) index positive phase. This study provides a detailed characterization of how snow chemistry in this area responds to major environmental conditions, with particular attention to sea-ice extent, atmospheric circulation, synoptic conditions, and Arctic climate variability.
- Article
(7243 KB) - Full-text XML
-
Supplement
(6787 KB) - BibTeX
- EndNote


Chemical analysis of surface Arctic snow can provide valuable comprehension of the composition of Arctic aerosols, its deposition, and related exchange processes (Lai et al., 2017). In Svalbard, climate-driven changes in air temperature, precipitation, and sea ice extent over recent decades have strongly shaped these processes, underscoring the importance of a detailed snow chemical characterisation (Gjermundsen et al., 2020; Rantanen et al., 2022).
The Svalbard region, located at the southern edge of the seasonal Arctic sea-ice zone, is characterised by a maritime climate with strong temperature variations during winter (Hansen et al., 2014; Barbaro et al., 2021). In the Arctic winter, the stratospheric polar jet fosters a high-atmospheric vorticity zone. This winter vortex typically acts as a strong barrier for the long-range transport of pollutants from mid-latitudes (Lawrence et al., 2020). However, it occasionally allows warm southern air to penetrate the region (Schoeberl and Newman, 2015). Additionally, Svalbard frequently experiences intense cyclonic storms in autumn and winter, which bring both heat and moisture from lower latitudes (Rinke et al., 2017). These intense meteorological variations, generally linked with a weaker polar vortex (Sobota et al., 2020; Salzano et al., 2023), favour long-range transport of aerosols to the archipelago, including pollutants from continental sources (Stohl et al., 2007; Yttri et al., 2014; Vecchiato et al., 2024; D'Amico et al., 2024).
Arctic snow captures dry and wet deposition and forms an archive that includes a range of seasonal chemical species such as major ions and trace elements, as well as human-made pollutants emitted into the Arctic atmosphere (Koziol et al., 2021). Ny-Ålesund is a well-monitored area and a natural laboratory for complex system observations, ideal for exploring both long-range contaminants from mid- to high-latitude regions of Eurasia and Canada (Nawrot et al., 2016; Song et al., 2022; Vecchiato et al., 2024; D'Amico et al., 2024), and local inputs from both natural processes and human settlement (Vecchiato et al., 2018). Previous research has extensively investigated the chemistry of Arctic snow and the exchange of inorganic species between the cryosphere and the atmosphere across multiple sites, including Barrow, Summit Greenland, Alert, Sodankylä, and over the Arctic Ocean during the MOSAiC expedition (e.g., Beine et al., 2003; Björkman et al., 2013; Jacobi et al., 2019). Specific studies in Ny-Ålesund and surrounding areas have explored the temporal and compositional aspects of the lower atmosphere (Stohl et al., 2007; Eleftheriadis et al., 2009; Geng et al., 2010; Zhan et al., 2014; Feltracco et al., 2020, 2021; Turetta et al., 2021), though relatively few have addressed the detailed seasonal dynamics of snow-atmosphere interactions in this region. Building on this existing research, our study aims to enhance the understanding of these interactions, particularly in the context of recent climatic changes.
In this study, we evaluate the surface snow concentration of ionic (Cl−, Br−, NO, SO, methane sulphonic acid (MSA), Na+, NH, K+, Ca2+) and elemental impurities (Li, Be, Mg, Al, Ca, V, Cr, Mn, Fe, Co, Ni, Cu, Zn, As, Se, Rb, Sr, Ag, Cd, Sb, Cs, Ba, Tl, Pb, Bi, U) for the snow seasons between 2018–2021, at the Gruvebadet Snow Research Site (GSRS) location, 1 km south of Ny-Ålesund, where clean and undisturbed snow conditions are guaranteed throughout the whole sampling season. The differences in average meteorological and climatological conditions across the studied seasons are analysed to assess how sea ice extent, polar vortex, and Arctic Oscillation (AO) conditions influence the composition of surface snow in connection with the aerosol-producing and deposition processes in Kongsfjorden. Additionally, a Kruskal-Wallis's test, followed by Dunn's post-hoc analysis, has been employed to identify species most affected by inter-annual and seasonal variations, with the goal of uncovering potential correlations between meteorological-climatic conditions and chemical concentrations.
2.1 Sampling and processing
Three sampling campaigns were conducted in Svalbard between 2018 and 2021, covering the period from October to May according to the onset of the snowpack formation and melting. Sample collection followed the protocol presented in Spolaor et al. (2019), further adopted by Bertò et al. (2021), where consecutive and adjacent sampling was carried in a 3 × 3 m snow sampling area, within a clean sampling snowfield of 100 m width. Each sample was collected 10 cm apart from the previous one, along a precise path. This method was designed to minimise the temporal variability between consecutive samples and reduce the impact of potential spatial variability (within the 5 %–15 % range, according to Spolaor et al., 2019).
During the first sampling campaign, carried out from 4 October 2018 to 10 May 2019, 133 snow samples were collected at the Gruvebadet Snow Research Site (GSRS), a clean-area located about 1 km south of Ny-Ålesund, nearby the Gruvebadet Atmospheric Laboratory (GAL), dedicated to the chemical and physical monitoring of the seasonal snowpack (Scoto et al., 2023; Fig. 1).
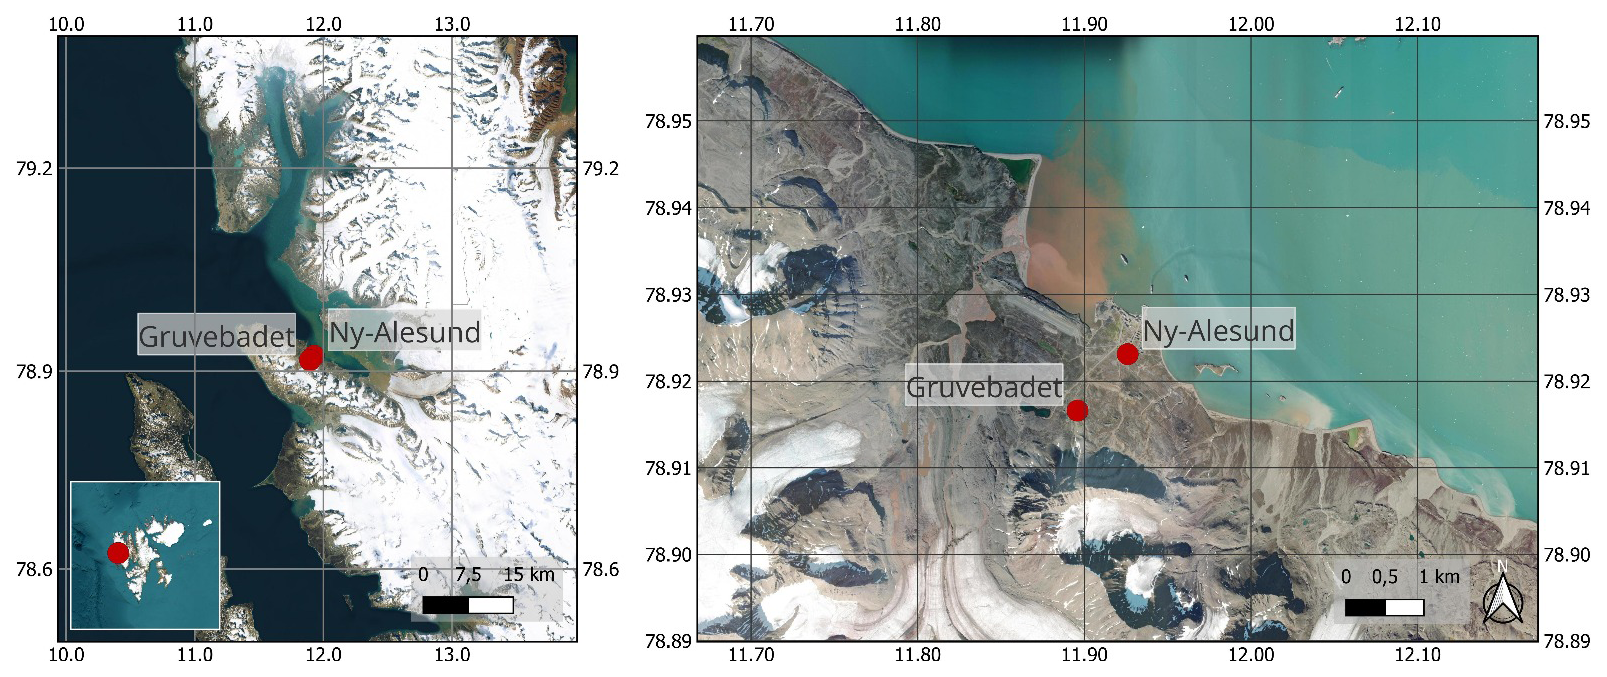
Figure 1Gruvebadet Snow Research Site (GSRS) location with respect to Ny-Ålesund Research Station, in the Brøgger peninsula (Svalbard Islands).
The surface snow was sampled within the upper 3 cm, as this layer is the most directly affected by atmospheric deposition and snow-atmosphere exchanges (Spolaor et al., 2018, 2021b). Sampling only the uppermost layer reduces the risk of signal dilution in deeper snow layers, and ensures a simple, robust protocol suitable for long-term campaigns with minimal disturbance of the snowpack.
Throughout the season, the sampling resolution varied based on light conditions. During the polar night (from October to early March), snow sampling was carried out every 3–5 d. With the beginning of the polar day, daily sampling was conducted until the end of the snow season.
The second campaign was carried out from 26 October 2019 to 25 May 2020, with a total of 107 samples collected. Consecutive samples represent the same snow layer in the absence of snowfall or wind drift/erosion. However, factors such as snow aging, potential element re-emission, transformation, and dry deposition can introduce variability, making continuous monitoring essential.
Finally, during the third snow sampling campaign, lasting from 27 October 2020 to 15 June 2021, a weekly sampling was conducted at GSRS, with a total of 32 samples collected.
During snow sampling, the temperature and density of surface snow were measured, and the density of snow was calculated based on weighting a 100 cc cylinder. After collection, snow samples were melted, and two different aliquots were obtained and stored in separate vials. In a 1.5 mL polypropylene (PP) vial, 1 mL of sample was stored for ionic species, while another aliquot was stored in a 5 mL LDPE vials for trace elements analysis. PP vials designated to ionic species analysis were previously sonicated for 30 min in UltraPure Water (UPW) (18 MΩ cm−1 at 25 °C) for decontamination. LDPE vial used for trace elements analysis were instead conditioned with HNO3 2 % and sonicated for 30 min. All sample aliquots were stored at −20 °C in dark conditions and transported to the Venice ISP-CNR laboratories.
To assess potential contamination during sampling, handling, and transport, field blanks were collected during each campaign. Metal-free vials (Avantor, VWR Centrifuge Tubes, CHN) were opened to ambient air at the sampling sites for a few minutes without collecting snow, then sealed and transported to the Ny-Ålesund laboratory. There, they were filled with 2 % HNO3 and stored under the same conditions as the snow samples. In parallel, analytical blanks were prepared by opening vials to air, sealing them, and transporting them directly to Venice, where they were filled with 2 % HNO3 and ultrapure water from the laboratory. Both field and analytical blanks were analysed alongside the snow samples, confirming that background contamination levels were consistently below LODs or one order of magnitude lower than the lowest concentration detected for all analytes.
Furthermore, seawater temperatures and salinity at 10 m depth were also monitored in Kongsfjorden (Kb3; 78°57.228′ N, 11°57.192′ E) during 2019–2021 spring seasons, with data collected every 3–6 d (Assmy et al., 2023). Data was derived from Conductivity Temperature Depth (CTD) casts with either a MiniSTD model SD-204 (SAIV A/S, Bergen, Norway) or a XR-620 CTD (RBR Ltd, Ottawa, Canada). Combined casts of both instruments conducted in May 2020 and 2021 did not reveal differences in temperature or salinity in the reported accuracy (two post comma digits).
2.2 Analysis of ionic species
The analysis of anionic species (Cl−, Br−, NO, SO, MSA) was carried out using an ion chromatograph (IC, Thermo Scientific Dionex™ ICS-5000, Waltham, MA, USA) coupled with a single quadrupole mass spectrometer (MS, MSQ Plus™, Thermo Scientific, Bremen, Germany). The separation was performed using an anionic exchange column (Dionex Ion Pac AS 19 2 mm ID × 250 mm length) equipped with a guard column (Dionex Ion Pac AG19 2 mm ID × 50 mm length). Sodium hydroxide (NaOH), used as mobile phase, was produced by an eluent generator (Dionex ICS 5000EG, Thermo Scientific). The NaOH gradient with a 0.25 mL min−1 flow rate was: 0–6 min at 15 mM; 6-15 min gradient from 15 to 45 mM; 15–23 min column cleaning with 45 mM; 23–33 min equilibration at 15 mM. The injection volume was 100 µL. A suppressor (ASRS 500, 2 mm, Thermo Scientific) removed NaOH before entering the MS source. The IC-MS operated with a negative electrospray source (ESI) with a temperature of 500 °C and a needle voltage of 3 kV. The other MS parameters are reported by Barbaro et al. (2017). The same IC system was simultaneously used to determine cationic species (Na+, K+, Ca2+ and NH). However, Ca2+ was not measured within the samples collected during the second campaign due to instrumental limitations.
The separation occurred with a capillary cation-exchange column (Dionex Ion Pac CS19–4 mm 0.4 mm ID × 250 mm length), equipped with a guard column (Dionex Ion Pac CG19–4, 0.4 mm ID × 50 mm length), and the species were determined using a conductivity detector. Analytical blanks of ultrapure water (> 18 MΩ cm) were included in the analysis, and the Method Detection Limit (MDL) was set to 3 times the standard deviation of the blank values. Checks for accuracy were made using certified multi-element standard solutions for anions (Cl−, Br−, NO, SO, no. 89886-50ML-F, Sigma Aldrich) and cations (Na+, K+, Ca2+, no. 89316-50ML-F, Sigma Aldrich) at a concentration of 10 mg L−1 ± 0.2 %. The analytical precision was quantified as the relative standard deviation (RSD) for replicates (n>3) of standard solutions and was always < 10 % for each ion.
2.3 Trace Elements analysis
Twenty-six elements (Li, Be, Mg, Al, Ca, V, Cr, Mn, Fe, Co, Ni, Cu, Zn, As, Se, Rb, Sr, Ag, Cd, Sb, Cs, Ba, Tl, Pb, Bi and U) were analysed on samples previously melted and acidified to 2 % v/v with HNO3 (UpA grade, Romil, UK) for 24 h before analysis (Spolaor et al., 2018; Spolaor et al., 2021a).
The analysis was performed using Inductively Coupled Plasma Mass Spectrometry (ICP-MS, iCAP RQ, Thermo Scientific, US). The ICP-MS was equipped with an ASX-560 autosampler (Teledyne Cetac Technologies), PolyPro PFE nebulizer, PFE cyclonic spray chamber thermostated at 2.7 °C, sapphire injector, quartz torch and Ni cones. The acquisition was performed at 1550 W of plasma RF power in Kinetic Energy Discrimination (KED) – high matrix mode, using He as collision gas (4.3 mL min−1). Instrument parameters were optimised for best sensitivity in the whole mass range, minimum oxides (< 1 %) and double charges (< 3 %). Quantification was obtained by external calibration with multi-elemental standards prepared in ultrapure water (18 MΩ cm−1 at 25 °C) with 2 % v/v ultrapure grade HNO3 (UpA grade, Romil, UK), with a combination of certified level multi-elemental solutions IMS-102 and IMS-104 from UltraScientific. Analytical quality control was performed by memory test blank (repeated analysis of ultrapure grade HNO3 2 % v/v blank solution) after each sample and calibration verification (repeated analysis of reference standards) every 11 samples. More details are found in Spolaor et al. (2021a).
2.4 Transport modelling, sea ice, Kongsfjorden condition, and polar vortex
The Lagrangian particle dispersion model HYSPLIT (Draxler, 1998; Stein et al., 2015) was used to determine the source region of air masses over Ny-Ålesund. This model has previously been shown to be an effective tool for the prediction of transport pathways into and within the Arctic and Antarctic regions (Barbaro et al., 2015; Feltracco et al., 2021). The simulations were driven using meteorological data from the Global Data Assimilation System (GDAS) one-degree archive, set the top of the model at 10 000 m and the height source equal to the GSRS altitude. Back-trajectories were calculated every 6 h, with a propagation time of 120 h for each sampling period. The choice of a 6 h interval for the calculation of back-trajectories allows for the capture of temporal variability in air mass origins over the day, which is particularly important in polar regions where atmospheric circulation patterns can change rapidly. This temporal resolution strikes a balance between computational efficiency and the need for sufficient detail to characterise the variability in source regions during each sampling period. The propagation time of 120 h was selected to provide an adequate temporal window to trace long-range transport pathways that influence air mass composition at Ny-Ålesund. This configuration is consistent with previous studies on atmospheric circulation in the same site (Feltracco et al., 2021).
This approach was used to ensure an envelope working for all investigated tracers. The resulting multiple trajectories were based on the screen-plot analyses of total spatial variance.
The Ice Service provided by the Norwegian Meteorological Institute (NIS) was employed to analyse the weather conditions via remotely sensed data and to generate ice charts of Svalbard, ice-edge information, and sea surface temperatures trends. Sea ice extent variability in Kongsfjorden was evaluated based on dataset made available by Gerland et al. (2022).
Differences between the sampling campaigns were evaluated through the National Centers for Environmental Prediction/National Center for Atmospheric Research (NCEP/NCAR) Reanalysis data from NOAA Physical Sciences Lab's daily composites tool, used to calculate the near-surface air temperatures across the Northern Hemisphere from October to May.
2.5 Statistical procedures and Enrichment Factors (EFs) Analysis
Results below the limit of detection were assumed to be equal to of Method Determination Limit (MDL) prior to perform statistical analysis, to approximate their likely level based on the data distribution curve (best approximated as log-normal for most of the studied variables) (George et al., 2021).
Enrichment Factors (EFs) were calculated to explore the mixed sources of the investigated elements (Wedepohl, 1995). For this scope, Ba was used as a crustal element of reference (Spolaor et al., 2021a; Ruppel et al., 2023). To complement the EFs analysis, a Hierarchical Cluster Analysis (HCA) was performed using Ward's algorithm and Euclidean distances as clustering criteria, to determine the presence of some clusters and simplify the interpretation of the dataset (Spagnesi and Barbaro, 2025).
Additionally, to examine the inter-annual and seasonal variations in chemical's concentrations and to identify the species most affected by these changes, a Kruskal-Wallis' test was employed, followed by Dunn's post-hoc test for pairwise comparisons. The Kruskal-Wallis' test, a nonparametric alternative to Anova, which is typically applied when samples do not follow a normal distribution (Van Hecke, 2013), was chosen to assess differences in chemical concentrations across the years of sampling campaigns and multiple seasons. This allowed for an objective evaluation of temporal differences in concentration levels, while Dunn's post-hoc analysis, which uses the same shared rankings and pooled variance assumed under the Kruskal-Wallis null hypothesis, helped identify which specific seasons showed statistically significant differences from each other. The Bonferroni correction was used for the Dunn's test to control for false positives when performing multiple pairwise comparisons (Dunn, 1961).
The ultimate goal of this analysis was to uncover potential correlations between meteorological-climatic conditions and chemical concentrations in surface snow, helping to better understand how environmental factors contribute to contamination trends.
These combined statistical approaches provided a comprehensive framework for analysing the complex dataset.
3.1 Interannual trends of chemical species on the surface snow
Three consecutive snow seasons were evaluated to define the chemical composition of the surface snow in the Arctic site of GSRS. The sea salt ions Cl− (50 %), and Na+ (23 %) represent the most abundant species, followed by SO (11 %), Mg (7 %), Ca (2 %), Fe (1 %) and Al (1 %). Similar relative concentration abundances were also found in previous studies on the snow of the Svalbard Archipelago (Beaudon and Moore, 2009; Vega et al., 2015; Barbaro et al., 2021; Spolaor et al., 2021b).
Table 1 reports the average ionic loads of the most abundant (> 1 %) species in the surface snow, considering three different seasons: autumn is defined until 21 December, winter until 21 March, and spring from then to the melt onset, identified by 5–6 consecutive days of negative snow accumulation. The average ionic loads of the less abundant (< 1 %) species are reported instead in Table S1 in the Supplement. Average loads are presented in place of medians to avoid underrepresentation of the occasional high concentration events, which are critical for understanding the snowpack chemistry dynamics in the Arctic environment.
Table 1Average ionic loads of the most abundant (> 1 %) ionic and elemental species in the surface snow during each season of the three consecutive sampling campaigns. The standard deviation is shown in brackets, while in the case of nss-SO the brackets represent the percentage of nss-SO compared to the total SO. “n” indicates the number of samples considered for the calculation of the average. Annual averages are reported at the end of each sampling year. In bold, we showed the sum of snow season with standard deviation in brackets.
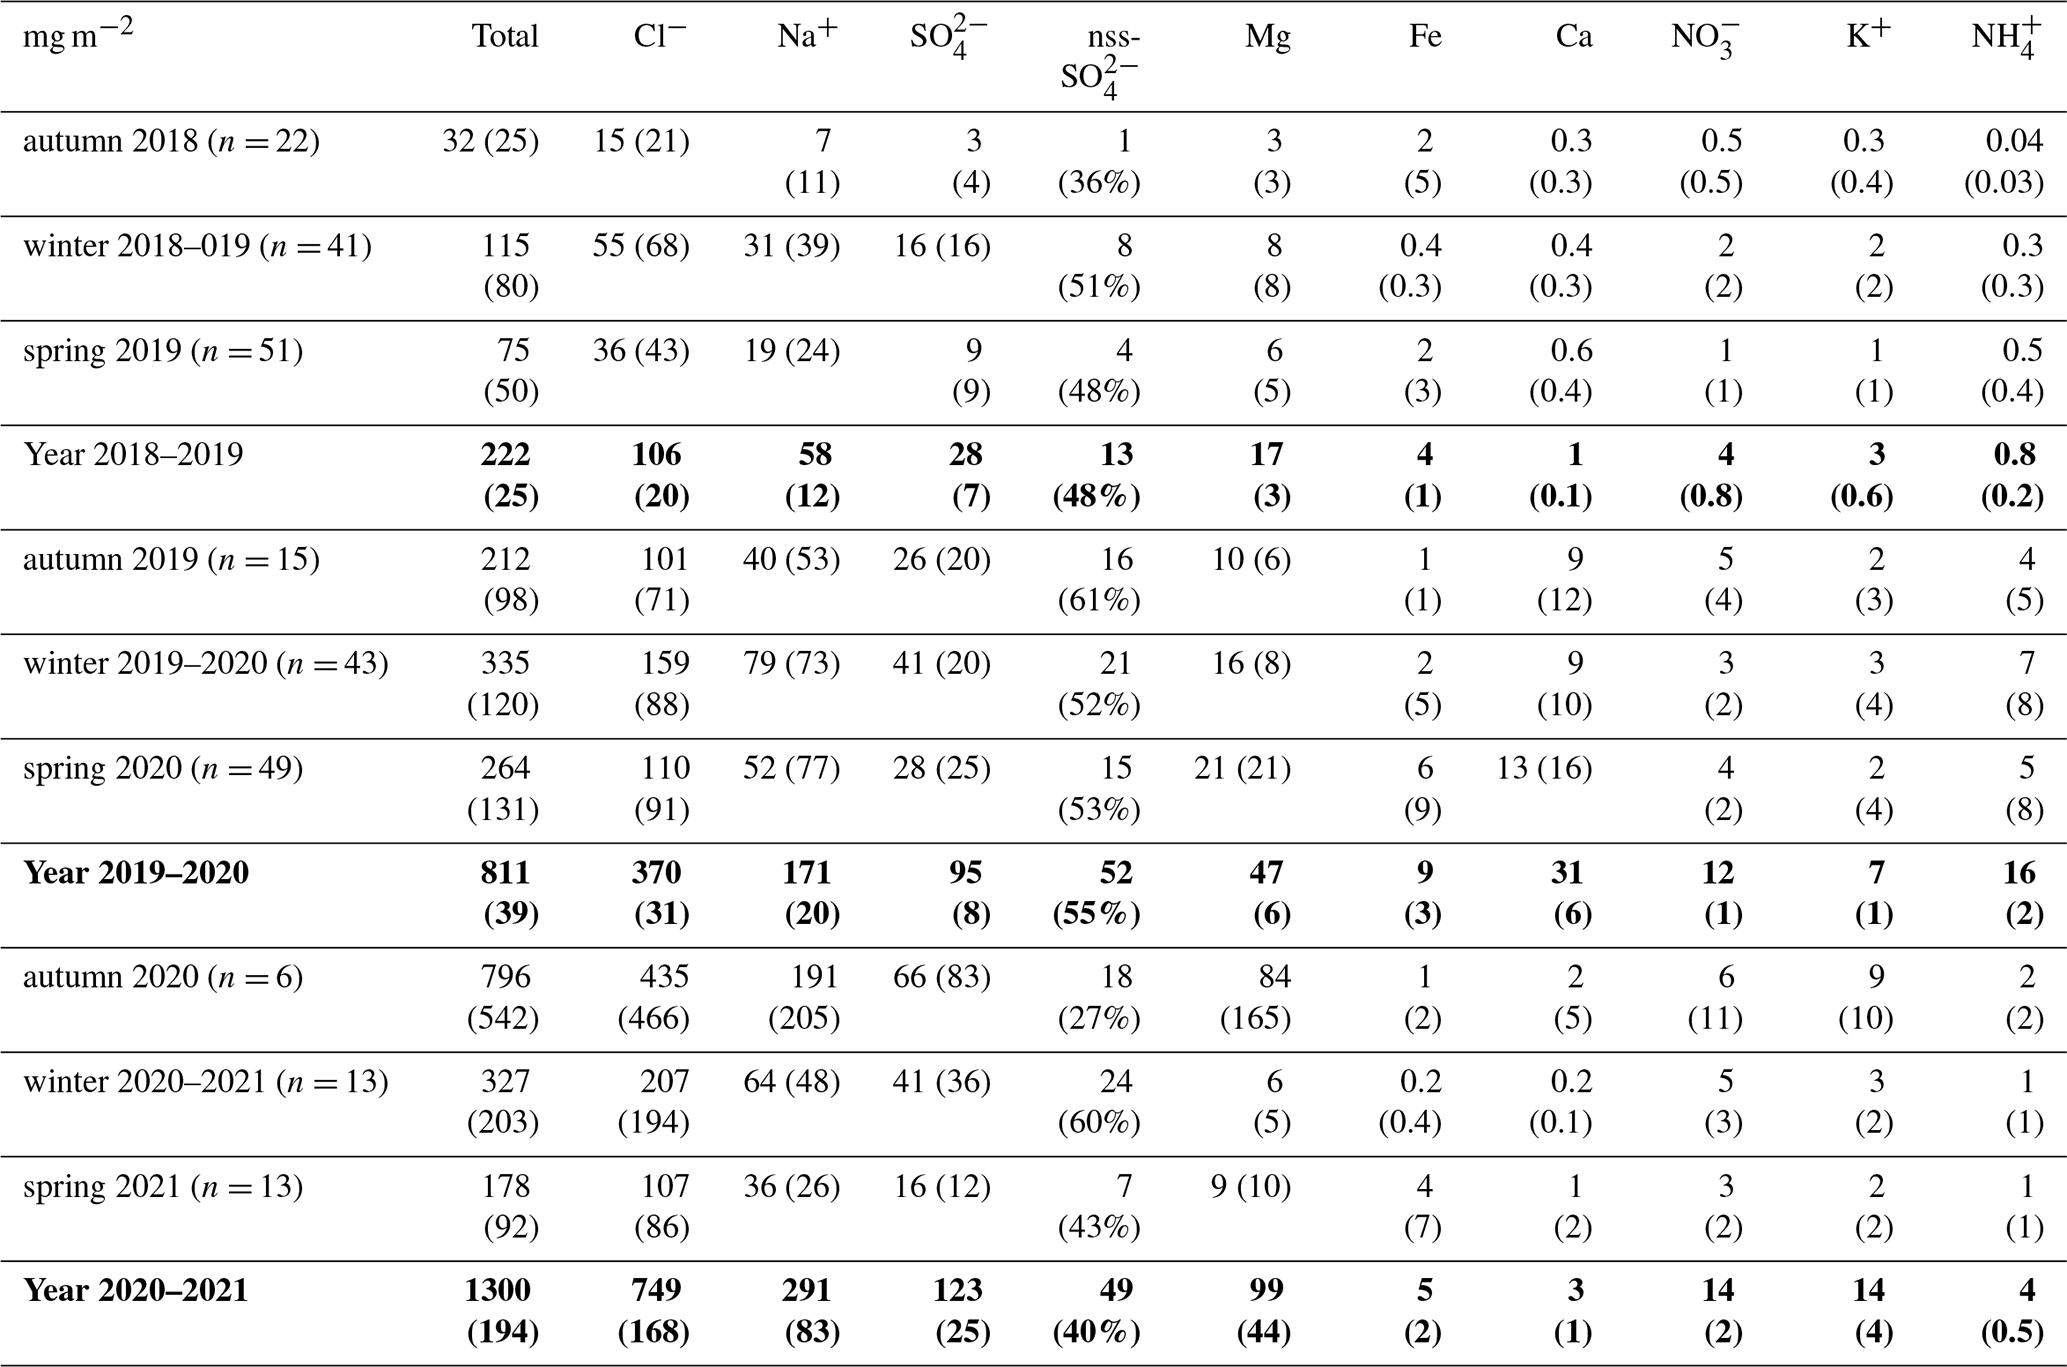
The average loads of the first sampling year were lower compared to the other campaigns (Fig. S1; Table 1).
High average loads were observed instead for Cl− and Na+ in the top snowpack layer during the 2019–2020 and 2020–2021 winter seasons. The highest concentrations of sea salt species were found in autumn 2020, despite low snow accumulation (17.25 cm) in a period of relatively high precipitation (4.91 mm) (Fig. 2, Table S3). This apparent contradiction can likely be attributed to the increased wind speeds during that time, which may have caused snow redistribution, thereby limiting accumulation despite the considerable precipitation.
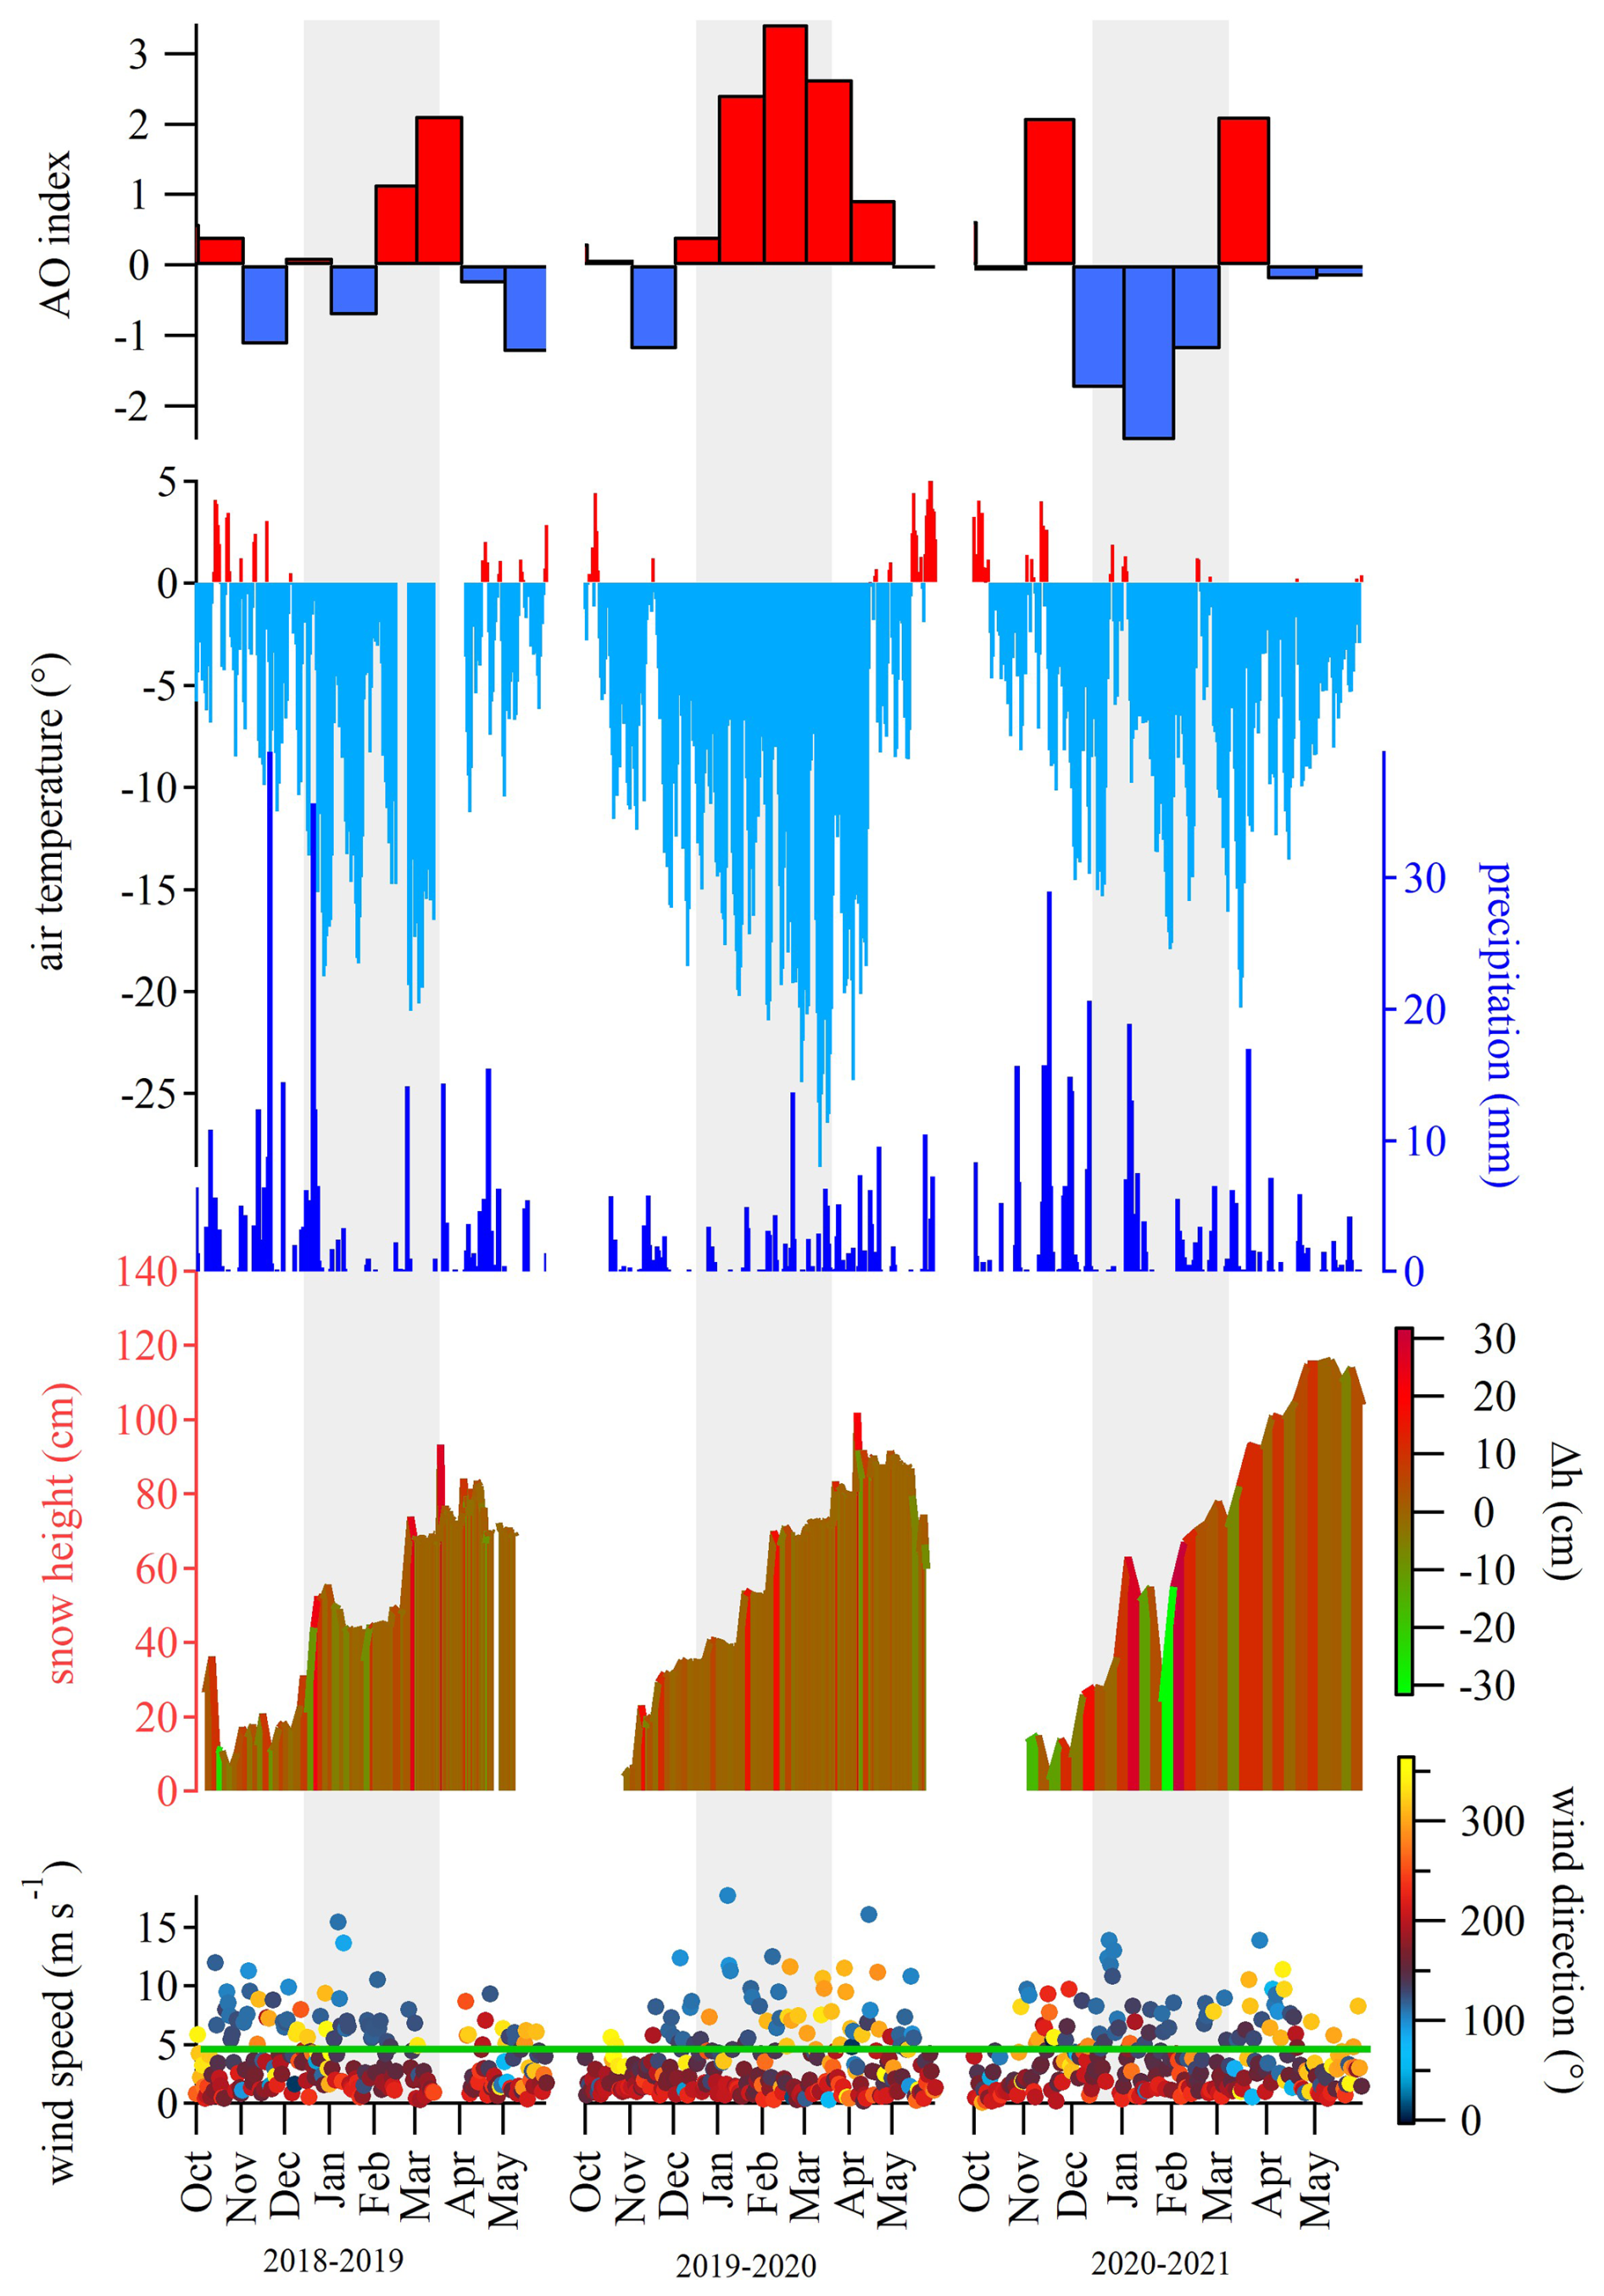
Figure 2(a) AO Index; (b) air temperature (°C); (c) precipitation (mm); (d) snow height (cm) and Δh snow height (cm); (e) wind speed (m s−1) and wind direction (°) from the NCEP/NCAR Reanalysis data. The green horizontal line in panel (e) indicates the 5 m s−1 threshold, above which wind drift may occur on surface snow layers. The colour of this line refers to the Δh color scale shown in panel (d), where green indicates negative values of Δh. NOAA Physical Sciences Lab's daily composites tool was used to calculate the near-surface air temperatures across the Northern Hemisphere from October to May. Grey bands across the panels indicate the winter periods.
The non-sea-salt sulphate (nss-SO), calculated using a seawater SO mass ratio of 0.252 (Millero et al., 2008), was the most abundant fraction of the total sulphate in autumn 2019 and winter 2020–2021, while in autumn 2018 and 2020 sea salt sulphate (ss-SO) was the dominant fraction. No clear predominance between the two fractions was achieved during the other investigated seasons, which may reflect a more mixed influence of marine and continental sources (Table 1).
The abundance of all chemical species investigated is quite similar for all years (Fig. S1), although the sampling campaign 2019–2020 showed higher percentage of calcium ranging between 3 % and 5 %, in contrast to the typical concentrations < 1 % found in the other two campaigns.
To further examine differences in species concentrations across seasons and years, a Kruskal-Wallis test was performed. The test indicates significant differences (χ2>15.51, df= 8, p-value = 0.05) for several species across the nine seasons of the three sampling campaigns. These species include Br− (χ2= 16.9), MSA (χ2= 81.3), SO (χ2= 21.3), nss-SO (χ2= 23.4), Bi (χ2= 19.2), Cd (χ2= 31.9), Cu (χ2= 44.5), Fe (χ2 = 21.9), Pb (χ2= 45.1), Ni (χ2= 20.6), Ag (χ2= 24.5), U (χ2= 22.1), V (χ2= 40.9), Zn (χ2= 29.9). To identify which seasons accounted for these differences, a Dunn's test with Bonferroni correction was applied as a post-hoc test, revealing significant seasonal differences for multiple elements (Fig. S2), with pronounced differences particularly between autumn and winter, and between spring and winter (P.adj < 0.05; Table S5).
Finally, correlations between meteo-climatic variables (air temperature, wind speed, wind direction, precipitation, AO index) and the concentrations of the selected species were computed to assess potential meteorological influences. The results indicated generally weak positive correlations (ρ<0.5, p-values < 0.05) for the variables considered. Notably, MSA showed a correlation with air temperature (ρ = 0.2, p-values < 0.05), as did Bi (ρ= 0.2, p-values < 0.05), Cu (ρ= 0.2, p-values < 0.05), Fe (ρ = 0.2, p-values < 0.05), Pb (0.1, p-values < 0.05), Ni, (ρ= 0.2, p-values < 0.05), Ag (ρ= 0.2, p-values < 0.05), U (ρ= 0.3, p-values < 0.05), V (ρ = 0.3, p-values < 0.05), and Zn (ρ= 0.3, p-values < 0.05).
3.2 Polar vortex and Arctic Sea ice extent in 2019–2020
According to the 2023 survey conducted by the National Snow and Ice Data Center (NSIDC), the maximum extent of Arctic sea ice since 2014 has been recorded in March 2020, with 14.73 million square kilometres of the Arctic Ocean surface, in a decadal trend characterised by a −2.53 % of decline. Considering the Kongsfjorden area, the total sea ice extent varied from 63.94 km2 in March 2019 to 129.81 km2 in March 2020, and was with 46.26 km2 lowest in March 2021 (Gerland et al., 2022). Specifications on Drift Ice (DI), Fast Ice (FI), and Open Water (OW) extent are reported in Table S2. The 2020 maximum sea ice extent followed the exceptionally strong and cold stratospheric polar vortex that took place in the Northern Hemisphere (NH) during the 2019–2020 polar winter, together with low wave activity from the troposphere, which allowed the polar vortex to remain relatively undisturbed (Lawrence et al., 2020). Notably, the 2020 Arctic Sea ice extent is 16 % and 9 % higher than previous (2018–2019) and following (2020–2021) records (dataset NSIDC, NOAA). Lower surface mean air temperatures (−14.7 °C, compared to the −11.4 °C recorded in 2018–2019, and the −8.0 °C recorded in the 2020–2021), average reduced precipitations (2.1 mm compared to 2.6 mm in 2018–2019, and 3.2 mm in 2020–2021), higher maximum mean wind speed (17.7 ms−1 for 6 d, compared to 15.4 m s−1 for 3 d in 2018–2019, and 13.8 ms−1 for 5 d in 2020–2021), and higher mean snow height (62.63 cm compared to 58.06 cm in 2018–2019, and 57.77 cm in 2020–2021) were observed during the 2019–2020 winter season, attributed to the influence of a strong polar vortex triggered by a net positive Artic Oscillation (AO) phase. The 2020 anomalous AO index is displayed in Fig. S3. Seasonal values of mean air temperatures (°C), mean precipitation (mm), maximum mean wind speed (m s−1) and mean snow depth (cm) during the three consecutive sampling campaigns are reported in Table S3. Temperature data were provided by the Norwegian Centre for Climate Services (NCCS), while sea ice extent data were supplied by National Snow and Ice Data Center (NSIDC). Seawater temperature data collected at 10 m depth at a mid-fjord station near Ny-Ålesund (Kb3) was found to be colder during 2020 compared to 2019 and 2021 spring seasons (Table S4). Although these temperatures were still above the freezing point for the observed salinity levels, they contributed to colder overall conditions in Kongsfjorden, supporting the formation and prolonged presence of sea ice when combined with cold atmospheric conditions.
4.1 Ny-Ålesund seasonal and interannual trends variability in surface snow
The three consecutive sampling campaigns conducted from 2018 to 2021 confirmed the dominance of sea salt input in the surface snow of Svalbard, due to the proximity of the sampling site to the coastline (Barbaro et al., 2021). The dominant ions are Na+, Cl−, and SO, associated with the scavenging precipitation of marine aerosol (Hodgkins and Tranter, 1998). The observed mean seasonal trends (Fig. S1) display the highest concentrations of marine species in autumn 2020, followed by 2020–2021 and 2019–2020 winter seasons. However, wintertime concentrations are presumably linked to weakened (2019–2020) or destroyed (2020–2021) polar vortex (Fig. 2) and intense cyclonic storms, associated with anomalous warming events capable of transporting both heat and moisture from lower latitudes to Svalbard (Rinke et al., 2017). In addition to these factors, it is important to account for snow ablation or erosion by wind. The change in snow height (Δh) between consecutive sampling events provides valuable insights into such processes. A decrease in snow height signals ablation can indeed result from snow melting (under positive temperatures), snow aging, sublimation, or snow drift. In particular, when wind speeds exceed 5 m s−1, the threshold commonly accepted for initiating snow drift and ablation episodes (Pomeroy, 1989), we can infer the snow erosion due to wind drift likely occurred (Fig. 2). This effect may explain some of the variability in snow ion concentrations, especially during intense storms or strong winds.
Autumn 2020 represents most likely an outlier, due to scarce precipitations (Fig. 3) that led to more concentrated impurities in the surface snow. In contrast, late spring 2020 saw a notable increase in typical marine ions (Na+, Cl−, Br-, MSA, SO) and geogenic elements (Al, Ca, Mn, Fe, Sr), compared to spring 2019 (Fig. 3). This increase may be attributed to the very close drift Arctic Sea ice presence in Kongsfjorden (Table S2), which reached its maximum extent in March 2020 due to low-temperature anomalies and intensified atmospherically driven sea ice transport and deformation, caused by higher than normal winter wind speeds (Fig. S4). These conditions likely enhanced the production of sea spray aerosols, which, when carried by winds, may have increased the deposition of marine species onto the snowpack. The increased deposition of geogenic elements might also have been influenced by low temperature anomalies (as seen with Fe), and/or by stronger wind speeds, although significant correlations have not emerged in this preliminary statistical analysis. Additionally, an outstanding positive phase of the Arctic Oscillation (AO) in the troposphere (Fig. 2) was recorded in January–March 2020 (Lawrence et al., 2020; Dethloff et al., 2022). Although the entire period was remarkable, January and February featured as clear outliers in the historical timeseries (1950–2023) reported by the NOAA service, while March 2020 exhibited significantly elevated values but did not exceed the statistical threshold for outliers (Fig. S3).
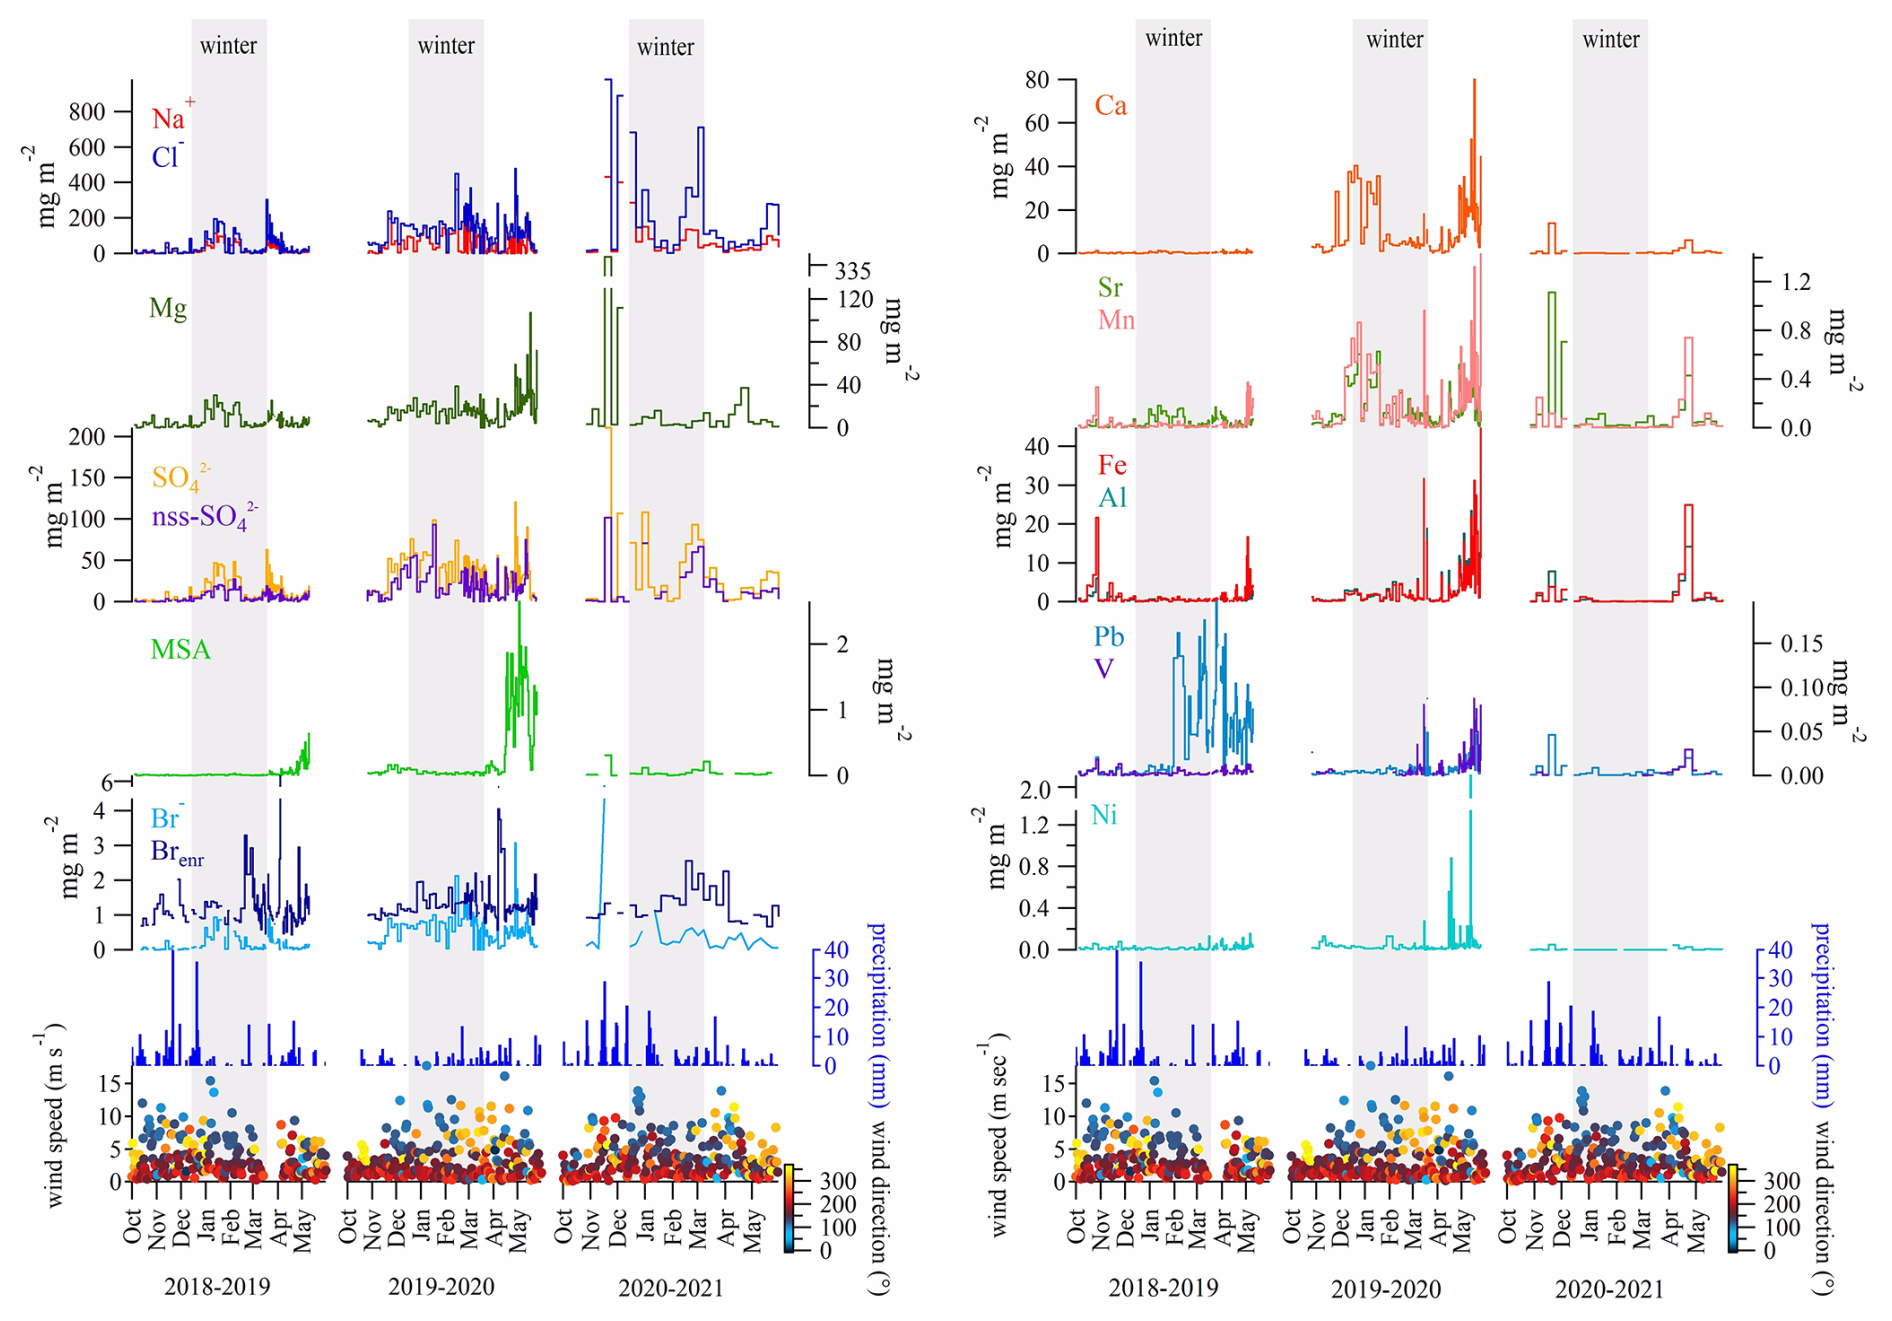
Figure 3Ionic loads (mg m−2) of Na+, Cl−, Mg, SO, nss-SO, MSA, Br−, Brenr, Ca, Sr, Mn, Fe, Al, Pb, V, Ni in the surface snow for the three sampling campaigns: 2018–2019, 2019–2020, 2020–2021. Seasonal trends are here presented for specific elements to provide a detailed view of how concentrations vary across distinct sampling periods. Precipitation trends (mm), wind speed (m s−1), and wind direction (°) are reported twice for visual clarity.
A 2021 spring peak of marine species was also recorded, although more attenuated than in spring 2020 (Figs. 3 and S1). This variation is likely attributable to different extents of sea ice in the fjord. Nonetheless, seawater temperatures in 2021, similar to those in 2020 and 2.3 °C colder than in 2019 (Table S4), along with comparable wind speed conditions (Fig. S4), may also have contributed to the observed trends in marine species concentrations. Similarly, the spring peak of Mg, Sr, Mn, Fe, Al, and V in 2021 seems to reflect the high wind speed (Fig. 3) and positive AO index (Fig. 2a) recorded from March to April 2021. Positive anomalies for air temperatures (A) and wind speed (W) conditions (Fig. 2b and e), together with negative anomalies in seawater (O) conditions (Table S4) were observed during the 2020–2021 campaign, while negative A and O conditions were accompanied to positive W during 2019–2020. On the contrary, 2018–2019 diverges from the other campaigns for positive O condition associated to negative W condition anomalies. These contrasting patterns suggest that variability in atmospheric circulation and oceanic state exerts a direct control on the timing and intensity of aerosol deposition to the snowpack. In particular, stronger winds and warmer air masses enhance the transport and deposition of crustal and sea-salt species, whereas negative oceanic anomalies appear to modulate their availability as sources. This highlights how combined shifts in atmospheric and oceanic conditions drive the observed interannual variability of ionic and elemental concentrations in surface snow.
4.2 Enrichment Factors and source attribution
Enrichment Factors (EFs) are a mean of identifying and quantifying human interference with element cycles (Wedepohl, 1995). EFs are calculated from elemental ratios, and are most often used to indicate the impacts of pollution according to Eq. (1):
where [TE] is the concentration of the trace element of interest, [Ba] is the concentration of a lithogenic tracer (in this case Ba substitutes Al), and the subscripts “sample” and “UCC” refer to the concentration of the lithogenic tracer within the sample and the UCC (e.g., Taylor and McLennan, 1995).
Evaluation of EF can help to discuss the singular case of Pb, which showed a 12.5-fold increase during winter-spring 2019 period compared to autumn 2018 (Fig. 3), and provide insights into element sources.
4.2.1 Enrichment Factors in seasonal snow of Ny-Ålesund
The calculated EFs (Fig. 4) for Be, Al, V, Mn, Fe, Co, Rb, Cs, and U were consistently below 10, indicating a predominantly crustal (geogenic) origin for these elements (Wedepohl, 1995; Gabrieli et al., 2011). In contrast, Ni, and Sr displayed EFs greater than 10, suggesting contributions from mixed sources. Notably, Ni exhibited exceptionally high EF values – above 100 – during autumn 2019 and spring 2020 (Ni). Mixed sources were also recognised for Li, K, Cr, Cu, Zn, As, Ag, Cd, and Tl with occasional EF values over 100. This suggests significant anthropogenic contributions, especially for Cu (spring and autumn 2019; spring 2020), As (from autumn 2020 to spring 2021), Zn (autumn 2019) and Cd (from autumn 2018 to spring 2019; winter 2019–2020).
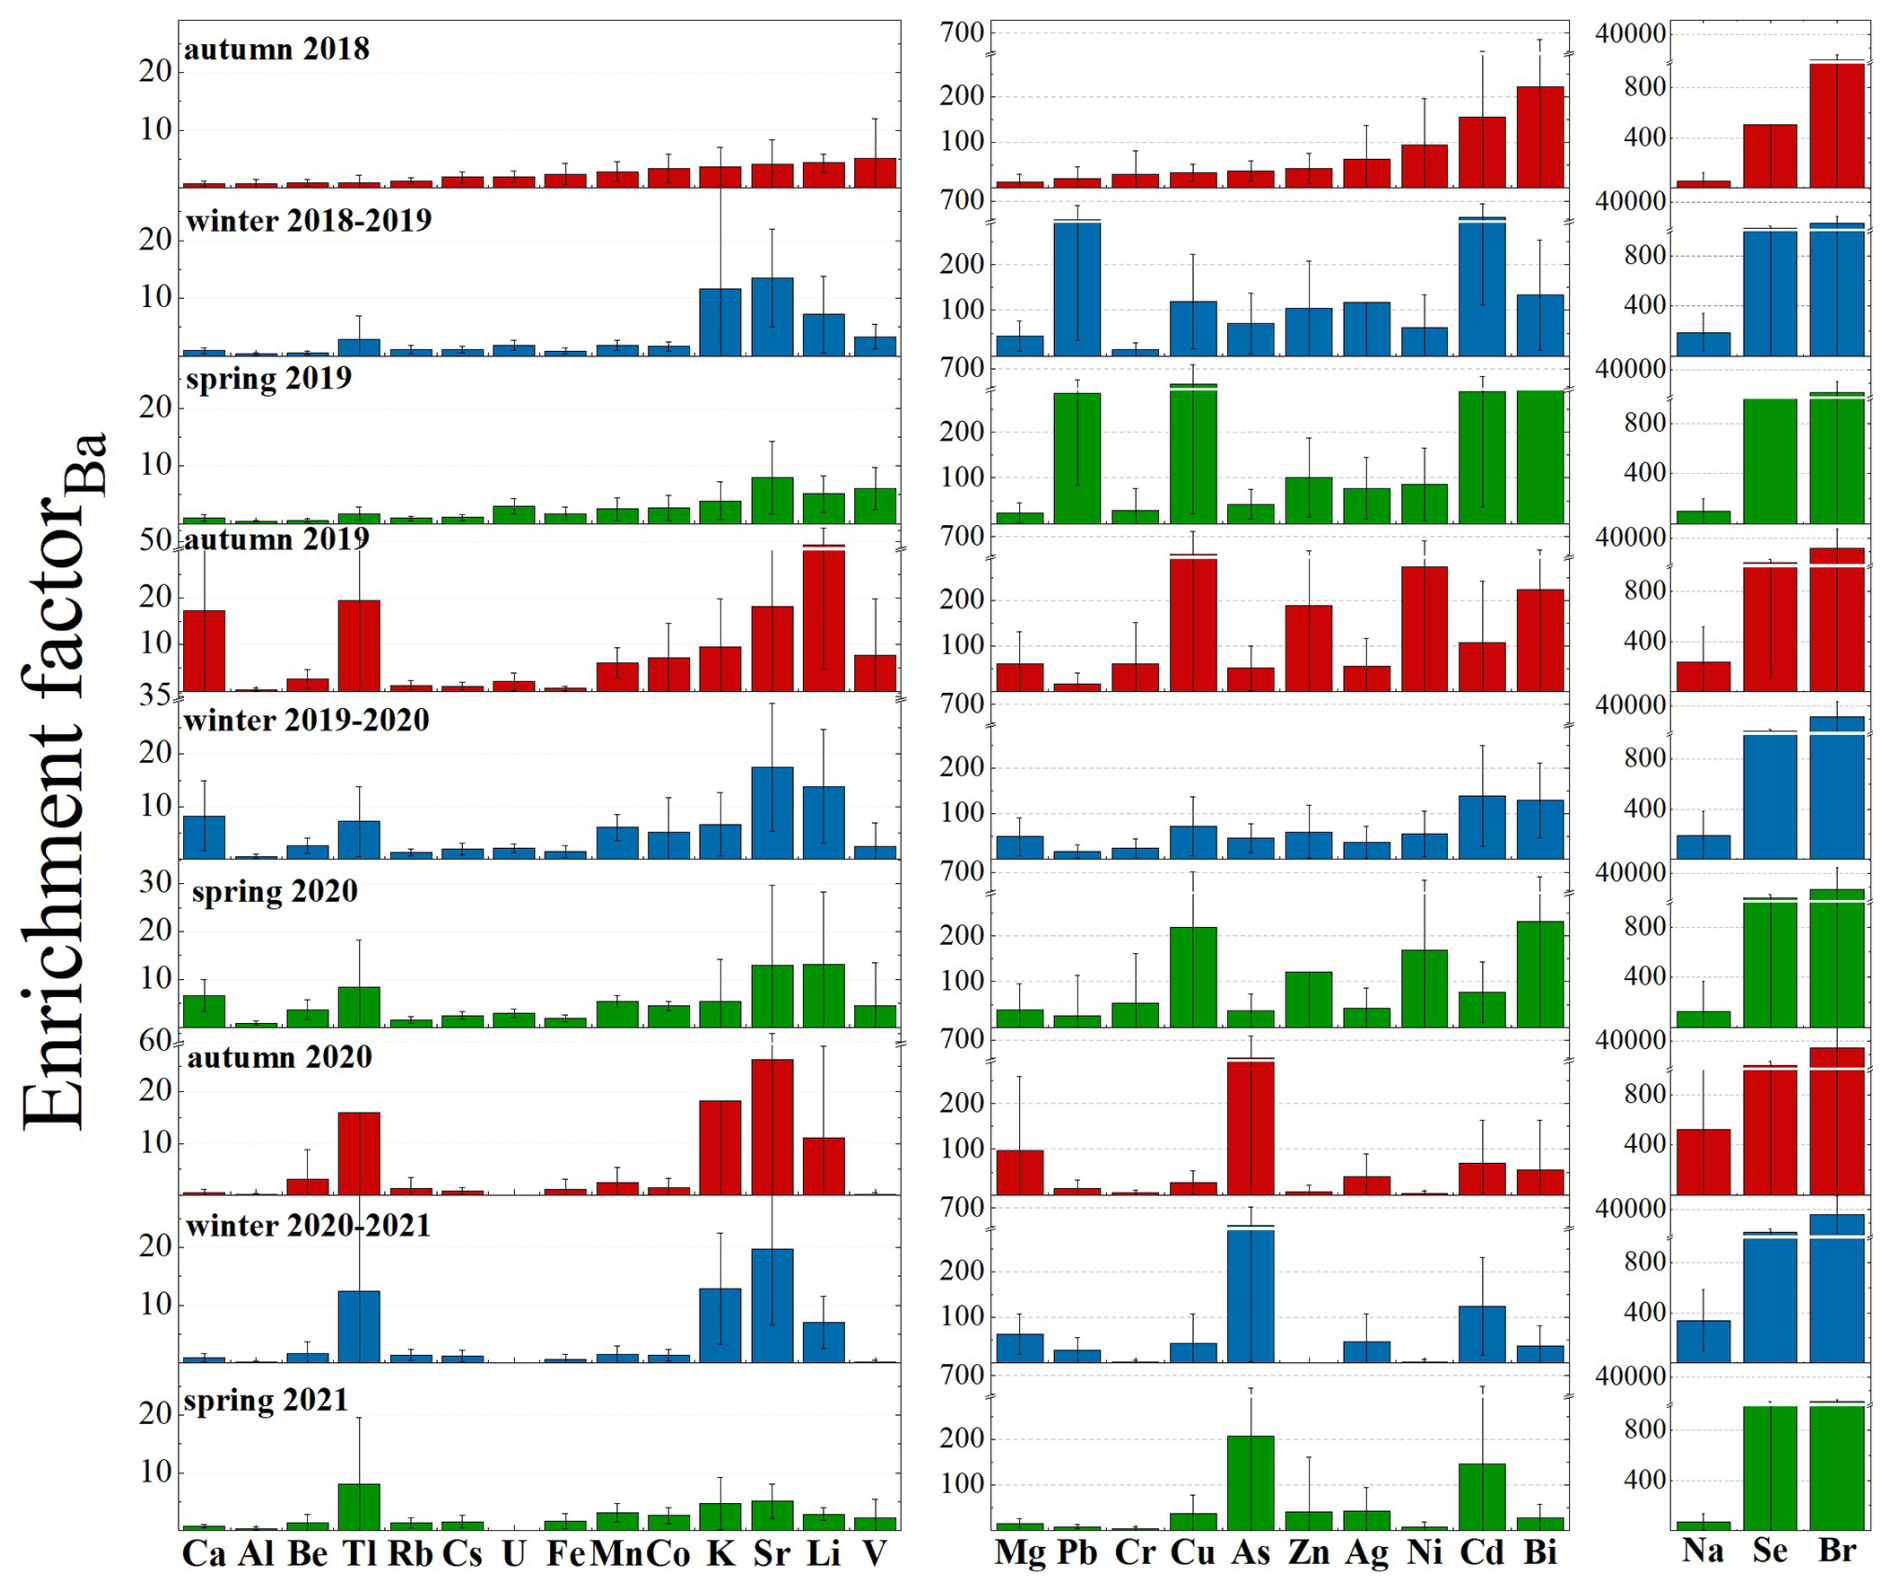
Figure 4Enrichment Factors (EFs) calculated on all the presented trace elements for the three sampling campaigns: 2018–2019, 2019–2020, 2020–2021. Calculating EFs for the full dataset offers a more robust assessment of potential sources and enrichment patterns, minimizing the variability inherent in individual seasons and allowing for a clearer distinction between crustal and non-crustal contributions.
The EF for Pb during all seasons exceeded 100, indicating a strong anthropogenic contribution. In contrast, the peak observed in 2020 no longer shows such elevated EF values (i.e., EF = 26), suggesting a mixed source (Fig. 4). This implies that the April–May 2020 peak is largely of crustal origin, as the overlap with V (EF < 10) also suggests, possibly due to local dust events driven by strong winds exceeding the 5 m s−1 threshold (Fig. 3; Table S3).
The 2019 springtime Pb concentration maxima are typically consistent with a mixture of eastern and western European sources (Sherrell et al., 2000; Bazzano et al., 2015, 2021). In this study, cluster mean trajectories obtained for winter 2018–2019 highlighted a 25 % of air mass provenance from Russian Arctic and a 13 % from eastern Siberia (Fig. S5), possibly explaining the higher concentrations of Pb revealed in spring 2019, following a reduced precipitation regime that occurred in January 2019. A local anthropogenic origin can be excluded though, since no activities (ordinary-extraordinary maintenance or particular events) were recorded in the vicinity of the sampling site in the 2019 sampling season. However, at present, the long-range transport of Pb remains a hypothesis, likely supported by the breakdown of polar vortex (Fig. 2).
Backward trajectories (Fig. S5) for Ny-Ålesund area (78.92° N, 11.89° E) appear mostly in line with literature findings (Platt et al., 2022; Vecchiato et al., 2024), showing three main seasonal characters: a prevalent mass movement from ice-covered Central Arctic Ocean, Kara Sea, and Greenland Sea during autumn, a main provenance from Central Arctic Ocean and Kara Sea during winter, and a predominant trajectory from Northern Canada in addition to air masses arriving from Arctic Ocean and Kara seas during spring.
4.2.2 Main ion sources in seasonal snow of Ny-Ålesund
Examining the dominant ions associated with marine aerosol, we found Cl median ratios ranging from 1.3 to 1.5 w w−1, slightly lower than the expected value of 1.8 w w−1 in the pure seawater (Zhuang et al., 1999), pointing the occurrence of a minimum Cl− depletion in aerosol, quantified as 14 % for the 2018–2019 and 2019–2020 campaigns, and as just 2 % for the 2020–2021 campaign. A possible explanation for this phenomenon could be the de-chlorination of sea-spray aerosol during transport. This reaction occurs when sea-salt particles containing NaCl interact with acids such as HNO3, H2SO4, or organic acids, leading to the release of gaseous HCl (Zhuang et al., 1999, and reference therein). Although less likely, this process could also occur at the snow-atmosphere interface. On the contrary, a possible influence of biomass burning on Cl− depletion process has been excluded by the very low correlation (0.18, p-value < 0.05) found between Cl− depletion values and nss-K ratios, which is a tracer of relative contribution of biomass burning (Song et al., 2018).
Positive correlations between Mg, Ca, and K+ with Na+ and Cl− (Fig. 5, p-value < 0.05) suggest a common sea-spray source. However, the concentrations of Mg are also positively correlated with nss-Ca (ρload= 0.55, p-value < 0.05), calculated according to Morales et al. (1998), indicating a shared non-marine source. This suggests that in addition to their marine origin, these ions (Mg, Ca) also have contributions from a non-marine, crustal source. Further evidence comes from the ratios in surface snow samples collected during the three campaigns, which were higher than those found in seawater (0.32, Millero et al., 2008). This excess indicates the likely presence of mineral particles (i.e., calcite and dolomite), potentially originating from local rock or soil dust (e.g., limestone, dolostone, and marble, which are abundant in Svalbard), as previously observed by Barbaro et al. (2021). To further explore the mixed sources of these elements, we calculated the Enrichment Factors (EFs) of Mg and Ca. For Mg, the EF values were consistently above 10 in all the seasons analysed, indicating a significant non-crustal source (e.g., marine). In contrast, Ca displayed EF values greater than 10 only during autumn 2019, suggesting that its non-crustal contribution (likely from sea spray) was more pronounced during that specific season. Based on these findings, we conclude that Mg and Ca effectively share a common sea spray origin, but the sea-salt contribution of Ca was mainly significant in autumn 2019, while the excess of Ca in other seasons likely reflects inputs from crustal source, such as local mineral dust.
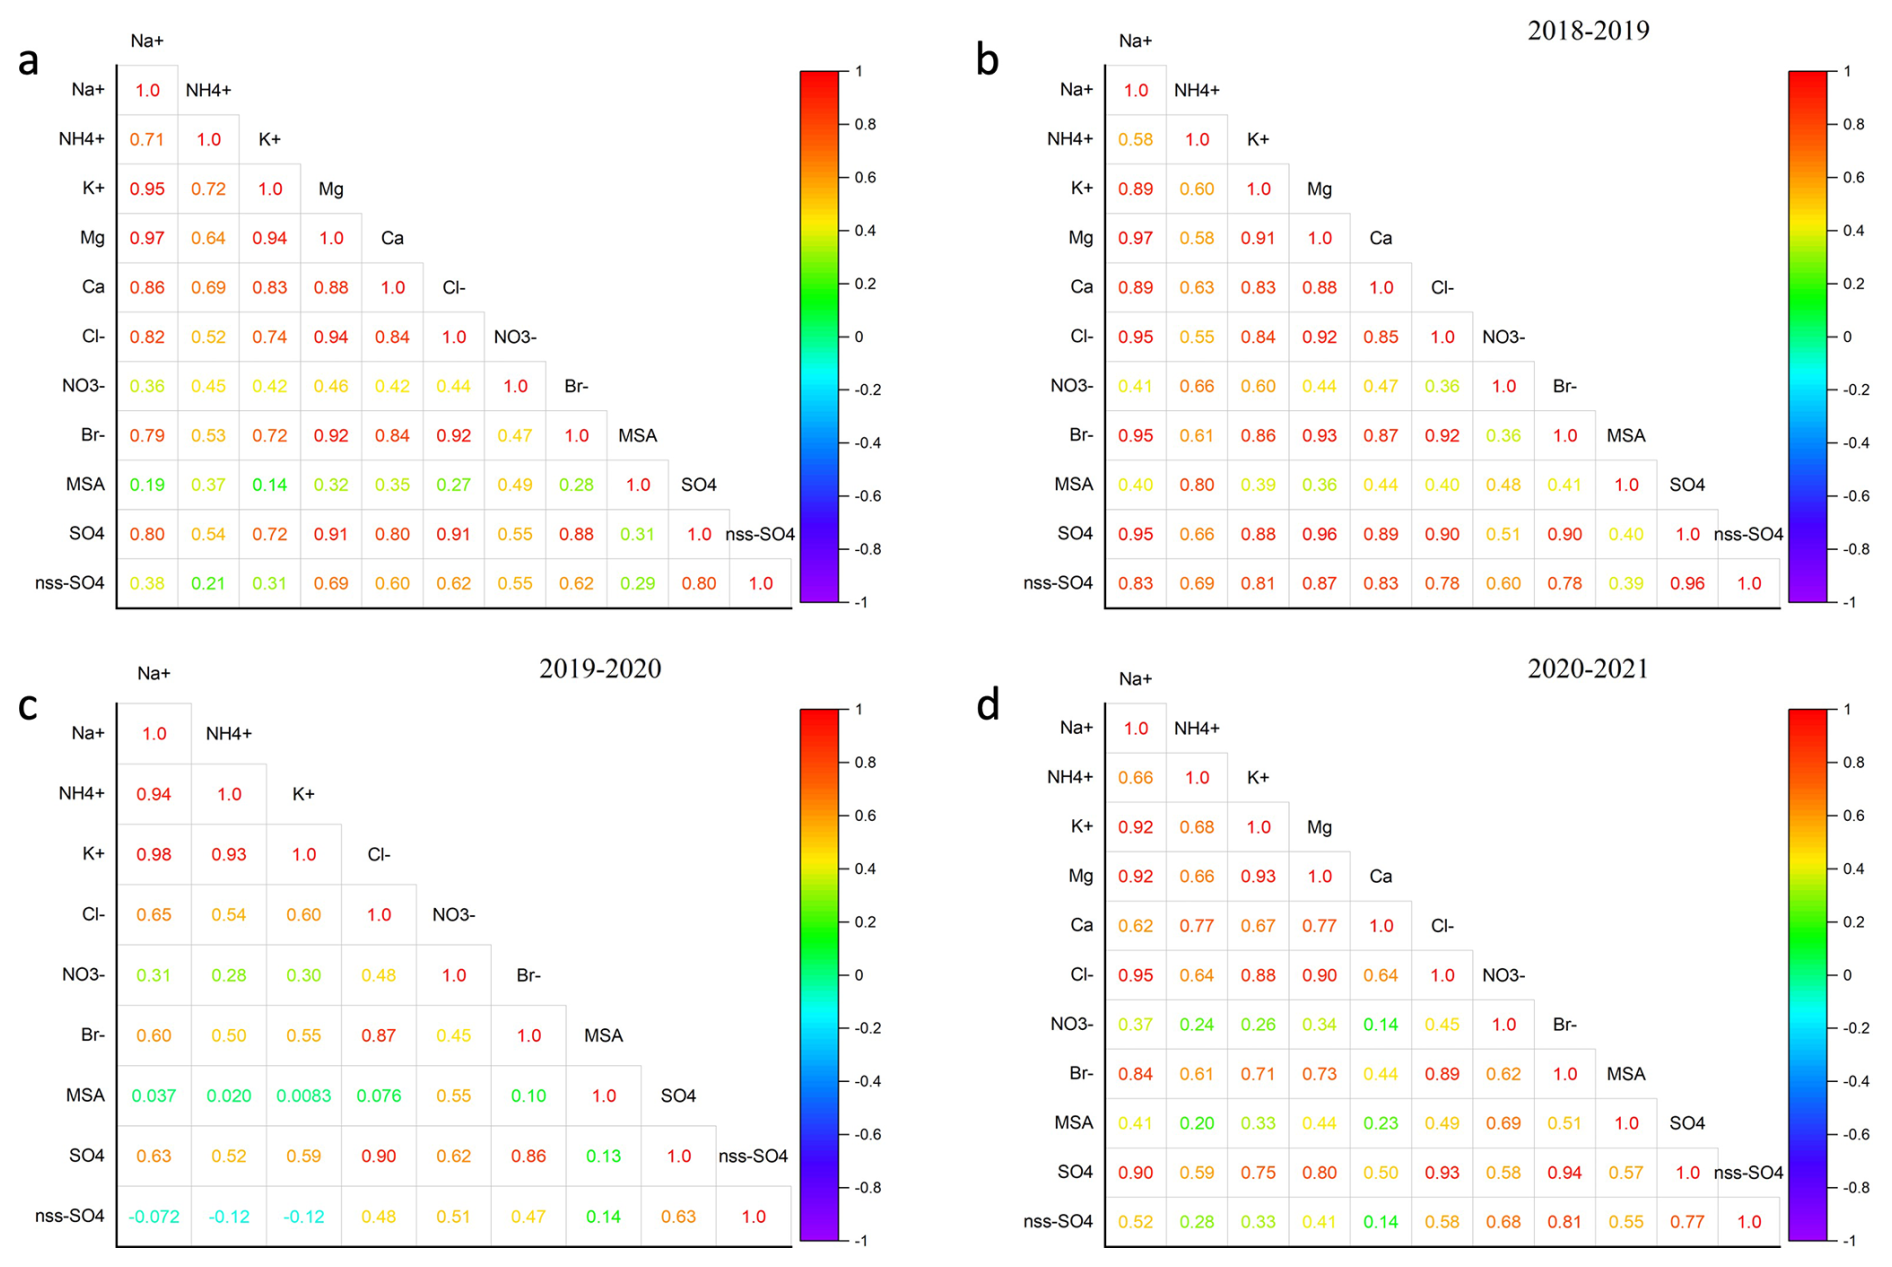
Figure 5Spearman correlation plots. (a) Correlation plot for the three sampling seasons; (b) Correlation plot for the 2018–2019 season; (c) Correlation plot for the 2019–2020 season; (d) Correlation plot for the 2020–2021 season. Higher positive correlations are presented in shades of red, while lower negative correlations are shown in shades of blue.
Similarly, sulphate (SO) is highly and significantly correlated (p-values < 0.05) with both Na+ (ρload= 0.80) and Cl− (ρload= 0.91), indicating that sea-spray is its main source. Nonetheless, Na and Cl ratios are significantly lower than typical seawater values (3.97 and 7.13, respectively, according to Millero et al., 2008) for the former two campaigns (2018–2019, 2019–2020). The elevated sulphate concentrations compared to sodium, also in winter snow, suggest the absence of a strong frost flower signature. Additionally, the lack of significant depletion in nss-SO further supports the minimal role of frost flowers in contributing to the snow composition. Therefore, while frost flowers are known to impact snow chemistry in Svalbard (Rankin et al., 2002; Beaudon and Moore, 2009; Roscoe et al., 2011), our analysis indicates that their contribution to the observed sea salt peaks in Kongsfjorden during the 2018–2019, 2019–2020 campaigns was likely limited. This analysis highlights that, while sea ice extent supports higher sea-salt concentrations in snow, the specific sulphate and ion ratios observed point to sea spray as the main source, with only a minor role for frost flower-related inputs.
Instead, the presence of nss-SO suggests potential inputs from other sources, such as crustal material, anthropogenic emissions (e.g., fossil fuel combustion), or the oxidation of dimethylsulfide (DMS) released from marine biological activities.
To estimate the crustal fraction of sulphate (cr-SO), the nss-Ca (as crustal marker) content was multiplied by 0.59 (SO w/w ratio in the uppermost Earth crust – Wagenbach et al. 1996), obtaining variable contributions for the three sampling campaigns, ranging from 2.45 % up to 12.94 %. Conversely, the anthropogenic contribution to nss-SO concentrations was investigated by the application of the [ex-SO] concentration formula (Schwikowski et al., 1999), considering the average concentration of [Ca] instead of the average ionic concentration [Ca2+] because Ca2+ concentrations were not measured in the samples collected during the second campaign due to instrumental limitations:
The coefficient 0.12 is based on the molar ratio of SO to Na?, while the value 0.175 represents the observed slope corresponding to the pre-industrial nss-SO ratio in mineral dust found in snow (Schwikowski et al., 1999, and reference therein). The obtained results showed a 50 % up to 60 % of anthropogenic contribution for the nss-SO input. This finding corroborates previous results from Amore et al. (2022), who noted that anthropogenic sulphate was the most abundant apportioned component at Gruvebadet, accounting for at least 50 % all over the year during the 2010–2019 investigated period. The plausible source of the anthropogenic fraction is the atmospheric transport of secondary aerosols containing SO, and ammonium sulphate. This sulphate can be formed by SOx emitted from coal combustion throughout the winter and biomass burning in the spring (Barbaro et al., 2021 and reference therein). The nss-SO does not correlate significantly with other ionic species (except for Mg), thus suggesting a separate origin (Fig. 5).
To quantify the biogenic nss-SO contribution, the methanesulfonic acid (MSA) loads – the final product of DMS oxidation – were multiplied by 3.0 (Udisti et al., 2016), revealing biogenic SO contributions ranging from 0.15 % (2018–2019, 2020–2021) up to 0.38 % (2019–2020). Furthermore, the ratio was inspected, revealing a mean value of 0.02 ± 0.03 during the first (2018–2019) and the third (2020–2021) sampling campaigns, and a maximum ratio equal to 0.06 ± 0.18 reached during the second campaign (2019–2020), similar to the subarctic western North Pacific ratio found by Jung et al. (2014). However, several factors can influence MSA formation, a univocal marker of biogenic emissions, including higher biological productivity related to higher nutrient input; the concentrations of NO3 radicals as key oxidants for DMS decomposition (higher NO3 gives higher MSA); and lower air temperatures, which tend to yield higher MSA levels (Andreae et al., 1985; Udisti et al., 2020).
For the 2019–2020 campaign, it seems likely that a combination of these three factors, together with the positive expansion of sea ice and the very close drift ice presence in March 2020, as revealed from satellite reconstructions (Fig. S6), contributed to the increased release of MSA in aerosol, and its consistent deposition in surface snow (Fig. 3). Indeed, DMS was likely accumulated under the sea ice cover in the fjord and surrounding areas, and then being released and oxidised in the atmosphere when the ice broke off and melted (April-May). Furthermore, lower temperatures (−17.3 °C in March 2020, compared to −16.1 °C in March 2019, and −9.8 °C in March 2021), positive correlation between MSA and NO (ρload= 0.49, p-value < 0.05), and high-speed short-range transport (wind directions between 0–60° and speeds > 5 m s−1) from the source to the near-coast sink site (GSRS) would have aided elevated concentrations of MSA in atmospheric depositions. However, the dominant south and southwest winds (180–240°) during the major MSA peak in April 2020 (Fig. 3) likely transported marine aerosols and DMS from open ocean regions, further facilitating the increased MSA concentrations observed.
Contrarily, in the 2018–2019 season, sea ice lasted only until April and was restricted to the inner, shallower parts of Kongsfjorden (Assmy et al., 2023). This limited duration may not have provided enough time with adequate sunlight for substantial biological activity to accumulate beneath or within the ice. This occurred despite the dominance in 2019, unlike the following year, of Phaeocystis pouchetii, a phytoplankton species known for its capacity to generate DMS in significant quantities (Assmy et al., 2023).
Finally, the ammonium (NH) load showed positive correlations with several ions (Fig. 5). It was strongly correlated with Na+ (ρload= 0.71, p-value < 0.05), Cl− (ρload= 0.52, p-value < 0.05) and K+ (ρload = 0.72, p-value < 0.05). Positive correlations were also observed with SO (ρload= 0.54, p-value < 0.05), NO (ρload= 0.45, p-value < 0.05), MSA (ρload= 0.37, p-value < 0.05) and Br− (ρload= 0.53, p-value < 0.05). These results suggest a close link with sea-salt ions and biogenic emissions. However, some contribution from biomass burning events and potential influence from anthropogenic activities cannot be excluded.
4.2.3 Bromine enrichment
The bromine enrichment factor (Brenr) is well known to reflect specific processes (i.e., sea ice gas phase Br emission) that affect the Br concentration and load in the snowpack (Spolaor et al., 2014). Therefore, calculating the relative enrichment over the ratio in sea water can offer crucial insights on sea ice variability for the investigated Arctic areas (Barbaro et al., 2021). As reported in previous studies (Maffezzoli et al., 2017; Barbaro et al., 2021), the Br enrichment factor (Brenr) can be calculated as Brenr= Br), where 0.0065 represents the Br seawater mass ratio. Contrarily to what observed in a former study (Barbaro et al., 2021) for the Hornsund area and north-western Spitsbergen, where the Brenr mean values were often < 1, indicating some Br− depletion, in this study we observed Brenr mean values ranging from 1.5 up to 17.7, with the highest value associated to the second sampling campaign conducted in 2019–2020, which showed the most extensive sea ice coverage. These results support the impact of the sea ice expansion and the close drift ice in the Kongsfjorden on the snow chemical composition. Indeed, newly formed sea ice releases gas-phase Br into the polar atmosphere, thus supplying an extra Br− source in addition to sea spray (Spolaor et al., 2016).
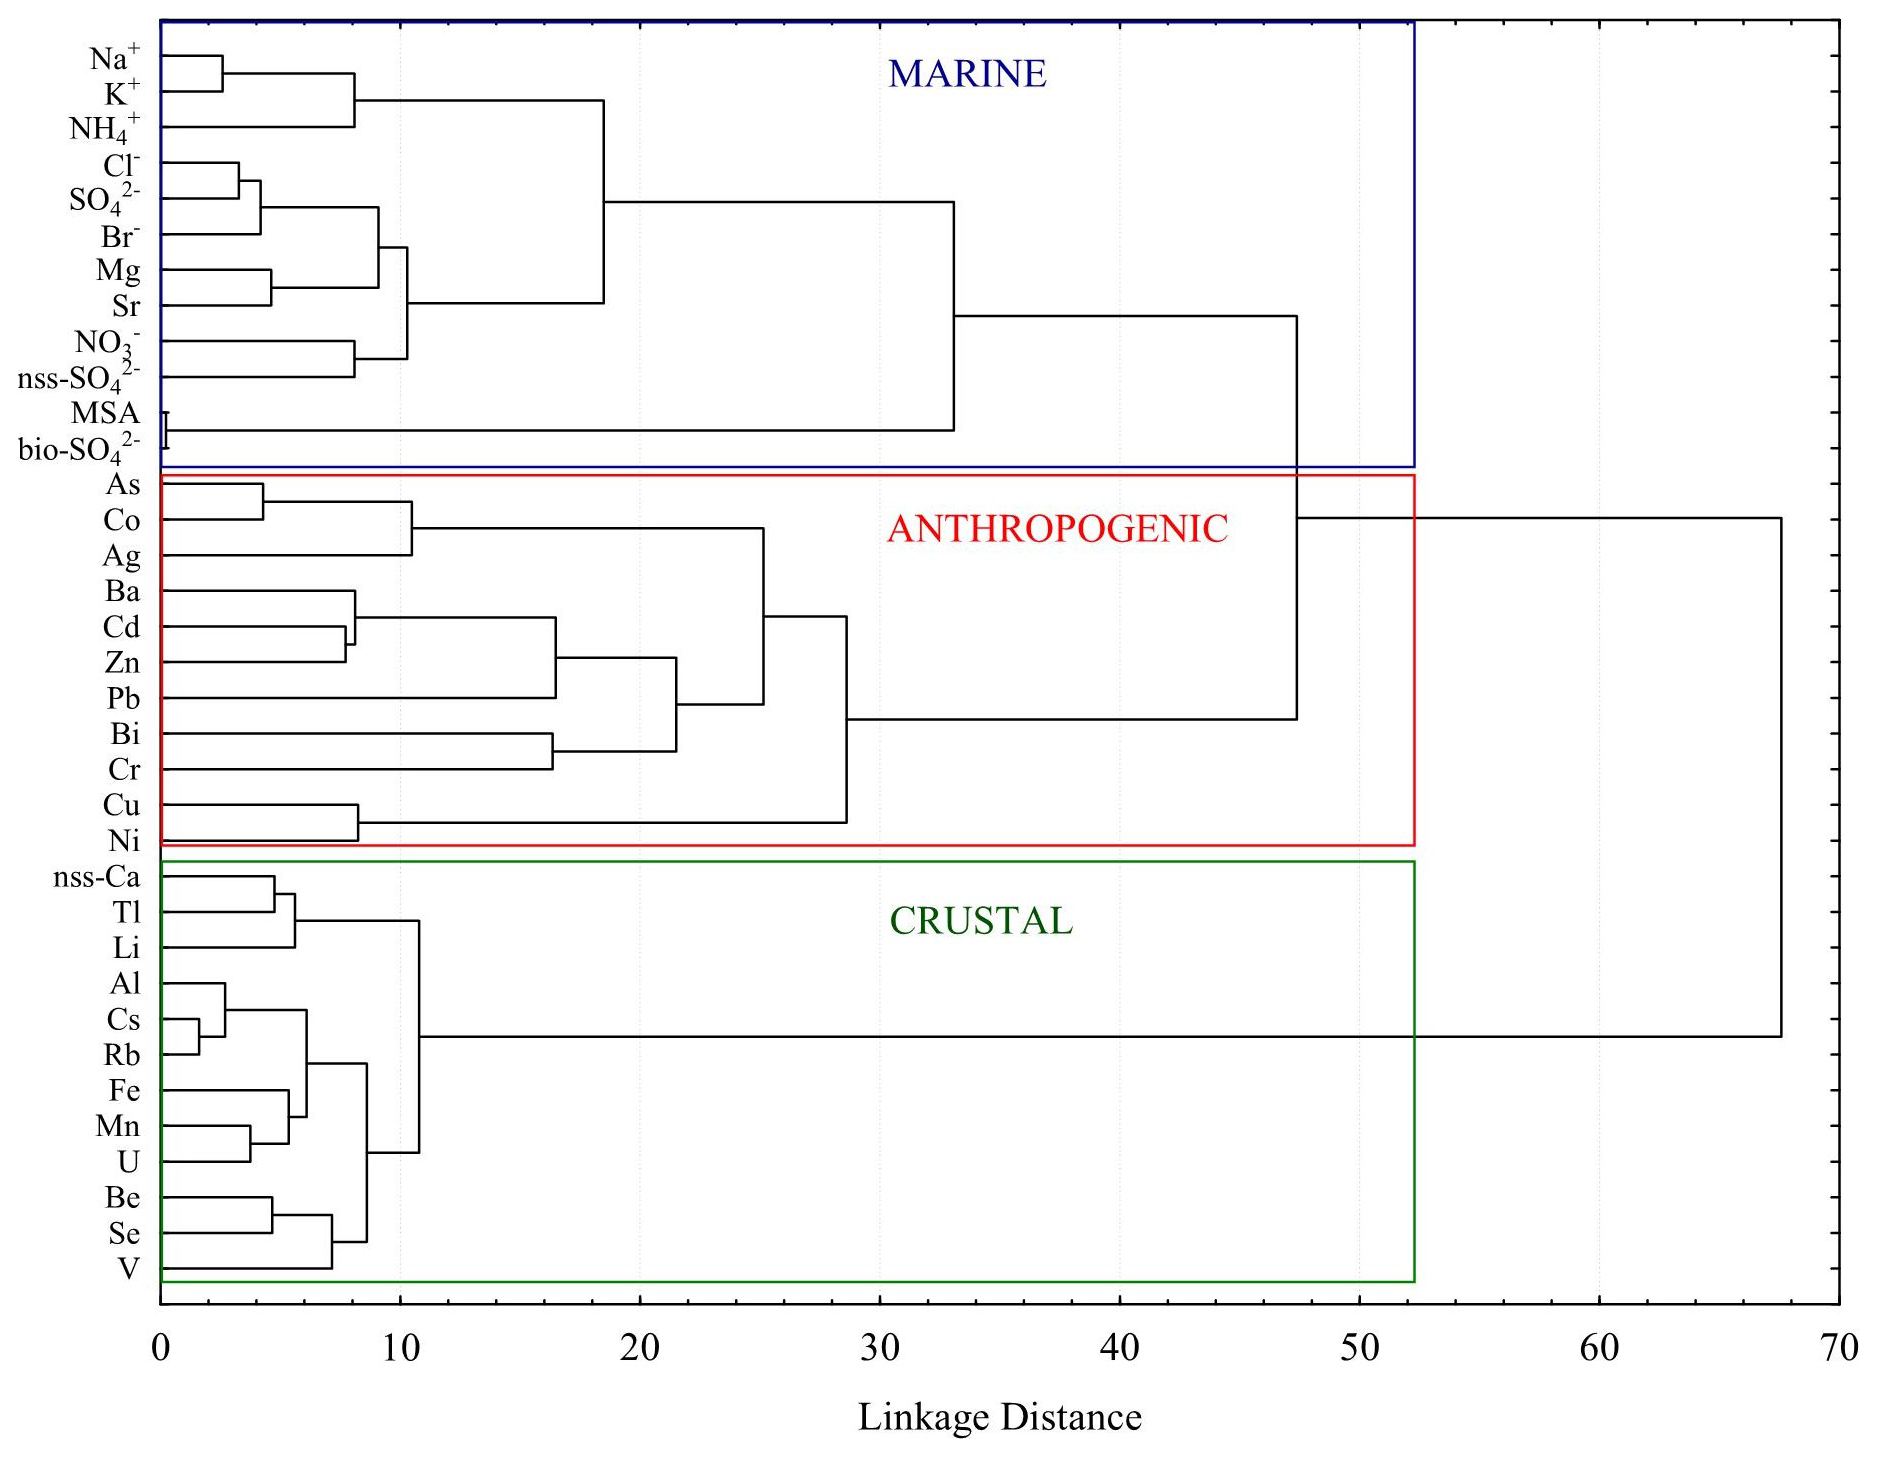
Figure 6Hierarchical cluster analysis applied to further disentangle the particulate trace element non-crustal sources.
4.3 Anthropogenic and natural sources of ions and particulate trace elements
To complement the EFs analysis and further distinguish possible anthropogenic contributions from natural ones (marine and geogenic) for ions and particulate trace elements, a Hierarchical Cluster Analysis (HCA) method was carried out using the whole dataset, which encompasses all three sampling campaigns (2018–2021) to capture the full variability in sulphate sources and atmospheric processes across different seasons and years. Results of clustering (Fig. 6) clearly disentangle marine (Na+, Cl−, K+, NH, SO, NO, Br−, Mg, Sr, bio-SO, MSA), anthropogenic (As, Co, Ag, Ba, Cd, Zn, Pb, Bi, Cr, Cu, Ni), and geogenic (nss-Ca, Tl, Li, Al, Cs, Rb, Fe, Mn, U, Be, Se, V) sources of ionic and elemental species, considering the whole sampling campaign period (2018–2021). Interestingly, nss-SO is brought together with the marine cluster, suggesting that its presence is largely influenced by marine biogenic sources, alongside contributions from secondary sulphate formation in the atmosphere. This indicates that nss-SO, despite having a variety of sources such as human contribution or dust, is closely linked to the marine environment. One important reason for this is the emission of DMS by phytoplankton. Additionally, secondary sulphate formation may have further contributed to the nss-SO. Cobalt was grouped within the anthropogenic cluster in HCA, in contrast with EFs that suggested a crustal origin. This apparent discrepancy may reflect the relatively larger uncertainties typically associated with EF calculations, which can inherit errors from the choice of reference element, assumptions about crustal composition, and variability in background concentrations, compared to the more integrative approach of HCA (e.g., Reimann and de Caritat, 2000). Moreover, the trend for Co closely aligns with anthropogenic ones (e.g., As), while distinct trends are evident for crustal elements. Therefore, while the HCA results offer a reliable perspective on source differentiation and clustering patterns, they are best interpreted as complementary to the EF calculations rather than directly integrated with them. Incorporating EFs directly into the HCA could introduce significant inaccuracies, as EFs rely on reference element ratios that may vary and thus add complexity to the clustering process, potentially skewing the results. Consequently, HCA independently provides robust insights in this context, enhancing our understanding without the additional uncertainties that EF-based clustering might introduce.
In this study, trace elements and major ions were investigated in surface snow samples collected in Ny-Ålesund between October 2018 to June 2021. Seasonal and interannual variations of impurities were observed, with the highest concentrations of marine species recorded in late spring 2020 (e.g., Cl 110 mg m−2, Na 52 mg m−2, SO = 28 mg m−2). These elevated levels coincided with the most extensive sea ice in Kongsfjorden in March 2020 (FI = 113.28 km2, DI = 16.53 km2), driven by negative temperature anomalies in both the atmosphere (−7.47 °C) and ocean (−0.55 °C), and likely related to higher air mass recycle within the Arctic. This provides direct evidence that sea ice extent modulates the storage, release, and transport of marine-derived impurities, influencing snow-atmosphere chemical exchange processes under varying climatic conditions. Higher concentrations in spring 2020 for geogenic (e.g., Fe = 6 mg m−2, Ca = 13 mg m−2) and anthropogenic (e.g., Co = 5 µg m−2, Cr = 25 µg m−2, Ni = 131 µg m−2) species are consistent with the combined influence of higher wind speeds (16.09 m s−1), low temperatures, and generally drier conditions resulting from the exceptional occurrence of a strong and cold stratospheric polar vortex, accompanied by an unprecedently positive phase of the Arctic Oscillation in the troposphere during January–March 2020. While correlations between meteorological variables and concentrations were generally weak, the overall meteorological context suggests that these unusual conditions likely contributed to the observed deposition patterns. This is particularly evident especially in the cold year of 2020, when the production of sea spray related aerosol likely derives by a larger extension of sea ice and stronger local Arctic circulation, as also indicated by elevated Brenr mean values (17.7 compared to the usual < 1; Barbaro et al., 2021). The identification of geogenic, marine, and anthropogenic sources in the snowpack was allowed by a chemometric approach (HCA), which complemented the enrichment factor analysis. This approach mitigates potential biases for EFs results that may come from reference element selection, assumptions about crustal composition, and background variability (Reimann and de Caritat, 2000). In this work, the use of chemometric techniques (HCA) and back-trajectory analysis enabled a clearer attribution of sources and transport pathways, improving interpretation of snow composition in relation to meteorological drivers. Notably, seasonal air mass patterns revealed dominant Arctic-origin air masses in fall and winter and reduced mid-latitude inputs in spring, highlighting shifts in snow-atmosphere interactions under a warming Arctic. These results demonstrate that recent climatic anomalies, including changes in sea ice extent, shifts in Arctic Oscillation phases, and stronger polar vortices, significantly modulate the chemical composition of the snowpack in Svalbard. Our findings underscore the sensitivity of snow-atmosphere exchanges to both local and large-scale climatic processes, providing valuable context for interpreting trends in snow chemistry in a rapidly changing Arctic environment. Limitations such as weak correlations between meteorological variables and concentrations suggest that further multivariate and long-term analyses are needed to quantify these relationships more robustly. Overall, this study emphasizes that snow chemistry can serve as a sensitive indicator of Arctic atmospheric dynamics and climatic variability, advancing our understanding of the links between cryosphere processes, atmospheric circulation, and ionic-elemental deposition.
The data supporting the findings of this study are available within the article and in the Supplement. Other data that support the findings of this study are available at https://doi.org/10.5281/zenodo.17243937 (Spagnesi and Barbaro, 2025).
The supplement related to this article is available online at https://doi.org/10.5194/acp-25-16215-2025-supplement.
AS: Conceptualization, Data curation, Investigation, Writing – original draft, Writing – review and editing. EB: Conceptualization, Field work, Data curation, Formal Analysis, Writing – original draft, Writing – review and editing, Funding acquisition. MF: Formal Analysis, Field work, Data curation, Writing – review and editing. FS: Field work, Formal analysis, Investigation, Writing – review and editing. MV: Writing – review and editing. MV: Field work, Writing – review and editing. MM: Investigation. FB: Investigation, Writing – review and editing. FB: Investigation. Field work. CJMH: Investigation, Data curation, Writing – review and editing. AB: Field work, Data curation, Writing – review and editing. AG: Resources, Supervision, Validation, Writing – review and editing, Funding acquisition. CB: Resources, Supervision, Validation, Writing – review and editing, Funding acquisition. AS: Funding acquisition, Supervision, Validation, Writing – review and editing.
The contact author has declared that none of the authors has any competing interests.
Publisher’s note: Copernicus Publications remains neutral with regard to jurisdictional claims made in the text, published maps, institutional affiliations, or any other geographical representation in this paper. While Copernicus Publications makes every effort to include appropriate place names, the final responsibility lies with the authors. Views expressed in the text are those of the authors and do not necessarily reflect the views of the publisher.
We are grateful to the Arctic Station Dirigibile Italia from the Italian National Research Council – Institute of Polar Science (CNR-ISP) for logistical support. The authors gratefully acknowledge Claudio Artoni, Maria Papale, Ivan Sartorato, Federico Dallo, Alice Callegaro, Marco Casula, Mariasilvia Giamberini, Fabio Giardi, and all the station leaders of “Dirigibile Italia” who participated and offered valuable help and logistic support during the 2018–2021 sampling campaigns. Furthermore, we acknowledge Klara Wolf, Linda Rehder, and Ane Kvernvik for help with CTD sampling. We acknowledge the help of ELGA LabWater in providing the PURELAB Pulse and PURELAB Flex, which produced the ultrapure water used in these experiments.
This project has received funding from the European Union's Horizon 2020 research and innovation programme under grant agreement no. 689443 via ERA_PLANET 55 Strand 4 project iCUPE (Integrative and Comprehensive Understanding on Polar Environments).
This paper was edited by Barbara Ervens and reviewed by four anonymous referees.
Amore, A., Giardi, F., Becagli, S., Caiazzo, L., Mazzola, M., Severi, M., Traversi, R.: Source apportionment of sulphate in the High Arctic by a 10 yr-long record from Gruvebadet Observatory (Ny-Ålesund, Svalbard Islands). Atmos. Environ., 270, 118890, https://doi.org/10.1016/j.atmosenv.2021.118890, 2022.
Andreae, M. O., Ferek, R. J., Bermond, F., Byrd, K. P., Engstrom, R. T., Hardin, S., Houmere, P. D., LeMarrec, F., Raemdonck, H., and Chatfield, R. B.: Dimethyl sulfide in the marine atmosphere, J. Geophys. Res., 90, 12891–12900, https://doi.org/10.1029/JD090iD07p12891, 1985.
Assmy, P., Kvernvik, A. C., Hop, H., Hoppe, C. J. M., Chierici, M., David, D., Duarte, P., Fransson, A., Garcìa, L. M., Patuła, W., Kwaśniewski, S., Maturilli, M., Pavlova, O., Tatarek, A., Wiktor, J. M., Wold, A., Wolf, K. K. E., and Bailey, A.: Seasonal plankton dynamics in Kongsfjorden during two years of contrasting environmental conditions, Prog. Oceanogr., 213, 102996, https://doi.org/10.1016/j.pocean.2023.102996, 2023.
Barbaro, E., Zangrando, R., Vecchiato, M., Piazza, R., Cairns, W. R. L., Capodaglio, G., Barbante, C., and Gambaro, A.: Free amino acids in Antarctic aerosol: potential markers for the evolution and fate of marine aerosol, Atmos. Chem. Phys., 15, 5457–5469, https://doi.org/10.5194/acp-15-5457-2015, 2015.
Barbaro, E., Padoan, S., Kirchgeorg, T., Zangrando, R., Toscano, G., Barbante, C., and Gambaro, A.: Particle size distribution of inorganic and organic ions in coastal and inland Antarctic aerosol, Environ. Sci. Pollut. Res., 24, 2724–2733, https://doi.org/10.1007/s11356-016-8042-x, 2017.
Barbaro, E., Koziol, K., Björkman, M. P., Vega, C. P., Zdanowicz, C., Martma, T., Gallet, J.-C., Kępski, D., Larose, C., Luks, B., Tolle, F., Schuler, T. V., Uszczyk, A., and Spolaor, A.: Measurement report: Spatial variations in ionic chemistry and water-stable isotopes in the snowpack on glaciers across Svalbard during the 2015–2016 snow accumulation season, Atmos. Chem. Phys., 21, 3163–3180, https://doi.org/10.5194/acp-21-3163-2021, 2021.
Bazzano, A., Ardini, F., Becagli, S., Traversi, R., Udisti, R., Cappelletti, D., and Grotti, M.: Source assessment of atmospheric lead measured at Ny-Ålesund, Svalbard, Atmos. Environ., 113, 20–26, https://doi.org/10.1016/j.atmosenv.2015.04.053, 2015.
Bazzano, A., Bertinetti, S., Ardini, F., Cappelletti, D., and Grotti, M.: Potential Source Areas for atmospheric Lead reaching Ny-Ålesund from 2010 to 2018, Atmos., 12, 388, https://doi.org/10.3390/atmos12030388, 2021.
Beaudon, E. and Moore, J.: Frost flower chemical signature in winter snow on Vestfonna ice cap, Nordaustlandet, Svalbard, The Cryosphere, 3, 147–154, https://doi.org/10.5194/tc-3-147-2009, 2009.
Beine, H. J., Dominè, F., Ianniello, A., Nardino, M., Allegrini, I., Teinilä, K., and Hillamo, R.: Fluxes of nitrates between snow surfaces and the atmosphere in the European high Arctic, Atmos. Chem. Phys., 3, 335–346, https://doi.org/10.5194/acp-3-335-2003, 2003.
Bertò, M., Cappelletti, D., Barbaro, E., Varin, C., Gallet, J.-C., Markowicz, K., Rozwadowska, A., Mazzola, M., Crocchianti, S., Poto, L., Laj, P., Barbante, C., and Spolaor, A.: Variability in black carbon mass concentration in surface snow at Svalbard, Atmos. Chem. Phys., 21, 12479–12493, https://doi.org/10.5194/acp-21-12479-2021, 2021.
Björkman, M., Kühnel, R., Partridge, D. G., Roberts, T. J., Aas, W., Mazzola, M., Viola, A., Hodson, A., Ström, J., and Isaksson, E.: Nitrate dry deposition in Svalbard, Tellus B, 65, https://doi.org/10.3402/tellusb.v65i0.19071, 2013.
D'Amico, M., Kallenborn, R., Scoto, F., Gambaro, A., Gallet, J.-C., Spolaor, A., and Vecchiato, M.: Chemicals of Emerging Arctic Concern in north-western Spitsbergen snow: Distribution and sources, Sci. Total Environ., 908, 168401, https://doi.org/10.1016/j.scitotenv.2023.168401, 2024.
Dethloff, K., Maslowski, W., Hendricks, S., Lee, Y. J., Goessling, H. F., Krumpen, T., Haas, C., Handorf, D., Ricker, R., Bessonov, V., Cassano, J. J., Kinney, J. C., Osinski, R., Rex, M., Rinke, A., Sokolova, J., and Sommerfeld, A.: Arctic sea ice anomalies during the MOSAiC winter 2019/20, The Cryosphere, 16, 981–1005, https://doi.org/10.5194/tc-16-981-2022, 2022.
Draxler, R. R.: An overview of the HYSPLIT_4 modelling system for trajectories, dispersion and deposition, Aust. Meteorol. Mag., 47, 295–308, 1998.
Dunn, O. J.: Multiple comparisons among means, J. Am. Stat. Assoc., 56, 293, https://doi.org/10.1080/01621459.1961.10482090, 1961.
Eleftheriadis, K., Vratolis, S., and Nyeki, S.: Aerosol black carbon in the European Arctic: Measurements at Zeppelin station, Ny-Ålesund, Svalbard from 1998–2007, Geophys. Res. Lett., 36, 1–5, https://doi.org/10.1029/2008GL035741, 2009.
Feltracco, M., Barbaro, E., Tedeschi, S., Spolaor, A., Turetta, C., Vecchiato, M., Morabito, E., Zangrando, R., Barbante, C., and Gambaro, A.: Interannual variability of sugars in Arctic aerosol: Biomass burning and biogenic inputs, Sci. Total Environ., 706, 136089, https://doi.org/10.1016/j.scitotenv.2019.136089, 2020.
Feltracco, M., Barbaro, E., Hoppe, C. J. M., Wolf, K. K. E., Spolaor, A., Layton, R., Keuschnig, C., Barbante, C., Gambaro, A., and Larose, C.: Airborne bacteria and particulate chemistry capture Phytoplankton bloom dynamics in an Arctic fjord, Atmos. Environ., 256, 118458, https://doi.org/10.1016/j.atmosenv.2021.118458, 2021.
Gabrieli, J., Cozzi, G., Vallelonga, P., Schwikowski, M., Sigl, M., Eickenberg, J., Wacker, L., Boutron, C., Gäggeler, H., Cescon, P., and Barbante, C.: Contamination of Alpine snow and ice at Colle Gnifetti, Swiss/Italian Alps, from nuclear weapons tests, Atmospheric Environment, 45, 587–593, https://doi.org/10.1016/j.atmosenv.2010.10.039, 2011.
Geng, H., Ryu, J., Jung, H. J., Chung, H., Ahn, K. H. O., and Ro, C. U. N.: Single-particle characterization of summertime arctic aerosols collected at Ny-Ålesund, Svalbard, Environ. Sci. Technol., 44, 2348–2353, https://doi.org/10.1021/es903268j, 2010.
George, B. J., Gains-Germain, L., Broms, K., Black, K., Furman, M., Hays, M. D., Thomas, K. W., and Simmons, J. E.: Censoring trace-level environmental data: statistical analysis considerations to limit bias, Environ. Sci. Technol., 55, 3786–3795, https://doi.org/10.1021/acs.est.0c02256, 2021.
Gerland, S., Pavlova, O., Marnela, M., Divine, D.V., Kohler, J., Renner, A., and Skoglund, A.: Sea ice extent variability in Kongsfjorden, Svalbard during 2003–2021, based on visual observations from the mountain Zeppelinfjellet, Norwegian Polar Institute [data set], https://doi.org/10.21334/npolar.2022.d6d31f5b, 2022.
Gjermundsen, A., Seland Graff, L., Bentsen, M., Anders Breivik, L., Boldingh Debernard, J., Makkonen, R., Olivié, D. J. L., Seland, Ø., Zieger, P., and Schulz, M.: How representative is Svalbard for future Arctic climate evolution? An Earth system modelling perspective (SvalCLIM), SESS Report 2020 – The State of Environmental Science in Svalbard, Zenodo, https://doi.org/10.5281/zenodo.4034104, 2020.
Hansen, B. B., Isaksen, K., Benestad, R. E., Kohler, J., Pedersen, Å., Loe, L. E., Coulson, S. J., Larsen, J. O., and Varpe, Ø.: Warmer and wetter winters: Characteristics and implications of an extreme weather event in the High Arctic, Environ. Res. Lett., 9, https://doi.org/10.1088/1748-9326/9/11/114021, 2014.
Hodgkins, R. and Tranter, M.: Solute in High Arctic glacier snow cover and its impact on runoff chemistry, Ann. Glaciol., 26, 156–160, https://doi.org/10.3189/1998AoG26-1-156-160, 1998.
Jacobi, H.-W., Obleitner, F., Da Costa, S., Ginot, P., Eleftheriadis, K., Aas, W., and Zanatta, M.: Deposition of ionic species and black carbon to the Arctic snowpack: combining snow pit observations with modeling, Atmos. Chem. Phys., 19, 10361–10377, https://doi.org/10.5194/acp-19-10361-2019, 2019.
Jung, J., Furutani, H., Uematsu, M., and Park, J.: Distributions of atmospheric non-sea-salt sulphate and methanesulfonic acid over the Pacific Ocean between 48° N and 55° S during summer, Atmos. Environ., 99, 374–384, https://doi.org/10.1016/j.atmosenv.2014.10.009, 2014.
Koziol, K., Uszczyk, A., Pawlak, F., Frankowski, M., and Polkowska, Ż.: Seasonal and Spatial Differences in Metal and Metalloid Concentrations in the Snow Cover of Hansbreen, Svalbard, Front. Earth Sci., 8, 1–8, https://doi.org/10.3389/feart.2020.538762, 2021.
Lai, A. M., Shafer, M. M., Dibb, J. E., Polashenski, C. M., and Schauer, J. J.: Elements and inorganic ions as source tracers in recent Greenland snow, Atmos. Environ., 164, 205–215, https://doi.org/10.1016/j.atmosenv.2017.05.048, 2017.
Lawrence, Z. D., Perlwitz, J., Butler, A. H., Manney, G. L., Newman, P. A., Lee, S. H., and Nash, E. R.: The Remarkably Strong Arctic Stratospheric Polar Vortex of Winter 2020: Links to Record-Breaking Arctic Oscillation and Ozone Loss, J. Geophys. Res. Atmos., 125, 1–21, https://doi.org/10.1029/2020JD033271, 2020.
Maffezzoli, N., Spolaor, A., Barbante, C., Bertò, M., Frezzotti, M., and Vallelonga, P.: Bromine, iodine and sodium in surface snow along the 2013 Talos Dome–GV7 traverse (northern Victoria Land, East Antarctica), The Cryosphere, 11, 693–705, https://doi.org/10.5194/tc-11-693-2017, 2017.
Millero, F. J., Feistel, R., Wright, D. G., and McDougall, T. J.: The composition of Standard Seawater and the definition of the Reference-Composition Salinity Scale, Deep-Sea Res., 55, 50–72, 2008.
Morales, J. A., Pirela, D., de Nava, M. G., de Borrego, B. S., Velásquez, H., and Durán, J.: Inorganic water soluble ions in atmospheric particles over Maracaibo Lake Basin in the western region of Venezuela, Atmos. Res., 46, https://doi.org/10.1016/S0169-8095(97)00071-9, 1998.
Nawrot, A. P., Migała, K., Luks, B., Pakszys, P., and Głowacki, P.: Chemistry of snow cover and acidic snowfall during a season with a high level of air pollution on the Hans Glacier, Spitsbergen, Polar Sci., 10, 249–261, https://doi.org/10.1016/j.polar.2016.06.003, 2016.
Platt, S. M., Hov, Ø., Berg, T., Breivik, K., Eckhardt, S., Eleftheriadis, K., Evangeliou, N., Fiebig, M., Fisher, R., Hansen, G., Hansson, H.-C., Heintzenberg, J., Hermansen, O., Heslin-Rees, D., Holmén, K., Hudson, S., Kallenborn, R., Krejci, R., Krognes, T., Larssen, S., Lowry, D., Lund Myhre, C., Lunder, C., Nisbet, E., Nizzetto, P. B., Park, K.-T., Pedersen, C. A., Aspmo Pfaffhuber, K., Röckmann, T., Schmidbauer, N., Solberg, S., Stohl, A., Ström, J., Svendby, T., Tunved, P., Tørnkvist, K., van der Veen, C., Vratolis, S., Yoon, Y. J., Yttri, K. E., Zieger, P., Aas, W., and Tørseth, K.: Atmospheric composition in the European Arctic and 30 years of the Zeppelin Observatory, Ny-Ålesund, Atmos. Chem. Phys., 22, 3321–3369, https://doi.org/10.5194/acp-22-3321-2022, 2022.
Pomeroy, J. W.: A process-based model of snow drifting, Ann. Glaciol., 13, 237–240, https://doi.org/10.3189/S0260305500007965, 1989.
Rankin, A. M., Wolff, E. W., and Martin, S.: Frost flowers: Implications for tropospheric chemistry and ice core interpretation, Journal of Geophysical Research: Atmospheres, 107, AAC-4, https://doi.org/10.1029/2002JD002492, 2002.
Rantanen, M., Karpechko, A. Y., Lipponen, A., Nordling, K., Hyvärinen, O., Ruosteenoja, K., Vihma, T., and Laaksonen, A.: The Arctic has warmed nearly four times faster than the globe since 1979, Commun. Earth Environ., 3, 168, https://doi.org/10.1038/s43247-022-00498-3, 2022.
Reimann, C. and De Caritat, P.: Intrinsic flaws of element Enrichment Factors (EFs) in environmental geochemistry, Environ. Sci. Technol., 34, https://doi.org/10.1021/es001339o, 2000.
Rinke, A., Maturilli, M., Graham, R. M., Matthes, H., Handorf, D., Cohen, L., Hudson, S. R., and Moore, J. C.: Extreme cyclone events in the Arctic: Wintertime variability and trends, Environ. Res. Lett., 12, https://doi.org/10.1088/1748-9326/aa7def, 2017.
Roscoe, H. K., Brooks, B., Jackson, A. V., Smith, M. H., Walker, S. J., Obbard, R. W., and Wolff, E. W.: Frost flowers in the laboratory: Growth, characteristics, aerosol, and the underlying sea ice, J. Geophys. Res., 116, D12301, https://doi.org/10.1029/2010JD015144, 2011.
Ruppel, M. M., Khedr, M., Liu, X., Beaudon, E., Szidat, S., Tunved, P., Ström, J., Koponen, H., Sippula, O., Isaksson, E., Gallet, J.-C., Hermanson, M., Manninen, S., and Schnelle-Kreis, J.: Organic compounds, radiocarbon, trace elements and atmospheric transport illuminating sources of elemental carbon in a 300-year Svalbard ice core, J. Geophys. Res.-Atmos., 128, https://doi.org/10.1029/2022JD038378, 2023.
Salzano, R., Cerrato, R., Scoto, F., Spolaor, A., Valentini, E., Salvadore, M., Esposito, G., Sapio, S., Taramelli, A., and Salvatori, R.: Detection of winter heat wave impact on surface runoff in a periglacial environment (Ny-Ålesund, Svalbard), Remote Sens., 15, 4435, https://doi.org/10.3390/rs15184435, 2023.
Schoeberl, M. R. and Newman, P. A.: Middle Atmosphere: Polar Vortex, Encyclopedia of Atmospheric Sciences, 2nd edn., Elsevier, 12–17, https://doi.org/10.1016/B978-0-12-382225-3.00228-0, 2015.
Schwikowski, M., Döscher, A., Gäggeler, H. W., and Schotterer, U.: Anthropogenic versus natural sources of atmospheric sulphate from an Alpine ice core, Tellus B: Chemical and Physical Meteorology, 51, 938–951, https://doi.org/10.3402/tellusb.v51i5.16506, 1999.
Scoto, F., Pappaccogli, G., Mazzola, M., Donateo, A., Salzano, R., Monzali, M., de Blasi, F., Larose, C., Gallet, J.-C., Decesari, S., and Spolaor, A.: Automated observation of physical snowpack properties in Ny-Ålesund, Front. Earth Sci., 11, 1123981, https://doi.org/10.3389/feart.2023.1123981, 2023.
Sherrell, R. M., Boyle, E. A., Harris, N. R., and Falkner, K. K.: Temporal variability of Cd, Pb, and Pb isotope deposition in central Greenland snow, Geochem. Geophys., 1, 1–22, https://doi.org/10.1029/1999GC000007, 2000.
Sobota, I., Weckwerth, P., and Grajewski, T.: Rain-On-Snow (ROS) events and their relations to snowpack and ice layer changes on small glaciers in Svalbard, the high Arctic, J. Hydrol., 590, 125279, https://doi.org/10.1016/j.jhydrol.2020.125279, 2020.
Song, C., Becagli, S., Beddows, D. C. S., Brean, J., Browse, J., Dai, Q., Dall'Osto, M., Ferracci, V., Harrison, R. M., Harris, N., Li, W., Jones, A. E., Kirchg?ßner, A., Kramawijaya, A. G., Kurganskiy, A., Lupi, A., Mazzola, M., Severi, M., Traversi, R., and Shi, Z.: Understanding sources and drivers of size-resolved aerosol in the High Arctic islands of Svalbard using a receptor model coupled with machine learning, Environ. Sci. Technol., 56, 11189–11198, https://doi.org/10.1021/acs.est.1c07796, 2022.
Song, J., Zhao, Y., Zhang, Y., Fu, P., Zheng, L., Yuan, Q., Wang, S., Huang, X., Xu, W., Cao, Z., Gromov, S., and Lai, S.: Investigation of biomass burning on atmospheric aerosols over the western South China Sea: Insights from ions, carbonaceous fractions and stable carbon isotope ratios, Environ. Pollut., 242, 1800–1809, https://doi.org/10.1016/j.envpol.2018.07.088, 2018.
Spagnesi, A. and Barbaro, E.: Database manuscript “Seasonal and interannual variability on the chemical composition of the Svalbard surface snowpack”, Zenodo [data set], https://doi.org/10.5281/zenodo.17243937, 2025.
Spolaor, A., Vallelonga, P., Gabrieli, J., Martma, T., Björkman, M. P., Isaksson, E., Cozzi, G., Turetta, C., Kjær, H. A., Curran, M. A. J., Moy, A. D., Schönhardt, A., Blechschmidt, A.-M., Burrows, J. P., Plane, J. M. C., and Barbante, C.: Seasonality of halogen deposition in polar snow and ice, Atmos. Chem. Phys., 14, 9613–9622, https://doi.org/10.5194/acp-14-9613-2014, 2014.
Spolaor, A., Opel, T., McConnell, J. R., Maselli, O. J., Spreen, G., Varin, C., Kirchgeorg, T., Fritzsche, D., Saiz-Lopez, A., and Vallelonga, P.: Halogen-based reconstruction of Russian Arctic sea ice area from the Akademii Nauk ice core (Severnaya Zemlya), The Cryosphere, 10, 245–256, https://doi.org/10.5194/tc-10-245-2016, 2016.
Spolaor, A., Angot, H., Roman, M., Dommergue, A., Scarchilli, C., Vardè, M., Del Guasta, M., Pedeli, X., Varin, C., Sprovieri, F., Magand, O., Legrand, M., Barbante, C., and Cairns, W. R. L: Feedback mechanisms between snow and atmospheric mercury: Results and observations from field campaigns on the Antarctic plateau, Chemosphere, 197, 306–317, https://doi.org/10.1016/j.chemosphere.2017.12.180, 2018.
Spolaor, A., Barbaro, E., Cappelletti, D., Turetta, C., Mazzola, M., Giardi, F., Björkman, M. P., Lucchetta, F., Dallo, F., Pfaffhuber, K. A., Angot, H., Dommergue, A., Maturilli, M., Saiz-Lopez, A., Barbante, C., and Cairns, W. R. L.: Diurnal cycle of iodine, bromine, and mercury concentrations in Svalbard surface snow, Atmos. Chem. Phys., 19, 13325–13339, https://doi.org/10.5194/acp-19-13325-2019, 2019.
Spolaor, A., Moroni, B., Luks, B., Nawrot, A., Roman, M., Larose, C., Stachnik, Ł., Bruschi, F., Kozioł, K., Pawlak, F., Turetta, C., Barbaro, E., Gallet, J.-C., and Cappelletti, D.: Investigation on the Sources and Impact of Trace Elements in the Annual Snowpack and the Firn in the Hansbreen (Southwest Spitsbergen), Front. Earth Sci., 8, 1–10, https://doi.org/10.3389/feart.2020.536036, 2021a.
Spolaor, A., Varin, C., Pedeli, X., Christille, J. M., Kirchgeorg, T., Giardi, F., Cappelletti, D., Turetta, C., Cairns, W. R. L., Gambaro, A., Bernagozzi, A., Gallet, J. C., Björkman, M. P., and Barbaro, E.: Source, timing and dynamics of ionic species mobility in the Svalbard annual snowpack, Sci. Total Environ., 751, 141640, https://doi.org/10.1016/j.scitotenv.2020.141640, 2021b.
Stein, A. F., Draxler, R. R., Rolph, G. D., Stunder, B. J. B., Cohen, M. D., and Ngan, F.: Noaa's hysplit atmospheric transport and dispersion modeling system, B. Am. Meteorol. Soc., 96, 2059–2077, https://doi.org/10.1175/BAMS-D-14-00110.1, 2015.
Stohl, A., Berg, T., Burkhart, J. F., Fjǽraa, A. M., Forster, C., Herber, A., Hov, Ø., Lunder, C., McMillan, W. W., Oltmans, S., Shiobara, M., Simpson, D., Solberg, S., Stebel, K., Ström, J., Tørseth, K., Treffeisen, R., Virkkunen, K., and Yttri, K. E.: Arctic smoke – record high air pollution levels in the European Arctic due to agricultural fires in Eastern Europe in spring 2006, Atmos. Chem. Phys., 7, 511–534, https://doi.org/10.5194/acp-7-511-2007, 2007.
Taylor, S. R. and McLennan, S. M.: The geochemical evolution of continental crust, Rev. Geophys. 33, 241–265, https://doi.org/10.1029/95RG00262, 1995.
Turetta, C., Feltracco, M., Barbaro, E., Spolaor, A., Barbante, C., and Gambaro, A.: A year-round measurement of water-soluble trace and rare earth elements in arctic aerosol: Possible inorganic tracers of specific events, Atmosphere, 12, https://doi.org/10.3390/atmos12060694, 2021.
Udisti, R., Bazzano, A., Becagli, S., Bolzacchini, E., Caiazzo, L., Cappelletti, D., Ferrero, L., Frosini, D., Giardi, F., Grotti, M., Lupi, A., Malandrino, M., Mazzola, M., Moroni, B., Severi, M., Traversi, R., Viola, A., and Vitale, V.: Sulphate source apportionment in the Ny-Ålesund (Svalbard Islands) Arctic aerosol, Rend. Fis. Acc. Lincei, 27, S85–S94, https://doi.org/10.1007/s12210-016-0517-7, 2016.
Udisti, R., Traversi, R., Becagli, S., Tomasi, C., Mazzola, M., Lupi, A., and Quinn, P. K.: Arctic Aerosols, in: Physics and Chemistry of the Arctic Atmosphere, Springer Polar Sciences, edited by: Kokhanovsky, A. and Tomasi, C., 209–329, https://doi.org/10.1007/978-3-030-33566-3_4, 2020.
Van Hecke, T.: Power study of anova versus Kruskal-Wallis test, J. Stat. Manag. Syst., 15, 2–3, https://doi.org/10.1080/09720510.2012.10701623, 2013.
Vecchiato, M., Barbaro, E., Spolaor, A., Burgay, F., Barbante, C., Piazza, R., and Gambaro, A.: Fragrances and PAHs in snow and seawater of Ny-Ålesund (Svalbard): Loca and long-range contamination, Environ. Pollut., 242, 1740–1747, https://doi.org/10.1016/j.envpol.2018.07.095, 2018.
Vecchiato, M., Barbante, C., Barbaro, E., Burgay, F., Cairns, W. R. L., Callegaro, A., Cappelletti, D., Dallo, F., D'Amico, M., Feltracco, M., Gallet J.-C., Gambaro, A., Larose, C., Maffezzoli, N., Mazzola, M., Sartorato, I., Scoto, F., Turetta, C., Vardè, M., Xie, Z., and Spolaor, A.: The seasonal change of PAHs in Svalbard surface snow, Environ. Pollut., 340, 122864, https://doi.org/10.1016/j.envpol.2023.122864, 2024.
Vega, C. P., Björkman, M. P., Pohjola, V. A., Isaksson, E., Pettersson, R., Martma, T., Marca, A., Kaiser, J., Vega, C. P., Björkman, M. P., Pohjola, V. A., Isaksson, E., Pettersson, R., Martma, T., Marca, A., Kaiser, J., Pohjola, V. A., Isaksson, E., Pettersson, R., Vega, C. P., and Bjo, M. P.: Nitrate stable isotopes and major ions in snow and ice samples from four Svalbard sites Nitrate stable isotopes and major ions in snow and ice samples from four Svalbard sites, Polar Res., 2015, 23246, https://doi.org/10.3402/polar.v34.23246, 2015.
Wagenbach, D., Preunkert, S., Schäfer, J., Jung, W., and Tomadin, L.: Northward transport of Saharan dust recorded in a deep alpine ice core, in: The impact of desert dust across the mediterranean, Springer, the Netherlands, edited by: Guerzoni, S. and Chester, R., 291–300, ISBN: 0-7923-4294-1, 1996.
Wedepohl, K. H.: The composition of the chemical crust. Geoch. Cosm. Act., 59, 1217–1232, https://doi.org/10.1016/0016-7037(95)00038-2, 1995.
Yttri, K. E., Lund Myhre, C., Eckhardt, S., Fiebig, M., Dye, C., Hirdman, D., Ström, J., Klimont, Z., and Stohl, A.: Quantifying black carbon from biomass burning by means of levoglucosan – a one-year time series at the Arctic observatory Zeppelin, Atmos. Chem. Phys., 14, 6427–6442, https://doi.org/10.5194/acp-14-6427-2014, 2014.
Zhan, J., Gao, Y., Li, W., Chen, L., Lin, H., and Lin, Q.: Effects of ship emissions on summertime aerosols at Ny-Alesund in the Arctic, Atmos. Pollut. Res., 5, 500–510, https://doi.org/10.5094/APR.2014.059, 2014.
Zhuang, H., Chan, C. K., Fang, M., and Wexler, A. S.: Size distributions of particulate sulphate, nitrate, and ammonium at a coastal site in Hong Kong, Atmos. Environ., 33, 843–853, 1999.