the Creative Commons Attribution 4.0 License.
the Creative Commons Attribution 4.0 License.
 | 04 Feb 2025
Distinct effects of fine and coarse aerosols on microphysical processes of shallow-precipitation systems in summer over southern China
Fengjiao Chen
Yuanjian Yang
Lu Yu
Yang Li
Weiguang Liu
Yan Liu
Simone Lolli
Densely populated southern China, adjacent to the South China Sea, which is associated with shallow precipitation during summer, is an open-air natural laboratory for studying the impact of aerosol particles on shallow-precipitation events. Using 8 years of data from Dual-frequency Precipitation Radar measurements, aerosol reanalysis, and atmospheric reanalysis, this study investigates the potential influence of coarse and fine aerosol particles on the structure of the precipitation and the microphysical processes of shallow precipitation in southern China. Statistical results indicate that during coarse-aerosol-polluted conditions, shallow-precipitation clouds have a lower mean height of the storm top (STH; ∼3.2 km) but a higher mean near-surface rain rate (RR; ∼1.78 mm h−1) and are characterized by high concentrations of large raindrops, driven mainly by significant collision–coalescence processes (accounting for 74.1 %). In contrast, during fine-aerosol-polluted conditions, shallow-precipitation clouds develop a deeper median STH of ∼3.7 km with lower surface RR characterized by a low concentration of small raindrops, resulting from increased breakup processes (33.1 %) and reduced collision–coalescence processes (69.6 %). The coarse (fine) aerosol particles act as promoters (inhibitors) of radar reflectivity in the profile of shallow precipitation, regardless of dynamic and humid conditions. The effect of coarse aerosol particles in promoting precipitation and the inhibiting effect of fine aerosol particles are the most significant under low-humidity conditions, mainly attributed to significantly enhanced collision–coalescence processes, exceeding 22.2 %. Furthermore, the increase in RR above 3 km in coarse-aerosol-polluted environments is mainly driven by the high concentration of hydrometeors in low-instability conditions, whereas it is driven by large hydrometeors in high-instability environments.
- Article
(5220 KB) - Full-text XML
- BibTeX
- EndNote


Shallow precipitation, generally identified by storm height, dominates in marine regions such as the ocean and coastal continent, potentially accounting for 20 % of rainfall over tropical oceans and 7.5 % over tropical land (Liu and Zipser, 2009; Chen et al., 2016; Short and Nakamura, 2000). This underscores its crucial significance in the regulation of the global water cycle. However, shallow precipitation is a complex phenomenon influenced by various factors such as water vapor, thermodynamic environment, and aerosol particles (Lang et al., 2021; Chen et al., 2024; Smalley and Rapp, 2020). Aerosol particles, as one of these factors, have sparked significant debate due to the intricate nature of aerosol–radiation and aerosol–cloud interactions among various species, resulting in unanswered questions about whether aerosol particles will increase or decrease shallow precipitation (Koren et al., 2014; Fan et al., 2020; Christensen and Stephens, 2012; Mi et al., 2024).
The impact of aerosol particles on precipitation has been widely investigated in many previous studies (Sun and Zhao, 2021; Miltenberger et al., 2018; Liu et al., 2022; Fan et al., 2018; Zheng et al., 2020). Regional differences show that aerosol particles can delay the start time of precipitation by 2 h in the Pearl River Delta but advance by 3 h in the North China Plain (Sun and Zhao, 2021). Furthermore, precipitation is suppressed for stratocumulus and small cumulus clouds in highly polluted environments but enhanced for heavy precipitation events and deep convective clouds (Yuan et al., 2011; Rosenfeld et al., 2008; Xiao et al., 2022; Miltenberger et al., 2018). However, convective rainfall invigoration depends on aerosol concentrations, which turns into suppression at the turning zone of aerosol optical depth of 0.25–0.30 (Guo et al., 2019), potentially linked to a change from aerosol microphysical effects to aerosol radiative effects (Jiang et al., 2016). Liu et al. (2022) examined various aerosol types and discovered that marine warm clouds experienced a 4-fold increase in rainfall flux in the presence of high levels of coarse spray aerosol particles, while there was a reduction by 75 % in conditions with high concentrations of fine aerosol particles. Additionally, these contrast effects are independent of meteorological conditions. Another study suggests that the improvement of rainfall in orographic regions with high mineral dust concentrations is more significant in humid environments (Zhang et al., 2020b). Overall, the effects of aerosol particles on precipitation depend on numerous elements such as weather conditions, types of aerosol particles, their concentration, and types of clouds, among others, and thus need to be carefully analyzed.
Most of these studies on the interactions between aerosol particles and precipitation have focused on the intensity, frequency of precipitation, and start and peak times of precipitation, but few studies have reported on how aerosol particles impact rainfall through modulating microphysical structures and processes of precipitation. Using three-dimensional observations of precipitation and microphysics from the Dual-frequency Precipitation Radar (DPR) on board the Global Precipitation Measurement (GPM) mission, recent studies have revealed that aerosol particles mainly reduce mean droplet concentration and increase the effective radius of precipitation in most regions of eastern China (Sun et al., 2022), except northeastern China. Xiao et al. (2022) found that the aerosol invigoration effect on convective rainfall is characterized by higher droplet concentration with smaller size under polluted conditions in northeastern China. However, the impact of different aerosol species on precipitation microphysical structures and microphysical processes (i.e., coalescence efficiency of rain droplets) has been scarcely examined but is essential for understanding the full picture of the connections between aerosol particles, precipitation microphysics, and precipitation.
Southern China (18–29° N and 110–123° E) is a region where shallow precipitation occurs frequently (occurrence frequency of up to 20 %) and different types of aerosol particles prevail during summer (Yang et al., 2021), making it an ideal region for the study of the aerosol effect on shallow precipitation. Using the combined dataset of GPM DPR and MERRA-2 (Modern-Era Retrospective analysis for Research and Applications, Version 2), this study aims to answer the following questions. (1) Do coarse and fine aerosol particles enhance or diminish the surface precipitation associated with shallow precipitation? (2) In what manner do aerosol particles influence the microphysical structures or processes of precipitation (such as breakup and collision–coalescence)? (3) To what extent are the relationships between aerosol particles and rainfall, microphysical structures, and processes sensitive to the dynamic and vapor components? The data and methods are introduced in Sect. 2. Section 3 discusses the impacts of fine and coarse aerosol particles on the microphysical properties and processes for shallow precipitation. A summary and conclusions are presented in Sect. 4.
2.1 Data
In this study, four different datasets are used to illustrate the potential impact of aerosol particles on microphysical precipitation structures and shallow-precipitation processes over southern China during the summers between 2014 and 2021.
In the present study, the hourly MERRA-2 aerosol dataset (MERRA2_400.tavg1_2d_aer_Nx) at 0.5×0.625 spatial resolution is used, which has been widely utilized with the advantage of high temporal and spatial resolution. MERRA-2 is produced using the Goddard Earth Observing System, Version 5 (GEOS-5), atmospheric model and the Gridpoint Statistical Interpolation (GSI) assimilation system (Molod et al., 2015). GEOS-5 integrates a radiatively coupled version of the Goddard Chemical Aerosol Radiation and Transport (GOCART) model to simulate aerosol components (Chin et al., 2002). In the estimation of aerosol properties, MERRA-2 assimilates aerosol data from ground-based observations from the AErosol RObotic NETwork (AERONET) and spaceborne aerosol products from the Advanced Very High Resolution Radiometer (AVHRR) and Multi-angle Imaging SpectroRadiometer (MISR) (Randles et al., 2017; Buchard et al., 2017). Previous studies have shown relatively good consistency of aerosol optical depth (AOD) from MERRA-2 and ground-based observations, i.e., AERONET and the Sun-sky radiometer Observation NETwork (SONET) (Ou et al., 2022; Buchard et al., 2015; Sun et al., 2019b). The correlation coefficient between MERRA-2 AOD and AERONET could reach 0.92 in summer in China (Sun et al., 2019b). However, there is a slight underestimation of MERRA-2 AOD when compared to in situ observations. Ou et al. (2022) revealed that the MERRA-2 AOD is underestimated by approximately 0.1 compared to a SONET station over southern China. This is mainly because MERRA-2 lacks nitrate aerosol particles, leading to underestimations in the estimation of total AOD and fine aerosol particles (Sun et al., 2019a; Ou et al., 2022). The fine- and coarse-aerosol-polluted environments are defined by not only the AOD thresholds but also the AOD fractions to the total AOD, which may reduce uncertainties caused by underestimating AOD to some extent.
Aerosol species, including black carbon, organic carbon, sulfate, sea salt, and dust, are assumed to be external mixtures that do not interact with each other. In the present study, we consider the aerosol optical thickness and the extinction at 550 nm for five species, i.e., black carbon, organic carbon, sulfate, sea salt, and dust, as well as the Ångström exponent (α) between 470 and 870 nm. α is a significant parameter in aerosol science which elucidates the AOD dependency on wavelength. A higher α is related to a higher concentration of fine particles, whereas a lower α suggests a higher concentration of coarse particles (Lolli et al., 2023).
The GPM DPR consists of two precipitation radars operating in the Ka and Ku bands, providing a unique opportunity to obtain information on three-dimensional precipitation and particle drop size distributions (DSDs) at the same time. In the present study, the official DPR (version 7) dataset covering the summers (June to August) of 2014 and 2021 is also used, which provides information on the observation time, the near-surface rain rate (RR), the liquid water path (LWP), the three-dimensional profiles of attenuation-corrected reflectivity (Ze), rainfall, the mass-weighted mean diameter (Dm; in mm), and the generalized intercept (Nw; i.e., number concentration of droplets in ) of the normalized gamma distributions with a vertical resolution of 125 m in each scanning pixel (Iguchi et al., 2017). The reliability of DSDs and precipitation has been validated by many previous studies (Huang et al., 2021; Radhakrishna et al., 2016). Due to the high spatial resolution (125 m in vertical and 4.5 km in horizontal resolution), the official 2ADPR (version 7) dataset has been widely used in the field of climatology (Chen et al., 2024, 2020; Zhang et al., 2020a). Shallow-precipitation clouds are defined by their near-surface RR exceeding 0.1 mm h−1 and storm top height (STH) below 5 km in altitude. The STH is defined as the maximum height where the Ze exceeds 20 dBZ (Liu and Zipser, 2013).
In this study, convective available potential energy (CAPE) and relative humidity (RH) at 850 hPa from the fifth-generation global reanalysis of the European Centre for Medium-Range Weather Forecasts (ERA5) covering the period from 2014 to 2021 are also used to investigate the meteorological dependence on the relationship between aerosol particles and precipitation. Additionally, the global 1 km grid quality-controlled global digital elevation model (DEM) (https://www.ngdc.noaa.gov/mgg/topo/gltiles.html, last access: 28 January 2025) is also used to exclude the influence of topography in the present study.
2.2 Methods
Due to the different spatial and temporal resolutions of DPR, MERRA-2, and ERA5, prior to examining the potential influence of various aerosol types on shallow precipitation, it is necessary to harmonize these three datasets. Since the DPR detects the rainy pixels at approximately 4.5 km spatial resolution, both MERRA-2 at 0.5°×0.625° resolution and ERA5 at 0.25° resolution are first linearly interpolated to 0.05° resolution. To accurately depict the aerosol conditions preceding shallow precipitation, observations of AOD from MERRA-2, corresponding closely to the timing of DPR observations and with a spatial resolution of 0.05°, are utilized. Concurrently, atmospheric data derived from ERA5 at 0.05° resolution, which is at the closest proximity to the center and observation time of the DPR pixel, are also used. The aerosol fine-mode AOD is defined as the total AOD sum of partial AOD of black carbon, organic carbon, and sulfate, while the AOD of coarse aerosol particles is the total value of the sum of AOD values of sea salt and dust particles (Gelaro et al., 2017). Additionally, to eliminate the potential impact of topography on precipitation and aerosol analysis, the study includes only shallow-precipitation pixels that occur over regions with a topographic elevation of less than 100 m.
Figure 1a illustrates the probability density of the joint distribution of AOD and α prior to the occurrence of shallow-precipitation events. Shallow precipitation is most probable when the AOD is approximately 0.4 and α is approximately 1.4, which suggests a predominance of the fine aerosol mode. This can be primarily attributed to the increased presence of fine aerosol particles in southern China during the summer season, as represented in Fig. 1b, where the probability density distributions (PDFs) of AOD for fine aerosol particles and total aerosol particles reveal comparable values. Nonetheless, shallow precipitation is also evident in settings characterized by coarse aerosol particles, exhibiting a significant frequency when α is less than 1 and AOD is less than 0.3, as shown in Fig. 1a.
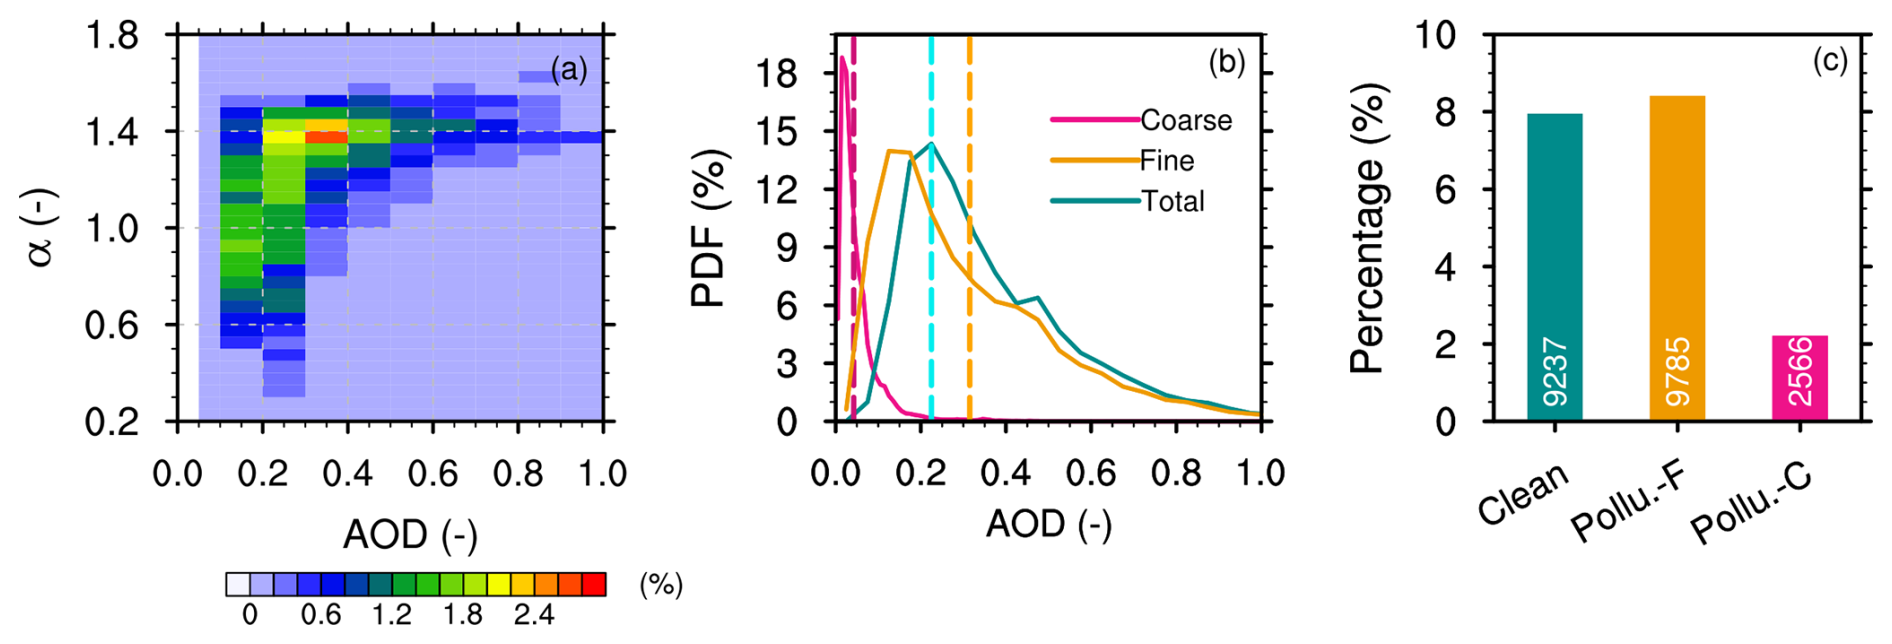
Figure 1The observed frequency of AOD and α prior to the occurrence of shallow precipitation is illustrated in (a). The probability distribution functions of AOD for fine, coarse, and total aerosol particles before shallow-precipitation events depicted in (b). The proportion of shallow-precipitation samples relative to total precipitation samples, categorized by different aerosol particle conditions, is shown in (c), as recorded by DPR in southern China during the summers from 2014 to 2021. The vertical pink line (orange) in (b) represents the upper 60 % threshold for fine (coarse) aerosol particles. The vertical cyan line in (b) denotes the lower 30 % threshold for the total AOD. The shallow-precipitation samples are represented by white text in (c).
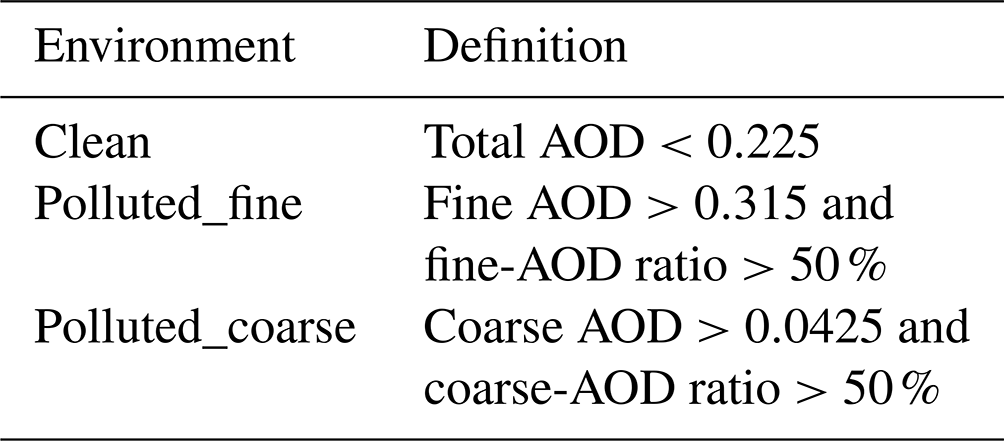
There are three types of aerosol conditions discussed in the present study: clean environment, fine-aerosol-polluted environment, and coarse-aerosol-polluted environment. To classify clean and aerosol-polluted conditions over southern China, PDFs of AOD for fine, coarse, and total aerosol particles are calculated before shallow precipitation, as shown in Fig. 1b. It can be observed that the coarse-mode AOD is relatively small, primarily distributed between 0 and 0.2, while fine-mode AOD and total AOD are almost equal, mainly concentrated between 0 and 1.0. Specifically, the peak frequency occurs at an AOD of approximately 0.1 for coarse aerosol particles, 0.15 for fine aerosol particles, and 0.2 for total aerosol particles. We define a clean environment as one in which the AOD of the total aerosol particles falls below the 30th percentile in all the data sampled, specifically the AOD of the total aerosol particles of <0.225 (see Table 1 for reference). A fine-aerosol-polluted (or coarse-aerosol-polluted) environment must not only exceed 60 % quantiles across all sampled data but also have the AOD of fine (or coarse) particles exceeding 50 % of the AOD for total aerosol particles. This approach ensures that in fine-aerosol-polluted (or coarse-aerosol-polluted) environments, fine (or coarse) particles are the primary influencing factor. Based on these standards, a coarse-aerosol-polluted environment is classified as having a coarse AOD of >0.0425, as well as a proportion of coarse AOD to total aerosol particles exceeding 50 %. Similarly, a fine-aerosol-polluted environment is defined by a fine AOD of >0.315, with the proportion of fine AOD to total aerosol particles exceeding 50 % (see Table 1 for reference). A sensitivity test was conducted with different thresholds to ensure the robustness of the present study. The results indicate that varying the thresholds does not significantly affect the conclusions of the work. During the study period, there are 9237, 9785, and 2566 shallow-precipitation samples under clean, fine-aerosol-polluted, and coarse-aerosol-polluted conditions, respectively (Fig. 1c). The mean AODs of five aerosol species under various environmental conditions are calculated to understand the contributions of different aerosol types (not shown). In southern China, the primary contributors to aerosol species are sulfate aerosol particles, sulfate aerosol particles, and sea salt aerosol particles in clean, fine-aerosol-polluted, and coarse-aerosol-polluted environments, respectively. The shallow precipitation accounts for a higher proportion with respect to the total precipitation samples, reaching ∼8 % in clean and fine-aerosol-polluted conditions (Fig. 1c). However, under coarse-aerosol-polluted conditions, the proportion of shallow-precipitation samples is much lower, at around ∼2 %. Due to the lower AOD of the coarse aerosol mode, occurrences where the AOD of coarse aerosol particles account for more than 50 % of the total AOD are less frequent, which explains the lower shallow-precipitation samples in coarse-aerosol-polluted conditions. However, the approximately 2500 samples ensure the reliability of our research results to some extent.
Table 1Definitions of polluted and clean conditions of coarse and fine aerosol modes in southern China during the summers from 2014 to 2021.
3.1 Influence of aerosol particles on rainfall and microphysical characteristics
Figure 2 exhibits boxplots illustrating the near-surface RR, Nw, Dm, and Ze at an altitude of 2.5 km, alongside LWP and STH, for shallow precipitation under varying aerosol conditions in southern China. Compared to the clean environment, RR decreases slightly during fine-aerosol-polluted conditions, with a median value of only 0.7 mm h−1, while in the presence of coarse-aerosol-polluted environment, the median value of RR increases, reaching 1.0 mm h−1. This is consistent with a higher median Ze at 2.5 km altitude (25 dBZ) under coarse-aerosol-polluted conditions and a lower one (22 dBZ) under fine-aerosol-polluted conditions, suggesting the inhibition effect of fine particles and the invigoration effect of coarse particles on the near-surface RR for shallow precipitation. Nevertheless, the presence of coarse-aerosol-polluted conditions appears to inhibit the vertical development of shallow-precipitation clouds (Fig. 2f), with a median STH (∼3.2 km) significantly lower than that (∼3.7 km) for fine-aerosol-polluted environments. Examining the situation from a microphysical standpoint, it is observed that in comparison to a clean environment, there is a reduction in the median values of LWP at approximately 170 g m−2, Nw at 34, and Dm at 1.05 mm at an altitude of 2.5 km in fine-mode aerosol environments. On the contrary, under coarse-aerosol-polluted conditions, the median values of LWP, Nw, and Dm at 2.5 km altitude increase, reaching 210 g m−2, 35, and 1.15 mm, respectively. This indicates that the enhancement of the near-surface RR under coarse-aerosol-polluted conditions is contributed by higher concentrations of large rain droplets, while the weakening under fine-aerosol-polluted conditions is influenced by lower concentrations of small rain droplets. In southern China, sea salt aerosol particles are the primary components of coarse particles, and a recent study by Liu et al. (2022) has shown that sea salt aerosol particles are more likely to form large cloud droplets through hygroscopic growth, facilitating the formation of raindrops through condensation within shallow-precipitation clouds. On the contrary, fine aerosol particles tend to reduce the effective radius of cloud droplets, with small cloud droplets being prone to evaporation and subsequent loss of cloud water. Our results fill the gap between cloud microphysics, precipitation microphysics, and rainfall.
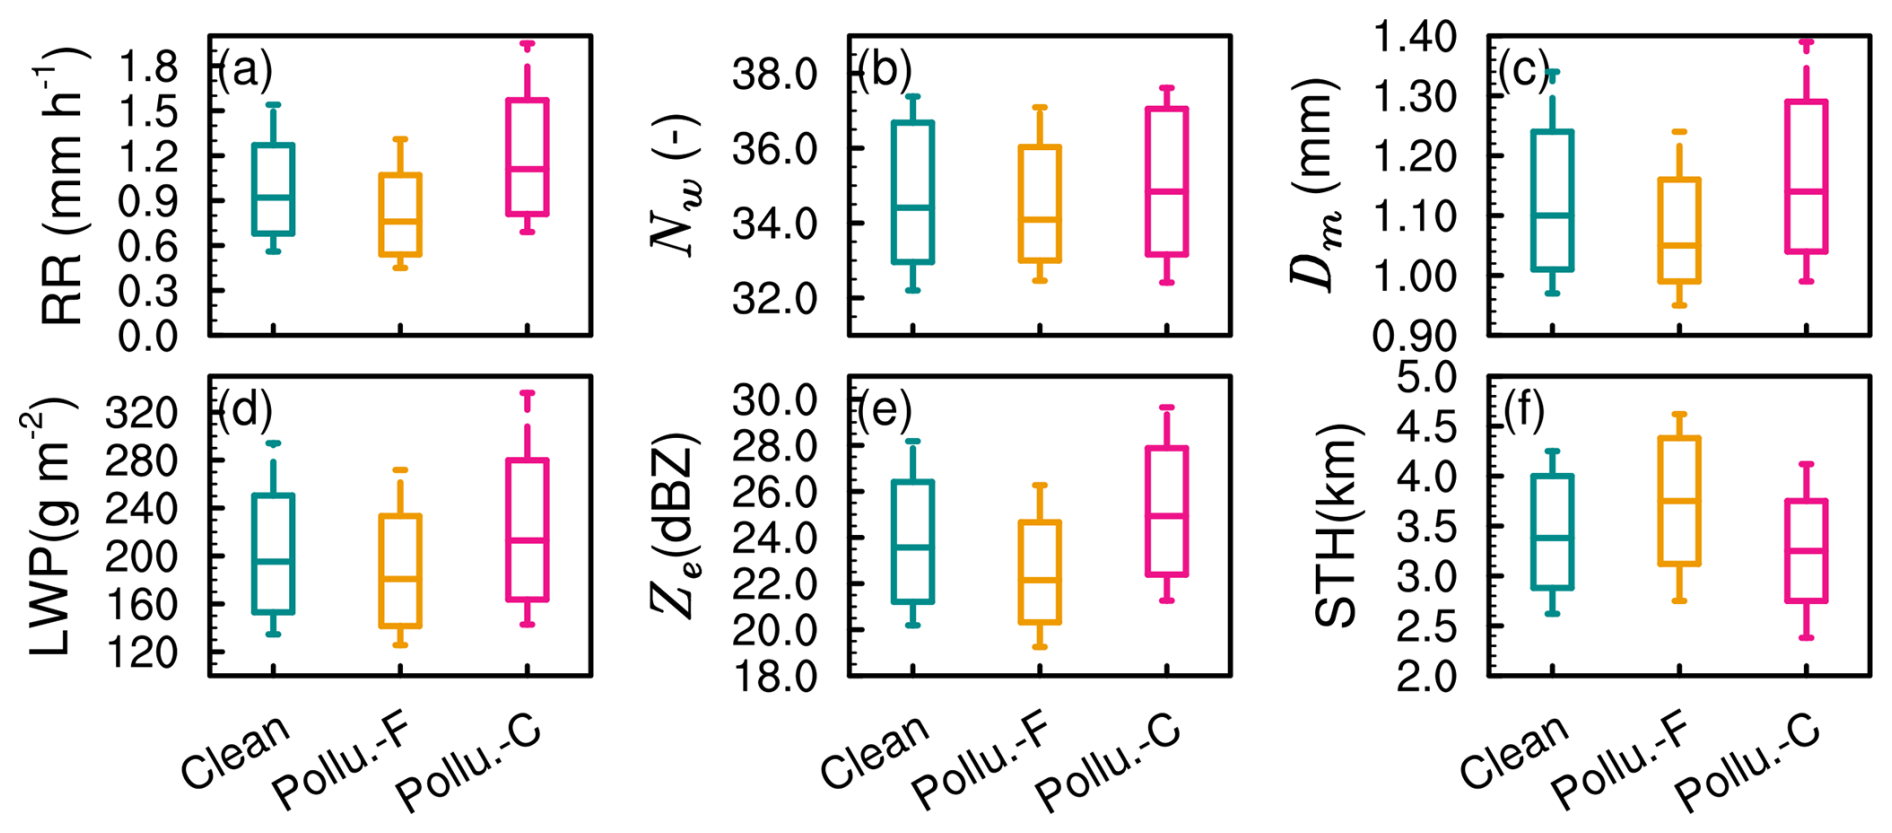
Figure 2The boxplot presents the near-surface rain rate (a), Nw (b), Dm (c), LWP (d), Ze (e), and STH (f) for shallow precipitation across varying aerosol conditions in southern China during the summer seasons from 2014 to 2021. The top and bottom edges of the boxes indicate the upper and lower tercile, respectively. The line inside the box denotes the median. The whiskers extending from the box illustrate the upper and lower quartiles.
DSDs directly impact RR. Therefore, the DSDs at 2.5 km altitude for shallow-precipitation clouds over southern China under three aerosol particle conditions are illustrated in Fig. 3. Irrespective of the aerosol particle background, the DSDs are characterized by a high concentration of small droplets and a low concentration of large droplets, aligning with prior research findings (Wang et al., 2016; Chen et al., 2022). In a clean environment (Fig. 3a), the DSD of shallow precipitation exhibits a high-frequency center around Nw of approximately 40, with Dm around 1.0 mm, reaching a frequency exceeding 70 %. A secondary peak (40 %) slightly shifts towards the lower right, located at Dm around 1.2 mm and Nw around 32. In the case of fine-aerosol-polluted environments (Fig. 3b), the average RR (1.15 mm h−1) and Dm (1.14 mm) are slightly reduced compared to the clean environment, while the mean Nw increases slightly to 36.37. Furthermore, the secondary peak observed in a clean environment becomes more pronounced under fine-aerosol-polluted conditions, with a frequency exceeding 50 %. In contrast to clean and fine-aerosol-polluted environments, both the mean values of RR and Nw increase under coarse-aerosol-polluted conditions (Fig. 3c). Furthermore, the DSD reveals more samples with Dm exceeding 2 mm or Nw exceeding 40, further indicating the enhancement of RR for shallow precipitation in coarse-aerosol-polluted environments.
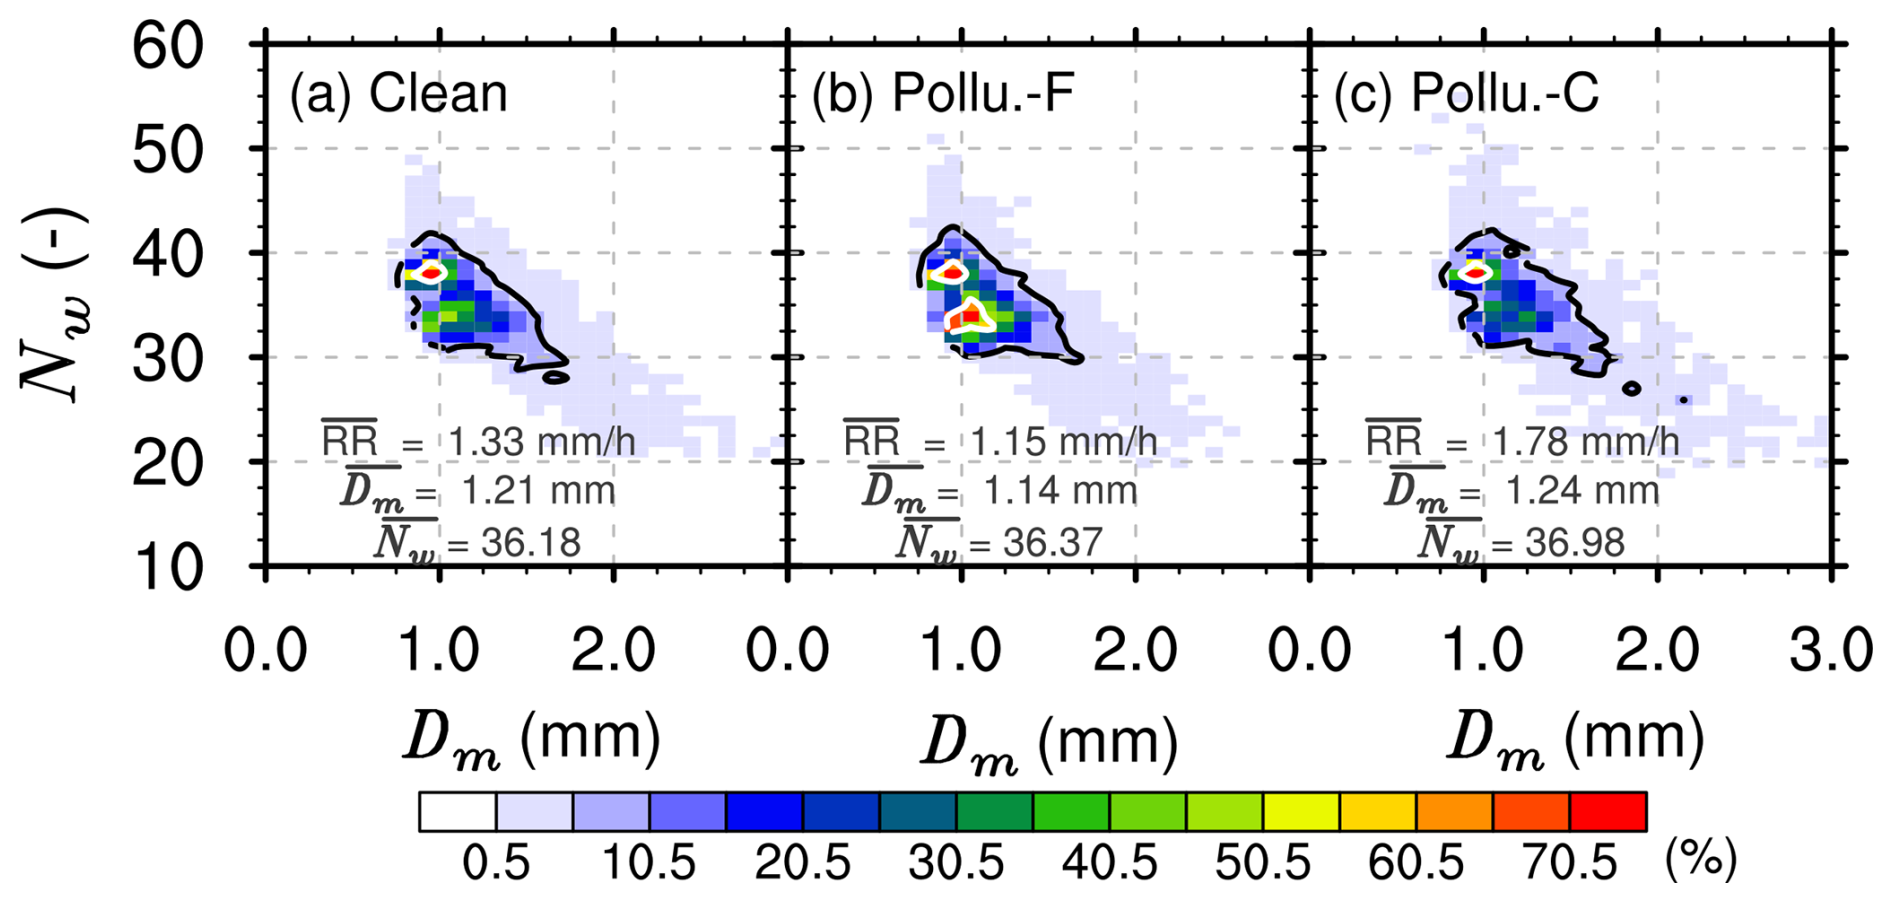
Figure 3DSDs at 2.5 km altitude for shallow precipitation in clean (a), fine-aerosol-polluted (b), and coarse-aerosol-polluted (c) environments over southern China during the summers from 2014 to 2021. The mean values of Dm and Nw under different aerosol particle conditions are presented in each panel. The 5 % and 50 % contours are indicated by solid black and white lines, respectively.
3.2 Influence of aerosol particles on microphysical structures and processes
The above analysis has shown significant differences in the near-surface RR and DSD for shallow precipitation under different aerosol particle environments. The vertical structure of precipitating clouds is closely related to the near-surface RR and DSD, reflecting the thermal and dynamic structure within the clouds. Investigating the precipitation and microphysical structures under different aerosol particle backgrounds can further deepen our understanding of the thermodynamic and microphysical mechanisms by which aerosol particles affect shallow precipitation near the surface.
Figure 4 presents the profiles of the median values of Ze, RR, Dm, and Nw for shallow precipitation over southern China in summer in three different types of aerosol particle environments. In general, shallow precipitation exhibits an increase in Ze, RR, Dm, and Nw with a decrease in altitude across various aerosol particle environments, suggesting that the growth process of shallow precipitation is predominantly governed by warm-rain collision–coalescence mechanisms. This is similar to the precipitation structures for shallow precipitation in the Yangtze–Huai River basin (Chen et al., 2024). However, the median values of Ze, RR, Dm, and Nw at each altitude differ under different types of aerosol particle environments. The promotion effect of coarse aerosol particles and the inhibition effect of fine aerosol particles are present throughout the profile. For example, the median values of Ze, RR, Dm, and Nw at any given altitude are the largest in a coarse-aerosol-polluted environment and the smallest in a fine-aerosol-polluted pollution. Furthermore, the most significant differences in precipitation microphysical structures under different aerosol backgrounds occur near the surface (below 2 km). For example, at 1 km altitude, the differences in Ze, RR, Dm, and Nw are approximately 3 dBZ, 0.4 mm h−1, 0.12 mm, and 1, respectively.
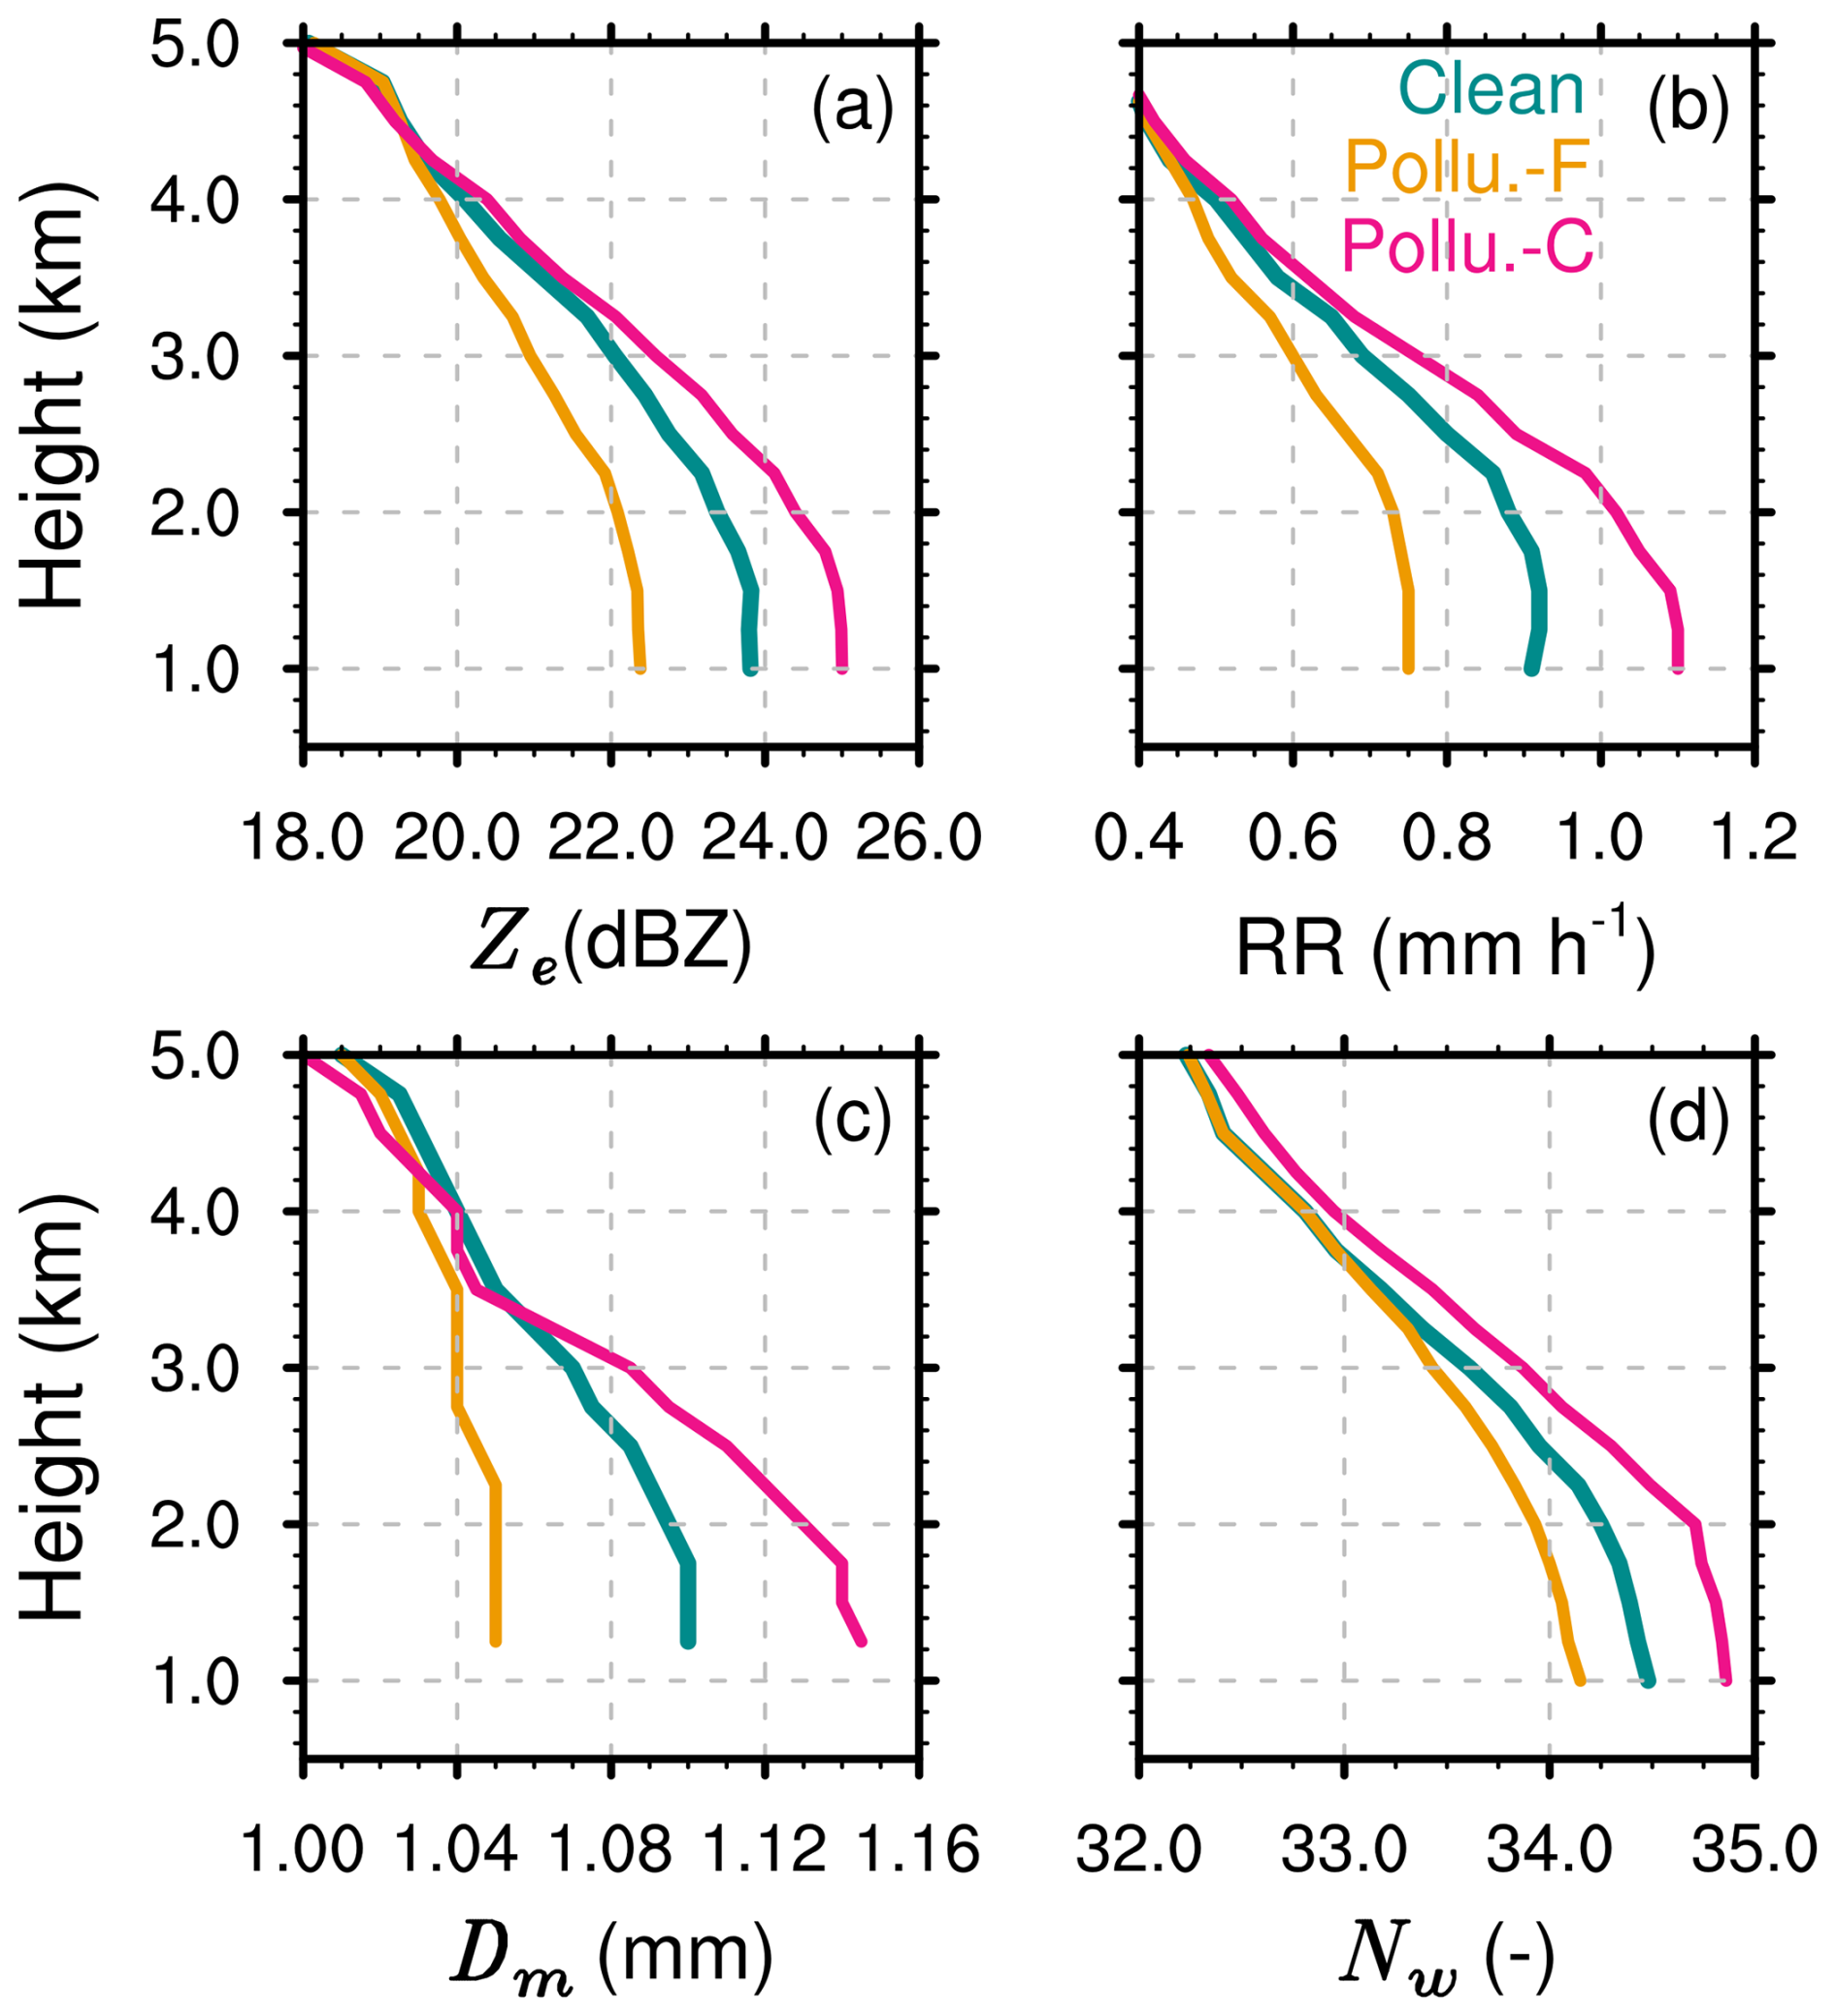
Figure 4The profiles of the median Ze (a), rain rate (b), Dm (c), and Nw (d) for shallow precipitation in different aerosol particle conditions over southern China during the summers from 2014 to 2021.
Considering the increasing amplitude of the median values of Ze, RR, Dm, and Nw with decreasing altitude, there are significant differences under different aerosol backgrounds, reflecting different microphysical precipitation processes within shallow-precipitation systems. Specifically, in coarse-aerosol-polluted environments, the growth rates in Ze, RR, Dm, and Nw from the 3 to 1 km altitude layer are the largest, while these growth rates are the lowest in fine-aerosol-polluted environments. This explains why a concentration increase in coarse particles results in an enhancement of RR compared to a clean environment, whereas an increase in fine aerosol particles leads to a precipitation suppression. For instance, the median Dm in pristine environments shows an increment from 1.07 mm at 3 km altitude to 1.1 mm at 1 km. In environments polluted by coarse aerosol particles, Dm exhibits a more pronounced increasing trend, with the median Dm rising from 1.08 mm at 3 km to 1.14 mm at 1 km. Conversely, with fine aerosol particles, the change in the median Dm from 3 to 1 km is negligible, almost remaining constant at approximately 1.04 mm.
To more intuitively reflect the potential impact of different types of aerosol particles on the near-surface microphysical processes of shallow precipitation, the methods of Kumjian et al. (2014) are adopted to quantify the near-surface microphysical processes using changes in Ze () and Dm () at 3 and 1 km. For example, collision–coalescence typically causes increases in Ze and Dm, while breakup causes decreases. Similarly, an upward trend in Dm combined with a downward trend in Ze as they approach the ground (positive ΔDm and negative ΔZe) indicates evaporation or size sorting is the dominant process. The signature of a “balance” between collision–coalescence and breakup is shown by a minor reduction in Dm and a rise in Ze.
Figure 5 shows the proportions of collision–coalescence, size-sorting, breakup, and balance processes of raindrops in shallow-precipitation clouds under three different aerosol backgrounds. In general, the microphysical process of collision–coalescence of raindrops dominates shallow precipitation, accounting for more than 60 %. This is followed by the raindrop breakup process, which accounts for more than 20 %, while size-sorting and balance processes account for the smallest proportions, only about 3 % and 1 %, respectively. In presence of the fine aerosol mode, the proportion of the collision–coalescence process is only 62.4 %, while this proportion reaches 74.1 % in coarse-aerosol-polluted environments, with an increase of about 11.7 %. Similarly, the proportion of the raindrop breakup process is 33.1 %, with a decrease of 10 % compared to 22.1 % in coarse-aerosol-polluted environments. This indicates the increase in the proportion of raindrop breakup processes and the weakening of the collision–coalescence process in fine-aerosol-polluted environments, which may be the reason for the weakened near-surface RR. Conversely, in coarse-aerosol-polluted environments, raindrops undergo more collision–coalescence growth processes and fewer breakup and evaporation processes, which contributes to the enhancement of the surface RR.

Figure 5The percentages of coalescence (a), size sorting (b), breakup (c), and balance (d) for shallow-precipitation raindrops under different aerosol particle conditions in southern China during the summers from 2014 to 2021.
3.3 Sensitivities of aerosol impacts on precipitation to meteorological factors
The findings from the prior section demonstrate that shallow precipitation shows notable variations in the surface RR, precipitation structures, and microphysical processes depending on different aerosol particle conditions. However, precipitation itself is a complex process influenced by multiple thermal and dynamic environmental factors, such as instability, humidity, temperature, and wind vectors. Among these, dynamic conditions and moisture levels are particularly important indicators. Therefore, CAPE and RH at 850 hPa, which, respectively, reflect atmospheric instability and moisture, are used to isolate and assess the impact of aerosol particles. CAPE is divided into three intervals based on the terciles of CAPE values during precipitation events in southern China: CAPE of 333 J kg−1 (CAPE1), (CAPE2), and CAPE of 1031 J kg−1 (CAPE3). Similarly, RH at 850 hPa is divided into three intervals, that is, RH of 83 % (RH1), (RH2), and RH of 91 % (RH3).
The boxplots of RR, LWP, and STH, as well as Nw, Dm, and Ze at 2.5 km altitude, for shallow precipitation in southern China under different aerosol particle backgrounds and CAPE values are presented in Fig. 6. Consistent with the conclusions of Fig. 2, it becomes apparent that under varying CAPE conditions, the median STH of shallow-precipitation clouds attains its lowest values in coarse-aerosol-polluted environments, whereas the median RR and Ze at an altitude of 2.5 km reach their highest levels. On the contrary, the median STH is the highest, but the median RR and Ze at 2.5 km are the lowest in a fine-aerosol-polluted environment. This indicates that the suppression of RR in fine-aerosol-polluted environments and the invigoration of RR in coarse-aerosol-polluted environments are independent of the dynamic conditions (CAPE in this case). Furthermore, when seen from a microphysics perspective, under different CAPE conditions, shallow-precipitation clouds in coarse-aerosol-polluted environments exhibit the highest median values of values of LWP, Nw, and Dm at 2.5 km, while these variables are the lowest in fine-aerosol-polluted environments. This helps explain why shallow precipitation has the highest near-surface RR in coarse-aerosol-polluted environments and the lowest surface RR in fine-aerosol-polluted environments from the microphysical perspective.
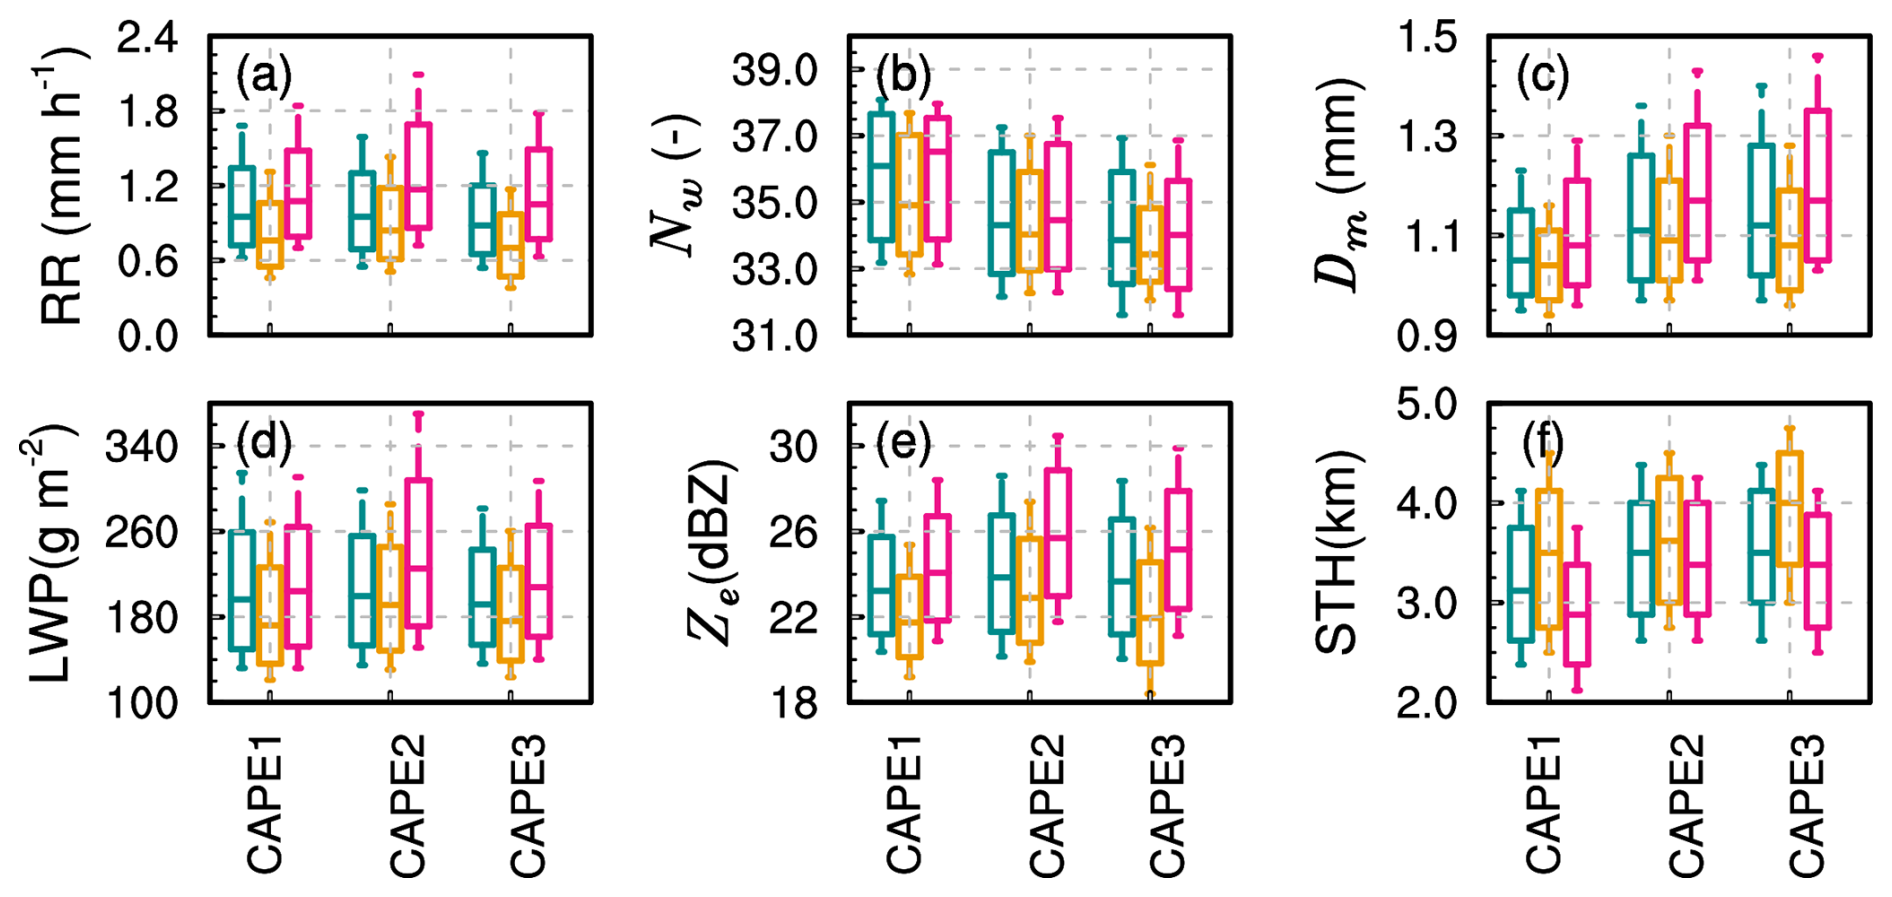
Figure 6Boxplot of the near-surface rain rate (a), Nw (b), Dm (c), LWP (d), Ze (e), and STH (f) under different aerosol particle and CAPE conditions for shallow precipitation over southern China during the summers of 2014–2021. The blue, orange, and pink colors indicate the clean, fine-aerosol-polluted, and coarse-aerosol-polluted environments, respectively. The boxes' top and bottom edges indicate the upper and lower tercile, respectively. The median is depicted by the line inside the box. The whiskers extending from the box illustrate the lower and upper quartiles.
Similarly, the sensitivity of humidity to the impact of aerosol particles on shallow precipitation is examined by presenting the boxplots of precipitation parameters, as illustrated in Fig. 7. Regardless of RH at 850 hPa, the vertical development of shallow-precipitation clouds is hindered in coarse-aerosol-polluted environments, with the median STH being the smallest. However, the near-surface RR is the highest, corresponding to the highest median Ze at 2.5 km. On the contrary, in fine-aerosol-polluted environments, the vertical development of shallow-precipitation clouds is enhanced (with the highest median STH), but the near-surface RR and Ze are the weakest. This further confirms that the impact of coarse and fine aerosol particles on the near-surface RR and LWP is independent of moisture and dynamic conditions.
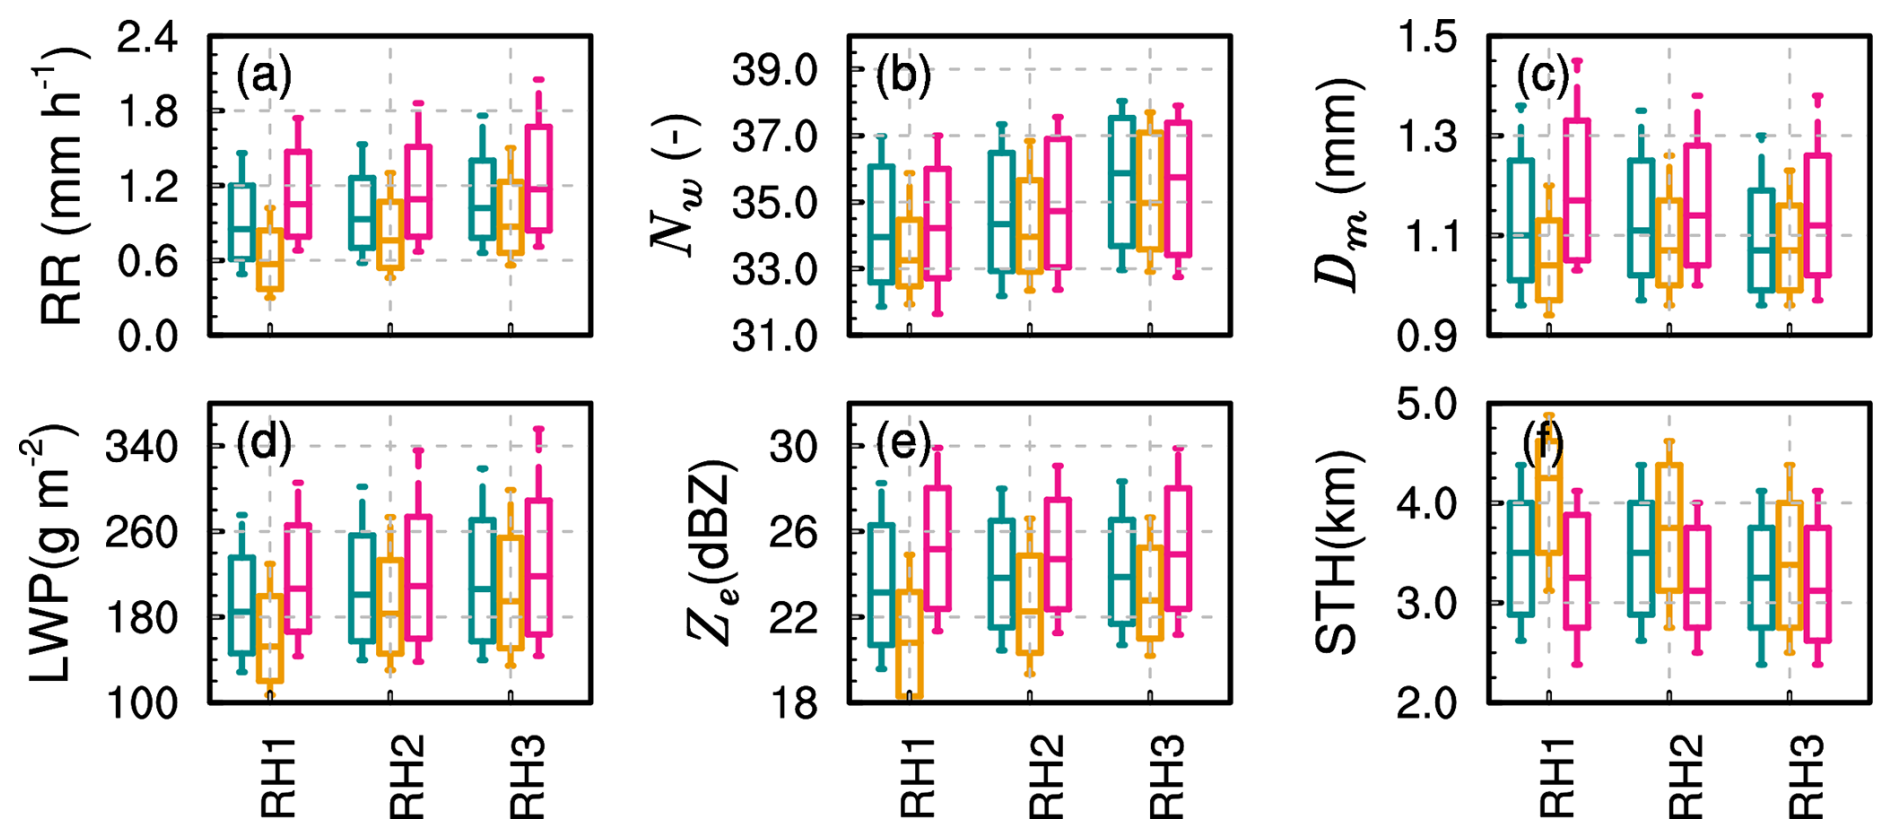
Figure 7Same as Fig. 6 but for RH at 850 hPa. The blue, orange, and pink colors indicate the clean, fine-aerosol-polluted, and coarse-aerosol-polluted environments, respectively.
It is important to note that the degree of enhancement or suppression of RR by coarse and fine aerosol particles varies under different humidity conditions. Compared to high-humidity environments, coarse aerosol particles have the most significant enhancement effect on RR, while fine aerosol particles have the most significant suppression effect in relatively low-humidity environments (RH1). In fine-aerosol-polluted environments, the boxplot of RR shows a significant decrease compared to that in clean environments, while that in coarse-aerosol-polluted environments shows a significant increase. Specifically, the median RR in the coarse-aerosol-polluted environment is around 1.1 mm h−1, while it is around 0.7 mm h−1 in the fine-aerosol-polluted environment.
Regarding STH, under low-humidity and fine-aerosol-polluted conditions, shallow-precipitation clouds develop more deeply, with the 25th percentile of STH reaching 5 km, which is significantly higher than in clean and coarse-aerosol-polluted environments. This may be because there is a reduction in the effective radius of cloud droplets in fine-aerosol-polluted and low-humidity conditions. Smaller cloud droplets are more prone to evaporation, resulting in a lower LWP, which does not favor an increase in the near-surface RR. This is also reflected in the near-surface DSD, which is characterized by lower Nw and smaller Dm. However, although the humidity is relatively low, the coarse particles, being more hygroscopic, can form larger cloud droplets, reducing the loss of cloud water due to evaporation (resulting in a higher LWP) and thereby enhancing surface RR. This is also reflected in the near-surface DSD, which is characterized by higher Nw and larger Dm. In high-humidity environments, a high concentration of fine particles can promote the formation of more cloud condensation nuclei, which to some extent reduces the loss of cloud water due to the evaporation of small particles. Therefore, the LWP in fine-particle pollution environments does not differ much from that in coarse-aerosol-polluted environments. This may also lead to smaller differences in RR, Ze, and other variables between coarse- and fine-aerosol-polluted environments under relatively high-humidity conditions.
3.4 Sensitivities of aerosol impacts on microphysical structures and processes to meteorological factors
This section continues to examine how coarse and fine aerosol modes affect the precipitation structure and the microphysical processes in different environmental settings. As shown in Fig. 8, under different CAPE and aerosol particle backgrounds, shallow-precipitation profiles consistently exhibit increasing trends in Ze, RR, Nw, and Dm with decreasing altitude. Furthermore, irrespective of CAPE values, at a specified altitude, the parameters Ze and RR are observed to be at their maximum in environments polluted with coarse aerosol particles, followed by those in a clean environment, and they are at their minimum in environments polluted with fine aerosol particles. This is consistent with the results in Fig. 4. When compared between different CAPE conditions, the Ze, RR, and Dm of shallow precipitation in CAPE2 are the highest at different altitudes, while as CAPE increases further (CAPE3), these values even decrease. Apart from instability, precipitation can be influenced by moisture, topography, and other factors; therefore, it is possible for an even lower RR in high-CAPE conditions.
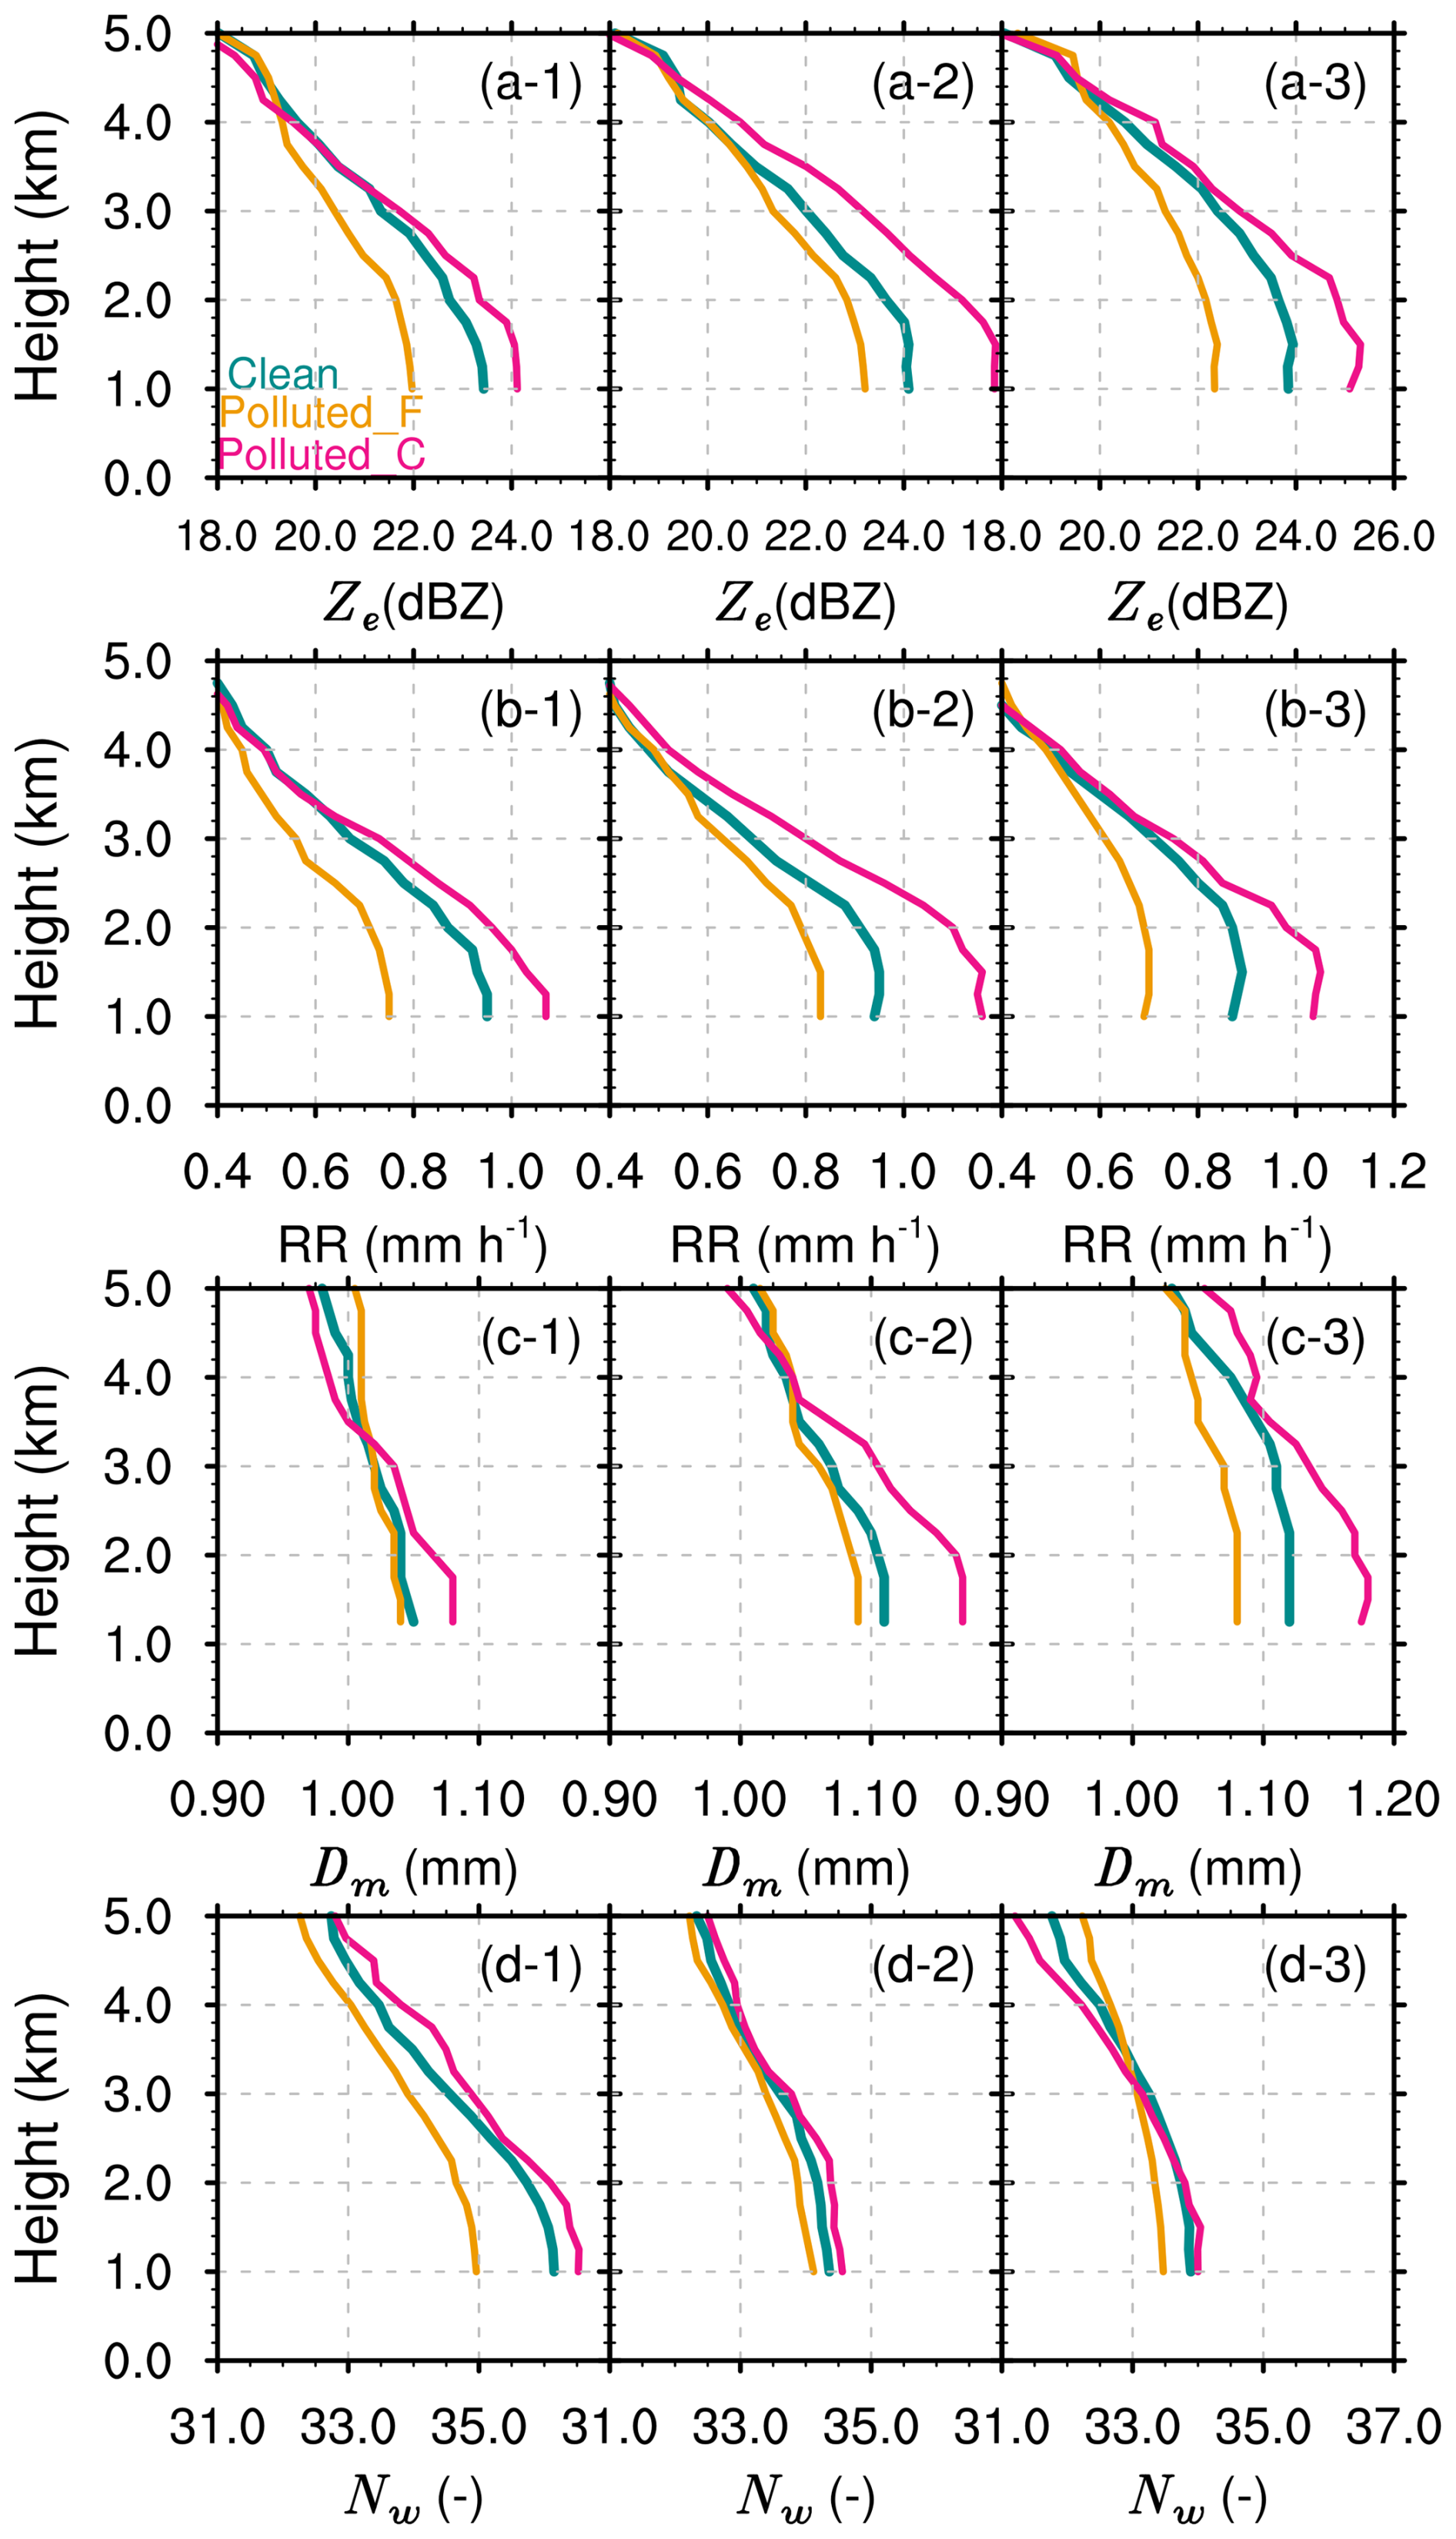
Figure 8The Ze (a), rain rate (b), Dm (c), and Nw (d) profiles for shallow precipitation in different aerosol particle and CAPE conditions over southern China during the summers from 2014 to 2021. CAPE1, CAPE2, and CAPE3 are shown in the left, middle, and right panels, respectively.
When seen from the perspective of Dm and Nw (Fig. 8c1–c3 and d1–d3), the promotion effect of coarse aerosol particles and the suppression effect of fine aerosol particles can vary under different dynamic environmental conditions. Under moderate CAPE conditions (CAPE2), Dm and Nw in coarse-aerosol-polluted environments are the largest at different altitudes, while Dm and Nw in a fine-aerosol-polluted environment are the smallest. This indicates that under moderate CAPE conditions, the enhancement of RR in coarse-aerosol-polluted environments is contributed by large particles and high concentrations. For low-CAPE conditions (CAPE1), the median Dm above 3 km is even the smallest in coarse-aerosol-polluted environments, compared to clean and fine-aerosol-polluted environments. Therefore, the maximum values of RR and Ze at this layer are mainly contributed by high concentrations of raindrops (with large median Nw, as shown in Fig. 8d-1). For high-CAPE conditions (CAPE3), the median Nw above the 3 km altitude layer in coarse-aerosol-polluted environments is the smallest. Therefore, the maximum values of RR and Ze at this altitude are mainly contributed by high concentrations of raindrops (with large median Dm, as shown in Fig. 8c-3).
Similarly, the profiles of Ze, RR, Dm, and Nw at different RH values at 850 hPa and aerosol particle backgrounds are illustrated in Fig. 9. Consistent with previous research results, the median values of Ze, RR, Dm, and Nw of shallow precipitation exhibit a gradual increase with decreasing altitude, reflecting the warm-rain collision–coalescence growth process. However, the microphysical structures of shallow precipitation vary under different RH conditions with similar aerosol particle backgrounds. As RH at 850 hPa increases, the median values of Ze, RR, Dm, and Nw of shallow precipitation increase more significantly with decreasing altitude. For example, under low-humidity conditions (RH1), the median Dm increases slightly when raindrops fall from 3 to 1 km (Fig. 9c-1) and even decreases under fine-aerosol-polluted conditions, indicating more breakup processes. Subsequently, with increasing humidity, the increase in Dm becomes more apparent (Fig. 9c-3). For example, the median Dm increases from 1.05 to 1.15 mm in coarse-aerosol-polluted environments.
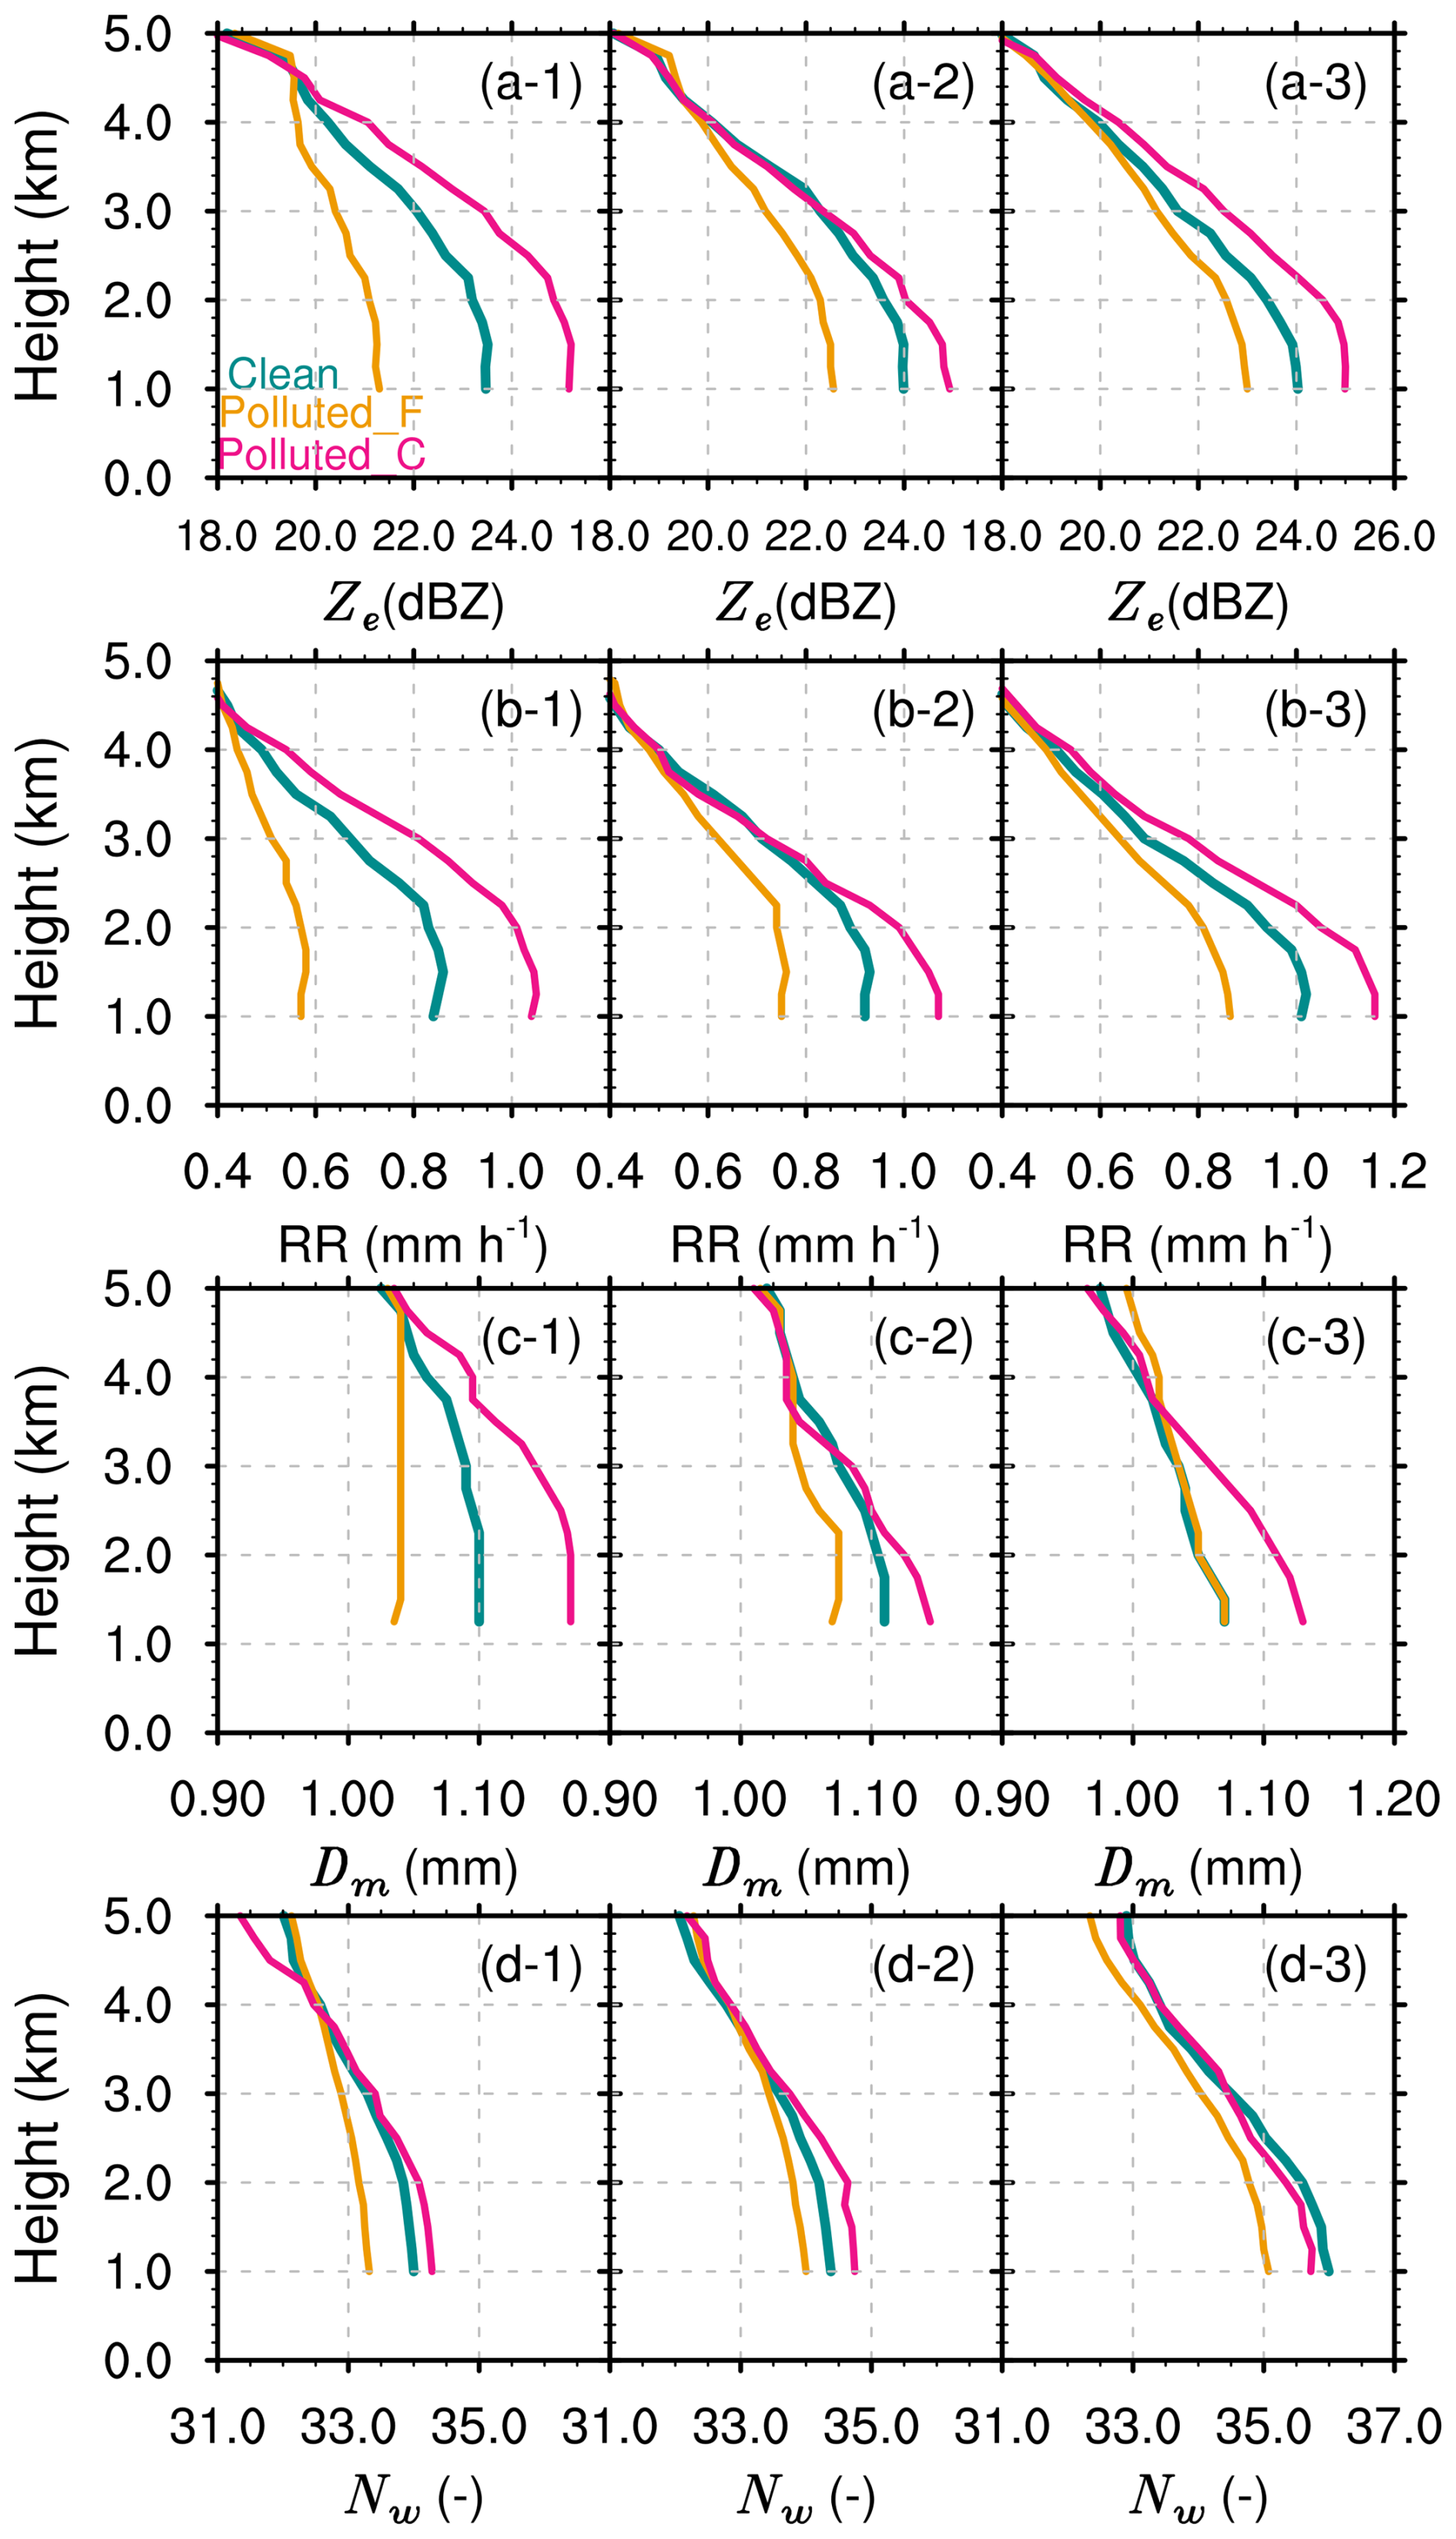
Figure 9The Ze (a), rain rate (b), Dm (c), and Nw (d) profiles for shallow precipitation in different aerosol particle conditions and RH values at 850 hPa over southern China during the summers from 2014 to 2021. RH1, RH2, and RH3 are shown in left, middle, and right panels, respectively.
The median values of Ze and RR across various aerosol particle backgrounds are markedly elevated in environments contaminated with coarse aerosol particles across all altitude layers, demonstrating a notable increase with decreasing altitude. Conversely, in conditions contaminated by fine aerosol particles, the median values of Ze and RR are at their lowest at each altitude layer, exhibiting minimal increases as altitude decreases. This is consistent with previous conclusions (Figs. 4 and 8), further indicating that the impact of coarse and fine aerosol particles on the near-surface RR and the precipitation structure is not sensitive to dynamic and moisture conditions. However, from the perspective of the microphysical structure, there are still some differences in aerosol particle backgrounds. Under low- and moderate-humidity conditions (RH1 and RH2), at a given altitude, Dm and Nw are the largest in coarse-aerosol-polluted environments and the smallest in fine-aerosol-polluted environments. In RH3 conditions at the same altitude, a clean environment has the highest Nw and a relatively small Dm; for the coarse mode, Nw is moderate with the largest Dm; and for the fine mode, Nw is the lowest with a relatively small Dm. This indicates that in high-RH environments, fine aerosol particles mainly reduce RR by suppressing the concentration of raindrops, while coarse aerosol particles increase RR by increasing the size of raindrops. Furthermore, the differences in precipitation structures in coarse- and fine-aerosol-polluted environments depend on humidity conditions, consistent with the conclusions in Fig. 7. The differences are the greatest under RH1 conditions, with the differences in RR, Ze, Dm, and Nw at 1 km altitude being 0.42 mm h−1, 4.5 dBZ, 0.19 mm, and about 1.3, respectively. Under RH3 conditions, the differences are smallest, with the differences in the aforementioned variables being 0.35 mm h−1, 2 dBZ, 0.05 mm, and approximately 0.8, respectively.
To quantitatively analyze the dependence of microphysical processes on dynamics and moisture under different aerosol particle backgrounds, we examined the differences in the two primary microphysical processes, i.e., collision–coalescence and breakup (Fig. 10). As a result of the low proportions of size sorting and balance, a further analysis of these microphysical processes is not included. The microphysical processes of precipitation depend on the dynamic and moisture conditions. For instance, with decreasing CAPE and increasing RH, the proportion of collision–coalescence increases, while the proportion of breakup decreases in clean, coarse-aerosol-polluted, and fine-aerosol-polluted environments. Environments with high RH and low CAPE encourage aerosol particles in the boundary layer to gather moisture, leading to the formation of additional cloud droplets. These droplets then condense further to create more raindrops, thus enhancing the collision–coalescence process.
After comparing various aerosol particle backgrounds, it is possible to determine certain overarching patterns that remain consistent regardless of thermodynamic conditions. Initially, irrespective of CAPE, RH, or aerosol particle background, shallow-precipitation systems predominantly exhibit the warm-rain collision–coalescence process, with its occurrence proportion spanning from a minimum of 51.2 % to a maximum of 82.3 %. There is also a certain proportion of breakup processes, ranging from 14.6 % to 43.2 %. Second, regardless of the value of CAPE and RH, the proportion of the collision–coalescence process is always the highest in coarse-aerosol-polluted environments, while the proportion of the breakup process is always the highest in fine-aerosol-polluted environments. These conclusions are consistent with the results in Fig. 5. However, the increase in the proportion of collision–coalescence in coarse-aerosol-polluted environments and the increase in the proportion of breakup in fine-aerosol-polluted environments depend on dynamic and moisture conditions. For example, under low-humidity (RH1) conditions, the proportion of the collision–coalescence process in coarse-aerosol-polluted environments (73.4 %) is significantly higher than that in fine-aerosol-polluted environments (51.2 %), with an enhancement of 22.2 %. On the contrary, the proportion of the breakup process in fine-aerosol-polluted environments (43.2 %) is significantly higher than in coarse-aerosol-polluted environments (22.3 %). This is consistent with previous findings that under RH1 conditions, Dm in fine-aerosol-polluted environments rapidly decreases with decreasing altitude.
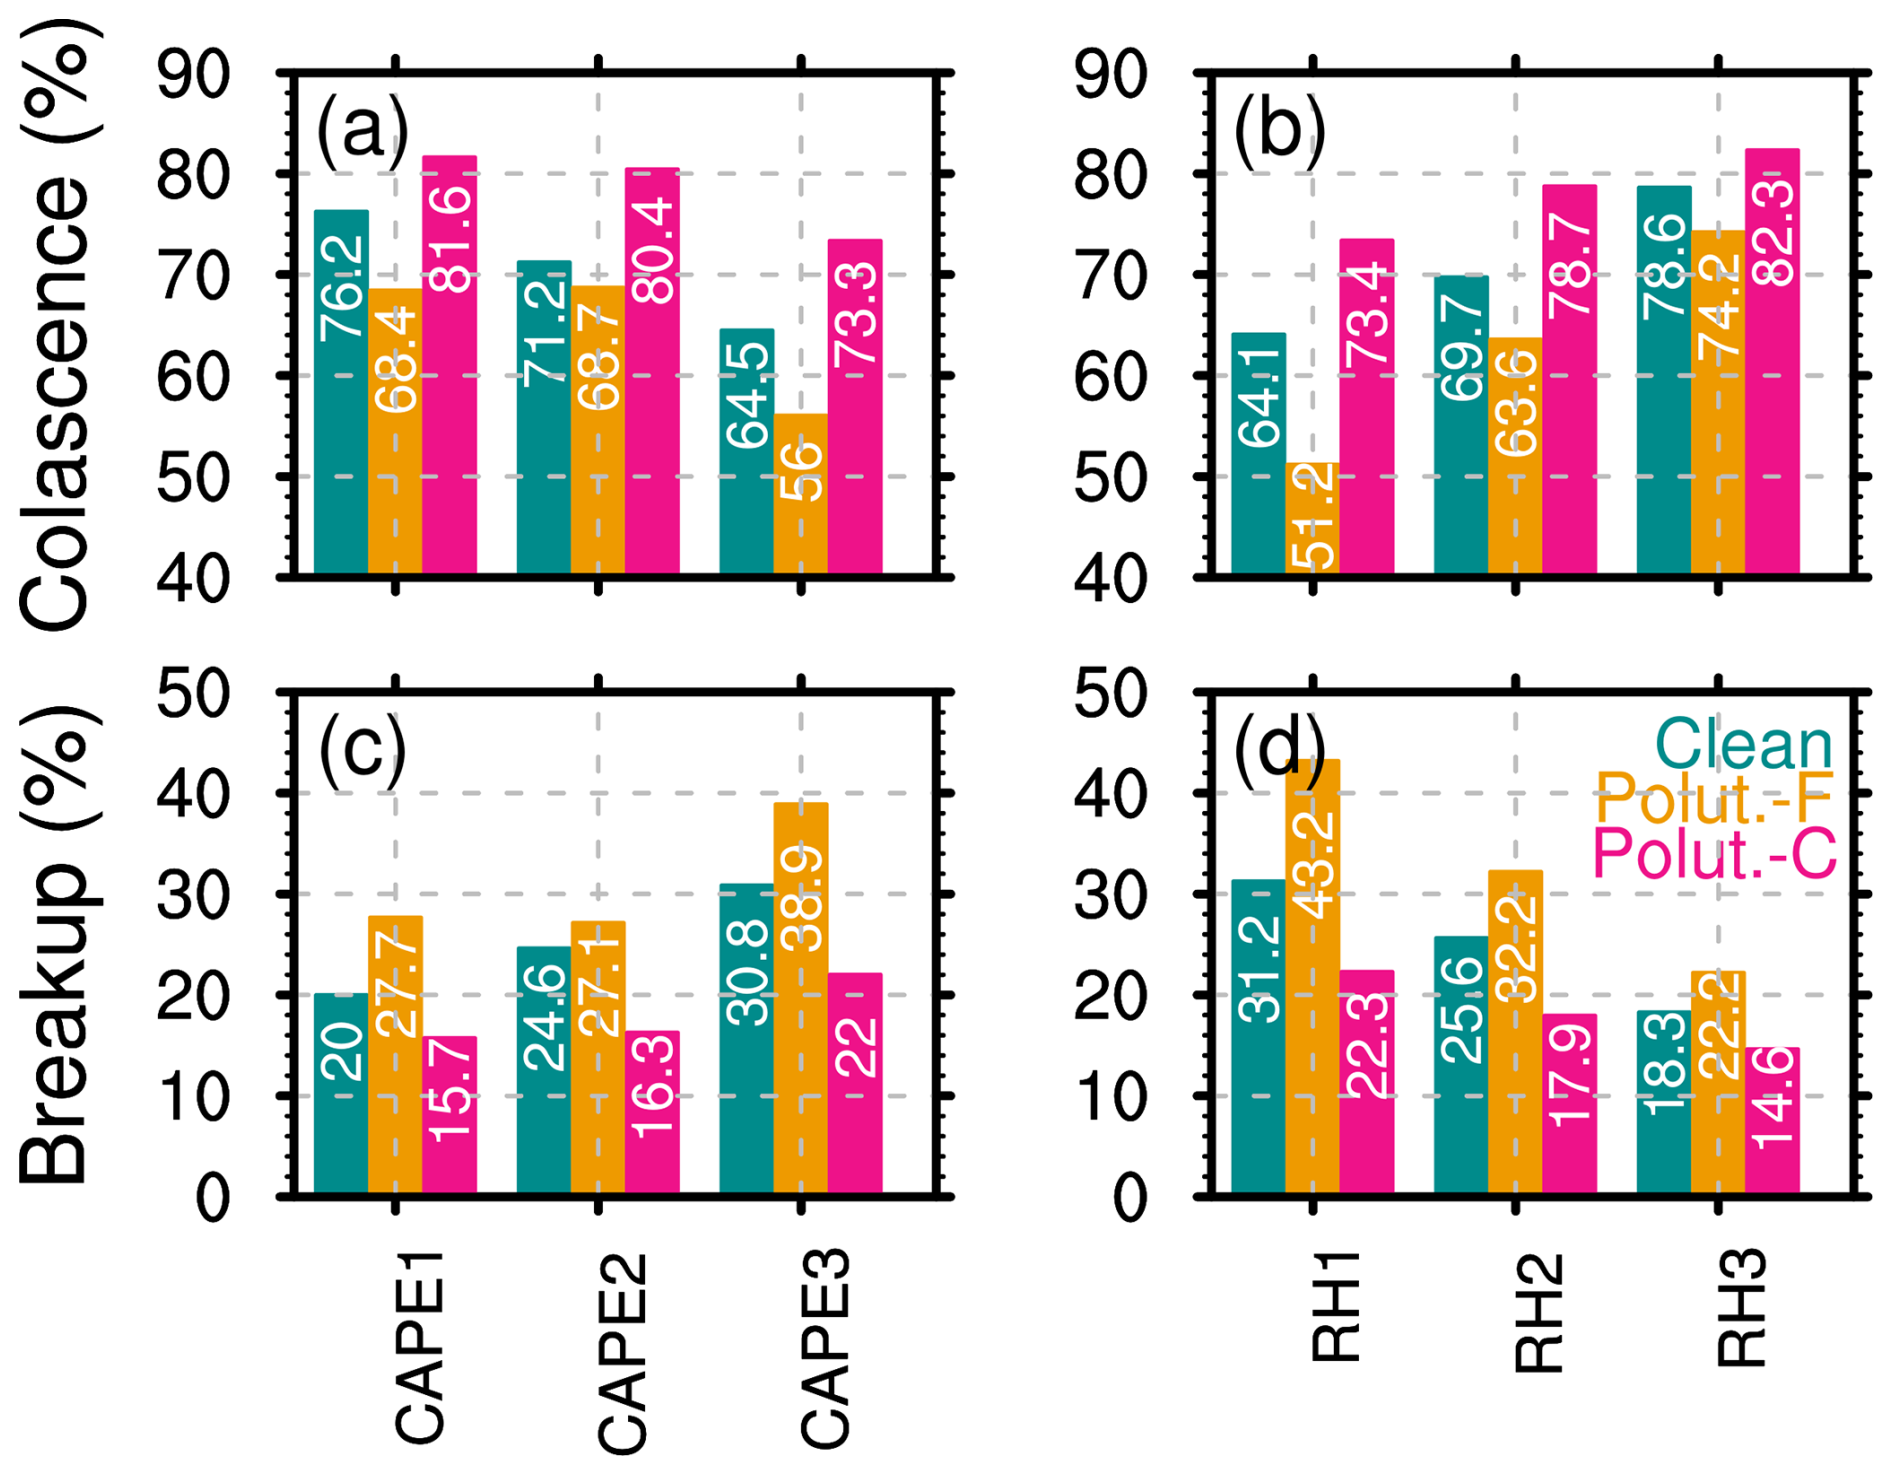
Figure 10The percentages of coalescence (a, b) and breakup (c, d) for shallow-precipitation raindrops under different conditions of aerosol particles, CAPE, and RH values at 850 hPa in southern China during the summers from 2014 to 2021.
Using the combined data of DPR, MERRA-2 aerosol datasets, and ERA5 during the summers of 2014–2021, this study investigates the potential impacts of coarse and fine aerosol particles on the rain rate (RR), microphysical structure, and processes for shallow precipitation in southern China. Clean, coarse-aerosol-polluted, and fine-aerosol-polluted modes are classified according to the AOD for total aerosol particles, coarse aerosol particles, and fine aerosol particles derived from MERRA-2 products. ERA5 reanalysis data are used to explore the sensitivity of aerosol impacts on shallow precipitation to dynamic and moisture conditions in southern China. The main findings are summarized as follows.
In comparison to clean environments, coarse-aerosol-polluted environments enhance near-surface rainfall rates of shallow precipitation, characterized by a stronger near-surface RR (average precipitation intensity of 1.78 mm h−1), and higher concentrations (average Nw of 36.98) of raindrops at larger sizes (average Dm of 1.24 mm). This can be ascribed to the presence of sea salt aerosol particles in southern China, which tend to form larger cloud droplets through hygroscopic growth. This, in turn, enhances the condensation process, leading to the formation of additional rain droplets. As a result, it facilitates the coalescence and growth of raindrops, ultimately contributing to the formation of larger raindrops. On the contrary, fine aerosol particles suppress the near-surface RR, with an average near-surface RR of only 1.33 mm h−1 and lower concentrations and smaller sizes of raindrops (average Nw of 36.37, average Dm of 1.14 mm). Liu et al. (2022) noted similar opposing effects of fine aerosol particles and coarse sea spray on warm marine clouds. Deep clouds show increased rainfall with high liquid water content but reduced rainfall if water content is low (Li et al., 2011). This underscores the distinct behavior of shallow precipitation and the varied impacts of aerosol types on it. However, fine-aerosol-polluted environments promote vertical development of shallow-precipitation clouds (median STH of 3.7 km) at approximately 0.5 km higher than in coarse-aerosol-polluted conditions. The inhibition of the vertical development of precipitation clouds by coarse aerosol particles explains their suppressive effect on lightning activity to some extent (Pan et al., 2022).
From the perspective of precipitation vertical structure and microphysical processes, shallow precipitation is dominated by warm-rain collision–coalescence processes under different aerosol particle backgrounds, with the collision–coalescence process accounting for over 62 %. However, there are significant differences in the efficiency of raindrop collision–coalescence growth under different aerosol particle conditions. In contrast to clean conditions, the median values of Ze, RR, Dm, and Nw are highest in the presence of the aerosol coarse mode and lowest in conditions for the fine aerosol mode at all altitude levels. Looking at it from a microphysical standpoint, the increase in Dm with decreasing altitude is most pronounced under coarse-aerosol-polluted conditions, reflecting more significant collision–coalescence growth processes, accounting for 74.1 %. In contrast, the increase in Dm with decreasing altitude is weakest under fine-aerosol-polluted conditions, due to the higher proportion of breakup processes (accounting for 33.1 %) and a decrease of approximately 12 % in the collision–coalescence process (accounting for 62.4 %). Overall, the promotion of RR is associated with more significant collision–coalescence processes by coarse aerosol particles, while the suppression of RR is characterized by more significant breakup processes with fine aerosol particles.
The effects of fine and coarse aerosol particles on the suppression and enhancement of RR are independent of CAPE and humidity, consistent with the findings by Liu et al. (2022). However, our results show that the extent of suppression or enhancement varies with CAPE and humidity. Additionally, the analysis of aerosol–precipitation interactions under different surface air temperatures yields results similar to those observed for CAPE and RH at 850 hPa (figures not shown). The promotion and suppression effects are the most pronounced under low-humidity conditions (RH1). This is mainly contributed by the stronger suppression of fine aerosol particles in low-humidity environments. For instance, the median RR is around 1.12 mm h−1 under coarse-aerosol-polluted conditions, while it is around 0.7 mm h−1 under fine-aerosol-polluted conditions, with a difference of approximately 0.42 mm h−1. The collision–coalescence and breakup microphysical processes play an important role in these differences, with collision–coalescence accounting for 73.4 % under coarse-aerosol-polluted conditions, which is 22.2 % higher than the 51.2 % observed under fine-aerosol-polluted conditions. Correspondingly, the breakup microphysical processes account for 43.2 % under fine-aerosol-polluted conditions, which is significantly higher than the 22.3 % in coarse-aerosol-polluted conditions. Under high-humidity conditions, fine-aerosol-polluted environments primarily reduce RR by inhibiting raindrops concentration (possibly as a result of the evaporation effects of small cloud droplets), while coarse aerosol particles invigorate RR by increasing the size of raindrops. Additionally, the increase in RR above 3 km in coarse-aerosol-polluted environments is mainly driven by the high concentration of hydrometeors in low-instability conditions, while it is driven by large hydrometeors in high-instability environments. It is important to note that precipitation is a complex process influenced by multiple meteorological factors, including instability, moisture, and temperature. Additionally, other factors such as wind vectors and pressure may also affect the impact of aerosol particles on precipitation, which is worthy of further study.
This study primarily elucidates the microphysical processes within shallow-precipitation systems under varying aerosol particle conditions. However, the methods and data utilized have broad application potential. Future research could extend these approaches to explore the relationship between deep convection or mixed-phase clouds and aerosol particles. Such investigations could reveal the complex effects of aerosol particles on the precipitation process and further enhance our scientific understanding of the physical connections between aerosol particles and precipitation microphysics. However, it is important to note that the spatial resolution of MERRA-2 and ERA5 is much coarser than that of DPR. The interpolation methods employed in the present study may introduce errors and may not fully capture the true conditions, making it challenging to accurately assess fine-scale processes in aerosol–cloud interactions. Furthermore, MERRA-2 shows a slight underestimation of approximately 0.1 compared to in situ observations in southern China (Ou et al., 2022), probably due to the absence of nitrate aerosol particles in the MERRA-2 dataset. Consequently, the fine-aerosol-polluted environments examined in this study may not fully capture conditions with high nitrate loading. There is an urgent need for long-term observational data of aerosol concentrations with high spatiotemporal resolution and accuracy to fully capture the samples of high aerosol particle loading and more effectively capture fine-scale processes in aerosol–cloud interactions.
The GPM DPR data provided by NASA Goddard Space Flight Center's Mesoscale Atmospheric Processes Laboratory and Precipitation Processing System (PPS) can be downloaded from https://disc.gsfc.nasa.gov/datasets/GPM_2ADPR_07/summary (Iguchi et al., 2017). MERRA-2 data can be downloaded from https://gmao.gsfc.nasa.gov/reanalysis/MERRA-2/data_access/, last access: 28 January 2025 (GMAO, 2015). The ERA5 data can be downloaded from https://www.ecmef.int/en/forecasts/dataset/ecmwf-reanalysis-v5, last access: 28 January 2025 (Hersbach et al., 2023a, b). The ancillary digital terrain data are from the National Geophysical Data Center (NGDC) (available online at https://www.ngdc.noaa.gov/mgg/topo/gltiles.html, Hastings and Palua, 1999).
YY designed the manuscript and led the data analysis. FC performed the analysis and wrote the manuscript draft. YangL and YanL collected the data. WL, YangL, and SL reviewed and edited the manuscript. SL helped with the data analysis.
The contact author has declared that none of the authors has any competing interests.
Publisher's note: Copernicus Publications remains neutral with regard to jurisdictional claims made in the text, published maps, institutional affiliations, or any other geographical representation in this paper. While Copernicus Publications makes every effort to include appropriate place names, the final responsibility lies with the authors.
The authors thank NASA Goddard Space Flight Center's Mesoscale Atmospheric Processes Laboratory and PPS, NGDC, and ECMWF for providing the analysis data.
This work has been jointly supported by the National Natural Science Foundation of China (grant nos. 42222503 and 42105078), the Jianghuai Meteorological Joint Project of Anhui Natural Science Foundation (no. 2408055UQ002), the Jiangsu Meteorological Bureau General ProjectCE6 (no. KM202407), the Open Grants of the China Meteorological Administration Radar Meteorology Key Laboratory (no. 2024LRM-B06), the Open Project of KLME & CIC-FEMD (no. KLME202303), the China Meteorological Administration “Application of quantum technology in meteorological detection” Youth Innovation Team Project (no. CMA2024QN11), and the Open Project of the State Key Laboratory of Severe Weather (no. 2024LASW-B11).
This paper was edited by Luis A. Ladino and reviewed by two anonymous referees.
Buchard, V., da Silva, A. M., Colarco, P. R., Darmenov, A., Randles, C. A., Govindaraju, R., Torres, O., Campbell, J., and Spurr, R.: Using the OMI aerosol index and absorption aerosol optical depth to evaluate the NASA MERRA Aerosol Reanalysis, Atmos. Chem. Phys., 15, 5743–5760, https://doi.org/10.5194/acp-15-5743-2015, 2015.
Buchard, V., Randles, C. A., da Silva, A. M., Darmenov, A., Colarco, P. R., Govindaraju, R., Ferrare, R., Hair, J., Beyersdorf, A. J., Ziemba, L. D., and Yu, H.: The MERRA-2 Aerosol Reanalysis, 1980 Onward. Part II: Evaluation and Case Studies, J. Climate, 30, 6851–6872, https://doi.org/10.1175/JCLI-D-16-0613.1, 2017.
Chen, F., Zheng, X., Wen, H., and Yuan, Y.: Microphysics of Convective and Stratiform Precipitation during the Summer Monsoon Season over the Yangtze–Huaihe River Valley, China, J. Hydrometeorol., 23, 239–252, 2022.
Chen, F., Zheng, X., Yu, L., Wen, H., and Liu, Y.: Precipitation, microphysical and environmental characteristics for shallow and deep clouds over Yangtze-Huaihe River Basin, Atmos. Res., 298, 107155, https://doi.org/10.1016/j.atmosres.2023.107155, 2024.
Chen, T., F., Fu, Y., Liu, P., and Yang, Y.: Seasonal Variability of Storm Top Altitudes in the Tropics and Subtropics Observed by TRMM PR, Atmos. Res., 169, 113–126, https://doi.org/10.1016/j.atmosres.2015.09.017, 2016.
Chen, Y., Zhang, A., Zhang, Y., Cui, C., Wan, R., Wang, B., and Fu, Y.: A Heavy Precipitation Event in the Yangtze River Basin Led by an Eastward Moving Tibetan Plateau Cloud System in the Summer of 2016, J. Geophys. Res.-Atmos., 125, e2020JD032429, https://doi.org/10.1029/2020JD032429, 2020.
Chin, M., Ginoux, P., Kinne, S., Torres, O., Holben, B. N., Duncan, B. N., Martin, R. V., Logan, J. A., Higurashi, A., and Nakajima, T.: Tropospheric Aerosol Optical Thickness from the GOCART Model and Comparisons with Satellite and Sun Photometer Measurements, J. Atmos. Sci., 59, 461–483, https://doi.org/10.1175/1520-0469(2002)059<0461:TAOTFT>2.0.CO;2, 2002.
Christensen, M. W. and Stephens, G. L.: Microphysical and macrophysical responses of marine stratocumulus polluted by underlying ships: 2. Impacts of haze on precipitating clouds, J. Geophys. Res.-Atmos., 117, D11203, https://doi.org/10.1029/2011JD017125, 2012.
Fan, C., Wang, M., Rosenfeld, D., Zhu, Y., Liu, J., and Chen, B.: Strong Precipitation Suppression by Aerosols in Marine Low Clouds, Geophys. Res. Lett., 47, e2019GL086207, https://doi.org/10.1029/2019GL086207, 2020.
Fan, J., Rosenfeld, D., Zhang, Y., Giangrande, S. E., Li, Z., Machado, L. A. T., Martin, S. T., Yang, Y., Wang, J., Artaxo, P., Barbosa, H. M. J., Braga, R. C., Comstock, J. M., Feng, Z., Gao, W., Gomes, H. B., Mei, F., Pöhlker, C., Pöhlker, M. L., Pöschl, U., and de Souza, R. A. F.: Substantial convection and precipitation enhancements by ultrafine aerosol particles, Science, 359, 411–418, https://doi.org/10.1126/science.aan8461, 2018.
Gelaro, R., McCarty, W., Suárez, M. J., Todling, R., Molod, A., Takacs, L., Randles, C. A., Darmenov, A., Bosilovich, M. G., Reichle, R., Wargan, K., Coy, L., Cullather, R., Draper, C., Akella, S., Buchard, V., Conaty, A., da Silva, A. M., Gu, W., Kim, G.-K., Koster, R., Lucchesi, R., Merkova, D., Nielsen, J. E., Partyka, G., Pawson, S., Putman, W., Rienecker, M., Schubert, S. D., Sienkiewicz, M., and Zhao, B.: The Modern-Era Retrospective Analysis for Research and Applications, Version 2 (MERRA-2), J. Climate, 30, 5419–5454, https://doi.org/10.1175/JCLI-D-16-0758.1, 2017.
GMAO (Global Modeling and Assimilation Office): tavg1_2d_aer_Nx: MERRA-2 Aerosol Diagnostics 1-hourly (single level, 0.625×0.5), version 5.12.4, Greenbelt, MD, USAm Goddard Space Flight Center Distributed Active Archive Center (GSFC DAAC) [data set], https://doi.org/10.5067/KLICLTZ8EM9D, 2015.
Guo, J., Su, T., Chen, D., Wang, J., Li, Z., Lv, Y., Guo, X., Liu, H., Cribb, M., and Zhai, P.: Declining Summertime Local-Scale Precipitation Frequency Over China and the United States, 1981–2012: The Disparate Roles of Aerosols, Geophys. Res. Lett., 46, 13281–13289, https://doi.org/10.1029/2019GL085442, 2019.
Hastings, D. and Paula, K.: Global Land One-kilometer Base Elevation (GLOBE) Digital Elevation Model, Documentation, Volume 1.0, Key to Geophysical Records Documentation (KGRD) 34. National Oceanic and Atmospheric Administration, National Geophysical Data Center [data set], 325 Broadway, Boulder, Colorado 80303, USA, https://www.ngdc.noaa.gov/mgg/topo/gltiles.html (last access: 28 January 2025), 1999.
Hersbach, H., Bell, B., Berrisford, P., Biavati, G., Horányi, A., Muñoz Sabater, J., Nicolas, J., Peubey, C., Radu, R., Rozum, I., Schepers, D., Simmons, A., Soci, C., Dee, D., and Thépaut, J.-N. : ERA5 hourly data on single levels from 1940 to present, Copernicus Climate Change Service (C3S) Climate Data Store (CDS) [data set], https://doi.org/10.24381/cds.adbb2d47, 2023a.
Hersbach, H., Bell, B., Berrisford, P., Biavati, G., Horányi, A., Muñoz Sabater, J., Nicolas, J., Peubey, C., Radu, R., Rozum, I., Schepers, D., Simmons, A., Soci, C., Dee, D., and Thépaut, J.-N.: ERA5 hourly data on pressure levels from 1940 to present, Copernicus Climate Change Service (C3S) Climate Data Store (CDS) [data set], https://doi.org/10.24381/cds.bd0915c6, 2023b.
Huang, H., Zhao, K., Fu, P., Chen, H., Chen, G., and Zhang, Y.: Validation of Precipitation Measurements From the Dual-Frequency Precipitation Radar Onboard the GPM Core Observatory Using a Polarimetric Radar in South China, IEEE T. Geosci. Remote, 60, 1–16, https://doi.org/10.1109/TGRS.2021.3118601, 2021.
Iguchi, T., Seto, S., Meneghini, R., Yoshida, N., Awaka, J., and Kubota, T.: GPM/DPR level-2 algorithm theoretical basis document, NASA Goddard Space Flight Center, Greenbelt, MD, USA, Tech. Rep. [data set], https://disc.gsfc.nasa.gov/datasets/GPM_2ADPR_07/summary (last access: 28 January 2025), 2017.
Jiang, M., Li, Z., Wan, B., and Cribb, M.: Impact of aerosols on precipitation from deep convective clouds in eastern China, J. Geophys. Res.-Atmos., 121, 9607–9620, https://doi.org/10.1002/2015JD024246, 2016.
Koren, I., Dagan, G., and Altaratz, O.: From aerosol-limited to invigoration of warm convective clouds, Science, 344, 1143–1146, https://doi.org/10.1126/science.1252595, 2014.
Kumjian, M. R., Khain, A. P., Benmoshe, N., Ilotoviz, E., Ryzhkov, A. V., and Phillips, V. T. J.: The Anatomy and Physics of ZDR Columns: Investigating a Polarimetric Radar Signature with a Spectral Bin Microphysical Model, J. Appl. Meteorol. Clim., 53, 1820–1843, https://doi.org/10.1175/JAMC-D-13-0354.1, 2014.
Lang, F., Huang, Y., Protat, A., Truong, S. C. H., Siems, S. T., and Manton, M. J.: Shallow Convection and Precipitation Over the Southern Ocean: A Case Study During the CAPRICORN 2016 Field Campaign, J. Geophys. Res.-Atmos., 126, e2020JD034088, https://doi.org/10.1029/2020JD034088, 2021.
Li, Z., Niu, F., Fan, J., Liu, Y., Rosenfeld, D., and Ding, Y.: Long-term impacts of aerosols on the vertical development of clouds and precipitation, Nat. Geosci., 4, 888–894, https://doi.org/10.1038/ngeo1313, 2011.
Liu, C. and Zipser, E. J.: “Warm Rain” in the Tropics: Seasonal and Regional Distributions Based on 9 yr of TRMM Data, J. Clim., 22, 767–779, https://doi.org/10.1175/2008JCLI2641.1, 2009.
Liu, C. and Zipser, E.: Regional variation of morphology of organized convection in the tropics and subtropics, J. Geophys. Res.-Atmos., 118, 453–466, https://doi.org/10.1029/2012JD018409, 2013.
Liu, F., Mao, F., Rosenfeld, D., Pan, Z., Zang, L., Zhu, Y., Yin, J., and Gong, W.: Opposing comparable large effects of fine aerosols and coarse sea spray on marine warm clouds, Communications Earth & Environment, 3, 232, https://doi.org/10.1038/s43247-022-00562-y, 2022.
Lolli, S., Sicard, M., Amato, F., Comeron, A., Gíl-Diaz, C., Landi, T. C., Munoz-Porcar, C., Oliveira, D., Dios Otin, F., Rocadenbosch, F., Rodriguez-Gomez, A., Alastuey, A., Querol, X., and Reche, C.: Climatological assessment of the vertically resolved optical and microphysical aerosol properties by lidar measurements, sunphotometer, and in-situ observations over 17 years at UPC Barcelona, EGUsphere [preprint], https://doi.org/10.5194/egusphere-2023-893, 2023.
Mi, J., Yang, Y, Zhou, S., Ma, X., and Wei, S.: Exploring impacts of aerosol on convective cloud using satellite remote sensing and machine learning, J. Appl. Remote Sens., 18, 012007, https://doi.org/10.1117/1.JRS.18.012007, 2024.
Miltenberger, A. K., Field, P. R., Hill, A. A., Rosenberg, P., Shipway, B. J., Wilkinson, J. M., Scovell, R., and Blyth, A. M.: Aerosol–cloud interactions in mixed-phase convective clouds – Part 1: Aerosol perturbations, Atmos. Chem. Phys., 18, 3119–3145, https://doi.org/10.5194/acp-18-3119-2018, 2018.
Molod, A., Takacs, L., Suarez, M., and Bacmeister, J.: Development of the GEOS-5 atmospheric general circulation model: evolution from MERRA to MERRA2, Geosci. Model Dev., 8, 1339–1356, https://doi.org/10.5194/gmd-8-1339-2015, 2015.
Ou, Y., Li, Z., Chen, C., Zhang, Y., Li, K., Shi, Z., Dong, J., Xu, H., Peng, Z., Xie, Y., and Luo, J.: Evaluation of MERRA-2 Aerosol Optical and Component Properties over China Using SONET and PARASOL/GRASP Data, Remote Sens.-Basel, 14, 821, https://doi.org/10.3390/rs14040821b, 2022.
Pan, Z., Mao, F., Rosenfeld, D., Zhu, Y., Zang, L., Lu, X., Thornton, J. A., Holzworth, R. H., Yin, J., Efraim, A., and Gong, W.: Coarse sea spray inhibits lightning, Nat. Commun., 13, 4289, https://doi.org/10.1038/s41467-022-31714-5, 2022.
Radhakrishna, B., Satheesh, S., Narayana Rao, T., Saikranthi, K., and Sunilkumar, K.: Assessment of DSDs of GPM-DPR with ground-based disdrometer at seasonal scale over Gadanki, India, J. Geophys. Res.-Atmos., 121, 11792–11802, https://doi.org/10.1002/2015JD024628, 2016.
Randles, C. A., Da Silva, A. M., Buchard, V., Colarco, P. R., Darmenov, A., Govindaraju, R., Smirnov, A., Holben, B., Ferrare, R., Hair, J., Shinozuka, Y., and Flynn, C. J.: The MERRA-2 Aerosol Reanalysis, 1980 – onward, Part I: System Description and Data Assimilation Evaluation, J. Climate, 30, 6823–6850, https://doi.org/10.1175/jcli-d-16-0609.1, 2017.
Rosenfeld, D., Lohmann, U., Raga, G. B., O'Dowd, C. D., Kulmala, M., Fuzzi, S., Reissell, A., and Andreae, M. O.: Flood or Drought: How Do Aerosols Affect Precipitation?, Science, 321, 1309–1313, https://doi.org/10.1126/science.1160606, 2008.
Short, D. A. and Nakamura, K.: TRMM Radar Observations of Shallow Precipitation over the Tropical Oceans, J. Clim., 13, 4107–4124, https://doi.org/10.1175/1520-0442(2000)013<4107:TROOSP>2.0.CO;2, 2000.
Smalley, K. M. and Rapp, A. D.: The Role of Cloud Size and Environmental Moisture in Shallow Cumulus Precipitation, J. Appl. Meteorol. Clim., 59, 535–550, https://doi.org/10.1175/JAMC-D-19-0145.1, 2020.
Sun, E., Che, H., Xu, X., Wang, Z., Lu, C., Gui, K., Zhao, H., Zheng, Y., Wang, Y., Wang, H., Sun, T., Liang, Y., Li, X., Sheng, Z., An, L., Zhang, X., and Shi, G.: Variation in MERRA-2 aerosol optical depth over the Yangtze River Delta from 1980 to 2016, Theor. Appl. Climatol., 136, 363–375, 2019a.
Sun, E., Xu, X., Che, H., Tang, Z., Gui, K., An, L., Lu, C., and Shi, G.: Variation in MERRA-2 aerosol optical depth and absorption aerosol optical depth over China from 1980 to 2017, J. Atmos. Sol.-Terr. Phy., 186, 8–19, https://doi.org/10.1016/j.jastp.2019.01.019, 2019b.
Sun, N., Fu, Y., Zhong, L., and Li, R.: Aerosol effects on the vertical structure of precipitation in East China, npj Climate and Atmospheric Science, 5, 60, https://doi.org/10.1038/s41612-022-00284-0, 2022.
Sun, Y. and Zhao, C.: Distinct impacts on precipitation by aerosol radiative effect over three different megacity regions of eastern China, Atmos. Chem. Phys., 21, 16555–16574, https://doi.org/10.5194/acp-21-16555-2021, 2021.
Wang, M., Zhao, K., Xue, M., Zhang, G., Liu, S., Wen, L., and Chen, G.: Precipitation microphysics characteristics of a Typhoon Matmo (2014) rainband after landfall over eastern China based on polarimetric radar observations, J. Geophys. Res.-Atmos., 121, 12415–12433, https://doi.org/10.1002/2016JD025307, 2016.
Xiao, Z., Zhu, S., Miao, Y., Yu, Y., and Che, H.: On the relationship between convective precipitation and aerosol pollution in North China Plain during autumn and winter, Atmos. Res., 271, 106120, https://doi.org/10.1016/j.atmosres.2022.106120, 2022.
Yang, Y., Wang, R., Chen, F., Liu, C., Bi, X., and Huang, M.: Synoptic weather patterns modulate the frequency, type and vertical structure of summer precipitation over Eastern China: A perspective from GPM observations, Atmos. Res., 249, 105342, https://doi.org/10.1016/j.atmosres.2020.105342, 2021.
Yuan, T., Remer, L. A., Pickering, K. E., and Yu, H.: Observational evidence of aerosol enhancement of lightning activity and convective invigoration, Geophys. Res. Lett., 38, L04701, https://doi.org/10.1029/2010GL046052, 2011.
Zhang, A., Chen, Y., Zhang, X., Zhang, Q., and Fu, Y.: Structure of Cyclonic Precipitation in the Northern Pacific Storm Track Measured by GPM DPR, J. Hydrometeorol., 21, 227–240, https://doi.org/10.1175/JHM-D-19-0161.1, 2020a.
Zhang, Y., Yu, F., Luo, G., Chen, J.-P., and Chou, C. C. K.: Impact of Mineral Dust on Summertime Precipitation Over the Taiwan Region, J. Geophys. Res.-Atmos., 125, e2020JD033120, https://doi.org/10.1029/2020JD033120, 2020b.
Zheng, Z., Zhao, C., Lolli, S., Wang, X., Wang, Y., Ma, X., Li, Q., and Yang, Y.: Diurnal variation of summer precipitation modulated by air pollution: observational evidences in the beijing metropolitan area, Environ. Res. Lett., 15, 094053, https://doi.org/10.1088/1748-9326/ab99fc, 2020.