the Creative Commons Attribution 4.0 License.
the Creative Commons Attribution 4.0 License.
 | 04 Feb 2025
Impacts of meteorology and emission reductions on haze pollution during the lockdown in the North China Plain
Lang Liu
Xin Long
Yi Li
Zengliang Zang
Fengwen Wang
Yan Han
Zhier Bao
Yang Chen
Tian Feng
Jinxin Yang
Haze events in the North China Plain (NCP) during the COVID-19 lockdown underscore the intricate challenges of air quality management amid reduced human activities. Utilizing the WRF-Chem model, we explored how sharp emission reductions and varying meteorological conditions influenced fine-particulate-matter (PM2.5) concentrations across the NCP. Our analysis highlights a marked regional contrast: in the northern NCP (NNCP), adverse meteorology largely offset emission reductions, resulting in PM2.5 increases of 30 to 60 µg m−3 during haze episodes. Conversely, the southern NCP (SNCP) benefited from favorable meteorological conditions that, combined with emission reductions, lowered PM2.5 by 20 to 40 µg m−3. These findings emphasize the critical role of meteorology in shaping the air quality response to emission changes, particularly in regions like the NNCP, where unfavorable weather patterns can counteract the benefits of emission reductions. Our study provides valuable insights into the complex interplay of emissions, meteorology, and pollutant dynamics, suggesting that adequate air quality strategies must integrate emission controls and meteorological considerations to address regional variations effectively.
- Article
(9933 KB) - Full-text XML
-
Supplement
(4449 KB) - BibTeX
- EndNote


Fine particulate matter (PM2.5) is a critical issue for both policymakers and the general public due to its widespread presence and adverse impacts on human health (Lelieveld et al., 2018), agriculture productivity (Dong and Wang, 2023), and the Earth's radiation balance (Li et al., 2022; Yang et al., 2021). The formation and accumulation of anthropogenic PM2.5 result from a complex interaction of emission sources, atmospheric chemical processes, and meteorological conditions (Le et al., 2020). Beyond significant local primary emissions and secondary chemical formation, stagnant meteorological conditions and regional transport significantly contribute to severe haze pollution events (Feng et al., 2020; Li et al., 2021). Since implementing air quality regulations, China has dramatically reduced anthropogenic emissions, leading to a notable decline in PM2.5 levels and overall improvements in air quality (Xiao et al., 2020; Zhang et al., 2019). For instance, the Beijing–Tianjin–Hebei (BTH) region witnessed a decline in the number of days with severe PM2.5 pollution from 122 d in 2013 to 31 d in 2017 (Li et al., 2019). Despite these improvements, severe PM2.5 pollution events still occur. Research has demonstrated that adverse meteorological conditions often play a dominant role in influencing PM2.5 concentrations in North China (Le et al., 2020; Shen et al., 2024; Wang et al., 2020), frequently offsetting the positive effects of emission reductions.
The coronavirus disease 2019 (COVID-19) pandemic, which, at the time of writing, had persisted for over 4.5 years, resulted in more than 7 million deaths globally by June 2023 (WHO, 2024). In response to the initial outbreak, the Chinese government enforced stringent lockdowns nationwide during the first 2 months of 2020 to limit the virus's spread (Le et al., 2020). These measures led to a sharp decline in anthropogenic emissions, particularly from the transportation sector (Liu et al., 2021; Xu et al., 2020a). However, during the period from 21 January to 16 February 2020, the North China Plain (NCP) experienced severe haze pollution, in stark contrast to other regions (Huang et al., 2021; Le et al., 2020; Wang et al., 2021). This unusual event in the NCP, occurring during a time of reduced human activity, provides a unique opportunity to study the complex interactions between atmospheric chemistry and meteorology under these exceptional conditions.
Recent research on the above haze event in China has highlighted that the unexpected regional haze formation during the COVID-19 lockdown was primarily driven by complex atmospheric chemical processes influenced by both emission reductions and meteorological factors (Ding et al., 2021; Li et al., 2021). Specifically, the sharp decline in NO2 emissions during the lockdown led to elevated O3 levels and increased nighttime formation of NO3 radicals, which boosted the atmospheric oxidation capacity and promoted the generation of secondary aerosols. Furthermore, anomalously high relative humidity during this period facilitated heterogeneous chemical reactions, further contributing to aerosol formation (Huang et al., 2021; Le et al., 2020; Ma et al., 2022). Once formed, these secondary aerosols were transported to monitoring stations in northern China, exacerbating local pollution levels (Lv et al., 2020). Some studies have emphasized that elevated ambient humidity is crucial in enhancing nitrate aerosols' formation efficiency – a key haze component – by influencing pH levels (Chang et al., 2020; Sun et al., 2020). In addition to these chemical interactions, the aerosol–planetary boundary layer (PBL) feedback mechanism is also believed to have significantly contributed to the haze event (Su et al., 2020). Overall, meteorological conditions influenced the formation, accumulation, and dispersion of PM2.5 during this period. However, the precise interactions between air pollutants, atmospheric chemistry, and their responses to emissions and meteorological conditions have not been determined.
In this study, we utilized the WRF-Chem model to evaluate the effects of meteorological conditions and abrupt reductions in anthropogenic emissions on PM2.5 levels in the NCP. We emphasize the localized differences in how meteorological conditions and emission reductions affect air quality within the North China Plain, specifically between the northern North China Plain (NNCP) and southern North China Plain (SNCP). Utilizing the WRF-Chem model, we conducted detailed sensitivity experiments that allowed us to isolate and quantify the individual and combined impacts of emissions and meteorology on air quality, which can deepen our understanding of air quality dynamics in different regional contexts. We addressed three critical questions by simulating severe air pollution episodes during the COVID-19 lockdown:
-
How do sudden emission reductions affect PM2.5 levels under varying meteorological scenarios?
-
What are the critical drivers of PM2.5 formation and accumulation during these emission reductions?
-
How do meteorological conditions interact with lowered emissions to shape air quality outcomes?
Through this analysis, we aim to offer valuable insights into the effectiveness of short-term emission control strategies and to explore the implications of future low-emission scenarios by examining the combined effects of meteorological variations and emission reductions on PM2.5 concentrations.
2.1 Datasets
The NCP encompasses 11 provinces and municipalities. This study focused on two sub-regions: the NNCP and the SNCP. We defined these regions by thoroughly analyzing geographical features, weather conditions, and emission sources. The NNCP, which generally includes the cities in the Beijing–Tianjin–Hebei (BTH) area, is surrounded by mountains and elevated terrain to the north and west. These features make it harder for pollutants to disperse, leading to pollutant buildup, especially in winter when stagnant atmospheric conditions dominate (Feng et al., 2020; Li et al., 2019). On the other hand, the SNCP is characterized by lower elevations and broad plains, which help disperse pollutants due to more favorable wind patterns and higher planetary boundary layer heights (Huang et al., 2021). The emissions in these two regions also differ significantly. The NNCP is mainly affected by concentrated urban and industrial emissions from the BTH area. At the same time, the SNCP has a broader variety of sources, including industrial and agricultural emissions, creating a more diverse pollutant profile (Zheng et al., 2021). These differences in geography, weather, and emissions provide a basis for studying how meteorological factors and emission reductions affect air quality differently across the NCP (Fig. 1). By examining these sub-regions separately, we can better understand how air quality interventions vary in effectiveness across different areas.
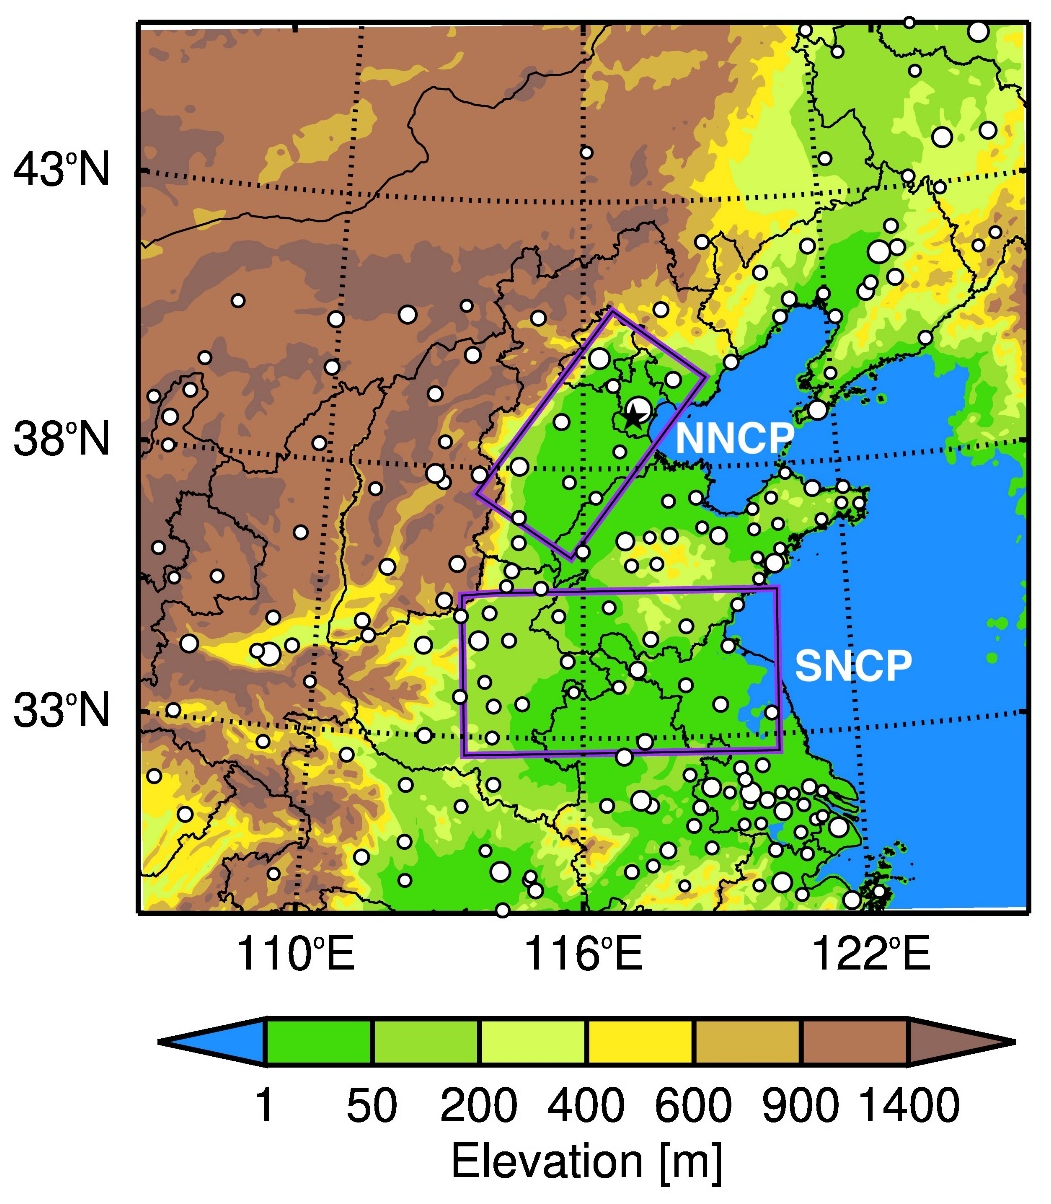
Figure 1The simulation domain in WRF-Chem, including topography. Circles represent the locations of cities with ambient air quality monitoring sites, with circle size reflecting the number of monitoring sites per city. The IAP observation site is marked with a black star. The regions of interest, NNCP (northern North China Plain) and SNCP (southern North China Plain), are highlighted.
We used two types of air quality data in this study. The first dataset, which has been available since 2013, consists of hourly air quality data provided by the Ministry of Ecology and Environment of China. This dataset includes hourly PM2.5, O3, NO2, SO2, and CO concentrations from 823 national monitoring sites across 185 cities in the study area. Specifically, the NNCP contains 10 cities with 65 measurement sites, while the SNCP includes 24 cities with 95 sampling sites (Fig. 1). The second dataset includes chemical compositions such as organic matter, nitrate, sulfate, and ammonium, collected at the Institute of Atmospheric Physics (IAP), Chinese Academy of Sciences in Beijing, China (39°58′28′′ N, 116°22′16′′ E). Detailed descriptions of the methods used to gather these chemical composition data are available in Sun et al. (2020).
We used the Multi-resolution Emission Inventory for China (MEIC), developed by Tsinghua University, with 2016 as the base year (http://meicmodel.org, last access: 3 February 2025). This emission inventory includes emissions from power plants, transportation, industry, agriculture, and residential activities, with data available at a monthly timescale and a spatial resolution of 6 km. We updated MEIC to reflect the total provincial emissions estimated for 2020, using near-real-time estimation (Zheng et al., 2021). While the total emissions for each province were updated, the spatial distribution of emissions within each province still followed the intensity proportions from the 2016 MEIC. Subsequently, we applied a top-down approach to further adjust the emission inventory, iteratively comparing model simulations with observed data to refine the estimates until the simulations closely matched the observations. We validated the final emission inventory using statistical parameters, including normalized mean bias (NMB), the index of agreement (IOA), and the correlation coefficient (r) (Sect. S1 in the Supplement). The simulated concentrations were first sampled at each observational site within the region. These site-specific concentrations were then averaged to calculate the regional mean for the NNCP and SNCP, respectively.
The spatial distribution of primary particles (PM2.5) and gaseous pollutants (CO, SO2, NOx, NH3, and HCHO) reveals significantly elevated emission levels across both the NNCP and the SNCP, particularly when compared to the less industrialized northwestern regions of the study area (Fig. S1 in the Supplement). These elevated emissions are primarily driven by dense urbanization and significant industrial activity (Zheng et al., 2021). The topographical features of the NCP, with higher elevations in the north and lower elevations in the south (Fig. 1), along with substantial pollutant emissions from southern regions, indicate that under persistent southerly winds, pollutants are efficiently transported northward. This northward movement exacerbates air quality degradation, contributing to severe haze episodes in the NNCP, intensifying regional air quality challenges and complicating mitigation efforts (Huang et al., 2021).
2.2 WRF-Chem model configuration and experiments
We employed a specific version (version 3.5.1) of the WRF-Chem model (Grell et al., 2005). We chose the WRF-Chem model because it can simulate coupled atmospheric processes, including emissions, transport, chemical transformations, and aerosol–cloud interactions. This “online” approach allows for dynamic feedback between meteorological conditions and air pollutants. It is well-suited for assessing the interplay between emission reductions and meteorology on PM2.5 concentrations during the COVID-19 lockdown period. The model's ability to simultaneously simulate meteorology and chemistry provides advantages over models that treat these processes separately, ensuring that interactions such as aerosol–radiation and aerosol–cloud effects are effectively captured (Li et al., 2011).
Further details regarding the model settings, initial and lateral meteorological and chemical fields, and anthropogenic and biogenic emission inventory are available in Sect. S1 in the Supplement. We used physical schemes of the WRF single-moment (WSM) six-class graupel microphysical scheme (Hong and Lim, 2006), the Mellor–Yamada–Janjić (MYJ) turbulent kinetic energy planetary boundary layer scheme (Janić, 2001), the unified Noah land-surface model (Chen and Dudhia, 2001), and the Monin–Obukhov surface layer scheme (Janić, 2001). Chemical schemes include the Models-3 CMAQ aerosol module (Binkowski and Roselle, 2003). Gas-phase reactions of volatile organic compounds (VOCs) and nitrogen oxide (NOx) use the Statewide Air Pollution Research Center version 1999 (SAPRC-99) chemical mechanism. Furthermore, the model includes effects such as organic coating on nitrate formation by suppressing the N2O5 heterogeneous hydrolysis uptake (Liu et al., 2020b), the reaction of stabilized Criegee intermediates (sCIs) with SO2 to form sulfate (Mauldin et al., 2012), and a parameterization of sulfate heterogeneous formation from SO2 involving Fe3+ catalyzed and irreversible uptake on aerosol liquid water surfaces (Li et al., 2017a). The Fast Tropospheric Ultraviolet and Visible (FTUV) radiation module calculates photolysis rates, and the model considers the interaction between aerosols and clouds (Li et al., 2011; Tie et al., 2003).
The simulation domain, centered at 38° N, 116° E, consisted of 300×300 horizontal grid cells with a 6 km resolution (Fig. 1). The vertical resolution consisted of 35 levels, extending from the surface to 50 hPa, allowing for a detailed representation of boundary layer processes and pollutant dispersion. The initial and boundary meteorological conditions were derived from the National Centers for Environmental Prediction (NCEP) Final (FNL) reanalysis data at a 1°×1° spatial resolution and 6 h temporal intervals (Kalnay et al., 2018). Chemical initial and boundary conditions were interpolated from the CAM-chem (Community Atmosphere Model with Chemistry) global chemistry model (Danabasoglu et al., 2020). The anthropogenic emissions inventory for 2020 was based on a bottom-up approach, incorporating near-real-time data (Zheng et al., 2021), and biogenic emissions were computed online using the Model of Emissions of Gases and Aerosols from Nature (MEGAN) (Guenther et al., 2006). For the episode simulations, the spin-up time is 3 d.
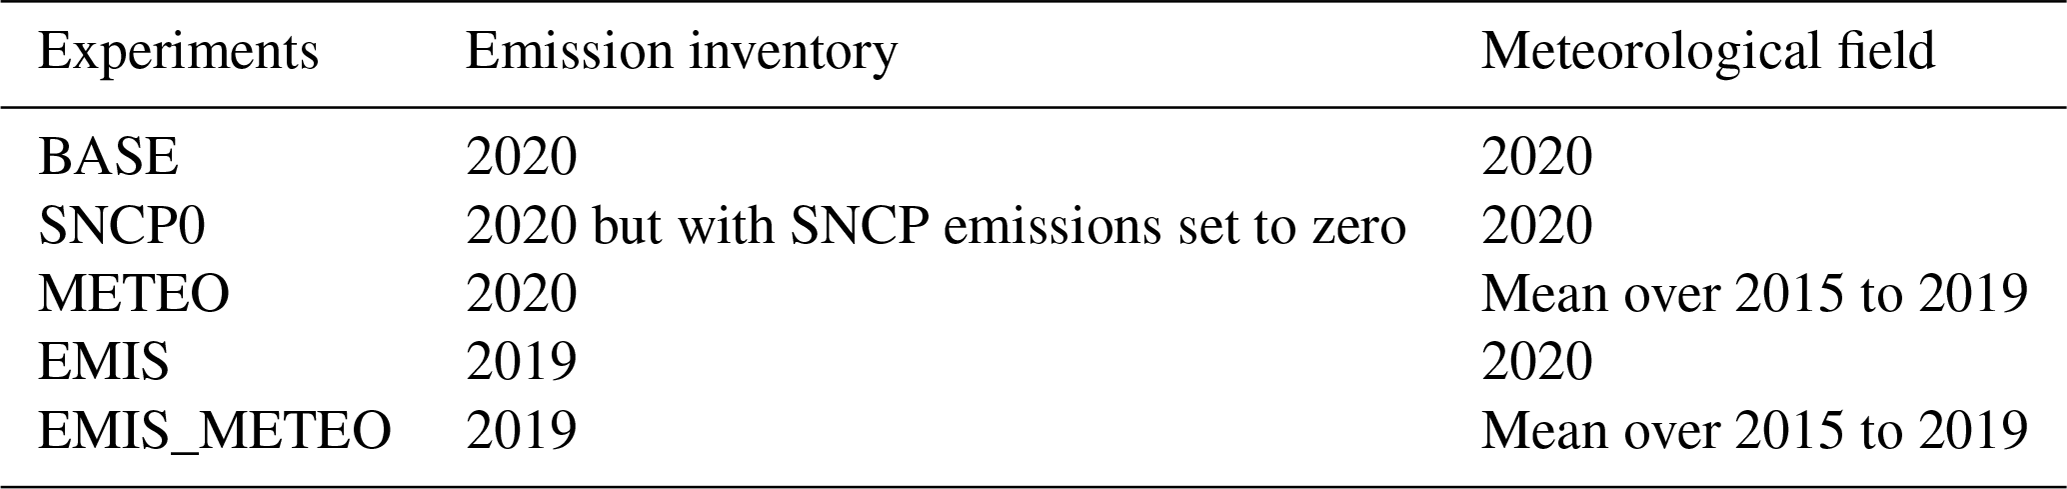
We designed five groups of numerical experiments, described in detail in Table 1. The first group is the baseline simulation, referred to as the BASE case, covering the period from 21 January to 16 February 2020. This simulation incorporates actual emissions and meteorological conditions during the COVID-19 lockdown period. The BASE case is characterized by reduced emissions, reflecting the unique environmental dynamics during the lockdown.
To quantify the influence of SNCP emissions on PM2.5 concentrations in NNCP, we also performed an additional sensitivity test (SNCP0) by setting SNCP emissions to zero within the BASE scenario. The other three groups are sensitivity simulations, which include the emission-condition-sensitive simulation (EMIS), the meteorology-condition-sensitive simulation (METEO), and the combined emission–meteorology-condition-sensitive simulation (EMIS_METEO). In the EMIS experiment, we used the anthropogenic emission inventory from the BASE case. Still, we excluded any abrupt decreases associated with anthropogenic emission reductions during the COVID-19 lockdown period in 2020, following the provincial emission reduction ratios provided by Huang et al. (2021) (Table S2). In the METEO case, we applied the same emission inventory as in the BASE case but with averaged meteorological conditions from 2015 to 2019. These mean meteorological fields were derived by averaging key meteorological variables (Sect. S2). For the EMIS_METEO case, we used the emission inventory from the EMIS case and the mean meteorological conditions from the METEO case.
The comparison between the BASE and EMIS cases allowed us to evaluate the impact of sudden reductions in anthropogenic emissions on PM2.5 levels. The comparison between the BASE and METEO cases provided a stable reference point by reducing the influence of anomalies or fluctuations in meteorological conditions from any year, enabling a comprehensive evaluation of the effects of meteorological factors on PM2.5 levels. Finally, comparing the BASE and EMIS_METEO cases enabled a thorough assessment of the combined impact of emission reductions and meteorological conditions on PM2.5 levels. Additionally, we analyzed the coupled effects between emission reductions and meteorological factors using a factor separation approach (Sect. S3).
3.1 Model performance
The temporal consistency between model simulations and observations is assessed using NMB and IOA (Table 2 and Figs. S2 and S3). For PM2.5 simulations, the average concentration in the NCP closely matched observations, with an NMB of −5.6 % and an IOA of 0.91 in the NNCP and an NMB of −2.1 % and an IOA of 0.86 in the SNCP. For gaseous pollutants, such as SO2, O3, NO2, and CO, the model effectively captured their diurnal concentration profiles in the NCP region, with IOAs exceeding 0.82 in the NNCP and 0.76 in the SNCP. The NMBs for these gaseous pollutants also agreed with observations, with IOAs remaining below 6 % in the NNCP and below 12 % in the SNCP.
Table 2The statistical parameters of model performance include temporal assessments of NMB and IOA in the NNCP and SNCP and at the IAP monitoring site.
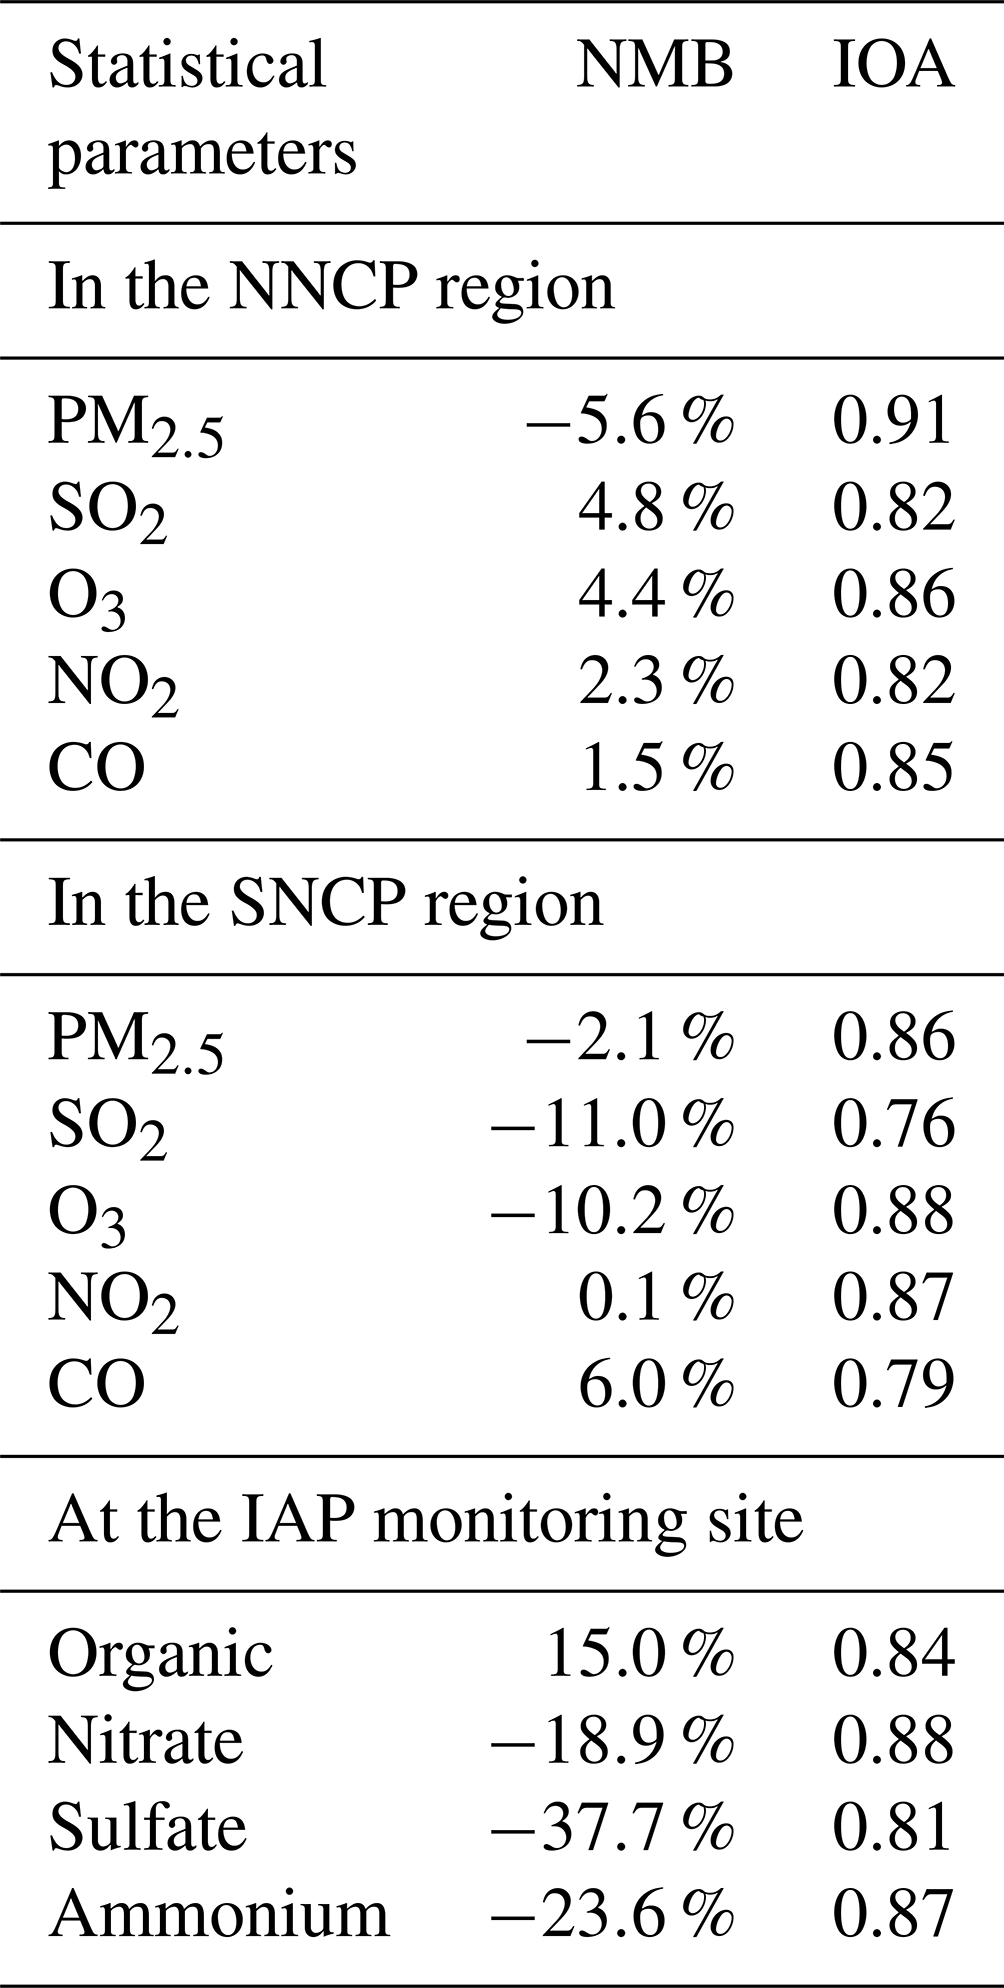
The simulated mass concentrations of PM2.5 components, including organic matter, nitrate, sulfate, and ammonium, at the IAP monitoring site, also effectively reproduced the temporal profiles of these chemical components, with IOAs exceeding 0.81. The model shows good agreement with organic matter and nitrate observations at the IAP observation site, with NMBs of 15.0 % and −18.9 %, respectively, and IOAs exceeding 0.84. However, sulfate is significantly underestimated, with an NMB of −37.7 %, which may be attributed to the model's incomplete representation of SO2 oxidation pathways, particularly through heterogeneous chemistry during haze events (Zheng et al., 2015) and the acidic aerosol environment (Guo et al., 2017; Liu et al., 2017). Since SO2, as a precursor of sulfate aerosols, is primarily emitted from point sources, such as power plants or industrial zones, its transport to observation sites is highly sensitive to uncertainties in wind field simulations, leading to substantial fluctuations in simulated SO2 and resultant sulfate aerosols. This underestimation in sulfate also affects ammonium concentrations ( %) due to its close association with sulfate and nitrate. On a regional scale, the model's good performance in SO2 simulation (NMB=4.8 % in the NNCP) does not entirely explain the sulfate underprediction, particularly near the IAP site, where local SO2 is underestimated by −12.1 % (Fig. S4). This local discrepancy suggests that WRF-Chem may inadequately capture oxidation processes such as aqueous-phase and metal-catalyzed reactions, leading to sulfate underestimation in urban areas with high pollution levels (Guo et al., 2017; Liu et al., 2017; Zheng et al., 2015). While the model effectively reproduces the temporal variability in critical components, the consistent underestimation of sulfate and ammonium indicates the need for further refinements in the representation of SO2 emissions and associated oxidation pathways (Cheng et al., 2016; Li et al., 2018).
The correlation coefficient indicates the spatial consistency of model simulations compared to observations (Fig. 2). During the episode, stagnant meteorological conditions with weak or calm winds led to unfavorable diffusion of atmospheric pollutants, accumulating and forming heavy haze pollution in the NCP region. The average simulated PM2.5 mass concentrations exceeded 100 µg m−3 in the SNCP and exceeded 120 µg m−3 in the NNCP (Fig. 2a). These results were consistent with observations, with a correlation coefficient of 0.91 (Fig. 2e). High O3 levels exceeding 80 µg m−3 were simulated over the NNCP region (Fig. 2c), which indicates an unexpectedly strong atmospheric oxidation capacity due to weakened titration from low NOx emissions during the period. During the episode, almost all avoidable outdoor human activities and most transportation were prohibited. As a result, the average simulated NO2 (Fig. 2b) and SO2 (Fig. 2d) mass concentrations remained very low in the urban areas of NCP, with values below 30 and 10 µg m−3, respectively. The spatial distributions of simulated and observed gaseous pollutants, averaged over the episode, demonstrated strong spatial consistency, with correlation coefficients (r) of 0.67 for O3, 0.86 for SO2, and 0.77 for NO2 across the research domain (Fig. 2e and f). This high consistency was also observed in the NNCP and SNCP regions (Fig. S5), with correlation coefficients for PM2.5 and O3 of 0.98 and 0.71 in the NNCP and 0.94 and 0.67 in the SNCP. Similarly, the correlation coefficients for SO2 and NO2 were 0.77 and 0.83 in the NNCP and 0.89 and 0.82 in the SNCP.
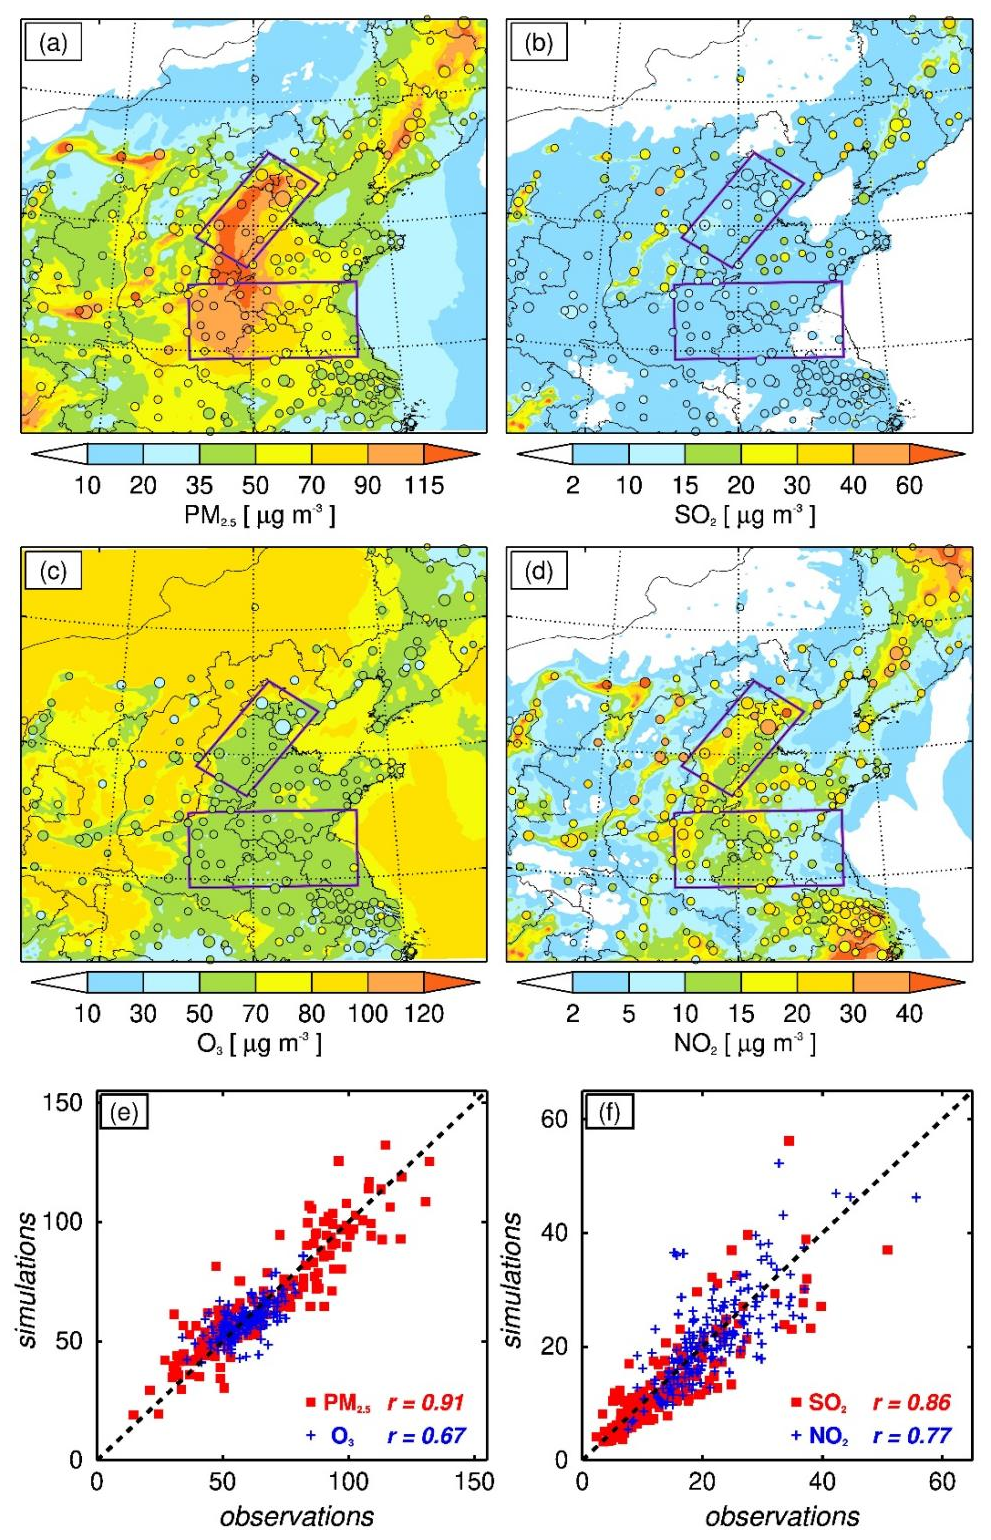
Figure 2The pattern comparisons between average observations and simulations for (a) PM2.5, (b) SO2, (c) O3, and (d) NO2. Additionally, statistical comparisons are presented for (e) PM2.5 and O3 and (f) SO2 and NO2, along with their correlation coefficients (r).
The day-to-day variations also show good consistency between the observed and simulated concentrations of PM2.5, O3, NO2, O2, and CO (Fig. 3). Despite some bias, the WRF-Chem model captures the temporal and spatial variations in PM2.5 and gaseous air pollutants in the BTH region, which suggests that the emission inventory and simulated meteorological factors are generally reasonable, providing a reliable basis for further assessment.
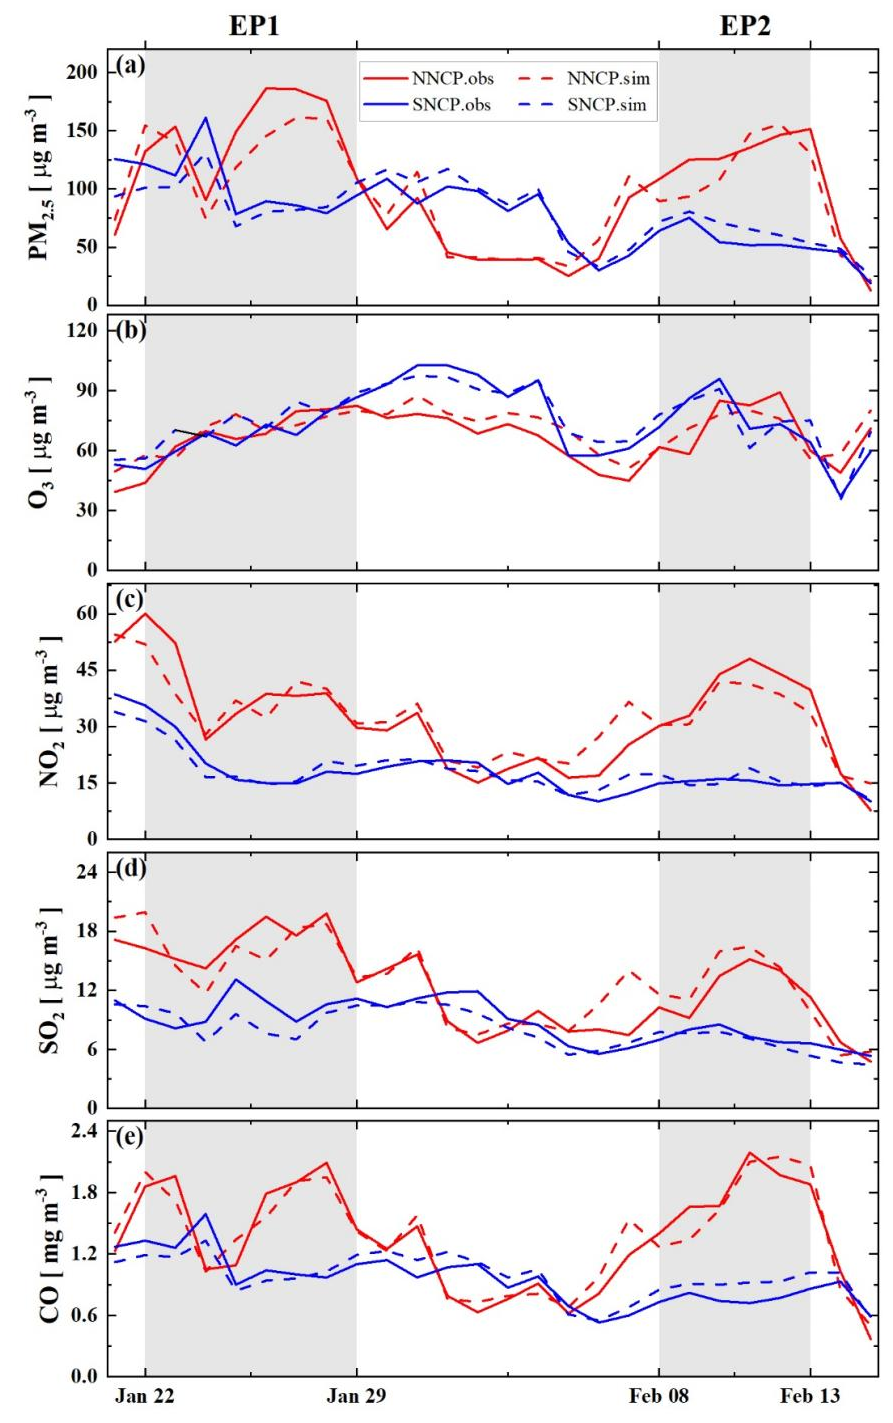
Figure 3Observed (solid lines) and simulated (dashed lines) day-to-day variations in surface PM2.5, O3, NO2, SO2, and CO levels in the NNCP (red lines) and SNCP (blue lines) from 21 January to 15 February 2020. The daily concentrations of the pollutants were calculated from the 24 h averages, except for O3, which was calculated from the 10:00 to 17:00 LT averages. Two haze episodes occurred during the study period: EP1 from 22 to 29 January and EP2 from 8 to 13 February.
3.2 Unexpected haze episodes in the NNCP
The COVID-19 pandemic lockdowns in China, which began in late January 2020, led to a sharp decline in socio-economic activities and a significant reduction in air pollutant emissions (Bao and Zhang, 2020; Liu et al., 2020a; Wang et al., 2020). In the NNCP, provincial emissions of NOx, SO2, and PM2.5 decreased by 38 %–45 %, 16 %–26 %, and 12 %–18 %, respectively (Huang et al., 2021). Observed concentrations of NO2 and SO2 significantly decreased to 30.8 and 13.5 µg m−3, respectively (Li et al., 2020; Zhao et al., 2020). Satellite observations from the TROPOMI instrument on Sentinel-5P captured a notable 65 % reduction in column-integrated NO2 over eastern China compared to the same period in 2019 (Bauwens et al., 2020; Shi and Brasseur, 2020).
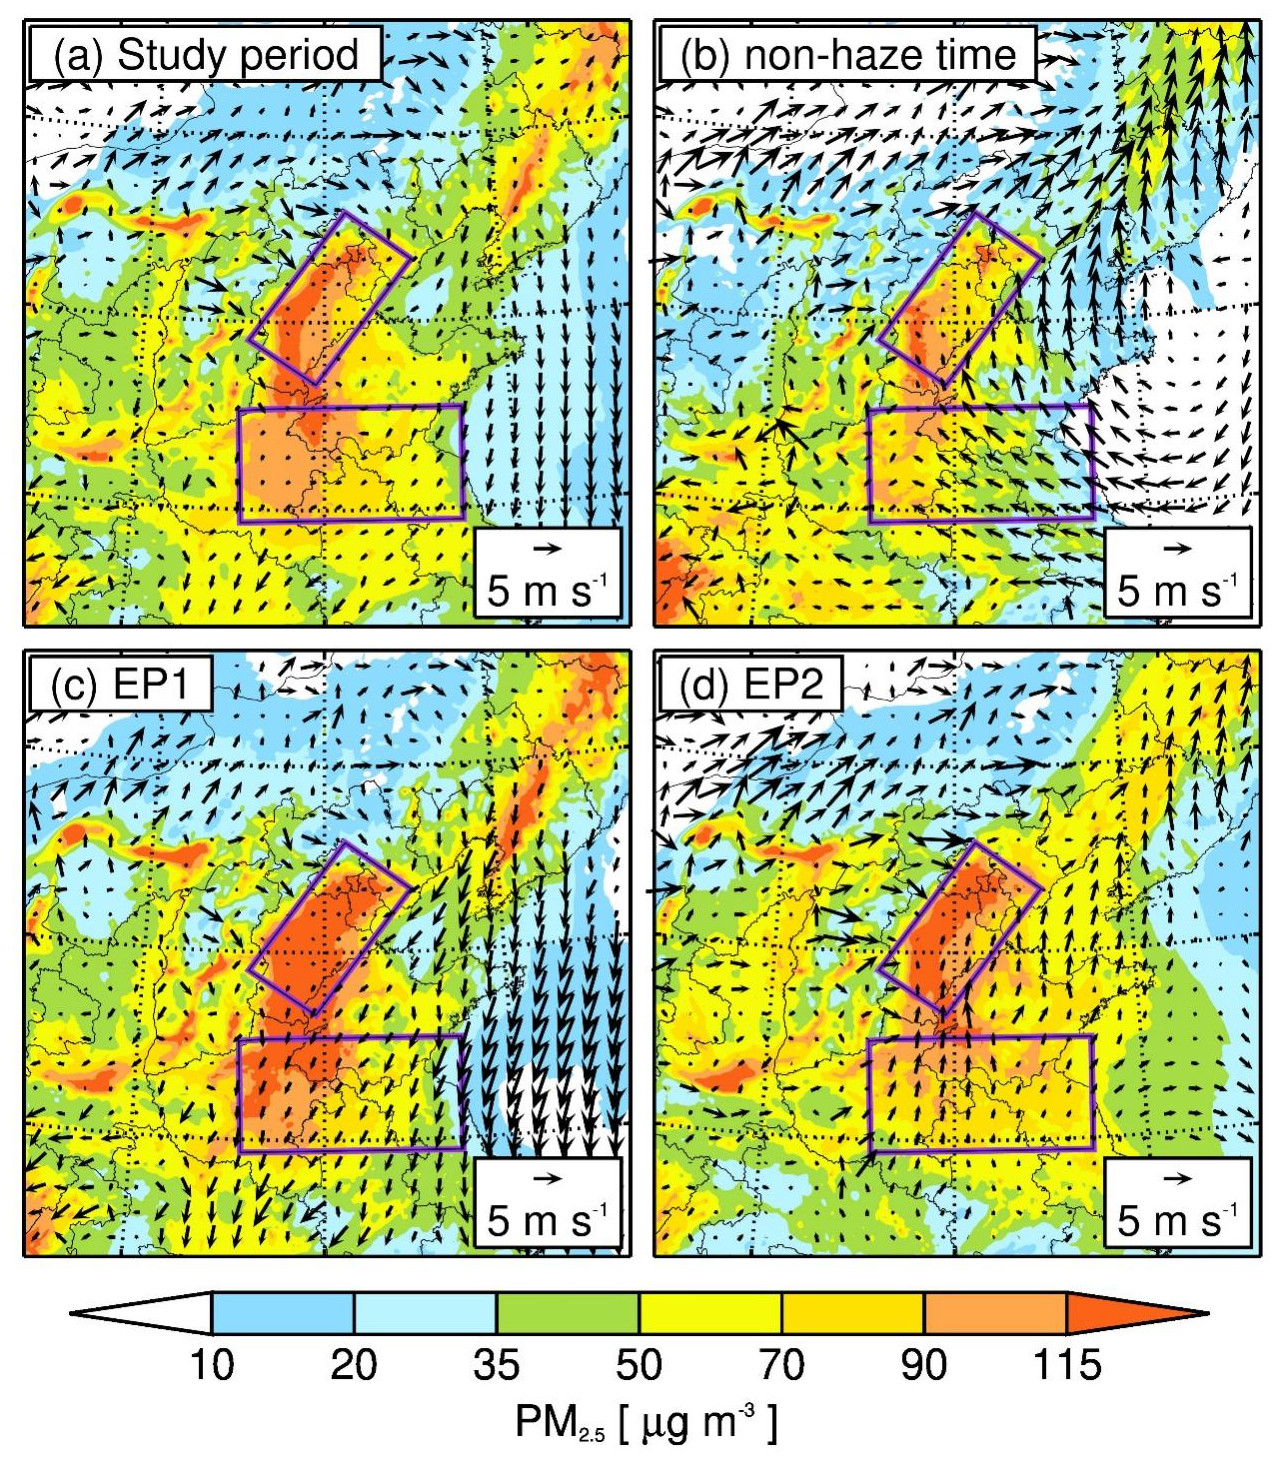
Figure 4The spatial patterns of near-surface simulated PM2.5 averaged from (a) the entire study period, (b) the non-haze period, (c) the EP1 haze period, and (d) the EP2 haze period, along with the simulated surface wind fields.
Despite the significant reduction in anthropogenic emissions and lower concentrations of NO2 and SO2, two unexpectedly heavy haze episodes occurred in the NNCP. Here, we defined haze events as periods when the daily average PM2.5 concentration in the NNCP exceeds 100 µg m−3. During the study period, two significant haze episodes were identified: EP1, lasting from 22 to 29 January, and EP2, lasting from 8 to 13 February. During EP1, the average PM2.5 concentration in the NNCP reached 153.4 µg m−3, peaking at approximately 185 µg m−3, significantly higher than in the SNCP, which peaked at around 120 µg m−3. In EP2, the average PM2.5 concentration in the NNCP reached 132.2 µg m−3, peaking at approximately 150 µg m−3. No haze was observed in SNCP during EP2, with average PM2.5 concentrations of 57.7 µg m−3 (Fig. 3).
During EP1, stagnant atmospheric conditions in the NNCP with wind speeds lower than 0.8 m s−1 (Figs. 4c and S6b and c), coupled with a low planetary boundary layer height (PBLH) of approximately 306 m (ranging from 190 to 454 m) (Fig. S6a), facilitated the accumulation of pollutants. Under these conditions, PM2.5 concentrations (Fig. 3a) reached peak values of around 150–200 µg m−3, and O3 concentrations (Fig. 3b) steadily increased, peaking at approximately 90 µg m−3. This trend indicates enhanced photochemical activity due to the stagnant conditions. Concurrently, NO2 concentrations (Fig. 3c) decreased, likely due to NO2 conversion to O3 and secondary aerosols. The consistently high levels of SO2 and CO (Fig. 3d and e) further indicated the limited dispersion under static atmospheric conditions. These conditions facilitated photochemical reactions, enhancing secondary pollution formation, as suggested by recent studies on secondary pollution during the COVID-19 lockdown (Huang et al., 2021).
In contrast, during EP2, the concentrations of PM2.5, O3, NO2, SO2, and CO (Fig. 3) exhibited bell-shaped-style fluctuating patterns, corresponding to the simultaneous increase and decrease in various pollutants. These fluctuating patterns indicate dynamic atmospheric conditions with significant air pollutant transport and mixing processes. The northward speeds of about 4.1 m s−1 in the SNCP facilitated the transport of air pollutants from the SNCP to the NNCP (Figs. 4d and S6b). Simultaneously, stagnant atmospheric conditions in the NNCP with wind speeds lower than 0.5 m s−1, corresponding to a low PBLH of 306 m (ranging from 209 to 458 m) (Fig. S6a), facilitated the accumulation of pollutants in the NNCP.
Overall, the contrasting atmospheric conditions during EP1 and EP2 underscore the complex interplay of meteorological factors and their significant impact on pollutant levels in the NNCP. The stagnant conditions during EP1 led to significant pollutant accumulation and secondary pollution formation, while the dynamic conditions during EP2 highlighted the role of regional pollutant transport in exacerbating haze episodes. These findings emphasize the need to consider local and regional atmospheric processes in air quality management strategies.
Reducing anthropogenic emissions has been a primary factor in decreasing PM2.5 pollution in China (Bao and Zhang, 2020; Liu et al., 2020a). However, these haze episodes in NNCP during the COVID-19 lockdown challenge the relationship between human activities and air quality. These unexpected haze episodes underscore the complexity of air quality dynamics, suggesting that factors such as meteorological conditions, secondary pollutant formation, regional transport, and non-industrial sources also significantly impact air quality (Huang et al., 2021; Liu et al., 2020a; Shi and Brasseur, 2020). Future air quality management strategies must incorporate these multifaceted interactions for more effective pollution control.
3.3 Meteorological conditions increase PM2.5 in NNCP and decrease it in SNCP
Meteorological factors significantly influenced PM2.5 concentrations during the study period, as illustrated by the pattern comparisons between the BASE and METEO simulations (Fig. 5a). Changes in PM2.5 concentrations ranged from decreases of up to 50 µg m−3 to increases exceeding 100 µg m−3, revealing an apparent north–south disparity. In the NNCP, meteorological conditions led to significant increases in PM2.5 concentrations, particularly in the northern regions, where levels rose by 50 to 100 µg m−3. In contrast, the SNCP, especially the western parts, experienced a decrease in PM2.5 levels by 30 to 50 µg m−3, reflecting the more favorable meteorological conditions that facilitated pollutant dispersion.
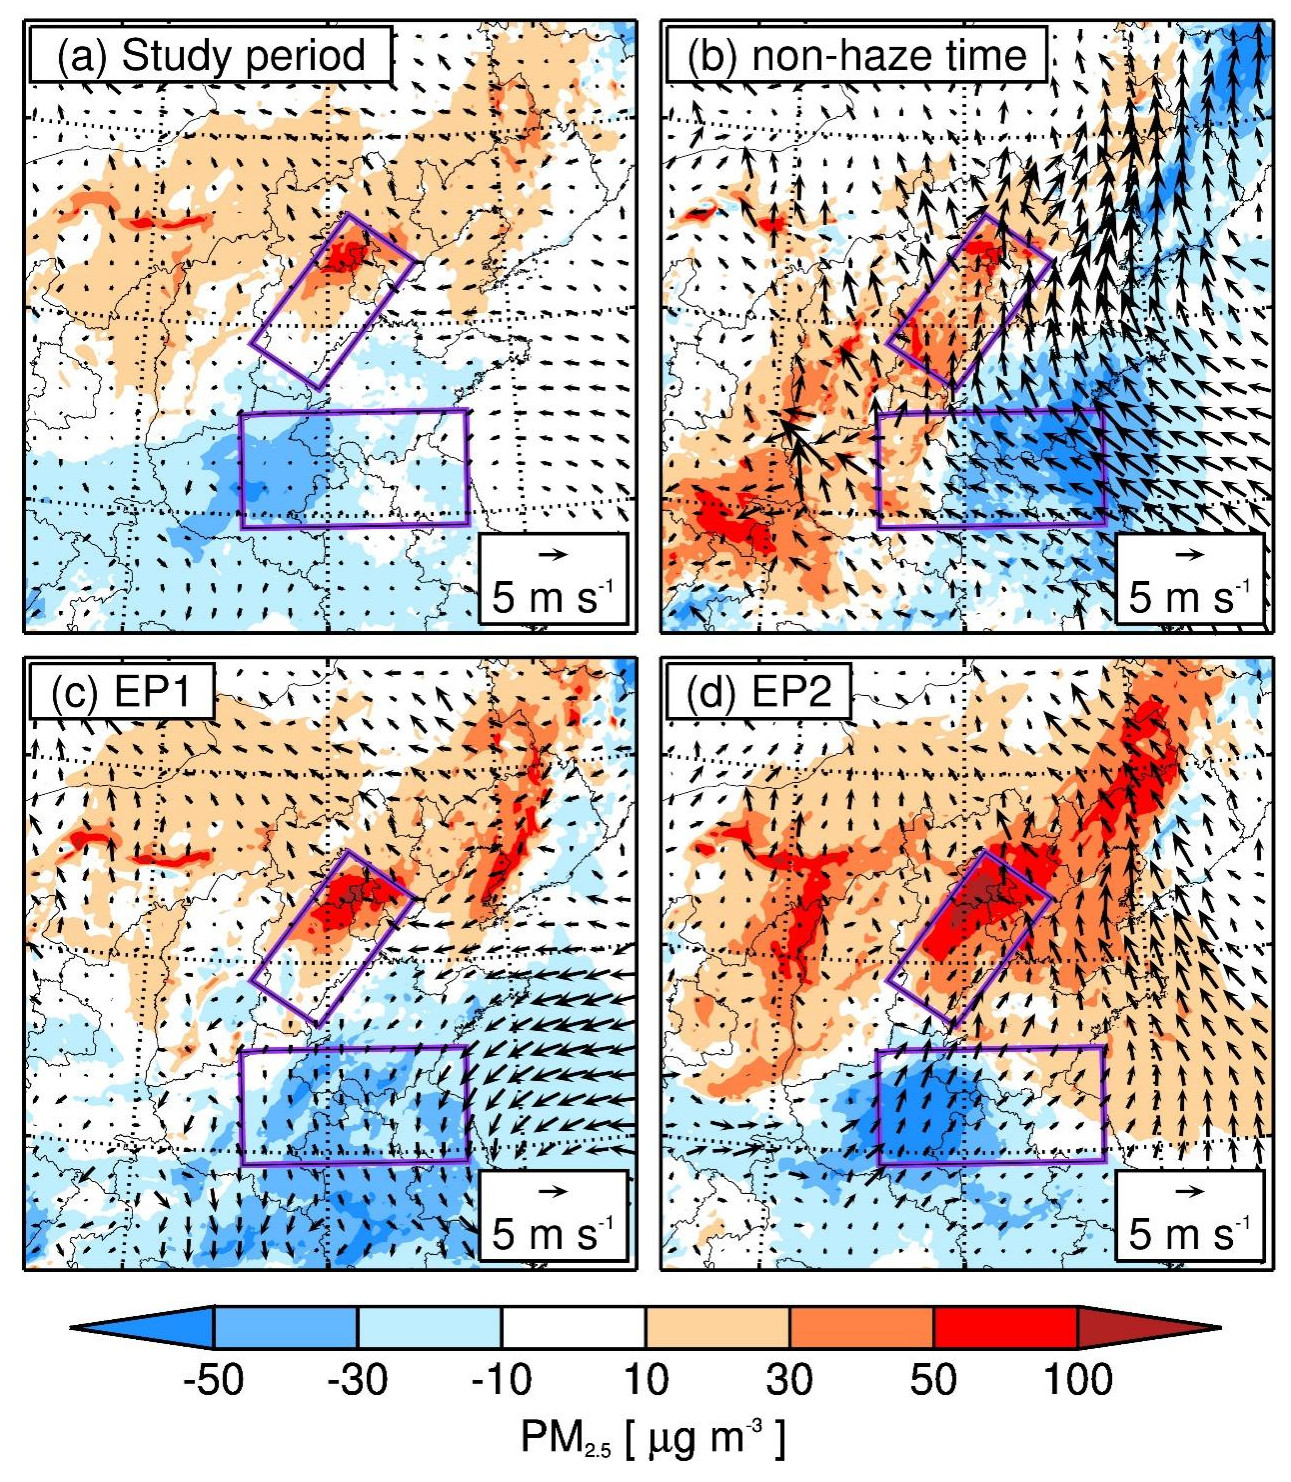
Figure 5The pattern comparisons of the BASE simulation minus the METEO simulation. The color gradient represents PM2.5 changes averaged from (a) the entire study period, (b) the non-haze period, (c) the EP1 haze period, and (d) the EP2 haze period, along with the simulated surface wind fields.
During haze episodes (EP1 and EP2), meteorological conditions had an even more pronounced effect. In EP1, PM2.5 concentrations in the NNCP increased by 30 to 100 µg m−3 (Fig. 5c), particularly in the central NNCP areas near the mountain foothills. Meanwhile, the SNCP benefited from reductions in PM2.5 concentrations of 30 to 50 µg m−3, suggesting that enhanced pollutant dispersion helped mitigate pollution in the southern region. The impact of meteorology was even more substantial during EP2, with PM2.5 increases in the NNCP exceeding 100 µg m−3 in some areas and reaching up to 150 µg m−3 in heavily affected regions (Fig. 5d). Low planetary boundary layer heights (PBLHs) and stagnant surface winds drove this increase, particularly in Beijing and its surrounding areas (Fig. S7c and d). Conversely, in the SNCP, reductions in PM2.5 concentrations of 30 to 50 µg m−3 were observed, aided by higher PBLH and stronger northward winds, which enhanced pollutant dispersion. Meanwhile, the comparison between the SNCP0 simulation (with SNCP emissions set to zero) and the BASE case demonstrated a substantial reduction in PM2.5 concentrations in the NNCP (Fig. S8), particularly during EP2. This reduction, ranging from 15 to 30 µg m−3 in some regions of the NNCP (Fig. S8b), provides direct evidence that SNCP emissions contribute significantly to PM2.5 accumulation in the NNCP via northward transport. This finding underscores the importance of regional transport, facilitated by northward winds, in elevating PM2.5 concentrations in the NNCP, especially under meteorological conditions that support pollutant movement from south to north.
During non-haze periods, weather conditions still significantly impacted PM2.5 levels across the region, though the effect was less intense than haze episodes. In the NNCP, stagnant air and low wind speeds led to PM2.5 increases of 10 to 30 µg m−3 (Fig. 5b). These weak conditions prevented effective pollutant dispersion, causing pollutants to accumulate, although less than during significant pollution events. This ongoing buildup due to poor weather shows the continued vulnerability of the NNCP to limited ventilation (Feng et al., 2021; Yan et al., 2024). In contrast, in the SNCP, weather conditions helped reduce PM2.5 by 10 to 30 µg m−3 (Fig. 5b). This improvement was mainly due to a higher PBLH (Fig. S7b) and stronger winds (Fig. 5b), which promoted pollutant dispersion. The PBLH rose by 100 to 300 m, allowing pollutants to spread vertically, leading to lower PM2.5 levels at the surface. Favorable winds also helped clear pollutants, enhancing the positive effects of meteorology on air quality. Previous studies have shown that regions with better dispersion conditions can achieve more significant air quality improvements, even with similar emissions, due to more efficient pollutant removal (Xu et al., 2020b; Zhang et al., 2021). These regional differences during non-haze periods show the critical role of weather in influencing air quality. In the NNCP, weak atmospheric circulation limited pollutant dispersion, causing moderate PM2.5 increases. In contrast, in the SNCP, more dynamic weather conditions promoted pollutant removal, leading to substantial reductions.
Regional variations in haze episodes underscore the critical role of elevated near-surface temperature (T2) and relative humidity (RH) in driving secondary aerosol formation (Fig. S9). In the NNCP, elevated T2 accelerates gas-phase oxidation reactions, converting volatile organic compounds (VOCs) and nitrogen oxides (NOx) into secondary organic aerosols (SOAs) and nitrate aerosols, thus contributing to increased PM2.5 levels despite reduced emissions (Huang et al., 2021; Seinfeld and Pandis, 2016). Similarly, elevated RH facilitates aqueous-phase reactions that convert SO2 into sulfate on particle surfaces, aided by aerosol liquid water, and this effect is particularly pronounced during haze episodes, where high RH accelerates sulfate formation even with decreased emissions (Le et al., 2020; Wang et al., 2020). The online WRF-Chem model captures these interactions in the EMIS_METEO simulation, integrating the effects of T2 and RH into the modeled PM2.5 concentrations. Although the study does not isolate each specific chemical pathway, the correlation between elevated T2, RH, and higher PM2.5 concentrations aligns with previous research and underscores the pivotal role of meteorological conditions in secondary aerosol formation. This finding highlights the importance of considering meteorological influences in addition to emission reductions, as unfavorable weather conditions can offset the expected improvements from reduced emissions and sustain elevated PM2.5 levels. This understanding is essential for developing effective air pollution control strategies that account for emissions and meteorological variability.
These meteorological effects also impact secondary aerosols, including secondary organic aerosols (SOAs) and secondary inorganic aerosols (SIAs), with substantial variability between the NNCP and SNCP regions. In the NNCP, stagnant conditions and reduced boundary layer heights limited pollutant dispersion, contributing to the accumulation of SOAs and SIAs. High humidity further exacerbated the formation of secondary aerosols, resulting in elevated concentrations (Fig. S10). Conversely, the SNCP benefited from a higher PBLH (Fig. S7) and dynamic wind patterns (Fig. 4a), which enhanced the dispersion of both primary and secondary aerosols, reducing their concentrations. Due to the very low emissions of biogenic secondary organic aerosol (BSOA) precursors during wintertime (Guenther et al., 2012), the BSOA contribution to PM2.5 concentrations is insignificant, averaging less than 2 µg m−3 throughout the study period (Fig. S11a). The average BSOA accounted for less than 2 % of total PM2.5 mass in the BASE simulations (Fig. S11b), indicating a minor role of biogenic emissions in shaping wintertime air quality.
3.4 Emission reduction decreases the PM2.5 in the NNCP and SNCP
Abrupt decreases in anthropogenic emissions during the COVID-19 lockdown led to significant reductions in PM2.5 concentrations across both the NNCP and the SNCP (Fig. 6a). Both regions experienced substantial PM2.5 decreases, contributing to improvements in air quality. In addition to the overall PM2.5 reductions, emission controls significantly impacted SOAs and SIAs in the NNCP and SNCP (Fig. S10b and d). The reductions in SOAs and SIAs were driven by decreased availability of precursors such as VOCs for SOAs and SO2 and NOx for SIAs (Huang et al., 2021).
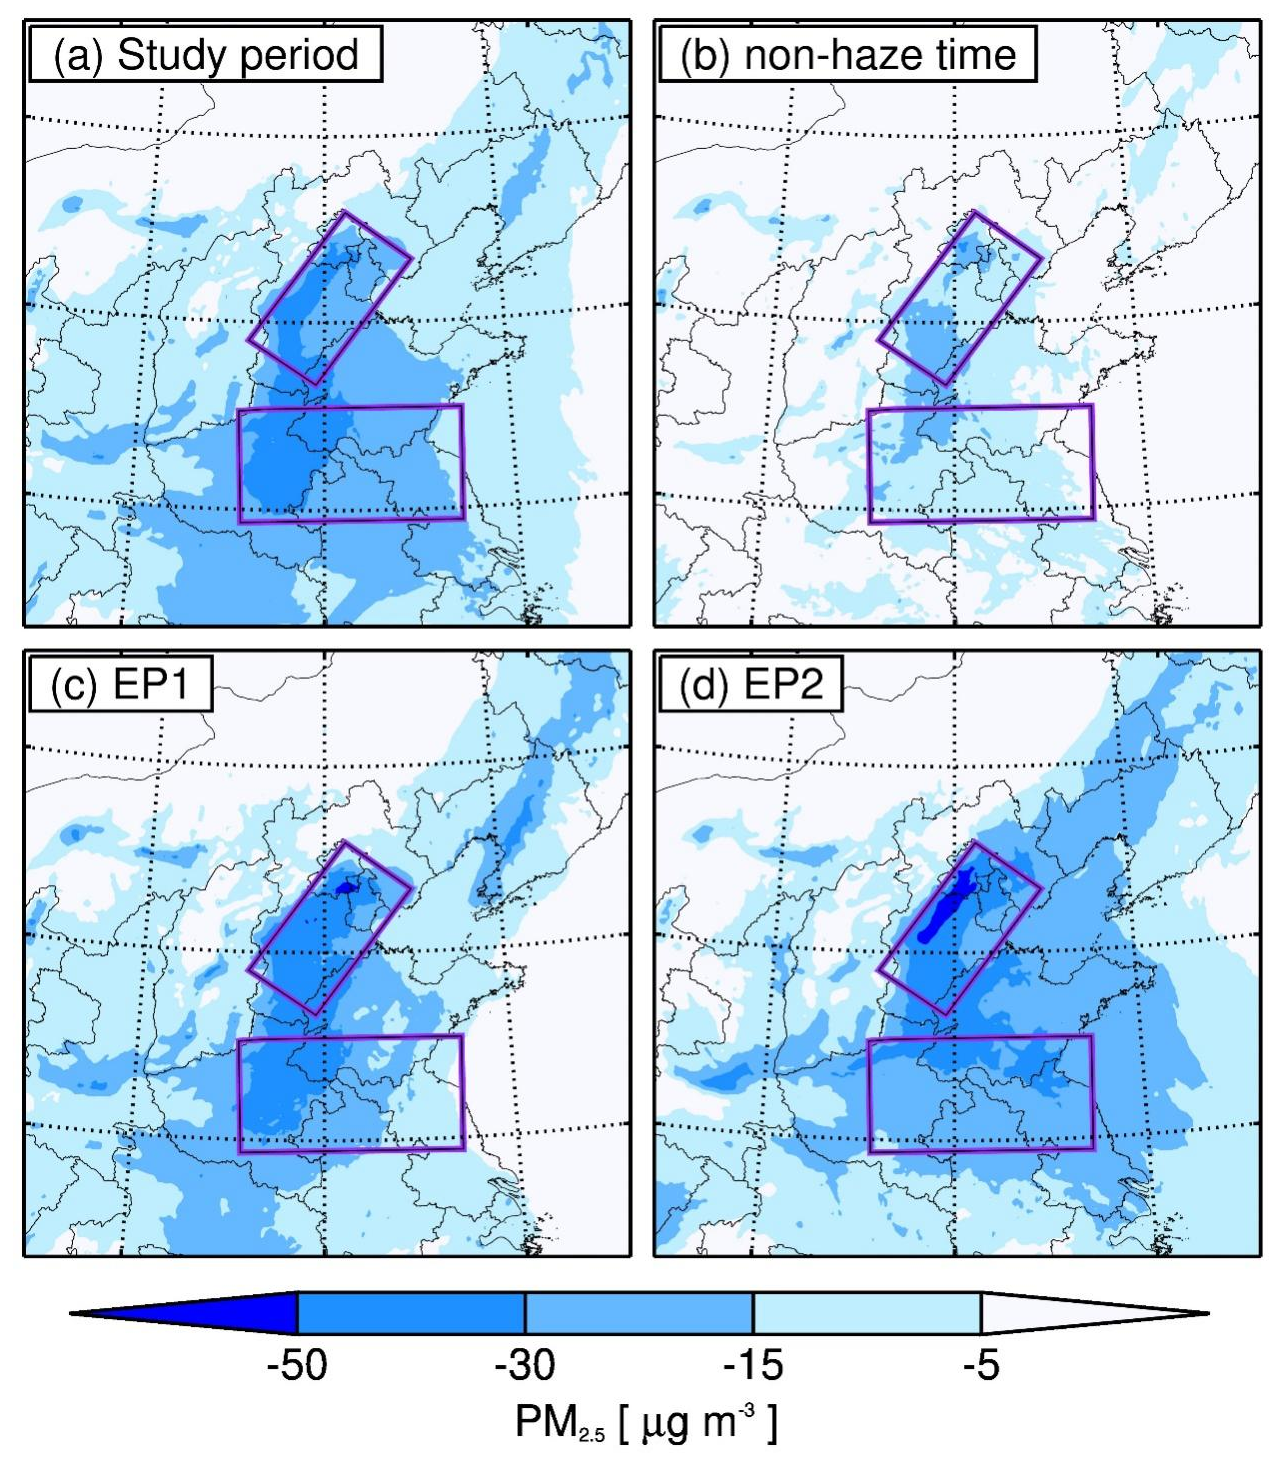
Figure 6The pattern comparisons of the BASE simulation minus the EMIS simulation. The color gradient represents PM2.5 changes averaged from (a) the entire study period, (b) the non-haze period, (c) the EP1 haze period, and (d) the EP2 haze period.
Wintertime ozone production in urban areas of northern China typically occurs in a NOx-saturated regime, primarily due to a lack of HOx radicals and limited solar radiation during winter (Seinfeld and Pandis, 2016). Additionally, reduced fresh NO emissions alleviate ozone titration (Levy et al., 2014). Thus, a reduction in NOx often leads to increased ozone levels. In the NCP during winter, there is usually an inverse relationship between PM2.5 and O3, attributed to the aerosol radiative effect on ozone photochemistry (Li et al., 2017b; Wu et al., 2020). However, during the COVID-19 lockdown, this inverse relationship disappeared in the NNCP, with ozone concentrations reaching approximately 65.7 µg m−3 even when PM2.5 levels exceeded 100 µg m−3 (Fig. S12). Significant reductions in NOx emissions reduced ozone titration, resulting in elevated ozone levels despite higher PM2.5 concentrations. This pattern aligns with previous findings that in NOx-saturated environments, reductions in NOx can increase ozone levels, with additional effects from aerosol radiative influences and precursor interactions shaping the O3–PM2.5 relationship (Le et al., 2020). These dynamics highlight the importance of considering nonlinear chemical and meteorological factors when assessing air quality responses to emission reductions.
During haze episodes (EP1 and EP2), the absolute decrease in PM2.5 was considerably greater than during non-haze periods. PM2.5 reductions during these episodes generally exceeded 30 to 50 µg m−3 (Fig. 6c and d), particularly in areas along the mountain foothills, where contributions surpassed 50 µg m−3 during EP2 (Fig. 6d). This considerable decrease underscores the enhanced effectiveness of emission control measures during severe pollution events, highlighting the importance of emission reductions in extreme pollution levels (Zheng et al., 2021).
In non-haze periods, the reductions in PM2.5 were less pronounced, typically ranging from 5 to 30 µg m−3 (Fig. 6b). These results suggest that emission reductions effectively lowered PM2.5 concentrations, but their impact was more moderate under baseline conditions with lower pollution levels. The sensitivity simulations confirm that emission reductions during the lockdown directly contributed to decreased PM2.5 levels across regions.
It is important to note that the reductions seen in the EMIS scenario are attributed solely to changes in emissions and do not account for meteorological influences. The meteorological conditions during the study period likely offset some emission-driven improvements, which will be further explored in the analysis of combined effects. However, the EMIS results demonstrate the potential effectiveness of emission controls in reducing PM2.5, particularly in regions with high anthropogenic activity.
3.5 Combined and coupled effects of meteorology and emission reduction on PM2.5
The combined and coupled effects of meteorological conditions and emission reductions during the COVID-19 lockdown significantly influenced PM2.5 concentrations in the NNCP and SNCP. These effects varied depending on the region and the interaction between meteorological factors and reduced emissions, aligning with findings from similar studies in urban areas during lockdowns that emphasize the role of meteorology in modulating pollution levels (Huang et al., 2021).
The results highlight contrasting impacts between the NNCP and SNCP regarding combined effects. In the NNCP, the combined effects of weather conditions and emission reductions led to noticeable increases in PM2.5 levels during the study period. These combined effects raised PM2.5 concentrations by 10 to 75 µg m−3, especially in the northern regions (Fig. 7a). Even during non-haze periods, this combined influence caused PM2.5 to increase by 10 to 40 µg m−3 (Fig. 7b). The impact was even more significant during haze episodes. For example, during EP2, PM2.5 levels increased by exceeding 100 µg m−3 (Fig. 7d), showing that adverse weather conditions, like stagnant winds and low boundary layer heights, negated the benefits of emission reductions. In the SNCP, the combined effects led to significant decreases in PM2.5 levels. Throughout the study period, PM2.5 concentrations dropped by 30 to 100 µg m−3 (Fig. 7a). The positive impact of emission reductions was most apparent during haze episodes, where the combined effects during EP2 led to reductions exceeding 100 µg m−3 in some areas (Fig. 7d).
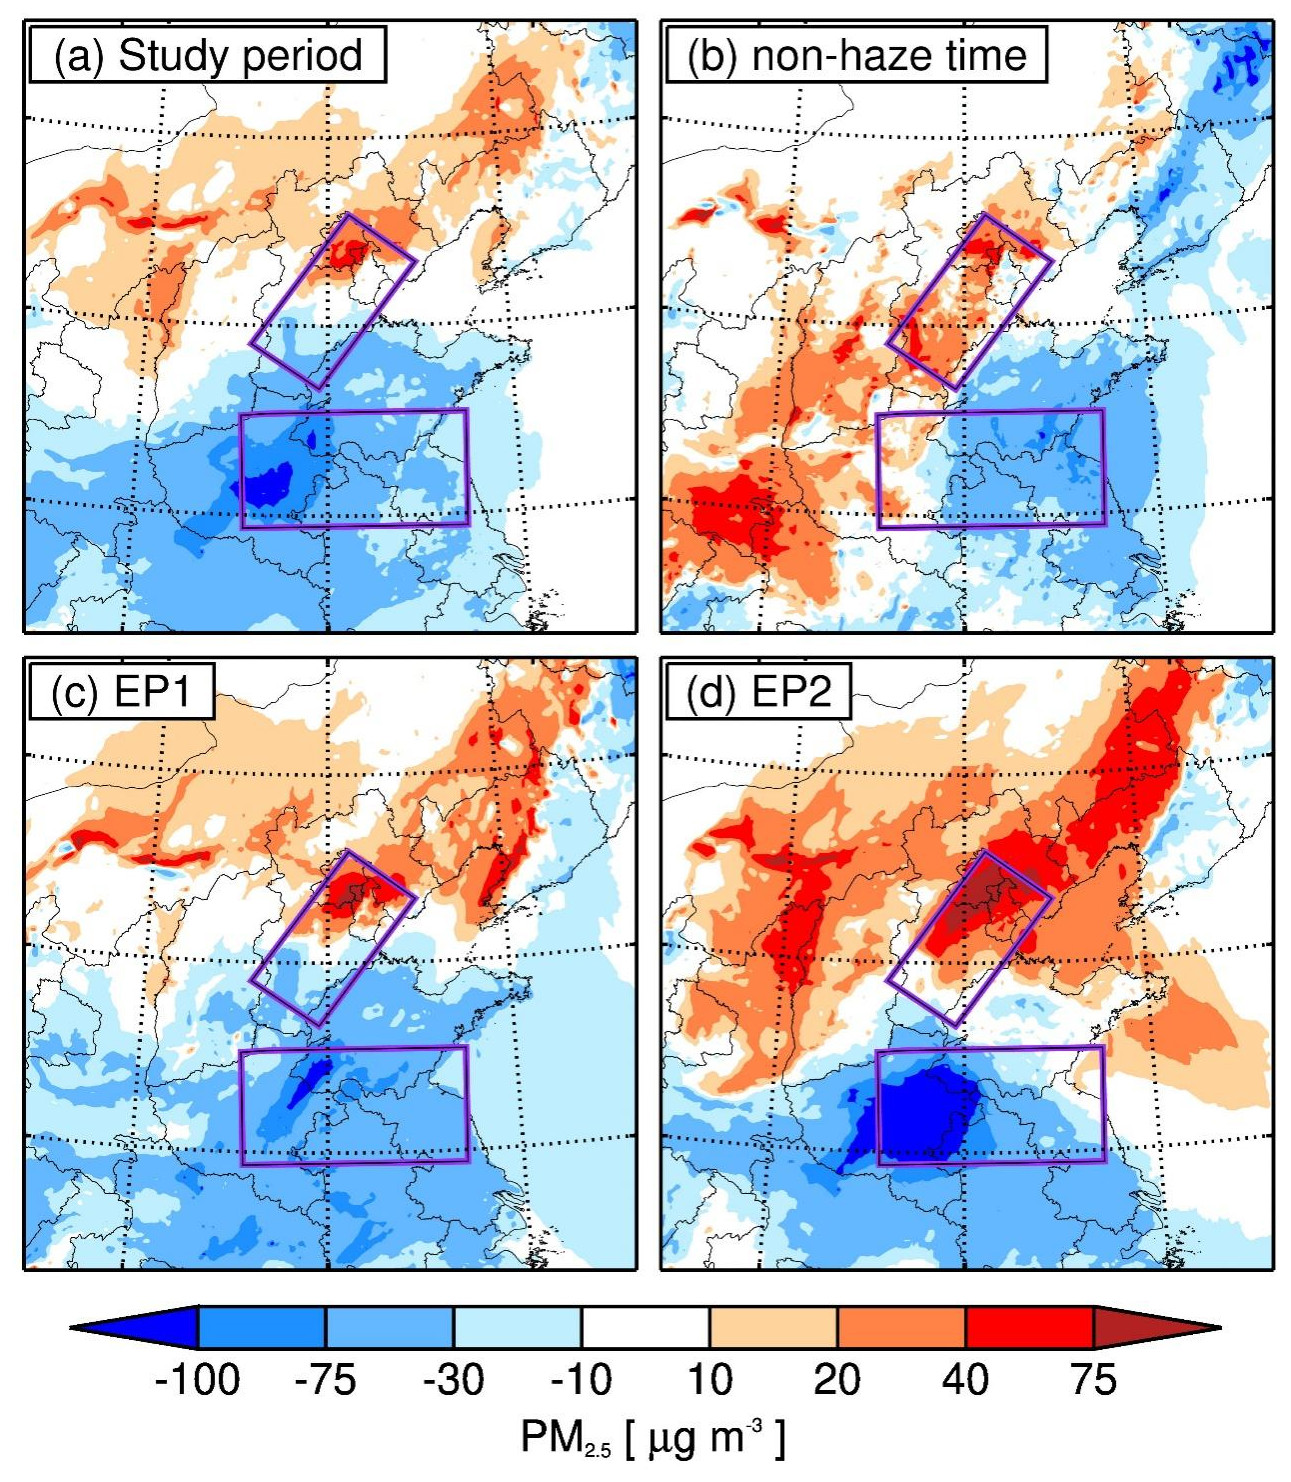
Figure 7The pattern comparisons of the BASE simulation minus the EMIS_METEO simulation. The color gradient represents coupled effects on PM2.5 averaged from (a) the entire study period, (b) the non-haze period, (c) the EP1 haze period, and (d) the EP2 haze period.
The factor separation analysis provided critical insights into the combined effects of emissions and meteorology (Fig. S13). During non-haze periods (Fig. S13b), the coupled effects contributed to a PM2.5 increase of 5 to 10 µg m−3 in the NNCP. Still, it increased to 10 to 50 µg m−3during haze episodes, particularly during EP2 (Fig. S13d). This indicates that unfavorable meteorological conditions limited the effectiveness of emission reductions in the NNCP. As a result, emission reductions, though beneficial, were insufficient to improve air quality significantly under these conditions. This finding aligns with previous studies showing that areas with adverse weather conditions often struggle to improve air quality despite emission reductions (Feng et al., 2021). Such conditions hinder pollutant dispersion, making it difficult for emission reductions to decrease PM2.5 concentrations significantly (Zheng et al., 2021).
In contrast, the SNCP exhibited more vital coupled effects between meteorology and emission reductions. During haze episodes, this interaction led to an additional 10–50 µg m−3 reduction in PM2.5 levels (Fig. S13c and d). The coupled effects between favorable meteorological conditions and reduced emissions greatly enhanced PM2.5 decreases, especially during the EP2 haze episode. This more substantial interaction in the SNCP highlights how favorable meteorology can amplify the impact of emission reductions, leading to more vital improvements in air quality. Previous research has shown that when meteorology supports pollutant dispersion, the benefits of emission reductions are maximized, resulting in significant decreases in pollutant concentrations (Xu et al., 2020b; Zhang et al., 2021).
The station-averaged regional contributions also reveal differences between the NNCP and SNCP during the COVID-19 lockdown (Fig. 8). In the NNCP, adverse meteorological conditions dominated, driving significant PM2.5 increases of 60 to 90 µg m−3 during haze episodes. In comparison, emission reductions contributed more modest decreases of 20 to 40 µg m−3. Coupled effects added only 10 to 15 µg m−3 in reductions, insufficient to offset the impact of poor weather (Fig. 8a). Conversely, in the SNCP, emission reductions had a more substantial effect, with PM2.5 levels decreasing by 30 to 50 µg m−3 during haze episodes, as meteorology and emissions worked synergistically. Coupled effects in the SNCP contributed an additional 15 to 20 µg m−3 in reductions, highlighting a more vital interaction between favorable meteorology and emission controls (Fig. 8b). Daily contributions support these trends, with the NNCP seeing persistent increases, while the SNCP experienced consistent reductions, especially during EP2, where daily decreases ranged from 40 to 60 µg m−3 (Fig. S14).
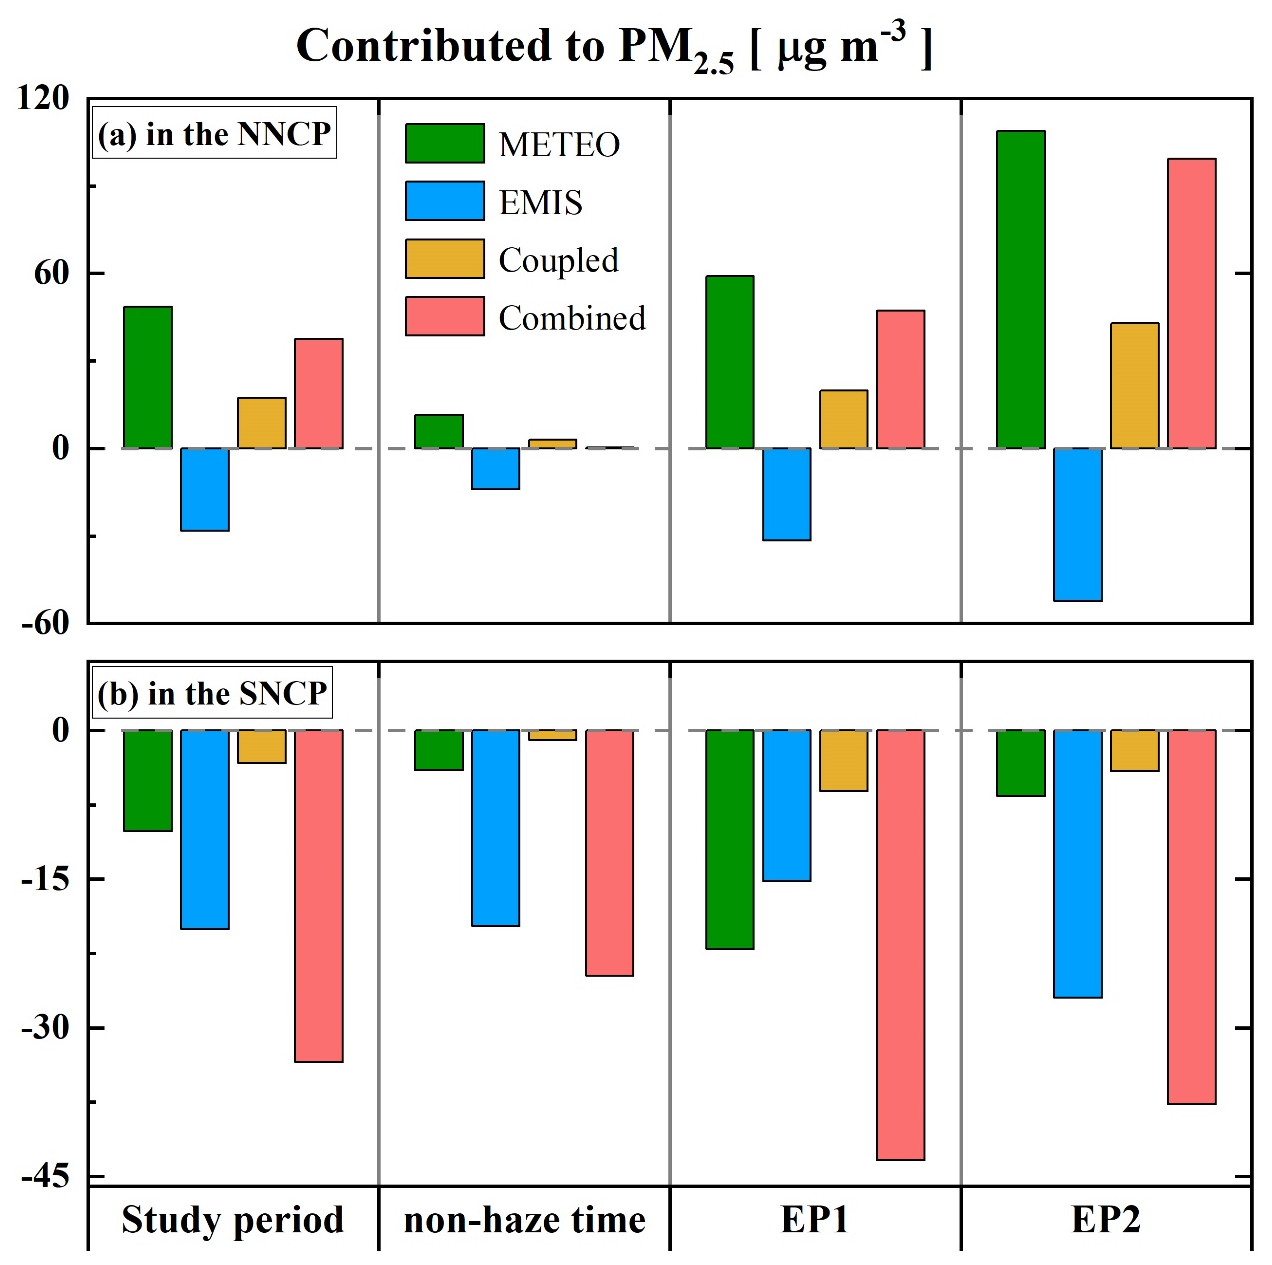
Figure 8Regional contributions to PM2.5 averaged in (a) the NNCP and (b) the SNCP during the entire period, the non-haze period, EP1, and EP2. The contributions include meteorological conditions (METEO), abrupt anthropogenic emissions (EMIS) decreases, and coupled and combined effects of METEO and EMIS.
This study highlights the significant but regionally variable impacts of meteorological conditions and emission reductions on PM2.5 levels across the NCP during the COVID-19 lockdown. In the NNCP, adverse meteorological conditions, characterized by cold, stagnant, and humid air masses, often outweighed the benefits of emission reductions, leading to increased PM2.5 concentrations, especially during haze episodes. Conversely, in the SNCP, warmer air masses and more favorable meteorological conditions enhanced the effectiveness of emission reductions, resulting in decreased PM2.5 levels.
Previous studies have primarily focused on the overall impacts of meteorological conditions and emission reductions on air quality across the North China Plain and even nationwide. We emphasize the localized differences in how meteorological conditions and emission reductions affect air quality within the North China Plain, specifically between the NNCP and SNCP. Our findings underscore the critical role that meteorological conditions play in modulating the effects of emission reductions. The combination of unfavorable meteorological factors and emission reductions in the NNCP led to overall increases in PM2.5 levels, with significant increases during haze episodes. Meanwhile, in the SNCP, meteorological conditions and emission reductions consistently contributed to lower PM2.5 concentrations.
These results emphasize the necessity of integrated air quality management strategies for emission sources and atmospheric dynamics. By understanding the spatial and temporal variations in PM2.5 in response to different meteorological conditions, policymakers can design more effective pollution control measures, particularly during critical pollution episodes. This study provides valuable insights into the complex interactions between emissions, meteorology, and air quality, highlighting the need for comprehensive approaches to improve air quality in the NCP.
The code and data used in this study are available from Lang Liu (liulang@ieecas.cn) and Xin Long (longxin@cigit.ac.cn).
The supplement related to this article is available online at: https://doi.org/10.5194/acp-25-1569-2025-supplement.
LL and XL designed the research and wrote the manuscript. YL, ZZ, FW, YY, ZB, TF, and JY contributed to interpreting the results. All the authors provided critical feedback and helped to improve the manuscript.
The contact author has declared that none of the authors has any competing interests.
Publisher's note: Copernicus Publications remains neutral with regard to jurisdictional claims made in the text, published maps, institutional affiliations, or any other geographical representation in this paper. While Copernicus Publications makes every effort to include appropriate place names, the final responsibility lies with the authors.
This work was supported by the National Natural Science Foundation of China (grant nos. 42007206 and U23A2030), the Science and Technology Innovation Program of Hunan Province (2024RC3129), a fund and program of the National University of Defense Technology (202301-YJRC-ZZ-002, ZK23-52, 22-ZZCX-081), and the Open Fund of the State Key Laboratory of Loess and Quaternary Geology (grant no. SKLLQG2219). The authors also thank Tsinghua University for compiling and sharing MEIC.
This research has been supported by the National Natural Science Foundation of China (grant nos. 42007206 and U23A2030), the Science and Technology Innovation Program of Hunan Province (2024RC3129), a fund and program of the National University of Defense Technology (202301-YJRC-ZZ-002, ZK23-52, 22-ZZCX-081), and the Open Fund of the State Key Laboratory of Loess and Quaternary Geology (grant no. SKLLQG2219).
This paper was edited by Yuan Wang and reviewed by three anonymous referees.
Bao, R. and Zhang, A.: Does lockdown reduce air pollution? Evidence from 44 cities in northern China, Sci. Total Environ., 731, 139052, https://doi.org/10.1016/j.scitotenv.2020.139052, 2020.
Bauwens, M., Compernolle, S., Stavrakou, T., Müller, J.-F., Van Gent, J., Eskes, H., Levelt, P. F., Van Der A, R., Veefkind, J. P., and Vlietinck, J.: Impact of coronavirus outbreak on NO2 pollution assessed using TROPOMI and OMI observations, Geophys. Res. Lett., 47, e2020GL087978, https://doi.org/10.1029/2020GL087978, 2020.
Binkowski, F. S. and Roselle, S. J.: Models-3 community multiscale air quality (CMAQ) model aerosol component 1. Model description, J. Geophys. Res. Atmos., 108, 4183, https://doi.org/10.1029/2001JD001409, 2003.
Chang, Y., Huang, R.-J., Ge, X., Huang, X., Hu, J., Duan, Y., Zou, Z., Liu, X., and Lehmann, M. F.: Puzzling haze events in China during the coronavirus (COVID-19) shutdown, Geophys. Res. Lett., 47, e2020GL088533, https://doi.org/10.1029/2020GL088533, 2020.
Chen, F. and Dudhia, J.: Coupling an advanced land surface–hydrology model with the Penn State–NCAR MM5 modeling system. Part II: Preliminary model validation, Mon. Weather Rev., 129, 587–604, 2001.
Cheng, Y., Zheng, G., Wei, C., Mu, Q., Zheng, B., Wang, Z., Gao, M., Zhang, Q., He, K., and Carmichael, G.: Reactive nitrogen chemistry in aerosol water as a source of sulfate during haze events in China, Sci. Adv., 2, e1601530, https://doi.org/10.1126/sciadv.1601530, 2016.
Danabasoglu, G., Lamarque, J. -F., Bacmeister, J., Bailey, D. A., DuVivier, A. K., Edwards, J., Emmons, L. K., Fasullo, J., Garcia, R., Gettelman, A., Hannay, C., Holland, M. M., Large, W. G., Lauritzen, P. H., Lawrence, D. M., Lenaerts, J. T. M., Lindsay, K., Lipscomb, W. H., Mills, M. J., Neale, R., Oleson, K. W., Otto-Bliesner, B., Phillips, A. S., Sacks, W., Tilmes, S., Van Kampenhout, L., Vertenstein, M., Bertini, A., Dennis, J., Deser, C., Fischer, C., Fox-Kemper, B., Kay, J. E., Kinnison, D., Kushner, P. J., Larson, V. E., Long, M. C., Mickelson, S., Moore, J. K., Nienhouse, E., Polvani, L., Rasch, P. J., and Strand, W. G.: The Community Earth System Model Version 2 (CESM2), J. Adv. Model. Earth Syst., 12, e2019MS001916, https://doi.org/10.1029/2019MS001916, 2020.
Ding, J., Dai, Q., Li, Y., Han, S., Zhang, Y., and Feng, Y.: Impact of meteorological condition changes on air quality and particulate chemical composition during the COVID-19 lockdown, J. Environ. Sci., 109, 45–56, 2021.
Dong, D. and Wang, J.: Air pollution as a substantial threat to the improvement of agricultural total factor productivity: Global evidence, Environ. Int., 173, 107842, https://doi.org/10.1016/j.envint.2023.107842, 2023.
Feng, J., Liao, H., Li, Y., Zhang, Z., and Tang, Y.: Long-term trends and variations in haze-related weather conditions in north China during 1980–2018 based on emission-weighted stagnation intensity, Atmos. Environ., 240, 117830, https://doi.org/10.1016/j.atmosenv.2020.117830, 2020.
Feng, T., Zhao, S., Bei, N., Liu, S., and Li, G.: Increasing atmospheric oxidizing capacity weakens emission mitigation effort in Beijing during autumn haze events, Chemosphere, 281, 130855, https://doi.org/10.1016/j.chemosphere.2021.130855, 2021.
Grell, G. A., Peckham, S. E., Schmitz, R., McKeen, S. A., Frost, G., Skamarock, W. C., and Eder, B.: Fully coupled “online” chemistry within the WRF model, Atmos. Environ., 39, 6957–6975, 2005.
Guenther, A., Karl, T., Harley, P., Wiedinmyer, C., Palmer, P. I., and Geron, C.: Estimates of global terrestrial isoprene emissions using MEGAN (Model of Emissions of Gases and Aerosols from Nature), Atmos. Chem. Phys., 6, 3181–3210, https://doi.org/10.5194/acp-6-3181-2006, 2006.
Guenther, A. B., Jiang, X., Heald, C. L., Sakulyanontvittaya, T., Duhl, T., Emmons, L. K., and Wang, X.: The Model of Emissions of Gases and Aerosols from Nature version 2.1 (MEGAN2.1): an extended and updated framework for modeling biogenic emissions, Geosci. Model Dev., 5, 1471–1492, https://doi.org/10.5194/gmd-5-1471-2012, 2012.
Guo, H., Liu, J., Froyd, K. D., Roberts, J. M., Veres, P. R., Hayes, P. L., Jimenez, J. L., Nenes, A., and Weber, R. J.: Fine particle pH and gas–particle phase partitioning of inorganic species in Pasadena, California, during the 2010 CalNex campaign, Atmos. Chem. Phys., 17, 5703–5719, https://doi.org/10.5194/acp-17-5703-2017, 2017.
Hong, S.-Y. and Lim, J.-O. J.: The WRF single-moment 6-class microphysics scheme (WSM6), Asia-Pac. J. Atmos. Sci., 42, 129–151, 2006.
Huang, X., Ding, A., Gao, J., Zheng, B., Zhou, D., Qi, X., Tang, R., Wang, J., Ren, C., Nie, W., Chi, X., Xu, Z., Chen, L., Li, Y., Che, F., Pang, N., Wang, H., Tong, D., Qin, W., Cheng, W., Liu, W., Fu, Q., Liu, B., Chai, F., Davis, S. J., Zhang, Q., and He, K.: Enhanced secondary pollution offset reduction of primary emissions during COVID-19 lockdown in China, Natl. Sci. Rev., 8, nwaa137, https://doi.org/10.1093/nsr/nwaa137, 2021.
Janić, Z. I.: Nonsingular Implementation of the Mellor-Yamada Level 2.5 Scheme in the NCEP Meso Model, NCEP Office Note #437, NCEP, Camp Springs, USA, 2001.
Kalnay, E., Kanamitsu, M., Kistler, R., Collins, W., Deaven, D., Gandin, L., Iredell, M., Saha, S., White, G., and Woollen, J.: The NCEP/NCAR 40-year reanalysis project, in: Renewable energy, Vol1_146-Vol1_194, Routledge, https://doi.org/10.1175/1520-0477(1996)077<0437:TNYRP>2.0.CO;2, 2018.
Le, T., Wang, Y., Liu, L., Yang, J., Yung, Y. L., Li, G., and Seinfeld, J. H.: Unexpected air pollution with marked emission reductions during the COVID-19 outbreak in China, Science, 369, 702–706, 2020.
Lelieveld, J., Haines, A., and Pozzer, A.: Age-dependent health risk from ambient air pollution: a modelling and data analysis of childhood mortality in middle-income and low-income countries, Lancet Planet. Health, 2, e292–e300, 2018.
Levy, I., Mihele, C., Lu, G., Narayan, J., and Brook, J. R.: Evaluating multipollutant exposure and urban air quality: pollutant interrelationships, neighborhood variability, and nitrogen dioxide as a proxy pollutant, Environ. Health Perspect., 122, 65–72, 2014.
Li, G., Bei, N., Tie, X., and Molina, L. T.: Aerosol effects on the photochemistry in Mexico City during MCMA-2006/MILAGRO campaign, Atmos. Chem. Phys., 11, 5169–5182, https://doi.org/10.5194/acp-11-5169-2011, 2011.
Li, G., Bei, N., Cao, J., Huang, R., Wu, J., Feng, T., Wang, Y., Liu, S., Zhang, Q., Tie, X., and Molina, L. T.: A possible pathway for rapid growth of sulfate during haze days in China, Atmos. Chem. Phys., 17, 3301–3316, https://doi.org/10.5194/acp-17-3301-2017, 2017a.
Li, G., Bei, N., Cao, J., Wu, J., Long, X., Feng, T., Dai, W., Liu, S., Zhang, Q., and Tie, X.: Widespread and persistent ozone pollution in eastern China during the non-winter season of 2015: observations and source attributions, Atmos. Chem. Phys., 17, 2759–2774, https://doi.org/10.5194/acp-17-2759-2017, 2017b.
Li, J., Liao, H., Hu, J., and Li, N.: Severe particulate pollution days in China during 2013–2018 and the associated typical weather patterns in Beijing-Tianjin-Hebei and the Yangtze River Delta regions, Environ. Pollut., 248, 74–81, 2019.
Li, J., Gao, W., Cao, L., He, L., Zhang, X., Yan, Y., Mao, J., Xin, J., Wang, L., and Tang, G.: Effects of different stagnant meteorological conditions on aerosol chemistry and regional transport changes in Beijing, China, Atmos. Environ., 258, 118483, https://doi.org/10.1016/j.atmosenv.2021.118483, 2021.
Li, J., Carlson, B. E., Yung, Y. L., Lv, D., Hansen, J., Penner, J. E., Liao, H., Ramaswamy, V., Kahn, R. A., and Zhang, P.: Scattering and absorbing aerosols in the climate system, Natl. Rev. Earth Environ., 3, 363–379, 2022.
Li, L., Hoffmann, M. R., and Colussi, A. J.: Role of nitrogen dioxide in the production of sulfate during Chinese haze-aerosol episodes, Environ. Sci. Technol., 52, 2686–2693, 2018.
Li, L., Li, Q., Huang, L., Wang, Q., Zhu, A., Xu, J., Liu, Z., Li, H., Shi, L., and Li, R.: Air quality changes during the COVID-19 lockdown over the Yangtze River Delta Region: An insight into the impact of human activity pattern changes on air pollution variation, Sci. Total Environ., 732, 139282, https://doi.org/10.1016/j.scitotenv.2020.139282, 2020.
Liu, F., Page, A., Strode, S. A., Yoshida, Y., Choi, S., Zheng, B., Lamsal, L. N., Li, C., Krotkov, N. A., and Eskes, H.: Abrupt decline in tropospheric nitrogen dioxide over China after the outbreak of COVID-19, Sci. Adv., 6, eabc2992, https://doi.org/10.1126/sciadv.abc2992, 2020a.
Liu, L., Bei, N., Hu, B., Wu, J., Liu, S., Li, X., Wang, R., Liu, Z., Shen, Z., and Li, G.: Wintertime nitrate formation pathways in the north China plain: Importance of N2O5 heterogeneous hydrolysis, Environ. Pollut., 266, 115287, https://doi.org/10.1016/j.envpol.2020.115287, 2020b.
Liu, M., Song, Y., Zhou, T., Xu, Z., Yan, C., Zheng, M., Wu, Z., Hu, M., Wu, Y., and Zhu, T.: Fine particle pH during severe haze episodes in northern China, Geophys. Res. Lett., 44, 5213–5221, 2017.
Liu, Y., Wang, T., Stavrakou, T., Elguindi, N., Doumbia, T., Granier, C., Bouarar, I., Gaubert, B., and Brasseur, G. P.: Diverse response of surface ozone to COVID-19 lockdown in China, Sci. Total Environ., 789, 147739, https://doi.org/10.1016/j.scitotenv.2021.147739, 2021.
Lv, Z., Wang, X., Deng, F., Ying, Q., Archibald, A. T., Jones, R. L., Ding, Y., Cheng, Y., Fu, M., and Liu, Y.: Source–receptor relationship revealed by the halted traffic and aggravated haze in Beijing during the COVID-19 lockdown, Environ. Sci. Technol., 54, 15660–15670, 2020.
Ma, T., Duan, F., Ma, Y., Zhang, Q., Xu, Y., Li, W., Zhu, L., and He, K.: Unbalanced emission reductions and adverse meteorological conditions facilitate the formation of secondary pollutants during the COVID-19 lockdown in Beijing, Sci. Total Environ., 838, 155970, https://doi.org/10.1016/j.scitotenv.2022.155970, 2022.
Mauldin III, R. L., Berndt, T., Sipilä, M., Paasonen, P., Petäjä, T., Kim, S., Kurtén, T., Stratmann, F., Kerminen, V.-M., and Kulmala, M.: A new atmospherically relevant oxidant of sulphur dioxide, Nature, 488, 193–196, 2012.
Seinfeld, J. H. and Pandis, S. N.: Atmospheric chemistry and physics: from air pollution to climate change, John Wiley & Sons, ISBN 9781118947401, 2016.
Shen, F., Hegglin, M. I., and Yuan, Y.: Impact of weather patterns and meteorological factors on PM2.5 and O3 responses to the COVID-19 lockdown in China, Atmos. Chem. Phys., 24, 6539–6553, https://doi.org/10.5194/acp-24-6539-2024, 2024.
Shi, X. and Brasseur, G. P.: The response in air quality to the reduction of Chinese economic activities during the COVID-19 outbreak, Geophys. Res. Lett., 47, e2020GL088070, https://doi.org/10.1029/2020GL088070, 2020.
Su, T., Li, Z., Zheng, Y., Luan, Q., and Guo, J.: Abnormally Shallow Boundary Layer Associated With Severe Air Pollution During the COVID-19 Lockdown in China, Geophys. Res. Lett., 47, e2020GL090041, https://doi.org/10.1029/2020GL090041, 2020.
Sun, Y., Lei, L., Zhou, W., Chen, C., He, Y., Sun, J., Li, Z., Xu, W., Wang, Q., and Ji, D.: A chemical cocktail during the COVID-19 outbreak in Beijing, China: Insights from six-year aerosol particle composition measurements during the Chinese New Year holiday, Sci. Total Environ., 742, 140739, https://doi.org/10.1016/j.scitotenv.2020.140739, 2020.
Tie, X., Madronich, S., Walters, S., Zhang, R., Rasch, P., and Collins, W.: Effect of clouds on photolysis and oxidants in the troposphere, J. Geophys. Res.-Atmos., 108, 4642, https://doi.org/10.1029/2003JD003659, 2003.
Wang, C., Horby, P. W., Hayden, F. G., and Gao, G. F.: A novel coronavirus outbreak of global health concern, Lancet, 395, 470–473, 2020.
Wang, J., Lei, Y., Chen, Y., Wu, Y., Ge, X., Shen, F., Zhang, J., Ye, J., Nie, D., and Zhao, X.: Comparison of air pollutants and their health effects in two developed regions in China during the COVID-19 pandemic, J. Environ. Manage., 287, 112296, https://doi.org/10.1016/j.jenvman.2021.112296, 2021.
WHO – World Health Organisation: COVID-19 deaths, WHO COVID-19 Dashboard, World Health Organisation, https://data.who.int/dashboards/covid19/deaths?n=o (last access: 25 August 2024), 2024.
Wu, J., Bei, N., Hu, B., Liu, S., Wang, Y., Shen, Z., Li, X., Liu, L., Wang, R., Liu, Z., Cao, J., Tie, X., Molina, L. T., and Li, G.: Aerosol–photolysis interaction reduces particulate matter during wintertime haze events, P. Natl. Acad. Sci., 117, 9755–9761, https://doi.org/10.1073/pnas.1916775117, 2020.
Xiao, Q., Geng, G., Liang, F., Wang, X., Lv, Z., Lei, Y., Huang, X., Zhang, Q., Liu, Y., and He, K.: Changes in spatial patterns of PM2.5 pollution in China 2000–2018: Impact of clean air policies, Environ. Int., 141, 105776, https://doi.org/10.1016/j.envint.2020.105776, 2020.
Xu, J., Ge, X., Zhang, X., Zhao, W., Zhang, R., and Zhang, Y.: COVID-19 impact on the concentration and composition of submicron particulate matter in a typical city of Northwest China, Geophys. Res. Lett., 47, e2020GL089035, https://doi.org/10.1029/2020GL089035, 2020a.
Xu, Y., Xue, W., Lei, Y., Huang, Q., Zhao, Y., Cheng, S., Ren, Z., and Wang, J.: Spatiotemporal variation in the impact of meteorological conditions on PM2.5 pollution in China from 2000 to 2017, Atmos. Environ., 223, 117215, https://doi.org/10.1016/j.atmosenv.2019.117215, 2020b.
Yan, F., Su, H., Cheng, Y., Huang, R., Liao, H., Yang, T., Zhu, Y., Zhang, S., Sheng, L., Kou, W., Zeng, X., Xiang, S., Yao, X., Gao, H., and Gao, Y.: Frequent haze events associated with transport and stagnation over the corridor between the North China Plain and Yangtze River Delta, Atmos. Chem. Phys., 24, 2365–2376, https://doi.org/10.5194/acp-24-2365-2024, 2024.
Yang, G., Ren, G., Zhang, P., Xue, X., Tysa, S. K., Jia, W., Qin, Y., Zheng, X., and Zhang, S.: PM2.5 influence on urban heat island (UHI) effect in Beijing and the possible mechanisms, J. Geophys. Res.-Atmos., 126, e2021JD035227, https://doi.org/10.1029/2021JD035227, 2021.
Zhang, Q., Zheng, Y., Tong, D., Shao, M., Wang, S., Zhang, Y., Xu, X., Wang, J., He, H., and Liu, W.: Drivers of improved PM2.5 air quality in China from 2013 to 2017, P. Natl. Acad. Sci. USA, 116, 24463–24469, 2019.
Zhang, S., Zeng, G., Yang, X., Wu, R., and Yin, Z.: Comparison of the influence of two types of cold surge on haze dispersion in eastern China, Atmos. Chem. Phys., 21, 15185–15197, https://doi.org/10.5194/acp-21-15185-2021, 2021.
Zhao, Y., Zhang, K., Xu, X., Shen, H., Zhu, X., Zhang, Y., Hu, Y., and Shen, G.: Substantial Changes in Nitrogen Dioxide and Ozone after Excluding Meteorological Impacts during the COVID-19 Outbreak in Mainland China, Environ. Sci. Technol. Lett., 7, 402–408, https://doi.org/10.1021/acs.estlett.0c00304, 2020.
Zheng, B., Zhang, Q., Geng, G., Chen, C., Shi, Q., Cui, M., Lei, Y., and He, K.: Changes in China's anthropogenic emissions and air quality during the COVID-19 pandemic in 2020, Earth Syst. Sci. Data, 13, 2895–2907, https://doi.org/10.5194/essd-13-2895-2021, 2021.
Zheng, G. J., Duan, F. K., Su, H., Ma, Y. L., Cheng, Y., Zheng, B., Zhang, Q., Huang, T., Kimoto, T., Chang, D., Pöschl, U., Cheng, Y. F., and He, K. B.: Exploring the severe winter haze in Beijing: the impact of synoptic weather, regional transport and heterogeneous reactions, Atmos. Chem. Phys., 15, 2969–2983, https://doi.org/10.5194/acp-15-2969-2015, 2015.