the Creative Commons Attribution 4.0 License.
the Creative Commons Attribution 4.0 License.
 | 13 Nov 2025
Modeling on the drought stress impact on the summertime biogenic isoprene emissions in South Korea
Yong-Cheol Jeong
Hyeonmin Kim
Rokjin J. Park
Mahmoudreza Momeni
Biogenic isoprene emissions play an important role in air quality so it is important to quantify their response to extreme events such as drought. This study aims at constraining drought stress on biogenic isoprene emissions in South Korea using satellite formaldehyde (HCHO) column, the key product of isoprene oxidation, and a chemistry transport model (GEOS-Chem) with Model of Emissions of Gases and Aerosols from Nature version 2.1 (MEGAN2.1). It was found that the HCHO column from the Ozone Monitoring Instrument (OMI) increased by 5.4 % under the drought condition compared to the normal condition, but GEOS-Chem simulated a 20.23 % increase indicating an overestimation of isoprene emissions under drought. We implemented two existing drought stress algorithms in MEGAN2.1 and found they were not effective to reduce HCHO column biases in South Korea because those algorithms were proposed and developed for the Southeast United States (SE US). To improve this, we applied an iterative finite difference mass balance (IFDMB) method to estimate isoprene emissions using the OMI HCHO column. With this method, isoprene emissions were reduced by 60 % under the drought condition compared to those simulated by the standard MEGAN2.1 implemented in GEOS-Chem. The increase of HCHO column under the drought condition compared to the normal condition was also reduced to 10.71 %, which is comparable to that in the satellite retrievals. Based on isoprene emission difference between MEGAN2.1 and IFDMB, we developed the empirical equations to adjust isoprene emissions in South Korea that also improved model prediction of the secondary pollutant such as ozone.
- Article
(11477 KB) - Full-text XML
-
Supplement
(1421 KB) - BibTeX
- EndNote


In the troposphere, biogenic non-methane volatile organic compounds (BVOCs) are important to regional air quality because they are precursors to tropospheric ozone and secondary organic aerosols (Atkinson, 2000; Holm and Balmes, 2022; Pacifico et al., 2009). BVOCs are emitted from terrestrial vegetations and 50 %–70 % of global BVOCs emissions are isoprene emissions (Pacifico et al., 2009; Sindelarova et al., 2014). Isoprene emissions depend on not only physiological factors such as plant functional type, leaf area index, and leaf age, but also meteorological factors such as temperature, radiation, and soil moisture, which affect plant's physiology such as stomatal conductance, isoprene synthase activity, and carbon substrate supply (Ferracci et al., 2020; Guenther et al., 2012; Guenther et al., 2006; Potosnak et al., 2014; Seco et al., 2022). Given this, it is of great importance in the air quality study to quantify such climatic or meteorological impacts on isoprene emissions.
Drought is one of the most important climatic or meteorological extreme events that can modulate isoprene emissions by high temperature and low soil moisture (Limousin et al., 2010; Zhou et al., 2014; Rissanen et al., 2022; Huang et al., 2015; Seco et al., 2015). Although the response of isoprene emissions is non-monotonic to the drought severity, isoprene emissions tend to increase under drought condition in general (Ferracci et al., 2020; Funk et al., 2005; Pegoraro et al., 2004; Potosnak et al., 2014) while the extent of the increase is challenging to quantify because the number of in-situ isoprene measurements worldwide is spatiotemporally scarce. Taking advantage of wide spatiotemporal coverage of satellite retrievals, some studies (Wang et al., 2022b; Wasti and Wang, 2022) have used the tropospheric formaldehyde (HCHO) column retrievals from the satellite to estimate isoprene emissions response to drought. It is well known that HCHO could be used as a proxy for isoprene emissions because HCHO is produced fast with high yield from isoprene oxidation (Wolfe et al., 2016; Palmer et al., 2003; Sprengnether et al., 2002). Recent studies (Li et al., 2022; Naimark et al., 2021) showed that the tropospheric HCHO column from the Ozone Monitoring Instrument (OMI) on the Aura satellite increased by 6.5 %–22 % in the southeastern United States (US) region during the summertime drought, which is indicative of the increase of isoprene emissions during drought.
The Model of Emissions of Gases and Aerosols from Nature (MEGAN) (Guenther et al., 2006; Guenther et al., 2012) is widely used to estimate isoprene emissions as a function of physiological and meteorological factors. However, isoprene emissions simulated by MEGAN showed a large overestimation under the drought condition, so some efforts have been carried out in various ways to reduce such bias (Wang et al., 2022a, 2021). In Jiang et al. (2018), for example, a drought stress algorithm for MEGAN isoprene emission was proposed based on observational constraints from isoprene flux measurements at the Missouri Ozarks AmeriFlux (MOFLUX) site in the southeastern US (SE US) during two summertime drought condition (summers of 2011 and 2012). Wang et al. (2022b), on the other hand, used the OMI HCHO column as top-down constraints to derive a drought stress algorithm for MEGAN isoprene emissions in order to achieve a wider spatiotemporal coverage. They compared the OMI HCHO column with the HCHO column simulated by a chemical transport model (GEOS-Chem) with MEGAN isoprene emission in the SE US region for a multiple-year period (2005–2017 summers) and showed that the model HCHO column had larger biases under the drought condition compared to the normal/wet condition. To reduce the model HCHO biases under the drought condition, they derived a drought stress algorithm for MEGAN isoprene emission which could minimize the HCHO biases in the SE US region. This algorithm reduced isoprene emission by 8.6 %–20.7 % in the summertime drought condition in the SE US.
In South Korea, it is also known that isoprene emissions play an important role on air quality (Kim et al., 2018, 2013; Lee and Park, 2022). Observational evidence of the impact of drought stress on isoprene emissions (Wasti and Wang, 2022) showed that the OMI HCHO column increased by 2.97 % in the mild drought and by 8.02 % in the extreme drought in the summertime in the South Korean region, indicating the increase of isoprene emissions under the drought condition. However, an effort to evaluate MEGAN isoprene emissions in South Korea has not been made yet despite the wide use of MEGAN in air quality simulations for South Korea (Jang et al., 2020; Lee and Park, 2022; Lee et al., 2014; Yu et al., 2023). Following this need, the present study aimed to constrain isoprene emissions under the summertime (June–July–August, JJA hereafter) drought condition in the South Korean region by using the chemical transport model (GEOS-Chem) with MEGAN and satellite HCHO columns. We first investigated the HCHO column biases of GEOS-Chem under the drought condition. After we verified that the current two drought stress algorithms for MEGAN isoprene emissions were not effective to reduce the HCHO column biases in South Korea, we conducted a top-down inversion of isoprene emissions in this region and estimated the drought impact on isoprene emissions based on the inversion results.
2.1 Drought index
We adopted a gridded drought index, the evapotranspiration deficit index (DEDI), to detect the drought in South Korea region. The DEDI is derived from actual evapotranspiration (AET) and potential evapotranspiration (PET) datasets (Zhang et al., 2023a), which are provided by the European Centre for Medium-Rand Weather Forecast (ECMWF) Reanalysis version 5 (ERA5) (Hersbach et al., 2020). Because the DEDI considers a balance between the atmospheric evaporation demand and the actual land water evaporated from soil, water surfaces and vegetation, the DEDI can connect the climate system with terrestrial ecosystems (Zhang et al., 2023a). The horizontal resolution of the DEDI data was 0.25° × 0.25° and it was regridded to 0.25° × 0.3125° to match with the horizontal resolution used in the following model simulations. Consistent with the previous studies (Wang et al., 2022b), we focused on the weekly drought by averaging daily DEDI values in all grid points. To decide the drought thresholds of the DEDI data in South Korean region, we followed the percentile category approach. As described in the previous studies (Zhang et al., 2023a, 2022), the 30 % percentile value (−0.49) of the climatological DEDI (1981–2010; 30 years) was obtained to detect drought periods (DEDI ). Since DEDI data is available at fine spatial (0.25° × 0.25°) and temporal (daily) resolutions than other drought indices, we chose DEDI over other indices to help increase data sizes in the limited study period and domain. Figure S1 in the Supplement shows the weekly DEDI values in the recent seven summers (2016–2022 JJA) and compared them with the Standardized Precipitation Index 1 (SPI1) (McKee et al., 1993) which is based on the 1-month accumulated precipitation measurements from the in-situ sites in South Korea. The daily SPI1, provided by the Korea Meteorological Administration (KMA), was averaged to derive the weekly SPI1, and the DEDI value at the nearest point to each SPI1 in-situ site was used here for comparison with the SPI1. As described in Zhang et al. (2023a), DEDI had consistent drought conditions with the SPI1 (Fig. S1), indicating that DEDI can represent the observed drought conditions. Both drought indices showed that 2016 JJA, 2017 JJA, and 2018 JJA had strong and persistent drought conditions compared to other summers, so we focused on these three summers (2016–2018 JJA) in the following analyses and model simulations. For each grid point, therefore, the normal (DEDI .49) and drought (DEDI ) conditions were defined based on a weekly basis using DEDI during three summers (2016–2018).
2.2 In-situ observations of Ozone and PM2.5 and the OMI HCHO product
We used the observed in-situ surface ozone (O3) and particulate matter with a diameter less than or equal to 2.5 µm (PM2.5) datasets in South Korea for 2016–2018 JJA period. The hourly O3 (PM2.5) concentrations at all available sites were used in this study (Fig. 1) to derive daytime mean (07:00 a.m.–06:00 p.m. LT) O3 (PM2.5) concentrations in each day. We focused on daytime because most of the biogenic isoprene emissions occur in daytime and BVOCs react with nitrogen oxides (NOx) under the presence of solar radiation to produce secondary pollutants, especially O3 (Atkinson, 2000). The weekly daytime-mean O3 (PM2.5) concentration at each site was derived by averaging daily daytime mean O3 (PM2.5) concentrations.
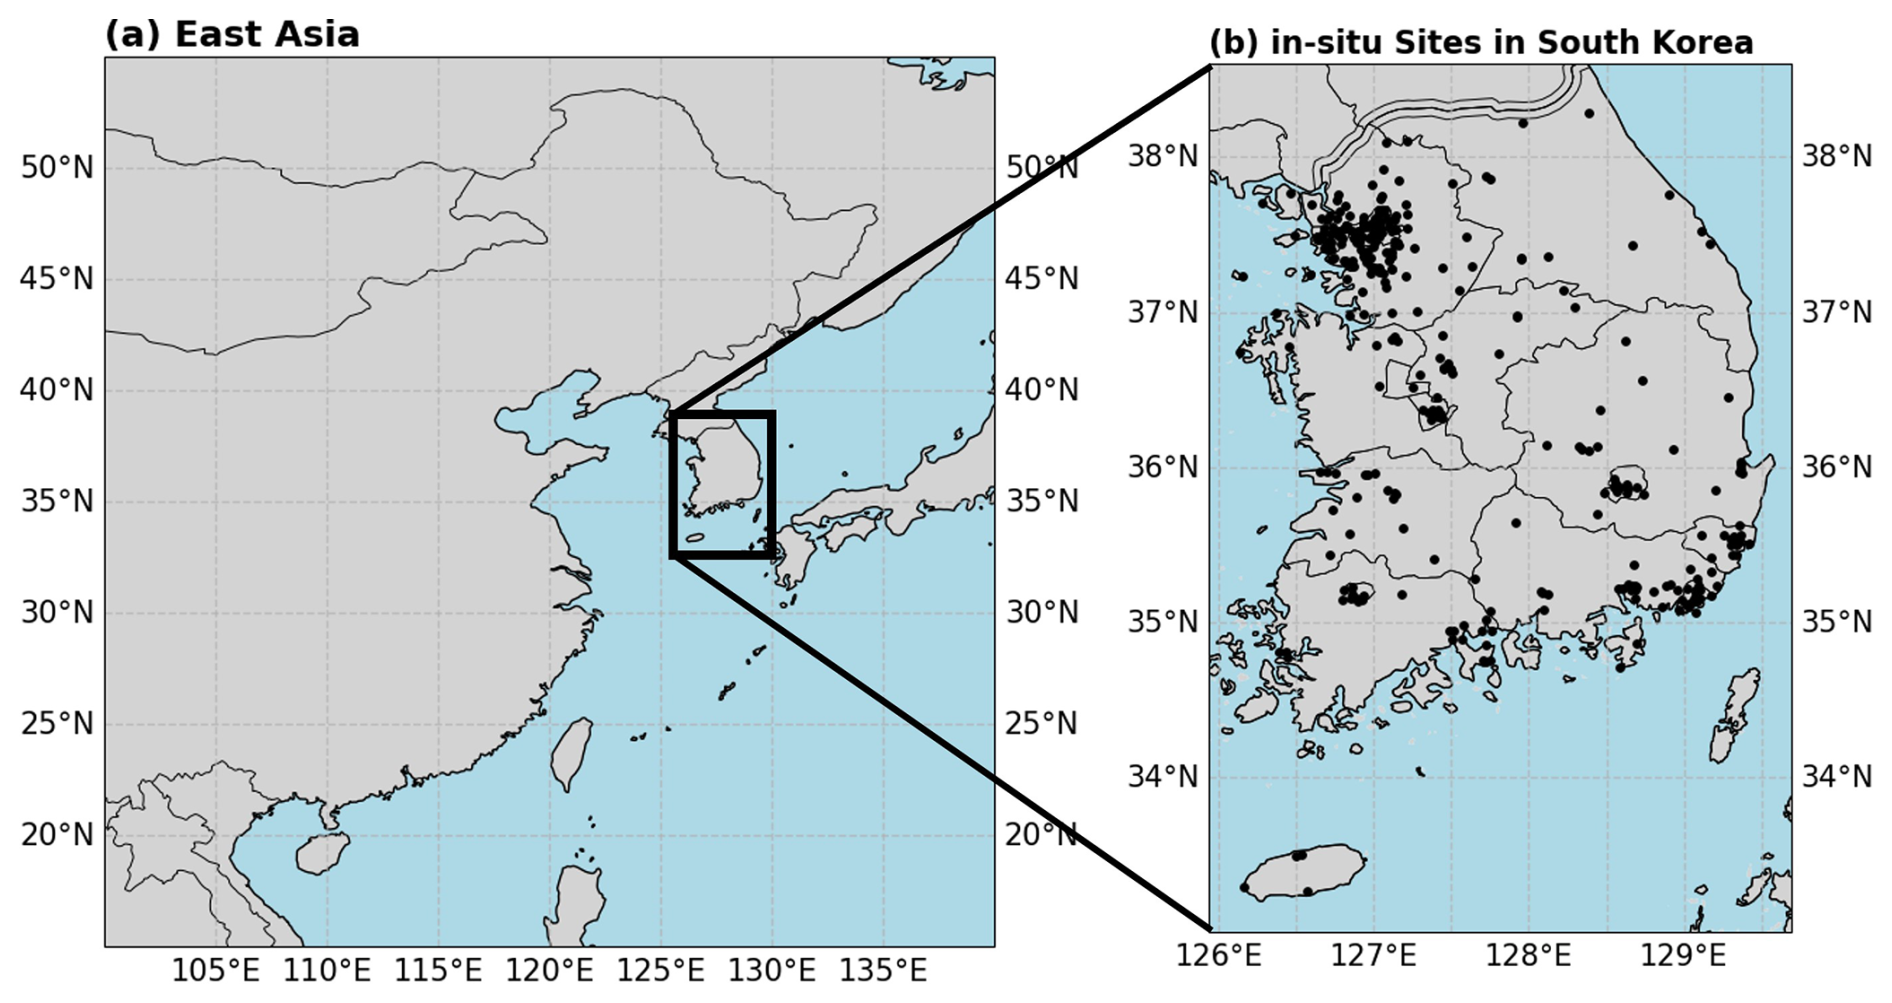
Figure 1(a) The location for South Korea in East Asia and (b) the locations for in-situ air pollutant measurements in South Korea.
The Ozone Monitoring Instrument (OMI) v003 Level 3 tropospheric formaldehyde (HCHO) column density data (OMHCHOd; Chance, 2019) were used in this study. All pixels with bad formaldehyde retrievals, high cloud fractions (> 30 %), high solar zenith angle (> 70°), and pixels affected by OMI's row anomaly in Level 2 HCHO column data (OMHCHO) have been already filtered out in OMHCHOd data (Chance, 2019). The horizontal resolution was 0.1° × 0.1°, and it was regridded to 0.25° × 0.3125° to match with the horizontal resolution used in the model simulations. Zhu et al. (2020) verified the OMI HCHO column retrievals with the HCHO aircraft observation in South Korea region during the Korea–United States Air Quality (KORUS-AQ) campaign from the May to early June 2016. They found that the OMI HCHO column retrievals were biased low by about 22 % relative to the aircraft observation. To correct this underestimation, we applied a constant factor of 1.28 to the OMHCHOd data as in the previous studies (Shen et al., 2019; Wang et al., 2022b). We also compared this method to a different bias correction method suggested by Müller et al. (2024) and the results were shown in Fig. S2. The two corrected HCHO columns were highly correlated with a regression slope close to one, except for a few HCHO points under normal condition. The corrected HCHO columns used in this study were 7 %–12 % higher compared to those from Müller et al. (2024) under normal and drought conditions, respectively.
2.3 GEOS-Chem model simulations
We used the atmospheric composition simulations of the nested-grid GEOS-Chem chemical transport model (version 12-7-2) over East Asia (100–140° E, 15–55° N; Fig. 1) with a horizontal resolution of 0.25° × 0.3125° (Bey et al., 2001; Chen et al., 2009; Wang et al., 2004) to obtain the modeled isoprene emissions and HCHO columns in 2016–2018 JJA period. The model was driven by GEOS-forward processing (GEOS-FP) meteorological data from NASA's Global Modeling and Assimilation Office (GMAO). The chemical boundary conditions for the nested domain were obtained from the GEOS-Chem global simulations with a horizontal resolution of 2° × 2.5° every three hours. The GEOS-Chem Tropchem mechanism was used for the gas-phase chemistry mechanisms in GEOS-Chem (Fisher et al., 2016; Mao et al., 2013; Marais et al., 2016) and gas-aerosol phase partitioning of the nitric acid and ammonia was calculated by ISORROPIA II (Fountoukis and Nenes, 2007). For anthropogenic emissions in East Asia region, we used the Korea-United States Air version 5 (KORUSv5) emission inventory (Woo et al., 2020), which is one of the most recent anthropogenic emission inventories in East Asia. The Global Fire Emissions Database 4 inventory (GFED4) (van der Werf et al., 2010) was used for biomass burning, and biogenic emissions such as isoprene emissions were simulated by MEGAN version 2.1 (MEGAN2.1) (Guenther et al., 2012). The details of biogenic isoprene emissions in MEGAN2.1 are described in the following section.
2.4 Isoprene emissions in MEGAN2.1 and two drought stress algorithms used in this study
In GEOS-Chem, biogenic isoprene emission factor (γ2.1) in MEGAN2.1 is represented as below (Guenther et al., 2006; Guenther et al., 2012):
where CFAC is a canopy environment coefficient, γPAR is a factor for light, γT is a factor for temperature, γAGE is a factor for leaf age, γLAI is a factor for leaf area index (LAI), is a factor for CO2 inhibition, and γSM is a factor for soil moisture. Here, the factors except for γSM can be referred to as γ0 to represent non-drought factors. γSM is set to one by default in the standard GEOS-Chem because there is no available soil moisture database. Therefore, this limitation can lead to overestimation of isoprene emissions and the following HCHO column under the drought condition (Wang et al., 2022b).
We implemented two existing drought stress algorithms proposed for the better representation of isoprene emissions in MEGAN under drought condition and tested them in the South Korean region. One drought stress algorithm implemented in this study was proposed in Wang et al. (2022b). Wang et al. (2022b) found that GEOS-Chem overestimated HCHO column in the SE US compared to the OMI HCHO column under drought condition and this overestimation was larger in high surface temperature condition (above 300 K). The drought stress algorithm was derived to minimize these HCHO column biases between OMI and GEOS-Chem, and the resultant formula for γSM is shown below:
where T is surface temperature and βt is soil moisture stress. To get βt value at each grid in GEOS-Chem, an ecophysiology module developed by Lam et al. (2023) was adopted in GEOS-Chem. The basic formulations in the ecophysiology module are based on the Joint UK Land Environmental Simulator (JULES) (Best et al., 2011; Clark et al., 2011), and this ecophysiology module can calculate soil moisture stress (βt) using gridded soil parameter data from Hadley Centre Global Environment Model version 2–Earth System Model (HadGEM2-ES). This soil moisture stress (βt) ranges from zero (fully stressed) to one (no stress) and it can be used as a threshold to trigger the drought stress algorithm in MEGAN2.1. In this study, the threshold for the βt was set to 0.64 which was 60 % percentile of βt in the South Korean drought condition (Fig. S3), similar to the threshold used for the SE US (0.60) in Wang et al. (2022b).
The other drought stress algorithm implemented in this study was proposed in Jiang et al. (2018). Based on the observed physiological response of vegetations to drought stress, this drought stress algorithm was derived by reducing Vcmax, which is a maximum carboxylation rate by photosynthetic RuBisCo enzyme in vegetations (Jiang et al., 2018). The resultant formula for γSM is shown below:
The Vcmax value is also available from the ecophysiology module in GEOS-Chem. The α value of 77 was derived to minimize the mean bias of isoprene fluxes between GEOS-Chem and the measurement at the Missouri Ozarks AmeriFlux (MOFLUX) site under the SE US drought condition (Wang et al., 2022b).
It is noteworthy that these two drought stress algorithms were developed or tuned based on observational constraints pertaining to the SE US region. In the next section, we investigated whether these two drought stress algorithms work in the South Korean region or not. Given that the HCHO column is the main constraint of isoprene emissions, the investigation focused on the comparison between the OMI HCHO column and the HCHO column simulated with these two drought stress algorithms. For convenience purposes, the simulations with drought stress algorithms by Wang et al. (2022b) and by Jiang et al. (2018) were referred to as WD and JD, respectively.
3.1 HCHO column biases in the standard GEOS-Chem
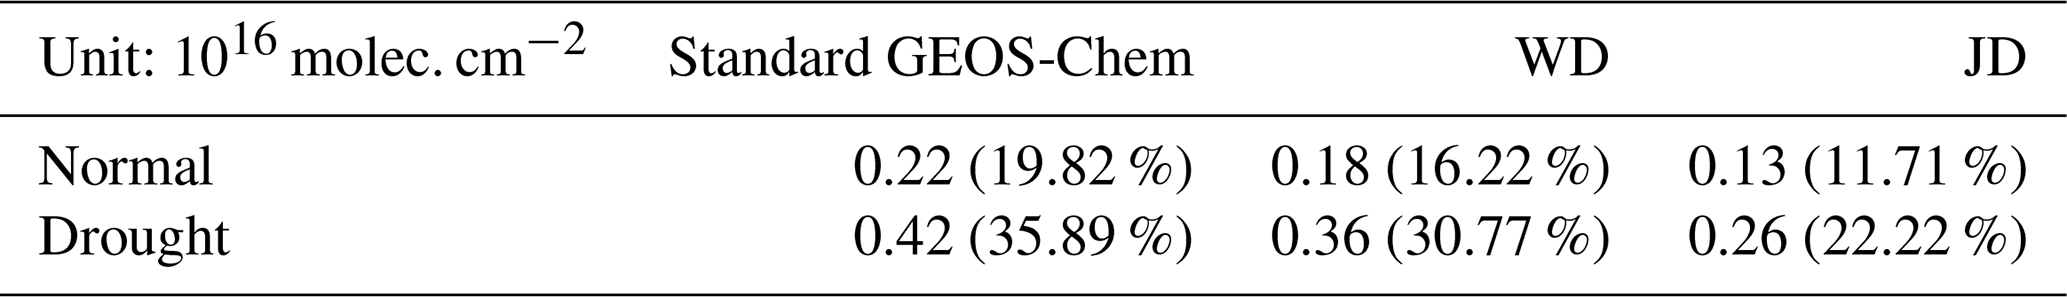
Before investigating the two drought stress algorithms, we first compared the HCHO columns from the OMI and from the standard GEOS-Chem under the normal and drought conditions in the South Korean region (Fig. 2). The mean OMI HCHO column in South Korea was 1.11 × 10¹⁶ molec. cm−2 under the normal condition during the study period (2016–2018 JJA) and increased by 5.4 % to 1.17 × 10¹⁶ molec. cm−2 under the drought condition (Fig. 2a–c). Wasti and Wang (2022) showed comparable increases of the OMI HCHO column under the South Korean drought condition, which were 2.97 % in the mild drought and 8.02 % in the extreme drought. An increase of similar percentages in HCHO columns was also found in other regions under drought condition such as the SE US and Amazon (Li et al., 2022; Morfopoulos et al., 2022; Wang et al., 2022b). It is known that the impact of water stress on isoprene emissions depends on the severity of the drought (Potosnak et al., 2014; Seco et al., 2015; Wasti and Wang, 2022). To examine this impact, the DEDI was separated into five categories following Zhang et al. (2022): Normal/Wet, Incipient drought, Moderate drought, Severe drought, and Extreme drought (Table S1 in the Supplement). Based on these five categories, we calculated the observed HCHO columns in each drought category (Fig. S4). While the domain-mean HCHO columns tended to increase as the drought became stronger, the signal is weak and not uniform by location. For example, the OMI HCHO column over the northeastern parts of South Korea (Taebaek Mountains), which showed a decrease under the drought condition (Fig. 2a–c), showed an increase only under the extreme drought category (Fig. S4). This is probably because our study period included only three summers. Given the small sampling size, we chose not to separate drought severity in the following analysis. By comparison, the mean HCHO columns simulated by the standard GEOS-Chem was 1.33 × 10¹⁶ molec. cm−2 under the normal condition and increased by 20.23 % to 1.59 × 10¹⁶ molec. cm−2 under the drought condition (Fig. 2d–f). Thus, the model was found to significantly overestimate the increase of the HCHO column under the drought condition compared to that of the OMI HCHO column. This overestimation can be further revealed by the model biases under both normal and drought conditions. The model (relative) biases of the HCHO column were 0.22 × 10¹⁶ molec. cm−2 (19.82 %) under the normal condition and 0.42 × 10¹⁶ molec. cm−2 (35.89 %) under the drought condition (Table 1). The model bias increased by 0.20 × 10¹⁶ molec. cm−2 (16.07 %) under the drought condition, indicating larger HCHO column bias under the drought condition. The spatial correlation between the OMI HCHO column and the standard GEOS-Chem under the normal condition was 0.58 (Fig. S5a), which was statistically significant at a 99 % confidence level based on the Student's t-test. It indicates that the GEOS-Chem has reasonable performance in terms of spatial distribution of the HCHO column under the normal condition. However, the lower spatial correlation between two (0.32) was found under the drought condition (Fig. S5b), which consistently indicated the worsening performance of GEOS-Chem under the drought condition. The worsening performance of GEOS-Chem under the drought condition was also found in other regions. In the SE US region (Wang et al., 2022b), for example, GEOS-Chem had a minimal bias of the HCHO column (0.05 × 10¹⁶ molec. cm−2) under the normal condition, and the biases tended to increase with the drought severity (0.08 × 10¹⁶–0.15 × 10¹⁶ molec. cm−2), resulting in 1.1–1.5 times higher increases of the HCHO column under the drought condition compared to that of the OMI HCHO column.
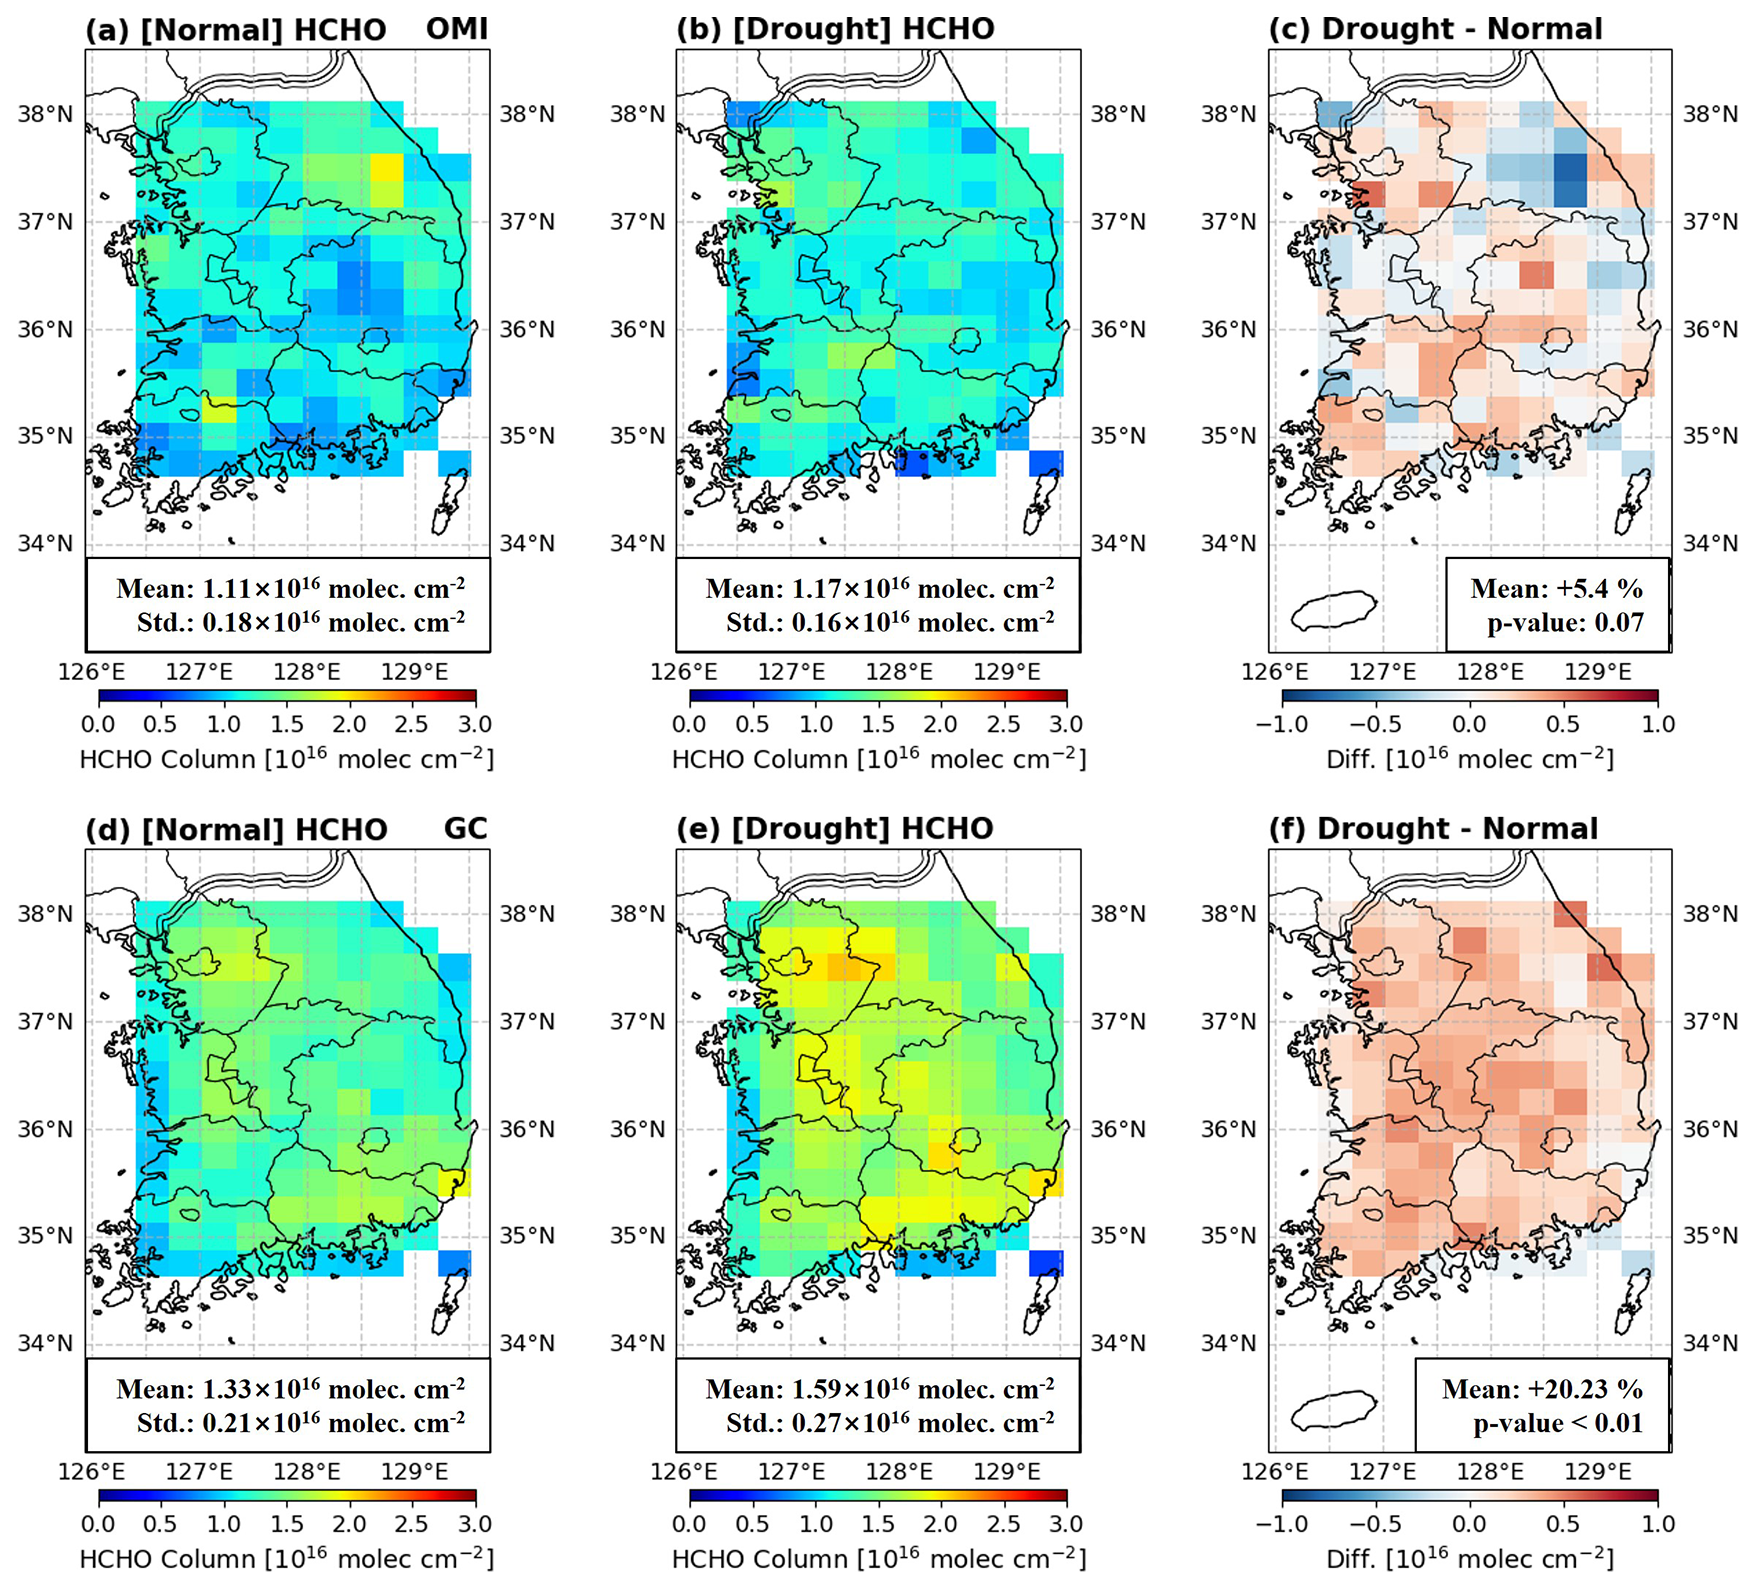
Figure 2The OMI HCHO column under (a) the normal condition, (b) the drought condition, and (c) the difference (drought – normal). (d–f) Same as (a)–(c) but for the standard GEOS-Chem. The mean and standard deviation (Std.) is presented in each panel and p-value for the mean difference was derived from Student's t-test.
Table 1The mean HCHO column bias (relative bias) of GEOS-Chem simulations under the normal condition and drought condition in South Korean region.
As described in the aforementioned study (Wang et al., 2022b), the worsening performance of GEOS-Chem under the drought condition suggested an improper representation of the drought-induced change in the model. Given that HCHO is produced by oxidation of VOCs emitted to the atmosphere, we examined how the anthropogenic VOC (AVOC) and BVOC emissions over South Korea changed under the drought condition compared to the normal condition in the model (Fig. 3a). Here, following Lee and Park (2022), AVOC emissions included toluene, xylene, lumped alkanes (≥ C4), benzene, acetaldehyde, lumped alkene (≥ C3), C2H6, C3H8, and HCHO. BVOC emissions included isoprene, acetone, acetaldehyde, and lumped alkene (≥ C3). In the model, the total amount of AVOC emissions was consistent throughout the normal and drought conditions while that of BVOC emissions increased by 65.55 % under the drought condition compared to the normal condition. Therefore, AVOC emission changes could be ruled out and it is the increase of BVOC emissions that caused the large increase of HCHO columns in GEOS-Chem under drought condition. Since the model has a large overestimation of HCHO columns under drought, BVOC emissions were likely overestimated under drought condition. Wildfires are another source that can cause HCHO column bias in the model (Alvarado et al., 2020; Liao et al., 2021). However, most of the wildfires in South Korea occur in the winter-spring season and there was no major wildfire in South Korea in the study period (2016–2018 JJA) (Jo et al., 2023).
Given that isoprene emissions were the most dominant BVOC emissions (more than 85 %) in South Korea (Fig. S6), we examined isoprene emissions in the standard GEOS-Chem model by comparing their spatial distributions under the normal and drought conditions (Fig. 3b–d). The reason why isoprene emissions are higher than monoterpenes and sesquiterpenes is because of the type of forests in South Korea. According to the Korea Forest Service (https://english.forest.go.kr/kfsweb/kfi/kfs/cms/cmsView.do?cmsId=FC_001679&mn=UENG_01_03#:~:text=Status%20of%20Forest%20in%20Korea&text=The%20forested%20area%20in%20Korea, last access: 7 November 2025), about 60 % of forests in Korea consist of deciduous-leaved forests (Quercus mongolica, Quercus variabilis, and Quercus acutissima) and mixed forests, and 36.9 % are coniferous forests. The deciduous-leaved trees are well-known sources of biogenic isoprene. The mean (total) fluxes of isoprene emissions over South Korea were 3.76 × 10⁻¹⁰ kg m−2 s−1 (25.08 Gg/week) under the normal condition and 6.45 × 10⁻¹⁰ kg m−2 s−1 (42.47 Gg/week) under the drought condition. Notably, the mean (total) fluxes of isoprene emissions under the drought condition were 71.5 % (68.54 %) higher compared to the normal condition. This increase of isoprene emissions was larger than that of the simulated HCHO column. The difference could be caused by enhanced HCHO loss by the increased photolysis under the clear sky during the drought condition (Naimark et al., 2021; Wang et al., 2022b). Spatially, the increase of isoprene emissions is the largest over the eastern and central parts of the region (Fig. 3d). These areas correspond to two mountain ranges in South Korea, the TaeBaek (TB) and the SoBaek (SB) mountain ranges, respectively (Yu et al., 2023). The high isoprene emissions in these regions are due to the high densities of broadleaf deciduous temperate trees, which are well-known sources of biogenic isoprene (Jang et al., 2020; Yu et al., 2023).
Despite the significant increase of isoprene emissions in the mountain ranges under the drought condition, the increase of the HCHO column under the drought condition was relatively homogeneous in the model (Fig. 2f). The HCHO production depends on the abundance of oxidants such as nitrogen oxides (NOx= NO2+ NO). In the low NOx environment, high isoprene emissions can suppress hydroxyl radicals (OH), leading to lower HCHO yield than in the high NOx environment (Marais et al., 2012; Wells et al., 2020). Indeed, we computed a ratio between the modeled HCHO column change (Drought – Normal) and the modeled isoprene emissions change (Fig. S7a) and found that the ratio tended to be higher over the regions with higher NO2 column (northwest and southeast) compared to the mountain ranges with lower NO2 column (Fig. S7b–c). Therefore, the different HCHO productions under the different abundance of NOx could result in the relatively homogeneous distribution of the modeled HCHO column compared to that of isoprene emissions. Given that the modeled HCHO column was affected by the abundance of NOx, the model performance on NO2 could play a role on the larger HCHO column bias under the drought condition. However, GEOS-Chem was found to have only small NO2 column bias (less than −3.0 %) in the South Korean region and the bias was smaller under the drought condition than the normal condition (Fig. S7d). Therefore, larger HCHO column bias under the drought condition was unlikely caused by NO2 bias.
Based on the above discussions, the larger HCHO column bias under the drought condition was likely caused by the model overestimation (71.5 % increase) of isoprene emissions under the drought condition in South Korea. As described in Sect. 2.4, MEGAN2.1 implementation in the standard GEOS-Chem model does not have the soil moisture parameter and hence overestimates isoprene emissions under the drought condition. The drought stress algorithms (i.e., WD and JD; Sect. 2.4) were developed to address this caveat. For example, Wang et al. (2022b) showed that the increases of isoprene emissions under the SE US drought condition were 22.7 %–56 % in GEOS-Chem and those were reduced to 15.2 %–35.23 % after implementing their drought stress algorithm. Given this, we implemented two existing drought stress algorithms (WD and JD; Sect. 2.4) in the following section and investigated whether they could reduce the overestimation of isoprene emissions and correct the HCHO column bias under the drought condition in South Korea.
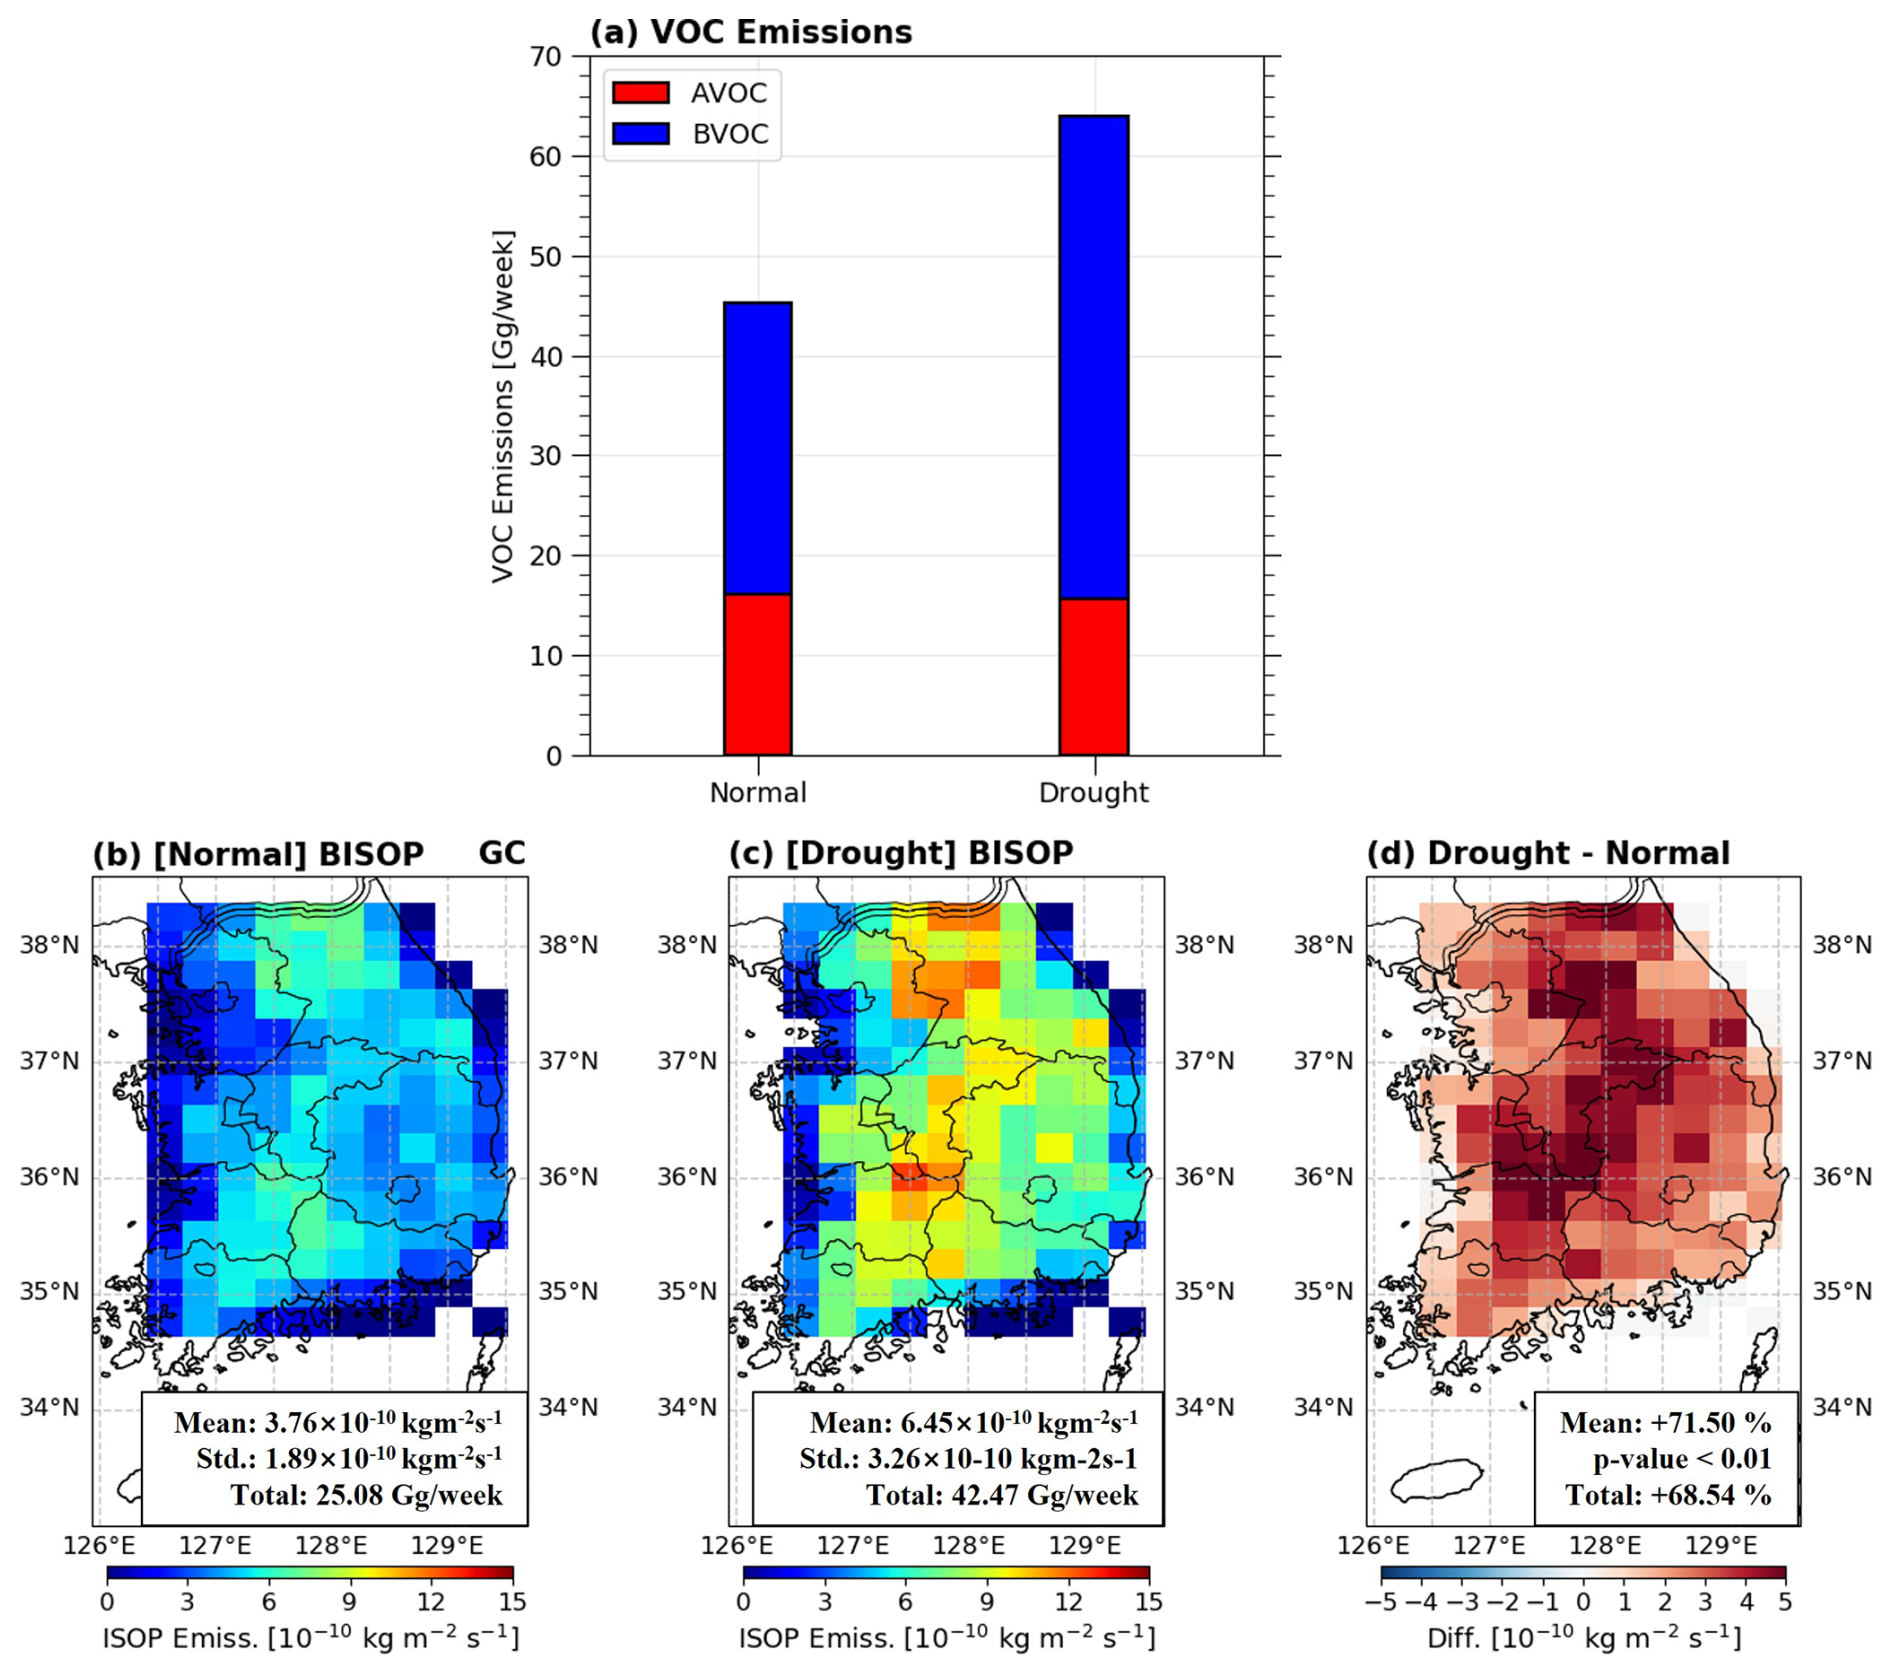
Figure 3(a) The total amounts of AVOC and BVOC emissions over South Korea under the normal and drought conditions. (b) The biogenic isoprene emissions (BISOP) under (b) the normal condition, (c) the drought condition, and (d) the difference (drought–normal) in the standard GEOS-Chem. The mean and standard deviation (Std.) is presented in each panel and p-value for the mean difference was derived from Student's t-test.
3.2 HCHO column biases in two existing drought stress algorithms
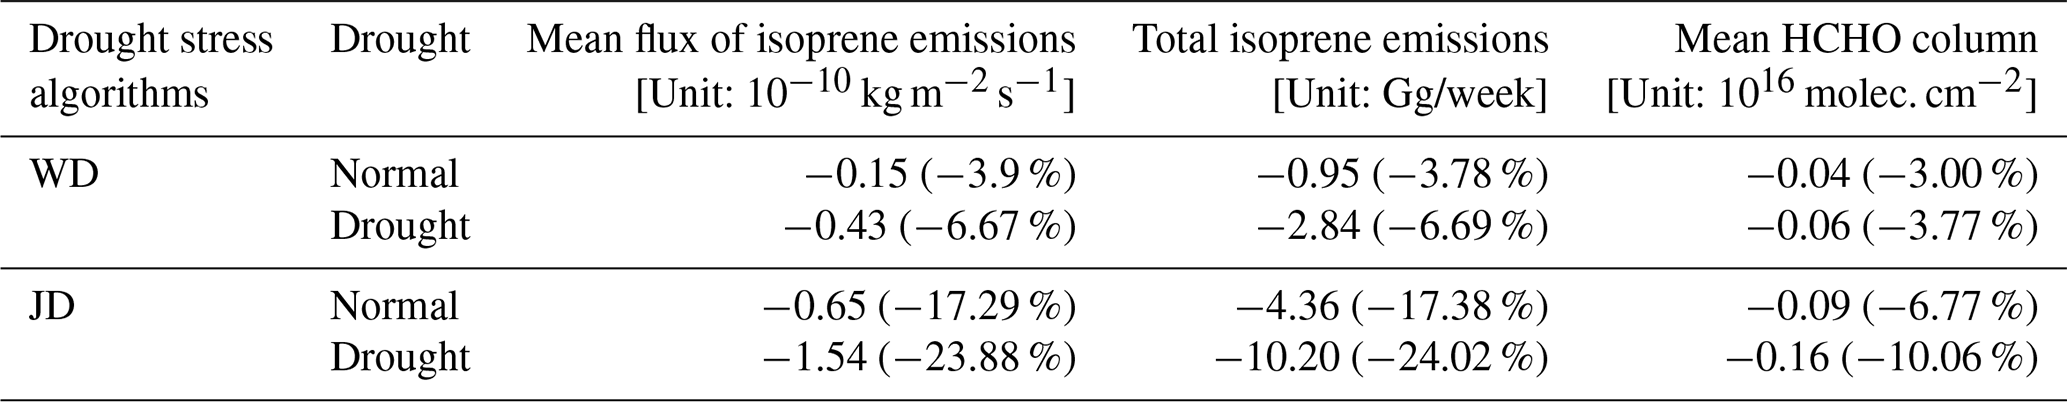
Figure 4a–f show the spatial distributions of isoprene emissions simulated by WD and JD. Both WD and JD showed significant increases of isoprene emissions over the mountain ranges under the drought condition, which was consistent with the standard GEOS-Chem, but the magnitudes of the increases were reduced. In WD (Fig. 4a–c), the mean (total) fluxes of isoprene emissions were 3.61 × 10⁻¹⁰ kg m−2 s−1 (24.13 Gg/week) under the normal condition and 6.02 × 10⁻¹⁰ kg m−2 s−1 (39.63 Gg/week) under the drought condition. Compared to the standard GEOS-Chem (Table 2), under the normal condition, the mean flux of isoprene emissions was reduced by 0.15 × 10⁻¹⁰ kg m−2 s−1 (3.9 %) and the total isoprene emission was reduced by 0.95 Gg/week (3.78 %). Under the drought condition (Table 2), the mean flux of isoprene emissions was reduced by 0.43 × 10⁻¹⁰ kg m−2 s−1 (6.67 %) and the total isoprene emission was reduced by 2.84 Gg/week (6.69 %). The increase of the mean (total) fluxes of isoprene emissions under the drought condition was 66.75 % (64.24 %), which was reduced by 4.3 % compared to the standard GEOS-Chem. In JD (Fig. 4d–f), the mean (total) fluxes of isoprene emissions were 3.11 × 10⁻¹⁰ kg m−2 s−1 (20.72 Gg/week) under the normal condition and 4.91 × 10⁻¹⁰ kg m−2 s−1 (32.27 Gg/week) under the drought condition. Compared to the standard GEOS-Chem (Table 2), under the normal condition, the mean flux of isoprene emissions was reduced by 0.65 × 10⁻¹⁰ kg m−2 s−1 (17.29 %) and the total isoprene emission was reduced by 4.36 Gg/week (17.38 %). Under the drought condition (Table 2), the mean flux of isoprene emissions was reduced by 1.54 × 10⁻¹⁰ kg m−2 s−1 (23.88 %) and the total isoprene emission was reduced by 10.20 Gg/week (24.02 %). The increase of the mean (total) fluxes of isoprene emissions under the drought condition was 57.88 % (55.74 %), which was reduced by 12.8 % compared to the standard GEOS-Chem.
The spatial distributions of the HCHO columns in WD and JD are presented in Fig. 4g–l. In WD, the mean HCHO columns in South Korea were 1.29 × 10¹⁶ molec. cm−2 under the normal condition and 1.53 × 10¹⁶ molec. cm−2 under the drought condition (Fig. 4g–i). In JD, they were 1.24 × 10¹⁶ molec. cm−2 under the normal condition and 1.43 × 10¹⁶ molec. cm−2 under the drought condition (Fig. 4j–l). The mean HCHO column biases (relative bias) under the normal and drought conditions were 0.18 × 10¹⁶ molec. cm−2 (16.22 %) and 0.36 × 10¹⁶ molec. cm−2 (30.77 %) in WD, respectively, and they were 0.13 × 10¹⁶ molec. cm−2 (11.71 %) and 0.26 × 10¹⁶ molec. cm−2 (22.22 %) in JD, respectively (Table 1). Although WD and JD reduced the biases of the HCHO column in the standard GEOS-Chem under both normal and drought conditions, the biases were still significant in those simulations especially under the drought condition. Furthermore, both drought stress algorithms simulated a much larger increase of the HCHO columns between normal and drought conditions (18.99 % in WD and 15.28 % in JD) than that indicated by OMI (5.4 %). Therefore, neither WD nor JD was effective for improving isoprene emissions under drought condition in South Korea. This is because both algorithms were developed and tuned based on the SE US region as described in Sect. 2.4. The two regions have different main deciduous-leaf tree species. South Korea has mainly Quercus mongolica, Quercus variabilis, and Quercus acutissima (Lee et al., 2025), while the SE US has Quercus stellata, Quercus alba, and Quercus prinus (Perry et al., 2022). This fundamental difference may cause ineffectiveness of WD and JD in South Korea. For example, the formula for WD was derived to minimize the HCHO column biases in the SE US where the biases of the HCHO column under drought condition were effectively reduced from 0.08 × 10¹⁶–0.15 × 10¹⁶ to −0.05 × 10¹⁶–0.02 × 10¹⁶ molec. cm−2 by implementing WD (Wang et al., 2022b). In South Korea, however, the bias of the HCHO column under the drought condition was reduced from 0.42 × 10¹⁶ only to 0.36 × 10¹⁶ molec. cm−2 by WD, indicating that the bias of the HCHO column was not effectively reduced by WD.
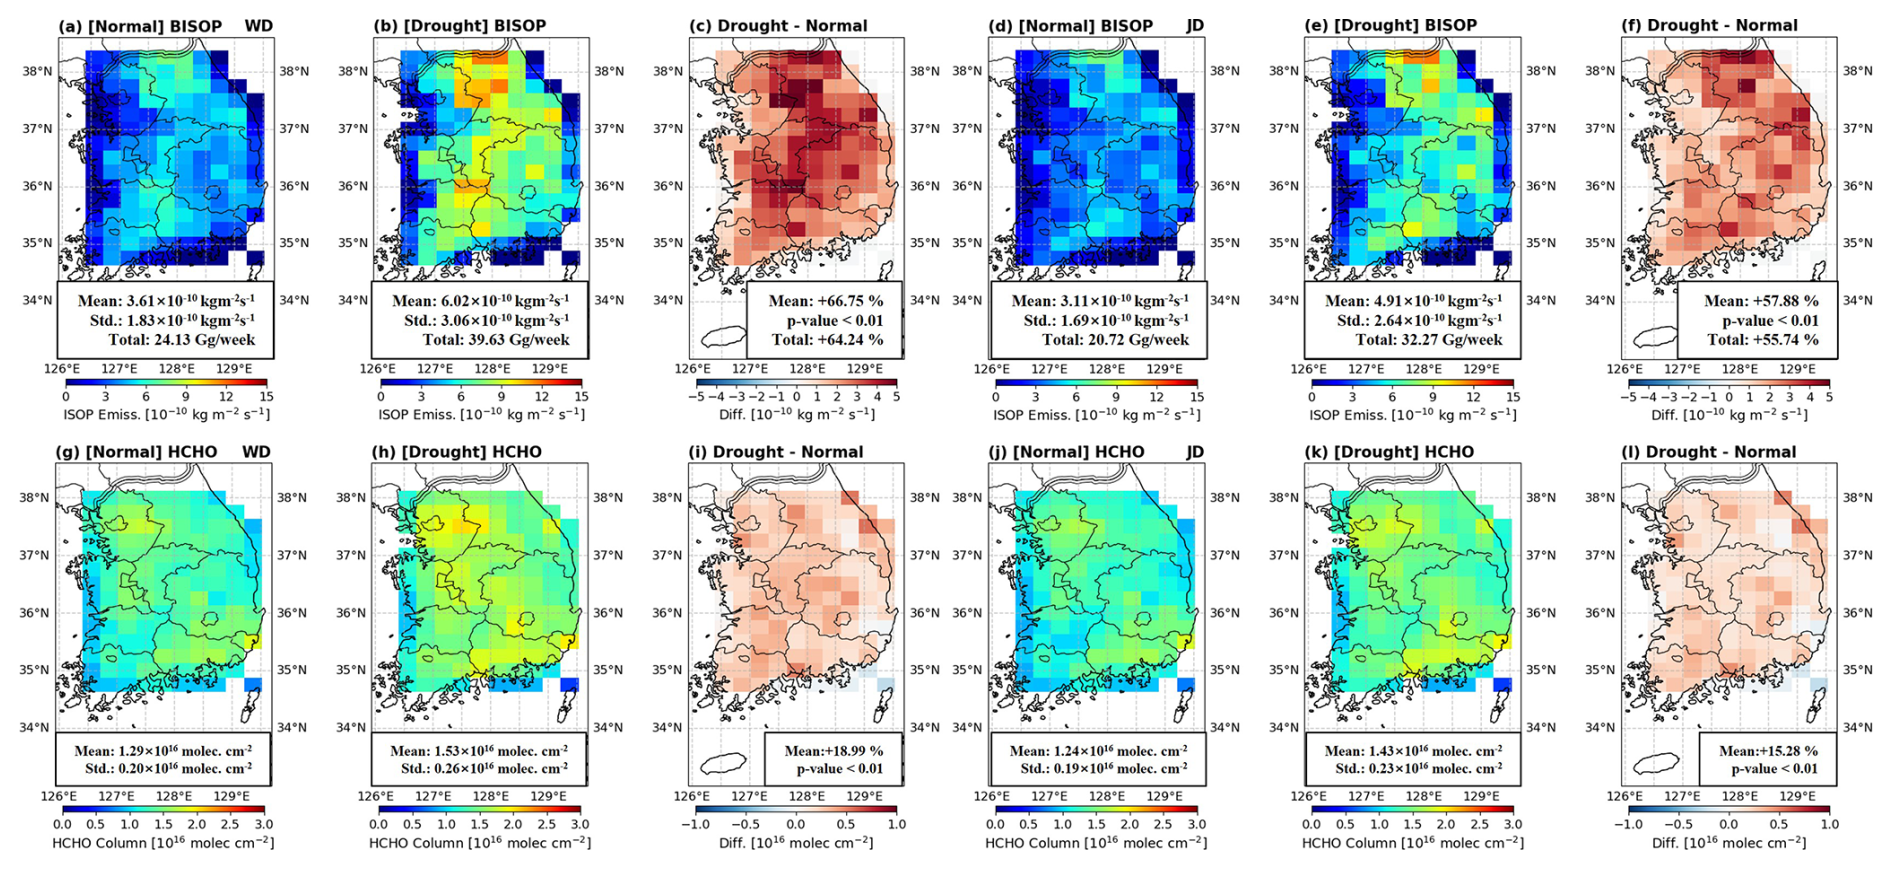
Figure 4The biogenic isoprene emissions (BISOP) in WD under (a) the normal condition, (b) the drought condition, and (c) the difference (drought – normal). (d–f) Same as (a)–(c) but in JD. The HCHO column in WD under (g) the normal condition, (h) the drought condition, and (i) the difference (drought – normal). (j–l) Same as (g)–(i) but in JD. The mean and standard deviation (Std.) is presented in each panel and p-value for the mean difference was derived from Student's t-test.
Table 2The differences (relative difference) in the biogenic isoprene emissions and the HCHO column simulated by each drought stress algorithms compared to the standard GEOS-Chem.
4.1 Iterative finite difference mass balance (IFDMB) method
Since the overestimation of isoprene emissions under the drought condition still existed with these two drought stress algorithms, alternative approaches are needed to reduce this overestimation. An inverse modeling method using the satellite HCHO column as top-down constraint could be a useful tool to estimate isoprene emissions. In this section, we applied one of the most widely used inverse modeling methods, an iterative finite difference mass balance (IFDMB) method, to quantify isoprene emissions more accurately and to improve the HCHO column biases in the South Korean region.
The IFDMB method is one of the widely used inverse modeling methods to estimate the targeted emissions at the surface from the satellite observation of the associated atmospheric chemical species (Choi et al., 2022; Cooper et al., 2017; Li et al., 2019; Momeni et al., 2024). This study focuses on estimating isoprene emissions by utilizing the HCHO column data derived from OMI satellite observations and GEOS-Chem model simulations. The IFDMB method calculates a scaling factor by assessing the difference between the observed and modeled HCHO columns, incorporating the sensitivity of the modeled HCHO columns to isoprene emissions in each iteration. This scaling factor is subsequently applied to refine isoprene emissions. Based on its simplicity, the IFDMB method is less computationally demanding and can be more efficient (Li et al., 2019) compared to other inverse modeling methods such as a four-dimensional variational data assimilation (4D-Var) method or a hybrid IFDMB-4DVar (Choi et al., 2022; Cooper et al., 2017). A limitation of the IFDMB method is that it neglects the effect of horizontal transport across the model columns, making it most suitable for chemical species with relatively short lifetimes. The lifetime of the isoprene and the HCHO in the atmosphere is known to be short (only a few hours) (Bates and Jacob, 2019), so we used the IFDMB method in this study taking advantage of its simplicity. The detailed estimation of the isoprene emission at each grid and iteration in the IFDMB method is shown below (Cooper et al., 2017; Li et al., 2019; Momeni et al., 2024):
where Et is the newly estimated isoprene emissions at the present iteration (a posterior), Ea is the isoprene emissions at the previous iteration (a priori), ΩO is the OMI HCHO column, Ωa is the HCHO column simulated by GEOS-Chem, and S is the sensitivity of the HCHO column with respect to isoprene emission change. S is defined at each grid and iteration as follows:
where E is the biogenic isoprene emission, ΔE is a change in the biogenic isoprene emission, Ω is the HCHO column, and ΔΩ is a change in the HCHO column. To get the initial value of S, an 20 % increase was applied to isoprene emissions simulated by MEGAN2.1 at each grid (Momeni et al., 2024). The S was obtained in every month in all 3 years. To avoid negative values in the posterior emissions, the constraint ( > −1) was set so that Et cannot be negative. In addition, to make consistency with other isoprene emission dataset, the maximum value of Et at each grid was set to long-term (2005–2014) daily maximum isoprene emissions from the GlobEmission data (Bauwens et al., 2016) which is another isoprene emission dataset estimated from the OMI HCHO column retrievals. The iteration continued until the normalized mean difference between Ea and Et was less than 1 % (Momeni et al., 2024). It required 5–7 iterations for each month to get the final posterior isoprene emissions. At every iteration, GEOS-Chem was set to read the newly updated isoprene emissions. Other biogenic emissions such as Limonene, Ethanol, Acetaldehyde, Acetone, Sesquiterpene, Alkenes, Monoterpenes, and MTPA, and all AVOC emissions were set to the same values as in the standard GEOS-Chem simulation to focus on isoprene emission changes. The assumption behind the application of IFDMB method was that AVOC emissions used in this study were correct, at least with much higher accuracy than isoprene emissions, which is the main caveat in this study. However, AVOC emissions were localized over the northwestern and southeastern parts of South Korea where major metropolitan areas are located (Fig. S8) while isoprene emissions were distributed over most of South Korea (Fig. 3b–c). Also, AVOC emissions were consistent throughout the normal and drought conditions (Figs. S8 and 3a), which means that changes in HCHO under the drought condition were caused by the changes in isoprene emissions. Therefore, the impact of AVOC emissions may be localized and spatially distinct from that of isoprene emissions.
4.2 Estimated isoprene emissions by the IFDMB and improvement in the HCHO column biases
Figure 5a–c show the distributions of the final posterior isoprene emissions estimated by the IFDMB. The overall distribution under the normal condition (Fig. 5a) was characterized by the high isoprene emissions over the TB and SB mountain ranges with high densities of biogenic isoprene sources, which was consistent with that from the standard GEOS-Chem (Fig. 3b). The increase of the isoprene emissions under the drought condition was also dominant over these mountain ranges (Fig. 5b–c). In both normal and drought conditions, therefore, the spatial distribution of isoprene emissions estimated by the IFDMB could represent higher isoprene emissions over the mountain ranges with large density of broadleaf trees. However, as expected by the positive HCHO column biases in the standard GEOS-Chem (Fig. 2), the IFDMB estimated the isoprene emissions over most of the South Korean region to be lower (Fig. 5a–b) compared to those in the standard GEOS-Chem (Fig. 3b–c) under both normal and drought conditions. The mean (total) fluxes of isoprene emissions over South Korea were 1.87 × 10⁻¹⁰ kg m−2 s−1 (12.50 Gg/week) under the normal condition and 2.59 × 10⁻¹⁰ kg m−2 s−1 (17.03 Gg/week) under the drought condition. Compared to the standard GEOS-Chem, isoprene emissions were reduced by 50.16 % under the normal condition, and by 60 % under the drought condition. The increase of isoprene emissions under the drought condition derived by the IFDMB was 36.24 %, much lower than that in the standard GEOS-Chem (68.54 %) and the two drought stress algorithms (64.24 % in WD, 55.74 % in JD). This amount of the increase of isoprene emissions during drought was consistent with those in other regions such as a 30 % increase in northern China (Wang et al., 2021) and 15 %–35 % increases in SE US region (Wang et al., 2022b).
The spatial distributions of the HCHO column derived from the final posterior isoprene emissions are presented in Fig. 5d–f. The mean HCHO columns in South Korea were 1.12 × 10¹⁶ molec. cm−2 under the normal condition and 1.24 × 10¹⁶ molec. cm−2 under the drought condition. The increase of the HCHO column under the drought condition was 10.71 %, comparable to that in OMI and much lower than that in the standard GEOS-Chem (20.23 %). Figure 5g compares the HCHO columns under the normal and drought conditions in all simulations with OMI. As expected, the smallest HCHO column bias was found in the IFDMB under both normal and drought conditions. The HCHO column biases of the IFDMB were 0.01 × 10¹⁶ molec. cm−2 under the normal condition and 0.07 × 10¹⁶ molec. cm−2 under the drought condition. Under the normal condition, the mean HCHO column bias with respect to OMI was 0.9 % in the IFDMB but the biases were 19.82 %, 16.22 %, and 11.71 % in the standard GEOS-Chem, WD, and JD, respectively. Under the drought condition, the mean HCHO column bias with respect to OMI was 5.98 % in the IFDMB compared to 35.9 %, 30.77 %, and 22.22 % in the standard GEOS-Chem, WD, and JD, respectively. Therefore, by adopting the IFDMB-derived biogenic isoprene emissions, the HCHO column biases were reduced under both normal and drought conditions in the South Korean region. This indicates that the IFDMB is effective to reduce the HCHO column biases by adjusting isoprene emissions than the two existing drought stress algorithms.
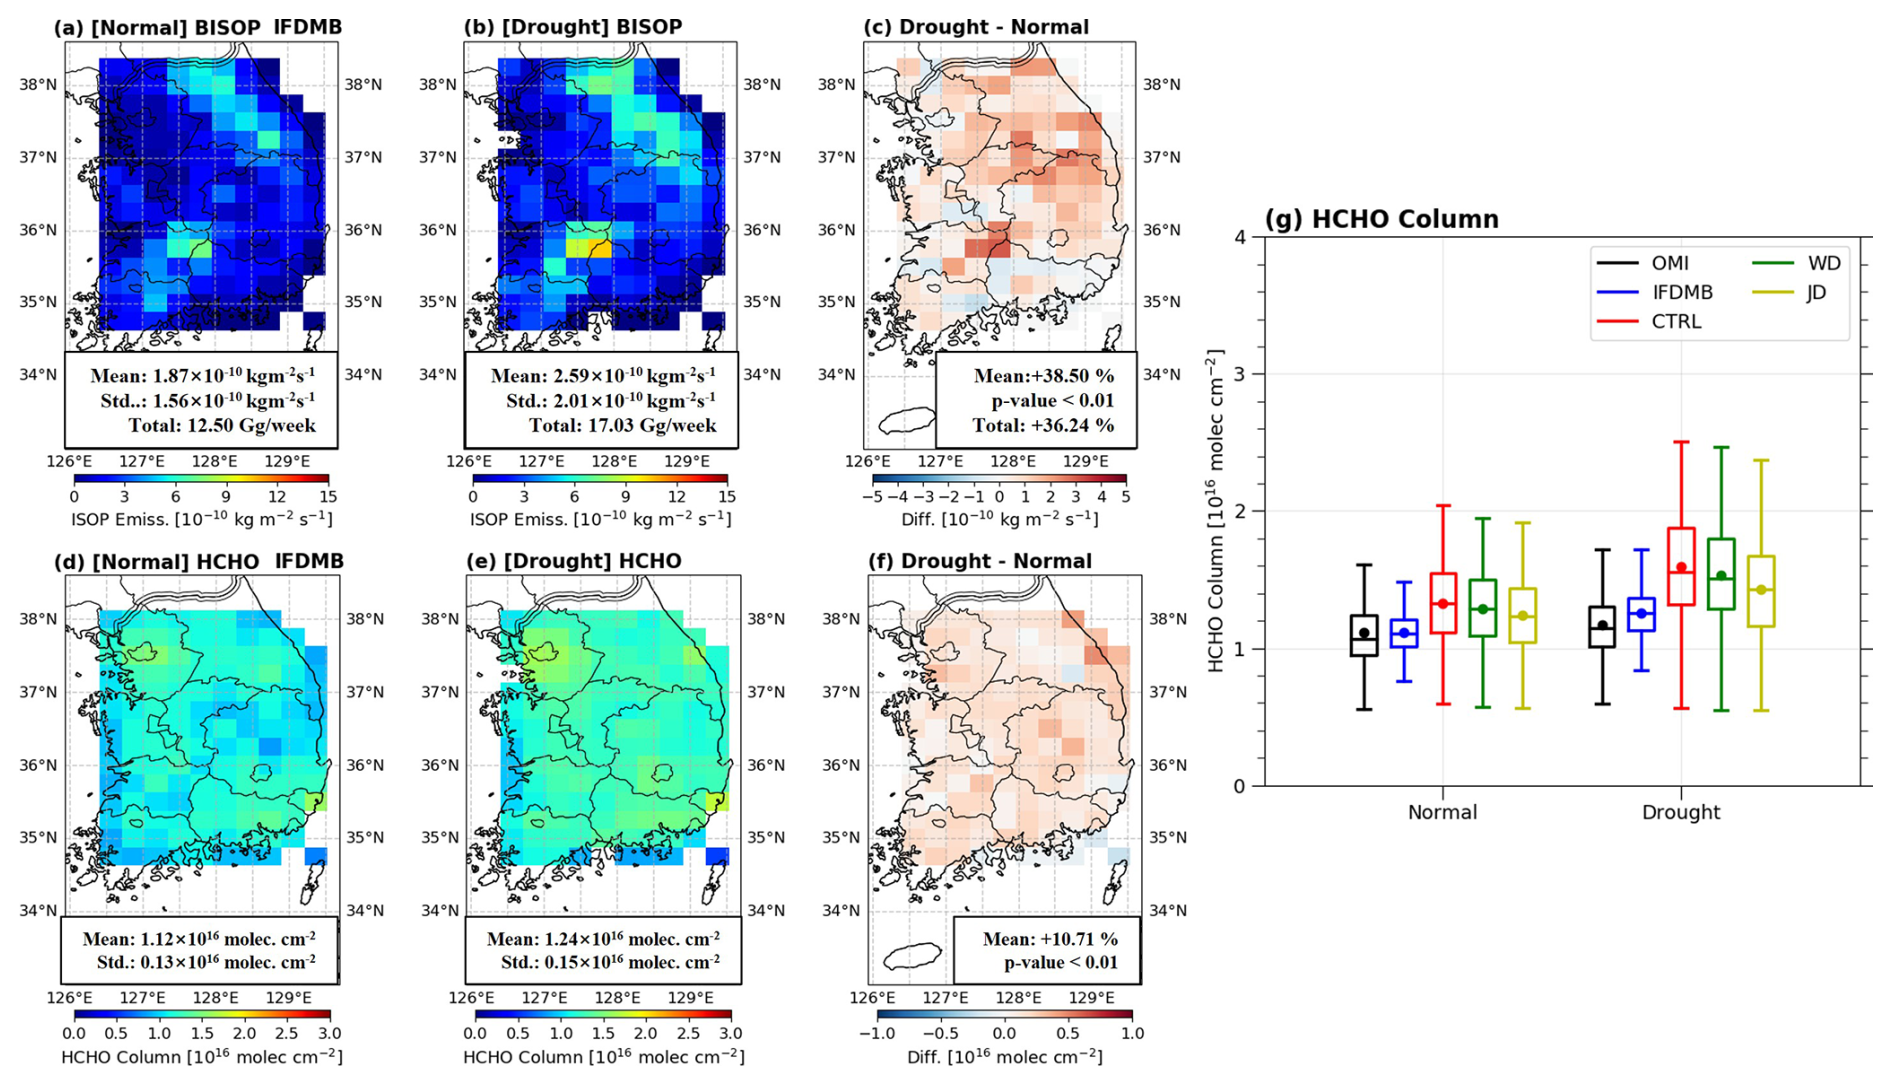
Figure 5The final posterior biogenic isoprene emissions (BISOP) under (a) the normal condition, (b) the drought condition, and (c) the difference (drought – normal) estimated by the IFDMB. The HCHO column under (d) the normal condition, (e) the drought condition, and (f) the difference (drought – normal) derived from the final posterior BISOP estimated by the IFDMB. The mean and standard deviation (Std.) is presented in each panel and p-value for the mean difference was derived from Student's t-test. (g) The boxplot for HCHO column in OMI and in all GEOS-Chem simulations. The box in boxplot extends from the first quartile (Q1) to the third quartile (Q3) with a line at the median value and a dot at a mean value. The inter-quartile range (IQR) is from Q1 to Q3, and the whisker in boxplot extends from the Q1–1.5 × IQR to the Q3 + 1.5 × IQR.
4.3 Other secondary aerosols such as O3 and PM2.5 in IFDMB
The changes in isoprene emissions can also lead to changes in other secondary air pollutants such as O3 and PM2.5. Regarding O3, previous studies showed that most of the South Korean region is in NOx saturated (VOC-limited) regime or transitional regime for O3 formation (Kashfi Yeganeh et al., 2024; Schroeder et al., 2020; Wasti and Wang, 2022). In these regimes, the decrease (increase) in HCHO can lead to decrease (increase) in O3 concentration. Given that there was no significant difference in NO2 column between the standard GEOS-Chem and the IFDMB (Fig. S7d), we investigated how the modeled O3 concentrations changed with posterior isoprene emissions estimated by the IFDMB. Figure 6a–b show scatter plots of daytime (07:00 a.m.–06:00 p.m. LT) mean O3 concentrations between the surface observations and the model outputs (black for standard GEOS-Chem and red for IFDMB) under the normal condition and the drought condition. Under the normal condition (Fig. 6a), the mean O3 concentrations in South Korea were 35.50 and 46.90 ppbv in the observation and the standard GEOS-Chem, respectively. The standard GEOS-Chem had positive O3 biases in most of the measurement sites, which was indicated by the normalized mean biases (NMB) of 33.58 %. After using posterior isoprene emissions estimated by the IFDMB, the modeled O3 concentrations decreased in most of the South Korean region. The mean O3 concentrations in the IFDMB were 44.23 ppbv under the normal condition, indicating that the mean O3 concentrations were reduced by 2.66 ppbv (5.67 %) with respect to the standard GEOS-Chem by applying IFDMB. As a result, the NMB in IFDMB was 25.91 % under the normal condition, which was reduced by 7.67 % compared to the standard GEOS-Chem. Other metrics such as coefficient of determination (R2) and root mean square error (RMSE) also show improvement in IFDMB compared to the standard GEOS-Chem (Fig. 6a). Under the drought condition (Fig. 6b), the mean observed O3 concentrations in South Korea was 43.15 ppbv, which was higher than those under the normal condition. The increase in O3 concentrations under the drought condition was consistent with the expectation of a VOC-limited regime in response to increasing HCHO yet no change in NO2 under the drought condition as seen by OMI (Fig. S7d). The mean O3 concentrations in the standard GEOS-Chem was 55.42 ppbv under the drought condition with the NMB of 31.04 %. In IFDMB, the mean O3 concentrations was 50.47 ppbv under the drought condition, which was reduced by 4.95 ppbv (8.93 %) with respect to the standard GEOS-Chem. This is consistent with the VOC-limited regime where the reduction in isoprene emissions by the IFDMB leads to reduced ozone concentrations. The NMB in the IFDMB was 19.63 % under the drought condition, reduced by 11.41 % compared to the standard GEOS-Chem. As under the normal condition, the improvement was also indicated by higher R2 and lower RMSE. Thus, the modeled O3 concentration was found to be improved by applying the IFDMB method for better isoprene emissions modeling.
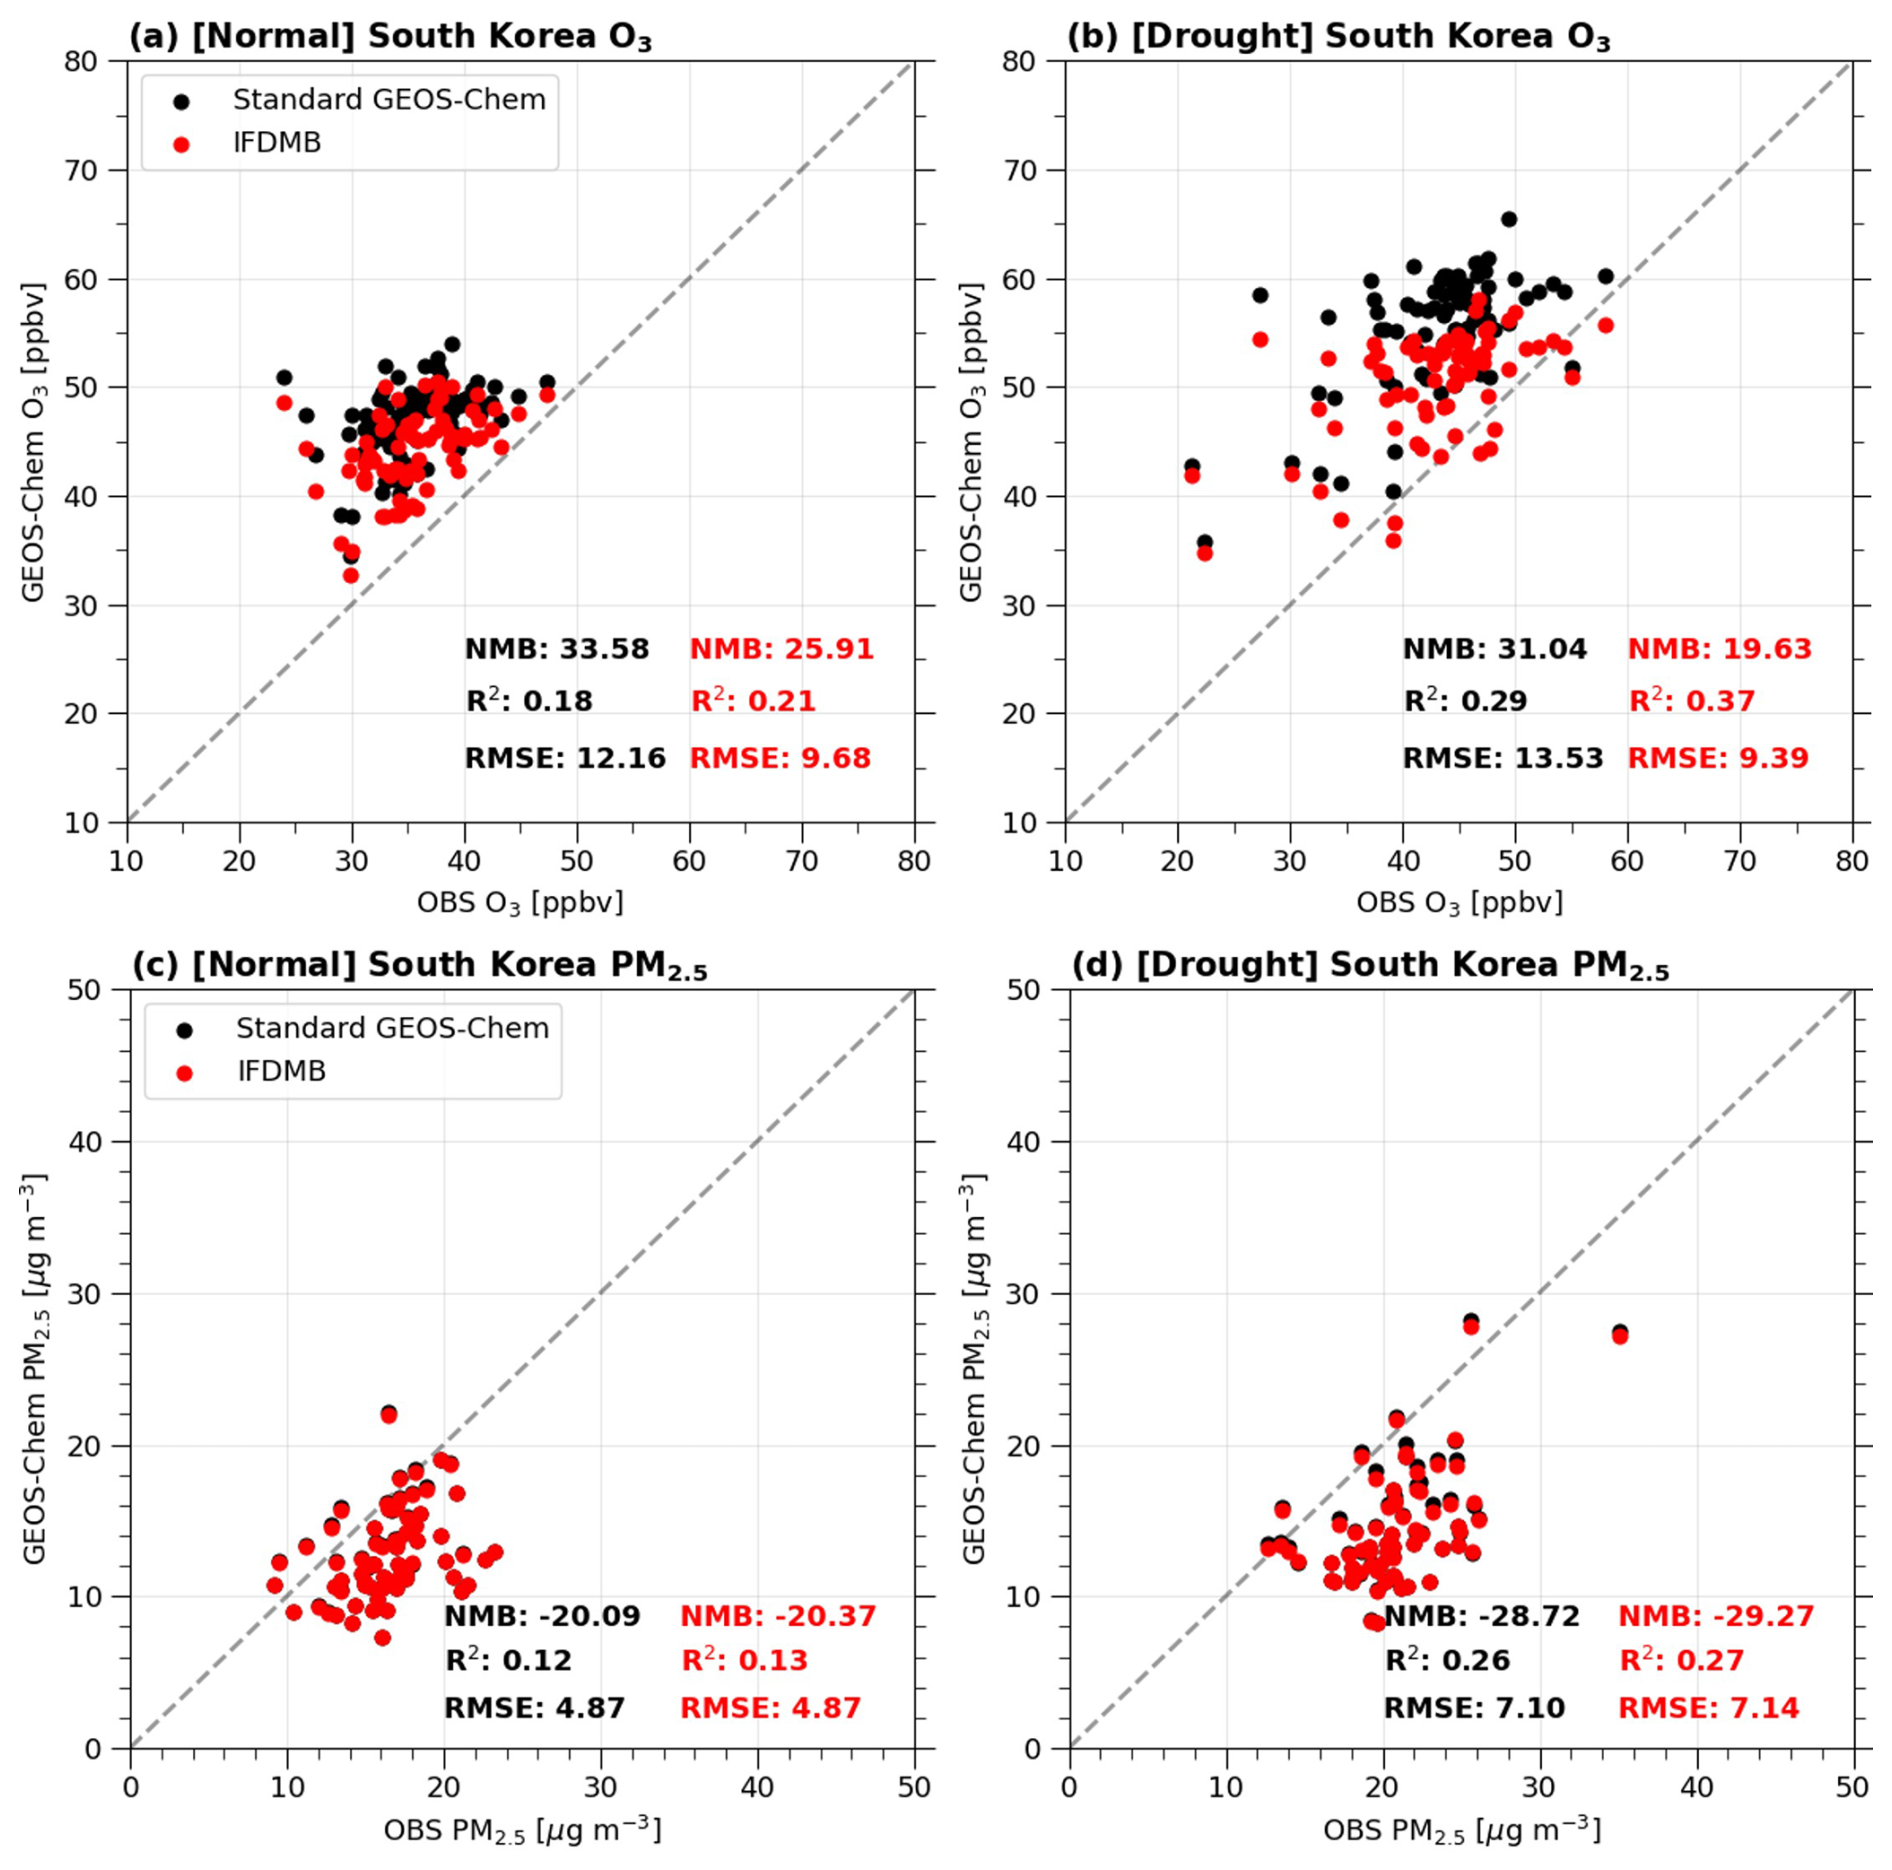
Figure 6The scatter plot for the observed O3 and the simulated O3 under (a) the normal and (b) drought conditions. Black and red dots denote standard GEOS-Chem and IFDMB, respectively. Normalized mean bias (NMB), coefficient of determination (R2), and root mean square error (RMSE) for the standard GEOS-Chem (black) and IFDMB (red) are presented in each panel. The gray dotted line is 1:1 line. (c–d) Same as (a)–(b) but for PM2.5.
Figure 6c–d show scatter plots of daytime (07:00 a.m.–06:00 p.m.) mean PM2.5 concentrations between the surface observations and the model outputs (black for standard GEOS-Chem and red for IFDMB) under the normal condition and the drought condition. Under the normal condition (Fig. 6c), the mean PM2.5 concentrations were 16.41 and 12.42 µg m−3 in the observation and the standard GEOS-Chem, respectively. The standard GEOS-Chem had negative PM2.5 biases in most of the measurement sites except for the Seoul metropolitan area. The NMB for the standard GEOS-Chem was −20.09 %. In IFDMB, contrary to ozone, the changes in PM2.5 concentration were not significant as indicated by the NMB, R2, and RMSE. Such insignificant changes in PM2.5 in IFDMB were also found under the drought condition (Fig. 6d). In South Korea, the major constituents in PM2.5 are the inorganic constituents such as nitrate (NO), sulfate (SO), ammonium (NH) emitted from the anthropogenic sources (Ryou et al., 2018; Park et al., 2020), which was the reason for the insignificant change in PM2.5 between the standard GEOS-Chem and the IFDMB.
4.4 Empirical equations to adjust MEGAN2.1 isoprene emissions in South Korea
Based on the IFDMB results, we derived empirical equations to adjust summertime (JJA) MEGAN2.1 isoprene emissions in South Korea in order to generalize a quantitative estimate of the drought impact on biogenic isoprene emissions in the region. Figure 7a shows the scatterplots between biogenic isoprene emissions scaled by LAI in the standard GEOS-Chem and in IFDMB under both normal and drought conditions. The scaling by the LAI was to consider the regional difference in biogenic isoprene emissions due to the different vegetation coverage (Wang et al., 2022b). We overlaid the surface temperatures at each point because it is known that isoprene emissions generally increase with the surface temperature in MEGAN2.1 (Guenther et al., 2012; Guenther et al., 2006). The significant differences between isoprene emissions in the standard GEOS-Chem and in the IFDMB were found mostly in conditions with high surface temperatures (Fig. 7a–b). This suggests that MEGAN2.1 implemented in the standard GEOS-Chem tends to overestimate isoprene emissions compared to those in the IFDMB in high surface temperatures under both normal and drought conditions. The isoprene emissions in the standard GEOS-Chem have a strong dependence on temperature (Sect. 2.4). This dependence may be overestimated in South Korea under high temperature conditions.
Given that a lack of ecophysiology module to simulate soil moisture (βt) was the main reason why the standard GEOS-Chem has significant biases in the drought condition, we constructed an equation to adjust MEGAN2.1 isoprene emissions by using soil moisture parameter (βt) to separate the normal and drought conditions in the model and using surface temperature to adjust MEGAN2.1 isoprene emissions in each condition. The basic equation was based on the difference between isoprene emissions from MEGAN2.1 and IFDMB, and was defined as follow:
where EMEGAN is the isoprene emissions in the standard GEOS-Chem, EIFDMB is the isoprene emissions estimated by the IFDMB, and γSM_OMI is for the term in the parentheses () to adjust EMEGAN. The term in the parentheses was referred to as γSM_OMI because it is derived from OMI and plays the same role as the isoprene emission factors (γSM) in the WD and JD algorithms (Eqs. 2 and 3) to adjust MEGAN2.1 isoprene emissions. Given that the difference between EIFDMB and EMEGAN was associated with the surface temperatures (Fig. 7a–b), we plotted γSM_OMI with respect to the surface temperatures under both normal and drought conditions (Fig. 7c–d). It was found that γSM_OMI exponentially decreased as the surface temperatures increased, which was consistent with the fact that EMEGAN in higher surface temperatures needed a stronger adjustment (Fig. 7a–b). The γSM_OMI near 295 K were close to 1 (Fig. 7c–d), which reflected similar isoprene emissions between the MEGAN2.1 and the IFDMB in lower surface temperature (Fig. 7a–b). Based on the exponentially fitted equations for γSM_OMI under the normal and drought conditions, the empirical equations for γSM_OMI were obtained as below:
where T is the surface temperature, and the e is the exponential constant. Here, we used the same soil moisture stress threshold (βt) to separate the normal and drought conditions. Also, we set a temperature threshold to apply these empirical equations only for the surface temperatures above 295 K because the fitted equations were obtained based on the samples above 295 K. It is noteworthy that the general form of these empirical equations for γSM_OMI was consistent with the equation in WD, indicating that equations for γSM_OMI in this study and in WD imposed stronger adjustment to MEGAN2.1 isoprene emissions in higher surface temperatures. However, the magnitude of the adjustment was generally stronger in this study than that in WD given the larger HCHO column biases in WD in South Korea (Fig. 4g–i; Table 1).
We further verified the proposed empirical equations for γSM_OMI (Eq. 7) by applying them to the MEGAN2.1 isoprene emissions and getting the adjusted isoprene emissions (Fig. 7e–f). The overall structures of the adjusted isoprene emissions were comparable to those in IFDMB under both normal and drought conditions (Fig. 5a–b). The pattern correlations between the adjusted isoprene emissions and those in the IFDMB were 0.73 under the normal condition, and 0.80 under the drought condition. The total fluxes of the adjusted isoprene emissions were 13.31 Gg/week the normal condition, 18.52 Gg/week under the drought condition, which was comparable to those in IFDMB (12.5 Gg/week under the normal condition, 17.03 Gg/week under the drought condition). Therefore, it was confirmed that applying the empirical equations for γSM_OMI to the MEGAN2.1 isoprene emissions could replicate isoprene emissions estimated by the IFDMB without running the inversion.
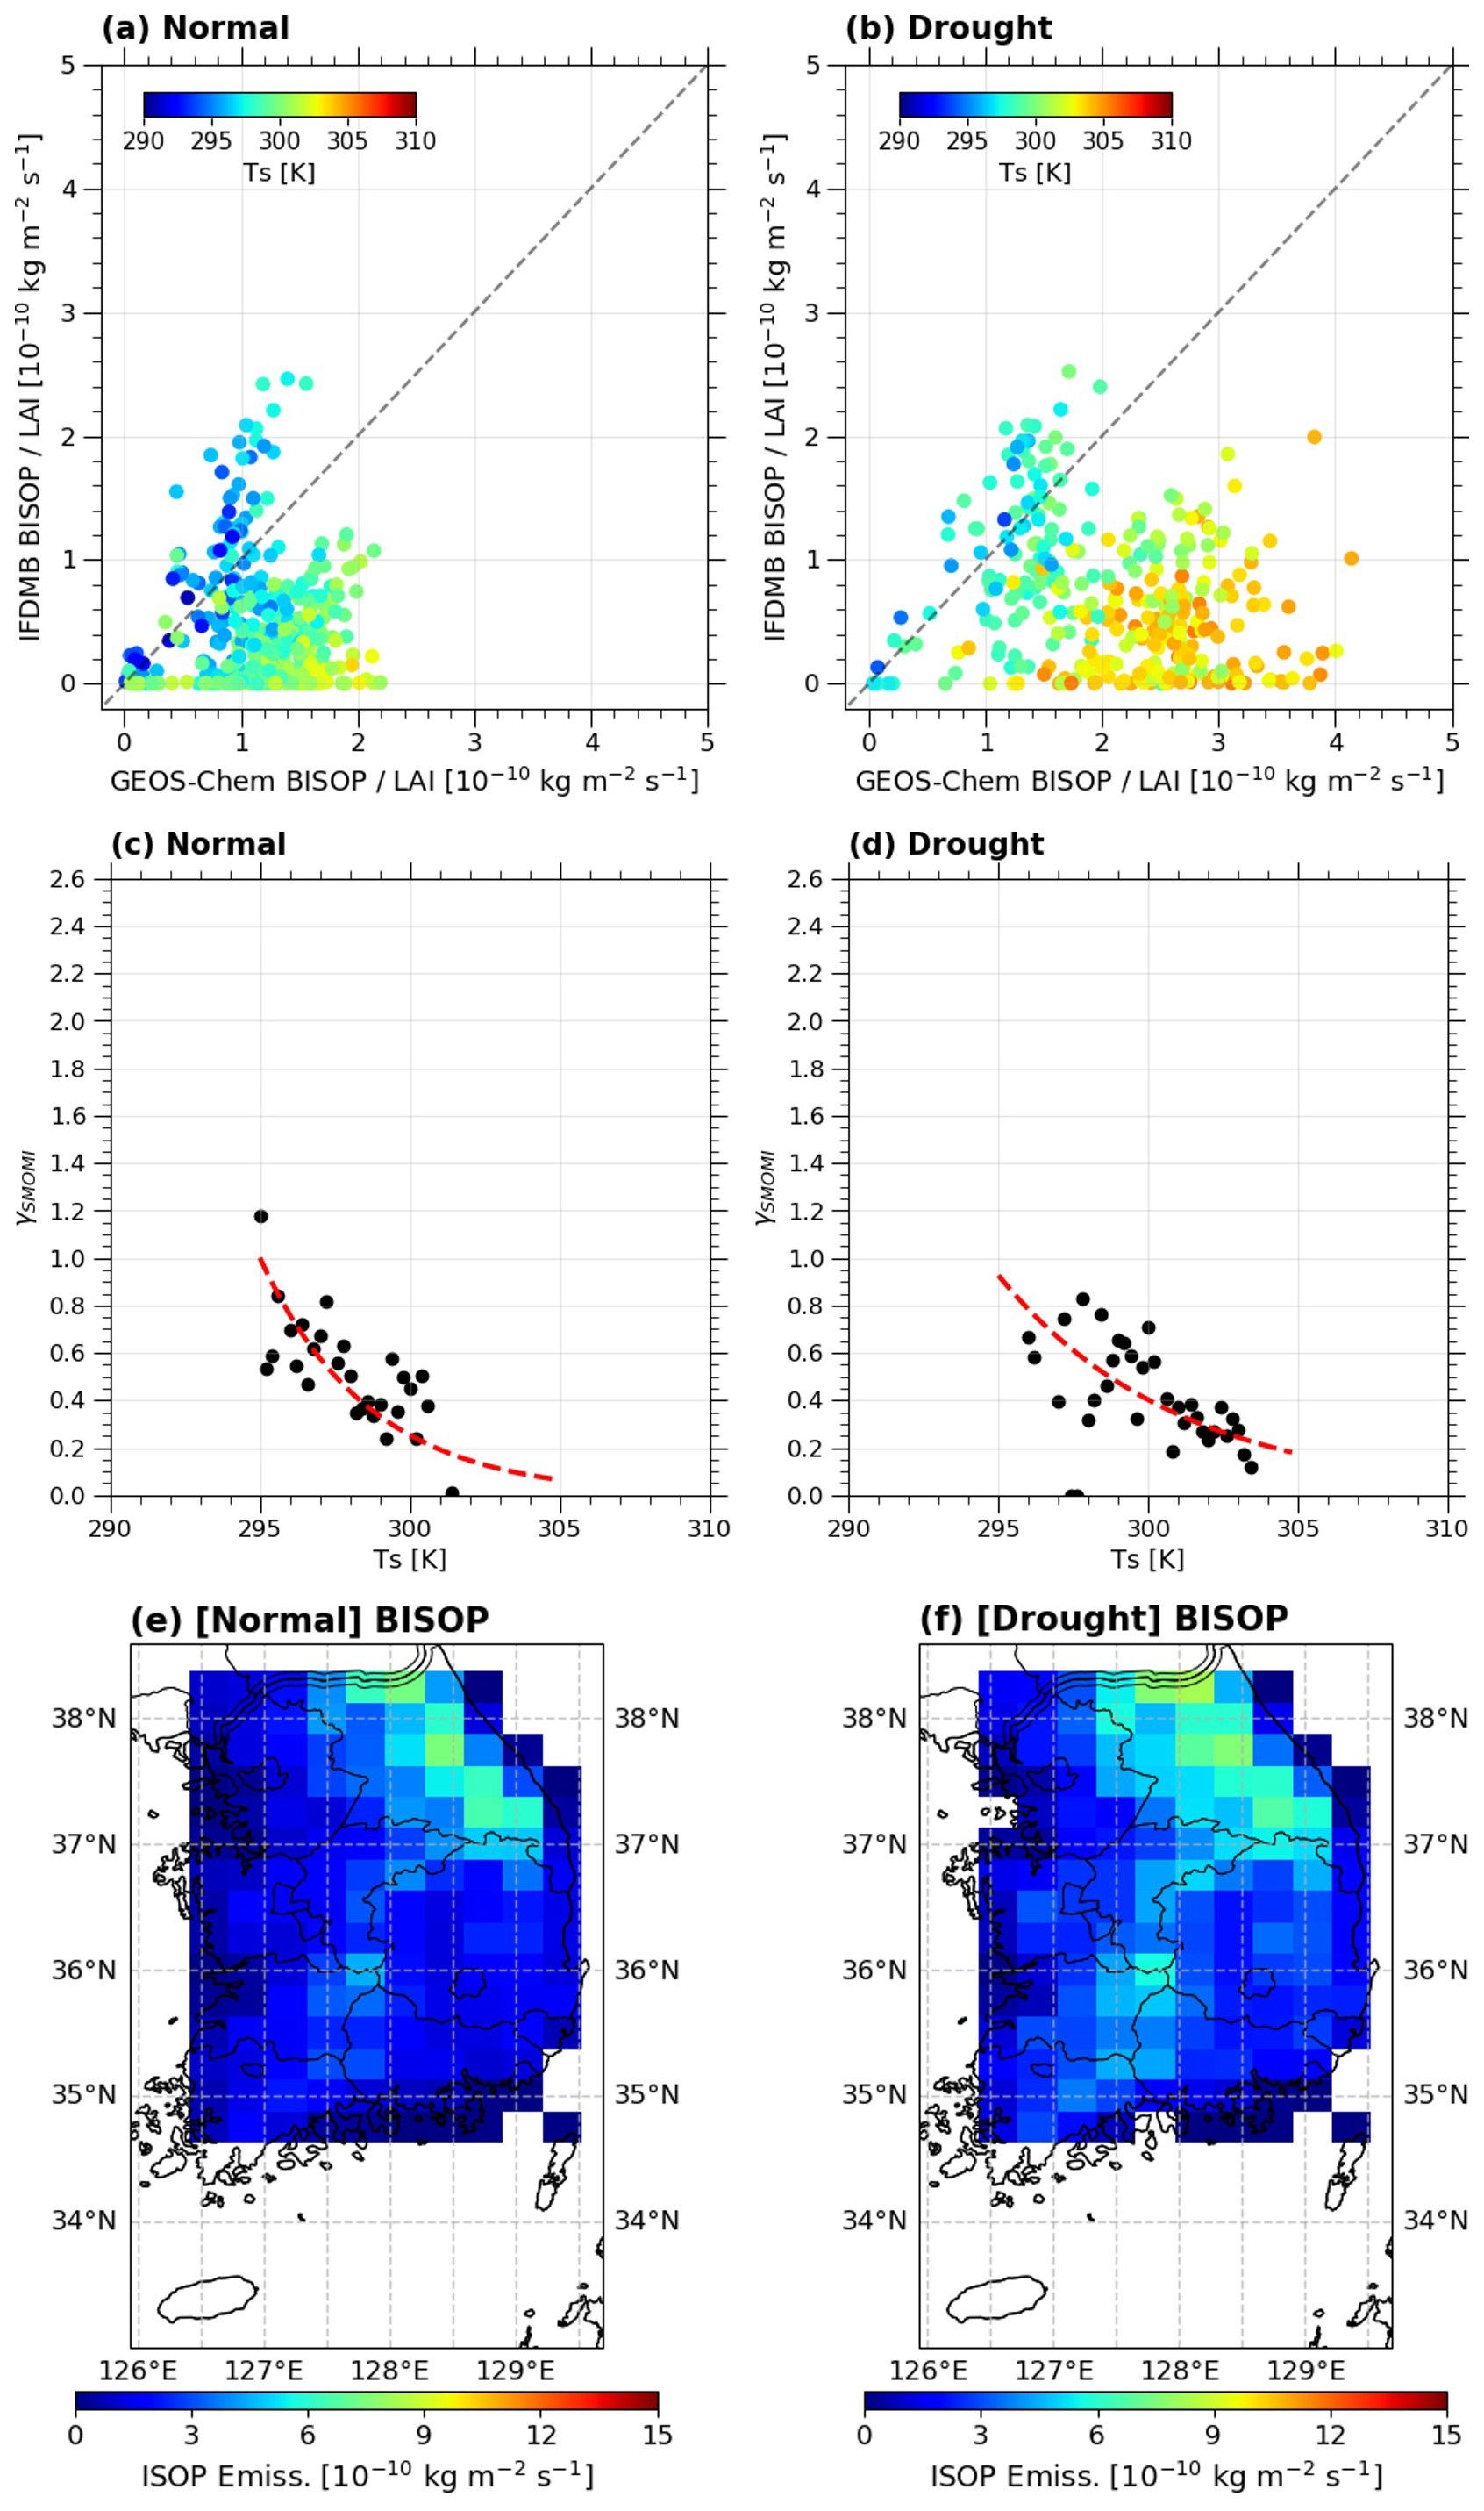
Figure 7The scatterplots between biogenic isoprene emissions in the standard GEOS-Chem and those in IFDMB under (a) the normal and (b) the drought conditions. Each dot represents isoprene emission value in the standard GEOS-Chem versus that in IFDMB at each grid point in South Korea. Here, the biogenic isoprene emissions were divided by LAI to consider the different vegetation coverage. The surface temperature was overlaid at each grid point. The gray dotted line is 1:1 line. γSM_OMI with respect to the surface temperatures with an interval of 0.2 K in (c) the normal and (d) the drought conditions. The red dotted lines indicate the fitted lines. The raw data points before binning in 0.2 K are provided in Fig. S9. The adjusted biogenic isoprene emissions by the empirical equations for γSM_OMI under (e) the normal and (f) the drought conditions.
In this study, we showed that the mean OMI HCHO columns were 1.11 × 10¹⁶ molec. cm−2 under the normal condition and 1.17 × 10¹⁶ molec. cm−2 under the drought condition, indicating 5.4 % increase of the mean HCHO column under the drought condition in South Korea (2016–2018 JJA). Compared to the OMI HCHO column, GEOS-Chem overestimated the HCHO column by 19.82 % under the normal condition and by 35.89 % under the drought condition. The worsening performance of GEOS-Chem during drought was likely caused by the overestimation of isoprene emission increase (71.5 %) under the drought condition. Given that MEGAN2.1 implementation in the standard GEOS-Chem model does not have the soil moisture parameter and hence overestimates isoprene emissions under the drought condition, we implemented two existing drought stress algorithms (WD and JD) for the MEGNA2.1 isoprene emission. Although mean flux of isoprene emission was reduced by 3.9 % (17.29 %) under the normal condition and by 6.67 % (23.88 %) under the drought condition in WD (JD) compared to the standard GEOS-Chem, GEOS-Chem still overestimated the HCHO column by 16.22 % (11.71 %) under the normal condition and by 30.77 % (22.22 %) under the drought condition in WD (JD) compared to the OMI. This result indicated that both WD and JD, which were developed and tuned based on the SE US region, were not effective to reduce HCHO column biases under the drought condition in South Korea.
To improve this, we applied an alternative approach, iterative finite difference mass balance (IFDMB) method, to estimate isoprene emissions based on the HCHO column difference between OMI and the standard GEOS-Chem. By the IFDMB method, the mean fluxes of isoprene emissions were 1.87 × 10⁻¹⁰ kg m−2 s−1 under the normal condition and 2.59 × 10⁻¹⁰ kg m−2 s−1 under the drought condition, which were reduced by 50.16 % under the normal condition and by 60 % under the drought condition compared to the standard GEOS-Chem. The mean HCHO columns were 1.12 × 10¹⁶ molec. cm−2 under the normal condition and 1.24 × 10¹⁶ molec. cm−2 under the drought condition. The HCHO column biases were significantly reduced to 0.9 % under normal condition and to 5.98 % under the drought condition with respect to the OMI. The increases of the HCHO column under the drought condition was 10.71 %, which was also comparable to the OMI.
The daytime (07:00 a.m.–06:00 p.m. LT) mean observed O3 concentrations in South Korea were 33.56 ppbv under the normal condition and 42.33 ppbv under the drought condition. The standard GEOS-Chem could simulate the increase of O3 under the drought condition, but it overestimated O3 by 32.24 % under the normal condition and by 25.36 % under the drought condition. By applying IFDMB, these biases were improved to 24.64 % under the normal condition and to 12.98 % under the drought condition. The PM2.5 changes between the standard GEOS-Chem and IFDMB were insignificant because major constituents in PM2.5 in South Korea was inorganic components emitted from the anthropogenic sources.
We also proposed the empirical equations that could adjust the summertime MEGAN2.1 isoprene emissions in the South Korean region. The empirical equations were constructed based on isoprene emission difference between the standard GEOS-Chem and the IFDMB. The empirical equations were dependent on the surface temperature because significant isoprene emissions differences were found in higher surface temperatures. The adjusted isoprene emissions with these empirical equations had consistent amounts and spatial structure with those estimated by the IFDMB, which confirmed that these empirical equations could be used in the MEGAN2.1 to adjust the isoprene emissions in South Korea.
The GEOS-Chem in this study was driven by GEOS-FP meteorology dataset that is one of the conventional and widely used meteorology datasets to drive GEOS-Chem. We found that the surface temperatures from GEOS-FP meteorology have positive biases compared to the observed surface temperatures in South Korea (Fig. S10a). Given that MEGAN2.1 isoprene emissions tended to have larger biases in the higher temperature (Fig. 7a–b), these biases in surface temperature might cause the overestimation of isoprene emission in the standard GEOS-Chem under both normal and drought conditions. Indeed, it was found that the regions with larger surface temperature biases tend to have larger reductions of biogenic isoprene emissions by IFDMB (Fig. S10b–c). So, isoprene emissions might be better simulated in MEGAN2.1 with the bias-corrected surface temperature in GEOS-FP meteorology dataset, which needs future investigation. In spite of this, the proposed empirical equations would be useful for the future study investigating drought stress in South Korea using GEOS-FP meteorology datasets.
As presented in this study, the air quality (O3) worsens under the drought condition in South Korea. Some climate studies have showed that the drought would occur frequently with the future climate change (Zscheischler et al., 2020). So, the exquisite modeling of isoprene emissions under the drought stress is important in the air quality study. To achieve this, in-situ isoprene emission flux measurements in the South Korea, which cover wide regions and long time periods, would be helpful to constrain the future air quality projection.
The GEOS-Chem version 12-7-2 is available at https://doi.org/10.5281/zenodo.3701669 (The International GEOS-Chem Community, 2020). The information for the ecophysiology module implemented in GEOS-Chem is available at https://github.com/geoschem/geos-chem/pull/629/files#diff-7df9bad6db453c401ce2a47eb0236a 70f9b0951f2fcff1303e39a2cc835580c7 (Lam et al., 2023). The DEDI is available at https://doi.org/10.5281/zenodo.7768534 (Zhang et al., 2023b), and the observed SPI1 in South Korea is available at https://data.kma.go.kr/resources/html/en/aowdp.html (last access: 7 November 2025). The in-situ observation of ozone and PM2.5 in South Korea can be obtained from https://www.airkorea.or.kr/eng/ (last access: 7 November 2025). The OMI satellite HCHO and NO2 columns can be obtained from https://doi.org/10.5067/Aura/OMI/DATA3010 (Chance, 2019) and https://doi.org/10.5067/Aura/OMI/DATA3007 (Krotkov et al., 2019), respectively.
The supplement related to this article is available online at https://doi.org/10.5194/acp-25-15507-2025-supplement.
YW supervised the entire research. YCJ conducted overall analysis and all model simulations using GEOS-Chem version 12-7-2 provided by HK and RJP. WL contributed to implementing the ecophysiology module and two drought stress algorithms to GEOS-Chem. MM contributed to applying the IFDMB method. YCJ wrote the manuscript draft, and all authors contributed to the preparation of the final version of the manuscript.
The contact author has declared that none of the authors has any competing interests.
Publisher’s note: Copernicus Publications remains neutral with regard to jurisdictional claims made in the text, published maps, institutional affiliations, or any other geographical representation in this paper. While Copernicus Publications makes every effort to include appropriate place names, the final responsibility lies with the authors. Views expressed in the text are those of the authors and do not necessarily reflect the views of the publisher.
The authors thank all individuals and groups for creating all datasets used in this study. The authors also thank three anonymous referees for valuable comments which improved this study.
This work was supported by NASA Atmospheric Composition Modeling and Analysis Program (80NSSC19K0986).
This paper was edited by Kostas Tsigaridis and reviewed by three anonymous referees.
Alvarado, L. M. A., Richter, A., Vrekoussis, M., Hilboll, A., Kalisz Hedegaard, A. B., Schneising, O., and Burrows, J. P.: Unexpected long-range transport of glyoxal and formaldehyde observed from the Copernicus Sentinel-5 Precursor satellite during the 2018 Canadian wildfires, Atmos. Chem. Phys., 20, 2057–2072, https://doi.org/10.5194/acp-20-2057-2020, 2020.
Atkinson, R.: Atmospheric chemistry of VOCs and NOx, Atmos. Environ., 34, 2063–2101, https://doi.org/10.1016/S1352-2310(99)00460-4, 2000.
Bates, K. H. and Jacob, D. J.: A new model mechanism for atmospheric oxidation of isoprene: global effects on oxidants, nitrogen oxides, organic products, and secondary organic aerosol, Atmos. Chem. Phys., 19, 9613–9640, https://doi.org/10.5194/acp-19-9613-2019, 2019.
Bauwens, M., Stavrakou, T., Müller, J.-F., De Smedt, I., Van Roozendael, M., van der Werf, G. R., Wiedinmyer, C., Kaiser, J. W., Sindelarova, K., and Guenther, A.: Nine years of global hydrocarbon emissions based on source inversion of OMI formaldehyde observations, Atmos. Chem. Phys., 16, 10133–10158, https://doi.org/10.5194/acp-16-10133-2016, 2016.
Best, M. J., Pryor, M., Clark, D. B., Rooney, G. G., Essery, R. L. H., Ménard, C. B., Edwards, J. M., Hendry, M. A., Porson, A., Gedney, N., Mercado, L. M., Sitch, S., Blyth, E., Boucher, O., Cox, P. M., Grimmond, C. S. B., and Harding, R. J.: The Joint UK Land Environment Simulator (JULES), model description – Part 1: Energy and water fluxes, Geosci. Model Dev., 4, 677–699, https://doi.org/10.5194/gmd-4-677-2011, 2011.
Bey, I., Jacob, D. J., Yantosca, R. M., Logan, J. A., Field, B. D., Fiore, A. M., Li, Q., Liu, H. Y., Mickley, L. J., and Schultz, M. G.: Global modeling of tropospheric chemistry with assimilated meteorology: Model description and evaluation, J. Geophys. Res., 106, 23073–23095, https://doi.org/10.1029/2001JD000807, 2001.
Chance, K.: OMI/Aura Formaldehyde (HCHO) Total Column Daily L3 Weighted Mean Global 0.1 deg Lat/Lon Grid V003, Greenbelt, MD, USA, Goddard Earth Sciences Data and Information Services Center (GES DISC) [data set], https://doi.org/10.5067/Aura/OMI/DATA3010, 2019.
Chen, D., Wang, Y., McElroy, M. B., He, K., Yantosca, R. M., and Le Sager, P.: Regional CO pollution and export in China simulated by the high-resolution nested-grid GEOS-Chem model, Atmos. Chem. Phys., 9, 3825–3839, https://doi.org/10.5194/acp-9-3825-2009, 2009.
Choi, J., Henze, D. K., Cao, H., Nowlan, C. R., González Abad, G., Kwon, H. A., Lee, H. M., Oak, Y. J., Park, R. J., and Bates, K. H.: An inversion framework for optimizing non-methane VOC emissions using remote sensing and airborne observations in northeast Asia during the KORUS-AQ field campaign, J. Geophys. Res., 127, e2021JD035844, https://doi.org/10.1029/2021JD035844, 2022.
Clark, D. B., Mercado, L. M., Sitch, S., Jones, C. D., Gedney, N., Best, M. J., Pryor, M., Rooney, G. G., Essery, R. L. H., Blyth, E., Boucher, O., Harding, R. J., Huntingford, C., and Cox, P. M.: The Joint UK Land Environment Simulator (JULES), model description – Part 2: Carbon fluxes and vegetation dynamics, Geosci. Model Dev., 4, 701–722, https://doi.org/10.5194/gmd-4-701-2011, 2011.
Cooper, M., Martin, R. V., Padmanabhan, A., and Henze, D. K.: Comparing mass balance and adjoint methods for inverse modeling of nitrogen dioxide columns for global nitrogen oxide emissions, J. Geophys. Res., 122, 4718–4734, https://doi.org/10.1002/2016JD025985, 2017.
Ferracci, V., Bolas, C. G., Freshwater, R. A., Staniaszek, Z., King, T., Jaars, K., Otu-Larbi, F., Beale, J., Malhi, Y., and Waine, T. W.: Continuous isoprene measurements in a UK temperate forest for a whole growing season: Effects of drought stress during the 2018 heatwave, Geophy. Res. Lett., 47, e2020GL088885, https://doi.org/10.1029/2020GL088885, 2020.
Fisher, J. A., Jacob, D. J., Travis, K. R., Kim, P. S., Marais, E. A., Chan Miller, C., Yu, K., Zhu, L., Yantosca, R. M., Sulprizio, M. P., Mao, J., Wennberg, P. O., Crounse, J. D., Teng, A. P., Nguyen, T. B., St. Clair, J. M., Cohen, R. C., Romer, P., Nault, B. A., Wooldridge, P. J., Jimenez, J. L., Campuzano-Jost, P., Day, D. A., Hu, W., Shepson, P. B., Xiong, F., Blake, D. R., Goldstein, A. H., Misztal, P. K., Hanisco, T. F., Wolfe, G. M., Ryerson, T. B., Wisthaler, A., and Mikoviny, T.: Organic nitrate chemistry and its implications for nitrogen budgets in an isoprene- and monoterpene-rich atmosphere: constraints from aircraft (SEAC4RS) and ground-based (SOAS) observations in the Southeast US, Atmos. Chem. Phys., 16, 5969–5991, https://doi.org/10.5194/acp-16-5969-2016, 2016.
Fountoukis, C. and Nenes, A.: ISORROPIA II: a computationally efficient thermodynamic equilibrium model for K+–Ca2+–Mg2+––Na+–––Cl−–H2O aerosols, Atmos. Chem. Phys., 7, 4639–4659, https://doi.org/10.5194/acp-7-4639-2007, 2007.
Funk, J. L., Jones, C. G., Gray, D. W., Throop, H. L., Hyatt, L. A., and Lerdau, M. T.: Variation in isoprene emission from Quercus rubra: Sources, causes, and consequences for estimating fluxes, J. Geophys. Res., 110, https://doi.org/10.1029/2004JD005229, 2005.
Guenther, A., Karl, T., Harley, P., Wiedinmyer, C., Palmer, P. I., and Geron, C.: Estimates of global terrestrial isoprene emissions using MEGAN (Model of Emissions of Gases and Aerosols from Nature), Atmos. Chem. Phys., 6, 3181–3210, https://doi.org/10.5194/acp-6-3181-2006, 2006.
Guenther, A., Jiang, X., Heald, C. L., Sakulyanontvittaya, T., Duhl, T. A., Emmons, L., and Wang, X.: The Model of Emissions of Gases and Aerosols from Nature version 2.1 (MEGAN2.1): an extended and updated framework for modeling biogenic emissions, Geosci. Model Dev., 5, 1471-1492, https://doi.org/10.5194/gmd-5-1471-2012, 2012.
Hersbach, H., Bell, B., Berrisford, P., Hirahara, S., Horányi, A., Muñoz-Sabater, J., Nicolas, J., Peubey, C., Radu, R., and Schepers, D.: The ERA5 global reanalysis, Q. J. R. Meteorol. Soc., 146, 1999–2049, https://doi.org/10.1002/qj.3803, 2020.
Holm, S. M. and Balmes, J. R.: Systematic review of ozone effects on human lung function, 2013 through 2020, Chest, 161, 190–201, https://doi.org/10.1016/j.chest.2021.07.2170, 2022.
Huang, L., McGaughey, G., McDonald-Buller, E., Kimura, Y., and Allen, D. T.: Quantifying regional, seasonal and interannual contributions of environmental factors on isoprene and monoterpene emissions estimates over eastern Texas, Atmos. Environ., 106, 120–128, https://doi.org/10.1016/j.atmosenv.2015.01.072, 2015.
Jang, Y., Eo, Y., Jang, M., Woo, J.-H., Kim, Y., Lee, J.-B., and Lim, J.-H.: Impact of land cover and leaf area index on BVOC emissions over the Korean Peninsula, Atmosphere, 11, 806, https://doi.org/10.3390/atmos11080806, 2020.
Jiang, X., Guenther, A., Potosnak, M., Geron, C., Seco, R., Karl, T., Kim, S., Gu, L., and Pallardy, S.: Isoprene emission response to drought and the impact on global atmospheric chemistry, Atmos. Environ., 183, 69–83, https://doi.org/10.1016/j.atmosenv.2018.01.026, 2018.
Jo, H.-W., Krasovskiy, A., Hong, M., Corning, S., Kim, W., Kraxner, F., and Lee, W.-K.: Modeling Historical and Future Forest Fires in South Korea: The FLAM Optimization Approach, Remote Sens., 15, 1446, https://doi.org/10.3390/rs15051446, 2023.
Kashfi Yeganeh, A., Momeni, M., Choi, Y., Park, J., and Jung, J.: A case study of surface ozone source contributions in the Seoul metropolitan area using the adjoint of CMAQ, J. Air Waste Manag. Assoc., https://doi.org/10.1080/10962247.2024.2361021, 2024.
Kim, H.-K., Song, C.-K., Han, K. M., Eo, Y. D., Song, C. H., Park, R., Hong, S.-C., Kim, S.-K., and Woo, J.-H.: Impact of biogenic emissions on early summer ozone and fine particulate matter exposure in the Seoul Metropolitan Area of Korea, Air Qual. Atmos. Health., 11, 1021-1035, https://doi.org/10.1007/s11869-018-0602-4, 2018.
Kim, S.-Y., Jiang, X., Lee, M., Turnipseed, A., Guenther, A., Kim, J.-C., Lee, S.-J., and Kim, S.: Impact of biogenic volatile organic compounds on ozone production at the Taehwa Research Forest near Seoul, South Korea, Atmos. Environ., 70, 447–453, https://doi.org/10.1016/j.atmosenv.2012.11.005, 2013.
Krotkov, N. A., Lamsal, L. N., Marchenko, S. V., Celarier, E. A., Bucsela, E. J., Swartz, W. H., Joiner, J., and the OMI core team: OMI/Aura NO2 Cloud-Screened Total and Tropospheric Column L3 Global Gridded 0.25 degree x 0.25 degree V3, NASA Goddard Space Flight Center, Goddard Earth Sciences Data and Information Services Center (GES DISC) [data set], https://doi.org/10.5067/Aura/OMI/DATA3007, 2019.
Lam, J. C. Y., Tai, A. P. K., Ducker, J. A., and Holmes, C. D.: Development of an ecophysiology module in the GEOS-Chem chemical transport model version 12.2.0 to represent biosphere–atmosphere fluxes relevant for ozone air quality, Geosci. Model Dev., 16, 2323–2342, https://doi.org/10.5194/gmd-16-2323-2023, 2023.
Lee, H.-M. and Park, R. J.: Factors determining the seasonal variation of ozone air quality in South Korea: Regional background versus domestic emission contributions, Environ. Pollut., 308, 119645, https://doi.org/10.1016/j.envpol.2022.119645, 2022.
Lee, J., Yang, T., and Choi, C.: Mapping Nine Dominant Tree Species in the Korean Peninsula Using U-Net and Harmonic Analysis of Sentinel-2 Imagery, Korean J. Remote Sens. 41, 243–260, https://doi.org/10.7780/kjrs.2025.41.2.1.1, 2025.
Lee, K.-Y., Kwak, K.-H., Ryu, Y.-H., Lee, S.-H., and Baik, J.-J.: Impacts of biogenic isoprene emission on ozone air quality in the Seoul metropolitan area, Atmos. Environ., 96, 209–219, https://doi.org/10.1016/j.atmosenv.2014.07.036, 2014.
Li, C., Martin, R. V., Shephard, M. W., Cady-Pereira, K., Cooper, M. J., Kaiser, J., Lee, C. J., Zhang, L., and Henze, D. K.: Assessing the iterative finite difference mass balance and 4D-Var methods to derive ammonia emissions over North America using synthetic observations, J. Geophys. Res., 124, 4222–4236, https://doi.org/10.1029/2018JD030183, 2019.
Li, W., Wang, Y., Flynn, J., Griffin, R. J., Guo, F., and Schnell, J. L.: Spatial variation of surface O3 responses to drought over the contiguous United States during summertime: Role of precursor emissions and ozone chemistry, J. Geophys. Res., 127, e2021JD035607, https://doi.org/10.1029/2021JD035607, 2022.
Liao, J., Wolfe, G. M., Hannun, R. A., St. Clair, J. M., Hanisco, T. F., Gilman, J. B., Lamplugh, A., Selimovic, V., Diskin, G. S., Nowak, J. B., Halliday, H. S., DiGangi, J. P., Hall, S. R., Ullmann, K., Holmes, C. D., Fite, C. H., Agastra, A., Ryerson, T. B., Peischl, J., Bourgeois, I., Warneke, C., Coggon, M. M., Gkatzelis, G. I., Sekimoto, K., Fried, A., Richter, D., Weibring, P., Apel, E. C., Hornbrook, R. S., Brown, S. S., Womack, C. C., Robinson, M. A., Washenfelder, R. A., Veres, P. R., and Neuman, J. A.: Formaldehyde evolution in US wildfire plumes during the Fire Influence on Regional to Global Environments and Air Quality experiment (FIREX-AQ), Atmos. Chem. Phys., 21, 18319–18331, https://doi.org/10.5194/acp-21-18319-2021, 2021.
Limousin, J.-M., Misson, L., Lavoir, A.-V., Martin, N. K., and Rambal, S.: Do photosynthetic limitations of evergreen Quercus ilex leaves change with long-term increased drought severity?, Plant Cell Environ., 33, 863–875, https://doi.org/10.1111/j.1365-3040.2009.02112.x, 2010.
Mao, J., Fan, S., Jacob, D. J., and Travis, K. R.: Radical loss in the atmosphere from Cu-Fe redox coupling in aerosols, Atmos. Chem. Phys., 13, 509–519, https://doi.org/10.5194/acp-13-509-2013, 2013.
Marais, E. A., Jacob, D. J., Kurosu, T. P., Chance, K., Murphy, J. G., Reeves, C., Mills, G., Casadio, S., Millet, D. B., Barkley, M. P., Paulot, F., and Mao, J.: Isoprene emissions in Africa inferred from OMI observations of formaldehyde columns, Atmos. Chem. Phys., 12, 6219–6235, https://doi.org/10.5194/acp-12-6219-2012, 2012.
Marais, E. A., Jacob, D. J., Jimenez, J. L., Campuzano-Jost, P., Day, D. A., Hu, W., Krechmer, J., Zhu, L., Kim, P. S., Miller, C. C., Fisher, J. A., Travis, K., Yu, K., Hanisco, T. F., Wolfe, G. M., Arkinson, H. L., Pye, H. O. T., Froyd, K. D., Liao, J., and McNeill, V. F.: Aqueous-phase mechanism for secondary organic aerosol formation from isoprene: application to the southeast United States and co-benefit of SO2 emission controls, Atmos. Chem. Phys., 16, 1603–1618, https://doi.org/10.5194/acp-16-1603-2016, 2016.
McKee, T. B., Doesken, N. J., and Kleist, J.: The relationship of drought frequency and duration to time scales, in: Proceedings of the 8th Conference on Applied Climatology, Anaheim, CA, 17–22 January 1993, 179–183,, 1993.
Momeni, M., Choi, Y., Yeganeh, A. K., Pouyaei, A., Jung, J., Park, J., Shephard, M. W., Dammers, E., and Cady-Pereira, K. E.: Constraining East Asia ammonia emissions through satellite observations and iterative finite difference mass balance (iFDMB) and investigating its impact on inorganic fine particulate matter, Environ. Int., 108473, https://doi.org/10.1016/j.envint.2024.108473, 2024.
Morfopoulos, C., Müller, J. F., Stavrakou, T., Bauwens, M., De Smedt, I., Friedlingstein, P., Prentice, I. C., and Regnier, P.: Vegetation responses to climate extremes recorded by remotely sensed atmospheric formaldehyde, Glob. Change Biol., 28, 1809–1822, https://doi.org/10.1111/gcb.15880, 2022.
Müller, J.-F., Stavrakou, T., Oomen, G.-M., Opacka, B., De Smedt, I., Guenther, A., Vigouroux, C., Langerock, B., Aquino, C. A. B., Grutter, M., Hannigan, J., Hase, F., Kivi, R., Lutsch, E., Mahieu, E., Makarova, M., Metzger, J.-M., Morino, I., Murata, I., Nagahama, T., Notholt, J., Ortega, I., Palm, M., Röhling, A., Stremme, W., Strong, K., Sussmann, R., Té, Y., and Fried, A.: Bias correction of OMI HCHO columns based on FTIR and aircraft measurements and impact on top-down emission estimates, Atmos. Chem. Phys., 24, 2207–2237, https://doi.org/10.5194/acp-24-2207-2024, 2024.
Naimark, J. G., Fiore, A. M., Jin, X., Wang, Y., Klovenski, E., and Braneon, C.: Evaluating drought responses of surface ozone precursor proxies: Variations with land cover type, precipitation, and temperature, Geophy. Res. Lett., 48, e2020GL091520, https://doi.org/10.1029/2020GL091520, 2021.
Pacifico, F., Harrison, S., Jones, C., and Sitch, S.: Isoprene emissions and climate, Atmos. Environ., 43, 6121–6135, https://doi.org/10.1016/j.atmosenv.2009.09.002, 2009.
Palmer, P. I., Jacob, D. J., Fiore, A. M., Martin, R. V., Chance, K., and Kurosu, T. P.: Mapping isoprene emissions over North America using formaldehyde column observations from space, J. Geophys. Res., 108, https://doi.org/10.1029/2002JD002153, 2003.
Park, E. H., Heo, J., Kim, H., and Yi, S.-M.: Long term trends of chemical constituents and source contributions of PM2.5 in Seoul, Chemosphere, 251, 126371, https://doi.org/10.1016/j.chemosphere.2020.126371, 2020.
Pegoraro, E., Rey, A., Greenberg, J., Harley, P., Grace, J., Malhi, Y., and Guenther, A.: Effect of drought on isoprene emission rates from leaves of Quercus virginiana Mill, Atmos. Environ., 38, 6149–6156, https://doi.org/10.1016/j.atmosenv.2004.07.028, 2004.
Perry, C. H., Finco, M. V., and Barry, T.: Forest atlas of the United States (U.S. Department of Agriculture, Forest Service, Northern Research Station), https://www.fs.usda.gov/sites/default/files/fs_media/fs_document/Forest-Atlas-of-the-United-States.pdf (last access: 7 November 2025), 2022.
Potosnak, M. J., LeStourgeon, L., Pallardy, S. G., Hosman, K. P., Gu, L., Karl, T., Geron, C., and Guenther, A. B.: Observed and modeled ecosystem isoprene fluxes from an oak-dominated temperate forest and the influence of drought stress, Atmos. Environ., 84, 314–322, https://doi.org/10.1016/j.atmosenv.2013.11.055, 2014.
Rissanen, K., Aalto, J., Gessler, A., Hölttä, T., Rigling, A., Schaub, M., and Bäck, J.: Drought effects on volatile organic compound emissions from Scots pine stems, Plant Cell Environ., 45, 23–40, https://doi.org/10.1111/pce.14219, 2022.
Ryou, H., Heo, J., and Kim, S.-Y.: Source apportionment of PM10 and PM2.5 air pollution, and possible impacts of study characteristics in South Korea, Environ. Pollut., 240, 963–972, https://doi.org/10.1016/j.envpol.2018.03.066, 2018.
Schroeder, J. R., Crawford, J. H., Ahn, J.-Y., Chang, L., Fried, A., Walega, J., Weinheimer, A., Montzka, D. D., Hall, S. R., and Ullmann, K.: Observation-based modeling of ozone chemistry in the Seoul metropolitan area during the Korea-United States Air Quality Study (KORUS-AQ), Elem. Sci. Anth., 8, 3, https://doi.org/10.1525/elementa.400, 2020.
Seco, R., Karl, T., Guenther, A., Hosman, K. P., Pallardy, S. G., Gu, L., Geron, C., Harley, P., and Kim, S.: Ecosystem-scale volatile organic compound fluxes during an extreme drought in a broadleaf temperate forest of the Missouri Ozarks (central USA), Glob. Change Biol., 21, 3657–3674, https://doi.org/10.1111/gcb.12980, 2015.
Seco, R., Holst, T., Davie-Martin, C. L., Simin, T., Guenther, A., Pirk, N., Rinne, J., and Rinnan, R.: Strong isoprene emission response to temperature in tundra vegetation, P. Natl. Acad. Sci. USA, 119, e2118014119, https://doi.org/10.1073/pnas.2118014119, 2022.
Shen, L., Jacob, D. J., Zhu, L., Zhang, Q., Zheng, B., Sulprizio, M. P., Li, K., De Smedt, I., González Abad, G., and Cao, H.: The 2005–2016 trends of formaldehyde columns over China observed by satellites: Increasing anthropogenic emissions of volatile organic compounds and decreasing agricultural fire emissions, Geophy. Res. Lett., 46, 4468–4475, https://doi.org/10.1029/2019GL082172, 2019.
Sindelarova, K., Granier, C., Bouarar, I., Guenther, A., Tilmes, S., Stavrakou, T., Müller, J.-F., Kuhn, U., Stefani, P., and Knorr, W.: Global data set of biogenic VOC emissions calculated by the MEGAN model over the last 30 years, Atmos. Chem. Phys., 14, 9317–9341, https://doi.org/10.5194/acp-14-9317-2014, 2014.
Sprengnether, M., Demerjian, K. L., Donahue, N. M., and Anderson, J. G.: Product analysis of the OH oxidation of isoprene and 1, 3-butadiene in the presence of NO, J. Geophys. Res., 107, ACH 8-1–ACH 8-13, https://doi.org/10.1029/2001JD000716, 2002.
The International GEOS-Chem Community: geoschem/geos-chem: GEOS-Chem 12.7.2 (12.7.2), Zenodo [code], https://doi.org/10.5281/zenodo.3701669, 2020.
van der Werf, G. R., Randerson, J. T., Giglio, L., Collatz, G. J., Mu, M., Kasibhatla, P. S., Morton, D. C., DeFries, R. S., Jin, Y., and van Leeuwen, T. T.: Global fire emissions and the contribution of deforestation, savanna, forest, agricultural, and peat fires (1997–2009), Atmos. Chem. Phys., 10, 11707–11735, https://doi.org/10.5194/acp-10-11707-2010, 2010.
Wang, H., Lu, X., Seco, R., Stavrakou, T., Karl, T., Jiang, X., Gu, L., and Guenther, A. B.: Modeling isoprene emission response to drought and heatwaves within MEGAN using evapotranspiration data and by coupling with the community land model, J. Adv. Model. Earth Sy., 14, e2022MS003174, https://doi.org/10.1029/2022MS003174, 2022a.
Wang, P., Liu, Y., Dai, J., Fu, X., Wang, X., Guenther, A., and Wang, T.: Isoprene emissions response to drought and the impacts on ozone and SOA in China, J. Geophys. Res., 126, e2020JD033263, https://doi.org/10.1029/2020JD033263, 2021.
Wang, Y., Lin, N., Li, W., Guenther, A., Lam, J. C. Y., Tai, A. P. K., Potosnak, M. J., and Seco, R.: Satellite-derived constraints on the effect of drought stress on biogenic isoprene emissions in the southeastern US, Atmos. Chem. Phys., 22, 14189–14208, https://doi.org/10.5194/acp-22-14189-2022, 2022b.
Wang, Y. X., McElroy, M. B., Jacob, D. J., and Yantosca, R. M.: A nested grid formulation for chemical transport over Asia: Applications to CO, J. Geophys. Res., 109, https://doi.org/10.1029/2004JD005237, 2004.
Wasti, S. and Wang, Y.: Spatial and temporal analysis of HCHO response to drought in South Korea, Sci. Total Environ., 852, 158451, https://doi.org/10.1016/j.scitotenv.2022.158451, 2022.
Wells, K. C., Millet, D. B., Payne, V. H., Deventer, M. J., Bates, K. H., de Gouw, J. A., Graus, M., Warneke, C., Wisthaler, A., and Fuentes, J. D.: Satellite isoprene retrievals constrain emissions and atmospheric oxidation, Nature, 585, 225–233, https://doi.org/10.1038/s41586-020-2664-3, 2020.
Wolfe, G. M., Kaiser, J., Hanisco, T. F., Keutsch, F. N., de Gouw, J. A., Gilman, J. B., Graus, M., Hatch, C. D., Holloway, J., Horowitz, L. W., Lee, B. H., Lerner, B. M., Lopez-Hilifiker, F., Mao, J., Marvin, M. R., Peischl, J., Pollack, I. B., Roberts, J. M., Ryerson, T. B., Thornton, J. A., Veres, P. R., and Warneke, C.: Formaldehyde production from isoprene oxidation across NOx regimes, Atmos. Chem. Phys., 16, 2597–2610, https://doi.org/10.5194/acp-16-2597-2016, 2016.
Woo, J.-H., Kim, Y., Kim, H.-K., Choi, K.-C., Eum, J.-H., Lee, J.-B., Lim, J.-H., Kim, J., and Seong, M.: Development of the CREATE inventory in support of integrated climate and air quality modeling for Asia, Sustainability, 12, 7930, https://doi.org/10.3390/su12197930, 2020.
Yu, J., Han, K. M., Song, C. H., Lee, K., Lee, S., Kim, Y., Woo, J.-H., Kim, S., and Wisthaler, A.: Evaluation of biogenic emissions from three different vegetation distributions in South Korea, Atmos. Environ., 296, 119588, https://doi.org/10.1016/j.atmosenv.2023.119588, 2023.
Zhang, X., Duan, Y., Duan, J., Jian, D., and Ma, Z.: A daily drought index based on evapotranspiration and its application in regional drought analyses, Sci. China Earth Sci., 1-20, https://doi.org/10.1007/s11430-021-9822-y, 2022.
Zhang, X., Duan, J., Cherubini, F., and Ma, Z.: A global daily evapotranspiration deficit index dataset for quantifying drought severity from 1979 to 2022, Sci. Data, 10, 824, https://doi.org/10.1038/s41597-023-02756-1, 2023a.
Zhang, X., Duan, J., Cherubini, F., and Ma, Z.: A high-resolution global land daily drought index dataset during 1979–2022, Zenodo [data set], https://doi.org/10.5281/zenodo.7768534, 2023b.
Zhou, S., Medlyn, B., Sabaté, S., Sperlich, D., and Prentice, I. C.: Short-term water stress impacts on stomatal, mesophyll and biochemical limitations to photosynthesis differ consistently among tree species from contrasting climates, Tree Physiol., 34, 1035–1046, https://doi.org/10.1093/treephys/tpu072, 2014.
Zhu, L., González Abad, G., Nowlan, C. R., Chan Miller, C., Chance, K., Apel, E. C., DiGangi, J. P., Fried, A., Hanisco, T. F., Hornbrook, R. S., Hu, L., Kaiser, J., Keutsch, F. N., Permar, W., St. Clair, J. M., and Wolfe, G. M.: Validation of satellite formaldehyde (HCHO) retrievals using observations from 12 aircraft campaigns, Atmos. Chem. Phys., 20, 12329–12345, https://doi.org/10.5194/acp-20-12329-2020, 2020.
Zscheischler, J., Martius, O., Westra, S., Bevacqua, E., Raymond, C., Horton, R. M., van den Hurk, B., AghaKouchak, A., Jézéquel, A., and Mahecha, M. D.: A typology of compound weather and climate events, Nat. Rev. Earth Environ., 1, 333–347, https://doi.org/10.1038/s43017-020-0060-z, 2020.
- Abstract
- Introduction
- Data and Method
- HCHO column biases under the drought condition in South Korea
- Estimation of isoprene emissions by applying an iterative finite difference mass balance (IFDMB) method
- Conclusions
- Code and data availability
- Author contributions
- Competing interests
- Disclaimer
- Acknowledgements
- Financial support
- Review statement
- References
- Supplement