the Creative Commons Attribution 4.0 License.
the Creative Commons Attribution 4.0 License.
 | 11 Nov 2025
Measurement report: Unexpected high volatile organic compounds emission from vehicles on the Tibetan Plateau
Weichao Huang
Sihang Wang
Bingna Chen
Pengfei Yu
Haichao Wang
Nan Ma
Mei Li
Keding Lu
Vehicular emissions significantly impact atmospheric composition, yet their behavior in high-altitude environments remains poorly understood. Here, we present a comprehensive investigation of vehicular emissions conducted across ten tunnels on the Tibetan Plateau, encompassing nearly 3000 m of altitudinal variation. Our findings reveal that total emission factors of volatile organic compounds (VOCs) increase with altitude, driven primarily by a pronounced rise in evaporative emissions. Source apportionment indicates that evaporative emissions contribute 67 % of the total VOCs, markedly outweighing the 24 % from tailpipe exhaust, a pattern that diverges from those observed at lower altitudes, where tailpipe emissions dominate. We identify low atmospheric pressure as the key factor enhancing evaporative VOC release at high altitudes. This study offers critical new insights into the mechanisms of vehicular emissions in plateau regions, underscoring the necessity of accounting for specific environmental conditions and fuel evaporation when formulating emission control strategies for high-altitude settings.
- Article
(1387 KB) - Full-text XML
-
Supplement
(3031 KB) - BibTeX
- EndNote


The Tibetan Plateau, with an average altitude of over 4000 m and a total area of approximately 2.5×10⁶ km2, is known as the “Roof of the World” (Xu et al., 2014). The low pressure and cold climate have resulted in low levels of population and industrialization in the Tibetan Plateau, making it one of the most pristine regions in the world (Xue et al., 2013; Li et al., 2017). However, with the development of infrastructure and tourism, the vehicle ownership in Tibet has notably increased in recent years, leading to a rapid growth in vehicular emissions (Tang et al., 2022; Zhong et al., 2023). Yet, the characteristics of vehicular emissions on the Tibetan Plateau – both in terms of emission strengths and compositions, remain largely unknown.
Vehicular emissions comprise tailpipe exhausts and non-tailpipe emissions (Wu et al., 2023; Wang et al., 2022a; Hata et al., 2019; Jathar et al., 2014; Du et al., 2018). The former refers to gases emitted from engine systems due to incomplete combustion or unburned fuel (Zhang et al., 2024), while the latter mainly consists of evaporative emissions from fuels and fuel-related additives, released through processes such as running loss, hot soak, permeation, and diurnal breathing (Zhang et al., 2024; Pierson et al., 1999; Yue et al., 2017; Man et al., 2020; Liu et al., 2015; Harrison et al., 2021). In terms of volatile organic compounds (VOCs), the compositions of the two types of emissions differs significantly. With the upgrading engine and after-treatment technologies, tailpipe exhausts have been effectively reduced in recent decades (Cliff et al., 2023; Wang et al., 2022a). As a consequence, the relative contributions of non-tailpipe emissions are increasing, accounting for 32 % to 48 % of total vehicular VOC emissions (Liu et al., 2017; Wu et al., 2023; Chai et al., 2023; Huo et al., 2024; Sun et al., 2021).
The evaporation of fuels and solvents is an equilibrium process involving hydrocarbon molecules transitioning between the gas and liquid phases, governed primarily by temperature and pressure conditions (Huang et al., 2022). Elevated temperature and low pressures theoretically facilitate fuel evaporation (Huo et al., 2024; Wang et al., 2018). However, in plateau regions, low atmospheric pressure often coincides with cooler temperatures, resulting in competing influences that are not yet fully quantified. Computational models such as MOVES model estimate that tank vapor generation at 1700 m a.s.l. (above sea level) is approximately 1.4 times that at sea level, indicating potentially significant altitude-enhanced emissions (US EPA, 2024). They also underscore the critical need for empirical validation under real-world, high-altitude conditions, which remain severely limited.
Within the framework of the second scientific expedition and research program of the Tibetan plateau (STEP) (Yao et al., 2012; Ye et al., 2023), we conducted vehicular emission measurements in 10 tunnels across the Tibetan Plateau, spanning an altitude range of nearly 3000 m. This unique natural setting enabled us to investigate how vehicular emission characteristics respond to changing elevation, with a particular emphasis on the role of low atmospheric pressure. The study aims to enhance the current understanding of VOC emissions from vehicular in high-altitude regions, which remain poorly characterized in existing literature.
2.1 Research site
Following the criteria of representative altitude, we specifically chose ten tunnels located between Lhasa and Nyingchi, two major cities in Tibet autonomous region, China (Fig. S1 in the Supplement). We prioritized selecting one-way tunnels, as well as the longest available tunnels. These tunnels cover a distance of approximately 700 km and span an altitude range of nearly 3000 m. By merging tunnels with similar altitudes (height difference less than 100 m), we categorized the ten tunnels into six groups: 2000, 3000, 3400, 3600, 4200, and 4750 m. Detailed information about the tunnels is summarized in Table S1 in the Supplement.
2.2 Mobile measurement system
A vehicle equipped with a CO2/H2O gas analyzer (850A, LiCOR, Inc., USA), an infrared absorption CO analyzer (48i-TL, Thermo, Inc., USA), and summa canisters (Entech Instrument, Inc., USA, 3.2 L) as offline VOCs sampler, served as the mobile measurement system for this study (Fig. S2). Experiments were conducted with the vehicle traveling along the right side of the road inside the tunnel at relatively constant speeds, ranging from 15 to 40 km h−1, depending on the length of the tunnels. The sampling tubing was positioned on the left side of the mobile measurement vehicle to capture mid-tunnel conditions. The experimental process was documented using both driving recorder footage and manual record-keeping (Fig. S2).
The online instruments were pre-calibrated to minimize random errors. The VOC samples, collected over a 10 d sampling campaign across multiple tunnels, were analyzed within one week after transportation to our laboratory using a gas chromatography-flame ionization detection/mass spectrometry (GC-FID/MS) system (Sect. S1 in the Supplement), ensuring minimal pre-analysis storage time. In the one-way tunnels, the online data (i.e., CO2 and CO) showed a noticeable piston effect (Fig. S3) (Chung and Chung, 2007), with concentrations gradually increasing towards the end of the tunnel. The air at the tunnel's tail end was assumed to represent a well-mixed plume from emissions of all vehicles in the tunnel (Hwang et al., 2023; Gillies et al., 2001). Therefore, in these tunnels, offline sampling was initiated in the rear section and lasted approximately 1 min to capture the accumulated air masses. Additionally, three tunnels in our study had bidirectional traffic, where the piston effect was less pronounced due to opposing flows. For these cases, sampling was conducted at the tunnel midpoint to ensure representative mixing of emissions from both directions. Background concentrations of VOCs were determined at the Yangbajing background site during the same field campaign of STEP (July–August 2022) (Tao et al., 2024).
Each tunnel underwent either parallel or bidirectional sampling, with a minimum of two tests conducted, resulted in a total of 46 valid samples. A total of 90 VOCs were quantitatively identified and classified into six categories: alkanes (29 species), alkenes (11 species), alkynes (1 species), aromatics (14 species), halocarbons (27 species), and oxygenated volatile organic compounds (OVOCs) (8 species) (Table S2). As illustrated in Figs. S4 and S5, the parallel samples from the same tunnels showed good consistency.
2.3 Emission factors and emission ratios
To compare the vehicular emission intensities under different conditions with a standardized scale, we calculated the fuel-based emission factors (EF) and emission ratios (ER) of VOC relative to CO, respectively.
In Eqs. (1) and (2), EFi is the emission factor of VOC species i, µg kg, and ERi is the emission ratio of VOC species i, ppb ppm−1; Ci, and CCO are the concentration of VOC species i, CO2 and CO respectively; CF is the carbon mass fraction of the fuel, and a typical value of 0.86 used here (Wren et al., 2018). , MWCO and MWC are the molecular weights of CO2, CO, and carbon atom respectively, g mol−1.
2.4 Source profiles similarity analysis
An approach commonly used to assess the resemblance between mass spectrometry signals, known as vector similarity analysis (Humes et al., 2022; Zhu et al., 2021; Kostenidou et al., 2009; Ulbrich et al., 2009; Wang et al., 2024), is adopted here to evaluate the similarity among various source profiles. Specifically, relative molecular weight of each VOC species multiplied by its corresponding mass fraction is treated as a dimension in the vector. The cosine angle (θ) between the vector of two source profiles (x and y) is then calculated using Eq. (3) to determine their similarity. The θ angles are categorized into four groups: 0–15, 15–30, 30–50, and >50°, representing excellent consistency, good consistency, many similarities, and poor consistency, respectively (Wang et al., 2024).
2.5 Positive matrix factorization and non-negative least squares analysis
The positive matrix factorization (PMF) model 5.0, developed by the United States Environmental Protection Agency (US EPA) (Paatero and Tapper, 1994), was used to identify sources of VOCs sampled from the tunnels. Three factors representing different sources of VOCs are extracted from the PMF model: evaporative emissions, tailpipe exhaust, and non-vehicular sources. A total of 66 measured VOC species were included in the PMF analysis, comprising high-concentration species and typical tracers of evaporative and combustion sources. As such, PMF factors can be identified with those well-known and long-lived emission tracers, such as methyl tertiary-butyl ether (MTBE) as a tracer for gasoline evaporation (Kirchstetter et al., 1999), alongside interpreting the sources of other species based on their covariance with those well-known tracers and their presence in PMF factors.
To corroborate the findings from the PMF analysis, a non-negative least squares (NNLS) multivariate linear regression was utilized to examine the relative contributions of evaporative and exhaust emissions (Wang et al., 2022b). Using characteristic indicators of evaporative and tailpipe emissions as independent variables, the optimal proportions of contributions from the three sources are determined to minimize the sum of squared residuals of the objective function. Detailed information can be found in Sect. S2 and Table S3. The data associated with this research can be accessed via the Zenodo repository (Huang, 2024).
3.1 Vehicular VOC emissions increase in high-altitude tunnels
For cross-study comparison, a consistent subset of 59 VOC species, commonly detected in both our study and low-altitude tunnel studies (e.g., Ho et al., 2009), was selected to ensure comparability in EF and ER calculations. The total EF and ER of the detected VOCs generally exhibit higher values at increased altitudes (Figs. 1a and S6), with the averages across all plateau tunnels of 3.3 ± 3.1 µg kg and 87 ± 92 ppb ppm−1, respectively. When comparing the identical compositions, the average EF in plateau tunnels is 1.9 times higher than that in the Shing Mun tunnel in Hong Kong (50 m a.s.l.) (Ho et al., 2009). The determined ER is 3.9 and 1.9 times higher than those in the Shing Mun tunnel and the Chung-Liao tunnel in Taiwan (330 m a.s.l.) (Chiang et al., 2007), respectively. These results are significantly higher than the 1.4 times increase in fuel evaporation observed in Denver (1700 m a.s.l.) relative to sea level (US EPA, 2024).
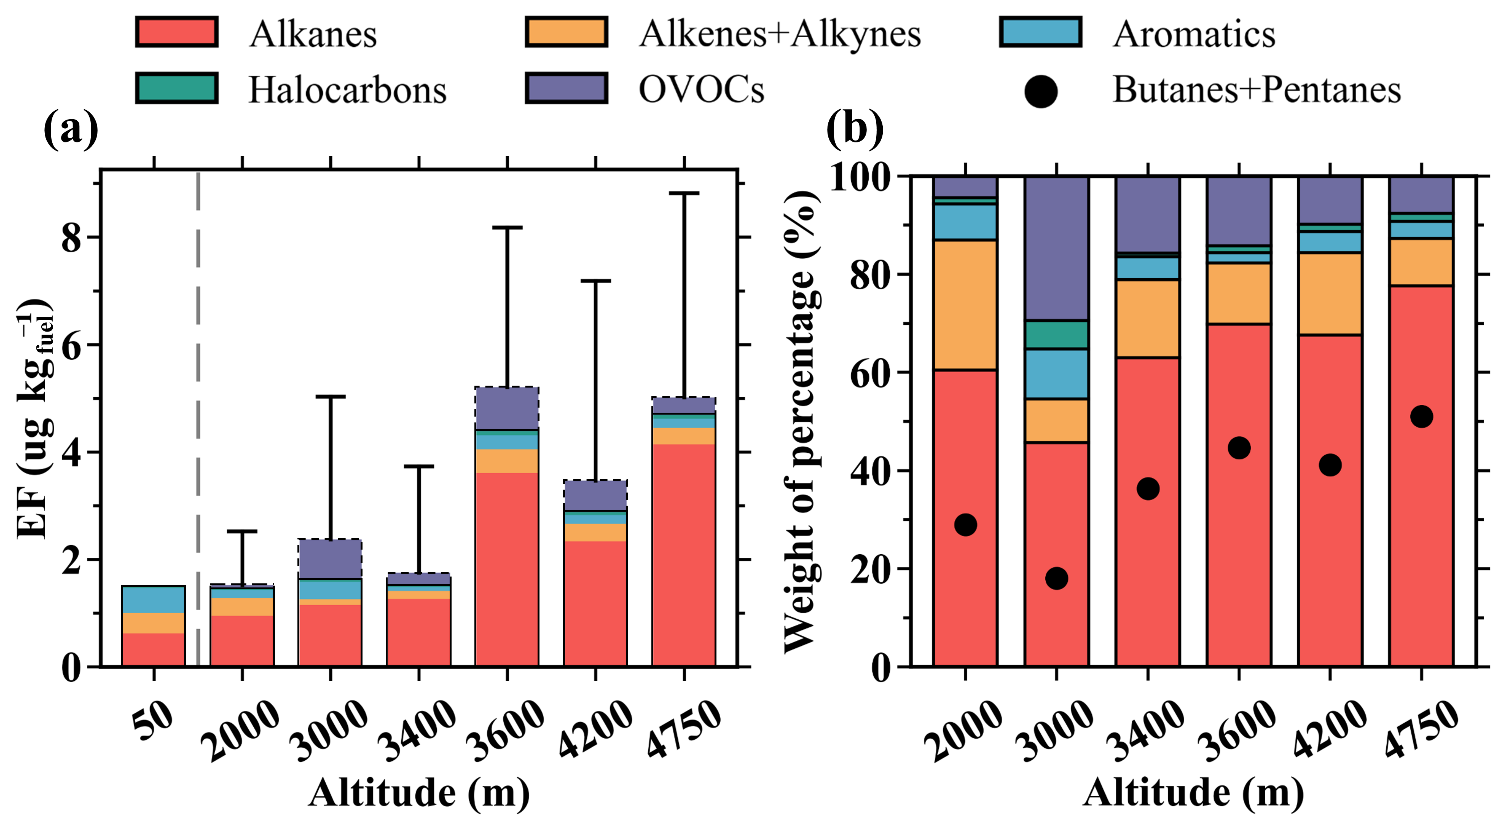
Figure 1Altitudinal trends of different VOC components. (a) Stacked plot illustrating variations of EF with altitude. The solid line in (a) represents a subset of 59 VOC species that overlapped with species reported in key low-altitude tunnel studies (Ho et al., 2009; Chiang et al., 2007). The gray dashed line on the left side represents results from other studies conducted in low-altitude tunnels. Specifically, data at 50 m from the Shing Mun tunnel in Hong Kong (Ho et al., 2009). (b) Altitudinal variations in source profiles (relative mass percentage contribution) observed in this study.
Alkanes are the predominant components of VOCs in plateau tunnels (Fig. 1b), with an average mass fraction of 65 ± 17 %, significantly higher than those reported in low-altitude studies, reporting the range of alkanes typically from 23 % to 57 % (Staehelin et al., 1998; Hwa et al., 2002; Zhang et al., 2018b; Chiang et al., 2007; Gentner et al., 2013; Sun et al., 2019; Feng et al., 2021; Song et al., 2020; Jin et al., 2021; Song et al., 2018). Meanwhile, the proportion of alkanes shows an increasing trend with altitude, growing from 60 % at 2000 m to 77 % at 4750 m. The tunnels at 3000 m deviates from this trend, potentially due to interference from other sources, which will be discussed later.
Butanes (n/i-butane) and pentanes (n/i-pentane) are identified as the major species in plateau tunnels, collectively contributing to 46 ± 20 % of the total VOCs mass and 67 ± 19 % of the total alkane emissions. This high proportion significantly exceeds those typically found in low-altitude tunnels, ranging from 3.0 % to 21 % (Staehelin et al., 1998; Hwa et al., 2002; Zhang et al., 2018b; Chiang et al., 2007; Gentner et al., 2013; Sun et al., 2019; Feng et al., 2021; Song et al., 2020; Jin et al., 2021; Song et al., 2018). Furthermore, their combined fraction exhibited an upward trend with rising altitude, consistent with the trend observed for alkanes. Clearly, the increased vehicular VOC emissions on the plateau are primarily attributable to the increase in alkanes, specifically butanes and pentanes.
3.2 Low atmospheric pressure significantly enhances evaporative emissions
Butanes and pentanes are primary constituents of fuel evaporation (Chin and Batterman, 2012; Wu et al., 2023; Zhang et al., 2021). As depicted in Fig. 2a, the EF of butanes and pentanes both exhibit distinct enhancement with higher altitude, consistent with their proportional trends. Notably, the average EF of butanes and pentanes in plateau tunnels are 4.5 to 21 times higher than those at 50 m altitude, respectively. Similar results can also be obtained when expressed in terms of the ER (Fig. S7a). To the best of our knowledge, this is the first report of enhanced evaporative emissions from vehicles in high-altitude regions.
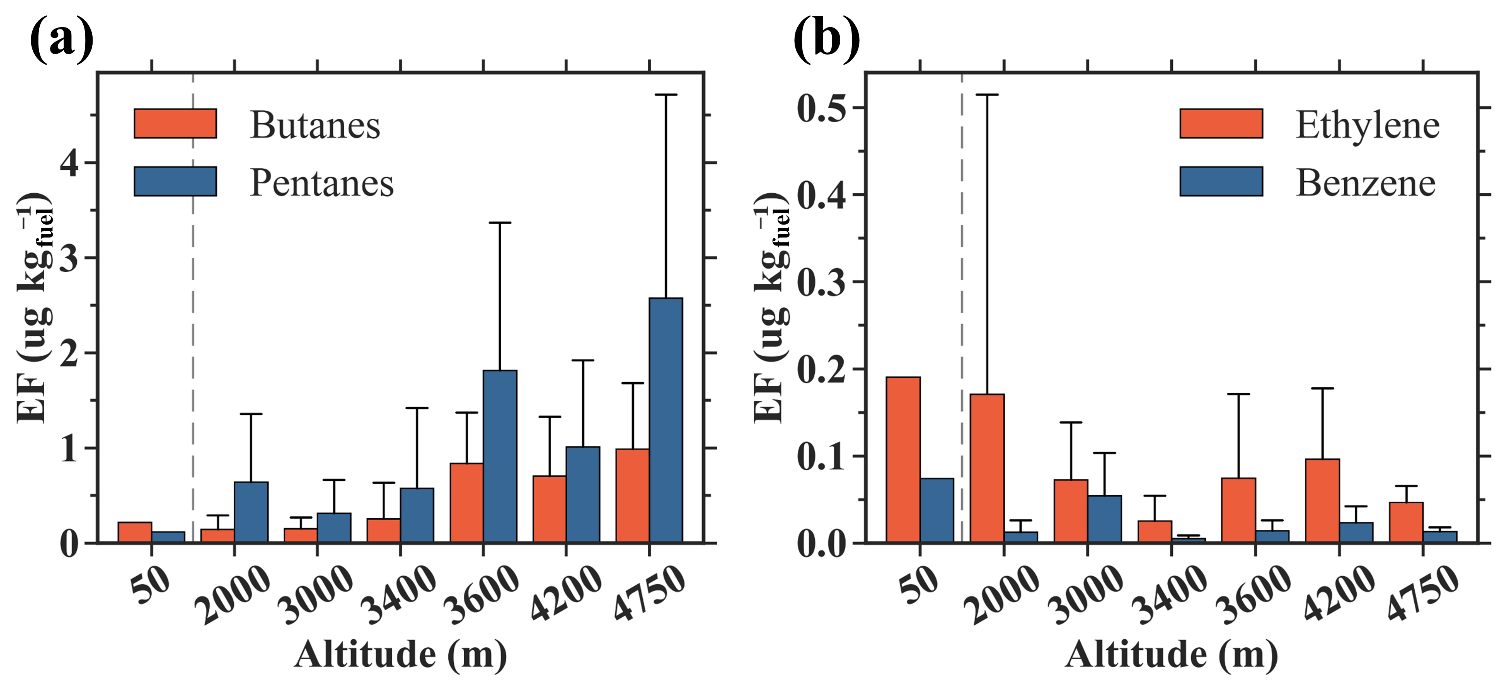
Figure 2Variation trends of EF for representative species with altitude. (a) Trends in EF for butanes and pentanes. (b) Trends in EF for ethylene and benzene. Data at 50 m is from the Shing Mun tunnel in Hong Kong (Ho et al., 2009).
As altitude increases, atmospheric pressure decreases, with pressure at 4750 m altitude being only about 55 % of sea level pressure. According to Dalton evaporation formula (Hage, 1975), the rate of liquid evaporation is inversely proportional to atmospheric pressure. In addition, based on the Clausius-Clapeyron equation (Koutsoyiannis, 2012), lower pressure decreases the boiling point of a solvent. Four-carbon and five-carbon compounds could be more sensitive to this effect, as their boiling points typically lie close to ambient temperatures under standard pressure. For example, as atmospheric pressure decreases from 101 to 56 kPa (corresponding to altitudes from sea level to 4750 m), the boiling point of n-pentane decreases from 35 to 19° (Sect. S3). This means that the n-pentane would reach its boiling point at 4750 m altitude at ambient temperature, which is 19–22° for daytime during our measurement campaign. Interestingly, our tests have confirmed these thermodynamic theories despite the discrepancies between fuel and ideal solutions. While lower temperatures in high-altitude regions are expected to reduce evaporation (Huang et al., 2022), our real-world tests indicate that the influence of low pressure completely outweighs the temperature effect on the Tibetan Plateau.
In contrast, the EF of certain tracers (i.e., ethylene, benzene) mainly from tailpipe exhausts exhibit a fluctuating distribution pattern at various altitudes (Figs. 2b and S7b), with some trend for even higher emissions at 50 m altitude compared to those on the plateau. Moreover, the ratio, as an indicator of engine combustion efficiency (Vollmer et al., 2007; Ammoura et al., 2014; Hu et al., 2019), did not appear a discernible altitude-specific distribution across our dataset (Fig. S8), with average values ranging from 5.1 to 11 ppbv ppmv−1. This range is comparable to values reported in low-altitude tunnel studies, spanning 4.4–15 ppbv ppmv−1 across cities in Asia and Europe (Cui et al., 2018; Liu et al., 2022; Ammoura et al., 2014; Legreid et al., 2007). Although reduced oxygen at higher elevations may theoretically impair combustion efficiency and increase ratios, other factors, such as vehicle type, engine operation conditions, and tunnel ventilation may obscure the effect of altitude alone.
3.3 Source profile of vehicular VOC emissions on the Tibetan Plateau
Although the vehicle types and quantities vary among the tunnels, the VOCs source profiles at six altitudes demonstrate remarkable consistency, except at 3000 m, where aromatics and OVOCs are relatively higher compared to other altitudes (Fig. S9). Quantitative similarity analysis also indicates that the θ angles between tunnels excluding 3000 m are less than 30°, indicating excellent or good consistency (Table S4). The tunnel at 3000 m is located in the urban areas of Nyngchi and is much shorter than the others (Table S1). As shown in discussion of source analysis below, these two factors both make the collected tunnel samples more susceptible to influenced by surrounding urban sources, hence exhibiting the poorest similarity.
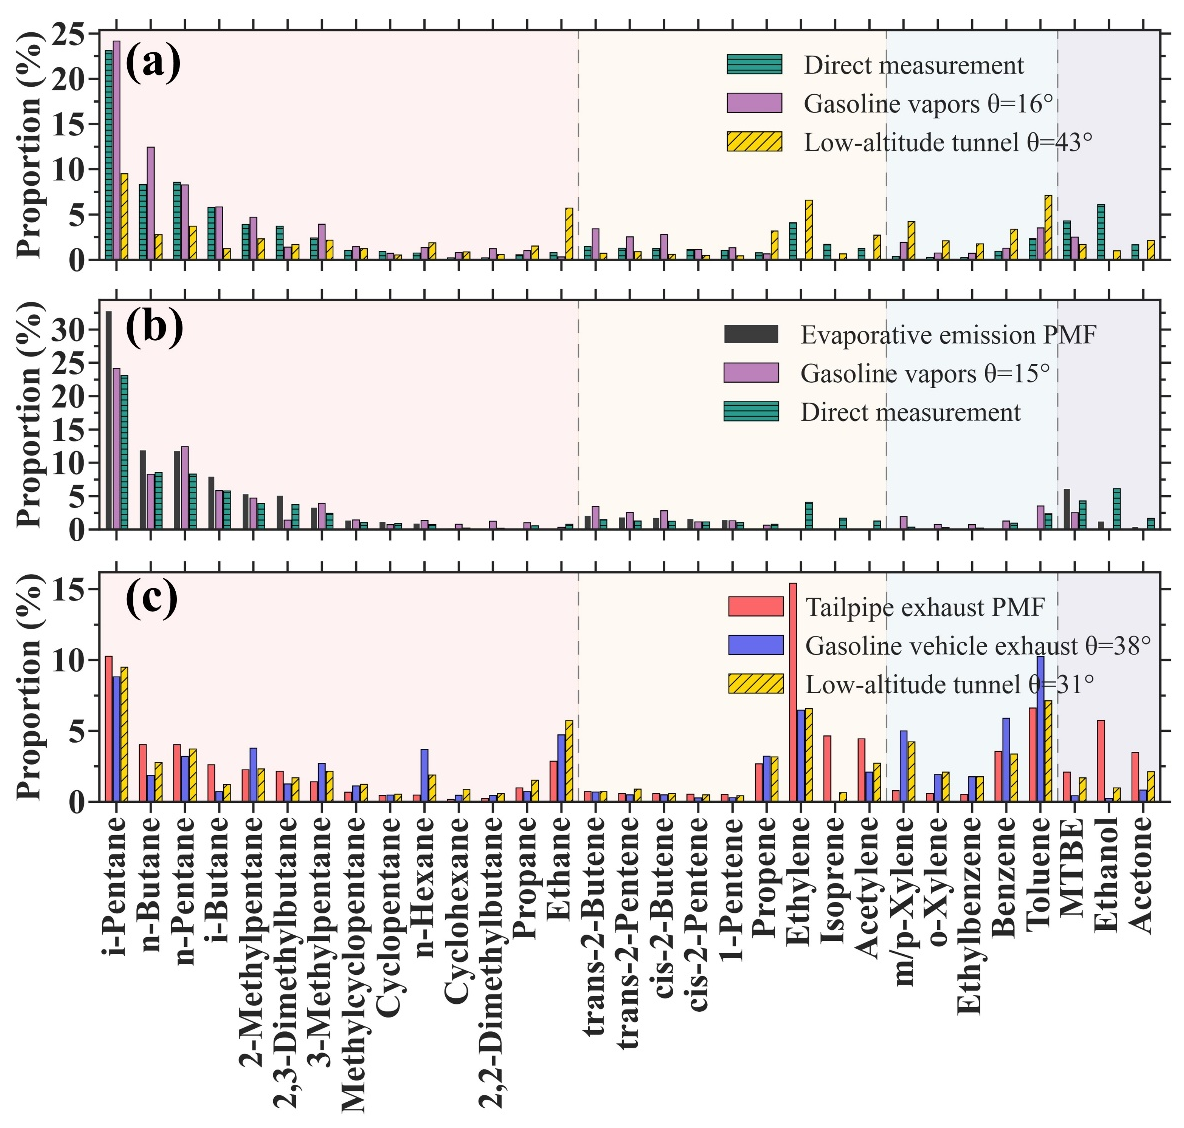
Figure 3Comparison of source profiles between this study and other studies. (a) Comparison of the tunnel measurement source profile in this study with the gasoline vapor source profile tested by SHED and the source profile of the low-altitude tunnel. (b) Comparison of source profiles for evaporative emissions derived from PMF, gasoline vapor emissions from SHED test results, and directly measured source profile in this study. (c) Comparison of source profiles for tailpipe exhaust derived from PMF, gasoline vehicle exhausts from chassis dynamometer test, and the low-altitude tunnel source profile. The background colors of red, yellow, blue, and purple represent alkanes, alkenes, aromatics, and OVOCs, respectively.
The average source profile of plateau tunnels significantly differs from those documented for low-altitude tunnels (Figs. 3a, S10) (Staehelin et al., 1998; Hwa et al., 2002; Zhang et al., 2018b; Chiang et al., 2007; Gentner et al., 2013; Zhang et al., 2018a; Sun et al., 2019; Feng et al., 2021; Song et al., 2020; Jin et al., 2021; Song et al., 2018). The former exhibit much higher contributions from evaporative-related species (such as butanes, pentanes, and MTBE), while the proportions of combustion-related VOC species (such as ethylene, acetylene, and aromatics) are substantially lower compared to the latter. Moreover, the source profiles at high altitudes align closely with the sealed housing for evaporative determination (SHED) tests (Harley et al., 2000; Na et al., 2004; Liu et al., 2008; Zhang et al., 2013; Wu et al., 2015; Man et al., 2020; Sun et al., 2021), whereas those at low altitudes correlate well with vehicle exhaust from chassis dynamometer test (Schauer et al., 2002; Na et al., 2004; Guo et al., 2011; Gao et al., 2012; Ou et al., 2014; Li et al., 2019; Wang et al., 2022a). This observation is further supported by the similarity analysis (Table S5). These results demonstrate that vehicular VOC emissions on the Tibetan Plateau are dominated by evaporative emissions, which significantly differ from low-altitude tunnels, where tailpipe exhaust prevail.
Table 1The θ angles (°) among the source profiles of this study and those derived from SHED tests, gasoline vehicle exhaust from dynamometer tests, and low-altitude tunnel measurements. Direct measurement refers to the average VOC source profile based on all tunnel samples measured in this study.
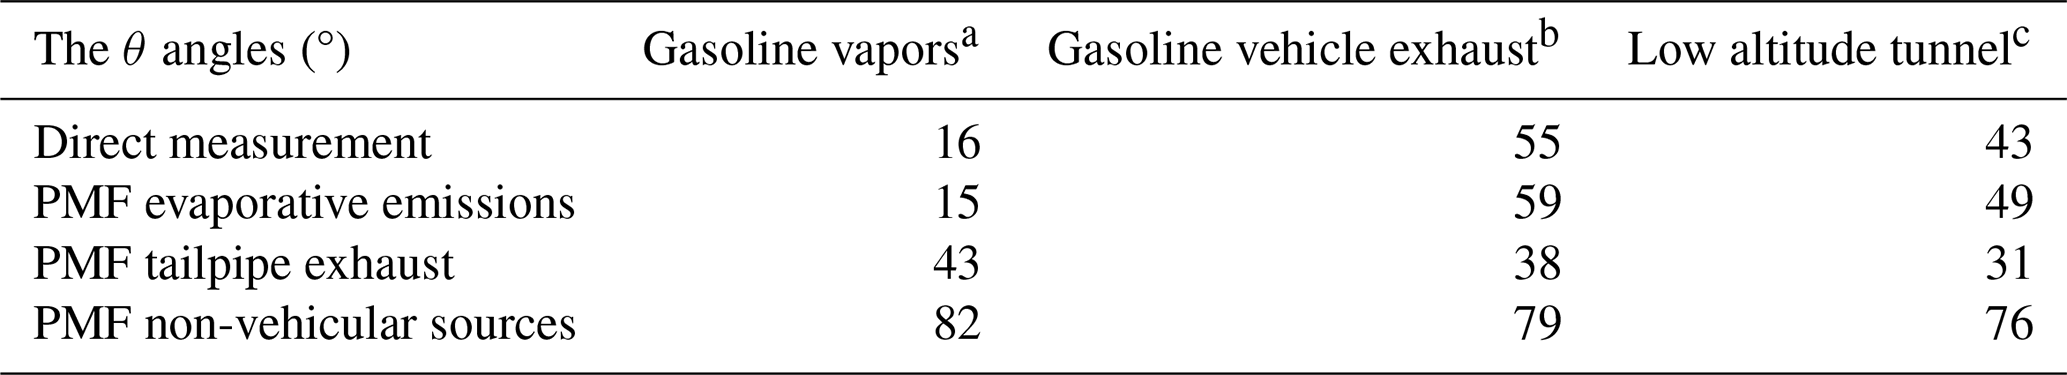
a Average profiles of gasoline vapors derived from SHED tests (Harley et al., 2000; Na et al., 2004; Liu et al., 2008; Zhang et al., 2013; Wu et al., 2015; Man et al., 2020; Sun et al., 2021). b Average profiles of gasoline vehicle exhaust derived from dynamometer tests (Schauer et al., 2002; Na et al., 2004; Guo et al., 2011; Gao et al., 2012; Ou et al., 2014; Li et al., 2019; Wang et al., 2022a). c Average profiles of vehicular emissions derived from low-altitude tunnel measurements (Staehelin et al., 1998; Hwa et al., 2002; Zhang et al., 2018b; Chiang et al., 2007; Gentner et al., 2013; Zhang et al., 2018a; Sun et al., 2019; Feng et al., 2021; Song et al., 2020; Jin et al., 2021; Song et al., 2018).
3.4 Source apportionment of VOCs in plateau tunnels
The factors derived from the PMF model are depicted in Fig. S11. One of these factors exhibits remarkable consistency with the composition of laboratory-measured gasoline vapor, with the angle between them being 15° (Fig. 3b, Table 1), thus designated as “evaporative emissions”. Specifically, the source profile of evaporative emissions comprises a majority of C4–C8 alkanes, C4–C6 alkenes (except for isoprene), and MTBE (Fig. S12, Table S6). In contrast, another factor contains a high proportion of C2–C3 alkanes, C2–C3 alkenes, C9–C12 alkanes, aromatics, as well as acetylene, a typical marker of combustion emissions. This agrees with the reported characteristics of tailpipe exhausts in the literature (Wang et al., 2020, 2022a), therefore, this factor is interpreted as representing “tailpipe exhausts”. The angle between the profiles of the PMF-resolved tailpipe exhaust and the chassis dynamometer-tested gasoline vehicle exhaust is 38° (Fig. 3c), showing a relatively poor similarity (Wang et al., 2024), which could be attributed to the influence of diesel vehicles, as well as potential influences from other sources. This discrepancy likely arises because the dynamometer data exclusively represent gasoline vehicle emissions, whereas the tunnel samples include contributions from diesel vehicles, which typically emit higher proportions of heavier alkanes and aromatics (Wang et al., 2022a; Schauer et al., 2002), differing from the VOC composition commonly observed in gasoline vehicle exhaust. The third factor contains substantial amounts of ethanol (59 %), halocarbons (5.4 %–65 %), and isoprene (36 %). Ethanol is unlikely to originate from fuel evaporation or combustion, as there is no ethanol-blended gasoline in Tibet. Additionally, halocarbon species are typically deemed insignificant in vehicular emissions (Kamiya et al., 2016). Isoprene, a tracer of plant emissions (Rasmussen, 1970), was only detected in the tunnels at 2000 m (Fig. S9), which aligns with the dense forests at 2000 m and sparse above 3000 m in Tibet (Fig. S13). It is thus considered to represent non-vehicular sources.
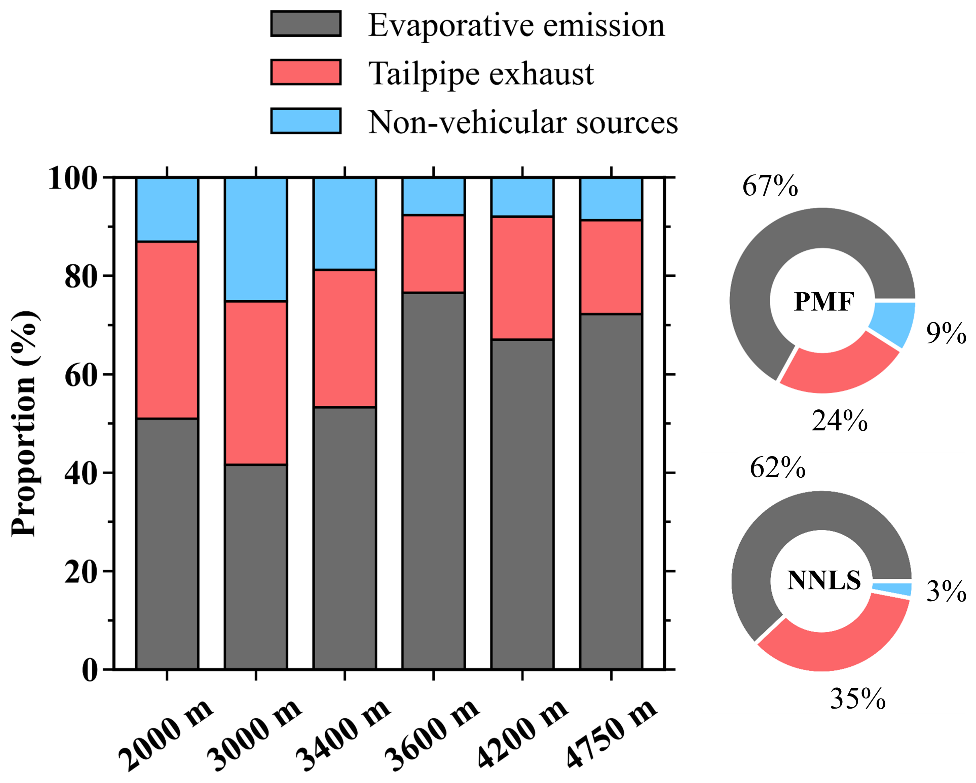
Figure 4The relative contributions of different sources to VOCs measured in tunnels at various altitudes from PMF analysis. Gray, light red, and light blue bars represent evaporative emissions, tailpipe exhaust, and non-vehicular sources, respectively. The average results for PMF analysis and NNLS analysis are shown in pie charts as well.
As anticipated, evaporative emissions made the largest contributions, account for 67 % of total VOC emissions, whereas tailpipe exhausts and non-vehicular sources contributed to 24 % and 9.0 % (Fig. 4), respectively. For comparison, a tunnel study in Tianjin performed in 2020 shows that evaporative emissions and tailpipe emissions contribute 32 % and 68 % of VOCs, respectively (Sun et al., 2021). Source apportionment in Henan reported that evaporative and tailpipe emissions contributed 38 % and 62 % of vehicular VOC emissions, respectively (Liu et al., 2022). In Haikou, a tropical city, tunnel measurements found that high temperatures significantly enhanced evaporative emissions, leading to the highest reported contribution of evaporative emission (45 %) (Huo et al., 2024). In addition, emission inventory (EI) data for China in 2015 indicated that evaporative emissions and tailpipe exhaust accounted for 39 % and 61 % of vehicular emissions, respectively (Liu et al., 2017). The markedly higher proportion of evaporative emissions in the plateau tunnels reflects that evaporative emission is the most important source of vehicular emissions in high-altitude regions. While variations in vehicle fleet composition, fuel quality, and driving conditions across different cities and time periods can significantly influence VOC emission characteristics in low-altitude studies, our high-altitude tunnel measurements consistently demonstrate systematically elevated evaporative emissions.
The contribution of vehicular evaporative emissions exhibits an upward trend with ascending altitude, rising from 51 % at 2000 m to 72 % at 4750 m (Table S7). The peak at 3600 m (77 %) could be attributed to its relatively higher EF of evaporative species (Fig. 2). In contrast, tailpipe exhaust shows an overall decreasing trend, with contributions decreasing from 36 % to 16 %, although some altitudes deviate somewhat from this trend. It should be note that the decline in the proportion of tailpipe exhaust does not necessarily indicate a decrease in combustion emission intensity but rather be attributed to the overall increase in total vehicular emissions. The contribution of non-vehicular emissions reaches its maximum at 3000 m altitude, consistent with previous descriptions that tunnels at this altitude are more susceptible to impacts from other sources in urban regions.
As a complementary analysis, the results of the NNLS multivariate linear are consistent with those of the PMF analysis, showing the highest contribution from evaporative emissions (62 %), followed by tailpipe exhaust (35 %) and non-vehicular sources (3.0 %) (Fig. 4). Additionally, the representative species for evaporative emissions and tailpipe exhaust from both approaches also show overall consistency (Fig. S12, Table S6). The agreement between the two approaches and their alignment with literature results underscore the reliability of our data and analysis results.
3.5 Implications and perspectives
Over the past two decades (2000–2020), the number of civilian vehicles in Tibet has increased by a factor of 14, while road mileage has expanded fivefold and road freight volume has surged over 30 times, exerting substantial pressure on the region's fragile ecosystem (National Bureau of Statistics of China, 2021). This study demonstrates that low atmospheric pressure significantly amplifies vehicular VOC emissions on the Tibetan Plateau by enhancing evaporative emissions. However, current emission inventories predominantly rely on emission factors derived from low-altitude regions, resulting in a significant underestimation of VOC emissions in high-altitude and mountainous areas. For instance, Liu et al. (2017) estimated that evaporative emissions accounted for only 4 % of total vehicular VOC emissions in Tibet, a figure markedly lower than our experimental results. This discrepancy implies that the inventory of vehicular VOC emissions in Tibet may be underestimated by approximately 70 %. Given that high-altitude lands (above 2000 m a.s.l.) constitute around 32 % of China's total land area and about 11 % of the global land area (Central People's Government of the People's Republic of China, 2005), these findings could have far-reaching implications for regional and even global atmospheric environments and climate.
In recent decades, stringent emission standards, advances in emission control technologies, and improvements in fuel quality have significantly reduced vehicular emissions (Wu et al., 2019; Man et al., 2018). However, these measures primarily focus on tailpipe emissions and may not effectively mitigate VOC emissions from fuel evaporation (Huang et al., 2022). This deficiency, as our study demonstrates, is more pronounced in high-altitude environments. Thus, it is crucial to develop targeted strategies and technologies to mitigate vehicular evaporative emissions, particularly in such regions.
One promising approach for Tibet is the strategic promotion of electric vehicles (EVs), supported by China's mature EVs industry and Tibet's abundance renewable energy resources. The region's installed capacity of hydropower and solar energy exceeds 10×106 kW (National Energy Administration, 2024), with ongoingdevelopment of large-scale solar and wind projects. However, local electricity demand remains low due to sparse population and limited industrial activity, resulting in surplus energy transmitted eastward via the “West–East Electricity Transmission” project (Xinhua News Agency, 2024). Promoting EVs could absorb this surplus, alleviating grid strain. Dispite this, the deployment of EVs in Tibet faces specific challenges, particularly due to the region's low-temperature environments. These conditions necessitate advancements in battery technology, such as the development of solid-state batteries with improved thermal resilience, as well as altitude-adaptive battery management systems. In summary, promotion of EVs in high-altitude regions like Tibet presents a win-win solution: it not only reduces vehicular emissions but also fosters a synergistic relationship with local renewable energy projects, yielding both environmental and economic benefits. This approach could serve as a model for integrating clean energy and transportation solutions in other high-altitude regions globally, contributing to broader efforts to mitigate climate change.
This study presents a detailed investigation of vehicular VOC emissions across the Tibetan Plateau, exploring their behavior in a high-altitude region. The findings reveal significant differences in emission characteristics compared to low-altitude regions. Total VOC emission factors and ratios increase significantly with altitude on the Tibetan Plateau, driven primarily by enhanced evaporative emissions, with alkanes, particularly butanes and pentanes, dominating at 67 % of emissions. Low atmospheric pressure at higher altitudes enhances evaporative emissions, with butanes and pentanes showing emission factors 4.5–21 times higher than at sea level, confirming pressure's dominant role over temperature. In contrast, tailpipe exhaust emissions, such as ethylene and benzene, show no clear altitude dependence. Source profile similarity analysis further elucidates differences among emission sources, revealing that VOC profiles in plateau tunnels closely resemble gasoline vapor from SHED tests, highlighting distinct high-altitude emission characteristics. Source apportionment analysis reveals that evaporative emissions contribute the most to VOCs, accounting for 67 %, followed by tailpipe exhaust (24 %) and non-vehicular sources (9 %). This is in stark contrast to low-altitude regions, where tailpipe emissions dominate. These results suggest that vehicular VOC emissions in high-altitude regions, such as the Tibetan Plateau, may be significantly underestimated. They underscore the critical need to account for unique environmental factors, such as low atmospheric pressure, when evaluating emissions in these areas. Furthermore, this study emphasizes the importance of developing altitude-specific emission inventories and leveraging the region's abundant renewable energy resources to reduce atmospheric impacts.
All data are available in the text, Supplement or publicly on Zenodo (https://doi.org/10.5281/zenodo.14007534, Huang, 2024).
The supplement related to this article is available online at https://doi.org/10.5194/acp-25-15403-2025-supplement.
PC and BY designed the research. PC and BY organized mobile measurements with contributions from PFY. SHW and PC contributed to data collection. WCH performed the data analysis, with contributions from SHW. WCH and SHW prepared the manuscript with contributions from PC, BY and HCW. All the authors reviewed the manuscript.
The contact author has declared that none of the authors has any competing interests.
Publisher's note: Copernicus Publications remains neutral with regard to jurisdictional claims made in the text, published maps, institutional affiliations, or any other geographical representation in this paper. While Copernicus Publications makes every effort to include appropriate place names, the final responsibility lies with the authors. Views expressed in the text are those of the authors and do not necessarily reflect the views of the publisher.
This study was supported by the Second Scientific Expedition Research Project on the Tibetan Plateau (grant no. 2019QZKK0604) and National Key R&D Program Project Task Book (grant no. 2023YFC3706103).
This paper was edited by Andrea Pozzer and reviewed by three anonymous referees.
Ammoura, L., Xueref-Remy, I., Gros, V., Baudic, A., Bonsang, B., Petit, J.-E., Perrussel, O., Bonnaire, N., Sciare, J., and Chevallier, F.: Atmospheric measurements of ratios between CO2 and co-emitted species from traffic: a tunnel study in the Paris megacity, Atmos. Chem. Phys., 14, 12871–12882, https://doi.org/10.5194/acp-14-12871-2014, 2014.
Central People's Government of the People's Republic of China: Geographical National Conditions, https://www.gov.cn/guoqing/2005-09/13/content_2582624.htm (last access: 12 April 2025), 2005.
Chai, J., Niu, Y., Yan, Y., Duan, X., Zhang, X., Xing, Y., Zheng, X., and Peng, L.: Variation, source and health risk assessment of volatile organic compounds in underground park: A case study of an underground park in Beijing, Environ. Chem., 42, 2292–2303, https://doi.org/10.7524/j.issn.0254-6108.2022112203, 2023 (in Chinese).
Chiang, H. L., Hwu, C. S., Chen, S. Y., Wu, M. C., Ma, S. Y., and Huang, Y. S.: Emission factors and characteristics of criteria pollutants and volatile organic compounds (VOCs) in a freeway tunnel study, Sci. Total. Environ., 381, 200–211, https://doi.org/10.1016/j.scitotenv.2007.03.039, 2007.
Chin, J. Y. and Batterman, S. A.: VOC composition of current motor vehicle fuels and vapors, and collinearity analyses for receptor modeling, Chemosphere, 86, 951–958, https://doi.org/10.1016/j.chemosphere.2011.11.017, 2012.
Chung, C. Y. and Chung, P. L.: A numerical and experimental study of pollutant dispersion in a traffic tunnel, Environ. Monit. Assess., 130, 289–299, https://doi.org/10.1007/s10661-006-9397-0, 2007.
Cliff, S. J., Lewis, A. C., Shaw, M. D., Lee, J. D., Flynn, M., Andrews, S. J., Hopkins, J. R., Purvis, R. M., and Yeoman, A. M.: Unreported VOC Emissions from Road Transport Including from Electric Vehicles, Environ. Sci. Technol., 57, 8026–8034, https://doi.org/10.1021/acs.est.3c00845, 2023.
Cui, L., Wang, X. L., Ho, K. F., Gao, Y., Liu, C., Ho, S. S. H., Li, H. W., Lee, S. C., Wang, X. M., Jiang, B. Q., Huang, Y., Chow, J. C., Watson, J. G., and Chen, L. W.: Decrease of VOC emissions from vehicular emissions' in Hong Kong from 2003 to 2015: Results from a tunnel, study, Atmos. Environ., 177, 64–74, https://doi.org/10.1016/j.atmosenv.2018.01.020, 2018.
Du, Z., Hu, M., Peng, J., Zhang, W., Zheng, J., Gu, F., Qin, Y., Yang, Y., Li, M., Wu, Y., Shao, M., and Shuai, S.: Comparison of primary aerosol emission and secondary aerosol formation from gasoline direct injection and port fuel injection vehicles, Atmos. Chem. Phys., 18, 9011–9023, https://doi.org/10.5194/acp-18-9011-2018, 2018.
Feng, M., Hu, X., Zhou, L., Zhang, T. Y., Zhang, X., Tan, Q. N., Zhou, Z. H., Deng, Y., Song, D. L., and Huang, C. M.: Real-World Vehicle Volatile Organic Compound Emissions and Their Source Profile in Chengdu Based on a Roadside and Tunnel Study, Atmosphere, 12, 13, https://doi.org/10.3390/atmos12070861, 2021.
Gao, S., Jin, L., Shi, J., Han, B., Wang, X., Peng, Y., Zhao, L., and Bai, Z.: VOCs emission characteristics and emission factors of light-duty gasoline vehicles with bench test, China-Environ. Sci., 32, 397–405, 2012 (in Chinese).
Gentner, D. R., Worton, D. R., Isaacman, G., Davis, L. C., Dallmann, T. R., Wood, E. C., Herndon, S. C., Goldstein, A. H., and Harley, R. A.: Chemical Composition of Gas-Phase Organic Carbon Emissions from Motor Vehicles and Implications for Ozone Production, Environ. Sci. Technol., 47, 11837–11848, https://doi.org/10.1021/es401470e, 2013.
Gillies, J. A., Gertler, A. W., Sagebiel, J. C., and Dippel, W. A.: On-Road Particulate Matter (PM2.5 and PM10) Emissions in the Sepulveda Tunnel, Los Angeles, California, Environ. Sci. Technol., 35, 1054–1063, https://doi.org/10.1021/es991320p, 2001.
Guo, H., Zou, S. C., Tsai, W. Y., Chan, L. Y., and Blake, D. R.: Emission characteristics of nonmethane hydrocarbons from private cars and taxis at different driving speeds in Hong Kong, Atmos. Environ., 45, 2711–2721, https://doi.org/10.1016/j.atmosenv.2011.02.053, 2011.
Hage, K. D.: Averaging errors in monthly evaporation estimates, Water Resour. Res., 11, 359–361, https://doi.org/10.1029/WR011i002p00359, 1975.
Harley, R. A., Coulter-Burke, S. C., and Yeung, T. S.: Relating liquid fuel and headspace vapor composition for California reformulated gasoline samples containing ethanol, Environ. Sci. Technol., 34, 4088–4094, https://doi.org/10.1021/es0009875, 2000.
Harrison, R. M., Allan, J., Carruthers, D., Heal, M. R., Lewis, A. C., Marner, B., Murrells, T., and Williams, A.: Non-exhaust vehicle emissions of particulate matter and VOC from road traffic: A review, Atmos. Environ., 262, 118592, https://doi.org/10.1016/j.atmosenv.2021.118592, 2021.
Hata, H., Okada, M., Funakubo, C., and Hoshi, J.: Tailpipe VOC Emissions from Late Model Gasoline Passenger Vehicles in the Japanese Market, Atmosphere, 10, 11, https://doi.org/10.3390/atmos10100621, 2019.
Ho, K. F., Lee, S. C., Ho, W. K., Blake, D. R., Cheng, Y., Li, Y. S., Ho, S. S. H., Fung, K., Louie, P. K. K., and Park, D.: Vehicular emission of volatile organic compounds (VOCs) from a tunnel study in Hong Kong, Atmos. Chem. Phys., 9, 7491–7504, https://doi.org/10.5194/acp-9-7491-2009, 2009.
Hu, W. T., Marek, E., Donat, F., Dennis, J. S., and Scott, S. A.: A thermogravimetric method for the measurement of ratio at the surface of carbon during combustion, Proc. Combust. Inst., 37, 2987–2993, https://doi.org/10.1016/j.proci.2018.05.040, 2019.
Huang, J., Yuan, Z. B., Duan, Y. S., Liu, D. G., Fu, Q. Y., Liang, G. P., Li, F., and Huang, X. F.: Quantification of temperature dependence of vehicle evaporative volatile organic compound emissions from different fuel types in China, Sci. Total. Environ., 813, 9, https://doi.org/10.1016/j.scitotenv.2021.152661, 2022.
Huang, W.: Measurement report: Unexpected high volatile organic compounds emission from vehicles on the Tibetan Plateau Dataset, Zenodo [data set], https://doi.org/10.5281/zenodo.14007534, 2024.
Humes, M. B., Wang, M., Kim, S., Machesky, J. E., Gentner, D. R., Robinson, A. L., Donahue, N. M., and Presto, A. A.: Limited secondary organic aerosol production from acyclic oxygenated volatile chemical products, Environ. Sci. Technol., 56, 4806–4815, https://doi.org/10.1021/acs.est.1c07354, 2022.
Huo, S., Zhang, X., Xu, W., Dang, J., Xu, F., Xie, W., Tao, C., Han, Y., Liu, X., Teng, Z., Xie, R., Cao, X., and Zhang, Q.: Updating vehicle VOCs emissions characteristics under clean air actions in a tropical city of China, Sci. Total. Environ., 930, 172733, https://doi.org/10.1016/j.scitotenv.2024.172733, 2024.
Hwa, M. Y., Hsieh, C. C., Wu, T. C., and Chang, L. F. W.: Real-world vehicle emissions and VOCs profile in the Taipei tunnel located at Taiwan Taipei area, Atmos. Environ., 36, 1993–2002, https://doi.org/10.1016/s1352-2310(02)00148-6, 2002.
Hwang, K., An, J. G., Loh, A., Kim, D., Choi, N., Song, H. Y., Choi, W., and Yim, U. H.: Mobile measurement of vehicle emission factors in a roadway tunnel: A concentration gradient approach, Chemosphere, 328, 8, https://doi.org/10.1016/j.chemosphere.2023.138611, 2023.
Jathar, S. H., Gordon, T. D., Hennigan, C. J., Pye, H. O. T., Pouliot, G., Adams, P. J., Donahue, N. M., and Robinson, A. L.: Unspeciated organic emissions from combustion sources and their influence on the secondary organic aerosol budget in the United States, Proc. Natl. Acad. Sci. U.S.A., 111, 10473–10478, https://doi.org/10.1073/pnas.1323740111, 2014.
Jin, B. Q., Zhu, R. C., Mei, H., Wang, M. L., Zu, L., Yu, S. J., Zhang, R. Q., Li, S. Y., and Bao, X. F.: Volatile organic compounds from a mixed fleet with numerous E10-fuelled vehicles in a tunnel study in China: Emission characteristics, ozone formation and secondary organic aerosol formation, Environ. Res., 200, 10, https://doi.org/10.1016/j.envres.2021.111463, 2021.
Kamiya, Y., Iijima, A., Ikemori, F., Okuda, T., and Ohura, T.: Source apportionment of chlorinated polycyclic aromatic hydrocarbons associated with ambient particles in a Japanese megacity, Sci. Rep., 6, 10, https://doi.org/10.1038/srep38358, 2016.
Kirchstetter, T. W., Singer, B. C., Harley, R. A., Kendall, G. R., and Hesson, J. M.: Impact of California Reformulated Gasoline on Motor Vehicle Emissions. 2. Volatile Organic Compound Speciation and Reactivity, Environ. Sci. Technol., 33, 329–336, https://doi.org/10.1021/es980374g, 1999.
Kostenidou, E., Lee, B.-H., Engelhart, G. J., Pierce, J. R., and Pandis, S. N.: Mass spectra deconvolution of low, medium, and high volatility biogenic secondary organic aerosol, Environ. Sci. Technol., 43, 4884–4889, https://doi.org/10.1021/es803676g, 2009.
Koutsoyiannis, D.: Clausius-Clapeyron equation and saturation vapour pressure: simple theory reconciled with practice, Eur. J. Phys., 33, 295–305, https://doi.org/10.1088/0143-0807/33/2/295, 2012.
Legreid, G., Reimann, S., Steinbacher, M., Staehelin, J., Young, D., and Stemmler, K.: Measurements of OVOCs and NMHCs in a swiss highway tunnel for estimation of road transport emissions, Environ. Sci. Technol., 41, 7060–7066, https://doi.org/10.1021/es062309+, 2007.
Li, H. Y., He, Q. S., Song, Q., Chen, L. G., Song, Y. J., Wang, Y. H., Lin, K., Xu, Z. C., and Shao, M.: Diagnosing Tibetan pollutant sources via volatile organic compound observations, Atmos. Environ., 166, 244–254, https://doi.org/10.1016/j.atmosenv.2017.07.031, 2017.
Li, W., Sha, Q. E., Yuan, Z., Wang, R., Lin, X., Zheng, J., and Shao, M.: Emission characteristics of VOCs from light-duty gasoline vehicles at constant speed in the Pearl River Delta, Acta. Sci. Circumst., 39, 243–251, https://doi.org/10.13671/j.hjkxxb.2018.0340, 2019 (in Chinese).
Liu, H., Hanyang, M., Tschantz, M., Wu, Y., He, K., and Hao, J.: VOC emissions from the vehicle evaporation process: status and control strategy, Environ. Sci. Technol., 49, https://doi.org/10.1021/acs.est.5b04064, 2015.
Liu, H., Man, H., Cui, H., Wang, Y., Deng, F., Wang, Y., Yang, X., Xiao, Q., Zhang, Q., Ding, Y., and He, K.: An updated emission inventory of vehicular VOCs and IVOCs in China, Atmos. Chem. Phys., 17, 12709–12724, https://doi.org/10.5194/acp-17-12709-2017, 2017.
Liu, X., Zhu, R., Jin, B., Mei, H., Zu, L., Yin, S., Zhang, R., and Hu, J.: Characteristics and source apportionment of VOC emissions from motor vehicles based on tunnel tests, Environ. Sci.-China, 43, 1777–1787, https://doi.org/10.13227/j.hjkx.202108192, 2022 (in Chinese).
Liu, Y., Shao, M., Fu, L. L., Lu, S. H., Zeng, L. M., and Tang, D. G.: Source profiles of volatile organic compounds (VOCs) measured in China: Part I, Atmos. Environ., 42, 6247–6260, https://doi.org/10.1016/j.atmosenv.2008.01.070, 2008.
Man, H. Y., Liu, H., Xiao, Q., Deng, F. Y., Yu, Q., Wang, K., Yang, Z. J., Wu, Y., He, K. B., and Hao, J. M.: How ethanol and gasoline formula changes evaporative emissions of the vehicles, Appl. Energy, 222, 584–594, https://doi.org/10.1016/j.apenergy.2018.03.109, 2018.
Man, H. Y., Liu, H., Niu, H., Wang, K., Deng, F. Y., Wang, X. T., Xiao, Q., and Hao, J. M.: VOCs evaporative emissions from vehicles in China: Species characteristics of different emission processes, Env. Sci. Ecotechnol., 1, 11, https://doi.org/10.1016/j.ese.2019.100002, 2020.
Na, K., Kim, Y. P., Moon, I., and Moon, K. C.: Chemical composition of major VOC emission sources in the Seoul atmosphere, Chemosphere, 55, 585–594, https://doi.org/10.1016/j.chemosphere.2004.01.010, 2004.
National Bureau of Statistics of China: China Statistical Yearbook 2021, China Statistics Press, Beijing, https://www.stats.gov.cn/sj/ndsj/2021/indexch.htm (last access: 10 November 2025), 2021.
National Energy Administration: Tibet Has Cumulatively Transmitted 14.6 Billion Kilowatt-Hours of Clean Energy: https://www.gov.cn/lianbo/difang/202409/content_6977529.htm (last access: 12 April 2025), 2024.
Ou, J., Feng, X., Liu, Y., Gao, Z., Yang, Y., Zhang, Z., Wang, X., and Zheng, J.: Source characteristics of VOCs emissions from vehicular exhaust in the Pearl River Delta region, Acta. Sci. Circumst., 34, 826–834, https://doi.org/10.13671/j.hjkxxb.2014.0614, 2014 (in Chinese).
Paatero, P. and Tapper, U.: Positive matrix factorization: A non-negative factor model with optimal utilization of error estimates of data values, Environmetrics, 5, 111–126, https://doi.org/10.1002/env.3170050203, 1994.
Pierson, W. R., Schorran, D. E., Fujita, E. M., Sagebiel, J. C., Lawson, D. R., and Tanner, R. L.: Assessment of Nontailpipe Hydrocarbon Emissions from Motor Vehicles, J. Air. Waste. Manag. Assoc., 49, 498–519, https://doi.org/10.1080/10473289.1999.10463827, 1999.
Rasmussen, R. A.: Isoprene: identified as a forest-type emission to the atmosphere, Environ. Sci. Technol., 4, 667–671, https://doi.org/10.1021/es60043a008, 1970.
Schauer, J. J., Kleeman, M. J., Cass, G. R., and Simoneit, B. R. T.: Measurement of emissions from air pollution sources. 5. C1–C32 organic compounds from gasoline-powered motor vehicles, Environ. Sci. Technol., 36, 1169–1180, https://doi.org/10.1021/es0108077, 2002.
Song, C., Ma, C., Zhang, Y., Wang, T., Wu, L., Wang, P., Liu, Y., Li, Q., Zhang, J., and Dai, Q.: Heavy-duty diesel vehicles dominate vehicle emissions in a tunnel study in northern China, Sci. Total. Environ., 637, 431–442, https://doi.org/10.1016/j.scitotenv.2018.04.387, 2018.
Song, C. B., Liu, Y., Sun, L. N., Zhang, Q. J., and Mao, H. J.: Emissions of volatile organic compounds (VOCs) from gasoline- and liquified natural gas (LNG)-fueled vehicles in tunnel studies, Atmos. Environ., 234, 13, https://doi.org/10.1016/j.atmosenv.2020.117626, 2020.
Staehelin, J., Keller, C., Stahel, W., Schläpfer, K., and Wunderli, S.: Emission factors from road traffic from a tunnel study (Gubrist tunnel, Switzerland). Part III: Results of organic compounds, SO2 and speciation of organic exhaust emission, Atmos. Environ., 32, 999–1009, https://doi.org/10.1016/S1352-2310(97)00339-7, 1998.
Sun, L., Liu, Y., Zhao, J., Sun, S., Song, C., Zhang, J., Li, Y., Lin, Y., Wang, T., and Mao, H.: Pollution Characteristics and Emission Factors of VOCs from Vehicle Emissions in the Tianjin Tunnel, Environ. Sci.-China, 40, 104–113, https://doi.org/10.13227/j.hjkx.201804187, 2019 (in Chinese).
Sun, L. N., Zhong, C. Z., Peng, J. F., Wang, T., Wu, L., Liu, Y., Sun, S. D., Li, Y. N., Chen, Q., Song, P. F., and Mao, H. J.: Refueling emission of volatile organic compounds from China 6 gasoline vehicles, Sci. Total. Environ., 789, 10, https://doi.org/10.1016/j.scitotenv.2021.147883, 2021.
Tang, G. Q., Yao, D., Kang, Y. Y., Liu, Y. T., Liu, Y. S., Wang, Y. H., Bai, Z. X., Sun, J., Cong, Z. Y., Xin, J. Y., Liu, Z. Y., Zhu, Z. Y., Geng, Y. J., Wang, L. L., Li, T. T., Li, X., Bian, J. C., and Wang, Y. S.: The urgent need to control volatile organic compound pollution over the Qinghai-Tibet Plateau, Iscience, 25, 13, https://doi.org/10.1016/j.isci.2022.105688, 2022.
Tao, J., Luo, B., Meng, Z., Xie, L., Zhang, S., Hong, J., Zhou, Y., Kuang, Y., Wang, Q., Huang, S., Cheng, P., Yuan, B., Yu, P., Su, H., Cheng, Y., and Ma, N.: A New Method for Size-Resolved Aerosol CCN Activity Measurement at Low Supersaturation in Pristine Atmosphere, J. Geophys. Res.-Atmos., 129, e2023JD040357, https://doi.org/10.1029/2023JD040357, 2024.
Ulbrich, I. M., Canagaratna, M. R., Zhang, Q., Worsnop, D. R., and Jimenez, J. L.: Interpretation of organic components from Positive Matrix Factorization of aerosol mass spectrometric data, Atmos. Chem. Phys., 9, 2891–2918, https://doi.org/10.5194/acp-9-2891-2009, 2009.
US EPA: Evaporative Emissions from Onroad Vehicles in MOVES5, EPA-420-R-424-014, https://nepis.epa.gov/Exe/ZyPDF.cgi?Dockey=P101CTZI.pdf (last access: 8 October 2025), 2024.
Vollmer, M. K., Juergens, N., Steinbacher, M., Reimann, S., Weilenmann, M., and Buchmann, B.: Road vehicle emissions of molecular hydrogen (H2) from a tunnel study, Atmos. Environ., 41, 8355–8369, https://doi.org/10.1016/j.atmosenv.2007.06.037, 2007.
Wang, H., Ge, Y., Hao, L., Xu, X., Tan, J., Li, J., Wu, L., Yang, J., Yang, D., and Peng, J. J. A. E.: The real driving emission characteristics of light-duty diesel vehicle at various altitudes, Atmos. Environ., 191, 126–131, 2018.
Wang, M. L., Li, S. Y., Zhu, R. C., Zhang, R. Q., Zu, L., Wang, Y. J., and Bao, X. F.: On-road tailpipe emission characteristics and ozone formation potentials of VOCs from gasoline, diesel and liquefied petroleum gas fueled vehicles, Atmos. Environ., 223, 9, https://doi.org/10.1016/j.atmosenv.2020.117294, 2020.
Wang, S., Yuan, B., Wu, C., Wang, C., Li, T., He, X., Huangfu, Y., Qi, J., Li, X.-B., Sha, Q., Zhu, M., Lou, S., Wang, H., Karl, T., Graus, M., Yuan, Z., and Shao, M.: Oxygenated volatile organic compounds (VOCs) as significant but varied contributors to VOC emissions from vehicles, Atmos. Chem. Phys., 22, 9703–9720, https://doi.org/10.5194/acp-22-9703-2022, 2022a.
Wang, S., Yuan, B., He, X., Cui, R., Song, X., Chen, Y., Wu, C., Wang, C., Huangfu, Y., Li, X.-B., Wang, B., and Shao, M.: Emission characteristics of reactive organic gases (ROGs) from industrial volatile chemical products (VCPs) in the Pearl River Delta (PRD), China, Atmos. Chem. Phys., 24, 7101–7121, https://doi.org/10.5194/acp-24-7101-2024, 2024.
Wang, X. L., Chen, L. W. A., Lu, M. G., Ho, K. F., Lee, S. C., Ho, S. S. H., Chow, J. C., and Watson, J. G.: Apportionment of Vehicle Fleet Emissions by Linear Regression, Positive Matrix Factorization, and Emission Modeling, Atmosphere, 13, 19, https://doi.org/10.3390/atmos13071066, 2022b.
Wren, S. N., Liggio, J., Han, Y., Hayden, K., Lu, G., Mihele, C. M., Mittermeier, R. L., Stroud, C., Wentzell, J. J. B., and Brook, J. R.: Elucidating real-world vehicle emission factors from mobile measurements over a large metropolitan region: a focus on isocyanic acid, hydrogen cyanide, and black carbon, Atmos. Chem. Phys., 18, 16979–17001, https://doi.org/10.5194/acp-18-16979-2018, 2018.
Wu, X., Zhang, S. J., Guo, X., Yang, Z. J., Liu, J. Q., He, L. Q., Zheng, X., Han, L., Liu, H., and Wu, Y.: Assessment of ethanol blended fuels for gasoline vehicles in China: Fuel economy, regulated gaseous pollutants and particulate matter, Environ. Pollut., 253, 731–740, https://doi.org/10.1016/j.envpol.2019.07.045, 2019.
Wu, Y., Yang, Y. D., Shao, M., and Lu, S. H.: Missing in total OH reactivity of VOCs from gasoline evaporation, Chin. Chem. Lett., 26, 1246–1248, https://doi.org/10.1016/j.cclet.2015.05.047, 2015.
Wu, Y. J., Liu, Y., Liu, P. J., Sun, L. N., Song, P. F., Peng, J. F., Li, R. K., Wei, N., Wu, L., Wang, T., Zhang, L. N., Yang, N., and Mao, H. J.: Evaluating vehicular exhaust and evaporative emissions via VOC measurement in an underground parking garage, Environ. Pollut., 333, 9, https://doi.org/10.1016/j.envpol.2023.122022, 2023.
Xinhua News Agency: From Coal Power Transmission to Green Power Delivery – China's “West–East Electricity Transmission” Accelerates Green Transition, https://www.nea.gov.cn/2024-08/23/c_1212390763.htm (last access: 12 April 2025), 2024.
Xu, X., Zhao, T., Lu, C., Guo, Y., Chen, B., Liu, R., Li, Y., and Shi, X.: An important mechanism sustaining the atmospheric “water tower” over the Tibetan Plateau, Atmos. Chem. Phys., 14, 11287–11295, https://doi.org/10.5194/acp-14-11287-2014, 2014.
Xue, L. K., Wang, T., Guo, H., Blake, D. R., Tang, J., Zhang, X. C., Saunders, S. M., and Wang, W. X.: Sources and photochemistry of volatile organic compounds in the remote atmosphere of western China: results from the Mt. Waliguan Observatory, Atmos. Chem. Phys., 13, 8551–8567, https://doi.org/10.5194/acp-13-8551-2013, 2013.
Yao, T., Thompson, L. G., Mosbrugger, V., Zhang, F., Ma, Y., Luo, T., Xu, B., Yang, X., Joswiak, D. R., and Wang, W.: Third pole environment (TPE), Environ. Dev., 3, 52–64, https://doi.org/10.1016/j.envdev.2012.04.002, 2012.
Ye, T., Shi, P. J., and Cui, P.: Integrated Disaster Risk Research of the Qinghai-Tibet Plateau Under Climate Change, Int. J. Disaster Risk Sci., 3, https://doi.org/10.1007/s13753-023-00510-0, 2023.
Yue, T. T., Yue, X., Chai, F. H., Hu, J. N., Lai, Y. T., He, L. Q., and Zhu, R. C.: Characteristics of volatile organic compounds (VOCs) from the evaporative emissions of modern passenger cars, Atmos. Environ., 151, 62–69, https://doi.org/10.1016/j.atmosenv.2016.12.008, 2017.
Zhang, J., Peng, J., Song, A., Du, Z., Guo, J., Liu, Y., Yang, Y., Wu, L., Wang, T., Song, K., Guo, S., Collins, D., and Mao, H.: Secondary Organic Aerosol Formation Potential from Vehicular Non-tailpipe Emissions under Real-World Driving Conditions, Environ. Sci. Technol., 58, 5419–5429, https://doi.org/10.1021/acs.est.3c06475, 2024.
Zhang, Q. J., Wu, L., Fang, X. Z., Liu, M. Y., Zhang, J., Shao, M., Lu, S. H., and Mao, H. J.: Emission factors of volatile organic compounds (VOCs) based on the detailed vehicle classification in a tunnel study, Sci. Total. Environ., 624, 878–886, https://doi.org/10.1016/j.scitotenv.2017.12.171, 2018a.
Zhang, Q. J., Sun, L. A., Wei, N., Wu, L., and Mao, H. J.: The characteristics and source analysis of VOCs emissions at roadside: Assess the impact of ethanol-gasoline implementation, Atmos. Environ., 263, 10, https://doi.org/10.1016/j.atmosenv.2021.118670, 2021.
Zhang, Y. L., Wang, X. M., Zhang, Z., Lü, S. J., Shao, M., Lee, F. S. C., and Yu, J. Z.: Species profiles and normalized reactivity of volatile organic compounds from gasoline evaporation in China, Atmos. Environ., 79, 110–118, https://doi.org/10.1016/j.atmosenv.2013.06.029, 2013.
Zhang, Y. L., Yang, W. Q., Simpson, I., Huang, X. Y., Yu, J. Z., Huang, Z. H., Wang, Z. Y., Zhang, Z., Liu, D., Huang, Z. Z., Wang, Y. J., Pei, C. L., Shao, M., Blake, D. R., Zheng, J. Y., Huang, Z. J., and Wang, X. M.: Decadal changes in emissions of volatile organic compounds (VOCs) from on-road vehicles with intensified automobile pollution control: Case study in a busy urban tunnel in south China, Environ. Pollut., 233, 806–819, https://doi.org/10.1016/j.envpol.2017.10.133, 2018b.
Zhong, Y. L., Yu, H., Wang, W. W., and Yu, P. F.: Impacts of future urbanization and rooftop photovoltaics on the surface meteorology and energy balance of Lhasa, China, Urban CLim., 51, 13, https://doi.org/10.1016/j.uclim.2023.101668, 2023.
Zhu, W., Guo, S., Zhang, Z., Wang, H., Yu, Y., Chen, Z., Shen, R., Tan, R., Song, K., Liu, K., Tang, R., Liu, Y., Lou, S., Li, Y., Zhang, W., Zhang, Z., Shuai, S., Xu, H., Li, S., Chen, Y., Hu, M., Canonaco, F., and Prévôt, A. S. H.: Mass spectral characterization of secondary organic aerosol from urban cooking and vehicular sources, Atmos. Chem. Phys., 21, 15065–15079, https://doi.org/10.5194/acp-21-15065-2021, 2021.