the Creative Commons Attribution 4.0 License.
the Creative Commons Attribution 4.0 License.
 | 10 Nov 2025
Deciphering dust provenance and transport pathways across Northern China's source-sink systems
Lanying Han
Zhenyu Zhang
Aimin Liang
Junfeng Lu
Zhibao Dong
Zhengcai Zhang
Northern China's arid lands constitute one of Earth's most active aeolian ecosystems, yet persistent uncertainties remain regarding the precise source apportionment of dust emissions impacting downstream regions. By applying advanced geochemical fingerprinting techniques to modern airborne dust samples collected from 11 to 29 April 2023 across major potential provenance areas (Taklimakan, Gurbantunggut, Hexi Corridor, Heihe River Basin, Alxa Plateau, and Qaidam Basin Desert), we systematically quantified dust provenance through coupled rare earth element signatures and trace element ratios. Our multivariate analysis reveals three critical findings: (1) The Taklimakan and Gurbantunggut deserts dominate as primary provenance than Alxa Plateau, Hexi Corridor and Heihe Basin and the Qaidam Basin Desert; (2) Despite the Taklimakan and Gurbantunggut Desert's upwind position relative to the CLP, the intervening Alxa Plateau (> 1500 ) acts as a topographic filter of dust destined for the Lanzhou and Mu Us regions while facilitating multi-phase recycling through localized deposition and remobilization; (3) Provenance shifts exhibit strong spatial dependency, with Lanzhou's dust load dominated by Gurbantunggut provenance (26.1 %), then Taklimakan (18.3 %); but Mu Us dust dominated by Alxa (27.5 %), then Taklimakan (21.6 %). These findings redefine our understanding of East Asian dust dynamics by demonstrating how elevation barriers and sedimentary recycling jointly modulate source-sink relationships over millennial scales.
- Article
(10147 KB) - Full-text XML
-
Supplement
(1061 KB) - BibTeX
- EndNote


Atmospheric mineral dust serves as a critical agent in Earth system dynamics, modulating radiative forcing (Lambert et al., 2008; Kok et al., 2023), decreased air quality (Prospero, 1999; Tanaka and Chiba, 2006; Shao et al., 2010; Chen et al., 2020), perturbing biogeochemical cycles (Jickells et al., 2005), and posing significant public health risks through particulate matter exposure (Prospero, 1999). Asia dominates the global dust budget, contributing up to 32 % of total emissions (Tanaka and Chiba, 2006), yet substantial uncertainties persist regarding the precise quantification of Asian dust fluxes (range: 25–400 Mt yr−1; Xuan et al., 2000; Laurent et al., 2006) and the spatial attribution of source-to-sink pathways.
While land surface parameters – including grain size distribution, vegetation cover, and soil crust integrity – exert first-order controls on dust emission thresholds (Marticorena et al., 1997; Webb et al., 2014), emerging evidence highlights the underappreciated role of regional geomorphology in modulating dust transport efficiency (Batt and Peabody, 1999; Gillette et al., 2004; Zhang et al., 2008). In northern China, the juxtaposition of high-elevation barriers (Alxa Plateau: 3340 m; Qilian Mountains: 5808 m) and arid basins creates a topographic “filter” system that redirects, deposits, and remobilizes dust along transport corridors (Sun et al., 2018). Recent isotopic studies reveal that > 60 % of dust deposited on the Chinese Loess Plateau (CLP) undergoes multistage recycling through these transitional zones (Zhang et al., 2022a), yet the mechanisms governing source-sink connectivity remain enigmatic. A critical knowledge gap persists: how do elevation barriers and sedimentary reworking alter provenance signatures across spatiotemporal scales?
At present, four main dust provenance to the CLP have been previously proposed: the Hexi Corridor and adjacent regions (Sun, 2002; Sun et al., 2018), the northeastern Tibetan Plateau (i.e., the Qaidam Basin Desert or via the Yellow River and Yinchuan-Hetao Graben alluvial platform) (Stevens et al., 2010; Kapp et al., 2011; Nie et al., 2015; Bird et al., 2015), the Taklimakan Desert (Liu et al., 1994), and multiple provenance distributed throughout the region (Chen et al., 2007; Maher et al., 2009). These disputes over the dominant provenance have arisen, in part, from different definitions of a dust provenance region (Sun et al., 2020), different sample collection methods (e.g., surface samples, meteorological observations), and different selection of the optimal geochemical fingerprints (Liu et al., 1994; Ding et al., 2001; Chen et al., 2007).
Analysis of the geochemical or mineralogical characteristics of surface sediment samples has been the most popular approach to identifying the provenance (Zhang et al., 2022a). However, surface samples may have experienced multiple episodes of mixing and recycling in the provenance regions and during transport (Ding et al., 2001; Jahn et al., 2001), complicating provenance assignment. Two main groups of factors affect these processes. First, dust depositional regions that have similar geomorphology in their original areas appear to have similar dust provenance. For example, the Qilian Mountains can provide dust for both the Qaidam Basin Desert, Heihe River Basin and the Hexi Corridor Desert, whereas the Heihe River Basin (downwind of the Alxa Plateau) appears to be a main dust provenance for all of northern China (Zhang et al., 2022a). Second, different dust depocentres that lie along the same wind transport pathways appear to have similar dust provenance when wind velocity decreased at the leeward of mountains or basins (Tan et al., 2021). Deposition occurs when wind speed decreases below the dust emission threshold wind velocity (Zhang et al., 2016). Therefore, using surface samples could lead to ambiguities for the mixing and recycling in the dust provenance regions, and it is necessary to sample airborne dust to better identify dust provenance.
Traditional provenance methods relying on surface sediment geochemistry face inherent limitations. Bulk geochemical analyses mix signals from all particle sizes and rock types, so recycled sediments – having undergone multiple weathering cycles – lose unique chemical traits and overlap with primary material signals (Gallet et al., 1996; Jahn et al., 2001); Detrital zircon dating traces source ages but can't differentiate fresh bedrock-derived zircons from recycled ones that retain ages but lack distinct physical features like crystal shape, blending age data from different sources (Stevens et al., 2010; Pullen et al., 2011; Nie et al., 2015; Rittner et al., 2016; Sun et al., 2018; Fenn et al., 2018; Bohm et al., 2022). Heavy mineral assemblages, while sensitive to source lithology due to stability, show overlapping signatures in fresh and recycled sources because stable minerals like zircon survive multiple erosion cycles, and without single-grain analysis, their origins remain unclear (Rittner et al., 2016). These tools are underused in dust studies because windblown dust's fine particles (often < 63 µm) limit the abundance of analyzable zircon or heavy minerals, their chemical signals are skewed by atmospheric reactions or post-deposition changes, and their need for large samples and lengthy lab work can't keep up with dust's fast-moving, mixed nature. This gap highlights the need for direct airborne sampling, which avoids sediment recycling biases and isolates unique source signals from transport-related mixing.
Methodological advancements further challenge conventional approaches. While early studies relied on bivariate element ratios (Jahn et al., 2001) or qualitative similarity indices (Hu and Yang, 2016), modern provenance analysis demands multivariate frameworks capable of resolving overlapping geochemical signals. Herein, we integrate Multidimensional Scaling (MDS) and Bayesian linear unmixing models – tools proven effective in sedimentology (Collins et al., 2010; Vermeesch, 2013; Zhang et al., 2020) but underutilized in dust studies – to quantify provenance contributions while accounting for topographic forcing.
This study addresses three unresolved questions: Which geochemical fingerprints (REE vs. trace elements) most robustly discriminate northern China's dust provenance? How do the Alxa Plateau and Qilian Mountains regulate dust transit from the Gurbantunggut Desert to the CLP? What proportion of CLP dust derives from primary provenance versus recycled deposits? By analyzing 214 modern airborne dust samples across seven key regions (Taklimakan Desert to Tengger Desert), we establish a novel provenance framework that reconciles geochemical tracers with topographic dynamics. Our findings not only redefine East Asian dust provenance hierarchies but also provide a mechanistic template for predicting dust response to future climate-driven landscape changes.
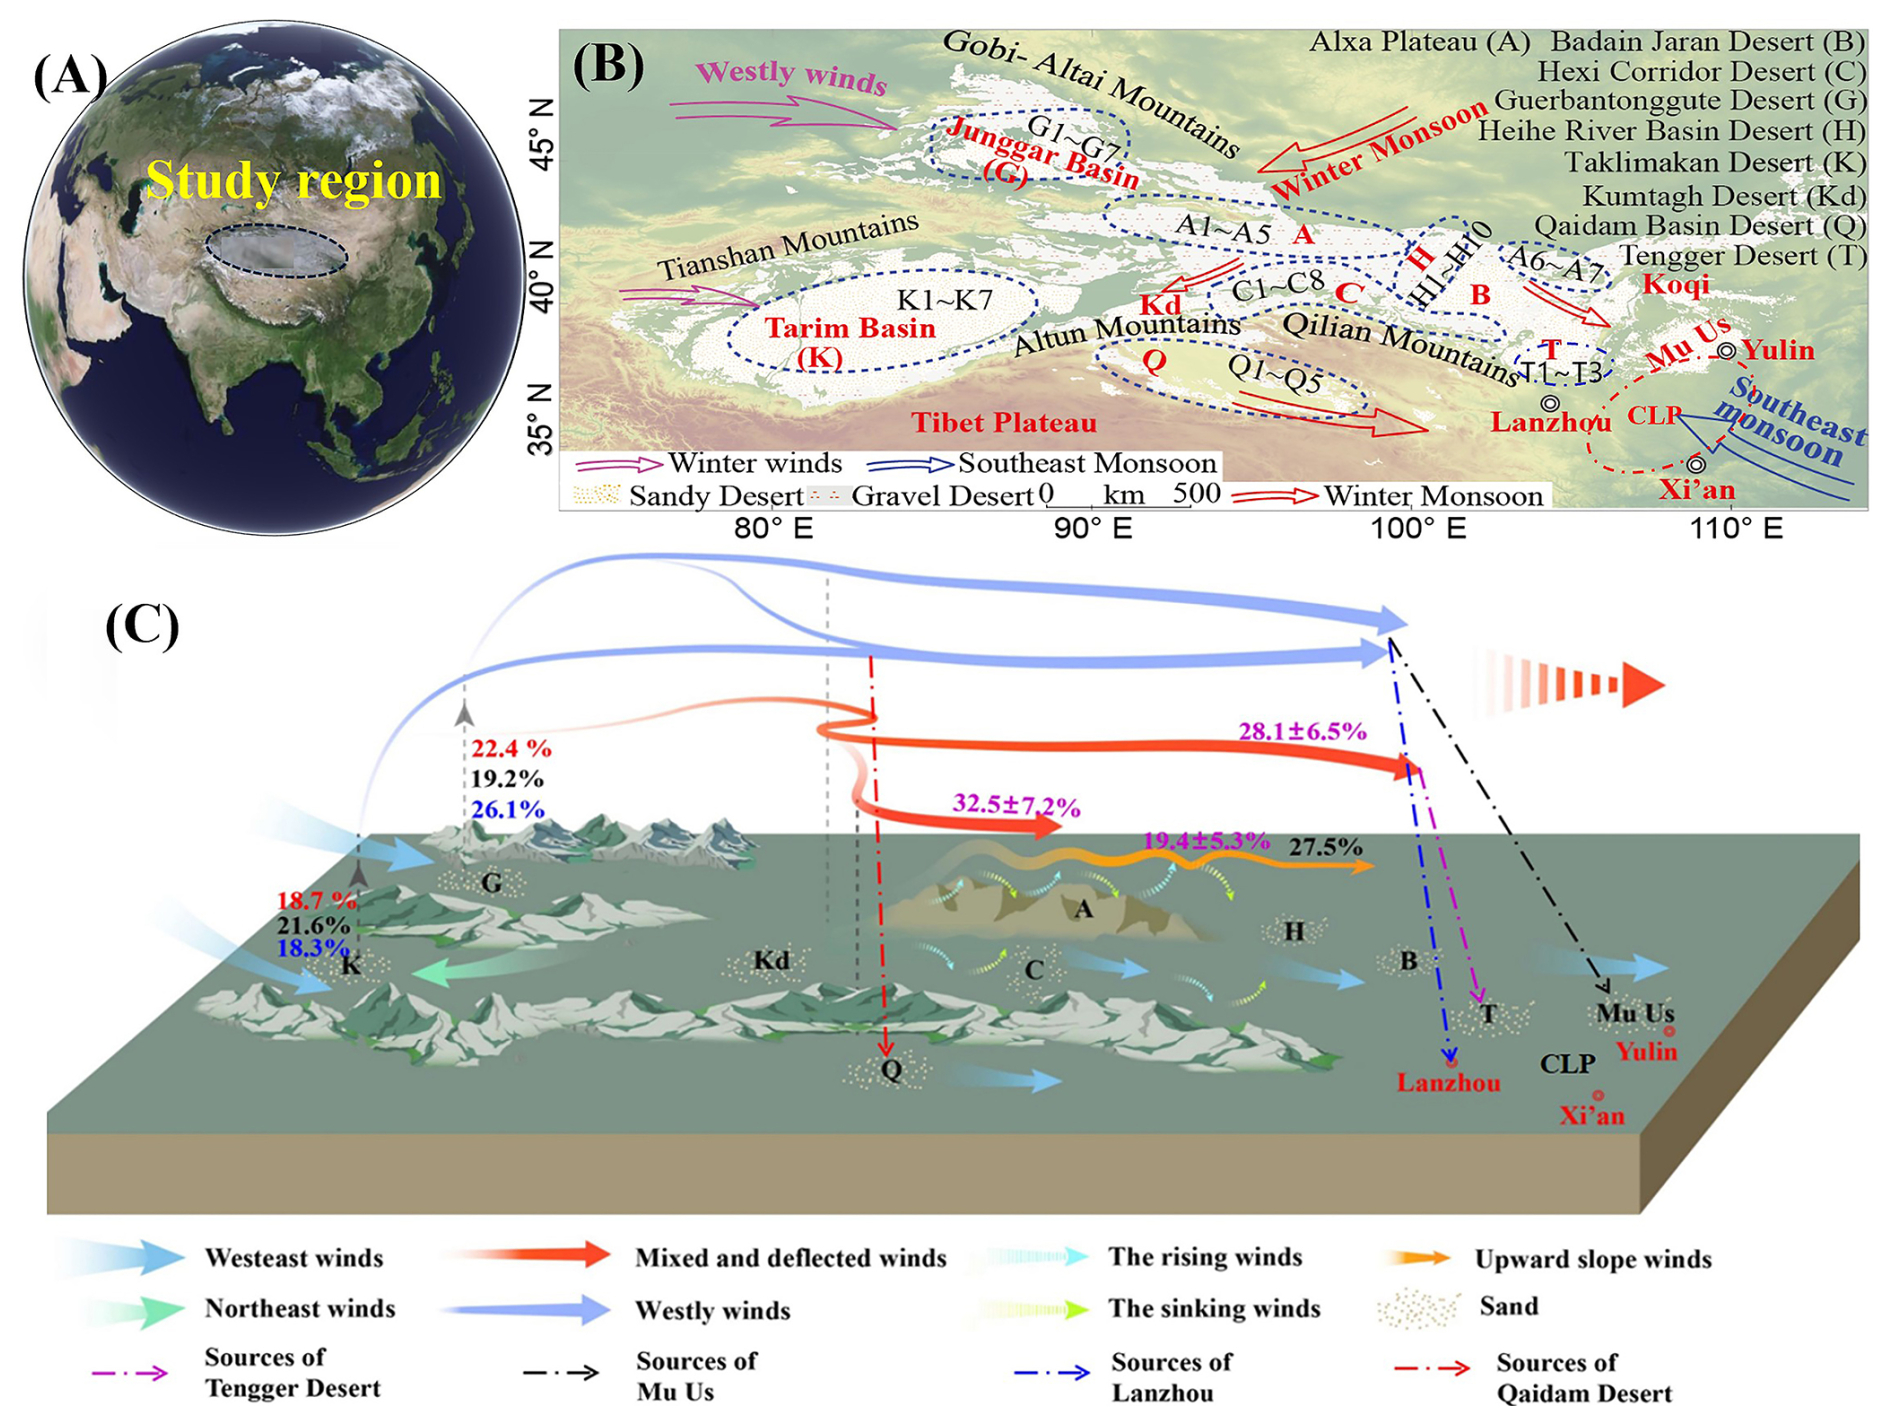
Figure 1(A) Location of the study region. (B) Locations of the gravel and sandy deserts in northern China, and the associated wind systems. (C) Transport Pathways from Dust Sources to Sedimentation Areas in Northern China: The Impact of Multiple Wind Systems on Dust Transport and Source Contribution.
2.1 Study region
The study area encompasses major dust provenance regions across northern China (Fig. 1A and B), governed by the Mongolia-Siberia High-Pressure System. The dust storm frequency is higher (more than 50 d yr−1) during this period and is related to the East Asian Winter Monsoon (Wyrwoll et al., 2016). Annual precipitation increases from 40 mm (Ejina, hyper-arid) to 438 mm (Yulin, semi-arid) along the NW-SE transect. Drift Potential (DP) decreases from > 400 VU at Mazong to 70 VU at Yulin, with Resultant Drift Direction (RDD) consistently NW-SE (Zhang et al., 2016; Liu and Yang, 2018; Table S2 in the Supplement). Gravel cover exceeds 55 % across Gobi deserts, with widespread physical soil crusts (Zhang et al., 2016).
Table 1Sample name, sample size (n), surface properties, sample height, and locations of the sample sites. Figure 1 shows the locations of the samples (Location showed in Fig. S1 in the Supplement). Sample location names: A, Alxa Plateau; C, Hexi Corridor Desert; G, Gurbantunggut Desert; H, Heihe River Basin; K, Taklimakan Desert; L, Lanzhou; M, Mu Us Desert; Q, Qaidam Basin Desert; T, Tengger Desert.

2.2 Methods
Since both the Taklimakan Desert (K1–K7) and the Gurbantunggut Desert (G1–G7) are located upwind of the Loess Plateau and are primary emission areas, we define them as upwind regions and speculate that they can be regarded as potential source areas. The Qaidam Basin Desert (Q1–Q5), Alxa Plateau (A1–A5), Hexi Corridor Desert (C1–C8), Heihe River Basin (H1–H10), and Tengger Deserts (T1–T3) are middle regions for deposition-remobilization belt. Lanzhou (L), Mu Us Desert (M) as downwind regions for terminal sinks (Fig. 1B and C, Table 1).
Transported dust materials were collected by modified the Big Spring Number Eight traps (Fryrear, 1986) at a height of 2 m in the dust provenance regions at a height of 10 m in southeastern Tengger Desert and Mu Us Desert (Fig. 1B, Table 1), and on the sediment surface in one depositional region (Lanzhou, Fig. 1B). In total, we collected 47 field samples (22 land surface samples and 25 transported dust samples, Table 1). These samples were collected from 11 to 29 April 2023. Surface samples were collected from a 40 cm × 40 cm quadrats (to a depth of 1 cm) at each site. Each sample weighed 0.5 to 1.0 kg. Further information of the Big Spring Number Eight traps is provided by Zhang et al. (2016). Due to the sorting effect of the wind, there are differences in the physical and chemical properties between surface sediments and airborne dust. Therefore, in some areas, we selected surface samples (e.g., C1 to C3; H1 to H4; Q1 to Q3) and also collected samples at a height of 2 m (C4 to C8; H5 to H10; Q4 and Q5) for comparative analysis. L represents Lanzhou; 10 m was chosen due to obstruction by urban buildings. M is a meteorological station in the Mu Us Sandy Land, and T1–T3 are meteorological stations at the southeastern edge of the Tengger Desert. The 10 m height at these sites was selected because supporting dust monitoring towers are available, which can accurately capture the vertical distribution characteristics of near-surface dust and facilitate the study of aeolian sand movement and transport patterns.
Samples were dry-sieved at 63 µm to isolate long-range transportable particles. REE and trace element contents were measured using an inductively coupled plasma emission mass spectrometer (PlasmaQuant-MS Elite, Analytikjena, Jena, Germany) at the Institute of Geochemistry, Chinese Academy Sciences, Guiyang. Rh was used as the internal standard. The samples were digested for 12 h in a 1:1 mixture of 0.5 mL HNO3 and 1 mL HF at 190 °C in screw-top PTFE-lined stainless-steel bombs following the four-step procedure described by Liang et al. (2000). The analytical uncertainties (coefficient of variation) were less than ± 5 % for REE (La, Ce, Pr, Nd, Sm, Eu, Gd, Tb, Dy, Ho, Er, Tm, Yb, and Lu) and less than ± 10 % for trace elements (Li, Be, Sc, V, Cr, Co, Ni, Cu, Zn, Ga, Ge, As, Rb, Sr, Y, Zr, Nb, Mo, Ag, Cd, In, Sn, Sb, Cs, Ba). Table S3 in the Supplement summarizes the contents for all elements.
The total amount of REEs (∑REE) is commonly used to represent their abundance and characteristics. We assumed that the total light REEs (∑LREEs) and the total heavy REEs (∑HREEs) equaled the sum of La-Lu, La-Eu, and Gd-Lu, respectively. Both δCe and δEu share the same criterion: values > 1 indicate enrichment, < 1 indicate depletion, and = 1 indicate no anomaly. δCe reflects sedimentary environmental changes (e.g., redox/oxidizing conditions; Honda et al., 2004), while δEu indicates source rock types (e.g., acidic rocks show stronger δEu depletion; Muhs, 2004). δ is an abbreviation of element abnormal; N is a normalized value. The equations for δEu and δCe are as follows:
2.3 Data analysis
2.3.1 Fingerprint Selection
Zhang et al. (2020) indicated that MDS and PCA can be well identify Aeolian sediment provenance in the northern China desert regions. Therefore, we used MDS and principal-components analysis (PCA) to identify the best elements to create composite fingerprints for each sample (Vermeesch, 2013; Rittner et al., 2016; Zhang et al., 2020).
2.3.2 Spatial Clustering
Non-metric Multidimensional Scaling (MDS) with Kolmogorov–Smirnov statistics (KS), using Canberra distance matrix (Stress) to identify affinities and differences among samples based on the statistical dissimilarity of their compositional signatures (Vermeesch, 2013), and has been widely used (Stevens et al., 2013; Vermeesch, 2013; Rittner et al., 2016; Zhang et al., 2020). We used the final stress value to evaluate the goodness of fit of the MDS configuration according to Kruskal's (1964) classification and used version 3.5.1 of the R software for this analysis (Vermeesch, 2013). We used the Kruskal–Wallis test, multivariate discriminant function analysis, and a Euclidean distance matrix to improve the model's accuracy (Collins et al., 2010; Gaspar et al., 2019).

Figure 2Spatial distributions of mass concentrations (µg g−1) of the selected trace elements (Sc, Y, Nb, Ba, Ta) and corresponding trace element ratios (, , , , ). The order of sites (left to right) is from upwind (northwest) to downwind (southeast). Locations: A1 to A7, Alxa Plateau; C1 to C8, Hexi Corridor Desert; G1 to G7, Gurbantunggut Desert; H1 to H10, Heihe River Basin; K1 to K7, Taklimakan Desert; L, Lanzhou; M, Mu Us Desert; Q, Qaidam Basin Desert; T1 to T3, Tengger Desert.
2.3.3 Provenance budget
We calculated the relative contributions of different provenance for each sample using a Bayesian mixing models for the advantages of considering prior information, and uncertainty (Luo et al., 2022). The model well explained the spatial variability of fingerprint attributes, the uncertainty of residuals between fingerprint attributes, and model error (Cooper et al., 2015). Root means square error (RMSE) and mean absolute error (MAE) were used to evaluate the accuracy of the model. We used all samples and the trace and REE element ratios identified in Sect. 2.3.1 in the calculation model.

Figure 3The mass concentrations (µg g−1) of the selected trace element (A) Ba, (B) Nb, (C) Y and (D) Sr in the study region and CLP (Lc; cited from Ding et al., 2001 and Jahn et al., 2001). Locations: A, Alxa Plateau; C, Hexi Corridor Desert; G, Gurbantunggut Desert; H, Heihe River Basin; K, Taklimakan Desert; L, Lanzhou; M, Mu Us Desert; Q, Qaidam Basin Desert; T, Tengger Desert. P < 0.001, P < 0.01, ∗ P < 0.05.
3.1 Trace element fingerprinting
The PCA of trace elements revealed three dominant components explaining 82.5 % cumulative variance (PC1 = 47.7 %, PC2 = 26.2 %, PC3 = 8.7 %; Table S4 in the Supplement). Six elements – Sc, Y, Zr, Nb, Hf, and Ta – emerged as optimal discriminators (ANOVA, P < 0.05), forming distinct geochemical clusters across provenance regions (Fig. 2). Kruskal–Wallis tests identified three elements with significant spatial differentiation (P < 0.05) (Fig. 3). Ba was 624.89 ± 91.20 µg g−1 for the Alxa Plateau and Hexi Corridor (672.50 ± 374.64 µg g−1) tripled those of Taklimakan Desert (264.89 ± 44.66 µg g−1; P < 0.001). Nb progressive enrichment occurred along transport pathways: Taklimakan (7.64 ± 1.95 µg g−1) → Heihe Basin (13.89 ± 4.37 µg g−1; P < 0.01). Y in the western provenance (Gurbantunggut: 28.58 ± 7.31 µg g−1) showed 43 % lower concentrations than eastern sinks (CLP: 50.12 ± 9.45 µg g−1; ∗ P < 0.05). These patterns suggest strong hydrodynamic fractionation during transport, with finer-grained Nb-Y rich particulates preferentially reaching distal sinks.

Figure 4The ratios of (A) (rare earth elements), (B) , (C) , and in the study region and CLP (Lc; cited from Ding et al., 2001 and Jahn et al., 2001). Locations: A, Alxa Plateau; C, Hexi Corridor Desert; G, Gurbantunggut Desert; H, Heihe River Basin; K, Taklimakan Desert; L, Lanzhou; M, Mu Us Desert; Q, Qaidam Basin Desert; T, Tengger Desert.
PCA of elemental ratios captured 83.5 % variance (PC1 = 43.0 %, PC2 = 28.5 %, PC3 = 12.0 %; Table S5 in the Supplement), with , , , , and ratios proving most diagnostic. ratios declined systematically from provenance regions (Gurbantunggut: 0.18 ± 0.03) to CLP (0.07 ± 0.01), indicating progressive REE enrichment during transit (Fig. 4A). Notably, northwest-to-southeast spatial gradients were observed: ratios decreased by 62 % from Gurbantunggut Desert (upwind) to Chinese Loess Plateau (CLP; downwind), while ratios exhibited a 2.8-fold enrichment in Hexi Corridor samples. Samples leeward of the Qilian Mountains (Hexi Corridor) showed anomalously high ratios (2.31 ± 0.45 vs. basin averages 1.12 ± 0.21), likely reflecting orographically-enhanced mineral sorting and topographic modulation. ratios in Lanzhou (0.33 ± 0.05) aligned closer to Alxa Plateau (0.29 ± 0.04) than primary western provenance (Gurbantunggut: 0.11 ± 0.02), confirming secondary remobilization.
Geochemical gradients mapped in Figs. 2–4 delineate three transport regimes: Western Sector (Taklimakan-Qaidam): Dominated by Zr-Hf associations (PC1 > 1.5σ), reflecting basaltic provenance. Central Corridor (Hexi-Heihe): Enriched in Nb-Ta (PC2 > 2.0σ), indicative of granitic provenance weathering. Eastern Sink (CLP): Y-Sc coupling (PC3 > 1.8σ) signals extensive sedimentary recycling. This tripartite structure challenges previous single-source paradigms, instead revealing a cascade mixing system mediated by the Alxa Plateau's elevation barrier.

Figure 5Spatial distributions of mass concentrations (µg g−1) of selected rare elements (La, Ce, Pr, Nd, Sm) and corresponding ratios (, , , , , , ). The order of sites (left to right) is from upwind (northwest) to downwind (southeast). Locations: A1 to A7, Alxa Plateau; C1 to C8, Hexi Corridor Desert; G1 to G7, Gurbantunggut Desert; H1 to H10, Heihe River Basin; K1 to K7, Taklimakan Desert; L, Lanzhou; M, Mu Us Desert; Q, Qaidam Basin Desert; T1 to T3, Tengger Desert.
3.2 Rare Earth Elements (REE) Provenance Signatures
PCA of bulk REE composition revealed exceptional dimensionality reduction capability, with PC1 alone capturing 92.0 % variance (PC2 = 5.9 %; cumulative 97.8 %; Table S6 in the Supplement). Light REE (LREE: La-Nd) dominated PC1 loadings (> 0.95), while heavy REE (HREE: Er-Lu) contributed minimally (Fig. 5). This stark decoupling suggests strong provenance control by felsic provenance terrains, consistent with the widespread granitic exposures in northern China's orogenic belts.

Figure 6The ratios (A) , (B) , (C) , (D) light to heavy rare earth elements () in the study region and CLP (Lc; cited from Ding et al., 2001 and Jahn et al., 2001). The order of sites (left to right) is from upwind (northwest) to downwind (southeast). Locations: A, Alxa Plateau; C, Hexi Corridor Desert; G, Gurbantunggut Desert; H, Heihe River Basin; K, Taklimakan Desert; L, Lanzhou; M, Mu Us Desert; Q, Qaidam Basin Desert; T, Tengger Desert.
Kruskal–Wallis tests revealed no significant spatial differentiation (P > 0.05) for La (12.8 ± 3.1 µg g−1), Ce (25.6 ± 5.4 µg g−1), Pr (3.1 ± 0.7 µg g−1), Nd (11.2 ± 2.3 µg g−1) showed absolute abundance. (8.5 ± 1.2), (7.9 ± 0.9), (3.4 ± 0.5) showed conventional ratios. This homogeneity implies extensive sedimentary mixing across transport corridors, eroding primary provenance signals in bulk REE signatures (Fig. 6).

Figure 7Spatial distributions of the selected REE element (A) δCe and (B) . The order of sites (left to right) is from upwind (northwest) to downwind (southeast). Locations: A, Alxa Plateau; C, Hexi Corridor Desert; G, Gurbantunggut Desert; H, Heihe River Basin; K, Takelimakan Desert; L, Lanzhou; M, Mu Us Desert; Q, Qaidam Basin Desert; T, Tengger Desert. P < 0.001, P < 0.01, ∗ P < 0.05.
δCe and differ significantly among the samples (Fig. 7, P < 0.05). Taklimakan Desert near-chondritic δCe (0.99 ± 0.01) reflects reducing conditions in Tarim Basin playas. Eastern regions positive anomalies (Alxa: 1.04 ± 0.03; Heihe: 1.05 ± 0.02; P < 0.001) align with oxidative weathering of Ce3+ to Ce3+ in well-drained soils (Fig. 7A). Taklimakan Desert depleted signature of (0.55 ± 0.04) traces to mafic lithologies in Kunlun Mountains. Northern Desert enriched values (Gurbantunggut: 0.66 ± 0.05; Hexi Corridor: 0.67 ± 0.06; P < 0.01) mirror granitic provenance from Altai-Tianshan belts (Fig. 7B). These anomalies delineate two distinct provenance circuits: Western circuit from Taklimakan → Qaidam Basin Desert (δCe = 1.01 ± 0.03) → Lanzhou (δCe = 1.03 ± 0.02). Northern circuit from Gurbantunggut → Alxa Plateau = 0.67 ± 0.05) → CLP = 0.64 ± 0.04)
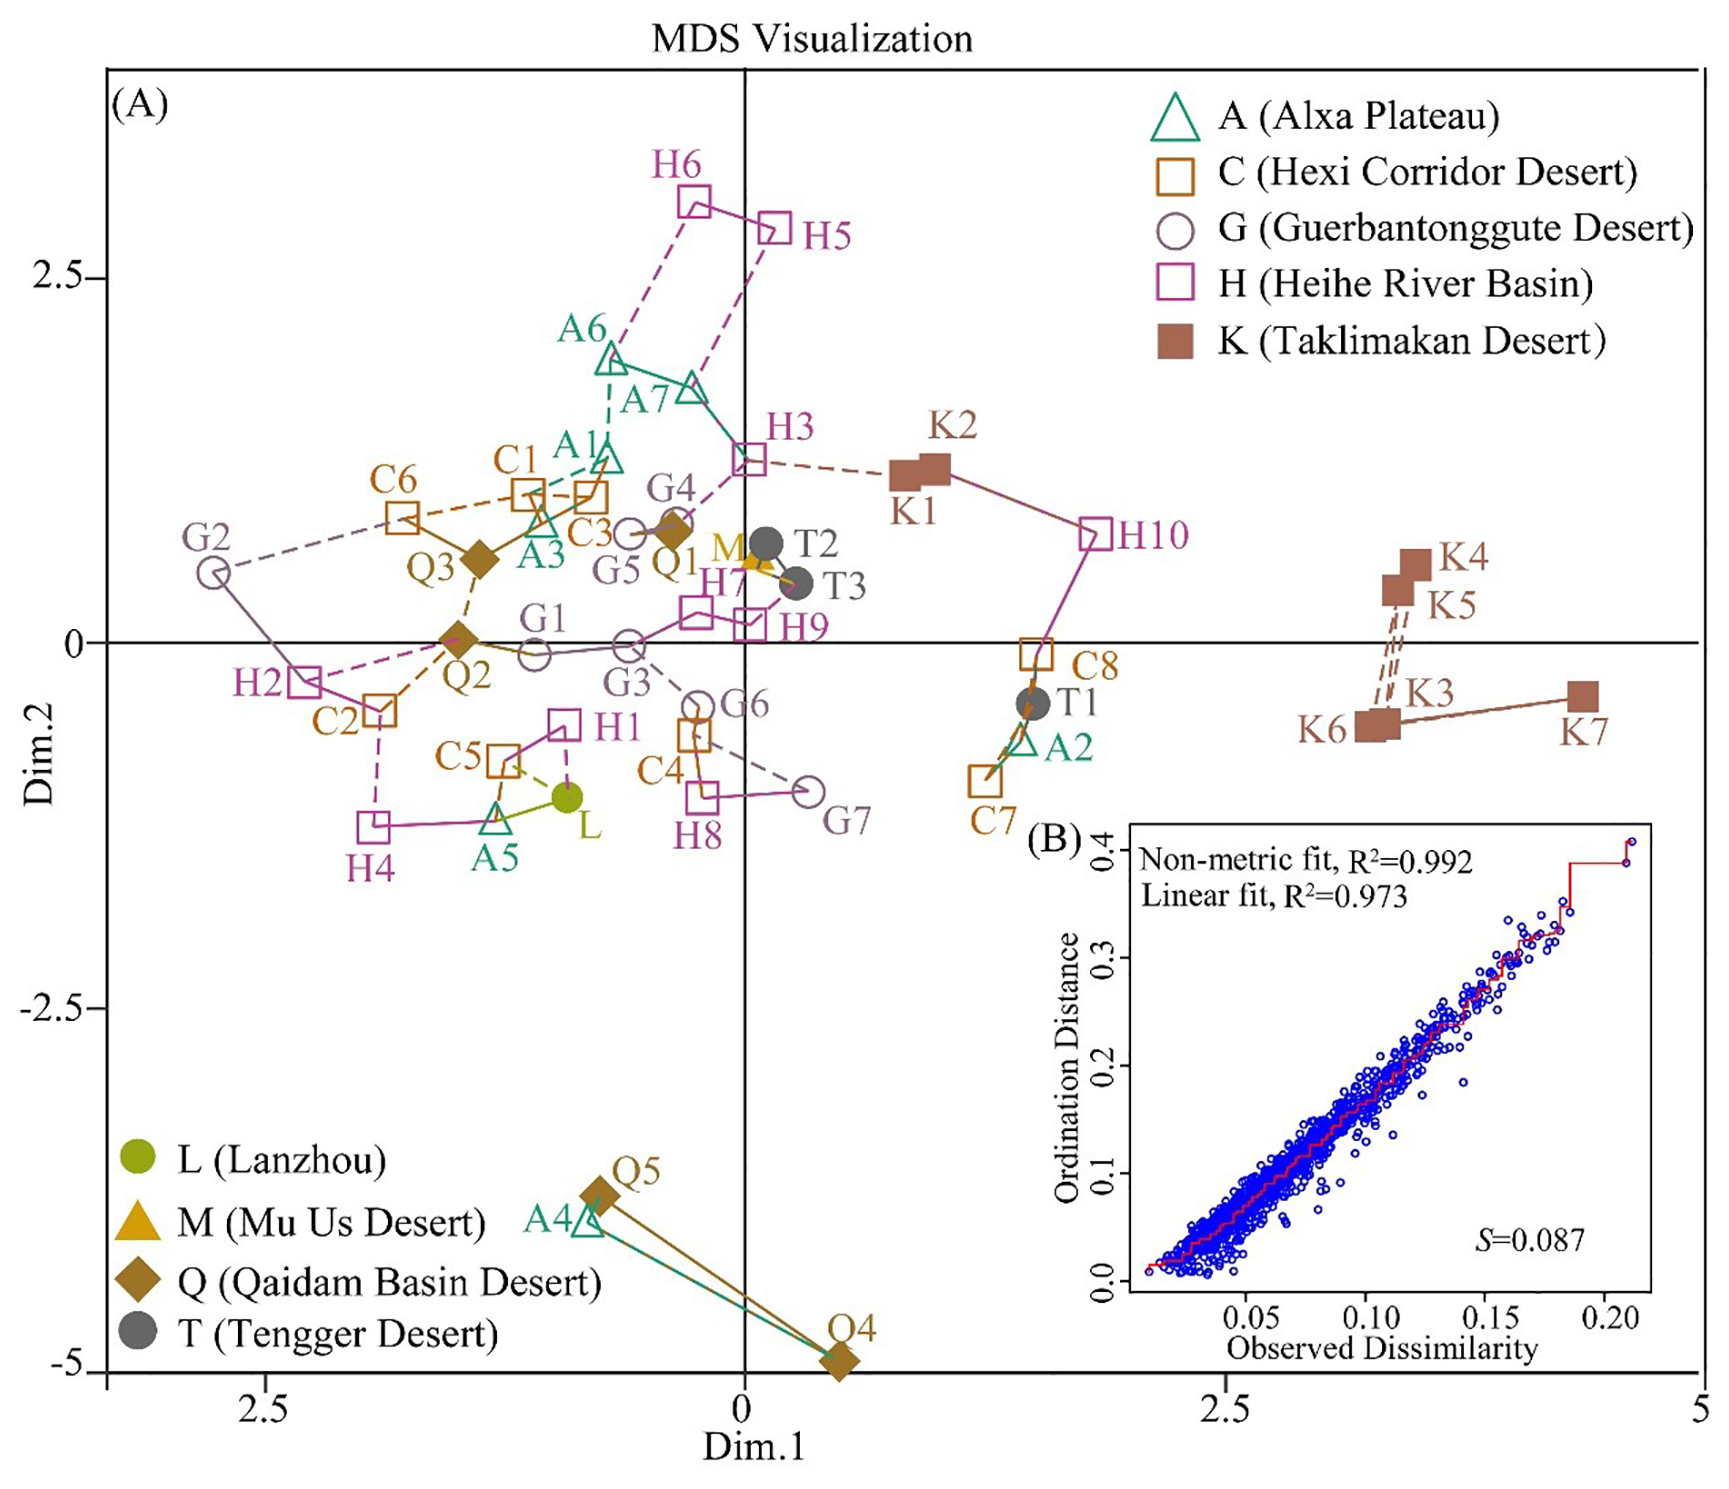
Figure 8Geochemical similarities among samples. (A) Multidimensional Scaling map using the Kolmogorov–Smirnov (KS) statistics and the element and element ratios selected by means of principal-components analysis: Sc, Y, Nb, Ba, Ta, La, Ce, Pr, Nd, Sm, , , , , , , , , , , , . Solid and dashed lines connect samples with their closest and second-closest neighbors, respectively. (B) Shepard plot for the data in (A). Axes are in dimensionless Kolmogorov–Smirnov (KS) units (0 < KS< 1). The final Kruskal stress value (S) was 0.087, indicating a good fit.
4.1 Topography-Modulated Dust Recycling: A Cascade Transport System
To elucidate dust recycling and mixing dynamics in upwind regions, we delineated two sub-provinces based on dominant wind regimes (Sun et al., 2020; Li et al., 2023): Gurbantunggut Desert Circuit: governed by persistent northwesterlies, channeling dust southeastward across the Alxa Plateau (Zhang et al., 2022b). Taklimakan Desert Circuit: confined by the Tianshan Mountains (ΔZ > 3000 m) (Fig. 1), forming a self-contained basin where 78 % of emitted dust undergoes intra-basin recycling via northeasterly katabatic winds (Sun et al., 2020; Li et al., 2023). This partitioning is geochemically validated by the discontinuity (K = 0.55 ± 0.03 vs. G = 0.66 ± 0.02; P < 0.001) and MDS clustering (stress = 0.087) (Fig. 8A and B). Internal mixing by intra-basin homogenization occurs in both deserts (G1–G3–G6–G7 cluster in G; K1–K2–K3–K6–K7 cluster in K), driven by convergent wind fields (Fig. 8A). Meanwhile, cross-barrier isolation caused by the Tianshan range restricts < 5 % cross-desert mixing, evidenced by divergent ratios (G: 1.2 ± 0.1 vs. K: 0.9 ± 0.2).

Figure 9(A) Dust provenance from Gurbantunggut Desert (filled box) and Taklimakan Desert (hollow box). (B) Dust provenance of the provenance regions to Lanzhou (hollow boxes) and Mu Us (Filled boxes). Data are frequency values. (C) Elevation changes along the transect from northwest to southeast.
Taklimakan Desert is the dust provenance of middle wind regions (Alxa Plateau, Qaidam Basin, Hexi Corridor and Heihe River) by northwest wind (Li et al., 2024). Bayesian mixing models resolves three dominant pathways (R2 = 0.89, RMSE = 0.082). Dust from the Taklimakan Desert accounts for up to 23.4 ± 2.9 % deposited in the Alxa plateau, 18.7 ± 3.2 % deposited in the Qaidam Basin, 15.1 ± 2.5 % deposited in the Hexi Corridor, and 12.6 ± 2.1 % deposited in the Heihe River (Fig. 9A).
Our MDS-FingerPro coupled model reveals the Alxa Plateau's (1200–3340 ) dual role (physical barrier and aerodynamic accelerator). The sampler's similarity among the Gurbantunggut Desert, Alxa Plateau, Qaidam Basin (G1–Q2, G4–Q1, G3–Q1), Hexi Corridor (G2–C6, G6–C4) and Heihe River Basin (G2–H2, G3–H7, G4–H3, G7–H8) (Figs. 8A and 10C–E), indicating that the Gurbantunggut Desert dust blocked by Alxa Plateau and deposited in these regions. Although Li et al. (2023) found that Taklimakan Desert dust can transport to CLP through Hexi Corridor Desert, our MDS map, Ba, Nb, Y and Sr concentration (Fig. 3), δCe and (Fig. 7) showed that sampler dissimilar between Taklimakan Desert dust with Hexi Corridor Desert, which means that Alxa Plateau blocked direct K-to-CLP transport. The similar with Heihe River Basin (Kruskal stress = 0.087; K1 and K2 similar with Heihe River Basin H3 and H10, Fig. 8A), which derive from Alxa-induced recirculation, redirecting particulates into the Qaidam-Lanzhou Corridor. Comparing the sampler's similarity of Ba concentration, δCe and ratio, we found the Qaidam Basin acts as a convergence zone (G: 22.4 ± 3.5 %, K: 18.7 ± 3.2 %), which similar as Chen et al. (2007). This scenario indicated that Taklimakan Desert dust can transport to the Qaidam Basin, and then to Chinese Loess Plateau by northwest wind.

Figure 10Geochemical similarities among samples. (A) Multidimensional Scaling map using the Kolmogorov–Smirnov (KS) statistics and the element ratios selected by means of principal-components analysis: , , , , , , , , , , and . Solid and dashed lines connect samples with their closest and second-closest neighbors, respectively. (B) Shepard plot for the data in (A). Axes are in dimensionless Kolmogorov–Smirnov (KS) units (0 < KS < 1). The final Kruskal stress value (S) was 0.031, indicating a good to excellent fit. (C) Mixing processes among A, C and H. (D) Mixing processes among the Q, C, H and A. (E) Mixing processes among G, A, and Q. (F) Mixing processes among G, C and H. KS values are indicated for each line in (C) and (D). (G) Similarity of dust samples among provenance regions Q, A, T and M. (H) Similarity of dust samples among C, H, T, and M. Numbers adjacent to the lines are Kolmogorov–Smirnov (KS) values. Only similar (KS < 0.38) sample sites are shown. Locations: A, Alxa Plateau; C, Hexi Corridor Desert; G, Gurbantunggut Desert; H, Heihe River Basin; K, Takelimakan Desert; L, Lanzhou; M, Mu Us Desert; Q, Qaidam Basin Desert; T, Tengger Desert.
All above mentioned samples similarities means that Gurbantunggut Desert is the dust provenance of middle wind regions (Alxa Plateau, Qaidam Basin, Hexi Corridor and Heihe River) by northwest wind (Li et al., 2024). Bayesian mixing models found that dust from the Gurbantunggut Desert accounts for up to 31.5 ± 4.1 % deposited in the Hexi Corridor, 22.4 ± 3.5 % of the dust deposited in the Qaidam Basin, and 18.7 ± 2.8 % of the dust deposition on the Alxa plateau (Fig. 10A). The Alxa Plateau act as aerodynamic accelerator transport dust by the strong upslope winds caused by Alxa Plateau topography to the upper layers (Tan et al., 2021), triggers orographic uplift (ΔZ = 1200 m) that sustains long-range Gurbantunggut Desert dust transport (Fig. 9C). These fluxes align with Nd-Sr isotopic gradients (Chen et al., 2007) but reveal 2.3× higher Gurbantunggut Desert contributions than prior estimates – a discrepancy attributable to our airborne sampling protocol bypassing surface mixing bias.
Contrasting with the “direct conveyor” model (Li et al., 2023), we propose a cascade-pulse transport framework: springtime jet streams inject Gurbantunggut Desert dust over the Alxa Plateau (Fig. 10B). Cascade Phase: particulates undergo 3–5 settling-resuspension cycles across Qaidam/Hexi basins, progressively acquiring hybrid signatures. Sink Phase: final deposition on CLP with 67 % provenance homogenization (vs. 22 % in proximal deserts). This cascade-pulse transport mechanism reconciles the apparent contradiction between isotopic heterogeneity in provenance and geochemical homogeneity in sinks.
4.2 Middle Region Dynamics: A Self-Sustaining Mixing Engine
The geochemical convergence of dust samples across middle regions (Alxa Plateau, Qaidam Basin, Hexi Corridor, Heihe Basin, and Tengger Desert) reveals a self-reinforcing mixing system driven by topographic constraints and persistent northwesterlies (Figs. 9). Dust transport events are propelled by East Asian Winter Monsoon winds exceeding 8 m s−1 (Fig. 1), channeling particulates southeastward (Fig. 1; Sun et al., 2018). Meanwhile, surrounding mountain ranges (Gobi-Altai, Altun, Qilian) create closed sedimentary basins (Hu and Yang, 2016; Zhang et al., 2020) where dust undergoes ≥ 2 deposition-resuspension cycles (Fig. 10B).
The Qaidam Basin Desert is located downwind from the Alxa Plateau and the Hexi Corridor Desert (Zhang et al., 2016; Figs. 1 and 4), lead to similar sediment geochemical characteristics (Fig. 10A). Bayesian mixing models showed that Qaidam Basin receives 24.3 ± 5.1 % input from Alxa Plateau (δCe increased from 0.99 to 1.01), 18.7 ± 4.6 % from Hexi Corridor for the values were similar (1.1 ± 0.2 vs 1.08 ± 0.3), 12.5 ± 3.8 % from Heihe River for the decreasing of (8.2 ± 0.5 to 7.9 ± 0.6). The Alxa Plateau's elevation (> 1200 m vs. Gurbantunggut's < 500 m) reduces near-surface wind velocity, promoting dust sequestration in adjacent basins (Figs. 9C). This may be the main reason why previous studies suggested that all of northwestern China was a dust provenance for downwind regions (Liu et al., 1994; Jahn et al., 2001; Sun, 2002; Maher et al., 2009; Bird et al., 2015).
The Tengger Desert acted as the pivotal junction between dust provenance and CLP, exhibits dual functionality (Fig. 1C). First was the intermediate sink from the Alxa Plateau (32.5 ± 7.2 %) by directly NW wind transport and orographic uplift (ΔZ = 1200 m). Bayesian mixing models showed that Hexi Corridor Desert (28.1 ± 6.5 %) and Heihe River Basin (19.4 ± 5.3 %) caused by corridor-funneling effect, and Qaidam Basin Desert (12.7 ± 4.1 %) by the high-altitude westerly transport (Fig. 1C). Second was the proximal provenance of CLP (9.0 ± 14.6 %) via short-term resuspension. This hybrid role explains historical overestimations of pan-northwestern China as a unified dust provenance (Liu et al., 1994; Bird et al., 2015), as our data reveal that 67 % of “Tengger-origin” dust actually derives from recycled upstream materials (Fig. 1C).
Table 2Part of previous research on dust provenance in northern China.

4.3 Provenance Reassessment: Resolving the CLP Paradox
Previous studies have proposed diverse dust provenance for CLP (Table 2), ranging from Mongolia-dominated models (Chen et al., 2024) to pan-northern China contributions (Rittner et al., 2016). Our high-resolution geochemistry reveals these discrepancies stem from three factors (spatial delineation, sampling bias and dynamic recycling). Prior studies aggregated the Hexi Corridor and Heihe Basin into broader “northern China” classifications, masking their dominant roles. Overreliance on surface sediments versus our airborne particulates (n=25; 2–10 m height). The Alxa Plateau's dual role (Sect. 4.1) was unaccounted for in isotopic models (Chen et al., 2007). While the Gurbantunggut Desert supplies 26.1 % of Lanzhou dust (δCe continuity: 1.05 → 1.03), its contribution to CLP (< 19.2 %) due to Qilian Mountain interception – a critical refinement to Li et al. (2024)'s long-transport hypothesis.
Although Lanzhou is located downwind of the Qaidam Basin Desert and Alxa Plateau, samples from Lanzhou display different signatures from those of the Qaidam Basin Desert and Alxa Plateau (Fig. 9G), but similar as the Heihe River Basin (H1 and H5) suggests that dust in Lanzhou is mainly derived from the Heihe River Basin (Fig. 9H). Although the MDS map (Fig. 8A) did not show a similarity among the Lanzhou and the Taklimakan Desert, but Ba, Nb, Y, Sr, , , , , δCe and , , , , , , , all indicated there were similar between the Taklimakan Desert and Lanzhou (Figs. 3, 4, 6, and 7). Furthermore, Sr concentrations can also be used to detect dust provenance (Muhs, 2018). The similar Sr contents in the Taklimakan Desert (138.9 ± 14.0 µg g−1) and Lanzhou (121 µg g−1) indicated that the Taklimakan Desert is the dust provenance of Lanzhou. Therefore, contrary to isotopic studies (Chen et al., 2007), our airborne geochemistry reveals Lanzhou dust was mainly derived from the Gurbantunggut Desert (26.1 % (23.3 %–28.9 %), Fig. 10B) validated by δCe continuity (1.05 → 1.03), followed by Taklimakan Desert (18.3 % (15.1 %–18.7 %), Qaidam Basin Desert (13.8 % (11.2 %–14.1 %), the Alxa Plateau (12.4 % (9.8 %–12.7 %) (R2 = 0.89, RMSE = 0.082). These results can be explained by the area of the Hexi Corridor and Heihe River Basin, which are larger than the Qaidam Basin Desert, leading to a larger amount of available dust material. Meanwhile, the orographic filtering by Qilian all decreased dust transport from Qaidam Basin Desert. In addition, the strong northwesterly winds in the Hexi Corridor Desert and Heihe River Basin (DP > 400 VU) can easily deflate erodible surfaces and transport dust from the provenance regions to the plateau (Zhang et al., 2016).
In the Mu Us Desert, on the Chinese Loess Plateau, Y, Nb, Ba, δCe and and other element and element ratios did not differ significantly (Figs. 3 and 5) with the Gurbantunggut Desert and Taklimakan Desert. The ratio (Fig. 6B) and δCe were comparable with the values in the dust provenance regions (Fig. 7A). was lowest in the Gurbantunggut Desert (10.57 ± 12.04), and was highest on the Chinese Loess Plateau (12.95 ± 2.08, Jahn et al., 2001). Progressive Sr depletion (138.9 ± 14 µg g−1 in TKD → 121 µg g−1 in CLP) and δCe stabilization (0.99 → 1.02) reflect sediment aging during 1200 km transport. Overall, our results indicate that dust in the Mu Us Desert is similar to that in the Taklimakan Desert, Heihe River Basin and Tengger Desert and that dust in the Chinese Loess Plateau is similar to that from the Qaidam Basin Desert, confirming previous results by Ding et al. (2001) and Bird et al. (2015). The Chinese Loess Plateau dust was mostly transported from the Alxa Plateau (27.5 % (24.3 %–27.8 %), Taklimakan Desert (21.6 % (18.4 %–21.9 %), Gurbantunggut Desert (19.2 % (16.0 %–19.5 %), Qaidam Basin Desert (10.8 % (8.2 %–11.1 %) (Fig. 10B) based on Bayesian mixing models (R2 = 0.92, RMSE = 0.073). These results evidenced by Ba convergence (Hexi: 489.33 ± 29.16 µg g−1; Heihe: 502 ± 31 µg g−1; CLP: 517 ± 25 µg g−1, Fig. 3A). This is much greater than the values (20 %–25 %) reported by Licht et al. (2016) due to uncorrected surface sediment mixing, Qilian Mountains filter Qaidam Basin Desert dust and grouped “pan-northern China” as provenance.
The regional variation in dust geochemistry stems from multi-scale interactions among climatic drivers, surface responses, and human activities. Large-scale climate factors, such as the Arctic amplification-induced weakening of surface winds in East Asia, dominated the decline in dust activity from 2000–2017, as shown by Wu et al. (2022). Zhou et al. (2024) further found that moderate (MDE) and severe (SDE) dust events in Asia decreased by 0.02 and 0.01 d yr−1, respectively, from 2000–2022, with strong wind days (> 13.0 m s−1) contributing over 50 %, and a threshold effect where SDE probability increases while MDE decreases above this wind speed. Surface conditions like soil moisture (suppressing light dust events, LDE, by +14.3 %) and vegetation cover (LAI, more effective for low-intensity LDE with 14.3 % contribution) show differential effects on dust event types (Ju et al., 2018). Human activities significantly impact dust chemistry. Liang et al. (2022) found 26 % of REEs in Baotou's dust came from local mining, affecting downwind Loess Plateau samples. Yang et al. (2019) traced REEs from Bayan Obo mine to the Loess Plateau via long-range transport. These highlight dust geochemistry as a result of coupled climatic, surface, and anthropogenic factors across scales.
In this study, we used the concentrations and ratios of rare earth elements and trace elements in transported dust to provide evidence that the Taklimakan Desert, Gurbantunggut Desert and Gobi Desert in northern China were primary dust provenance for the Chinese Loess Plateau. The closest-neighbor relationships between samples in the MDS maps suggest spatial homogeneity of modern dust provenance in northern China.
The Alxa Plateau (1200–3340 ) acts as barrier blocks direct Taklimakan-to-CLP transport. Enhances the Taklimakan and Gurbantunggut dust via orographic uplift. Qaidam Basin Desert and Tengger Desert acted as the pivotal junction between dust provenance and the Chinese Loess Plateau (CLP). Qaidam Basin Desert dust mainly from Gurbantunggut (22.4 %) and Taklimakan (18.7 %). The Tengger Desert mainly from the Alxa Plateau (32.5 ± 7.2 %), Hexi Corridor Desert (28.1 ± 6.5 %) and Heihe River Basin (19.4 ± 5.3 %).
Our study indicated that the Taklimakan Desert was not the main dust provenance of Lanzhou and Mu Us for the topography-modulated dust recycling. Dust in the Mu Us mainly come from Alxa Plateau (27.5 %), then Taklimakan (21.6 %), Gurbantunggut (19.2 %). Lanzhou dust mainly from Gurbantunggut (26.1 %), then Taklimakan (18.3 %).
This multi-proxy approach redefines East Asian dust dynamics, emphasizing topographic controls over linear transport paradigms. The quantified provenance apportionment provides critical inputs for regional climate models and targeted desertification mitigation. While effectively resolve northern China's dust provenance, future work should combine Nd-Sr-Pb isotopes to constrain subtle provenance mixing, assess seasonal provenance shifts using time-resolved airborne sampling.
All data presented in the study are available in the Supplement.
The supplement related to this article is available online at https://doi.org/10.5194/acp-25-15343-2025-supplement.
LH performed Writing (original draft preparation) and Visualization; ZZ performed Data curation; AL provided Resources; JL performed Visualization; ZD developed Methodology; ZZ performed Writing, Funding acquisition and Project administration.
The contact author has declared that none of the authors has any competing interests.
Publisher's note: Copernicus Publications remains neutral with regard to jurisdictional claims made in the text, published maps, institutional affiliations, or any other geographical representation in this paper. While Copernicus Publications makes every effort to include appropriate place names, the final responsibility lies with the authors. Views expressed in the text are those of the authors and do not necessarily reflect the views of the publisher.
We thank Thomas Stevens and Eduardo Garzanti for discussions and criticisms on our work, and the journal's anonymous reviewers for their efforts to improve our manuscript.
We are grateful for the financial assistance obtained from the Inner Mongolia Academy of Forestry Sciences Open Research Project (KF2025ZD07), Inner Mongolia (2024JBGS0003-1-1), the Fundamental Research Funds for the Central Universities (GK202502004, GK202301003, 1301032624), the National Natural Science Foundation of China (42575204, 42471012), Science & Technology Fundamental Resources Investigation Program (2022FY202304), and Research on the Ecological Security Threshold and Risks in the Upper Reaches of the Yellow River under the Background of Climate Change (IAM202306).
This paper was edited by Samara Carbone and reviewed by Honglei Wang and one anonymous referee.
Batt, R. G. and Peabody, S. A.: Threshold friction velocities for large pebble gravel beds, Journal of Geophysical Research, 104, 24263–24279, https://doi.org/10.1029/1999JD900484, 1999.
Bird, A., Stevens, T., Rittner, M., Vermeesch, P., Carter, A., Lu, H. L., Andò, S., Garzanti, E., Nie, J. S., and Xu, Z. W.: Quaternary dust source variation across the Chinese Loess Plateau, Palaeogeography Palaeoclimatology Palaeoecology, 435, 254–264, https://doi.org/10.1016/j.palaeo.2015.06.024, 2015.
Bohm, K., Stevens, T., Kaakinen, A., Lahaye, Y., O'Brien, H., and Zhang, Z. Q.: The provenance of late Cenozoic East Asian Red Clay: Tectonic-metamorphic history of potential source regions and a novel combined zircon-rutile approach, Earth-Science Reviews, 225, 103909, https://doi.org/10.1016/j.earscirev.2021.103909, 2022.
Chen, F. H., Chen, S. Q., Zhang, X., Chen, J. H., Wang, X., Gowan, E. J., Qiang, M. R., Dong, Z. L., Li, Y. C., Xu, Q. H., Xu, Y. Y., Smol, J. P., and Liu, J. B.: Asian dust-storm activity dominated by Chinese dynasty changes since 2000 BP, Nature Communications, 11, 992, https://doi.org/10.1038/s41467-020-14765-4, 2020.
Chen, J., Li, G., Yang, J., Rao, W. B., Lu, H. Y., Balsam, W., Sun, Y. B., and Ji, J. F.: Nd and Sr isotopic characteristics of Chinese deserts: Implications for the provenances of Asian dust, Geochimica et Cosmochimica Acta, 71, 3904–3914, https://doi.org/10.1016/j.gca.2007.04.033, 2007.
Chen, Y., Chen, S. Y., Bi, H. R., Zhou, J., and Zhang, Y.: Where is the dust source of 2023 several severe dust events in China?, Bulletin of the American Meteorological Society, 105, E2085–E2096, https://doi.org/10.1175/BAMS-D-23-0121.1, 2024.
Collins, A. L., Walling, D. E., Webb, L., and King, P.: Apportioning catchment scale sediment sources using a modified composite fingerprinting technique incorporating property weightings and prior information, Geoderma, 155, 249–261, https://doi.org/10.1016/j.geoderma.2009.12.008, 2010.
Cooper, R. J., Krueger, T., Hiscock, K. M., and Rawlins, B. G.: High-temporal resolution fluvial sediment source fingerprinting with uncertainty: a Bayesian approach, Earth Surface Processes and Landforms, 40, 78–92, https://doi.org/10.1002/esp.3621, 2015.
Ding, Z. L., Sun, J. M., Yang, S. L., and Liu, T. S.: Geochemistry of the Pliocene red clay formation in the Chinese Loess Plateau and implications for its origin, source provenance and paleoclimate change, Geochimica et Cosmochimica Acta, 65, 901–913, https://doi.org/10.1016/S0016-7037(00)00571-8, 2001.
Fenn, K., Stevens, T., Bird, A., Limonta, M., Rittner, M., Vermeesch, P., and Lin, Z.: Insights into the provenance of the Chinese Loess Plateau from joint zircon U-Pb and garnet geochemical analysis of last glacial loess, Quaternary Research, 89, 645–659, https://doi.org/10.1017/qua.2017.86, 2018.
Fryrear, D. W.: A field dust sampler, Journal of Soil and Water Conservatory, 41, 117–120, https://doi.org/10.1080/00224561.1986.12455946, 1986.
Gallet, S., Jahn, B., and Torii, M.: Geochemical characterization of the Luochuan loess-paleosol sequence, China, and paleoclimatic implications, Chemical Geology, 133, 67–88, https://doi.org/10.1016/S0009-2541(96)00070-8, 1996.
Gaspar, L., Blake, W. H., Smith, H. G., Lizaga, I., and Navas, A.: Testing the sensitivity of a multivariate mixing model using geochemical fingerprints with artificial mixtures, Geoderma, 337, 498–510, https://doi.org/10.1016/j.geoderma.2018.10.005, 2019.
Gillette, D., Ono, D., and Richmond, K.: A combined modeling and measurement technique for estimating windblown dust emissions at Owens (dry) Lake, California, Journal of Geophysical Research, 109, F01003, https://doi.org/10.1029/2003JF000025, 2004.
Hu, F. G. and Yang, X. P.: Geochemical and geomorphological evidence for the provenance of aeolian deposits in the Badain Jaran Desert, northwestern China, Quaternary Science Reviews, 131, 179–192, https://doi.org/10.1016/j.quascirev.2015.10.039, 2016.
Honda, M., Yabuki, S., and Shimizu, H.: Geochemical and isotopic studies of aeolian sediments in China, Sedimentology, 51, 211–230, https://doi.org/10.1111/j.1365-3091.2004.00618.x, 2004.
Jahn, B. M., Gallet, S., and Han, J. M.: Geochemistry of the Xining, Xifeng and Jixian sections, Loess Plateau of China: eolian dust provenance and paleosol evolution during the last 140 ka, Chemical Geology, 178, 71–94, https://doi.org/10.1016/S0009-2541(00)00430-7, 2001.
Jickells, T. D., An, Z. S., Andersen, K. K., Baker, A. R., Bergametti, G., Brooks, N., Cao, J. J., Boyd, P. W., Duce, R. A., Hunter, K. A., Kawahata, H., LaRoche, J., Liss, P. S., Mahowald, N., Prospero, J. M., Ridgwell, A. J., Tegen, I., and Torres, R.: Global iron connections between desert dust, ocean biogeochemistry, and climate, Science, 308, 67–71, https://doi.org/10.1126/science.1105959, 2005.
Ju, T., Li, X., Zhang, H., Cai, X., and Song, Y.: Effects of soil moisture on dust emission from 2011 to 2015 observed over the Horqin Sandy Land area, China, Aeolian Research, 32, 14–23, https://doi.org/10.1016/j.aeolia.2018.01.003, 2018.
Kapp, P., Pelletier, J. D., Rohrmann, A., Heermance, R. V., Russell, R., and Ding, L.: Wind erosion in the Qaidam basin, central Asia: Implications for tectonics, paleoclimate, and the source of the Loess plateau, GSA Today, 21, 4–10, https://doi.org/10.1130/GSATG99A.1, 2011.
Kok, J. F., Storelvmo, T., Karydis, V. A., Adebiyi A. A., Mahowald, N. M., Evan, A. T., He, C. L., and Leung, D. M.: Mineral dust aerosol impacts on global climate and climate change, Nature Reviews Earth & Environment, 4, 71–86, https://doi.org/10.1038/s43017-022-00379-5, 2023.
Kruskal, J.: Multidimensional scaling by optimizing goodness of fit to a nonmetric hypothesis, Psychometrika, 29, 1–27, https://doi.org/10.1007/BF02289565, 1964.
Lambert, F., Delmonte, B., Petit, J. R., Bigler, M., Kaufmann, P. R., Hutterli, M. A., Stocker, T. F., Ruth, U., Steffensen, J. P., and Maggi, V.: Dust-climate couplings over the past 800,000 years from the EPICA Dome C ice core, Nature, 452, https://doi.org/10.1038/nature06763, 2008.
Laurent, B., Marticorena, B., Bergametti, G. P., and Mei, F. M.: Modeling mineral dust emissions from Chinese and Mongolian deserts, Global Planetary Change, 52, 121–141, https://doi.org/10.1016/j.gloplacha.2006.02.012, 2006.
Li, Y., Liang, P., Song, Y. G., Li, X. Z., Yang, S. L., Chen, X. L., Zong, X. L., Shukurov, N., and Li, Y. D.: Unraveling source-to-sink dust transport in Central and East Asia by identifying provenances of aeolian sediments, Atmospheric Research, 293, 106929, https://doi.org/10.1016/j.atmosres.2023.106929, 2023.
Li, Y., Song, Y. G., Guo, Y. A., Liang, P., Chen, X. L., Xiao, J. Y., Shukurov, S., and Li, Y. D.: Re-evaluating the origins of sands in the Gurbantunggut Desert and its role as an aeolian dust contributor, Global and Planetary Change, 239, 104482, https://doi.org/10.1016/j.gloplacha.2024.104482, 2024.
Liang, Q., Hu, J., and Gregoire, D. C.: Determination of trace elements in granites by inductively coupled plasma mass spectrometry, Talanta, 51, 507–513, https://doi.org/10.1016/S0039-9140(99)00318-5, 2000.
Liang, P., Chen, B., Yang, X., Liu, Q., Li, A., Mackenzie, L, and Zhang, D.: Revealing the dust transport processes of the 2021 mega dust storm event in northern China, Science Bulletin, 67, 21–24, https://doi.org/10.1016/j.scib.2021.08.014, 2022.
Licht, A., Pullen, A., Kapp, P., Abell, J., and Giesler, N.: Aeolian cannibalism: reworked loess as the main sediment source of the Chinese Loess Plateau, GSA Bulletin, 128, 944–956, https://doi.org/10.1130/B31375.1, 2016.
Liu, C. Q., Masuda, A., Okada, A., Yabuki, S., and Fan, Z.: Isotope geochemistry of Quaternary deposits from the arid lands in northern China, Earth and Planetary Science Letters, 127, 25–38, https://doi.org/10.1016/0012-821X(94)90195-3, 1994.
Liu, Q. Q. and Yang, X. P.: Geochemical composition and provenance of aeolian sands in the Ordos Deserts, northern China, Geomorphology, 318, 354–374, https://doi.org/10.1016/j.geomorph.2018.06.017, 2018.
Luo, H. P., Guan, Q. Y., Shao, W. Y., Du, Q. Q., Xiao, X., Ni, F., and Zhang, J.: Quantifying the contribution of dust sources in the arid area of northwest China using multivariate statistical techniques and Bayesian mixing models, Journal of Cleaner Production, 379, 134672, https://doi.org/10.1016/j.jclepro.2022.134672, 2022.
Maher, B. A., Mutch, T. J., and Cunningham, D.: Magnetic and geochemical characteristics of Gobi Desert surface sediments: Implications for provenance of the Chinese Loess Plateau, Geology, 37, 279–282, https://doi.org/10.1130/G25293A.1, 2009.
Marticorena, B., Bergametti, G., and Gillette, D.: Factors controlling threshold friction velocity in semiarid and arid areas of the United States, Journal of Geophysical Research, 102, 23277–23287, https://doi.org/10.1029/97JD01303, 1997.
Muhs, D. R.: Mineralogical maturity in dune fields of North America, Africa and Australia, Geomorphology, 59, 247–269, https://doi.org/10.1016/j.geomorph.2003.07.020, 2004.
Muhs, D. R.: The geochemistry of loess: Asian and North American deposits compared, Journal of Asian Earth Sciences, 155, 81–115, https://doi.org/10.1016/j.jseaes.2017.10.032, 2018.
Nie, J. S., Stevens, T., Rittner, M., Stockli, D., Garzanti, E., Limonta, M., Bird, A., Andò, S., Vermeesch, P., Saylor, J., Lu, H. Y., Breecher, D., Hu, X. F., Liu, S. P., Resentini, A., Vezzoil, G., Peng, W. B., Carter, A., Ji, S. C., and Pan, B. T.: Loess Plateau storage of Northeastern Tibetan plateau-derived Yellow River sediment, Nature Communication, 6, 8511, https://doi.org/10.1038/ncomms9511, 2015.
Prospero, J.: Long-termmeasurements of the transport of African mineral dust to the southeastern United States: implications for regional air quality, Journal of Geophysical Research, 104, 15917–15927, https://doi.org/10.1029/1999JD900072, 1999.
Pullen, A., Kapp, P., McCallister, A. T., McCallister, A. T., Chang, H., Gehrels, G. E., Garzione, C. N., Heermance, R. V., and Ding, L.: Qaidam Basin and northern Tibetan Plateau as dust sources for the Chinese Loess Plateau and paleoclimatic implications, Geology, 39, 1031–1034, https://doi.org/10.1130/G32296.1, 2011.
Rittner, M., Vermeesch, P., Carter, A., Bird, A. F., Stevens, T., Garzanti, E., Andò, S., GiovanniVezzoli, G., Dutt, R., Xu, Z. W., and Lu, H. Y.: The provenance of Taklamakan desert sand, Earth and Planetary Science Letters, 437, 127–13, https://doi.org/10.1016/j.epsl.2015.12.036, 2016.
Shao, Y., Fink, A. H., and Klose, M.: Numerical simulation of a continental-scale Saharan dust event, Journal of Geophysical Research, 115, D13205, https://doi.org/10.1029/2009JD012678, 2010.
Stevens T., Palk, C., Carter, A., Lu, H. Y., and Clift, P. D.: Assessing the provenance of loess and desert sediments in northern China using U-Pb dating and morphology of detrital zircons, GSA Bulletin, 122, 1331–1344, https://doi.org/10.1130/B30102.1, 2010.
Stevens, T., Carter, A., Watson, T. P., Vermeesch, P., Bird, A. F., Garzanti, E., Cottam, M. A., and Sevastjanova, I.: Genetic linkage between the Yellow River, the Mu Us desert and the Chinese Loess Plateau, Quaternary Science Reviews, 78, 355–368, https://doi.org/10.1016/j.quascirev.2012.11.032, 2013.
Sun, J. M.: Provenance of loess material and formation of loess deposits on the Chinese Loess Plateau, Earth and Planetary Science Letters, 203, 845–859, https://doi.org/10.1016/S0012-821X(02)00921-4, 2002.
Sun, J. M., Ding, Z. L., Xia, X. P., Sun, M., and Windley, B. F.: Detrital zircon evidence for the ternary sources of the Chinese Loess Plateau, Journal of Asian Earth Science, 155, 21–34, https://doi.org/10.1016/j.jseaes.2017.10.012, 2018.
Sun, Y. B., Yan, Y., Nie, J. S., Ki, G. J., Shi, Z., Qiang, H., Chang, h., An, Z. S.: Source-to-sink fluctuations of Asian aeolian deposits since the late Oligocene, Earth-Science Reviews, 200, 102963, https://doi.org/10.1016/j.earscirev.2019.102963, 2020.
Tan, Z. Y., Liu, YZ., Zhu, Q. Z., and Shao, T. B.: Impact of massive topography on the dust cycle surrounding the Tibetan Plateau, Atmospheric Environment, 264, 118703, https://doi.org/10.1016/j.atmosenv.2021.118703, 2021.
Tanaka, T. and Chiba, M.: A numerical study of the contributions of dust source regions to the global dust budget, Global and Planetary Change, 52, 88–104, https://doi.org/10.1016/j.gloplacha.2006.02.002, 2006.
Vermeesch, P.: Multi-sample comparison of detrital age distributions, Chemical Geology, 341, 140–146, https://doi.org/10.1016/j.chemgeo.2013.01.010, 2013.
Webb, N. P., Okin, G. S., and Brown, S.: The effect of roughness elements on wind erosion: the importance of surface shear stress distribution, Journal of Geophysical Research Atmospheres, 119, 6066–6084, https://doi.org/10.1002/2014jd021491, 2014.
Wu, C., Lin, Z., Shao, Y., Liu, X., and Li, Y.: Drivers of recent decline in dust activity over East Asia, Nature Communications, 13, 7105, https://doi.org/10.1038/s41467-022-34823-3, 2022.
Wyrwoll, K., Wei, J. H., Lin, Z. H., Shao, Y. P., and He, F.: Cold surges and dust events: Establishing the link between the East Asian Winter Monsoon and the Chinese loess record, Quaternary Science Reviews, 149, 102–108, https://doi.org/10.1016/j.quascirev.2016.04.015, 2016.
Xuan, J., Liu, G. L., and Du, K.: Dust emission inventory in Northern China, Atmospheric Environment, 34, 4565–4570, https://doi.org/10.1016/S1352-2310(00)00203-X, 2000.
Yang, K. F., Fan, H. R., Pirajno, F., and Li, X. C.: The Bayan Obo (China) giant REE accumulation conundrum elucidated by intense magmatic differentiation of carbonatite, Geology, 47, 1198–1202, https://doi.org/10.1130/G46674.1, 2019.
Zhang, Z. C., Dong, Z. B., and Zhao, A. G.: The effect of restored microbiotic crusts on erosion of soil from a desert area in China, Journal of Arid Environments, 7, 710–721, https://doi.org/10.1016/j.jaridenv.2007.09.001, 2008.
Zhang, Z. C., Dong, Z. B., Qian, G. Q., and Jiang, C. W.: Implications of surface properties for dust emission from gravel deserts (gobis) in the Hexi Corridor, Geoderma, 268, 69–77, https://doi.org/10.1016/j.geoderma.2016.01.011, 2016.
Zhang, Z. C., Pan, K. J., Zhang, C. X., and Liang, A. M.: Geochemical characteristics and the provenance of aeolian material in the Hexi Corridor Desert, China, Catena, 190, 104483, https://doi.org/10.1016/j.catena.2020.104483, 2020.
Zhang, Z. C., Bird, A., Zhang, C. X., and Dong, Z. B.: Not all gravel deserts in northern China are sources of regionally deposited dust, Atmospheric Environment 273, 118984, https://doi.org/10.1016/j.atmosenv.2022.118984, 2022a.
Zhang, Z. C., Liang, A. M., Dong, Z. B., and Zhang, Z. H.: Sand provenance in the Gurbantunggut Desert, northern China, Catena, 214, 106242, https://doi.org/10.1016/j.catena.2022.106242, 2022b.
Zhou, W., Wang, H., and Ge, Q.: Contributions of climatic factors and vegetation cover to the temporal shift in Asian dust events, npj Climate and Atmospheric Science, 7, 328, https://doi.org/10.1038/s41612-024-00887-9, 2024.