the Creative Commons Attribution 4.0 License.
the Creative Commons Attribution 4.0 License.
 | 05 Nov 2025
Atmospheric dust and air quality over large-cities and megacities of the world
Kyriakoula Papachristopoulou
Thanasis Georgiou
Sofia Eirini Chatoutsidou
Mihalis Lazaridis
Antonis Gkikas
Ilias Fountoulakis
Ioanna Tsikoudi
Manolis P. Petrakis
Vassilis Amiridis
According to the United Nations (UN) more than 55 % of the global population resided in urban areas in 2018, a number projected to increase to an estimated 60 % of the world's population by 2030. As urbanization accelerates, degradation of air quality becomes an increasing environmental pressure to human welfare and health. To date, epidemiological studies reveal a strong connection between airborne dust and adverse health effects. This study investigates the fine-mode and coarse-mode dust particulate matter levels within the planetary boundary layer (PBL) over major cities and megacities of the world (population > 5 million), leveraging on the European Space Agency (ESA) – “LIdar climatology of Vertical Aerosol Structure” (LIVAS) multiyear satellite-based dust climate data record. Results show that current dust levels exceed World Health Organization (WHO) annual-mean air quality guidelines (AQGs) for PM2.5 and PM10 in 49.4 % and 87.7 % of the cities considered, respectively, exposing ∼ 700 million people to hazardous dust concentrations. Moreover, according to the outcomes of the study, this number is expected to increase to ∼ 850 million individuals (∼ 22 % increase) by 2030s, though due to the general declining dust tendencies the health hazard is projected to be diminished in severity. Particularly affected are cities in the regions of Middle East, Indian subcontinent, East Asia, North Africa, and the Sahel. Epidemiological models are employed to estimate associated health risks. The study provides an informative mitigation and adaptation tool to support observational-based policymaking, air quality management, and public health planning to protect human health in the context of accelerating urbanization.
Please read the corrigendum first before continuing.
-
Notice on corrigendum
The requested paper has a corresponding corrigendum published. Please read the corrigendum first before downloading the article.
-
Article
(29603 KB)
-
The requested paper has a corresponding corrigendum published. Please read the corrigendum first before downloading the article.
- Article
(29603 KB) - Full-text XML
- Corrigendum
- BibTeX
- EndNote


According to the United Nations (UN) Population Division of the Department of Economic and Social Affairs (UN, 2018a, 2019) more than 55 % of the global population resided in urban areas in 2018. Driven by various factors, including urbanization, migration, and higher birth rates than death rates (Lerch, 2017) urban areas are projected to house an estimated 60 % of the world's population by 2030 and more than two-thirds (∼ 68 %) of the global population by mid-century. As urbanization accelerates and population density rises, degradation of air quality becomes an increasingly pressing issue. Accounting for this environmental pressure, the World Health Organization (WHO) has highlighted the severe impact of poor air quality on public health, particularly in urban areas (Shairsingh et al., 2023). According to the WHO poor air quality is the second highest risk factor for noncommunicable diseases, with an estimated seven million premature deaths globally every year due to exposure to both indoor and outdoor air pollution (https://www.who.int/news-room/fact-sheets/detail/ambient-(outdoor)-air-quality-and-health; last access: 13 April 2025).
Among the aerosol species resulting in degradation of air quality are mineral dust particles, especially over densely populated and heavily industrialized areas (Papachristopoulou et al., 2022; Proestakis et al., 2024). Atmospheric dust is the dominant component of atmospheric aerosol over large areas of the Earth (Gliß et al., 2021; Kok et al., 2017, 2021, 2023). Transported over thousands of kilometres (e.g. Prospero, 1999a, 1999b; Dey et al., 2004; Schepanski et al., 2009; Kanitz et al., 2014; Weinzierl et al., 2016; Marinou et al., 2017; Proestakis et al., 2018, 2024; Ramaswamy et al., 2017; Adebiyi and Kok, 2020; Aslanoğlu et al., 2022; Drakaki et al., 2022; Gkikas et al., 2022), dust interacts with radiation, clouds, and precipitation (Twomey, 1977; Albrecht, 1989; Hatch et al., 2008; Rosenfeld et al., 2008; DeMott et al., 2009), affecting weather, climate, aviation safety, and solar energy production (Kosmopoulos et al., 2018; Papagiannopoulos et al., 2020; Fountoulakis et al., 2021; Masoom et al., 2021; Nickovic et al., 2021; Ryder et al., 2024). Ultimately, upon deposition (Gao et al., 2003; Hand et al., 2004; Prospero et al., 2010; Mahowald et al., 2011; van der Does et al., 2018, 2021; Proestakis et al., 2025) dust particles enrich with nutrients marine and terrestrial ecosystems (Okin et al., 2004; Jickells et al., 2005; Li et al., 2018).
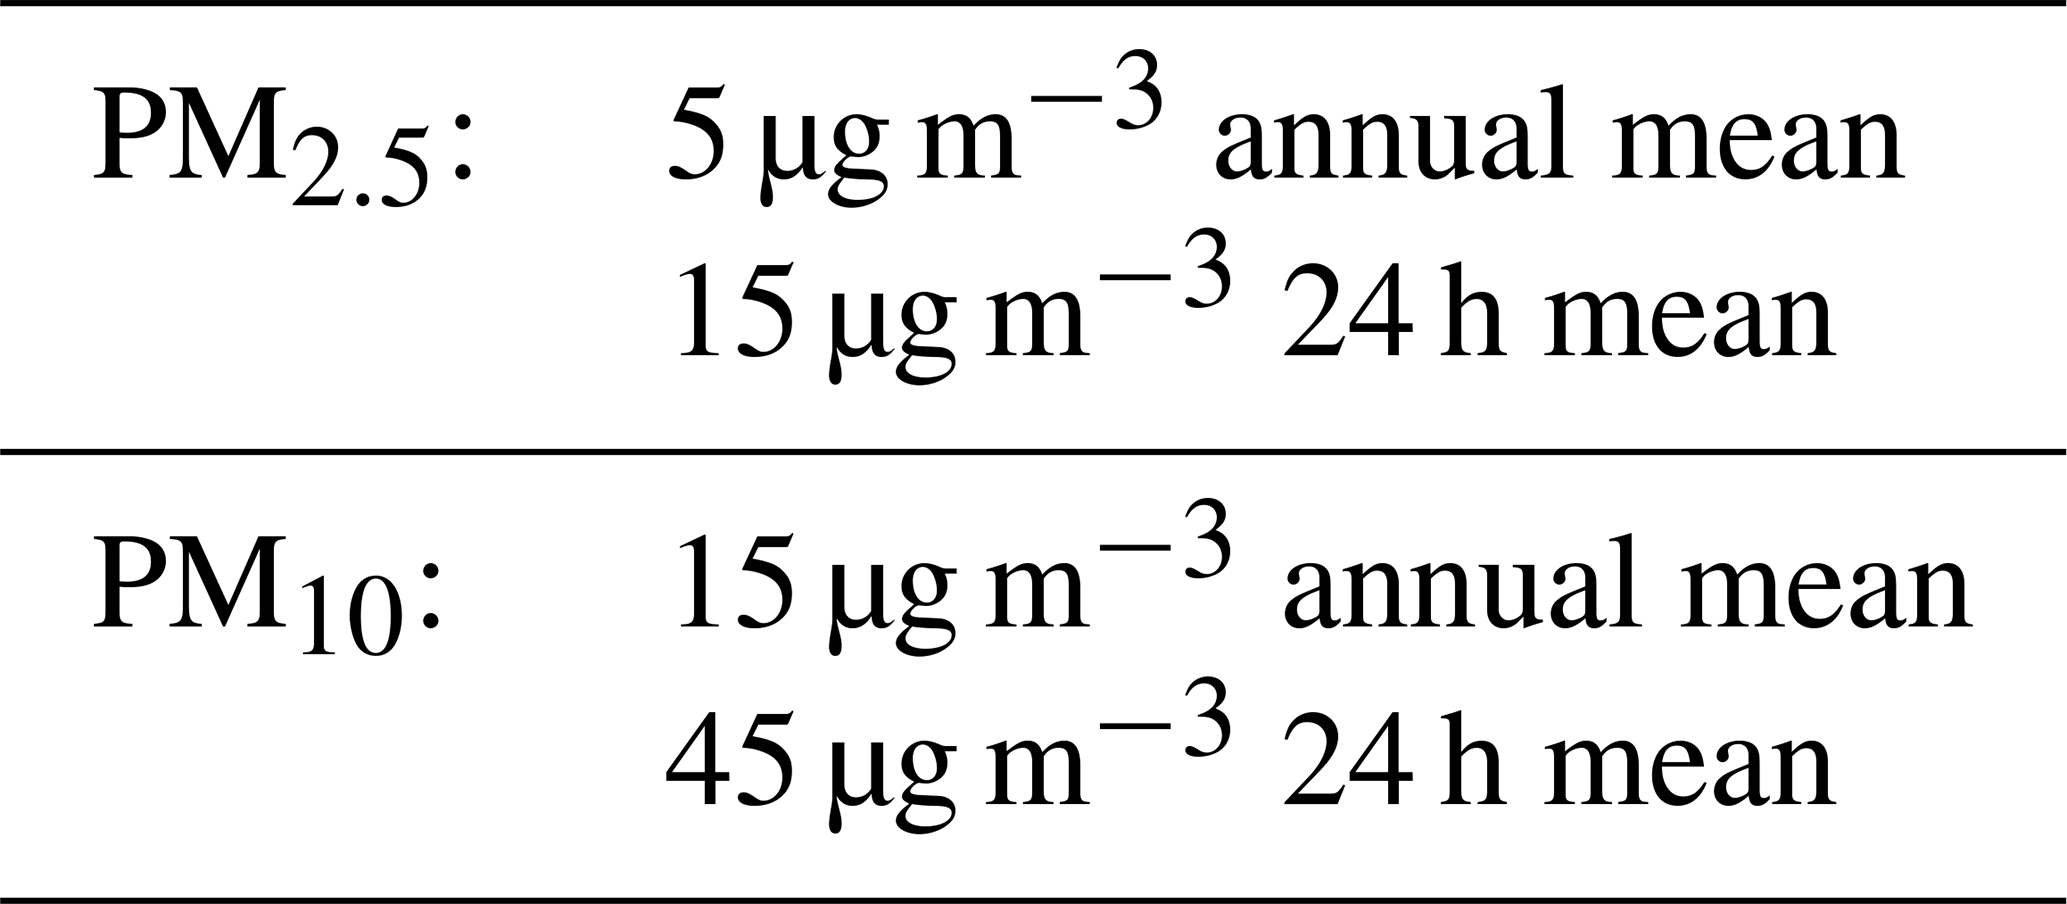
However, the multifaceted role of dust extends beyond its effects on biogeochemistry, the radiation budget, weather, and climate; it also poses a major threat to human health. To date, a key aspect governing the association between aerosols, air quality (AQ), and negative effects induced on human health is considered the amount of the airborne particulate matter (PM). More specifically, according to the WHO air quality guidelines (WHO, 2021), PM is generally divided into PM10 (coarse), PM2.5 (fine) and UFP (ultra-fine) classes, referring to categories of airborne particles with aerodynamic diameter ≤ 10, ≤ 2.5, and ≤ 0.1 µm, respectively (Table 1).
Table 1World Health Organization Air Quality Guidelines for PM2.5 and PM10.
Several epidemiological studies have revealed a strong connection between high concentrations of airborne dust and adverse health effects. In general, the health risk attributed to coarse-size mineral particles of the order of ∼ 10 µm or larger is considered low, referring mainly to mild skin irritation and/or allergic responses, even under conditions of high dust concentrations and long-term exposure (Sandstrom and Forsberg, 2008; Pérez García-Pando et al., 2014). However, dust PM2.5 particles, due to their small size, can penetrate deeper into the lungs and alveoli (Martinelli et al., 2013; Lazaridis, 2023), leading among others to allergic responses (Bousquet et al., 2003; Kellogg et al., 2004; Chang et al., 2006; Smith et al., 2012; Watanabe et al., 2011), cardiovascular diseases (Kwon et al., 2002; Meng and Lu, 2007; Middleton et al., 2008; Prospero et al., 2008; Sandstrom and Forsberg; 2008; Pérez et al., 2012; De Longueville et al., 2010; Martinelli et al., 2013; Goudie, 2014; Zhang et al., 2016b; Achakulwisut et al., 2018; Querol et al., 2019), respiratory diseases (Kwon et al., 2002; Wiggs et al., 2003; Chen et al., 2004; Veranth et al., 2004; Park et al., 2005; Derbyshire, 2007; Meng and Lu, 2007; Cheng et al., 2008; Yoo et al., 2008; De Longueville et al., 2010, 2013; Leski et al., 2011; Goudie, 2014; Katra et al., 2014; Mueller et al., 2017; Middleton, 2020), related due to silica with lung cancer (Giannadaki et al., 2014; Steenland and Ward, 2014), even to Valley Fever and Meningitis epidemic outbreaks in the Sahel during the Harmattan seasons (Tobías et al., 2011; Agier et al., 2013; Deroubaix et al., 2013; Pérez García-Pando et al., 2014; Martiny and Chiapello, 2013; Ceccato et al., 2014; Goudie, 2014; Jusot et al., 2017; Mueller et al., 2017; Nakazawa and Matsueda, 2017; Mazamay et al., 2020; Middleton., 2020; Woringer et al., 2022).
To date, in-situ measurements of particulate matter represent the most direct and reliable source of information on ambient air quality (including of the dust aerosol component), allowing for high temporal resolution measurement, low detection thresholds, and the capacity to distinguish between PM10, PM2.5 and even finer size fractions with high precision. Established under networks, such as OpenAQ (https://openaq.org/, last access: 16 September 2025), IQAir (https://www.iqair.com/air-quality-map, last access: 16 September 2025), and SPARTAN (https://www.spartan-network.org/, last access: 16 September 2025), in situ PM measurements are widely used for regulatory purposes, and are considered indispensable, among others, for health impact assessments, epidemiological studies, local air quality management and empowering evidence-based decision-making. More specifically, ground-based in situ monitoring stations provide unparalleled air quality measurements, enabling researchers, policymakers, and the public to track the aerosol load over time, to identify pollution hotspots, evaluate the effectiveness of environmental regulations, and allowing public health studies and air quality forecasting. In the case of the dust aerosol component in situ measurement have significantly contributed through shedding light on dust outbreaks over specific regions in terms of concentrations, phenomenology, and trends, and on dust relation with synoptic and mesoscale meteorology (Querol et al., 2009; Pey et al., 2013), the contribution to daily PM10 concentrations (Stafoggia et al., 2016), and the broader impact on air quality (Querol et al., 2019).
Nevertheless, despite these significant advantages numerous challenges inherent to the complex nature of in situ measurements of ambient air quality hamper the feasibility of establishing and providing long-term and continuous measurements of high spatial and temporal coverage. More specifically, surface monitoring stations and networks of monitoring stations are not uniformly operational and available across the globe. Even in the case of large cities and megacities, particularly in the case of cities of Africa, parts of Asia, Middle East, and South America, monitoring stations are sparse or even completely absent, while even where networks exist, the provided aerosol load measurements are frequently characterized by non-continuity in terms of temporal coverage due to instrument operation, maintenance, malefactions, or resource limitations. Moreover, different types of instruments and measurement protocols introduce inconsistencies across regions, while spatial representativeness remains limited, as most stations are confined to specific urban environments and may not adequately capture variability within a metropolitan or larger city area.
Towards addressing these formidable challenges air quality monitoring frequently relies on satellite-based earth observations of the aerosol load, offering unique advantages in terms of spatial consistency, global coverage, and the ability to provide long-term, homogeneous datasets across large regions where monitoring networks are incomplete or even completely absent, though with lower accuracy than the accuracy offered by in-situ measurements. However, and despite the increasing number of scientific studies indicating that airborne mineral dust constitutes a significant environmental hazard and risk factor for human health, current knowledge on the dust health impacts, when it comes to incorporating EOs is still characterized by large uncertainties, primarily attributed to three key challenges. The first challenge arises from the frequent reliance of many studies on Earth Observation (EO) using passive remote sensing (RS) techniques aiming to investigate the dust load at regional and global scales and to establish associations with dust-induced disorders on human health (i.e., De Longueville et al., 2010; Deroubaix et al., 2013; Katra et al., 2014; Prospero et al., 2014; Querol et al., 2019). However, passive RS techniques mainly retrieve and provide column-integrated aerosol properties and not acquire vertically resolved aerosol profiles, thereby limiting their capability to accurately quantify the aerosol load within the planetary boundary layer (PBL) (McGrath-Spangler and Denning, 2013; Luo et al., 2014) where the majority of anthropogenic activities take place. The second challenge pertains to the dependence of dust-related health disorders primarily on the dust PSD and, to a lesser extent, on total dust mass. large scale intensive experimental campaigns employing in-situ instrumentation report on dust particle size distribution (PSD) ranging from 0.1 (UFP upper limit) to more than 100 µm in diameter (Weinzierl et al., 2017; Ryder et al., 2018; van der Does et al., 2018), with the fine-mode fraction of dust particles been the particularly hazardous component as can penetrate deep into the lungs and alveoli, increasing morbidity and mortality rates. However, limited research has focused on the specific relationship between the inhalable fraction of dust PSD and associated health effects at regional and global scales using EO data. The third challenge arises from the use of atmospheric aerosol models which are extensively employed to provide four-dimensional spatiotemporal insight into dust emission, transport, deposition, and vertical structure (Textor et al., 2006; Astitha et al., 2012; Randles et al., 2017; Konsta et al., 2018; Inness et al., 2019). Models often employ static land cover classifications to classify arid and semi-arid regions as dust sources (Ginoux et al., 2001). However, implementation of static emission inventories introduces substantial uncertainties, particularly by neglecting anthropogenic dust emissions (Ginoux et al., 2012; Huang et al., 2015; Chen et al., 2019), leading to significant underestimations of the human health risks associated with dust exposure especially over densely populated and highly industrialized urban areas of the Earth (Proestakis et al., 2018, 2024; Papachristopoulou et al., 2022).
According to the Agenda for Sustainable Development Goals (SDGs) 2030, and more specifically SDG11, the UN are committed to make cities and human settlements inclusive, safe, resilient, and sustainable, addressing in a holistic approach environmental, economic, and social urban development (Weiland et al., 2021). As emphasized in the UN “World Urbanization Prospects (WUP): The 2018 Revision”, urban sustainable development depends increasingly on unravelling and understanding the key trends in urbanization, population, and air quality likely to unfold over the coming years (UN, 2019). Urban sustainable development critically depends on high quality demographic and air quality data translated into information on future projection for evidence-based policy making, to adhere to the UN “urban agglomeration” concept of cities essential for managing urbanization, mitigating air pollution, and safeguarding public health in rapidly growing urban areas worldwide.
The present study aims to address the following scientific questions: To what extent the submicrometer (fine) and supermicrometer (coarse) modes of mineral dust entrained into the atmosphere within the PBL has changed over the highly-industrialized and densely-populated areas/Megacities of the world over the last two decades? Is it feasible to identify statistically significant trends? Which areas experience fine-mode and coarse-mode dust mass concentrations within the PBL exceeding WHO air quality guidelines and over which areas it is foreseen the dust modes to exceed WHO air quality guidelines in the near-future?
The study, based on the European Space Agency (ESA) “LIdar climatology of Vertical Aerosol Structure” (LIVAS; Amiridis et al., 2013, 2015) atmospheric dust, fine-mode dust, and coarse-mode dust climate data record (CDR) (Proestakis et al., 2024), aims to quantify the intensity of PBL dust PM with reference on the WHO air quality guidelines and determine over which areas the dust modes are expected to exceed WHO air quality guidelines in the near-future. By doing so, the study aims to provide a stepping-stone to enhance our fundamental scientific understanding of the complex role of inhalable dust particles to the induced disorders of human health under, allowing new pathways to support development of adaptation and mitigation strategies to preserve human health under the ongoing climate change.
The paper is organized as follows. Section 2 provides a description of the datasets used (Sect. 2.1) and an overview of the applied methodology (Sect. 2.2), both designed to address the scientific questions of the study. In Sect. 3, a consistency assessment of increasing and decreasing trends in the PBL dust aerosol load is conducted using long-term AERONET observations as reference datasets. Section 4 examines the extent to which the fine-mode and coarse-mode components of dust aerosols, entrained into the atmosphere and confined within the PBL, have changed over large cities and megacities worldwide over the past two decades. Section 5 provides insights into the anticipated changes in atmospheric dust in the third decade of the 21st century, based on quantified fine-mode and coarse-mode PBL dust mass concentrations and the identified trends during the EO-based reference period. Section 6 translates the computed dust mass concentrations into environmental risk factors for human health disorders associated with atmospheric dust exposure. Finally, Sect. 7 summarizes the study and presents the main conclusions.
2.1 Datasets
2.1.1 Atmospheric Dust
Our study is based on the four-dimensional, multiyear, and near-global CDR of the fine-mode and coarse-mode components of atmospheric dust (Proestakis et al., 2024). A brief discussion and overview of the CDR is hereinafter provided on the basis of an indicative satellite Cloud-Aerosol Lidar and Infrared Pathfinder Satellite Observations (CALIPSO) (Winker et al., 2010) nighttime overpass on the 16 April 2018 between 18:29:57 and 18:35:30 UTC in the proximity of the Beijing megacity area (Fig. 1 left). During the overpass, according to the NOAA Hybrid Single-Particle Lagrangian Integrated Trajectory (HYSPLIT) model (Stein et al., 2015), air masses in the broader Beijing area where a mixture of emissions residing close to the surface within the PBL, probably attributed to the extensive anthropogenic and industrial activity, and higher altitude dust layers advected from the vast Gobi Desert extending Northwest of the Beijing megacity area mainly across Mongolia (Fig. 1 right).
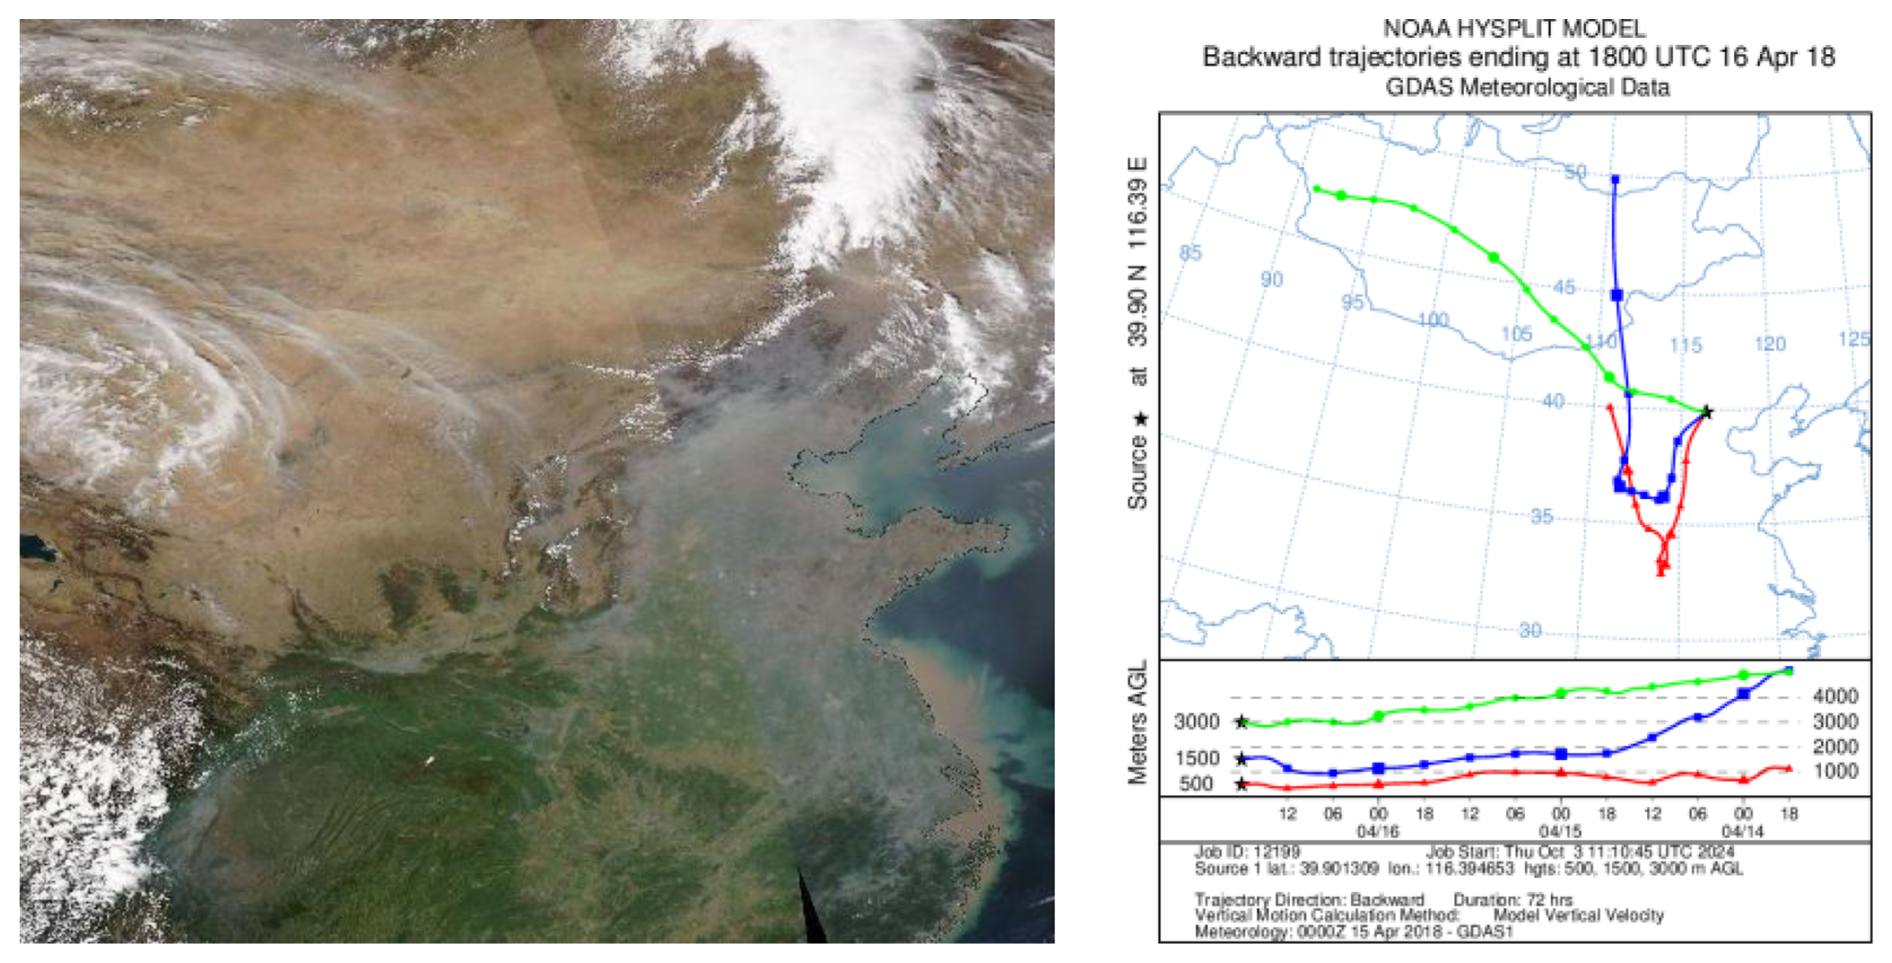
Figure 1Beijing megacity area during the CALIPSO nighttime overpass on the 16 April 2018 between 18:29:57 and 18:35:30 UTC (Source: NASA Worldview: https://worldview.earthdata.nasa.gov/, last access: 13 April 2025) (a) and NOAA HYSPLIT (https://www.ready.noaa.gov/HYSPLIT.php, last access: 13 April 2025) model back-trajectories at 500 m (red line), 1500 m (blue line), and 3000 m (green line) above ground level.
The CDR is established on the basis of Cloud-Aerosol Lidar with Orthogonal Polarization (CALIOP) (Hunt et al., 2009) quality-assured (Winker et al., 2013; Tackett et al., 2018) profiles of backscatter coefficient at 532 nm (Fig. 2b) and particulate depolarization ratio at 532 nm along the CALIPSO (Winker et al., 2010) orbit-track (Fig. 2a). Decoupling of the atmospheric dust load into the two modes, a submicrometer and a supermicrometer in terms of diameter, is performed on the basis of the two-step POlarization LIdar PHOtometer Networking (two-step POLIPHON) technique (Mamouri and Ansmann, 2014, 2017), developed within the framework of the European Aerosol Research Lidar Network (EARLINET; http://www.earlinet.org/, last access: 13 April 2025) activities (Pappalardo et al., 2014), applied on CALIOP Level 2 (L2) Version 4.51 (V.51) products and implementing CALIPSO layer detection (Vaughan et al., 2009), cloud–aerosol discrimination (Liu et al., 2009, 2019; Zeng et al., 2019) (Fig. 2c), and aerosol subtype classification (Omar et al., 2009; Kim et al., 2018; Kar et al., 2019) (Fig. 2d). The scientific cornerstones of both the two-step POLIPHON technique and the dust fine- and coarse- mode EO-based CDR are the extensive chamber laboratory experiments performed by Sakai et al. (2010) and Järvinen et al. (2016) reporting on distinct light-depolarizing properties of the two dust modes, essentially characterizing dust size distribution (Weinzierl et al., 2016; Ryder et al., 2018). Adapted and applied on CALIOP quality-assured optical products, the two-step POLIPHON technique yields quality-assured backscatter coefficient at 532 nm profiles of the atmospheric fine-mode (Fig. 2g), coarse-mode (Fig. 2f), and total dust (Fig. 2e) along the CALIPSO orbit-path (Fig. 2a). Accordingly, conversion of the backscatter coefficient at 532 nm profiles into extinction coefficient at 532 nm profiles (Fig. 2h, i, j) is performed on the basis of suitable geographically-dependent backscatter-to-extinction conversion factors (i.e. lidar ratio at 532 nm), as provided by the database of lidar-derived aerosol intensive optical properties DeLiAn (Floutsi et al., 2023). As a next step, the obtained quality-assured extinction coefficient at 532 nm profiles of the atmospheric coarse-mode and total dust are converted into coarse-mode and total dust mass concentration (MC) profiles (Fig. 2k, l) on the basis of representative dust extinction-to-volume concentration conversion factors provided by Ansmann et al. (2019) and assumed dust particle density (ρd) of 2.6 g cm−3 (Ansmann et al., 2012). Finally, the atmospheric fine-mode dust mass concentration profiles (Fig. 2m) are computed as the residual between the total dust mass concentration and the coarse-mode dust mass concentration profiles along the CALIPSO orbit track.
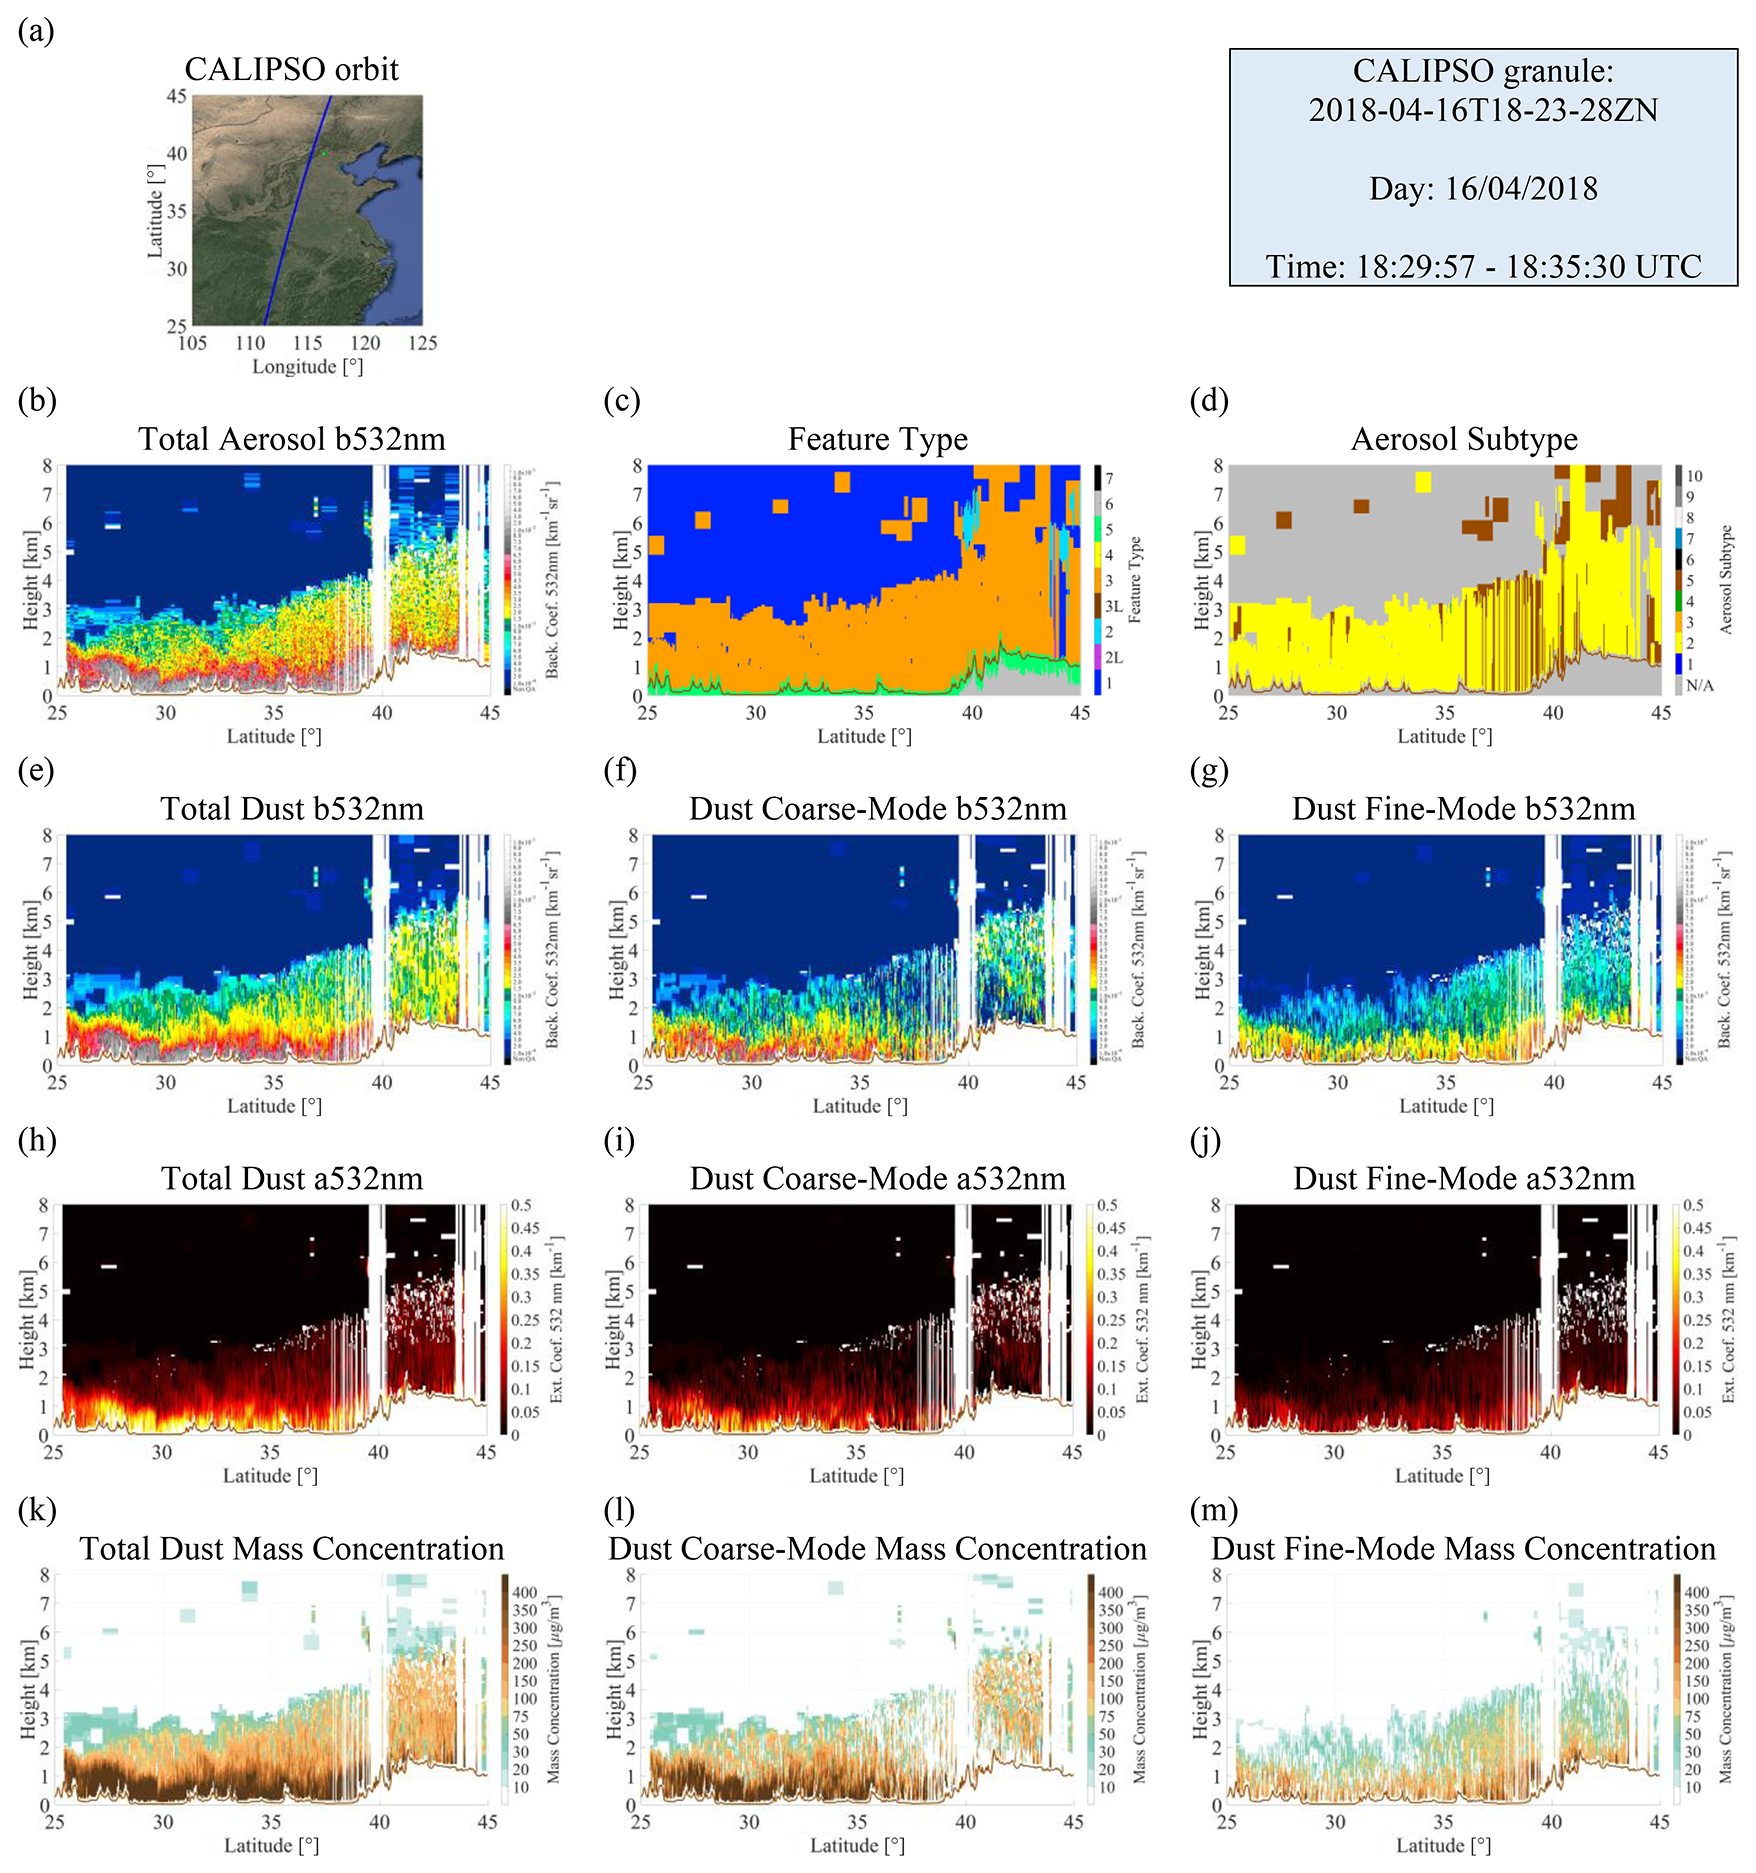
Figure 2Illustration of the established methodology towards extracting the atmospheric dust component from the total aerosol load and accordingly separating the fine-mode and coarse-mode components of atmospheric dust, provided on the basis of an indicative CALIPSO-Beijing nighttime overpass on the 16 April 2018 between 18:29:57 and 18:35:30 UTC (a). On the second row, the quality-assured total backscatter coefficient at 532 nm (b), Feature Type (c), and Aerosol Subtype (d) are provided. The third row provides the final products of total dust (e), coarse-mode dust (f), and fine-mode dust (g) in terms of quality-assured profiles of backscatter coefficient at 532 nm. On the fourth row, the total dust (h), coarse-mode dust (i), and fine-mode dust (j) components of the total aerosol load in terms of quality-assured extinction coefficient at 532 nm profiles are shown. The fifth row provides the total dust (k), coarse-mode dust (l), and fine-mode dust (m) components of the total aerosol load in terms of profiles of mass concentration (µg m−3). Layer background: © Google Maps. Layer background: © Google Maps.
The final products consist of the fine-mode and coarse-mode of atmospheric dust, quality-assured profiles of backscatter coefficient at 532 nm and extinction coefficient at 532 nm, and mass concentration for each component, with the original L2 horizontal and vertical resolution of CALIOP, of 5 km and 60 m respectively, along the CALIPSO orbit path (Winker et al., 2009). Accordingly, the EO-based dust fine-mode and coarse-mode CDR is established in monthly-mean and seasonal-mean profiles of backscatter coefficient at 532 nm and extinction coefficient at 532 nm. These profiles are established in 1° × 1° spatial resolution and 60 m vertical resolution, cover the latitudinal band between 70° S and 70° N and the entire lifetime of the CALIPSO mission. Moreover, vertical integration of the total aerosol, total dust, coarse-mode dust, and fine-mode dust mean quality-assured extinction coefficient at 532 nm profiles (Fig. 2h, i, j) with respect to height – between the top of atmosphere (TOA) and the mean surface elevation – yield columnar AOD (Fig. 3a), DOD (Fig. 3b), DODfine-mode (Fig. 3c) and DODcoarse-mode (Fig. 3d) at 532 nm values, facilitating implementation of the CDR climatological studies (Amiridis et al., 2013; Marinou et al., 2017; Aslanoğlu et al., 2022; Proestakis et al., 2018, 2024).
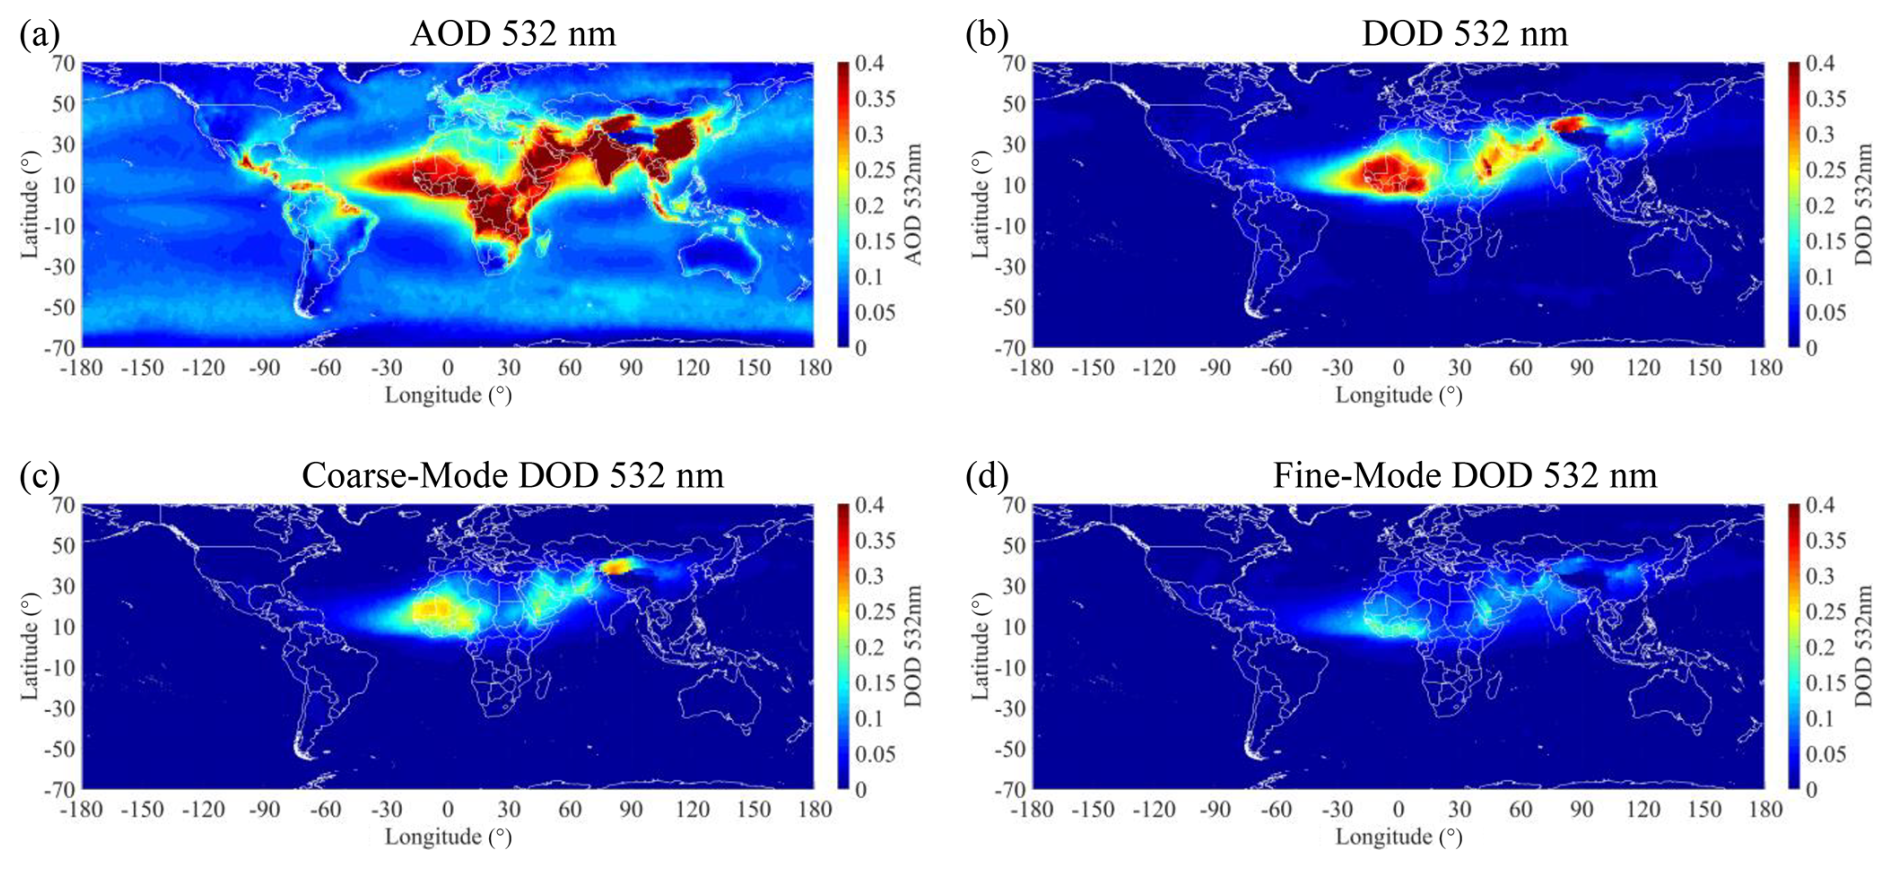
Figure 3CALIOP-based AOD at 532 nm (a), ESA-LIVAS DOD at 532 nm (b), and coarse-mode DOD at 532 nm (c) and fine-mode DOD at 532 nm (d), gridded at 1° × 1° spatial resolution and for the temporal period extending between June 2006 and July 2023.
The four-dimensional, multiyear, and near-global CDR of the fine-mode and coarse-mode components of atmospheric dust expressed in terms of columnar integrated extinction coefficient at 532 nm (DOD at 532 nm) was evaluated on the basis of AErosol RObotic NETwork (AERONET; https://aeronet.gsfc.nasa.gov/, last access: 13 April 2025) (Holben et al., 1998) fine-mode and coarse-mode aerosol optical thickness (AOT) at 500 nm derived during atmospheric conditions characterized by dust presence via the Spectral Deconvolution Algorithm (SDA; Eck et al., 1999; O'Neill et al., 2001a, b, 2003) and interpolated to 532 nm. The evaluation analysis between the EO-based DODfine at 532 nm products and AERONET AOTfine at 532 nm retrievals revealed a fairly good agreement between the two datasets for the fine-mode class, with a slope of 0.65, an offset of 0.018, and a Pearson's correlation coefficient of 0.69. However, an increasing underestimation of fine-mode dust was observed with higher dust aerosol concentrations (Fig. 6a in Proestakis et al., 2024). For the coarse-mode category, the evaluation demonstrated a substantially better agreement between the EO-based CDR and AERONET retrievals, with a slope of 0.78, an intercept of −0.002, and a Pearson's correlation coefficient of 0.92 (Fig. 6b in Proestakis et al., 2024). The EO-based fine- and coarse- mode atmospheric dust CDR was further verified in terms of profiles of mass concentration against airborne in situ dust aerosol size distributions (PSD) acquired by the United Kingdom (UK) Facility for Airborne Atmospheric Measurements (FAAM) BAe-146 research aircraft. These reference measurements were obtained in the framework of the “AERosol properties – Dust” (AER–D) experiment conducted in the tropical Atlantic Ocean, in the region extending between Cabo Verde and the Canary Islands, in August 2015 (Marenco et al., 2018; Ryder et al., 2018). With respect to the coarse-mode category, the validation intercomparison revealed agreement within 10 % between the EO-based coarse-mode dust mass concentration product and the reference in situ supermicrometer mass concentration measurements (Fig. 9c in Proestakis et al., 2024). With respect to the fine-mode category, the validation intercomparison activities revealed a fairly good agreement between the two datasets, although a noticeable underestimation was apparent (Fig. 9d in Proestakis et al., 2024). Overall, the quality assessment activities corroborated on the capacity and effectiveness of the lidar-based techniques established with the overarching objective to decouple the fine-mode and coarse-mode components from the total atmospheric dust load (Shimizu et al., 2004; Mamouri and Ansmann, 2014, 2017; Tesche et al., 2009) and revealed the high quality of the established EO-based products of the submicrometer and the supermicrometer dust components in terms of extinction coefficient at 532 nm and mass concentration profiles and DODs at 532 nm.
In addition, the four-dimensional, multiyear, and near-global CDR of the fine-mode and coarse-mode components of atmospheric dust provides monthly-mean mass concentration profiles, on regular grids with 1° × 1° spatial resolution spanning 70° S and 70° N, maintaining the original 60 m vertical resolution of CALIOP, and for the entire lifetime of the CALIPSO mission. These profiles enable the investigation of the study's central scientific questions of the study. More specifically, near-surface total (Fig. 4b), fine-mode (Fig. 4c), and coarse-mode (Fig. 4d) dust mass concentration retrievals have the capacity to provide critical insights into the potential impact of airborne particulate matter from mineral dust on human health, particularly in regions where concentrations exceed WHO-recommended safety thresholds for annual-mean and/or hourly-mean PM2.5 and PM10 (Table 1). This necessity of high-quality information on the spatial distribution of global surface mineral dust concentrations is reflected in the collaborative efforts of several national and international initiatives, including, among others, the World Meteorological Organization (WMO) and Global Atmosphere Watch (GAW) Sand and Dust Storm-Warning Advisory and Assessment System (SDS-WAS; https://community.wmo.int/en/activity-areas/gaw/science-for-services/sds-was, last access: 13 April 2025), the United Nations Environment Programme (UNEP) Global Environment Outlook (GEO; https://www.unep.org/resources/global-environment-outlook, last access: 13 April 2025), the Dust Alliance for North America (DANA; https://dust.cira.colostate.edu/, last access: 13 April 2025), the European Space Agency (ESA), and the Climate Change Initiative (CCI; https://climate.esa.int/en/, last access: 13 April 2025), aiming to address the multifaceted challenges posed by atmospheric dust hazards.
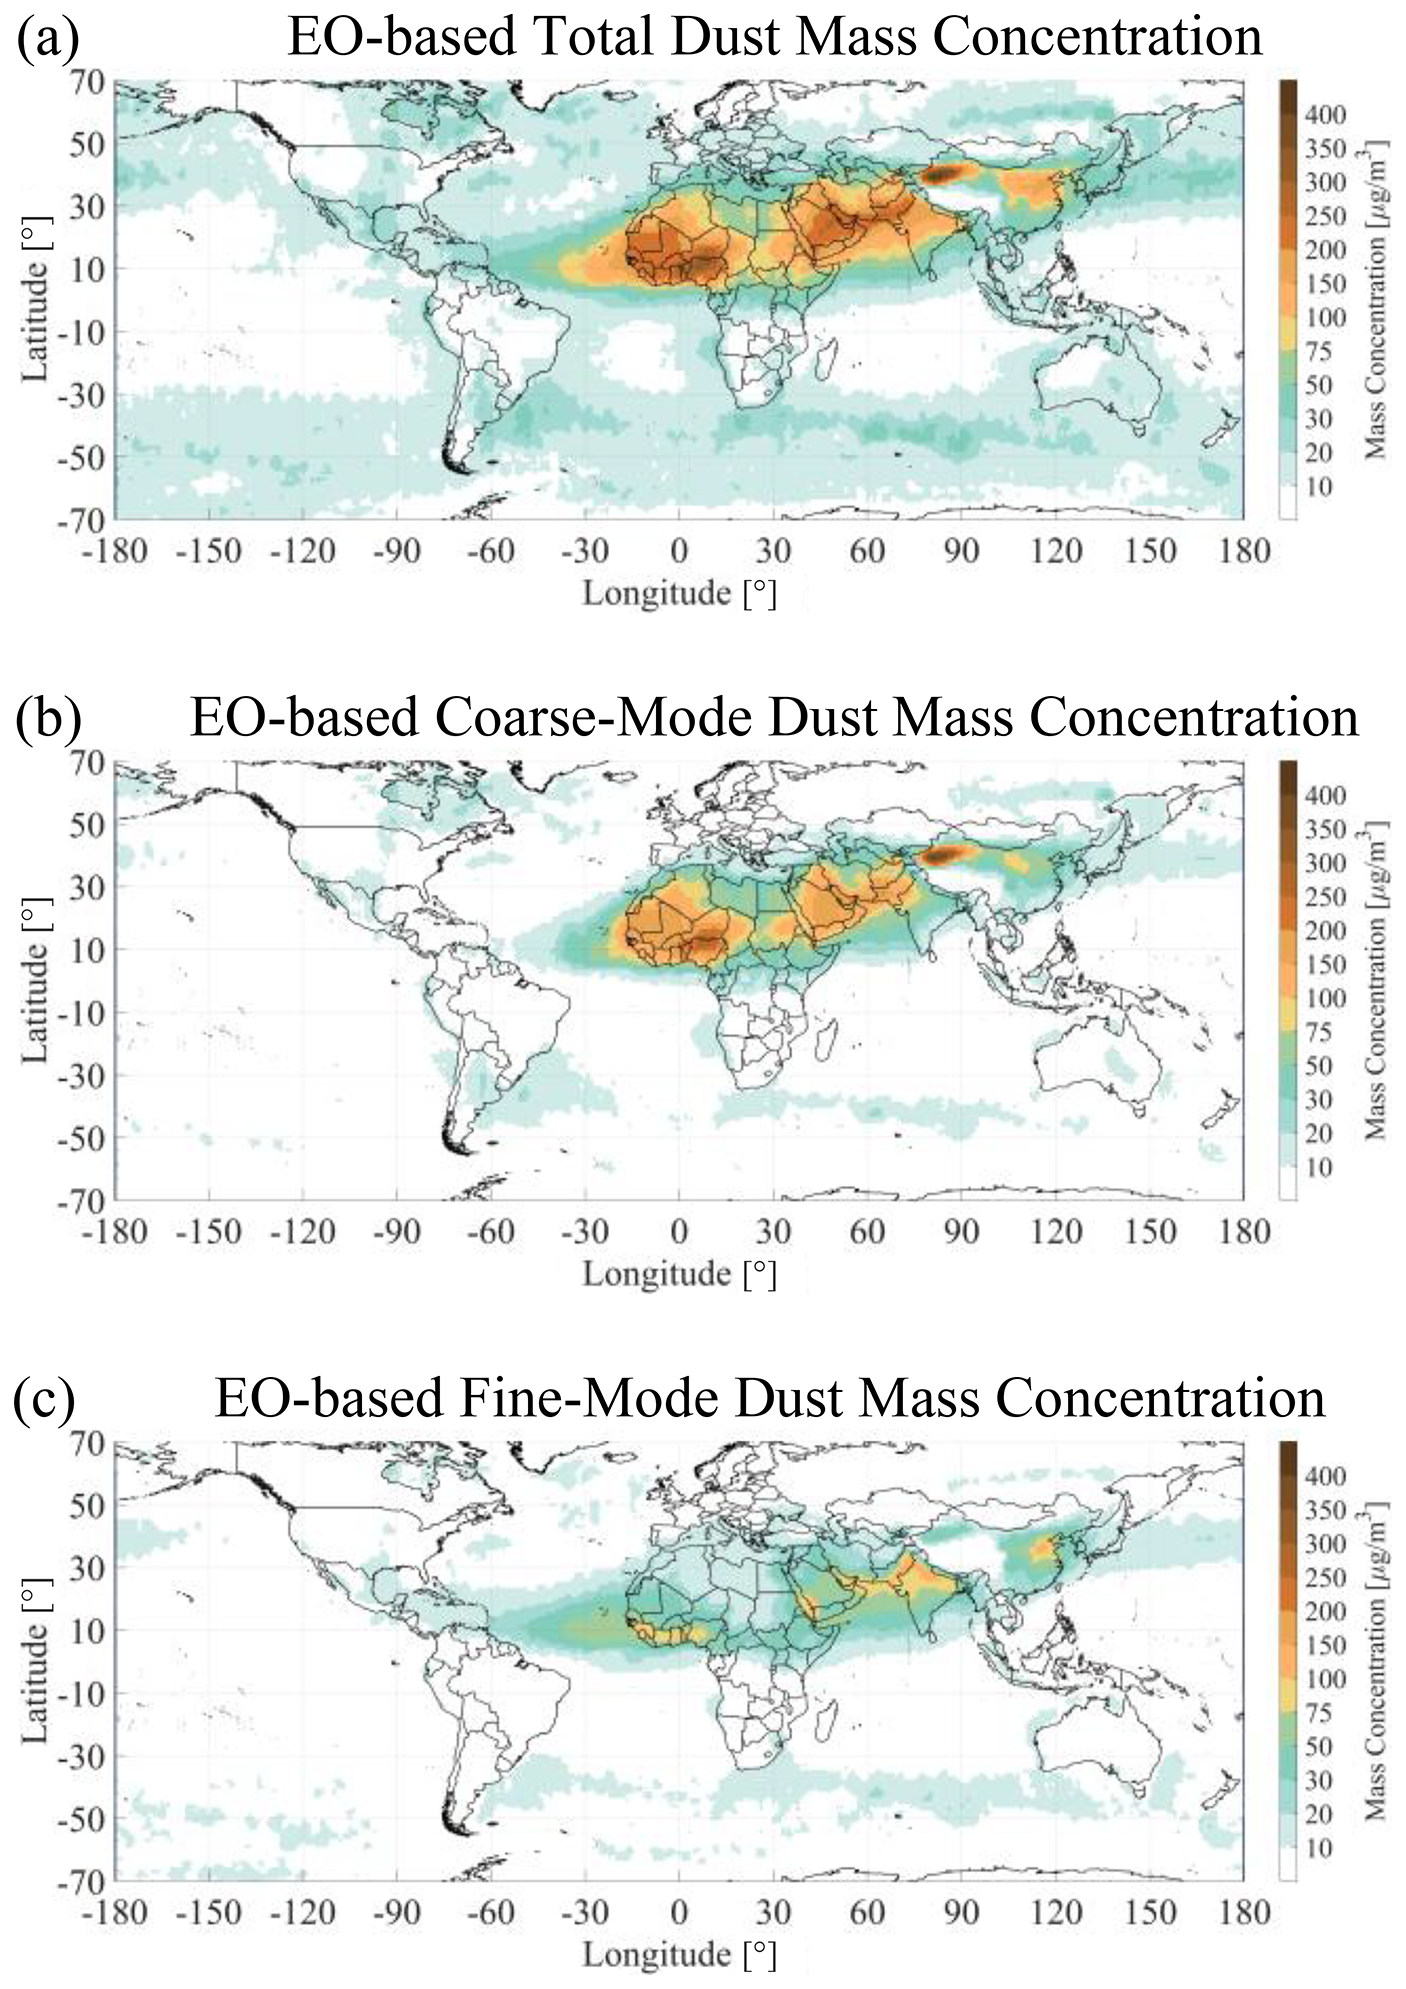
Figure 4EO-based total (a), coarse-mode (b), and fine-mode dust (c) dust mean mass concentration (µg m−3), corresponding to the altitudinal range 0–500 m above mean surface elevation, gridded at 1° × 1° spatial resolution and for the temporal period extending between June 2006 and July 2023.
2.1.2 ERA5 PBL
Satellite-based lidar remote sensing is capable of providing the vertical structure of aerosol layers in the atmosphere with high accuracy. However, the retrieved profiles exhibit significant signal uncertainties near the surface, as described in Winker et al. (2013) and Tackett et al. (2018). More specifically, elevated uncertainties in backscatter signals within range bins close to the surface arise from multiple factors, including the “negative signal anomaly” (NSA), which generates substantial negative signals near the surface. In addition, the “aerosol-base extension” algorithm fails to account for clear-air gaps below 90 m above the local surface or in cases where negative integrated attenuated backscatter signals occur near the surface (Vaughan et al., 2010). Other contributing factors include strong surface returns, particularly in regions characterized by high variability in local surface elevation within L2 5 km segments (Proestakis et al., 2019) or over high-albedo surfaces (Hunt et al., 2009), which can lead to unrealistic large values. Furthermore, a lower signal-to-noise ratio (SNR), primarily due to solar noise during daytime illumination conditions, reduces the detection sensitivity of atmospheric faint layers (Winker et al., 2013) and contributes to higher uncertainties (Young et al., 2013). These sources of uncertainties produce large negative or positive signals near the surface and bias level 3 (L3) EO-based products low or high, respectively.
To compensate for situations like this, near surface values the mean backscatter coefficient at 532 nm, extinction coefficient at 532 nm, and mass concentration values of range bins between the minimum surface elevation and the planetary boundary layer (PBL) height are considered. The underlying assumption is that the atmosphere due to turbulent mixing is well mixed and relatively homogenized within the PBL both for marine and continental conditions (McGrath-Spangler and Denning, 2013; Luo et al., 2014). More specifically, the boundary layer as a part of the lower troposphere contains a substantial portion of the air's mass and a significant concentration of aerosols, influencing air quality, climate, and weather (Stull, 1988). In addition, strong interactions between aerosols, radiation, and clouds take place within the boundary layer, shaping atmospheric processes and affecting local pollution dispersion to global climate patterns (Li et al., 2017). The boundary layer over land, particularly in urban areas, can reach considerable heights during the daytime due to the combined effects of surface heating, anthropogenic heat emissions, and turbulence generated by buildings and other structures (von Engeln and Teixeira, 2013; Barlow, 2014), in addition characterized by strong seasonality (Medeiros et al., 2005). These processes affect the overall structure and dynamics, leading to a deeper and more convective boundary layer (Hildebrand and Ackerman, 1984), enhancing at the same time the boundary layer vertical mixing and resulting to more homogeneous conditions in terms of aerosol mixing (Hägeli et al., 2000; Pal et al., 2010). More specifically, in a well-mixed turbulent boundary layer, the transport of momentum, energy, and mass is governed by turbulent eddies that act to homogenize scalar and vector quantities throughout the layer (Stull, 1988). Aerosols follow these turbulent dynamics and the thermodynamic stability of atmosphere, tending to be uniformly distributed within the boundary layer (Stull, 1988; Li et al., 2017). This behavior has been directly observed in several studies. Pikridas et al. (2019), using in situ airborne measurements, found that once the PBL is fully developed and mixed, aerosol concentrations become fairly uniform from approximately 100 m above ground up to the PBL top. Similarly, Liu et al. (2023), who investigated the vertical distribution and mixing state of black carbon in the urban boundary layer, demonstrated that during well-mixed daytime conditions, black carbon concentrations are vertically uniform throughout the PBL. Specifically, they found that about 80 % of the profiles were of a uniform type, under daytime during well-mixed boundary layer conditions. Additionally, the top of the boundary layer is usually capped by a temperature and humidity inversion, which inhibits further vertical mixing and confines the aerosols within the layer. This contrast between the homogeneous aerosol presence in the PBL and the cleaner free troposphere above, provides the physical basis for many remote sensing methods: they use aerosols as a tracer to determine the boundary layer height (Seibert et al., 2000; Brooks, 2003).
The PBL data used for this study were sourced for the ERA5 Reanalysis dataset (Hersbach et al., 2020), which represents the fifth generation of atmospheric reanalyses produced by the European Centre for Medium-Range Weather Forecasts (ECMWF). The ERA5 dataset provides global coverage at a horizontal resolution of 0.25° × 0.25° (approximately 28 km at the equator) and contains hourly estimates of various atmospheric, land, and oceanic climate variables derived from model simulations with assimilated observations. The data used in this study were extracted from the monthly averages of single level data collection, accessible through ECMWF's Climate Data Store (CDS; https://cds.climate.copernicus.eu/datasets/reanalysis-era5-single-levels-monthly-means?tab=overview, last access: 13 April 2025). To produce the timeseries for the urban locations of interest, the PBL data was spatially interpolated from the native ERA5 grid to the geographical coordinates of each city under investigation.
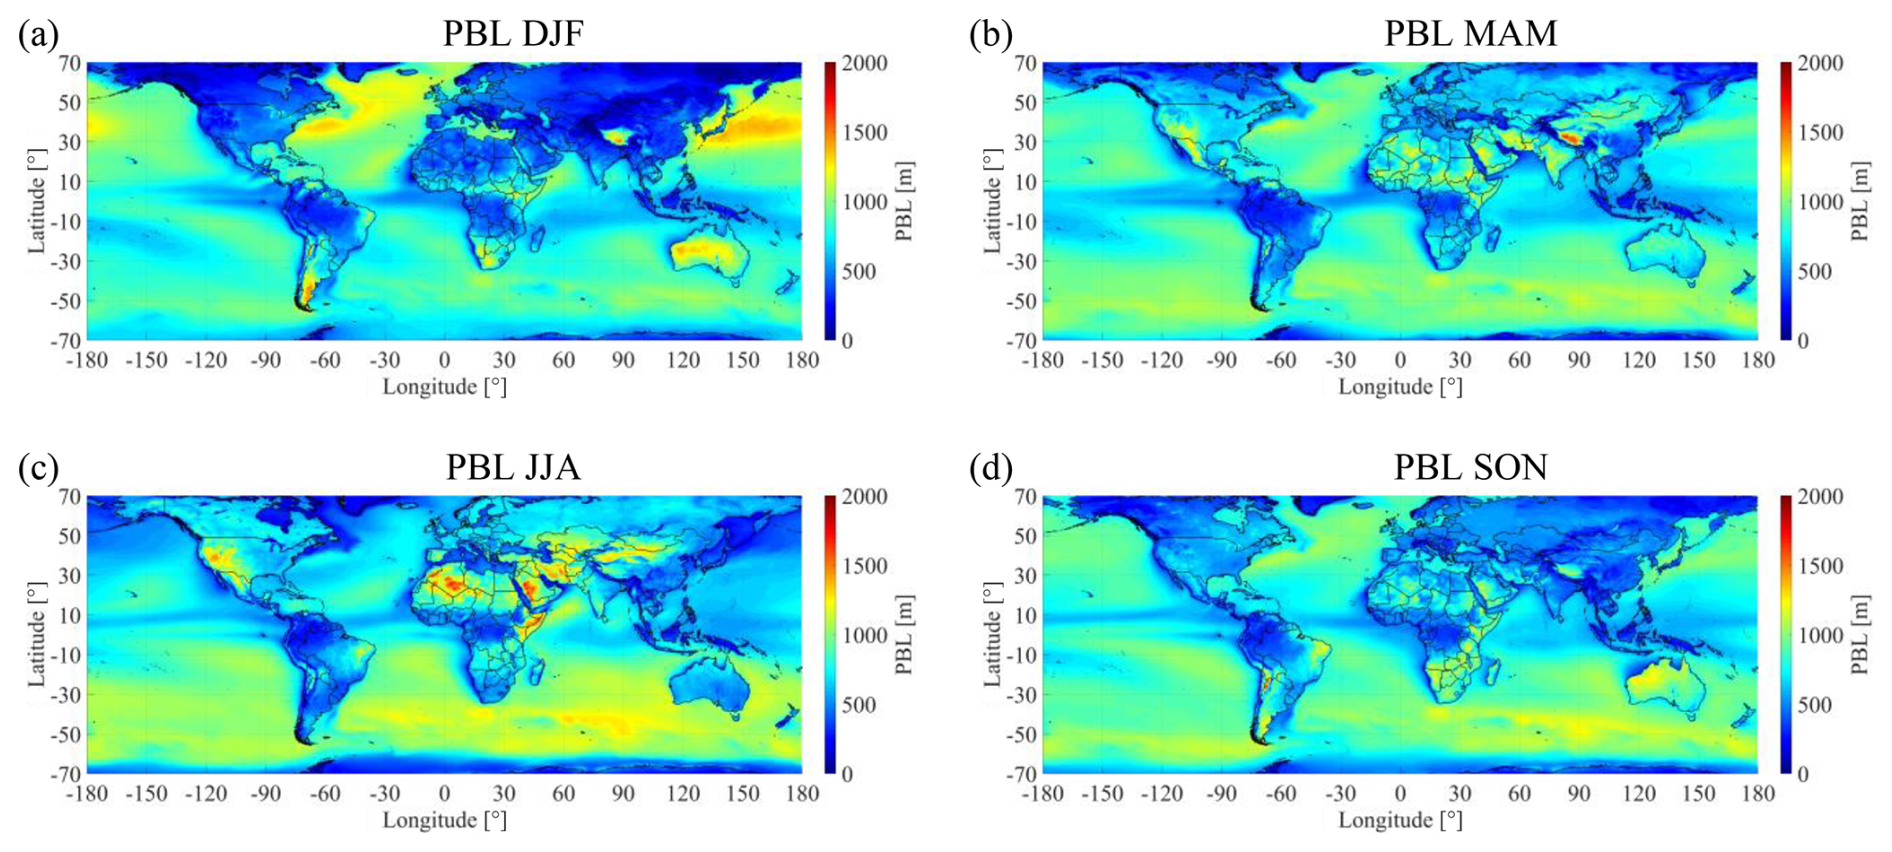
Figure 5ERA5 mean PBL height (m) above mean surface elevation, seasonally grouped for December–January–February (DJF; a), March–April–May (MAM; b), June–July–August (JJA; c), and September–October–November (SON; d) and for the year-period 2006 to 2023.
2.1.3 AERONET fine-mode and coarse-mode AOT
AERONET is composed of sunphotometers that have been manufactured by CIMEL (type CIMEL CE318, commonly referred as CIMEL sunphotometers) and are deployed at more than 600 stations world-wide, providing global coverage. The CIMEL measures sun and sky radiance at nine distinct wavelengths (340, 380, 440, 500, 675, 870, 940, and 1020 nm). Spectral aerosol optical properties are retrieved for eight of the overall nine channels (the 940 nm channel is used to retrieve the columnar water vapor) (Holben et al., 1998). AERONET products are widely used for satellite validation (e.g., Fan et al., 2023; Cheng et al., 2012; Tripathi et al., 2005) and climatological studies (e.g., Holben et al., 2001; Toledano et al., 2007; Kaskaoutis et al., 2007). Sky radiance measurements are performed for solar zenith angles 50–75° and are then processed using an inversion algorithm (Dubovik and King, 2000) to derive, among other products, a bi-modal particle size distribution. The fine and the coarse-mode optical depths are subsequently derived from the size distribution and the spectral shape of the total aerosol optical depth (O'Neill et al., 2003). The fine and coarse-mode AOT at 500 nm is available at the AERONET web-page (https://aeronet.gsfc.nasa.gov/, last access: 13 April 2025). An automated quality control and cloud screening algorithm has been applied to produce the AERONET version 3, level 2 (V3L2) product that has been used in this study (Giles et al., 2019). The uncertainties in the V3 L2 AERONET products are discussed analytically in Sinyuk et al. (2020).
2.1.4 Megacities and Population
In this study, we focus on megacities (with populations exceeding 10 million), while also including cities with population of 5–10 million, as they have the potential to become megacities in the future, based on accurate population data and projections from the United Nations (UN) Population Division of the Department of Economic and Social Affairs (UN, 2018a, 2019). The UN's collection of datasets (https://population.un.org/wup/, last access: 13 April 2025) provides city population estimates and projections, in thousands of inhabitants, on an annual basis over a long time period (1950–2035) (UN 2018b), allowing us to identify cities with the highest population changes. Table 2 summarizes the number of cities based on their population in 2007 and future projections. According to UN projections, 26 cities with populations between 5 and 10 million are expected to become megacities by 2035. Here, we focus on 81 cities with more than 5 million inhabitants as reported in 2018 (UN, 2018a, 2019). These cities are listed in Tables 3 and 4, and their geographical locations are shown in Fig. 6. This figure presents the population of the 81 cities in 2007, along with future projections for 2025 and 2035, highlighting cities with the highest population growth (red points in Fig. 6c).
Table 2Number of large cities (5–10 million) and megacities (more than 10 million) according to their population for the years 2007 (reference year), 2025, 2030, and 2035 (adopted by UN, 2018a, 2019).
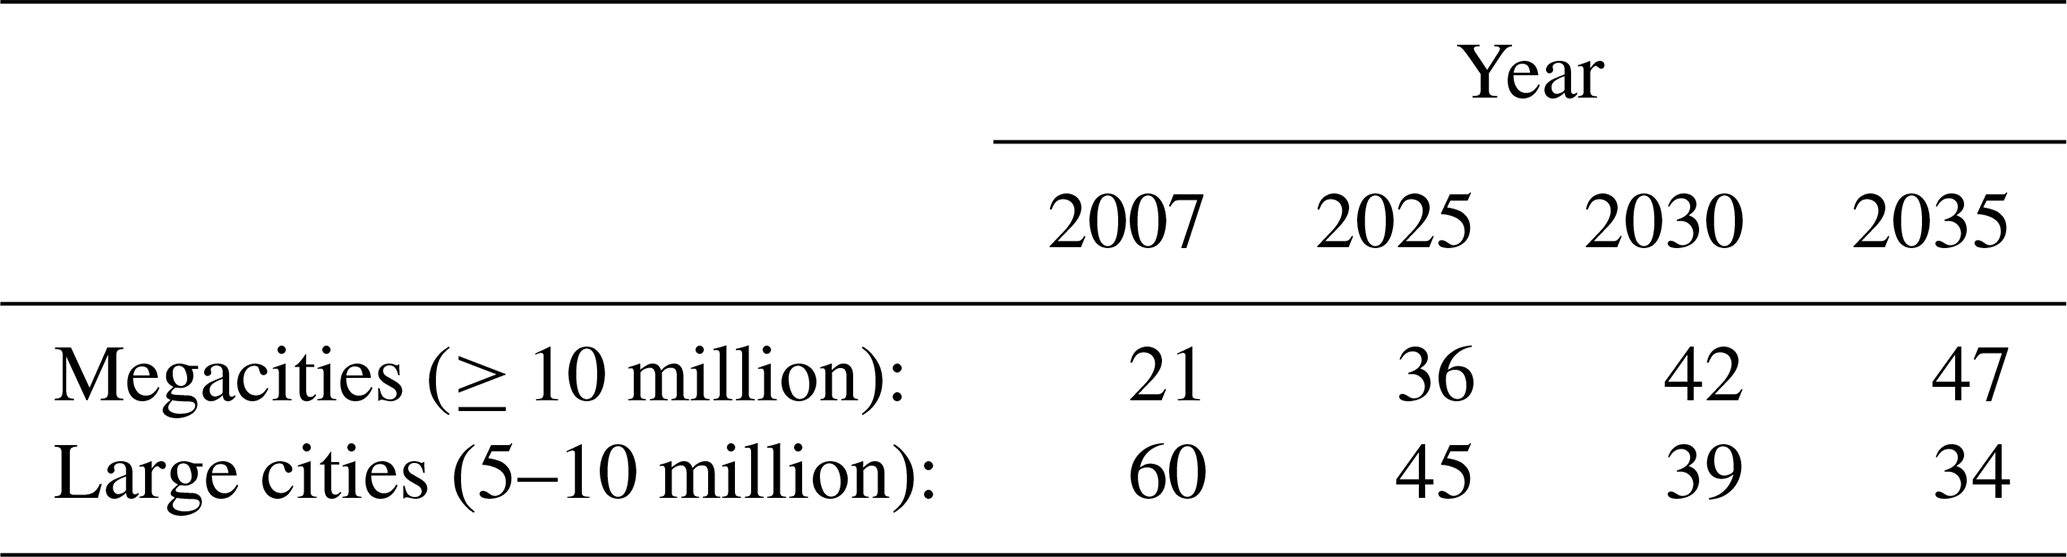
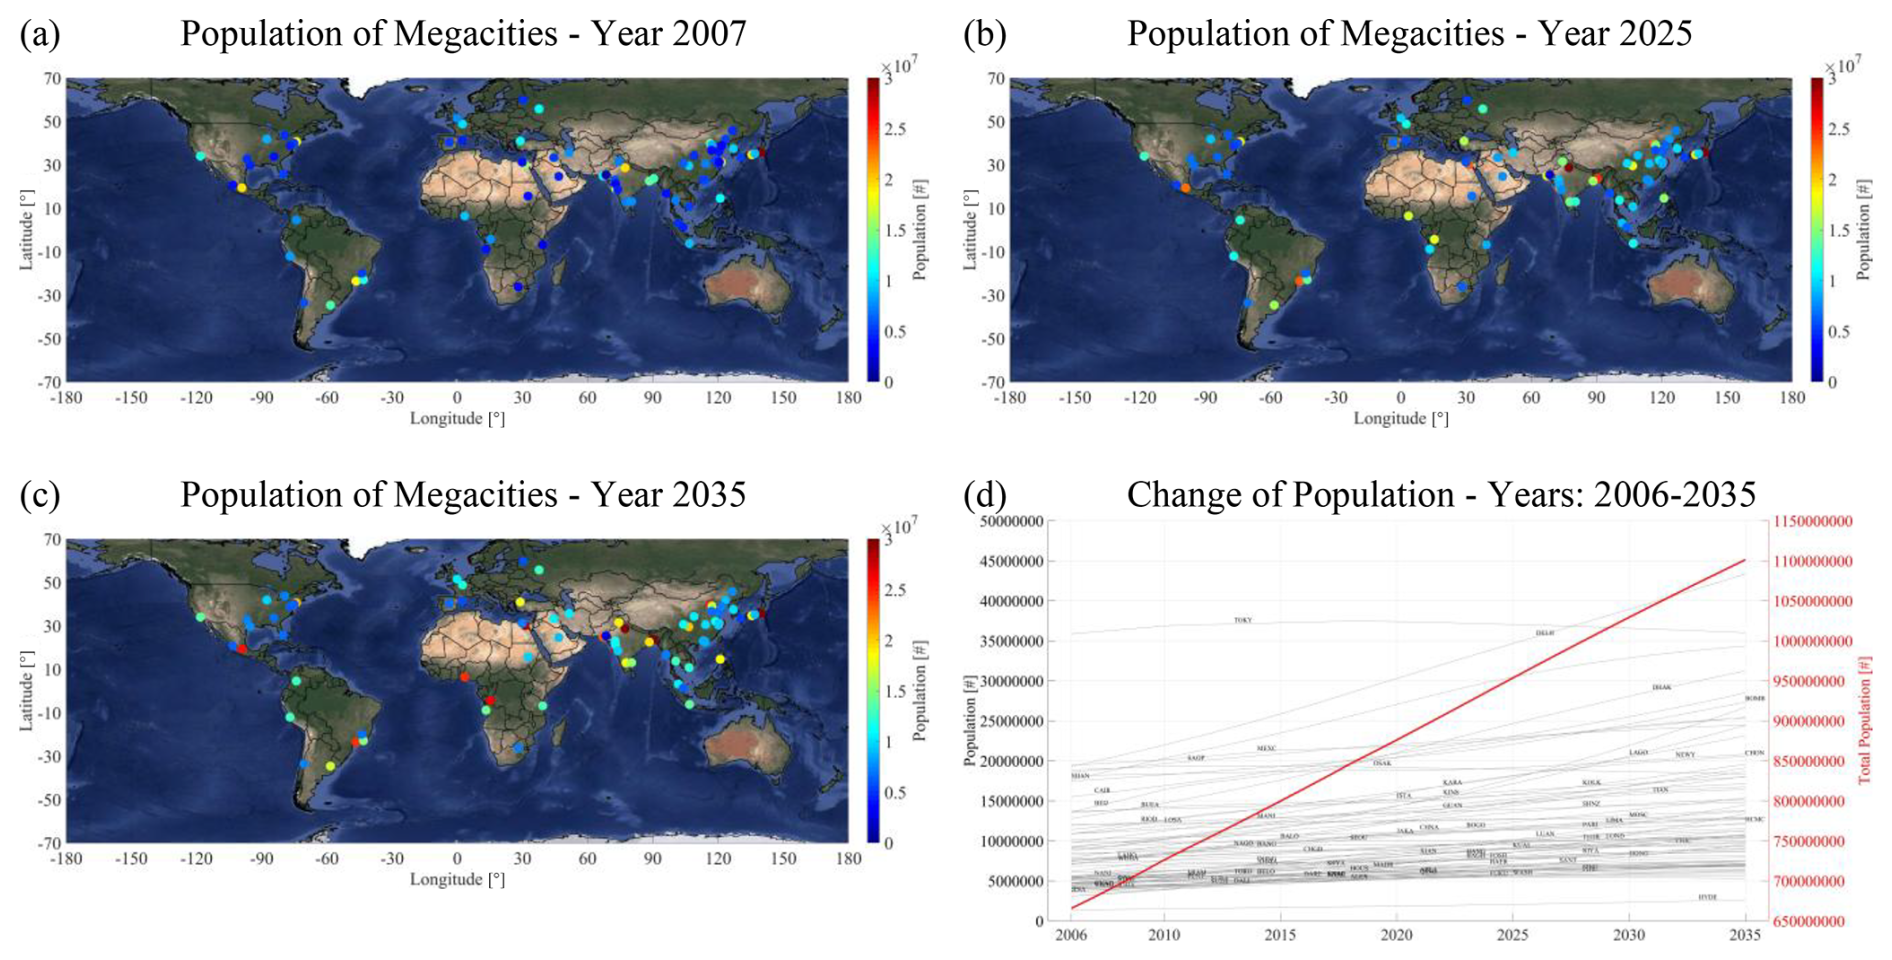
Figure 6Cities of the world with population greater than 5 million up to 2018 (adopted by UN, 2018a, b, 2019). Focusing on population change, the figure reports on the population of the largest cities, as documented for the years 2007 (Fig. 6a), 2025 (Fig. 6b), for the projected population of the largest cities on the year 2035 (Fig. 6c), including the total increase of the population of all cities between 2007 and present day (2025) and as projected to increase in the years till 2035 (Fig. 6d). Layer background: © Google Maps.
2.1.5 Health risk Assessment
The health risk assessment due to exposure to air pollution is achieved through the estimation of the Relative Risk. The latter expresses the risk of a population for a health effect (e.g. all-cause mortality, lung cancer etc.) when exposure to certain levels of air pollution takes place. Given a city or an area, exposure to PM10 or PM2.5 levels can be assessed using concentration-response functions obtained from epidemiological studies. These functions use a target concentration which represents a baseline where no health effect is observed.
For short-term exposure to PM10, the Relative Risk for all-cause mortality and for all ages is estimated by (Ostro, 2004):
where C is the annual mean concentration of PM10, C0 is the baseline PM10 concentration under which no health effect is expected (10 µg m−3), and β is a coefficient (0.0008) based on the concentration-response factor estimated by epidemiological studies (Soares et al., 2022).
For long-term exposure to PM2.5, the Relative Risk for cardiopulmonary mortality and lung cancer and for age groups over 30-years-old is estimated by (Ostro, 2004):
where C is the annual mean concentration of PM2.5, C0 is the baseline PM2.5 concentration (3 µg m−3), and β is a coefficient equal to 0.15515 for cardiopulmonary mortality and equal to 0.23218 for lung cancer.
Having the Relative Risk, the population attributable fraction (AF) is then estimated as (Ostro, 2004):
The attributable fraction is defined as the proportional reduction in a disease (e.g. all-cause mortality, cardiopulmonary mortality or lung cancer) for the exposed population that would occur if ambient concentrations were reduced to target values (Chalvatzaki et al., 2019; Soares et al., 2022).
2.2 Methodology
CALIOP-based fine-mode and coarse-mode components of atmospheric dust are established in quality-assured profiles of backscatter coefficient at 532 nm, extinction coefficient at 532 nm, and mass concentration with the original L2 horizontal and vertical resolution of 5 km and 60 m respectively, along the CALIPSO orbit path (Proestakis et al., 2024). Accordingly, the atmospheric fine-mode and coarse-mode dust products are processed to a four-dimensional, multiyear, and near-global Level 3 (L3) CDR of monthly-mean backscatter coefficient at 532 nm, extinction coefficient at 532 nm, and mass concentration, on a regular grid with 1° × 1° spatial resolution spanning between 70° S and 70° N, maintaining the original 60 m vertical resolution of CALIOP, and for the entire lifetime of the CALIPSO mission. However, the L3 fine-mode and coarse-mode atmospheric dust CDR lacks the spatial and temporal resolution necessary to effectively address the core scientific objectives of the study, for two primary reasons.
First, the likelihood that the center of a large city or megacity coincides with or is in close proximity to the center of a L3 1° × 1° grid cell is relatively low, which leads to the introduction of spatial biases. Therefore, a more suitable L3 CDR for the fine-mode and coarse-mode components of atmospheric dust must be established. To achieve this, for each large city or megacity, a 100 km radius surrounding the city center is defined. Within this area, all CALIOP-based L2 5 km quality-assured profiles of fine-mode and coarse-mode backscatter coefficient at 532 nm, extinction coefficient at 532 nm, and mass concentration are averaged. The selection of a 100 km radius is supported by the mesoscale aerosol variability in the lower troposphere (Pappalardo et al., 2010), the CALIPSO Selective Iterated BoundarY Locator (SIBYL) feature detection algorithm, which employs horizontal averaging up to 80 km along the CALIPSO orbital track (Vaughan et al., 2009), and the near-zero swath of CALIOP with a footprint of approximately 100 m on the Earth's surface (Omar et al., 2013). In addition, while consideration of a maximum CALIPSO overpass distance of less than 100 km of the city center may yield slight improvements in terms of biases (Amiridis et al., 2013; Omar et al., 2013; Pappalardo et al., 2010; Proestakis et al., 2019; Schuster et al., 2012; Proestakis et al., 2019), this approach would come at the expense of larger uncertainties due to the reduced sample size of L2 5 km profiles for fine-mode and coarse-mode backscatter coefficients at 532 nm, extinction coefficients at 532 nm, and mass concentration. Figure 7 illustrates the applied L2-to-L3 spatial-averaging methodology using the Beijing, China megacity case. The CALIPSO overpasses for Beijing, both during the daytime and nighttime, within a maximum distance of 100 km from the city center, are displayed using red and blue granules, respectively (Fig. 7a). The map overlays white circles indicating the locations of the four AERONET long-term monitoring stations: Beijing, Beijing-RADI, Beijing-PKU, and Beijing-CAMS. The mean dust mass concentration profiles of total (Fig. 7b), coarse-mode (Fig. 7c), and fine-mode (Fig. 7d) for the period from December 2006 to November 2022 (16-years) reveal elevated levels of dust particulate matter, particularly near the surface. These profiles are compared to the WHO annual mean and 24 h mean AQG thresholds for PM10 and PM2.5, additionally included in the figure. More specifically, for the case of the Beijing, China megacity the annual mean total, coarse-mode, and fine-mode dust mass concentration profiles reach values of 115.95, 38.91, and 80.22 µg m−3, respectively, significantly surpassing the WHO annual mean AQG limits for both PM10 and PM2.5 particulate matter exposure.
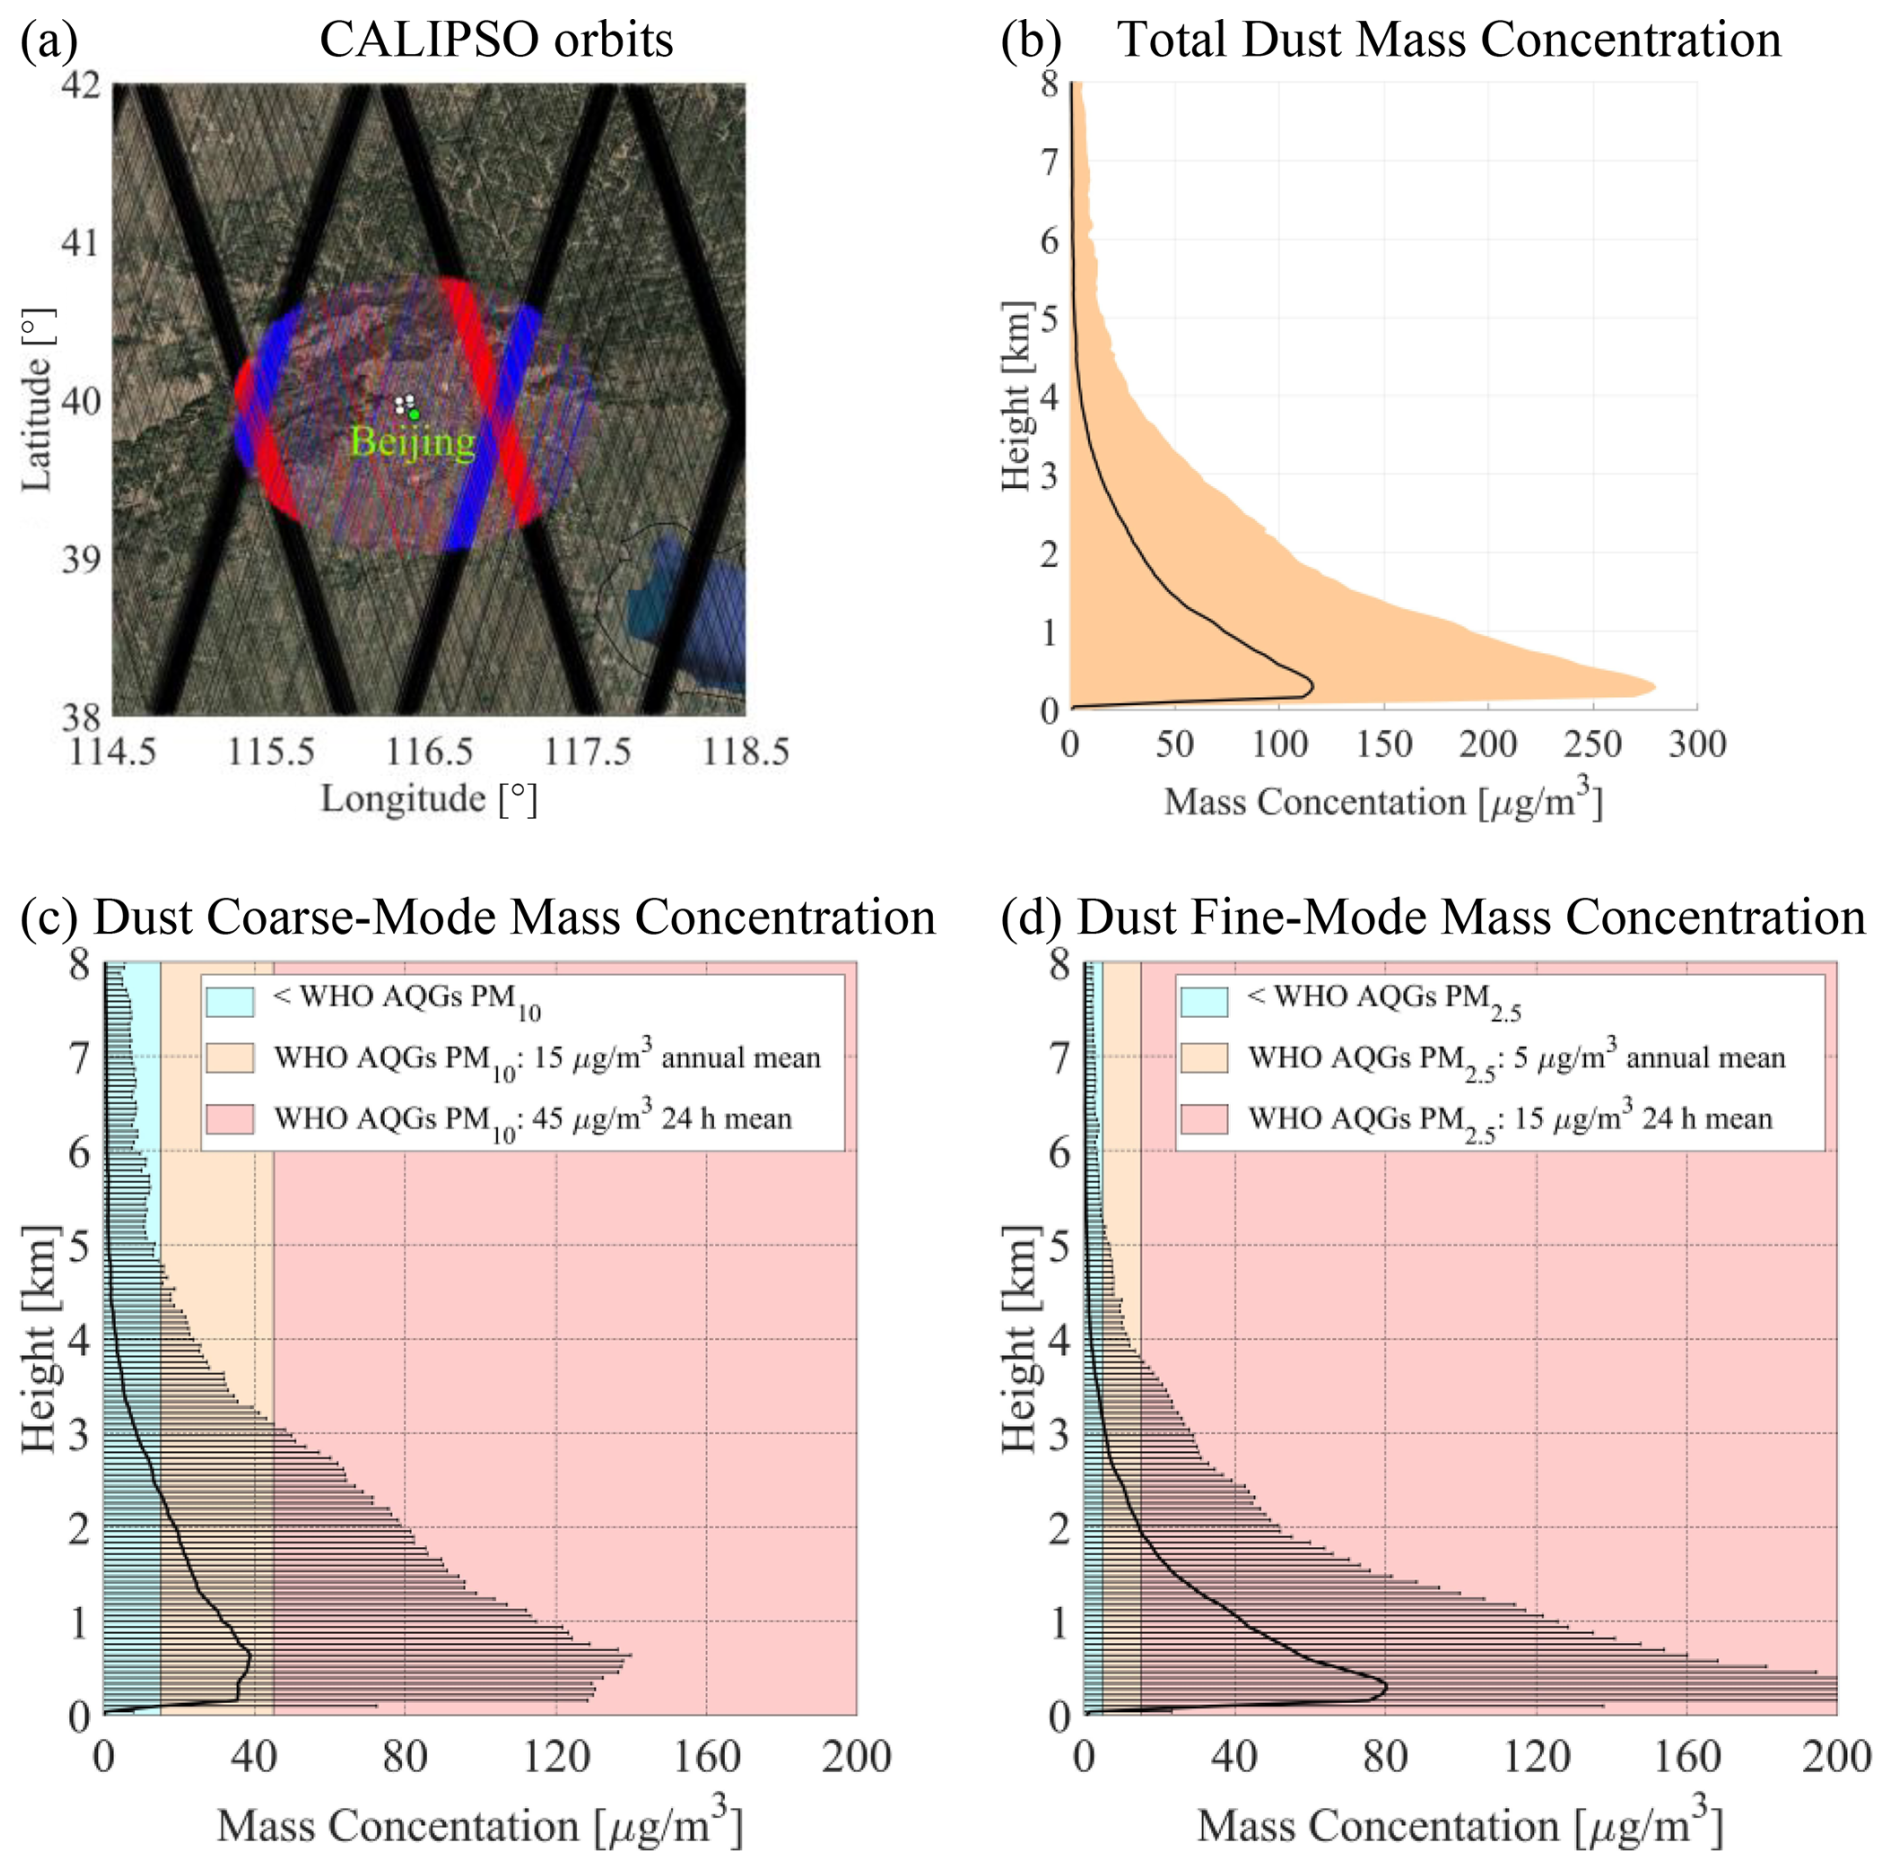
Figure 7CALIPSO daytime (red lines) and nighttime (blue lines) overpasses within 100 km distance from the Beijing megacity (a), mean mass concentration (µg m−3) profiles of dust (b), coarse-mode dust (c), and fine-mode dust (d), for the period extending between June 2006 and July 2023. The figure provides for the cases of the coarse-mode (Fig. 7c) and fine-mode (Fig. 7d) mean dust mass concentration profiles the corresponding World Health Organization (WHO) air quality guidelines (AQG) for PM10 and PM2.5 respectively, and for both the cases of 24 h-mean and annual-mean particulate matter exposure. Layer background: © Google Maps.
Second, a considerable number of large cities and megacities are located in regions characterized by persistent cloud coverage. More specifically, according to the United Nations (UN) Population Division of the Department of Economic and Social Affairs (UN, 2018a, b, 2019) fourteen out of eighty-one large cities and megacities (∼ 17.3 %) are located over the broader Indian subcontinent (e.g. Karachi, Hyderabad, Ahmedabad, Mumbai, Surat, Pune, Bengaluru, Chennai, Delhi), the Bay of Bengal (e.g. Kolkata, Dhaka, Bangkok), and the Gulf of Guinea (e.g. Lagos, Kinshasa). These regions experience extensive cloud coverage (King et al., 2013; Pincus et al., 2012, 2023) for prolonged periods of time, due to the west African monsoon circulation (Parker et al., 2005) and to Asian monsoonal activity (Dey et al., 2004; Vinoj et al., 2014). Consequently, an increased number of CALIPSO overpasses is required to enhance the statistical representativeness of the EO-based fine-mode and coarse-mode atmospheric dust CDR, mitigating data gaps caused by cloud contamination and improving the reliability of the dataset. To achieve this, the L3 CDR is processed at a different temporal resolution, transitioning from a monthly-mean to seasonal-mean representation of backscatter coefficient at 532 nm, extinction coefficient at 532 nm, and mass concentration profiling of the atmosphere. These profiles are seasonally grouped into December–January–February (DJF), March–April–May (MAM), June–July–August (JJA), and September–October–November (SON), covering the period from December 2006 to November 2022, thus encompassing 16 full years of CALIPSO observations.
It should be emphasized that the broad size distribution of mineral dust particles suspended in the atmosphere, ranging from less than 0.1 µm to more than 100 µm in diameter (Mahowald et al., 2014; Weinzierl et al., 2017; van der Does et al., 2018; Ryder et al., 2018, 2019), results into frequent inconsistencies in terms of terminology of dust size classes. The general consensus is that the classification has to follow the distinct fine-mode and coarse-mode classes apparent in the size distribution of airborne dust (Seinfeld and Pandis, 2006; Whitby, 1978). However, substantial discrepancies exist in the adopted boundary separating the two modes (Adebiyi et al., 2023), with frequent applied classification diameters including 1 µm (Mahowald et al., 2014; Mamouri and Ansmann, 2014, 2017; Ansmann et al., 2017), 2 µm (Spurny, 1998; Whitby, 1978; Willeke and Whitby, 1975), 2.5 µm (Seinfeld and Pandis, 2006; Zhang et al., 2013; Pérez García-Pando et al., 2016), 4 µm (Rajot et al., 2008), and 5 µm (Kok et al., 2017; Adebiyi and Kok, 2020). The applied separating diameter of 1 µm in the EO-based dust CDR follows the parametrizations provided by the extensive chamber laboratory experiments performed by Sakai et al. (2010) and Järvinen et al. (2016), defining the fine-mode as the submicrometer-mode (including the Aitken and accumulation subclasses) and the coarse-mode as the supermicrometer-mode (including the coarse, super-coarse, and giant dust subclasses). The available parametrization constrain of 1 µm diameter decoupling the dust fine and coarse-modes in terms of EOs results in inconsistencies in terms of available WHO AQG, applying separating diameter of 2.5 µm in the definition of PM2.5 and PM10 classes. Thus, in absence of WHO AQG provided for PM1.0 as separating diameter between the two dominant dust modes, the present study considers the annual-mean and 24 h mean PM2.5 and PM10 thresholds for the EO-based fine-mode dust and coarse-mode dust classes.
Figure 8 shows the total (first row), coarse-mode (second row), and fine-mode (third row) dust in terms of seasonal-mean extinction coefficient at 532 nm (left column) and seasonal-mean mass concentration profiles (right column), for the period December 2006–November 2022 and for the Beijing megacity of China. In addition, the shown black line indicates the seasonal-mean PBL height as provided by the ECMWF ERA5 while the white cycles in the dust extinction coefficient at 532 nm figures correspond to the PBL DOD at 532 nm for the case of the total (Fig. 8a), coarse-mode (Fig. 8c), and fine-mode (Fig. 8e) atmospheric dust. This hovmoller approach of time evolution of mass concentration vertical distribution analysis allows several interesting characteristics of atmospheric dust to be revealed. For instance, for the case of the Beijing-China megacity the seasonal-mean coarse-mode and fine-mode atmospheric dust profiles reveal that the predominant dust transport within the free troposphere occurs during the MAM and JJA seasons (Husar et al., 2001; Che et al., 2014, 2015; Proestakis et al., 2019). This phenomenon aligns with the activation of the major natural dust emission sources located to the west of Beijing, including the Taklimakan Desert encompassed by the Tarim Basin and the vast Gobi Desert spanning across northern China and southern Mongolia (Zhang et al., 1997). The dust emissions are driven by the region's favorably topography allowing development of strong cyclonic systems over the Mongolian Plateau (Sun et al., 2001; Gong et al., 2006a, Liu et al., 2008a, Bory et al., 2003; Yu et al., 2008), facilitating the eastward transport of dust across the mainland China and the broader northern Pacific Ocean (Shaw, 1980; Duce et al., 1980; Uno et al., 2001; 2009; Zhang et al., 2003; Huang et al., 2008). Furthermore, while the wave-like seasonality of long-range dust transport is evident in both coarse-mode and fine-mode dust profiles within the free troposphere, a more persistent presence of dust is observed within the PBL, particularly in the fine-mode component of dust. This finding supports the hypothesis of a substantial additional anthropogenic dust contribution to the total atmospheric dust load (Penner et al., 1994; Tegen and Fung, 1995; Ginoux et al., 2012), attributed to extensive industrial and human activities (Moulin and Chiapello, 2006; Chen et al., 2018, Ginoux et al., 2012, Tegen et al., 1996). The timeseries of seasonal coarse-mode and fine-mode PBL DOD at 532 nm and mean mass concentrations within the PBL facilitate addressing the core scientific questions of the study, with respect to PBL dust changes over the last two decades, the possible presence of statistically significant trends, identification of cities experiencing dust concentrations exceeding WHO AQG, and cities foreseen to exceed WHO AQG in the near-future.
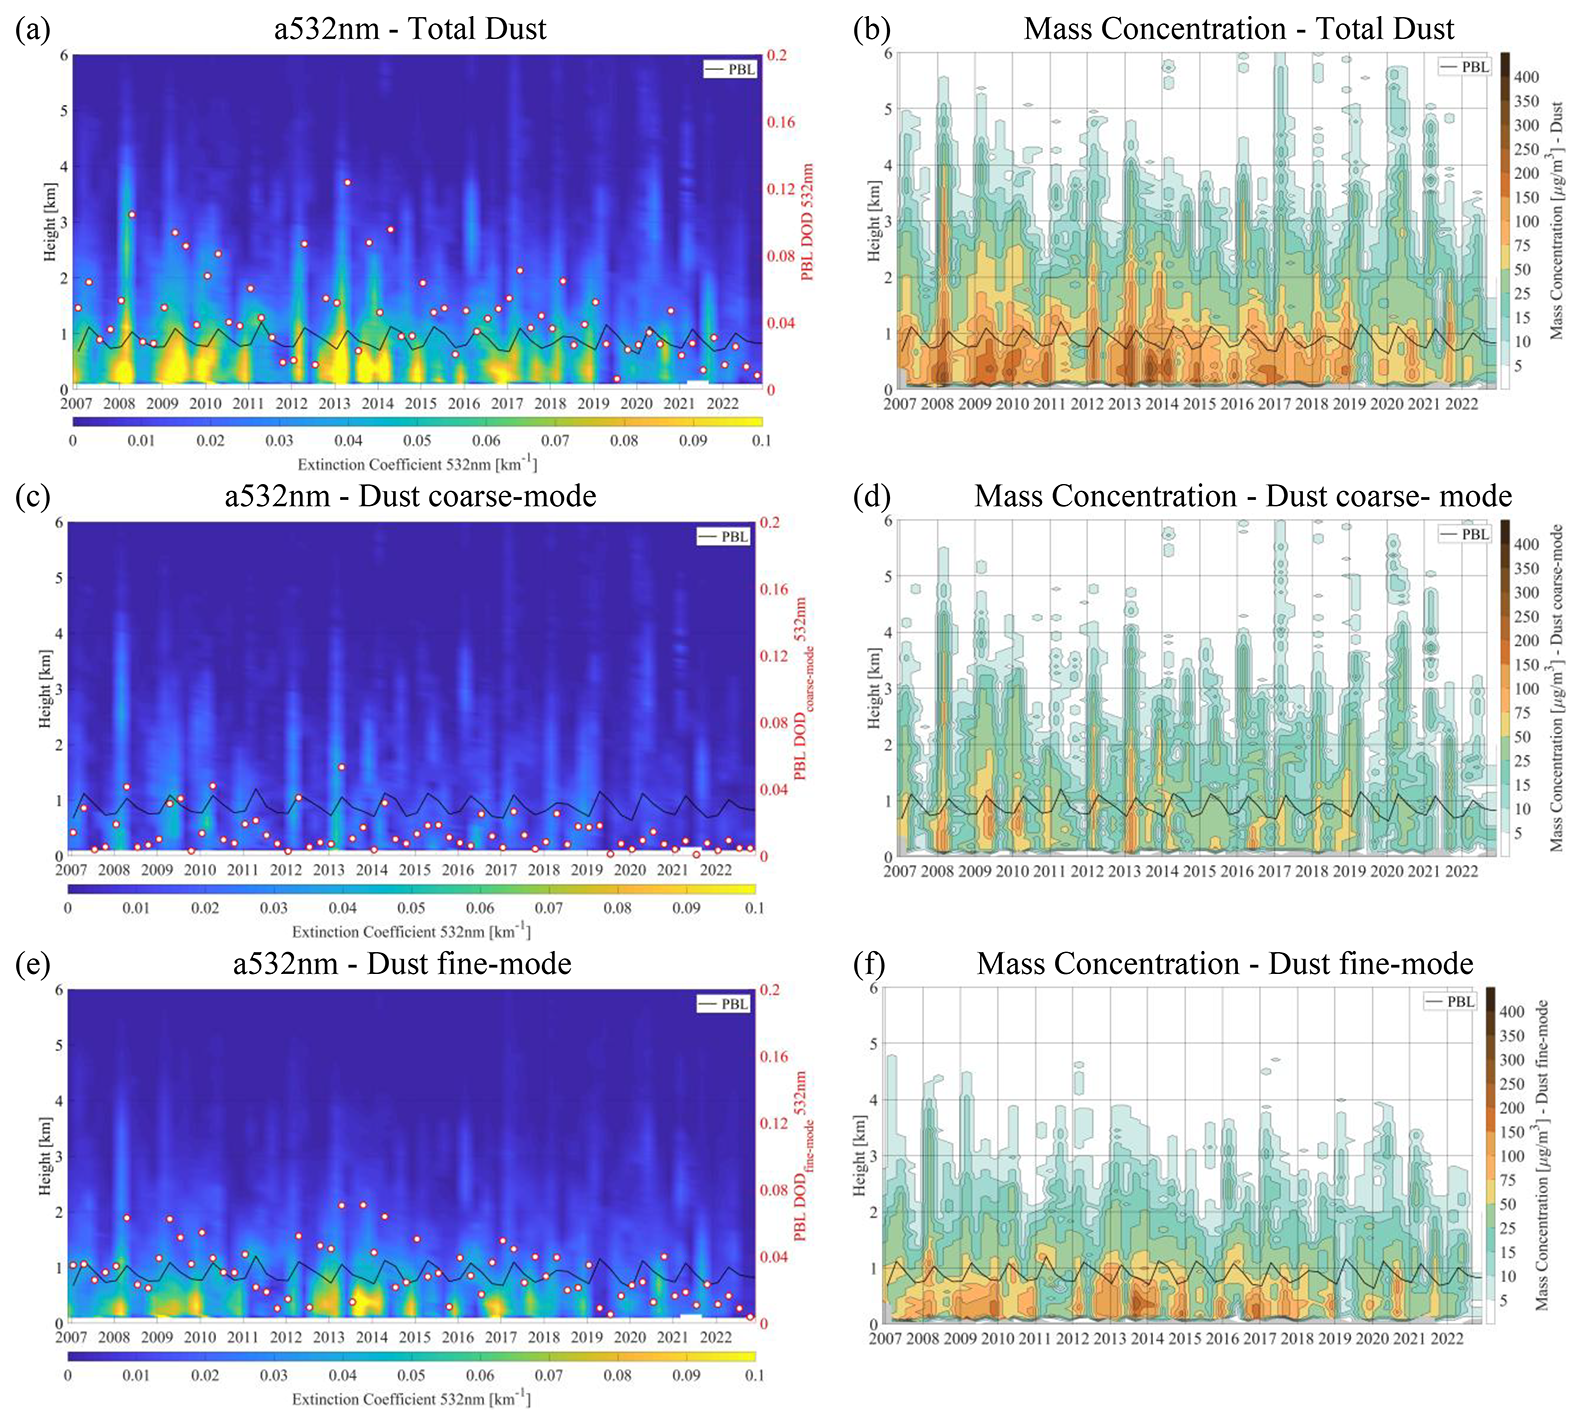
Figure 8Dust (first row), coarse-mode dust (second row), and fine-mode dust (third row) seasonal-mean extinction coefficient at 532 nm profiles (left column) and mass concentration profiles (right column) as established on the basis of CALIPSO overpasses within 100 km radius from the Beijing megacity area and for the temporal period extending between DJF/2006 and SON/2022. The black line indicates the seasonal-mean PBL height as provided by the ECMWF ERA5 while the white cycles in the dust extinction coefficient at 532 nm figures correspond to the PBL DOD at 532 nm for the case of the total (a), coarse-mode (c), and fine-mode (e) atmospheric dust.
The present section aims to provide insight into the consistency of the EO-based fine-mode and coarse-mode components of the atmospheric dust load (Sect. 2.2) to reproduce features reported by ground-based AERONET observations and products of the fine-mode and coarse-mode components of the total aerosol load (Sect. 2.1.3). Towards this objective, EO-based PBL DODfine-mode and DODcoarse-mode at 532 nm products and AERONET-based SDA AOTfine-mode and AOTcoarse-mode at 500 nm are compared. Prior to the intercomparison, the observational quality-assured datasets are pre-processed/aggregated into seasonal mean temporal resolution, covering the period extending between winter 2006 (DJF/2006) and autumn 2022 (SON/2022). The intercomparison is performed for the large-cities/megacities of the world where AERONET observations cover at least half of the EO-based period in terms of observations (> 7 years), allowing for more robust consistency assessment.
As indicative case of the intercomparison, the megacity of Beijing-China is presented and discussed. More specifically, Fig. 9 illustrates the seasonal-mean EO-based PBL DODcoarse-mode (Fig. 9a) and DODfine-mode (Fig. 9b) at 532 nm products based on CALIPSO overpasses within a 100 km radius of the Beijing-China megacity. As expected, the magnitude of DODcoarse-mode variation exhibits seasonal dependence, with higher values typically recorded during MAM and JJA, coinciding with the high seasonality of dust aerosol generation and transport related to activation of the Taklimakan and Gobi deserts (Husar et al., 2001; Liu et al., 2008b; Uno et al., 2009; Proestakis et al., 2018). The observed trends indicate a statistically significant change in both coarse-mode and fine-mode optical depth of dust within the PBL over the period December 2006–November 2022. Linear regression analysis yields slopes of −0.0007 and −0.0015 yr−1 for the coarse-mode and fine-mode of dust, respectively. The intercept values of 0.0196 and 0.0427 suggest the baseline DODcoarse-mode and DODfine-mode levels at the beginning of the study period (DJF/2006). The statistical significance of the apparent negative trends computed at the significance level of 5 % (both positive in the case of Beijing megacity) confirms whether the observed changes are robust and unlikely to be due to random variability. The significant decreasing trends reported in our study are consistent with the spatiotemporal variations in dust emissions and transport over East Asia and China as documented in the literature. More specifically, a well-documented decline in the overall frequency of moderate dust events and severe dust events, originating from the dust sources of Taklimakan Desert (Tarim Basin), the Gurbantünggüt Desert (Junggar Basin), the Turpan Basin, and the Gobi Desert, since the late 1970s has been documented (Gong et al., 2006b; Zhang et al., 2006; Wu et al., 2018). The observed decline in natural dust activity over East Asia in recent years (Proestakis et al., 2018; Yu et al., 2020) is primarily attributed to a reduction in strong wind days (Wu et al., 2022; Zhou et al., 2024), which has been identified as the dominant factor contributing to lower dust emissions. The weakening of surface winds has been closely linked to large-scale atmospheric circulation changes, including the Arctic Oscillation and North Atlantic Oscillation weakening the East Asian trough and Siberian High (Gong et al., 2006a; Wang et al., 2023) and the amplification of Arctic warming leading to weakening of the Polar Vortex (An et al., 2018; Gong et al., 2006a; Zhang et al., 2006; Liu et al., 2020; Wu et al., 2022), weakening dust emissions and decreasing the frequency of sand and dust storms in the broader East Asia region (Zou and Zhai, 2004; An et al., 2018; Fan et al., 2014; Liu et al., 2020; Wu et al., 2022). In addition, increased precipitation and soil moisture, along with rising vegetation coverage and leaf area index, have also played a significant role in suppressing dust emissions over arid and semiarid regions by stabilizing surface soils (Shi et al., 2007; Peng and Zhou, 2017; Kraaijenbrink et al., 2021; Zhou et al., 2024).
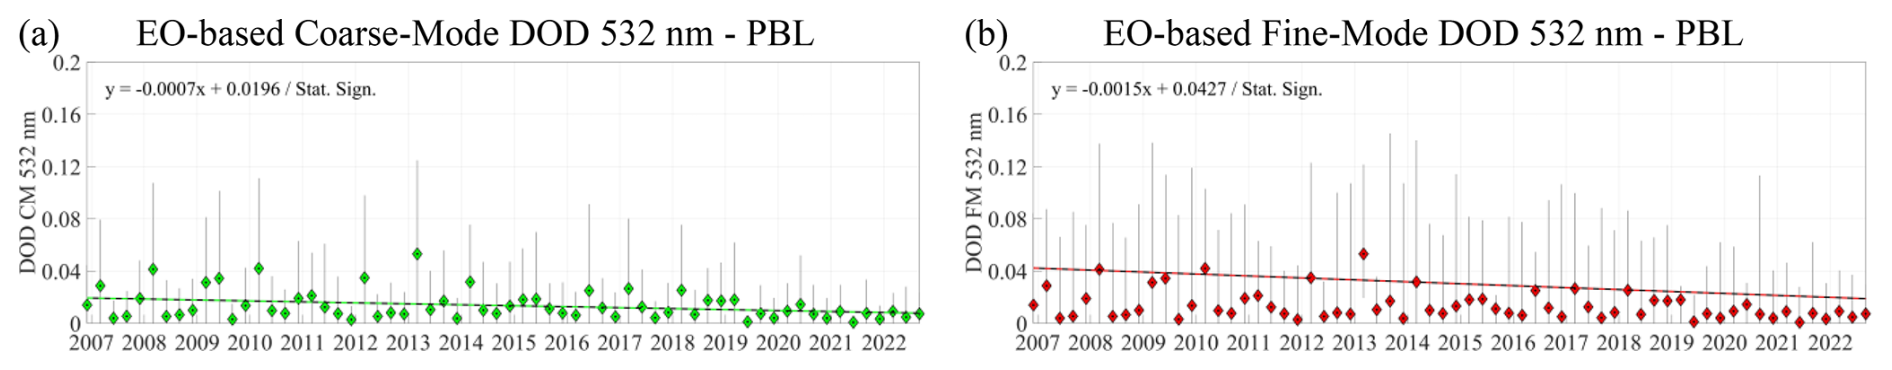
Figure 9EO-based seasonal-mean PBL coarse-mode DOD at 532 nm (a) and fine-mode DOD at 532 nm (b) and reported trends, computed on the basis of CALIPSO overpasses within 100 km radius from the Beijing megacity area and for the temporal period extending between DJF/2006 and SON/2022.
The statistically significant negative trends of EO-based PBL DODcoarse-mode and DODfine-mode at 532 nm over the Beijing-China megacity (Fig. 9) are consistent with the negative trends in AERONET AOTcoarse-mode and AOTfine-mode at 532 nm derived from SDA retrievals (Fig. 10) on the basis of sunphotometer measurements conducted by the Beijing, Beijing-RADI, Beijing-PKU, and Beijing-CAMS AERONET stations, operating in the proximity of the city center. The observed statistically significant negative AERONET AOT trends indicate a decline in the total aerosol load, including though both dust and non-dust aerosol load components. Moreover, the reported AERONET trends (Table 3) are in agreement with several scientific studies reporting AOD decrease over the broader eastern China region mainly after 2010 (Hsu et al., 2012; Zhao et al., 2017; Sogacheva et al., 2018; Zheng et al., 2018; Proestakis et al., 2018; Gupta et al., 2022), following a series of strict air quality regulatory control measures enforced by the Chinese government, including among others, the Air Pollution Prevention and Control Action Plan (2013–2017), the Blue Sky Protection Campaign (2018–2020), the China VI vehicle emission standards, and decrease in terms of particulate matter (PM2.5 and PM10) concentration limits.
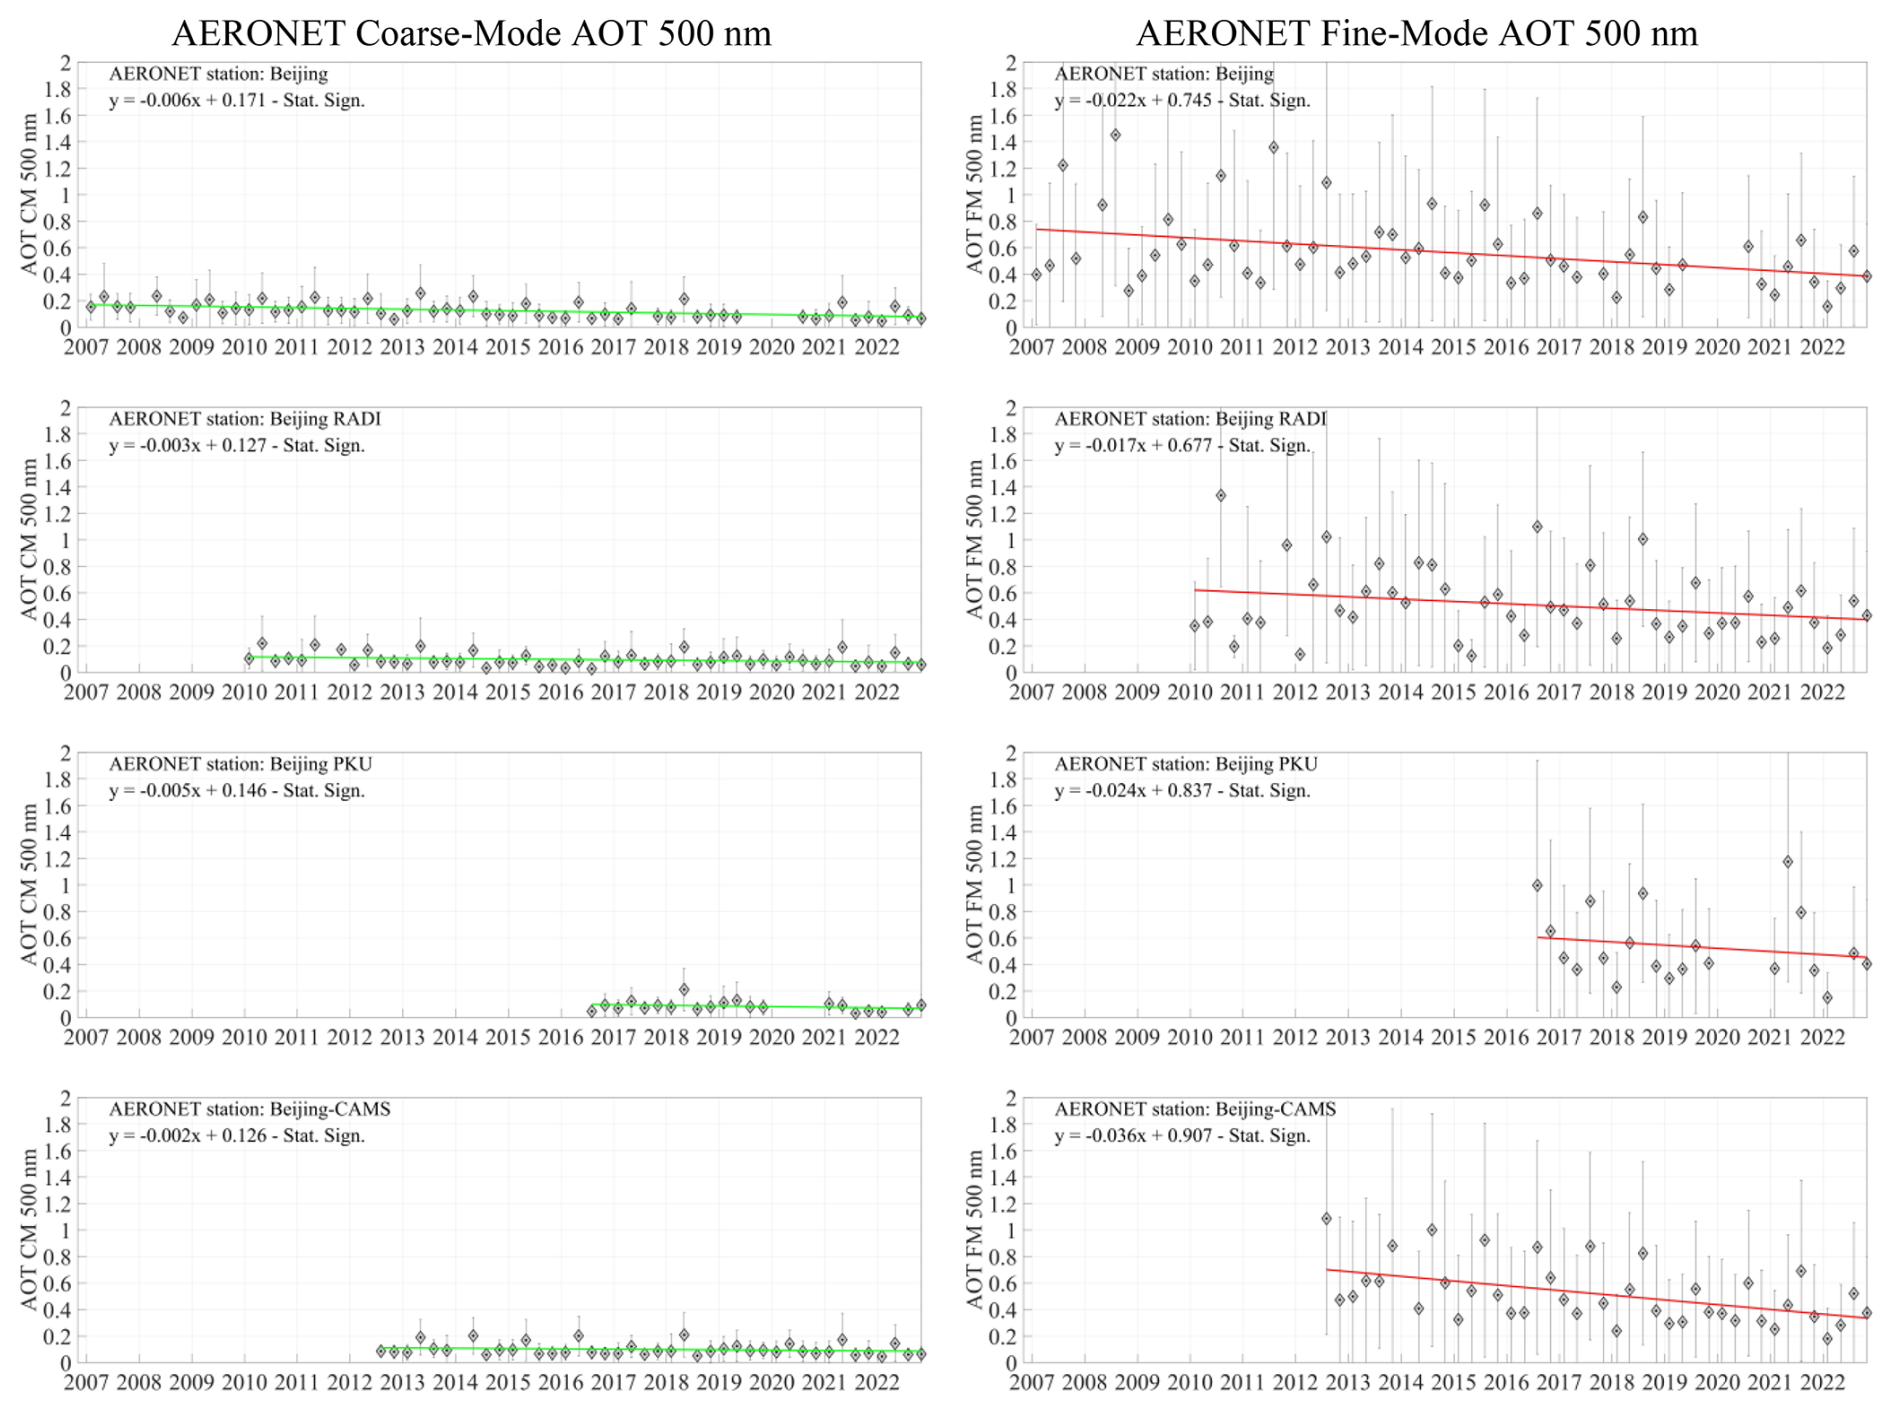
Figure 10AERONET-based SDA seasonal-mean coarse-mode AOT at 500 nm (left panel) and fine-mode AOT at 500 nm (right panel) and reported trends, for the cases of Beijing (first row), Beijing-RADI (second row), Beijing-PKU (third row), and Beijing-CAMS (fourth row) AERONET stations.
Table 3Overall tendencies of EO-based PBL fine-mode and coarse-mode DODs at 532 nm components, computed on the basis of CALIPSO overpasses within 100 km radius from the Beijing megacity area and for the temporal period extending between DJF/2006 and SON/2022, and AERONET fine-mode and coarse-mode AOTs at 500 nm for the Beijing, Beijing-RADI, Beijing-PKU, and Beijing-CAMS AERONET stations, including slope (Sfit) and intercept (Ifit) of a linear regression fit and statistical significance at 95 % confidence level.
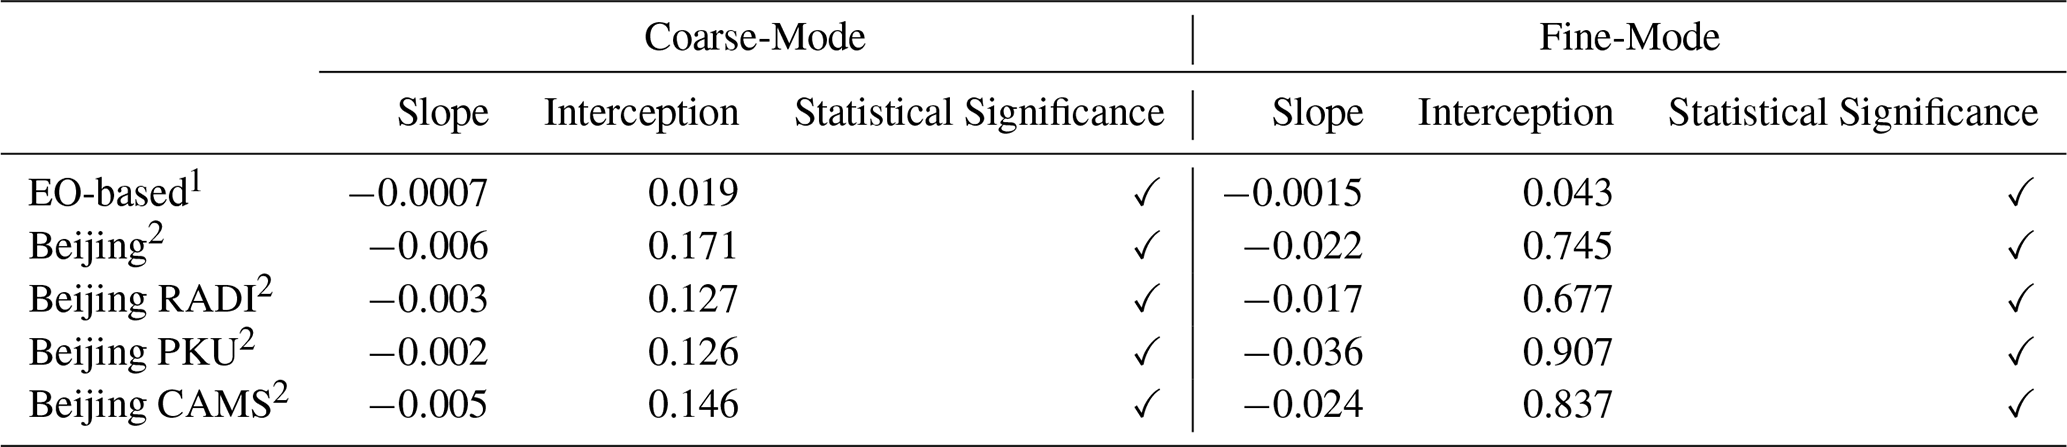
1 DOD at 523 nm, 2 AOT at 500 nm.
The intercomparison between EO-based PBL DOD products for coarse and fine-modes at 532 nm and corresponding AERONET AOT retrievals, used as reference, is crucial for enhancing the reliability and confidence in the spatial and temporal patterns observed. In addition, within the framework of the EARLINET well-established dust component separation two-step POLIPHON technique (Mamouri and Ansmann, 2014, 2017), the conversion of extinction coefficient profiles at 532 nm into dust mass concentration profiles is conducted using an assumed characteristic dust particle density (ρd) of 2.6 g cm−3 (Ansmann et al., 2012) and regional-dependent dust extinction-to-volume concentration conversion factors derived from AERONET-EARLINET synergy (Ansmann et al., 2019). Given that the EO-based PBL dust mass concentration (MC) products for fine and coarse-modes exhibit similar spatiotemporal patterns with the corresponding EO-based DOD products (Proestakis et al., 2024), the intercomparison with reference AERONET measurements and retrievals strengthens the credibility of conclusions drawn regarding dust mass concentration levels and their temporal evolution, as in the case of large cities and megacities of the world globally. Figure 11 provides the seasonal-mean EO-based PBL dust mass concentration for coarse-mode (Fig. 11a) and fine-mode (Fig. 11b) aerosols over the Beijing-China megacity, derived from CALIPSO observations within a 100 km radius and spanning the period from DJF 2006 to SON 2022. The shaded areas in both subfigures represent the WHO annual mean AQG thresholds for PM10 (15 µg m−3; coarse-mode proxy) and PM2.5 (5 µg m−3; fine-mode proxy), providing a benchmark for evaluating the severity of dust exposure. In both cases of coarse-mode and fine-mode dust mass concentration, the long-term mean exceeds the WHO-recommended air quality thresholds, with values as high as 24.1 ± 23.9 and 61.9 ± 35.7 µg m−3, respectively. The observed trends indicate a statistically significant negative (decreasing) change in both coarse-mode and fine-mode load of dust within the PBL – in terms of mass concentration – over the period December 2006–November 2022. Linear regression analysis yields slopes of −1.8 and −2.7 µg m−3 yr−1 for the coarse-mode and fine-mode of dust, respectively. The intercept values of 48.6 µg m−3 and 84 µg m−3 suggest the baseline PBL MCcoarse-mode and MCfine-mode levels at the beginning of the study period (DJF/2006) over Beijing. The statistical significance of the apparent negative trends computed at the significance level of 5 % (both positive in the case of Beijing megacity) confirms whether the observed changes are robust and unlikely to be due to random variability.
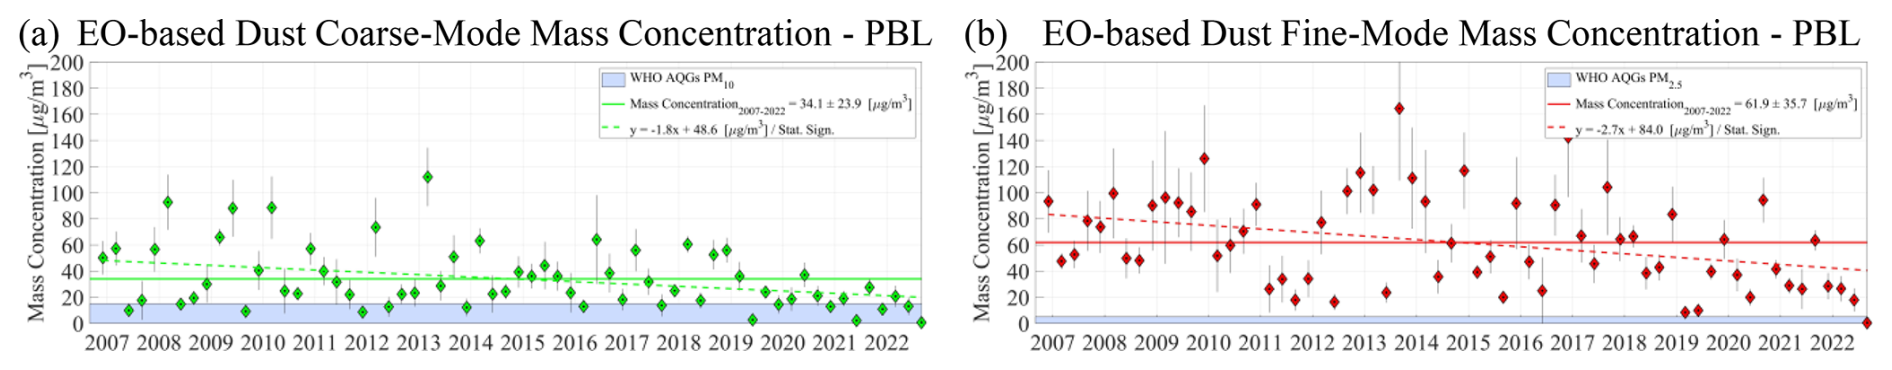
Figure 11EO-based seasonal-mean PBL coarse-mode dust mass concentration (a) and fine-mode dust mass concentration (b) and reported trends, computed on the basis of CALIPSO overpasses within 100 km radius from the Beijing megacity area and for the temporal period extending between DJF/2006 and SON/2022. The shaded areas denote the WHO AQG for PM10 (a) and PM2.5 (b) in terms of annual-mean particulate matter exposure.
Expanding the analysis to the entire dataset of the world's large cities and megacities yields insight into the spatial and temporal patterns observed over the highly urbanized and industrialized areas at a global scale. Towards this objective, Fig. 12a illustrates the geographical distribution of large cities and megacities of the world with available long-term (more than 6 years) AERONET fine-mode AOT at 500 nm product (in total 34 cases) used in the present assessment analysis. More specifically, the figure provides a global map displaying the spatial distribution of EO-based fine-mode DOD at 532 nm, overlaid with the locations of the cities where analysis of trend's intercomparison is feasible. The color of each city location signifies the level of agreement between the EO-based and AERONET trends, where locations shown in green (red) color indicate cases in agreement (disagreement) regarding the direction of fine-mode aerosol trends provided by satellite remote sensing observations and ground-based measurements. According to the intercomparison, a positive linear correlation of the derived trends is observed (R = 0.47) accompanied by low mean absolute bias (MBE = 0.004 yr−1). Figure 12b summarizes the available for the assessment cases, comparing the EO-based PBL fine-mode DOD at 532 nm (y-axis) with the AERONET fine-mode AOT at 500 nm trends (x-axis). The figure is divided into four quadrants labeled (A1), (A2), (B1), and (B2), which classify the trends into positive and negative categories. The first quadrant (A2) represents cities where both trends are positive, suggesting increasing fine-mode aerosols, while the third quadrant (B1) represents cities where both trends are negative, indicative of decreasing fine-mode aerosols. The second (A1) and fourth (B2) quadrants correspond to mixed trend behavior, where one observational dataset shows an increasing trend while the other shows a decreasing trend. Figure 12c is a confusion matrix summarizing the level of agreement between the two observational datasets, the EO-based fine-mode DOD at 532 nm trends and the AERONET-based fine-mode AOT at 500 nm trends. The matrix is divided into four domains corresponding to the scatter plot quadrants (Fig. 12b), with each region showing the number of cases in that specific quadrant and their percentage of the total. The total accuracy (TA) of the trends characterized by identical sign is quantified to ∼ 61.8 %, computed as the sum of B1 and A2 quadrants to the total number of cases. According to the assessment, the majority of the data points (52.9 %) fall in the third quadrant (B1), indicating a prevalent decreasing trend in fine-mode aerosols across both datasets. The first quadrant (A2) has 8.8 % of the sites showing agreement on increasing trends. The remaining quadrants (A1) and (B2) contain 38.2 % of the total cases, highlighting instances where trends are less consistent between the two datasets.
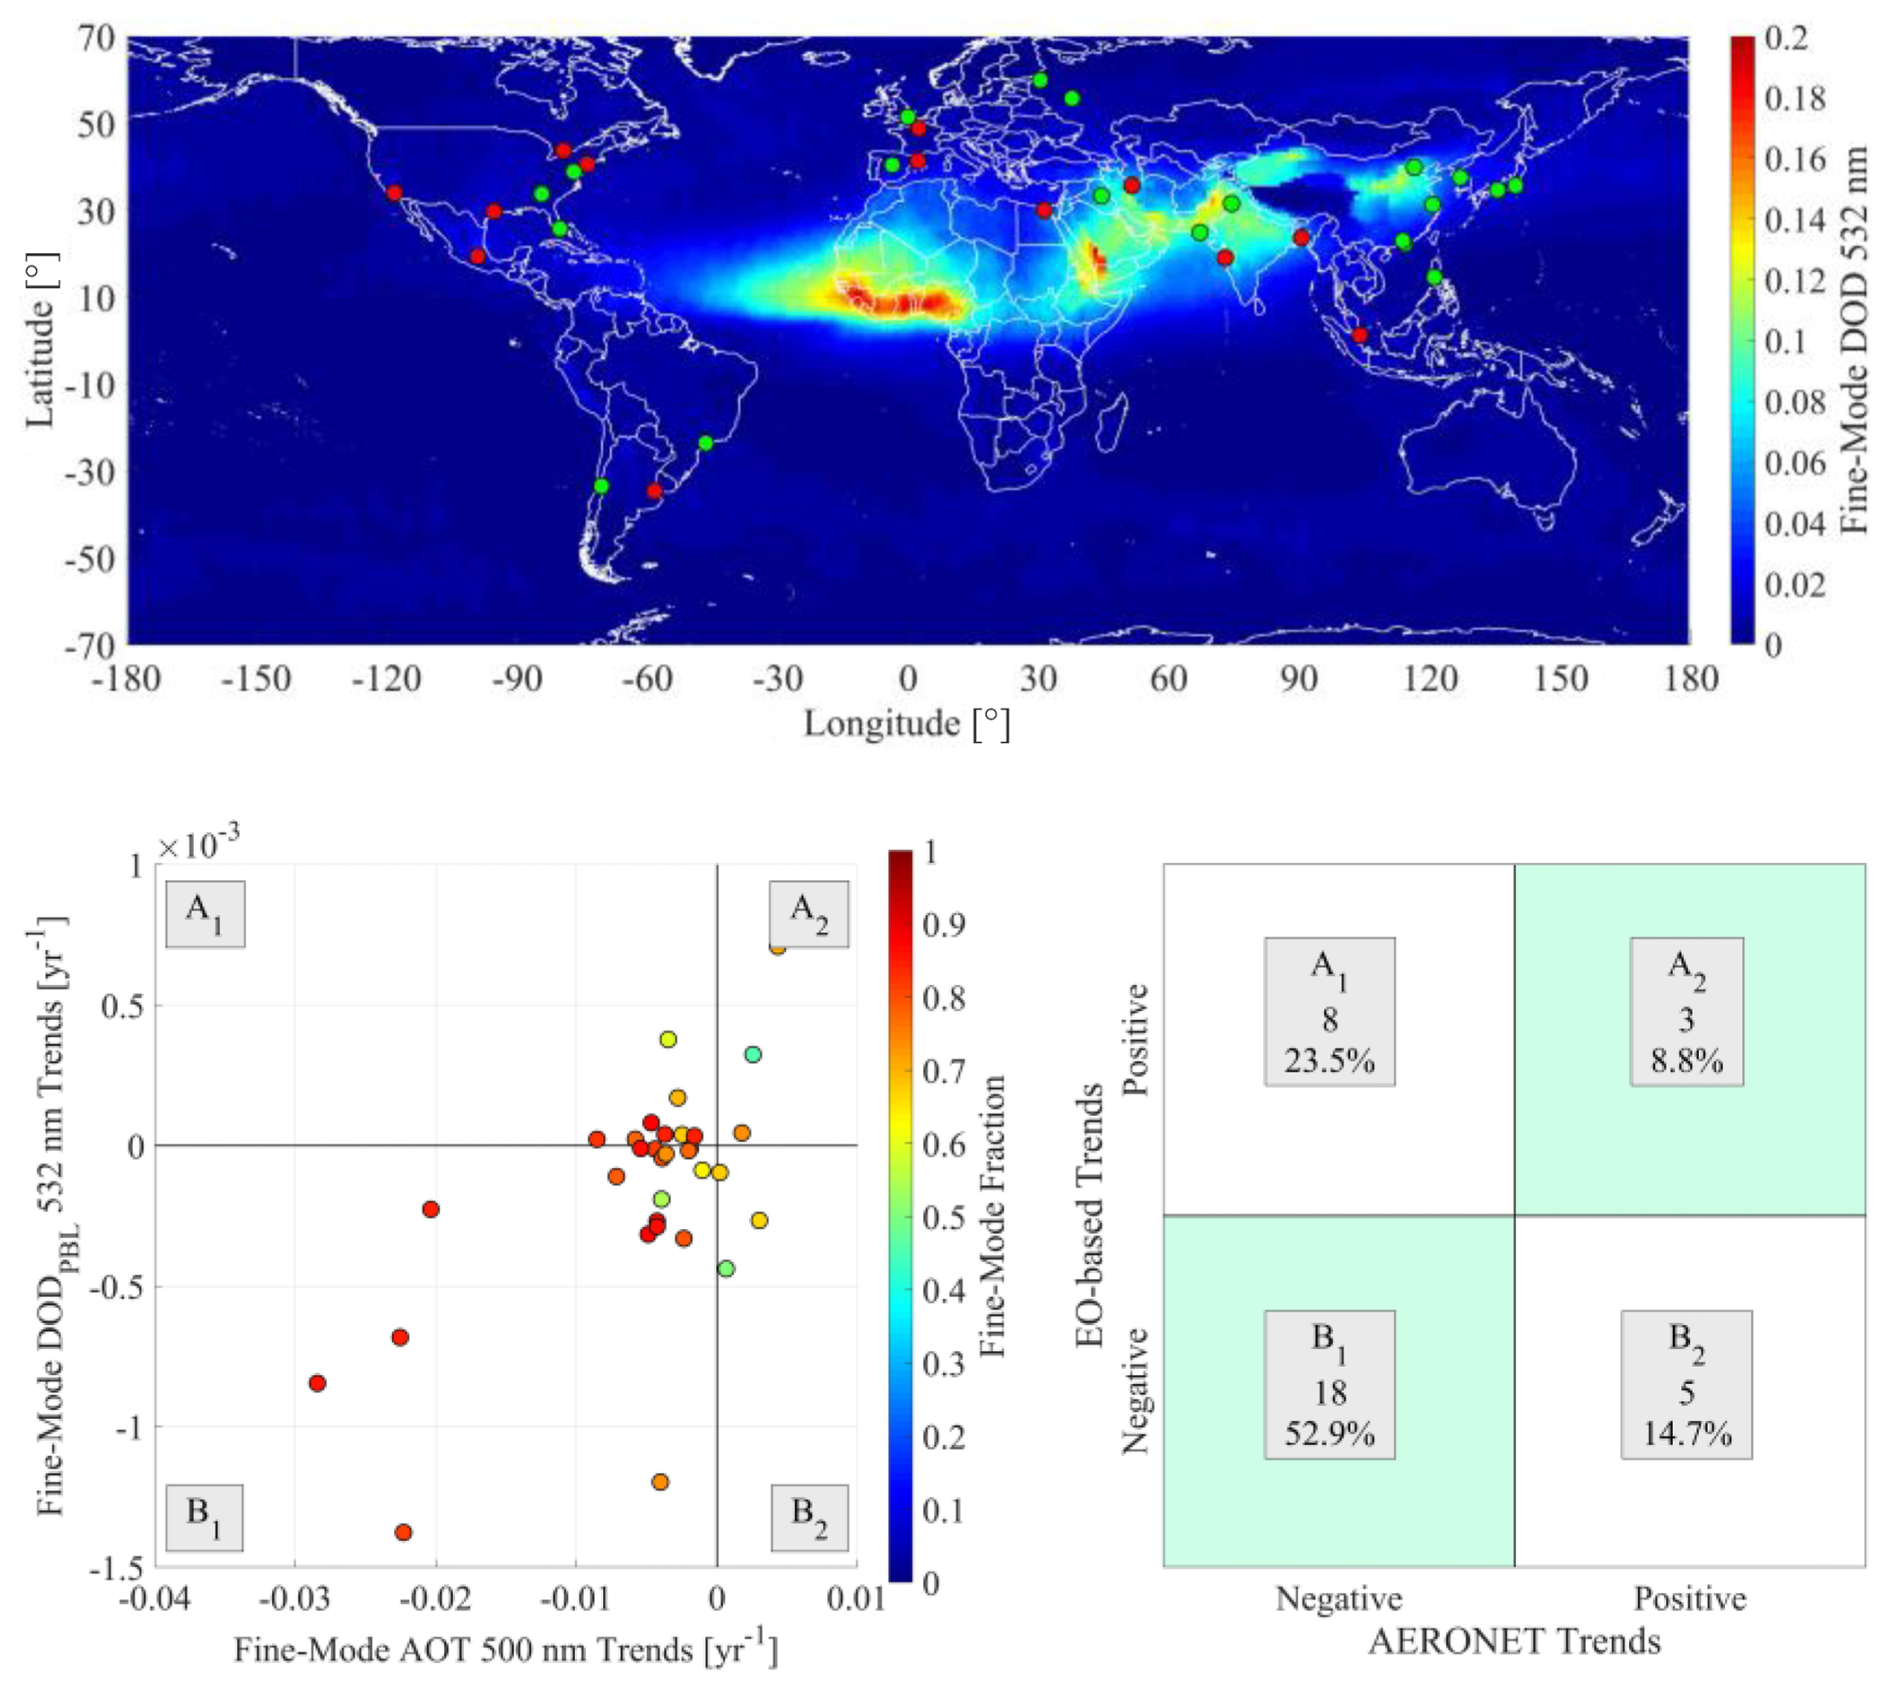
Figure 12Geographical location of the large cities of the world for which both EO-based temporal trends of fine-mode PBL DOD at 532 nm and AERONET-based temporal trends of fine-mode AOT at 500 nm are calculated (upper panel). Green and red dots denote world-cities with similar and different trend signs, respectively. Scatter plot between EO-based temporal trends of fine-mode PBL DOD at 532 nm and AERONET-based temporal trends of fine-mode AOT at 500 nm (lower left). The color bar indicates the AERONET fine-mode fraction. Confusion matrix of possible trend signs among the two datasets (lower right).
Overall, this statistical analysis of the apparent trends between the CALIPSO-based PBL DODfine-mode at 532 nm product and the AERONET AOTfine-mode at 500 nm retrievals, emphasizing the degree of agreement between different observational datasets. The clustering of the majority of the data in the lower left quadrant suggests a general decline in fine-mode aerosols, which could be attributed in addition to regional meteorological conditions to regulatory measures and enforced policies aiming to reduce anthropogenic emissions in urban and highly industrialized areas and to mitigate aerosol-related induced disorders on human health (Jin et al., 2016; Turnock et al., 2016; WHO, 2016; UNEP, 2016; Zhao et al., 2017; Zheng et al., 2018; Sogacheva et al., 2018; Abera et al., 2021; Ganguly et al., 2020; Gao et al., 2021; Gupta et al., 2022). It is important though to emphasize that the present intercomparison serves as an indirect consistency assessment between the CALIPSO-based PBL DODfine-mode at 532 nm product and AERONET AOTfine-mode at 500 nm retrievals, respectively. The analysis does not constitute a direct validation or an evaluation process for several reasons, primarily due to the fundamental distinction that the two datasets represent different physical quantities. More specifically, AERONET measurements and retrievals (AOT, AOTcoarse-mode, and AOTfine-mode) provide information on the total aerosol load in terms of column-integrated optical properties at 500 nm, especially during daytime illumination conditions, spanning the entire atmospheric column from the Earth's surface to the top of the atmosphere. In contrast, the satellite-based derived products (DOD, DODcoarse-mode, and DODfine-mode) represent the column-integrated mean extinction coefficient at 532 nm obtained during both daytime and nighttime, characterizing the supermicrometer and submicrometer components of atmospheric dust, within the planetary boundary layer from the Earth's surface to the PBL height. Consequently, due to the spatiotemporal inhomogeneity of aerosol fields, especially due to the mesoscale variability of aerosol residing within the lower troposphere, CALIOP and AERONET rarely sample the same air volumes (Pappalardo et al., 2010; Schuster et al., 2012). These fundamental differences between the intercomparison datasets, as extensively discussed in Proestakis et al. (2024), additional discrepancies between the coarse-mode and fine-mode of EO-based PBL DODs and AERONET AOTs arise from various factors, as extensively discussed in Proestakis et al. (2024). Discrepancies related to the distinct characteristics of CALIOP (Hunt et al., 2009; Winker et al., 2009) and sunphotometer measurements (Holben et al., 1998), discrepancies due to the retrieval algorithms of AEROET (Eck et al., 1999; O'Neill et al., 2001a, b, 2003) and EO-based products (Vaughan et al., 2009; Kim et al., 2018; Kar et al., 2019; Vaughan et al., 2019; Zeng et al., 2019), the applied quality assurance criteria (Marinou et al., 2017; Tackett et al., 2018), and the dust decoupling technique (Shimizu et al., 2004; Mamouri and Ansmann, 2014, 2017; Tesche et al., 2009).
The present section aims to address the scientific questions: which urban areas experience fine-mode and coarse-mode dust mass concentrations within the PBL exceeding WHO AQG and is it feasible to identify statistically significant trends? Identifying large cities and megacities where PBL dust PM2.5 and PM10 concentrations exceed WHO AQG enhances the necessary baseline for environmental health risk assessments, since such information is critical for implementing targeted mitigation strategies, for public health interventions, and for both climate modeling and air quality management. Moreover, addressing the question of statistically significant trends presence in dust concentration changes during the past decades is equally important since it enhances the potential to provide essential information whether conditions are changing over time, allowing policymakers to assess whether dust-related air quality is improving, deteriorating, or remaining stable, particularly in the context of desertification, urbanization, shifting weather patterns, and under the ongoing climate change.
To date, towards addressing these scientific questions numerous dust model-based and EO-based studies have investigated the long-term spatial and temporal variability and the tendencies of the atmospheric dust load, from local to planetary scales. Logothetis et al. (2021) studied the long-term variability of dust optical depth (DOD) over a 15-year period (2003–2017), using the MIDAS satellite dataset (Gkikas et al., 2021, 2022). Their findings indicate positive trends over the Arabian Peninsula and western Sahara, while declining tendencies were observed in the eastern Sahara, the Mediterranean, the Thar Desert and eastern China. Declining DOD trends in East Asia were also reported by Zhao et al. (2023) (2007–2019) and Zhao et al. (2024) (2007–2021), based on CAMS numerical products. These findings were consistent with those of Korras-Carraca et al. (2021), who processed the MERRA-2 aerosol products (2001–2019) and of Proestakis et al. (2018) who performed analysis on long-term CALIOP observations. The reduction in dust loads' intensity in East Asia over recent decades (since 2000) is further supported by Shin et al. (2023), who reported the predominance of negative trends in major Chinese, Korean and Japanese cities where AERONET sun-photometers are in operation. Recent studies (Wang et al., 2021; Wang et al., 2021; Du et al., 2023) have also reported a weakening of dust activity in deserts and desertified areas across the broader region, resulting in a reduced atmospheric dust burden. Ouma et al. (2024) showed that particulate matter with an aerodynamic diameter up to 2.5 µm (PM2.5), as simulated in the MERRA-2 reanalysis, exhibited an increasing trend over the period 1980–2021 in Africa. This positive tendency was driven by the temporal variability of mineral particles. Across the African continent, the highest positive rates were observed in the southern, eastern and northern sectors, while almost neutral or slightly negative trends were recorded in the western and central parts, respectively. Hsu et al. (2012), relying on SeaWiFs observations, reported a neutral AOD trend in the western Sahara and a weak increasing tendency in the eastern Sahara, over a period spanning from 1997 to 2010.
Notable positive AOD tendencies have been reported by Klingmüller et al. (2016) in dust-rich areas of the Arabian Peninsula between 2000 and 2015, based on MODIS observations. Notaro et al. (2015) demonstrated a strong contrast in dust optical depth (DOD) anomalies over Saudi Arabia between the periods 1998–2005 and 2007–2013, with negative and positive anomalies, respectively. These patterns were linked to drought conditions in the Fertile Crescent. The predominance of increasing AODs in most parts of the Arabian Peninsula has also been discussed by Che et al. (2019), who relied on both reanalysis (MERRA-2) and satellite (MODIS) aerosol products over a 16-year period (2001–2016). The upward trend of aerosol optical depth during the first decade of the 21st century has been further confirmed by several studies (Hsu et al., 2012; de Meij et al., 2012; Pozzer et al., 2015; Wei et al., 2019) relying either on numerical simulations or observations. The Mediterranean is frequently under the impact of dust outbreaks (Gkikas et al., 2016), due to its proximity to the most active deserts worldwide (Ginoux et al., 2012) and the prevailing atmospheric circulation favoring dust advection from the Sahara Desert and the Arabian Peninsula (Gkikas et al., 2015). Salvador et al. (2022) found an increase in both the frequency of occurrence and intensity of African dust outbreaks affecting the Iberian Peninsula and the Balearic Islands (1948–2020). Other satellite-based studies (de Meij et al., 2012; Hsu et al., 2012; Klingmüller et al., 2016) have shown negative DOD trends in the western Mediterranean opposite to the positive ones observed in the eastern sector during the early 21st century. This dipole pattern was not evident in Marinou et al. (2017), who demonstrated the predominance of negative DOD trends across the Mediterranean based on CALIPSO spaceborne retrievals (2007–2015). Similar findings were drawn by Logothetis et al. (2021) over an extended period (2003–2017). In the eastern Mediterranean, slightly increasing DOD trends were found during winter (2000–2017), consisting of positive trends before 2010 and negative trends thereafter (Shaheen et al., 2021). For the same region, and over a longer period (2000–2020), a similar DOD variability has been revealed for the high-dust season (April-July) over 2000–2017, followed by a neutral trend till 2020 (Shaheen et al., 2023). Aryal and Evans (2022) investigated the frequency of occurrence and the intensity of dust events in the western United States using PM measurements from the IMPROVE network (2001–2020). Their results indicate a notable decline in the frequency of high-concentration dust events during spring and summer, while low-concentration dust events have become more frequent. Additionally, the intensity of spring dust events has decreased for both high- and low-concentration cases. Tong et al. (2017), relying on the same ground-based measurements, but for an earlier period (1988–2011), demonstrated an intensification of dust activity in southwestern United States. Gassó and Torres (2019) reported a significant increase of dust activity in central Patagonia (South America) between 1964 and 2017, with an acceleration after 2007, based on both ground-based and satellite-derived observations. Finally, Che et al. (2019) reported a reduction in the total amount of dust emitted in Australia between 1980 and 2020, based on MERRA-2 simulations.
However, the assessment of the long-term spatial and temporal variability and the tendencies of the atmospheric dust load with focus on the fine-mode and coarse-mode components within the PBL over densely populated and heavily industrialized urban areas of the world is characterized by significant challenges, hampering the implementation of the affirmations trends to reflect into and assess the environmental risk factor dust aerosols pose for human health. The current consensus asserts that the total atmospheric dust load is the cumulative result of natural dust and anthropogenic dust, a distinction grounded in dust sources and emission mechanisms (Penner et al., 1994; Tegen and Fung, 1995; Ginoux et al., 2012). Natural dust entrainment into the atmosphere is driven by several meteorological phenomena and physical processes, such as low-level jets (LLJs; Fiedler et al., 2013), haboobs (Knippertz et al., 2007), dust devils (Koch and Renno, 2005), and pressure gradients (Klose et al., 2010), which develop primarily over arid and sparsely vegetated desert regions (Prospero et al., 2002). Anthropogenic dust originates directly or indirectly from human activities, such as transportation, infrastructure projects, and construction activities (Moulin and Chiapello, 2006; Chen et al., 2018), soil surface degradation and modifications of terrestrial surfaces, including deforestation and overgrazing (Ginoux et al., 2012), expansion of urban areas and agricultural land management (Tegen et al., 1996). To date, several scientific studies have highlighted that the anthropogenic dust contribution to the total atmospheric dust load is substantial. Ginoux et al. (2012) estimated that approximately 25 % of the global atmospheric dust burden results from anthropogenic activities, a percentage that in highly urbanized, densely populated, and industrialized regions of developing nations, where rapid economic growth drives extensive land-use changes, anthropogenic dust entrainment into the atmosphere can comprise up to 70 % of the total airborne dust load (Huang et al., 2015; Chen et al., 2019). Implementation of atmospheric aerosol models usually employ static land cover classifications of dust sources with focus on arid regions (Ginoux et al., 2001), neglecting though anthropogenic dust emissions (Ginoux et al., 2012; Huang et al., 2015; Chen et al., 2019), leading to underestimations due to the missing anthropogenic dust emissions of total dust load suspended into the atmosphere over highly urbanized areas of the Earth (Proestakis et al., 2018, 2024; Papachristopoulou et al., 2022). In addition, implementation of passive remote sensing techniques to quantify the aerosol load and investigate the induced disorders on human health frequently leads to overestimations and ambiguities, due to the retrieval of the total column-integrated aerosol load and not the aerosol load specifically within the PBL (McGrath-Spangler and Denning, 2013; Luo et al., 2014). Moreover, the observational-based aerosol load in terms of optical depth frequently reports on the cumulative fine-mode and coarse-mode aerosol load and not to the distinct components, hampering the capacity to decouple the induced disorders on human health to the fine-mode and coarse-mode separately (i.e., De Longueville et al., 2010; Deroubaix et al., 2013; Katra et al., 2014; Prospero et al., 2014; Querol et al., 2019).
The EO-based CDR employed in this study leverages multiple complementary observational capabilities and methodological developments enabling to tackle these challenges (Proestakis et al., 2024). First, it utilizes the capacity of CALIOP to retrieve vertically resolved aerosol profiles (Hunt et al., 2009), which allows for accurate quantification of the aerosol load within the PBL (Zhang et al., 2006; Tsikoudi et al., 2025). Second, it exploits the distinct optical properties of non-spherical dust particles, and more specifically on the particulate depolarization ratio, for both the total dust (Gobbi et al., 2000; Sugimoto et al., 2003; Shimizu et al., 2004; Esselborn et al., 2009; Freudenthaler et al., 2009; Ansmann et al., 2011; Tesche et al., 2011; Wiegner et al., 2011; Mamouri et al., 2013; Baars et al., 2016; Veselovskii et al., 2016; Hofer et al., 2017; Filioglou et al., 2020; Floutsi et al., 2023) and the submicrometer and supermicrometer components (Sakai et al., 2010; Järvinen et al., 2016). This facilitates the application of the two-step POLIPHON algorithm (Mamouri and Ansmann, 2014, 2017), which enables the decoupling of fine- and coarse-mode dust contributions. Third, the orbital characteristics of the CALIPSO mission (Winker et al., 2010) provide the capability to monitor the four-dimensional (spatial and temporal) distribution of atmospheric dust over multi-year periods (Amiridis et al., 2013; Marinou et al., 2017; Proestakis et al., 2018).
Collectively, these elements enable an in-depth assessment of the long-term variability, spatial distribution, and temporal evolution of the fine- and coarse-mode components of atmospheric dust within the PBL over densely populated and industrialized urban areas worldwide, as discussed in the framework of the Beijing-China megacity (Fig. 11). More specifically, expanding the Beijing-China PBL fine-mode and coarse-mode dust analysis to the entire dataset of the world's large cities and megacities (UN, 2018a, 2019) yields insight into the spatial and temporal patterns observed over the highly urbanized and industrialized areas a global scale, shown in Fig. 13. The figure is organized into three rows and two columns. Each row represents a different aerosol component: the total atmospheric load of dust (top row), the coarse-mode dust (middle row), and the fine-mode of dust (bottom row). The left column shows the mean PBL mass concentration for each dust type, while the right column illustrates the corresponding temporal trends, both for the large cities and megacities of the world and on the basis of EOs over the period from December 2006 to November 2022. Cities shown in (cycle) rhombus shape indicate (non) statistically significant trends. Cities shown in rhombus shape indicate statistically significant trends.
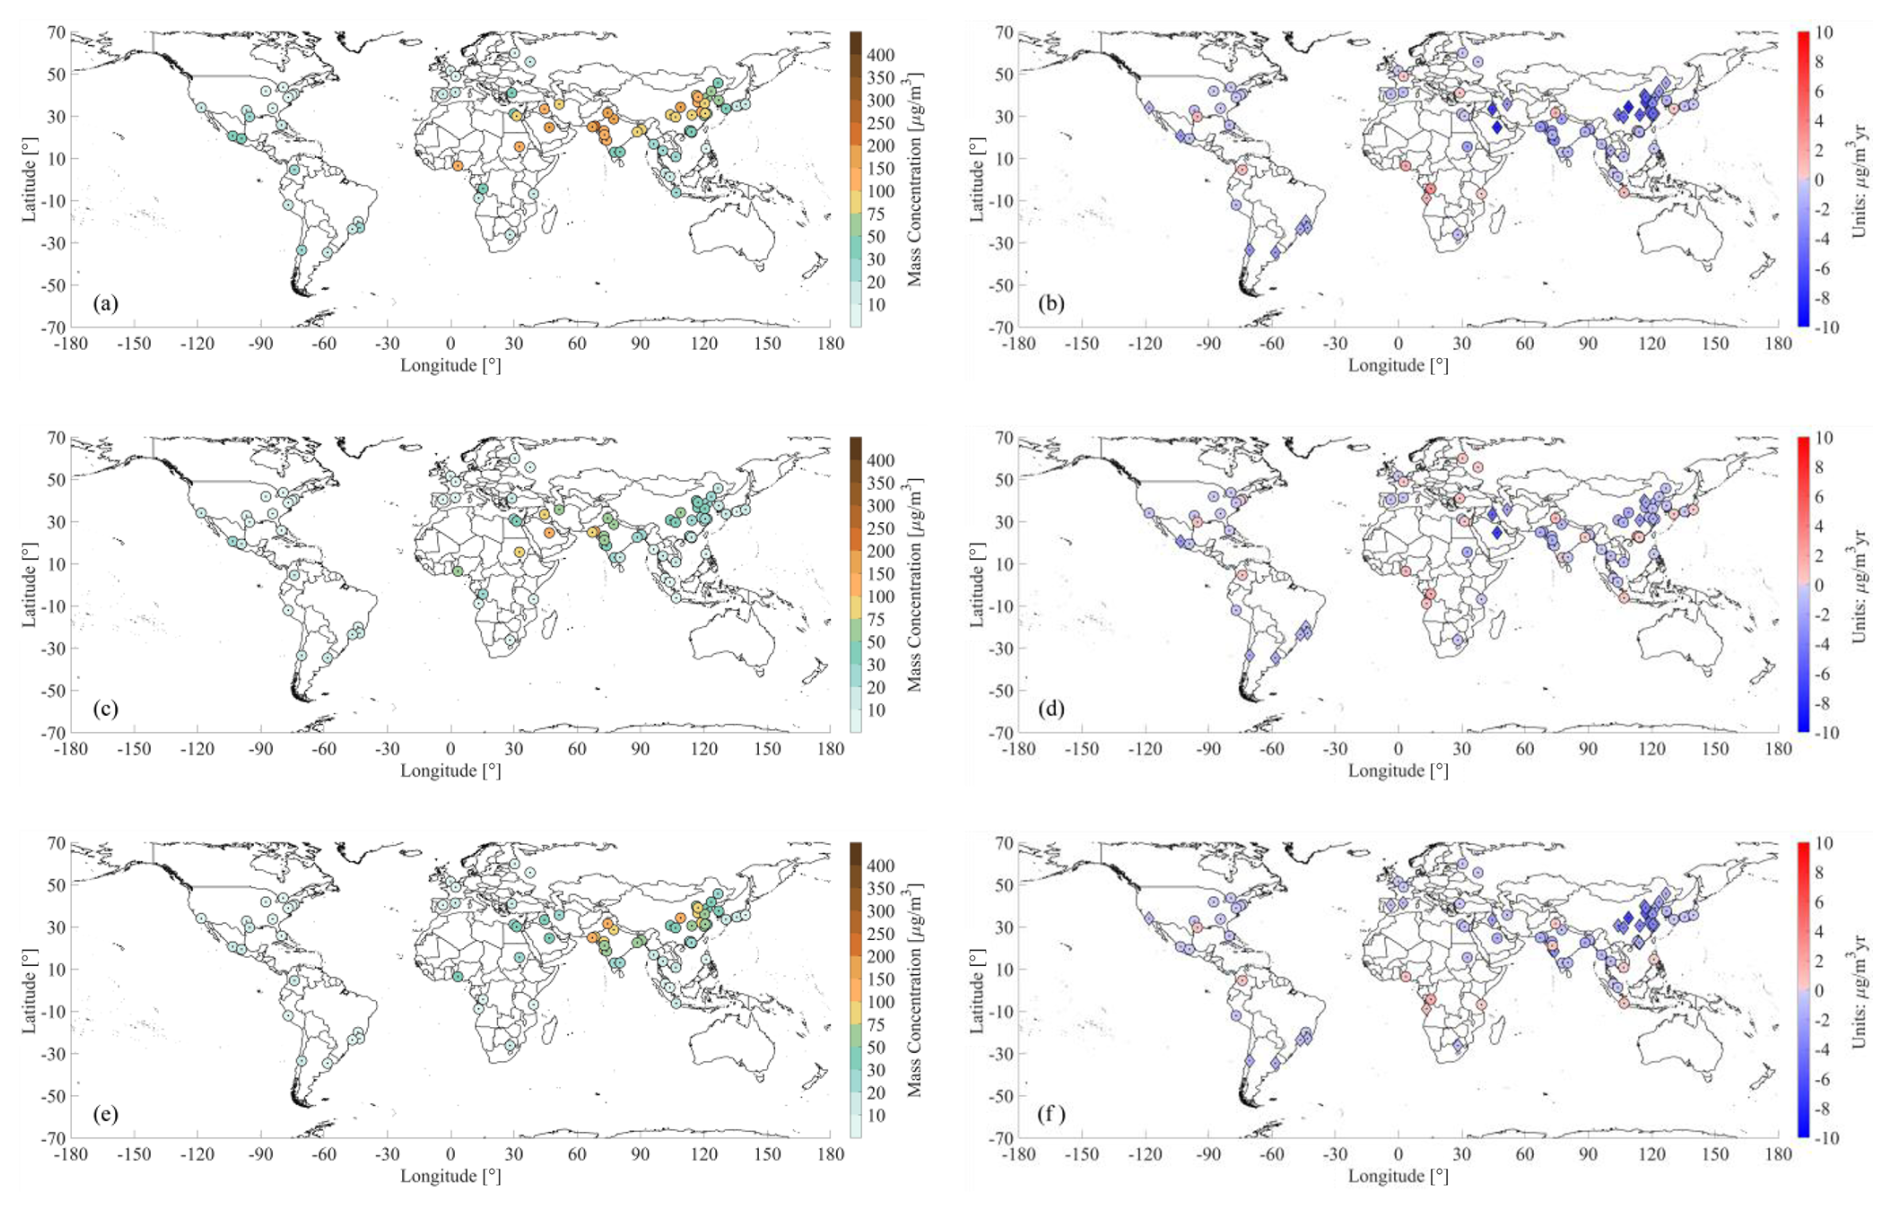
Figure 13Dust (first row), coarse-mode dust (second row), and fine-mode dust (third row) PBL mass concentration (left column) and PBL mass concentration trends (right column) as established on the basis of CALIPSO overpasses within 100 km radius from each world-city with population greater than 5 million as reported by the United Nations (UN, 2018a, 2019) and on the basis of the temporal period DJF/2006-SON/2022.
Regarding the coarse-mode fraction of dust aerosols confined within the PBL, mass concentrations in 40 out of 81 major cities and megacities worldwide (∼ 49.4 %), with populations exceeding 5 million as of 2018 (UN, 2018a, b, 2019), surpass the WHO annual mean AQG for annual mean PM10 concentrations (15 µg m−3; Table 1). The general geographical-distribution pattern is that large cities and megacities across North America, South America, South Africa, Europe, and the Indonesia/Indochina region generally exhibit relatively low coarse-mode dust concentrations within the PBL, remaining below WHO recommended AQG for annual mean PM10 thresholds. In contrast, large urban centers in the Middle East, the Indian subcontinent, East Asia, North Africa, and the Sahel-Central Africa region frequently record coarse-mode dust levels that significantly surpass these limits. The ten cities with the highest PBL-level coarse-mode dust mass concentrations include Riyadh, Saudi Arabia (149.9 ± 86.7 µg m−3), Hyderabad, India (121.2 ± 78.4 µg m−3), Baghdad, Iraq (89.9 ± 57.3 µg m−3), Khartoum, Sudan (87.7 ± 42.7 µg m−3), Karachi, Pakistan (85.9 ± 55.1 µg m−3), Xi'an, China (72.2 ± 57.2 µg m−3), Surat, India (60.3 ± 64.2 µg m−3), Ahmedabad, India (59.8 ± 58.6 µg m−3), Lagos, Nigeria (59.6 ± 84.3 µg m−3), and Delhi, India (58.2 ± 55.1 µg m−3). Collectively, these ten urban areas are home to over 105 million people, whose health is adversely impacted by elevated exposure to coarse-mode dust aerosols. An additional interesting feature is that the coarse-mode fraction of dust aerosols confined within the PBL in terms of mass concentrations, computed on the basis of EOs between December 2006 and November 2022, exhibit negative trends in 60 out of 81 major cities and megacities worldwide (∼ 74.1 %). Among cities exceeding WHO AQG for PM10, statistically significant decreasing trends are observed in Beijing, Tianjin, Suzhou, Hangzhou, and Wuhan (China), Baghdad (Iraq), Riyadh (Saudi Arabia), Santiago (Chile), Guadalajara (Mexico), and Tehran (Iran). The observed decline in airborne coarse-mode dust aerosols near the surface may result in reduced health risks for these populations, although this decreasing trend must be considered in the context of absolute mass concentration levels, which may still pose concerns. The remaining 21 out of 81 major cities and megacities worldwide (∼ 25.9 %) exhibit positive trends in the coarse-mode fraction of dust aerosols confined within the PBL, in terms of mass concentration. Although none of these urban areas display statistically significant increasing trends, indicating that the observed tendencies may lack robustness or consistency over time, such trends must still be interpreted and considered in the context of absolute mass concentration levels. Absence of statistically significant trends in cities where coarse-mode dust concentrations within the PBL exceed WHO AQG safety thresholds for PM10 may suggest persistent exposure levels that continue to pose health risks in the coming years, potentially reflecting a lack of effective or adequately implemented air quality management policies. Regarding the mass concentration of the coarse-mode fraction of dust aerosols confined within the PBL, analytical description for each of the large city or megacity across the world as reported by the UN (UN, 2018a, 2019), is provided in table 4.
With respect to the fine-mode fraction of dust aerosols confined within the PBL, mass concentrations in 71 out of 81 major cities and megacities worldwide (∼ 87.7 %), each with populations exceeding 5 million as of 2018 (UN, 2018a, b, 2019), exceed the WHO annual mean AQG for annual mean PM2.5 concentrations (5 µg m−3; Table 1). Unlike the more regionally in terms of continents concentrated pattern observed for coarse-mode dust, exceedances of WHO-recommended AQG for PM2.5 thresholds related to fine-mode dust are observed in major urban areas distributed globally, indicating a more widespread and pervasive issue. The ten cities with the highest PBL-level fine-mode dust mass concentrations include Karachi, Pakistan (113.5 ± 43.8 µg m−3), Xian, China (104.4 ± 77.7 µg m−3), Lahore, Pakistan (101.4 ± 43.4 µg m−3), Hyderabad, India (98.7 ± 36.5 µg m−3), Delhi, India (98.1 ± 42.4 µg m−3), Jinan, China (91.1 ± 47.7 µg m−3), Bombay, India (85.1 ± 50.3 µg m−3), Ahmedabad, India (82.9 ± 57.3 µg m−3), Nanjing, China (79.6 ± 49.1 µg m−3), and Tianjin, China (76.2 ± 43.9 µg m−3). Collectively, these ten urban areas are home to over 123 million people, whose health is adversely and highly impacted by elevated exposure to the inhalable fine-mode component of dust aerosols. An additional interesting feature is that the fine-mode fraction of dust aerosols confined within the PBL in terms of mass concentrations, computed on the basis of EOs between December 2006 and November 2022, exhibit negative trends in 70 out of 81 major cities and megacities worldwide (∼ 86.4 %). Among cities that exceed the WHO AQG for PM2.5, statistically significant decreasing trends have been observed in Bombay and Pune (India), Baghdad (Iraq), Santiago (Chile), Barcelona and Madrid (Spain), Johannesburg (South Africa), Sao Paulo and Rio de Janeiro (Brazil), Buenos Aires (Argentina), Los Angeles (USA), and several cities in China, including Shanghai, Beijing, Chongqing, Tianjin, Shenzhen, Chengdu, Nanjing, Hong Kong, Dongguan, Foshan, Xian, Hangzhou, Shenyang, Haerbin, Suzhou, Qingdao, Dalian, and Jinan. The observed reduction in airborne fine-mode dust aerosols within the PBL may lead to a decrease in health risks for these populations. However, this declining trend should be evaluated in the context of the absolute mass concentration levels, which may still present potential concerns, in the case of exceeding WHO AQG safety thresholds for PM2.5. The remaining 10 out of 81 major cities and megacities worldwide (∼ 12.3 %) exhibit positive trends in the fine-mode fraction of dust aerosols confined within the PBL, in terms of mass concentration, however only the urban case of Luanda-Angola is characterized by statistically significant increasing tendency. In addition, in this city case, the PBL fine-mode mass concentration of 7 ± 7.7 µg m−3 resides within the WHO annual mean AQG safety thresholds for PM2.5. It should be emphasized that absence of statistically significant trends in cities where fine-mode dust concentrations within the PBL exceed WHO AQG safety thresholds for PM2.5 reflects persistent exposure levels that continue to pose health risks in the coming years, potentially implying a lack of effective or adequately implemented air quality management policies. Regarding the mass concentration of the fine-mode fraction of dust aerosols confined within the PBL, analytical description for each of the large city or megacity across the world as reported by the UN (UN, 2018a, 2019), is provided in table 5.
It is essential to emphasize that in order to approach the scientific question on the multifaceted role of airborne dust as an environmental risk factor for human health, requirement is the simultaneous interpretation of (i) the coarse-mode and fine-mode components of PM from atmospheric dust within PBL, and (ii) their respective increasing or decreasing trends, in relation to the population size of large cities and megacities globally. To this end, Fig. 14 presents the mean mass concentrations of coarse-mode and fine-mode dust PM within the PBL across major urban centers as a function of population (left panel), along with the corresponding temporal trends derived from satellite EOs over the period December 2006 to November 2022 (right panel). Cities represented by rhombus symbols indicate statistically significant trends, whereas circular symbols denote non-significant trends. Moreover, the light-orange shaded regions in the upper left and lower right quadrants of both the left and the right panels indicate urban areas where WHO annual mean AQG are exceeded for PM2.5 and PM10, respectively. The red-shaded area highlights cities where both PM2.5 and PM10 concentrations surpass the WHO AQG.
It is estimated that out of approximately 810 million people residing in the world's 81 largest cities and megacities (average population, 2007–2022; UN, 2018a, 2019), the dust hazard consisted to a greater or lesser degree an environmental risk factor for the health of ∼ 700 millions of people. More specifically, in these 81 large cities and megacities of the world:
-
approximately 92 million live in urban areas where both coarse-mode and fine-mode PM levels are below the WHO AQG for PM2.5 and PM10, respectively.
-
approximately 311 million live in cities where either the fine-mode or coarse-mode dust PM component exceeds the respective WHO AQG for PM2.5 and PM10, respectively.
-
approximately 391 million reside in areas where both coarse-mode and fine-mode PM concentrations exceed the WHO AQG for PM2.5 and PM10, respectively.
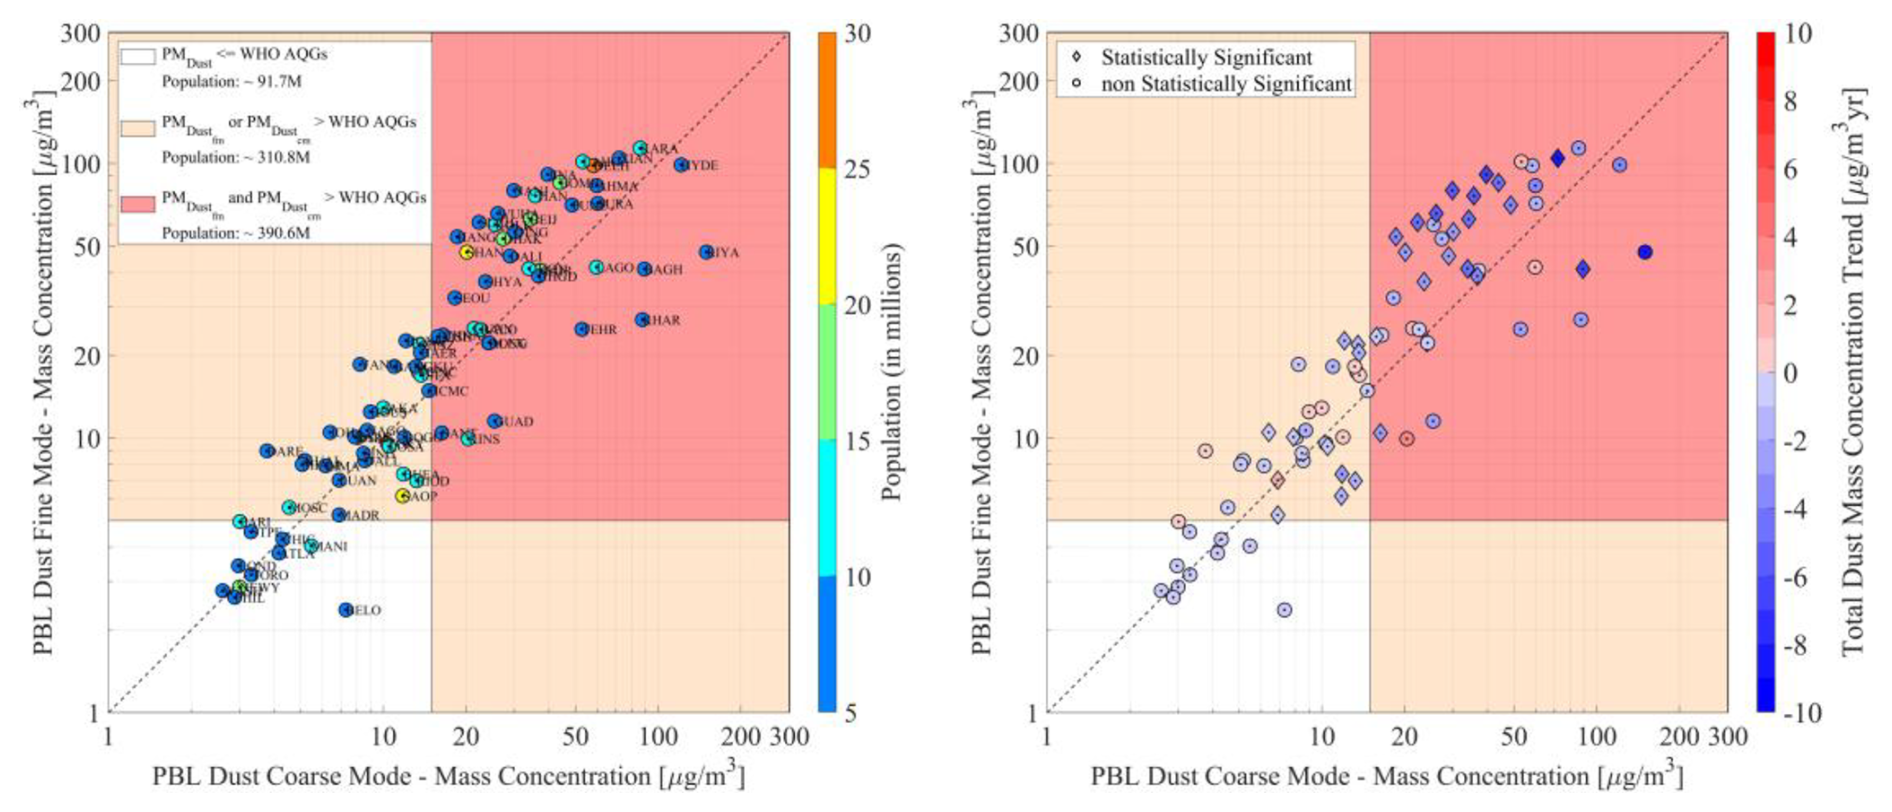
Figure 14(left) Large cities and megacities dust coarse-mode and fine-mode mean mass concentrations within the PBL and their population. Colored areas delineate WHO annual mean AQG for PM10 and PM2.5. (right) Increasing/decreasing trends of dust coarse-mode and fine-mode mass concentration of large cities and megacities within the PBL. Cities shown as diamonds (cycles) correspond to (non) statistically significant trends. The analysis is based on CALIOP observations of the temporal period 2007–2022.
Moreover, it should be emphasized that the documented EO-based atmospheric dust trends over the densely populated and heavily industrialized large cities and megacities of the world reported in the present study do not necessary reflect the effectiveness (or not) of regulatory measures as such a causal relationship between air quality regulatory policies/measures and air quality improvements in terms of dust would be to a degree speculative. More specifically, the current consensus is that atmospheric dust is the net contribution of natural dust and anthropogenic dust (Penner et al., 1994; Tegen and Fung, 1995; Ginoux et al., 2012). Natural dust is emitted in the atmosphere by mobilizing mechanisms including mainly dust devils (Koch and Renno, 2005), haboobs (Knippertz et al., 2007), pressure gradients (Klose et al., 2010), and low-level jets (LLJs; Fiedler et al., 2013) over arid regions (Prospero et al., 2002). Anthropogenic dust is emitted into the atmosphere by anthropogenic activities including mainly transportation, infrastructure and construction (Moulin and Chiapello, 2006; Chen et al., 2018), deterioration of soil surfaces and modifications in land use (i.e., deforestation), grazing (Ginoux et al., 2012), urbanization and agriculture (Tegen et al., 1996). To date anthropogenic dust is considered a significant proportion of the total aerosol load though of high spatial and temporal variability, with estimations ranging between ∼ 20 % (Ginoux et al., 2012) and as high as ∼ 70 % in the case of densely populated and heavily industrialized urban areas (Huang et al., 2015; Chen et al., 2019). Regulatory policies and measures regulate anthropogenic activities and as such anthropogenic aerosol emissions, extending to anthropogenic activities resulting to emission of anthropogenic dust. However, since the total atmospheric dust load is the superimposition of natural and anthropogenic dust and since regulation measures would have a more direct impact on the anthropogenic dust emissions and only indirectly to natural dust emissions, conclusions on reductions of the total atmospheric dust load as outcome of imposed regulatory measures cannot be made with high confidence and would be to a degree speculative.
Based on sixteen years of EOs (December 2006–November 2022), this study has: (i) quantified the mass concentration of the coarse-mode and fine-mode atmospheric dust components within the PBL, where the main anthropogenic activity takes place; (ii) identified increasing and decreasing temporal trends on the observational datasets and products; and (iii) considered the statistical significance of these trends across the world's largest urban centers. This section aims to extend the analysis by addressing the following scientific questions: How are the mass concentrations of coarse-mode and fine-mode atmospheric dust within the PBL expected to evolve in the near future? Which highly industrialized and densely populated large cities and megacities worldwide are projected to exceed the WHO AQG thresholds for PM10 and PM2.5, respectively, due to anticipated changes in the PBL dust load of the coarse-mode and fine-mode components of atmospheric dust? Addressing these questions on the atmospheric dust hazard is essential for anticipating future air quality challenges, supporting the development of targeted mitigation strategies, and protecting public health in rapidly growing urban environments.
As a representative case for the projection analysis, the megacity of Beijing, China, is utilized. More specifically, Fig. 15 presents the seasonal mean (denoted by white cycles) of EO-derived PMcoarse (Fig. 15a) and PMfine (Fig. 15b) components of total atmospheric dust load within the PBL, based on CALIPSO overpasses within a 100 km radius of the Beijing metropolitan area. Over the 16-year period from December 2006 to November 2022 (highlighted by the light blue shaded area), the mean mass concentrations of coarse-mode and fine-mode atmospheric dust within the PBL were quantified at 34.2 ± 24.1 µg m−3 (Fig. 15a) and 62.6 ± 36.4 µg m−3 (Fig. 15b), respectively. Both values exceed the WHO's annual-mean AQG thresholds (Table 1). Furthermore, statistically significant decreasing trends were observed in both fine-mode and coarse-mode dust concentrations, as derived from EO data. These negative tendencies are corroborated by ground-based sunphotometer AERONET measurements, specifically the SDA-derived fine-mode and coarse-mode AOT at 500 nm, timeseries established utilizing long-term data from the Beijing, Beijing-RADI, Beijing-PKU, and Beijing-CAMS stations (Fig. 10; Table 3). Moreover, based on the 2007–2022 observational timeframe and the derived trends, future projections of PBL coarse-mode and fine-mode dust mass concentrations beyond the observation period are presented. In Fig. 15, these projections are depicted as red trend lines, with the surrounding light red shaded areas denoting the associated confidence intervals. It has to be emphasized that the projections represent expected PBL dust concentrations under the assumption of continuation of 2007–2022 trends. However, the reliability of these projections decreases with increasing time beyond the observational temporal period. To account for increasing uncertainty, the projection period is constrained to the point at which (i) the confidence interval first intersects zero (yielding non-physical negative concentration values), or (ii) the confidence interval variability equals or exceeds the variability characterizing the original EO dataset, (iii) the confidence interval reaches values as high as the projected values themselves. For the indicative case of the Beijing metropolitan area, projections of the PBL coarse-mode and fine-mode dust mass concentration reports with relatively high confidence values as high as 14.7 ± 14.9 µg m−3 (2026) and 28 ± 28.1 µg m−3 (2029), respectively, corresponding to reduction of ∼ 57.1 % and ∼ 55.2 % for the two dust aerosol mode components.
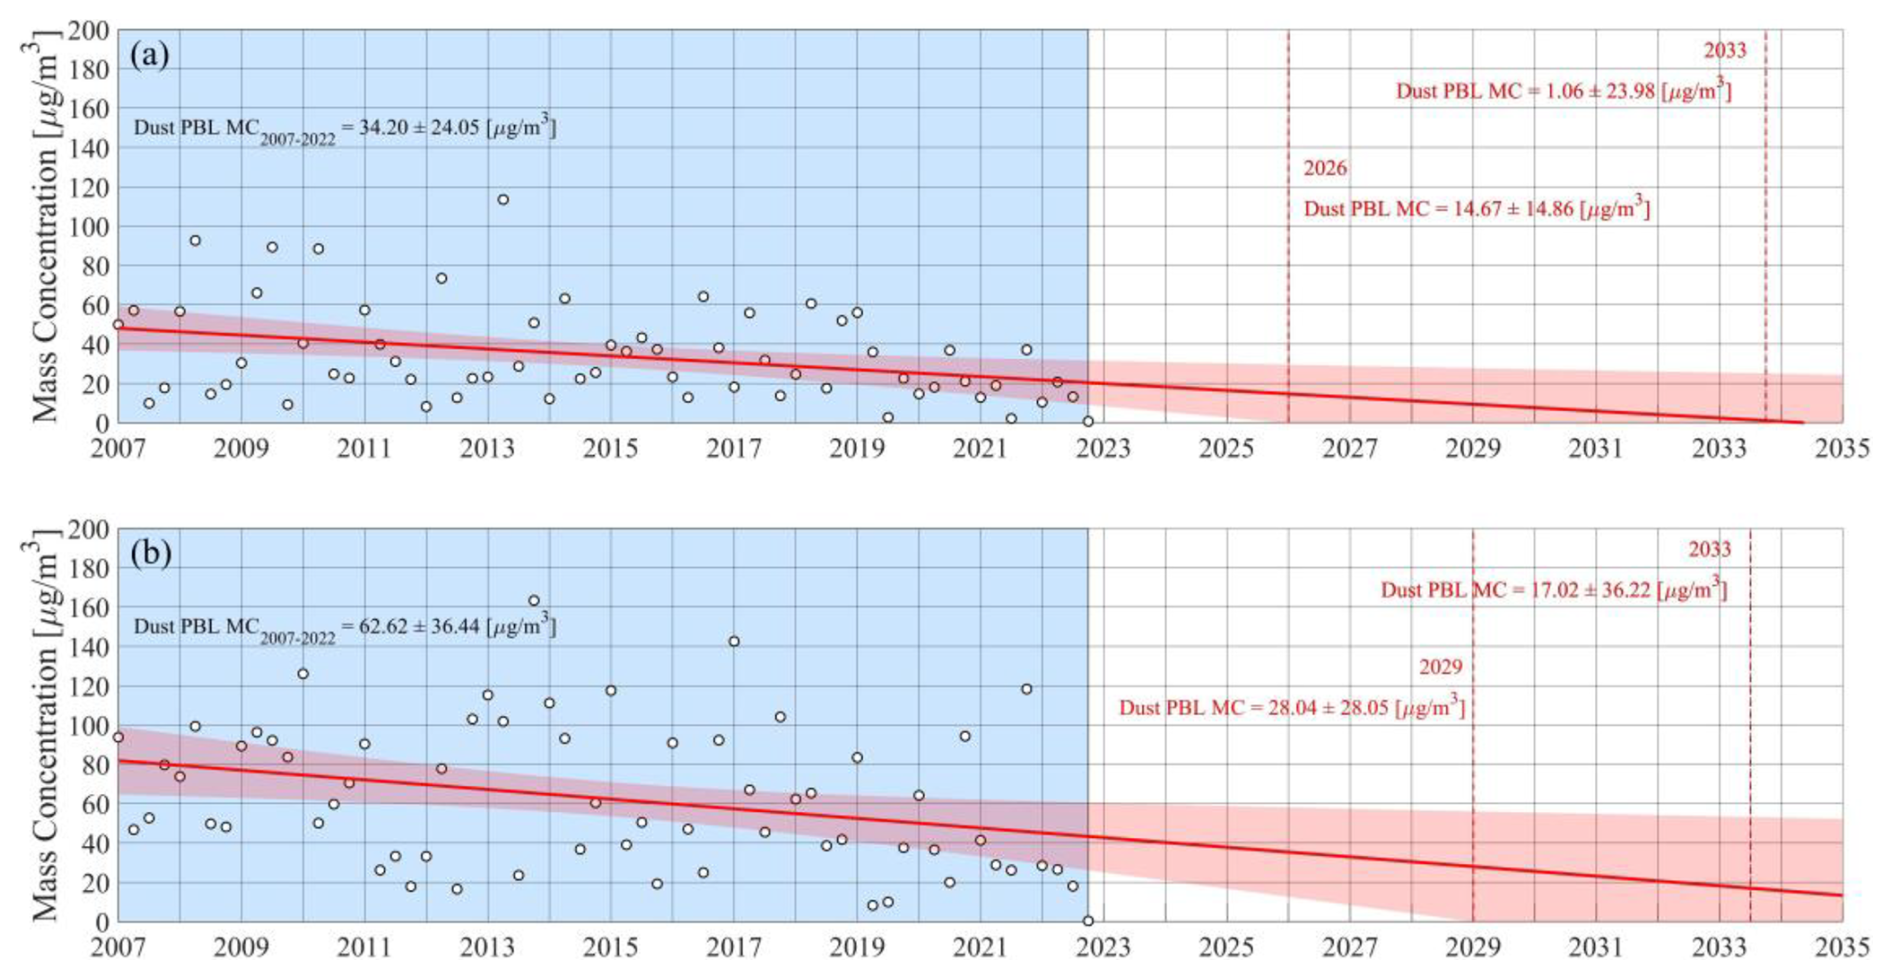
Figure 15Beijing megacity dust coarse-mode (a) and fine-mode (b) mass concentration within the PBL. Cycles in white colour correspond to seasonal mean mass concentration values for the CALIPSO period 2007–2022 (shaded area in light blue). Projection into the temporal period beyond 2022 and up to the year 2035 is shown in terms of linear regression extension and 95 % confidence interval for predictions.
Regarding the coarse-mode fraction of dust aerosols confined within the PBL, mass concentrations in 38 out of 81 major cities and megacities worldwide (∼ 46.9 %), with populations exceeding 5 million as of 2018 (UN, 2018a, b, 2019), surpass the WHO annual mean AQG for annual mean PM10 concentrations (15 µg m−3; Table 1). The ten cities with the highest PBL-level coarse-mode dust mass concentrations in the years following the EO-based temporal period include Hyderabad, India (86.8 ± 78.4 µg m−3; 2032), Lagos, Nigeria (77.6 ± 77.7 µg m−3; 2031), Lahore, Pakistan (70.8 ± 40.3 µg m−3; 2032), Guangzhou, China (67.7 ± 54.3 µg m−3; 2033), Karachi, Pakistan (61.3 ± 55.1 µg m−3; 2032), Riyadh, Saudi Arabia (61.2 ± 60.1 µg m−3; 2027), Khartoum, Sudan (60.2 ± 42.9 µg m−3; 2033), Dongguan, China (56 ± 56.9 µg m−3; 2032), Kinshasa, Democratic Republic of Congo (50.2 ± 46.8 µg m−3; 2032), and Xian, China (47.8 ± 48.1 µg m−3; 2029). Collectively, these ten urban areas in the year of projection it is foreseen to be home to over 160.6 million people, whose health will be adversely impacted by elevated exposure to coarse-mode dust aerosols. It is projected that, in the coming years, the number of large cities and megacities exhibiting coarse-mode dust aerosol concentrations within the PBL that (i) exceed the WHO 24 h mean PM10 AQG safety thresholds will decrease from 13 to 11, and (ii) the number of case that fall below the WHO annual mean PM10 AQG safety thresholds will increase from 41 to 43. In the cases of Delhi, India (−25.6 %; 2028), Tehran, Iran (−48.7 %; 2027; statistically significant trend), Baghdad, Iraq (−62 %; 2025; statistically significant trend), Pune (−18.6 %; 2029) and Surat (−30.1 %; 2026) in India the PBL coarse-mode dust concentration is foreseen to fall from exceeding WHO 24 h mean AQG to exceeding the annual mean AQG for PM10, with reference the 2007-2022 temporal period. Opposite is the tendency of the large urban areas of Guangzhou, China (216 %; 2033), Kinshasa, Democratic Republic of Congo (146.2 %; 2032), and Dongguan, China (136 %, 2032) where the increase above the WHO 24 h mean PM10 AQG safety thresholds is projected. Regarding the mass concentration of the coarse-mode fraction of dust aerosols confined within the PBL in the temporal period beyond the observational period, analytical description for each of the large city or megacity across the world as reported by the UN (UN, 2018a, 2019), is provided in Table 4.
Table 4Analytical table of 81 cities (first column, abbreviations second column) with the highest population up to 2018 (UN, 2018a, 2019). The table provides basic statistical analysis outcomes reporting on PBL Dust coarse-mode mass concentration values based on the period 2007–2022, including mean ± sd (µg m−3), increasing/decreasing tendency, and the corresponding statistical significance of the timeseries, in addition to their mean 2007–2022 population. The columns on the right provide insight beyond the EO-based period 2007–2022, including the year when the linear regression extension and the 95 % confidence interval for predictions deviates into lower confidence values and the UN projected population on that specific year.
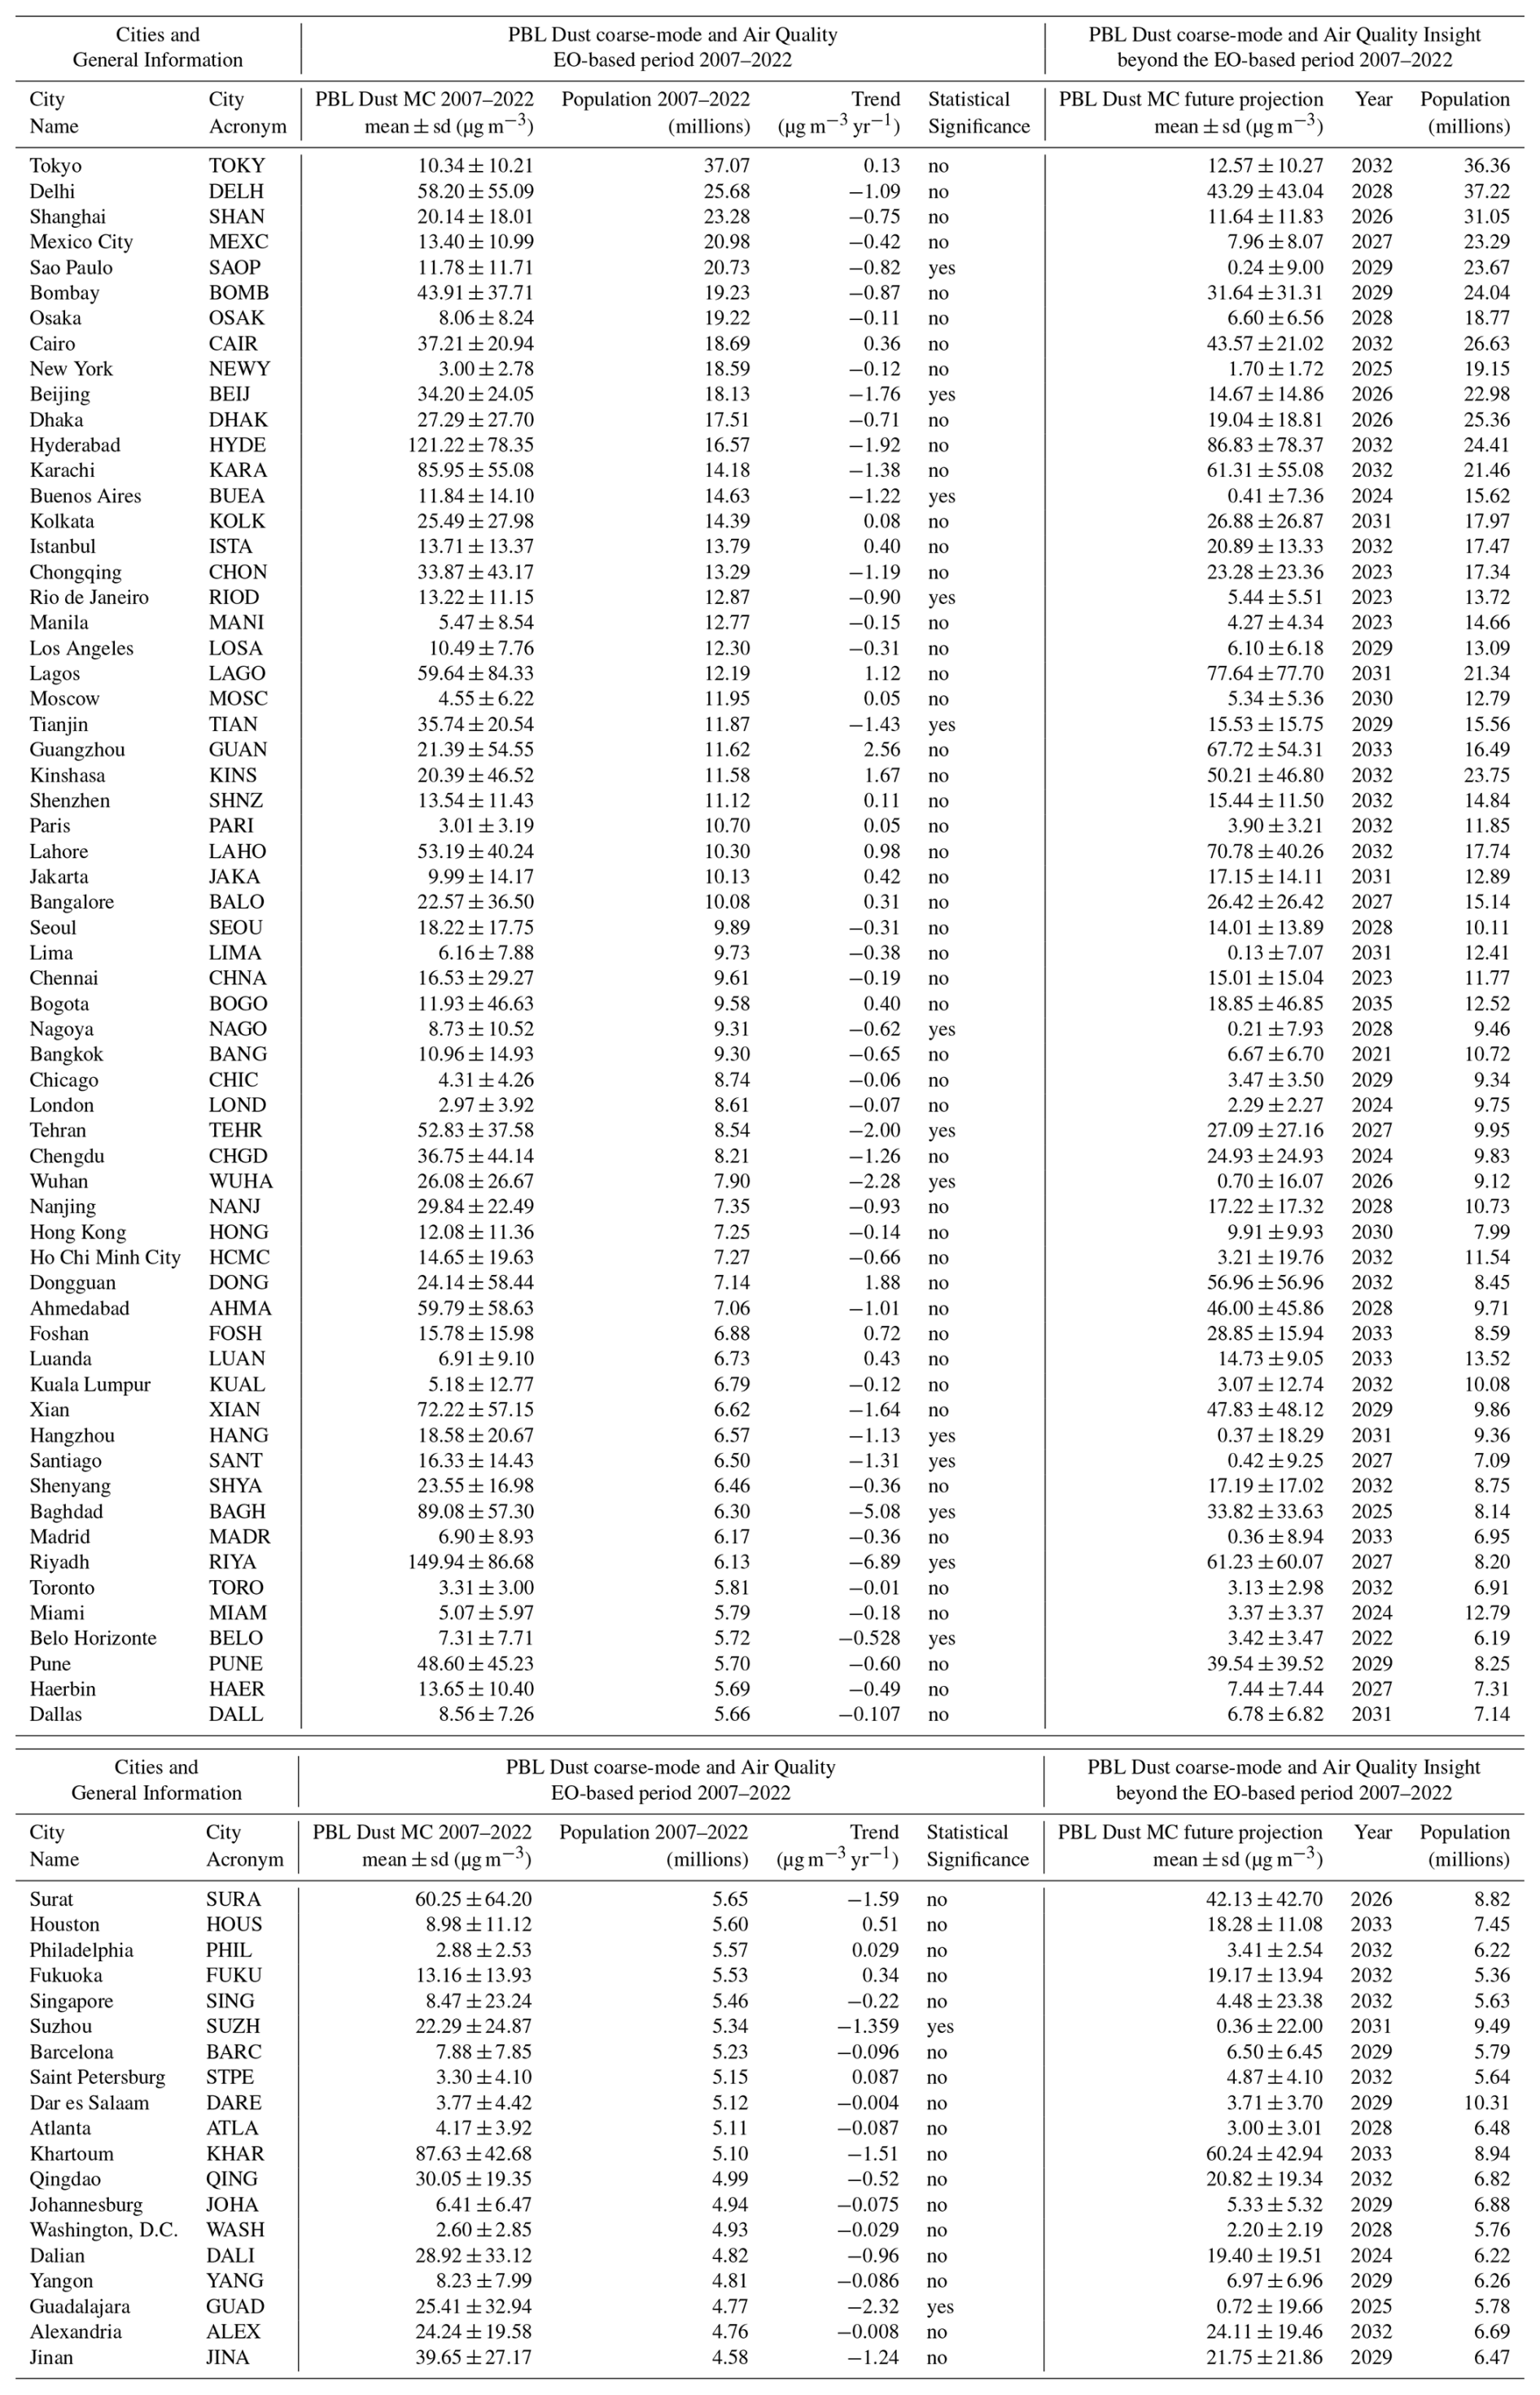
Regarding the fine-mode fraction of dust aerosols confined within the PBL, mass concentrations in 38 out of 81 major cities and megacities worldwide (∼ 46.9 %), with populations exceeding 5 million as of 2018 (UN, 2018a, b, 2019), surpass the WHO annual mean AQG for annual mean PM2.5 concentrations (5 µg m−3; Table 1). The ten cities with the highest PBL-level fine-mode dust mass concentrations in the years following the EO-based temporal period include Lahore, Pakistan (103.4 ± 43.1 µg m−3; 2032), Karachi, Pakistan (93.5 ± 43.8 µg m−3; 2032), Delhi, India (84.7 ± 42.6 µg m−3; 2032), Hyderabad, India (78.4 ± 36.3 µg m−3; 2032), Surat, India (75.5 ± 40.9 µg m−3; 2032), Lagos, Nigeria (51.5 ± 51.7 µg m−3; 2031), Ahmedabad, India (50.7 ± 50.2 µg m−3; 2030), Xian, China (41.6 ± 40.6 µg m−3; 2024), Bombay, India (39.7 ± 40.1 µg m−3; 2029), and Dhaka, Bangladesh (37.2 ± 37.1 µg m−3; 2031). Collectively, these ten urban areas in the year of projection it is foreseen to be home to over 207.7 million people, whose health will be adversely impacted by elevated exposure to fine-mode dust aerosols. It is projected that, in the coming years, the number of large cities and megacities exhibiting fine-mode dust aerosol concentrations within the PBL that (i) exceed the WHO 24 h mean PM2.5 AQG safety thresholds will decrease from 45 to 36, and (ii) that the number of cases that exceed WHO annual mean PM2.5 AQG though fall below the 24 h mean AQG safety thresholds will decrease from 25 to 24. Regarding the mass concentration of the fine-mode fraction of dust aerosols confined within the PBL in the temporal period beyond the observational period, analytical description for each of the large city or megacity across the world as reported by the UN (UN, 2018a, 2019), is provided in Table 5.
Table 5Analytical table of 81 cities (first column, abbreviations second column) with the highest population up to 2018 (UN, 2018a, 2019). The table provides basic statistical analysis outcomes reporting on PBL dust fine-mode mass concentration values based on the period 2007-2022, including mean ± sd (µg m−3), increasing/decreasing tendency, and the corresponding statistical significance of the timeseries, in addition to their mean 2007–2022 population. The columns on the right provide insight beyond the EO-based period 2007–2022, including the year when the linear regression extension and the 95 % confidence interval for predictions deviates into lower confidence values and the UN projected population on that specific year.
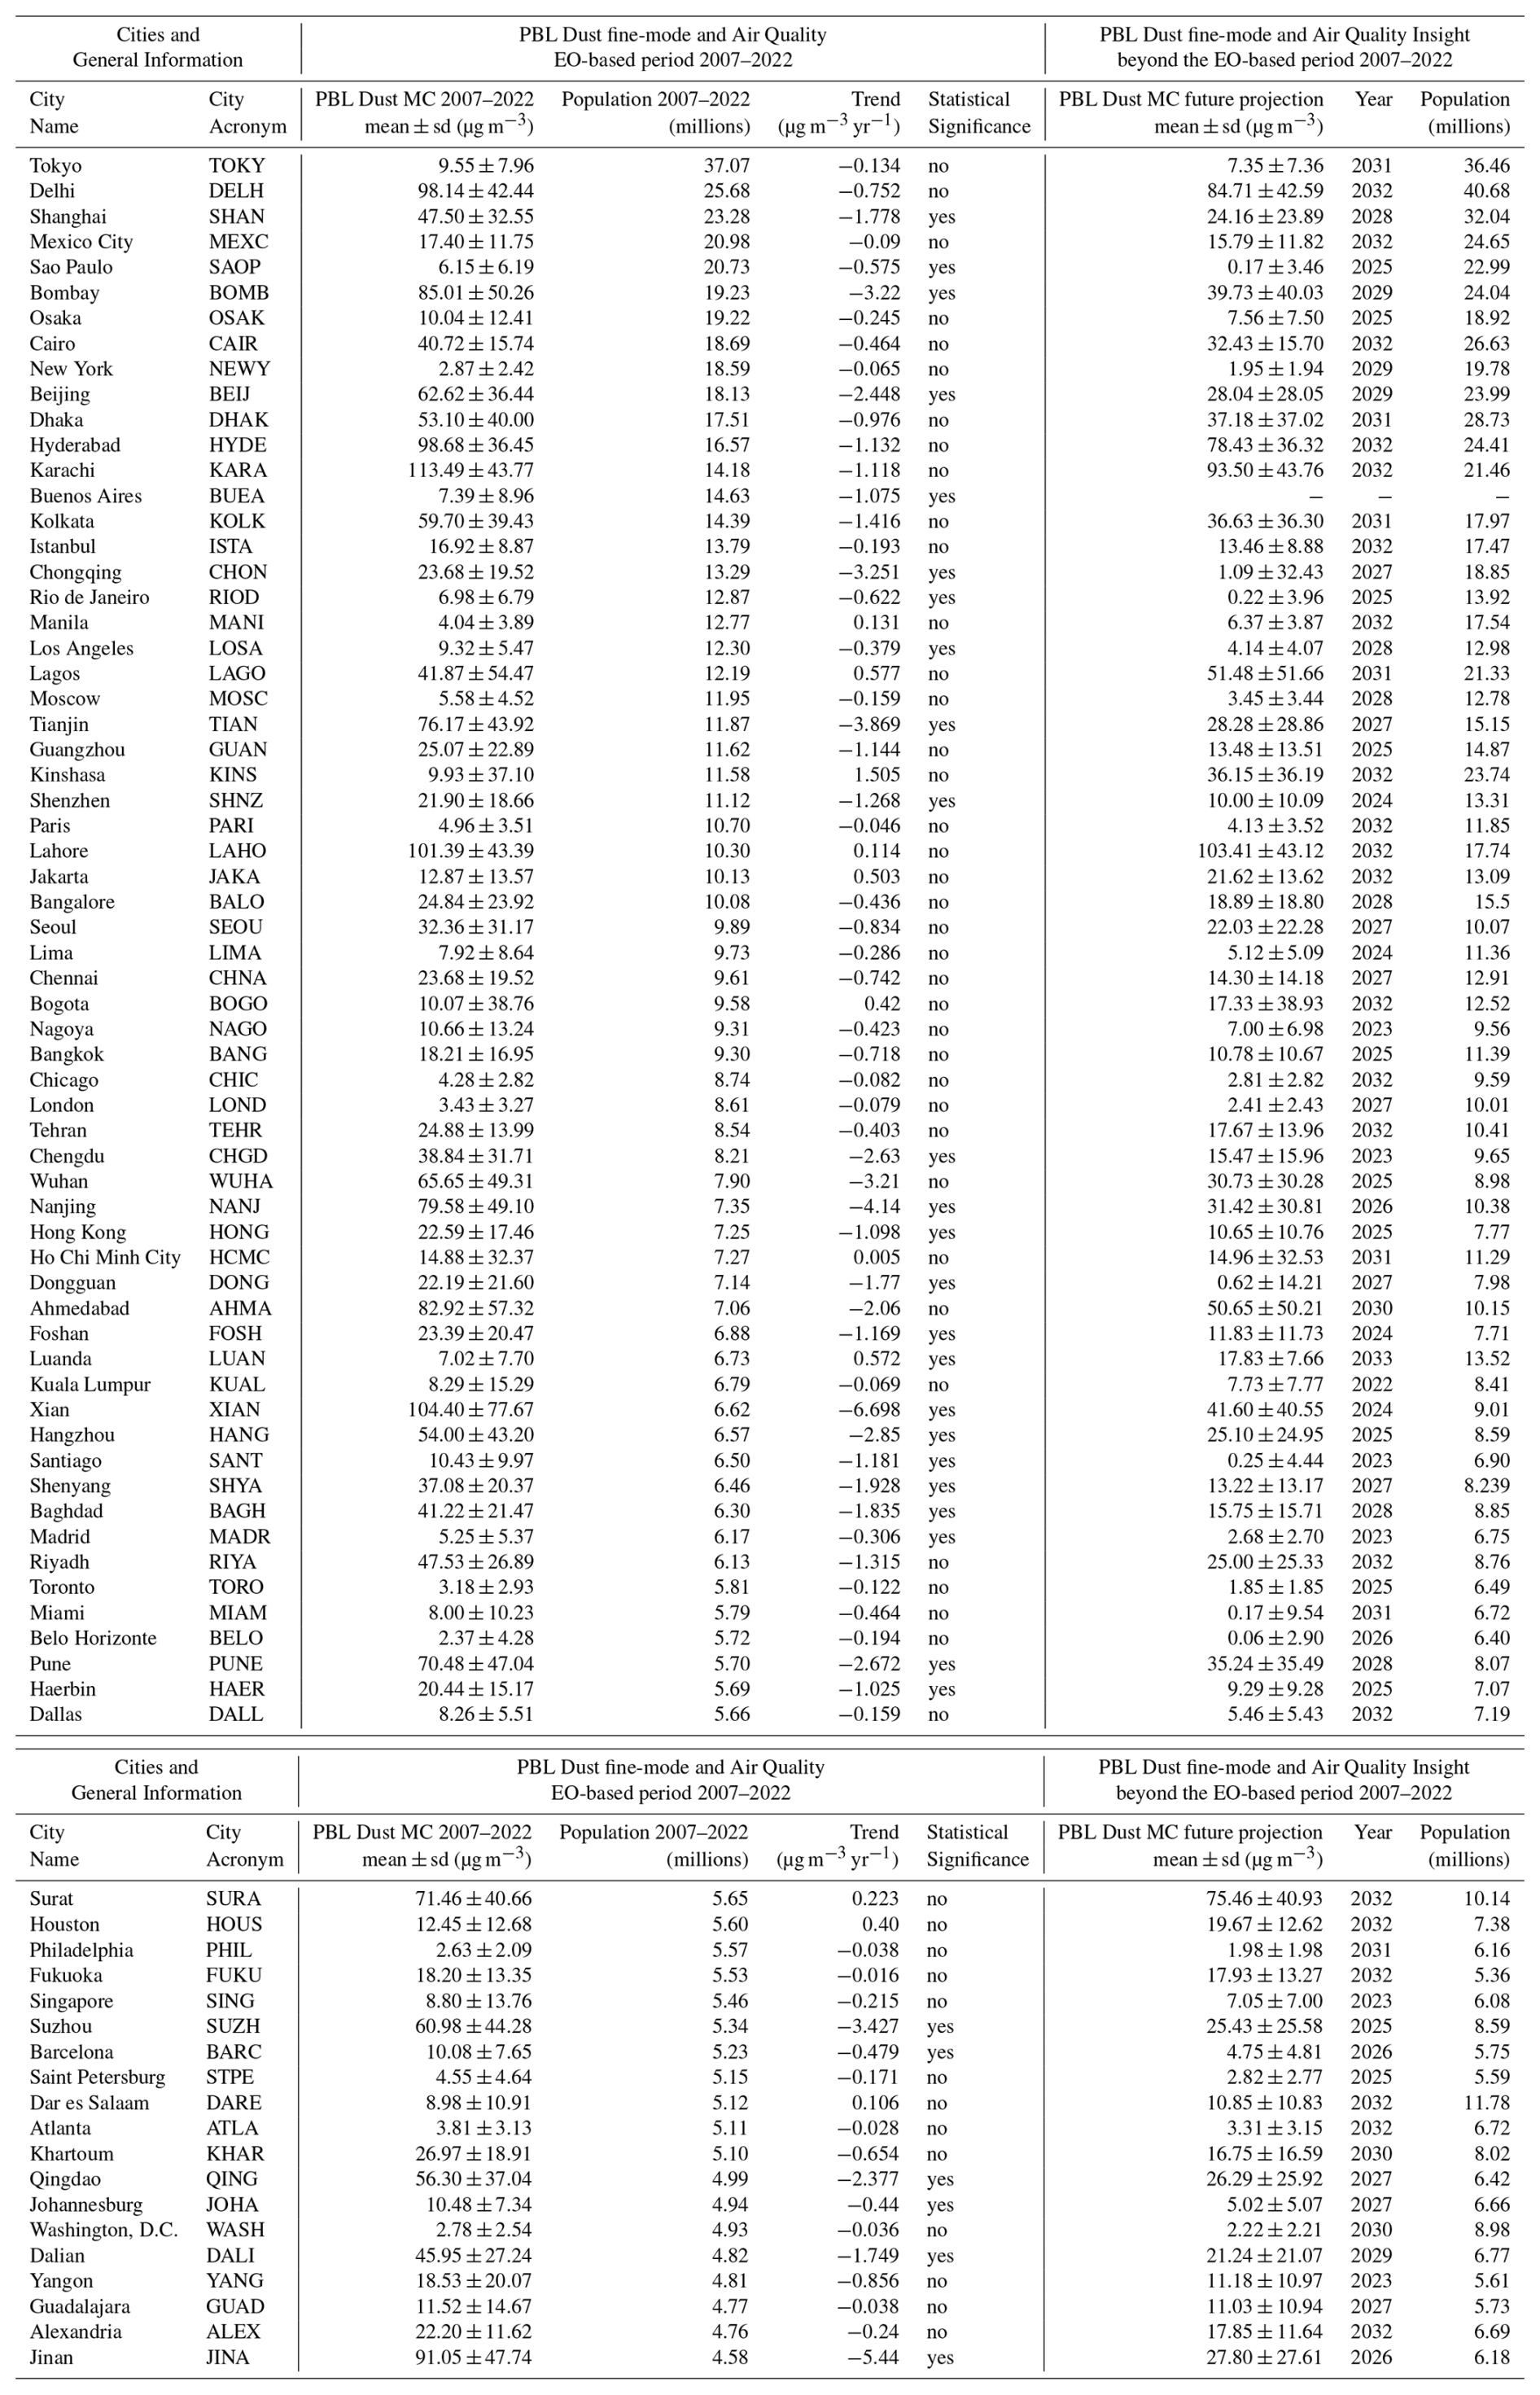
It is estimated that out of approximately 1030.2 million people residing in the world's 81 largest cities and megacities (average of the PBL mass concentration fine-mode dust projection year) population (UN, 2018a, 2019), the dust hazard consisted to a greater or lesser degree an environmental risk factor for the health of ∼ 857 millions of people. More specifically, in these 81 large cities and megacities of the world:
-
approximately 195 million will live in urban areas where both coarse-mode and fine-mode PM levels will fall below the WHO annual mean AQG for PM2.5 and PM10, respectively. This translates to ∼ 113.1 % increase in the population number of this category with respect to the reference observational 2007–2022 temporal period.
-
approximately 347 million will live in cities where either the fine-mode or coarse-mode dust PM component will exceed the respective WHO annual mean AQG for PM2.5 and PM10, respectively. This translates to ∼ 11.6 % increase in the population number of this category with respect to the reference observational 2007–2022 temporal period.
-
approximately 510 million will reside in areas where both coarse-mode and fine-mode PM concentrations will exceed the WHO annual mean AQG for PM2.5 and PM10, respectively. This translates to ∼ 30.5 % increase in the population number of this category with respect to the reference observational 2007–2022 temporal period.
It should be emphasized that the role of airborne fine-mode and coarse-mode dust aerosol components as environmental risk factors for human health disorders should be examined in the context of the absolute mass concentration levels and their changes with time, with reference WHO annual mean AQG safety thresholds for PM2.5 (5 µg m−3) and PM10, (15 µg m−3) in parallel with the large cities and megacities population change with time. More specifically, as shown in Fig. 16, at a continental level, the following atmospheric dust conditions are anticipated (Table 6):
-
Asia. The projected mass concentration of coarse-mode dust is anticipated to decline by ∼ 25.5 % (from 33.8 to 25.2 µg m−3), while fine-mode dust mass concentration is expected to decrease by ∼ 40.3 % (from 45.6 to 27.2 µg m−3). Despite these reductions, both components are projected to remain above the WHO annual mean AQG for PM2.5 and PM10, thereby continuing to pose a health risk, albeit reduced in severity. Notably, with an estimated ∼ 33.3 % increase in population (from 478.7 to 638.2 million) across 48 major cities and megacities in Asia (UN, 2018a, 2019), atmospheric dust is likely to remain a significant environmental health hazard, potentially affecting a larger number of individuals, however of lower severity since the per capita dust mass concentration exposure is projected to decrease.
-
Africa. Both coarse-mode and fine-mode mass concentrations of dust are projected to increase by ∼ 13.5 % and ∼ 12.4 %, respectively (from 30.8 to 34.9 µg m−3 and from 21.to 23.6 µg m−3). This increase coincides with a substantial projected population growth of ∼ 70.8 % (approximately from 69 to 118 million) across the 8 major cities and megacities of the continent (UN, 2018a, 2019). In this context, atmospheric dust is expected to represent an escalating environmental health hazard, both in terms of severity and population affected, due to rising per capita exposure to airborne dust particulate matter.
-
South America. Both coarse-mode and fine-mode mass concentrations of dust are projected to decline significantly, by ∼ 63.2 % and ∼ 47.3 %, respectively (from 11.2 to 4.1 µg m−3 and from 7.3 to 3.9 µg m−3), while the population residing in the 7 major cities and megacities of the continent (UN, 2018a, 2019) is expected to grow by ∼ 14.4 % (approximately from 80 to 91 million). In the case of large urban areas located in South America, atmospheric dust is projected to remain an environmental health hazard, potentially impacting a larger number of individuals; however, the associated risk may be of significant lower severity, since the per capita exposure to dust mass concentrations are projected to reside at climatological level, below the WHO annual mean AQG safety thresholds for PM2.5 and PM10.
-
North America. Coarse-mode dust mass concentration is projected to drop by ∼ 34.8 % (from 7.7 to 5 µg m−3), with a more modest ∼ 7.9 % decrease in fine-mode dust mass concentration (from 7.2 to 6.7 µg m−3), and an ∼ 18.8 % increase in population (approximately from 104 to 123 million), residing in the 12 major cities and megacities of the continent (UN, 2018a, 2019). While the coarse-mode of dust in terms of mass concentration is projected to fall below WHO annual mean AQG safety threshold PM10, the fine-mode of dust in terms of mass concentration is projected to remain close, though exceeding, to the WHO annual mean AQG safety threshold PM2.5. Atmospheric dust will remain an environmental health hazard, though of lower degree compared to the EO-based reference period, however potentially affecting a larger number of individuals.
-
Europe. Projections over the 6 large urban areas of Europe indicate an ∼ 18.7 % reduction in coarse-mode mass concentration of dust (from 4.8 to 3.9 µg m−3) and an ∼ 38.1 % decline in fine-mode mass concentration of dust (from 5.6 to 3.5 µg m−3), with a modest ∼ 10.4 % population increase (approximately from 48 to 53 million). Future projections indicate a high possibility that within the following years both the coarse-mode and fine-mode components of atmospheric dust in terms of mass concentration will fall below the WHO annual mean AQG for PM10 and PM2.5, respectively.
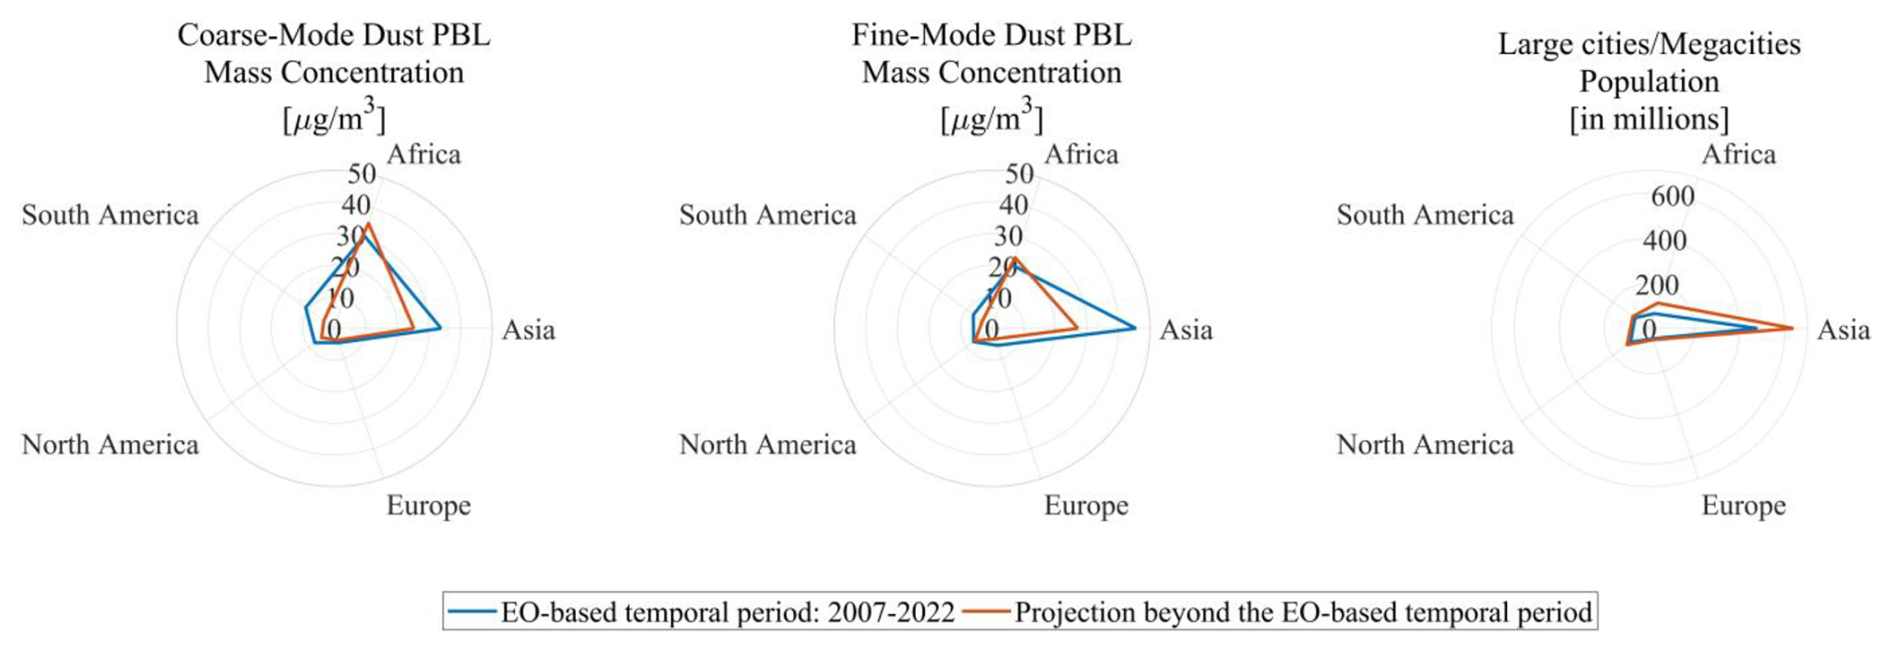
Figure 16Average continental-scale coarse-mode dust PBL mass concentration (left), fine-mode dust PBL mass concentration (center), and population of the large cities and megacities (right), depicting the long-term EO-based mean conditions (blue line) and for the projection beyond the EO-based temporal period (red line).
Table 6PBL coarse-mode and fine-mode dust mass concentrations and population of large cities and megacities of the world for the EO-based temporal period (2007–2022) and for the projection beyond the EO-based temporal period, for Asia, Africa, South America, North America, and Europe.
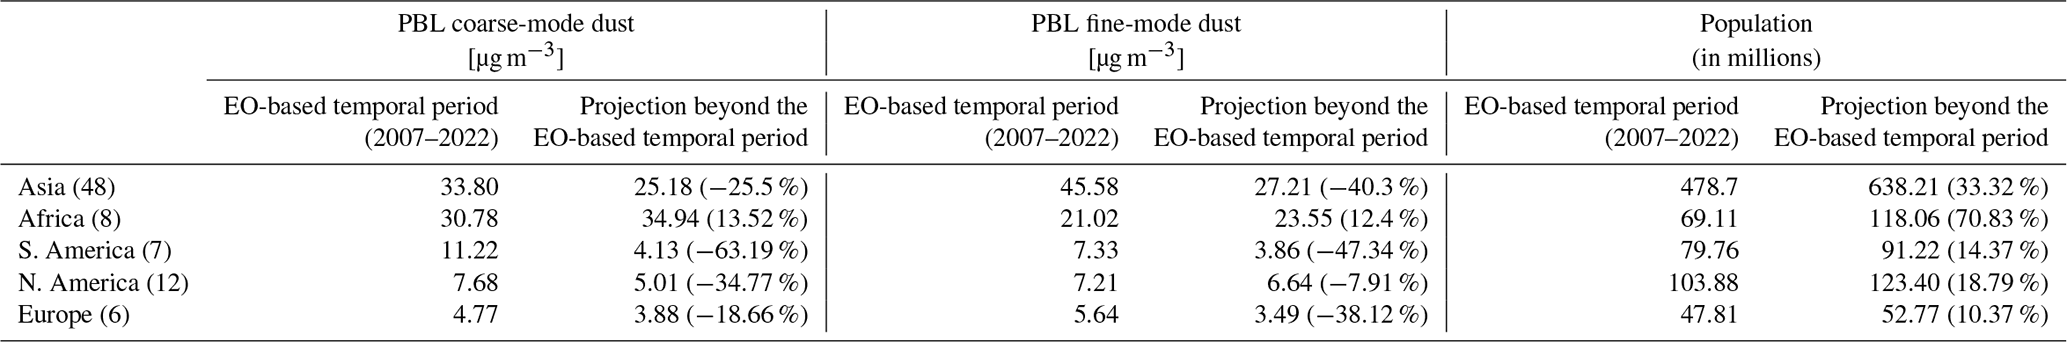
To date, numerous epidemiological studies report on the adverse effects of airborne dust on human health, with more pronounced the impact of the fine-mode (PM2.5) due to the deeper penetration into the respiratory system and the alveolar region (Martinelli et al., 2013; Lazaridis, 2023). Having quantified the PBL fine-mode and coarse-mode dust mass concentration over large cities and megacities of the world, the present section aims to translate these specific atmospheric conditions to a health risk associated with population exposure. The characterization is achieved through parametrizations established on the basis of epidemiological studies (Ostro, 2004; Soares et al., 2022) allowing to quantify the dust-exposure (i) relative risk (RR) and (ii) attributable fraction (AF).
For short-term exposure to the coarse-mode of dust, the RR for 41 cities with a 16-year mean mass concentration up to 15 µg m−3 was lower than 1.004 (Fig. 17a). The latter is linked with an AF lower than 0.4 %. These cities exhibit the lower dust mass concentrations than WHO 24 h mean AQG safety thresholds, thus are characterized by the lower risk expressed by a very small fraction of incidences for all-cause mortality for the exposed population. Higher coarse-mode dust mass concentrations and between 15 and 45 µg m−3 were obtained for 27 cities with an RR ranging between 1.004 and 1.030 and an AF ranging between 0.4 %–2.8 %. The higher mortality risks for these cities lead to an increased AF for the exposed population which indicates that 2.8 % of incidences can be avoided if concentration is reduced to the target value (10 µg m−3). Similarly, 13 cities with coarse-mode dust mass concentration higher than 45 µg m−3 were associated with an RR higher than 1.03 and up to 1.12 for the city of Riyadh (Saudi Arabia). These cities correspond to the most air quality burdened urban environments as mortality risks become considerable with 2.8 %–10.6 % of incidences could be avoided with a reduction of dust concentrations to 10 µg m−3. Table 7 lists the 10 cities and megacities with the higher coarse-mode dust mass concentrations and the respective RRs and AFs.
For long-term exposure to PM2.5, the RR for 11 cities with a 16-year mean fine-mode dust mass concentration lower than 5 µg m−3 was below 1.06 and 1.10 for cardiopulmonary mortality and lung cancer respectively (Fig. 17b). AF for these cities were the lowest, and less than 6.1 % of cardiopulmonary mortality and 8.9 % of lung cancer incidences could be avoided with a reduction of fine-mode dust mass concentration to 3 µg m−3. In contrast to health risk results for coarse-mode dust, a higher number of cities was obtained with a notable risk for fine dust-mode. This observation is a direct outcome of the stricter WHO AQG for PM2.5 compared to PM10 (WHO, 2021). In particular, 70 cities (15 < 25 cities < 45 µg m−3; 45 cities > 45 µg m−3) exhibited concentrations higher than 15 µg m−3 which is translated to a cardiopulmonary risk mortality of 1.06–1.68 and a lung cancer risk of 1.10–2.18. Translating these risks to AFs for the exposed population gives fractions that range up to 40.6 % (Karachi) for cardiopulmonary mortality and up to 54.1 % (Karachi) for lung cancer. These numbers suggest that a significant number of incidents could be avoided with reduction of fine-mode dust concentrations to the target value, and that the environment in these cities poses a considerable threat for the exposed population. Detailed RRs and AFs values for the cities and megacities with higher fine-mode dust mass concentrations are presented in Tables 8 and 9 for cardiopulmonary and lung cancer respectively.
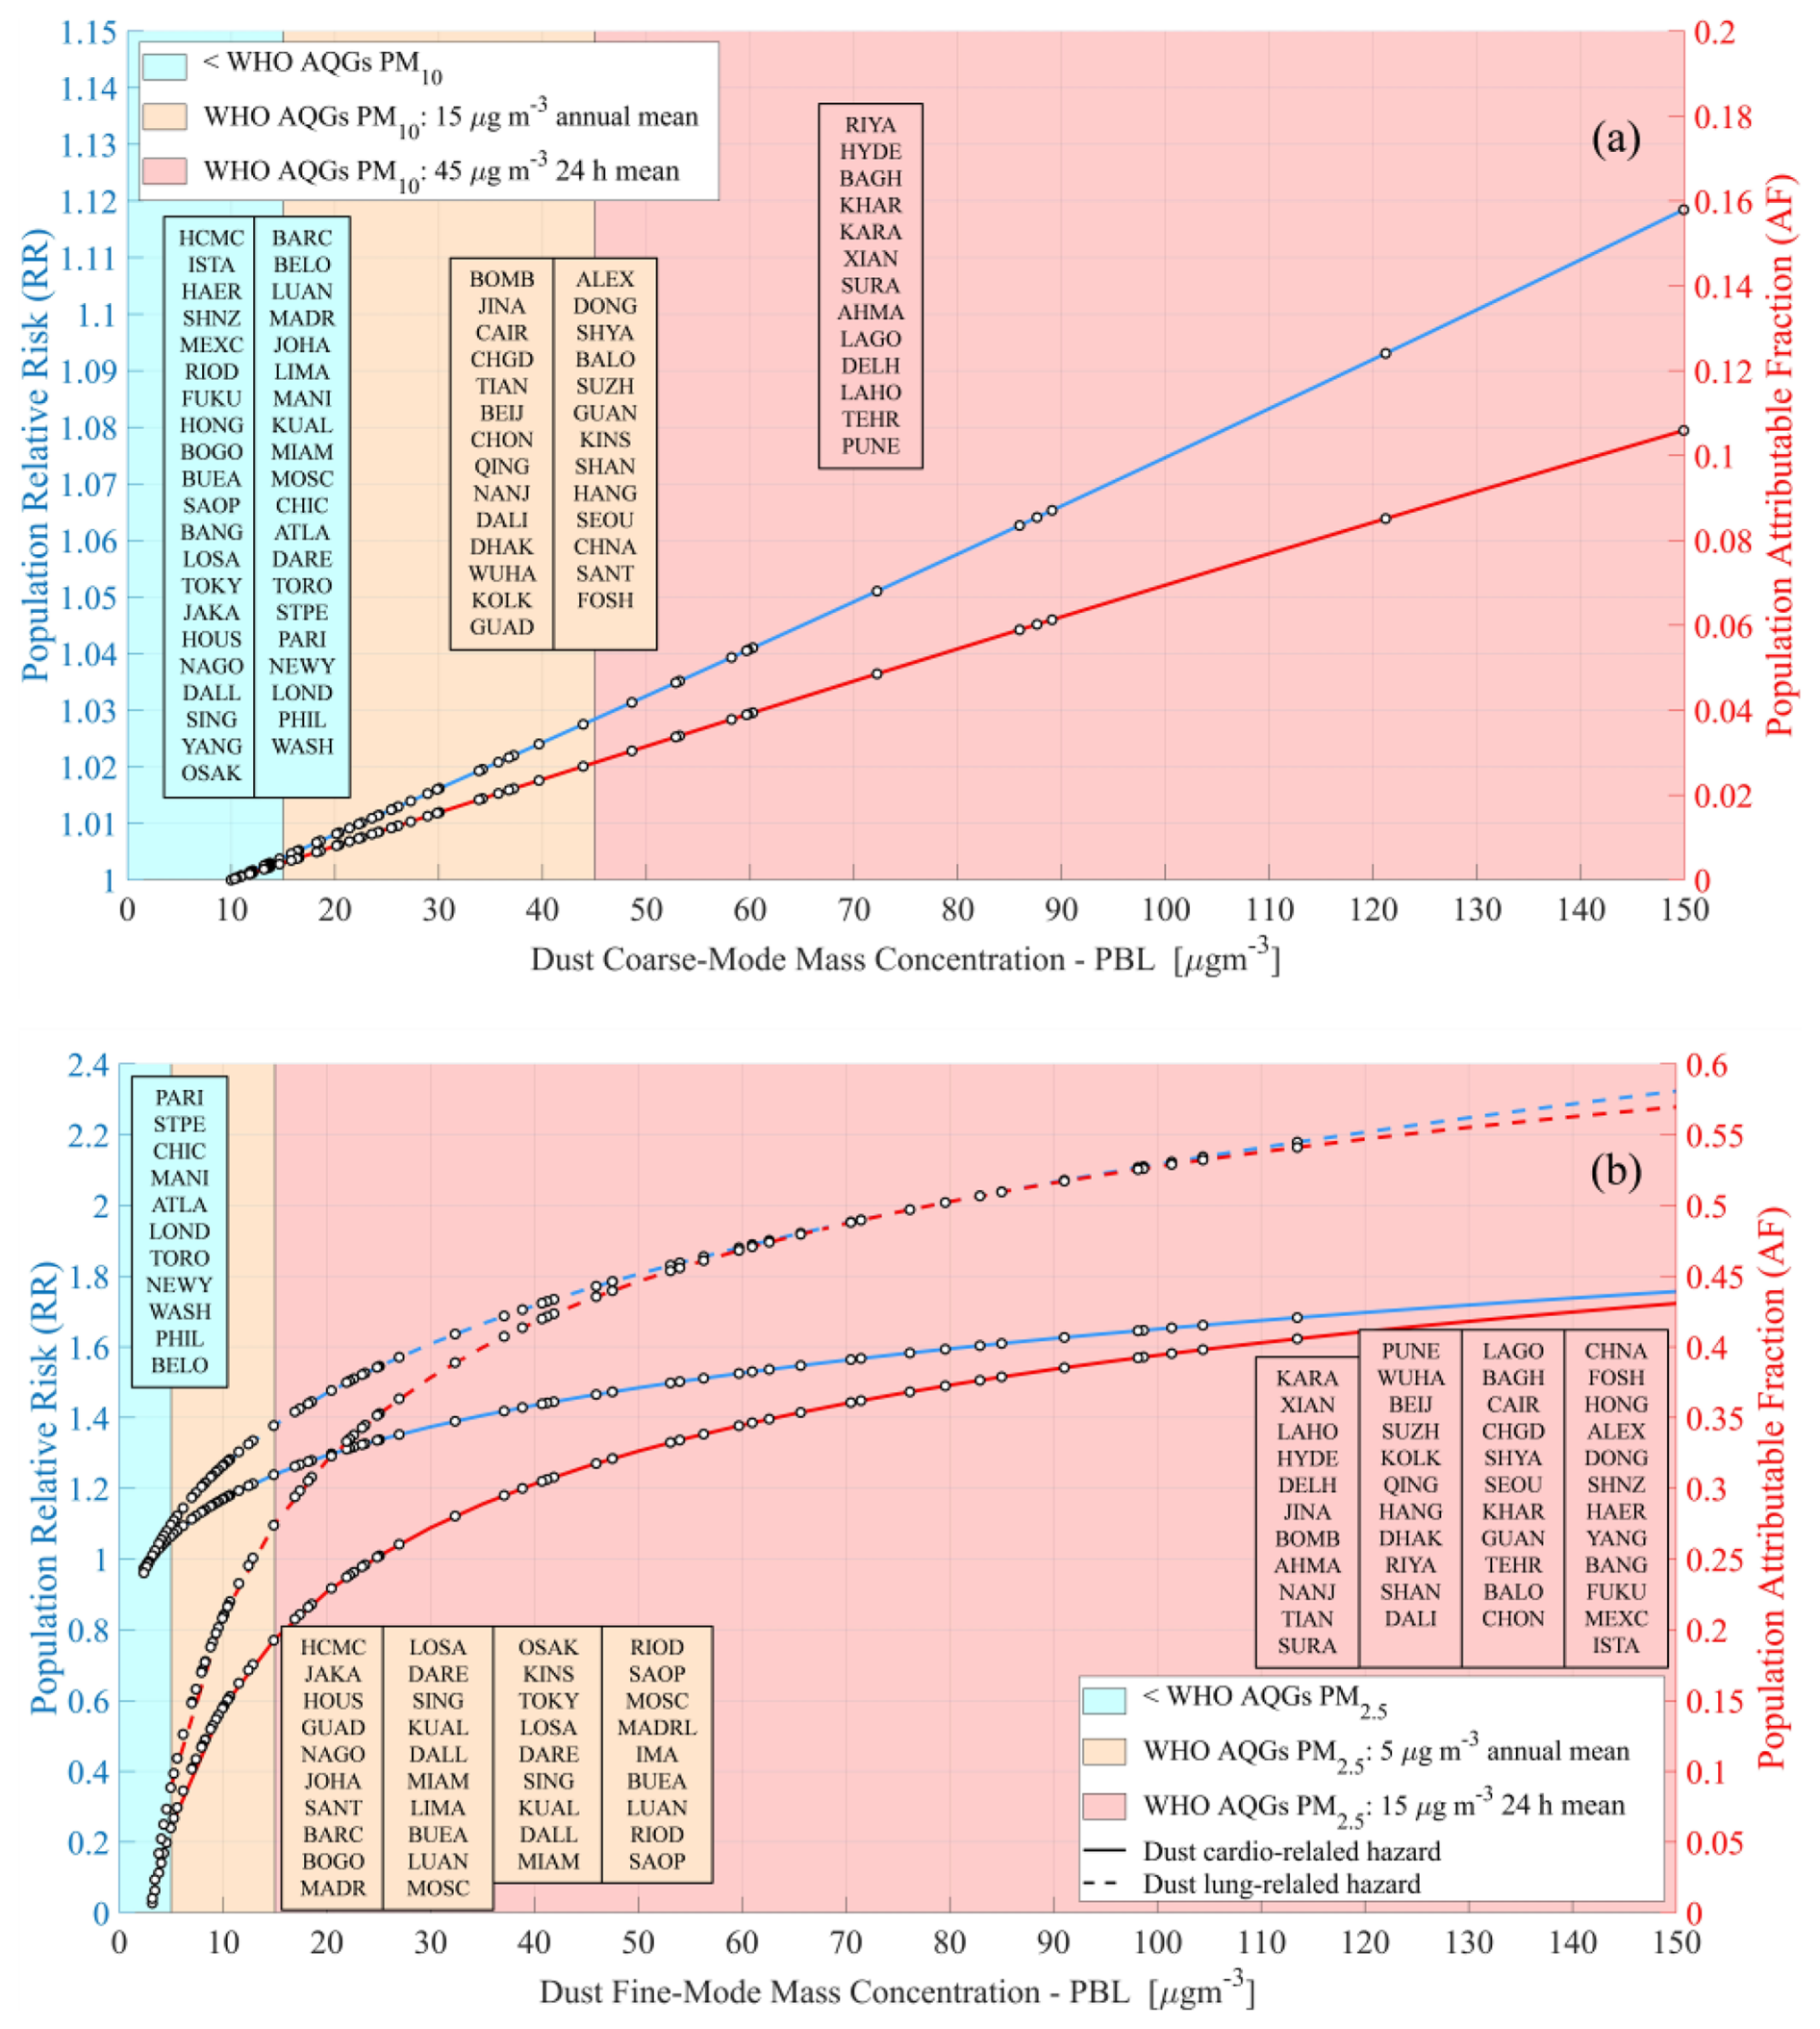
Figure 17Relative risk and attributable fraction for (a) dust coarse-mode and (b) dust fine-mode. Open circles in each curve represent the estimated index for each city. Color classification was based on WHO AQG using both annual and 24 h mean concentrations.
Table 7PBL coarse-mode dust mass concentration (mean ± std) for the EO-based temporal period (December 2006–November 2022), population relative risk (RR) mean and rage, and population attribution fraction (AF) mean and range, for the 10 large cities and megacities of the world with higher mass concentrations.
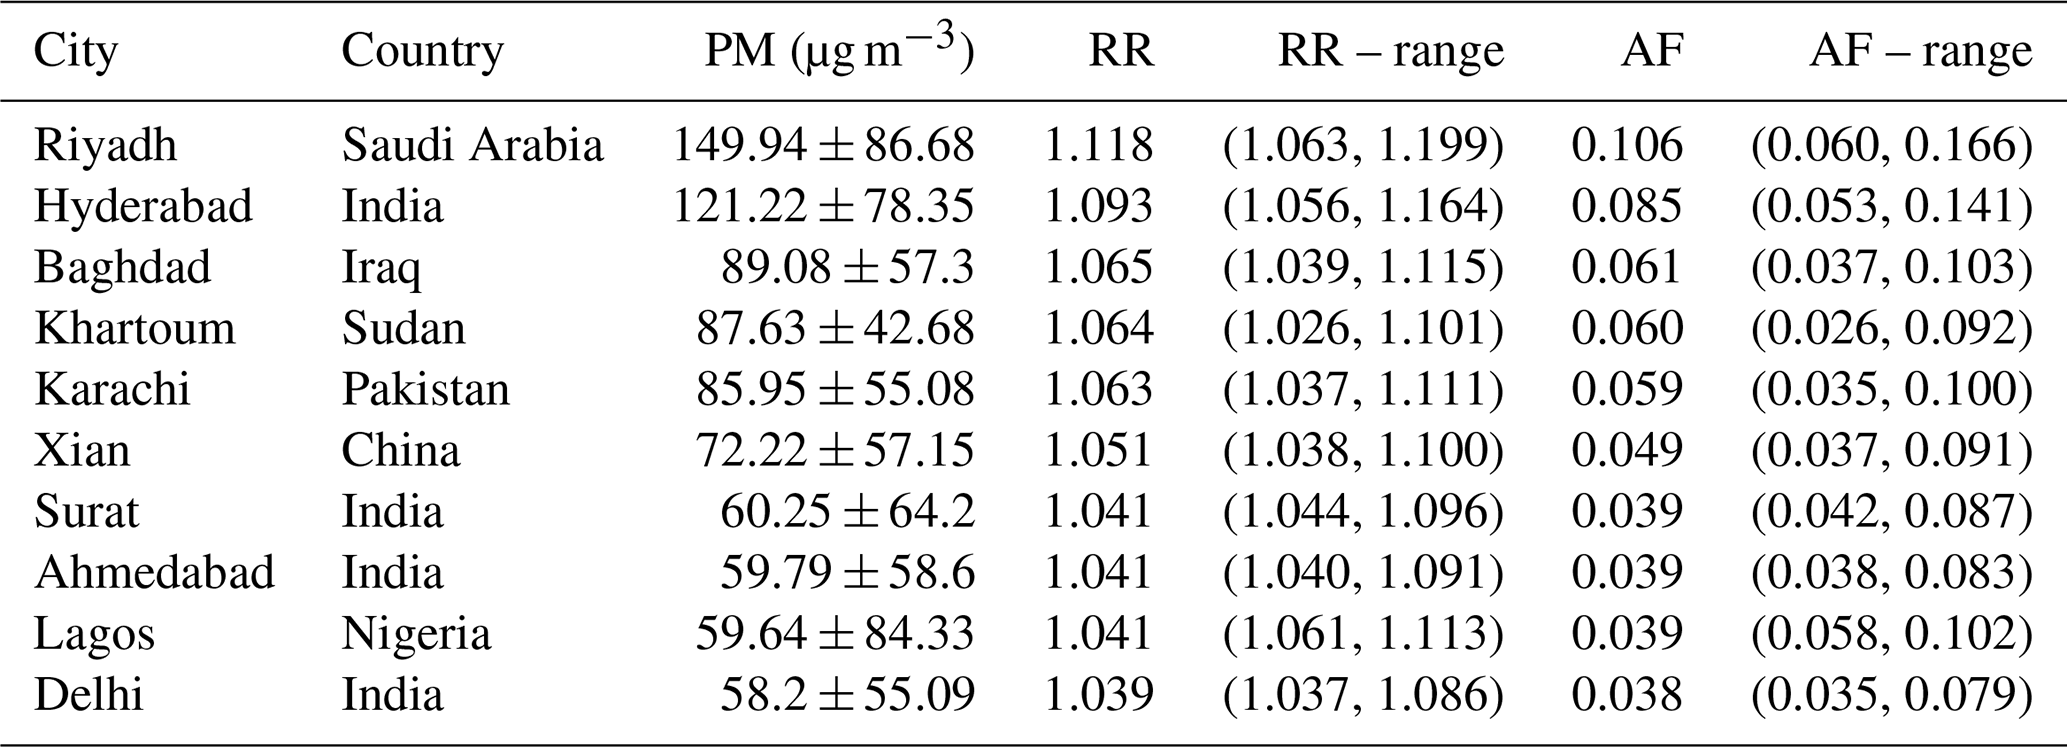
Table 8PBL fine-mode dust mass concentration (mean ± std) for the EO-based temporal period (December 2006–November 2022), population relative risk (RR) mean and rage, and population attribution fraction (AF) mean and range, for the 10 large cities and megacities of the world with higher mass concentrations, as cardiopulmonary related dust hazard.
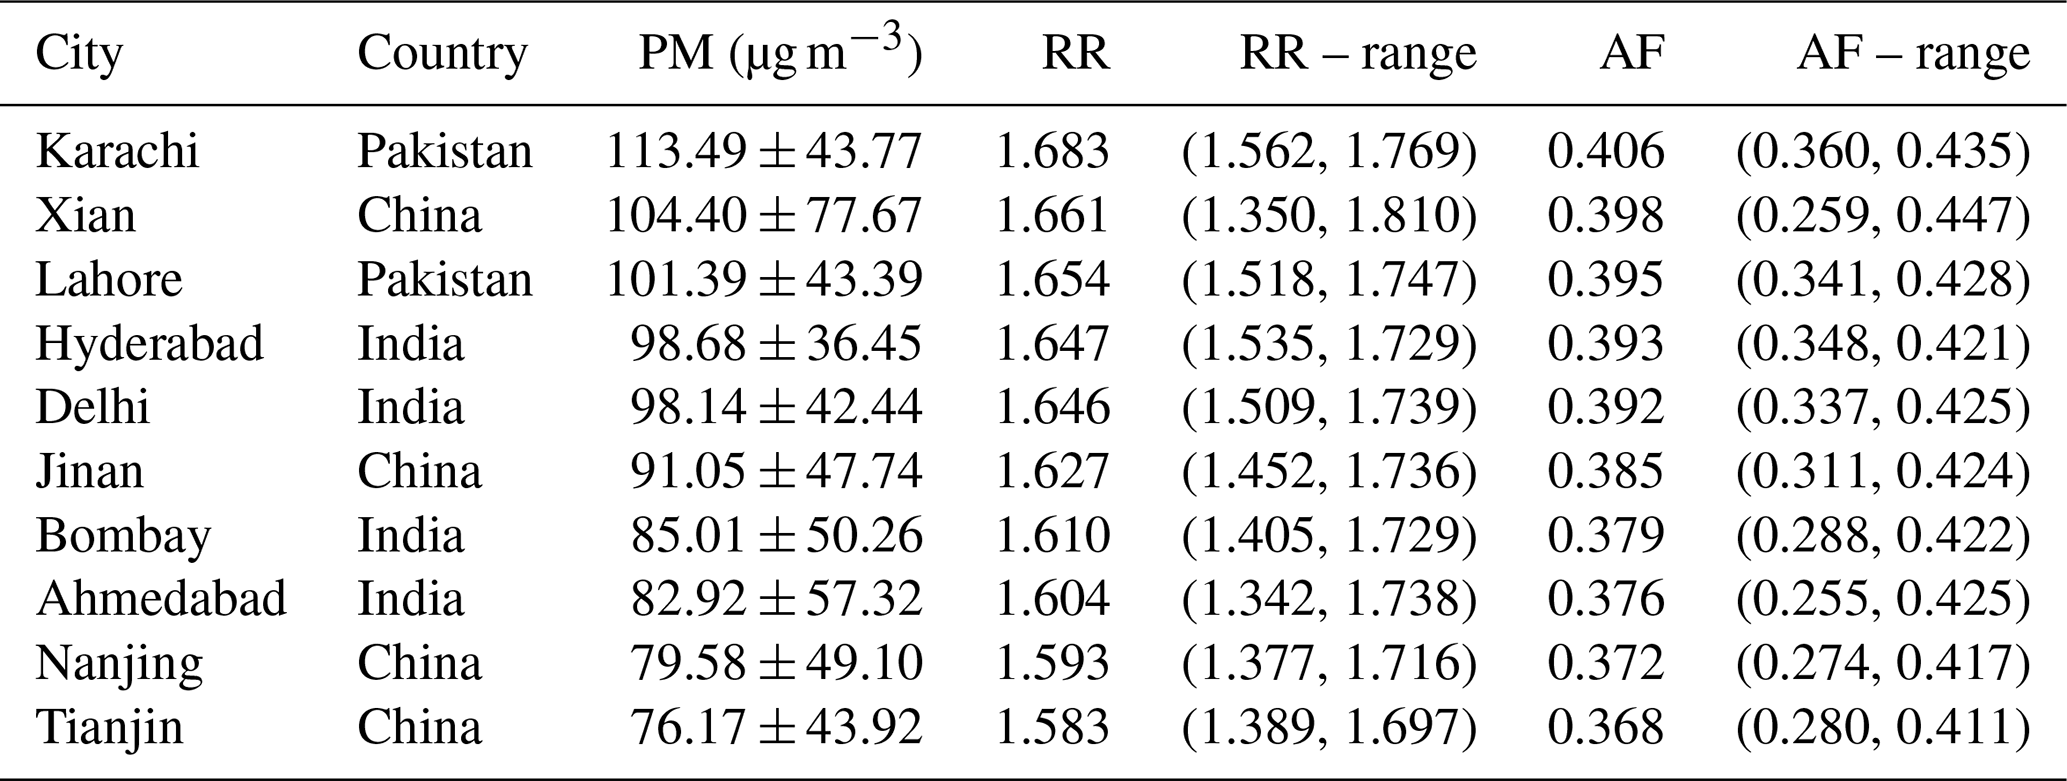
Table 9PBL fine-mode dust mass concentration (mean ± std) for the EO-based temporal period (December 2006–November 2022), population relative risk (RR) mean and rage, and population attribution fraction (AF) mean and range, for the 10 large cities and megacities of the world with higher mass concentrations, as lung cancer related dust hazard.
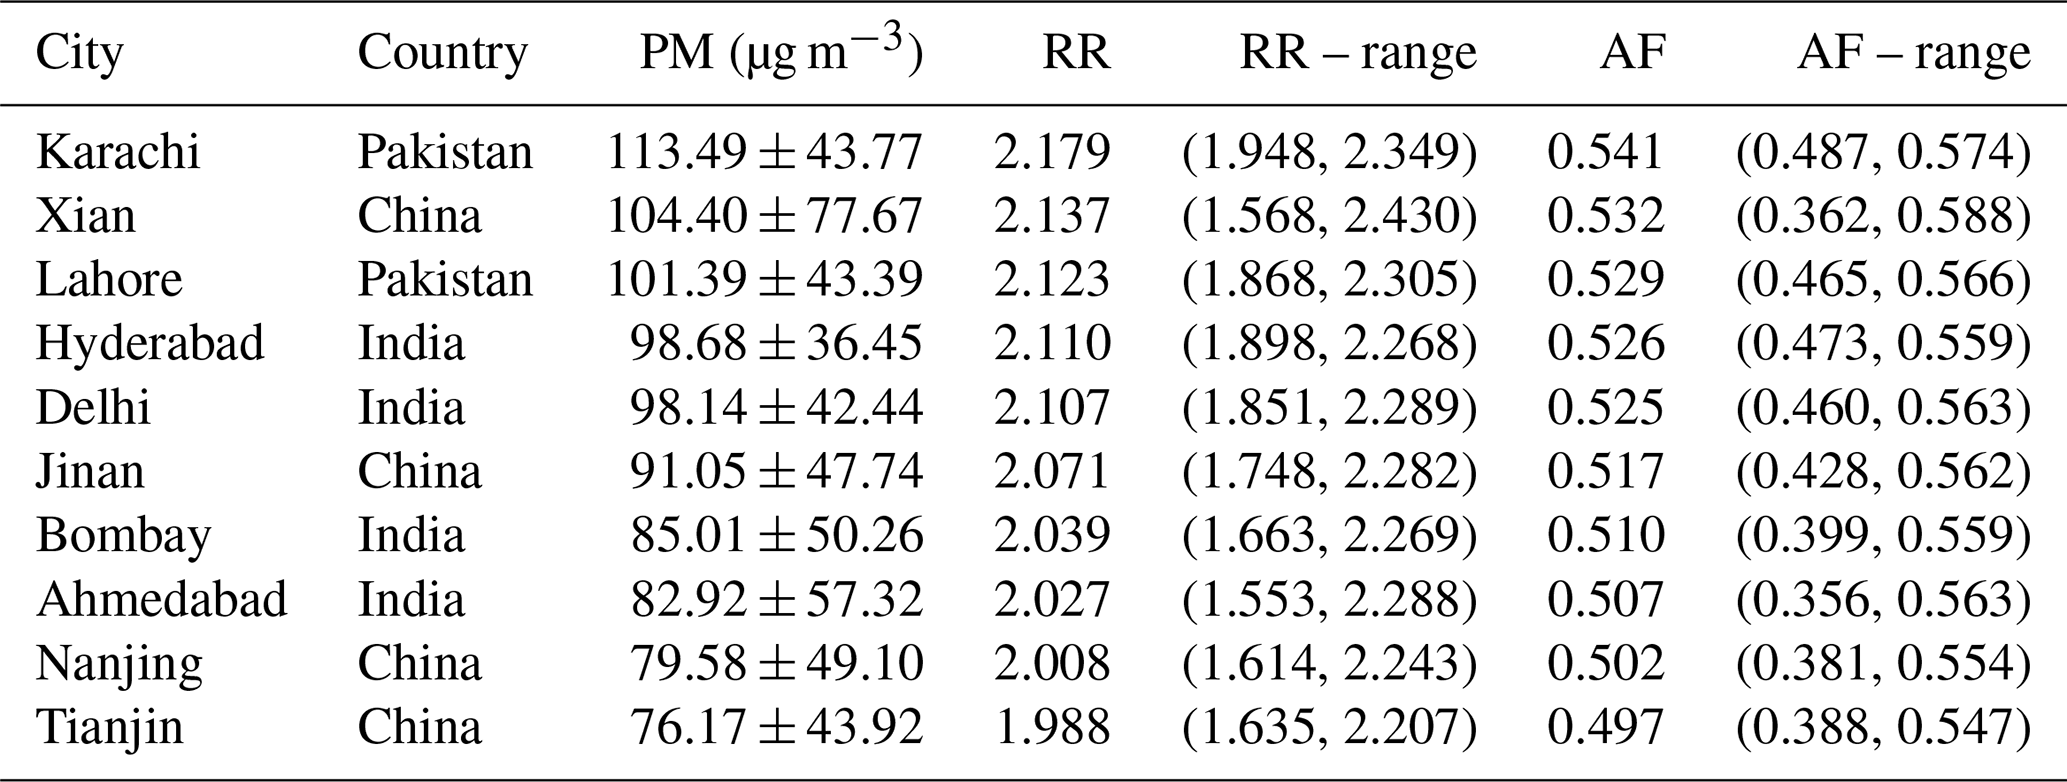
To what extent have the submicrometer (fine-mode) and supermicrometer (coarse-mode) fractions of mineral dust entrained into the atmosphere and confined within the PBL have changed over highly industrialized and densely populated urban areas during the past two decades? Is it feasible to detect statistically significant temporal trends in these changes? Which major urban centers currently experience fine-mode and coarse-mode dust mass concentrations within the PBL that exceed the WHO AQGs (WHO, 2021), and over which large cities and megacities it is foreseen the dust modes to exceed WHO AQGs in the near-future?
The present work provided EO-based quantification of the mass concentration levels of the two modes of dust and insight on the risk the hazard implies on human health. Cornerstone of the analysis is the ESA-LIVAS CDR (Amiridis et al., 2013, 2015; Marinou et al., 2017; Proestakis et al., 2018) that provides satellite-based, four-dimensional, near-global, and multiyear information on the two modes of dust, including mass concentration profiles for the period December 2006–November 2022 (Proestakis et al., 2024). In a nutshell, the ESA-LIVAS fine-mode and coarse-mode dust CDR is established through (i) a combination of long terms CALIPSO-CALIOP observations (Winker et al., 2010), (ii) laboratory experiments providing parametrizations on the dependence of depolarization ratio on dust PSD (Sakai et al., 2010; Järvinen et al., 2016), and (iii) an EARLINET-established sophisticated approach allowing to decouple the submicrometer and supermicrometer in terms of diameter components of dust, namely the two-step POLIPHON technique (Mamouri and Ansmann, 2014, 2017). The present study focused on the levels of dust fine-mode and coarse-mode mass concentration within the lowest part of the troposphere (PBL), where low air quality strongly influences human health, over the larger cities and megacities of the world, as defined by UN (UN, 2018a, 2019).
First central concluding remark is that atmospheric dust unequivocally poses a significant environmental hazard to public health in a substantial number of global large cities and megacities; conclusion reached on the basis of comparison between the EO-based derived near-surface dust mass concentrations and the WHO AQG safety thresholds. The comparison outcomes reveal that a significant proportion of major cities and megacities, approximately 49.4 % for PM10 and 87.7 % for PM2.5, exceed WHO annual mean AQG safety thresholds for coarse-mode and fine-mode dust aerosol mass concentrations within the PBL, respectively. In addition, with respect to the geographical distribution, cities in the Middle East, Indian subcontinent, East Asia, North Africa, and the Sahel-Central Africa region are particularly affected by both dust aerosol components. Based on population data from the UN (UN, 2018a, 2019), it is estimated that among approximately 807.9 million individuals residing in the world's 81 largest cities and megacities (average population, 2007–2022), ∼ 701.4 million are exposed to airborne dust levels beyond WHO AQGs. More specifically, approximately 91.7 million people live in urban areas where both fine-mode and coarse-mode dust PM concentrations remain below the WHO AQGs for PM2.5 and PM10, respectively. In contrast, around 310.8 million reside in cities where either the fine-mode or coarse-mode dust PM component exceeds the corresponding WHO AQG thresholds, while approximately 390.6 million live in urban regions where both PM2.5 and PM10 concentrations surpass the WHO air quality safety recommended limits.
Furthermore, it is of interest that the performed trend analysis carried out over the EO-based temporal period revealed in general declining tendencies in both the PBL coarse-mode and fine-mode components of dust aerosol, observed in ∼ 74.1 % and ∼ 86.4 % of the urban cities, respectively. However, in most of the cases the trends were characterized by lack of statistical significance. It is discussed and emphasized though that absence of statistically significant trends in urban centers characterized by coarse-mode or/and fine-mode dust mass concentrations within the PBL exceeding WHO AQG safety thresholds may reflect persistent exposure levels that pose and will continue to pose health risks in the coming years, potentially implying lack of effective, or adequately implemented, or even complete absence of air quality management policies, highlighting the necessity for region-specific air quality monitoring and public awareness raising, and intervention of mitigation and adaptation strategies.
Second central concluding remark is that in the years to come atmospheric dust is foreseen to remain an environmental hazard to public health in a substantial number of global large cities and megacities, in general potentially reduced in severity, however affecting a significantly larger number of individuals. It is estimated that approximately 1030 million individuals will inhabit the world's 81 largest cities and megacities during the first half of the third decade of the 21st century (UN, 2018a, 2019), population growth of approximately 27.8 % compared to the EO-based refernce temporal period. Projections of the PBL fine-mode and coarse-mode mass concentration trends into the temporal period extending beyond the EO-based temporal period indicate that of the estimated future urban population, approximately 856.5 million will be exposed to airborne dust levels potentially posing an environmental-induced human health risk. Specifically, around 195.4 million people (113.1 % increase) are expected to live in large urban areas where both PM2.5 and PM10 levels remain below WHO annual mean AQGs. In contrast, around 346.8 million individuals (11.6 % increase) will reside in large cities and megacities where either PM2.5 or PM10 concentrations exceed their respective WHO annual mean AQGs, while approximately 509.7 million of people (an 30.5 % increase) will be exposed to simultaneous exceedances of both dust components.
At a continental scale and large cities and megacities average, future projections reveal distinct trends in atmospheric dust exposure and associated health risks. In Asia, PBL coarse-mode and fine-mode dust mass concentrations are expected to decrease by approximately 25.5 % (from 33.8 to 25.2 µg m−3) and 40.3 % (from 45.6 to 27.2 µg m−3), respectively. Despite these declines, both fractions are projected to remain above WHO annual mean AQGs for PM10 and PM2.5, continuing to pose a health risk to an expanding urban population, which is estimated to grow by around 33.3 % (from 478.7 to 638.2 million). In Africa, PBL coarse-mode and fine-mode dust levels are anticipated to rise by approximately 13.5 % (from 30.8 to 34.9 µg m−3) and 12.4 % (from 21 to 23.6 µg m−3), respectively, alongside a significant population increase of around 70.8 % (from 69.1 to 118.1 million), indicating a likely intensification of the dust hazard. South America is projected to experience substantial reductions in PBL dust levels, with coarse-mode decreasing by approximately 63.2 % (from 11.2 to 4.1 µg m−3) and fine-mode by around 47.3 % (from 7.3 to 3.7 µg m−3), while the urban population is projected to grow moderately by around 14.4 % (from 79.8 to 91.2 million), suggesting lower severity of exposure despite more individuals being potentially affected. In North America, a decline of approximately 34.8 % in coarse-mode (from 7.7 to 5 µg m−3) and approximately 7.9 % in fine-mode (from 7.2 to 6.6 µg m−3) PBL dust is anticipated, accompanied by an around 18.8 % population increase (from 103.9 to 123.4 million); while coarse-mode levels are projected to fall below the WHO AQG for PM10, fine-mode is expected to remain slightly above the PM2.5 air quality recommendation threshold. Europe presents the most favorable scenario, with projected declines of approximately 18.7 % in coarse-mode (from 4.8 to 3.9 µg m−3) and approximately 38.1 % in fine-mode (from 5.6 to 3.5 µg m−3) PBL dust, and only a modest population growth of around 10.4 % (from 47.8 to 52.8 million), indicating a high probability that both PM fractions will fall below WHO annual mean AQGs, thereby reducing dust-related health risks.
As a next a final step, based on the quantified fine-mode and coarse-mode dust mass concentrations within the PBL over the major cities and megacities worldwide, the study translated the specific atmospheric dust conditions during the EO-based temporal period into associated health risks for the exposed urban populations (e.g. skin irritation, allergic reactions, cardiovascular and respiratory diseases, lung cancer; Martinelli et al., 2013; Giannadaki et al., 2014; Goudie, 2014; Querol et al., 2019; Middleton, 2020; Lazaridis, 2023). However, dust aerosol as cause and health impacts as effects, are not related linearly, but in a more complex way. To capture these effects, the study employed concentration-response functions derived from epidemiological studies (Ostro 2004; Soares et al., 2022). Using the estimated PBL dust mass concentrations for each urban area, two key health risk indicators were calculated: (i) the Relative Risk (RR), which quantifies the increased likelihood of specific health outcomes (e.g., all-cause mortality, lung cancer) due to air pollution exposure, and (ii) the Attributable Fraction (AF), which estimates the proportion of disease incidence in the population that could be prevented if ambient pollutant concentrations were reduced to reference levels. Overall, for short-term exposure to PM10, cities with coarse-mode dust levels below 15 µg m−3 showed RR < 1.004 and AF < 0.4 %, indicating minimal health impact. Cities with concentrations between 15–45 µg m−3 had RRs up to 1.030 and AFs reaching 2.8 %. In the most polluted urban environments (> 45 µg m−3) RR exceeded 1.118 with AFs reaching as high as 10.6 % (Riyadh-Saudi Arabia). For long-term exposure to PM2.5, 11 cities with fine-mode dust concentrations <5 µg m−3 exhibited RR < 1.06 for cardiopulmonary mortality and < 1.10 for lung cancer, corresponding to AFs below 6.1 % and 8.9 %, respectively. However, 70 cities with PM2.5 concentrations > 15 µg m−3 showed elevated health risks, with RR values reaching as high as 1.68 for cardiopulmonary and as high as 2.18 for lung cancer, translating to AF as high as approximately 40.6 % for cardiopulmonary and as high as 54.1 for lung cancer (Karachi-Pakistan).
Closing, among the aerosol species, mineral dust plays a dominant role in the Earth's climate system, affecting significantly anthropogenic activities, as well as humans' health. In this context, the findings of the present study are particularly valuable for data-scarce large cities and megacities, offering Earth Observation based insight into the health hazard associated with airborne dust aerosols. These insights can support evidence-based policymaking, urban planning, and public health interventions. This research has broad implications for global air quality management, especially in rapidly urbanizing regions. The demonstrated effectiveness of targeted regulatory measures, as reflected in the observed reduction of dust concentrations in certain cities, offers a promising path forward. At the same time, the identification of persistent hotspots where dust levels exceed safe thresholds underscores the urgent need for further action. By advancing observational evidence, this study contributes to a deeper scientific understanding of the health risks associated with dust aerosols. The findings highlight the necessity of integrating EO-based dust monitoring into urban health and environmental policy frameworks, facilitating the development of more effective adaptation and mitigation strategies. Ultimately, this work underscores the role of EO science in translating environmental monitoring into tangible public health benefits. It provides a strategic tool for stakeholders and decision-makers, enabling the design of robust interventions to protect human health in the face of accelerating urbanization and climate change.
The EO-based level 2 pure-dust fine-mode and coarse-mode CDR is available at https://doi.org/10.5281/zenodo.10389741 (Proestakis, 2023). The LIVAS level 2 and level 3 pure-dust CDR is available upon personal communication with Emmanouil Proestakis (proestakis@noa.gr), Eleni Marinou (elmarinou@noa.gr), and/or Vassilis Amiridis (vamoir@noa.gr). The CALIPSO lidar level 1B and level 2 data products are publicly available from the Atmospheric Science Data Center at NASA Langley Research Center (https://earthdata.nasa.gov/eosdis/daacs/asdc, Earthdata, last access: 29 October 2025). Population estimates of large cities and megacities over a long time period (1950–2035) is provided by the UN's collection of datasets (https://population.un.org/wup/, last access: 29 October 2025).
EP: conceptualization, methodology, software, data curation, formal analysis, and project administration. KP: conceptualization, methodology, data curation, formal analysis. Thanasis Georgiou: software, data curation, and formal analysis. SEC: conceptualization, methodology, software, data curation, formal analysis, investigation, and visualization. ML: conceptualization and methodology. AG: conceptualization and investigation. IF: conceptualization and validation. IT: conceptualizations. MPP: methodology. VA: conceptualization.
The contact author has declared that none of the authors has any competing interests.
Publisher’s note: Copernicus Publications remains neutral with regard to jurisdictional claims made in the text, published maps, institutional affiliations, or any other geographical representation in this paper. While Copernicus Publications makes every effort to include appropriate place names, the final responsibility lies with the authors. Views expressed in the text are those of the authors and do not necessarily reflect the views of the publisher.
This article is part of the special issue “Sun-photometric measurements of aerosols: harmonization, comparisons, synergies, effects, and applications”. It is not associated with a conference.
Emmanouil Proestakis acknowledges support by the AXA Research Fund for postdoctoral researchers under the project entitled “Earth Observation for Air-Quality – Dust Fine-Mode (EO4AQ-DustFM)”. Emmanouil Proestakis and Kyriakoula Papachristopoulou would like to acknowledge the COST Action HARMONIA, CA21119, supported by COST (European Cooperation in Science and Technology).
This research has been supported by the AXA Research Fund by the AXA Research Fund for postdoctoral researchers under the project entitled “Earth Observation for Air-Quality – Dust Fine-Mode (EO4AQ-DustFM)”.
This paper was edited by Matthias Tesche and reviewed by four anonymous referees.
Abera, A., Friberg, J., Isaxon, C., Jerrett, M., Malmqvist, E., Sjöström, C., Taj, T., and Vargas, A. M.: Air Quality in Africa: Public Health Implications, Annual Review of Public Health, 42, 193–210, https://doi.org/10.1146/annurev-publhealth-100119-113802, 2021.
Achakulwisut, P., Mickley, L. J., and Anenberg, S. C.: Drought-sensitivity of fine dust in the US Southwest: Implications for air quality and public health under future climate change, Environ. Res. Lett., 13, 054025, https://doi.org/10.1088/1748-9326/aabf20, 2018.
Adebiyi, A. A. and Kok, J. F.: Climate models miss most of the coarse dust in the atmosphere, Science Advances, 6, eaaz9507, https://doi.org/10.1126/sciadv.aaz9507, 2020.
Adebiyi, A., Kok, J. F., Murray, B. J., Ryder, C. L., Stuut, J.-B. W., Kahn, R. A., Knippertz, P., Formenti, P., Mahowald, N. M., Pérez García-Pando, C., Klose, M., Ansmann, A., Samset, B. H., Ito, A., Balkanski, Y., Di Biagio, C., Romanias, M. N., Huang, Y., and Meng, J.: A review of coarse mineral dust in the Earth system, Aeolian Research, 60, 100849, https://doi.org/10.1016/j.aeolia.2022.100849, 2023.
Agier, L., Deroubaix, A., Martiny, N., Yaka, P., Djibo, A., and Broutin, H.: Seasonality of meningitis in Africa and climate forcing: aerosols stand out, Journal of The Royal Society Interface, 10, 20120814, https://doi.org/10.1098/rsif.2012.0814, 2013.
Albrecht, B.: Aerosols, Cloud Microphysics, and Fractional Cloudiness, Science, 245, 1227–1230, https://doi.org/10.1126/science.245.4923.1227, 1989.
Amiridis, V., Wandinger, U., Marinou, E., Giannakaki, E., Tsekeri, A., Basart, S., Kazadzis, S., Gkikas, A., Taylor, M., Baldasano, J., and Ansmann, A.: Optimizing CALIPSO Saharan dust retrievals, Atmos. Chem. Phys., 13, 12089–12106, https://doi.org/10.5194/acp-13-12089-2013, 2013.
Amiridis, V., Marinou, E., Tsekeri, A., Wandinger, U., Schwarz, A., Giannakaki, E., Mamouri, R., Kokkalis, P., Binietoglou, I., Solomos, S., Herekakis, T., Kazadzis, S., Gerasopoulos, E., Proestakis, E., Kottas, M., Balis, D., Papayannis, A., Kontoes, C., Kourtidis, K., Papagiannopoulos, N., Mona, L., Pappalardo, G., Le Rille, O., and Ansmann, A.: LIVAS: a 3-D multi-wavelength aerosol/cloud database based on CALIPSO and EARLINET, Atmos. Chem. Phys., 15, 7127–7153, https://doi.org/10.5194/acp-15-7127-2015, 2015.
An, L., Che, H., Xue, M., Zhang, T., Wang, H., Wang, Y., Zhou, C., Zhao, H., Gui, K., Zheng, Y., Sun, T., Liang, Y., Sun, E., Zhang, H., and Zhang, X.: Temporal and spatial variations in sand and dust storm events in East Asia from 2007 to 2016: Relationships with surface conditions and climate change, Science of The Total Environment, 633, 452–462, https://doi.org/10.1016/j.scitotenv.2018.03.068, 2018.
Ansmann, A., Petzold, A., Kandler, K., Tegen, I., Wendisch, M., Müller, D., Weinzierl, B., Müller, T., and Heintzenberg, J.: Saharan Mineral Dust Experiments SAMUM–1 and SAMUM–2: what have we learned?, Tellus B: Chemical and Physical Meteorology, 63, 403–429, https://doi.org/10.1111/j.1600-0889.2011.00555.x, 2011.
Ansmann, A., Seifert, P., Tesche, M., and Wandinger, U.: Profiling of fine and coarse particle mass: case studies of Saharan dust and Eyjafjallajökull/Grimsvötn volcanic plumes, Atmos. Chem. Phys., 12, 9399–9415, https://doi.org/10.5194/acp-12-9399-2012, 2012.
Ansmann, A., Rittmeister, F., Engelmann, R., Basart, S., Jorba, O., Spyrou, C., Remy, S., Skupin, A., Baars, H., Seifert, P., Senf, F., and Kanitz, T.: Profiling of Saharan dust from the Caribbean to western Africa – Part 2: Shipborne lidar measurements versus forecasts, Atmos. Chem. Phys., 17, 14987–15006, https://doi.org/10.5194/acp-17-14987-2017, 2017.
Ansmann, A., Mamouri, R.-E., Hofer, J., Baars, H., Althausen, D., and Abdullaev, S. F.: Dust mass, cloud condensation nuclei, and ice-nucleating particle profiling with polarization lidar: updated POLIPHON conversion factors from global AERONET analysis, Atmos. Meas. Tech., 12, 4849–4865, https://doi.org/10.5194/amt-12-4849-2019, 2019.
Aryal, Y. and Evans, S.: Decreasing Trends in the Western US Dust Intensity With Rareness of Heavy Dust Events, Journal of Geophysical Research: Atmospheres, 127, e2021JD036163, https://doi.org/10.1029/2021JD036163, 2022.
Aslanoğlu, S. Y., Proestakis, E., Gkikas, A., Güllü, G., and Amiridis, V.: Dust Climatology of Turkey as a Part of the Eastern Mediterranean Basin via 9-Year CALIPSO-Derived Product, Atmosphere, 13, 733, https://doi.org/10.3390/atmos13050733, 2022.
Astitha, M., Lelieveld, J., Abdel Kader, M., Pozzer, A., and de Meij, A.: Parameterization of dust emissions in the global atmospheric chemistry-climate model EMAC: impact of nudging and soil properties, Atmos. Chem. Phys., 12, 11057–11083, https://doi.org/10.5194/acp-12-11057-2012, 2012.
Baars, H., Kanitz, T., Engelmann, R., Althausen, D., Heese, B., Komppula, M., Preißler, J., Tesche, M., Ansmann, A., Wandinger, U., Lim, J.-H., Ahn, J. Y., Stachlewska, I. S., Amiridis, V., Marinou, E., Seifert, P., Hofer, J., Skupin, A., Schneider, F., Bohlmann, S., Foth, A., Bley, S., Pfüller, A., Giannakaki, E., Lihavainen, H., Viisanen, Y., Hooda, R. K., Pereira, S. N., Bortoli, D., Wagner, F., Mattis, I., Janicka, L., Markowicz, K. M., Achtert, P., Artaxo, P., Pauliquevis, T., Souza, R. A. F., Sharma, V. P., van Zyl, P. G., Beukes, J. P., Sun, J., Rohwer, E. G., Deng, R., Mamouri, R.-E., and Zamorano, F.: An overview of the first decade of PollyNET: an emerging network of automated Raman-polarization lidars for continuous aerosol profiling, Atmos. Chem. Phys., 16, 5111–5137, https://doi.org/10.5194/acp-16-5111-2016, 2016.
Barlow, J. F.: Progress in observing and modelling the urban boundary layer, Urban Climate, 10, 216–240, https://doi.org/10.1016/j.uclim.2014.03.011, 2014.
Bory, A. J. M., Biscaye, P. E., and Grousset, F. E.: Two distinct seasonal Asian source regions for mineral dust deposited in Greenland (NorthGRIP), Geophys. Res. Lett., 30, 1167, https://doi.org/10.1029/2002GL016446, 2003.
Bousquet, J., Ndiaye, M., Aït-Khaled, N., Annesi-Maesano, I., and Vignola, A.-M.: Management of chronic respiratory and allergic diseases in developing countries. Focus on sub-Saharan Africa, Allergy, 58, 265–283, https://doi.org/10.1034/j.1398-9995.2003.02005.x, 2003.
Brooks, I. M.: Finding boundary layer top: Application of a wavelet covariance transform to lidar backscatter profiles, Journal of Atmospheric and Oceanic Technology, 20, 1092–1105, 2003.
Ceccato, P., Trzaska, S., Pérez García-Pando, C., Kalashnikova, O., del Corral, J., Cousin, R., Blumenthal, M. B., Bell, M., Connor, S. J., and Thomson, M. C.: Improving decision-making activities for meningitis and malaria, Geocarto International, 29, 19–38, https://doi.org/10.1080/10106049.2013.827749, 2014.
Chalvatzaki, E., Chatoutsidou, S. E., Lehtomäki, H., Almeida, S. M., Eleftheriadis, K., Hänninen, O., and Lazaridis, M.: Characterization of Human Health Risks from Particulate Air Pollution in Selected European Cities, Atmosphere, 10, 96, https://doi.org/10.3390/atmos10020096, 2019.
Chang, C.-C., Lee, I.-M., Tsai, S.-S., and Yang, C.-Y.: Correlation of Asian Dust Storm Events with Daily Clinic Visits for Allergic Rhinitis in Taipei, Taiwan, Journal of Toxicology and Environmental Health, Part A, 69, 229–235, https://doi.org/10.1080/15287390500227415, 2006.
Che, H., Xia, X., Zhu, J., Li, Z., Dubovik, O., Holben, B., Goloub, P., Chen, H., Estelles, V., Cuevas-Agulló, E., Blarel, L., Wang, H., Zhao, H., Zhang, X., Wang, Y., Sun, J., Tao, R., Zhang, X., and Shi, G.: Column aerosol optical properties and aerosol radiative forcing during a serious haze-fog month over North China Plain in 2013 based on ground-based sunphotometer measurements, Atmos. Chem. Phys., 14, 2125–2138, https://doi.org/10.5194/acp-14-2125-2014, 2014.
Che, H., Zhang, X.-Y., Xia, X., Goloub, P., Holben, B., Zhao, H., Wang, Y., Zhang, X.-C., Wang, H., Blarel, L., Damiri, B., Zhang, R., Deng, X., Ma, Y., Wang, T., Geng, F., Qi, B., Zhu, J., Yu, J., Chen, Q., and Shi, G.: Ground-based aerosol climatology of China: aerosol optical depths from the China Aerosol Remote Sensing Network (CARSNET) 2002–2013, Atmos. Chem. Phys., 15, 7619–7652, https://doi.org/10.5194/acp-15-7619-2015, 2015.
Che, H., Gui, K., Xia, X., Wang, Y., Holben, B. N., Goloub, P., Cuevas-Agulló, E., Wang, H., Zheng, Y., Zhao, H., and Zhang, X.: Large contribution of meteorological factors to inter-decadal changes in regional aerosol optical depth, Atmos. Chem. Phys., 19, 10497–10523, https://doi.org/10.5194/acp-19-10497-2019, 2019.
Chen, S., Jiang, N., Huang, J., Xu, X., Zhang, H., Zang, Z., Huang, K., Xu, X., Wei, Y., Guan, X., Zhang, X., Luo, Y., Hu, Z., and Feng, T.: Quantifying contributions of natural and anthropogenic dust emission from different climatic regions, Atmospheric Environment, 191, 94–104, https://doi.org/10.1016/j.atmosenv.2018.07.043, 2018.
Chen, S., Jiang, N., Huang, J., Zang, Z., Guan, X., Ma, X., Luo, Y., Li, J., Zhang, X., and Zhang, Y.: Estimations of indirect and direct anthropogenic dust emission at the global scale, Atmospheric Environment, 200, 50–60, https://doi.org/10.1016/j.atmosenv.2018.11.063, 2019.
Chen, Y.-S., Sheen, P.-C., Chen, E.-R., Liu, Y.-K., Wu, T.-N., and Yang, C.-Y.: Effects of Asian dust storm events on daily mortality in Taipei, Taiwan, Environmental Research, 95, 151–155, https://doi.org/10.1016/j.envres.2003.08.008, 2004.
Cheng, M.-F., Ho, S.-C., Chiu, H.-F., Wu, T.-N., Chen, P.-S., and Yang, C.-Y.: Consequences of Exposure to Asian Dust Storm Events on Daily Pneumonia Hospital Admissions in Taipei, Taiwan, Journal of Toxicology and Environmental Health, Part A, 71, 1295–1299, https://doi.org/10.1080/15287390802114808, 2008.
Cheng, T., Chen, H., Gu, X., Yu, T., Guo, J., and Guo, H.: The inter-comparison of MODIS, MISR and GOCART aerosol products against AERONET data over China, Journal of Quantitative Spectroscopy and Radiative Transfer, 113, 2135–2145, https://doi.org/10.1016/j.jqsrt.2012.06.016, 2012.
De Longueville, F., Hountondji, Y.-C., Henry, S., and Ozer, P.: What do we know about effects of desert dust on air quality and human health in West Africa compared to other regions?, Science of The Total Environment, 409, 1–8, https://doi.org/10.1016/j.scitotenv.2010.09.025, 2010.
De Longueville, F., Hountondji, Y.-C., Ozer, P., Marticorena, B., Chatenet, B., and Henry, S.: Saharan Dust Impacts on Air Quality: What Are the Potential Health Risks in West Africa?, Human and Ecological Risk Assessment: An International Journal, 19, 1595–1617, https://doi.org/10.1080/10807039.2012.716684, 2013.
de Meij, A., Pozzer, A., and Lelieveld, J.: Trend analysis in aerosol optical depths and pollutant emission estimates between 2000 and 2009, Atmos. Environ., 51, 75–85, https://doi.org/10.1016/j.atmosenv.2012.01.059, 2012.
DeMott, P. J., Sassen, K., Poellot, M. R., Baumgardner, D., Rogers, D. C., Brooks, S. D., Prenni, A. J., and Kreidenweis, S. M.: Correction to “African dust aerosols as atmospheric ice nuclei,” Geophysical Research Letters, 36, https://doi.org/10.1029/2009GL037639, 2009.
Derbyshire, E.: Natural Minerogenic Dust and Human Health, ambi, 36, 73–77, https://doi.org/10.1579/0044-7447(2007)36[73:NMDAHH]2.0.CO;2, 2007.
Deroubaix, A., Martiny, N., Chiapello, I., and Marticorena, B.: Suitability of OMI aerosol index to reflect mineral dust surface conditions: Preliminary application for studying the link with meningitis epidemics in the Sahel, Remote Sensing of Environment, 133, 116–127, https://doi.org/10.1016/j.rse.2013.02.009, 2013.
Dey, S., Tripathi, S. N., Singh, R. P., and Holben, B. N.: Influence of dust storms on the aerosol optical properties over the Indo-Gangetic basin, Journal of Geophysical Research: Atmospheres, 109, https://doi.org/10.1029/2004JD004924, 2004.
Drakaki, E., Amiridis, V., Tsekeri, A., Gkikas, A., Proestakis, E., Mallios, S., Solomos, S., Spyrou, C., Marinou, E., Ryder, C. L., Bouris, D., and Katsafados, P.: Modeling coarse and giant desert dust particles, Atmos. Chem. Phys., 22, 12727–12748, https://doi.org/10.5194/acp-22-12727-2022, 2022.
Du, P., Huang, Z., Tang, S., Dong, Q., Bi, J., Yu, X., and Gu, Q.: Long-Term Variation of Dust Devils in East Asia During 1959–2021, Journal of Geophysical Research: Atmospheres, 128, e2022JD038013, https://doi.org/10.1029/2022JD038013, 2023.
Dubovik, O. and King, M. D.: A flexible inversion algorithm for retrieval of aerosol optical properties from Sun and sky radiance measurements, Journal of Geophysical Research: Atmospheres, 105, 20673–20696, https://doi.org/10.1029/2000JD900282, 2000.
Duce, R. A., Unni, C. K., Ray, B. J., Prospero, J. M., and Merrill, J. T.: Long-Range Atmospheric Transport of Soil Dust from Asia to the Tropical North Pacific: Temporal Variability, Science, 209, 1522–1524, https://doi.org/10.1126/science.209.4464.1522, 1980.
Eck, T. F., Holben, B. N., Reid, J. S., Dubovik, O., Smirnov, A., O'Neill, N. T., Slutsker, I., and Kinne, S.: Wavelength dependence of the optical depth of biomass burning, urban and desert dust aerosols, J. Geophys. Res., 104, 31333–31350, https://doi.org/10.1029/1999JD900923, 1999.
Esselborn, M., Wirth, M., Fix, A., Weinzierl, B., Rasp, K., Tesche, M., and Petzold, A.: Spatial distribution and optical properties of Saharan dust observed by airborne high spectral resolution lidar during SAMUM 2006, Tellus B: Chemical and Physical Meteorology, 61, https://doi.org/10.1111/j.1600-0889.2008.00394.x, 2009.
Fan, B., Guo, L., Li, N., Chen, J., Lin, H., Zhang, X., Shen, M., Rao, Y., Wang, C., and Ma, L.: Earlier vegetation green-up has reduced spring dust storms, Sci. Rep., 4, 6749, https://doi.org/10.1038/srep06749, 2014.
Fan, R., Ma, Y., Jin, S., Gong, W., Liu, B., Wang, W., Li, H., and Zhang, Y.: Validation, analysis, and comparison of MISR V23 aerosol optical depth products with MODIS and AERONET observations, Science of The Total Environment, 856, 159117, https://doi.org/10.1016/j.scitotenv.2022.159117, 2023.
Fiedler, S., Schepanski, K., Heinold, B., Knippertz, P., and Tegen, I.: Climatology of nocturnal low-level jets over North Africa and implications for modeling mineral dust emission, J. Geophys. Res.-Atmos., 118, 6100–6121, https://doi.org/10.1002/jgrd.50394, 2013.
Filioglou, M., Giannakaki, E., Backman, J., Kesti, J., Hirsikko, A., Engelmann, R., O'Connor, E., Leskinen, J. T. T., Shang, X., Korhonen, H., Lihavainen, H., Romakkaniemi, S., and Komppula, M.: Optical and geometrical aerosol particle properties over the United Arab Emirates, Atmos. Chem. Phys., 20, 8909–8922, https://doi.org/10.5194/acp-20-8909-2020, 2020.
Floutsi, A. A., Baars, H., Engelmann, R., Althausen, D., Ansmann, A., Bohlmann, S., Heese, B., Hofer, J., Kanitz, T., Haarig, M., Ohneiser, K., Radenz, M., Seifert, P., Skupin, A., Yin, Z., Abdullaev, S. F., Komppula, M., Filioglou, M., Giannakaki, E., Stachlewska, I. S., Janicka, L., Bortoli, D., Marinou, E., Amiridis, V., Gialitaki, A., Mamouri, R.-E., Barja, B., and Wandinger, U.: DeLiAn – a growing collection of depolarization ratio, lidar ratio and Ångström exponent for different aerosol types and mixtures from ground-based lidar observations, Atmos. Meas. Tech., 16, 2353–2379, https://doi.org/10.5194/amt-16-2353-2023, 2023.
Fountoulakis, I., Kosmopoulos, P., Papachristopoulou, K., Raptis, I.-P., Mamouri, R.-E., Nisantzi, A., Gkikas, A., Witthuhn, J., Bley, S., Moustaka, A., Buehl, J., Seifert, P., Hadjimitsis, D. G., Kontoes, C., and Kazadzis, S.: Effects of Aerosols and Clouds on the Levels of Surface Solar Radiation and Solar Energy in Cyprus, Remote Sensing, 13, 2319, https://doi.org/10.3390/rs13122319, 2021.
Freudenthaler, V., Esselborn, M., Wiegner, M., Heese, B., Tesche, M., Ansmann, A., Müller, D., Althausen, D., Wirth, M., Fix, A., Ehret, G., Knippertz, P., Toledano, C., Gasteiger, J., Garhammer, M., and Seefeldner, M.: Depolarization ratio profiling at several wavelengths in pure Saharan dust during SAMUM 2006, Tellus B: Chemical and Physical Meteorology, 61, 165–179, https://doi.org/10.1111/j.1600-0889.2008.00396.x, 2009.
Ganguly, T., Selvaraj, K. L., and Guttikunda, S. K.: National Clean Air Programme (NCAP) for Indian cities: Review and outlook of clean air action plans, Atmospheric Environment: X, 8, 100096, https://doi.org/10.1016/j.aeaoa.2020.100096, 2020.
Gao, H., Yang, W., Wang, J., and Zheng, X.: Analysis of the Effectiveness of Air Pollution Control Policies Based on Historical Evaluation and Deep Learning Forecast: A Case Study of Chengdu-Chongqing Region in China, Sustainability, 13, 206, https://doi.org/10.3390/su13010206, 2021.
Gao, Y., Fan, S.-M., and Sarmiento, J. L.: Aeolian iron input to the ocean through precipitation scavenging: A modeling perspective and its implication for natural iron fertilization in the ocean, Journal of Geophysical Research: Atmospheres, 108, https://doi.org/10.1029/2002JD002420, 2003.
García-Pando, C. P., Thomson, M. C., Stanton, M. C., Diggle, P. J., Hopson, T., Pandya, R., Miller, R. L., and Hugonnet, S.: Meningitis and climate: from science to practice, Earth Perspectives, 1, 14, https://doi.org/10.1186/2194-6434-1-14, 2014.
Gassó, S. and Torres, O.: Temporal Characterization of Dust Activity in the Central Patagonia Desert (Years 1964–2017), Journal of Geophysical Research: Atmospheres, 124, 3417–3434, https://doi.org/10.1029/2018JD030209, 2019.
Giannadaki, D., Pozzer, A., and Lelieveld, J.: Modeled global effects of airborne desert dust on air quality and premature mortality, Atmos. Chem. Phys., 14, 957–968, https://doi.org/10.5194/acp-14-957-2014, 2014.
Giles, D. M., Sinyuk, A., Sorokin, M. G., Schafer, J. S., Smirnov, A., Slutsker, I., Eck, T. F., Holben, B. N., Lewis, J. R., Campbell, J. R., Welton, E. J., Korkin, S. V., and Lyapustin, A. I.: Advancements in the Aerosol Robotic Network (AERONET) Version 3 database – automated near-real-time quality control algorithm with improved cloud screening for Sun photometer aerosol optical depth (AOD) measurements, Atmos. Meas. Tech., 12, 169–209, https://doi.org/10.5194/amt-12-169-2019, 2019.
Ginoux, P., Chin, M., Tegen, I., Prospero, J. M., Holben, B., Dubovik, O., and Lin, S.-J.: Sources and distributions of dust aerosols simulated with the GOCART model, Journal of Geophysical Research: Atmospheres, 106, 20255–20273, https://doi.org/10.1029/2000JD000053, 2001.
Ginoux, P., Prospero, J. M., Gill, T. E., Hsu, N. C., and Zhao, M.: Global-scale attribution of anthropogenic and natural dust sources and their emission rates based on MODIS Deep Blue aerosol products, Reviews of Geophysics, 50, https://doi.org/10.1029/2012RG000388, 2012.
Gkikas, A., Houssos, E. E., Lolis, C. J., Bartzokas, A., Mihalopoulos, N., and Hatzianastassiou, N.: Atmospheric circulation evolution related to desert-dust episodes over the Mediterranean, Quarterly Journal of the Royal Meteorological Society, 141, 1634–1645, https://doi.org/10.1002/qj.2466, 2015.
Gkikas, A., Basart, S., Hatzianastassiou, N., Marinou, E., Amiridis, V., Kazadzis, S., Pey, J., Querol, X., Jorba, O., Gassó, S., and Baldasano, J. M.: Mediterranean intense desert dust outbreaks and their vertical structure based on remote sensing data, Atmos. Chem. Phys., 16, 8609–8642, https://doi.org/10.5194/acp-16-8609-2016, 2016.
Gkikas, A., Proestakis, E., Amiridis, V., Kazadzis, S., Di Tomaso, E., Tsekeri, A., Marinou, E., Hatzianastassiou, N., and Pérez García-Pando, C.: ModIs Dust AeroSol (MIDAS): a global fine-resolution dust optical depth data set, Atmos. Meas. Tech., 14, 309–334, https://doi.org/10.5194/amt-14-309-2021, 2021.
Gkikas, A., Proestakis, E., Amiridis, V., Kazadzis, S., Di Tomaso, E., Marinou, E., Hatzianastassiou, N., Kok, J. F., and García-Pando, C. P.: Quantification of the dust optical depth across spatiotemporal scales with the MIDAS global dataset (2003–2017), Atmos. Chem. Phys., 22, 3553–3578, https://doi.org/10.5194/acp-22-3553-2022, 2022.
Gliß, J., Mortier, A., Schulz, M., Andrews, E., Balkanski, Y., Bauer, S. E., Benedictow, A. M. K., Bian, H., Checa-Garcia, R., Chin, M., Ginoux, P., Griesfeller, J. J., Heckel, A., Kipling, Z., Kirkevåg, A., Kokkola, H., Laj, P., Le Sager, P., Lund, M. T., Lund Myhre, C., Matsui, H., Myhre, G., Neubauer, D., van Noije, T., North, P., Olivié, D. J. L., Rémy, S., Sogacheva, L., Takemura, T., Tsigaridis, K., and Tsyro, S. G.: AeroCom phase III multi-model evaluation of the aerosol life cycle and optical properties using ground- and space-based remote sensing as well as surface in situ observations, Atmos. Chem. Phys., 21, 87–128, https://doi.org/10.5194/acp-21-87-2021, 2021.
Gobbi, G. P., Barnaba, F., Giorgi, R., and Santacasa, A.: Altitude-resolved properties of a Saharan dust event over the Mediterranean, Atmospheric Environment, 34, 5119–5127, https://doi.org/10.1016/S1352-2310(00)00194-1, 2000.
Gong, D.-Y., Mao, R., and Fan, Y.-D.: East Asian dust storm and weather disturbance: possible links to the Arctic Oscillation, International Journal of Climatology, 26, 1379–1396, https://doi.org/10.1002/joc.1324, 2006a.
Gong, S. L., Zhang, X. Y., Zhao, T. L., Zhang, X. B., Barrie, L. A., McKendry, I. G., and Zhao, C. S.: A Simulated Climatology of Asian Dust Aerosol and Its Trans-Pacific Transport. Part II: Interannual Variability and Climate Connections, J. Climate, 19, 104–122, https://doi.org/10.1175/JCLI3606.1, 2006b.
Goudie, A. S.: Desert dust and human health disorders, Environment International, 63, 101–113, https://doi.org/10.1016/j.envint.2013.10.011, 2014.
Gupta, G., Venkat Ratnam, M., Madhavan, B. L., and Narayanamurthy, C. S.: Long-term trends in Aerosol Optical Depth obtained across the globe using multi-satellite measurements, Atmospheric Environment, 273, 118953, https://doi.org/10.1016/j.atmosenv.2022.118953, 2022.
Hägeli, P., Steyn, D. G., and Strawbridge, K. B.: Spatial And Temporal Variability Of Mixed-Layer Depth And Entrainment Zone Thickness, Boundary-Layer Meteorology, 97, 47–71, https://doi.org/10.1023/A:1002790424133, 2000.
Hand, J. L., Mahowald, N. M., Chen, Y., Siefert, R. L., Luo, C., Subramaniam, A., and Fung, I.: Estimates of atmospheric-processed soluble iron from observations and a global mineral aerosol model: Biogeochemical implications, Journal of Geophysical Research: Atmospheres, 109, https://doi.org/10.1029/2004JD004574, 2004.
Hatch, C. D., Gierlus, K. M., Schuttlefield, J. D., and Grassian, V. H.: Water adsorption and cloud condensation nuclei activity of calcite and calcite coated with model humic and fulvic acids, Atmos. Environ., 42, 5672–5684, https://doi.org/10.1016/j.atmosenv.2008.03.005, 2008.
Hersbach, H., Bell, B., Berrisford, P., Hirahara, S., Horányi, A., Muñoz-Sabater, J., Nicolas, J., Peubey, C., Radu, R., Schepers, D., Simmons, A., Soci, C., Abdalla, S., Abellan, X., Balsamo, G., Bechtold, P., Biavati, G., Bidlot, J., Bonavita, M., De Chiara, G., Dahlgren, P., Dee, D., Diamantakis, M., Dragani, R., Flemming, J., Forbes, R., Fuentes, M., Geer, A., Haimberger, L., Healy, S., Hogan, R. J., Hólm, E., Janisková, M., Keeley, S., Laloyaux, P., Lopez, P., Lupu, C., Radnoti, G., de Rosnay, P., Rozum, I., Vamborg, F., Villaume, S., and Thépaut, J.-N.: The ERA5 global reanalysis, Quarterly Journal of the Royal Meteorological Society, 146, 1999–2049, https://doi.org/10.1002/qj.3803, 2020.
Hildebrand, P. H. and Ackerman, B.: Urban Effects on the Convective Boundary Layer, https://doi.org/10.1175/1520-0469(1984)041<0076:UEOTCB>2.0.CO;2, 1984.
Hofer, J., Althausen, D., Abdullaev, S. F., Makhmudov, A. N., Nazarov, B. I., Schettler, G., Engelmann, R., Baars, H., Fomba, K. W., Müller, K., Heinold, B., Kandler, K., and Ansmann, A.: Long-term profiling of mineral dust and pollution aerosol with multiwavelength polarization Raman lidar at the Central Asian site of Dushanbe, Tajikistan: case studies, Atmos. Chem. Phys., 17, 14559–14577, https://doi.org/10.5194/acp-17-14559-2017, 2017.
Holben, B. N., Eck, T. F., Slutsker, I., Tanré, D., Buis, J. P., Setzer, A., Vermote, E., Reagan, J. A., Kaufman, Y. J., Nakajima, T., Lavenu, F., Jankowiak, I., and Smirnov, A.: AERONET – A Federated Instrument Network and Data Archive for Aerosol Characterization, Remote Sensing of Environment, 66, 1–16, https://doi.org/10.1016/S0034-4257(98)00031-5, 1998.
Holben, B. N., Tanré, D., Smirnov, A., Eck, T. F., Slutsker, I., Abuhassan, N., Newcomb, W. W., Schafer, J. S., Chatenet, B., Lavenu, F., Kaufman, Y. J., Castle, J. V., Setzer, A., Markham, B., Clark, D., Frouin, R., Halthore, R., Karneli, A., O'Neill, N. T., Pietras, C., Pinker, R. T., Voss, K., and Zibordi, G.: An emerging ground-based aerosol climatology: Aerosol optical depth from AERONET, Journal of Geophysical Research: Atmospheres, 106, 12067–12097, https://doi.org/10.1029/2001JD900014, 2001.
Hsu, N. C., Gautam, R., Sayer, A. M., Bettenhausen, C., Li, C., Jeong, M. J., Tsay, S.-C., and Holben, B. N.: Global and regional trends of aerosol optical depth over land and ocean using SeaWiFS measurements from 1997 to 2010, Atmos. Chem. Phys., 12, 8037–8053, https://doi.org/10.5194/acp-12-8037-2012, 2012.
Huang, J., Minnis, P., Chen, B., Huang, Z., Liu, Z., Zhao, Q., Yi, Y., and Ayers, J. K.: Long-range transport and vertical structure of Asian dust from CALIPSO and surface measurements during PACDEX, J. Geophys. Res.-Atmos., 113, D23212, https://doi.org/10.1029/2008JD010620, 2008.
Huang, J. P., Liu, J. J., Chen, B., and Nasiri, S. L.: Detection of anthropogenic dust using CALIPSO lidar measurements, Atmos. Chem. Phys., 15, 11653–11665, https://doi.org/10.5194/acp-15-11653-2015, 2015.
Hunt, W. H., Winker, D. M., Vaughan, M. A., Powell, K. A., Lucker, P. L., and Weimer, C.: CALIPSO Lidar Description and Performance Assessment, J. Atmos. Ocean. Technol., 26, 1214–1228, https://doi.org/10.1175/2009JTECHA1223.1, 2009.
Husar, R. B., Tratt, D. M., Schichtel, B. A., Falke, S. R., Li, F., Jaffe, D., Gasso, S., Gill, T., Laulainen, N. S., Lu, F., Reheis, M. C., Chun, Y., Westphal, D., Holben, B. N., Gueymard, C., McKendry, I., Kuring, N., Feldman, G. C., McClain, C., Frouin, R. J., Merrill, J., DuBois, D., Vignola, F., Murayama, T., Nickovic, S., Wilson, W. E., Sassen, K., Sugimoto, N., and Malm, W. C.: Asian dust events of April 1998, J. Geophys. Res.-Atmos., 106, 18317–18330, https://doi.org/10.1029/2000JD900788, 2001.
Inness, A., Ades, M., Agustí-Panareda, A., Barré, J., Benedictow, A., Blechschmidt, A.-M., Dominguez, J. J., Engelen, R., Eskes, H., Flemming, J., Huijnen, V., Jones, L., Kipling, Z., Massart, S., Parrington, M., Peuch, V.-H., Razinger, M., Remy, S., Schulz, M., and Suttie, M.: The CAMS reanalysis of atmospheric composition, Atmos. Chem. Phys., 19, 3515–3556, https://doi.org/10.5194/acp-19-3515-2019, 2019.
Järvinen, E., Kemppinen, O., Nousiainen, T., Kociok, T., Möhler, O., Leisner, T., and Schnaiter, M.: Laboratory investigations of mineral dust near-backscattering depolarization ratios, Journal of Quantitative Spectroscopy and Radiative Transfer, 178, 192–208, https://doi.org/10.1016/j.jqsrt.2016.02.003, 2016.
Jickells, T. D., An, Z. S., Andersen, K. K., Baker, A. R., Bergametti, G., Brooks, N., Cao, J. J., Boyd, P. W., Duce, R. A., Hunter, K. A., Kawahata, H., Kubilay, N., laRoche, J., Liss, P. S., Mahowald, N., Prospero, J. M., Ridgwell, A. J., Tegen, I., and Torres, R.: Global Iron Connections Between Desert Dust, Ocean Biogeochemistry, and Climate, Science, 308, 67–71, https://doi.org/10.1126/science.1105959, 2005.
Jin, Y., Andersson, H., and Zhang, S.: Air Pollution Control Policies in China: A Retrospective and Prospects, International Journal of Environmental Research and Public Health, 13, 1219, https://doi.org/10.3390/ijerph13121219, 2016.
Jusot, J.-F., Neill, D. R., Waters, E. M., Bangert, M., Collins, M., Bricio Moreno, L., Lawan, K. G., Moussa, M. M., Dearing, E., Everett, D. B., Collard, J.-M., and Kadioglu, A.: Airborne dust and high temperatures are risk factors for invasive bacterial disease, Journal of Allergy and Clinical Immunology, 139, 977-986.e2, https://doi.org/10.1016/j.jaci.2016.04.062, 2017.
Kanitz, T., Engelmann, R., Heinold, B., Baars, H., Skupin, A., and Ansmann, A.: Tracking the Saharan Air Layer with shipborne lidar across the tropical Atlantic, Geophysical Research Letters, 41, 1044–1050, https://doi.org/10.1002/2013GL058780, 2014.
Kar, J., Lee, K.-P., Vaughan, M. A., Tackett, J. L., Trepte, C. R., Winker, D. M., Lucker, P. L., and Getzewich, B. J.: CALIPSO level 3 stratospheric aerosol profile product: version 1.00 algorithm description and initial assessment, Atmos. Meas. Tech., 12, 6173–6191, https://doi.org/10.5194/amt-12-6173-2019, 2019.
Kaskaoutis, D. G., Kambezidis, H. D., Hatzianastassiou, N., Kosmopoulos, P. G., and Badarinath, K. V. S.: Aerosol climatology: dependence of the Angstrom exponent on wavelength over four AERONET sites, Atmos. Chem. Phys. Discuss., 7, 7347–7397, https://doi.org/10.5194/acpd-7-7347-2007, 2007.
Katra, I., Arotsker, L., Krasnov, H., Zaritsky, A., Kushmaro, A., and Ben-Dov, E.: Richness and Diversity in Dust Stormborne Biomes at the Southeast Mediterranean, Sci. Rep., 4, 5265, https://doi.org/10.1038/srep05265, 2014.
Kellogg, C. A., Griffin, D. W., Garrison, V. H., Peak, K. K., Royall, N., Smith, R. R., and Shinn, E. A.: Characterization of Aerosolized Bacteria and Fungi From Desert Dust Events in Mali, West Africa, Aerobiologia, 20, 99–110, https://doi.org/10.1023/B:AERO.0000032947.88335.bb, 2004.
Kim, M.-H., Omar, A. H., Tackett, J. L., Vaughan, M. A., Winker, D. M., Trepte, C. R., Hu, Y., Liu, Z., Poole, L. R., Pitts, M. C., Kar, J., and Magill, B. E.: The CALIPSO version 4 automated aerosol classification and lidar ratio selection algorithm, Atmos. Meas. Tech., 11, 6107–6135, https://doi.org/10.5194/amt-11-6107-2018, 2018.
King, M. D., Platnick, S., Menzel, W. P., Ackerman, S. A., and Hubanks, P. A.: Spatial and Temporal Distribution of Clouds Observed by MODIS Onboard the Terra and Aqua Satellites, IEEE Transactions on Geoscience and Remote Sensing, 51, 3826–3852, https://doi.org/10.1109/TGRS.2012.2227333, 2013.
Klingmüller, K., Pozzer, A., Metzger, S., Stenchikov, G. L., and Lelieveld, J.: Aerosol optical depth trend over the Middle East, Atmos. Chem. Phys., 16, 5063–5073, https://doi.org/10.5194/acp-16-5063-2016, 2016.
Klose, M., Shao, Y., Karremann, M. K., and Fink, A. H.: Sahel dust zone and synoptic background, Geophysical Research Letters, 37, https://doi.org/10.1029/2010GL042816, 2010.
Knippertz, P., Deutscher, C., Kandler, K., Mueller, T., Schulz, O., and Schuetz, L.: Dust mobilization due to density currents in the Atlas region: Observations from the Saharan Mineral Dust Experiment 2006 field campaign, J. Geophys. Res.-Atmos., 112, D21109, https://doi.org/10.1029/2007JD008774, 2007.
Koch, J. and Renno, N. O.: The role of convective plumes and vortices on the global aerosol budget, Geophys. Res. Lett., 32, L18806, https://doi.org/10.1029/2005GL023420, 2005.
Kok, J. F., Ridley, D. A., Zhou, Q., Miller, R. L., Zhao, C., Heald, C. L., Ward, D. S., Albani, S., and Haustein, K.: Smaller desert dust cooling effect estimated from analysis of dust size and abundance, Nature Geoscience, 10, 274–278, https://doi.org/10.1038/ngeo2912, 2017.
Kok, J. F., Adebiyi, A. A., Albani, S., Balkanski, Y., Checa-Garcia, R., Chin, M., Colarco, P. R., Hamilton, D. S., Huang, Y., Ito, A., Klose, M., Li, L., Mahowald, N. M., Miller, R. L., Obiso, V., Pérez García-Pando, C., Rocha-Lima, A., and Wan, J. S.: Contribution of the world's main dust source regions to the global cycle of desert dust, Atmos. Chem. Phys., 21, 8169–8193, https://doi.org/10.5194/acp-21-8169-2021, 2021.
Kok, J. F., Storelvmo, T., Karydis, V. A., Adebiyi, A. A., Mahowald, N. M., Evan, A. T., He, C., and Leung, D. M.: Mineral dust aerosol impacts on global climate and climate change, Nat. Rev. Earth Environ., 4, 71–86, https://doi.org/10.1038/s43017-022-00379-5, 2023.
Konsta, D., Binietoglou, I., Gkikas, A., Solomos, S., Marinou, E., Proestakis, E., Basart, S., Perez Garcia-Pando, C., El-Askary, H., and Amiridis, V.: Evaluation of the BSC-DREAM8b regional dust model using the 3D LIVAS-CALIPSO product, Atmos. Environ., 195, 46–62, https://doi.org/10.1016/j.atmosenv.2018.09.047, 2018.
Korras-Carraca, M.-B., Gkikas, A., Matsoukas, C., and Hatzianastassiou, N.: Global Clear-Sky Aerosol Speciated Direct Radiative Effects over 40 Years (1980–2019), Atmosphere, 12, 1254, https://doi.org/10.3390/atmos12101254, 2021.
Kosmopoulos, P. G., Kazadzis, S., El-Askary, H., Taylor, M., Gkikas, A., Proestakis, E., Kontoes, C., and El-Khayat, M. M.: Earth-Observation-Based Estimation and Forecasting of Particulate Matter Impact on Solar Energy in Egypt, Remote Sens., 10, 1870, https://doi.org/10.3390/rs10121870, 2018.
Kraaijenbrink, P. D. A., Stigter, E. E., Yao, T., and Immerzeel, W. W.: Climate change decisive for Asia's snow meltwater supply, Nat. Clim. Chang., 11, 591–597, https://doi.org/10.1038/s41558-021-01074-x, 2021.
Kwon, H.-J., Cho, S.-H., Chun, Y., Lagarde, F., and Pershagen, G.: Effects of the Asian Dust Events on Daily Mortality in Seoul, Korea, Environmental Research, 90, 1–5, https://doi.org/10.1006/enrs.2002.4377, 2002.
Lazaridis, M.: Modelling approaches to particle deposition and clearance in the human respiratory tract. Air Quality, Atmosphere & Health, 16, 1989–2002, https://doi.org/10.1007/s11869-023-01386-1, 2023.
Lerch, M.: International migration and city growth, UN Population Division, Technical Paper No. 10. New York: United Nations, 25 pp. https://www.un.org/en/development/desa/population/publications/pdf/technical/TP2017-10.pdf (last access: 29/10/2025), 2017.
Leski, T. A., Malanoski, A. P., Gregory, M. J., Lin, B., and Stenger, D. A.: Application of a Broad-Range Resequencing Array for Detection of Pathogens in Desert Dust Samples from Kuwait and Iraq, Applied and Environmental Microbiology, 77, 4285–4292, https://doi.org/10.1128/AEM.00021-11, 2011.
Li, W., El-Askary, H., Qurban, M. A., Proestakis, E., Garay, M. J., Kalashnikova, O. V., Amiridis, V., Gkikas, A., Marinou, E., Piechota, T., and Manikandan, K. P.: An Assessment of Atmospheric and Meteorological Factors Regulating Red Sea Phytoplankton Growth, Remote Sensing, 10, 673, https://doi.org/10.3390/rs10050673, 2018.
Li, Z., Guo, J., Ding, A., Liao, H., Liu, J., Sun, Y., Wang, T., Xue, H., Zhang, H., and Zhu, B.: Aerosol and boundary-layer interactions and impact on air quality, National Science Review, 4, 810–833, https://doi.org/10.1093/nsr/nwx117, 2017.
Liu, D., Wang, Z., Liu, Z., Winker, D., and Trepte, C.: A height resolved global view of dust aerosols from the first year CALIPSO lidar measurements, J. Geophys. Res.-Atmos., 113, D16214, https://doi.org/10.1029/2007JD009776, 2008a.
Liu, J., Wu, D., Liu, G., Mao, R., Chen, S., Ji, M., Fu, P., Sun, Y., Pan, X., Jin, H., Zhou, Y., and Wang, X.: Impact of Arctic amplification on declining spring dust events in East Asia, Clim. Dyn., 54, 1913–1935, https://doi.org/10.1007/s00382-019-05094-4, 2020.
Liu, Z., Kar, J., Zeng, S., Tackett, J., Vaughan, M., Avery, M., Pelon, J., Getzewich, B., Lee, K.-P., Magill, B., Omar, A., Lucker, P., Trepte, C., and Winker, D.: Discriminating between clouds and aerosols in the CALIOP version 4.1 data products, Atmos. Meas. Tech., 12, 703–734, https://doi.org/10.5194/amt-12-703-2019, 2019.
Liu, H., Pan, X., Lei, S., Zhang, Y., Du, A., Yao, W., Tang, G., Wang, T., Xin, J., Li, J., Sun, Y., Cao, J., and Wang, Z.: Vertical distribution of black carbon and its mixing state in the urban boundary layer in summer, Atmos. Chem. Phys., 23, 7225–7239, https://doi.org/10.5194/acp-23-7225-2023, 2023.
Liu, Z., Omar, A., Vaughan, M., Hair, J., Kittaka, C., Hu, Y., Powell, K., Trepte, C., Winker, D., Hostetler, C., Ferrare, R., and Pierce, R.: CALIPSO lidar observations of the optical properties of Saharan dust: A case study of long-range transport, Journal of Geophysical Research: Atmospheres, 113, https://doi.org/10.1029/2007JD008878, 2008b.
Liu, Z., Vaughan, M., Winker, D., Kittaka, C., Getzewich, B., Kuehn, R., Omar, A., Powell, K., Trepte, C., and Hostetler, C.: The CALIPSO Lidar Cloud and Aerosol Discrimination: Version 2 Algorithm and Initial Assessment of Performance, J. Atmos. Ocean. Technol., 26, 1198–1213, https://doi.org/10.1175/2009JTECHA1229.1, 2009.
Logothetis, S.-A., Salamalikis, V., Gkikas, A., Kazadzis, S., Amiridis, V., and Kazantzidis, A.: 15-year variability of desert dust optical depth on global and regional scales, Atmos. Chem. Phys., 21, 16499–16529, https://doi.org/10.5194/acp-21-16499-2021, 2021.
Luo, T., Yuan, R., and Wang, Z.: Lidar-based remote sensing of atmospheric boundary layer height over land and ocean, Atmos. Meas. Tech., 7, 173–182, https://doi.org/10.5194/amt-7-173-2014, 2014.
Mahowald, N., Lindsay, K., Rothenberg, D., Doney, S. C., Moore, J. K., Thornton, P., Randerson, J. T., and Jones, C. D.: Desert dust and anthropogenic aerosol interactions in the Community Climate System Model coupled-carbon-climate model, Biogeosciences, 8, 387–414, https://doi.org/10.5194/bg-8-387-2011, 2011.
Mahowald, N., Albani, S., Kok, J. F., Engelstaeder, S., Scanza, R., Ward, D. S., and Flanner, M. G.: The size distribution of desert dust aerosols and its impact on the Earth system, Aeolian Research, 15, 53–71, https://doi.org/10.1016/j.aeolia.2013.09.002, 2014.
Mamouri, R. E. and Ansmann, A.: Fine and coarse dust separation with polarization lidar, Atmos. Meas. Tech., 7, 3717–3735, https://doi.org/10.5194/amt-7-3717-2014, 2014.
Mamouri, R.-E. and Ansmann, A.: Potential of polarization/Raman lidar to separate fine dust, coarse dust, maritime, and anthropogenic aerosol profiles, Atmos. Meas. Tech., 10, 3403–3427, https://doi.org/10.5194/amt-10-3403-2017, 2017.
Mamouri, R. E., Ansmann, A., Nisantzi, A., Kokkalis, P., Schwarz, A., and Hadjimitsis, D.: Low Arabian dust extinction-to-backscatter ratio, Geophysical Research Letters, 40, 4762–4766, https://doi.org/10.1002/grl.50898, 2013.
Marenco, F., Ryder, C., Estellés, V., O'Sullivan, D., Brooke, J., Orgill, L., Lloyd, G., and Gallagher, M.: Unexpected vertical structure of the Saharan Air Layer and giant dust particles during AER-D, Atmos. Chem. Phys., 18, 17655–17668, https://doi.org/10.5194/acp-18-17655-2018, 2018.
Marinou, E., Amiridis, V., Binietoglou, I., Tsikerdekis, A., Solomos, S., Proestakis, E., Konsta, D., Papagiannopoulos, N., Tsekeri, A., Vlastou, G., Zanis, P., Balis, D., Wandinger, U., and Ansmann, A.: Three-dimensional evolution of Saharan dust transport towards Europe based on a 9-year EARLINET-optimized CALIPSO dataset, Atmos. Chem. Phys., 17, 5893–5919, https://doi.org/10.5194/acp-17-5893-2017, 2017.
Martinelli, N., Olivieri, O., and Girelli, D.: Air particulate matter and cardiovascular disease: a narrative review, Eur. J. Intern. Med., 24, 295–302, https://doi.org/10.1016/j.ejim.2013.04.001, 2013.
Martiny, N. and Chiapello, I.: Assessments for the impact of mineral dust on the meningitis incidence in West Africa, Atmospheric Environment, 70, 245–253, https://doi.org/10.1016/j.atmosenv.2013.01.016, 2013.
Masoom, A., Kosmopoulos, P., Bansal, A., Gkikas, A., Proestakis, E., Kazadzis, S., and Amiridis, V.: Forecasting dust impact on solar energy using remote sensing and modeling techniques, Solar Energy, 228, 317–332, https://doi.org/10.1016/j.solener.2021.09.033, 2021.
Mazamay, S., Broutin, H., Bompangue, D., Muyembe, J.-J., and Guégan, J.-F.: The environmental drivers of bacterial meningitis epidemics in the Democratic Republic of Congo, central Africa, PLOS Neglected Tropical Diseases, 14, e0008634, https://doi.org/10.1371/journal.pntd.0008634, 2020.
McGrath-Spangler, E. L. and Denning, A. S.: Global seasonal variations of midday planetary boundary layer depth from CALIPSO space-borne LIDAR, Journal of Geophysical Research: Atmospheres, 118, 1226–1233, https://doi.org/10.1002/jgrd.50198, 2013.
Medeiros, B., Hall, A., and Stevens, B.: What Controls the Mean Depth of the PBL?, Journal of Climate, 18, 3157–3172, https://doi.org/10.1175/JCLI3417.1, 2005.
Meng, Z. and Lu, B.: Dust events as a risk factor for daily hospitalization for respiratory and cardiovascular diseases in Minqin, China, Atmospheric Environment, 41, 7048–7058, https://doi.org/10.1016/j.atmosenv.2007.05.006, 2007.
Middleton, N.: Health in dust belt cities and beyond – an essay by Nick Middleton, BMJ, 371, m3089, https://doi.org/10.1136/bmj.m3089, 2020.
Middleton, N., Yiallouros, P., Kleanthous, S., Kolokotroni, O., Schwartz, J., Dockery, D. W., Demokritou, P., and Koutrakis, P.: A 10-year time-series analysis of respiratory and cardiovascular morbidity in Nicosia, Cyprus: the effect of short-term changes in air pollution and dust storms, Environmental Health, 7, 39, https://doi.org/10.1186/1476-069X-7-39, 2008.
Moulin, C. and Chiapello, I.: Impact of human-induced desertification on the intensification of Sahel dust emission and export over the last decades, Geophysical Research Letters, 33, https://doi.org/10.1029/2006GL025923, 2006.
Mueller, J. E., Woringer, M., Porgho, S., Madec, Y., Tall, H., Martiny, N., and Bicaba, B. W.: The association between respiratory tract infection incidence and localised meningitis epidemics: an analysis of high-resolution surveillance data from Burkina Faso, Sci. Rep., 7, 11570, https://doi.org/10.1038/s41598-017-11889-4, 2017.
Nakazawa, T. and Matsueda, M.: Relationship between meteorological variables/dust and the number of meningitis cases in Burkina Faso, Meteorological Applications, 24, 423–431, https://doi.org/10.1002/met.1640, 2017.
Nickovic, S., Cvetkovic, B., Petković, S., Amiridis, V., Pejanović, G., Solomos, S., Marinou, E., and Nikolic, J.: Cloud icing by mineral dust and impacts to aviation safety, Sci. Rep., 11, 6411, https://doi.org/10.1038/s41598-021-85566-y, 2021.
Notaro, M., Yu, Y., and Kalashnikova, O. V.: Regime shift in Arabian dust activity, triggered by persistent Fertile Crescent drought, Journal of Geophysical Research: Atmospheres, 120, 10229–10249, https://doi.org/10.1002/2015JD023855, 2015.
Okin, G. S., Mahowald, N., Chadwick, O. A., and Artaxo, P.: Impact of desert dust on the biogeochemistry of phosphorus in terrestrial ecosystems, Global Biogeochemical Cycles, 18, https://doi.org/10.1029/2003GB002145, 2004.
Omar, A. H., Winker, D. M., Vaughan, M. A., Hu, Y., Trepte, C. R., Ferrare, R. A., Lee, K.-P., Hostetler, C. A., Kittaka, C., Rogers, R. R., Kuehn, R. E., and Liu, Z.: The CALIPSO Automated Aerosol Classification and Lidar Ratio Selection Algorithm, J. Atmos. Oceanic Technol., 26, 1994–2014, https://doi.org/10.1175/2009JTECHA1231.1, 2009.
Omar, A. H., Winker, D. M., Tackett, J. L., Giles, D. M., Kar, J., Liu, Z., Vaughan, M. A., Powell, K. A., and Trepte, C. R.: CALIOP and AERONET aerosol optical depth comparisons: One size fits none, J. Geophys. Res.-Atmos., 118, 4748–4766, https://doi.org/10.1002/jgrd.50330, 2013.
O'Neill, N. T., Eck, T. F., Holben, B. N., Smirnov, A., Dubovik, O., and Royer, A.: Bimodal size distribution influences on the variation of Angstrom derivatives in spectral and optical depth space, Journal of Geophysical Research: Atmospheres, 106, 9787–9806, https://doi.org/10.1029/2000JD900245, 2001a.
O'Neill, N. T., Dubovik, O., and Eck, T. F.: Modified Ångström exponent for the characterization of submicrometer aerosols, Appl. Opt., 40, 2368–2375, https://doi.org/10.1364/AO.40.002368, 2001b.
O'Neill, N. T., Eck, T. F., Smirnov, A., Holben, B. N., and Thulasiraman, S.: Spectral discrimination of coarse and fine-mode optical depth, Journal of Geophysical Research: Atmospheres, 108, https://doi.org/10.1029/2002JD002975, 2003.
Ostro B.: Outdoor air pollution: Assessing the environmental burden of disease at national and local levels. Geneva, World Health Organization, 2004 (WHO Environmental Burden of Disease Series, No. 5), 62 pp., https://www.who.int/publications/i/item/9241591463 (last access: 30 October 20025), ISBN 92 4 159146 3, 2024.
Ouma, Y. O., Keitsile, A., Lottering, L., Nkwae, B., and Odirile, P.: Spatiotemporal empirical analysis of particulate matter PM2.5 pollution and air quality index (AQI) trends in Africa using MERRA-2 reanalysis datasets (1980–2021), Science of The Total Environment, 912, 169027, https://doi.org/10.1016/j.scitotenv.2023.169027, 2024.
Pal, S., Behrendt, A., and Wulfmeyer, V.: Elastic-backscatter-lidar-based characterization of the convective boundary layer and investigation of related statistics, Ann. Geophys., 28, 825–847, https://doi.org/10.5194/angeo-28-825-2010, 2010.
Papachristopoulou, K., Raptis, I.-P., Gkikas, A., Fountoulakis, I., Masoom, A., and Kazadzis, S.: Aerosol optical depth regime over megacities of the world, Atmos. Chem. Phys., 22, 15703–15727, https://doi.org/10.5194/acp-22-15703-2022, 2022.
Papagiannopoulos, N., D'Amico, G., Gialitaki, A., Ajtai, N., Alados-Arboledas, L., Amodeo, A., Amiridis, V., Baars, H., Balis, D., Binietoglou, I., Comerón, A., Dionisi, D., Falconieri, A., Fréville, P., Kampouri, A., Mattis, I., Mijić, Z., Molero, F., Papayannis, A., Pappalardo, G., Rodríguez-Gómez, A., Solomos, S., and Mona, L.: An EARLINET early warning system for atmospheric aerosol aviation hazards, Atmos. Chem. Phys., 20, 10775–10789, https://doi.org/10.5194/acp-20-10775-2020, 2020.
Pappalardo, G., Wandinger, U., Mona, L., Hiebsch, A., Mattis, I., Amodeo, A., Ansmann, A., Seifert, P., Linne, H., Apituley, A., Alados Arboledas, L., Balis, D., Chaikovsky, A., D'Amico, G., De Tomasi, F., Freudenthaler, V., Giannakaki, E., Giunta, A., Grigorov, I., Iarlori, M., Madonna, F., Mamouri, R.-E., Nasti, L., Papayannis, A., Pietruczuk, A., Pujadas, M., Rizi, V., Rocadenbosch, F., Russo, F., Schnell, F., Spinelli, N., Wang, X., and Wiegner, M.: EARLINET correlative measurements for CALIPSO: First intercomparison results, J. Geophys. Res.-Atmos., 115, D00H19, https://doi.org/10.1029/2009JD012147, 2010.
Pappalardo, G., Amodeo, A., Apituley, A., Comeron, A., Freudenthaler, V., Linné, H., Ansmann, A., Bösenberg, J., D'Amico, G., Mattis, I., Mona, L., Wandinger, U., Amiridis, V., Alados-Arboledas, L., Nicolae, D., and Wiegner, M.: EARLINET: towards an advanced sustainable European aerosol lidar network, Atmos. Meas. Tech., 7, 2389–2409, https://doi.org/10.5194/amt-7-2389-2014, 2014.
Park, J. W., Lim, Y. H., Kyung, S. Y., An, C. H., Lee, S. P., Jeong, S. H., and Ju, Y.-S.: Effects of ambient particulate matter on peak expiratory flow rates and respiratory symptoms of asthmatics during Asian dust periods in Korea, Respirology, 10, 470–476, https://doi.org/10.1111/j.1440-1843.2005.00728.x, 2005.
Parker, D. J., Burton, R. R., Diongue-Niang, A., Ellis, R. J., Felton, M., Taylor, C. M., Thorncroft, C. D., Bessemoulin, P., and Tompkins, A. M.: The diurnal cycle of the West African monsoon circulation, Quarterly Journal of the Royal Meteorological Society, 131, 2839–2860, https://doi.org/10.1256/qj.04.52, 2005.
Peng, D. and Zhou, T.: Why was the arid and semiarid northwest China getting wetter in the recent decades?, Journal of Geophysical Research: Atmospheres, 122, 9060–9075, https://doi.org/10.1002/2016JD026424, 2017.
Penner, J. E., Charlson, R. J., Hales, J. M., Laulainen, N. S., Leifer, R., Novakov, T., Ogren, J., Radke, L. F., Schwartz, S. E., and Travis, L.: Quantifying and Minimizing Uncertainty of Climate Forcing by Anthropogenic Aerosols, Bulletin of the American Meteorological Society, 75, 375–400, https://doi.org/10.1175/1520-0477(1994)075<0375:QAMUOC>2.0.CO;2, 1994.
Pérez, L., Tobías, A., Pey, J., Pérez, N., Alastuey, A., Sunyer, J., and Querol, X.: Effects of Local and Saharan Particles on Cardiovascular Disease Mortality, Epidemiology, 23, 768, https://doi.org/10.1097/EDE.0b013e3182625d0d, 2012.
Pérez García-Pando, C., Miller, R. L., Perlwitz, J. P., Rodríguez, S., and Prospero, J. M.: Predicting the mineral composition of dust aerosols: Insights from elemental composition measured at the Izaña Observatory, Geophysical Research Letters, 43, 10520–10529, https://doi.org/10.1002/2016GL069873, 2016.
Pey, J., Querol, X., Alastuey, A., Forastiere, F., and Stafoggia, M.: African dust outbreaks over the Mediterranean Basin during 2001–2011: PM10 concentrations, phenomenology and trends, and its relation with synoptic and mesoscale meteorology, Atmos. Chem. Phys., 13, 1395–1410, https://doi.org/10.5194/acp-13-1395-2013, 2013.
Pikridas, M., Bezantakos, S., Močnik, G., Keleshis, C., Brechtel, F., Stavroulas, I., Demetriades, G., Antoniou, P., Vouterakos, P., Argyrides, M., Liakakou, E., Drinovec, L., Marinou, E., Amiridis, V., Vrekoussis, M., Mihalopoulos, N., and Sciare, J.: On-flight intercomparison of three miniature aerosol absorption sensors using unmanned aerial systems (UASs), Atmos. Meas. Tech., 12, 6425–6447, https://doi.org/10.5194/amt-12-6425-2019, 2019.
Pincus, R., Platnick, S., Ackerman, S. A., Hemler, R. S., and Hofmann, R. J. P.: Reconciling Simulated and Observed Views of Clouds: MODIS, ISCCP, and the Limits of Instrument Simulators, https://doi.org/10.1175/JCLI-D-11-00267.1, 2012.
Pincus, R., Hubanks, P. A., Platnick, S., Meyer, K., Holz, R. E., Botambekov, D., and Wall, C. J.: Updated observations of clouds by MODIS for global model assessment, Earth Syst. Sci. Data, 15, 2483–2497, https://doi.org/10.5194/essd-15-2483-2023, 2023.
Pozzer, A., de Meij, A., Yoon, J., Tost, H., Georgoulias, A. K., and Astitha, M.: AOD trends during 2001–2010 from observations and model simulations, Atmos. Chem. Phys., 15, 5521–5535, https://doi.org/10.5194/acp-15-5521-2015, 2015.
Proestakis, E.: A four-dimensional, multiyear, and near-global climate data record of the fine-mode (sub-micrometer in terms of diameter) and coarse-mode (super-micrometer in terms of diameter) components of atmospheric pure-dust, (Version 1), Zenodo [data set], https://doi.org/10.5281/zenodo.10389741, 2023.
Proestakis, E., Amiridis, V., Marinou, E., Georgoulias, A. K., Solomos, S., Kazadzis, S., Chimot, J., Che, H., Alexandri, G., Binietoglou, I., Daskalopoulou, V., Kourtidis, K. A., de Leeuw, G., and van der A, R. J.: Nine-year spatial and temporal evolution of desert dust aerosols over South and East Asia as revealed by CALIOP, Atmos. Chem. Phys., 18, 1337–1362, https://doi.org/10.5194/acp-18-1337-2018, 2018.
Proestakis, E., Amiridis, V., Marinou, E., Binietoglou, I., Ansmann, A., Wandinger, U., Hofer, J., Yorks, J., Nowottnick, E., Makhmudov, A., Papayannis, A., Pietruczuk, A., Gialitaki, A., Apituley, A., Szkop, A., Muñoz Porcar, C., Bortoli, D., Dionisi, D., Althausen, D., Mamali, D., Balis, D., Nicolae, D., Tetoni, E., Liberti, G. L., Baars, H., Mattis, I., Stachlewska, I. S., Voudouri, K. A., Mona, L., Mylonaki, M., Perrone, M. R., Costa, M. J., Sicard, M., Papagiannopoulos, N., Siomos, N., Burlizzi, P., Pauly, R., Engelmann, R., Abdullaev, S., and Pappalardo, G.: EARLINET evaluation of the CATS Level 2 aerosol backscatter coefficient product, Atmos. Chem. Phys., 19, 11743–11764, https://doi.org/10.5194/acp-19-11743-2019, 2019.
Proestakis, E., Gkikas, A., Georgiou, T., Kampouri, A., Drakaki, E., Ryder, C. L., Marenco, F., Marinou, E., and Amiridis, V.: A near-global multiyear climate data record of the fine-mode and coarse-mode components of atmospheric pure dust, Atmos. Meas. Tech., 17, 3625–3667, https://doi.org/10.5194/amt-17-3625-2024, 2024.
Proestakis, E., Amiridis, V., García-Pando, C. P., Tsyro, S., Griesfeller, J., Gkikas, A., Georgiou, T., Ageitos, M. G., Escribano, J., Myriokefalitakis, S., Masso, E. B., Di Tomaso, E., Basart, S., Stuut, J.-B. W., and Benedetti, A.: Quantifying dust deposition over the Atlantic Ocean, Earth Syst. Sci. Data, 17, 4351–4395, https://doi.org/10.5194/essd-17-4351-2025, 2025.
Prospero, J. M.: Long-range transport of mineral dust in the global atmosphere: Impact of African dust on the environment of the southeastern United States, P. Natl. Acad. Sci. USA, 96, 3396–3403, https://doi.org/10.1073/pnas.96.7.3396, 1999a.
Prospero, J. M.: Long-term measurements of the transport of African mineral dust to the southeastern United States: Implications for regional air quality, Journal of Geophysical Research: Atmospheres, 104, 15917–15927, https://doi.org/10.1029/1999JD900072, 1999b.
Prospero, J. M., Ginoux, P., Torres, O., Nicholson, S. E., and Gill, T. E.: Environmental characterization of global sources of atmospheric soil dust identified with the Nimbus 7 Total Ozone Mapping Spectrometer (TOMS) absorbing aerosol product, Rev. Geophys., 40, 1002, https://doi.org/10.1029/2000RG000095, 2002.
Prospero, J. M., Blades, E., Naidu, R., Mathison, G., Thani, H., and Lavoie, M. C.: Relationship between African dust carried in the Atlantic trade winds and surges in pediatric asthma attendances in the Caribbean, Int. J. Biometeorol., 52, 823–832, https://doi.org/10.1007/s00484-008-0176-1, 2008.
Prospero, J. M., Landing, W. M., and Schulz, M.: African dust deposition to Florida: Temporal and spatial variability and comparisons to models, Journal of Geophysical Research: Atmospheres, 115, https://doi.org/10.1029/2009JD012773, 2010.
Prospero, J. M., Collard, F.-X., Molinié, J., and Jeannot, A.: Characterizing the annual cycle of African dust transport to the Caribbean Basin and South America and its impact on the environment and air quality, Global Biogeochemical Cycles, 28, 757–773, https://doi.org/10.1002/2013GB004802, 2014.
Querol, X., Pey, J., Pandolfi, M., Alastuey, A., Cusack, M., Pérez, N., Moreno, T., Viana, M., Mihalopoulos, N., Kallos, G., and Kleanthous, S.: African dust contributions to mean ambient PM10 mass-levels across the Mediterranean Basin, Atmospheric Environment, 43, 4266–4277, https://doi.org/10.1016/j.atmosenv.2009.06.013, 2009.
Querol, X., Tobías, A., Pérez, N., Karanasiou, A., Amato, F., Stafoggia, M., Pérez García-Pando, C., Ginoux, P., Forastiere, F., Gumy, S., Mudu, P., and Alastuey, A.: Monitoring the impact of desert dust outbreaks for air quality for health studies, Environment International, 130, 104867, https://doi.org/10.1016/j.envint.2019.05.061, 2019.
Rajot, J. L., Formenti, P., Alfaro, S., Desboeufs, K., Chevaillier, S., Chatenet, B., Gaudichet, A., Journet, E., Marticorena, B., Triquet, S., Maman, A., Mouget, N., and Zakou, A.: AMMA dust experiment: An overview of measurements performed during the dry season special observation period (SOP0) at the Banizoumbou (Niger) supersite, J. Geophys. Res.-Atmos., 113, D00C14, https://doi.org/10.1029/2008JD009906, 2008.
Ramaswamy, V., Muraleedharan, P. M., and Babu, C. P.: Mid-troposphere transport of Middle-East dust over the Arabian Sea and its effect on rainwater composition and sensitive ecosystems over India, Sci. Rep., 7, 13676, https://doi.org/10.1038/s41598-017-13652-1, 2017.
Randles, C. A., Silva, A. M. da, Buchard, V., Colarco, P. R., Darmenov, A., Govindaraju, R., Smirnov, A., Holben, B., Ferrare, R., Hair, J., Shinozuka, Y., and Flynn, C. J.: The MERRA-2 Aerosol Reanalysis, 1980 Onward. Part I: System Description and Data Assimilation Evaluation, Journal of Climate, 30, 6823–6850, https://doi.org/10.1175/JCLI-D-16-0609.1, 2017.
Rosenfeld, D., Lohmann, U., Raga, G. B., O'Dowd, C. D., Kulmala, M., Fuzzi, S., Reissell, A., and Andreae, M. O.: Flood or drought: How do aerosols affect precipitation?, Science, 321, 1309–1313, https://doi.org/10.1126/science.1160606, 2008.
Ryder, C. L., Marenco, F., Brooke, J. K., Estelles, V., Cotton, R., Formenti, P., McQuaid, J. B., Price, H. C., Liu, D., Ausset, P., Rosenberg, P. D., Taylor, J. W., Choularton, T., Bower, K., Coe, H., Gallagher, M., Crosier, J., Lloyd, G., Highwood, E. J., and Murray, B. J.: Coarse-mode mineral dust size distributions, composition and optical properties from AER-D aircraft measurements over the tropical eastern Atlantic, Atmos. Chem. Phys., 18, 17225–17257, https://doi.org/10.5194/acp-18-17225-2018, 2018.
Ryder, C. L., Highwood, E. J., Walser, A., Seibert, P., Philipp, A., and Weinzierl, B.: Coarse and giant particles are ubiquitous in Saharan dust export regions and are radiatively significant over the Sahara, Atmos. Chem. Phys., 19, 15353–15376, https://doi.org/10.5194/acp-19-15353-2019, 2019.
Ryder, C. L., Bézier, C., Dacre, H. F., Clarkson, R., Amiridis, V., Marinou, E., Proestakis, E., Kipling, Z., Benedetti, A., Parrington, M., Rémy, S., and Vaughan, M.: Aircraft engine dust ingestion at global airports, Nat. Hazards Earth Syst. Sci., 24, 2263–2284, https://doi.org/10.5194/nhess-24-2263-2024, 2024.
Sakai, T., Nagai, T., Zaizen, Y., and Mano, Y.: Backscattering linear depolarization ratio measurements of mineral, sea-salt, and ammonium sulfate particles simulated in a laboratory chamber, Appl. Opt., 49, 4441–4449, https://doi.org/10.1364/AO.49.004441, 2010.
Salvador, P., Pey, J., Pérez, N., Querol, X., and Artíñano, B.: Increasing atmospheric dust transport towards the western Mediterranean over 1948–2020, npj Clim. Atmos. Sci., 5, 1–10, https://doi.org/10.1038/s41612-022-00256-4, 2022.
Sandstrom, T. and Forsberg, B.: Desert Dust: An Unrecognized Source of Dangerous Air Pollution?, Epidemiology, 19, 808, https://doi.org/10.1097/EDE.0b013e31818809e0, 2008.
Schepanski, K., Tegen, I., and Macke, A.: Saharan dust transport and deposition towards the tropical northern Atlantic, Atmos. Chem. Phys., 9, 1173–1189, https://doi.org/10.5194/acp-9-1173-2009, 2009.
Schuster, G. L., Vaughan, M., MacDonnell, D., Su, W., Winker, D., Dubovik, O., Lapyonok, T., and Trepte, C.: Comparison of CALIPSO aerosol optical depth retrievals to AERONET measurements, and a climatology for the lidar ratio of dust, Atmos. Chem. Phys., 12, 7431–7452, https://doi.org/10.5194/acp-12-7431-2012, 2012.
Seibert, P., Beyrich, F., Gryning, S. E., Joffre, S., Rasmussen, A., and Tercier, P.: Review and intercomparison of operational methods for the determination of the mixing height, Atmospheric Environment, 34, 1001–1027, 2000.
Seinfeld, J. H. and Pandis, S. N.: Atmospheric chemistry and physics: from air pollution to climate change, John Wiley & Sons, ISBN 978-1-118-94740-1, 2006.
Shaheen, A., Wu, R., Lelieveld, J., Yousefi, R., and Aldabash, M.: Winter AOD trend changes over the Eastern Mediterranean and Middle East region, International Journal of Climatology, 41, 5516–5535, https://doi.org/10.1002/joc.7139, 2021.
Shaheen, A., Wu, R., Yousefi, R., Wang, F., Ge, Q., Kaskaoutis, D. G., Wang, J., Alpert, P., and Munawar, I.: Spatio-temporal changes of spring-summer dust AOD over the Eastern Mediterranean and the Middle East: Reversal of dust trends and associated meteorological effects, Atmospheric Research, 281, 106509, https://doi.org/10.1016/j.atmosres.2022.106509, 2023.
Shairsingh, K., Ruggeri, G., Krzyzanowski, M., Mudu, P., Malkawi, M., Castillo, J., Soares da Silva, A., Saluja, M., Martínez, K. C., Mothe, J., and Gumy, S.: WHO air quality database: relevance, history and future developments, Bull. World Health Organ., 101, 800–807, https://doi.org/10.2471/BLT.23.290188, 2023.
Shaw, G.: Transport of Asian Desert Aerosol to the Hawaiian-Islands, J. Appl. Meteorol., 19, 1254–1259, https://doi.org/10.1175/1520-0450(1980)019<1254:TOADAT>2.0.CO;2, 1980.
Shi, Y., Shen, Y., Kang, E., Li, D., Ding, Y., Zhang, G., and Hu, R.: Recent and Future Climate Change in Northwest China, Climatic Change, 80, 379–393, https://doi.org/10.1007/s10584-006-9121-7, 2007.
Shimizu, A., Sugimoto, N., Matsui, I., Arao, K., Uno, I., Murayama, T., Kagawa, N., Aoki, K., Uchiyama, A., and Yamazaki, A.: Continuous observations of Asian dust and other aerosols by polarization lidars in China and Japan during ACE-Asia, Journal of Geophysical Research: Atmospheres, 109, https://doi.org/10.1029/2002JD003253, 2004.
Shin, J., Shin, D., Müller, D., and Noh, Y.: Long-term analysis of AOD separated by aerosol type in East Asia, Atmospheric Environment, 310, 119957, https://doi.org/10.1016/j.atmosenv.2023.119957, 2023.
Sinyuk, A., Holben, B. N., Eck, T. F., Giles, D. M., Slutsker, I., Korkin, S., Schafer, J. S., Smirnov, A., Sorokin, M., and Lyapustin, A.: The AERONET Version 3 aerosol retrieval algorithm, associated uncertainties and comparisons to Version 2, Atmos. Meas. Tech., 13, 3375–3411, https://doi.org/10.5194/amt-13-3375-2020, 2020.
Smith, D. J., Jaffe, D. A., Birmele, M. N., Griffin, D. W., Schuerger, A. C., Hee, J., and Roberts, M. S.: Free Tropospheric Transport of Microorganisms from Asia to North America, Microb. Ecol., 64, 973–985, https://doi.org/10.1007/s00248-012-0088-9, 2012.
Soares, J., González Ortiz, A., Gsella, A., Horálek, J., Plass, D., and Kienzler, S.: Health risk assessment of air pollution and the impact of the new WHO guidelines (Eionet Report – ETC HE 2022/10), European Topic Centre on Human Health and the Environment, https://www.eionet.europa.eu/etcs/all-etc-reports (last access: 19 October 2025), 2022.
Sogacheva, L., Rodriguez, E., Kolmonen, P., Virtanen, T. H., Saponaro, G., de Leeuw, G., Georgoulias, A. K., Alexandri, G., Kourtidis, K., and van der A, R. J.: Spatial and seasonal variations of aerosols over China from two decades of multi-satellite observations – Part 2: AOD time series for 1995–2017 combined from ATSR ADV and MODIS C6.1 and AOD tendency estimations, Atmos. Chem. Phys., 18, 16631–16652, https://doi.org/10.5194/acp-18-16631-2018, 2018.
Spurny, K. R.: Methods of Aerosol Measurement before the 1960s, Aerosol Sci. Technol., 29, 329–349, https://doi.org/10.1080/02786829808965573, 1998.
Stafoggia, M., Zauli-Sajani, S., Pey, J., Samoli, E., Alessandrini, E., Basagaña, X., Cernigliaro, A., Chiusolo, M., Demaria, M., Díaz, J., Faustini, A., Katsouyanni, K., Kelessis, A. G., Linares, C., Marchesi, S., Medina, S., Pandolfi, P., Pérez, N., Querol, X., Randi, G., Ranzi, A., Tobias, A., Forastiere, F., and the MED-PARTICLES Study Group: Desert Dust Outbreaks in Southern Europe: Contribution to Daily PM10 Concentrations and Short-Term Associations with Mortality and Hospital Admissions, Environmental Health Perspectives, 124, 413–419, https://doi.org/10.1289/ehp.1409164, 2016.
Steenland, K. and Ward, E.: Silica: A lung carcinogen, CA: A Cancer Journal for Clinicians, 64, 63–69, https://doi.org/10.3322/caac.21214, 2014.
Stein, A. F., Draxler, R. R., Rolph, G. D., Stunder, B. J. B., Cohen, M. D., and Ngan, F.: NOAA's HYSPLIT Atmospheric Transport and Dispersion Modeling System, Bulletin of the American Meteorological Society, 96, 2059–2077, https://doi.org/10.1175/BAMS-D-14-00110.1, 2015.
Stull, R. B.: Mean boundary layer characteristics, in: An introduction to boundary layer meteorology, edited by: Stull, R. B., Springer Netherlands, Dordrecht, 1–27, https://doi.org/10.1007/978-94-009-3027-8_1, 1988.
Sugimoto, N., Uno, I., Nishikawa, M., Shimizu, A., Matsui, I., Dong, X., Chen, Y., and Quan, H.: Record heavy Asian dust in Beijing in 2002: Observations and model analysis of recent events, Geophysical Research Letters, 30, https://doi.org/10.1029/2002GL016349, 2003.
Sun, J. M., Zhang, M. Y., and Liu, T. S.: Spatial and temporal characteristics of dust storms in China and its surrounding regions, 1960-1999: Relations to source area and climate, J. Geophys. Res.-Atmos., 106, 10325–10333, https://doi.org/10.1029/2000JD900665, 2001.
Tackett, J. L., Winker, D. M., Getzewich, B. J., Vaughan, M. A., Young, S. A., and Kar, J.: CALIPSO lidar level 3 aerosol profile product: version 3 algorithm design, Atmos. Meas. Tech., 11, 4129–4152, https://doi.org/10.5194/amt-11-4129-2018, 2018.
Tegen, I. and Fung, I.: Contribution to the atmospheric mineral aerosol load from land surface modification, Journal of Geophysical Research, 100, 18707–18726, https://doi.org/10.1029/95jd02051, 1995.
Tegen, I., Lacis, A. A., and Fung, I.: The influence on climate forcing of mineral aerosols from disturbed soils, Nature, 380, 419–422, https://doi.org/10.1038/380419a0, 1996.
Tesche, M., Ansmann, A., MüLLER, D., Althausen, D., Mattis, I., Heese, B., Freudenthaler, V., Wiegner, M., Esselborn, M., Pisani, G., and Knippertz, P.: Vertical profiling of Saharan dust with Raman lidars and airborne HSRL in southern Morocco during SAMUM, Tellus B: Chemical and Physical Meteorology, 61, 144–164, https://doi.org/10.1111/j.1600-0889.2008.00390.x, 2009.
Tesche, M., Gross, S., Ansmann, A., Müller, D., Althausen, D., Freudenthaler, V., and Esselborn, M.: Profiling of Saharan dust and biomass-burning smoke with multiwavelength polarization Raman lidar at Cape Verde, Tellus B, 63, 649–676, https://doi.org/10.1111/j.1600-0889.2011.00548.x, 2011.
Textor, C., Schulz, M., Guibert, S., Kinne, S., Balkanski, Y., Bauer, S., Berntsen, T., Berglen, T., Boucher, O., Chin, M., Dentener, F., Diehl, T., Easter, R., Feichter, H., Fillmore, D., Ghan, S., Ginoux, P., Gong, S., Grini, A., Hendricks, J., Horowitz, L., Huang, P., Isaksen, I., Iversen, I., Kloster, S., Koch, D., Kirkevåg, A., Kristjansson, J. E., Krol, M., Lauer, A., Lamarque, J. F., Liu, X., Montanaro, V., Myhre, G., Penner, J., Pitari, G., Reddy, S., Seland, Ø., Stier, P., Takemura, T., and Tie, X.: Analysis and quantification of the diversities of aerosol life cycles within AeroCom, Atmos. Chem. Phys., 6, 1777–1813, https://doi.org/10.5194/acp-6-1777-2006, 2006.
Tobías, A., Caylà, J. A., Pey, J., Alastuey, A., and Querol, X.: Are Saharan dust intrusions increasing the risk of meningococcal meningitis?, International Journal of Infectious Diseases, 15, e503, https://doi.org/10.1016/j.ijid.2011.03.008, 2011.
Toledano, C., Cachorro, V. E., Berjon, A., de Frutos, A. M., Sorribas, M., de la Morena, B. A., and Goloub, P.: Aerosol optical depth and Ångström exponent climatology at El Arenosillo AERONET site (Huelva, Spain), Quarterly Journal of the Royal Meteorological Society, 133, 795–807, https://doi.org/10.1002/qj.54, 2007.
Tong, D. Q., Wang, J. X. L., Gill, T. E., Lei, H., and Wang, B.: Intensified dust storm activity and Valley fever infection in the southwestern United States, Geophysical Research Letters, 44, 4304–4312, https://doi.org/10.1002/2017GL073524, 2017.
Tripathi, S. N., Dey, S., Chandel, A., Srivastava, S., Singh, R. P., and Holben, B. N.: Comparison of MODIS and AERONET derived aerosol optical depth over the Ganga Basin, India, Ann. Geophys., 23, 1093–1101, https://doi.org/10.5194/angeo-23-1093-2005, 2005.
Tsikoudi, I., Marinou, E., Tombrou, M., Giannakaki, E., Proestakis, E., Rizos, K., Vakkari, V., and Amiridis, V.: Atmospheric Boundary Layer in the Atlantic: the desert dust impact, EGUsphere [preprint], https://doi.org/10.5194/egusphere-2025-1105, 2025.
Turnock, S. T., Butt, E. W., Richardson, T. B., Mann, G. W., Reddington, C. L., Forster, P. M., Haywood, J., Crippa, M., Janssens-Maenhout, G., Johnson, C. E., Bellouin, N., Carslaw, K. S., and Spracklen, D. V.: The impact of European legislative and technology measures to reduce air pollutants on air quality, human health and climate, Environ. Res. Lett., 11, 024010, https://doi.org/10.1088/1748-9326/11/2/024010, 2016.
Twomey, S.: Influence of Pollution on Shortwave Albedo of Clouds, J. Atmos. Sci., 34, 1149–1152, https://doi.org/10.1175/1520-0469(1977)034<1149:TIOPOT>2.0.CO;2, 1977.
United Nations (UN): Department of Economic and Social Affairs, P. D.: The World's Cities in 2018 – Data Booklet (ST/ESA/ SER.A/417), https://www.un.org/development/desa/pd/content/worlds-cities-2018-data-booklet (last access: 2 November 2025), 2018a.
United Nations (UN): Department of Economic and Social Affairs, P. D.: World Urbanization Prospects: The 2018 Revision, Online Edition, https://population.un.org/wup/Download/ (last access: June 2022), 2018b.
United Nations (UN): Department of Economic and Social Affairs, P. D.: World Urbanization Prospects: The 2018 Revision (ST/ESA/SER.A/420), United Nations, New York, ST/ESA/SER.A/420, 2019.
United Nations Environment Programme (UNEP): Integrated Assessment of Short-Lived Climate Pollutants for Latin America and the Caribbean: improving air quality while mitigating climate change, Summary for decision makers, United Nations Environment Programme, Nairobi, Kenya, ISBN 978-92-807-3549-9, 2016.
Uno, I., Amano, H., Emori, S., Kinoshita, K., Matsui, I., and Sugimoto, N.: Trans-Pacific yellow sand transport observed in April 1998: A numerical simulation, J. Geophys. Res.-Atmos., 106, 18331–18344, https://doi.org/10.1029/2000JD900748, 2001.
Uno, I., Eguchi, K., Yumimoto, K., Takemura, T., Shimizu, A., Uematsu, M., Liu, Z., Wang, Z., Hara, Y., and Sugimoto, N.: Asian dust transported one full circuit around the globe, Nat. Geosci., 2, 557–560, https://doi.org/10.1038/NGEO583, 2009.
van der Does, M., Knippertz, P., Zschenderlein, P., Harrison, R. G., and Stuut, J.-B. W.: The mysterious long-range transport of giant mineral dust particles, Science Advances, 4, eaau2768, https://doi.org/10.1126/sciadv.aau2768, 2018.
van der Does, M., Brummer, G.-J. A., Korte, L. F., and Stuut, J.-B. W.: Seasonality in Saharan Dust Across the Atlantic Ocean: From Atmospheric Transport to Seafloor Deposition, Journal of Geophysical Research: Atmospheres, 126, e2021JD034614, https://doi.org/10.1029/2021JD034614, 2021.
Vaughan, M. A., Powell, K. A., Winker, D. M., Hostetler, C. A., Kuehn, R. E., Hunt, W. H., Getzewich, B. J., Young, S. A., Liu, Z., and McGill, M. J.: Fully Automated Detection of Cloud and Aerosol Layers in the CALIPSO Lidar Measurements, J. Atmos. Oceanic Technol., 26, 2034–2050, https://doi.org/10.1175/2009JTECHA1228.1, 2009.
Vaughan, M. A., Liu, Z., McGill, M. J., Hu, Y., and Obland, M. D.: On the spectral dependence of backscatter from cirrus clouds: Assessing CALIOP's 1064 nm calibration assumptions using cloud physics lidar measurements, J. Geophys. Res.-Atmos., 115, D14206, 17 pp., https://doi.org/10.1029/2009JD013086, 2010.
Vaughan, M., Garnier, A., Josset, D., Avery, M., Lee, K.-P., Liu, Z., Hunt, W., Pelon, J., Hu, Y., Burton, S., Hair, J., Tackett, J. L., Getzewich, B., Kar, J., and Rodier, S.: CALIPSO lidar calibration at 1064 nm: version 4 algorithm, Atmos. Meas. Tech., 12, 51–82, https://doi.org/10.5194/amt-12-51-2019, 2019.
Veranth, J. M., Reilly, C. A., Veranth, M. M., Moss, T. A., Langelier, C. R., Lanza, D. L., and Yost, G. S.: Inflammatory Cytokines and Cell Death in BEAS-2B Lung Cells Treated with Soil Dust, Lipopolysaccharide, and Surface-Modified Particles, Toxicological Sciences, 82, 88–96, https://doi.org/10.1093/toxsci/kfh248, 2004.
Veselovskii, I., Goloub, P., Podvin, T., Bovchaliuk, V., Derimian, Y., Augustin, P., Fourmentin, M., Tanre, D., Korenskiy, M., Whiteman, D. N., Diallo, A., Ndiaye, T., Kolgotin, A., and Dubovik, O.: Retrieval of optical and physical properties of African dust from multiwavelength Raman lidar measurements during the SHADOW campaign in Senegal, Atmos. Chem. Phys., 16, 7013–7028, https://doi.org/10.5194/acp-16-7013-2016, 2016.
Vinoj, V., Rasch, P. J., Wang, H., Yoon, J.-H., Ma, P.-L., Landu, K., and Singh, B.: Short-term modulation of Indian summer monsoon rainfall by West Asian dust, Nature Geosci., 7, 308–313, https://doi.org/10.1038/ngeo2107, 2014.
von Engeln, A. and Teixeira, J.: A Planetary Boundary Layer Height Climatology Derived from ECMWF Reanalysis Data, Journal of Climate, 26, 6575–6590, https://doi.org/10.1175/JCLI-D-12-00385.1, 2013.
Wang, N., Chen, J., Zhang, Y., Xu, Y., and Yu, W.: The Spatiotemporal Characteristics and Driving Factors of Dust Emissions in East Asia (2000–2021), Remote Sensing, 15, 410, https://doi.org/10.3390/rs15020410, 2023.
Wang, X., Cai, D., Chen, S., Lou, J., Liu, F., Jiao, L., Cheng, H., Zhang, C., Hua, T., and Che, H.: Spatio-temporal trends of dust emissions triggered by desertification in China, CATENA, 200, 105160, https://doi.org/10.1016/j.catena.2021.105160, 2021.
Watanabe, M., Yamasaki, A., Burioka, N., Kurai, J., Yoneda, K., Yoshida, A., Igishi, T., Fukuoka, Y., Nakamoto, M., Takeuchi, H., Suyama, H., Tatsukawa, T., Chikumi, H., Matsumoto, S., Sako, T., Hasegawa, Y., Okazaki, R., Horasaki, K., and Shimizu, E.: Correlation between Asian Dust Storms Worsening Asthma in Western Japan, Allergology International, 60, 267–275, https://doi.org/10.2332/allergolint.10-OA-0239, 2011.
Wei, J., Peng, Y., Mahmood, R., Sun, L., and Guo, J.: Intercomparison in spatial distributions and temporal trends derived from multi-source satellite aerosol products, Atmos. Chem. Phys., 19, 7183–7207, https://doi.org/10.5194/acp-19-7183-2019, 2019.
Weiland, S., Hickmann, T., Lederer, M., Marquardt, J., and Schwindenhammer, S.: The 2030 Agenda for Sustainable Development: Transformative Change through the Sustainable Development Goals?, Politics and Governance, 9, 90–95, https://doi.org/10.17645/pag.v9i1.4191, 2021.
Weinzierl, B., Ansmann, A., Prospero, J. M., Althausen, D., Benker, N., Chouza, F., Dollner, M., Farrell, D., Fomba, W. K., Freudenthaler, V., Gasteiger, J., Groß, S., Haarig, M., Heinold, B., Kandler, K., Kristensen, T. B., Mayol-Bracero, O. L., Müller, T., Reitebuch, O., Sauer, D., Schäfler, A., Schepanski, K., Spanu, A., Tegen, I., Toledano, C., and Walser, A.: The Saharan Aerosol Long-Range Transport and Aerosol–Cloud-Interaction Experiment: Overview and Selected Highlights, B. Am. Meteor. Soc., 98, 1427–1451, https://doi.org/10.1175/BAMS-D-15-00142.1, 2016.
Weinzierl, B., Ansmann, A., Prospero, J. M., Althausen, D., Benker, N., Chouza, F., Dollner, M., Farrell, D., Fomba, W. K., Freudenthaler, V., Gasteiger, J., Groß, S., Haarig, M., Heinold, B., Kandler, K., Kristensen, T. B., Mayol-Bracero, O. L., Müller, T., Reitebuch, O., Sauer, D., Schäfler, A., Schepanski, K., Spanu, A., Tegen, I., Toledano, C., and Walser, A.: The Saharan Aerosol Long-Range Transport and Aerosol–Cloud-Interaction Experiment: Overview and Selected Highlights, Bulletin of the American Meteorological Society, 98, 1427–1451, https://doi.org/10.1175/BAMS-D-15-00142.1, 2017.
Whitby, K. T.: The physical characteristics of sulfur aerosols, Atmos. Environ., 12, 135–159, https://doi.org/10.1016/0004-6981(78)90196-8, 1978.
Wiegner, M., Groß, S., Freudenthaler, V., Schnell, F., and Gasteiger, J.: The May/June 2008 Saharan dust event over Munich: Intensive aerosol parameters from lidar measurements, Journal of Geophysical Research: Atmospheres, 116, https://doi.org/10.1029/2011JD016619, 2011.
Wiggs, G. F. S., O'hara, S. L., Wegerdt, J., Van Der Meer, J., Small, I., and Hubbard, R.: The dynamics and characteristics of aeolian dust in dryland Central Asia: possible impacts on human exposure and respiratory health in the Aral Sea basin, The Geographical Journal, 169, 142–157, https://doi.org/10.1111/1475-4959.04976, 2003.
Willeke, K. and Whitby, K. T.: Atmospheric Aerosols: Size Distribution Interpretation, J. Air Pollut. Control Assoc., 25, 529–534, https://doi.org/10.1080/00022470.1975.10470110, 1975.
Winker, D. M., Vaughan, M. A., Omar, A., Hu, Y., Powell, K. A., Liu, Z., Hunt, W. H., and Young, S. A.: Overview of the CALIPSO Mission and CALIOP Data Processing Algorithms, J. Atmos. Ocean. Technol., 26, 2310–2323, https://doi.org/10.1175/2009JTECHA1281.1, 2009.
Winker, D. M., Pelon, J., Coakley, J. A., Ackerman, S. A., Charlson, R. J., Colarco, P. R., Flamant, P., Fu, Q., Hoff, R. M., Kittaka, C., Kubar, T. L., Le Treut, H., Mccormick, M. P., Mégie, G., Poole, L., Powell, K., Trepte, C., Vaughan, M. A., and Wielicki, B. A.: The CALIPSO MissionA Global 3D View of Aerosols and Clouds, Bull. Amer. Meteor. Soc., 91, 1211–1230, https://doi.org/10.1175/2010BAMS3009.1, 2010.
Winker, D. M., Tackett, J. L., Getzewich, B. J., Liu, Z., Vaughan, M. A., and Rogers, R. R.: The global 3-D distribution of tropospheric aerosols as characterized by CALIOP, Atmos. Chem. Phys., 13, 3345–3361, https://doi.org/10.5194/acp-13-3345-2013, 2013.
Woringer, M., Martiny, N., Porgho, S., Bicaba, B. W., Bar-Hen, A., and Mueller, J. E.: Atmospheric Dust, Early Cases, and Localized Meningitis Epidemics in the African Meningitis Belt: An Analysis Using High Spatial Resolution Data, Environmental Health Perspectives, 126, 097002, https://doi.org/10.1289/EHP2752, 2018.
World Health Organization (WHO): Health and Environment: Draft road map for an enhanced global response to the adverse health effects of air pollution A69/18, World Health Organization, 7 pp., https://apps.who.int/gb/ebwha/pdf_files/WHA69/A69_18-en.pdf (last access: 30 October 2025), 2016.
World Health Organization (WHO): WHO global air quality guidelines: particulate matter (PM2.5 and PM10), ozone, nitrogen dioxide, sulfur dioxide and carbon monoxide, World Health Organization, 290 pp., https://www.who.int/publications/i/item/9789240034228 (last access: 30 October 2025), 2021.
Wu, C., Lin, Z., Liu, X., Li, Y., Lu, Z., and Wu, M.: Can Climate Models Reproduce the Decadal Change of Dust Aerosol in East Asia?, Geophysical Research Letters, 45, 9953–9962, https://doi.org/10.1029/2018GL079376, 2018.
Wu, C., Lin, Z., Shao, Y., Liu, X., and Li, Y.: Drivers of recent decline in dust activity over East Asia, Nat. Commun., 13, 7105, https://doi.org/10.1038/s41467-022-34823-3, 2022.
Yoo, Y., Choung, J. T., Yu, J., Kim, D. K., and Koh, Y. Y.: Acute Effects of Asian Dust Events on Respiratory Symptoms and Peak Expiratory Flow in Children with Mild Asthma, Journal of Korean Medical Science, 23, 66–71, https://doi.org/10.3346/jkms.2008.23.1.66, 2008.
Young, S. A., Vaughan, M. A., Kuehn, R. E., and Winker, D. M.: The Retrieval of Profiles of Particulate Extinction from Cloud–Aerosol Lidar and Infrared Pathfinder Satellite Observations (CALIPSO) Data: Uncertainty and Error Sensitivity Analyses, Journal of Atmospheric and Oceanic Technology, 30, 395–428, https://doi.org/10.1175/JTECH-D-12-00046.1, 2013.
Yu, H., Remer, L. A., Chin, M., Bian, H., Kleidman, R. G., and Diehl, T.: A satellite-based assessment of transpacific transport of pollution aerosol, J. Geophys. Res.-Atmos., 113, D14S12, https://doi.org/10.1029/2007JD009349, 2008.
Yu, H., Yang, Y., Wang, H., Tan, Q., Chin, M., Levy, R. C., Remer, L. A., Smith, S. J., Yuan, T., and Shi, Y.: Interannual variability and trends of combustion aerosol and dust in major continental outflows revealed by MODIS retrievals and CAM5 simulations during 2003–2017, Atmos. Chem. Phys., 20, 139–161, https://doi.org/10.5194/acp-20-139-2020, 2020.
Zeng, S., Vaughan, M., Liu, Z., Trepte, C., Kar, J., Omar, A., Winker, D., Lucker, P., Hu, Y., Getzewich, B., and Avery, M.: Application of high-dimensional fuzzy k-means cluster analysis to CALIOP/CALIPSO version 4.1 cloud–aerosol discrimination, Atmos. Meas. Tech., 12, 2261–2285, https://doi.org/10.5194/amt-12-2261-2019, 2019.
Zhang, J., Peng, G., Huang, M., and Zhang, S.: Are dust storm activities in North China related to Arctic ice–snow cover?, Global and Planetary Change, 52, 225–230, https://doi.org/10.1016/j.gloplacha.2006.02.007, 2006.
Zhang, L., Kok, J. F., Henze, D. K., Li, Q., and Zhao, C.: Improving simulations of fine dust surface concentrations over the western United States by optimizing the particle size distribution, Geophys. Res. Lett., 40, 3270–3275, https://doi.org/10.1002/grl.50591, 2013.
Zhang, W., Guo, J., Miao, Y., Liu, H., Zhang, Y., Li, Z., and Zhai, P.: Planetary boundary layer height from CALIOP compared to radiosonde over China, Atmos. Chem. Phys., 16, 9951–9963, https://doi.org/10.5194/acp-16-9951-2016, 2016a.
Zhang, X., Zhao, L., Tong, D. Q., Wu, G., Dan, M., and Teng, B.: A Systematic Review of Global Desert Dust and Associated Human Health Effects, Atmosphere, 7, 158, https://doi.org/10.3390/atmos7120158, 2016b.
Zhang, X. Y., Arimoto, R., and An, Z. S.: Dust emission from Chinese desert sources linked to variations in atmospheric circulation, J. Geophys. Res.-Atmos., 102, 28041–28047, https://doi.org/10.1029/97JD02300, 1997.
Zhang, X. Y., Gong, S. L., Shen, Z. X., Mei, F. M., Xi, X. X., Liu, L. C., Zhou, Z. J., Wang, D., Wang, Y. Q., and Cheng, Y.: Characterization of soil dust aerosol in China and its transport and distribution during 2001 ACE-Asia: 1. Network observations, J. Geophys. Res.-Atmos., 108, 4261, https://doi.org/10.1029/2002JD002632, 2003.
Zhao, B., Jiang, J. H., Gu, Y., Diner, D., Worden, J., Liou, K.-N., Su, H., Xing, J., Garay, M., and Huang, L.: Decadal-scale trends in regional aerosol particle properties and their linkage to emission changes, Environ. Res. Lett., 12, 054021, https://doi.org/10.1088/1748-9326/aa6cb2, 2017.
Zhao, H., Gui, K., Ma, Y., Wang, Y., Wang, Y., Wang, H., Zheng, Y., Li, L., Zhang, L., Che, H., and Zhang, X.: Seasonal evolution of aerosol loading and its vertical distribution in northeastern China from long-term satellite observations and model reanalysis, Atmospheric Environment, 302, 119720, https://doi.org/10.1016/j.atmosenv.2023.119720, 2023.
Zhao, H., Gui, K., Yao, W., Shang, N., Zhang, X., Liang, Y., Liu, Y., Li, L., Zheng, Y., Wang, Z., Wang, H., Sun, J., Che, H., and Zhang, X.: Relative contributions of component-segregated aerosols to trends in aerosol optical depth over land (2007–2019): Insights from CAMS aerosol reanalysis, Atmospheric Environment, 333, 120676, https://doi.org/10.1016/j.atmosenv.2024.120676, 2024.
Zheng, B., Tong, D., Li, M., Liu, F., Hong, C., Geng, G., Li, H., Li, X., Peng, L., Qi, J., Yan, L., Zhang, Y., Zhao, H., Zheng, Y., He, K., and Zhang, Q.: Trends in China's anthropogenic emissions since 2010 as the consequence of clean air actions, Atmos. Chem. Phys., 18, 14095–14111, https://doi.org/10.5194/acp-18-14095-2018, 2018.
Zhou, W., Wang, H., and Ge, Q.: Contributions of climatic factors and vegetation cover to the temporal shift in Asian dust events, npj Clim. Atmos. Sci., 7, 1–10, https://doi.org/10.1038/s41612-024-00887-9, 2024.
Zou, X. K. and Zhai, P. M.: Relationship between vegetation coverage and spring dust storms over northern China, Journal of Geophysical Research: Atmospheres, 109, https://doi.org/10.1029/2003JD003913, 2004.
- Abstract
- Introduction
- Datasets and methodology
- Consistency assessment of increasing/decreasing aerosol load tendencies
- Atmospheric dust and Air Quality – 16 years of Earth Observations (2007–2022)
- Atmospheric dust and Air Quality - insight into the third decade of the 21st century
- Atmospheric dust as environmental risk factor for human health disorders
- Summary and conclusions
- Data availability
- Author contributions
- Competing interests
- Disclaimer
- Special issue statement
- Acknowledgements
- Financial support
- Review statement
- References
The requested paper has a corresponding corrigendum published. Please read the corrigendum first before downloading the article.
- Article
(29603 KB) - Full-text XML
- Abstract
- Introduction
- Datasets and methodology
- Consistency assessment of increasing/decreasing aerosol load tendencies
- Atmospheric dust and Air Quality – 16 years of Earth Observations (2007–2022)
- Atmospheric dust and Air Quality - insight into the third decade of the 21st century
- Atmospheric dust as environmental risk factor for human health disorders
- Summary and conclusions
- Data availability
- Author contributions
- Competing interests
- Disclaimer
- Special issue statement
- Acknowledgements
- Financial support
- Review statement
- References