the Creative Commons Attribution 4.0 License.
the Creative Commons Attribution 4.0 License.
 | 05 Nov 2025
Characteristics, main sources, health risks of PM2.5-bound polyfluoroalkyl substances (PFAS) in Zhengzhou, central China: from seasonal variation perspective
Jingshen Zhang
Xibin Ma
Minzhen Li
Zichen Wang
Nan Jiang
Yan Liu
Fengchang Wu
Polyfluoroalkyl substances (PFAS) have become the focus due to their physicochemical stability and potential toxicity. In this study, the investigation aimed to characterize the pollution levels, identify the primary sources, and assess the health risks associated with PFAS in PM2.5. The average concentration range for PFAS were between 46.68 and 181.63 pg m−3, with the main components being perfluorooctanoic acid (PFOA), perfluorooctane sulfonate (PFOS), and perfluorobutanoic acid. PFAS concentrations in PM2.5 were greatly influenced by the short- and medium-range air masses, and markedly elevated by industrial activities in surrounding urban areas. The results by positive matrix factorization revealed that PFOA-based products (38.2 %) and degradation byproducts of fluorotelomer alcohols (26.7 %) were the predominant sources. The average daily inhalation of 17 PFAS fluctuated greatly (median: 4.35 × 10⁻³ to 8.78 pg (kg d)−1), showing different seasonal variations with estimated daily intake of PFOA and PFOS reaching peak value in winter (5869.39 pg) and spring (4219.41 pg), respectively. The research indicated that seasonal regulation of PFOA-related manufacturing and joint pollution control with neighboring cities could reduce PFAS levels in PM2.5. The results provided theoretical support for government to make targeted control plans for PFAS and basic data for relevant researchers.
- Article
(5209 KB) - Full-text XML
-
Supplement
(1865 KB) - BibTeX
- EndNote


Polyfluoroalkyl substances (PFAS) can form smooth surfaces that are waterproof, oil-resistant, and stain-resistant, hence their widespread application in various industrial productions, such as paints, surfactants, coatings, emulsifiers, and fire retardants (Lindstrom et al., 2011). During the production and utilization of PFAS-containing products, PFAS are released into a variety of environment. Consequently, PFAS could be detected in the human body (Cardenas et al., 2017), the atmosphere, water, or snow (Dreyer et al., 2009; Hu et al., 2016; Wang et al., 2017) and wildlife (Sedlak et al., 2017). PFAS, having environmental stability, potential for long-range transport and toxicity, cause significant risks to environment and human health (Wang et al., 2022a; Wu et al., 2022). PFAS levels in the atmosphere have attracted adequate attention due to the bioaccumulation and potential toxicity of PFAS.
The PFAS concentration range in the atmosphere of Japan and Malaysia were 3.7–330 pg m−3, with perfluorobutanoic acid (PFBA) exhibiting the highest concentrations (Wang et al., 2022b). The atmospheric concentration range of ∑13PFAS in Chinese cities was between 6.19 and 292.57 pg m−3, with an average value of 39.84 ± 28.08 pg m−3, exceeding the values in other countries. The predominant constituent was identified perfluorooctanoic acid (PFOA) (Han et al., 2019). PFOA and perfluorooctane sulfonate (PFOS) were the primary components of PFAS in the atmosphere of Shenzhen, accounting for approximately 35 % and 22 % of PFAS (Liu et al., 2015). The PFAS peak concentrations occurred during spring (97.5–709 pg L−1), while autumn recorded the lowest levels (9.27–105 pg L−1), exhibiting a seasonal variation in Chengdu (Fang et al., 2019). Due to their low volatility, PFAS tend to be more prevalent in the particulate phase (Liu et al., 2018). The previous study found that most PFAS in the atmosphere are concentrated in the particle phase rather than the gas phase, especially perfluoroalkyl carboxylic acids (PFCAs) tending to distribute in PM2.5 (Heydebreck et al., 2016; Lin et al., 2020). PM2.5 have the capacity to penetrate deep into the lungs, so health risks of PM2.5-bound PFAS have more health risks than PFAS alone, and the synergistic effects of PFAS in PM2.5 have become a key public health priority (Qiao et al., 2024). In a whole, there is a lack of seasonal comparative studies on PM2.5-bound PFAS in densely populated inland urban areas.
PFAS can be directly emitted into the atmosphere during production, transportation, application, and disposal processes (Dong et al., 2021), and enter other environment through atmospheric dry and wet deposition (Barton et al., 2006). Studies have demonstrated that long range atmospheric transport (LRAT) is a significant process influencing the distribution of PFAS (Gawor et al., 2014; Jahnke et al., 2007), serving as a key source for remote inland regions (Ellis et al., 2004; Murr, 2020) and even polar (Wang et al., 2014). Receptor model was successfully used in source apportionment of PFAS. Han et al. (2019) employed positive matrix factorization (PMF) to identify four sources of PFAS within the atmosphere. Meanwhile, Chen et al. (2021) and Wang et al. (2022b) combined principal component analysis with back-trajectory model to assess air mass influence PFAS concentrations in precipitation from the Tibetan Plateau and airborne particulate matter in Chengdu, China. Direct emissions associated with fluoropolymer manufacturing and indirect contributions from incomplete degradation of precursors are the main sources of PFAS in the atmosphere (Barber et al., 2007). For instance, fluorotelomer alcohols (FTOHs) are oxidized by hydroxyl radicals leading to the formation of PFAS (Thackray and Selin, 2017). PFAS are known to be carcinogenic and exposure assessments were conducted in previous studies. The average daily inhalation (ADI) of PFOA and PFOS were quantified, ranging from 0.05–11.97 pg (kg d)−1 and 0.03–8.90 pg (kg d)−1, respectively (Lin et al., 2022; Liu et al., 2015, 2023, 2018). According to human epidemiological studies, the European Food Safety Authority (EFSA) has delineated a tolerable weekly intake for PFOS at 13 ng kg−1 and for PFOA at 6 ng kg−1 (Yeung et al., 2019). In brief, few studies have begun to focus on the source and health risks of PFAS, however no systematic studies have been conducted of PFAS in PM2.5.
Given a comprehensive research of PFAS in PM2.5 is important for enhancing our understanding of the environmental activity, so the pollution characteristics, sources and health risks of PM2.5-bound PFAS were studied. The PM2.5 samples were collected in Zhengzhou, central China, characterized by dense population (12.828 million resident population in 2022) (Zhengzhou Municipal Bureau of Statistics, 2023) and heavy PM2.5 pollution (47.7 µg m−3 in 2022, exceeding the national average by 64.5 %) (Department of Ecology and Environment of Henan Province, 2023; Ministry of Ecology and Environment of the People's Republic of China, 2023), and 17 PFAS were analyzed in this study. The objectives of this study were (1) to characterize seasonal variations in PFAS pollution in PM2.5, (2) to employ multiple models (including back trajectory model, potential source contribution function (PSCF) and PMF model) to identify primary sources as well as potential regional sources contributing to PFAS, and (3) to evaluate health risks associated with PFAS in PM2.5 in four seasons. This study conducted a systemative investigation of PM2.5-bound PFAS in a typical rapidly developing city with relative high PM2.5 pollution, providing an integrated analysis of the pollution characteristics, source identification, and health risks of PFAS, thereby expanding the existing data of knowledge and providing a theoretical basis for the government to make control plans on PFAS in different seasons.
2.1 Sample collection
PM2.5 samples were collected from the rooftop of the Collaborative Innovation Building at Zhengzhou University (34°48′ N, 113°31′ E) on the roof (14 m height), approximately 500 m east of the West Fourth Ring Road and 2 km south of the Lianhuo Expressway. A total of 60 valid samples were collected from December 2022 to November 2023 (details in Table S4 in the Supplement). The diameter of the quartz membrane was 90 mm, with sampling conducted from 10:00 to 09:00 on the following day by using a sampler (JCH-6120-1, Ju Chuang Environmental inc., China) at a flow rate of 100 L min−1. Before sampling, quartz filters were wrapped in aluminum foil and baked in a muffle furnace at 450 °C for 5 h to eliminate organic components. They were then placed in a super clean room (temperature of 20 ± 5°; relative humidity of 50 ± 5 %) for 48 h. Clean the instrument with alcohol cotton before and after each sampling and record the standard state volume of the sampler. Quartz filters were weighed twice before and after sampling respectively, and the error between the two weighing was not more than 10 mg. After weighing the quartz filter, the quartz filter was wrapped in aluminum foil and stored at −18 °C. The above experimental processes were carried out in the ultra-clean room. The samples would be deemed invalid when adverse weather conditions (such as rain or snow) or power outages occurred during sampling process.
2.2 Chemicals and reagents
The chemical reagents used in this study were 17 kinds of PFAS mixed standard solutions and 9 kinds of mass-labeled internal standard mixed standard solutions. 17 PFAS mixed standard solutions: PFBA, Perfluoropentanoic acid (PFPeA), Perfluorohexanoic acid (PFHxA), Perfluoroheptanoic acid (PFHpA), PFOA, Perfluorononanoic acid (PFNA), Perfluorodecanoic acid (PFDA), Perfluoroundecanoic acid (PFUnDA), Perfluorododecanoic acid (PFDoDA), Perfluorotridecanoic acid (PFTrDA), Perfluorotetradecanoic acid (PFTeDA), Perfluorohexadecanoic acid (PFHxDA), Perfluorooctadecanoic acid (PFODA), Perfluorobutane sulfonate (PFBS), Perfluorohexane sulfonate (PFHxS), PFOS, and Perfluorodecane sulfonate (PFDS). 9 kinds of mass-labeled internal standard mixed solutions: 13C4PFBA, 13C4PFHxA, 13C4PFOA, 13C4PFNA, 13C4PFDA, 13C4PFUnDA, 13C2PFDoDA, 18O2PFHxS, and 13C4PFOS. Details could been found in Tables S1 and S2.
2.3 Sample preparation and instrument analysis
After the addition of methanol, the extraction was performed 3 times by sonication. Following the centrifugation (4500 rpm, 15 min), the extracts were diluted with ultrapure water. The extracts were purified using weak anion exchange cartridges and then concentrated to 200 µL with nitrogen. Prior to instrumental analysis, the sample was filtered through a 0.22 μm nylon membrane and transferred into a 2 mL brown injection vial. Detailed steps for sample pretreatment are documented in Sect. S1.1.1 in the Supplement.
The analysis of PFAS was performed using Ultra High Performance Liquid Chromatography-Tandem Mass Spectrometry (Ekspcrt nano Lc425, Singapore) UPLC-MS/MS. The analytical instrument employed consisted of a triple quadrupole liquid chromatography-mass spectrometer. For chromatographic separation, a C18 reverse-phase column (150 mm × 2.1 mm, 1.8 µm) was selected. Comprehensive details regarding the instrumental analysis can be found in Sect. S1.1.2.
2.4 Quality assurance and quality control
During the sample collection, processing, and analysis phases, fluorinated plastic materials were avoided, such as polytetrafluoroethylene (PTFE). Use ceramic scissors to cut quartz filters and wipe the scissor with methanol before cutting another sample to avoid excess particles affecting the next sample. The polypropylene tubes were used. All samplers and containers were precleaned with methanol. The concentrations of the prepared 7-point calibration solution were as follows 0.1, 1, 5, 10, 50, 100, and 200 µg L−1. The concentration of internal standard solution was 10 ng mL−1. The procedure blanks were prepared using the same methods as the samples. Two field blank membranes were collected during each seasonal sampling period. The final concentrations of PFAS were determined by subtracting the concentrations of the procedure blanks from those of the samples. Reagent blanks were employed to monitor instrumentation performance. PFAS were not detected in field blanks and program blanks. The method detection limit (MDL) was calculated based on three times the standard deviation of the blanks. If PFAS were not detected in the blanks, MDL refers to a concentration corresponding to peak intensity with a signal-to-noise ratio (S/N) of 3. Values below MDL were replaced with half of MDL (Han et al., 2019; Li et al., 2024). The MDL value and Mark recovery ranged from 0.2–0.3 (ng L−1) and 71.27 %–118.08 % respectively. This study used a dual-filter sampling system: The Teflon filter was positioned upstream to remove particulate matter, followed by a quartz filter downstream to capture gas-phase PFAS adsorbed onto the quartz filter (Turpin et al., 1994). The dual-filter sampling system was used for supplementary experiments. The sampling location and conditions were consistent with the main PM2.5 sampling work, and the sampling time was from 10:00 on 10 June 2025 to 9:00 on the following day. PFAS levels were below the MDL in the quartz filter sample. This result indicated that the impact of positive sampling artefacts in this study could be ignored. Since the dual-filter experiment was not conducted throughout the entire sampling phase, the possibility of positive sampling artefacts could not be completely excluded. Detailed information on the individual compounds of PFAS is documented in Tables S1 and S2.
The PMF model was used to cluster PFAS with similar sources to identify potential sources. The ADI model was employed to quantitatively evaluate the health risks posed by PFAS to human populations. The detailed information of PMF and ADI models could be found in Sect. S1.2 and S1.3, which provides an in-depth explanation of these analytical frameworks.
3.1 Characteristics of PFAS in PM2.5
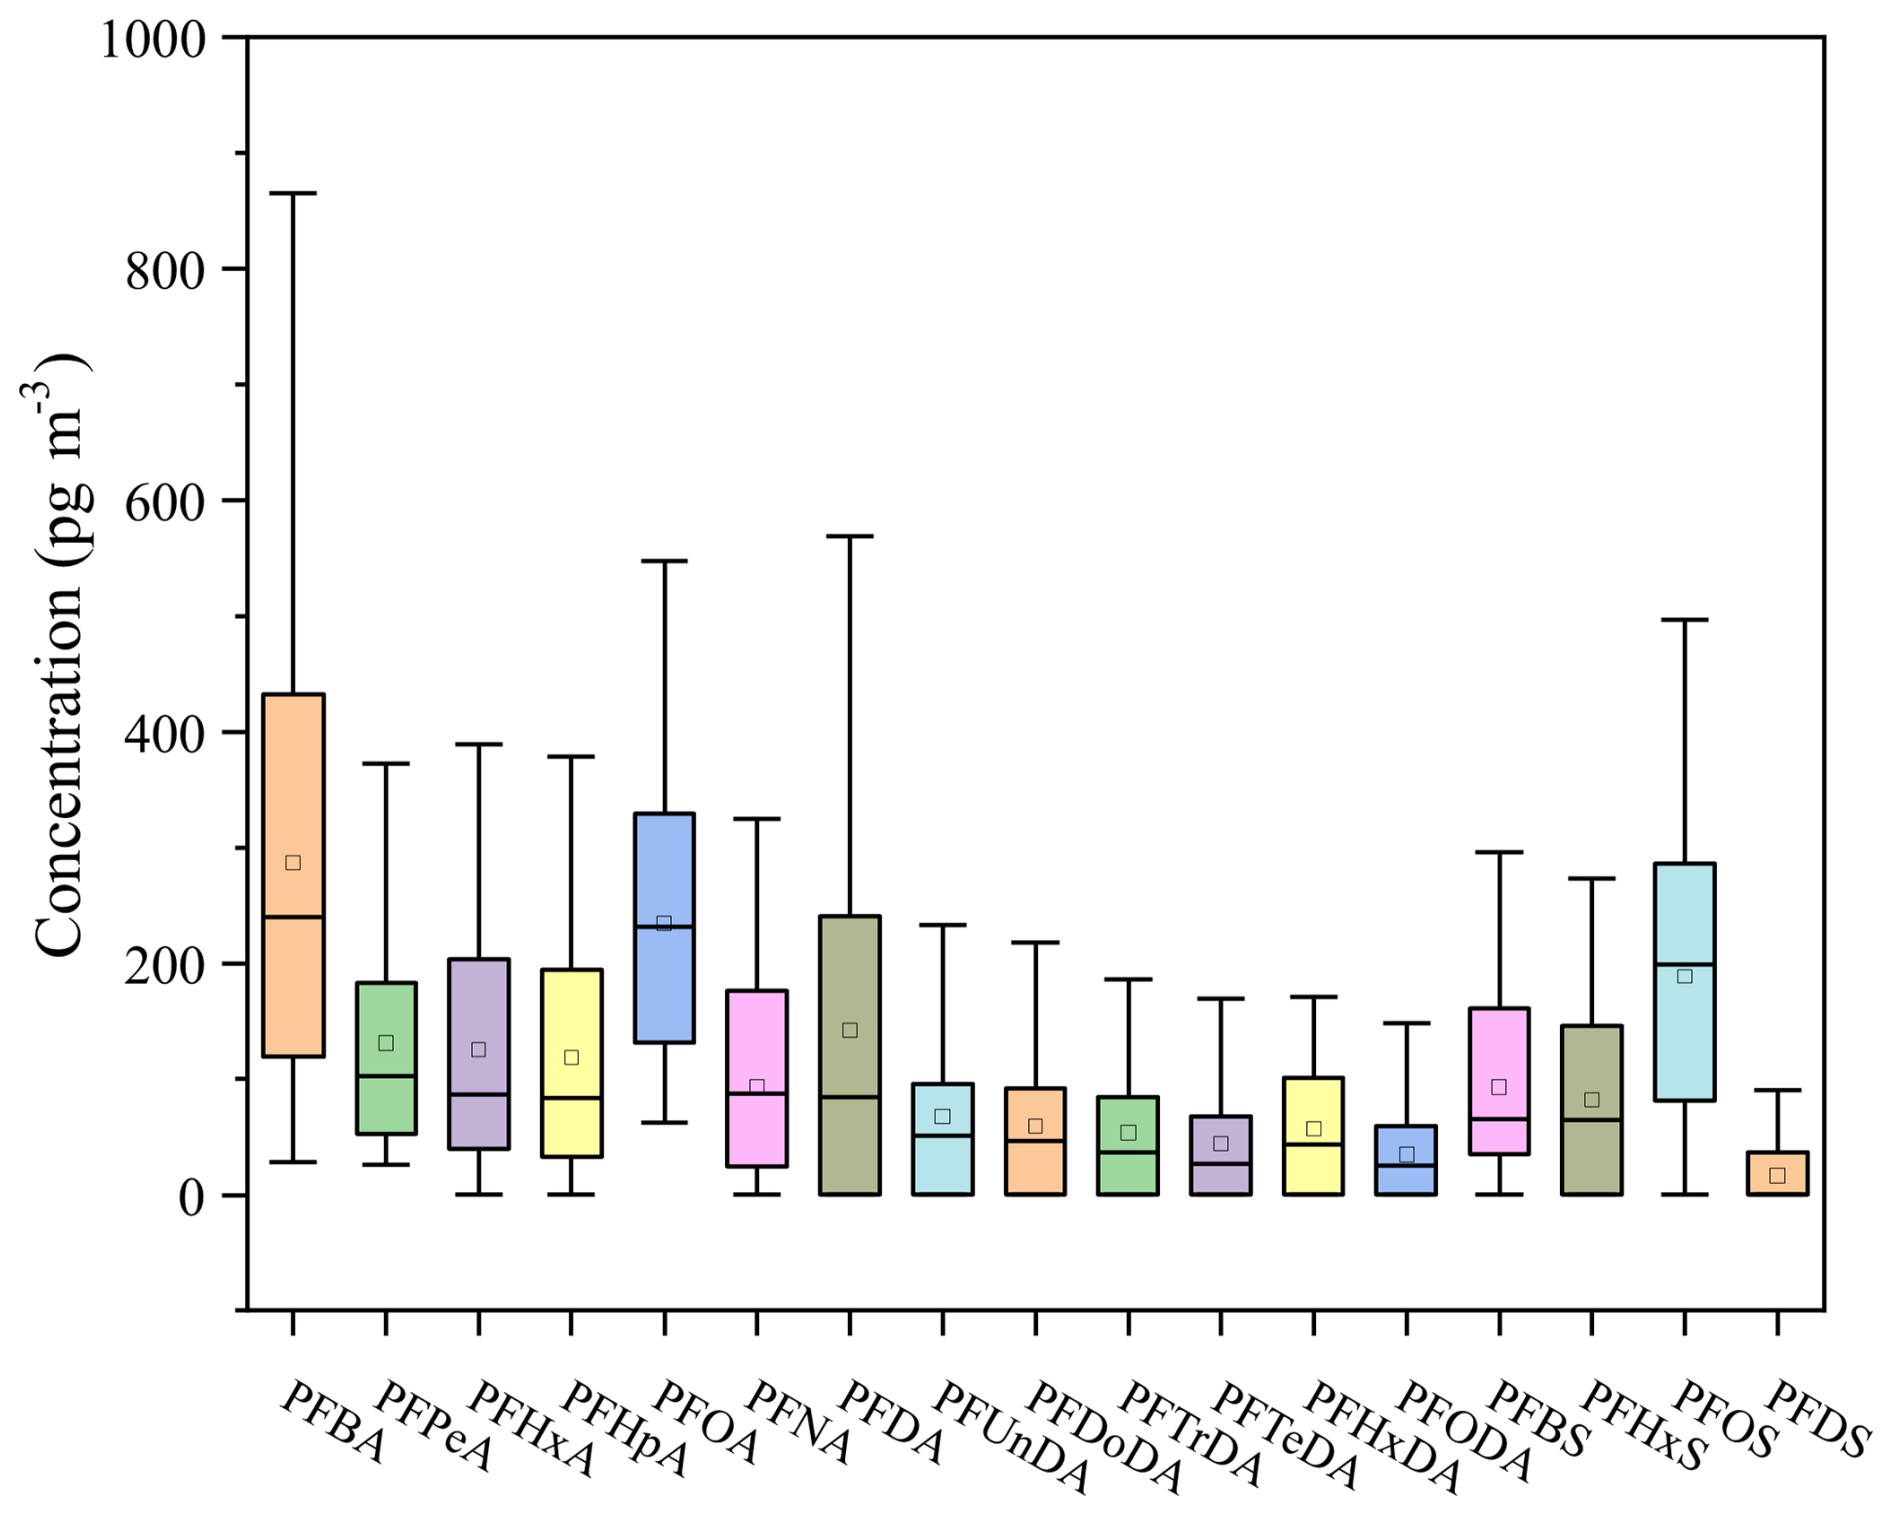
The PFAS average concentrations ranged from 46.68 to 181.63 pg m−3 in Fig. 1 across four seasons. However, the increased airflow during pump operation enhanced the adsorption of gaseous PFAS on quartz filters (Turpin et al., 1994; McMurdo et al., 2008; Ahrens et al., 2012; Chang et al., 2024), which may lead to a slight overestimated of PFAS values in this study. The PFAS average concentrations were comparable to levels observed in Chengdu (150 pg m−3) (Fang et al., 2019), but significantly higher than those recorded in Shenzhen (8.80 pg m−3) (Liu et al., 2015) and the average concentration in China (39.84 pg m−3) (Han et al., 2019). These factors, which characterized this region as having a dense population, concentrated industrial activities, and serious PM2.5 pollution, may contribute to higher PFAS levels than other cities. As shown in Fig. 2, the PFAS concentrations in PM2.5 peaked during winter and were 1.7 times higher than autumn level and 3.9 times higher than summer level. The result indicated that PFAS had obvious seasonal variation. The long-chain PFAS concentrations (1169.60 pg m−3) significantly exceeded that of short-chain PFAS (915.24 pg m−3), consistent with the findings in researches (Han et al., 2019; Tian et al., 2018). Detection rates for PFOA, PFPeA, and PFBA in four seasons reached 100 %, while detection rates for PFHxA, PFHpA, PFBS, and PFOS exceeded 80 %. During the study period, PFOA and PFOS along with its primary substitutes (PFOA primary substitutes: PFBA and PFHxA. PFOS primary substitutes: PFPeA and PFBS.) accounted for 23 %–34 % and 18.1 %–29.9 % of total PFAS, consistent with the research (Liu et al., 2017).
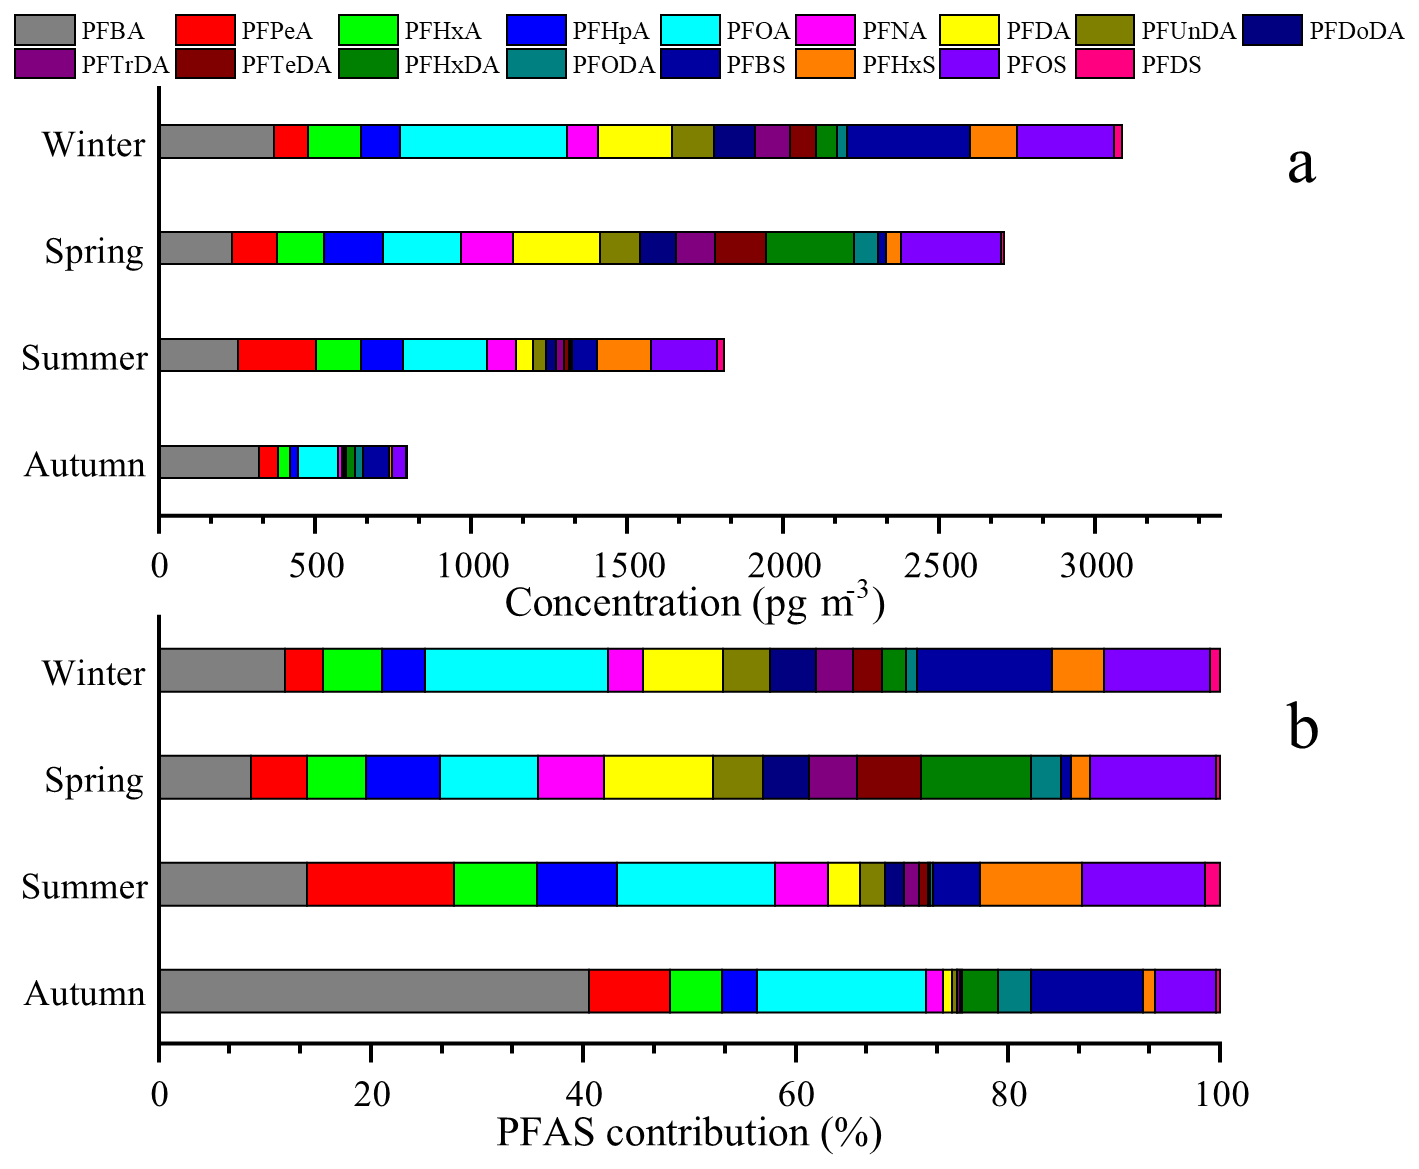
The content of PFOA and its substitutes reached 23 % of total PFAS in autumn, 34 % in winter and, and 31 % in spring and summer. Their applications span across the chemical industry and domestic activities, particularly in the manufacture of plastic and rubber commodities (Liu et al., 2015; Prevedouros et al., 2006). The rising domestic demand and industrial output of PFOA products were outstanding trends within China (Du et al., 2023). The mean concentration of PFOA (294.52 ± 215.40 pg m−3) in Zhengzhou markedly surpassed those recorded in Chengdu (42.3 ± 54.4 pg m−3), Ireland (8.9 pg m−3), and Japan (Tsukuba, 2.6 pg m−3; Morioka, 2.0 pg m−3), but it fell below the levels detected in Changshu, China (556.0 pg m−3), a local area of fluorochemical industrial park (Barber et al., 2007; Fang et al., 2019; Harada et al., 2005; Yu et al., 2018). The content of PFOS and its substitutes were more than 25 % in winter and summer, more than 20 % in autumn, and more than 10 % in spring. PFOS is extensively utilized in metal electroplating, firefighting foams, the semiconductor industry, paper treatment, textiles, and leather processing (Liu et al., 2017). PFPeA and PFBS are the principal substitutes to long-chain PFAS in China, being emitted during the production of PFOS products (Liu et al., 2017). Previous studies have identified PFHxDA as a degradation byproduct of substances based on FTOHs (Ellis et al., 2004; Loewen et al., 2005). The PFHxDA concentration escalated from 2.2 % in winter to 10.4 % in spring, potentially attributable to enhanced atmospheric oxidation.
The seasonal distribution of PFAS in the study region exhibited a pattern where winter concentrations surpassed those of other seasons, with the lowest in autumn. This seasonal variation correlated with the heightened PM2.5 pollution during the winter in this region. It was noteworthy that PFAS concentrations during autumn (46.68 pg m−3), when were at the minimum, still exceeded the national average concentration of 39.84 pg m−3 (Han et al., 2019). Long-chain PFAS (e.g., PFOA and PFOS) were major pollutants and require replacement with short-chain alternatives (e.g., PFBS and PFPeA) or non-fluorinated substitutes such as silicon-based emulsifiers. The chemical industry and domestic activities were the primary contributors to PFAS pollution in this region. A comprehensive analysis of the pollution characteristics and sources of PFAS in PM2.5 was important for generating strategies aiming at release PFAS pollution.
3.2 Analysis of potential regional sources of PFAS in PM2.5
The content of PFAS in the atmosphere is easily influenced by the transport of atmospheric air masses (Liu et al., 2015). As shown in Fig. 3, this study conducted a meteorological trajectory cluster analysis during the sampling period. The spring season was most influenced by short-range atmospheric air masses (accounting for 40.4 %) in this study region. The air mass originated from Middle-Lower Yangtze River plains (PFAS concentrations: 0.26–1.90 pg m−3) (Lu et al., 2018) and then entered the study region from Hubei Province. This air mass would reduce the content of PFAS concentrations in the study area because of the slow diffusion of pollutants caused by relative stability of this air mass and the lower PFAS concentrations than this region. The study region was also affected by the transport of long-range air masses from the northwest direction (accounting for 38.5 %), which passed through the Inner Mongolia and Loess Plateau and the Taihang Mountains. In the autumn, the study region was more influenced by long-range air masses from the northwest (accounting for 57.7 %), which passed through Inner Mongolia and the Loess Plateau to reach the study area. In winter, all trajectory clusters, accounting for 10.0 %, 23.3 %, and 66.7 % respectively, originated from the northwest, indicating a pronounced influence of the cold air from that direction. The increased use of urban coal combustion in winter along this direction tended to create polluted air masses, which were then transported and increased the pollution levels in the study region by northwesterly winds. The long-range air masses, passing through the Inner Mongolia Plateau and the Loess Plateau of northwest, generated the most important influence on the seasonal transport patterns during summer, autumn, and winter in the study region. Northwest China is situated in a plateau region. The high-altitude region has a cold-trapping effect on PFAS in the atmosphere (Gouin et al., 2004), which can effectively reduce the content of PFAS in atmospheric air masses. The Loess Plateau could weaken the influence of air masses from the northwest on PM2.5-bound PFAS levels in the study region. This result was consistent with the analysis of potential sources of PFAS using the PSCF below.
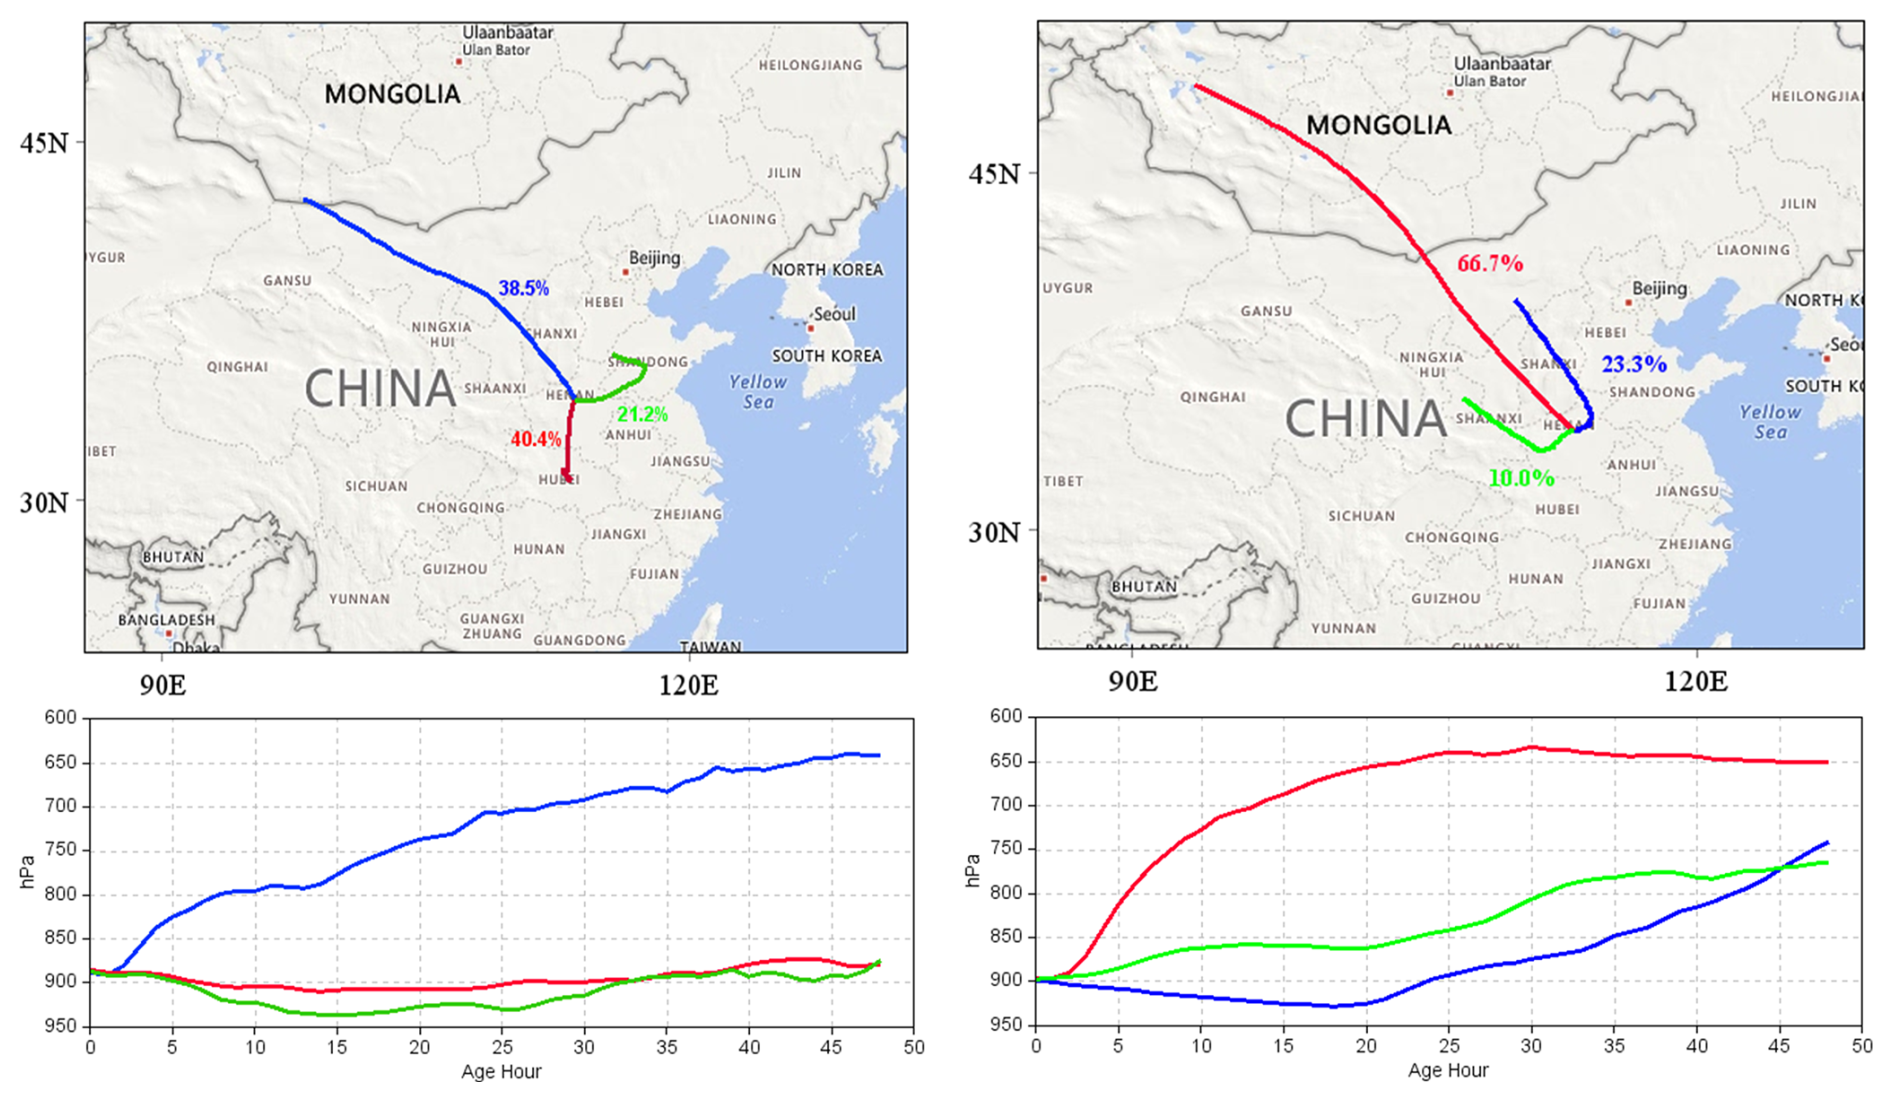
Figure 3Cluster analysis map of backward trajectories in Zhengzhou City (left and right are spring and winter respectively, created by MeteoInfoMap 3.5.11; Wang, 2014, 2019). © Microsoft. The software is open.
As shown in Fig. 4, the strong potential source regions (WPSCF ≥ 0.5) during spring were primarily concentrated in the southwest region of the province, significantly influenced by the southwest air masses. The strong potential source regions were mainly found in the surrounding regions of the province during summer, transferred to the northwest and southwest outside the province during autumn, and were principally distributed in the northwest and northeast within the province during winter. The study results indicated that the influence of the northeast air masses on the distribution of potential sources was more obvious in the study region. This result could be attributed to the fact that the study region was located in the typical industrial province characterized by industries such as textile treatment, metal electroplating, and fire-fighting foam manufacturing. The wide use of PFAS in industrial production, such as emulsifiers and fluoropolymers, had led to increased emissions of these substances into the atmosphere. Additionally, human activities, such as the use of non-stick coatings on cookware and waterproof and stain-resistant materials, particularly in densely populated areas near study region, heightened PFAS pollution levels (Dewapriya et al., 2023; Dhore and Murthy, 2021; Grunfeld et al., 2024; Li et al., 2024; Wang et al., 2024). This result was consistent with conclusions drawn by Chen et al. (2021) and Han et al. (2019). Seasonal variation could cause the distribution of strong potential source regions to change. In contrast to spring and summer, the distribution of strong potential source regions were more influenced by the northwest air masses in autumn and winter. In addition to autumn, strong potential source regions mainly distributed in the surrounding regions of the province in spring, summer and winter.
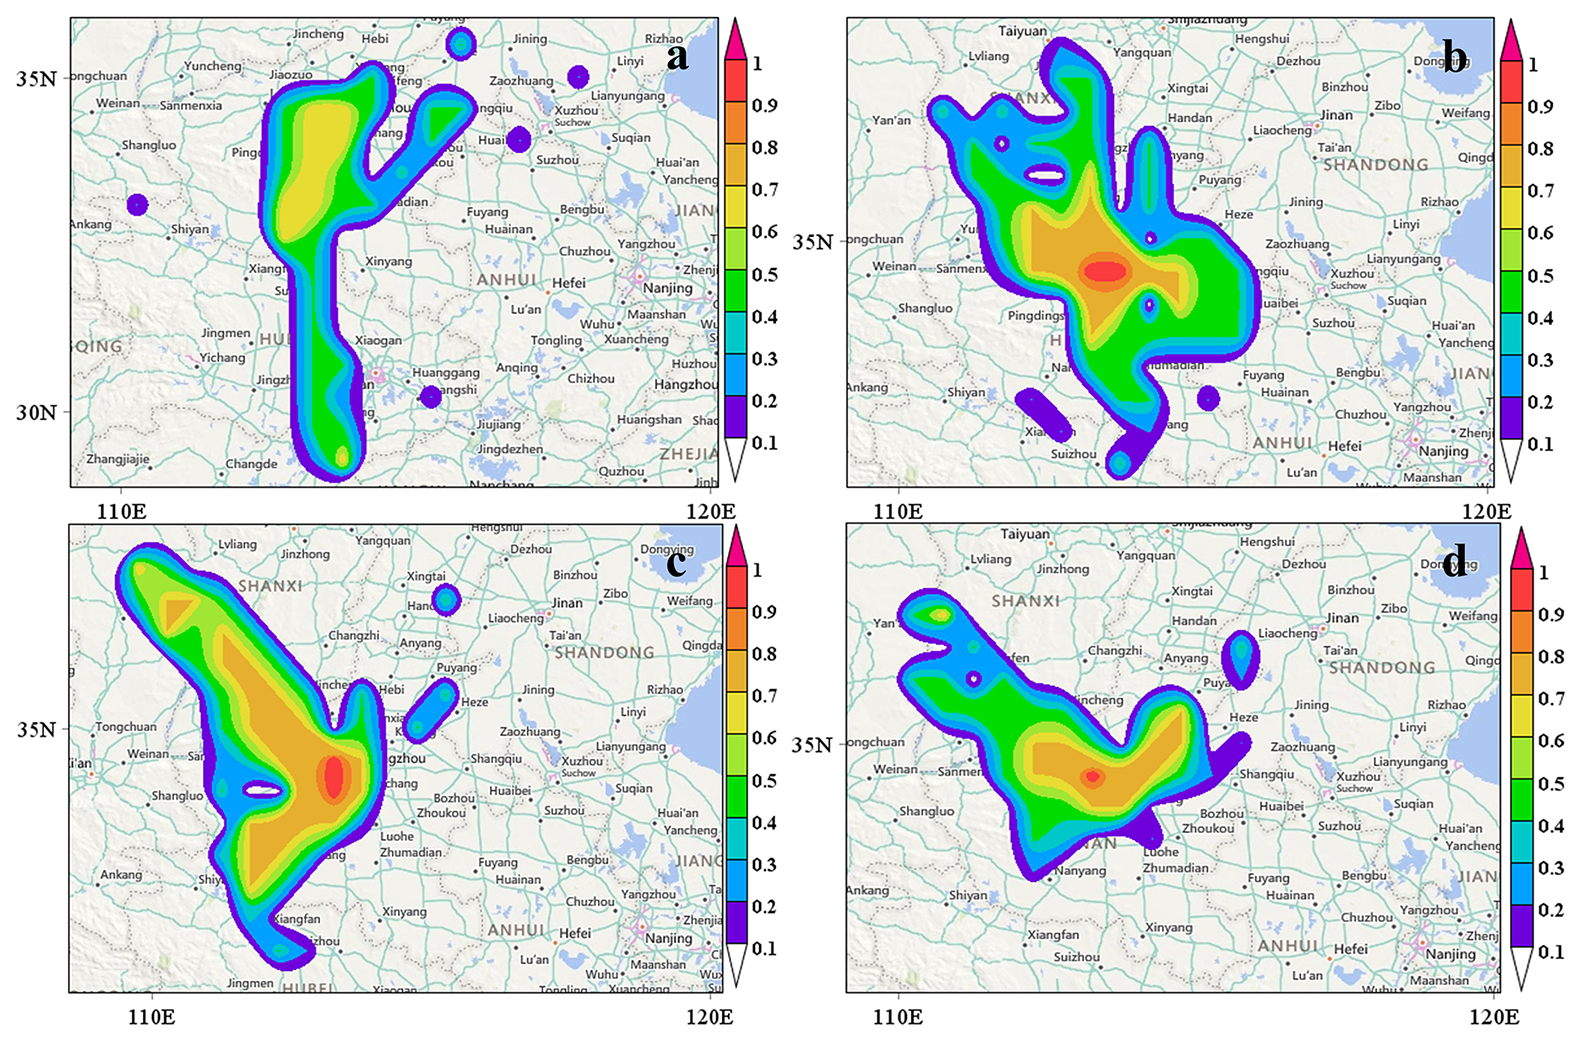
Figure 4Map of potential source analysis of PM2.5-bound PFAS in Zhengzhou City in four seasons (a: spring, b: summer, c: fall and d: winter respectively, created by MeteoInfoMap 3.5.11; Wang, 2014, 2019). © Microsoft. The software is open.
Research indicated that the PFAS levels in PM2.5 were more influence by medium- and short-range air masses and terrain. To control PFAS levels in PM2.5, it is necessary to not only manage local emissions but also identify the pollution transport pathways and sources across different seasons. Strengthen the joint prevention and control of neighboring cities on a seasonal basis. For example, regulate PFAS emissions from textile and electroplating industries along southern urban in spring, collaborate with northwestern provinces to curb coal combustion in key transport cities in winter, establish pollution-blocking monitoring networks at northwestern entry points (e.g., Jiaozuo city and Jiyuan city) and leveraging the Taihang Mountains and Loess Plateau to intercept pollutants, in summer and autumn. The results of this research provided a theoretical basis for the formulation of policies related to the control of PFAS levels in PM2.5.
3.3 PMF receptor analysis
To further investigate the potential PFAS sources in PM2.5, this study employed PMF for source apportionment of PFAS. As illustrated in Fig. 5b, Factor 1 was predominantly characterized by high loadings of PFUnDA (72.5 %), PFDoDA (71.4 %), PFTrDA (80.4 %), and PFTeDA (96.0 %). Long-chain PFAS (C11–C14) were known degradation products of Long-chain FTOHs (Liu et al., 2017; Thackray and Selin, 2017; Wang et al., 2014). The global accumulated estimates for PFUdA, PFDoDA, PFTrDA, and PFTeDA ranged from 9 to 230 t from 2003 to 2015, and the research shown an expected release of between 0 to 84 t from 2016 to 2030 based on the lifecycle use and emission patterns associated with fluorocomplexes and other fluorine-containing products (Wang et al., 2014). Therefore, this factor, contributing 26.7 % to total PFAS, was thought to be the degradation products of FTOHs.
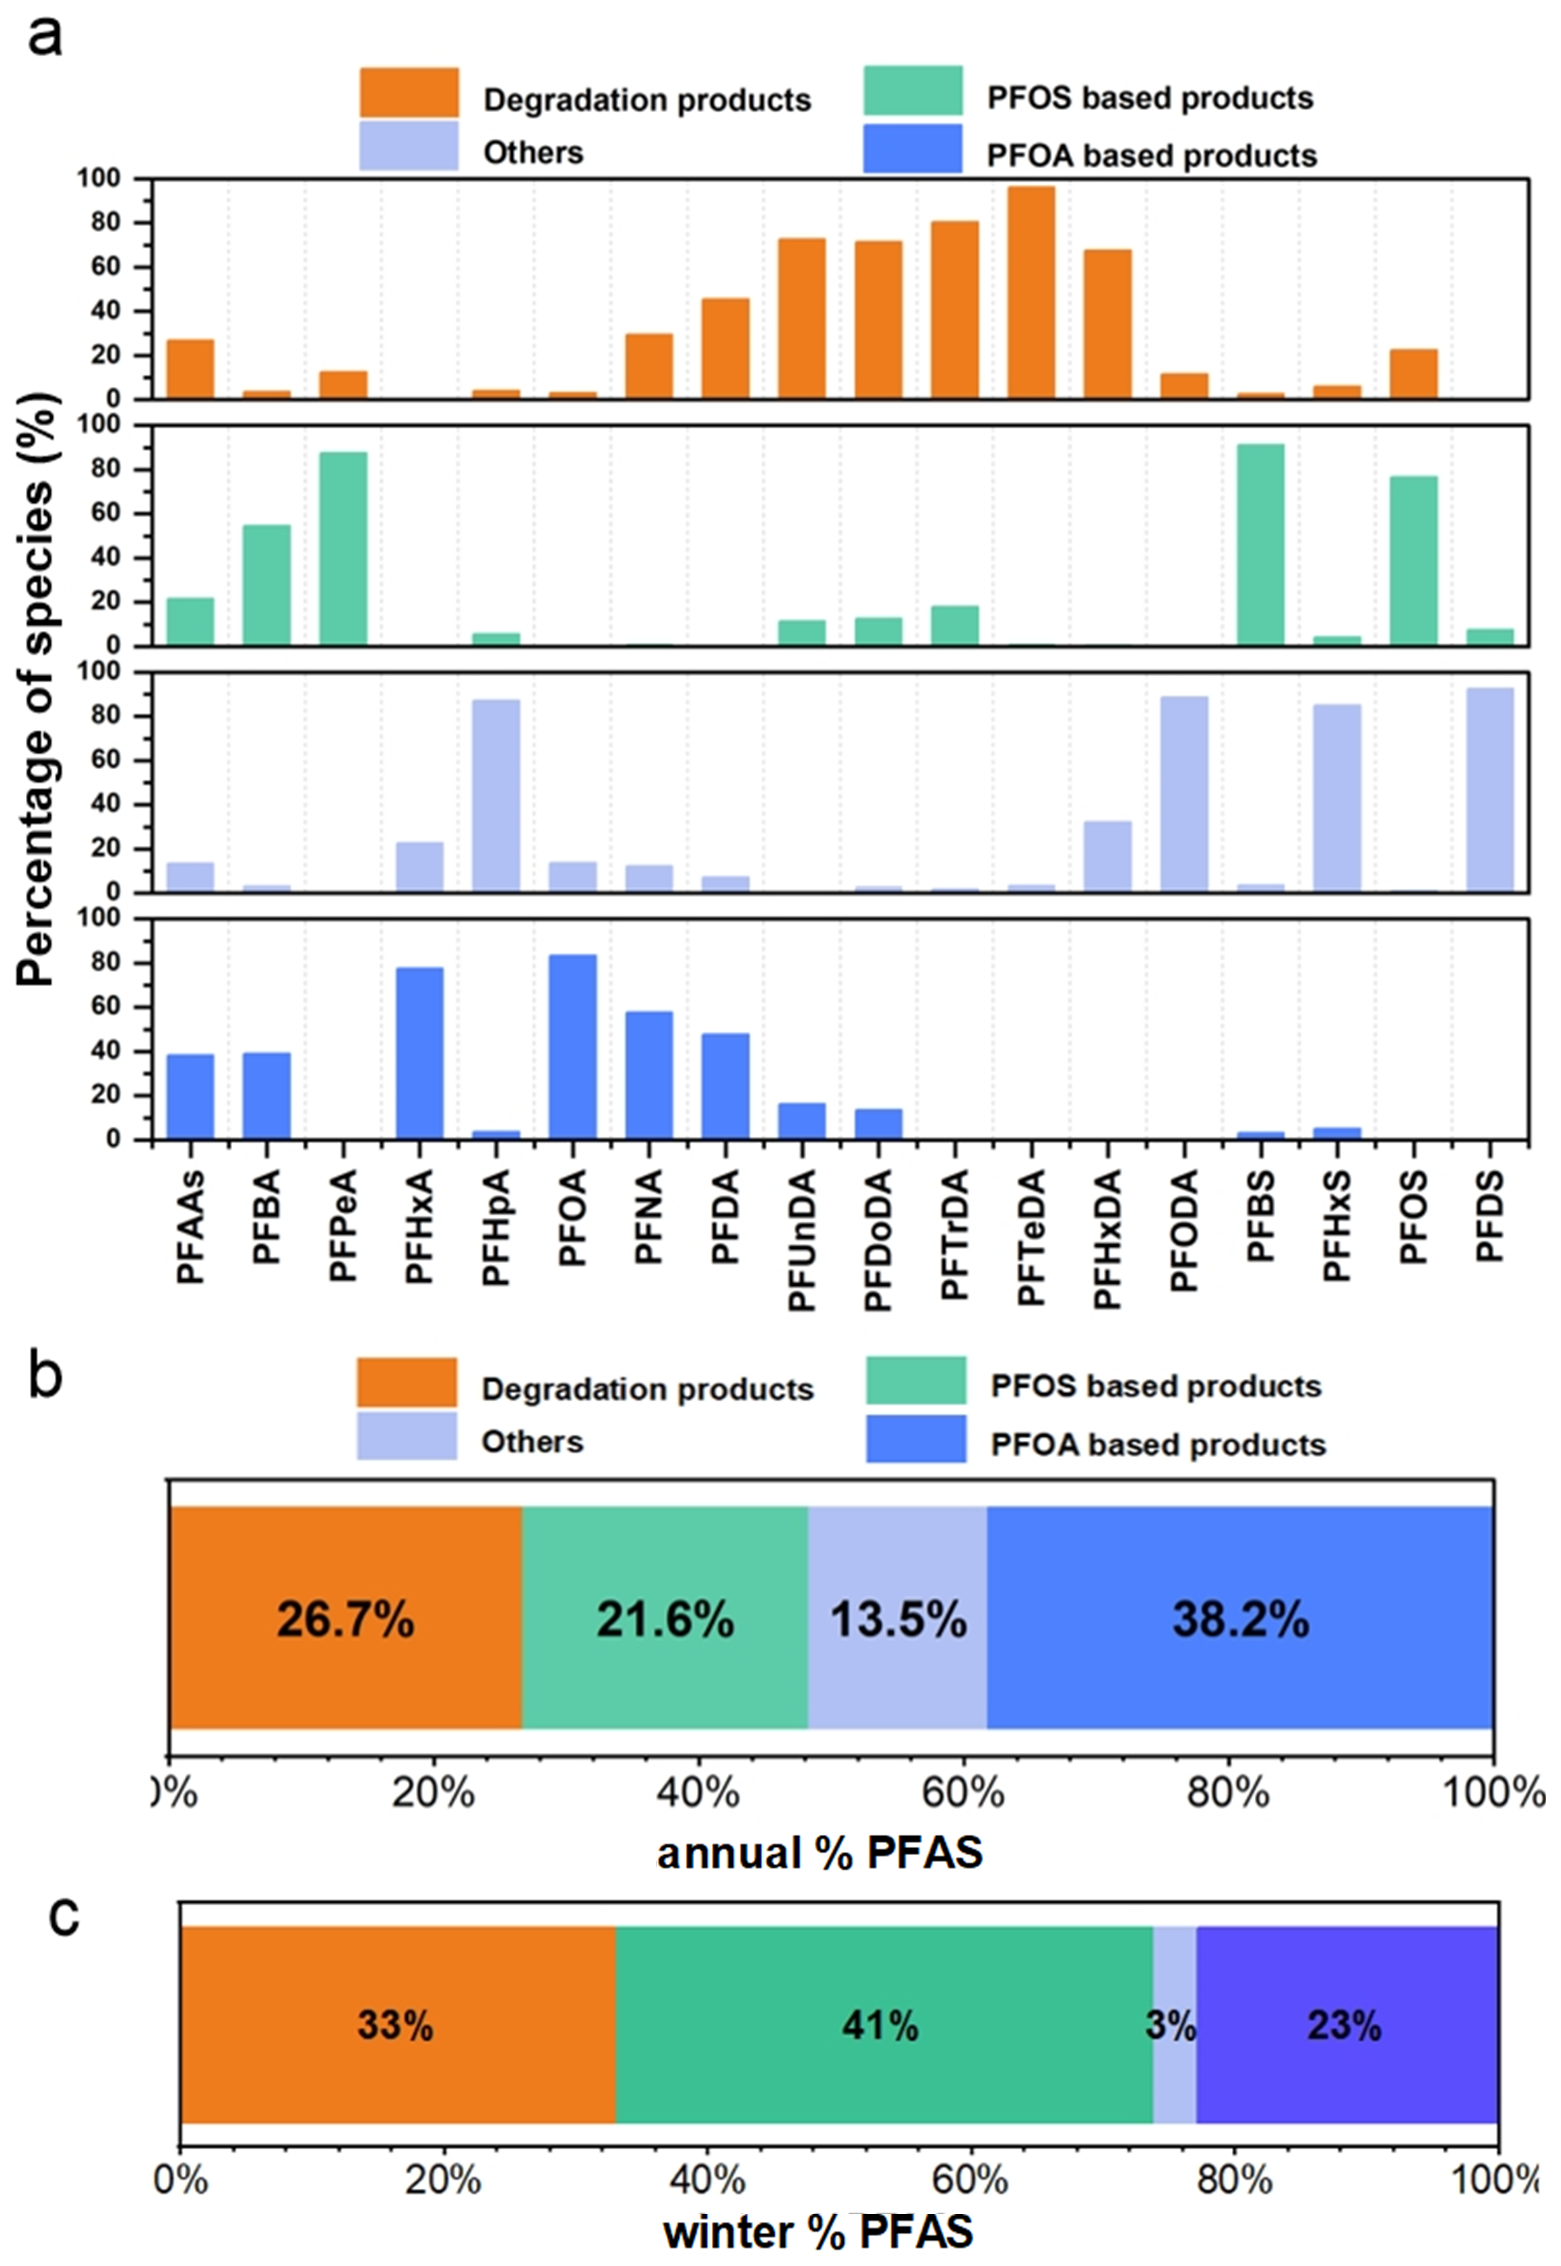
Figure 5The source distribution spectrum of PFAS in PMF (a), the annual source proportion diagram (b) and the winter source proportion diagram (c).
According to the PMF analysis results, it indicated that PFPeA, PFBS, and PFOS may originate from a common source with contribution rates of 87.4 %, 91.0 %, and 76.6 % in Factor 2 respectively. The research indicated that three primary kinds of chemicals related to PFOS-namely perfluorooctane sulfonates, substances containing these compounds and polymers were widely useded in industrial production (Xie et al., 2013). The use of PFOS-related products have resulted in the emission of PFOS into the atmosphere during both industrial processes and human activities. PFPeA and PFBS, because of being the significant substitutes of long-chain PFAS, may be released as impurities or by-products during the manufacturing of PFOS-based products (Liu et al., 2017). Therefore, this factor, contributing 21.6 % to total PFAS, was regarded as a direct source of perfluorooctane sulfonic acid products.
Factor 3 was characterized by high loadings of PFHpA (loading value: 87.1 %) and PFHxS (loading value: 85.0 %). The formation and transformation for PFHpA and its derivatives remained unclear. The factor containing only PFHxS did not point to a specific source. Therefore, it was thought to be other sources influenced potentially by atmospheric air masses or alternative origins. Thus, the contribution from the source was thought to be 13.5 % for PFAS.
Factor 4 was identified as the primary source of PFOA products manufacturing, characterized by significant loadings of PFHxA (77.5 %), PFOA (83.4 %), PFNA (77.5 %), and PFDA (47.6 %). PFOA had been widely used as an emulsifying agent in the production of plastics, rubber products, textile flame retardants, paper surface treatments, fire-fighting foams, and PTFE emulsifiers (Liu et al., 2015). The research indicated that due to a rapid increase in domestic demand for PFOA products in China, the emissions of PFCAs from factories producing these substances have increased (Wang et al., 2014). PFOA, PFNA and their substitutes could be released through waste gases. The contribution of this source to PFAS accounted for 38.2 %.
The sources of PFAS are multifaceted and seasonal. Source apportionment was conducted in winter when PFAS pollution was most severe. As shown in Fig. 5c, PFOS products contributed the most to PFAS sources in winter PM2.5 (41 %), followed by FTOHs degradation products (33 %). Factor analysis indicated the contributions of PFAS in PM2.5 came from the degradation of specific fluorinated products and direct emissions from industrial productions. The analysis of long-chain PFAS emphasized the potential environmental impact associated with the production and use of FTOHs with degradation products contributing 26.7 % to PFAS in PM2.5. Furthermore, contributions from PFOS- and PFOA-related compounds to PFAS in PM2.5 were found to be 21.6 % and 38.2 %. Additionally, it was thought that 13.5 % of PFAS originated from unknown sources, and indicated a significant gap in our understanding regarding their environmental behavior. This finding emphasizes the urgent need for further research aiming at enhancing our comprehension of PFAS in PM2.5.
3.4 Environmental indication of health impact risk
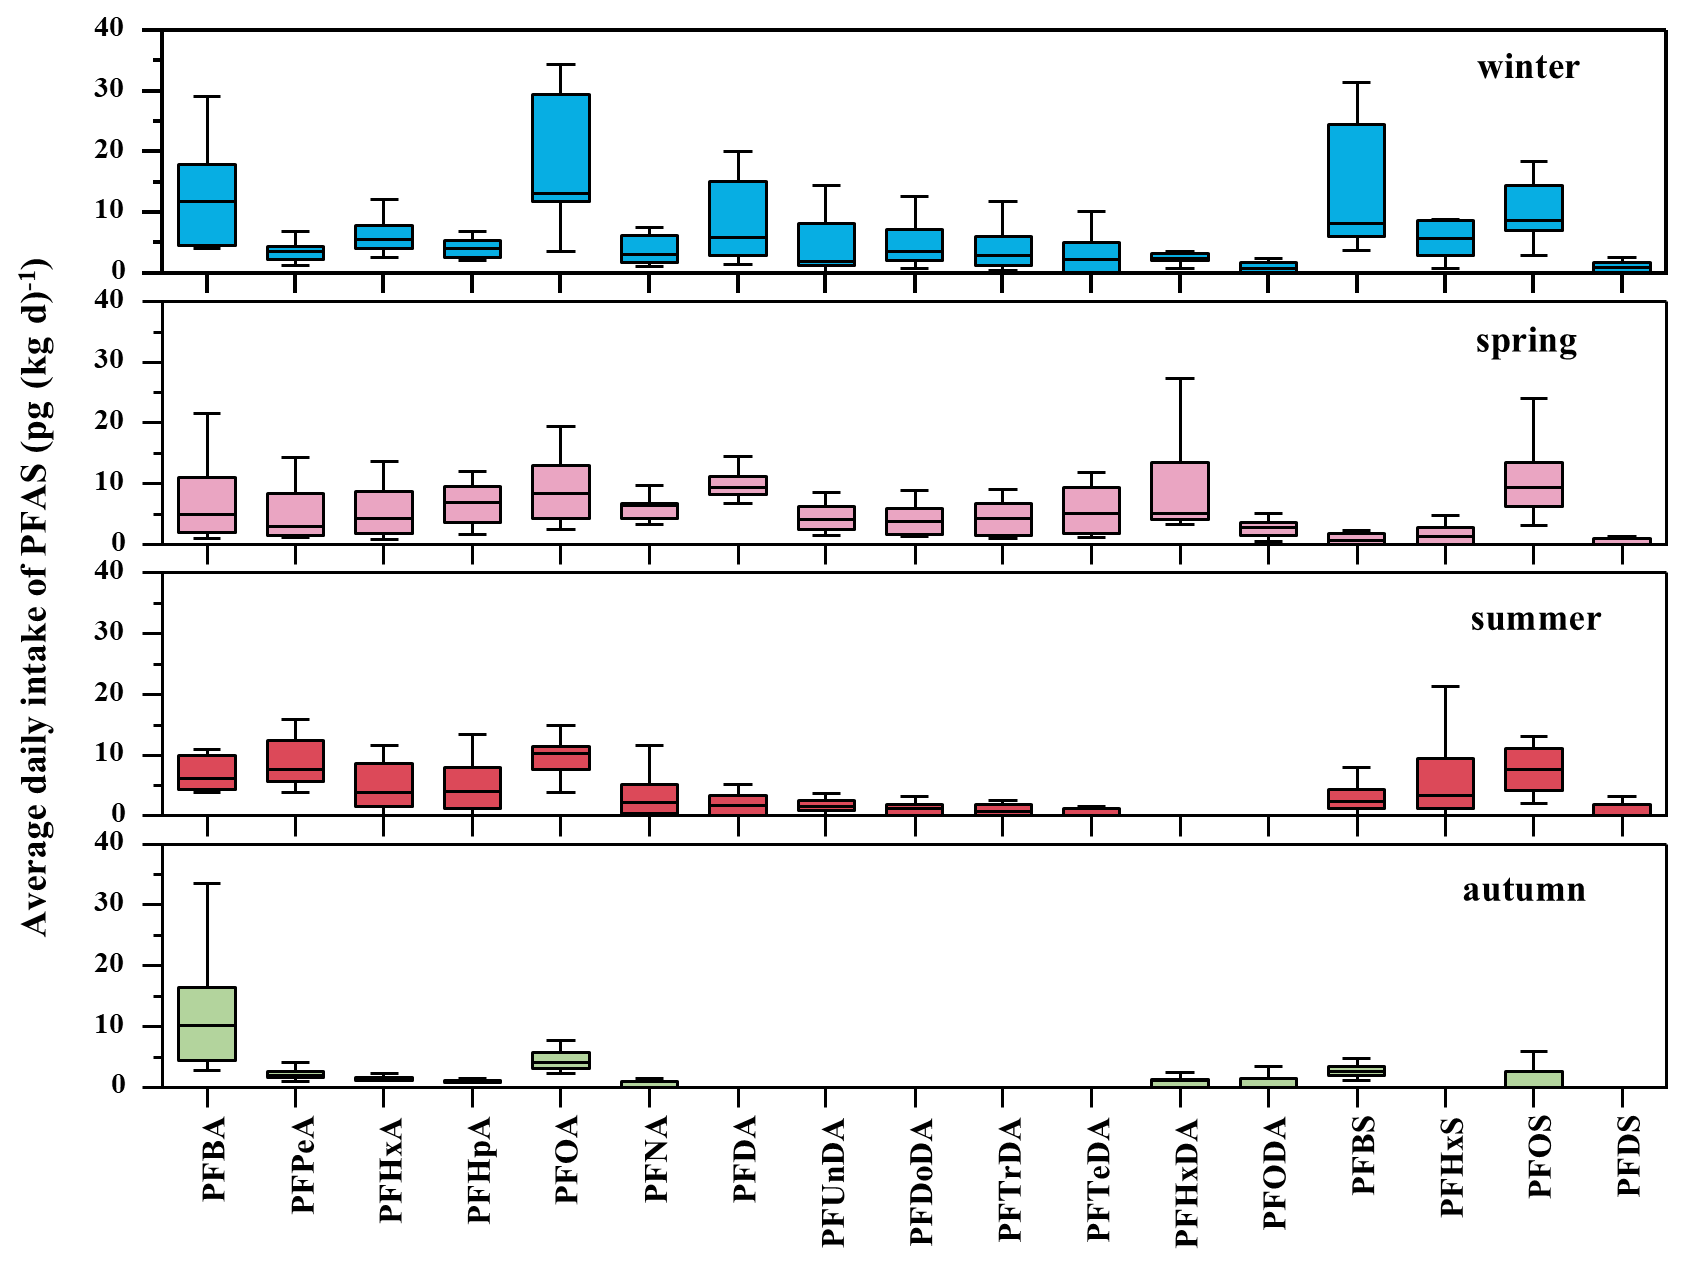
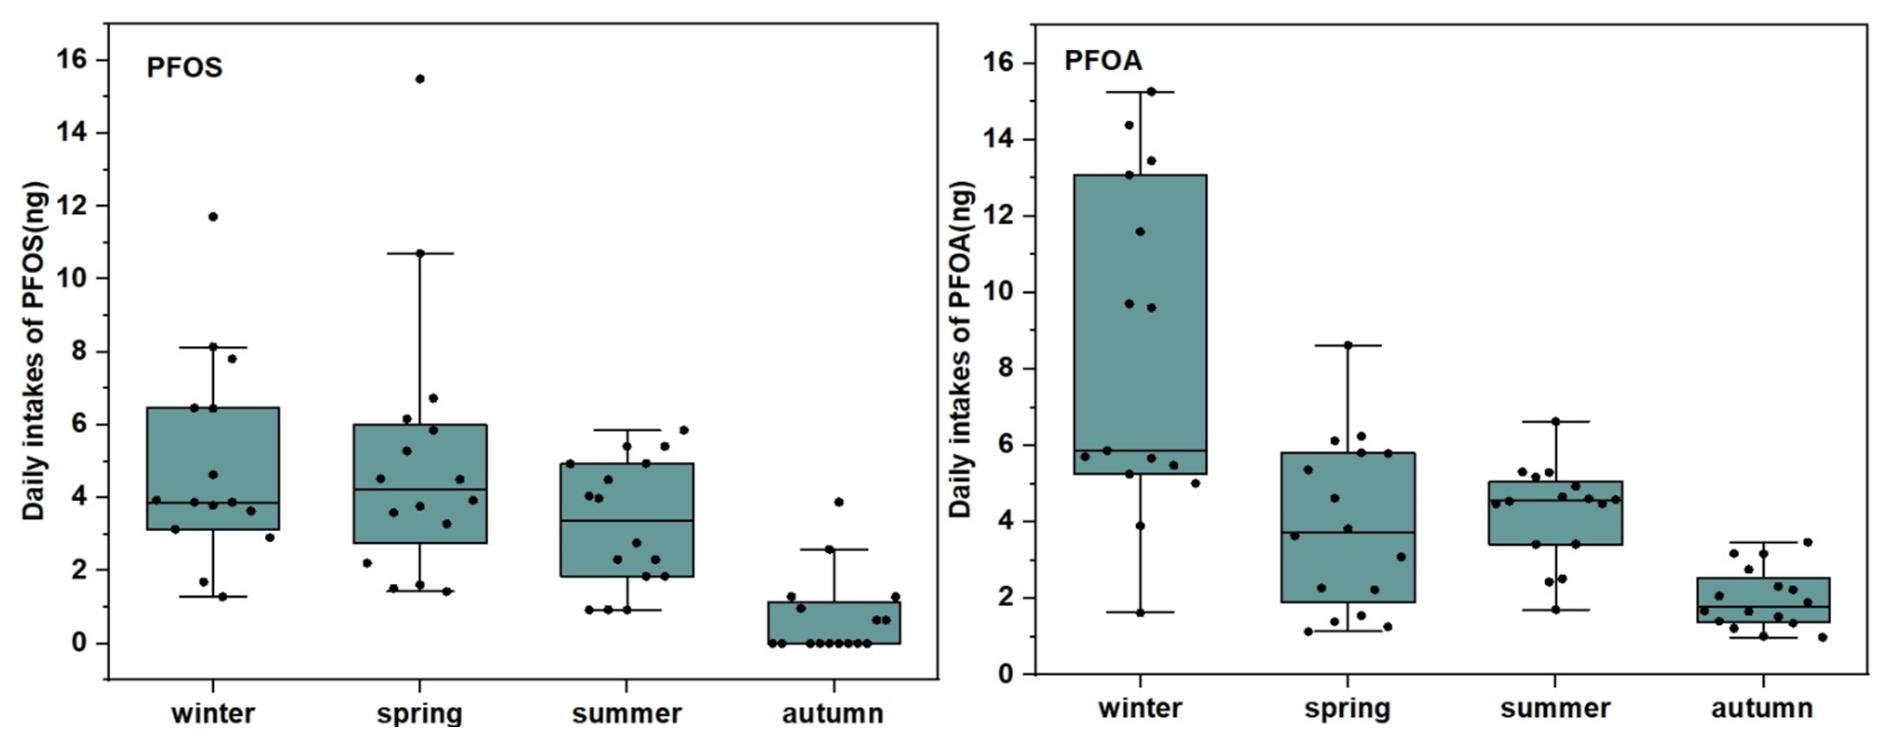
Figure 6 illustrated the ADI of PFAS in PM2.5. The median ADI ranged from 4.35 × 10⁻³ to 8.78 pg (kg d)−1, with relative high values for PFBA, PFOA, and PFOS in four seasons. Notably, PFOA exhibited a median ADI as high as 8.78 pg (kg d)−1, with potential carcinogenicity risk on human immune and reproductive systems (Lin et al., 2022). The high ADI values of these compounds raise concerns regarding their potential health impacts, especially given that PM2.5 can be inhaled into human lungs, thereby complicating the health implications of exposure to PM2.5 containing PFAS. Although the ADI levels of these compounds remained below the tolerable intake limits set by the EFSA (Yeung et al., 2019), it is important to consider that PFAS are resistant to degradation within the human body. For example PFOS has a half-life of approximately 5.4 years (Wei et al., 2023). Therefore, long-term exposure to lower concentrations of PFAS than limit values still may accumulate over time and potentially lead to adverse health outcomes. This study discovered pronounced seasonal variation in the estimated daily intake (EDI) (Fig. 7). The PFOA and PFOS EDI exhibited the remarkable peak during winter (the median values: 5869.39 pg) and spring (the median values: 4219.41 pg) respectively, and recorded the lowest average daily exposure dose during autumn (the median values 1787.21 and 3285.28 pg). A comparative analysis of the seasonal EDI patterns indicated that the winter season was characterized by a relatively elevated daily exposure dose, particularly for PFOA. The observed seasonal fluctuations in EDI were due to changes in concentration due to a combination of influence factors such as ambient temperature, relative humidity, human activities, and atmospheric air mass transport. For example, these factors comprehensively influenced the atmospheric partitioning and deposition of PFOA and PFOS, thereby impacting the population's exposure to these PFAS.
To mitigate PFAS contamination and protect environmental health, it is recommended to strengthen regulatory controls on industrial emissions, upgrade wastewater treatment technologies, and enhance public awareness of PFAS risks. Regular monitoring of PFAS in environmental media is crucial, and industries should be incentivized to adopt safer alternatives. Additionally, further research is needed to better understand the long-term environmental and health impacts of PFAS exposure.
This study conducted a one-year sampling of PM2.5 and utilized UPLC-MS/MS to detect PFAS in the samples. A comprehensive analysis of the pollution characteristics, source apportionment, and health risk assessment of PFAS in PM2.5 was conducted. The results indicated that the detection rates of PFOA, PFPeA and PFBA were 100 %, PFHxA, PFHpA, PFBS and PFOS were more than 80 %. PFAS concentrations were highest in winter (mean value: 181.63 pg m−3) and lowest in autumn (mean value: 46.68 pg m−3), however the lowest values still significantly higher than the national average from previous study. PFOA and PFOS along with its substitutes were primary PFAS in PM2.5. Backward trajectory analysis of the study region revealed that the PFAS concentrations were susceptible to medium and short-range atmospheric air mass transport. Controlling the concentration of PFAS in PM2.5 requires primarily reducing local emissions and strengthening joint prevention in different seasons. PMF analysis indicated that the main PFAS sources were products of PFOA and its substitutes (38.2 %), degradation products of fluorotelomer-based products (26.7 %) and PFOS and its substitutes (21.6 %). There was also an unknown source accounting for 13.6 %, indicating that there are still significant limitations in our understanding of the PFAS environmental behavior, and further research is necessary. The PFAS ADI was below the tolerable intake limit set by the EFSA. The high EDI PFAS values, which could be inhaled into human lungs through PM2.5, should be a concern due to their potential to complicate health effects, making PFAS research particularly important in regions with heavy PM2.5 pollution. Monitoring the impact of atmospheric air mass transport in the study region by season, strengthening targeted joint prevention and control with neighboring cities are crucial steps in reducing the concentration of PFAS in PM2.5. The study results of concentration characteristics, origin and health effects of PFAS could provide theoretical support and basic data for government and follow-up researchers to reduce PFAS levels.
All raw data can be provided by the corresponding authors upon request.
The supplement related to this article is available online at https://doi.org/10.5194/acp-25-14735-2025-supplement.
JZ: writing – review and editing; XM: writing – original draft preparation, writing – review and editing; ML: writing – review and editing; ZW: writing – review and editing; NJ: writing – review and editing, supervision, project administration; FW: resources.
The contact author has declared that none of the authors has any competing interests.
Publisher’s note: Copernicus Publications remains neutral with regard to jurisdictional claims made in the text, published maps, institutional affiliations, or any other geographical representation in this paper. While Copernicus Publications makes every effort to include appropriate place names, the final responsibility lies with the authors. Also, please note that this paper has not received English language copy-editing. Views expressed in the text are those of the authors and do not necessarily reflect the views of the publisher.
The authors gratefully acknowledge the financial support of the National Natural Science Foundation of China, the Key Research and Development Special Project of Henan Province,and Huanghuai Lab Sci-Tech Innovation Project.
This research has been supported by the National Natural Science Foundation of China (grant no. 52570217, 52170117), the Key Research and Development Special Project of Henan Province (grant no. 252102321049) and Huanghuai Lab Sci-Tech Innovation Project (grant no. 240700004).
This paper was edited by Ivan Kourtchev and reviewed by two anonymous referees.
Ahrens, L., Harner, T., Shoeib, M., Lane, D. A., and Murphy, J. G.: Improved Characterization of Gas-Particle Partitioning for Per- and Polyfluoroalkyl Substances in the Atmosphere Using Annular Diffusion Denuder Samplers, Envion. Sci. Technol., 46, 7199–7206, https://doi.org/10.1021/es300898s, 2012.
Barber, J. L., Berger, U., Chaemfa, C., Huber, S., Jahnke, A., Temme, C., and Jones, K. C.: Analysis of per- and polyfluorinated alkyl substances in air samples from Northwest Europe, J. Environ. Monit., 9, 530–541, https://doi.org/10.1039/b701417a, 2007.
Barton, C. A., Butler, L. E., Zarzecki, C. J., Flaherty, J., and Kaiser, M.: Characterizing perfluorooctanoate in ambient air near the fence line of a manufacturing facility: Comparing modeled and monitored values, J. Air Waste Manage. Assoc., 56, 48–55, https://doi.org/10.1080/10473289.2006.10464429, 2006.
Cardenas, A., Gold, D. R., Hauser, R., Kleinman, K. P., Hivert, M. F., Calafat, A. M., Ye, X. Y., Webster, T. F., Horton, E. S., and Oken, E.: Plasma Concentrations of Per- and Polyfluoroalkyl Substances at Baseline and Associations with Glycemic Indicators and Diabetes Incidence among High-Risk Adults in the Diabetes Prevention Program Trial, Environ. Health. Persp., 125, https://doi.org/10.1289/ehp1612, 2017.
Chang, N. Y., Eichler, C. M. A., Amparo, D. E., Zhou, J. Q., Baumann, K., Hubal, E. A. C., Surratt, J. D., Morrison, G. C., and Turpin, B. J.: Indoor air concentrations of PM2.5 quartz fiber filter-collected ionic PFAS and emissions to outdoor air: findings from the IPA campaign, Environ. Sci.-Process Impacts., https://doi.org/10.1039/d4em00359d, 2024.
Chen, M. K., Wang, C. A. F., Gao, K., Wang, X. P., Fu, J. J., Gong, P., and Wang, Y. J.: Perfluoroalkyl substances in precipitation from the Tibetan Plateau during monsoon season: Concentrations, source regions and mass fluxes, Chemosphere, 282, https://doi.org/10.1016/j.chemosphere.2021.131105, 2021.
Department of Ecology and Environment of Henan Province: Bulletin of ecological and Environmental Status of Henan Province, https://sthjt.henan.gov.cn/2023/06-05/2755216.html (last access: 25 May 2024), 2023.
Dewapriya, P., Chadwick, L., Gorji, S. G., Schulze, B., Valsecchi, S., Samanipour, S., Thomas, K. V., and Kaserzon, S. L.: Per- and polyfluoroalkyl substances (PFAS) in consumer products: Current knowledge and research gaps, J. Hazard. Mater. Lett, 4, 100086, https://doi.org/10.1016/j.hazl.2023.100086, 2023.
Dhore, R. and Murthy, G. S.: Per/polyfluoroalkyl substances production, applications and environmental impacts, Bioresour. Technol, 341, 125808, https://doi.org/10.1016/j.biortech.2021.125808, 2021.
Dong, Z., Jiang, N., Zhang, R. Q., Xu, Q. X., Ying, Q., Li, Q., and Li, S. L.: Molecular characteristics, source contributions, and exposure risks of polycyclic aromatic hydrocarbons in the core city of Central Plains Economic Region, China: Insights from the variation of haze levels, Sci. Total. Environ., 757, 143885, https://doi.org/10.1016/j.scitotenv.2020.143885, 2021.
Dreyer, A., Weinberg, I., Temme, C., and Ebinghaus, R.: Polyfluorinated Compounds in the Atmosphere of the Atlantic and Southern Oceans: Evidence for a Global Distribution, Envion. Sci. Technol., 43, 6507–6514, https://doi.org/10.1021/es9010465, 2009.
Du, D., Lu, Y. L., Li, Q. F., Zhou, Y. Q., Cao, T. Z., Cui, H. T., and Han, G. X.: Estimating industrial process emission and assessing carbon dioxide equivalent of perfluorooctanoic acid (PFOA) and its salts in China, Sci. Total. Environ., 867, 161507, https://doi.org/10.1016/j.scitotenv.2023.161507, 2023.
Ellis, D. A., Martin, J. W., De Silva, A. O., Mabury, S. A., Hurley, M. D., Andersen, M. P. S., and Wallington, T. J.: Degradation of fluorotelomer alcohols: A likely atmospheric source of perfluorinated carboxylic acids, Envion. Sci. Technol., 38, 3316–3321, https://doi.org/10.1021/es049860w, 2004.
Fang, S. H., Li, C., Zhu, L. Y., Yin, H.L., Yang, Y. C., Ye, Z. X., and Cousins, I. T.: Spatiotemporal distribution and isomer profiles of perfluoroalkyl acids in airborne particulate matter in Chengdu City, China, Sci. Total. Environ., 689, 1235–1243, https://doi.org/10.1016/j.scitotenv.2019.06.498, 2019.
Gawor, A., Shunthirasingham, C., Hayward, S. J., Lei, Y. D., Gouin, T., Mmereki, B. T., Masamba, W., Ruepert, C., Castillo, L. E., Shoeib, M., Lee, S. C., Harner, T., and Wania, F.: Neutral polyfluoroalkyl substances in the global Atmosphere, Environ. Sci.-Process Impacts, 16, 404–413, https://doi.org/10.1039/c3em00499f, 2014.
Gouin, T., Mackay, D., Jones, K. C., Harner, T., and Meijer, S. N.: Evidence for the “grasshopper” effect and fractionation during long-range atmospheric transport of organic contaminants, Environ. Pollut., 128, 139–148, https://doi.org/10.1016/j.envpol.2003.08.025, 2004.
Grunfeld, D. A., Gilbert, D., Hou, J., Jones, A. M., Lee, M. J., Kibbey, T. C. G., and O'Carroll, D. M.: Underestimated burden of per- and polyfluoroalkyl substances in global surface waters and groundwaters, Nat. Geosci., 17, 340–346, https://doi.org/10.1038/s41561-024-01402-8, 2024.
Han, D., Ma, Y., Huang, C., Zhang, X., Xu, H., Zhou, Y., Liang, S., Chen, X., Huang, X., Liao, H., Fu, S., Hu, X., and Cheng, J.: Occurrence and source apportionment of perfluoroalkyl acids (PFAAs) in the atmosphere in China, Atmos. Chem. Phys., 19, 14107–14117, https://doi.org/10.5194/acp-19-14107-2019, 2019.
Harada, K., Nakanishi, S., Saito, N., Tsutsui, T., and Koizumi, A.: Airborne perfluorooctanoate may be a substantial source contamination in Kyoto area, Japan, Bull. Environ. Contam. Toxicol., 74, 64–69, https://doi.org/10.1007/s00128-004-0548-0, 2005.
Heydebreck, F., Tang, J., Xie, Z., and Ebinghaus, R.: Emissions of Per- and Polyfluoroalkyl Substances in a Textile Manufacturing Plant in China and Their Relevance for Workers' Exposure, Envion. Sci. Technol., 50, 10386–10396, https://doi.org/10.1021/acs.est.6b03213, 2016.
Hu, X. D. C., Andrews, D. Q., Lindstrom, A. B., Bruton, T. A., Schaider, L. A., Grandjean, P., Lohmann, R., Carignan, C. C., Blum, A., Balan, S. A., Higgins, C. P., and Sunderland, E. M.: Detection of Poly- and Perfluoroalkyl Substances (PFASs) in US Drinking Water Linked to Industrial Sites, Military Fire Training Areas, and Wastewater Treatment Plants, Environ. Sci. Tech. Let., 3, 344–350, https://doi.org/10.1021/acs.estlett.6b00260, 2016
Jahnke, A., Berger, U., Ebinghaus, R., and Temme, C.: Latitudinal gradient of airborne polyfluorinated alkyl substances in the marine atmosphere between Germany and South Africa (53° N–33° S), Envion. Sci. Technol., 41, 3055–3061, https://doi.org/10.1021/es062389h, 2007.
Li, X., Wang, Y., Cui, J., Shi, Y., and Cai, Y.: Occurrence and Fate of Per- and Polyfluoroalkyl Substances (PFAS) in Atmosphere: Size-Dependent Gas-Particle Partitioning, Precipitation Scavenging, and Amplification, Envion. Sci. Technol., 58, 9283–9291, https://doi.org/10.1021/acs.est.4c00569, 2024.
Lin, H. J., Taniyasu, S., Yamazaki, E., Wei, S., Wang, X. H., Gai, N., Kim, J. H., Eun, H., Lam, P. K. S., and Yamashita, N.: Per- and Polyfluoroalkyl Substances in the Air Particles of Asia: Levels, Seasonality, and Size-Dependent Distribution, Envion. Sci. Technol., 54, 14182–14191, https://doi.org/10.1021/acs.est.0c03387, 2020.
Lin, H. J., Taniyasu, S., Yamashita, N., Khan, M.K., Masood, S.S., Saied, S., and Khwaja, H.A.: Per- and polyfluoroalkyl substances in the atmospheric total suspended particles in Karachi, Pakistan: Profiles, potential sources, and daily intake estimates, Chemosphere, 288, 132432, https://doi.org/10.1016/j.chemosphere.2021.132432, 2022.
Lindstrom, A. B., Strynar, M. J., and Libelo, E. L.: Polyfluorinated Compounds: Past, Present, and Future, Envion. Sci. Technol., 45, 7954–7961, https://doi.org/10.1021/es2011622, 2011.
Liu, B. L., Zhang, H., Yao, D., Li, J. Y., Xie, L. W., Wang, X. X., Wang, Y. P., Liu, G. Q., and Yang, B.: Perfluorinated compounds (PFCs) in the atmosphere of Shenzhen, China: Spatial distribution, sources and health risk assessment, Chemosphere, 138, 511–518, https://doi.org/10.1016/j.chemosphere.2015.07.012, 2015.
Liu, L. S., Guo, Y. T., Wu, Q. Z., Zeeshan, M., Qin, S. J., Zeng, H. X., Lin, L. Z., Chou, W. C., Yu, Y. J., Dong, G. H., and Zeng, X. W.: Per- and polyfluoroalkyl substances in ambient fine particulate matter in the Pearl River Delta, China: Levels, distribution and health implications, Environ. Pollut., 334, 122138, https://doi.org/10.1016/j.envpol.2023.122138, 2023.
Liu, W., He, W., Wu, J., Wu, W., and Xu, F.: Distribution, partitioning and inhalation exposure of perfluoroalkyl acids (PFAAs) in urban and rural air near Lake Chaohu, China, Environ. Pollut., 243, 143–151, https://doi.org/10.1016/j.envpol.2018.08.052, 2018.
Liu, Z. Y., Lu, Y. L., Wang, P., Wang, T. Y., Liu, S. J., Johnson, A. C., Sweetman, A. J., and Baninla, Y.: Pollution pathways and release estimation of perfluorooctane sulfonate (PFOS) and perfluorooctanoic acid (PFOA) in central and eastern China, Sci. Total. Environ., 580, 1247–1256, https://doi.org/10.1016/j.scitotenv.2016.12.085, 2017.
Loewen, M., Halldorson, T., Wang, F. Y., and Tomy, G.: Fluorotelomer carboxylic acids and PFOS in rainwater from an urban center in Canada, Envion. Sci. Technol., 39, 2944–2951, https://doi.org/10.1021/es048635b, 2005.
Lu, Z. B., Lu, R., Zheng, H. Y., Yan, J., Song, L. N., Wang, J., Yang, H. Z., and Cai, M. H.: Risk exposure assessment of per- and polyfluoroalkyl substances (PFASs) in drinking water and atmosphere in central eastern China, Environ. Sci. Pollut. Res., 25, 9311–9320, https://doi.org/10.1007/s11356-017-0950-x, 2018.
McMurdo, C. J., Ellis, D. A., Webster, E., Butler, J., Christensen, R. D., and Reid, L. K.: Aerosol enrichment of the surfactant PFO and mediation of the water - Air transport of gaseous PFOA, Envion. Sci. Technol., 42, 3969–3974, https://doi.org/10.1021/es7032026, 2008.
Ministry of Ecology and Environment of the People's Republic of China: Bulletin of the State of China's ecological Environment, http://mee.gov.cn/hjzl/sthjzk/zghjzkgb/ (last access: 25 May 2024), 2023.
Murr, D.: Levels and trends of poly- and perfluoroalkyl substances in the Arctic environment An update (Vol. 5, 240–271, 2019), Emerg. Contam., 6, 386–386, https://doi.org/10.1016/j.emcon.2019.06.002, 2020.
Prevedouros, K., Cousins, I. T., Buck, R. C., and Korzeniowski, S. H.: Sources, fate and transport of perfluorocarboxylates, Envion. Sci. Technol., 40, 32–44, https://doi.org/10.1021/es0512475, 2006.
Qiao, B., Song, D., Chen, H., Yao, Y., and Sun, H.: Legacy and emerging per- and polyfluoroalkyl substances (PFAS) in the atmosphere: A comprehensive review, Sci. China Technol. Sc., 67, 3032–3050, https://doi.org/10.1007/s11431-024-2689-7, 2024.
Sedlak, M. D., Benskin, J. P., Wong, A., Grace, R., and Greig, D. J.: Per-and polyfluoroalkyl substances (PFASs) in San Francisco Bay wildlife: Temporal trends, exposure pathways, and notable presence of precursor compounds, Chemosphere, 185, 1217–1226, https://doi.org/10.1016/j.chemosphere.2017.04.096, 2017.
Thackray, C. P. and Selin, N. E.: Uncertainty and variability in atmospheric formation of PFCAs from fluorotelomer precursors, Atmos. Chem. Phys., 17, 4585–4597, https://doi.org/10.5194/acp-17-4585-2017, 2017.
Tian, Y., Yao, Y. M., Chang, S., Zhao, Z., Zhao, Y. Y., Yuan, X. J., Wu, F. C., and Sun, H. W.: Occurrence and Phase Distribution of Neutral and Ionizable Per- and Polyfluoroalkyl Substances (PFASs) in the Atmosphere and Plant Leaves around Landfills: A Case Study in Tianjin, China, Envion. Sci. Technol., 52, 1301–1310, https://doi.org/10.1021/acs.est.7b05385, 2018.
Turpin, B. J., Huntzicker, J. J., and Hering, S. V.: Investigation of organic aerosol sampling artifacts in the los angeles basin, Atmos. Environ., 28, 3061–3071, https://doi.org/10.1016/1352-2310(94)00133-6, 1994.
Wang, F., Zhuang, Y., Dong, B., and Wu, J.: Review on Per- and Poly-Fluoroalkyl Substances' (PFASs') Pollution Characteristics and Possible Sources in Surface Water and Precipitation of China, Water 14, 812, https://doi.org/10.3390/w14050812, 2022a.
Wang, J., Shen, C., Zhang, J., Lou, G. Y., Shan, S. D., Zhao, Y. Q., Man, Y. B., and Li, Y. L.: Per- and polyfluoroalkyl substances (PFASs) in Chinese surface water: Temporal trends and geographical distribution, Sci. Total. Environ., 915, 170127, https://doi.org/10.1016/j.scitotenv.2024.170127, 2024.
Wang, Q.-W., Yang, G.-P., Zhang, Z.-M., and Jian, S.: Perfluoroalkyl acids in surface sediments of the East China Sea, Environ. Pollut., 231, 59–67, https://doi.org/10.1016/j.envpol.2017.07.078, 2017.
Wang, S., Lin, X., Li, Q., Liu, C., Li, Y., and Wang, X.: Neutral and ionizable per-and polyfluoroalkyl substances in the urban atmosphere: Occurrence, sources and transport, Sci. Total. Environ., 823, 153794, https://doi.org/10.1016/j.scitotenv.2022.153794, 2022b.
Wang, Y. Q.: Meteolnfo: GIS software for meteorological data visualization and analysis, Meteorol. Appl., 21, 360–368, https://doi.org/10.1002/met.1345, 2014.
Wang, Y. Q.: An Open Source Software Suite for Multi-Dimensional Meteorological Data Computation and Visualisation, Journal of Open Research Software, 7, 21, https://doi.org/10.5334/jors.267, 2019.
Wang, Z., Cousins, I. T., Scheringer, M., Buck, R. C., and Hungerbuehler, K.: Global emission inventories for C4-C14 perfluoroalkyl carboxylic acid (PFCA) homologues from 1951 to 2030, Part I: production and emissions from quantifiable sources, Environ. Int., 70, 62–75, https://doi.org/10.1016/j.envint.2014.04.013, 2014.
Wei, Y. F., Wang, S. D., Jiang, N., Zhang, R. Q., and Hao, Q.: Comparative multi-model study of PM2.5 acidity trend changes in ammonia-rich regions in winter: Based on a new ammonia concentration assessment method, J. Hazard. Mater., 458, 131970, https://doi.org/10.1016/j.jhazmat.2023.131970, 2023.
Wu, J., Wang, F., Wang, Z., Hu, H., Yang, L., and Fu, H.: Global performance and trends of research on per- and polyfluoroalkyl substances (PFASs) between 2001 and 2018 using bibliometric analysis, Chemosphere, 295, 133853, https://doi.org/10.1016/j.chemosphere.2022.133853, 2022.
Xie, S., Wang, T., Liu, S., Jones, K. C., Sweetman, A. J., and Lu, Y.: Industrial source identification and emission estimation of perfluorooctane sulfonate in China, Environ. Int., 52, 1–8, https://doi.org/10.1016/j.envint.2012.11.004, 2013.
Yeung, L. W. Y., Yamashita, N., and Falandysz, J.: Legacy and emerging perfluorinated and polyfluorinated compounds: An update, Chemosphere, 237, 124506, https://doi.org/10.1016/j.chemosphere.2019.124506, 2019.
Yu, N. Y., Guo, H. W., Yang, J. P., Jin, L., Wang, X. B., Shi, W., Zhang, X. W., Yu, H. X., and Wei, S.: Non-Target and Suspect Screening of Per- and Polyfluoroalkyl Substances in Airborne Particulate Matter in China, Envion. Sci. Technol., 52, 8205–8214, https://doi.org/10.1021/acs.est.8b02492, 2018.
Zhengzhou Municipal Bureau of Statistics: Zhengzhou Statistical Yearbook, https://tjj.zhengzhou.gov.cn (last access: 25 May 2024), 2023.