the Creative Commons Attribution 4.0 License.
the Creative Commons Attribution 4.0 License.
 | 04 Nov 2025
Volatile emissions during the 2021 Cumbre Vieja (La Palma) eruption integrating multiplatform atmospheric observations
Noémie Taquet
Thomas Boulesteix
Robin Campion
Wolfgang Stremme
Sergio Rodríguez
Jessica López-Darias
Carlos Marrero
Diego González-García
Andreas Klügel
Frank Hase
M. Isabel García
Ramón Ramos
Pedro Rivas-Soriano
Sergio Léon-Luis
Virgilio Carreño
Antonio Alcántara
Eliezer Sépulveda
Celia Milford
Pablo González-Sicilia
Carlos Torres
In a world increasingly impacted by climate change and natural hazards, atmospheric monitoring networks are essential for informed decision-making. During the 2021 La Palma eruption, we integrated surface and ground-based remote sensing measurements from global atmospheric network instruments, complemented by rapidly deployed sensors, to monitor volcanic gas emissions up to 140 km from the source. We used direct-sun measurements from low-resolution (EM27/SUN) and high-resolution (IFS-125HR) Fourier transform infrared (FTIR) spectrometers. On La Palma, the EM27/SUN was combined with a differential optical absorption spectroscopy (DOAS) instrument. We present new FTIR retrieval methods to derive the SO2, CO2, CO, HF, and HCl relative abundance in the plume from both low- and high-resolution solar absorption spectra. Using Sentinel-5P TROPOspheric Monitoring Instrument (TROPOMI) data, we derived SO2 fluxes and estimated total emissions of 1.8 ± 0.2 Mt SO2, 19.4 ± 1.8 Mt CO2, 0.123 ± 0.005 Mt CO, 0.05 ± 0.01 Mt HCl, and 0.013 ± 0.002 Mt HF over the course of the eruption. These results are consistent with the mass balance derived from petrologic degassing estimates. This study demonstrates that high- and low-resolution FTIR and DOAS spectrometers, integrated within global monitoring networks, can provide quantitative constraints on volcanic gas composition and fluxes over large distances. Such capabilities are directly applicable to volcanic crisis monitoring, complementing dedicated networks, satellite observations and supporting improved assessments of volcanic impacts on the atmospheric composition at regional scales.
- Article
(10109 KB) - Full-text XML
-
Supplement
(329 KB) - BibTeX
- EndNote


Volcanic emissions of greenhouse gases and pollutants remain poorly constrained due to the limited number of volcanoes well monitored for gas emissions. The present knowledge relies on either short-term records at permanent stations or on discrete campaigns of measurements, mostly during eruptive crises. Characterizing volcanic degassing processes is essential to improve our understanding of the multi-species volcanic gas emissions across various geodynamic settings and their long- and short-term impacts on the atmospheric composition.
The abundance and composition of dissolved volatiles control the buoyancy and viscosity of magmas, making them a primary driver of eruptive dynamism and duration (Longpré et al., 2025). Water (H2O) and carbon dioxide (CO2) are the most abundant species in volcanic degassing, followed by sulfur dioxide (SO2) and halogen-derived species (mainly halides). They show a different solubility in magma that depends mainly on pressure, temperature, and redox conditions (Gennaro et al., 2020; Cassidy et al., 2022). CO2 and H2O are usually among the deepest exsolved gas species, followed by SO2 and halogens in the subsurface. Therefore, the exploration of their pre- and co-eruptive relative abundance can reveal critical information on the pressurization of the magma plumbing system, as well as on ascent rates and volatile exsolution pathways (Voigt et al., 2014; Taquet et al., 2019). The temporal evolution of the ΔCO2 SO2 ratio and halogen-derived species-to-SO2 ratios in volcanic plumes have often been used to infer the respective contribution of deep to shallow magmatic processes in the transitions in eruptive dynamism, such as changes in the bubble contents in the magma chamber, replenishment, magma batch mixing, or fractional crystallization (Harris and Rose, 1996; Shinohara et al., 2003, 2008; Werner et al., 2012; La Spina et al., 2015). Volcanic plume compositions, when combined with seismic and structural data, help constrain volatile fluxes, magma ascent rates, and the architecture of the magmatic plumbing system. Integrating gas measurements with petrological constraints from matrix, melt inclusions (MIs), and fluid inclusions (FIs) enables the reconstruction of pre-eruptive volatile contents and degassing pathways, which are key to modeling eruption dynamics (e.g., Ubide et al., 2023; Longpré et al., 2025).
The 2021 Cumbre Vieja (La Palma) fissure eruption (from 19 September to 14 December 2021; volcanic explosivity index, VEI, 3), called Tajogaite, was the first subaerial eruption in the Canary Islands archipelago in 50 years and, thus, the first opportunity to directly assess the amount and composition of volcanic degassing during an eruption in the Canary Islands (Burton et al., 2023). It was preceded by up to 12 low-intensity seismic swarms between October 2017 and September 2021, occurring at depths of between 20 and 30 km, without evidence of surface deformation (Torres-González et al., 2020; Mezcua and Rueda, 2023). Some of these seismic swarms were accompanied by changes in the flux or composition of trace gases (CO2, He, and Rn) in the soil or at the Dos Aguas cold spring located in the Caldera de Taburiente to the north (Torres-González et al., 2020; Padrón et al., 2022). These observations were interpreted as evidence of magma migration from a deeper upper-mantle reservoir to a shallower subcrustal reservoir (Padrón et al., 2022). On 11 September 2021, a new seismic swarm occurred at ∼ 10 km depth and intensified over the following days, accompanied by ground inflation reaching 30 cm (De Luca et al., 2022). Subsequently, the seismicity migrated towards the surface, and the Tajogaite eruption started on 19 September 2021. Several craters opened and grew along a northwest–southeast eruptive fracture (Muñoz et al., 2022) on the western flank of the Cumbre Vieja ridge (CVR). The eruption simultaneously exhibited multiple eruptive styles at various summital and flank vents, including more than 100 m high Hawaiian lava fountains, Strombolian spattering activity, ash venting, Vulcanian explosions, and significant effusive activity. Over the 85 d of its activity, it produced a ∼ 1.8 × 10⁸ m3 lava flow field (Civico et al., 2022), covering an area of 12 km2, and a tephra blanket with a total estimated volume of ∼ 2.3 × 10⁷ m3 (Bonadonna et al., 2022), provoking the evacuation of several thousand people and the destruction of ∼ 3000 buildings (Copernicus EMSR546, 2021; PEVOLCA, 2021). During the course of the eruption, volcanic gases were injected between 1000 and 6000 m a.s.l. (Bonadonna et al., 2022; Milford et al., 2023; Hedelt et al., 2025) and were transported over North Africa, over Europe, and (on several occasions) across the Atlantic to the Caribbean (Hedelt et al., 2025). Total SO2 emissions were estimated to be about 1.84 Mt (Milford et al., 2023) using the daily mass estimates derived from TROPOspheric Monitoring Instrument (TROPOMI) measurements and provided by the MOUNTS project (Valade et al., 2019).
Geophysical and geochemical co-eruptive observations revealed insights into the structure of the plumbing system (D'Auria et al., 2022; Dayton et al., 2023) and melt evolution during the eruption (Day et al., 2022; Ubide et al., 2023; Dayton et al., 2024; Longpré et al., 2025). Co-eruptive seismicity defines two clusters (D'Auria et al., 2022; Del Fresno et al., 2023), with the shallowest one ranging between 5 and 15 km depth, starting on 26 September 2021 and remaining until the end of the eruptive period, and the deepest one ranging between 20 and 25 km depth, occurring from 1 October to 13 December 2021. Additionally, a temporal progression in the melt chemical composition was observed: the initial erupted magma exhibited a tephritic composition (MgO ∼ 6 wt % and TiO2 ∼ 4 wt %) and was gradually (< day 20; Day et al., 2022) replaced by a basanitic magma (MgO ∼ 8 wt % and TiO2 3.7 wt %) for the rest of the eruption (Day et al., 2022; Ubide et al., 2023). This type of transition reflects a behavior similar to that previously documented for the 1949 and 1971 Cumbre Vieja eruptions (Klügel et al., 2000), and it was interpreted as mixing between a resident mush and deep, fresh basaltic magmas in the shallow reservoir. Such changes in magma composition could contribute to changes in eruptive dynamism and might be reflected in surface gas composition changes. In fact, variability in the eruptive dynamism was observed through seismic and deformation monitoring (Del Fresno et al., 2023; Charco et al., 2024), tephra analysis, and geochemical lava and ash studies (Bonadonna et al., 2022, 2023; Birnbaum et al., 2023; Longpré et al., 2025). In the early phase of the Tajogaite eruption, rapid cone growth and vent openings were accompanied by explosive tephra ejections. On 25 September, a significant cone collapse was accompanied by increasing explosive activity with evidence of white xeno-pumice fragments in tephra (Day et al., 2022; Romero et al., 2022). Lava became more fluid after the transition from a tephritic to a basanitic composition. By late October–November, the plume height stabilized at 2500–3500 m a.s.l. (Córdoba-Jabonero et al., 2023), with lower SO2 emissions (Milford et al., 2023). The final weeks saw intense activity, collapses, structural changes, and vent reconfiguration (González, 2022; Walter et al., 2023).
To date, only a few studies have reported the composition of the gas plume measured during the Tajogaite eruption, and none have provided a multi-species time series of estimated emission fluxes over the entire eruptive period. Ericksen et al. (2024) derived CO2 volcanic emission fluxes from drone-borne SBA-5 infrared CO2 sensor measurements and also measured ΔCO2 SO2 ratios using ground-based MultiGAS instruments localized near the vent. Burton et al. (2023) reported the first time series of the ΔCO2 SO2 ratio of the gas plume, employing ground-based Fourier transform infrared (FTIR) spectrometry techniques using incandescent ash plumes, lava fountaining, and lava flow as thermal sources as well as occasional solar absorption measurements. They also reported drone-borne and ground-based MultiGAS in-plume measurements. Recently, Asensio-Ramos et al. (2025) reported the first time series of ΔCO2 SO2, SO2 HCl, and ΔCO ΔCO2 ratios measured at the base of the eruptive column using open-path FTIR measurements with lava fountaining and lava flows as the thermal source. Using surface gas measurements, petrological data, and estimates of lava emission rates, Burton et al. (2023) reveal evidence of exceptional CO2-rich gas emission with respect to the emitted lava volume during the eruption. Recent studies showed the presence of particularly SO2- and CO2-rich compositions of deeply entrapped MIs in volcanic rocks from the Canary Islands (Longpré et al., 2017; Taràacsak et al., 2019, Dayton et al., 2024), which may be linked to mantle metasomatism (Hansteen et al., 1991, 1998).
This study presents both comprehensive time series of ΔCO2, ΔCO, HCl, and HF to SO2 molar ratios measured in the Tajogaite volcanic plume and the corresponding emission fluxes between 21 September and 14 December 2021, spanning the full duration of the eruption. The measurements were conducted at distances of 15 and 140 km from the vent using ground-based direct-sun FTIR and differential optical absorption spectroscopy (DOAS) instruments, integrated into global atmospheric monitoring networks. Ground-based FTIR and UV direct-sun methods provide multi-species and time-resolved total column measurements of the main volcanic gases, regardless of the plume altitude, while ensuring operator and instrument safety (Butz et al., 2017; Taquet et al., 2023). They have the advantage of using the sun as a common and both homogeneous and constant-intensity source (at the timescale of a single measurement), providing solar spectra in a wide spectral range and with a high signal-to-noise ratio. We took advantage of the instrumentation installed at the Izaña Atmospheric Observatory (IZO) on Tenerife. Its high altitude and geographical location were ideal for repeatedly directly capturing the volcanic plume, including in situ surface measurements, thereby enhancing the temporal density of our dataset. We estimated daily SO2 volcanic emission fluxes from space-based TROPOMI/Sentinel-5P measurements and then used the measured species-to-SO2 ratio to derive the emission fluxes of the other volcanic species and their total emissions. Our results are interpreted in the light of petrological (including new melt inclusions and matrix glass compositions presented in this study) and geophysical data taken from the literature.
A comprehensive network for the monitoring of trace gases, aerosols, and ash fallout was operative for air quality monitoring and scientific research during the eruption. Monitoring efforts relied on a combination of permanent stations that are part of international atmospheric research and air quality monitoring networks – such as those in the Canary Islands Government Air Quality Monitoring Network (AQMN) and the facilities at IZO – and on additional equipment specifically installed for monitoring the volcanic emergency. In this framework, the State Meteorological Agency of Spain (AEMET), through the Izaña Atmospheric Research Center (IARC) and the Territorial Delegation of AEMET in the Canary Islands (DTCAN) and in collaboration with the Spanish National Research Council (CSIC) and other institutions, deployed scientific instrumentation on La Palma. The objectives of the deployment were as follows: (1) monitoring and characterization of the vertical structure of the eruptive plume real-time, which was carried out through the implementation of an aerosol profiling network in the context of the European Aerosol, Clouds and Trace Gases Research Infrastructure (e.g., ACTRIS, 2021; Barreto et al., 2022; Álvarez et al., 2023); (2) complementing the air quality network observations managed by the Government of the Canary Islands (Milford et al., 2023, and references therein); and (3) investigating the physicochemical composition of the volcanic plume, exploring its links with the evolution of the eruptive process, and studying the ash–gas–aerosol interactions (e.g., García et al., 2022; Córdoba-Jabonero et al., 2023; Cuevas et al., 2024, and references therein).
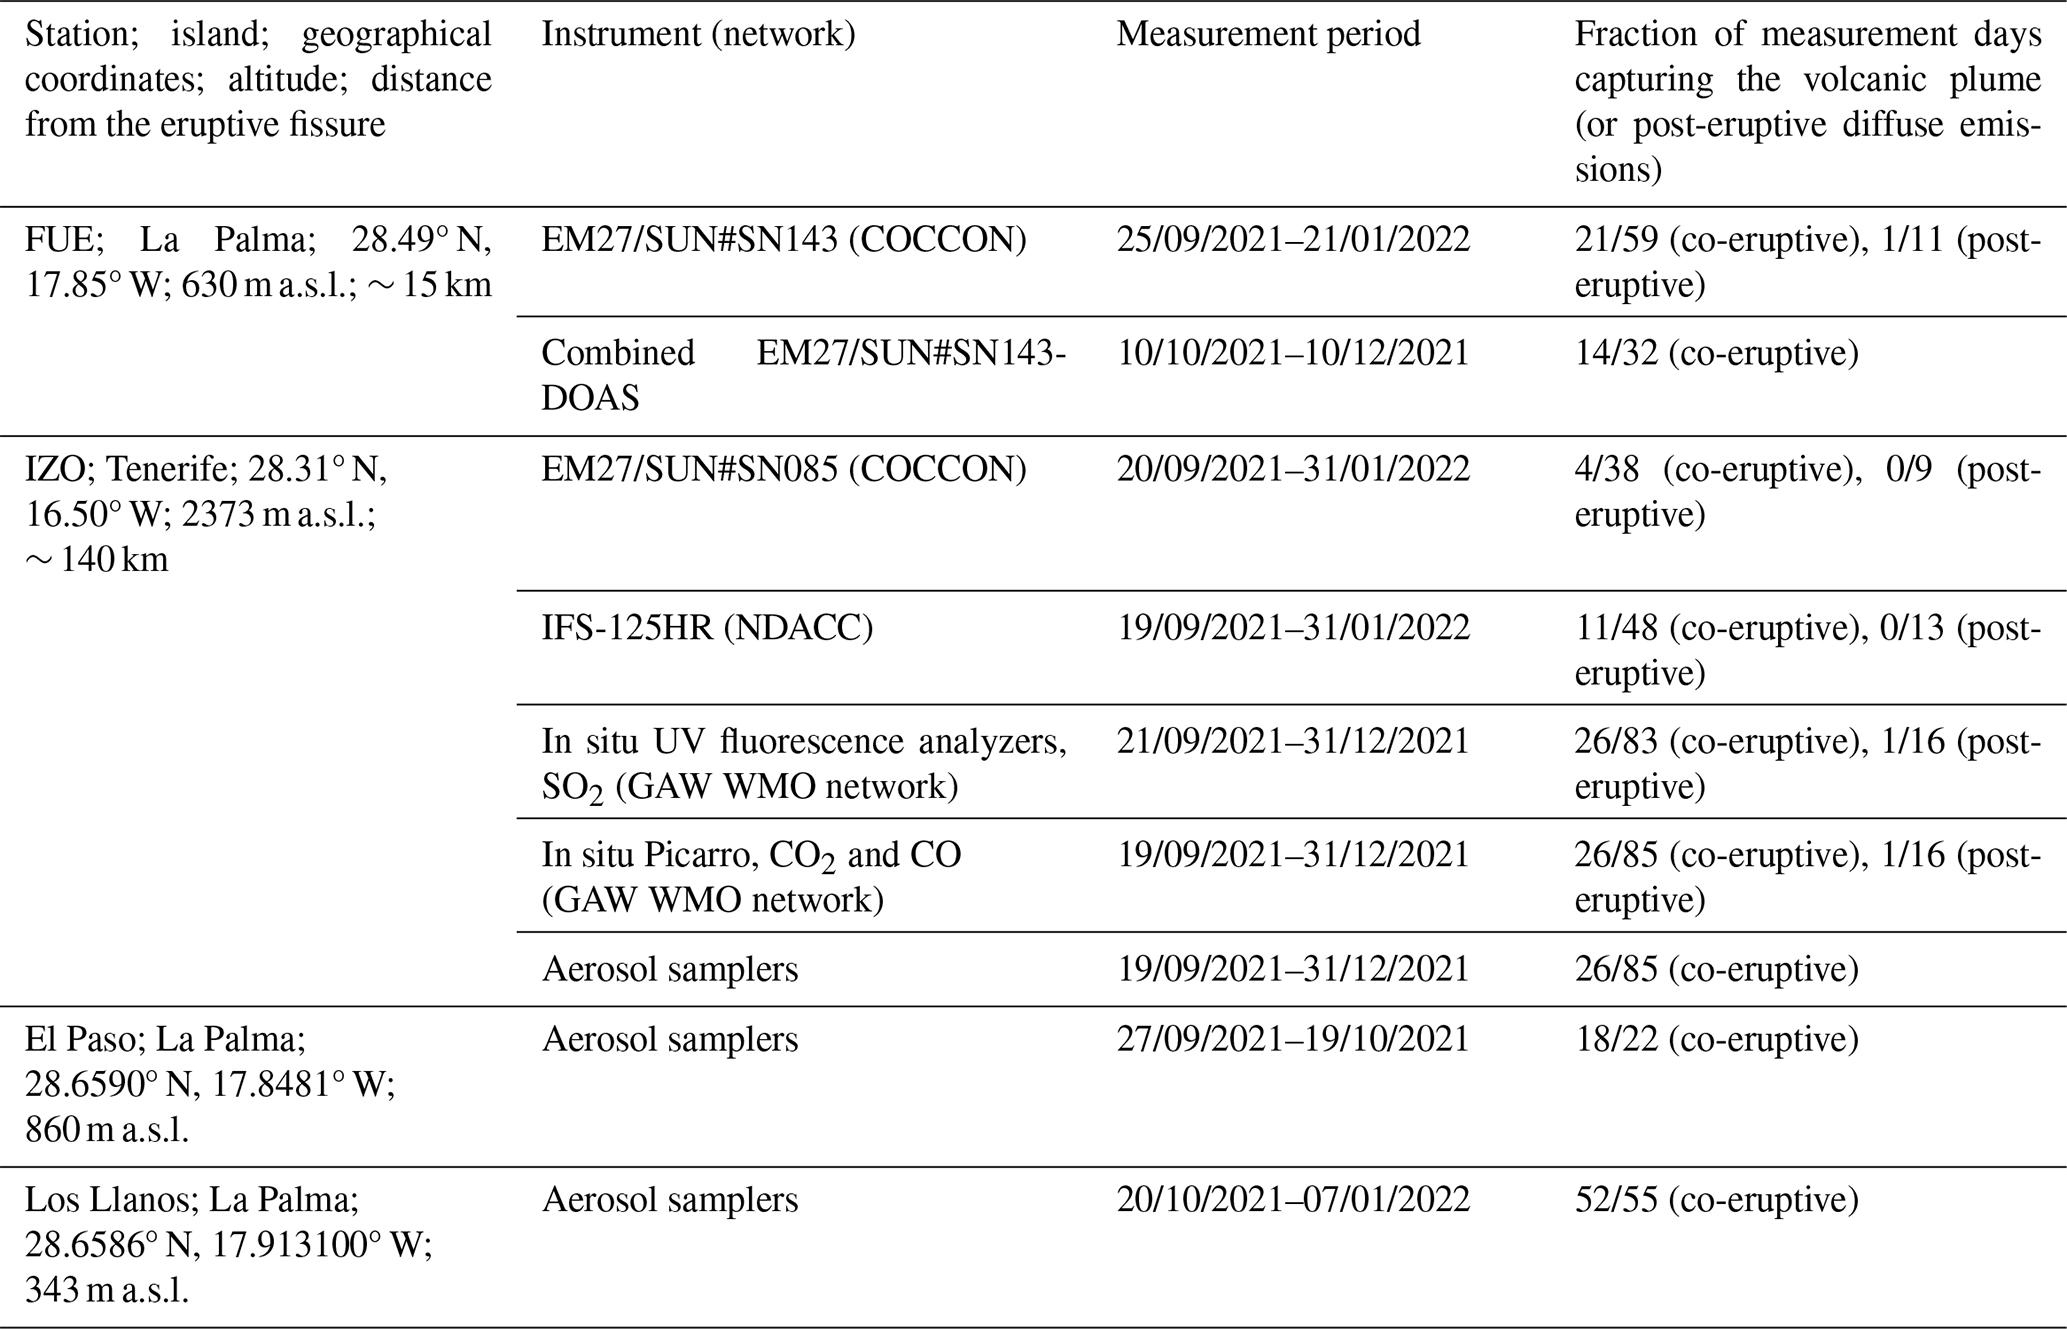
We conducted remote-sensing (HCl, HF, SO2, CO2, CO) and surface (CO, CO2, SO2) gas and ash measurements during the entire eruptive period at two stations located on La Palma (FUE) and Tenerife (IZO) islands (Fig. 1) to assess the co- and post-eruptive compositional variability in the Tajogaite volcanic plume. In addition, aerosol and surface SO2 measurements were conducted at other locations on La Palma (Los Lanos de Aridane and El Paso). Mobile in situ plume measurements were also performed on La Palma using a MultiGAS instrument during episodes of plume grounding driven by favorable meteorological conditions. Figure 1 displays a map showing the locations of the FUE and IZO stations as well as the MultiGAS, aerosol, and SO2 measurement sites on La Palma along with a typical SO2 plume as detected by the space-based TROPOMI/Sentinel-5P sensor. The instruments at each site and the measurement periods are summarized in Table 1 and detailed below.
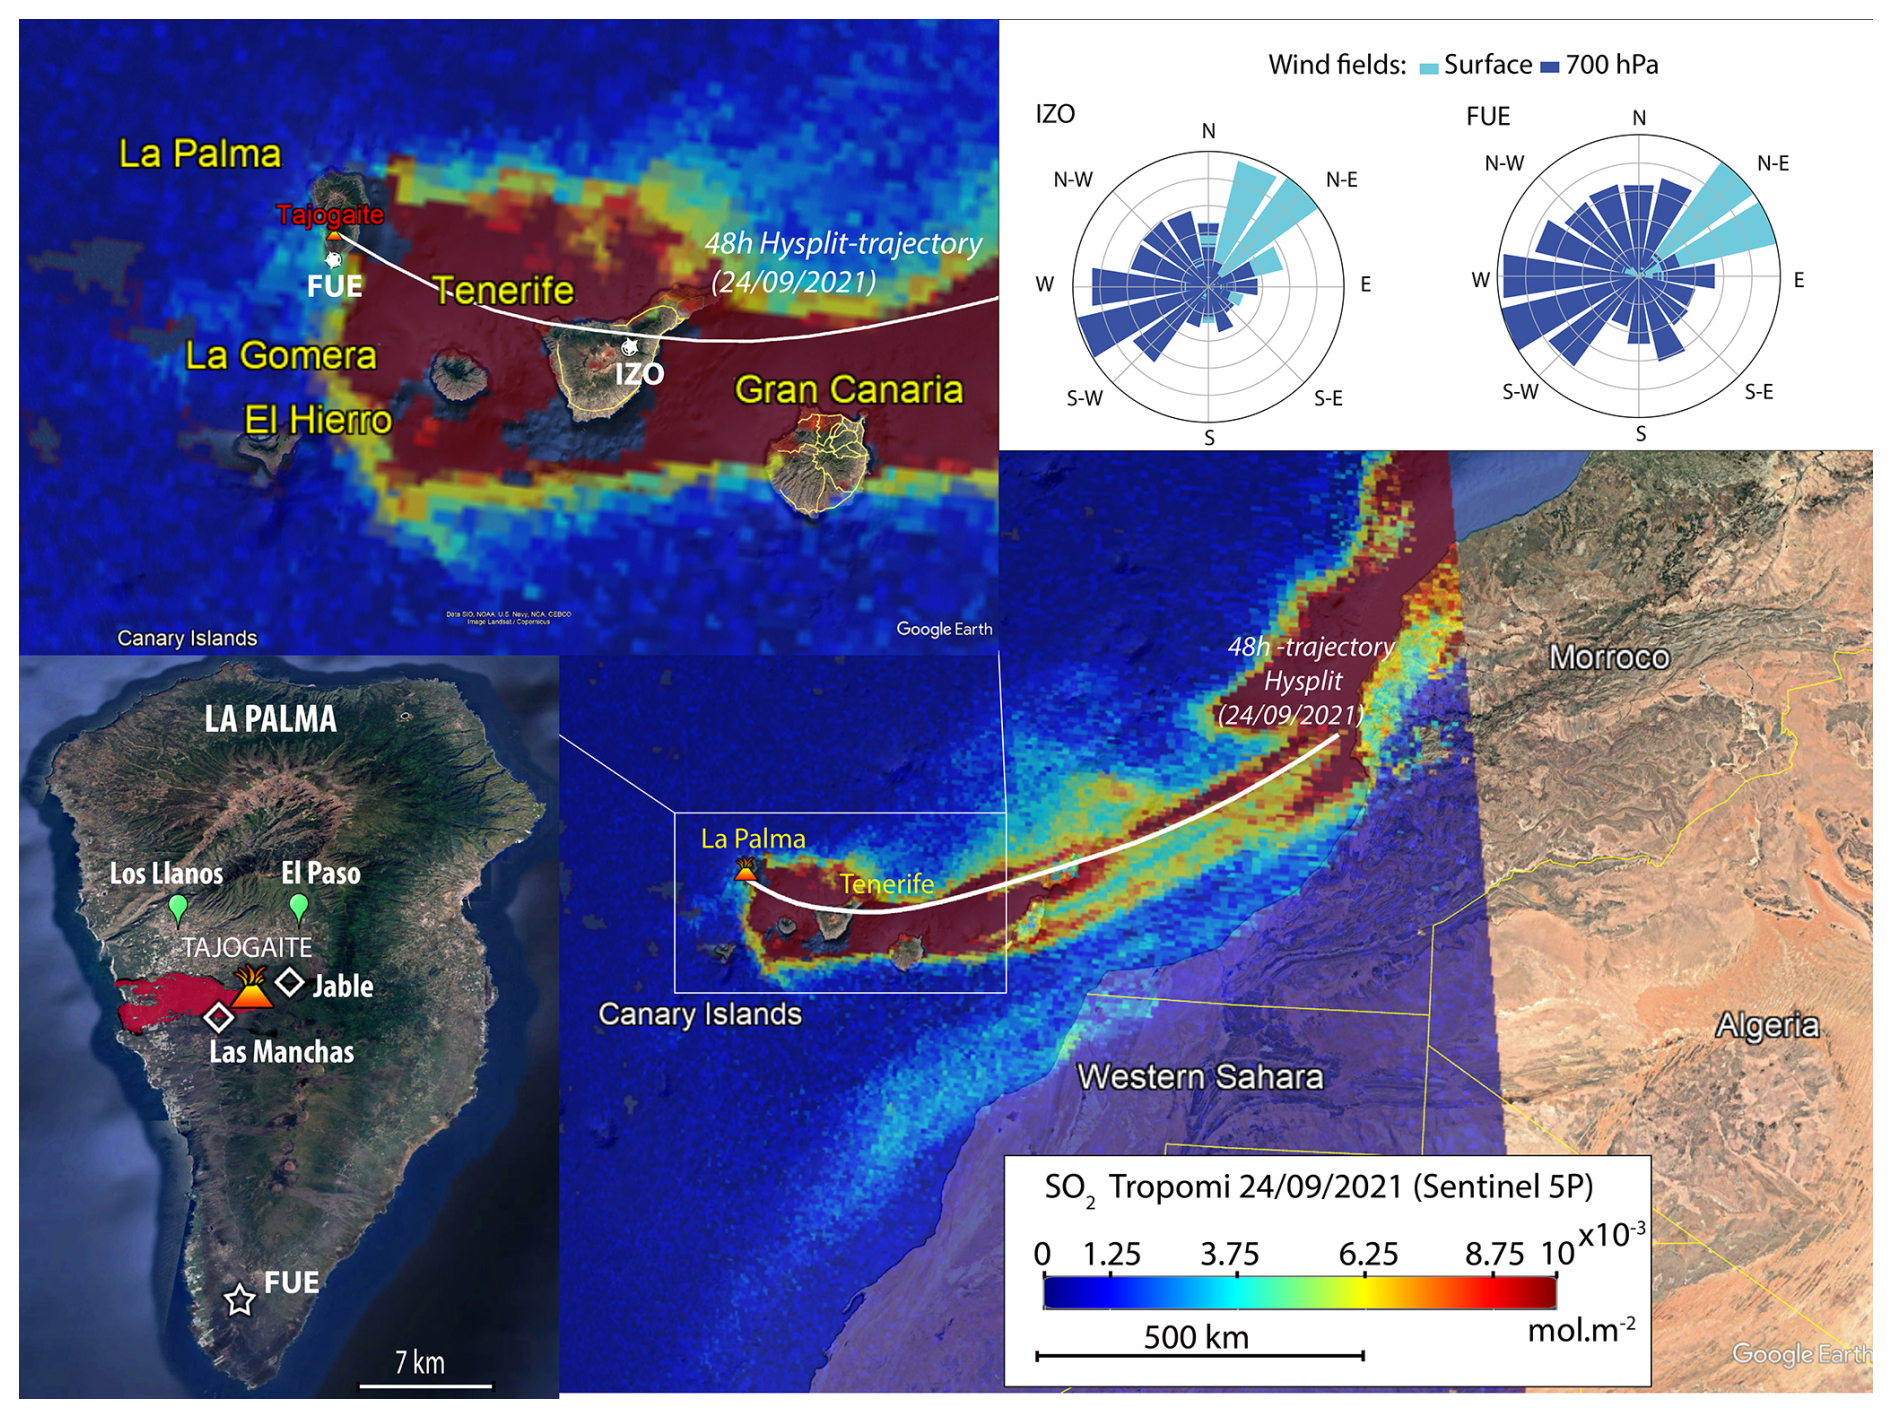
Figure 1Location of our measurement stations in the Canary Islands during the 2021 La Palma eruption (FUE and IZO represent the Fuencaliente and Izaña stations, respectively, marked by white stars). SO2 data from the TROPOMI/Sentinel-5P sensor for 24 September 2021 are shown on the map, illustrating typical plume dispersion over hundreds of kilometers. The instruments implemented at FUE and IZO stations are summarized in Table 1. Wind rose diagrams for the surface and 700 hPa levels (corresponding to the average of the plume altitude during the eruption) are also presented for the IZO and FUE stations (upper right-hand panel), considering the entire eruptive period and the European Centre for Medium-Range Weather Forecasts (ECMWF) Reanalysis v5 (ERA5) data (ECMWF: https://www.ecmwf.int/en/forecasts/dataset/ecmwf-reanalysis-v5, last access: 19 October 2025). The base layer was sourced from Google Earth (© Google), while the SO2 distribution map was derived from TROPOMI data accessed through the Sentinel Hub platform. The upper left-hand panel presents a zoom on La Palma island including all of the surface (hollow white diamonds for MultiGAS), aerosol (green), and columns gas (white stars) measurement sites from which data were used for this study. The Tajogaite eruption lava flow field (shaded red area) was taken from the European Environment Agency's Copernicus Emergency Management Service (https://emergency.copernicus.eu/mapping/list-of-components/EMSR546, last access: 19 October 2025).
Table 1Solar FTIR–DOAS and surface gas and particulate matter in situ measurements conducted at the FUE, IZO, and La Palma stations from 21 September 2021 to 21 January 2022. Details on aerosol in situ measurements are given in López-Darias et al. (2025).
2.1 Fuencaliente station (FUE, La Palma)
In the context of the AEMET responsibilities, as a state agency, for the continuous monitoring of the meteorological and climatic conditions and of atmospheric composition, a specific instrumental deployment has been set up on La Palma. In particular, a new station for gas and particle monitoring was implemented at the San Antonio Volcano Visitor Center of Fuencaliente, at the southern tip of La Palma island, ∼ 15 km from the eruptive fissure of the Tajogaite volcano (Fig. 1). The FUE station included a wide range of instruments such as a Cimel sun–lunar CE318T photometer, contributing to the Aerosol Robotic Network (AERONET), for aerosol column measurements; a Lufft CHM15k ceilometer for aerosol and cloud vertical profiling; an all-sky camera for weather monitoring (Román et al., 2021); and a tephra trap.
A few days after the beginning of the eruption (on 25 September 2021), we deployed an EM27/SUN spectrometer (developed by the Karlsruhe Institute of Technology (KIT), in collaboration with Bruker Optics, Germany), which is the standard instrument of the Collaborative Carbon Column Observing Network (COCCON; Frey et al., 2019) dedicated to the measurement of greenhouse gases. This portable FTIR spectrometer, equipped with a Quartz beam splitter and two InGaAs photodetectors, provides low-spectral resolution (0.5 cm−1) solar absorption spectra in the near-infrared (NIR) range (from 4000 to 11 000 cm−1), allowing the analysis of COCCON standard species (O2, CO2, CO, H2O, and CH4). It records double-sided forward–backward interferograms with a scanner velocity of 10 kHz and typically averages 10 scans, so that a spectrum is acquired approximately every minute. The spectral range of this instrument also allows one to obtain other gas species of interest for volcanology and air quality studies, such as halogen halides (HCl and HF) (Butz et al., 2017). From 10 October 2021 to 10 December 2021, following the approach of Butz et al. (2017), we combined the EM27/SUN with a UV–Vis DOAS spectrometer (model Avantes ULS2048). The DOAS instrument has a 50 µm wide slit entrance and allows one to record spectra in the 270–425 nm spectral range with a spectral resolution of 0.4 nm. We used a 200 µm wide quartz-made optical fiber. Both instruments shared the incident sun radiation from the EM27/SUN solar tracker to add simultaneous measurements of SO2 with the same measurement configuration (Fig. 2).
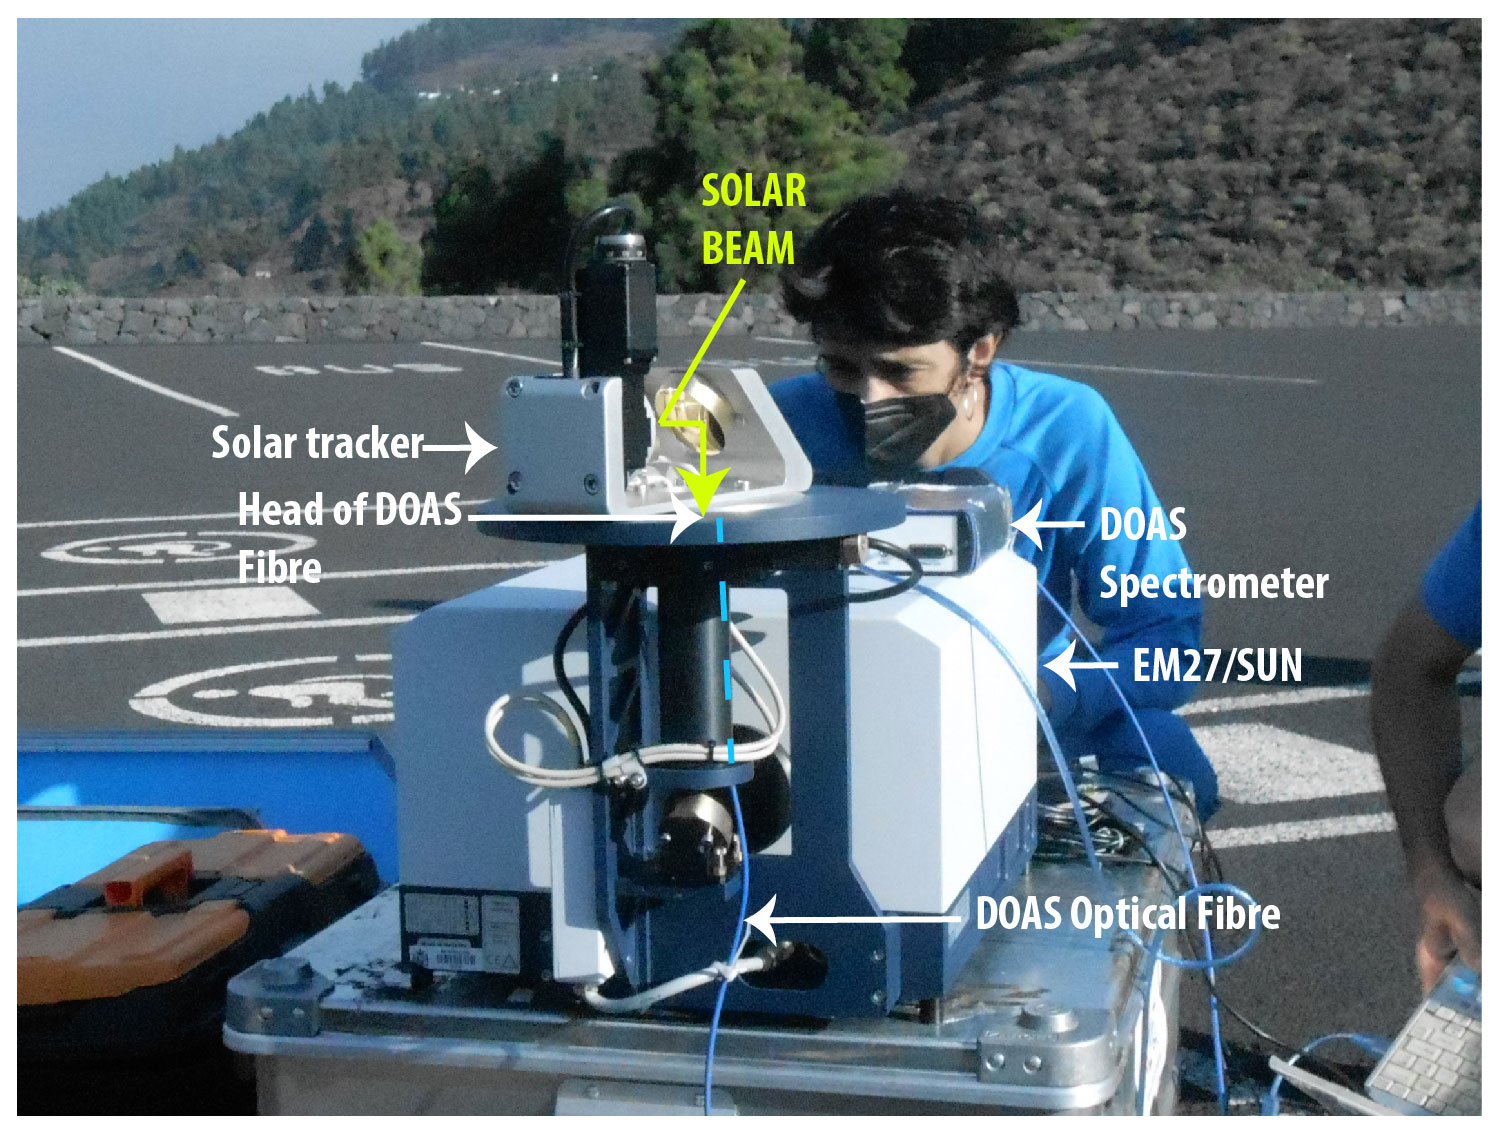
Figure 2Photograph (taken by R. Campion) of the combined EM27/SUN-DOAS direct-sun measurement setup implemented at the FUE station during the Tajogaite eruption (La Palma island). The DOAS optical fiber is introduced and attached in the FTIR sunlight collection tube, pointing towards the solar tracker mirrors. The yellow lines schematize the incident sunlight optical path.
The DOAS fiber was inserted and attached coaxially into the tube directing the light from the solar tracker toward the EM27/SUN spectrometer entrance (Fig. 2). Therefore, it allows one to collect the maximum light intensity with minimal disturbance to the solar beam transmitted to the EM27/SUN. The fiber was connected to the DOAS spectrometer, installed in a protective case sheltered from solar radiation near the EM27/SUN instrument. DOAS direct-sun absorption spectra were routinely recorded using the MobileDOAS software (unpublished acquisition program developed for mobile DOAS measurements by C. Fayt and A. Merlaud from the BIRA-IASB institute) with an integration time of about 30 s and, on average, 20 scans. The details of the DOAS and EM27/SUN spectral analysis and retrievals are given in Sect. 3.
2.2 Izaña Atmospheric Observatory (IZO, Tenerife)
The proximity of the island of Tenerife to La Palma and the location of the IZO station in the free troposphere (2373 m a.s.l.) resulted in this international reference observatory being affected several times by the Tajogaite volcanic plume. This allowed for a more in-depth study of various aspects of the volcanic eruption from a multi-instrumental perspective. Given its strategic location and its excellent atmospheric conditions, IZO indeed has a comprehensive, state-of-the-art program for atmospheric composition measurements. Uninterrupted meteorological and climatological observations started in 1916 and, since 1984, IZO has contributed to the GAW WMO (Global Atmosphere Watch of the World Meteorological Organization) program and to multiple international networks and databases (e.g., World Data Centre for Greenhouse Gases – WDCGG; World Ozone and Ultraviolet Radiation Data Centre – WOUDC; Network for the Detection of Atmospheric Composition Change – NDACC; Total Carbon Column Observing Network – TCCON; Collaborative Carbon Column Observing Network – COCCON; Aerosol Robotic Network – AERONET; Baseline Surface Radiation Network – BSRN; Micro-Pulse Lidar Network – MPLNET; EUMETNET EIG GNSS water VApour Program – E-GVAP; and National Oceanic and Atmospheric Administration (NOAA) Earth System Research Laboratory (ESRL) Global Monitoring Division (GMD) Carbon Cycle and Greenhouse Gases (CCGG) Group; Cuevas et al., 2024, and references therein). Within IZO's atmospheric research activities, the station is equipped with high-resolution (IFS-125HR) and low-resolution (EM27/SUN) FTIR spectrometers, which have been providing ongoing long-term solar absorption measurements since 1999 and 2018, respectively. The EM27/SUN spectrometer is the same instrument model as that implemented at the FUE station, allowing for the analysis of CO2, CO, HF, and HCl species, as previously described.
The IZO FTIR spectrometers routinely contribute to NDACC (https://ndacc.larc.nasa.gov, last access: March 2025), TCCON (https://tccon-wiki.caltech.edu, last access: March 2025), and COCCON (https://www.imk-asf.kit.edu/english/COCCON.php, last access: March 2025) (Schneider et al., 2005; García et al., 2021). As part of NDACC activities, direct solar mid-infrared (MIR) absorption spectra are measured in the range from 700 to 4500 cm−1, with a spectral resolution of 0.005 cm−1. NDACC operations involve co-adding several scans to increase the signal-to-noise ratio, resulting in each spectrum acquisition taking several minutes. García et al. (2021) provide further details on the IZO FTIR program. The IZO IFS-125HR MIR solar spectra were used to analyze the SO2 species alongside HCl and HF, which were also measured from the EM27/SUN spectra (unlike SO2). This approach further allowed us to evaluate the uncertainties associated with our new retrieval methods for the HF and HCl species (see Sect. 3 and Appendix A). The details of the spectral analysis and retrievals are given in Sect. 3.
Moreover, as part of the GAW WMO program, continuous surface measurements of CO2 (since 1984), SO2 (since 2006), and CO (since 2008) are performed at IZO. Different in situ analyzers and measurement techniques have been used for measuring these gases: CO2 with nondispersive infrared (NDIR) gas LI-COR analyzers, CO with gas chromatography (GC) Trace Analytical RGA-3 instruments, and SO2 with ultraviolet (UV) fluorescence analyzers (Thermo 43C-Trace Level). Since 2015, CO2 and CO have also been monitored using a cavity ring-down spectroscopy (CRDS)-based Picarro G2401 instrument. These observations are carried out following the strict GAW WMO measurement protocols, and their quality is periodically assessed by external audits by the World Calibration Center for surface O3, CO, CH4, and CO2 (WCC-Empa). The bias for the CO2 and CO measurements in the framework of the GAW WMO network is ±0.1 ppm and ±2 ppb, respectively (WMO, 2018). For SO2, the uncertainties are expected to be around ±0.2 ppb (manufacturer specifications; see also Cuevas et al., 2024, and references therein). This continuous gas monitoring captured the Tajogaite plume composition on several occasions, when meteorological conditions allowed rapid and direct transport to the IZO station.
2.3 Retrieval of SO2 volcanic emission fluxes from TROPOMI data
The SO2 flux was retrieved by processing the images of the TROPOMI hyperspectral UV–SWIR (ultraviolet–shortwave infrared) sensor aboard the Sentinel-5P satellite. The images were processed by the traverse method, initially developed for the coarser-resolution TOMS satellite images by Bluth et al. (1994) and later adapted to more recent sensors such as OMI (Ozone Monitoring Instrument) and TROPOMI. The traverses are drawn across the plume semiautomatically, and the SO2 flux is calculated using the following equation:
where Xi is the SO2 vertical column density (VCD), Li is the length of the pixel, Θ is the angle between the pixel row and the wind direction, and v is the plume transport speed. The SO2 VCD was interpolated at plume height between the SO2_1km and the SO2_7km subproducts of version 3 of the TROPOMI SO2 product, described in Theys et al. (2021). The plume speed was obtained from the Global Data Assimilation System model of NOAA, through the READY (Real-time Environmental Applications and Display sYstem) archived meteorology portal (https://www.ready.noaa.gov/index.php, last access: 19 October 2025). For the flux calculation, we used the average wind speed at the plume altitude over the analyzed plume portion. The plume altitude was estimated from visual observations, such as photographs, distal webcam images (from Roque de los Muchachos), and HYSPLIT (Hybrid Single-Particle Lagrangian Integrated Trajectory) trajectory simulations, picking the injection altitude that best reproduces the general plume direction observed in the TROPOMI image, and confirmed with the AEMET/IGN estimates for the coincident days. The SO2 fluxes were finally estimated using the average of several traverses (usually a few tens and, on some occasions, up to 200 traverses, depending on the coherence of the plume and the wind field that transports it). The traverse method does not work in cases of plume stagnation in a low-wind environment or when the plume is split into several directions due to wind shear. These situations happened about 30 % of the time during the eruption, causing some gaps in the SO2 flux time series. We also excluded images in which the plume was only partially captured.
2.4 Mobile MultiGAS measurements
During the eruptive period, between 28 September and 10 October 2021, mobile surface MultiGAS measurements (SO2, CO2, H2O, and H2S) were carried out in the volcanic plume, when meteorological conditions allowed it to be sampled at ground level at a high concentration. The instrument comprised an MSR145 datalogger, an Edinburgh Gascard NG for CO2 (0–1000 ppm) with a pump, a City Technology T3ST/F electrochemical sensor for SO2 (0–50 ppm), and a City Technology T3H electrochemical sensor for H2S (0–20 ppm). SO2 concentrations up to 7 ppm were measured at distances of about 2 km east and west of the vent (Fig. 1). Time series of concentrations of the different gas species were cross-correlated by adjusting the time lag (usually between 5 and 9 s) and smoothing parameter until the best R2 coefficient of determination was obtained. The measurements presented here have R2 values higher than 0.75.
2.5 Sulfate aerosol measurements
Samples of aerosols, or particulate matter (PM), smaller than 10 µm (PM10) were collected at two sites on La Palma, at El Paso and at Los Llanos de Aridane, and at IZO on Tenerife. We used high-volume samplers (30 m3 h−1) and quartz microfiber filters (150 mm diameter). Sulfate concentrations were determined by ion chromatography (Metrohm™ 930 Compact IC FLEX), after a leaching extraction of the sample in deionized Milli-Q-grade water using the methods described in Rodríguez et al. (2012).
2.6 Volcanic glass S, Cl, and F content as well as sulfide droplet composition
We report 14 new compositions of MIs hosted in olivine, clinopyroxene, and amphibole (kaersutite) crystals (Appendix B3; Supplement Table S1). We also report Cl, F, and S contents in tephra glasses that were measured alongside major elements during the analytical session described in González-García et al. (2023), although only the major elemental data were published in that study. The volatiles were analyzed using a Cameca SX-100 electron microprobe (EPMA) at the Department of Geosciences of the University of Bremen (Germany), with an accelerating voltage of 15 kV, beam current of 40 nA, and defocused beam of 10µm, following the methods described in González-García et al. (2023). The instrument was calibrated with a natural fluorite for F, pyrite for S, and Smithsonian scapolite for Cl. Counting times on peak were 120 s for F and 60 s for S and Cl. The analysis of F used the PHA (pulse height analysis) setting following Zhang et al. (2016); the interference of the FeLα line on the FKα peak was corrected using the overlay function of the Cameca software. The Smithsonian reference materials VG-2 glass, VG-A99 glass, and Kakanui hornblende (Jarosewich et al., 1980) were analyzed along with the samples for precision and accuracy control. Accuracy is better than 6 % for S and Cl and better than 20 % for F; reproducibility is typically better than 10 %. In addition, the composition of two sulfide droplets was semiquantitatively estimated by EDX (energy-dispersive X-ray) spectroscopy.
A scanning electron microscope (SEM) was used to obtain high-resolution backscattered-electron (BSE) images of two sulfide droplets found in the tephra sample LM-2309 (Las Manchas, 23 September). The BSE images were acquired using a JEOL JSM-7610F gun emission scanning electron microscope installed at the Institute of Earth System Sciences, Leibniz Universität Hannover, Germany, using an acceleration voltage of 15 kV and a working distance of 15 mm. Bruker ESPRIT software was used for image acquisition.
3.1 Spectral analysis from the combined EM27/SUN-DOAS system
3.1.1 EM27/SUN retrievals (CO2, CO, HCl, and HF)
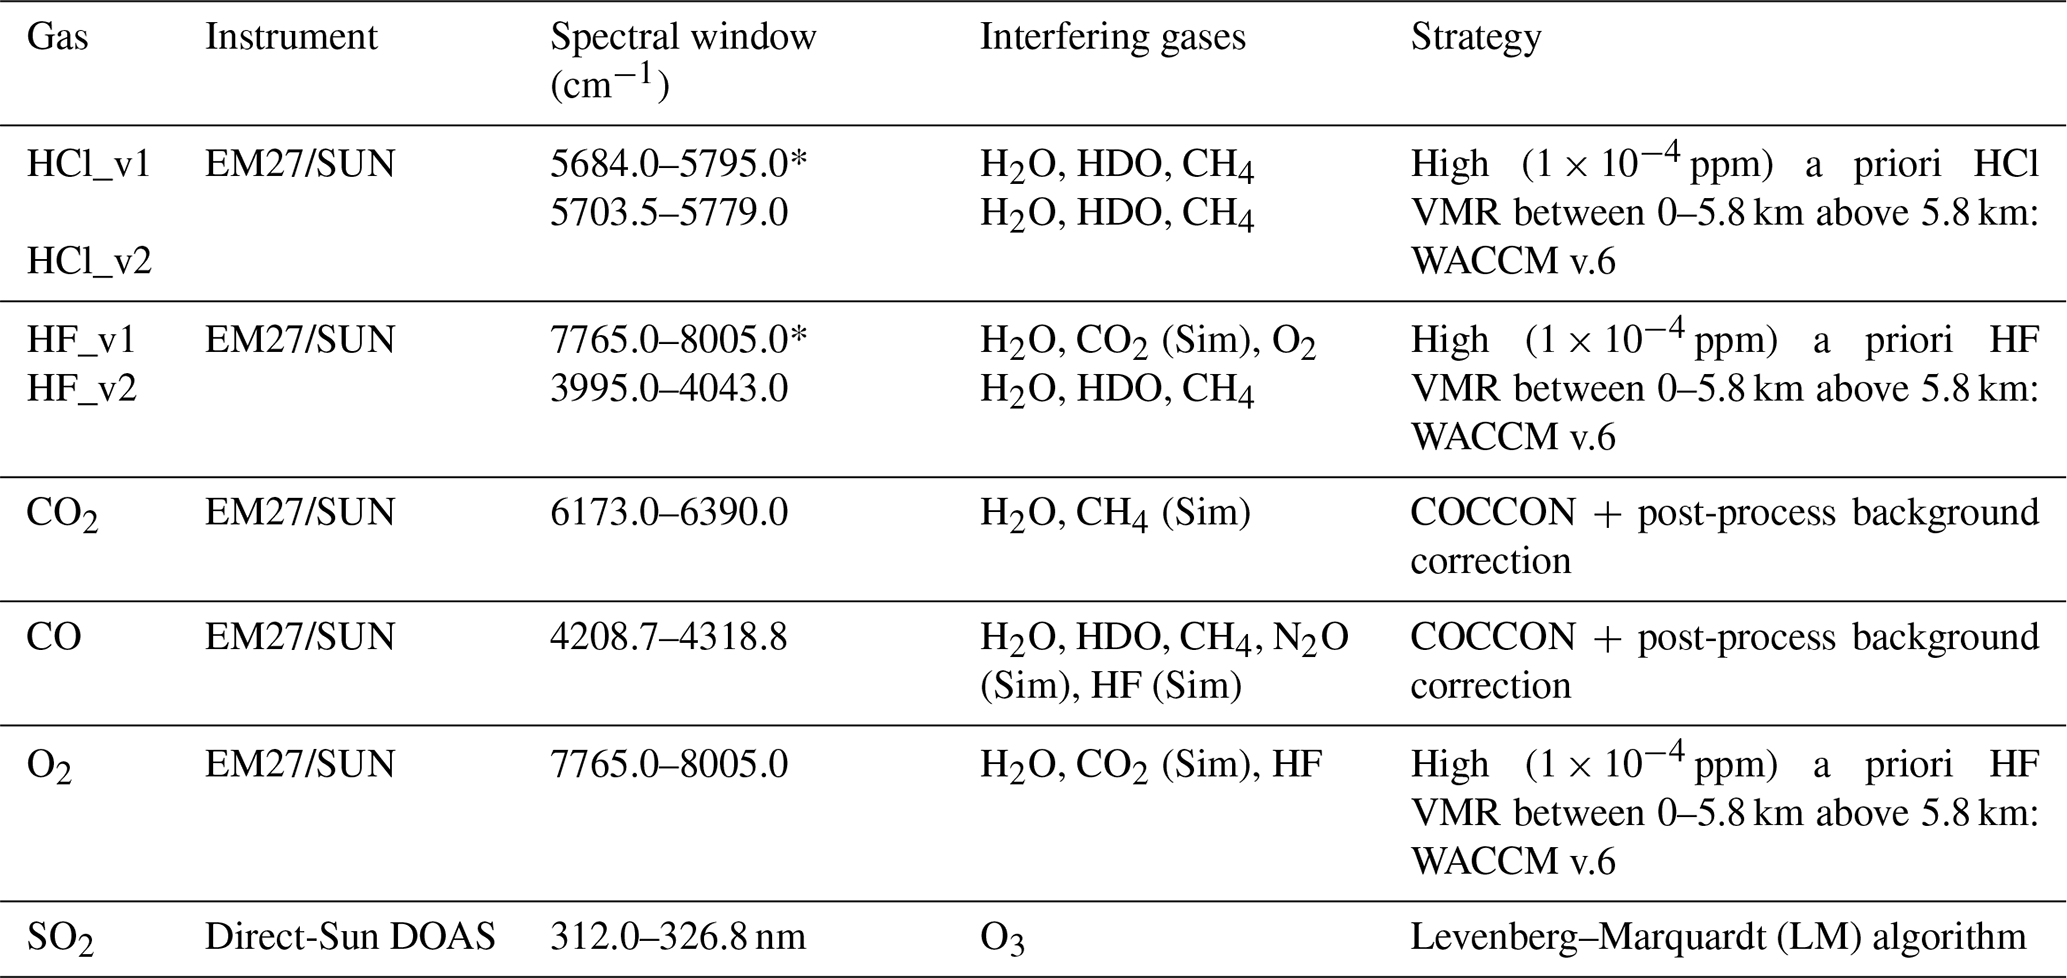
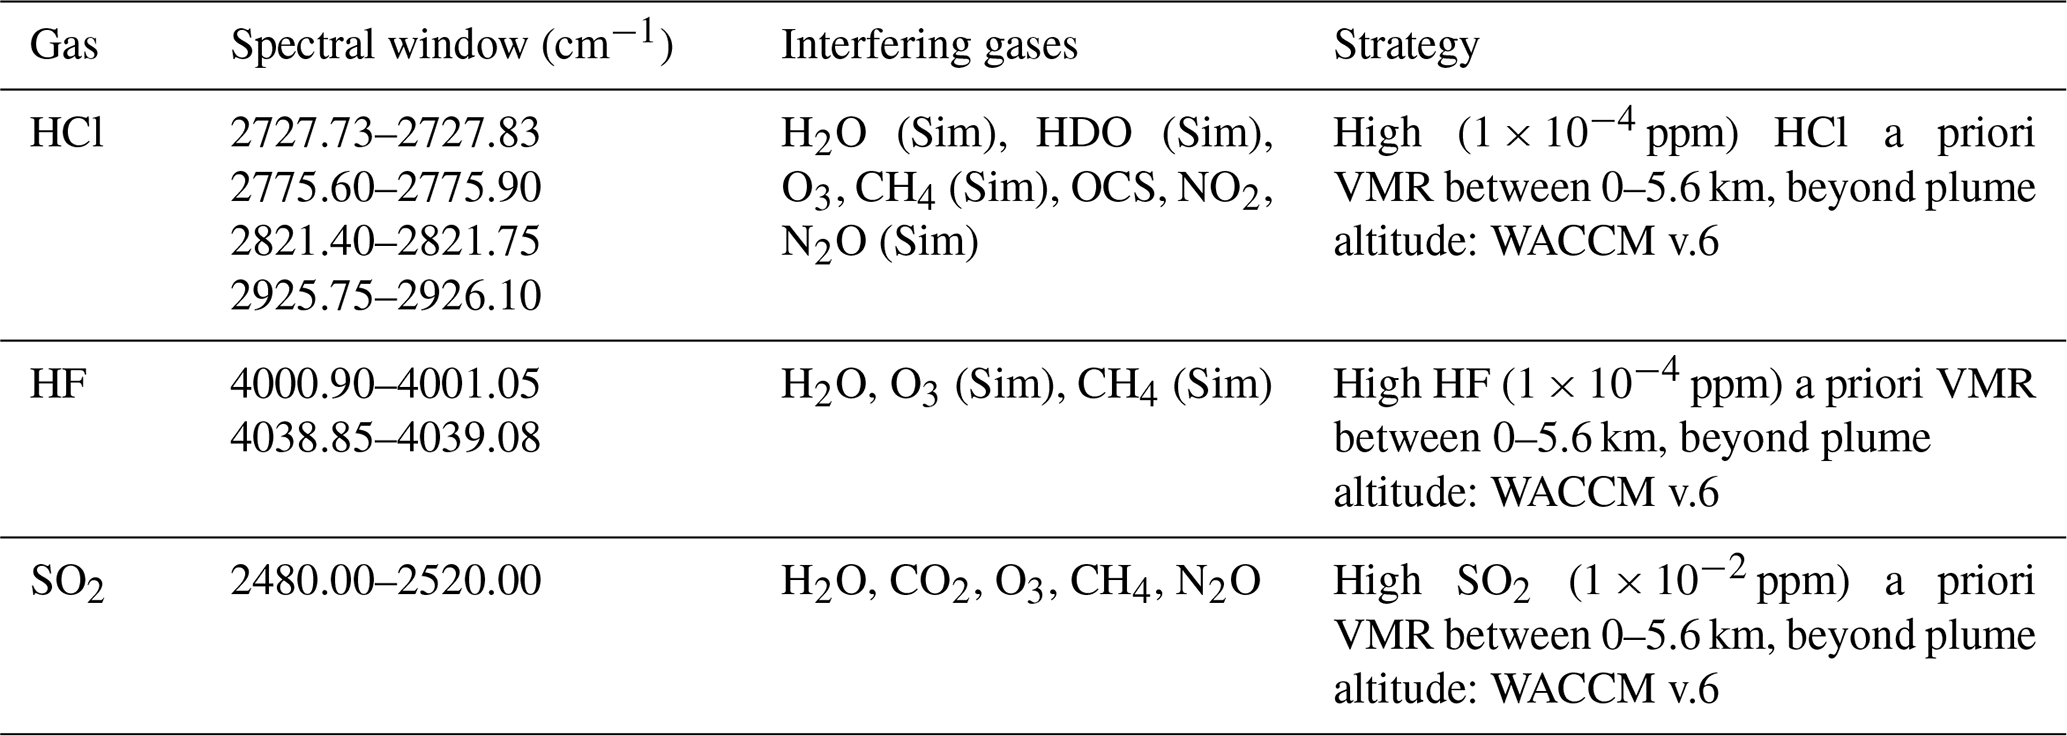
The processing of EM27/SUN measurements was performed using the open-source PROFFAST pylotv1.2 packages developed by KIT and used by the COCCON community. The COCCON standard retrieval procedure used for the analysis of atmospheric CO2, CO, CH4, and H2O species is fully described in Frey et al. (2019), Alberti et al. (2022), Herkommer et al. (2024), Herkommer (2024), and Feld et al. (2024). Here, we only provide details on the specific retrieval strategies that we developed for volcanological applications. The PROFFAST package includes a preprocessing code generating the required spectra by a fast Fourier transform. The processing incorporates various quality checks – as a signal threshold, intensity variations during recording, and the requirement for proper spectral abscissa scaling – and only generates spectra from raw measurements passing all checks (with the remaining measurements being flagged). We used the instrumental line shape (ILS) parameters reported in Alberti et al. (2022), following the COCCON standard recommendations. Calibrated spectra are then analyzed using the PROFFAST radiative transfer and inversion models to derive the total columns by scaling the a priori volume mixing ratio (VMR) profiles iteratively until the simulated spectra are adjusted to the measured spectra. Surface pressures are derived from the in situ high-precision sensor measurements (PCE-THB-40 at FUE and SETRA-470 at IZO). All of the EM27/SUN retrievals presented in this study were performed using the HITRAN 2020 spectroscopic line lists (Gordon et al., 2022). We used meteorological data and a priori VMR profiles based on the sub-daily available GGG2020 TCCON meteorological data (MAP files downloaded from the Caltech server and based on the National Centers for Environmental Prediction (NCEP) reanalysis). We adapted the a priori VMR profiles for the target species depending on whether the gas was purely volcanic (low atmospheric abundance) or also had an atmospheric background. The spectral windows and retrieval strategies used for each species are presented in Table 2 and detailed below.
For the analysis of HCl and HF species, we utilized a priori VMR profiles with high concentrations (1 × 10⁻⁴ ppm) up to the altitude of the volcanic plume (∼ 6 km a.s.l., based on IGN/AEMET; Milford et al., 2023); for the upper levels, we utilized VMR concentrations derived from the Whole Atmosphere Community Climate Model (WACCM v.6, https://www2.acom.ucar.edu/gcm/waccm, last access: February 2025) average profiles provided by the National Center for Atmospheric Research (NCAR; James Hannigan, personal communication, 2014), which are commonly used by the NDACC community. In this case, we adapted the PROFFAST retrieval inputs so that only the tropospheric portion (up to the altitude of the volcanic plume) was scaled, keeping the stratospheric part constant. This approach has previously been employed to measure volcanic emissions of HCl and HF from Mount Etna, also relying on low-resolution EM27/SUN spectra (Butz et al., 2017), but utilizing the PROFFIT package for the retrieval. We used new, specifically optimized spectral windows (HCl_v2 and HF_v2 in Table 2) for the analysis of these two species to be able to detect even very low concentrations, such as those detected at the IZO station, 140 km from the eruptive fissure. The analysis was also conducted using the same spectral ranges as Butz et al. (2017) (HCl_v1 and HF_v1 in Table 2) to evaluate the consistency and improvements introduced by the new strategies for our application. Appendix A gives a full comparison between the results obtained using the new and Butz et al. (2017) retrievals as well as with those from the high-resolution spectra analysis (see Sect. 3.2) for side-by-side measurements.
For the retrieval of volcanic CO and CO2, due to their high atmospheric abundance and variability, we used the COCCON standard retrievals (scaling of the whole profile and use of the COCCON spectral windows and TCCON a priori VMRs) and then removed the atmospheric background to derive the volcanic contribution. The column-averaged dry-air mole fraction of CO2 and CO (XCO2 and XCO) were estimated using the O2 total columns according to Wunch et al. (2011) () after applying air-mass-independent and air-mass-dependent correction factors (AICF and ADCF, respectively). We have slightly modified the standard procedure for performing the O2 retrieval by adding HF as a species to be retrieved, using a specific a priori VMR profile based on the WACCM v.6 climatology. However, the HF a priori profile was adjusted to have a constant and significantly higher concentration ( ppm) up to the maximum plume altitude. For the other interfering gases, we used the a priori VMRs derived from the TCCON GGG2020 MAP files.
To remove the background atmospheric concentrations of XCO2 and XCO, we used the daily averaged IZO Xgas time series to model the long-term natural variability with a third-degree polynomial, which was then interpolated and subtracted from the FUE XCO2 and XCO time series. Examples of XCO2 and XCO background fits are given in Figs. A3 and A4, respectively. For CO2, an additional intraday variability had to be taken into account. It was simulated by averaging and fitting some intraday IZO XCO2 time series that were not affected by the volcanic plume. Intraday simulations were performed for each day, using the average fit and adjusting the offset. The accuracy of the method was assessed by comparing the simulated XCO2 background at the station impacted by the volcanic plume with the measured XCO2 background at the other station when it was not affected by the plume (Fig. A3). The respective average and maximum absolute differences arising from this procedure were found to be 0.1 and 0.8 ppm in extreme cases. Finally, the ΔCO2 and ΔCO volcanic enhancements were determined from the Xgas enhancements by multiplying them by the dry-air columns derived from the surface pressure measurements and H2O total columns (Wunch et al., 2011).
Table 2Retrieval parameters used for the EM27/SUN and DOAS spectral analysis. “Sim” corresponds to the interfering species that were forward-simulated. “*” refers to similar spectral windows to those of Butz et al. (2017).
3.1.2 DOAS retrievals (SO2)
Solar DOAS spectra were processed using the QDOAS v2.111 software (Danckaert et al., 2014), applying a Levenberg–Marquardt (LM) algorithm to retrieve the slant column densities. We used the same analysis strategy as described in Taquet et al. (2023), with the key parameters summarized in Table 2. Wavelength calibration and slit function were determined by laboratory close-path measurement using a low-density mercury lamp, and they were further adjusted based on the position and widening of the Fraunhofer lines during the QDOAS processing. SO2 was retrieved in the 312.0–326.8 nm spectral window according to Butz et al. (2017). The high-resolution solar spectrum from Chance and Kurucz (2010) was used as the reference spectrum. We used the cross-section at 298 K from Vandaele et al. (2009) for SO2 and the cross-section at 221 K from Burrows et al. (1999) for the interfering gas O3. A third-order polynomial function was included in the fitting routine to remove the broadband extinction. The I0 effect, due to the limited resolution of the spectrometers (Platt and Stutz, 2008), was corrected using the QDOAS I0-correction algorithm applied for six fixed SO2 slant column values of 0.0, 1.0 × 10¹⁸, 2.0 × 10¹⁸, 3.0 × 10¹⁸, 4.0 × 10¹⁸, and 5.0 × 10¹⁸ molec. cm−2 (the latter is close to the maximum uncorrected slant column). Then, each corrected value was determined by interpolating the corrected slant column values. Unlike radiance scattered-light measurements, the direct-sun configuration remains unaffected by the Ring effect (Herman et al., 2009), which was therefore not considered in the retrieval. Finally, SO2 slant columns were converted into vertical columns by dividing them by the solar zenith angle (SZA)-dependent air mass factor (1/cos (SZA)) to be combined with the FTIR data.
3.2 IFS-125HR analysis (HCl, HF, and SO2)
The HCl and HF retrieval strategy from the IFS-125HR spectra is based on the NDACC Infrared Working Group (IRWG) recommendations (IRWG, 2014) and on the adapted retrievals for volcanological applications reported in Taquet et al. (2019) and Stremme et al. (2023). However, they have been optimized here to properly capture tropospheric volcanic contributions up to 140 km from the eruptive fissure. Consistent with the NDACC approach, both species were retrieved using the nonlinear least-squares fitting algorithm PROFFIT (Profile Fit, Hase et al., 2004) and considering the specified spectral regions and interfering gases given in Table 3. The inversion procedure is solved using a first-order Tikhonov–Phillips regularization (L1; Rodgers, 2000) on a logarithmic scale, where the VMR a priori profiles for the interfering gases are taken from WACCM v.6 climatological profiles. The NCEP 12:00 UTC daily temperature and pressure profiles are employed for the radiative transfer simulations.
The most significant changes with respect to NDACC involved the a priori VMR profiles considered for the target gases, vertical L1 regularization, and the spectroscopic database. Similarly to the EM27/SUN analysis, we adopt modified HF and HCl a priori VMR profiles with high concentrations (1 × 10⁻⁴ ppm) up to the maximum plume altitude (∼ 6 km a.s.l.), which are completed for the IFS-125HR using WACCM v.6 information beyond this altitude. In addition, the 2020 HITRAN spectroscopic line lists were utilized for all gases. Finally, in contrast to the NDACC approach, where the lowermost and uppermost altitude levels are fixed to the a priori value to ensure stability in the retrieval, in this study, the first level is left unconstrained to provide flexibility in the retrieval process in the lower troposphere.
In the case of SO2, a harmonized and standardized FTIR strategy is not available within NDACC. Therefore, in this work, we employ the strategy developed by García et al. (2022), which has been successfully applied to various NDACC FTIR sites affected by volcanic SO2 emissions (Smale et al., 2023; García et al., 2025). This approach is based on the study by Taquet et al. (2019), which presents SO2 total column amounts from the measured solar absorption spectra in the 2500 cm−1 region using a scaling retrieval and the inversion code PROFFIT. Similarly to the HF and HCl volcanic products, the SO2 a priori VMR profiles are adapted in the lower troposphere, while climatological WACCM v.6 profiles are considered for all interfering gases (Table 3).
Appendix A provides a summary of the comparison of the standard NDACC HCl and HF products with those developed in this study. It also includes the new IFS-125HR SO2 retrievals as well as the comparison between all of the IFS-125HR and EM27/SUN products.
Table 3Retrieval parameters used for the IFS-125HR analysis. “Sim” corresponds to the interfering species that were forward-simulated. The spectral windows are acquired using the NDACC filter SC (S3) for HCl, the NDACC filter SA (S1) for HF, and the NDACC filter SF (S6) for SO2. Therefore, they are almost coincident, although not simultaneous, observations.
4.1 Evolution of the volcanic plume composition during the Tajogaite eruption
The temporal variability in the Tajogaite plume composition is examined using the time series of the ratios, some of them involving species with contrasting exsolution depths. Daily ΔCO2 SO2, HCl SO2, HF SO2, HCl ΔCO2, HF ΔCO2, ΔCO SO2, and ΔCO ΔCO2 molecular ratios were estimated from the daily correlation plots of the total column time series, following the methodology detailed in Taquet et al. (2019, 2023), and are reported in Fig. 3. The same method used for column-averaged ratios was applied to calculate the surface concentration ratios from GAW and MultiGAS measurements (also presented in Fig. 3). The background contribution of atmospheric species (CO2 and CO) to these measurements was removed using daily polynomial curves fitted from the surface measurements without the contribution of volcanic emissions (i.e., SO2<0.05 ppm). Additionally, in the same figure, we reported our MultiGAS ΔCO2 SO2 measurements, obtained on 29 September and on 2 and 7 October from Las Manchas (∼ 500 m a.s.l., southwest of the eruptive fissure; Fig. 1) and from the El Jable viewpoint (2100 m a.s.l., east of the eruptive fissure; Fig. 1), ranging between 1.7 and 14.3. The scarcity of FTIR measurements from early November until the end of the eruption, across all measurement techniques, is mainly due to poor or unsuitable weather conditions.
Our column-averaged ΔCO2 SO2 molecular ratios range between 9 ± 6 and 63 ± 28 (9–24 at IZO and 14–63 at FUE) during the eruption. These values are consistent with the surface measurements at IZO (ratios from 5.6 ± 0.1 to 18.3 ± 0.7) and with our MultiGAS measurements at La Palma (1.7–14.3). These values are also consistent with the proximal measurements reported in the literature including open-path FTIR (Burton et al., 2023; Asensio-Ramos et al., 2025) and MultiGAS (Burton et al., 2023; Ericksen et al., 2024) measurements, ranging between 2 and 52 (shaded area in Fig. 3). All the measured ΔCO2 SO2 ratios define an increasing trend until at least 2 November 2021 and show more scatter after this date (Fig. 3).
HCl SO2 molecular ratios range between 0.02 ± 0.002 and 0.17 ± 0.01 (from 0.02 to 0.05 at IZO and from 0.02 to 0.17 at FUE) and show short-term variations around a nearly constant daily average of 0.05 ± 0.03 throughout the entire eruptive period. These ratios are consistent with the SO2 HCl values of 16.8 and 8 (HCl SO2= 0.06 and 0.12, respectively) reported in Burton et al. (2023), which correspond to a lava-fountaining plume and spattering event (Fig. 3). It is also consistent with the more recently published ratios ranging between 0.04 and 0.2 (Asensio-Ramos et al., 2025; reported in Fig. 3 in shaded area). HF SO2 molecular ratios vary between 0.0012 ± 0.0002 and 0.081 ± 0.007 (from 0.001 ± 0.001 to 0.082 ± 0.007 at FUE and from 0.007 ± 0.002 to 0.037 ± 0.025 at IZO) and show a similar day-to-day variability to that observed for the HCl SO2 ratios throughout the eruptive period. HCl ΔCO2 molecular ratios exhibit values from (6 ± 1) × 10−4 to (4.1 ± 0.1) × 10−3 at FUE and from (2 ± 1) × 10−3 to (3 ± 1) × 10−3 at IZO, while the HF ΔCO2 ratios range from (0.5 ± 0.1) × 10−4 to (4.5 ± 0.1) × 10−3 at FUE and from (2.6 ± 0.3) × 10−4 to (2.7 ± 0.2) × 10−3 at IZO. Like HCl SO2 and HF SO2, the HCl ΔCO2 and HF ΔCO2 ratios exhibit similar day-to-day variability. Their fluctuations include short-term decreasing trends, as observed between 2 and 14 October 2021 and between 21 October and 4 November 2021. The ΔCO SO2 FTIR ratios span from 0.13 ± 0.01 to 0.66 ± 0.03 at FUE and from 0.02 ± 0.01 to 0.17 ± 0.07 at IZO, and they are relatively stable around an average of 0.24, with one extreme event observed between 1 and 4 November 2021.
During the initial phase of the eruption, prior to the eruptive pause on 27 September 2021, our ratios were comparable to those observed throughout the rest of the eruptive period, with ΔCO2 SO2 ranging between 5.6 ± 0.1 and 9 ± 1.1, HCl SO2 between 0.031 ± 0.005 and 0.049 ± 0.007, and HF SO2 between 0.009 ± 0.003 and 0.022 ± 0.006. A significant and abrupt increase in all species-to-SO2 ratios is observed on 2–3 November 2021, which also coincides with a minor peak in the HCl ΔCO2 and HF ΔCO2 ratios. This event represents a notable and enduring change in gas ratio variability involving CO2 (i.e., ΔCO2 SO2 and HCl ΔCO2) and coincides with a sudden decrease in the amplitude of seismic tremor (VLP and LP; Fig. 3; Bonadonna et al., 2022). Prior to this date, the variability in the ΔCO2 SO2 ratio closely followed the increasing trend in VLP tremor amplitude, whereas it declined afterwards and exhibited a noticeable short-term variability until the end of the eruption. This noticeable change depicts two periods in our dataset (hereafter referred to as phase I and II), whose relationship with the previously described events and time frames of the eruption (Bonadonna et al., 2022; Ubide et al., 2023; Milford et al., 2023) will be discussed in Sect. 5. For HCl ΔCO2 and HF ΔCO2, the ratios are significantly lower during phase II (average of 0.0012 ± 0.0005 and 0.0007 ± 0.0004, respectively) than during phase I (average of 0.0027 ± 0.0009 and 0.0014 ± 0.001, respectively). For other species, only a brief spike is noted at this time, with ratios returning to phase-I levels at the onset of phase II.
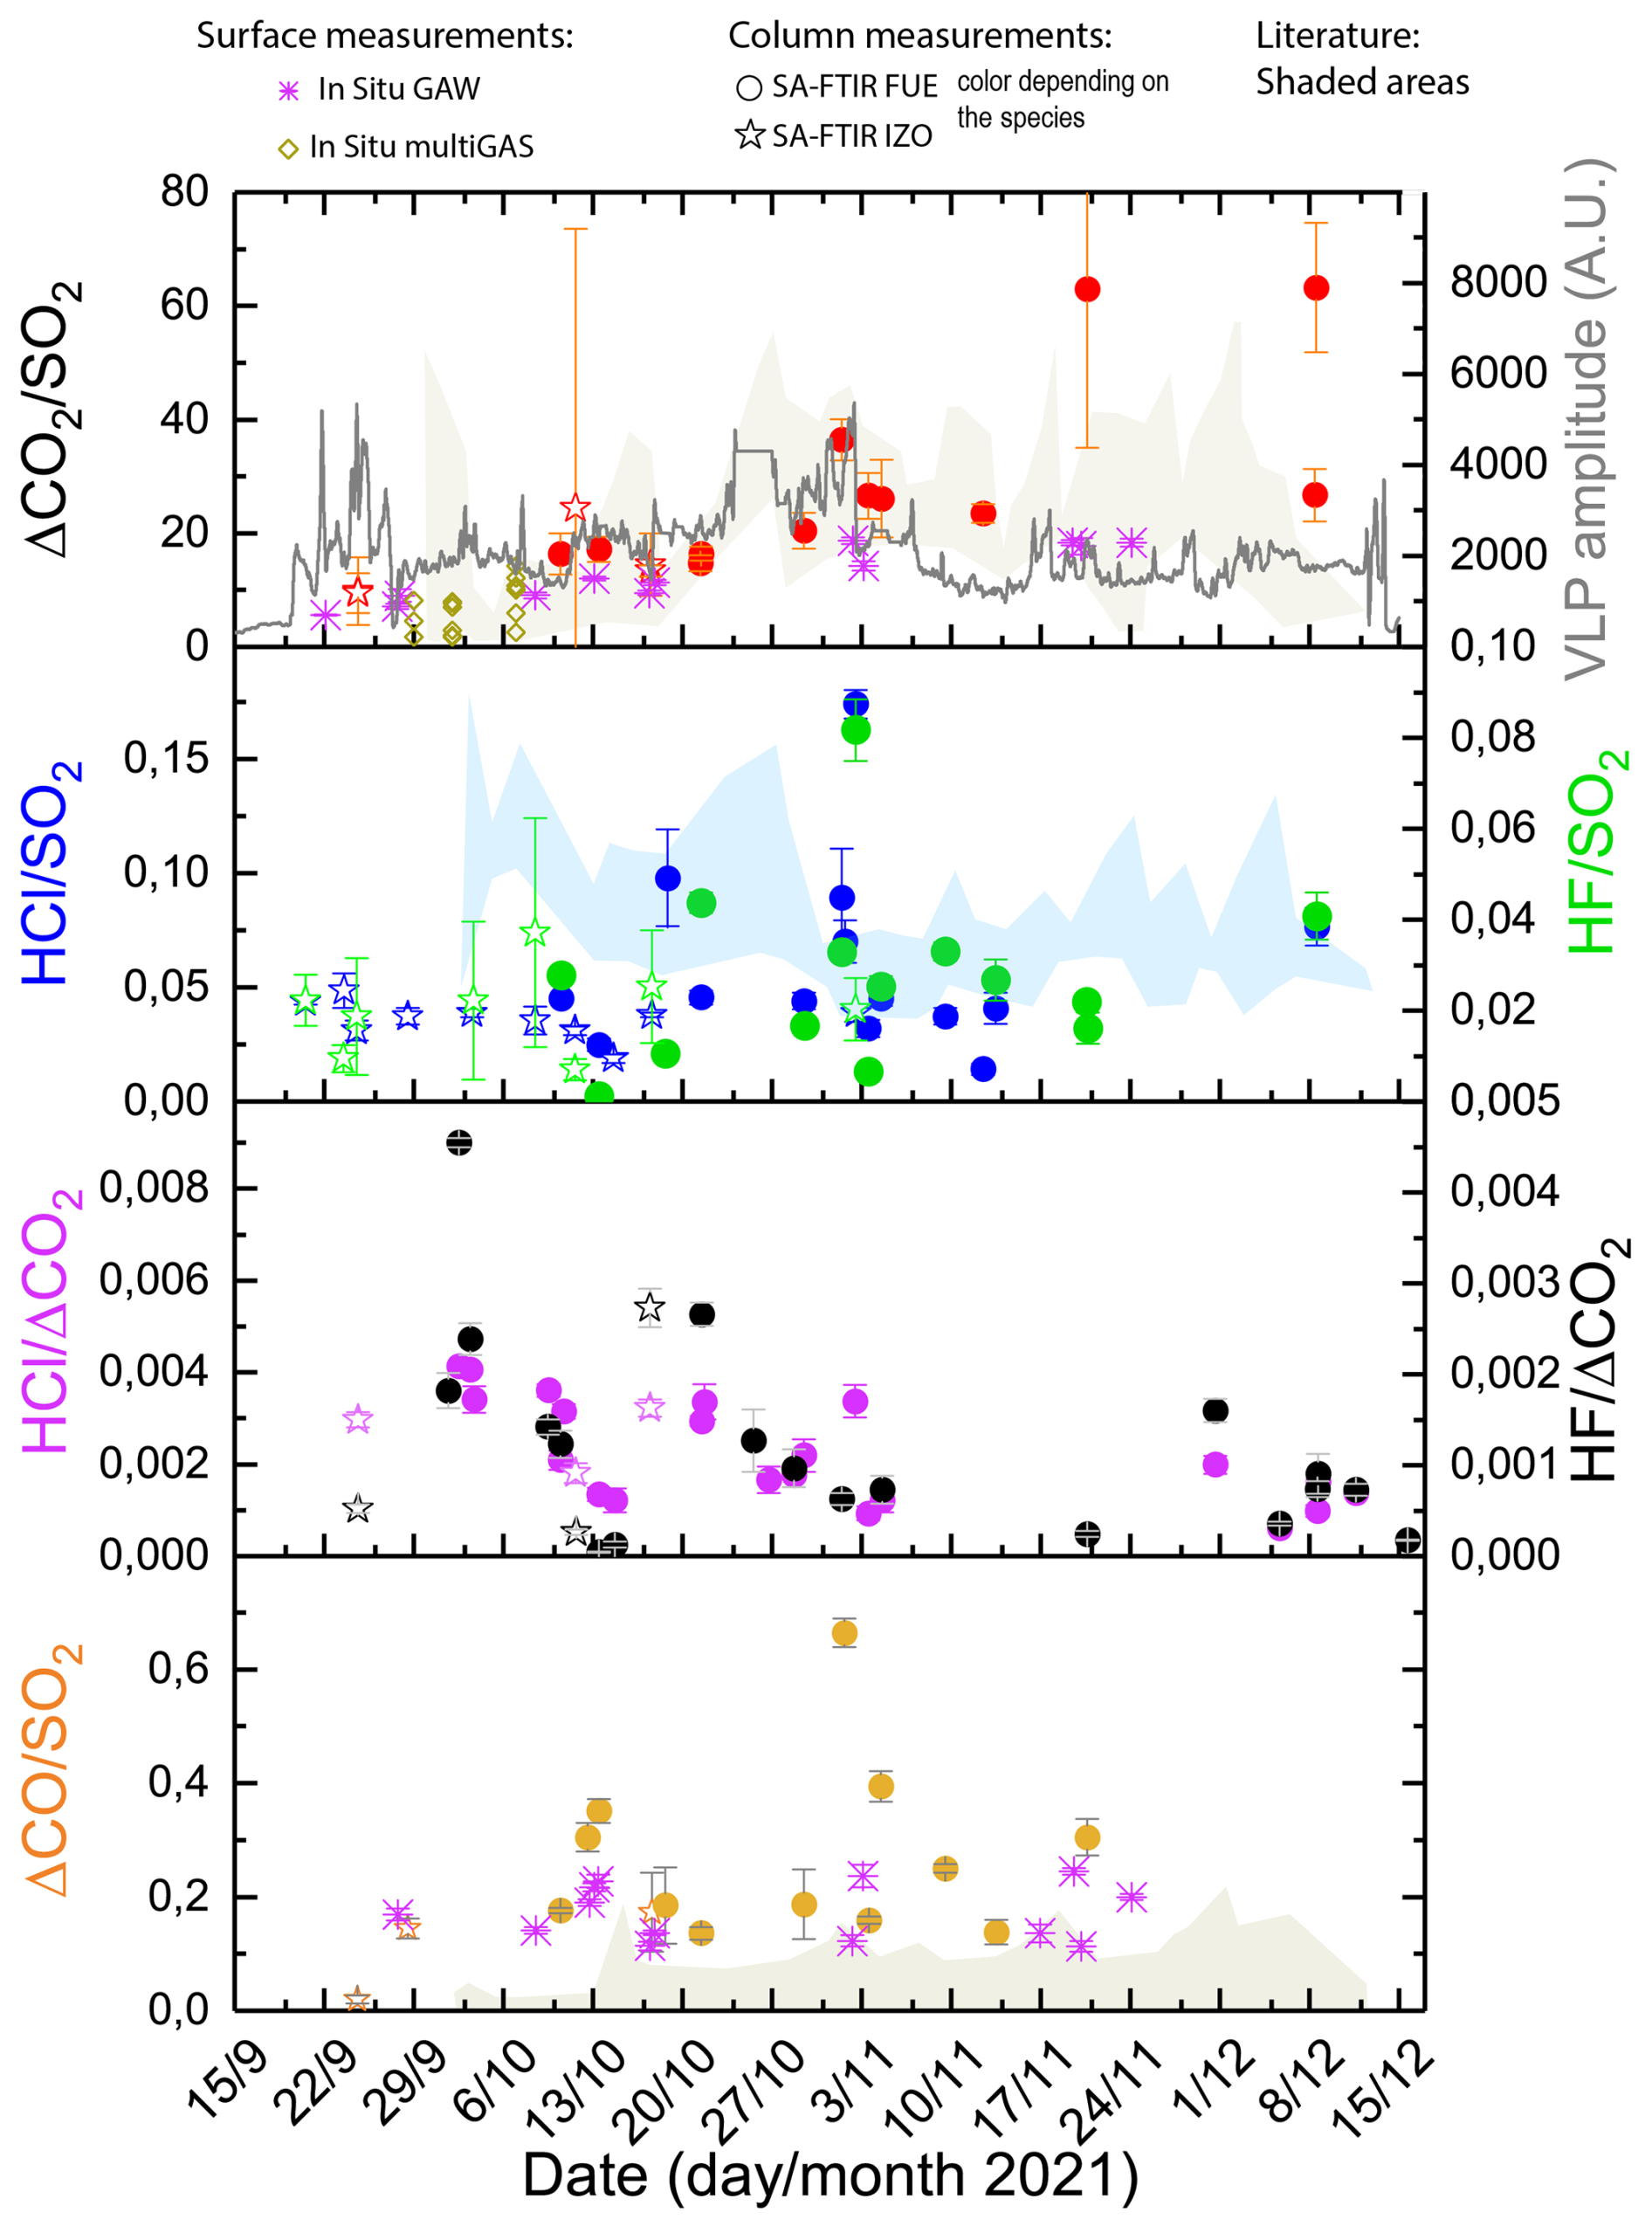
Figure 3Variability in the Tajogaite volcanic plume composition during the eruption. Daily molecular ratios are calculated from the daily species-to-SO2 or species-to-CO2 correlation plots of the total columns (SA: solar absorption FTIR and DOAS measurements) and surface (GAW and MultiGAS analysis) time series. Only the ratios with an R2>0.6 in the correlation plots are reported here to exclude those with poor reliability. Data from the literature are presented as shaded areas, including the ratios reported by Burton et al. (2023), Ericksen et al. (2024), and Asensio-Ramos et al. (2025). The latter were derived from MultiGAS and open-path FTIR measurements. Very long period (VLP; 0.4–0.6 Hz) tremor amplitude (upper panel, gray line) is taken from Bonadonna et al. (2022).
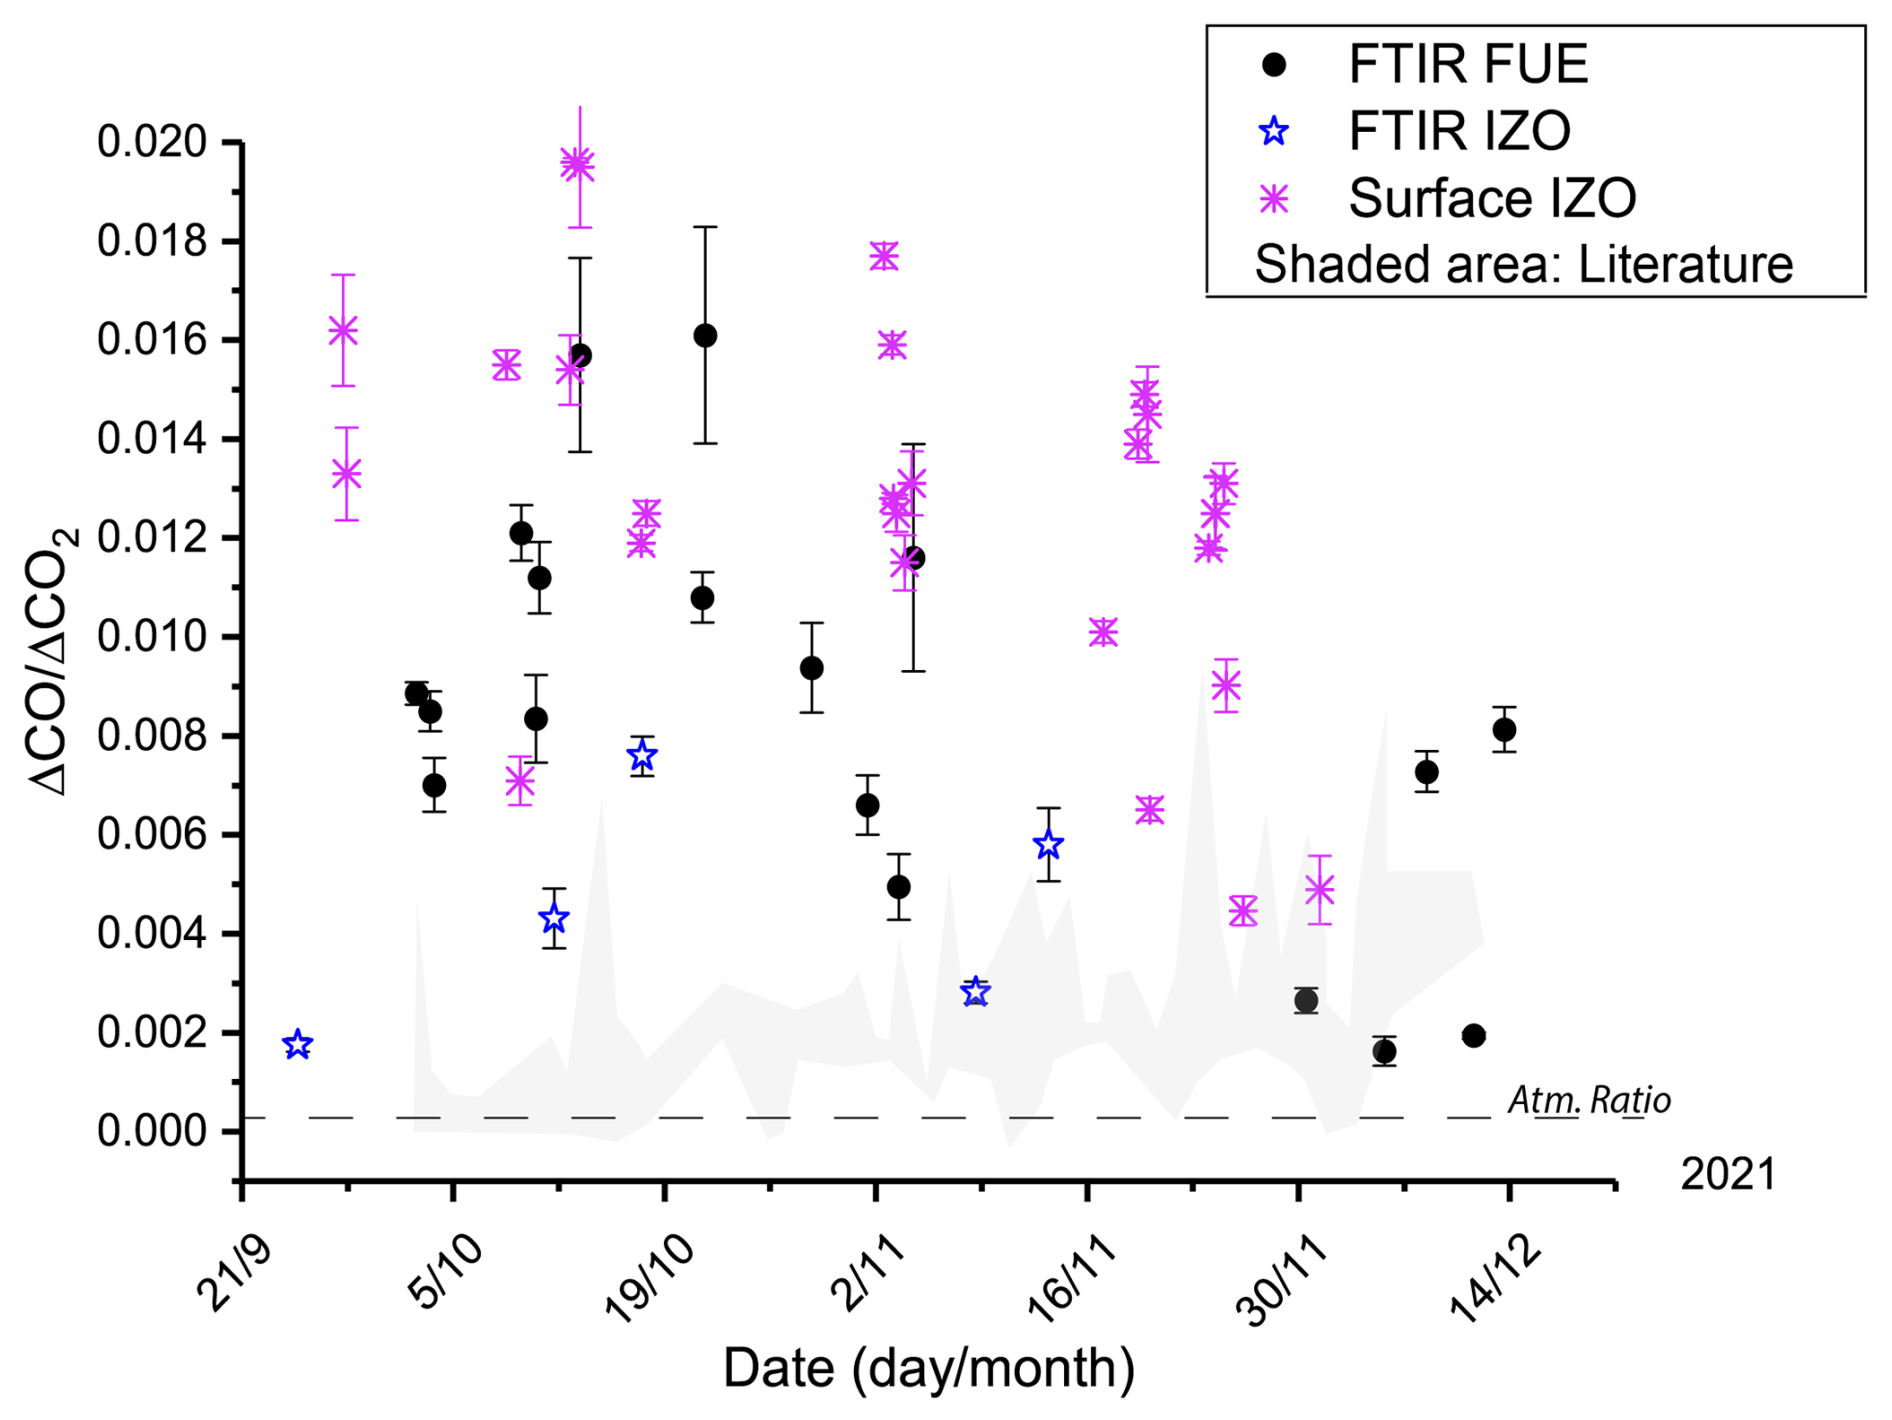
Figure 4Time series of the ΔCO ΔCO2 ratio at both FUE and IZO stations. The ratios at IZO presented here are derived from in situ surface (purple) and FTIR (blue stars) measurements. Shaded areas present the data from the literature including Álvarez et al. (2023), measured by solar absorption FTIR, and Asensio-Ramos et al. (2025), derived from OP-FTIR measurements. The dashed black line represents the long-term atmospheric ratio (Atm. Ratio) measured at IZO (derived from García et al., 2022).
Figure 4 presents the time series of ΔCO ΔCO2 ratios derived from FTIR solar absorption measurements at the FUE and IZO stations throughout the eruption, alongside in situ surface measurements at IZO (GAW data). The ΔCO ΔCO2 values observed at both sites and using both techniques are of the same order of magnitude and exceed the average atmospheric background ratio at IZO (∼ 0.0002) by more than 1 order of magnitude. At FUE, the FTIR-derived ratios show a progressive increase from 0.0016 to 0.016 during the first 30 d of the eruption, followed by a decrease to lower values before mid-November. The surface ΔCO ΔCO2 ratios at IZO fall within a similar range to those derived from FTIR at FUE, with some coinciding values in very good agreement. On average, the surface ratios at IZO are higher than the FTIR-derived ones at the same site. This discrepancy may be explained not only by the strong short-term variability in the ΔCO ΔCO2 ratios (only a few data points are coincident) but also by the fact that, although all of these points coincide with the presence of SO2 (indicating the presence of volcanic plume), the correlation between ΔCO and SO2 is relatively weak (R2<0.6), suggesting additional sources contributing to the CO enhancements. Furthermore, satellite imagery suggests that, on these days, the line of sight of the IZO FTIR instrument may have intersected aged volcanic plumes, potentially altering the retrieved ΔCO ΔCO2 ratios due to both geometric and compositional effects. The difference between the surface ΔCO ΔCO2 ratios observed at FUE and IZO and those reported by Asensio-Ramos et al. (2025) (shaded area) is discussed in Sect. 5.
4.2 SO2, CO2, and halogen-derived volcanic emission fluxes and total emissions
SO2 volcanic emission fluxes were estimated whenever the weather conditions made it possible, following the method described in Sect. 2.3 and reported in Fig. 5. The SO2 volcanic emission fluxes retrieved during this eruption exhibited a remarkably strong correlation (R2=0.92) with the daily SO2 masses (taken from the MOUNTS website; Valade et al., 2019). To fill the long-term gaps in our SO2 flux time series, a less reliable mass-derived product was included, derived from the linear relation between the SO2 volcanic emission fluxes and daily mass (empty circles in Fig. 5a). This was only applied to days with minimal accumulation. The SO2 volcanic emission flux time series exhibit a decreasing exponential trend (red curve), with an equation of the form and a coefficient of determination of R2=0.63. Most mass-derived products were found to closely follow the overall trend (red curve in Fig. 5a), indicating that, despite inherent uncertainties, these estimates are likely robust enough to assess long-term variability in this case study. This also suggests that short-term variations in wind direction or partial plume coverage in satellite images (initial filtering criteria) may have a limited impact on the observed global trend.
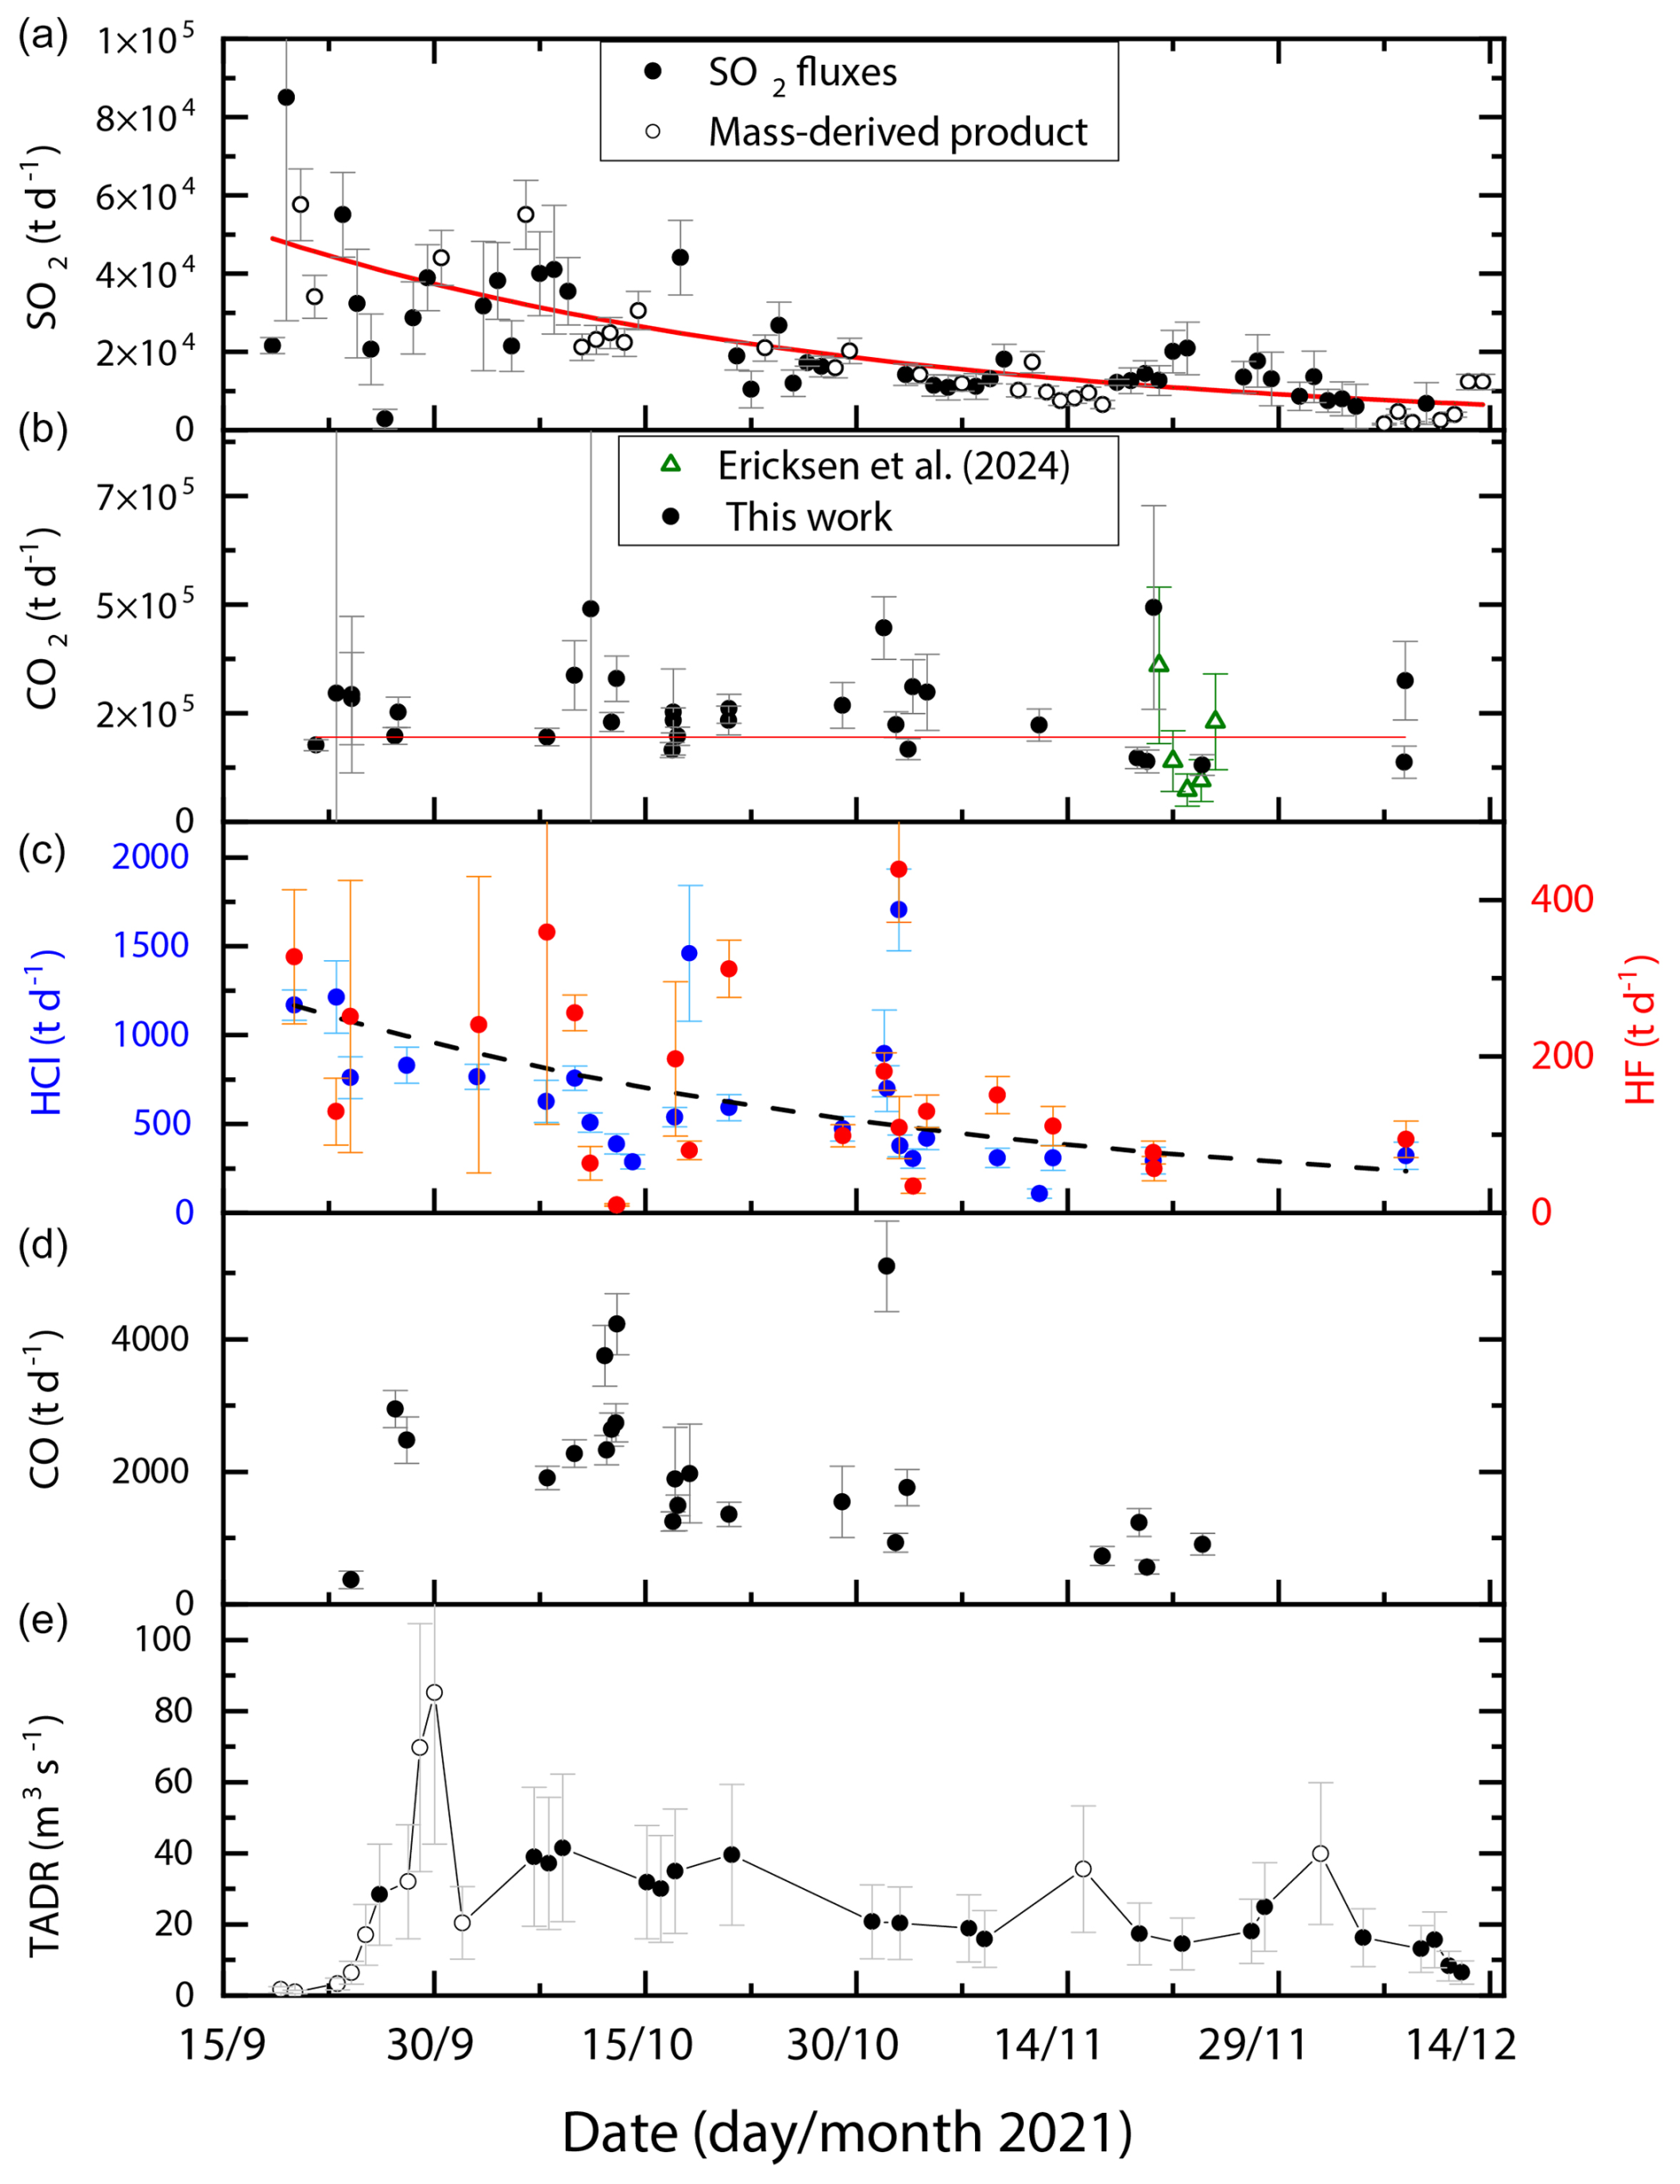
Figure 5(a–d) Emission fluxes of SO2, CO2, HCl, HF, and CO and (e) corrected TADR, following Plank et al. (2023), during the eruption. The thick red line in panel (a) is the exponential fit to the SO2 emission flux time series. The red line in panel (b) is the linear regression for the dataset. The dashed black line in panel (c) is the exponential fit to the HCl time series. Black points in panel (e) are part of the TADR–SO2 emission flux correlation.
Volcanic emission fluxes for the other species were estimated using daily species-to-SO2 ratios and either (i) interpolating the exponentially decreasing fit of SO2 fluxes or (ii) performing a linear interpolation of the SO2 emission flux time series. The HCl, HF, CO2, and CO volcanic emission fluxes are shown in Fig. 5b–d, concurrently with the time-averaged discharge rate (TADR, Fig. 5e) time series of Plank et al. (2023), multiplied by a factor of 2, as suggested by the authors to take the underestimation of the lava volume into account.
A significant observation is the long-term decrease in the volcanic emission fluxes of SO2, HCl, HF, and CO, which aligns with the TADR trend throughout the eruption, in contrast to the nearly stable trend in CO2. The similarity of the trends in the daily average SO2 emission fluxes and the TADR is further supported by an excellent correlation (Pearson correlation coefficient = 0.94; see Fig. E1), defining a slope of 14.1 ± 1.2 kg of SO2 per “thermal” cubic meter of discharged lava (lava volumes estimated using the radiant flux). This relationship includes 21 out of 27 of the available TADR–flux pairs) and is mainly valid from 7 October 2021 onwards (full circles in Fig. E1). The points corresponding to the onset of the eruption (outliers represented as hollow circles in Fig. E1) have either higher SO2 fluxes for a given TADR until the 25 September or higher discharge rates after the 27 September eruptive break and until 30 September at least (the next pair is that of 7 October, belonging to the correlation).
Another important observation is that the SO2 flux peak recorded during the first week of the eruption, accounting for approximately 20 % of the total SO2 emissions, occurs during a period of apparently low TADR and around 10 d prior to the first peak with maximum values of TADR for the eruption. The relationship between the SO2 volcanic emission fluxes and the TADR is examined in the light of the petrological data in Sect. 5.
Furthermore, the early-November peaks in the HF, HCl, and CO emission flux time series, which align with those observed in several ratio time series (Fig. 3), correspond to the inflection point in the overall flux decline, occurring near the end of phase I, as defined by Milford et al. (2023). As the CO2 volcanic emission fluxes appear to be nearly constant throughout the entire eruptive period, we can interpret the lower HCl and HF / CO2 ratios of phase II to be the result of globally lower fluxes during this period, in line with the pressure decrease in the reservoir (Charco et al., 2024).
Table 4 presents the average volcanic emission fluxes for each species over the entire eruption, distinguishing between the results from the two previously described methods. Total emissions were estimated by combining a Monte Carlo approach to account for uncertainties with trapezoidal integration to compute the area under the curve, and they are reported in Table 4. The average fluxes over the entire eruptive period and the estimated total emissions of SO2, HCl, HF, and CO2 (Table 4) provide insight into the scale of the emissions of this eruption with respect to other emission sources.
Table 4Estimate of total emissions during the eruption from gas-to-SO2 ratios and SO2 emission fluxes. The emission flux estimates were performed using (1) an exponential fit for the SO2 emission flux interpolation and (2) the direct linear interpolation of daily SO2 emission flux estimates (results in parentheses). Total emissions to the atmosphere are then derived by combining the Monte Carlo and trapezoid integration methods.
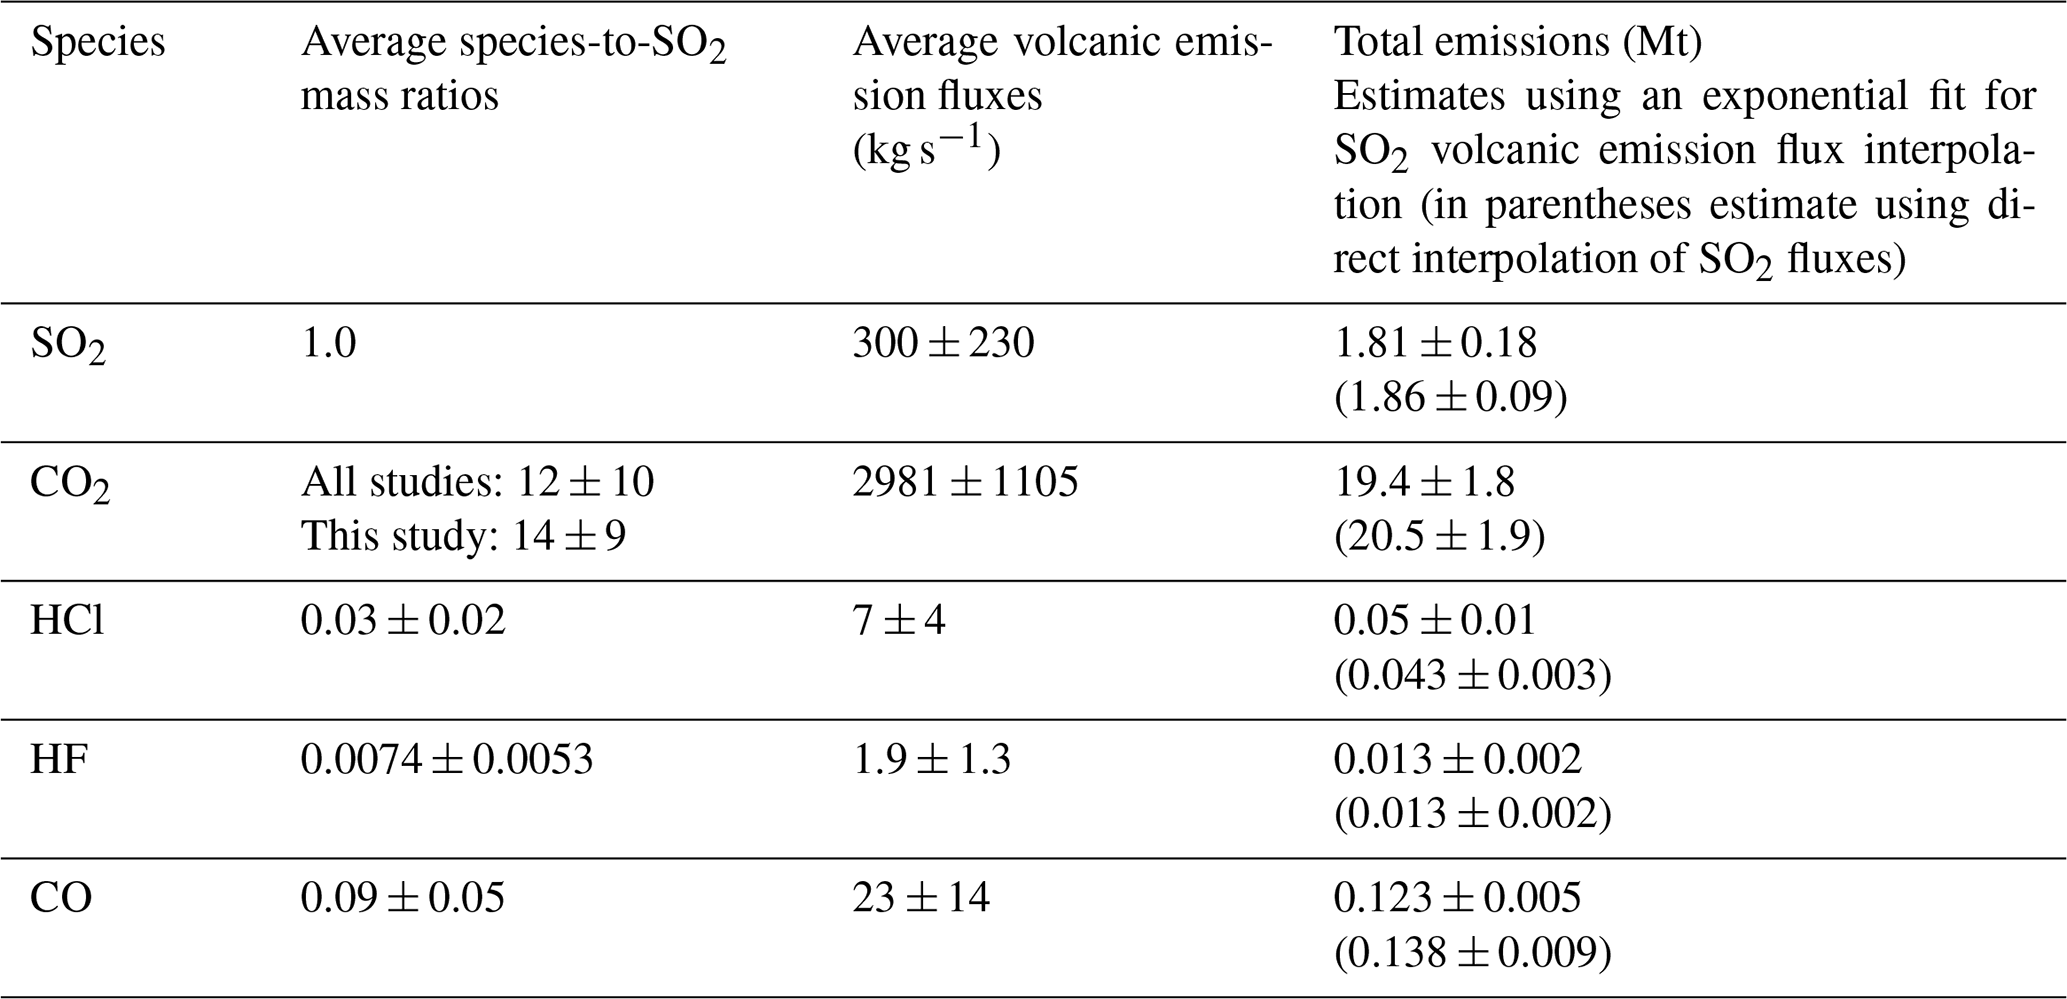
The total SO2 emissions of 1.81 ± 0.18 Mt, derived from our exponentially decreasing fit, is similar to that reported in Milford et al. (2023) using the daily SO2 mass derived from TROPOMI data (credit: ESA, MOUNTS). These total SO2 emissions are comparable to the emissions of the submarine 2011 Tagoro eruption at El Hierro, which released between 1.8 and 2.9 Mt SO2 into the ocean (estimated using the petrologic method; see Longpré et al., 2017).
During the Tajogaite eruption, the highest SO2 emission fluxes occurred during the first 10 d of the eruption (median of 37 kt d−1 during this period), whereafter a lower median of about 20 kt d−1 was observed. These SO2 emission rates are the same order of magnitude as recent basaltic eruptions such as, for instance, Piton de La Fournaise on Réunion Island in 2020 (average: 9 kt d−1; max: 25 kt d−1; Hayer et al., 2023) and Bárðarbunga in Iceland in 2014–2015 (average of 50 kt d−1 over 6 months; Pfeffer et al., 2018), whereas they are lower than the emission rate of Kilauea in 2018 (average of 200 kt d−1; Kern et al., 2020); however, the latter two events exhibit much higher eruptive TADR. For the Tajogaite eruption, the high SO2 fluxes result from the high sulfur content of parental magma, as reflected by the average content of 3360 ppm in our MIs (Supplementary data, Table S1), similar to the value of 3500 ppm reported in Burton et al. (2023) and Dayton et al. (2024).
For CO2, we obtained a steady average emission flux of 260 ± 24 kt d−1 and total emissions of 19 ± 2 Mt over the course of the eruption. This result aligns closely with the estimates of 28 ± 14 Mt reported by Burton et al. (2023). These emissions represent 15 % of global subaerial volcanic and tectonic annual emissions (Fischer and Aiuppa, 2020) or the equivalent of the annual CO2 budget of ocean island basalt (OIB) volcanism, as estimated by Lo Forte et al. (2024). The high CO2 emissions with respect to the low extruded magma volume during the Tajogaite eruption, compared to other effusive eruptions, is explained by the extraordinarily carbon-rich magma, as it is reflected in both fluid and melt inclusions (up to 2 wt % CO2 in MIs; Dayton et al., 2024). This is a characteristic of Macaronesian magmas and possibly of global OIB (Burton et al., 2023; Lo Forte et al., 2024; Van Gerve et al., 2024).
Daily total CO emissions measured during the eruption, averaging 2 kt d−1, were exceptionally high, with a cumulative total of 0.12 ± 0.01 Mt. Only few volcanic CO emissions are reported in the literature, such as 0.15 kt d−1 at Erebus volcano (Wardell et al., 2004), 0.007 kt d−1 at Ol Doinyo Lengai (Oppenheimer et al., 2002), 0.16 to 0.27 kt d−1 at Nyiragongo volcano (Sawyer et al., 2008a), and 0.0007 kt d−1 at Erta Ale (Sawyer et al., 2008b), and they are more than 1 order of magnitude lower than our estimates during the Tajogaite eruption.
Finally, our estimated HCl and HF total emissions are about 50 ± 10 kt and 13 ± 2 kt, respectively, with corresponding averages of 604 ± 340 t d−1 and 173 ± 86 t d−1. These emissions are of the same order of magnitude as those observed for other basaltic volcanoes, such as Etna (300–1300 t d−1 of HCl during the 2008–2009 eruption, as reported in La Spina et al., 2023, and 800 t d−1 of HCl and 200 t d−1 of HF in 1997, as reported in Oppenheimer et al., 1998), Bárðarbunga volcano (500 and 280 t d−1 for HCl and HF, respectively, as reported in Galeczka et al., 2018). HCl and HF emissions from the Tajogaite eruption are more than an order of magnitude higher than those observed at Kilauea volcano, which were reported to be 12–22 t d−1 of HCl and 6–9 t d−1 of HF in 2008 and 2009 (Mather et al., 2012).
5.1 Comparison of CO2-, CO-, HCl-, and HF-to-SO2 ratios from different measurement methods and sites
One of our key results is the remarkably strong consistency between the measured volcanic gas species-to-SO2 ratios, regardless of the measurement site, the technique, or the instrument used (Fig. 3). The measurements conducted at the IZO station gave the excellent opportunity to assess the robustness of our estimated ratios, using both the EM27/SUN and IFS-125HR instruments, and their consistency with surface measurements. We found excellent agreement between the HCl and HF total columns (with volcanic plume contribution) derived from the IFS-125HR and EM27/SUN products (see Appendix A for details).
We found good comparability with respect to the available ΔCO2 SO2 and ΔCO SO2 between surface and column measurements, reflecting an efficient vertical mixing. This also suggests that when the volcanic plume is detected by the surface measurements at the IZO station, the ground-level concentrations are representative of the average volcanic plume composition. As the IZO station is often located above the base height of the trade wind inversion (TWI) layer (Milford et al., 2023), volcanic plumes detected at IZO were typically transported rapidly through the low free troposphere. The progressive decrease in the plume injection height throughout the eruption, combined with seasonal changes in the vertical stratification of the atmosphere (TWI height), resulted in sparse detections of the plume at the IZO station after mid-November 2021 (Milford et al., 2023). This led to a reduction in the coincident surface and total column observations.
Moreover, the comparison of ratios at different distances from the eruptive vents (i) at IZO (140 km) and (ii) near the active vent measured by OP-FTIR or MultiGAS instruments (this work; Burton et al., 2023; Ericksen et al., 2024) allows qualitative assessment of the impact of in-plume reactions on our measurements. The ratios taken from Burton et al. (2023) were derived from either in situ ground-based or drone-borne MultiGAS measurements within the plume close to the volcanic vents or, after 2 October 2021, from open-path FTIR measurements pointing to the eruptive column and using the lava fountain as a source. Those reported by Ericksen et al. (2024) are ground-based MultiGAS measurements. In any case, the gas measured by these authors corresponds to the plume less than 1 km from the volcanic vents. Because CO2 is a nonreactive species, a significant conversion of SO2 into sulfate aerosols (H2SO4) during the transport between La Palma and IZO should increase the ΔCO2 SO2 ratio. Hence, if significant conversion of SO2 to sulfates occurred during transport, the IZO ratios should be higher than those measured closer to the volcano. To examine this aspect, we estimated the plume age for each recorded event using the HYSPLIT transport model, in both retro-trajectories and forward-simulation configuration mode. For meteorological data, we utilized 72 h extended files containing high-resolution meteorological information derived from the WRF-ARW (Advanced Research Weather Research and Forecasting) model as input. This model runs twice a day, using initial and boundary conditions from ECMWF's HRES-IFS (high-resolution Integrated Forecast System) data, with a resolution of 0.09° × 0.09° (for further details, refer to Appendix C). Table 5 shows the coinciding values of the ΔCO2 SO2 ratios measured at less than 1 km from the eruptive fissure (Burton et al., 2023) and at IZO (this work) as well as an estimate of plume age for each event. Despite the limited number of coincident events at the two sites, no clear dependence of this ratio on distance was observed for plumes with an age of 12 h or less. A certain similarity was found, at least until the beginning of November, even in cases of relatively old plumes (∼ 12 h), suggesting a swift transport between La Palma and Tenerife and negligible in-plume reactions (or at least indistinguishable within the uncertainties in the ratios). In the troposphere, the SO2 to SO oxidation rates vary significantly, from a few percent per hour by in-cloud droplet processes (driven by aqueous-phase oxidation, e.g., H2O2) to a few percent per day (in dry air, driven by OH radicals) (Seinfeld and Pandis, 1997). Our results suggest that this latter (slow dry oxidation) process may be the prevailing one during transport in the dry free-troposphere, from La Palma to IZO. This interpretation is supported by the sulfate aerosols measured in situ on La Palma (Rodríguez et al., 2025) and at IZO, when the volcanic plume reaches the station, plotted in Fig. 6. Figure 6a reports the statistical distribution of the ratio (in percent, %) of particulate sulfur (S(p), i.e., sulfate SO) over total sulfur (i.e., gas sulfur as sulfur dioxide (S(g)) plus S(p)) measured in the aerosols smaller than 10 µm (PM10) at IZO and at La Palma during the eruption. Figure 6b shows the correlation plot of S(g) as a function of S(g)+S(p). We observe a higher maximum conversion rate at IZO (45 %) than on La Palma (20 %), as expected. However, 80 % of the dataset (Fig. 6a and b) presents a conversion rate of the sulfur content to SO4 of below 15 % and 7 % at IZO and La Palma, respectively.
Table 5Comparison of the ΔCO2 SO2 ratio values at two different distances from the Tajogaite eruptive center and the estimate of plume age at IZO station. FTIR ratios are given in parentheses to distinguish them from surface ratios.
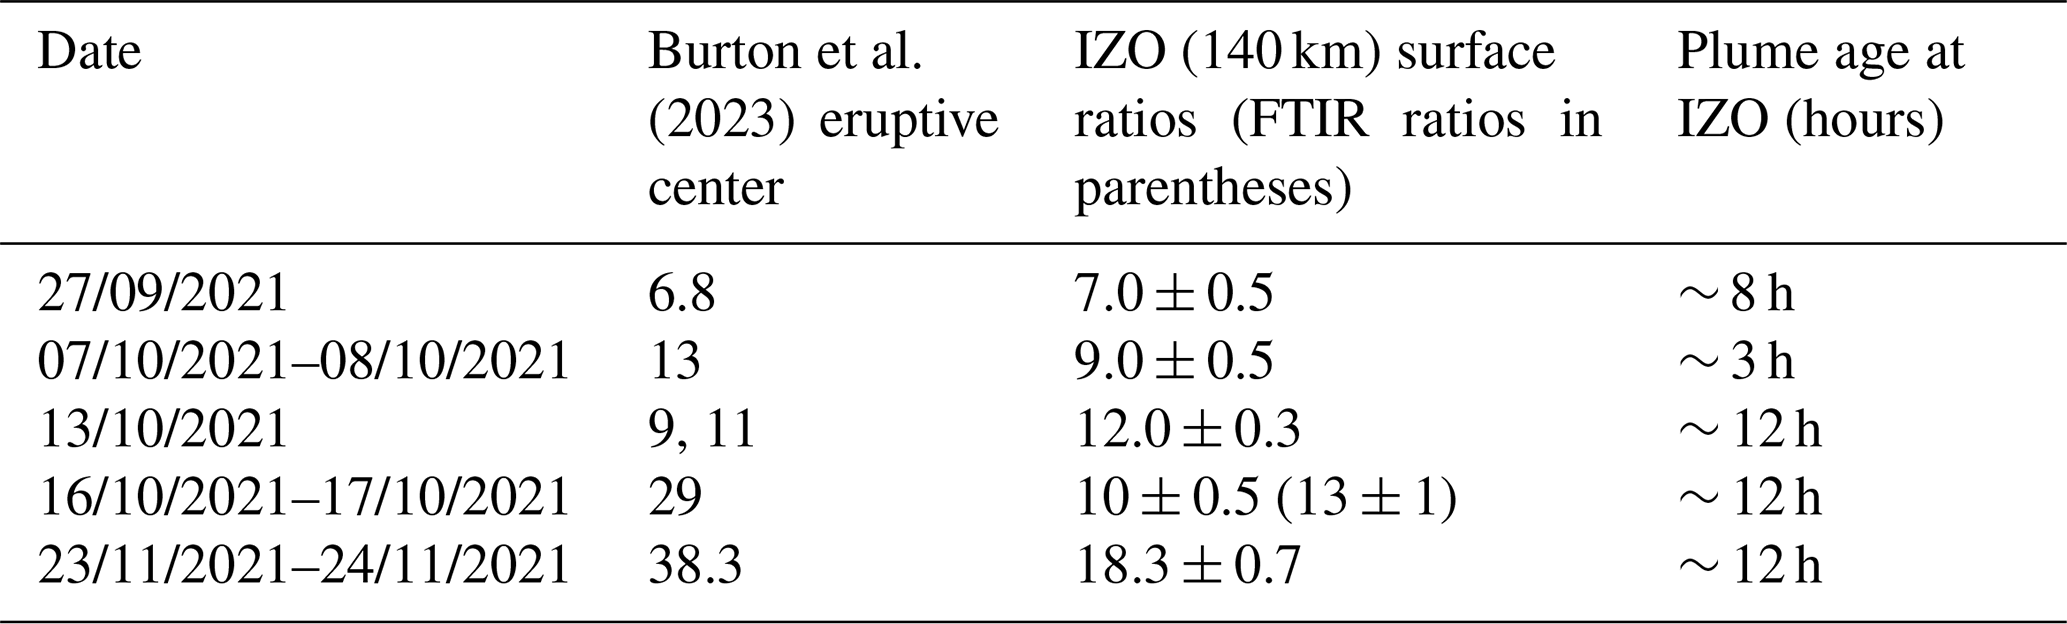
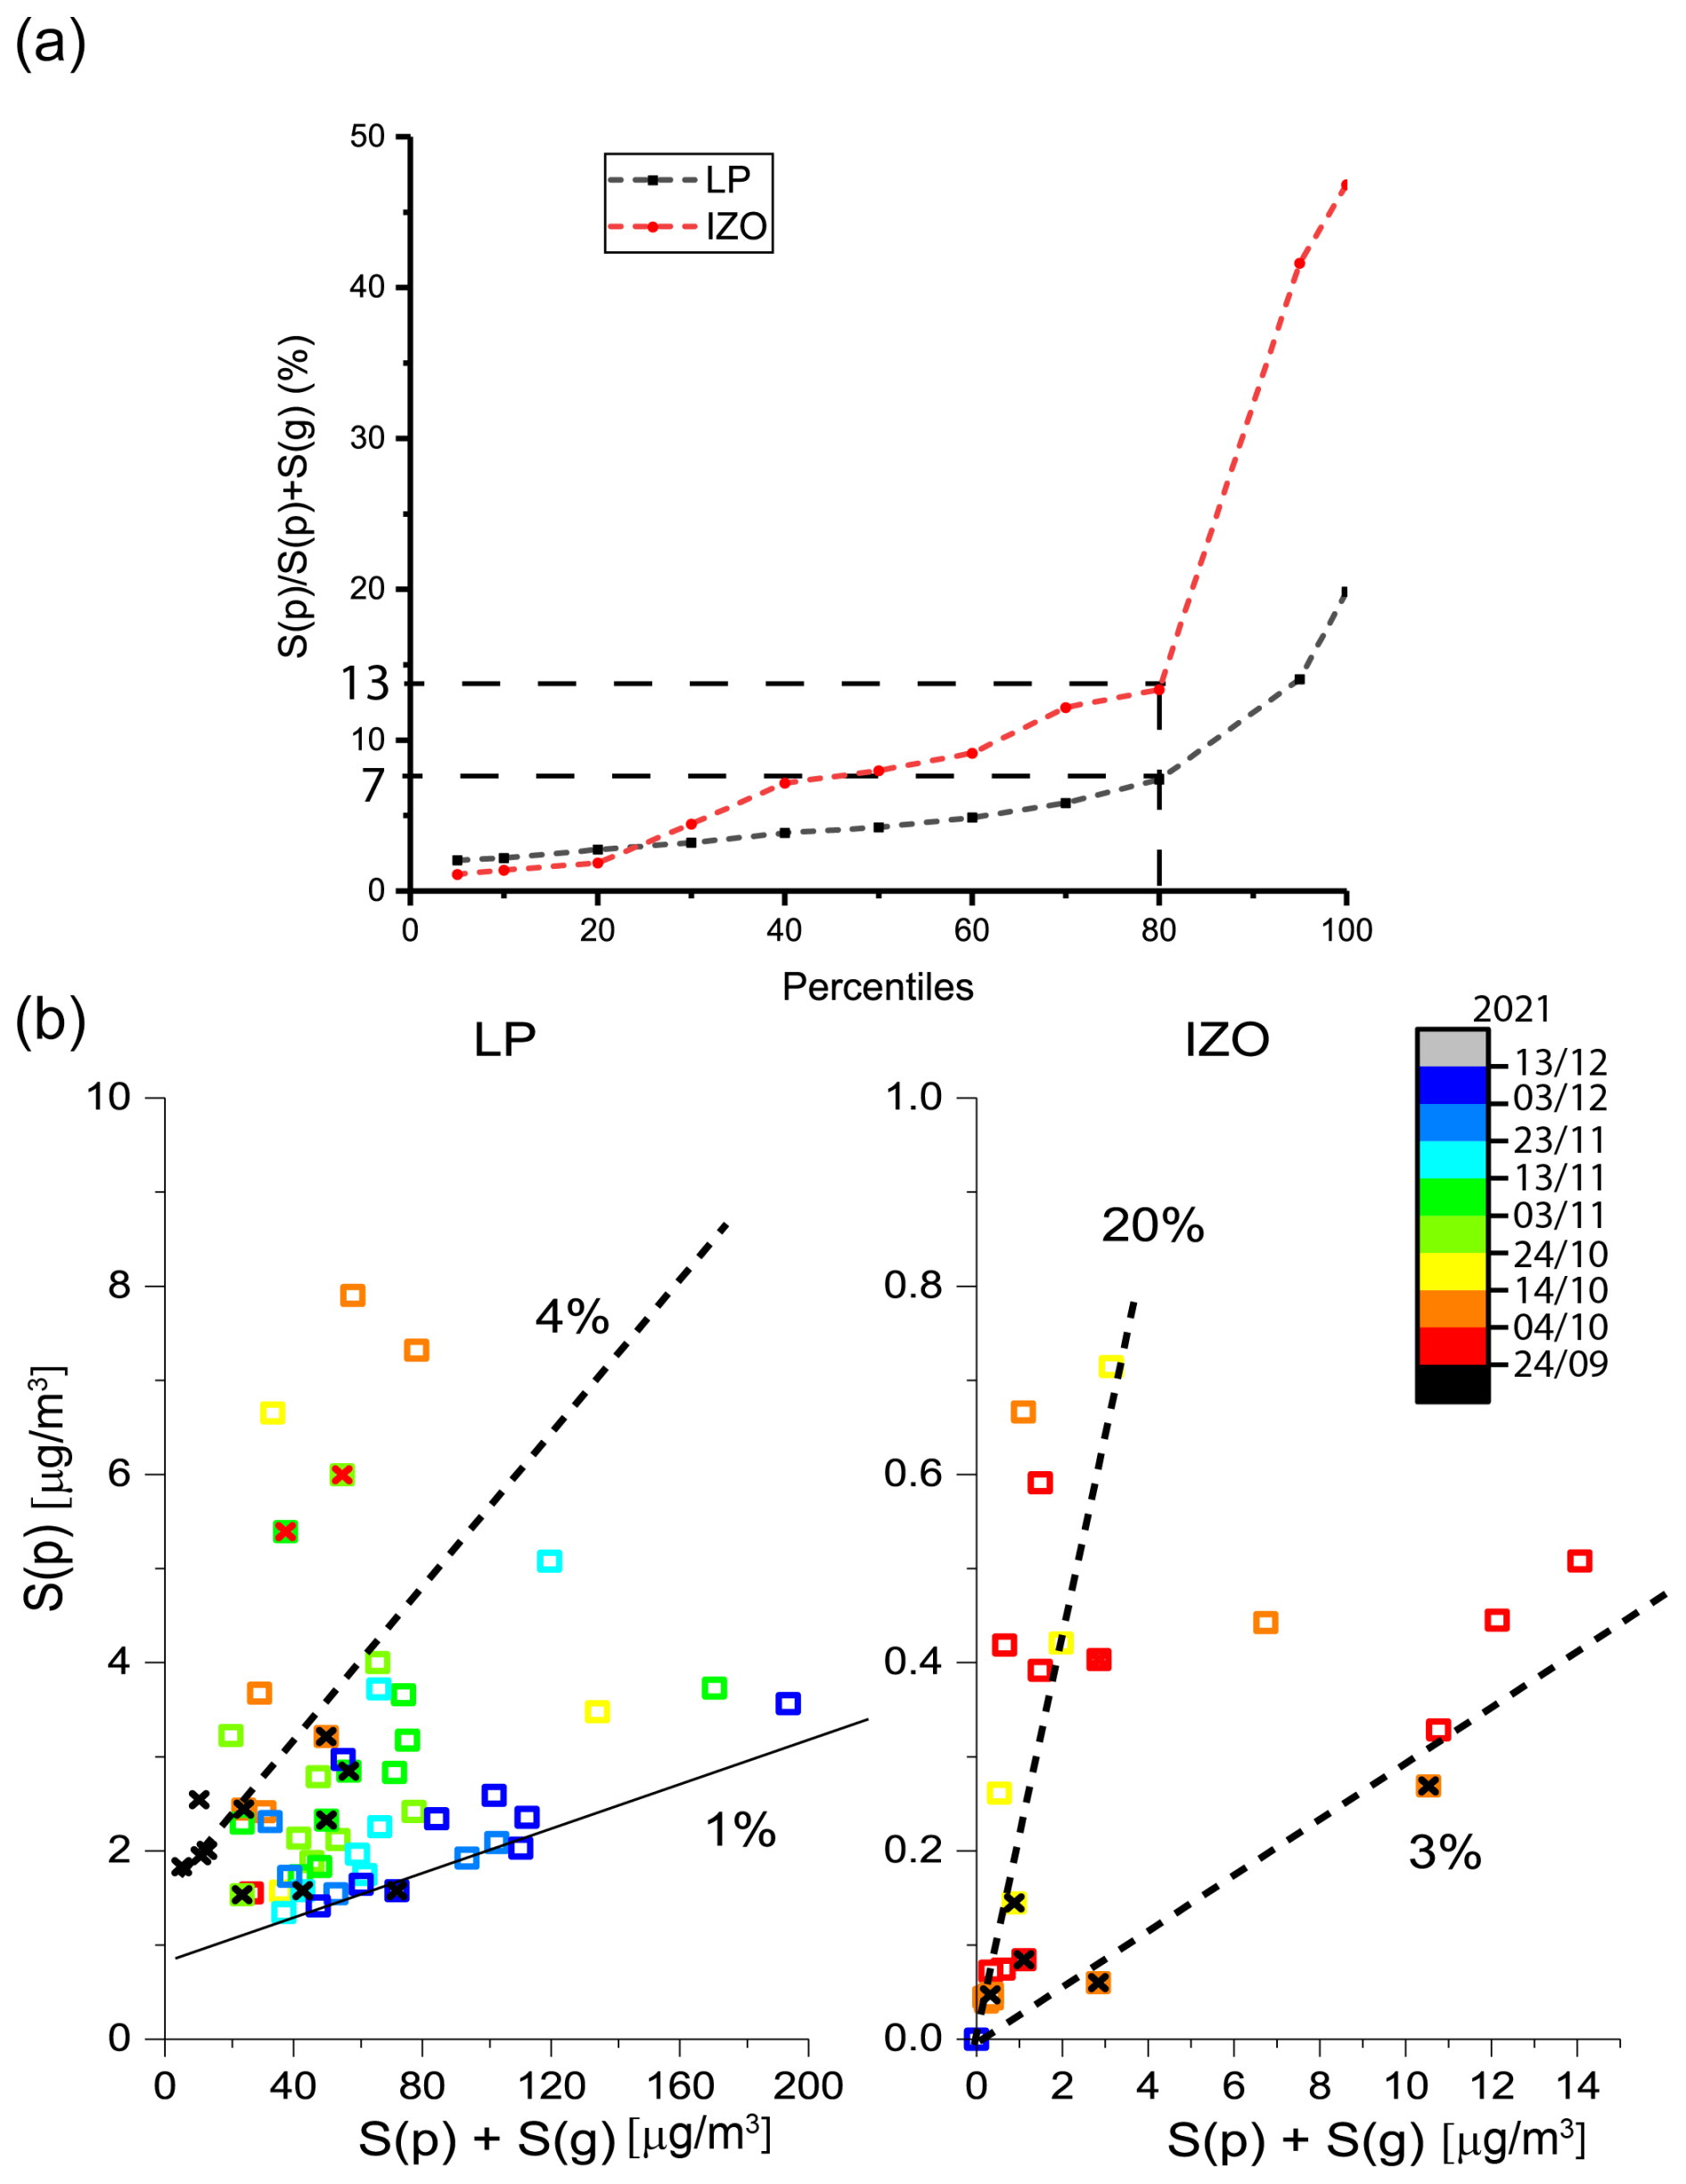
Figure 6Statistical distribution of the S(p)-over-S(p)+S(g) ratio (in percent; p and g refer to particle and gas, respectively) measured at IZO (Tenerife) and at El Paso (La Palma) during the Tajogaite eruption. Panel (a) shows the statistical distribution of the conversion rate estimated from the La Palma and IZO aerosol measurements. Panel (b) reports S(p) as a function of S(p)+S(g) from the IZO and La Palma PM10 analysis with the time shown as a color scale. Crosses inside the square denote data points coinciding with FTIR measurements.
Furthermore, the time distribution of the S(p)/(S(p)+S(g) ratio (Fig. 6) suggests a higher conversion rate of SO2 to sulfate during the first part of the eruption (until the beginning of November) compared to the second period. This trend appears closely tied to the volcanic plume's altitude relative to the trade wind inversion (TWI), as described by Milford et al. (2023). During the first period of the eruption (until early November), plumes from explosive activity and fountaining vents often rose above the TWI, and surface measurements at La Palma likely captured older, dilute, more oxidized emissions from effusive vents trapped in the TWI. Conversely, from the beginning of November, the entire plume, comprising both explosive and effusive components, was more frequently trapped below the TWI, leading to the detection of younger, more concentrated, and less oxidized emissions at ground level. In any case, the plumes reaching IZO are most likely dominated by explosive emissions which, despite substantial transport times, exhibit oxidation rates below 15 %. Such low conversion rates would not produce resolvable differences in our gas-to-SO2 ratios. The last two events in Table 5 present some difference between both sites. On 16 October 2021, the FTIR and surface ratios at IZO are comparable, highlighting their robustness; however, these ratios are a factor of 2–3 lower than those reported by Burton et al. (2023). We remark that, for these days, the measurement target reported by these authors mention the base of the lava fountain instead of the spattering vents or passive degassing, as for the other three dates, implying different conditions and processes.
Finally, the ΔCO ΔCO2 ratios measured at FUE station (Fig. 4) and those recorded at IZO from surface measurements are on average higher and have higher variability than those recently reported in Asensio-Ramos et al. (2025) from open-path measurements (Fig. 4). This difference is likely due to the different measurement methods (solar absorption vs. open-path measurements using hot lava as source), implying different loci of measurements and gas contribution along their respective line of sight. Tajogaite volcano presented notable differences in eruptive behavior between the different vents along the volcanic fissure, with those at higher elevations being more explosive than lower vents. Recent studies suggest that eruptive dynamics may affect the abundance of redox-sensitive species (e.g., Oppenheimer et al., 2018; Moussallam et al., 2019). Furthermore, we note that most of the Asensio-Ramos et al. (2025) measurement sites until the beginning of November (i.e., when our highest ΔCO ΔCO2 ratios were recorded) were located to the north-northwest of the eruptive fissure. With winds dominantly blowing towards the south and southwest during this period, this configuration avoided a significant contribution of biomass- and building-burning plumes to their measurements. This was not the case for the FUE measurements, which are more likely to have been affected by this contribution (provoked by the advance of the lava flows). This hypothesis is also supported by the similarity of the ΔCO ΔCO2 time series at FUE with the time series of the areas covered daily by the advancing lava flows (Appendix D, Fig. D1), reflecting the extent of burnt vegetation. The typical values reported in the literature for the wildfires (Yokelson et al., 2007; Akagi et al., 2014; Vasileva et al., 2017; Álvarez et al., 2023) are generally higher than our values, by at least a factor of 5, which is likely explained by the different contributors of the measured plume, i.e., a mixing of volcanic plume and vegetation/infrastructure burning in the case of the 2021 La Palma eruption.
5.2 New insight into the eruption dynamics
The ratios and emission flux time series and the total emission estimates presented here provide some information about the degassing processes during the Tajogaite eruption.
Our time series of SO2 volcanic emission fluxes confirms the decreasing trend observed from the SO2 daily mass time series from MOUNTS (http://www.mounts-project.com, last access: 25 October 2025; Valade et al., 2019) and reported in Milford et al. (2023). The concurrent decrease in SO2 emissions with decreasing tephra accumulation rates and a decreasing plume height was suggested to reflect the decrease in the pressure in the plumbing system (Milford et al., 2023). This was confirmed by the co-eruptive deflation trend observed and inverted by Charco et al. (2024), possibly related to the pressure drop due to drainage of the reservoir. The relatively good fit of the SO2 flux data obtained using an exponential function further supports this interpretation.
We found a good correlation between the SO2 volcanic emission flux time series and the TADR (slope: 14.1 ± 1.2 kg of SO2 per cubic meter of lava; R=0.94). A similar correlation between SO2 emissions and effusive volumes was previously observed during the 2021 Fagradalsfjall eruption (Pfeffer et al., 2024). The few outliers to this correlation (empty circles in Fig. E2) occurred during three distinct periods: (1) the initial days of the eruption, coinciding with the peak in SO2 emissions; (2) just after the 27 September eruptive pause, at the onset of a sharp increase in effusion rates; and (3) following the opening of the late-November vents, north of the main vent alignment. These outliers correspond to abrupt changes in the output rate, likely associated with transient perturbations in the surface thermal structure conditions, which are known to affect the reliability of TADR estimations based on radiant density models (Coppola et al., 2016). Interestingly, applying the TADR values derived from the Pleiades-based volume estimates of Belart and Pinel (2022), which are averaged over 6–7 d, would bring at least three of these outliers back in line with the main trend. This suggests that apparent short-term imbalances between SO2 emissions and effusion rates may be rapidly compensated for, resulting in a coherent degassing–effusion relationship over multiday timescales. This is particularly evident at the beginning of the eruption, where the Belart and Pinel (2022) estimates yield significantly higher TADR values than those of Plank et al. (2023) (Fig. E2).
Beyond these transient deviations, the correlation between SO2 flux and TADR remains remarkably consistent throughout the eruption, suggesting that the emitted SO2 predominantly reflects syn-eruptive magma degassing. This coherence, maintained over nearly 3 months of activity, indicates that the degassing regime remained stable once the eruption was fully underway. The early deviation from this trend, characterized by an apparent excess of SO2 emissions relative to effusion, may reflect the release of sulfur that had already exsolved in the shallow system prior to the eruption and its rapid release, followed, after the eruptive pause, by the evacuation of the partly degassed magma. While this interpretation is consistent with the observed trends (Fig. E2), it remains tentative, given the absence of composition data for the earliest days of the eruption.
This correlation confirms that the emitted SO2 only proceeds from the ascending magma. We observed a similar behavior for HCl, HF, and CO emission fluxes, which contrasts with the almost constant CO2 flux throughout the 85 d of the eruption. This observation is fully consistent with the degassing model proposed by Burton et al. (2023), who suggested a decoupling between CO2 and SO2 degassing processes. According to this model, a CO2-rich volatile phase, already exsolved in the upper-mantle reservoir, could account for a large fraction of the emitted CO2 (up to ∼ 80 % according to Dayton et al., 2024), sustaining nearly constant CO2 fluxes through the system. This difference is partially reflected in the time series of the ΔCO2 SO2 ratio that steadily increases from the beginning of the eruption to the end of phase I, mimicking the trend in the VLP tremor amplitude. Such co-evolution abruptly ends at the beginning of November, from which point the ratio becomes more variable. As the CO2 volcanic emission fluxes are constant within uncertainties during the whole eruption and the SO2 volcanic emission fluxes are mainly controlled by the magma discharge rate, the steady increase in the ratio during the first part of the eruption thus reflects the progressive decrease in the proportion of the shallow (discharge) component relatively to the deep-reservoir CO2-rich fluids. Within the framework of overall lower SO2 fluxes due to waning activity, the variability in the ratios of phase II reflect the control of low SO2 contents in the plume and short-term variability in the SO2 emissions.
The early-November transition between phase I and phase II follows the appearance of new vents at the end of October (Muñoz et al., 2022), interpreted as further propagation/opening of the underlying dike intrusion. This transition shortly anticipates an abrupt and enduring drop in tremor amplitude (both VLP and LP frequency bands; Bonadonna et al., 2022), geochemical changes (Ubide et al., 2023; Dayton et al., 2024), and hydrologic and hydrochemical changes in the aquifer. The latter comprises, e.g., an influx of pure (most likely endogenous) CO2 (Jiménez et al., 2024) that drastically increased the groundwater HCO content at several sampling points from 27 October 2021 (Amonte et al., 2022; García-Gil et al., 2023b) or the establishment of a direct relationship between the level in several groundwater wells and the tremor amplitude around 7 November 2021 (Garcia-Gil et al., 2023a). VLP tremor amplitudes are especially sensitive to variations in magma ascent dynamics and conduit geometry (D'Auria and Martini, 2009; Bonadonna et al., 2022). Similar drops in VLP tremor amplitude were observed at other volcanoes, such as at Piton de la Fournaise (Duputel et al., 2023), where they were interpreted in terms of a reduction in dike dimension, heralding the end of the eruption. All of these observations suggest that these events at the beginning of November constitute a turning point in the eruption, implying significant structural changes in the plumbing system.
This turning point is particularly evident from the split described in the time series in the Sr isotopic compositions of the matrix, and it is interpreted as the consequence of a deep-origin melt injection replenishing the feeder system (Ubide et al., 2023). This interpretation further relies on this compositional change occurring in close time relationship with an increase in the magnitude of seismicity, VLP tremor amplitude, and a short-term (5 d) rebound in the time series of daily SO2 masses. We emphasize that the short-term increase in daily SO2 masses observed between 28 October and 2 November 2021 should be interpreted with caution. First of all, at the depth of injection, with SO2 being mostly soluble in magma until a few hundred meters depth (Burton et al., 2023), any increase in SO2 emissions would be due to an increase in the lava discharge rate at the surface. Moreover, this apparent peak coincides with a period of low wind speeds and a reversal in wind direction at 700 hPa (ERA5 data), which likely caused plume stagnation and gas accumulation. These meteorological conditions can lead to an overestimation of SO2 masses derived from satellite data. Therefore, we do not interpret this increase as a definitive sign of enhanced volcanic degassing. Furthermore, the deep-origin melt injection in this period is not supported by the absence of corresponding signals in the GPS baseline time series (Charco et al., 2024), TADR data (Plank et al., 2023), or our CO2 fluxes or CO2 SO2 ratios.
The observed multiparametric transition in the eruption dynamics at the beginning of November could be alternatively explained by a significant alteration of the magma pathway between the surface and the top of the magma chamber. As the eruption waned, the ascent rate decreased and the conduit became more unstable (Muñoz et al., 2022), with the opening of new vents from mid-November (González, 2022; Walter et al., 2023), resulting in interaction with the aquifer; changes in the tremor amplitude, mixing ratio, and/or composition of endmembers; and the return of radiogenic signatures.
5.3 Volatile mass balances and implications
Once released from the magma, volcanic gases suffer a number of processes such as oxidation, scavenging, and dissolution in aqueous fluids that can alter their original composition before their detection. Integrating petrological constraints helps to understand volcanic degassing processes, linking deep degassing to atmospheric observations and refining our understanding of element cycling and the environmental impact of volcanic plumes. Here, we report such an exercise, estimating expected emissions from petrological data and comparing them with our estimates derived from atmospheric measurements.
5.3.1 “Effective S degassing” and SO2 mass balance
Combining our SO2 volcanic emission fluxes and new petrological data with complementary literature allows us to estimate an S degassing balance for the Tajogaite eruption. We used a similar Monte Carlo approach to that proposed in Dayton et al. (2024) but refined the degassing balance as follows: we used an erupted lava volume of (177 ± 5.8) × 106 Mm3 from Civico et al. (2022), a distal tephra volume of (22.8 ± 1.8) × 106 Mm3 from Bonadonna et al. (2023), and a cone volume of (36.5 ± 0.3) × 106 Mm3 from Civico et al. (2022). The total erupted mass is obtained applying a similar approach to Dayton et al. (2024), using densities of 2403 ± 170 kg m−3 for lava flows, based on an average percentage of vesicles for the erupted lava, 1800 kg m−3 for the cone, and 1200 ± 120 kg m−3 for the tephra blanket (Bonadonna et al., 2022), resulting in a total erupted mass of 5.2 × 10⁸ t. S degassing from the magma is usually estimated from petrological data (the difference between MI and matrix glass S contents), as in the mass balance of Burton et al. (2023) and Dayton et al. (2024) for the Tajogaite eruption. The observed correlation between the TADR and our SO2 volcanic emission fluxes allows us to directly relate the degassed volume to the emitted S mass, with 14.1 ± 1.2 kg of SO2 emitted per “thermal” cubic meter of lava (lava volumes estimated using the radiant flux). We corrected this thermal volume for the tephra volume (blanket and cone), representing ∼ 33 % of the total emitted volume, because this does not participate significantly in the radiant flux. This resulted in 9.4 ± 0.8 kg of degassed SO2 per cubic meter of emitted lava, which converts to 2611 ± 285 ppm of effective S degassing, considering the above density and a correction of the crystal mass fraction (25 % following Dayton et al., 2024). This value is very similar to that obtained by Dayton et al. (2024) using the difference between the S content of inclusions (3062 ± 500 ppm) and matrix glasses (345 ± 53 ppm). Note that the matrix S contents that we present (average 534 ppm; N=52; σ=130 ppm; Table S1 in the Supplement) are consistent with previously published datasets for the eruption (average of 403 ppm; N=438; σ=10 ppm; Burton et al., 2023; Longpré et al., 2025). These data are, nevertheless, substantially higher than the value reported by Dayton et al. (2024). Using these values in the Monte Carlo degassing simulation of Dayton et al. (2024), the full degassing of 0.25 km3 of magma would produce emissions of 1.93 ± 0.21 Mt SO2. This is compatible with the TROPOMI-derived total SO2 emissions (1.81 ± 0.18 Mt).
A possibly unaccounted for repository for initial S in the degassing balance could be rare sulfide droplets, previously described to be present in the eruptive products matrix (Fig. B1; Day et al., 2022; Pankhurst et al., 2022) as well as (more recently) in clinopyroxene (CPx) cores and in magnetites (Andújar et al., 2025). These droplets separated from the silicate melt upon reaching sulfide saturation during a pre-eruptive crystallization episode (Day et al., 2022), as confirmed by our own saturation calculations using the O'Neill (2021) sulfur content at sulfide saturation (SCSS) model (see Fig. B2). Importantly for the sulfur budget, although part of the primitive magma S content, as recorded in MIs, the sulfur that they contain is neither included in matrix glass analyses (as it is physically segregated) nor released as gas during eruption. The sulfide abundance could range between 0.03 vol. % (QEMSCAN quantification in Pankhurst et al., 2022) and 0.066 vol. % (0.001 mass fraction in the crystallizing assemblage in the models of Day et al., 2022). Assuming a density of 4500 kg m−3 (Saumur et al., 2015) and an average sulfur content of ∼ 35 % in the analyzed sulfides (Fig. B1), this range of abundance would represent a potential sulfide cargo in the erupted lava until day 20 (Day et al., 2022) of ∼ 30 to 60 kt of non-degassed sulfur (equivalent to ∼ 60 to 120 kt of SO2). Accounting for this contribution would further improve the agreement between the petrologic budget (1.81–1.87 Mt of SO2) and satellite-based estimates (1.81 ± 0.18 Mt of SO2).
Surprisingly, applying the same approach for the first week of the eruption (LU1 in Bonadonna et al., 2023) encompassing the TROPOMI-derived SO2 emission peak, we observe a mismatch of a factor of 3 between the expected SO2 degassing and that measured by TROPOMI. This arises from the very low thermal lava volume (4.3 Mm3, estimated using the radiant flux and corrected with a factor of 2, as proposed by Plank et al., 2023), which can be due to the transient time required for the surface thermal structure to become steady (Coppola et al., 2016). Alternatively, using the cumulative volume of 43.0 ± 6.1 Mm3 on the 26 September 2021, reported by Belart and Pinel (2022) and derived from multiple Pléiades stereoscopic surveys during the first period of the eruption, and assuming a volume of 15 ± 0.12 Mm3 for the edifice (Romero et al., 2022), we found cumulative SO2 emissions of about 580 ± 66 kt, which is closer to the TROPOMI-derived estimates for this period (about 560 kt).
5.3.2 CO2 mass balance and estimation of the reservoir volume
Applying the same Monte Carlo approach used for sulfur and assuming full CO2 degassing, we estimate that ∼ 4.4 ± 0.8 Mt of CO2 would have been released from the erupted material alone. This is consistent with the estimate of 5.4 ± 1.0 Mt by Dayton et al. (2024). However, plume measurements indicate significantly higher total CO2 emissions during the eruption, amounting to 19.4 ± 1.8 Mt. This discrepancy, combined with the near-constant fluxes throughout the eruption, supports the presence of a CO2-rich fluid phase in the reservoir (Hansteen et al., 1998; Burton et al., 2023) coexisting with a CO2-saturated melt, capable of contributing an additional 15 Mt of CO2. Based on FI densities reported by Dayton et al. (2023), we estimate that this additional 15 Mt of CO2 corresponds to a fluid volume of ∼ 25–17 Mm3 at the pressure of the shallow (deflating) reservoir pressure and at that of the deeper reservoir, respectively.
The ∼ 1 % pressure drop relative to the pressure at the beginning of the eruption observed by Charco et al. (2024) provides an opportunity to derive a first-order constraint on the volume of the deflating reservoir. Assuming this pressure loss is attributed to a volume change due to magma extraction, we can estimate the total volume of “hydraulically” connected magma/mush feeding the eruption.
To estimate the total volume (magma+fluid) extracted from the reservoir, we undertook the following steps:
-
We corrected the eruptive products volume for vesicularity (dense rock equivalent, or DRE, volume, taking a melt density of ∼ 2700 kg m−3 as a reference; see the previous section and Dayton et al., 2024).
-
We added the volume of the magma-filled dike and sill network (as described by De Luca et al., 2022).
-
We corrected for the effect of magma compressibility.
According to Rivalta and Segall (2008), the volume ratios (intrusion/associated reservoir deflation) necessary to estimate magma compressibility range between 1.2 and 7.7. For the Tajogaite eruption, the most likely value is ∼ 5 (reservoir from 10 to 15 km deep, saturation depth >25 km; see Fig. 3 in Rivalta and Segall, 2008). Using such values for correcting our magma volume and adding our extracted (additional) fluid volume estimate allow for the estimation of a total volume (magma + fluids) extracted from the reservoir of ∼ 60 Mm3 (from 45 to 200 Mm3 for the full range of volume ratios). Considering that the extraction of this volume produced the pressure drop in the deflating reservoir, we roughly estimate the volume of magma/mush to equate to at least 6 km3 (4–20 km3 range). This estimate provides a first-order volume of magma/mush that could have been “hydraulically” connected to the surface during the eruption. It includes at least the shallow reservoir but may also encompass deeper zones of the plumbing system if they were effectively connected during the eruptive episode.
5.3.3 Halogen mass balance
Fluorine and chlorine generally have high solubility in magmas and only begin to exsolve at shallow depths, close to the fragmentation level (e.g., Aiuppa et al., 2009). This is likely the case for the 2021 La Palma eruption, where rapid magma ascent (Romero et al., 2022; Bonechi et al., 2024) limited halogen degassing due to kinetic constraints. As a result, the melt retained most of its original halogen content, and the difference between melt inclusions and matrix glass Cl and F contents is hardly resolvable from analytical uncertainty (Dayton et al., 2024). We, thus, assessed the consistency of our fluxes using another approach: estimating the expected Cl and F degassed amounts from the total observed emissions.
The adsorption of halogen-derived salts onto ash surfaces is likely to be a non-negligible sink for hydrogen halides of the volcanic plume (Bagnato et al., 2013) and should be considered in our balance. Thus, we propose a rough estimate of the scavenged halogen mass using the median (and standard error) content of Cl (335 ± 34 ppm) and F (422 ± 49 ppm) from a compilation (N=57) of published lixiviation experiments (Ruggieri et al., 2023; Sánchez-España et al., 2023; Rodríguez et al., 2025) and the mass of tephra emitted throughout the eruption (Bonadonna et al., 2022), including the cone (Civico et al., 2022). We obtain estimates of 31 ± 8 kt HCl and 39 ± 11 kt HF possibly scavenged from the plume, which we need to sum to our measured HCl and HF budgets (49 ± 12 and 13 ± 2 kt of HCl and HF, respectively), giving surface emissions of 80 ± 15 and 52 ± 11 kt for HCl and HF, respectively.
Using the average Cl and F contents in the MIs of Dayton et al. (2024), these emissions can be explained by Cl and F losses of ∼ 195 and 130 ppm from melt, respectively. This is 35 % and 9 % of the initial melt content of Cl and F, respectively. This Cl difference should be resolvable analytically, but the F difference is indeed within the analytical uncertainty of the electron microprobe for volcanic glasses (Rose-Koga et al., 2021) and at the limit of that for the secondary ion mass spectrometry analyses of Dayton et al. (2024). We propose a complementary estimation of the Cl loss from melt using petrological data of the MIs and matrix glasses of the eruption (Burton et al., 2023; Dayton et al., 2024; Longpré et al., 2025). The determination of the amount of Cl degassing from melt is indeed obscured by the magma evolution in the plumbing system, as shown by the bivariate diagram between K2O and the Cl contents (Fig. B3), where the matrix glass Cl contents are consistently higher than those of MIs, impeding simple quantifications by difference as for S balance. In this diagram, MIs define a trend (Pearson's R=0.943) that can be used to estimate the average Cl amount degassed from magma. We find an error-weighted mean Cl content difference between the simulated undegassed magma compositions and the matrix glasses of 189 ± 10 ppm (95 %; N=633; σ=135), within uncertainties of our degassing balance approach. The total HCl emissions that would arise from such degassing from the volume of eruptive products is 77 ± 7 kt, which is indistinguishable from our HCl balance of 80 ± 15 kt within uncertainties. This approach is not possible for F due to significant variability in the MI F contents.
5.4 Potential atmospheric implications of Tajogaite eruption emissions
Volcanic emissions of greenhouse gases and reactive species represent critical inputs for climate models, as they contribute to baseline radiative forcing, perturb the oxidative capacity of both the troposphere and stratosphere, influence aerosol–cloud microphysical interactions, and play a significant role in the geochemical cycling of key elements (such as sulfur, carbon, and halogens) between the Earth's surface and atmosphere (Von Glasow et al., 2009, and references therein). Accurate quantification of these natural fluxes is essential for distinguishing anthropogenic signals from background variability in the atmospheric composition. The Tajogaite eruption provides a striking example of how a single volcanic event can temporarily dominate regional atmospheric budgets. Its SO2 emissions were approximately 15 times greater than Spain's total anthropogenic SO2 emissions for the year 2021 (123 kt; MITECO, 2023) and even exceeded the total EU anthropogenic SO2 emissions for that year (1.4 Tg; EEA, 2023). Assuming a conservative 20 % conversion rate of S to sulfate aerosols (see Sect. 5.1 and Fig. 6), the eruption is estimated to have produced approximately 0.5 Mt of sulfate particles. However, as the plume remained below 8 km of altitude, well within the troposphere, these aerosols were likely short-lived and regionally confined, with a limited potential to affect atmospheric radiation budgets, and a negligible climatic forcing from aerosol loading. In terms of carbon emissions, the CO2 released by the eruption amounted to approximately 10 % of Spain's anthropogenic CO2 emissions for 2021 (https://www.miteco.gob.es/content/dam/miteco/es/calidad-y-evaluacion-ambiental/temas/sistema-espanol-de-inventario-sei-/es-nid-edicion-2025-.pdf, last access: 31 August 2025). Emissions of CO were also substantial, corresponding to about 7 % of the 2021 national anthropogenic CO inventory (1.64 Mt; MITECO, 2023). Halogen emissions were particularly notable. The total atmospheric HCl output was around 10 times higher than the annual UK emissions since 2017 (UK National Atmospheric Inventory) and represented roughly 20 % of total European anthropogenic HCl emissions in 2014 (220 kt; Zhang et al., 2022), which are primarily associated with the energy sector (38 %) and open waste burning (23 %). Similarly, the eruption's HF atmospheric emissions exceeded UK national totals for the same period by an order of magnitude. In contrast to the purely atmospheric pathway, a significant fraction of the halogens were likely scavenged from the plume by ash particles. This process, which accounts for an estimated 31 ± 8 kt of HCl and 39 ± 11 kt of HF, provides a distinct mechanism for their re-entry into the geosphere through ash deposition. Subsequently, these ash-bound halogens are remobilized by initial rainfall events (Medina et al., 2025), where they can enter and be transported through the natural elemental cycles of Cl and F in the soil, aquifer, and marine environments.
Volcanic emissions of chlorine are known to significantly influence tropospheric ozone (O3), as these halogens participate in catalytic cycles that destroy O3, particularly in the presence of sunlight and moisture (Gerlach, 2004). Studying these emissions allows for the assessment of the chemical forcing of volcanoes on the troposphere, the testing of atmospheric chemistry models using real events, and the improvement of our understanding of the climatic and chemical roles of volcanic eruptions, even moderate ones like Tajogaite. In this study, we looked for signs of such an impact in the local O3 total column from FTIR spectroscopy but found no clear evidence. However, Fig. 7 displays the time series of the O3 partial pressure up to 8000 m, retrieved from electrochemical concentration cell (ECC) ozonesonde measurements conducted by AEMET (García et al., 2021) from Puerto de la Cruz, Tenerife. These are shown together with cumulative SO2, HF, and HCl emissions up to 18 November 2021, corresponding to the period with the most continuous and densely sampled flux measurements. A noticeable coincidence was observed between the two sharp increases in the cumulative HCl (and HF) emissions, occurring on the 18 October 2021 and 2 November 2021 and local ozone depletion (with O3 values near zero) at plume altitudes. This coincidence is not observed for low HCl SO2 ratios.
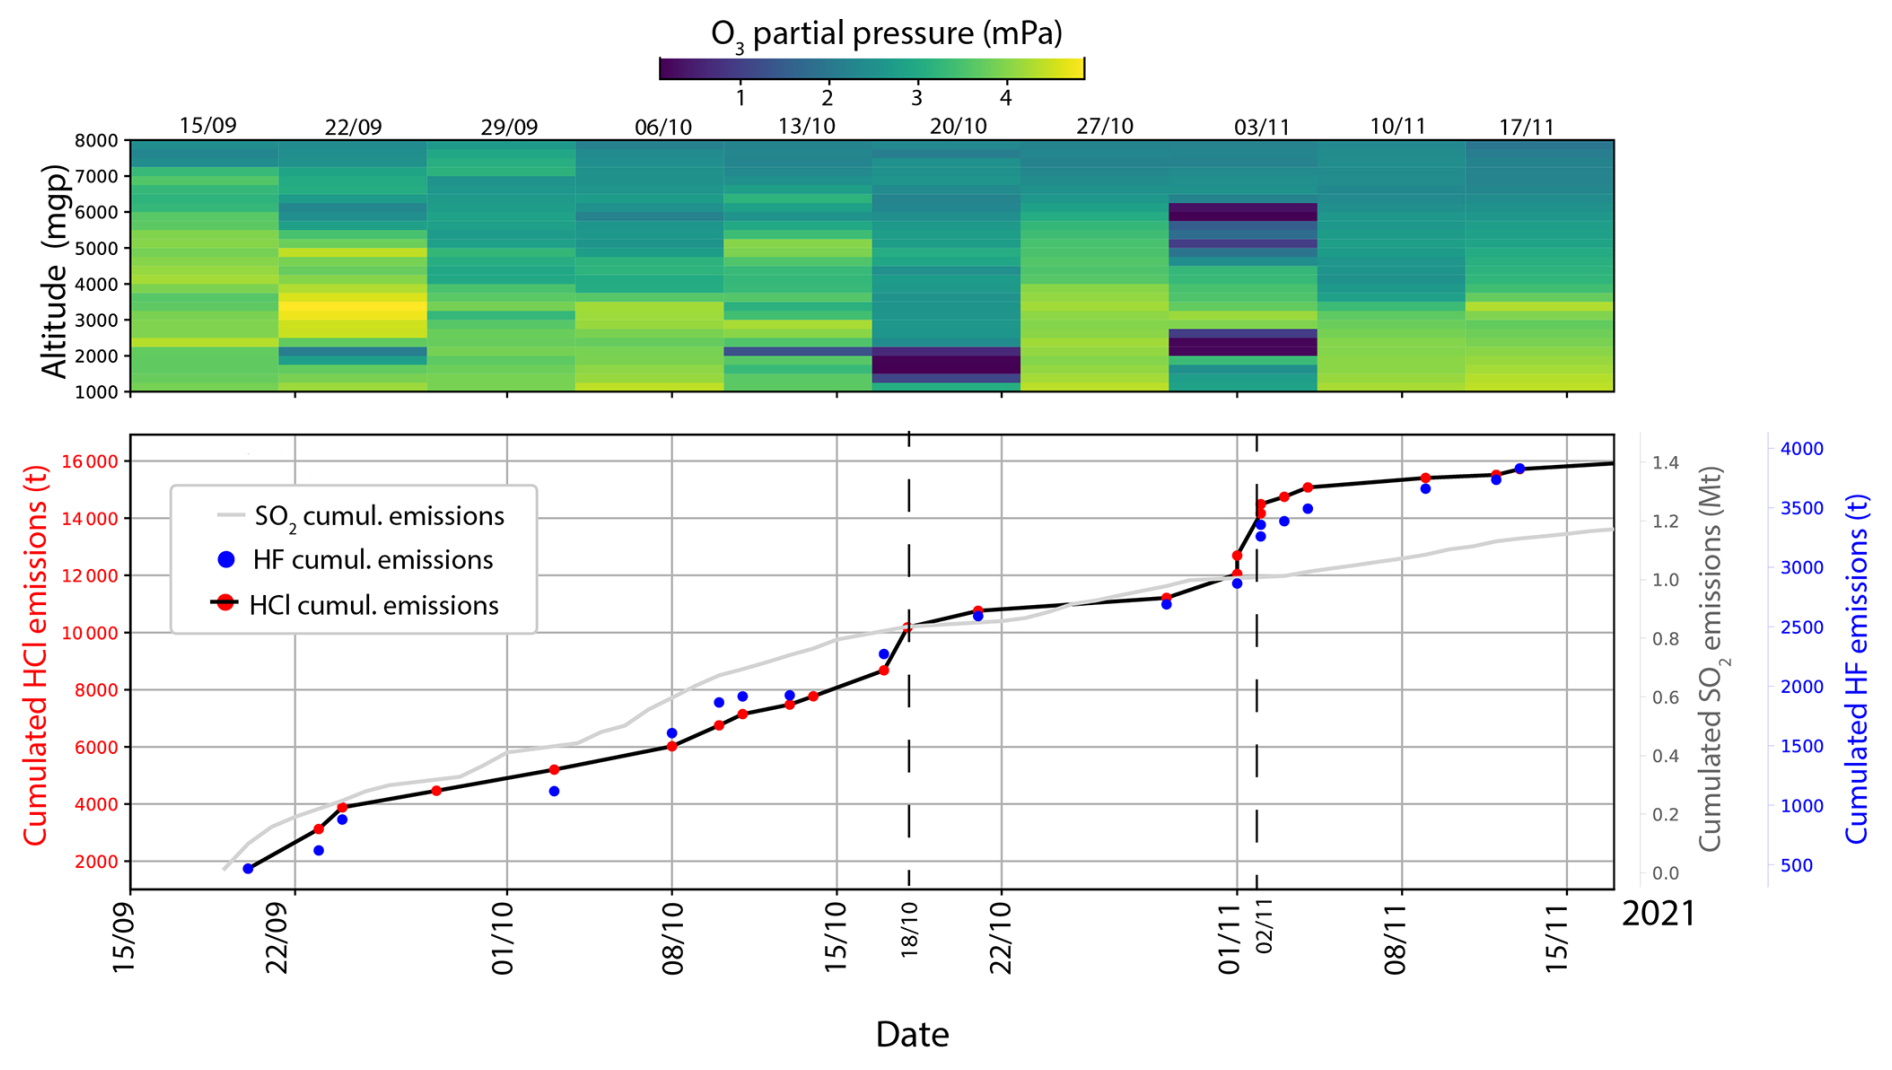
Figure 7Relationship between the partial pressure of O3 at the volcanic plume altitude (from AEMET radiosonde data) and the volcanic gas emissions. SO2, HCl, and HF emissions to the atmosphere are shown as cumulative curves to highlight key temporal variations. The O3 partial pressure is derived from radiosonde measurements conducted at the AEMET Tenerife station.
Although geometric constraints and weather conditions affected the continuity of our cumulative flux estimates, this preliminary observation suggests that halogen-induced O3 loss may occur locally, at least where the plume was present, even if only transiently. The observed O3 loss appears to be short-lived, with concentrations recovering shortly after, arguing against a persistent or widespread effect. To better assess the intensity and duration of this impact, more continuous time series and refined flux retrievals are required. Nonetheless, this initial evidence from the Tajogaite eruption provides a valuable basis for future investigations.
In this study, we explored the variability in the chemical composition of the Tajogaite eruption volcanic gas plume by combining ground-based FTIR and UV direct-sun measurements with surface gas observations at two sites: Fuencaliente, on La Palma, and the high-altitude Izaña Atmospheric Observatory (IZO), a reference station for atmospheric studies located on Tenerife. New retrieval methods are presented to derive the HF and HCl volcanic contributions in the total columns obtained from the solar FTIR spectra for both low-spectral-resolution (EM27/SUN) and high-spectral-resolution (IFS-125HR) measurements performed up to 140 km from the eruptive fissure. The good agreement between the different products (total columns and ratios) obtained from the different instruments (FTIR, DOAS, and surface measurements) demonstrates the robustness of our results, even at such distant and low-concentration locations as IZO (140 km away). Our compositional ratios measured during the eruption are also consistent with the sparse data reported in the literature (Asensio-Ramos et al., 2025; Ericksen et al., 2024; Burton et al., 2023), including for previous basaltic eruptions in the world (e.g., Aiuppa et al., 2009). We derived SO2 volcanic emission fluxes from the TROPOMI data and assessed the long-term variability in the emission fluxes of the other volcanic species, based on our compositional data. We found total emissions of CO2, SO2, HCl, HF, and CO of 19.4 ± 1.8, 1.8 ± 0.2, 0.05 ± 0.01, 0.013 ± 0.002, and 0.123 ± 0.005 Mt, respectively. These emissions were found to be non-negligible in the annual Spanish national and European inventory balance compared to anthropogenic emissions. Furthermore, while the SO2 and halogen halide emission fluxes decreased throughout the eruption along with the lava emission fluxes, the CO2 emission fluxes were found to be almost constant, implying a comparatively increasing discharge with respect to the daily emitted lava volumes. This is consistent with a significant amount of CO2 being already exsolved in the reservoir, as previously observed by Burton et al. (2023), Dayton et al. (2023), and Dayton et al. (2024). Global degassing balances were performed for C, S, Cl, and F, showing a good consistency between the plume measurements and the petrological data. This study highlights the potential of employing existing global atmospheric FTIR, DOAS, and surface measurement networks to remotely explore (>100 km) the variability in volcanic plumes' chemical composition and its implications at different timescales. By demonstrating their effectiveness with respect to tracking volcanic emissions in real time, our findings underscore the value of these networks for both operational volcano monitoring and scientific investigations during and after eruptive crises. Such measurements are crucial for assessing the role of volcanic emissions as natural sources in the global cycling of carbon, sulfur, and halogens. This study emphasizes the value of solar absorption measurements for volcanology, atmospheric research, and air quality monitoring during eruptions and suggests their potential application during major eruptions, even when access is more restricted.
Appendix A provides a summary of the comparison of the standard NDACC FTIR HCl and HF products with those developed in this study (Fig. A1) and the new IFS-125HR SO2 retrievals (Fig. A1c) as well as the comparison between all the IFS-125HR and EM27/SUN products (Fig. A2). As illustrated by the comparison (Table A1), the standard and optimized approaches show excellent agreement under background conditions with a mean bias of approximately 3 % and 15 % for HCl and HF, respectively, while the scatter is limited to 4 % for both trace gases. These values fall within the expected uncertainty estimations of the IFS-125HR products (García et al., 2021). However, for volcanic emissions, the NDACC approaches, in contrast to our optimized approach, are not able to capture the volcanic HCl and HF contributions in the lower/middle troposphere, resulting in a mean difference of 88 % and 100 % for HCl and HF, respectively. Column enhancements as large as 6.00×10²⁰ and 2.05×10²⁰ molec. m−2 for HCl and HF, respectively, were reported during the volcanic process, which accounts for the high variability observed between mean, median, and scatter values under volcanic emissions.
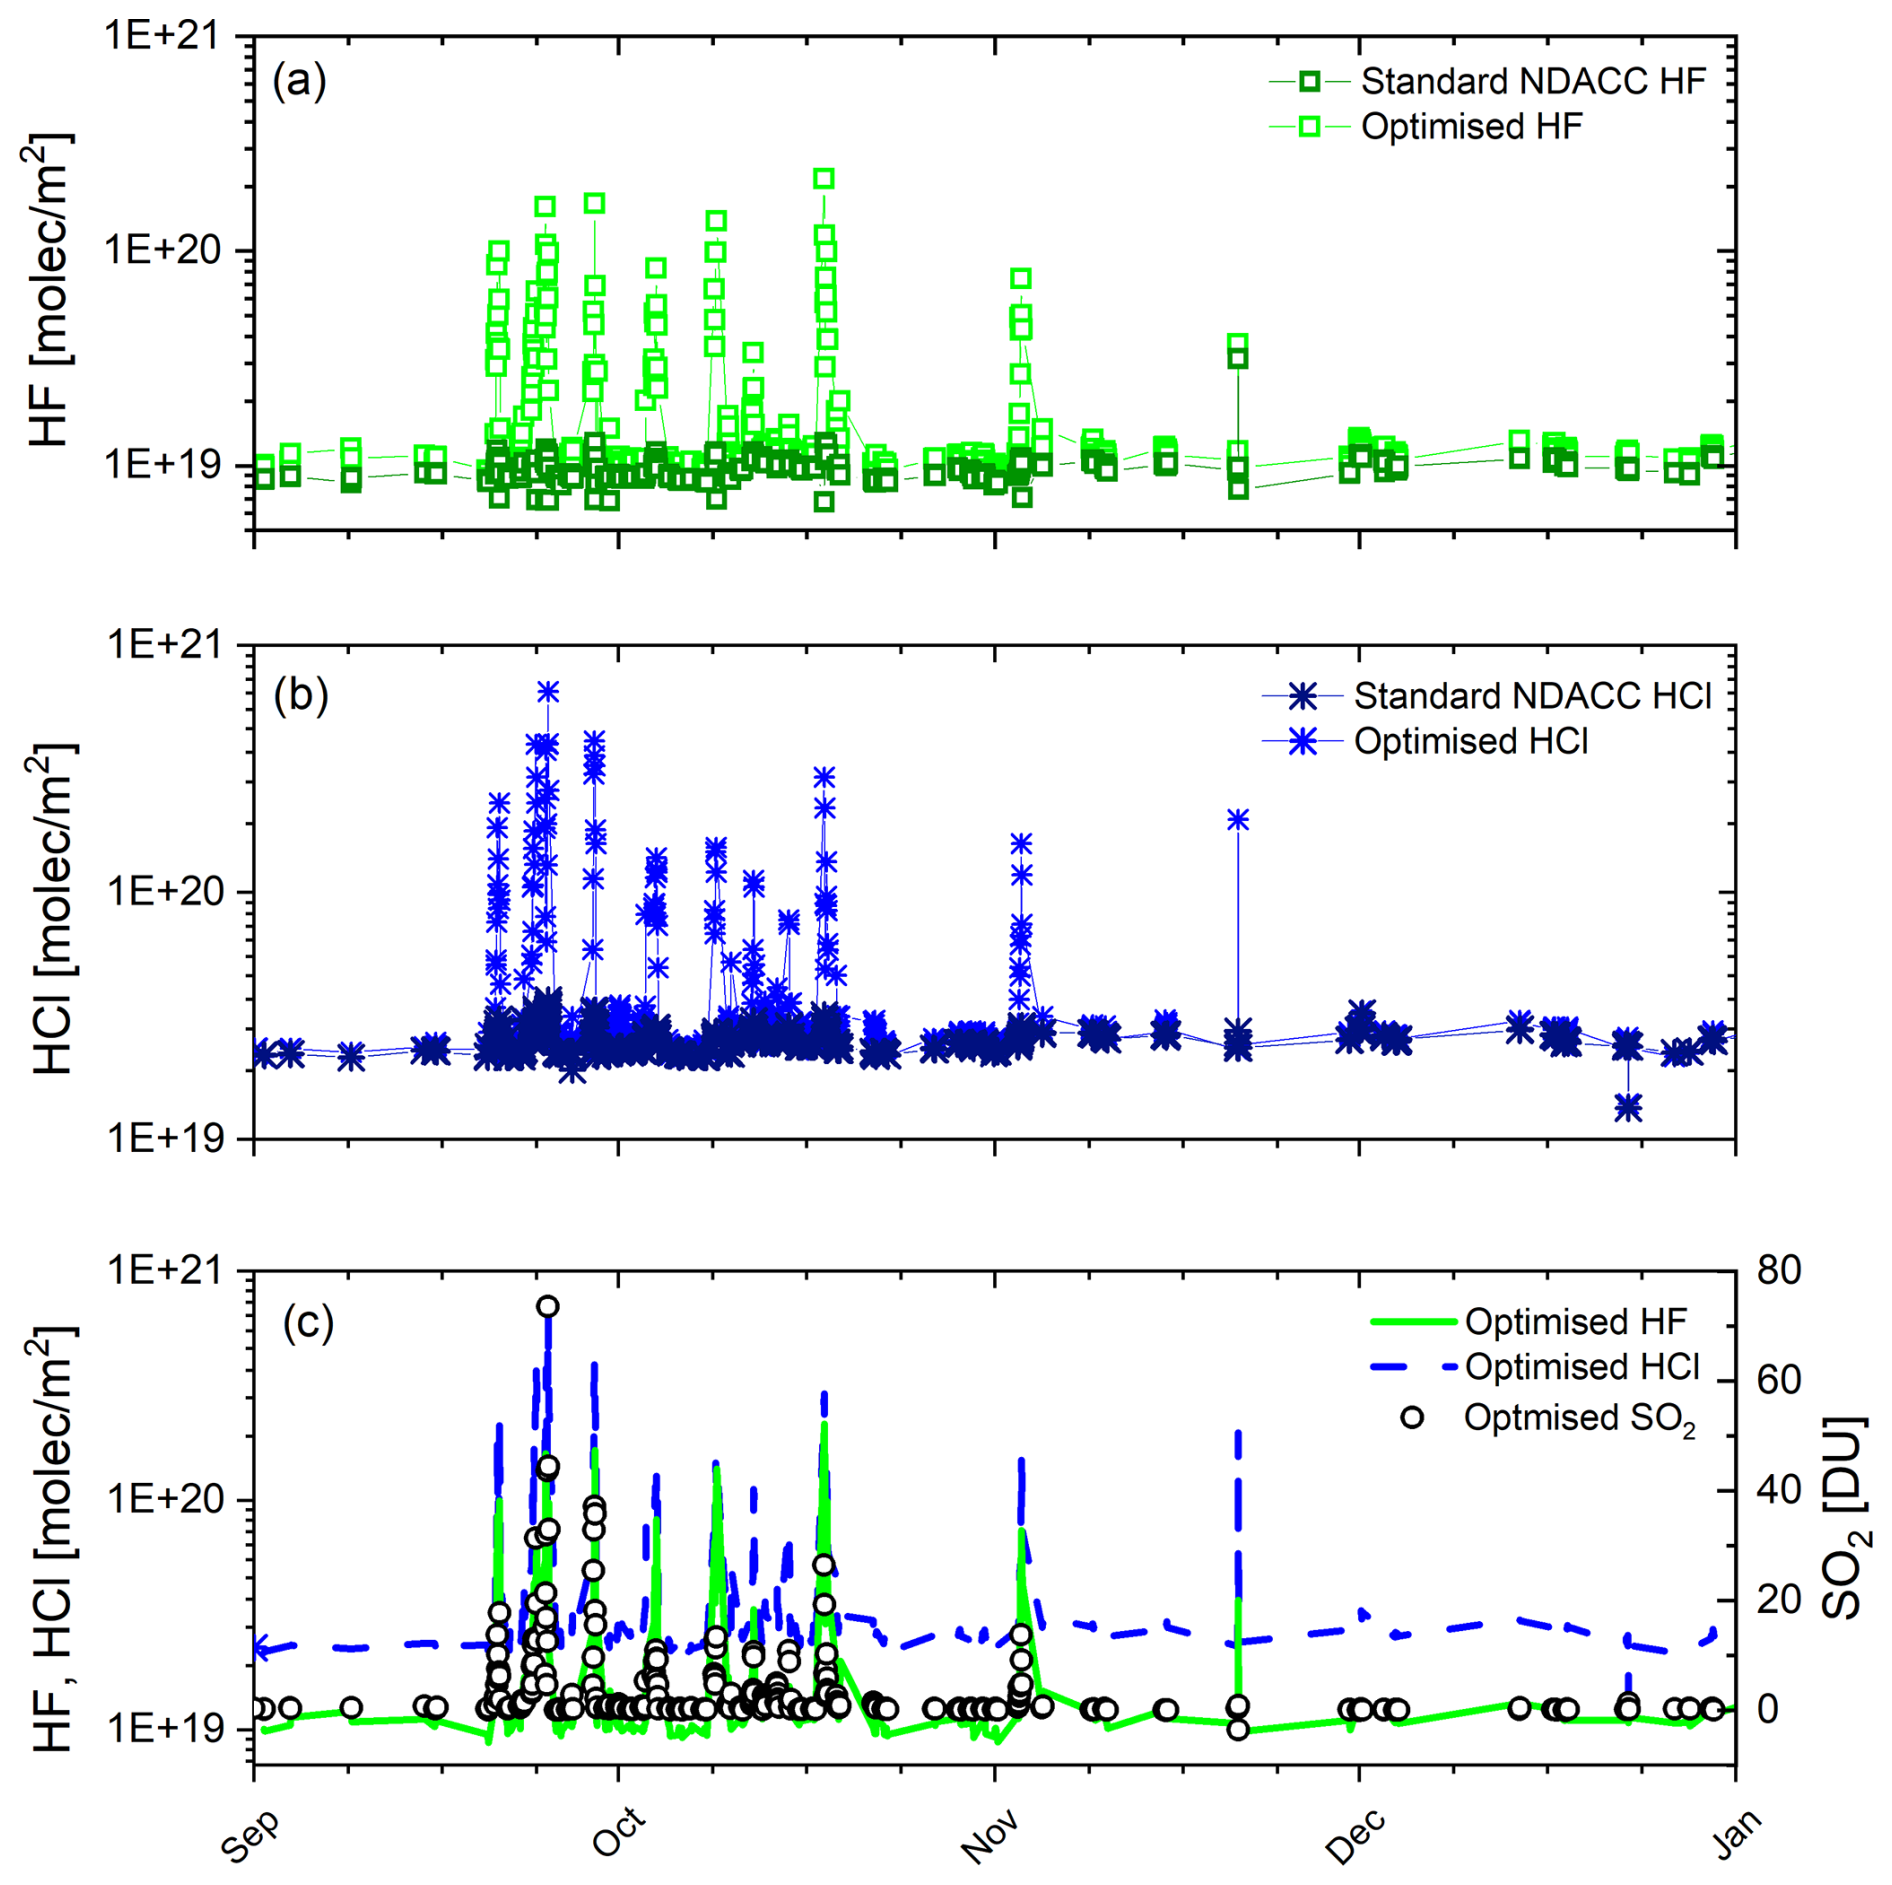
Figure A1Time series of the standard NDACC and optimized HF (a) and HCl (b) total column amounts measured at IZO from the IFS-125HR instrument between 1 September and 31 December 2021. (c) Time series of the optimized HF, HCl, and SO2 IFS-125HR products at IZO for the same period.
Figure A1 also presents the SO2 total column amounts retrieved from the IFS-125HR measurements at IZO. The excellent agreement found between the SO2, HCl, and HF retrievals consistently capturing volcanic plumes probes the reliability and quality of the optimized IFS-125HR products, which has also been documented by side-by-side Pandora and FTIR SO2 observations (Taquet et al., 2023). As found for the NDACC FTIR sites of IZO and ALTZ (Altzomoni, Mexico) (García et al., 2022), the Pandora and FTIR comparison shows an excellent correlation for the whole SO2 range observed (Pearson's correlation coefficients larger than 0.99), and the scatter between techniques is comparable to the background signal (less than 0.7 and 2.0 DU for IZO and Altzomoni, respectively). For further details about SO2 IFS-125HR retrieval, the reader is referred to García et al. (2022).
Table A1Summary of the comparison between the standard NDACC and optimized HF and HCl total column amounts measured at IZO from the IFS-125HR instrument for the periods (1) between 1–15 September and 1–31 December 2021, under background conditions, and (2) between 19 September and 31 November, affected by volcanic emissions. N stands for the number of measurements, while STD corresponds to the standard deviation of the data distribution.
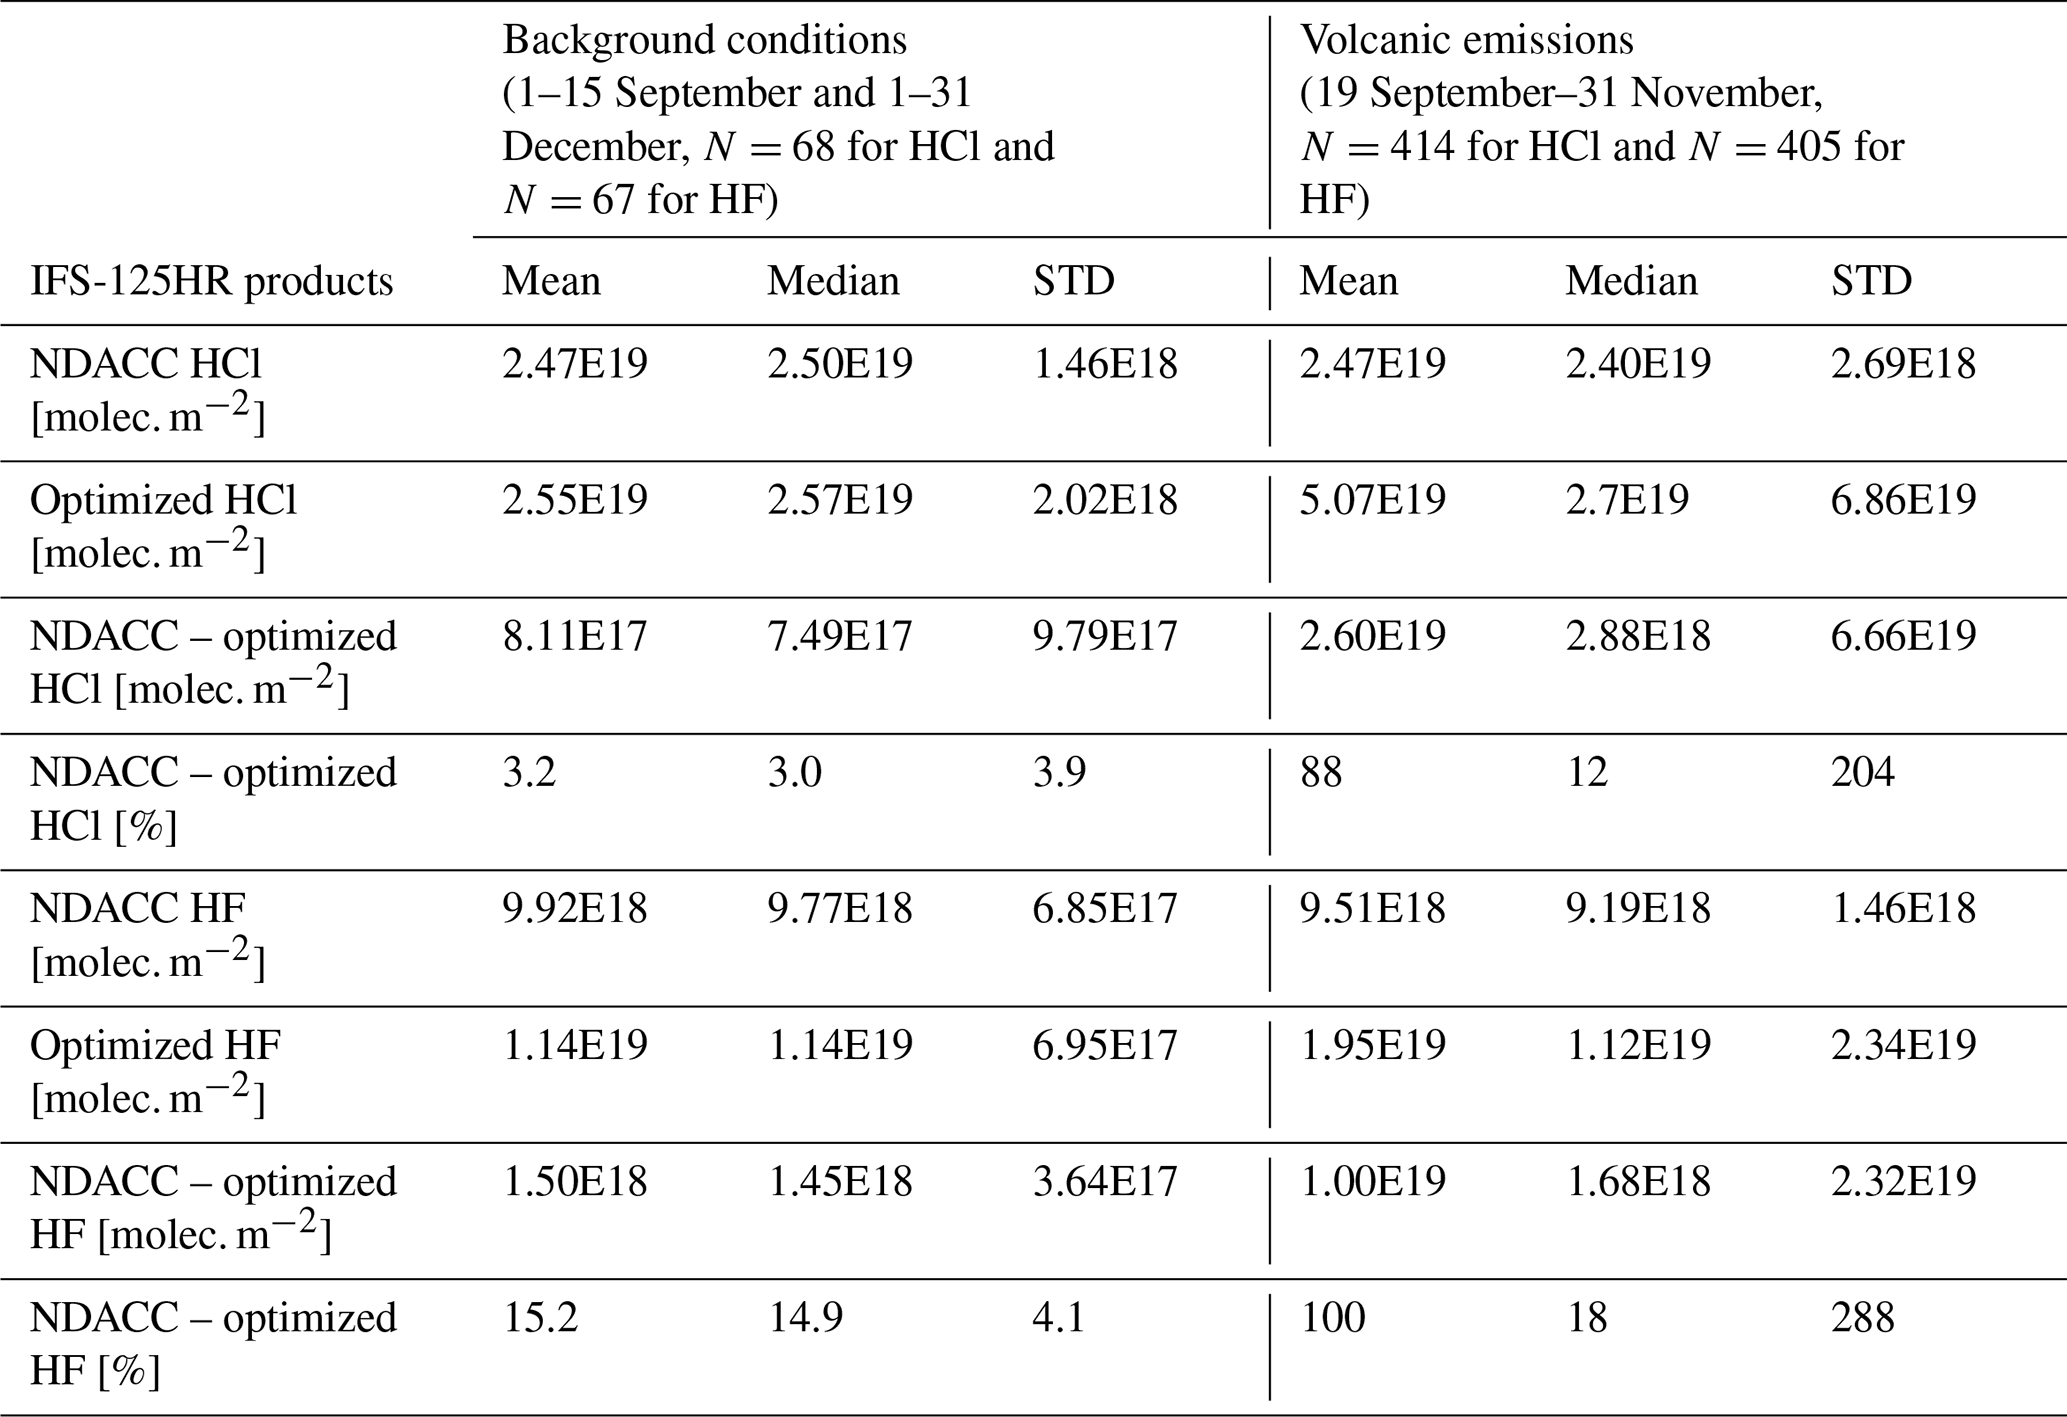
Figure A2 shows the comparison of the new HCl and HF products (HCl_v2 and HF_v2, respectively) derived from the EM27/SUN measurements and those (HCl_v1 and HF_v1) estimated using the same retrieval as Butz et al. (2017) with the new products derived from the IFS-125HR measurements at IZO. Fit parameters are presented in Table A2. An excellent correlation was found for the newly developed EM27/SUN products (HCl_v2 and HF_v2), highlighting the improvements in the retrieval methods, especially in case of distant measurement sites.
Determination of CO2 and CO volcanic contribution
CO and CO2 analysis from the total column measurements require the simulation and removal of the background concentration. Figures A3 and A4 show the procedure that we employed for this study, using two examples from the FUE and IZO dataset. The time series is first detrended from the annual cycle, using IZO long-term time series and a third-degree polynomial. The intraday variability in the CO2 background is then simulated using the average of the XCO2 intraday time series from spectra without the volcanic plume contribution. The background contribution is simulated for each day, fitting an offset. An example of the total procedure is illustrated in Figs. A3 and A4 for CO2 and CO, respectively. The simulated background at FUE (in red) was compared with IZO measurements (in blue) when it was not affected by the volcanic plume. The resulting intraday time series of ΔXCO2 (Fig. A3c and d) and ΔXCO (Fig. A4c and d) in the presence of the volcanic plume are well correlated with the ΔHCl, which can be considered to be a tracer of the volcanic plume.
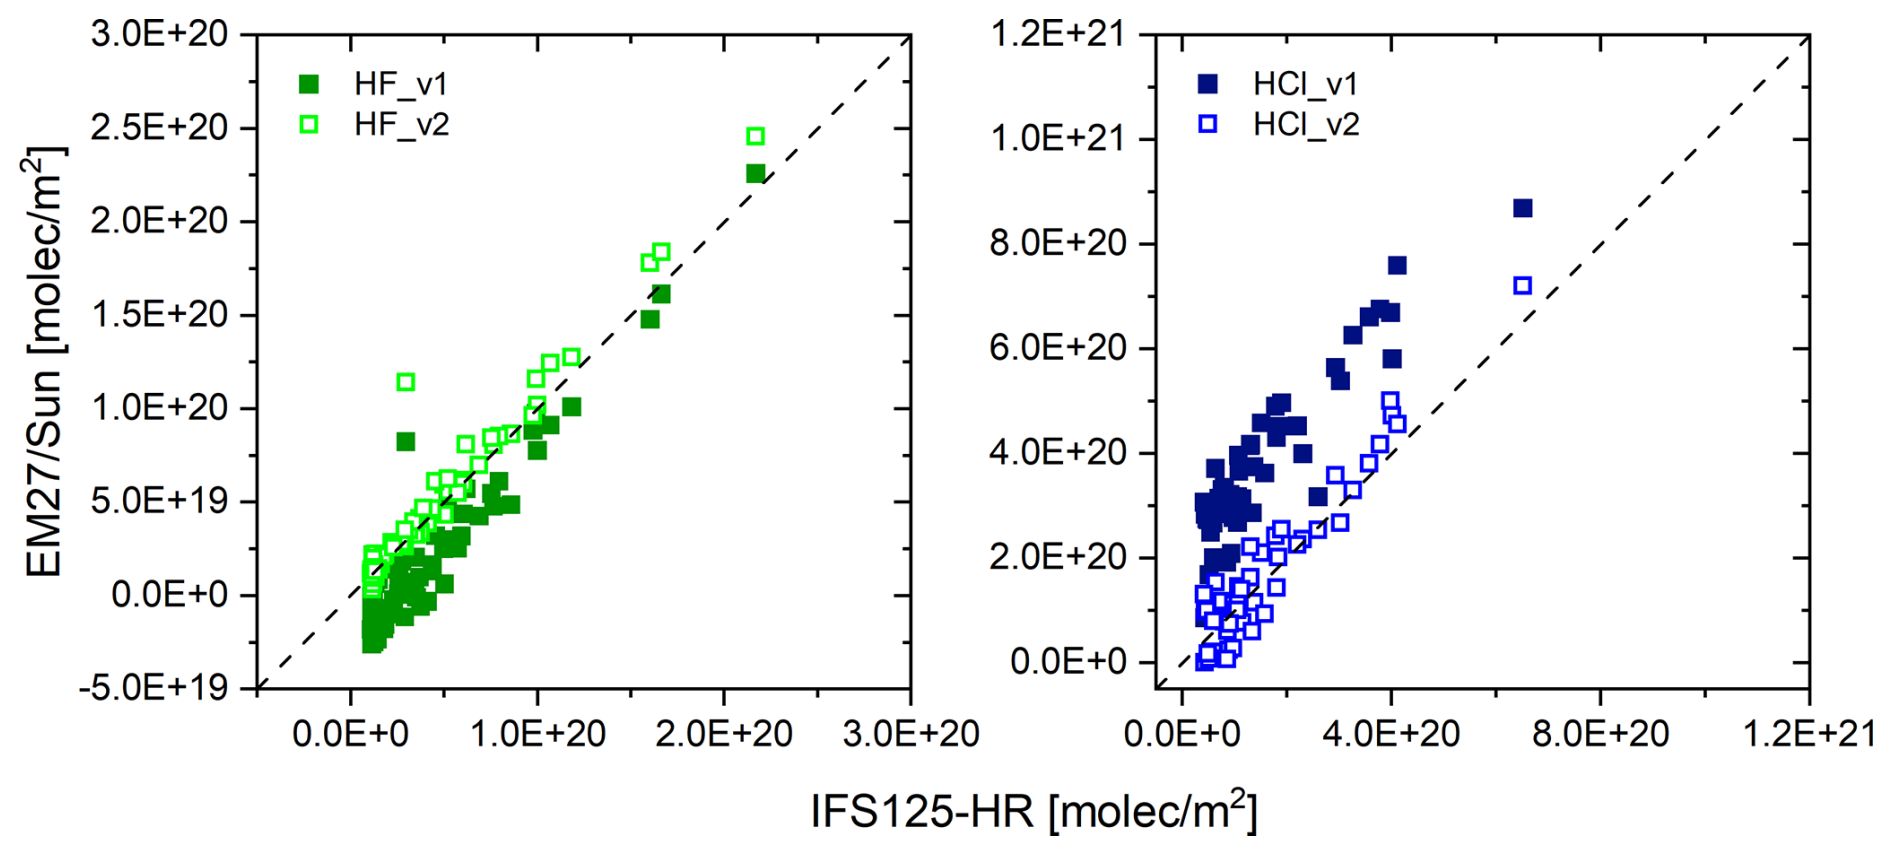
Figure A2Intercomparison between the IFS-125HR and EM27/SUN HF and HCl total columns obtained from side-by-side measurements during the Tajogaite eruption. The diagonal (y=x) is plotted as a dashed line. The fit parameters from linear regression are given in Table A2. “HF_v1” and “HCl_v1” correspond to the products obtained using the same spectral windows as used in Butz et al. (2017), while “HF_v2” and “HCl_v2” are the new products developed in this study.
Table A2Fit parameters obtained from the linear regression between the EM27/SUN HF and HCl products and those from the IFS-125HR.
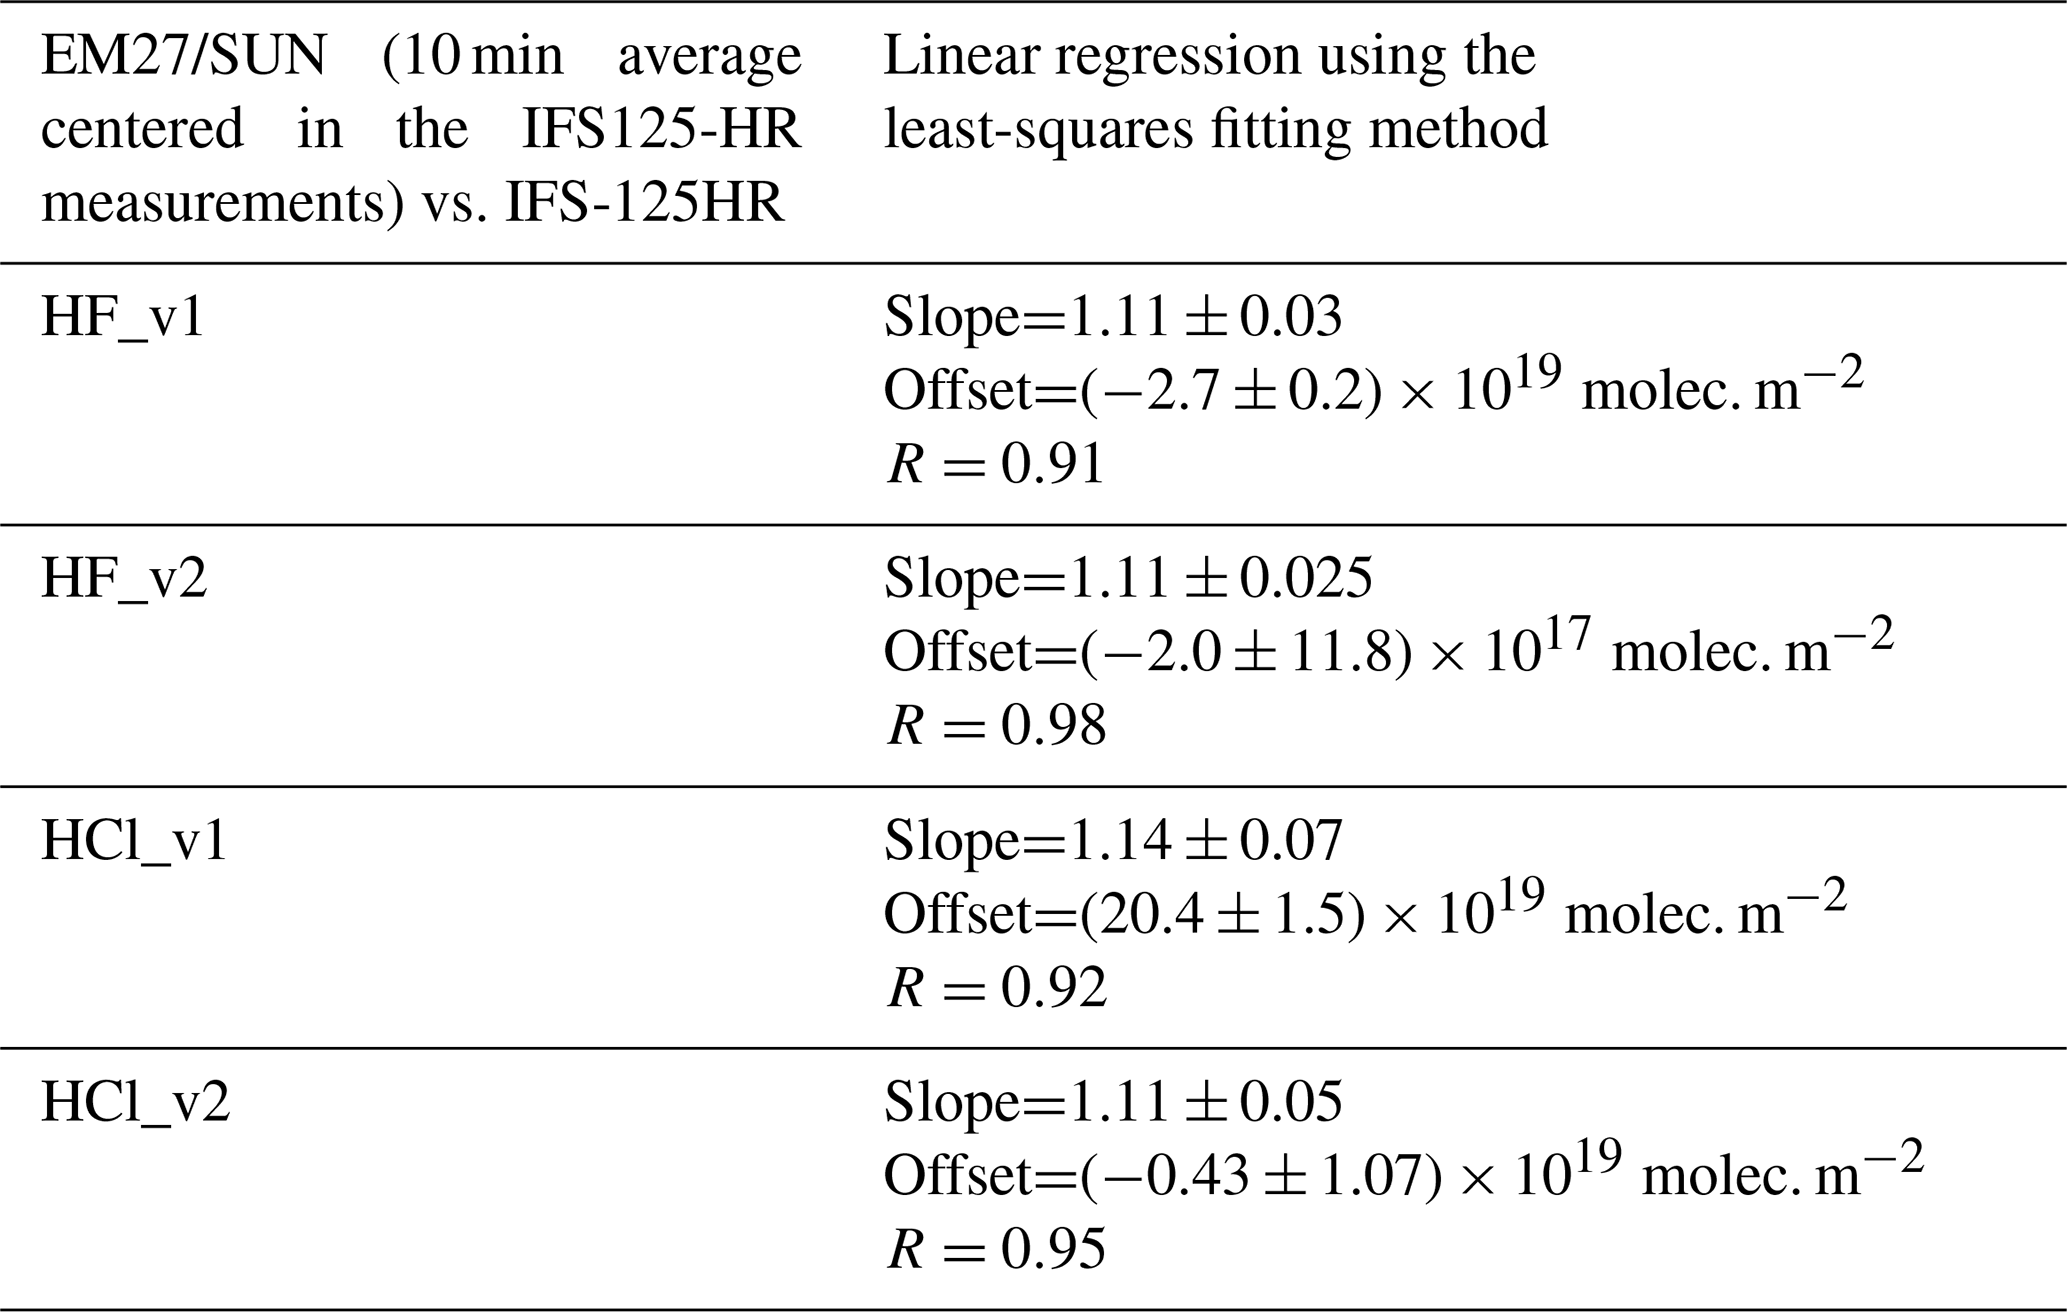
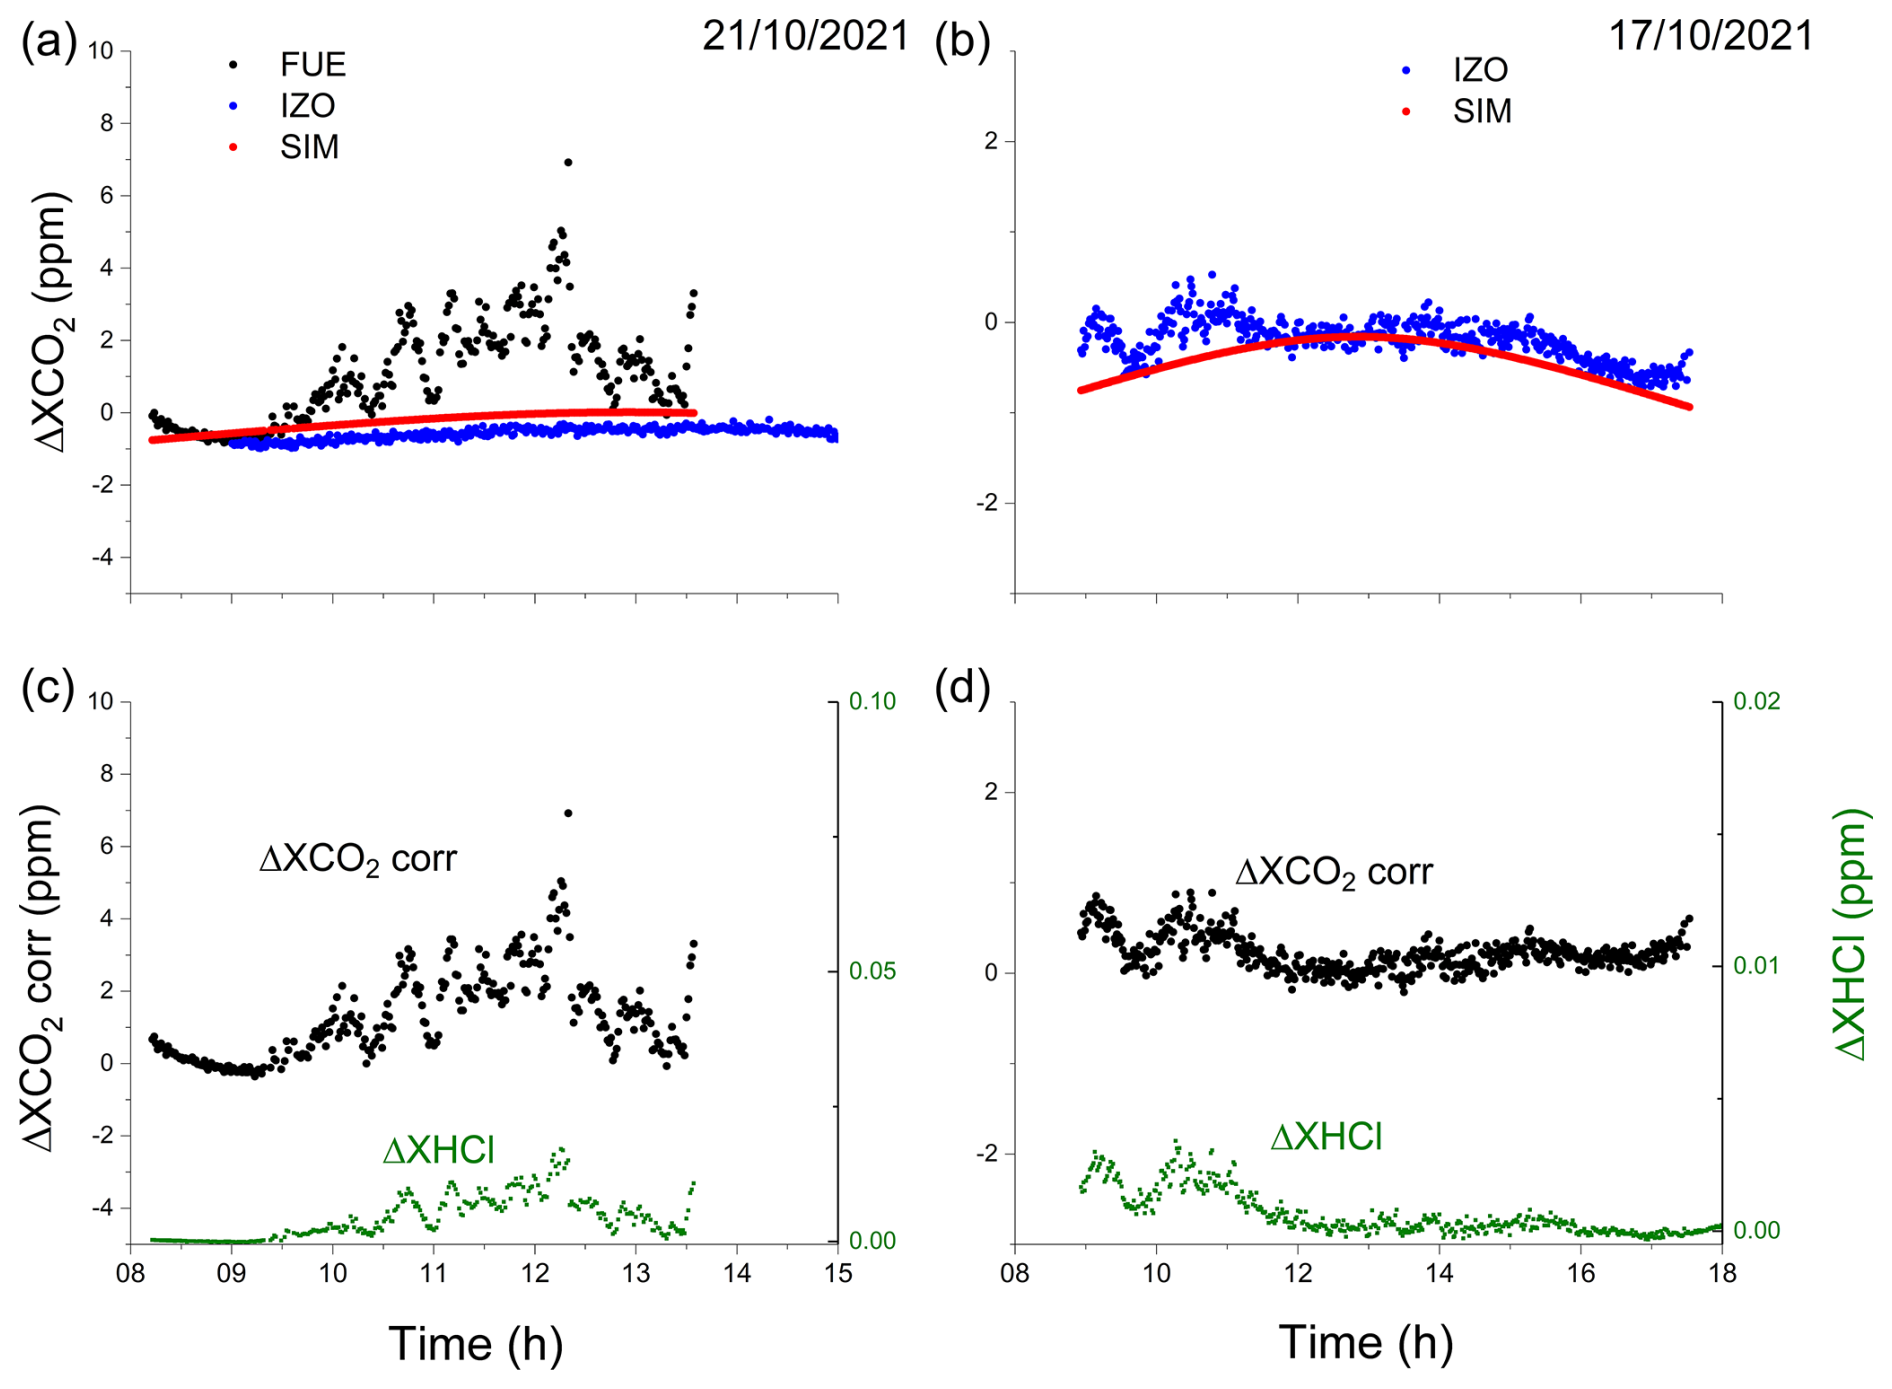
Figure A3Procedure for removing the atmospheric background contribution to estimate the CO2 and CO abundance in the volcanic plume. Panels (a) and (b) show a typical example of uncorrected ΔXCO2 at FUE (in black) and IZO (in blue) and the corresponding simulated background (red). The background simulations (in red) obtained using the average diurnal pattern without the presence of the volcanic plume and adjusting offset is compared with the measurements taken at the IZO station (blue) on the same day. The corrected ΔXCO2 is presented in black in panels (c) and (d) concurrently with the ΔXHCl, which can be considered to be a tracer of the volcanic plume.
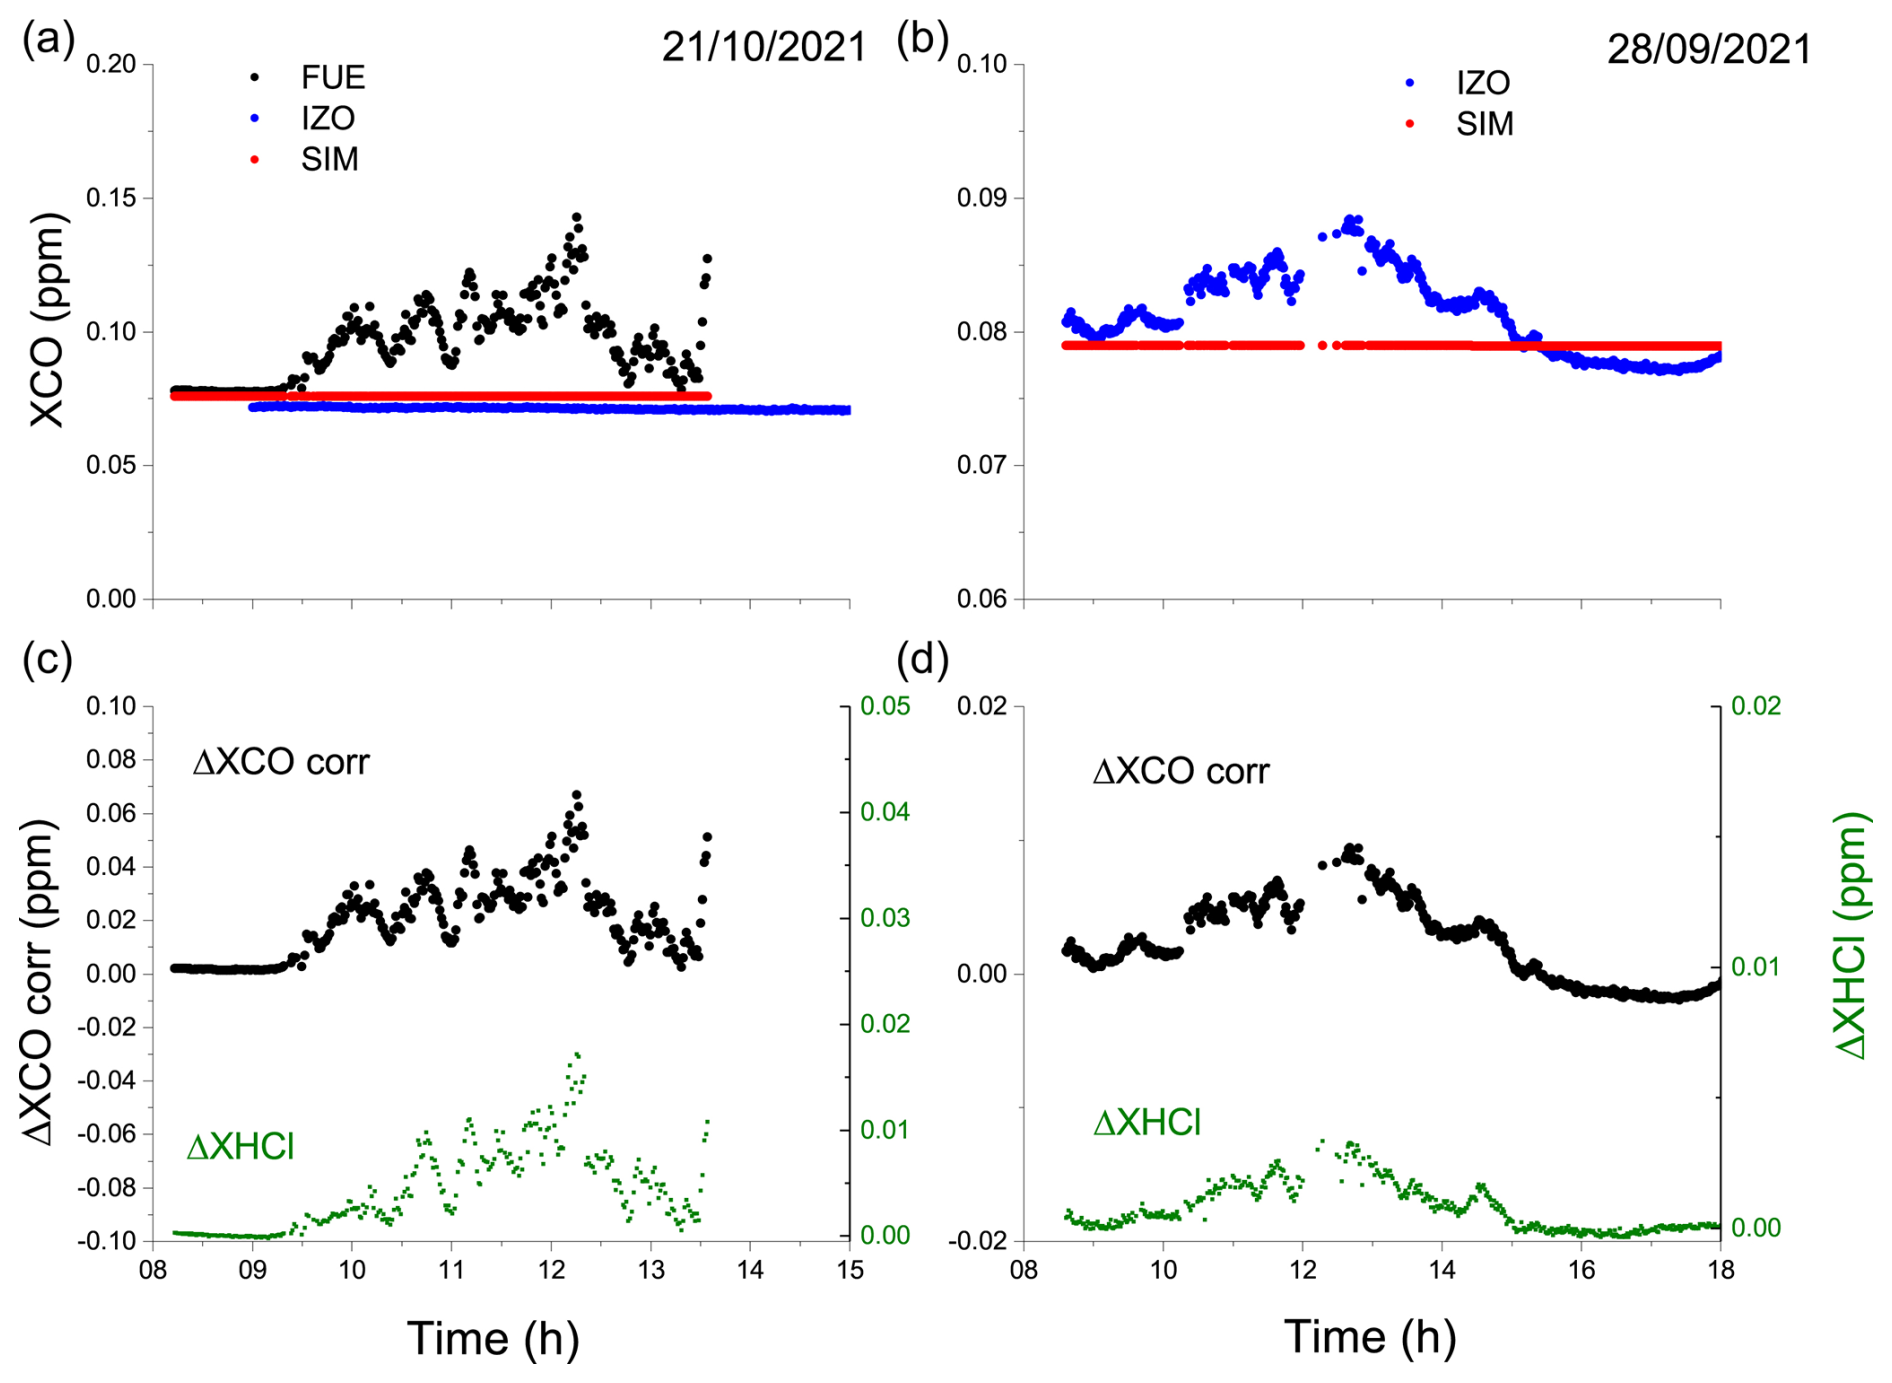
Figure A4Same as Fig. A3 but for CO. For CO, the procedure only consisted of removing the long-term trend, estimated from the long-term IZO daily average time series.
Appendix B presents the tephra compositions acquired with a scanning electron microscope and electron microprobe and elements of the petrologic approaches used in for the estimation of the volatile emissions.
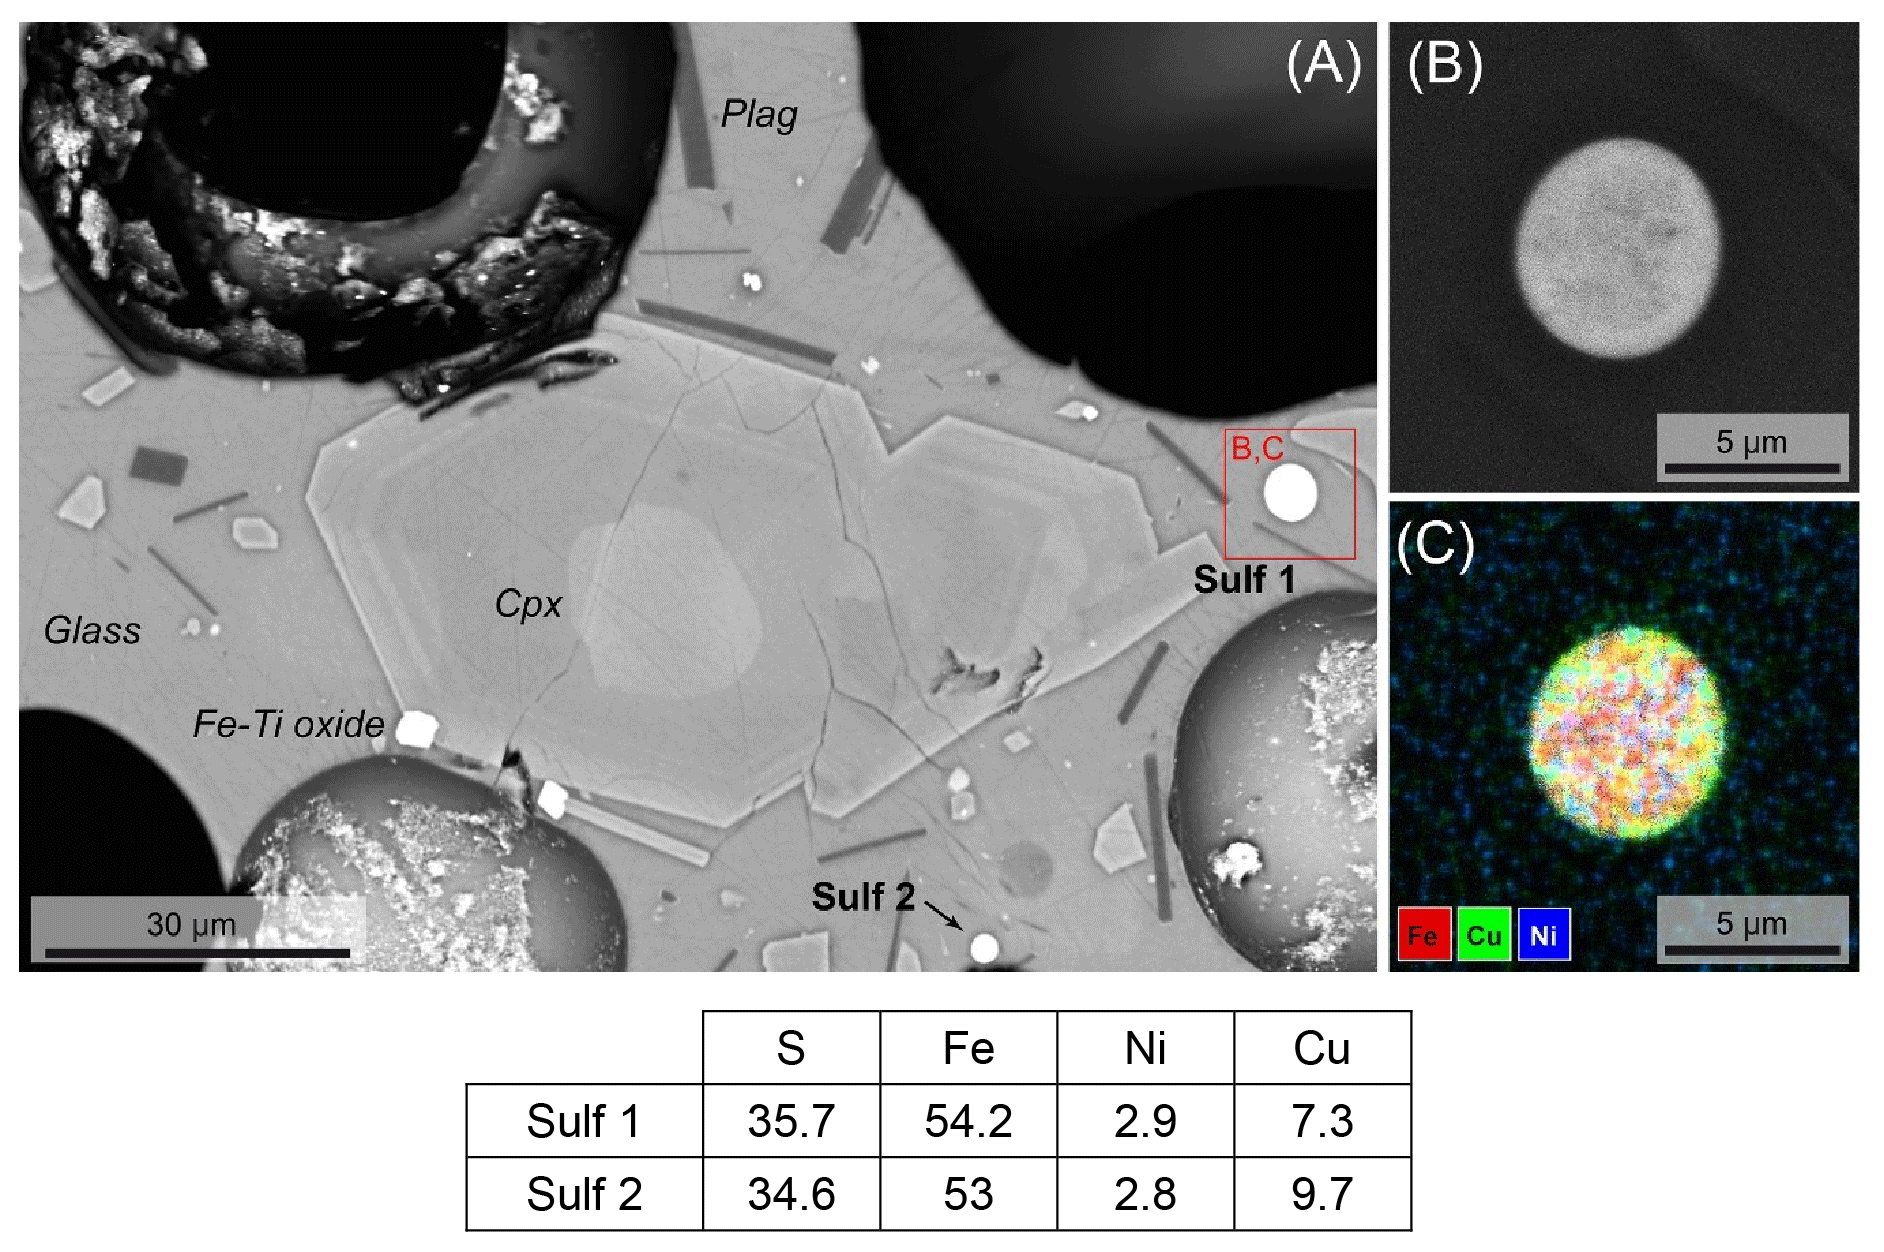
Figure B1(a) Backscattered-electron (BSE) image of a section of LM-2309 tephra sample (González-García et al., 2023) displaying two sulfide droplets (Sulf1 and Sulf2). (b) A detailed BSE image of Sulf1 and (c) an EDX compositional map of Sulf1, showing zoning in Fe–Cu–Ni sulfides. The images were acquired using (a) a JEOL JSM-7610F gun emission scanning electron microscope operating at 15 kV (IESW, Hanover) (a) and a TESCAN Vega 4 operating at 20 kV with EDX Bruker detectors (UCM, Madrid) (b, c). The table below shows their compositions (in wt %), determined by energy-dispersive spectroscopy with a Cameca SX-100 electron microprobe (University of Bremen).
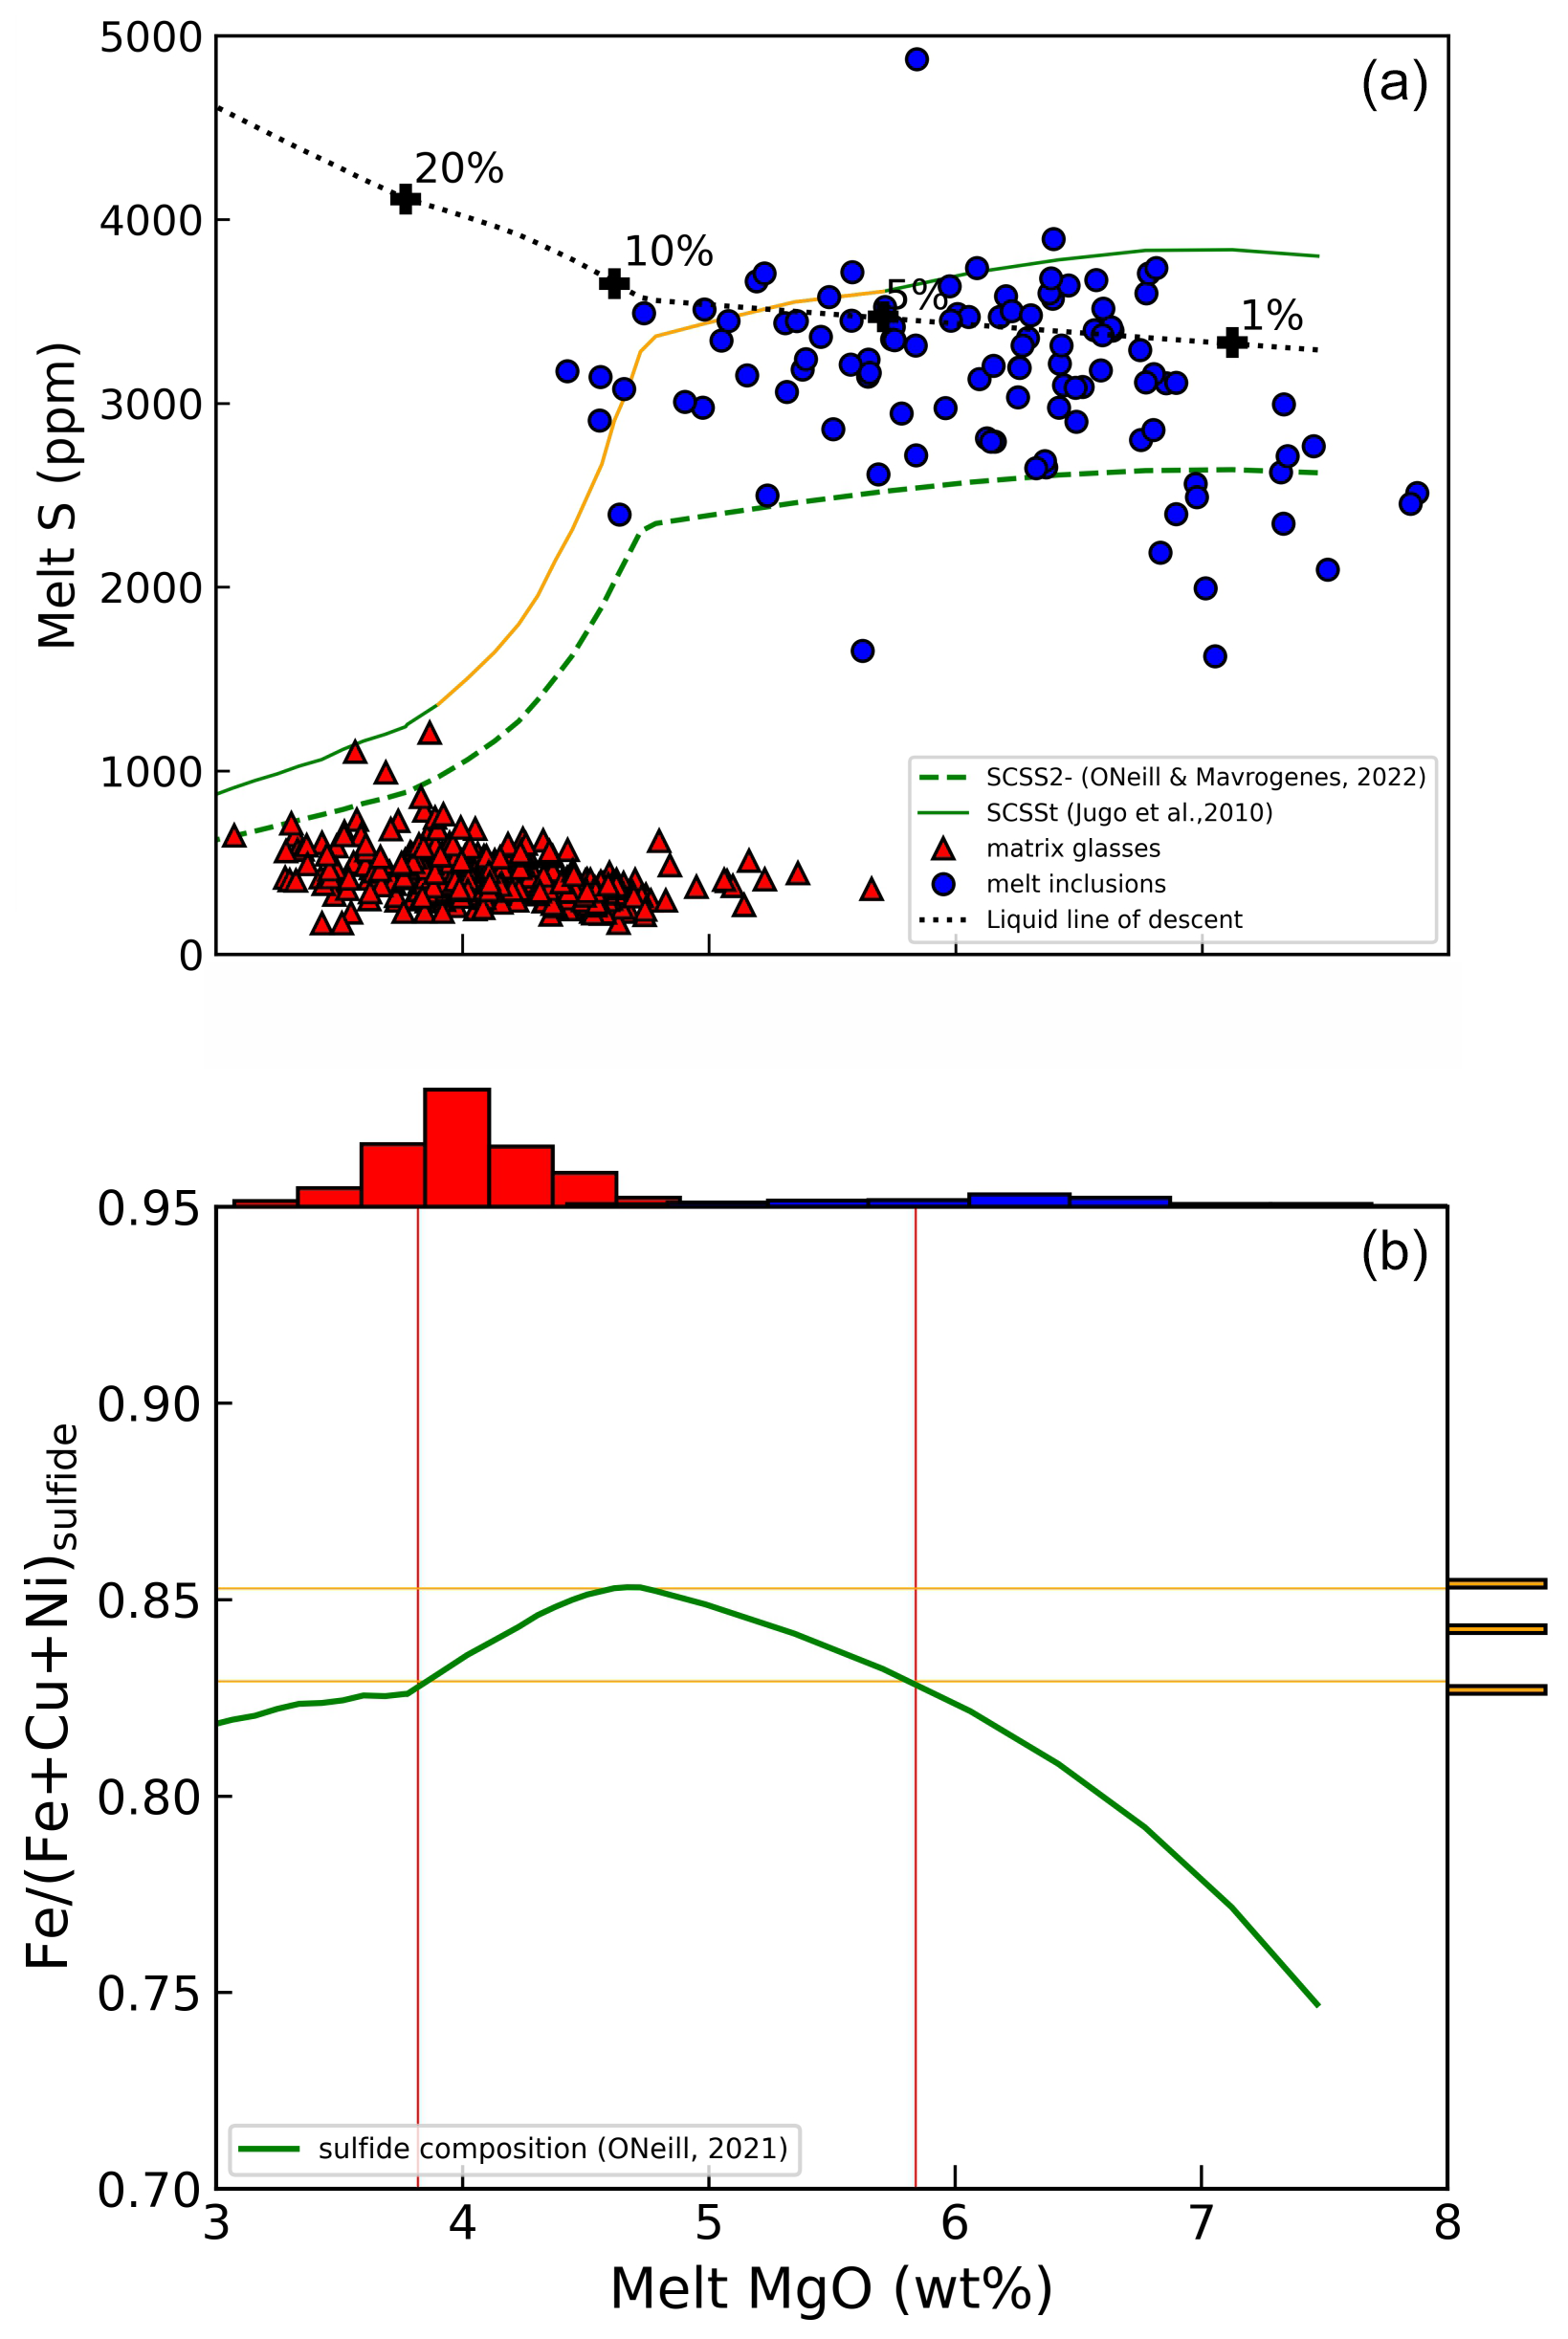
Figure B2The upper panel shows the results of the sulfur content at sulfide saturation (SCSS) calculations performed using the model of O'Neill (2021) implemented in the open-source Python 3 tool PySulfSat (Wieser and Gleeson, 2023). The starting composition is one of the most primitive MIs of the literature dataset for the eruption (LM0 G29; Dayton et al., 2024), to which a Petrolog3 (Danyushevsky and Plechov, 2011) crystallization model (with olivine ± clinopyroxene + spinel as the crystallizing phase, following Day et al., 2022) is applied at a magma stalling at 3.5 kbar and an fO2 buffer of NNO+0.4, following Andújar et al. (2025). Given these conditions, the melt is expected to contain a significant proportion of sulfur as sulfate (S6+), rather than sulfide (S2−). Therefore, we used the SCSSt model of Jugo (2009), which accounts for mixed sulfur speciation, to evaluate saturation. Only a few inclusions slightly exceed the SCSSt curve, consistent with the rarity of sulfide globules in the eruptive products and with the interpretation that sulfide saturation was only reached locally or after some crystallization (Day et al., 2022). The bottom panel shows the modeled composition () of the sulfide phase precipitating along the liquid line of descent, which is matching the measured compositions between ∼ 4 and 5.8 wt % MgO (after 5 %–15 % crystallization). This range is reported as the orange portion of the liquid line of descent in the upper panel.
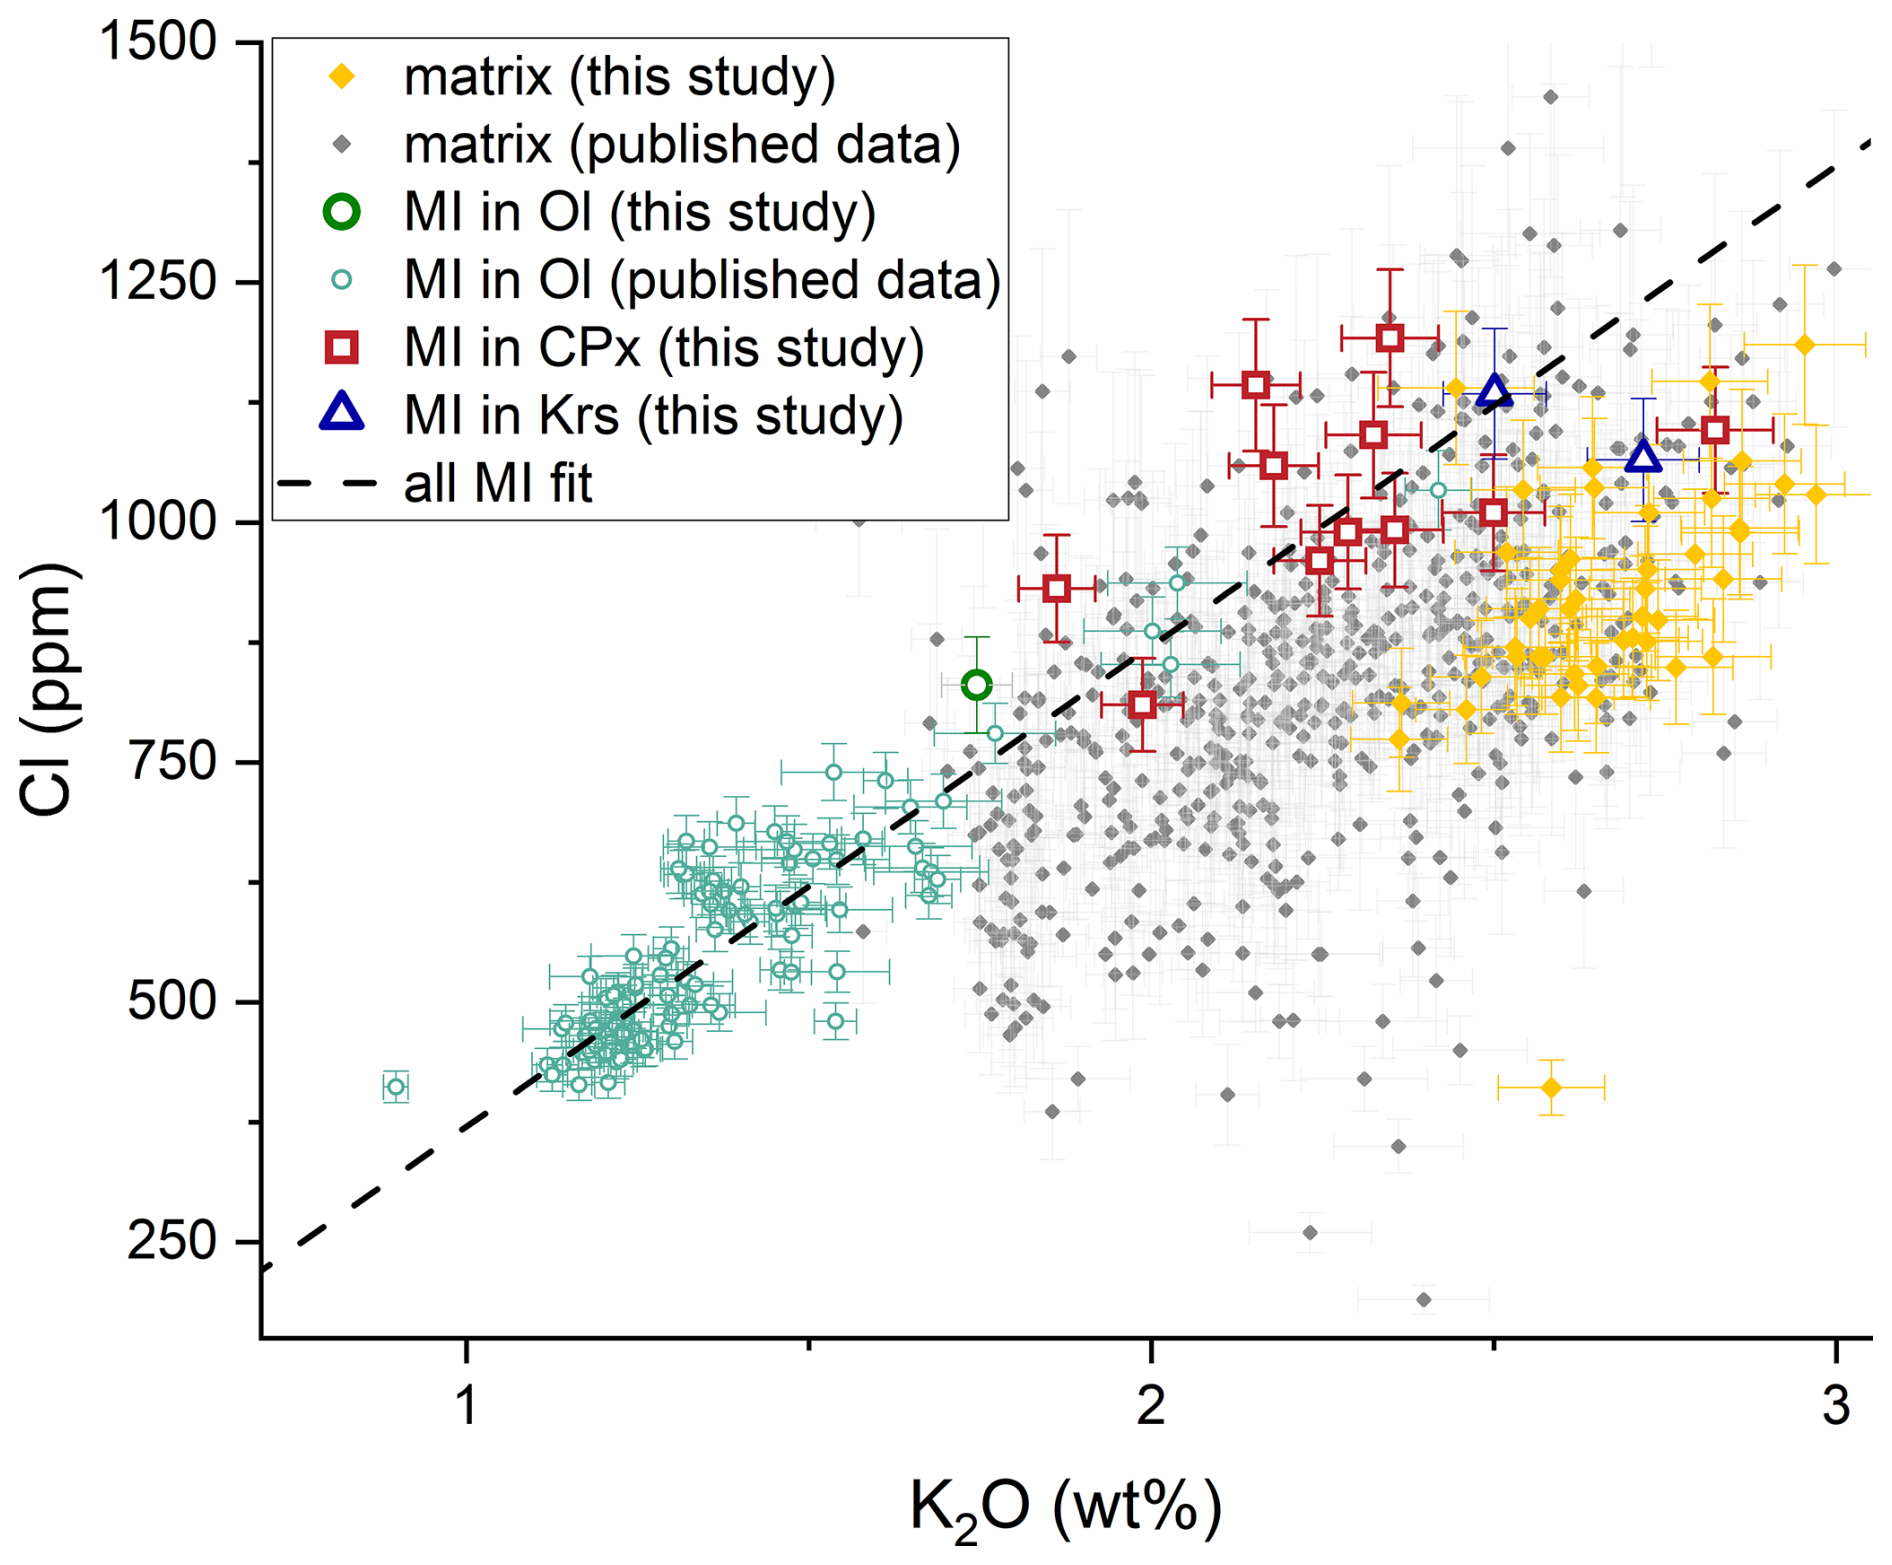
Figure B3New and previously published Cl content in MIs (hollow green circles) and matrix glass (orange diamonds) with melt evolution, represented by the incompatible K2O. MI compositions are from this study, Burton et al. (2023), and Dayton et al. (2024). Ol stands for olivine, CPx for clinopyroxene, and Krs for kaersutite. Matrix glasses have been measured on tephra samples and are from this study, Burton et al. (2023), Ubide et al. (2023), Dayton et al. (2024), and Longpré et al. (2025). The dashed line is the linear regression through the MI dataset and represents the increase in melt Cl content during crystal fractionation. We calculated the degassed Cl amount as the error-weighted mean difference between each matrix Cl content and the regression line.
Appendix C details the procedure that we employed to estimate the plume age for the dates reported in Table 5, using the HYSPLIT (Hybrid Single-Particle Lagrangian Integrated Trajectory) forward simulations.
We used high-resolution meteorological data derived from the WRF-AWR (Advanced Research Weather Research and Forecasting) model (Powers et al., 2017; Skamarock et al., 2019). The WRF-ARW model is run operationally twice daily, utilizing initial and boundary conditions from HRES-IFS (high-resolution forecast Integrated Forecast System) data provided by ECMWF (European Centre for Medium-Range Weather Forecasts) at a resolution of 0.09° × 0.09°. The model configuration includes three nested domains with horizontal resolutions of 6, 2, and 1 km, respectively, and 31 vertical levels, operating in non-hydrostatic mode. Each simulation produces forecasts extending up to 72 h. The outputs of the WRF-ARW model are converted into the required format for the HYSPLIT model using the ARW2ARL program. This process produces meteorological data formatted for use in trajectory and dispersion simulations. To prepare the data for HYSPLIT, the WRF-ARW outputs are processed to generate ARL files with a 12 h temporal span. These files are designed to overlap every 12 h, ensuring continuous hourly meteorological data coverage. This approach provides a seamless dataset necessary for accurate and uninterrupted backward-trajectory and forward-simulation calculations. Forward simulations were performed using HYSPLIT with a standard configuration over a minimum total calculation time of 48 h and an hourly time resolution. The plume altitude was taken from the IGN/AEMET data and Milford et al. (2023) for each studied date.
Appendix D presents the comparison between the ΔXCOXCO2 measured at FUE using the direct-sun FTIR measurements and the area covered daily by the lava flows, derived from the daily Copernicus EMSR546 mapping. A good agreement is found between the two datasets, indicating a possible contribution from burning infrastructure and vegetation to our FUE FTIR measurements. This contrasted with the ratios reported by Asensio-Ramos et al. (2025) derived from open-path measurements performed north-northwest of the eruptive fissure, which were less affected by this contribution.
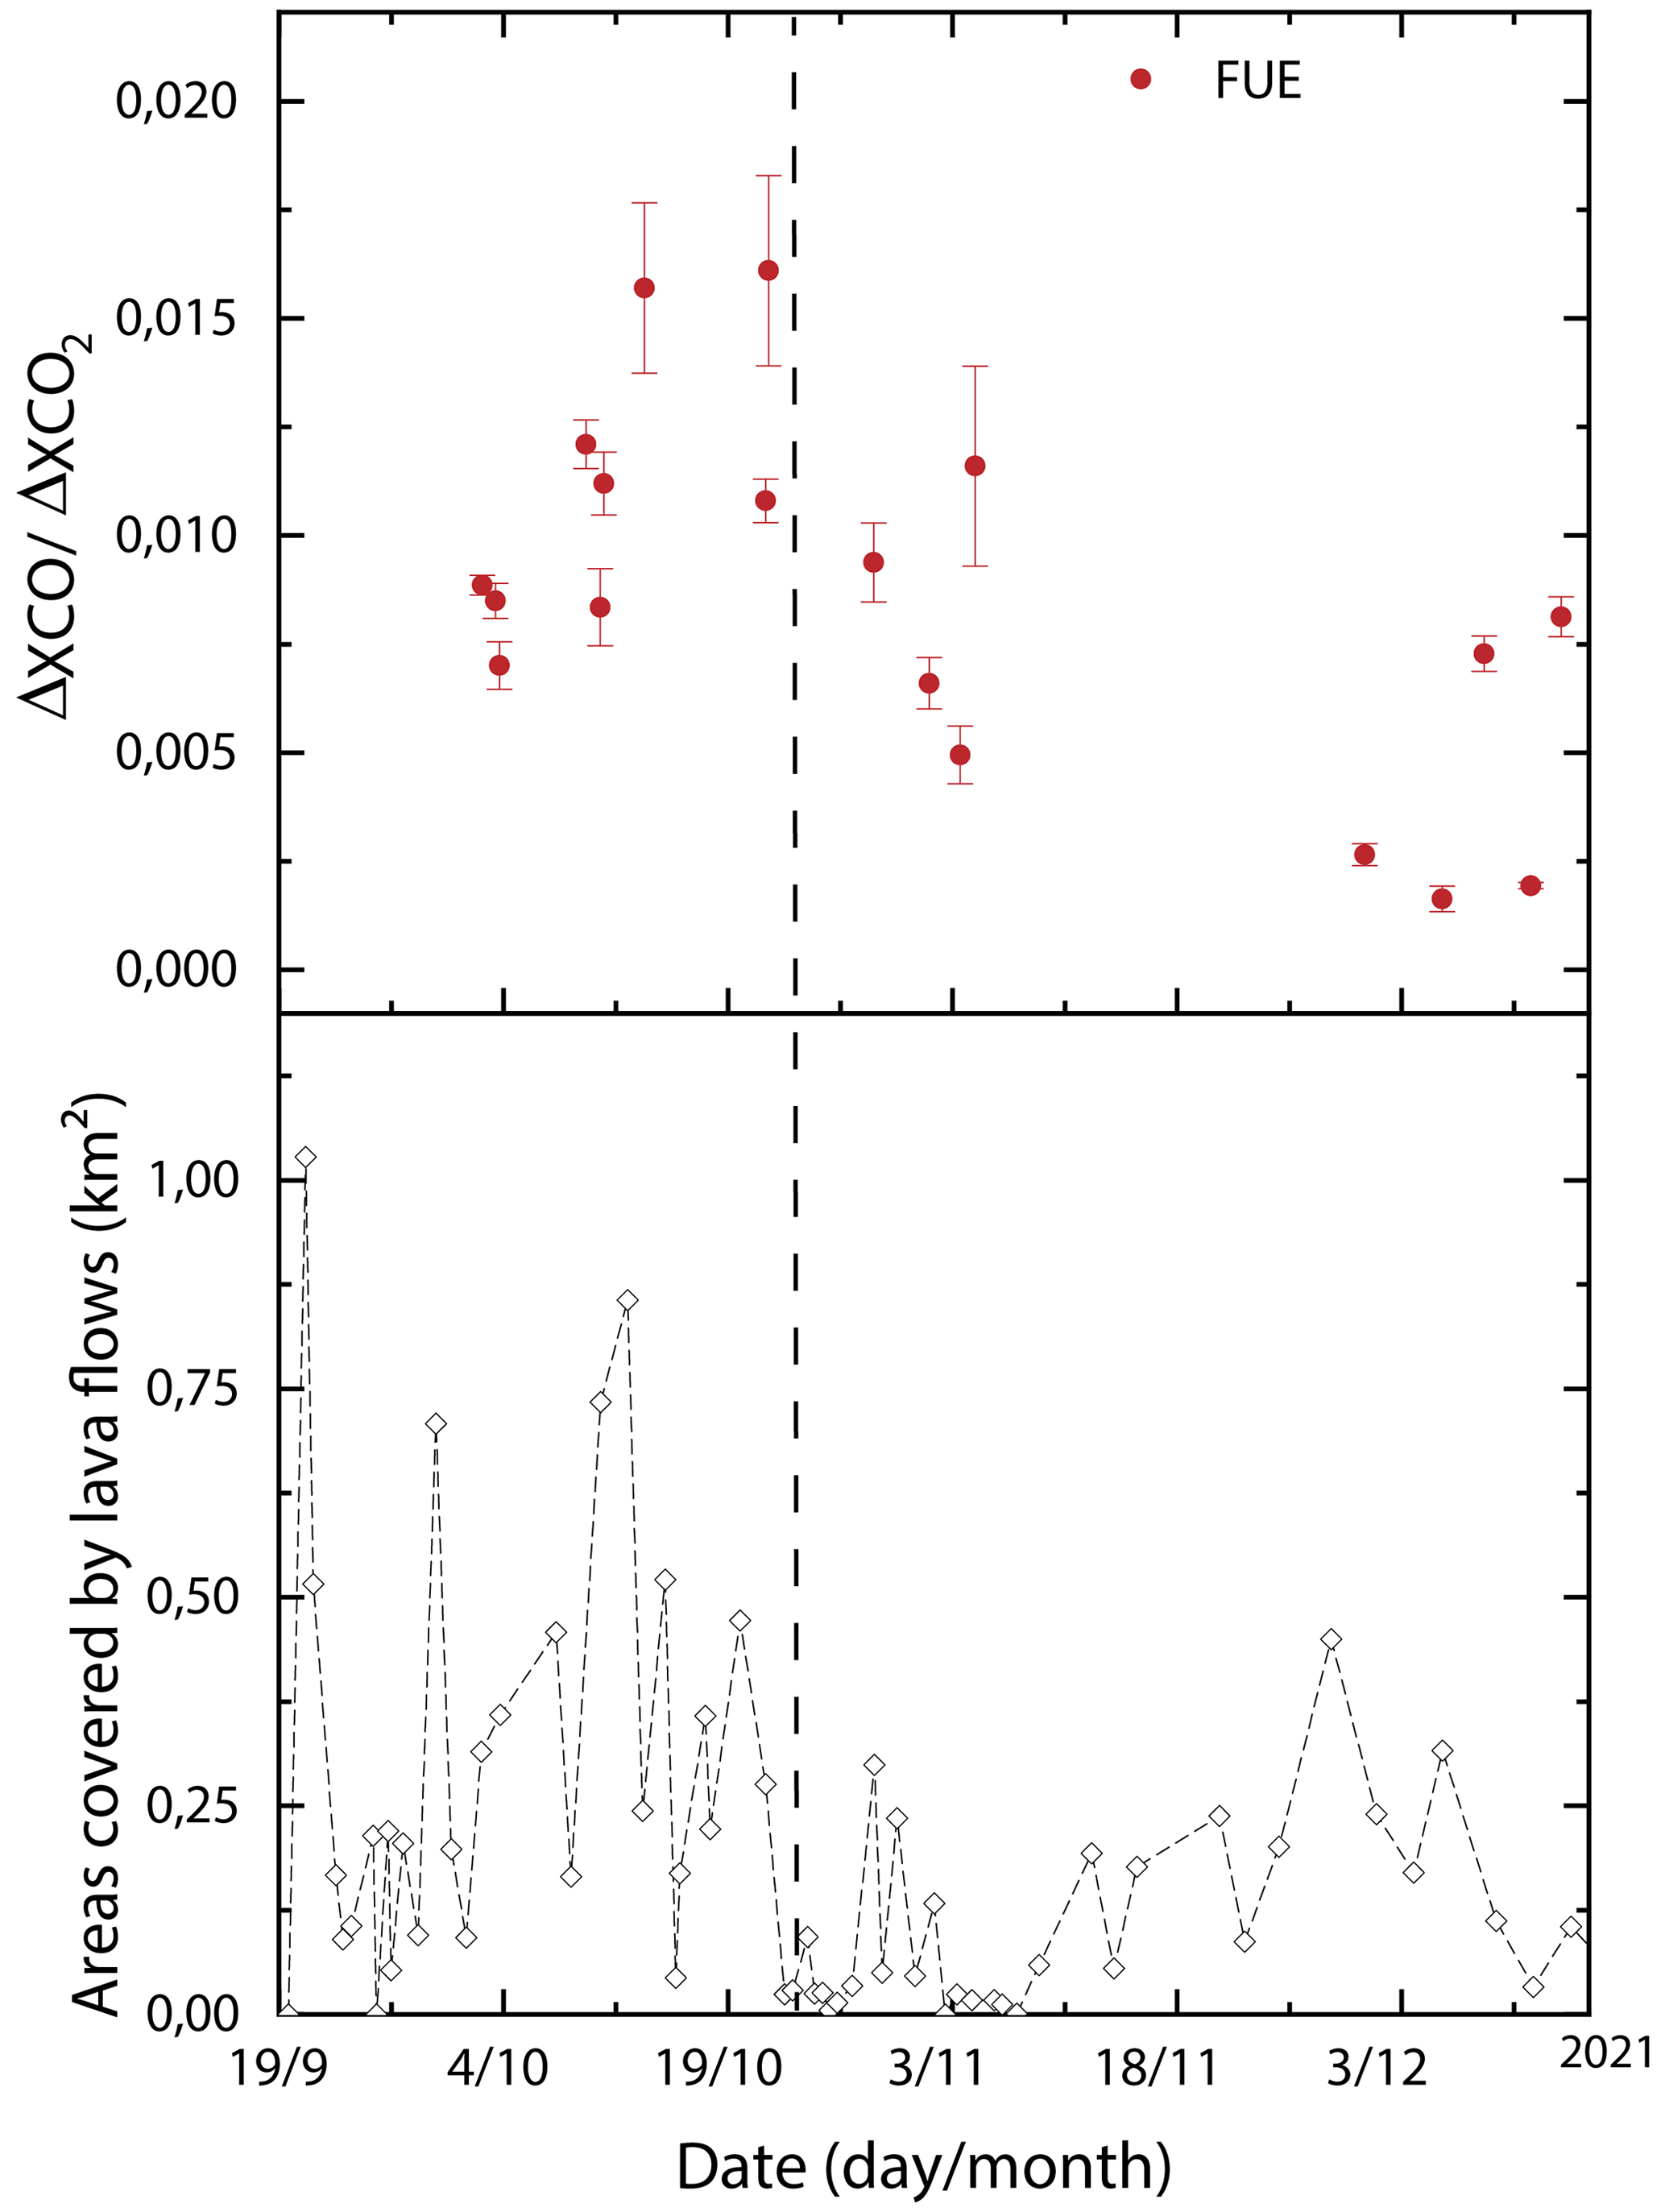
Figure D1Comparison between the time series of ΔXCO ΔXCO2 ratios obtained over the whole eruptive period at FUE and the daily covered area by the lava flows derived from the daily Copernicus EMSR546 mapping (Copernicus Emergency Management Service; Copernicus EMS – mapping).
Appendix E describes the relationship observed between the retrieved daily SO2 emission fluxes and the lava time-averaged discharge rate (TADR). The TADR estimates the lava volume responsible for the radiant flux measured by satellite (Coppola et al., 2016). We exploit the fact that this volume is also the source of SO2 emissions (Fig. E1), providing a direct quantification of the amount of S actually degassing (“effective S degassing”), which is usually indirectly derived in an a posteriori manner, using the difference between the S content of the primitive magma (melt inclusions) and that remaining in the matrix of the (degassed) eruptive products. This quantity is shown to be constant through the eruption (Fig. E2).
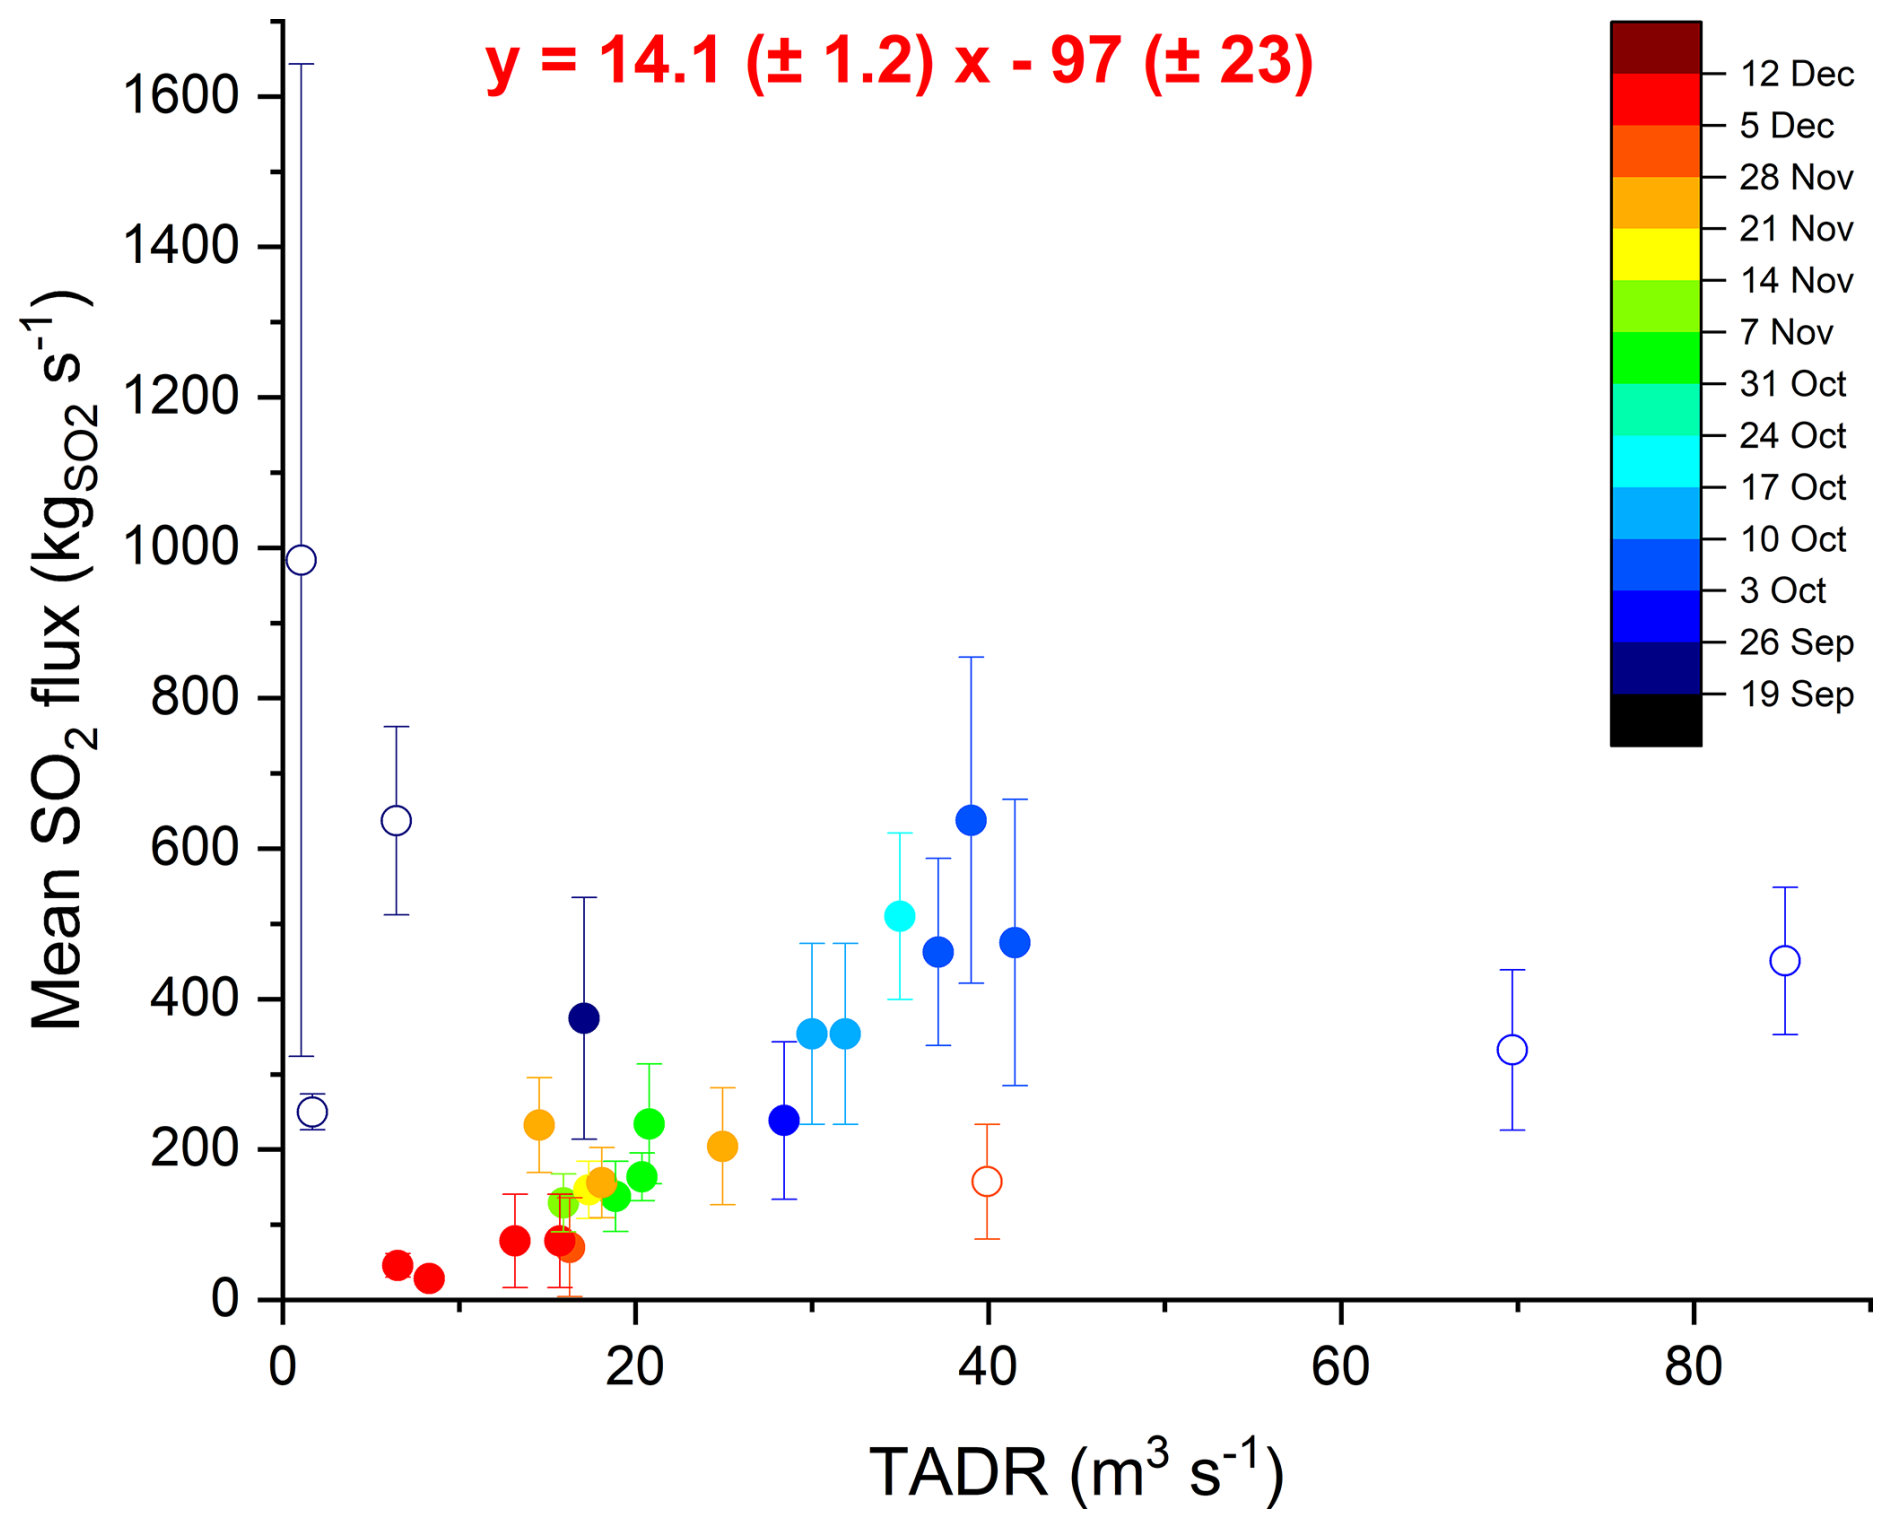
Figure E1Correlation between the TADR and SO2 volcanic emission fluxes illustrating an average “effective S degassing” of 14.1 ± 1.2 kg per (thermal) cubic meter of lava discharged to the surface. Hollow points correspond to the outliers of the dataset.
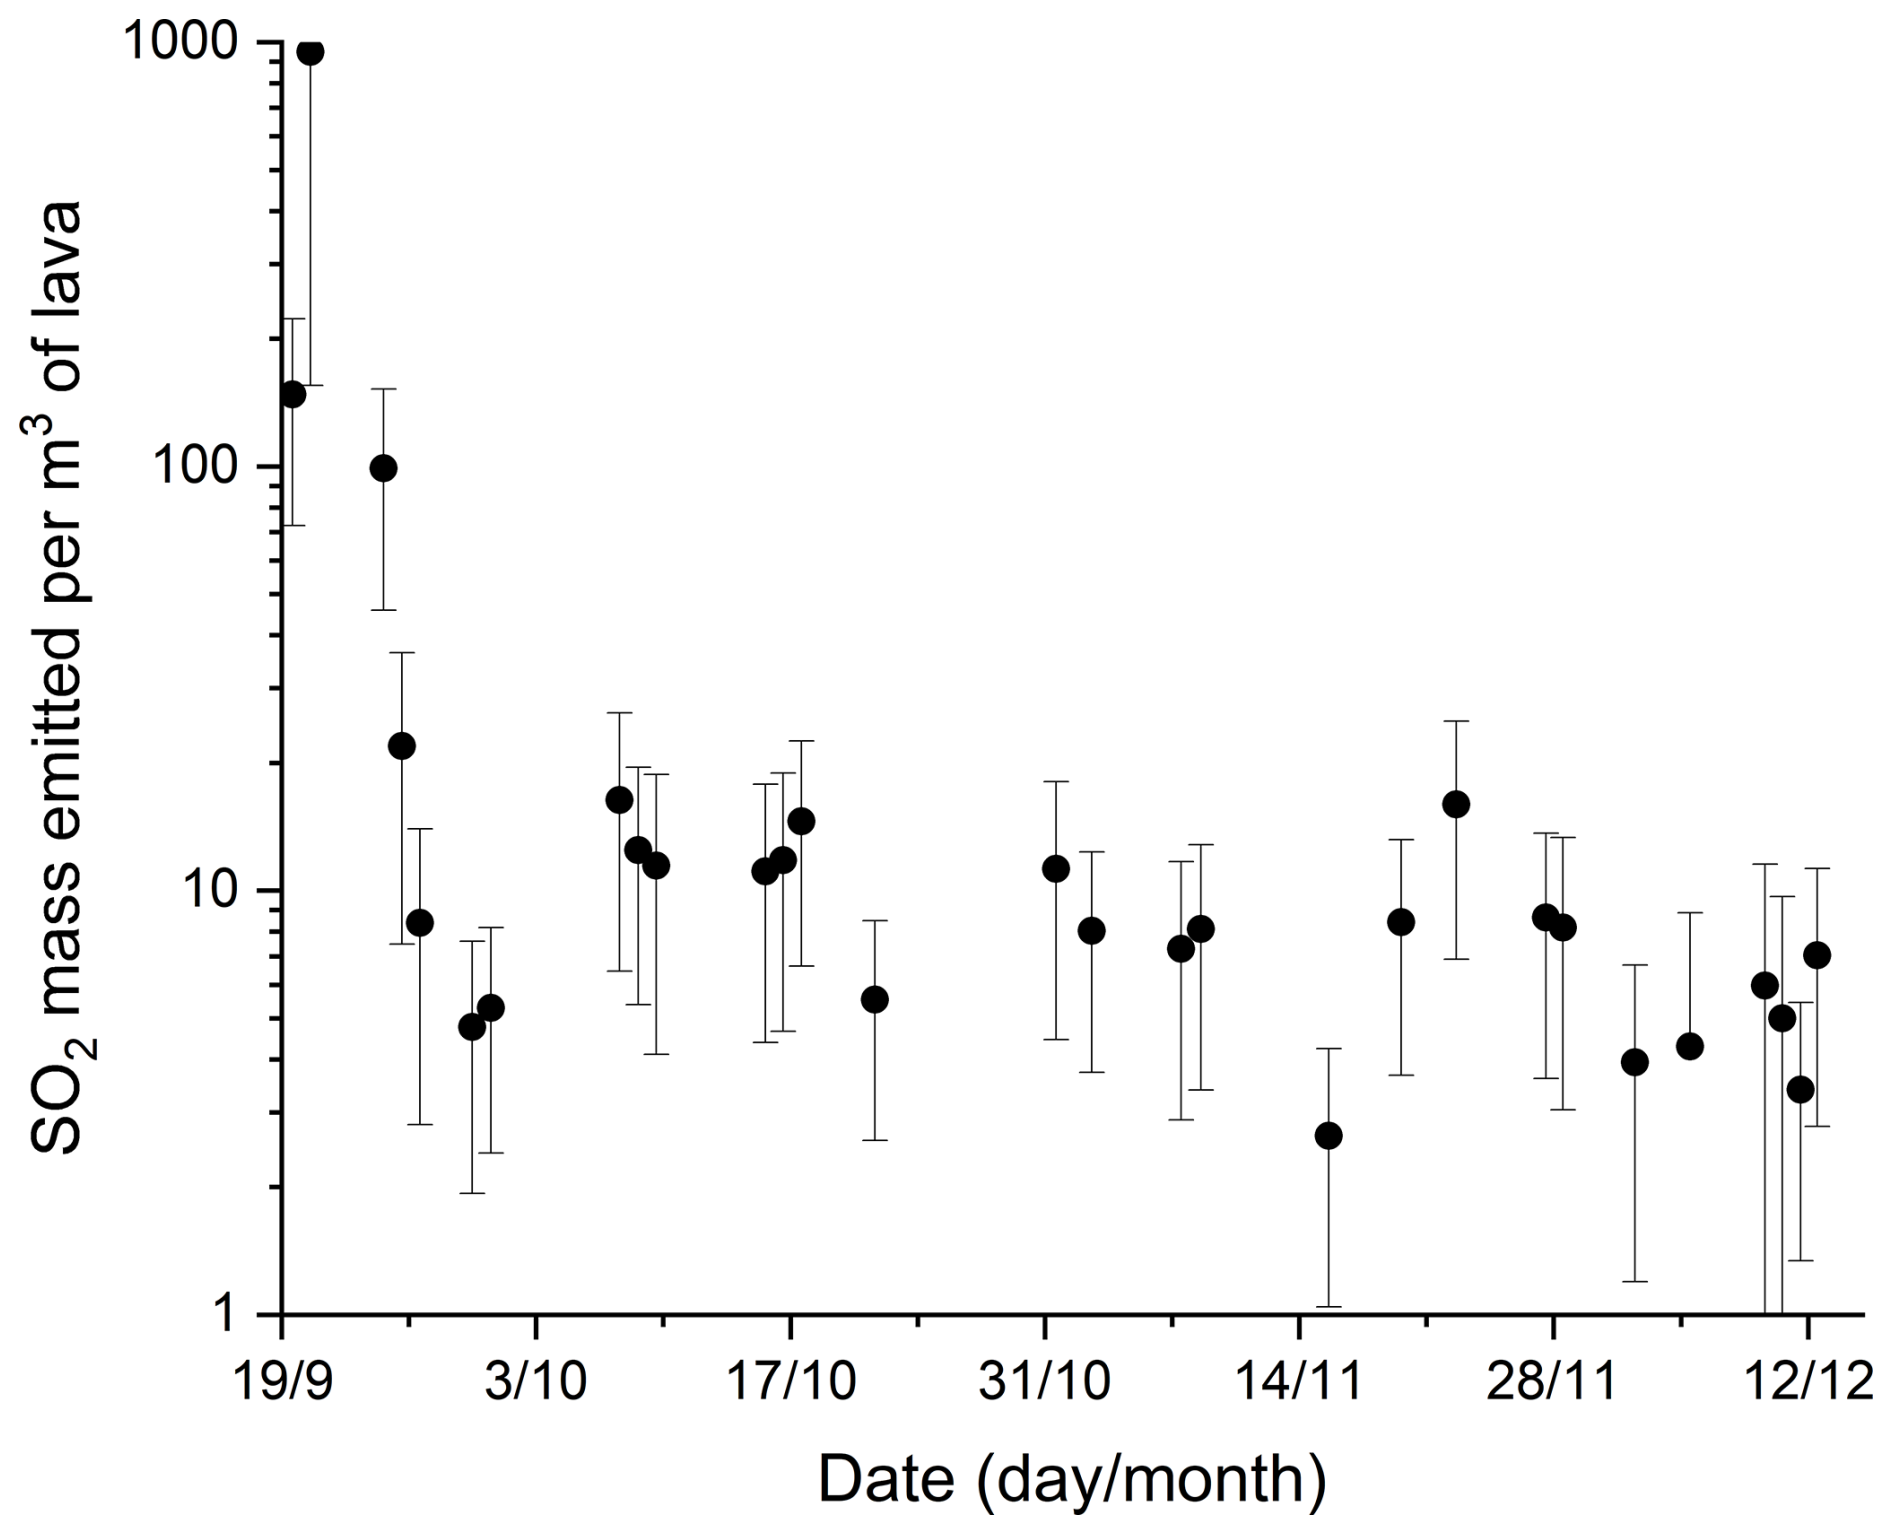
FTIR data used in this study are available upon request. In situ surface data from the Izaña Atmospheric Observatory contribute to the WMO GAW program and are available from the World Data Centre for Greenhouse Gases (WDCGG, https://gaw.kishou.go.jp/, last access: 26 October 2025). TROPOMI data (Copernicus Sentinel-5P) are publicly available from the Sentinel-5P data hub at https://sentinels.copernicus.eu/web/sentinel/data-products/-/asset_publisher/fp37fc19FN8F/ (last access: 26 October 2025). The petrological dataset is available in the Supplement.
The supplement related to this article is available online at https://doi.org/10.5194/acp-25-14591-2025-supplement.
All of the co-authors contributed to the preparation and writing of the manuscript. OG, TB, and NT conceptualized the study. OG led the development of the FTIR program at the Izaña Atmospheric Observatory and its long-term operation. OG, RR, AA, and VC were in charge of the implementation and operation of the Fuencaliente station (La Palma) during the eruption; they also ensured the operation and maintenance of measurements at IZO. OG, NT, WS, ES, and SL contributed to the FTIR and DOAS measurements and data analysis. SL and PRS are responsible for the GAW surface measurements at IZO and their processing. NT, TB, RC, WS, and OG contributed to the implementation and operation of the combined DOAS-EM27/SUN measurements at Fuencaliente. NT, TB, and RC performed the MultiGAS measurements and ash sampling. RC processed the MultiGAS data. DGG and AK performed the SEM and EPMA analyses and helped with the interpretation and discussion of results. CA and MIG contributed to the realization of the HYSPLIT modeling of the volcanic plume dispersion to estimate the plume age. SR and JLD performed the chemical analysis of PM10 and contributed to the associated interpretation. MIG, SR, PGS, TB, and NT contributed to the discussion on the PM10 measurements. FH helped with the FTIR operating maintenance and data processing; FH also developed the PROFFAST and PROFFIT retrieval codes and provided continuous support to the group with respect to the use of the code and spectrometer operation. FH and OG led the German–Spanish collaboration and provided precious help with respect to the EM27/SUN measurements within the framework of the COCCON network.
At least one of the (co-)authors is a member of the editorial board of Atmospheric Chemistry and Physics. The peer-review process was guided by an independent editor, and the authors also have no other competing interests to declare.
Publisher's note: Copernicus Publications remains neutral with regard to jurisdictional claims made in the text, published maps, institutional affiliations, or any other geographical representation in this paper. While Copernicus Publications makes every effort to include appropriate place names, the final responsibility lies with the authors. Views expressed in the text are those of the authors and do not necessarily reflect the views of the publisher.
We acknowledge the two reviewers for their constructive comments, which contributed to significantly improving the manuscript. The AEMET team and TB acknowledge the San Antonio Volcano Visitor Center in Fuencaliente and its personnel for authorizing and facilitating the instrumentation deployment there. The AEMET team would also like to thank all of the researchers and technical personnel for the maintenance and operation of the instrumentation at the Izaña Atmospheric Observatory. The CSIC team and RC acknowledge the administration of the IPNA-CSIC and the CSIC deployment plan during the eruption and its coordination by Manuel Nogales. NT is grateful to the IPNA-CSIC and its director, Juan Ignacio Padron Peña, for allowing her temporary research internship during the eruption. TB, NT, RC, DGG, and AK are grateful to PEVOLCA for granting permission for access to the exclusion zone during sampling and to F. M. Medina from the Cabildo Insular de La Palma for sampling authorizations and for facilitating the fieldwork campaigns. TB and NT acknowledge Pablo González (Group of Volcanology of IPNA-CSIC) and A. Barreto (Aerosols Group of the CIAI-AEMET), for fruitful discussions, and M. Charco (IGEO-CSIC, Madrid), for providing the corrected lava emission volume data. The authors are grateful to S. Valade for the SO2 masses from the MOUNTS project. NT, RC, and TB acknowledge C. Fayt, M. Van Roozendael, and A. Merlaud from the BIRA-IASB institute for providing and helping with the use of QDOAS software. The CSIC team and RC acknowledge the Cabildo Insular de La Palma and its personnel for their assistance in the field. They also warmly thank J. G. Barreto from Spar La Palma and TICOM solutions and his personnel for their logistic support and assistance in the field. DGG acknowledges X. Arroyo for support at the UCM SEM laboratory, Madrid.
This study was partially funded by the European Union – NextGenerationEU – actions P02.C05.I03.P51.S000.42 and P02.C05.I03.P51.S000.43. This study is part of the AERO-EXTREME projects (PID2021-125669NB-I00), funded by the Spanish National Research Agency (Agencia Estatal de Investigación) and the European Regional Development Fund. This work has received funding from the European Union's Horizon Europe Research and Innovation program (under grant no. 101189654). DGG acknowledges financial support from the Alexander von Humboldt Foundation through a Humboldt Research Fellowship for Postdoctoral Researchers. This work benefited from funding from CSIC and the Ministry of Science and Innovation (through the CSIC-PIE project no. PIE20223PAL009). The aerosol sampling on La Palma during the eruption and part of the chemical analysis were performed within the framework of the CSIC-LAPALMA-06 project, funded by CSIC and the Ministry of Science and Innovation.
This paper was edited by Carl Percival and reviewed by Yves Moussallam and Nicole Bobrowski.
ACTRIS: ACTRIS-Spain coordinating unprecedented actions for the Cumbre Vieja volcanic emergency, (last access: 26 October 2025), November 2021.
Aiuppa, A., Baker, D. R., and Webster, J. D.: Halogens in volcanic systems, Chemical Geology, 263(1–4), 1–18, https://doi.org/10.1016/j.chemgeo.2008.10.005, 2009.
Akagi, S. K., Burling, I. R., Mendoza, A., Johnson, T. J., Cameron, M., Griffith, D. W. T., Paton-Walsh, C., Weise, D. R., Reardon, J., and Yokelson, R. J.: Field measurements of trace gases emitted by prescribed fires in southeastern US pine forests using an open-path FTIR system, Atmos. Chem. Phys., 14, 199–215, https://doi.org/10.5194/acp-14-199-2014, 2014.
Alberti, C., Hase, F., Frey, M., Dubravica, D., Blumenstock, T., Dehn, A., Castracane, P., Surawicz, G., Harig, R., Baier, B. C., Bès, C., Bi, J., Boesch, H., Butz, A., Cai, Z., Chen, J., Crowell, S. M., Deutscher, N. M., Ene, D., Franklin, J. E., García, O., Griffith, D., Grouiez, B., Grutter, M., Hamdouni, A., Houweling, S., Humpage, N., Jacobs, N., Jeong, S., Joly, L., Jones, N. B., Jouglet, D., Kivi, R., Kleinschek, R., Lopez, M., Medeiros, D. J., Morino, I., Mostafavipak, N., Müller, A., Ohyama, H., Palmer, P. I., Pathakoti, M., Pollard, D. F., Raffalski, U., Ramonet, M., Ramsay, R., Sha, M. K., Shiomi, K., Simpson, W., Stremme, W., Sun, Y., Tanimoto, H., Té, Y., Tsidu, G. M., Velazco, V. A., Vogel, F., Watanabe, M., Wei, C., Wunch, D., Yamasoe, M., Zhang, L., and Orphal, J.: Improved calibration procedures for the EM27/SUN spectrometers of the COllaborative Carbon Column Observing Network (COCCON), Atmos. Meas. Tech., 15, 2433–2463, https://doi.org/10.5194/amt-15-2433-2022, 2022.
Alvárez, Ó., Barreto, Á., García, O. E., Hase, F., García, R. D., Gröbner, J., León-Luis, S. F., Sepúlveda, E., Carreño, V., Alcántara, A., Ramos, R., Almansa, A. F., Kazadzis, S., Taquet, N., Toledano, C., and Cuevas, E.: Aerosol properties derived from ground-based Fourier transform spectra within the COllaborative Carbon Column Observing Network, Atmos. Meas. Tech., 16, 4861–4884, https://doi.org/10.5194/amt-16-4861-2023, 2023.
Amonte, C., Melián, G. V., Asensio-Ramos, M., Pérez, N. M., Padrón, E., Hernández, P. A., and D'Auria, L.: Hydrogeochemical temporal variations related to the recent volcanic eruption at the Cumbre Vieja Volcano, La Palma, Canary Islands, Front. Earth Sci., 10, 1003890, https://doi.org/10.3389/feart.2022.1003890, 2022.
Andújar, J., Scaillet, B., Frascerra, D., Di Carlo, I., Casillas, R., Suárez, E. D., Domínguez-Cerdeña, I., Meletlidis, S., López, C., Slodczyk, A., Martí, J., and Núñez-Guerrero, E.: Evolution of the crustal reservoir feeding La Palma 2021 eruption. Insights from phase equilibrium experiments and petrologically derived time scales, Journal of Volcanology and Geothermal Research, 463, 108327, https://doi.org/10.1016/j.jvolgeores.2025.108327, 2025.
Asensio-Ramos, M., Cofrades, A. P., Burton, M., La Spina, A., Allard, P., Barrancos, J., Hayer, C., Esse, B., D'Auria, L., Hernández, P. A., Padrón, E., Melián, G. V., and Pérez, N. M.: Insights into magma dynamics from daily OP-FTIR gas compositions throughout the 2021 Tajogaite eruption, La Palma, Canary Islands, Chemical Geology, 676, 122605, https://doi.org/10.1016/j.chemgeo.2024.122605, 2025.
Bagnato, E., Aiuppa, A., Bertagnini, A., Bonadonna, C., Cioni, R., Pistolesi, M., Pedone, M., and Hoskuldsson, A.: Scavenging of sulphur, halogens and trace metals by volcanic ash: The 2010 Eyjafjallajökull eruption, Geochimica et Cosmochimica Acta, 103, 138–160, https://doi.org/10.1016/j.gca.2012.10.048, 2013.
Barreto, A., García, O. E., Román, R., Sicard, M., Rizi, V., Roininen, R., Romero-Campos, P. M., González, Y., Rodríguez, S., García, R. D., Torres, C., Iarlori, M., Cuevas, E., Córdoba-Jabonero, C., de la Rosa, J., Rodríguez-Gómez, A., Muñoz-Porcar, C., Comerón, A., Bedoya-Velásquez, A., Antuña-Sanchez, J. C., Neustroev, V., Pietropaolo, E., Lopez-Darias, Y., López-Cayuela, M. A., Carvajal-Pérez, C., Bustos, J. J., Álvarez, O., Toledano, C., Aramo, C., Vilches, J., González, R., Almansa, F. A., Ceolato, R., Taquet, N., Prats, N., Redondas, A., Bayo, C., Ramos, R., Carreño, V., León, S. L., Rivas, P. P., Alcántara, A., López, C., and Martín, P.: La Palma Volcano Eruption: Characterisation of Volcanic Aerosols and Gas Emissions from a Synergetic Perspective, International Radiation Symposium (IRS), Thessaloniki (Greece), 4–8 July, https://hal.science/hal-04903546 (last access: 26 October 2025), 2022.
Belart, J. M. C. and Pinel, V.: Pléiades co- and post-eruption survey in Cumbre Vieja volcano, La Palma, Spain (1), Zenodo, https://doi.org/10.5281/ZENODO.5833771, 2022.
Birnbaum, J., Lev, E., Hernandez, P. A., Barrancos, J., Padilla, G. D., Asensio-Ramos, M., Calvo, D., Rodríguez, F., Pérez, N. M., D'Auria, L., and Calvari, S.: Temporal variability of explosive activity at Tajogaite volcano, Cumbre Vieja (Canary Islands), 2021 eruption from ground-based infrared photography and videography, Front. Earth Sci., 11, 1193436, https://doi.org/10.3389/feart.2023.1193436, 2023.
Bluth, G. J. S., Casadevall, T. J., Schnetzler, C. C., Doiron, S. D., Walter, L. S., Krueger, A. J., and Badruddin, M.: Evaluation of sulfur dioxide emissions from explosive volcanism: the 1982–1983 eruptions of Galunggung, Java, Indonesia, Journal of Volcanology and Geothermal Research, 63, 243–256, https://doi.org/10.1016/0377-0273(94)90077-9, 1994.
Bonadonna, C., Pistolesi, M., Biass, S., Voloschina, M., Romero, J., Coppola, D., Folch, A., D'Auria, L., Martin-Lorenzo, A., Dominguez, L., Pastore, C., Reyes Hardy, M., and Rodríguez, F.: Physical Characterization of Long-Lasting Hybrid Eruptions: The 2021 Tajogaite Eruption of Cumbre Vieja (La Palma, Canary islands), JGR Solid Earth, 127, e2022JB025302, https://doi.org/10.1029/2022JB025302, 2022.
Bonadonna, C., Pistolesi, M., Dominguez, L., Freret-Lorgeril, V., Rossi, E., Fries, A., Biass, S., Voloschina, M., Lemus, J., Romero, J. E., Zanon, V., Pastore, C., Reyes Hardy, M.-P., Di Maio, L. S., Gabellini, P., Martin-Lorenzo, A., Rodriguez, F., and Perez, N. M.: Tephra sedimentation and grainsize associated with pulsatory activity: the 2021 Tajogaite eruption of Cumbre Vieja (La Palma, Canary islands, Spain), Front. Earth Sci., 11, 1166073, https://doi.org/10.3389/feart.2023.1166073, 2023.
Bonechi, B., Polacci, M., Arzilli, F., Romero, J. E., Fellowes, J., and Burton, M: Magma residence time, ascent rate and eruptive style of the November ash-laden activity during the 2021 Tajogaite eruption (La Palma, Spain), Volcanica, 7(1), 51–65, https://doi.org/10.30909/vol.07.01.5165, 2024
Burrows, J. P., Richter, A., Dehn, A., Deters, B., Himmelmann, S., Voigt, S., and Orphal, J.: Atmospheric Remote-Sensing Reference Data From GOME-2. Temperature-dependent Absorption Cross-sections of O3 in the 231–794 nm Range, Journal of Quantitative Spectroscopy and Radiative Transfer, 61, 509–517, https://doi.org/10.1016/S0022-4073(98)00037-5, 1999.
Burton, M., Aiuppa, A., Allard, P., Asensio-Ramos, M., Cofrades, A. P., La Spina, A., Nicholson, E. J., Zanon, V., Barrancos, J., Bitetto, M., Hartley, M., Romero, J. E., Waters, E., Stewart, A., Hernández, P. A., Lages, J. P., Padrón, E., Wood, K., Esse, B., Hayer, C., Cyrzan, K., Rose-Koga, E. F., Schiavi, F., D'Auria, L., and Pérez, N. M.: Exceptional eruptive CO2 emissions from intra-plate alkaline magmatism in the Canary volcanic archipelago, Commun Earth Environ, 4, 467, https://doi.org/10.1038/s43247-023-01103-x, 2023.
Butz, A., Dinger, A. S., Bobrowski, N., Kostinek, J., Fieber, L., Fischerkeller, C., Giuffrida, G. B., Hase, F., Klappenbach, F., Kuhn, J., Lübcke, P., Tirpitz, L., and Tu, Q.: Remote sensing of volcanic CO2, HF, HCl, SO2, and BrO in the downwind plume of Mt. Etna, Atmos. Meas. Tech., 10, 1–14, https://doi.org/10.5194/amt-10-1-2017, 2017.
Cassidy, M., Iveson, A. A., Humphreys, M. C. S., Mather, T. A., Helo, C., Castro, J. M., Ruprecht, P., Pyle, D. M., and EIMF: Experimentally derived F, Cl, and Br fluid/melt partitioning of intermediate to silicic melts in shallow magmatic systems, American Mineralogist, 107, 1825–1839, https://doi.org/10.2138/am-2022-8109, 2022.
Chance, K. and Kurucz, R. L.: An improved high-resolution solar reference spectrum for earth's atmosphere measurements in the ultraviolet, visible, and near infrared, Journal of Quantitative Spectroscopy and Radiative Transfer, 111, 1289–1295, https://doi.org/10.1016/j.jqsrt.2010.01.036, 2010.
Charco, M., González, P. J., Pallero, J. L. G., García-Cañada, L., Del Fresno, C., and Rodríguez-Ortega, A.: The 2021 La Palma (Canary islands) Eruption Ending Forecast Through Magma Pressure Drop, Geophysical Research Letters, 51, e2023GL106885, https://doi.org/10.1029/2023GL106885, 2024.
Civico, R., Ricci, T., Scarlato, P., Taddeucci, J., Andronico, D., Del Bello, E., D'Auria, L., Hernández, P. A., and Pérez, N. M.: High-resolution Digital Surface Model of the 2021 eruption deposit of Cumbre Vieja volcano, La Palma, Spain, Sci. Data, 9, 435, https://doi.org/10.1038/s41597-022-01551-8, 2022.
Copernicus EMSR546: EMSR546 | Copernicus EMS On Demand Mapping, https://mapping.emergency.copernicus.eu/activations/EMSR546/ (last access: 26 October 2025.), 2021.
Coppola, D., Laiolo, M., Cigolini, C., Donne, D. D., and Ripepe, M.: Enhanced volcanic hot-spot detection using MODIS IR data: results from the MIROVA system, SP, 426, 181–205, https://doi.org/10.1144/SP426.5, 2016.
Córdoba-Jabonero, C., Sicard, M., Barreto, Á., Toledano, C., López-Cayuela, M. Á., Gil-Díaz, C., García, O., Carvajal-Pérez, C. V., Comerón, A., Ramos, R., Muñoz-Porcar, C., and Rodríguez-Gómez, A.: Fresh volcanic aerosols injected in the atmosphere during the volcano eruptive activity at the Cumbre Vieja area (La Palma, Canary Islands): Temporal evolution and vertical impact, Atmospheric Environment, 300, 119667, https://doi.org/10.1016/j.atmosenv.2023.119667, 2023.
Cuevas, E., Milford, C., Barreto, A., Bustos, J. J., García, O. E., García, R. D., Marrero, C., Prats, N., Ramos, R., Redondas, A., Reyes, E., Rivas-Soriano, P. P., Romero-Campos, P. M., Torres, C. J., Schneider, M., Yela, M., Belmonte, J., Almansa, F., López-Solano, C., Basart, S., Werner, E., Rodríguez, S., Alcántara, A., Alvarez, O., Bayo, C., Berjón, A., Borges, A., Carreño, V., Castro, N. J., Chinea, N., Cruz, A. M., Damas, M., González, Y., Hernández, C., Hernández, J., León-Luís, S. F., López-Fernández, R., López-Solano, J., Mármol, I., Martín, T., Parra, F., Rodríguez-Valido, M., Sálamo, C., Santana, D., Santo-Tomás, F. and Serrano, A.: Izaña Atmospheric Research Center Activity Report 2021–2022, edited by: Cuevas, E., Milford, C., and Tarasova, O., State Meteorological Agency (AEMET), Madrid, Spain and World Meteorological Organization, Geneva, Switzerland, NIPO: 666-24-002-7, WMO/GAW Report No. 290, https://doi.org/10.31978/666-24-002-7, 2024.
Danckaert, T., Fayt, C., Van Roozendael, M., De Smedt, I., Letocart, V., Merlaud, A., and Pinardi, G.: Qdoas Software User Manual, Version 2.108, 2014.
Danyushevsky, L. V. and Plechov, P.: Petrolog3: Integrated software for modeling crystallization processes: PETROLOG3, Geochem. Geophys. Geosyst., 12, https://doi.org/10.1029/2011GC003516, 2011.
D'Auria, L. and Martini, M.: Slug Flow: Modeling in a Conduit and Associated Elastic Radiation, in: Encyclopedia of Complexity and Systems Science, edited by: Meyers, R. A., Springer New York, New York, NY, 8153–8168, https://doi.org/10.1007/978-0-387-30440-3_483, 2009.
D'Auria, L., Koulakov, I., Prudencio, J., Cabrera-Pérez, I., Ibáñez, J. M., Barrancos, J., García-Hernández, R., Martínez Van Dorth, D., Padilla, G. D., Przeor, M., Ortega, V., Hernández, P., and Peréz, N. M.: Rapid magma ascent beneath La Palma revealed by seismic tomography, Sci. Rep., 12, 17654, https://doi.org/10.1038/s41598-022-21818-9, 2022.
Day, J. M. D., Troll, V. R., Aulinas, M., Deegan, F. M., Geiger, H., Carracedo, J. C., Pinto, G. G., and Perez-Torrado, F. J.: Mantle source characteristics and magmatic processes during the 2021 La Palma eruption, Earth and Planetary Science Letters, 597, 117793, https://doi.org/10.1016/j.epsl.2022.117793, 2022.
Dayton, K., Gazel, E., Wieser, P., Troll, V. R., Carracedo, J. C., La Madrid, H., Roman, D. C., Ward, J., Aulinas, M., Geiger, H., Deegan, F. M., Gisbert, G., and Perez-Torrado, F. J.: Deep magma storage during the 2021 La Palma eruption, Sci. Adv., 9, eade7641, https://doi.org/10.1126/sciadv.ade7641, 2023.
Dayton, K., Gazel, E., Wieser, P. E., Troll, V. R., Carracedo, J. C., Aulinas, M., and Perez-Torrado, F. J.: Magmatic Storage and Volatile Fluxes of the 2021 La Palma Eruption, Geochem. Geophys. Geosyst., 25, e2024GC011491, https://doi.org/10.1029/2024GC011491, 2024.
Del Fresno, C., Cesca, S., Klügel, A., Domínguez Cerdeña, I., Díaz-Suárez, E. A., Dahm, T., García-Cañada, L., Meletlidis, S., Milkereit, C., Valenzuela-Malebrán, C., López-Díaz, R., and López, C.: Magmatic plumbing and dynamic evolution of the 2021 La Palma eruption, Nat. Commun., 14, 358, https://doi.org/10.1038/s41467-023-35953-y, 2023.
De Luca, C., Valerio, E., Giudicepietro, F., Macedonio, G., Casu, F., and Lanari, R.: Pre- and Co-Eruptive Analysis of the September 2021 Eruption at Cumbre Vieja Volcano (La Palma, Canary Islands) Through DInSAR Measurements and Analytical Modeling, Geophysical Research Letters, 49, e2021GL097293, https://doi.org/10.1029/2021GL097293, 2022.
Duputel, Z., Ferrazzini, V., Journeau, C., Catherine, P., Kowalski, P., and Peltier, A.: Tracking changes in magma transport from very-long-period seismic signals at Piton de la Fournaise volcano, Earth and Planetary Science Letters, 620, 118323, https://doi.org/10.1016/j.epsl.2023.118323, 2023.
EEA: European Union emission inventory report 1990–2021, EEA Report 04/2023, https://doi.org/10.2800/68478, 2023.
Ericksen, J., Fischer, T. P., Fricke, G. M., Nowicki, S., Pérez, N. M., Hernández Pérez, P., Padrón González, E., and Moses, M. E.: Drone CO2 measurements during the Tajogaite volcanic eruption, Atmos. Meas. Tech., 17, 4725–4736, https://doi.org/10.5194/amt-17-4725-2024, 2024.
Feld, L., Herkommer, B., Vestner, J., Dubravica, D., Alberti, C., and Hase, F.: PROFFASTpylot: Running PROFFAST with Python, JOSS, 9, 6481, https://doi.org/10.21105/joss.06481, 2024.
Fischer, T. P. and Aiuppa, A.: AGU Centennial Grand Challenge: Volcanoes and Deep Carbon Global CO2 Emissions From Subaerial Volcanism – Recent Progress and Future Challenges, Geochem. Geophys. Geosyst., 21, e2019GC008690, https://doi.org/10.1029/2019GC008690, 2020.
Frey, M., Sha, M. K., Hase, F., Kiel, M., Blumenstock, T., Harig, R., Surawicz, G., Deutscher, N. M., Shiomi, K., Franklin, J. E., Bösch, H., Chen, J., Grutter, M., Ohyama, H., Sun, Y., Butz, A., Mengistu Tsidu, G., Ene, D., Wunch, D., Cao, Z., Garcia, O., Ramonet, M., Vogel, F., and Orphal, J.: Building the COllaborative Carbon Column Observing Network (COCCON): long-term stability and ensemble performance of the EM27/SUN Fourier transform spectrometer, Atmos. Meas. Tech., 12, 1513–1530, https://doi.org/10.5194/amt-12-1513-2019, 2019.
Galeczka, I., Oelkers, E. H., and Gislason, S. R.: The effect of the 2014-15 Bárðarbunga volcanic eruption on chemical denudation rates and the CO2 budget, Energy Procedia, 146, 53–58, https://doi.org/10.1016/j.egypro.2018.07.008, 2018.
García, O. E., Schneider, M., Sepúlveda, E., Hase, F., Blumenstock, T., Cuevas, E., Ramos, R., Gross, J., Barthlott, S., Röhling, A. N., Sanromá, E., González, Y., Gómez-Peláez, Á. J., Navarro-Comas, M., Puentedura, O., Yela, M., Redondas, A., Carreño, V., León-Luis, S. F., Reyes, E., García, R. D., Rivas, P. P., Romero-Campos, P. M., Torres, C., Prats, N., Hernández, M., and López, C.: Twenty years of ground-based NDACC FTIR spectrometry at Izaña Observatory – overview and long-term comparison to other techniques, Atmos. Chem. Phys., 21, 15519–15554, https://doi.org/10.5194/acp-21-15519-2021, 2021.
García, O. W. Stremme, N. Taquet, F. Hase, I. Ortega, J. Hannigan, D. Smale, C. Vigouroux, M. Grutter, T. Blumenstock, M. Schneider, and A. Redondas: Sulphur dioxide from ground-based Fourier transform infrared spectroscopy: application to volcanic emissions, In: IRWG-NDACC Meeting (Vol. 2022), https://ftp.acom.ucar.edu/user/jamesw/IRWG/2022/Meeting/Activities/Garcia-SO2_IRWG_2022.pdf (last access: 26 October 2025), 2022.
García, R. D., García, O. E., Cuevas-Agulló, E., Barreto, Á., Cachorro, V. E., Marrero, C., Almansa, F., Ramos, R., and Pó, M.: Spectral Aerosol Radiative Forcing and Efficiency of the La Palma Volcanic Plume over the Izaña Observatory, Remote Sensing, 15, 173, https://doi.org/10.3390/rs15010173, 2022.
García-Gil, A., Jimenez, J., Marazuela, M. Á., Baquedano, C., Martínez-León, J., Cruz-Pérez, N., Laspidou, C., and Santamarta, J. C.: Effects of the 2021 La Palma volcanic eruption on groundwater resources (part I): Hydraulic impacts, Groundwater for Sustainable Development, 23, 100989, https://doi.org/10.1016/j.gsd.2023.100989, 2023a.
García-Gil, A., Jimenez, J., Gasco Cavero, S., Marazuela, M. Á., Baquedano, C., Martínez-León, J., Cruz-Pérez, N., Laspidou, C., and Santamarta, J. C.: Effects of the 2021 La Palma volcanic eruption on groundwater resources (part II): Hydrochemical impacts, Groundwater for Sustainable Development, 23, 100992, https://doi.org/10.1016/j.gsd.2023.100992, 2023b.
Gerlach, T. M.: Volcanic sources of tropospheric ozone-depleting trace gases, Geochem. Geophys. Geosyst., 5, https://doi.org/10.1029/2004gc000747, 2004.
Gennaro, E., Paonita, A., Iacono-Marziano, G., Moussallam, Y., Pichavant, M., Peters, N., and Martel, C.: Sulphur behaviour and redox conditions in etnean magmas during magma differentiation and degassing, Journal of Petrology, egaa095, https://doi.org/10.1093/petrology/egaa095, 2020.
González, P. J.: Volcano-tectonic control of Cumbre Vieja, Science, 375, 1348–1349, https://doi.org/10.1126/science.abn5148, 2022.
González-García, D., Boulesteix, T., Klügel, A., and Holtz, F.: Bubble-enhanced basanite–tephrite mixing in the early stages of the Cumbre Vieja 2021 eruption, La Palma, Canary islands, Sci. Rep., 13, 14839, https://doi.org/10.1038/s41598-023-41595-3, 2023.
Gordon, I. E., Rothman, L. S., Hargreaves, R. J., Hashemi, R., Karlovets, E. V., Skinner, F. M., Conway, E. K., Hill, C., Kochanov, R. V., Tan, Y., Wcisło, P., Finenko, A. A., Nelson, K., Bernath, P. F., Birk, M., Boudon, V., Campargue, A., Chance, K. V., Coustenis, A., Drouin, B. J., Flaud, J. –M., Gamache, R. R., Hodges, J. T., Jacquemart, D., Mlawer, E. J., Nikitin, A. V., Perevalov, V. I., Rotger, M., Tennyson, J., Toon, G. C., Tran, H., Tyuterev, V. G., Adkins, E. M., Baker, A., Barbe, A., Canè, E., Császár, A. G., Dudaryonok, A., Egorov, O., Fleisher, A. J., Fleurbaey, H., Foltynowicz, A., Furtenbacher, T., Harrison, J. J., Hartmann, J. –M., Horneman, V. –M., Huang, X., Karman, T., Karns, J., Kassi, S., Kleiner, I., Kofman, V., Kwabia–Tchana, F., Lavrentieva, N. N., Lee, T. J., Long, D. A., Lukashevskaya, A. A., Lyulin, O. M., Makhnev, V. Yu., Matt, W., Massie, S. T., Melosso, M., Mikhailenko, S. N., Mondelain, D., Müller, H. S. P., Naumenko, O. V., Perrin, A., Polyansky, O. L., Raddaoui, E., Raston, P. L., Reed, Z. D., Rey, M., Richard, C., Tóbiás, R., Sadiek, I., Schwenke, D. W., Starikova, E., Sung, K., Tamassia, F., Tashkun, S. A., Vander Auwera, J., Vasilenko, I. A., Vigasin, A. A., Villanueva, G. L., Vispoel, B., Wagner, G., Yachmenev, A., and Yurchenko, S. N.: The HITRAN2020 molecular spectroscopic database, Journal of Quantitative Spectroscopy and Radiative Transfer, 277, 107949, https://doi.org/10.1016/j.jqsrt.2021.107949, 2022.
Hansteen, T. H., Andersen, T., Neumann, E.-R., and Jelsma, H.: Fluid and silicate glass inclusions in ultramafic and mafic xenoliths from Hierro, Canary Islands: implications for mantle metasomatism, Contr. Mineral. and Petrol., 107, 242–254, https://doi.org/10.1007/BF00310710, 1991.
Hansteen, T. H., Klügel, A., and Schmincke, H.-U.: Multi-stage magma ascent beneath the Canary Islands: evidence from fluid inclusions, Contributions to Mineralogy and Petrology, 132, 48–64, https://doi.org/10.1007/s004100050404, 1998.
Harris, D. M. and Rose, W. I.: Dynamics of carbon dioxide emissions, crystallization, and magma ascent: hypotheses, theory, and applications to volcano monitoring at Mount St. Helens, Bull. Volcanol., 58, 163–174, https://doi.org/10.1007/s004450050133, 1996.
Hase, F., Hannigan, J. W., Coffey, M. T., Goldman, A., Höpfner, M., Jones, N. B., Rinsland, C. P., and Wood, S. W.: Intercomparison of retrieval codes used for the analysis of high-resolution, ground-based FTIR measurements, Journal of Quantitative Spectroscopy and Radiative Transfer, 87, 25–52, https://doi.org/10.1016/j.jqsrt.2003.12.008, 2004.
Hayer, C., Burton, M., Ferrazzini, V., Esse, B., and Di Muro, A.: Unusually high SO2 emissions and plume height from Piton de la Fournaise volcano during the April 2020 eruption, Bull. Volcanol., 85, 21, https://doi.org/10.1007/s00445-023-01628-1, 2023.
Hedelt, P., Reichardt, J., Lauermann, F., Weiß, B., Theys, N., Redondas, A., Barreto, A., Garcia, O., and Loyola, D.: Analysis of the long-range transport of the volcanic plume from the 2021 Tajogaite/Cumbre Vieja eruption to Europe using TROPOMI and ground-based measurements, Atmos. Chem. Phys., 25, 1253–1272, https://doi.org/10.5194/acp-25-1253-2025, 2025.
Herkommer, B.: Improving the consistency of greenhouse gas measurements from ground-based remote sensing instruments using a portable FTIR spectrometer, https://doi.org/10.5445/IR/1000168723, 2024.
Herkommer, B., Alberti, C., Castracane, P., Chen, J., Dehn, A., Dietrich, F., Deutscher, N. M., Frey, M. M., Groß, J., Gillespie, L., Hase, F., Morino, I., Pak, N. M., Walker, B., and Wunch, D.: Using a portable FTIR spectrometer to evaluate the consistency of Total Carbon Column Observing Network (TCCON) measurements on a global scale: the Collaborative Carbon Column Observing Network (COCCON) travel standard, Atmos. Meas. Tech., 17, 3467–3494, https://doi.org/10.5194/amt-17-3467-2024, 2024.
Herman, J., Cede, A., Spinei, E., Mount, G., Tzortziou, M., and Abuhassan, N.: NO2 column amounts from ground-based Pandora and MFDOAS spectrometers using the direct-sun DOAS technique: Intercomparisons and application to OMI validation, J. Geophys. Res., 114, 2009JD011848, https://doi.org/10.1029/2009JD011848, 2009.
IRWG: Infrared Working Group Uniform Retrieval Parameter Summary, Tech. rep., http://www.acom.ucar.edu/irwg/IRWG_Uniform_RP_Summary-3.pdf (last access: 24/10/2025), 2014.
Jarosewich, E., Nelen, J. A., and Norberg, J. A.: Reference Samples for Electron Microprobe Analysis*, Geostandards Newsletter, 4, 43–47, https://doi.org/10.1111/j.1751-908X.1980.tb00273.x, 1980.
Jiménez, J., Gasco Cavero, S., Marazuela, M. Á., Baquedano, C., Laspidou, C., Santamarta, J. C., and García-Gil, A.: Effects of the 2021 La Palma volcanic eruption on groundwater hydrochemistry: Geochemical modelling of endogenous CO2 release to surface reservoirs, water-rock interaction and influence of thermal and seawater, Science of The Total Environment, 929, 172594, https://doi.org/10.1016/j.scitotenv.2024.172594, 2024.
Jugo, P. J.: Sulfur content at sulfide saturation in oxidized magmas, Geology, 37, 415–418, https://doi.org/10.1130/G25527A.1, 2009.
Kern, C., Lerner, A. H., Elias, T., Nadeau, P. A., Holland, L., Kelly, P. J., Werner, C. A., Clor, L. E., and Cappos, M.: Quantifying gas emissions associated with the 2018 rift eruption of Kīlauea Volcano using ground-based DOAS measurements, Bull. Volcanol., 82, 55, https://doi.org/10.1007/s00445-020-01390-8, 2020.
Klügel, A., Hoernle, K. A., Schmincke, H., and White, J. D. L.: The chemically zoned 1949 eruption on La Palma (Canary islands): Petrologic evolution and magma supply dynamics of a rift zone eruption, J. Geophys. Res., 105, 5997–6016, https://doi.org/10.1029/1999JB900334, 2000.
La Spina, A., Burton, M., Allard, P., Alparone, S., and Muré, F.: Open-path FTIR spectroscopy of magma degassing processes during eight lava fountains on Mount Etna, Earth and Planetary Science Letters, 413, 123–134, https://doi.org/10.1016/j.epsl.2014.12.038, 2015.
La Spina, A., Burton, M., Salerno, G., and Caltabiano, T.: Insights into magma dynamics at Etna (Sicily) from SO2 and HCl fluxes during the 2008–2009 eruption, Geology, 51, 419–423, https://doi.org/10.1130/G50707.1, 2023.
Lo Forte, F. M., Schiavi, F., Rose-Koga, E. F., Rotolo, S. G., Verdier-Paoletti, M., Aiuppa, A., and Zanon, V.: High CO2 in the mantle source of ocean island basanites, Geochimica et Cosmochimica Acta, 368, 93–111, https://doi.org/10.1016/j.gca.2024.01.016, 2024.
Longpré, M.-A., Stix, J., Klügel, A., and Shimizu, N.: Mantle to surface degassing of carbon- and sulphur-rich alkaline magma at El Hierro, Canary Islands, Earth and Planetary Science Letters, 460, 268–280, https://doi.org/10.1016/j.epsl.2016.11.043, 2017.
Longpré, M.-A., Tramontano, S., Pankhurst, M. J., Roman, D. C., Reiss, M. C., Cortese, F., James, M. R., Spina, L., Rodríguez, F., Coldwell, B., Martín-Lorenzo, A., Barbee, O., D'Auria, L., Chamberlain, K. J., and Scarrow, J. H.: Shifting melt composition linked to volcanic tremor at Cumbre Vieja volcano, Nat. Geosci., https://doi.org/10.1038/s41561-024-01623-x, 2025.
López-Darias, J., Rodríguez, S., de la Rosa, J., Vilches, J., Boulesteix, T., Taquet, N., Belbachir, I., Villena-Armas, G., Sánchez de La Campa, A. M., García O., and Ayala, J. H.: Source apportionment of processes contributing to volcanic PM10 aerosols during the 2021 eruption of Tajogaite. Science of the Total Environment, 1000, 180321, https://doi.org/10.1016/j.scitotenv.2025.180321, 2025.
Mather, T. A., Witt, M. L. I., Pyle, D. M., Quayle, B. M., Aiuppa, A., Bagnato, E., Martin, R. S., Sims, K. W. W., Edmonds, M., Sutton, A. J., and Ilyinskaya, E.: Halogens and trace metal emissions from the ongoing 2008 summit eruption of Kīlauea volcano, Hawai`i, Geochimica et Cosmochimica Acta, 83, 292–323, https://doi.org/10.1016/j.gca.2011.11.029, 2012.
Medina, F. M., Guerrero-Campos, M., Hernández Martín, G., Boulesteix, T., Weiser, F., Walentowitz, A., Jentsch, A., Beierkuhnlein, C., Marrero, P., Shatto, C., Chano, V., and Nogales, M.: Seed Bank and Ashfalls: The Ecological Resetting Effect of the Recent Tajogaite Volcano Eruption in the Canary Pine Forest (La Palma, Spain), J. Vegetation Science, 36, e70045, https://doi.org/10.1111/jvs.70045, 2025.
Mezcua, J. and Rueda, J.: Seismic swarms and earthquake activity b-value related to the September 19, 2021, La Palma volcano eruption in Cumbre Vieja, Canary islands (Spain), Bull. Volcanol., 85, 32, https://doi.org/10.1007/s00445-023-01646-z, 2023.
Milford, C., Torres, C., Vilches, J., Gossman, A.-K., Weis, F., Suárez-Molina, D., García, O. E., Prats, N., Barreto, Á., García, R. D., Bustos, J. J., Marrero, C. L., Ramos, R., Chinea, N., Boulesteix, T., Taquet, N., Rodríguez, S., López-Darias, J., Sicard, M., Córdoba-Jabonero, C., and Cuevas, E.: Impact of the 2021 La Palma volcanic eruption on air quality: Insights from a multidisciplinary approach, Science of The Total Environment, 869, 161652, https://doi.org/10.1016/j.scitotenv.2023.161652, 2023.
MITECO: Inventory Informative Report (Informe de Inventario de Emisiones de Contaminantes a la Atmósfera), Ministerio para la Transición Ecológica y el Reto Demográfico Secretaría General Técnica, Centro de Publicaciones (2023), https://www.miteco.gob.es/content/dam/miteco/es/calidad-y-evaluacion-ambiental/temas/sistema-espanol-de-inventario-sei-/es_iir_edicion2023_tcm30-560375.pdf (last access: 26 October 2025), 2023.
Moussallam, Y., Oppenheimer, C., and Scaillet, B.: On the relationship between oxidation state and temperature of volcanic gas emissions, Earth and Planetary Science Letters, 520, 260–267, https://doi.org/10.1016/j.epsl.2019.05.036, 2019.
Muñoz, V., Walter, T. R., Zorn, E. U., Shevchenko, A. V., González, P. J., Reale, D., and Sansosti, E.: Satellite Radar and Camera Time Series Reveal Transition from Aligned to Distributed Crater Arrangement during the 2021 Eruption of Cumbre Vieja, La Palma (Spain), Remote Sensing, 14, 6168, https://doi.org/10.3390/rs14236168, 2022.
O'Neill, H. St. C.: The Thermodynamic Controls on Sulfide Saturation in Silicate Melts with Application to Ocean Floor Basalts, in: Geophysical Monograph Series, edited by: Moretti, R. and Neuville, D. R., Wiley, 177–213, https://doi.org/10.1002/9781119473206.ch10, 2021.
Oppenheimer, C., Francis, P., Burton, M., Maciejewski, A. J. H., and Boardman, L.: Remote measurement of volcanic gases by Fourier transform infrared spectroscopy, Applied Physics B: Lasers & Optics, 67, https://doi.org/10.1007/s003400050536,1998.
Oppenheimer, C., Burton, M. R., Durieux, J., and Pyle, D. M.: Open-path Fourier transform spectroscopy of gas emissions from Oldoinyo Lengai volcano, Tanzania, Optics and Lasers in Engineering, 37, 203–214, https://doi.org/10.1016/s0143-8166(01)00095-1, 2002.
Oppenheimer, C., Scaillet, B., Woods, A., Sutton, A. J., Elias, T., and Moussallam, Y.: Influence of eruptive style on volcanic gas emission chemistry and temperature, Nature Geosci, 11, 678–681, https://doi.org/10.1038/s41561-018-0194-5, 2018.
Padrón, E., Pérez, N. M., Hernández, P. A., Sumino, H., Melián, G. V., Alonso, M., Rodríguez, F., Asensio-Ramos, M., and D'Auria, L.: Early Precursory Changes in the3 He/4 He Ratio Prior to the 2021 Tajogaite Eruption at Cumbre Vieja Volcano, La Palma, Canary Islands, Geophysical Research Letters, 49, e2022GL099992, https://doi.org/10.1029/2022GL099992, 2022.
Pankhurst, M. J., Scarrow, J. H., Barbee, O. A., Hickey, J., Coldwell, B. C., Rollinson, G. K., Rodríguez-Losada, J. A., Martín Lorenzo, A., Rodríguez, F., Hernández, W., Calvo Fernández, D., Hernández, P. A., and Pérez, N. M.: Rapid response petrology for the opening eruptive phase of the 2021 Cumbre Vieja eruption, La Palma, Canary Islands, Volcanica, 5, 1–10, https://doi.org/10.30909/vol.05.01.0110, 2022.
PEVOLCA: Scientific Committee Report 25/12/2021: Actualización de la actividad volcánica en Cumbre Vieja (La Palma), https://info.igme.es/eventos/Erupcion-volcanica-la-palma/pevolca (last access: 26 October 2025), 2021.
Platt, U. and Stutz, J.: Differential Absorption Spectroscopy, in: Differential Optical Absorption Spectroscopy, Springer Berlin Heidelberg, Berlin, Heidelberg, 135–174, https://doi.org/10.1007/978-3-540-75776-4_6, 2008.
Pfeffer, M., Bergsson, B., Barsotti, S., Stefánsdóttir, G., Galle, B., Arellano, S., Conde, V., Donovan, A., Ilyinskaya, E., Burton, M., Aiuppa, A., Whitty, R., Simmons, I., Arason, Þ., Jónasdóttir, E., Keller, N., Yeo, R., Arngrímsson, H., Jóhannsson, Þ., Butwin, M., Askew, R., Dumont, S., Von Löwis, S., Ingvarsson, Þ., La Spina, A., Thomas, H., Prata, F., Grassa, F., Giudice, G., Stefánsson, A., Marzano, F., Montopoli, M., and Mereu, L.: Ground-Based Measurements of the 2014–2015 Holuhraun Volcanic Cloud (Iceland), Geosciences, 8, 29, https://doi.org/10.3390/geosciences8010029, 2018.
Pfeffer, M. A., Arellano, S., Barsotti, S., Petersen, G. N., Barnie, T., Ilyinskaya, E., Hjörvar, T., Bali, E., Pedersen, G. B. M., Guðmundsson, G. B., Vogfjorð, K., Ranta, E. J., Óladóttir, B. A., Edwards, B. A., Moussallam, Y., Stefánsson, A., Scott, S. W., Smekens, J.-F., Varnam, M., and Titos, M.: SO2 emission rates and incorporation into the air pollution dispersion forecast during the 2021 eruption of Fagradalsfjall, Iceland, Journal of Volcanology and Geothermal Research, 449, 108064, https://doi.org/10.1016/j.jvolgeores.2024.108064, 2024.
Plank, S., Shevchenko, A. V., d'Angelo, P., Gstaiger, V., González, P. J., Cesca, S., Martinis, S., and Walter, T. R.: Combining thermal, tri-stereo optical and bi-static InSAR satellite imagery for lava volume estimates: the 2021 Cumbre Vieja eruption, La Palma, Sci. Rep., 13, 2057, https://doi.org/10.1038/s41598-023-29061-6, 2023.
Powers, J. G., Klemp, J. B., Skamarock, W. C., Davis, C. A., Dudhia, J., Gill, D. O., Coen, J. L., Gochis, D. J., Ahmadov, R., Peckham, S. E., Grell, G. A., Michalakes, J., Trahan, S., Benjamin, S. G., Alexander, C. R., Dimego, G. J., Wang, W., Schwartz, C. S., Romine, G. S., Liu, Z., Snyder, C., Chen, F., Barlage, M. J., Yu, W., and Duda, M. G.: The Weather Research and Forecasting Model: Overview, System Efforts, and Future Directions, Bulletin of the American Meteorological Society, 98, 1717–1737, https://doi.org/10.1175/BAMS-D-15-00308.1, 2017.
Rivalta, E. and Segall, P.: Magma compressibility and the missing source for some dike intrusions, Geophysical Research Letters, 35, 2007GL032521, https://doi.org/10.1029/2007GL032521, 2008.
Rodgers, C. D.: Inverse Methods for Atmospheric Sounding: Theory and Practice, WORLD SCIENTIFIC, https://doi.org/10.1142/3171, 2000.
Rodríguez, S., Alastuey, A., and Querol, X.: A review of methods for long term in situ characterization of aerosol dust, Aeolian Research, 6, 55–74, https://doi.org/10.1016/j.aeolia.2012.07.004, 2012.
Román, R., González, R., Antuña-Sánchez, J.-C., Barreto, , Martín, P., Toledano, C., Ramos, R., Cazorla, A., Herrero-Anta, S., Mateos, D., García, O. E., González-Fernández, D., Carracedo, R., Herreras-Giralda, M., Carreño, V., Calle, A., Cachorro, V. E., Cuevas, E., and de Frutos, M.: Vertical profiles of aerosol properties retrieved at La Palma, Canary Islands, during the Cumbre-Vieja volcano eruption in September–October 2021, in: Conference European Lidar Conference 2021 (ELC2021), p. S05P14, 2021.
Romero, J. E., Burton, M., Cáceres, F., Taddeucci, J., Civico, R., Ricci, T., Pankhurst, M. J., Hernández, P. A., Bonadonna, C., Llewellin, E. W., Pistolesi, M., Polacci, M., Solana, C., D'Auria, L., Arzilli, F., Andronico, D., Rodríguez, F., Asensio-Ramos, M., Martín-Lorenzo, A., Hayer, C., Scarlato, P., and Perez, N. M.: The initial phase of the 2021 Cumbre Vieja ridge eruption (Canary islands): Products and dynamics controlling edifice growth and collapse, Journal of Volcanology and Geothermal Research, 431, 107642, https://doi.org/10.1016/j.jvolgeores.2022.107642, 2022.
Rose-Koga, E. F., Bouvier, A.-S., Gaetani, G. A., Wallace, P. J., Allison, C. M., Andrys, J. A., Angeles De La Torre, C. A., Barth, A., Bodnar, R. J., Bracco Gartner, A. J. J., Butters, D., Castillejo, A., Chilson-Parks, B., Choudhary, B. R., Cluzel, N., Cole, M., Cottrell, E., Daly, A., Danyushevsky, L. V., DeVitre, C. L., Drignon, M. J., France, L., Gaborieau, M., Garcia, M. O., Gatti, E., Genske, F. S., Hartley, M. E., Hughes, E. C., Iveson, A. A., Johnson, E. R., Jones, M., Kagoshima, T., Katzir, Y., Kawaguchi, M., Kawamoto, T., Kelley, K. A., Koornneef, J. M., Kurz, M. D., Laubier, M., Layne, G. D., Lerner, A., Lin, K.-Y., Liu, P.-P., Lorenzo-Merino, A., Luciani, N., Magalhães, N., Marschall, H. R., Michael, P. J., Monteleone, B. D., Moore, L. R., Moussallam, Y., Muth, M., Myers, M. L., Narváez, D. F., Navon, O., Newcombe, M. E., Nichols, A. R. L., Nielsen, R. L., Pamukcu, A., Plank, T., Rasmussen, D. J., Roberge, J., Schiavi, F., Schwartz, D., Shimizu, K., Shimizu, K., Shimizu, N., Thomas, J. B., Thompson, G. T., Tucker, J. M., Ustunisik, G., Waelkens, C., Zhang, Y., and Zhou, T.: Silicate melt inclusions in the new millennium: A review of recommended practices for preparation, analysis, and data presentation, Chemical Geology, 570, 120145, https://doi.org/10.1016/j.chemgeo.2021.120145, 2021.
Ruggieri, F., Forte, G., Bocca, B., Casentini, B., Bruna Petrangeli, A., Salatino, A., and Gimeno, D.: Potentially harmful elements released by volcanic ash of the 2021 Tajogaite eruption (Cumbre Vieja, La Palma Island, Spain): Implications for human health, Science of The Total Environment, 905, 167103, https://doi.org/10.1016/j.scitotenv.2023.167103, 2023.
Sánchez-España, J., Mata, M. P., Vegas, J., Lozano, G., Mediato, J., Martínez Martínez, J., Galindo, I., Sánchez, N., Del Moral, B., Ordóñez, B., De Vergara, A., Nieto, A., Andrés, M., Vázquez, I., Bellido, E., and Castillo-Carrión, M.: Leaching tests reveal fast aluminum fluoride release from ashfall accumulated in La Palma (Canary Islands, Spain) after the 2021 Tajogaite eruption, Journal of Volcanology and Geothermal Research, 444, 107959, https://doi.org/10.1016/j.jvolgeores.2023.107959, 2023.
Saumur, B. M., Cruden, A. R., and Boutelier, D.: Sulfide Liquid Entrainment by Silicate Magma: Implications for the Dynamics and Petrogenesis of Magmatic Sulfide Deposits, J. Petrology, 56, 2473–2490, https://doi.org/10.1093/petrology/egv080, 2015.
Sawyer, G. M., Carn, S. A., Tsanev, V. I., Oppenheimer, C., and Burton, M.: Investigation into magma degassing at Nyiragongo volcano, Democratic Republic of the Congo, Geochem. Geophys. Geosyst., 9, https://doi.org/10.1029/2007gc001829, 2008a.
Sawyer, G. M., Oppenheimer, C., Tsanev, V. I., and Yirgu, G.: Magmatic degassing at Erta 'Ale volcano, Ethiopia, Journal of Volcanology and Geothermal Research, 178, 837–846, https://doi.org/10.1016/j.jvolgeores.2008.09.017, 2008b.
Schneider, M., Blumenstock, T., Chipperfield, M. P., Hase, F., Kouker, W., Reddmann, T., Ruhnke, R., Cuevas, E., and Fischer, H.: Subtropical trace gas profiles determined by ground-based FTIR spectroscopy at Izaña (28° N, 16° W): Five-year record, error analysis, and comparison with 3-D CTMs, Atmos. Chem. Phys., 5, 153–167, https://doi.org/10.5194/acp-5-153-2005, 2005.
Seinfeld, J. H. and Pandis, S. N. : Atmospheric Chemistry and Physics: From Air Pollution to Climate Change, Wiley-VCH, New York, ISBN 0-471-17815-2, 1997.
Shinohara, H., Kazahaya, K., Saito, G., Fukui, K., and Odai, M.: Variation of CO2 SO2 ratio in volcanic plumes of Miyakejima: Stable degassing deduced from heliborne measurements, Geophysical Research Letters, 30, 2002GL016105, https://doi.org/10.1029/2002GL016105, 2003.
Shinohara, H., Aiuppa, A., Giudice, G., Gurrieri, S., and Liuzzo, M.: Variation of H2O/CO2 and CO2 SO2 ratios of volcanic gases discharged by continuous degassing of Mount Etna volcano, Italy, J. Geophys. Res., 113, 2007JB005185, https://doi.org/10.1029/2007JB005185, 2008.
Skamarock, W. C., Klemp, J. B., Dudhia, J., Gill, D. O., Liu, Z., Berner, J., Wang, W., Powers, J. G., Duda, M. G., Barker, D. M., and Huang, X.-Y.: A Description of the Advanced Research WRF Model Version 4, UCAR/NCAR, https://doi.org/10.5065/1DFH-6P97, 2019.
Smale, D., Hannigan, J. W., Lad, S., Murphy, M., McGaw, J., and Robinson, J.: Opportunistic observations of Mount Erebus volcanic plume HCl, HF and SO2 by high resolution solar occultation mid infra-red spectroscopy, Journal of Quantitative Spectroscopy and Radiative Transfer, 307, 108665, https://doi.org/10.1016/j.jqsrt.2023.108665, 2023.
Stremme, W., Grutter, M., Baylón, J., Taquet, N., Bezanilla, A., Plaza-Medina, E., Schiavo, B., Rivera, C., Blumenstock, T., and Hase, F.: Direct solar FTIR measurements of CO2 and HCl in the plume of Popocatépetl Volcano, Mexico, Front. Earth Sci., 11, 1022976, https://doi.org/10.3389/feart.2023.1022976, 2023.
Taquet, N., Stremme, W., Grutter, M., Baylón, J., Bezanilla, A., Schiavo, B., Rivera, C., Campion, R., Boulesteix, T., Nieto-Torres, A., Espinasa-Pereña, R., Blumenstock, T., and Hase, F.: Variability in the Gas Composition of the Popocatépetl Volcanic Plume, Front. Earth Sci., 7, 114, https://doi.org/10.3389/feart.2019.00114, 2019.
Taquet, N., Rivera Cárdenas, C., Stremme, W., Boulesteix, T., Bezanilla, A., Grutter, M., García, O., Hase, F., and Blumenstock, T.: Combined direct-sun ultraviolet and infrared spectroscopies at Popocatépetl volcano (Mexico), Front. Earth Sci., 11, 1062699, https://doi.org/10.3389/feart.2023.1062699, 2023.
Theys, N., Fioletov, V., Li, C., De Smedt, I., Lerot, C., McLinden, C., Krotkov, N., Griffin, D., Clarisse, L., Hedelt, P., Loyola, D., Wagner, T., Kumar, V., Innes, A., Ribas, R., Hendrick, F., Vlietinck, J., Brenot, H., and Van Roozendael, M.: A sulfur dioxide Covariance-Based Retrieval Algorithm (COBRA): application to TROPOMI reveals new emission sources, Atmos. Chem. Phys., 21, 16727–16744, https://doi.org/10.5194/acp-21-16727-2021, 2021.
Torres-González, P. A., Luengo-Oroz, N., Lamolda, H., D'Alessandro, W., Albert, H., Iribarren, I., Moure-García, D., and Soler, V.: Unrest signals after 46 years of quiescence at Cumbre Vieja, La Palma, Canary islands, Journal of Volcanology and Geothermal Research, 392, 106757, https://doi.org/10.1016/j.jvolgeores.2019.106757, 2020.
Ubide, T., Márquez, Á., Ancochea, E., Huertas, M. J., Herrera, R., Coello-Bravo, J. J., Sanz-Mangas, D., Mulder, J., MacDonald, A., and Galindo, I.: Discrete magma injections drive the 2021 La Palma eruption, Sci. Adv., 9, eadg4813, https://doi.org/10.1126/sciadv.adg4813, 2023.
Valade, S., Ley, A., Massimetti, F., D'Hondt, O., Laiolo, M., Coppola, D., Loibl, D., Hellwich, O., and Walter, T. R.: Towards Global Volcano Monitoring Using Multisensor Sentinel Missions and Artificial Intelligence: The MOUNTS Monitoring System, Remote Sensing, 11, 1528, https://doi.org/10.3390/rs11131528, 2019.
Vandaele, A. C., Hermans, C., and Fally, S.: Fourier transform measurements of SO2 absorption cross sections: II., Journal of Quantitative Spectroscopy and Radiative Transfer, 110, 2115–2126, https://doi.org/10.1016/j.jqsrt.2009.05.006, 2009.
Van Gerve, T. D., Neave, D. A., Wieser, P., Lamadrid, H., Hulsbosch, N., and Namur, O.: The Origin and Differentiation of CO 2 -Rich Primary Melts in Ocean Island Volcanoes: Integrating 3D X-Ray Tomography with Chemical Microanalysis of Olivine-Hosted Melt Inclusions from Pico (Azores), Journal of Petrology, 65, egae006, https://doi.org/10.1093/petrology/egae006, 2024.
Von Glasow, R., Bobrowski, N., and Kern, C.: The effects of volcanic eruptions on atmospheric chemistry, Chemical Geology, 263, 131–142, https://doi.org/10.1016/j.chemgeo.2008.08.020, 2009.
Vasileva, A., Moiseenko, K., Skorokhod, A., Belikov, I., Kopeikin, V., and Lavrova, O.: Emission ratios of trace gases and particles for Siberian forest fires on the basis of mobile ground observations, Atmos. Chem. Phys., 17, 12303–12325, https://doi.org/10.5194/acp-17-12303-2017, 2017.
Voigt, C., Jessberger, P., Jurkat, T., Kaufmann, S., Baumann, R., Schlager, H., Bobrowski, N., Giuffrida, G., and Salerno, G.: Evolution of CO2, SO2, HCl, and HNO3 in the volcanic plumes from Etna, Geophys. Res. Lett., 41, 2196–2203, https://doi.org/10.1002/2013GL058974, 2014.
Walter, T. R., Zorn, E. U., González, P. J., Sansosti, E., Muñoz, V., Shevchenko, A. V., Plank, S. M., Reale, D. and Richter, N.: Late complex tensile fracturing interacts with topography at Cumbre Vieja, La Palma, Volcanica, 6, 1–17, https://doi.org/10.30909/vol.06.01.0117, 2023.
Wardell, L. J., Kyle, P. R., and Chaffin, C.: Carbon dioxide and carbon monoxide emission rates from an alkaline intra-plate volcano: Mt. Erebus, Antarctica, Journal of Volcanology and Geothermal Research, 131, 109–121, https://doi.org/10.1016/S0377-0273(03)00320-2, 2004.
Werner, C., Evans, W. C., Kelly, P. J., McGimsey, R., Pfeffer, M., Doukas, M., and Neal, C.: Deep magmatic degassing versus scrubbing: Elevated CO 2 emissions and in the lead-up to the 2009 eruption of Redoubt Volcano, Alaska, Geochem. Geophys. Geosyst., 13, 2011GC003794, https://doi.org/10.1029/2011GC003794, 2012.
Wieser, P. and Gleeson, M.: PySulfSat: An open-source Python3 Tool for modeling sulfide and sulfate saturation, Volcanica, 6, 107–127, https://doi.org/10.30909/vol.06.01.107127, 2023.
WMO: 19th WMO/IAEA Meeting on Carbon Dioxide, Other Greenhouse Gases and Related Tracers Measurement Techniques (GGMT-2017), Dübendorf, Switzerland, 27–31 August 2017, GAW Report No. 242, World Meteorological Organization, Geneva, Switzerland, https://community.wmo.int/en/meetings/19th-wmoiaea-meeting-carbon-dioxide-other-greenhouse-gases-and-related-measurement-techniques-ggmt-2017 (last access: 26 October 2025), 2018.
Wunch, D., Toon, G. C., Blavier, J. F. L., Washenfelder, R. A., Notholt, J., Connor, B. J., Griffith, D. W. T., Sherlock, V., and Wennberg, P. O.: The total carbon column observing network, Philos. T. R. Soc. A, 369, 2087–2112, 2011.
Yokelson, R. J., Karl, T., Artaxo, P., Blake, D. R., Christian, T. J., Griffith, D. W. T., Guenther, A., and Hao, W. M.: The Tropical Forest and Fire Emissions Experiment: overview and airborne fire emission factor measurements, Atmos. Chem. Phys., 7, 5175–5196, https://doi.org/10.5194/acp-7-5175-2007, 2007.
Zhang, B., Shen, H., Yun, X., Zhong, Q., Henderson, B. H., Wang, X., Shi, L., Gunthe, S. S., Huey, L. G., Tao, S., Russell, A. G., and Liu, P.: Global Emissions of Hydrogen Chloride and Particulate Chloride from Continental Sources, Environ. Sci. Technol., 56, 3894–3904, https://doi.org/10.1021/acs.est.1c05634, 2022.
Zhang, C., Koepke, J., Wang, L., Wolff, P. E., Wilke, S., Stechern, A., Almeev, R., and Holtz, F.: A Practical Method for Accurate Measurement of Trace Level Fluorine in Mg- and Fe-Bearing Minerals and Glasses Using Electron Probe Microanalysis, Geostandard Geoanalytic Res., 40, 351–363, https://doi.org/10.1111/j.1751-908X.2015.00390.x, 2016.
- Abstract
- Introduction
- Gas and particulate matter measurement sites and instrumentation
- FTIR and DOAS analysis: specific SO2, HCl, HF, CO2, and CO retrievals
- Results
- Discussion
- Summary and conclusions
- Appendix A: Comparison between the new HF and HCl products derived from the IFS-125HR and EM27/SUN measurements
- Appendix B
- Appendix C
- Appendix D
- Appendix E
- Data availability
- Author contributions
- Competing interests
- Disclaimer
- Acknowledgements
- Financial support
- Review statement
- References
- Supplement