the Creative Commons Attribution 4.0 License.
the Creative Commons Attribution 4.0 License.
 | 04 Nov 2025
Heterogeneous impacts of fire-sourced ozone (O3) pollution on global crop yields in the future climate scenarios
Rui Li
Yumeng Shao
Dongmei Tang
Yining Gao
Hongfang Zhao
Wildfire smoke often aggravates the ozone (O3) pollution and negatively affect crop yields. To date, the global impact of fire-sourced O3 exposure on crop yields still remained unknown. To address this issue, a multi-stage model was developed to quantify the global wildfire-induced ambient O3 concentrations in the future scenarios. The results suggested that the relationship between observed K+ and levoglucosan levels with simulated fire-sourced maximum daily average 8 h (MDA8) O3 concentration reached 0.67 and 0.73, respectively, indicating the robustness of fire-sourced O3 estimate. In both of historical and future scenarios, Sub-Sahara Africa (SS: 14.9±8.4 (historical) and 18.3±9.6 (mean of the future scenarios) µg m−3) and South America (SA: 4.0±2.5 and 4.7±3.2 µg m−3) showed the highest fire-sourced MDA8 O3 concentrations among all of the regions. However, the crop production losses (CPL) caused by O3 exposure reached the highest values in China due to very high total crop yields and relatively high wildfire-induced MDA8 O3 levels. Moreover, CPL in China was sensitive to emission scenario, indicating the effective emission control could largely decrease fire-sourced O3 damage to crop. In contrast, both of SS and SA even showed the higher CPL in low-carbon scenario (SSP1-2.6), suggesting more stringent control measures are required to offset the wildfire contribution. Our findings call for attention on the threat to future global food security from the absence of pollution mitigation and the persistence of global warming.
- Article
(2983 KB) - Full-text XML
-
Supplement
(2779 KB) - BibTeX
- EndNote


Along with the warming climate, large-scale wildfire events have experienced dramatic increases in frequency and intensity in the past decades, and the wildfire seasons have been significantly prolonged in many regions such as the western part of the United States and Australia (Jones et al., 2022; Richardson et al., 2022; Wang et al., 2022). Wildfire often released a large number of gaseous precursors such as carbon monoxide (CO), nitrogen dioxides (NOx), and volatile organic compounds (VOC) (Anderson et al., 2024; Xu et al., 2022), which could significantly enhance the ozone (O3) levels through photochemical reactions (Jaffe et al., 2013). Recent studies have revealed that wildfire contributed to 3.6 % of ambient all-source O3 level globally (Xu et al., 2023). The aggravation of O3 pollution not only poses detrimental effects on human health (Liu et al., 2018), but also reduced the crop yields because the excessive O3 exposure could affect plant photosynthesis via stomatal uptake (Karmakar et al., 2022; Zhao et al., 2020). Thus, quantifying the negative impacts of fire-sourced O3 pollution on crop yields was beneficial to propose optimal strategy to ensure agricultural production.
Notably, warming climate in the future not only would increase wildfire burned areas, but also intensified the severity of fire weather (Richardson et al., 2022; Wasserman and Mueller, 2023). Moreover, wildfire and heatwave have generated the positive feedback and the mechanism would be further enhanced in the future (Senande-Rivera et al., 2022; Zhao et al., 2024). Meanwhile, the ambient O3 concentration was very sensitive to air temperature, and the continuous increase of air temperature inevitably aggravate wildfire-related O3 pollution in the future (Bloomer et al., 2009; Li et al., 2024a; Selin et al., 2009). Therefore, it is necessary to analyze the spatiotemporal characteristics of global wildfire-induced O3 concentrations especially in the future scenarios, which was favorable to accurately identify the hotspots for wildfire-induced O3 pollution and to propose effective control measures targeting different future scenarios.
A growing body of studies have focused on the wildfire contribution to O3 pollution. Lee and Jaffe (2024) employed the generalized additive model (GAM) to predict the wildfire-related O3 concentration in the United States and found wildfire increased maximum daily average 8 h (MDA8) O3 concentration across the entire country (Lee and Jaffe, 2024). Besides, Xu et al. (2023) have quantified that the wildfire led to average 3.2 µg m−3 increase of O3 concentration globally using the GEOS-Chem model. Unfortunately, most of the current studies assessed the contribution of historical wildfire to ambient O3 level, and the estimates showed large uncertainties associated with the burned areas, fuel consumption, and fuel types. Moreover, most of these studies only focused on the historical estimates, while only two studies explored the wildfire contribution to O3 pollution in the future scenarios (Yang et al., 2022; Yue et al., 2015). Both of these studies only focused on wildfire in North America, whereas the future wildfire contribution to O3 pollution in other regions are still unknown. Moreover, their negative impacts on crop yields are also not clear. In fact, the global wheat yield losses reached 0.95 % (around 20 t km−2) per ppb O3 increase (Guarin et al., 2019). Although the current contribution ratio of wildfire to all-source O3 level is not high, the higher wildfire risk and total crop yields in the future scenarios highlights the seriousness of crop yield losses.
Here, our study developed an ensemble machine-learning model to predict fire-sourced MDA8 O3 levels under four future scenarios (SSP1-2.6, SSP2-4.5, SSP3-7.0, and SSP5-8.5). Then, the spatiotemporal variations of these concentrations and the key drivers behind them were further revealed. Finally, a crop yield loss assessment framework was applied to quantify the negative impacts (crop yield losses) of wildfire-induced O3 exposure on global crop yield. The hotspots of crop yield losses in different scenarios should be determined and the appropriate control measures should be proposed to reduce the economic losses.
2.1 Data preparation
Most ground-level MDA8 O3 observations focused on East Asia, India, Western Europe, and the contiguous United States. Daily MDA8 O3 data during 2015–2019 over China were collected from the Ministry of Ecology and Environment of China. The observation network comprises of 2000 monitoring sites distributed across various land-use types (Fig. S1 in the Supplement). Quality assurance for the ground-level observations in China was performed based on the HJ 630-2011 specifications. The dataset of daily MDA8 O3 concentrations from 2015 to 2019 in India were collected from the Central Pollution Control Board (CPCB) online database (https://airquality.cpcb.gov.in/ccr/#/caaqm-dashboard-all/caaqm-landing/caaqm-comparison-data, last access: 5 August 2025). The detailed data quality assurance/control has been introduced by Gurjar et al. (2016). Ground-level observation dataset for member countries of the European Economic Area were collected from the European Environment Agency. The data quality control of European Environment Agency was explained by Keller et al. (2021). The dataset of daily MDA8 O3 levels in more than 200 monitoring sites across the United States were downloaded from the website of https://www.epa.gov/ (last access: 7 August 2025) (Fig. S1). The quality control of these observations in EPA was carefully introduced by (Lamsal et al., 2015). Observation data in other countries and territories were downloaded from the website of OpenAQ (https://openaq.org/, last access: 12 July 2025). After the data cleaning and quality control, more than 300 000 daily MDA8 O3 measurements in 3015 sites were collected to simulate the global O3 concentrations. For O3, 1 part per billion (ppb) was approximated as 1.96 µg m−3 based on the standard air pressure and temperature (25.5 °C and 101.325 kPa). The Unite of O3 was changed into µg m−3 unified.
GEOS-Chem (v13.4.0) model was utilized to estimate atmospheric MDA8 O3 concentrations during 1 January–31 December during 2015–2019, 2045–2049, and 2095–2099 periods. In our study, the years of 2015–2019 was regarded as the historical period, whereas the years of 2045–2049 and 2095–2099 were regarded as the future period. This model comprises of a complex chemistry mechanism of tropospheric NOx-VOC-O3-aerosol (Geddes et al., 2016; Zhao et al., 2017). This model for O3 estimates during historical period and future scenario were driven by MERRA2 and GCAP2_CMIP6 reanalysis meteorological factors, respectively (Bali et al., 2021; Zhang, 2016). The future scenario includes SSP1-2.6 (low-carbon emission scenario), SSP2-4.5 (middle-carbon emission scenario), SSP3-7.0 (traditional energy scenario), and SS5-8.5 (high energy consumption scenario). A global simulation was performed at a spatial resolution of 2×2.5° resolution (Bindle et al., 2021; Wainwright et al., 2012). The historical anthropogenic emission inventory during 2015–2019 was downloaded from Community Emissions Data System (CEDS) (Hoesly et al., 2018). The anthropogenic and wildfire emissions during 2045–2049 and 2095–2099 were collected from the website of https://esgf-node.llnl.gov/search/input4mips/ (last access: 20 July 2025). Wildfire emission during 2015–2019 was obtained from GFED (Chen et al., 2023; Pan et al., 2020; Peiro et al., 2022; van Wees et al., 2022). Some other natural emission such as the lightning NOx emission was collected from http://geoschemdata.wustl.edu/ExtData/HEMCO/OFFLINE_LIGHTNING/v2020-03/MERRA2/ (last access: 22 July 2025) (Li et al., 2022; Nault et al., 2017; Verma et al., 2021). The whole simulation processes included four steps. Firstly, we run the GEOS-Chem model with all emissions (including wildfires) to establish reference O3 concentrations (Baseline simulation). Second, we repeated the simulation while excluding wildfire emissions with the same meteorological conditions (MERRA2 and GCAP2_CMIP6) and anthropogenic emission inventory (CEDS). Third, we computed the wildfire-induced O3 by subtracting zero-out results from the baseline. At last, we compare modeled O3 concentrations with observational data (e.g., ground-based measurements) to assess uncertainty.
Meteorological factors including 2 m dewpoint temperature (D2m), surface pressure (Sp), 2 m temperature (T2m), and total precipitation (Tp), 10 m wind component (U10 and V10) during 2015–2019 were collected from the fifth-generation European Centre for Medium-Range Weather Forecasts Reanalysis (ERA-5). All of these meteorological data showed the same spatial resolution of 0.25° × 0.25°. For the estimates in the future scenarios, the CMIP6 dataset in four scenarios (e.g., SSP1-2.6, SSP2-4.5, SSP3-7.0, and SSP5-8.5) were also applied to predict MDA8 O3 concentrations during 2015–2019, 2045–2049, and 2095–2099. The dataset includes simulated O3 concentrations, 2 m air temperatures, wind speed at 850 and 500 hPa, total cloud cover, precipitation, relative humidity, and short-wave radiation. The modelled meteorological parameters and chemical compositions derived from multiple earth system models were integrated into the machine-learning model. The detailed models are introduced in our previous studies (Li et al., 2024b). The elevation was collected from ETOPO at a spatial resolution of 1′. Additionally, the land use type data were downloaded from the reference of Liu et al. (2020).
2.2 Model development
A multi-stage model was developed to estimate the global fire-sourced MDA8 O3 concentrations (Fig. S2). In the first stage, the ground-level MDA8 O3 levels, meteorological factors, land use types, and simulated O3 levels derived from GEOS-Chem model were integrated into XGBoost model to simulate the full-coverage MDA8 O3 levels during 2015–2019. In the second stage, the simulated O3 concentrations and meteorological parameters in four scenarios (SSP1-2.6, SSP2-4.5, SSP3-7.0, and SSP5-8.5) during 2015–2019, 2045–2049, and 2095–2099 were collected from CMIP6 dataset including 16 earth system models. Then, the data in the future scenarios were integrated into the XGBoost model to further calibrate the CMIP6 modeling results based on historical dataset (2015–2019) derived from the first stage model. This stage could obtain the calibrated MDA8 O3 concentrations in different scenarios during 2015–2019, 2045–2049, and 2095–2099. The detailed equations of XGBoost model are summarized as follows:
where F(t) represents the cost function at the tth period; ∂ denotes the derivative of the function; means the second derivative of the function; l refers to the differentiable convex loss function that reveals the difference of the predicted O3 level (yΛ) of the ith instance at the tth period and the target value (yi); ft(x) is the increment; Ω(ft) reflects the regularizer. Maximum tree depth and learning rate are 20 and 0.1, respectively.
All of the independent variables obtained from various sources were resampled to 0.25° grids using Kriging interpolation. For the machine-learning model development, it was necessary to eliminate some redundant independent variables and then determine the optimal variable group. The redundant variables were identified based on the fact that the overall predictive accuracy could degrade after the removal of these variables. 10-fold cross-validation method was applied to examine the predictive accuracy of XGBoost model.
In the third/final stage, the calibrated MDA8 O3 concentrations based on previous two-stage models were utilized to optimize the fire-sourced MDA8 O3 concentrations. Due to uncertainties in the GFED and anthropogenic emission inventories, as well as in the chemical mechanisms, the simulated total and fire-sourced MDA8 O3 concentrations often deviate substantially from ground-based observations. Therefore, it is essential to use the calibrated MDA8 O3 concentrations from the previous two stages rather than the originally simulated values to adjust the fire-sourced O3 levels. However, the magnitude of the error between the simulated fire-sourced O3 concentrations and the actual values cannot be directly quantified. Based on previous studies (McDuffie et al., 2021), we assumed that the ratio of simulated fire-sourced O3 concentration to simulated total O3 concentration from the GEOS-Chem model was equivalent to the ratio of optimized fire-sourced O3 concentration to calibrated total O3 concentration. The detailed equations are summarized as follows:
where O3_opt_fire is optimized wildfire-induced MDA8 O3 concentration in the final stage. O3_cal_total is calibrated total MDA8 O3 concentration. O3_chem_fire is simulated wildfire-induced MDA8 O3 concentration using GEOS-Chem model. O3_chem_total is simulated total MDA8 O3 concentrations using GEOS-Chem model.
In future simulations of fire-sourced MDA8 O3 concentrations, we did not apply the historical ratio of fire-sourced O3 to total O3 concentrations to future scenarios directly, but used the GEOS-Chem model to calculate the ratios of fire-sourced O3 to total O3 concentrations under four future climate scenarios.
The modelling accuracy of fire-induced MDA8 O3 cannot be evaluated directly, whereas the modelling performance of total MDA8 O3 concentrations could be assessed. Some typical statistical indices (Supplement) were applied to evaluate the modelling accuracy of this model on the basis of the ground-level observations. For the accuracy of fire-sourced MDA8 O3 estimate, we used some fire fingerprints (K+ and levoglucosan) to assess their relationships with fire-sourced O3 concentrations. This method could also examine whether the assumption of in the stage 3 was right and suitable to our study.
2.3 The crop yield loss estimate
Maize, rice, spring wheat, and winter wheat were major food crops globally, and they were sensitive to O3 stress. A typical AOT40 exposure index was defined to assess the negative impact of O3 exposure on crop yields. The AOT40 index was calculated by summing the hourly mean O3 levels above 40 ppb during the 8 h over the crop growing season.
where [CO3]i is the hourly O3 (ppb), and n denotes the number of hours over the growing season. This growing season was determined by the University of Wisconsin Center for Sustainability and the Global Environment (UW SAGE) global crop calendar containing the planting and harvest dates by crop species and variety (Sacks et al., 2010; Schiferl and Heald, 2018). To date, some OTC/FACE experiments have been applied to assess the adverse effects of elevated O3 concentrations on maize, rice, spring wheat, and winter wheat. The relationships between AOT40 and the relative yields (RY) for major crops have also been developed in recent years. The detailed equations are shown in Table S1 in the Supplement. The relative yield loss (RYL) of crop is defined as
The estimated yield and economic losses are not only related to the RYL, while also associated with the grain yield in each grid. The detail equations are shown as follows:
where CPLi is the estimated crop production loss and CPi is the actual crop production in each grid during the study period.
The data about actual crop production in each grid were collected from The Agricultural Model Intercomparison and Improvement Project (AgMIP). The average value of simulated crop yields based on four models including DSSAT-Pythia, pDSSAT, LPJ-GUESS, and LPJ-ML were applied to estimate the actual crop production in each grid during 2015–2019, 2045–2049, and 2095–2099. We selected the simulate results of these models because they showed the better accuracy.
3.1 Model evaluation
Multi-source information data were integrated into the multi-stage model to predict fire-sourced MDA8 O3 concentrations globally. At first, the global MDA8 O3 simulation was evaluated. As illustrated in Fig. S3, the 10-fold cross-validation (CV) results suggested that the R2 value for MDA8 O3 estimate reached 0.72. The root mean square error (RMSE) and mean absolute error (MAE) for MDA8 O3 were 18.1 and 13.2 µg m−3, respectively (Fig. S3). The CV R2 value in our study reached 0.72, which was higher than that estimated by Liu et al. (2020) (0.64), indicating the satisfied predictive accuracy of O3 estimates. However, the result was slightly lower than that (R2: 0.80 and 0.81) estimated by Xu et al. (2023) and DeLang et al. (2021). It was supposed that the training samples in our study was much less than those used by Xu et al. (2023) (2000–2019 simulation) and DeLang et al. (2021) (1990–2019 simulation). It was well known that the predictive accuracy was strongly dependent on the sample size (Li et al., 2020a, b). Overall, the predictive performance of ambient O3 pollution was robust.
Although the prediction capability of this model has been well validated, the accuracy for the fire-sourced MDA8 O3 estimates could not be directly tested. It is well-known that potassium (K+) is often considered to be a fingerprint of wildfire, and thus we employ the relationship between ground-level K+ observations and wildfire-induced MDA8 O3 concentrations to examine the modelling accuracy. As shown in Fig. S3, the correlation (R value) between observed K+ levels and fire-sourced MDA8 O3 concentrations reached 0.67 (146 training samples), which was above 0.5 (p<0.01). The results have confirmed that the wildfire-induced O3 estimate showed the satisfied predictive performance. Although K+ has been often applied to reflect the wildfire contribution, the K+ could be also derived from anthropogenic emission and dust resuspension. To further validate the modelling performance of wildfire-related MDA8 O3, the strong fire fingerprint (levoglucosan) was employed to construct the relationship with fire-sourced MDA8 O3 concentrations. The results suggested that the R value (R=0.73) was even higher than that between observed K+ levels and fire-sourced MDA8 O3 concentrations. Overall, the predictive performance was close to some previous studies (Childs et al., 2022; O'Dell et al., 2019; Xu et al., 2023), and thus we could use the result to further perform the data analysis.
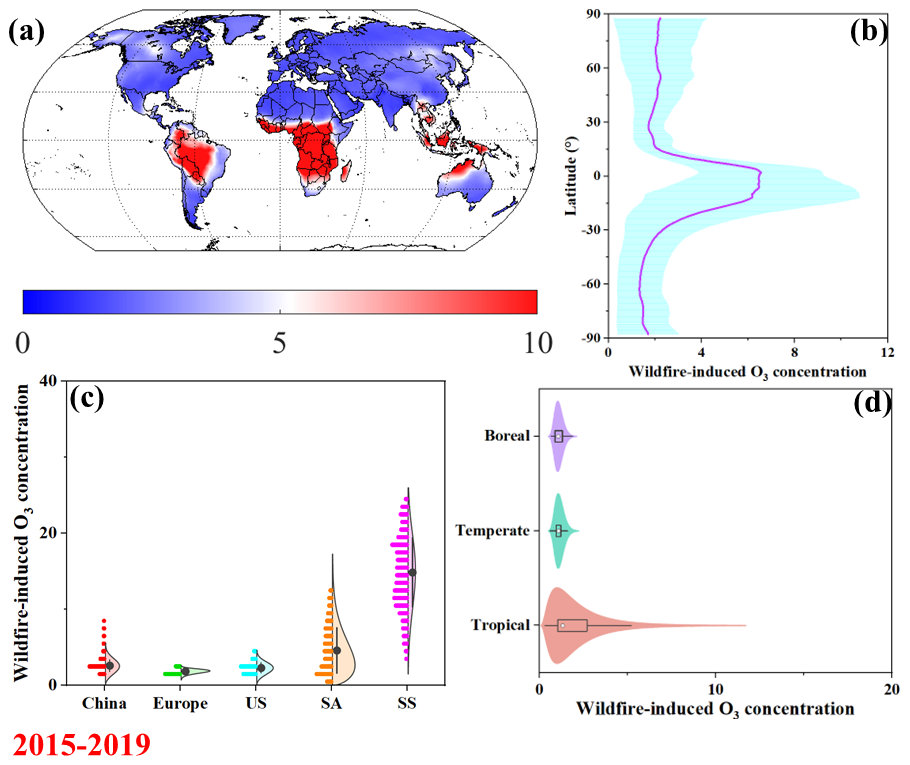
Figure 1The multi-year average concentrations of fire-sourced MDA8 O3 (unit: µg m−3) during 2015–2019 (2010s) at the global scale (a). The latitudinal variations of fire-sourced MDA8 O3 levels (Unit: µg m−3) (b). The spatial distributions of fire-sourced MDA8 O3 concentrations (unit: µg m−3) during 2015–2019 (2010s) (c). US, SA, and SS represent the United States, South America, and Sub-Sahara Africa, respectively. The difference of fire-sourced MDA8 O3 concentrations in different regions (d).
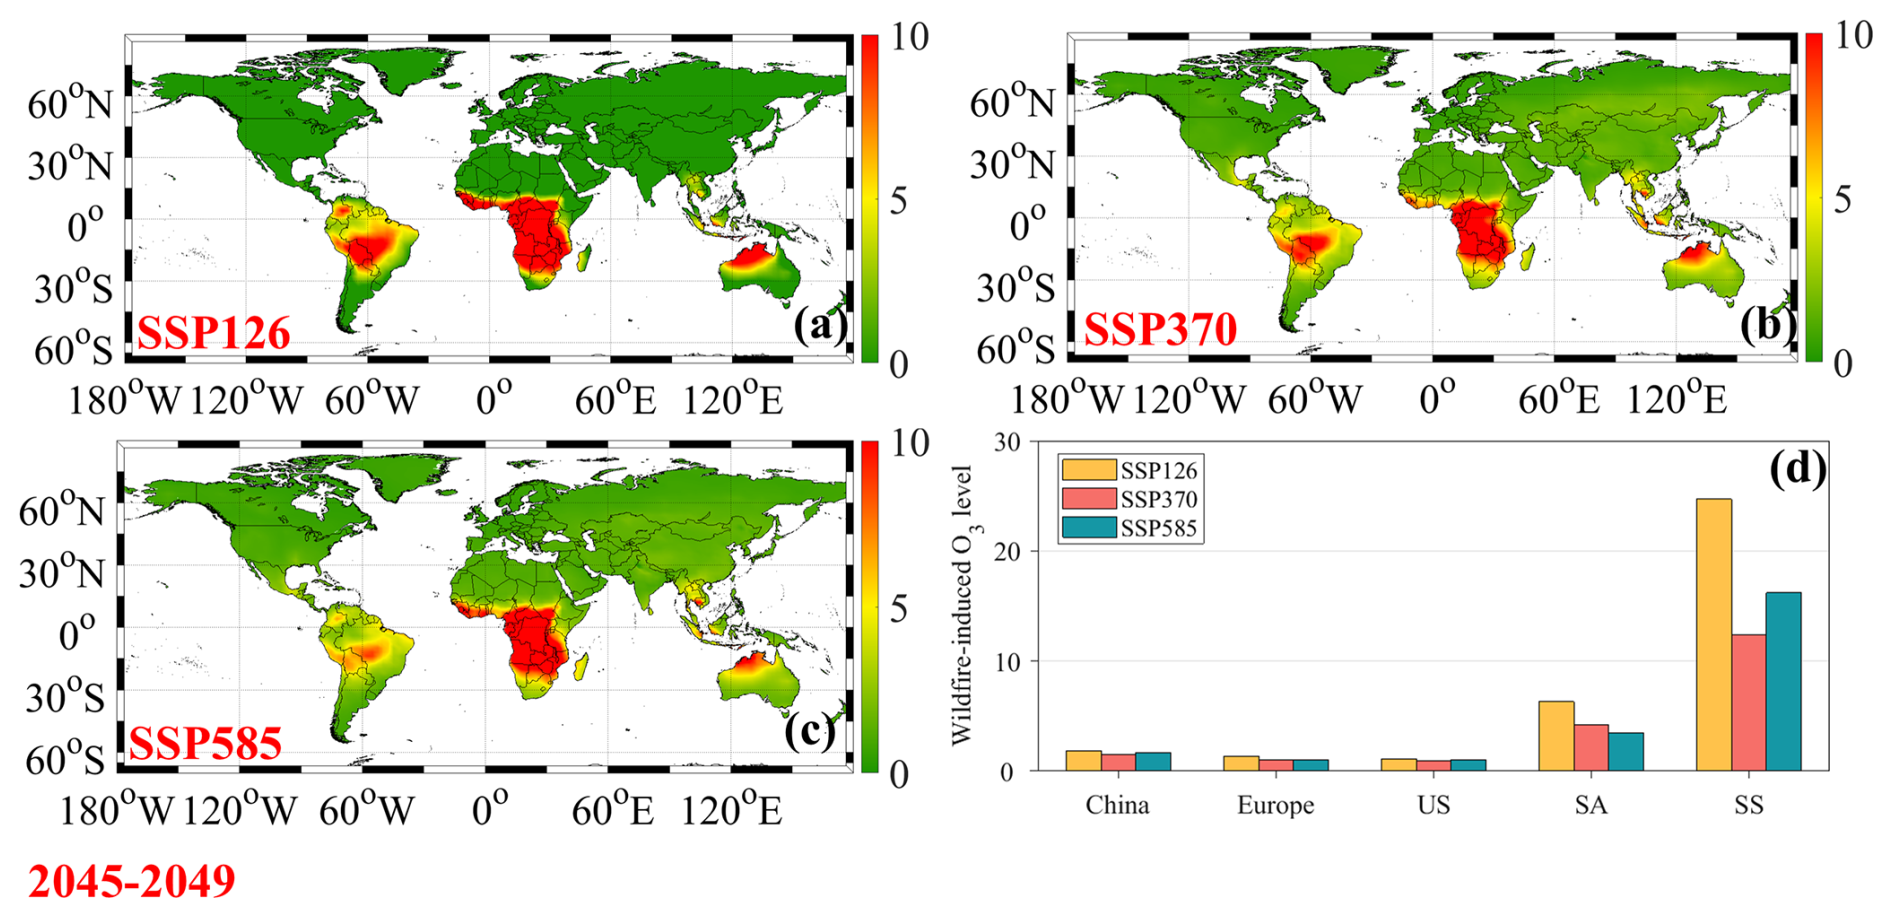
Figure 2The global variations of fire-sourced MDA8 O3 levels (unit: µg m−3) in SSP1-2.6 (a), SSP3-7.0 (b), and SSP5-8.5 (c) scenarios during 2040s. The spatial distributions of wildfire-related MDA8 O3 concentrations (unit: µg m−3) in different regions during 2040s (d). US, SA, and SS represent the United States, South America, and Sub-Sahara Africa, respectively.
3.2 Spatiotemporal trends of fire-sourced O3 concentrations
Global variations of fire-sourced MDA8 O3 concentrations in historical and future scenarios are shown in Figs. 1 and 2. From 2015 to 2019, the fire-sourced MDA8 O3 level was in the order of Sub-Saharan Africa (SS) (14.9±8.4 µg m−3) > South Asia (SA) (4.0±2.5 µg m−3) > China (1.6±0.7 µg m−3) > United States (US) (1.3±0.9 µg m−3) > Europe (1.2±0.4 µg m−3). In future scenarios, fire-sourced MDA8 O3 levels display marked spatial variability across different Shared Socioeconomic Pathways (SSPs). MDA8 O3 showed the higher concentrations in some regions such as SS, SA, and US. Among all of the scenarios, fire-sourced O3 levels displayed the highest concentrations in SS. It was assumed that this region possessed extensive burned area (52 %) and higher biomass fuel consumption (5200 g C m−2) compared with other regions (van Wees et al., 2022). Following SS, SA also exhibited the higher wildfire-related MDA8 O3 concentrations. The elevated concentrations of fire-sourced O3 levels in SA were closely associated with exceptionally high fuel consumption (8600 g C m−2) (Chen et al., 2023; van Wees et al., 2022) though the burned areas were not very high among all of the regions. In addition, it should be noted that many previous studies have confirmed US showed the higher wildfire-induced PM2.5 or other aerosol components compared with many other regions (e.g., East Asia and South America) (Park et al., 2024; Xu et al., 2023). However, it did not show the higher O3 concentrations in nearly all of the scenarios in our study. It was assumed that the MDA8 O3 concentration exhibited significant latitudinal distribution (decreasing with the increase of latitude) globally. Both of China and Europe showed very low burned areas (0.2 %) and fuel consumption (950 g C m−2), and thus the fire-sourced MDA8 O3 concentrations were relatively lower compared with SS and SA.
Besides, the fire-sourced MDA8 O3 levels exhibited significant inter-annual trends and large discrepancy between different scenarios. The global average fire-sourced MDA8 O3 concentrations showed overall increase from 2010s (1.3±0.7 µg m−3) to 2090s (SSP1-2.6, SSP3-7.0, and SSP5-8.5: 1.9±0.9, 1.6±0.8, and 1.4±0.7 µg m−3) for nearly all of the scenarios. The global average wildfire-related MDA8 O3 concentrations (the average of 2040s and 2090s) followed the order of SSP3-7.0 (1.6±0.9 µg m−3) > SSP5-8.5 (1.5±0.8 µg m−3) > SSP1-2.6 (1.4±0.8 µg m−3). The highest wildfire-related MDA8 O3 levels in SSP3-7.0 (air temperature: about 1.8 °C higher than SSP1-2.6) and SSP5-8.5 (air temperature: about 2.3 °C higher than SSP1-2.6) scenarios were contributed by the increased fuel consumption and the warmer condition because O3 level was more sensitive to air temperature increase (Wang et al., 2021; Wu et al., 2021).
Nevertheless, different regions showed distinct long-term trends. Wildfire-related MDA8 O3 levels in nearly all of the regions in SSP3-7.0 scenario (air temperature: about 1.1 °C higher than historical period) showed remarkable increases compared with the historical period because the warmer condition facilitated the rapid increase of O3 level (Zhao et al., 2020). For low-carbon scenario (SSP1-2.6), the wildfire-related MDA8 O3 concentrations in China, Europe, and US showed the relatively lower O3 levels, whereas SA and SS still increased by 40 % and 64 %, respectively. The results suggested that the low-carbon pathway cannot effectively reduce the wildfire-induced O3 pollution in both of SA and SS.
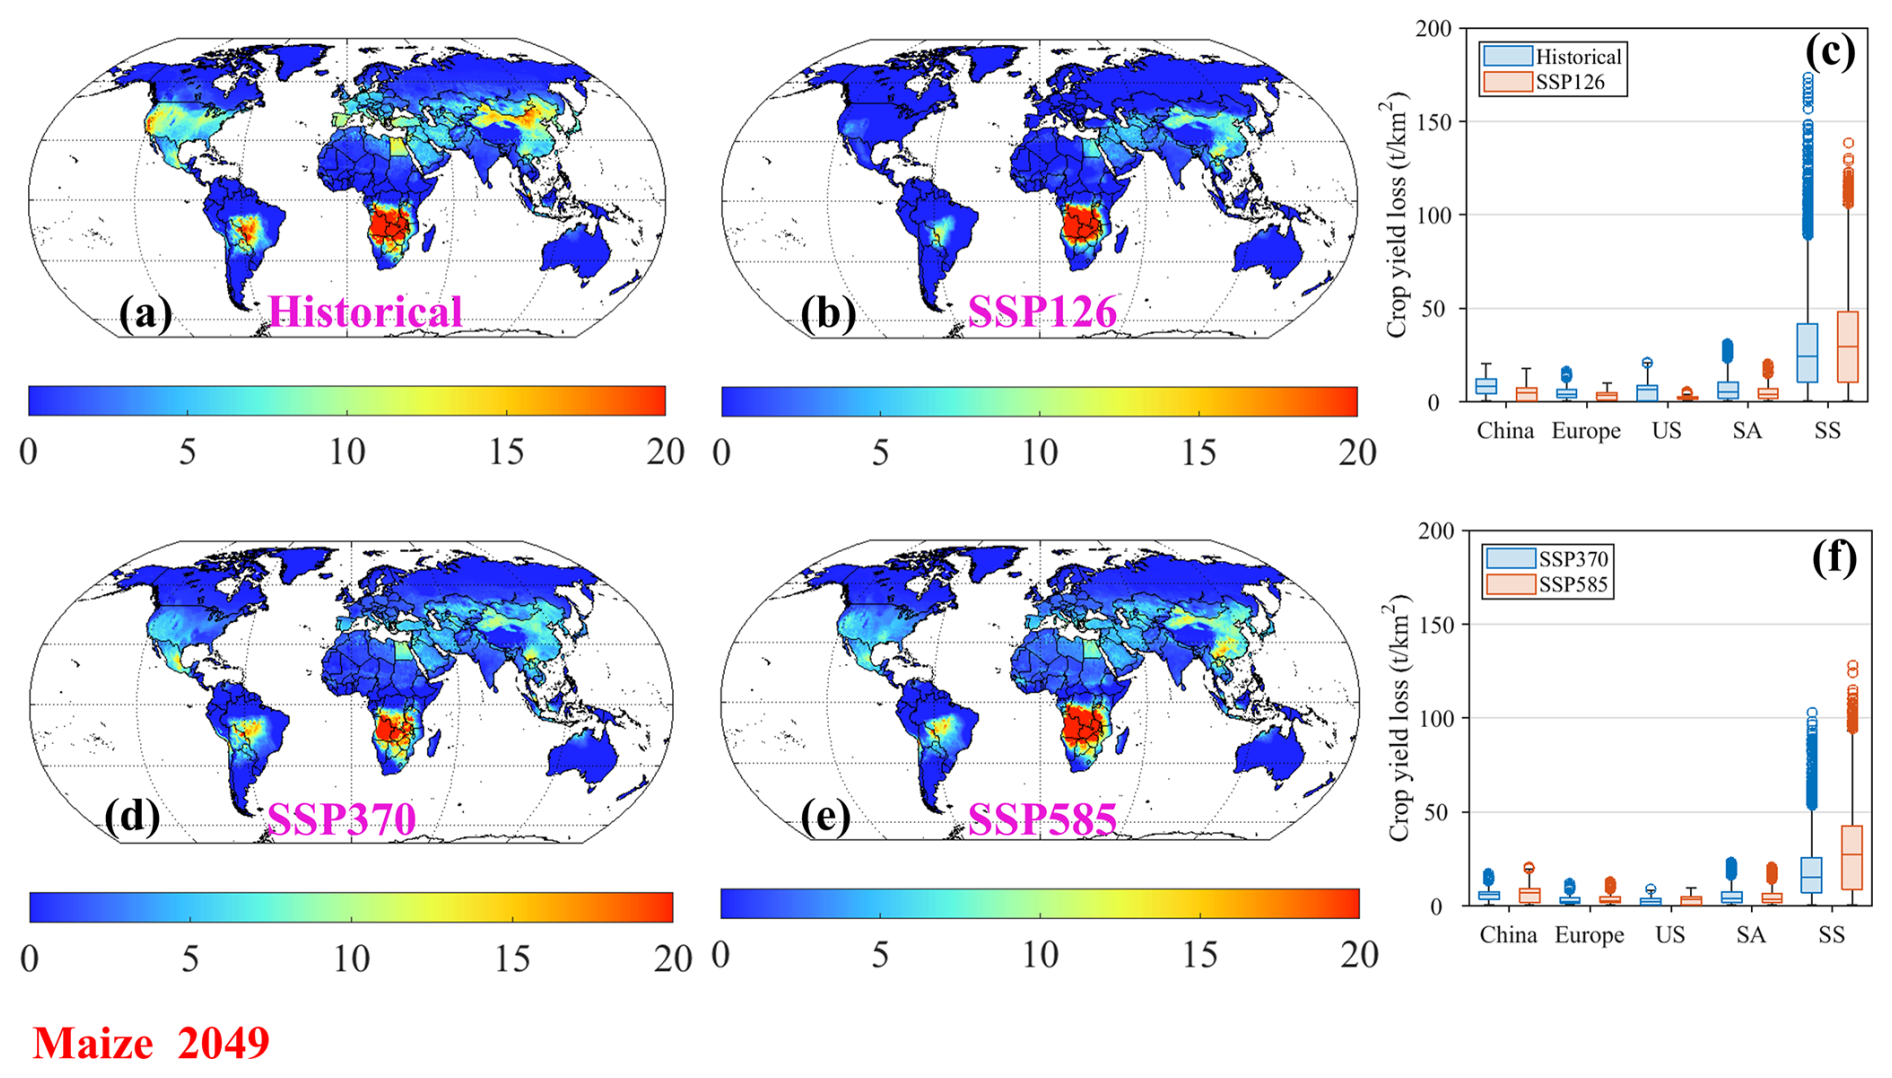
Figure 3The global variations of fire-sourced O3-related maize yield losses (unit: t km−2) during historical (a), SSP1-2.6 (b), SSP3-7.0 (d), and SSP5-8.5 (e) scenarios during 2040s, respectively. The spatial variations of fire-sourced maize yield losses (Unit: t km−2) in major regions during 2040s. US, SA, and SS represent the United States, South America, and Sub-Sahara Africa, respectively.
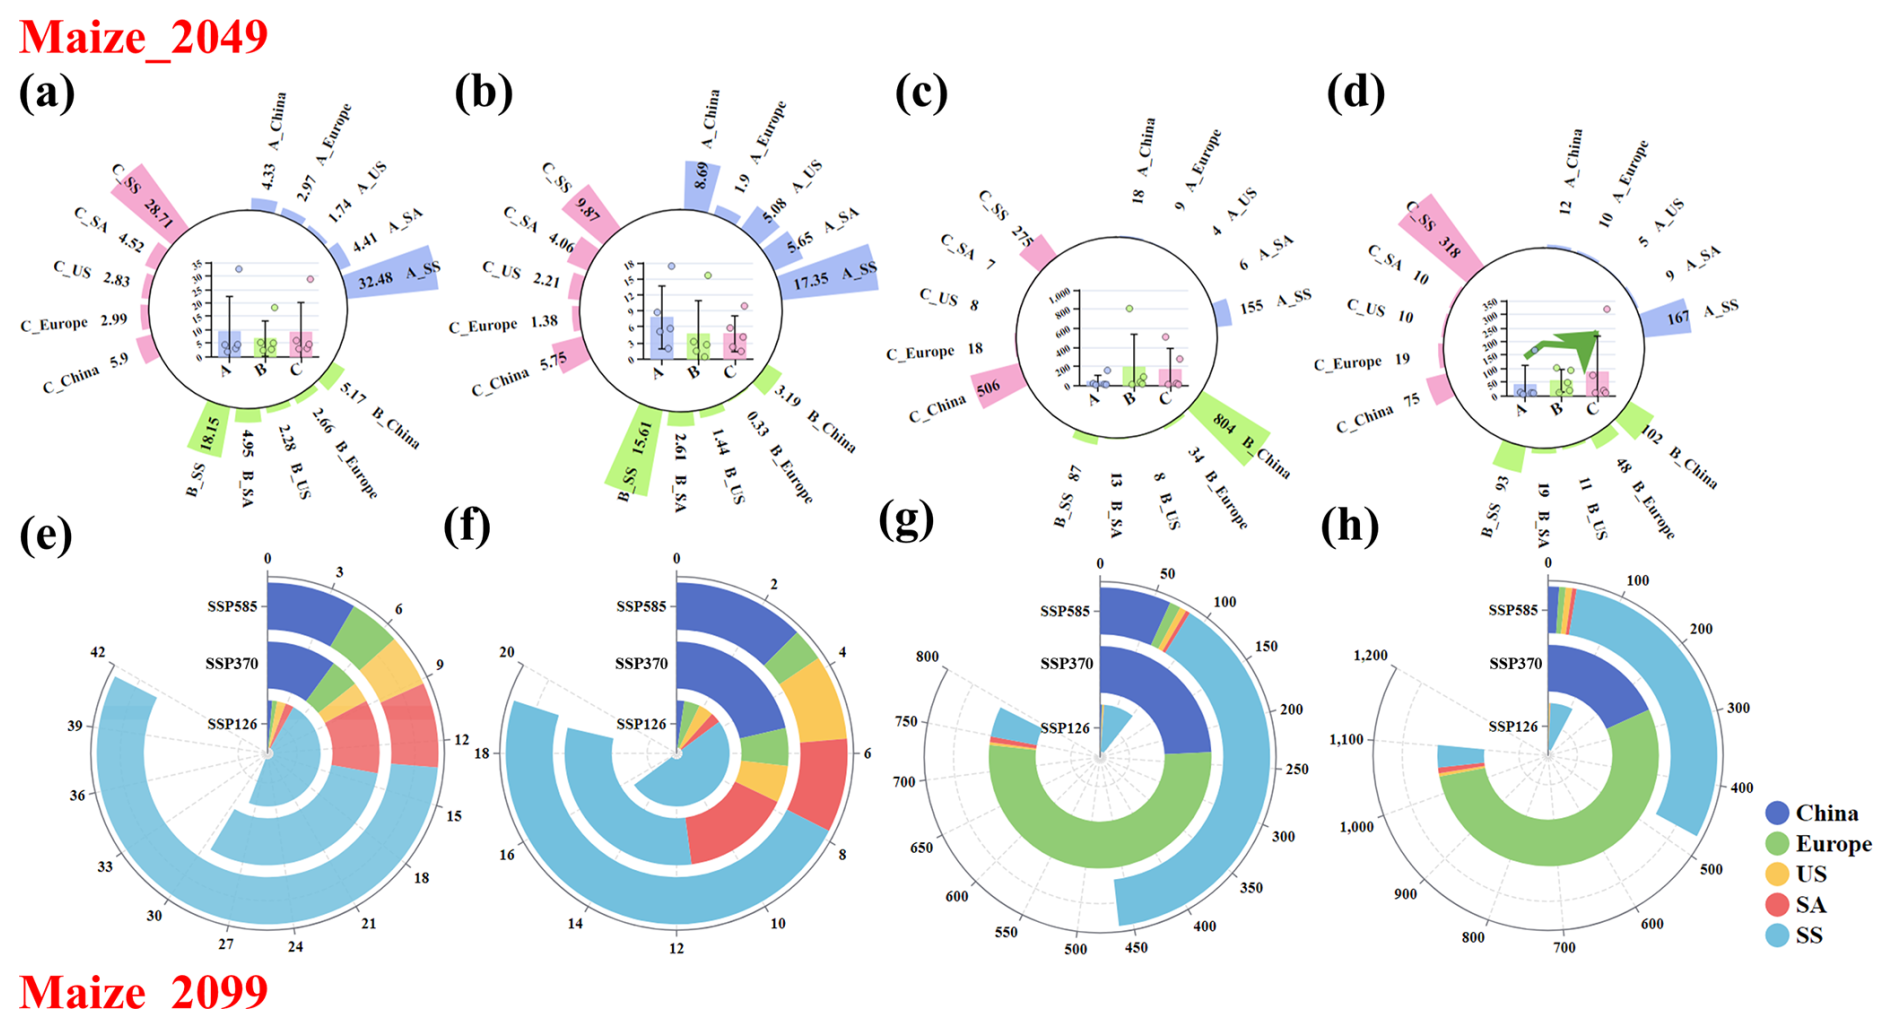
Figure 4The spatial variations of fire-sourced O3-related maize (a), rice (b), spring wheat (c), and winter wheat (d) yield losses (unit: t km−2) during SSP1-2.6, SSP3-7.0, and SSP5-8.5 scenarios during 2040s, respectively. A, B, and C denote SSP1-2.6, SSP3-7.0, and SSP5-8.5 scenarios, respectively. (e)–(h) represent fire-sourced O3-related maize (e), rice (f), spring wheat (g), and winter wheat (h) yield losses during SSP1-2.6, SSP3-7.0, and SSP5-8.5 scenarios during 2090s, respectively. US, SA, and SS represent the United States, South America, and Sub-Sahara Africa, respectively.
3.3 The crop yield losses caused by O3 exposures
As shown in Figs. 3 and 4, the global crop yield losses caused by fire-sourced O3 exposure have been quantified based on the Eqs. (3)–(5). During historical period, the global fire-sourced O3 caused 3.1 (2.4–3.8), 1.7 (1.5–1.9), 24 (21–27), and 43 (39–47) t km−2 crop losses for maize, rice, spring wheat, and winter wheat, respectively. Compared with the historical period, CPL values in different future scenarios displayed large discrepancy. In SSP1-2.6 scenario, CPL of maize, rice, spring wheat, and winter wheat associated with fire-sourced O3 exposure were 1.1 (0.9–1.3), 0.5 (0.4–0.6), 4.6 (4.1–5.4), and 4.6 (3.5–5.2) t km−2, respectively (Figs. S4–S11). However, CPL for maize (2.1 (1.9–2.3) and 2.4 (2.1–3.0) t km−2), rice (1.1 (0.9–1.3) and 1.3 (1.1–1.5) t km−2), spring wheat (557 (486–628) and 184 (154–218) t km−2), and winter wheat (258 (208–308) and 19 (14–22) t km−2) caused by fire-sourced O3 exposure experienced dramatic increases in SSP3-7.0 and SSP5-8.5 scenarios (Figs. S4–S11). There are two reasons accounting for the fact. First of all, the wildfire-related O3 exposures showed marked increase in high-emission scenarios (Yang et al., 2022; Yue et al., 2017). Moreover, the crop yields also displayed substantial increases in both of these scenarios because rapid increase of fertilizer consumption (Brunelle et al., 2015; Randive et al., 2021).
In addition, CPL caused by fire-sourced O3 exposure also suffered significant spatial difference. During the historical period, the total CPL for four major foods caused by fire-sourced O3 exposure in China, Europe, US, SA, and SS were 1451 (1302–1650), 65 (54–82), 61 (48–70), 56 (52–59), and 404 (372–425) t km−2, respectively. In the future scenario (SSP1-2.6, SSP3-7.0, and SSP5-8.5), the total CPL for four major foods caused by fire-sourced O3 exposure in China, Europe, US, SA, and SS were 23 (19–28) (711 (630–802) and 339 (299–375)), 14 (12–16) (684 (596–768) and 32 (28–34)), 11 (8–12) (19 (17–22) and 21 (18–23)), 14 (12–15) (35 (30–39) and 21 (18–24)), 298 (272–320) 160 (145–179) and 745 (641–840) t km−2, respectively. In both of historical and future scenarios, SS, SA, and China showed the higher CPL compared with other regions. The higher CPL in SS and SA might be attributable to the higher fire-sourced O3 concentrations and crop yields. The higher CPL in China might be associated with exceptionally high crop yields though the wildfire-induced O3 level was not very high. For most regions, CPL showed the higher values in high-emission scenarios (SSP3-7.0 and SSP5-8.5). Although SS and SA also showed the higher CPL in high-emission scenarios (SSP5-8.5), the CPL values of SS and SA in SSP1-2.6 scenario were still very high. The results suggested that the low-carbon policy still cannot effectively weaken local agricultural damage of fire-sourced O3 exposure.
3.4 Implications and limitations
Our study developed a multi-stage machine-learning model based on the multi-source information data to predict the fire-sourced MDA8 O3 concentrations at the global scale. It is the first study to use the ground-level observations as the constraint to improve the O3 estimates in the future scenarios. The results confirmed that the model showed the better predictive accuracy and transferability.
Our assessment highlighted the severity and scale of the fire-sourced MDA8 O3 level and a notable increasing trend in the future scenarios. Especially in high-emission scenarios (SSP3-7.0 and SSP5-8.5), the fire-sourced MDA8 O3 showed the higher concentrations compared with the low-carbon scenario. Therefore, the global mean temperature increase should be limited to 2.0 or 1.5 °C above pre-industrial levels. In addition, both of SS and SA showed the highest wildfire-induced MDA8 O3 concentration compared with other regions, indicating these hotspots should be determined to propose some control measures. For instance, wildfires could be partially controlled via effective evidence-based fire management and appropriate planning (González-Mathiesen and March, 2021; Gonzalez-Mathiesen et al., 2021). Some prevention policy should be proposed to reduce agricultural waste incineration and some prescribed fires (Koul et al., 2022; Lange and Gillespie, 2023). Some wildlands could be also changed into agricultural or commercial lands to reduce the occurrence frequency of forest wildfire (Mansoor et al., 2022).
Besides, the impacts of fire-sourced O3 pollution on crop yields were also quantified. The results confirmed China was faced of serious crop production losses, which was even higher than those in SS and SA because the higher crop production and increasing O3 pollution risk in the future scenarios. Overall, crop yield losses of China showed significantly higher values in high-emission scenario (SSP3-7.0 and SSP5-8.5) compared with low-emission scenario (SSP1-2.6). The results suggested that low-carbon policy not only largely weaken O3 pollution derived from anthropogenic emission in China, but also decrease wildfire-induced O3 damages to crop yields effectively. The results also confirm that the carbon neutrality policy implemented in China possess sufficient agricultural benefits. In contrast, crop yield losses of SS and SA in low-carbon scenario still showed very high risks. It requires more stringent control measures to further reduce local anthropogenic emission in order to offset the wildfire-induced O3 contribution.
It should be noted that our study is still subject to some limitations. Firstly, the future wildfire emission inventory still shows some uncertainties because the accuracy of land use types and burned areas in the future scenarios cannot be examined directly. Furthermore, in the historical estimates, we only used a chemical transport model (GEOS-Chem model) to simulate the fire-sourced O3 concentrations though the ground-level observations were assimilated. However, only one model could increase the uncertainties because the O3 background might be overestimated. Second, the chemical transport model used in our study did not account for plume rise, which could overestimate the contribution of wildfire emissions to O3 pollution. Third, the ground-level observations of ambient O3 are unevenly distributed around the world, which could limit the predictive accuracy of O3 levels especially in some regions (e.g., SS and SA) lack of monitoring sites. In the future, it is highly necessary to add sufficient ground-level O3 observations to further improve the accuracy of O3 estimates. Finally, the zero-out method might suffer from some limitations because O3 chemistry is highly nonlinear. More other methods such as air pollutant tracing method should be applied to quantify the fire-sourced O3 concentrations combined with zero-out method. In the GEOS-Chem model, wildfire-emitted precursors (e.g., NOx, VOCs) could be assigned unique “tags” as separate tracers. These tagged species undergo the same transport, chemistry, and deposition processes as regular emissions but are tracked independently. For ozone (O3) attribution, the model calculates the fraction of O3 produced from wildfire-tagged NOx/VOCs oxidation pathways. The tagged O3 concentrations are then extracted to quantify the wildfire contribution, while accounting for nonlinear chemical interactions (e.g., NOx saturation effects). The combination of multiple methods could increase the robustness of fire-sourced O3 estimates.
The CMIP6 dataset used in this publication is available at https://esgf-node.ipsl.upmc.fr/search/cmip6-ipsl (last access: 22 July 2025).
The supplement related to this article is available online at https://doi.org/10.5194/acp-25-14501-2025-supplement.
RL, DT, and HZ designed the study. RL developed the model. DT, YS, YG, and HZ analyzed the observations and model data. RL wrote the paper. RL and YS revised the paper.
The contact author has declared that none of the authors has any competing interests.
Publisher's note: Copernicus Publications remains neutral with regard to jurisdictional claims made in the text, published maps, institutional affiliations, or any other geographical representation in this paper. While Copernicus Publications makes every effort to include appropriate place names, the final responsibility lies with the authors. Views expressed in the text are those of the authors and do not necessarily reflect the views of the publisher.
This work was supported by the National Natural Science Foundation of China (grant no. U23A2030).
This work was supported by the National Natural Science Foundation of China (grant nos. 42577111 and U23A2030).
This paper was edited by Eva Y. Pfannerstill and reviewed by three anonymous referees.
Anderson, K., Chen, J., Englefield, P., Griffin, D., Makar, P. A., and Thompson, D.: The Global Forest Fire Emissions Prediction System version 1.0, Geosci. Model Dev., 17, 7713–7749, https://doi.org/10.5194/gmd-17-7713-2024, 2024.
Bali, K., Dey, S., and Ganguly, D.: Diurnal patterns in ambient PM2.5 exposure over India using MERRA-2 reanalysis data. Atmos. Environ., 248, 118180, https://doi.org/10.1016/j.atmosenv.2020.118180, 2021.
Bindle, L., Martin, R. V., Cooper, M. J., Lundgren, E. W., Eastham, S. D., Auer, B. M., Clune, T. L., Weng, H., Lin, J., Murray, L. T., Meng, J., Keller, C. A., Putman, W. M., Pawson, S., and Jacob, D. J.: Grid-stretching capability for the GEOS-Chem 13.0.0 atmospheric chemistry model, Geosci. Model Dev., 14, 5977–5997, https://doi.org/10.5194/gmd-14-5977-2021, 2021.
Bloomer, B. J., Stehr, J. W., Piety, C. A., Salawitch, R. J., and Dickerson, R. R.: Observed relationships of ozone air pollution with temperature and emissions, Geophys. Res. Lett., 36, https://doi.org/10.1029/2009GL037308, 2009.
Brunelle, T., Dumas, P., Souty, F., Dorin, B., and Nadaud, F.: Evaluating the impact of rising fertilizer prices on crop yields, Agr. Econ., 46, 653–666, https://doi.org/10.1111/agec.12161, 2015.
Chen, Y., Hall, J., van Wees, D., Andela, N., Hantson, S., Giglio, L., van der Werf, G. R., Morton, D. C., and Randerson, J. T.: Multi-decadal trends and variability in burned area from the fifth version of the Global Fire Emissions Database (GFED5), Earth Syst. Sci. Data, 15, 5227–5259, https://doi.org/10.5194/essd-15-5227-2023, 2023.
Childs, M. L., Li, J., Wen, J., Heft-Neal, S., Driscoll, A., Wang, S., Gould, C. F., Qiu, M., Burney, J., and Burke, M.: Daily local-level estimates of ambient wildfire smoke PM2.5 for the contiguous US, Environ. Sci. Technol., 56, 13607–13621, 2022.
DeLang, M. N., Becker, J. S., Chang, K.-L., Serre, M. L., Cooper, O. R., Schultz, M. G., Schröder, S., Lu, X., Zhang, L., and Deushi, M.: Mapping yearly fine resolution global surface ozone through the Bayesian maximum entropy data fusion of observations and model output for 1990–2017, Environ. Sci. Technol., 55, 4389–4398, https://doi.org/10.1021/acs.est.0c07742, 2021.
Geddes, J. A., Heald, C. L., Silva, S. J., and Martin, R. V.: Land cover change impacts on atmospheric chemistry: simulating projected large-scale tree mortality in the United States, Atmos. Chem. Phys., 16, 2323–2340, https://doi.org/10.5194/acp-16-2323-2016, 2016.
González-Mathiesen, C. and March, A.: Understanding Disaster Risk, Elsevier, 159–178, https://doi.org/10.1016/B978-0-12-819047-0.00002-0, 2021.
Gonzalez-Mathiesen, C., Ruane, S., and March, A.: Integrating wildfire risk management and spatial planning–A historical review of two Australian planning systems, Int. J. Disast. Risk Re., 53, 101984, https://doi.org/10.1016/j.ijdrr.2020.101984, 2021.
Guarin, J. R., Kassie, B., Mashaheet, A. M., Burkey, K., and Asseng, S.: Modeling the effects of tropospheric ozone on wheat growth and yield, Eur. J. Agron., 105, 13–23, https://doi.org/10.1016/j.eja.2019.02.004, 2019.
Gurjar, B. R., Ravindra, K., and Nagpure, A. S.: Air pollution trends over Indian megacities and their local-to-global implications, Atmos. Environ., 142, 475–495, https://doi.org/10.1016/j.atmosenv.2016.06.030, 2016.
Hoesly, R. M., Smith, S. J., Feng, L., Klimont, Z., Janssens-Maenhout, G., Pitkanen, T., Seibert, J. J., Vu, L., Andres, R. J., Bolt, R. M., Bond, T. C., Dawidowski, L., Kholod, N., Kurokawa, J.-I., Li, M., Liu, L., Lu, Z., Moura, M. C. P., O'Rourke, P. R., and Zhang, Q.: Historical (1750–2014) anthropogenic emissions of reactive gases and aerosols from the Community Emissions Data System (CEDS), Geosci. Model Dev., 11, 369–408, https://doi.org/10.5194/gmd-11-369-2018, 2018.
Jaffe, D. A., Wigder, N., Downey, N., Pfister, G., Boynard, A., and Reid, S. B.: Impact of wildfires on ozone exceptional events in the western US, Environ. Sci. Technol., 47, 11065–11072, https://doi.org/10.1021/es402164f , 2013.
Jones, M. W., Abatzoglou, J. T., Veraverbeke, S., Andela, N., Lasslop, G., Forkel, M., Smith, A. J., Burton, C., Betts, R. A., and van der Werf, G. R.: Global and regional trends and drivers of fire under climate change, Rev. Geophys., 60, e2020RG000726, https://doi.org/10.1029/2020RG000726, 2022.
Karmakar, S. P., Das, A. B., Gurung, C., and Ghosh, C.: Effects of ozone on plant health and environment: A mini review, Res. Jr. Agril. Sci., 13, 612–619, 2022.
Keller, C. A., Evans, M. J., Knowland, K. E., Hasenkopf, C. A., Modekurty, S., Lucchesi, R. A., Oda, T., Franca, B. B., Mandarino, F. C., Díaz Suárez, M. V., Ryan, R. G., Fakes, L. H., and Pawson, S.: Global impact of COVID-19 restrictions on the surface concentrations of nitrogen dioxide and ozone, Atmos. Chem. Phys., 21, 3555–3592, https://doi.org/10.5194/acp-21-3555-2021, 2021.
Koul, B., Yakoob, M., and Shah, M. P.: Agricultural waste management strategies for environmental sustainability, Environ. Res., 206, 112285, https://doi.org/10.1016/j.envres.2021.112285, 2022.
Lamsal, L. N., Duncan, B. N., Yoshida, Y., Krotkov, N. A., Pickering, K. E., Streets, D. G., and Lu, Z.: US NO2 trends (2005–2013): EPA Air Quality System (AQS) data versus improved observations from the Ozone Monitoring Instrument (OMI), Atmos. Environ., 110, 130–143, https://doi.org/10.1016/j.atmosenv.2015.03.055, 2015.
Lange, J. and Gillespie, J.: Bushfire, prescribed burning, and non-human protection, Geogra. Res., 61, 169–192, https://doi.org/10.1111/1745-5871.12558, 2023.
Lee, H. and Jaffe, D. A.: Wildfire Impacts on O3 in the Continental United States Using PM2.5 and a Generalized Additive Model (2018–2023), Environ. Sci. Technol., 58, 14764–14774, https://doi.org/10.1021/acs.est.4c05870, 2024.
Li, H., Yang, Y., Su, H., Wang, H., Wang, P., and Liao, H.: Ozone pollution in China affected by climate change in a carbon neutral future as predicted by a process-based interpretable machine learning method, Geophys. Res. Lett., 51, e2024GL109520, https://doi.org/10.1029/2024GL109520, 2024a.
Li, M., Mao, J., Chen, S., Bian, J., Bai, Z., Wang, X., Chen, W., and Yu, P.: Significant contribution of lightning NOx to summertime surface O3 on the Tibetan Plateau, Sci. Total Environ., 829, 154639, https://doi.org/10.1016/j.scitotenv.2022.154639, 2022.
Li, R., Cui, L., Fu, H., Meng, Y., Li, J., and Guo, J.: Estimating high-resolution PM1 concentration from Himawari-8 combining extreme gradient boosting-geographically and temporally weighted regression (XGBoost-GTWR), Atmos. Environ., 229, 117434, https://doi.org/10.1016/j.atmosenv.2020.117434, 2020a.
Li, R., Cui, L., Fu, H., Zhao, Y., Zhou, W., and Chen, J.: Satellite-Based Estimates of Wet Ammonium (NH4-N) Deposition Fluxes Across China during 2011–2016 Using a Space–Time Ensemble Model, Environ. Sci. Technol., 54, 13419–13428, https://doi.org/10.1021/acs.est.0c03547, 2020b.
Li, R., Gao, Y., Zhang, L., Shen, Y., Xu, T., Sun, W., and Wang, G.: Global estimates of ambient reactive nitrogen components during 2000–2100 based on the multi-stage model, Atmos. Chem. Phys., 24, 7623–7636, https://doi.org/10.5194/acp-24-7623-2024, 2024b.
Liu, H., Liu, S., Xue, B., Lv, Z., Meng, Z., Yang, X., Xue, T., Yu, Q., and He, K.: Ground-level ozone pollution and its health impacts in China, Atmos. Environ., 173, 223–230, https://doi.org/10.1016/j.atmosenv.2017.11.014, 2018.
Liu, R., Ma, Z., Liu, Y., Shao, Y.C., Zhao, W., and Bi, J.: Spatiotemporal distributions of surface ozone levels in China from 2005 to 2017: A machine learning approach, Environ. Interna., 142, 105823, https://doi.org/10.1016/j.envint.2020.105823, 2020.
Mansoor, S., Farooq, I., Kachroo, M. M., Mahmoud, A. E. D., Fawzy, M., Popescu, S. M., Alyemeni, M., Sonne, C., Rinklebe, J., and Ahmad, P.: Elevation in wildfire frequencies with respect to the climate change, J. Environ. Manage., 301, 113769, https://doi.org/10.1016/j.jenvman.2021.113769, 2022.
McDuffie, E. E., Martin, R. V., Spadaro, J. V., Burnett, R., Smith, S. J., O'Rourke, P., Hammer, M. S., van Donkelaar, A., Bindle, L., and Shah, V.: Source sector and fuel contributions to ambient PM2.5 and attributable mortality across multiple spatial scales, Nat. Commun., 12, 3594, https://doi.org/10.1038/s41467-021-23853-y, 2021.
Nault, B., Laughner, J., Wooldridge, P., Crounse, J., Dibb, J., Diskin, G., Peischl, J., Podolske, J., Pollack, I., and Ryerson, T.: Lightning NOx emissions: Reconciling measured and modeled estimates with updated NOx chemistry, Geophys. Res. Lett., 44, 9479–9488, https://doi.org/10.1002/2017GL074436, 2017.
O'Dell, K., Ford, B., Fischer, E. V., and Pierce, J. R.: Contribution of wildland-fire smoke to US PM2.5 and its influence on recent trends, Environ. Sci. Technol., 53, 1797–1804, https://doi.org/10.1021/acs.est.8b05430, 2019.
Pan, X., Ichoku, C., Chin, M., Bian, H., Darmenov, A., Colarco, P., Ellison, L., Kucsera, T., da Silva, A., Wang, J., Oda, T., and Cui, G.: Six global biomass burning emission datasets: intercomparison and application in one global aerosol model, Atmos. Chem. Phys., 20, 969–994, https://doi.org/10.5194/acp-20-969-2020, 2020.
Park, C. Y., Takahashi, K., Fujimori, S., Phung, V. L. H., Li, F., Takakura, J. Y., Hasegawa, T., and Jansakoo, T.: Future fire-PM2.5 mortality varies depending on climate and socioeconomic changes, Environ. Res. Lett., 19, 024003, https://doi.org/10.1088/1748-9326/ad1b7d, 2024.
Peiro, H., Crowell, S., and Moore III, B.: Optimizing 4 years of CO2 biospheric fluxes from OCO-2 and in situ data in TM5: fire emissions from GFED and inferred from MOPITT CO data, Atmos. Chem. Phys., 22, 15817–15849, https://doi.org/10.5194/acp-22-15817-2022, 2022.
Randive, K., Raut, T., and Jawadand, S.: An overview of the global fertilizer trends and India's position in 2020, Miner. Econ., 34, 371–384, https://doi.org/10.1007/s13563-020-00246-z, 2021.
Richardson, D., Black, A. S., Irving, D., Matear, R. J., Monselesan, D. P., Risbey, J. S., Squire, D. T., and Tozer, C. R.: Global increase in wildfire potential from compound fire weather and drought, NPJ Clim. Atmos. Sci., 5, 23, https://doi.org/10.1038/s41612-022-00248-4, 2022.
Sacks, W. J., Deryng, D., Foley, J. A., and Ramankutty, N.: Crop planting dates: an analysis of global patterns, Global Ecol. Biogeogr., 19, 607–620, https://doi.org/10.1111/j.1466-8238.2010.00551.x, 2010.
Schiferl, L. D. and Heald, C. L.: Particulate matter air pollution may offset ozone damage to global crop production, Atmos. Chem. Phys., 18, 5953–5966, https://doi.org/10.5194/acp-18-5953-2018, 2018.
Selin, N. E., Wu, S., Nam, K.-M., Reilly, J. M., Paltsev, S., Prinn, R. G., and Webster, M. D.: Global health and economic impacts of future ozone pollution, Environ. Res. Lett., 4, 044014, https://doi.org/10.1088/1748-9326/4/4/044014, 2009.
Senande-Rivera, M., Insua-Costa, D., and Miguez-Macho, G.: Spatial and temporal expansion of global wildland fire activity in response to climate change, Nat. Commun., 13, 1208, https://doi.org/10.1038/s41467-022-28835-2, 2022.
van Wees, D., van der Werf, G. R., Randerson, J. T., Rogers, B. M., Chen, Y., Veraverbeke, S., Giglio, L., and Morton, D. C.: Global biomass burning fuel consumption and emissions at 500 m spatial resolution based on the Global Fire Emissions Database (GFED), Geosci. Model Dev., 15, 8411–8437, https://doi.org/10.5194/gmd-15-8411-2022, 2022.
Verma, S., Yadava, P. K., Lal, D., Mall, R., Kumar, H., and Payra, S.: Role of lightning NOx in ozone formation: A review, Pure Appl. Geophys., 178, 1425–1443, 2021.
Wainwright, C. D., Pierce, J. R., Liggio, J., Strawbridge, K. B., Macdonald, A. M., and Leaitch, R. W.: The effect of model spatial resolution on Secondary Organic Aerosol predictions: a case study at Whistler, BC, Canada, Atmos. Chem. Phys., 12, 10911–10923, https://doi.org/10.5194/acp-12-10911-2012, 2012.
Wang, B., Spessa, A.C., Feng, P., Hou, X., Yue, C., Luo, J.-J., Ciais, P., Waters, C., Cowie, A., and Nolan, R. H.: Extreme fire weather is the major driver of severe bushfires in southeast Australia, Sci. Bull., 67, 655–664, 2022.
Wang, Y., Yuan, Q., Li, T., Zhu, L., and Zhang, L.: Estimating daily full-coverage near surface O3, CO, and NO2 concentrations at a high spatial resolution over China based on S5P-TROPOMI and GEOS-FP, ISPRS J. Photogramm., 175, 311–325, 2021.
Wasserman, T. N. and Mueller, S. E.: Climate influences on future fire severity: a synthesis of climate-fire interactions and impacts on fire regimes, high-severity fire, and forests in the western United States, Fire Ecol., 19, 1–22, 2023.
Wu, B., Liu, C., Zhang, J., Du, J., and Shi, K.: The multifractal evaluation of PM2.5-O3 coordinated control capability in China, Ecol. Indic., 129, 107877, https://doi.org/10.1016/j.ecolind.2021.107877, 2021.
Xu, Q., Westerling, A. L., Notohamiprodjo, A., Wiedinmyer, C., Picotte, J. J., Parks, S. A., Hurteau, M. D., Marlier, M. E., Kolden, C. A., and Sam, J. A.: Wildfire burn severity and emissions inventory: an example implementation over California, Environ. Res. Lett., 17, 085008, https://doi.org/10.1088/1748-9326/ac80d0, 2022.
Xu, R., Ye, T., Yue, X., Yang, Z., Yu, W., Zhang, Y., Bell, M. L., Morawska, L., Yu, P., and Zhang, Y.: Global population exposure to landscape fire air pollution from 2000 to 2019, Nature, 621, 521–529, 2023.
Yang, C.-E., Fu, J. S., Liu, Y., Dong, X., and Liu, Y.: Projections of future wildfires impacts on air pollutants and air toxics in a changing climate over the western United States, Environ. Pollut., 304, 119213, https://doi.org/10.1016/j.envpol.2022.119213, 2022.
Yue, X., Mickley, L. J., Logan, J. A., Hudman, R. C., Martin, M. V., and Yantosca, R. M.: Impact of 2050 climate change on North American wildfire: consequences for ozone air quality, Atmos. Chem. Phys., 15, 10033–10055, https://doi.org/10.5194/acp-15-10033-2015, 2015.
Yue, X., Strada, S., Unger, N., and Wang, A.: Future inhibition of ecosystem productivity by increasing wildfire pollution over boreal North America, Atmos. Chem. Phys., 17, 13699–13719, https://doi.org/10.5194/acp-17-13699-2017, 2017.
Zhang, H.: Impacts of global change on tropospheric ozone and mercury, Michigan Technological University, 2016.
Zhao, H., Zheng, Y., Zhang, Y., and Li, T.: Evaluating the effects of surface O3 on three main food crops across China during 2015–2018, Environ. Pollut., 258, 113794, https://doi.org/10.1016/j.envpol.2019.113794, 2020.
Zhao, J., Yue, C., Wang, J., Hantson, S., Wang, X., He, B., Li, G., Wang, L., Zhao, H., and Luyssaert, S.: Forest fire size amplifies postfire land surface warming, Nature, 633, 828–834, 2024.
Zhao, Y., Zhang, L., Tai, A. P. K., Chen, Y., and Pan, Y.: Responses of surface ozone air quality to anthropogenic nitrogen deposition in the Northern Hemisphere, Atmos. Chem. Phys., 17, 9781–9796, https://doi.org/10.5194/acp-17-9781-2017, 2017.