the Creative Commons Attribution 4.0 License.
the Creative Commons Attribution 4.0 License.
 | 03 Feb 2025
Reactive nitrogen in and around the northeastern and mid-Atlantic US: sources, sinks, and connections with ozone
Gregory R. Carmichael
Kevin W. Bowman
Isabelle De Smedt
Andreas Colliander
Michael H. Cosh
Sujay V. Kumar
Alex B. Guenther
Scott J. Janz
Ryan M. Stauffer
Anne M. Thompson
Niko M. Fedkin
Robert J. Swap
John D. Bolten
Alicia T. Joseph
This study describes the application of a regional Earth system model with updated parameterizations for selected land–atmosphere exchange processes and multiplatform, multidisciplinary observations. We estimate reactive nitrogen (Nr = NOy+ NHx) emissions from various sources, surface and column nitrogen dioxide (NO2), and total and speciated Nr dry and wet deposition during 2018–2023 over the northeastern and mid-Atlantic US where nitrogen-oxide-limited or transitional chemical regimes dominate. The estimated Nr concentrations and deposition fluxes are related to ozone (O3) in terms of spatiotemporal variability and its key drivers as well as possible ecosystem impacts. Modeled surface O3 persistently agrees well with observations, with root mean square errors staying within 4–7 ppbv for individual years in May–June–July. Model-based surface O3–NO2 column correlation, which shows a dependency on column formaldehyde NO2, is higher in 2020 (r=0.62) than in other years (r=0.47–0.56). Ozone vegetative uptake overall dropped by ∼10 % from 2018 to 2023, displaying clearer downward temporal changes than total Nr deposition as declining NOy emission and deposition competed with increasing NHx fluxes. It is highlighted that temporal variabilities of Nr and O3 concentrations and fluxes on subregional to local scales respond to hydrological variability that can be influenced by precipitation and controllable human activities like irrigation. Deposition and biogenic emissions that are highly sensitive to interconnected environmental and plant physiological conditions, plus extra-regional sources (e.g., O3-rich stratospheric air and dense wildfire plumes from upwind regions), have been playing increasingly important roles in controlling pollutant budgets as local emissions decline owing to effective emission regulations and COVID lockdowns.
- Article
(16054 KB) - Full-text XML
-
Supplement
(20883 KB) - BibTeX
- EndNote


Nitrogen oxides (NOx) are an important ozone (O3) precursor and destroyer, and ground-level O3 is an air pollutant regulated by US Environmental Protection Agency (EPA). NOx consists of nitric oxide (NO) and nitrogen dioxide (NO2), the latter of which is another US EPA-regulated air pollutant that has the highest exposure disparities (Liu et al., 2021). Emitted from various anthropogenic (anth) and natural sources, NOx is readily transformable to or from other forms of reactive nitrogen (Nr = oxidized NOy+ reduced NHx) species, such as ammonia (NH3), peroxyacetyl nitrate (PAN), and nitric acid (HNO3). Some of these chemical reactions also contribute to fine particulate matter pollution, which is connected to O3 via aerosol radiative effects and heterogeneous chemistry (Seinfeld and Pandis, 2016; Monks et al., 2021). Many previous studies have demonstrated that NOx emissions and concentrations play more crucial roles than volatile organic compounds (VOCs) in regulating the magnitude and spatiotemporal variability of O3 (e.g., Duncan et al., 2010; Jin et al., 2017; Koplitz et al., 2022; Souri et al., 2023) as well as aerosols (Carlton et al., 2010; Holt et al., 2015) in much of the northeastern and mid-Atlantic states, the most populous US region where the land surface is highly heterogeneous and hydroclimatic extremes and exceedances of the US National Ambient Air Quality Standards occur from time to time (US Global Change Research Program, 2023; US EPA, 2023). An improved understanding of the sources, sinks, and distributions of NOx and Nr as well as how these have been and will be changing through time is beneficial for interpreting O3 air pollution levels and their spatiotemporal variability in this area. The removal of Nr, O3, and other chemicals involved in their life cycles from the atmosphere through wet and/or dry deposition closely interacts with multiple other interconnected environmental stressors (e.g., temperature, humidity, precipitation, soil moisture, SM, and carbon dioxide, CO2) and plant physiological conditions. Together, they can cause intertwined and cascading effects on the diverse terrestrial and aquatic ecosystems (e.g., United Nations Economic Commission for Europe, 1999; Galloway et al., 2003, 2004; Felzer et al., 2009; Simpson et al., 2014; Lombardozzi et al., 2015; Mills et al., 2018; Walker et al., 2019; Clifton et al., 2020; Emberson, 2020) in this area. Due to effective environmental regulations and unusual situations such as COVID lockdowns, anth emissions continue to decrease there. For studies on Nr and O3, attention should also be given to quantifying the impacts of multiple climatic factors as well as nonlocal air pollution sources such as those imported from upwind US regions, Canada, and the stratosphere, which are partially controlled by the Bermuda High and other pressure systems (e.g., Colarco et al., 2004; Zhu and Liang, 2013; Ott et al., 2016; Rogers et al., 2020).
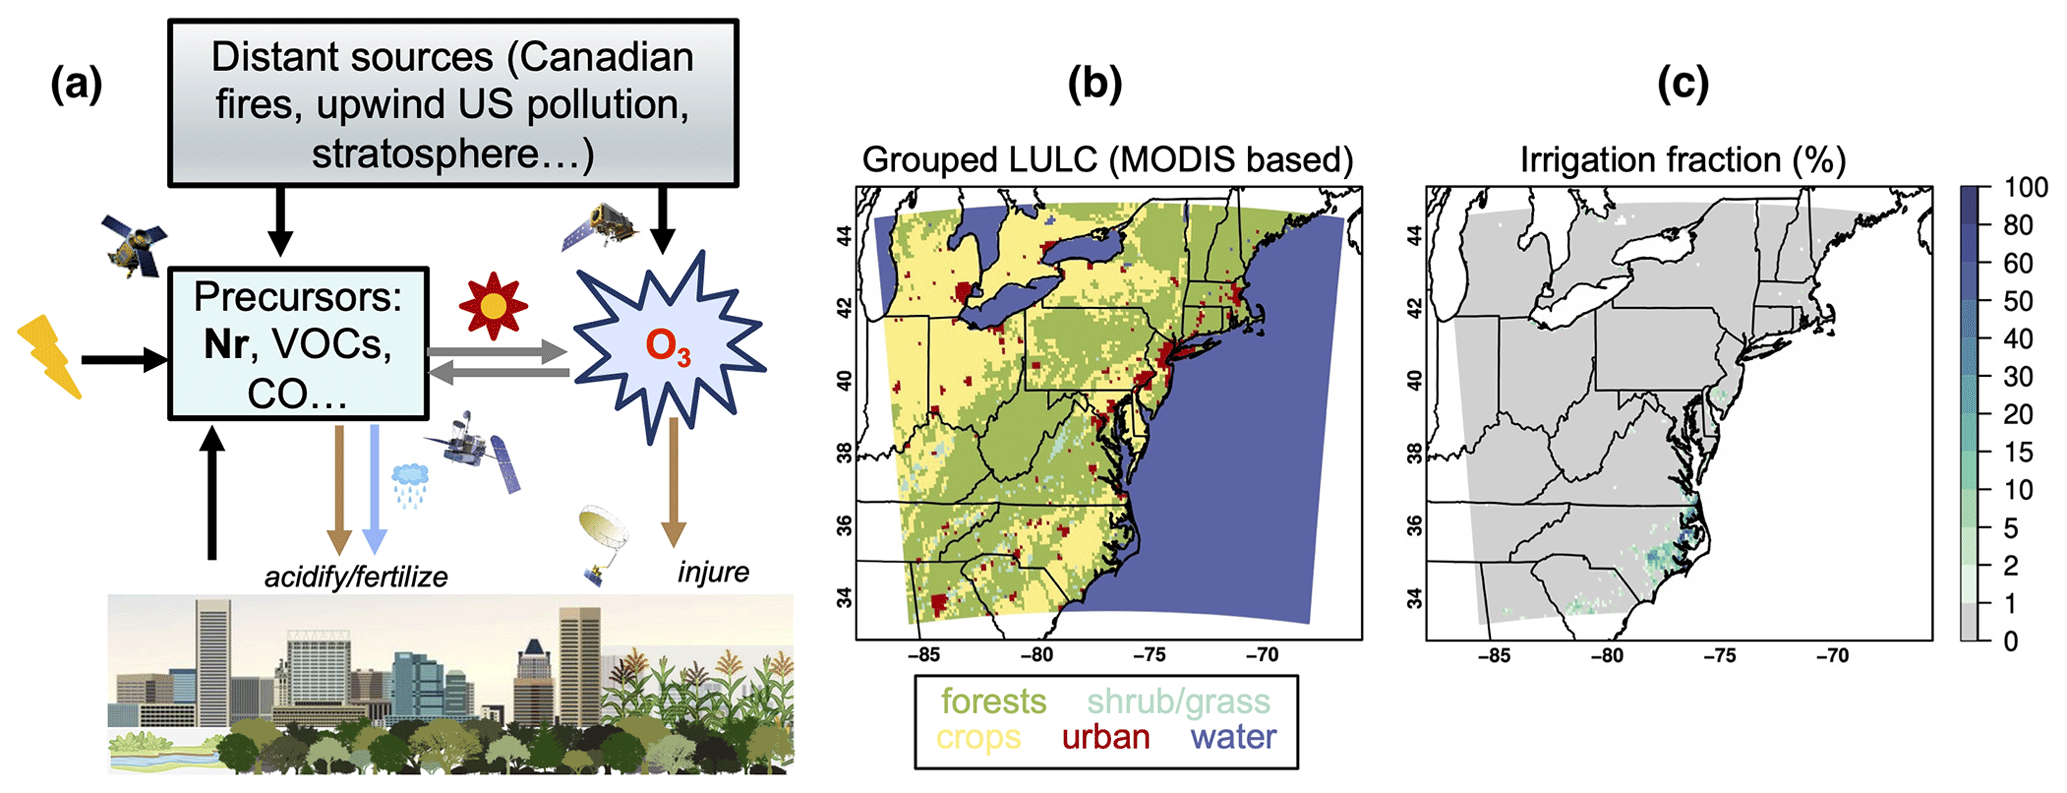
Figure 1(a) A simplified schematic representation of Nr–O3 relationships in Earth systems. (b) Model domain and the grid-dominant land use/land cover (LULC) classifications, grouped from the original 20-category International Geosphere–Biosphere Programme-modified Moderate Resolution Imaging Spectroradiometer (MODIS) using the same criteria as in Huang et al. (2022). (c) Irrigation fraction information required in the irrigation scheme. The grouped LULC is used for reporting potential O3 and Nr ecosystem impacts in Sect. 3.2, and approximately 32 %, 24 %, 1 %, 3 %, and 40 % of model grids belong to the grouped forest, crops, shrub/grass, urban, and water categories, respectively.
Previous global and regional modeling studies have shown that reproducing the observed warm-season Nr and surface O3 levels in the US east is challenging (e.g., Fiore et al., 2009; Chai et al., 2007, 2013; Lapina et al., 2014; Huang et al., 2017a; Lin et al., 2017). The estimated background O3 therein, as well as the importance of its individual contributors, varies substantially among models. Often, the large model–observation mismatches in surface O3 of up to tens of parts per billion by volume are not well explained or attributed mainly to the models' uncertain or outdated anth emission inputs. Some of these studies implemented advanced chemical data assimilation (DA) methods to reduce the errors in their predicted surface O3 states by ∼50 % (Chai et al., 2007). They did not improve the mechanistic representations of O3-related processes, which are of higher policy relevance and would enhance the sustainability of the chemical DA impacts. The large uncertainty in model results limits our capability to understand air quality over these regions and evaluate potential strategies to mitigate the air pollution impacts. High-resolution Earth system modeling with proper model parameterizations, up-to-date inputs, and comprehensive, process-based analysis aided by cross-disciplinary observations can help elucidate the various factors controlling Nr and O3 (Fig. 1a) to better assist with assessing their environmental impacts from the past to the future.
This study is designed to support the International Global Atmospheric Chemistry–Tropospheric Ozone Assessment Report (TOAR) Phase II activity, which aims to further examine the distributions, temporal changes, and impacts of O3 and its key precursors. A regional Earth system model is applied with updated parameterizations for selected land–atmosphere exchange processes (Sect. 2.1), running over the northeast and mid-Atlantic states for multiple years at 10 km horizontal resolution that is considered to be able to better capture NOx lifetime and budgets than coarser-resolution systems (Li et al., 2023). The model is used together with multiplatform, multidisciplinary observations (Sect. 2.2) and a range of analysis methods (e.g., model evaluation and diagnosis, formal DA, and sensitivity simulations; Sect. 2.3) to help achieve the following specific goals: (1) to estimate Nr emissions from various anth and natural (e.g., soil NO and nitrous acid, HONO) sources, NO2 surface concentrations and column densities, and total and speciated Nr dry and wet deposition fluxes during 2018–2023, with discussions on key anth as well as environmental and climatic drivers of their spatiotemporal variability during this period (Sect. 3.1); (2) to relate Nr and O3 concentrations as well as their deposition fluxes during 2018–2023 in terms of spatiotemporal variability, reactions to environmental and biophysical stresses, and possible ecosystem impacts (Sect. 3.2); and (3) through three sets of case studies (Sect. 3.3) to discuss in detail land–atmosphere exchange processes, which have been understudied topics. Specifically, we demonstrate the capability of land DA to reduce the uncertainty in the modeled land surface states, land–atmosphere exchange processes, and atmospheric states at daily to interannual timescales; the impacts of controllable human activities such as irrigation on the land surface and atmospheric fields as well as pollutant ecosystem uptake; and the impacts of transboundary air pollution during selected extreme events on air pollutant budgets and ecosystem impacts. These case studies also help identify sources of model uncertainty before we draw conclusions and outline future directions for further advancements in related areas in Sect. 4.
2.1 The coupled modeling system and baseline simulation
On a 10 km, 63-vertical-layer Lambert conformal grid (Fig. 1b–c) from the subsurface to ∼100 hPa, the NASA-Unified Weather Research and Forecasting model with online chemistry (WRF-Chem) simulations were conducted over the northeast and mid-Atlantic states for 2018–2023 growing seasons starting from 25 April of each year. The analysis of the baseline simulation was focused on May–June–July (MJJ) of 2018–2020, 2022, and 2023. MJJ falls within the plant growing and O3 seasons when atmospheric Nr and O3 most actively interact with ecosystems (Y. Li et al., 2016; Clifton et al., 2020). The year 2021 is not a focus in this paper, partly due to the lack of reliable information to represent the COVID impacts on anth emissions for that year. The four-layer Noah-Multiparameterization (MP; Niu et al., 2011) land surface model (LSM) version 3.6 within the NASA Land Information System served as the land component of this modeling system, running with a sprinkler irrigation scheme and the Community Land Model type of SM factor scheme controlling stomatal resistance (i.e., β factor). Noah-MP was forced by the North American Land Data Assimilation System Phase 2 forcing data during the long-term (since 2000) offline spin-up. Noah-MP's CO2 forcings for the 2018, 2019, 2020, 2022, and 2023 warm seasons were set to 410, 412, 415, 420, and 423 ppmv, respectively, based on measurements at the Mauna Loa Observatory and the nearby Maunakea Observatories for part of 2023 (https://gml.noaa.gov/webdata/ccgg/trends/co2/co2_mm_mlo.txt, last access: 12 January 2024). This advanced Noah-MP's default setup in terms of appropriately representing the global CO2 growth rates of 2–3 ppmv yr−1 for recent years (https://gml.noaa.gov/ccgg/trends/gl_gr.html, last access: 12 July 2024). Ignoring the spatial and (intra)seasonal variability in CO2 of up to tens of parts per million by volume over the study region (Karion et al., 2020) may have introduced only small uncertainty in photosynthesis and deposition modeling according to an independent model sensitivity analysis in which CO2 forcings were perturbed (e.g., Sun et al., 2022). The land use/land cover (LULC) and soil type inputs of Noah-MP were based on the 20-category International Geosphere–Biosphere Programme-modified Moderate Resolution Imaging Spectroradiometer (MODIS; Fig. 1b) and the 16-category State Soil Geographic (Fig. S1 in the Supplement) datasets, respectively. Crop type and irrigation area as well as fraction information required by the irrigation scheme came from Monfreda et al. (2008) and Salmon et al. (2015), respectively, the latter of which (Fig. 1c) incorporated MODIS information.
Major atmospheric and land model physics as well as chemistry schemes were configured in similar ways to those in Huang et al. (2022). The photosynthesis-based dry deposition approach recommended in Huang et al. (2022) and a number of other previous dry deposition studies cited therein was applied to most gaseous species. No change was made to the sulfur dioxide dry deposition approach (Erisman et al., 1994) for this study. The modeled wet deposition fluxes were also evaluated and discussed in this work. As a replacement for the metric-based approach in Huang et al. (2022), O3 vegetative impacts were dynamically modeled by applying two separate factors to photosynthesis and stomatal conductance rates (Lombardozzi et al., 2015) that are calculated in Noah-MP. These factors are land-cover-dependent functions of O3 uptake accumulated during the growing season when the leaf area index (LAI) exceeds 0.5. To account for the ability of plants to detoxify O3, O3 fluxes were only accumulated when they exceeded a threshold of 1.0 nmol O3 m−2 s−1. As demonstrated in previous offline (Lombardozzi et al., 2015) and online (J. Li et al., 2016; Sadiq et al., 2017) modeling studies, dynamically modeling O3 vegetative impacts could help quantify the perturbations of O3 to a variety of hydrological, ecological, and weather variables. Online-calculated biogenic emissions of O3 precursors such as VOCs and Nr species in the simulations were adjusted to be more sensitive to multiple environmental stresses. Specifically, a drought adjusting factor γd was introduced in the Model of Emissions of Gases and Aerosols from Nature (MEGAN) biogenic isoprene emission calculations following the suggestions by Jiang et al. (2018), which depends on the β factor and the maximum carboxylation rate. The plant function type information needed for MEGAN was converted from the annual European Space Agency Climate Change Initiative (ESA CCI) land cover product for 2018–2020, and the 2020 data from this product were also used for the years afterwards. The Noah-MP-modeled LAIv (i.e., LAI green vegetation fraction) feeds into MEGAN calculations. Soil emissions of NO were estimated largely based on the mechanism recommended by Hudman et al. (2012) and Simpson and Darras (2021), i.e., for dry and wet soils that are determined by an SM index (i.e., a function of SM, soil wilting point, and field capacity), different sets of biome-based emission coefficients (Steinkamp and Lawrence, 2011), and the standing Nr pool plus nitrogen input from deposition adjusted by water-filled pore space θ (i.e., SM divided by porosity), soil temperature (Wang et al., 2021), and canopy reduction factor. The pulsing effects, which are small for this study area and season, were accounted for. Soil HONO emissions were also calculated online, scaled from soil NO emissions using biome-dependent factors specified in Table A1 of Rasool et al. (2019) that were partly adapted from Oswald et al. (2013). Nitrogen input from fertilizer was not included in the soil emissions calculations to avoid double counting with agricultural emissions from the anth emission input to be introduced below. Oceanic natural NH3 emissions were not included, which were estimated to have negligible impacts on Nr overland (Paulot et al., 2013). Lightning emissions were also calculated online and vertically distributed by adopting the setup described in Huang et al. (2021), which was based on cloud-top-height-based parameterizations (Wong et al., 2013) and climatological intra-cloud to cloud-to-ground flash ratios. A passive lightning NOx tracer was again implemented that experienced atmospheric transport but not chemical reactions. Aerosol direct, semidirect, and indirect radiative effects were enabled.
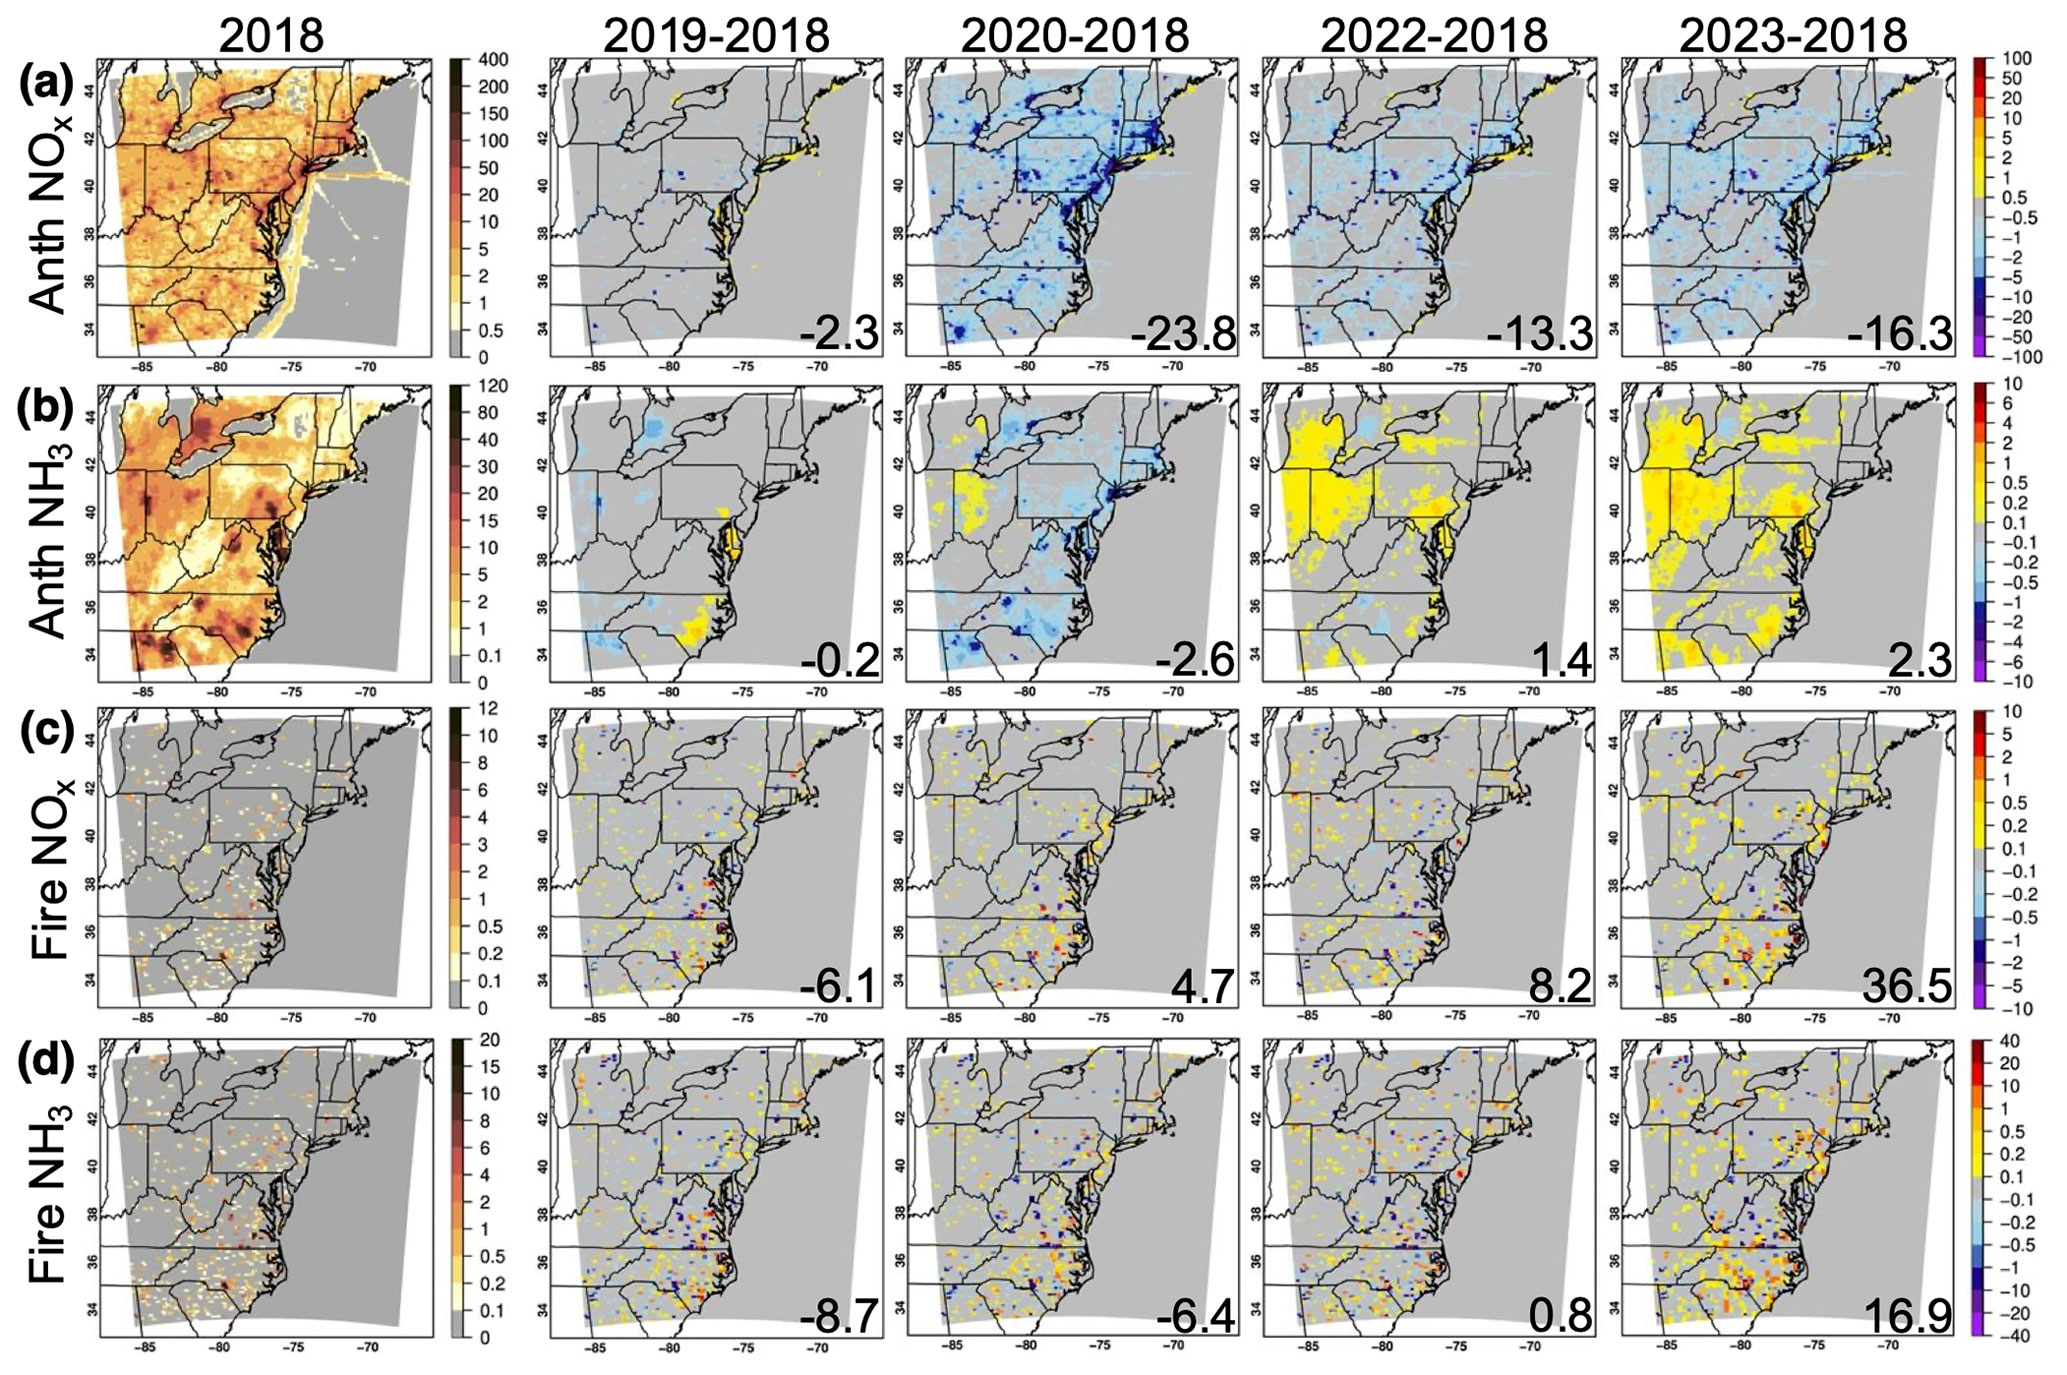
Figure 2(a, b) Anthropogenic (Anth) and (c, d) biomass burning (fire) (a, c) NOx and (b, d) NH3 emissions for MJJ 2018 and the differences between MJJ values for each of the following years and for 2018 (mol km−2 h−1). Numbers in the corners of the difference plots indicate the percent changes relative to MJJ 2018.
Emissions from various anth source sectors came from the Copernicus Atmosphere Monitoring Service (CAMS) global inventory version 5.3, available at 0.1°×0.1° horizontal resolution with monthly and year-by-year variability. To account for COVID impacts, for 2020, grid- and sector-dependent factors (Doumbia et al., 2021) were applied to adjust the emissions. This CAMS inventory for the years after 2015 was developed by extrapolating the Emissions Database for Global Atmospheric Research version 5 based on the Community Emissions Data System version 2 trends and including emissions from ships as well as monthly variability that were estimated separately (Granier et al., 2019; Soulie et al., 2024). It is noted in Elguindi et al. (2020) and references therein that NOx emissions for recent decades from an earlier version of the CAMS inventory do not notably differ from other bottom-up inventories over the US where more detailed information for emission inventory developments is available. In contrast, top-down estimates diverge significantly due to uncertainty in the satellite NO2 retrievals used as well as the model representations of various atmospheric processes, many of which are scale-dependent. A clear understanding of the impact of background NOx sources, including natural emissions, on constraining NOx emissions with satellite NO2 data is urgently needed. The 0.1°×0.1°, version 2.6r1 of the Quick Fire Emissions Dataset (QFED, Darmenov and da Silva, 2015), developed with the fire radiative power approach, was applied with plume rise (Grell et al., 2011). QFED NOx emissions over North America during 2012–2019 have comparable magnitudes to other widely used fire emission datasets such as the Fire INventory from NCAR (FINN), while its NH3 emissions are higher than the estimates from other products (Wiedinmyer et al., 2023). Figure 2 presents the total anth and biomass burning (fire) NOx and NH3 emissions averaged for each year's MJJ. Anth NOx emissions are shown to decrease due to effective emission controls (i.e., a −16.3 % overall change from 2018 to 2023), except for slight increases along a few shipping lanes. They are anomalously low in 2020 (∼23.8 % lower than 2018), largely due to reduced human activities during the COVID lockdowns. The temporal changes in non-methane (NM) VOC emissions are relatively smaller, with the domain mean in 2023 only ∼6 % lower than in 2018. The total anth NH3 emissions were growing in many places, most evidently over croplands as a result of the rising agricultural soil and livestock emissions. The QFED-based fire NOx and NH3 emissions were generally increasing, reaching their highest values in 2023.
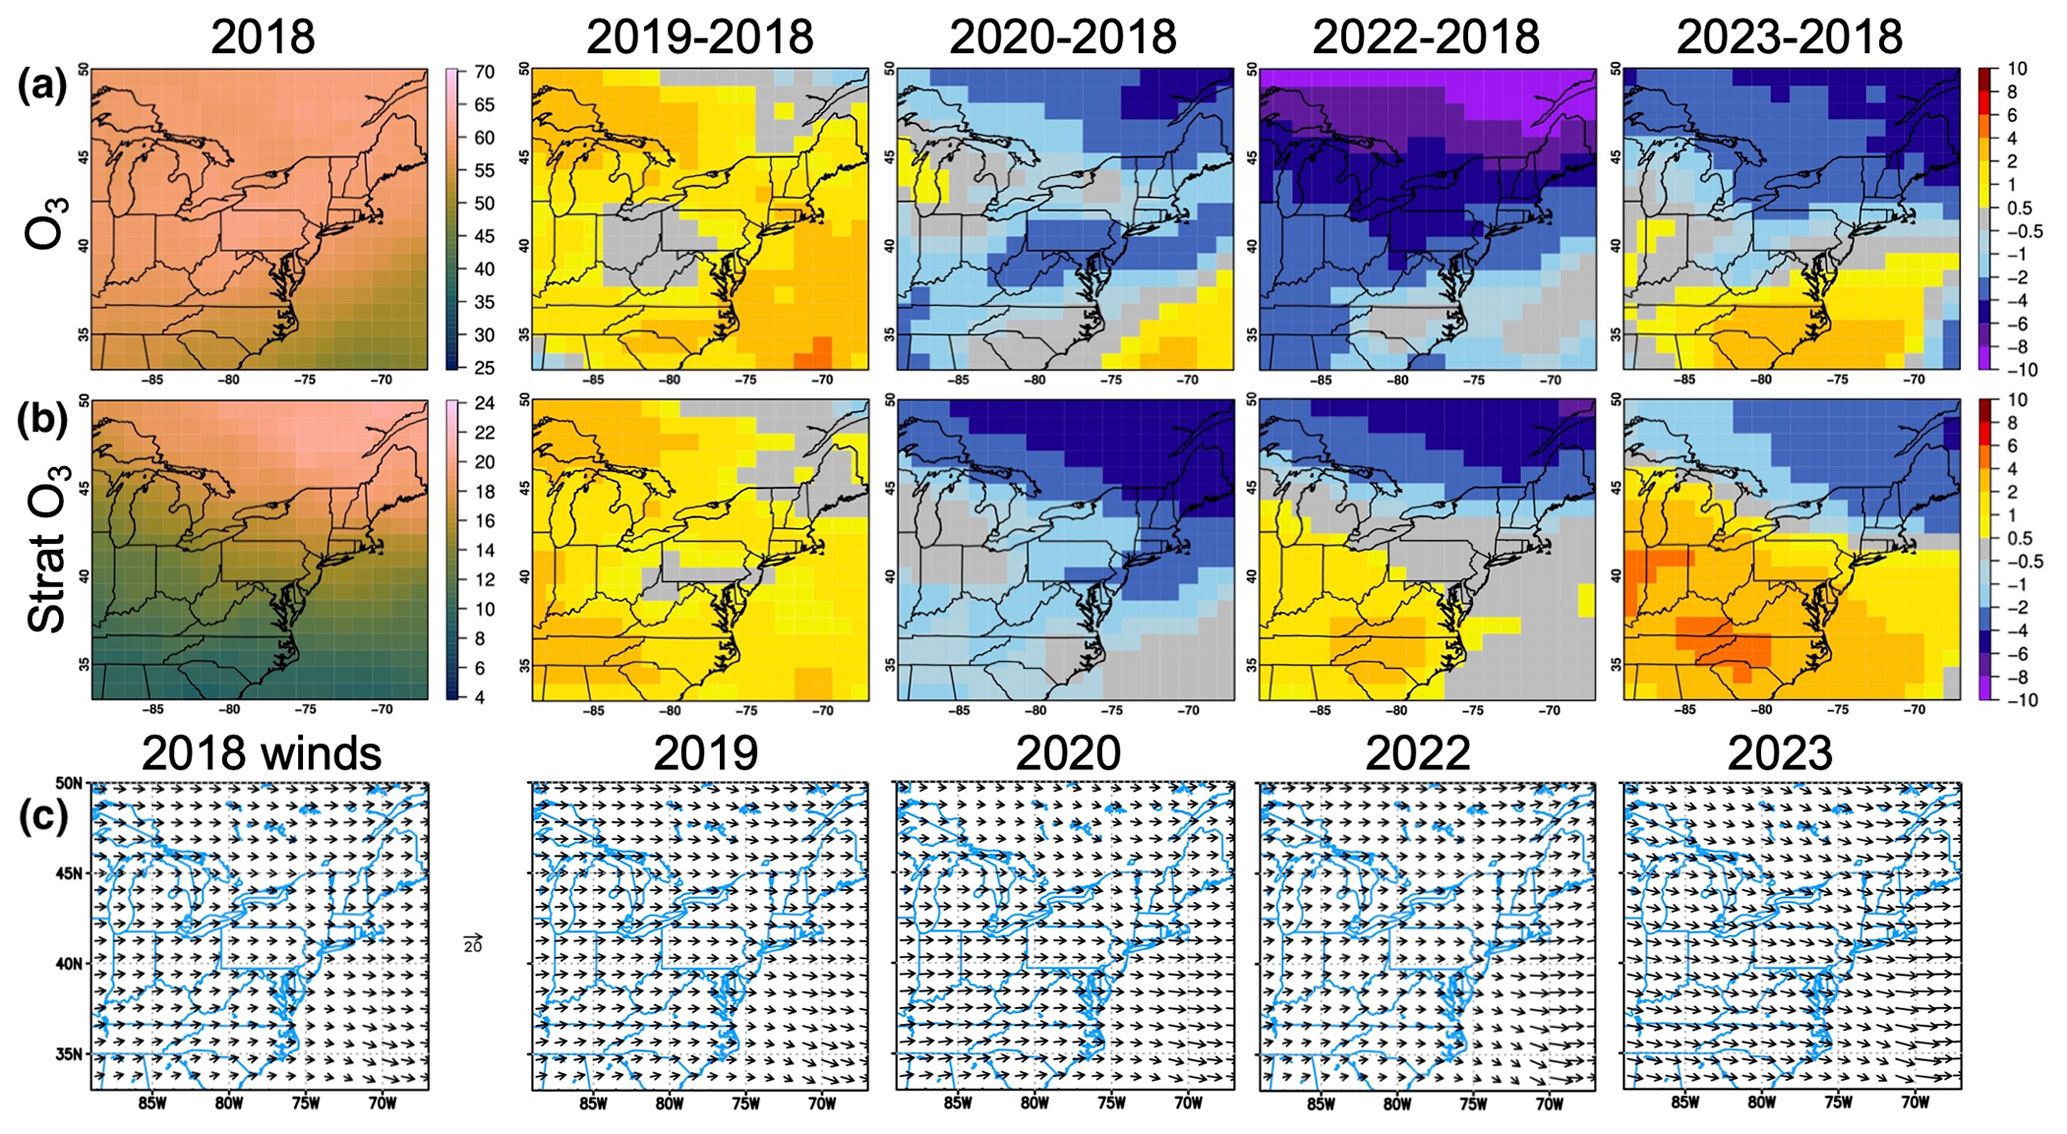
Figure 3(a) Total and (b) stratospheric O3 for MJJ at ∼600–800 hPa and their interannual differences in parts per billion by volume. (c) Wind fields for each year's MJJ from WRF-Chem's chemical boundary condition models. Stratospheric O3 impacts on the surface are indicated in Fig. S2.
Daily reinitialized atmospheric initial conditions (ICs) and boundary conditions (BCs) were downscaled from the 3 h, 32 km North American Regional Reanalysis (NARR) dataset, which overall represents the observed daily variability in apparent temperature well for the eastern US (e.g., Ibebuchi et al., 2024). Huang et al. (2017b) showed that initializing WRF with the North American Mesoscale Forecast System (6 h, 12 km) atmospheric fields instead of NARR's did not result in significant changes in WRF-simulated surface air temperature fields over the southeastern US. A set of the 6 h Community Atmosphere Model with Chemistry (CAM-Chem, for 2018–2020, vertical levels) and Whole Atmosphere Community Climate Model (WACCM, beyond 2020, vertical levels) simulations that also ingested QFED fire information served as the chemical BCs of the WRF-Chem baseline simulation because of higher completeness of chemical species and, for WACCM, availability for very recent years compared to chemical reanalysis products which are likely to be more accurate. The chemical BC models' stratospheric O3 tracer fields also supported our multiyear analysis and a case study (Sect. 3.3.3). From 2018 to 2023, the lower free-tropospheric O3 in MJJ first rose by up to 4 ppbv and then dipped down by up to 4–6 ppbv before rising again (Fig. 3a). The interannual variability in lower free-tropospheric O3 and its precursors upwind of the eastern US, as well as the synoptic wind fields that shifted from westerly in 2018–2022 to northwesterly in 2023 (Fig. 3c), play critical roles in controlling the modeled large-scale O3 patterns and their temporal changes. Ozone transport from the stratosphere more strongly influenced the lower free-tropospheric O3 over the southern part of our domain in 2023 than in 2018 by up to 4 ppbv (Fig. 3a–b). Although the stratospheric air influences on surface O3 were diluted to no more than a few parts per billion by volume (Fig. S2), the challenges regional models experience in reproducing their magnitudes and interannual variability may introduce uncertainty to the estimated surface O3 changes.
2.2 Observations
2.2.1 Chemical observations from satellites, aircraft, and ozonesondes
The TROPOspheric Monitoring Instrument (TROPOMI) on board the Copernicus Sentinel-5 Precursor satellite, launched in 2017, has provided trace gas and aerosol measurements at daily global coverage since April 2018, with the ascending node at ∼ 13:30 local time overpasses. It has much finer resolutions (i.e., 3.5×5.5 km2 at nadir since August 2019 and 3.5×7 km2 before then), a wider spectral range, and a higher signal-to-noise ratio per ground pixel than its predecessors. TROPOMI data have demonstrated their robustness in studying air pollution from numerous source sectors (e.g., land and water traffic; power plants; oil, gas, and other industries; biogenic and fire) in greater detail (e.g., Georgoulias et al., 2020; van der Velde et al., 2021; Griffin et al., 2021; Goldberg et al., 2021; Dix et al., 2022). In this study, the gridded (0.02°×0.02°) monthly and daily level 2 TROPOMI tropospheric vertical column NO2 data were analyzed together with WRF-Chem fields to help understand the temporal changes in column NO2. The gridded (0.05°×0.05°) monthly TROPOMI formaldehyde (HCHO) tropospheric vertical columns (De Smedt et al., 2021) were also used to calculate HCHO NO2 ratios to help determine O3 chemical regimes over the study area. The TROPOMI-based HCHO NO2 ratios were supplemented by those derived from the gridded (1 km ×1 km) NO2 and HCHO data collected on selected days in 2018 over New York City and the Long Island Sound by two similar airborne instruments (Judd et al., 2020): Geostationary Trace gas and Aerosol Sensor Optimization (GeoTASO) and the GEO-CAPE Airborne Simulator (GCAS).
Additionally, to help identify and attribute air pollutants during highly polluted events in 2023 (Sect. 3.3.3), the Joint Polar Satellite System-1 Cross-track Infrared Sounder (JPSS-1/CrIS, with descending and ascending nodes at ∼ 01:30 and 13:30 local time, respectively) O3, carbon monoxide (CO), and PAN level 2 daily summary data provided by the TRopospheric Ozone and Precursors from Earth System Sounding project were analyzed. The analysis of these extreme events was also supported by eight ozonesondes launched from the Virginia Commonwealth University Rice Rivers Center (RRC; 37.33197° N, 77.20842° W) during the inaugural edition of the NASA Student airborne Research Program (SARP)-East campaign in summer 2023, along with model results and ground-based observations (Sect. 2.2.3).
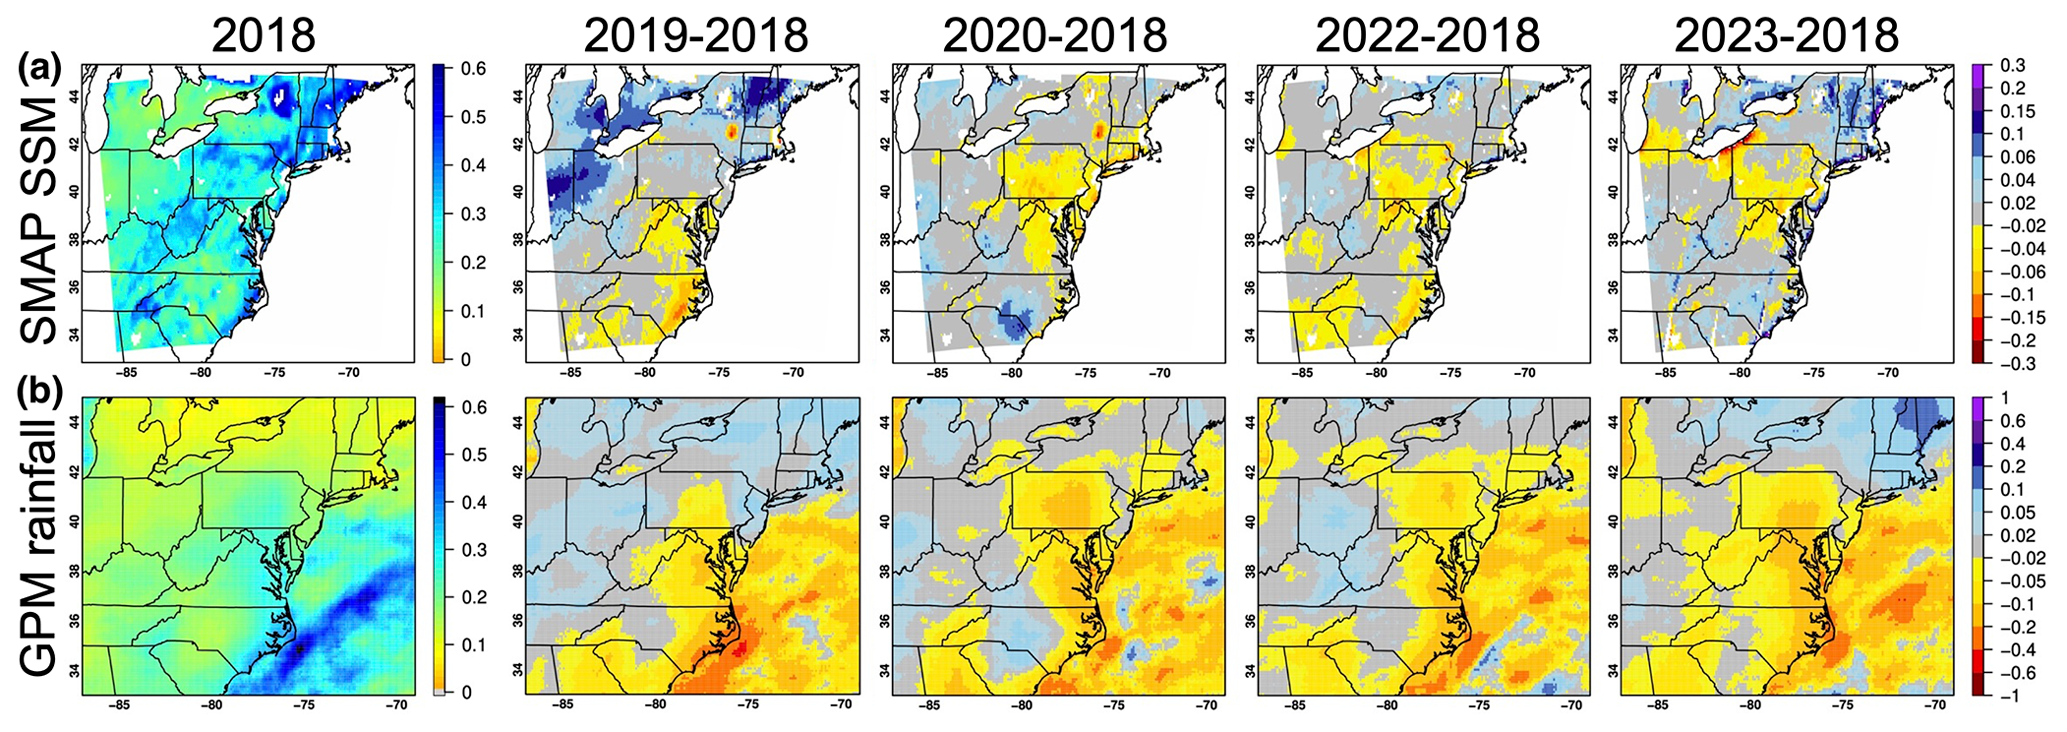
Figure 4(a) SMAP morning SSM (m3 m−3) on WRF-Chem grids and (b) GPM/IMERG precipitation (mm h−1) on its native grid for MJJ 2018 (left) as well as the differences between MJJ values for each of the following years and 2018. SMAP measures the globe every 2–3 d, and GPM daily global-coverage products are used for this work. SMAP data are not available during 20 June–22 July 2019 due to instrument outages, and the ESA CCI version 8.1 SM product indicates qualitatively similar MJJ 2019–2018 variability.
2.2.2 Satellite SM and precipitation products
To characterize drought conditions and their temporal variability, which interact with atmospheric chemistry, NASA's L-band Soil Moisture Active Passive (SMAP) 9 km enhanced surface (first 5 cm belowground) SM (SSM) data version 5 were utilized and so were version 7 daily precipitation data from the NASA–JAXA Global Precipitation Measurement (GPM) produced at 0.1°×0.1° resolution using the Integrated Multi-satellitE Retrievals for GPM-Final run algorithm. Despite the different sampling strategies and retrieval algorithms of SMAP and GPM, interannual variability in drought conditions indicated by these SSM and precipitation data is qualitatively consistent (Fig. 4) and also consistent with information from independent sources such as the North American Drought Monitor (https://droughtmonitor.unl.edu/NADM, last access: 12 July 2024; see Table S1 and Fig. S3 in the Supplement for further analysis and discussion). In addition to rainfall, irrigation water and other elements relevant to water and energy balances can also impact the variability in SSM, which has feedback to regional precipitation patterns. The wide range of the SMAP SSM from <0.2 to >0.5 m3 m−3 and the interannual differences, which often exceed 0.1 m3 m−3, indicate diverse SM regimes (i.e., dry, transitional, and wet) and therefore spatially and temporally varying land–atmosphere coupling strengths (Seneviratne et al., 2010, and references therein). The varying SSM–temperature coupling strengths were determined based on WRF-Chem results, with support of the 0.25°×0.25° European Centre for Medium-Range Weather Forecasts Reanalysis version 5 (ERA5) surface air temperature field. In a case study (Sect. 3.3.1), SMAP SSM data were assimilated into the Noah-MP LSM to improve the land ICs of WRF-Chem and, further, the modeled weather and atmospheric chemistry fields.
2.2.3 Ground-based observations
Hourly surface ultraviolet absorbance O3 observations from the US EPA's Air Quality System (AQS, a major source of the TOAR database; last access: 20 August 2024) were used to support the quantification of O3 temporal variability and model evaluation. The AQS NO2 observations, which have poorer spatial coverage than their O3 data, were also examined to help qualitatively understand surface NO2 variability. These AQS NO2 measurements made using chemiluminescence detection with catalytic conversion are known to be positively biased by up to 50 % due to NOz (NOy–NOx) interferences (e.g., Dunlea et al., 2007). Speciated aerosol measurements offered by the Clean Air Status and Trends Network (CASTNET) and AQS, CASTNET HNO3, the National Atmospheric Deposition Program (NADP)/Ammonia Monitoring Network (AMoN) NH3 observations, and the NADP/National Trends Network (NTN) wet deposition fluxes and precipitation data were used to infer or directly evaluate WRF-Chem's deposition performance. Deposition datasets from other studies, some of which integrated surface and/or satellite observations with other models (e.g., Schwede and Lear, 2014; Fu et al., 2022; Rubin et al., 2023), will be referred to in the following discussions.
Additional datasets for selected time periods were used in DA case studies to help interpret and validate the model results (Sect. 3.3.1). These include gauge-based precipitation data and SSM measured using HydraProbe sensors at Harvard Forest, Massachusetts (42.53523° N, 72.17393° W), and a US Climate Reference Network (CRN) site in Millbrook, New York (41.786° N, 73.74° W) during the July 2022 SMAP validation experiment (SMAPVEX22), as well as surface air temperature observations in July 2018 and 2022 from the National Centers for Environmental Prediction (NCEP) Global Surface Observational Weather Data product.
2.3 Case studies and sensitivity simulations
Temporal variability of Nr and O3 concentrations and fluxes at the subregional to local scale is partially driven by hydrological variability, which can be influenced by both precipitation and human activities such as irrigation. Two sets of modeling and DA case studies (Sect. 2.3.1 and 2.3.2) were conducted to show that the modeled land surface states, such as SM, can be improved via land DA and/or updating the model's irrigation schemes, which further impacts the modeled land–atmosphere exchange processes and atmospheric fields.
2.3.1 Effects of SM DA on modeled NO2 and O3
For this case study, SMAP morning (∼ 06:00 local time) SSM data were bias-corrected by matching the means and standard deviations of SMAP and Noah-MP SSM monthly climatology. The bias-corrected data were then assimilated into the Noah-MP LSM using a 40-member ensemble Kalman filter approach to adjust WRF-Chem's land ICs during July 2018 and July 2022. Meteorological forcing (precipitation, shortwave and longwave radiation) and state (Noah-MP SM) perturbation attributes were set up largely based on the Kumar et al. (2009) recommendations for the Noah LSM, and the input observation error standard deviation was set to 0.04 m3 m−3 according to the SMAP data quality requirement. Through this experiment we evaluate whether and to what extent satellite SM DA can improve the day-to-day (i.e., before and after a precipitating event during the SMAPVEX22 campaign when in situ SSM data were also collected near the SMAP morning overpassing times) and interannual variability (i.e., July 2018 and July 2022) of Noah-MP SM, even in dense vegetation regions such as the eastern US where satellite SM retrieval is generally more challenging. How the adjustments to Noah-MP land surface states by DA impacted the modeled atmospheric fields was also quantified.
2.3.2 Irrigation impacts on O3 vegetation uptake and Nr deposition
Using flux-based O3 metrics derived from model outputs, recent studies (Mills et al., 2018; Huang et al., 2022) estimated that the negative impacts of ground-level O3 on crop yields are particularly large over humid irrigated and rainfed agricultural lands, where plant stomatal uptake of O3 is significant. The global-scale coarse-resolution analysis for 2010–2012 by Mills et al. (2018), which was based on O3 flux metrics, also determined that irrigation promotes O3 impacts on wheat production by up to ∼10 %. To dynamically evaluate in detail the irrigation impacts on land surface and atmospheric fields as well as the estimated O3 and Nr ecosystem impacts across our study area for recent years, WRF-Chem simulations were conducted with three sets of irrigation configurations, defined as (a), (b), and (c) below, and for each of these three scenarios, two simulations were conducted with and without O3 vegetation impacts.
- a.
Full irrigation (baseline): sprinkler irrigation occurs in the morning when root zone SM drops below 50 % of field capacity.
- b.
Reduced irrigation: sprinkler irrigation occurs in the morning when root zone SM drops below 25 % of field capacity, and the estimated irrigation water usage for this scenario is of the full-irrigation scenario for irrigated areas south of ∼37° N in our domain.
- c.
The irrigation option was completely disabled.
This sensitivity analysis is focused on 21–30 June 2022, when irrigated fields in the Carolinas that grow mostly O3-sensitive crops were under stress according to the Vegetation Drought Response Index produced by the National Drought Mitigation Center (Fig. S4). This region also encompasses Nr deposition hotspots that have been experiencing critical load (CL) exceedances (i.e., the amount of Nr deposition exceeds the CL threshold, the point above which deposition could harm sensitive ecosystems). For this period, irrigation water consumption under the full-irrigation scenario may be higher than normal, and the estimated surface fluxes under reduced- and no-irrigation scenarios may be particularly smaller than usual and more strongly constrained by SM.
2.3.3 Impacts of transboundary pollution on weather, air quality, and ecosystems
The northeast and mid-Atlantic US air quality is regularly affected by pollutants emitted and/or formed in upwind US states. Actions have been taken to tackle cross-state air pollution such as using the Cross-State Air Pollution Rule framework (https://www.epa.gov/Cross-State-Air-Pollution/overview-cross-state-air-pollution-rule-csapr, last access: 12 January 2024). However, with the US EPA's “Good Neighbor Plan” being put on hold by the Supreme Court (https://www.epa.gov/Cross-State-Air-Pollution/good-neighbor-plan-2015-ozone-naaqs, last access: 12 July 2024), downwind US states may continue to face difficulties complying with the 2015 O3 National Ambient Air Quality Standards due to the upwind states' pollution impacts. Periodically, distant sources including Canadian wildfires and O3-rich stratospheric air also travel to the northeastern and Atlantic states. Satellite and in situ observations are powerful in detecting such episodic events that have occurred more frequently in recent years, assisting with early warnings and early actions. To help quantify the impacts of such extreme events, as well as other upwind air pollution sources, on weather, air quality, and ecosystems during 13–16 June 2023, two WRF-Chem sensitivity simulations were conducted and analyzed together with the baseline simulation and multiplatform observations. Clean chemical BCs were applied in one of these sensitivity simulations, and WACCM running with the FINN fire emission input served as the chemical BCs of the other WRF-Chem sensitivity simulation named “Sen”. Fire emission is identified as one of the most important configurations in global wildfire modeling (e.g., Veira et al., 2015).
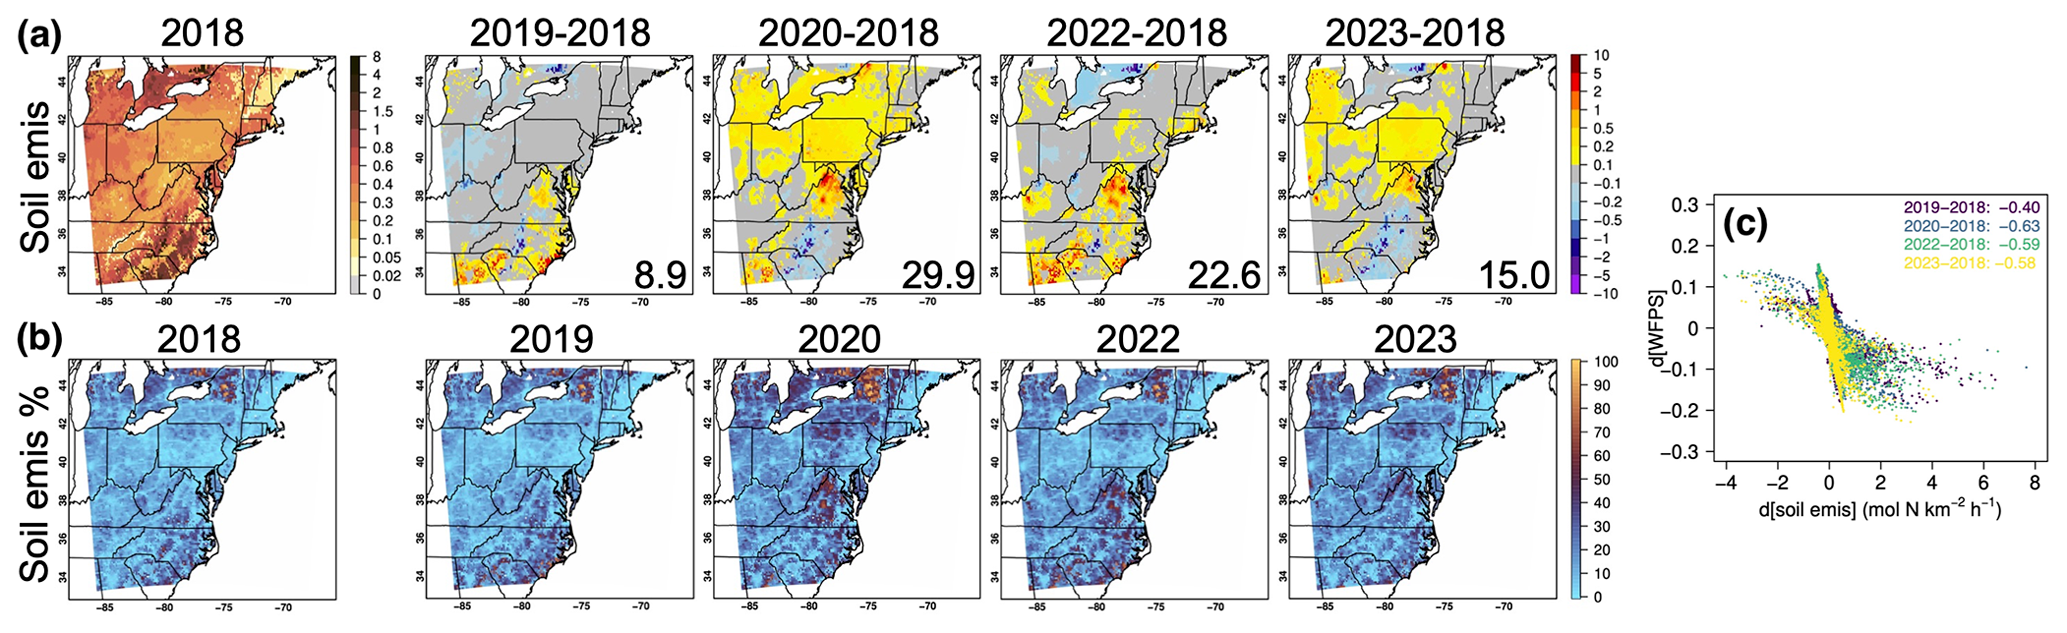
Figure 5(a) Modeled soil NO and HONO emissions (mol N km−2 h−1) and (b) soil NO and HONO emission percent contributions to total anth+fire+soil NOy emissions. Model results are averaged for MJJ 2018, shown together with the differences between MJJ values for each of the following years and 2018. Numbers in the corners of the soil emission difference plots in (a) indicate the percent changes relative to MJJ 2018. The scatterplot in (c) indicates relationships between the interannual differences in water-filled pore space (WFPS, whose spatial patterns are shown in Fig. S5) and soil NOy emissions, including their correlation coefficients in the upper-right legend (p≪0.01).
3.1 Nr emissions, concentrations, and deposition fluxes during 2018–2023
The modeled soil NO and HONO emissions vary strongly with SM as well as soil temperature that can be impacted by SM. Even without land DA the model reproduced the large-scale spatial gradients and interannual variability of soil wetness fairly well (Figs. 4a and S5). Soil emissions exhibit notable monthly variations, with multiyear June and July mean values ∼11 % and ∼59 % higher than the May mean, respectively, associated with overall warmer and drier conditions. These monthly variations, together with the ∼8 % and ∼18 % multiyear June–May and July–May mean differences in anth+fire emissions, as well as modeled surface and column NO2 fields, help interpret the higher TROPOMI and AQS NO2 in warmer months over many rural areas, especially those near high-temperature agricultural regions (Fig. S6), a point Goldberg et al. (2021) also highlighted. The maxima and minima of MJJ soil emissions are shown for 2020 and 2018, respectively, and the interannual variability of soil emissions roughly anticorrelates with that of SM, with the correlation coefficient r ranging from −0.63 to −0.40 (p≪0.01; Fig. 5a, c). For most years, the estimated MJJ mean soil NO and HONO emissions are particularly high in warm and/or dry areas including parts of the Carolinas, Virginia, New York, Michigan, and Ontario (Canada), where their contributions to the total soil+anth+fire NOy emissions persistently exceeded 30 % (Fig. 5a–b). Based on a global atmospheric chemistry model with a similar soil emission scheme, previous estimates of the soil NO emission contributions to column NO2 for this area were minor compared to other US regions in 2005 (i.e., <15 % uniformly in Vinken et al., 2014), when anth NOx emissions were >25 % higher than in 2018 according to the CAMS inventory and other estimates. Owing to the overall declining US anth emissions and the changing climate, soil emissions play an increasingly important role in controlling Nr and, further, O3 air quality in this area. Accordingly, the need to properly parameterize soil emissions and accurately model soil environments (e.g., SM, soil temperature, pH) has been growing stronger, which could greatly benefit from laboratory and field experiments.
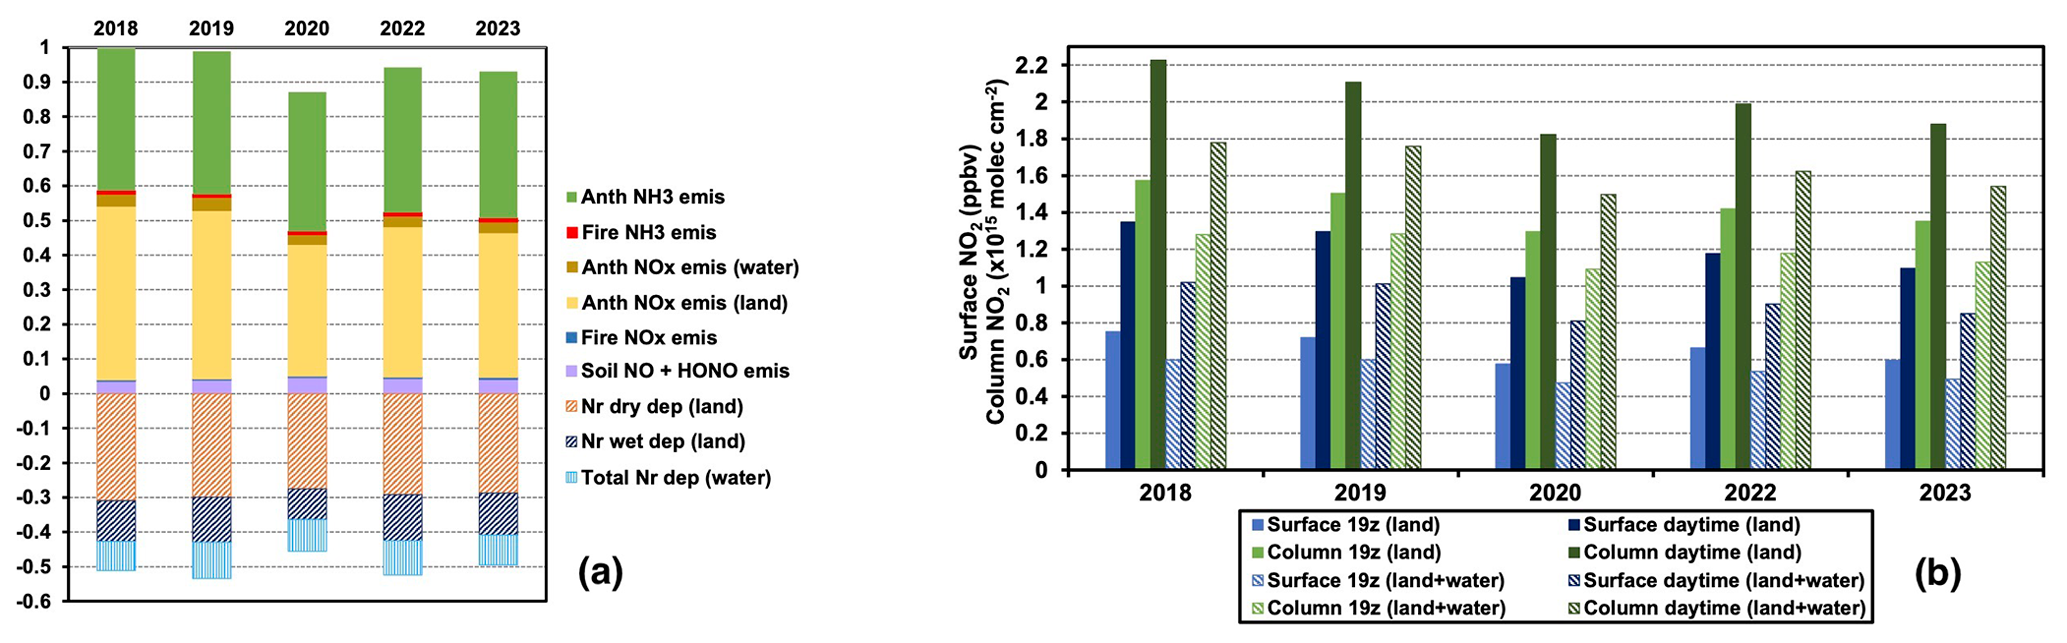
Figure 6(a) Emission and deposition fluxes by year, scaled to MJJ 2018 total emissions. (b) Domain-wide MJJ average surface and column NO2, summarized for early afternoon (19:00 UTC) and daytime as well as for land and all model grids. Water and land model grids are defined in Fig. 1b.
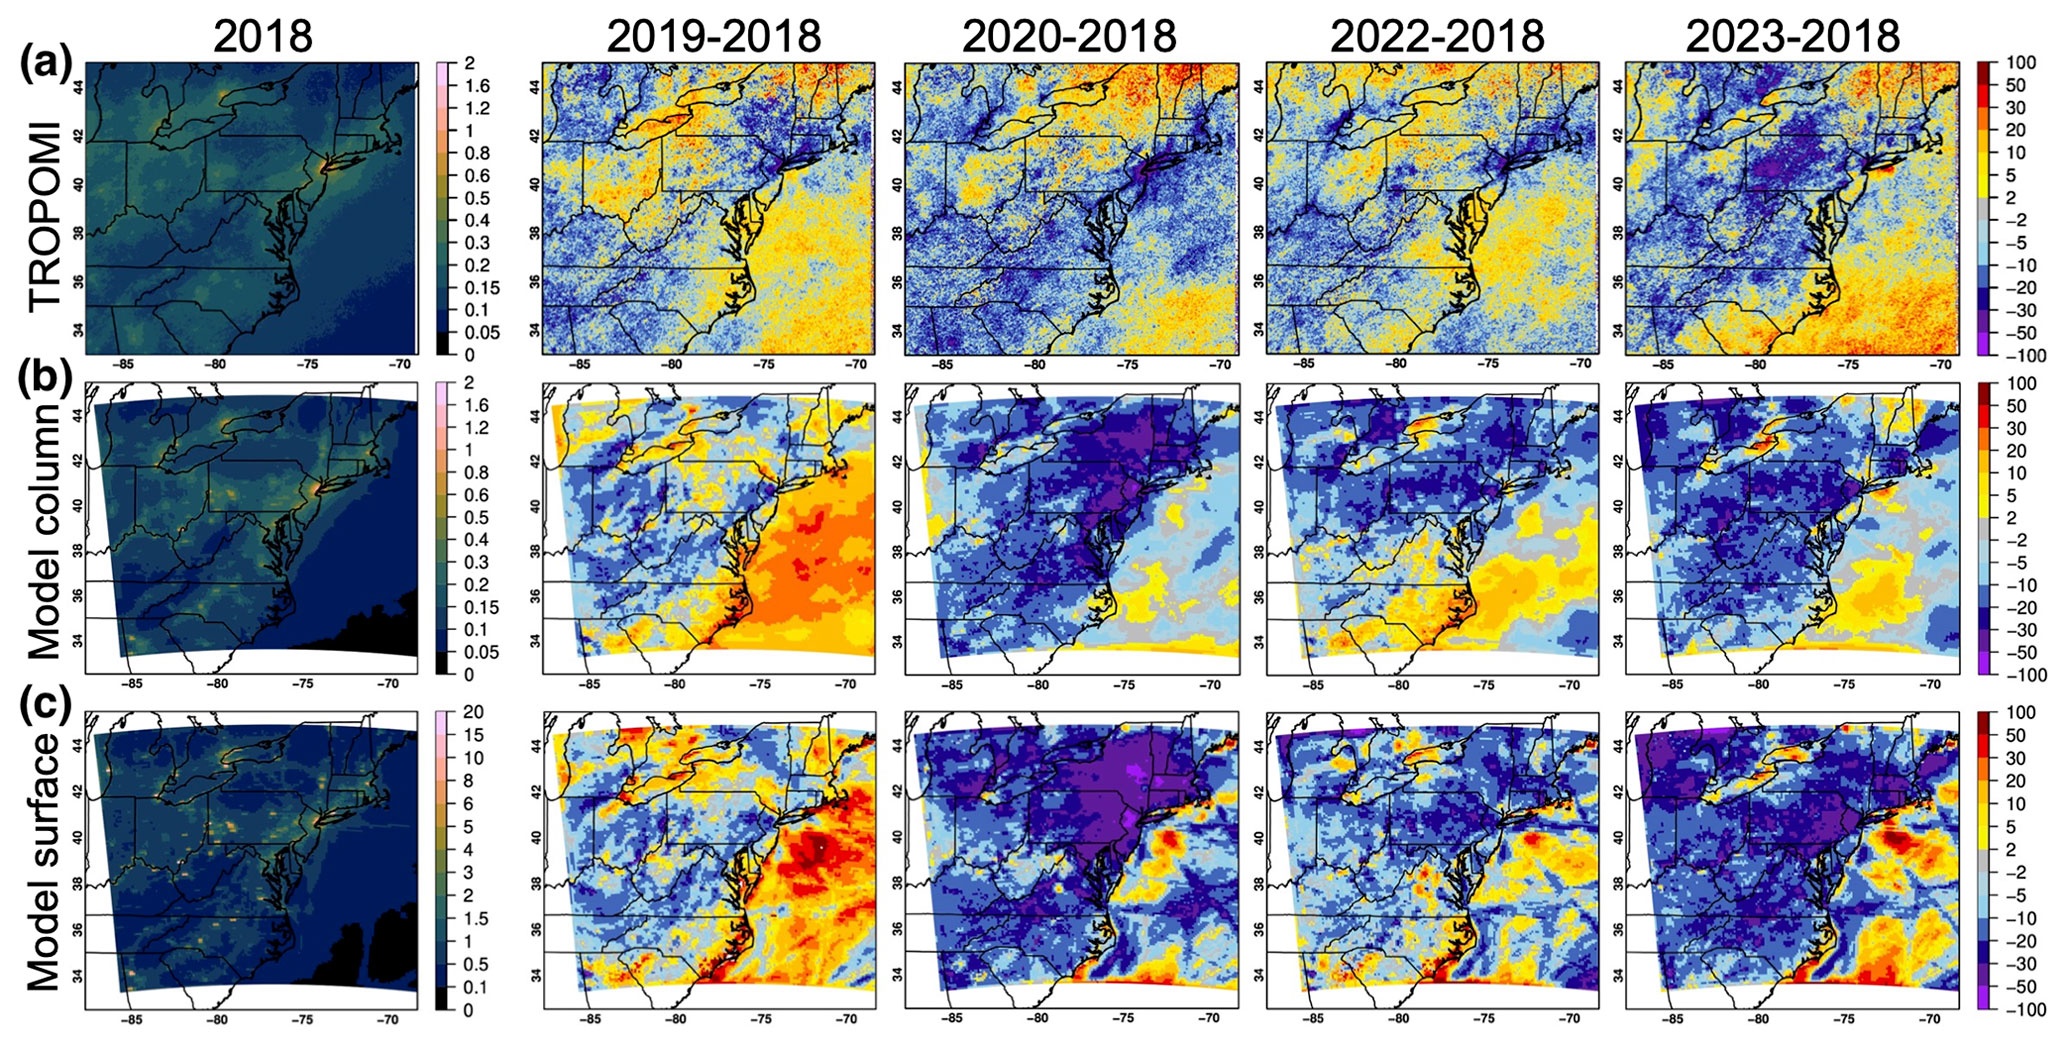
Figure 7(a) TROPOMI and (b) WRF-Chem NO2 columns. (c) WRF-Chem surface NO2 at 19:00 UTC. Results are averaged for MJJ 2018 (left, in ×1016 molec. cm−2 for column NO2 and parts per billion by volume for surface NO2) and shown together with the percent differences between MJJ values for each of the following years and 2018.
Despite the increasing anth NH3 and fire Nr emission trends (Sect. 2.1) and the abovementioned interannual variability in soil NO and HONO emissions, the total Nr emissions as well as surface NOy emissions that contributed to >50 % of the total Nr emissions show decreasing year-to-year changes during 2018–2023 except for the dip in 2020 that is mainly attributable to the COVID lockdowns (Fig. 6a). Closely linked to such temporal changes in NOy emissions, which in many areas overwhelm the effects of slower NO2 and NOy dry deposition (Fig. S7 and later discussion), the modeled column and surface NO2 both display downward changes since 2018, with their lowest values occurring in 2020 (Figs. 6b and 7). From 2018 to 2023, on average, column and surface NO2 dropped by 15 %–20 %. Impacted by the decreasing NO2, HCHO columns overall demonstrate year-to-year changes that are a few percent slower than NO2 (Fig. S8), in large part because of less significant non-methane VOC emission changes (Sect. 2.1). Impacted mostly by shipping and lightning emissions as well as North American pollution outflows, the amount of NO2 above the ocean is lower than over land. Early afternoon (19:00 UTC, local standard time +5 or +6 h, near TROPOMI overpass times) surface and column NO2 is ∼44 % and ∼29 % lower than their daytime averages (13–24:00 UTC, roughly the sampling times of geostationary missions such as the Tropospheric Emissions: Monitoring of Pollution, TEMPO, and the anticipated Geostationary Extended Observations). The stronger subdaily variability in surface NO2 than in column NO2 reflects the impacts of photochemistry and the evolution of the planetary boundary layer on the rapidly changing vertical distributions of chemicals throughout the daytime, which have also been demonstrated in Huang et al. (2017b) and other studies with aircraft observations. Strongly dependent on convection, lightning NO emissions show high variations from year to year in terms of locations and magnitudes, having larger impacts on free-tropospheric and column average NO2 than surface NO2 (Fig. S9).
The column NO2 spatiotemporal variabilities based on WRF-Chem and TROPOMI greatly resemble one another (Fig. 7a–b), and larger model–TROPOMI discrepancies are seen over the areas possibly influenced by lightning NO emissions and transboundary pollution where both model and retrieval errors may be large. The interannual variations in such pollutant sources aloft may also explain the different interannual variability in surface and column NO2 for some locations and years. AQS NO2 data, although sparsely distributed and positively biased, qualitatively confirmed the model-suggested year-to-year changes in surface NO2 (Fig. S10).
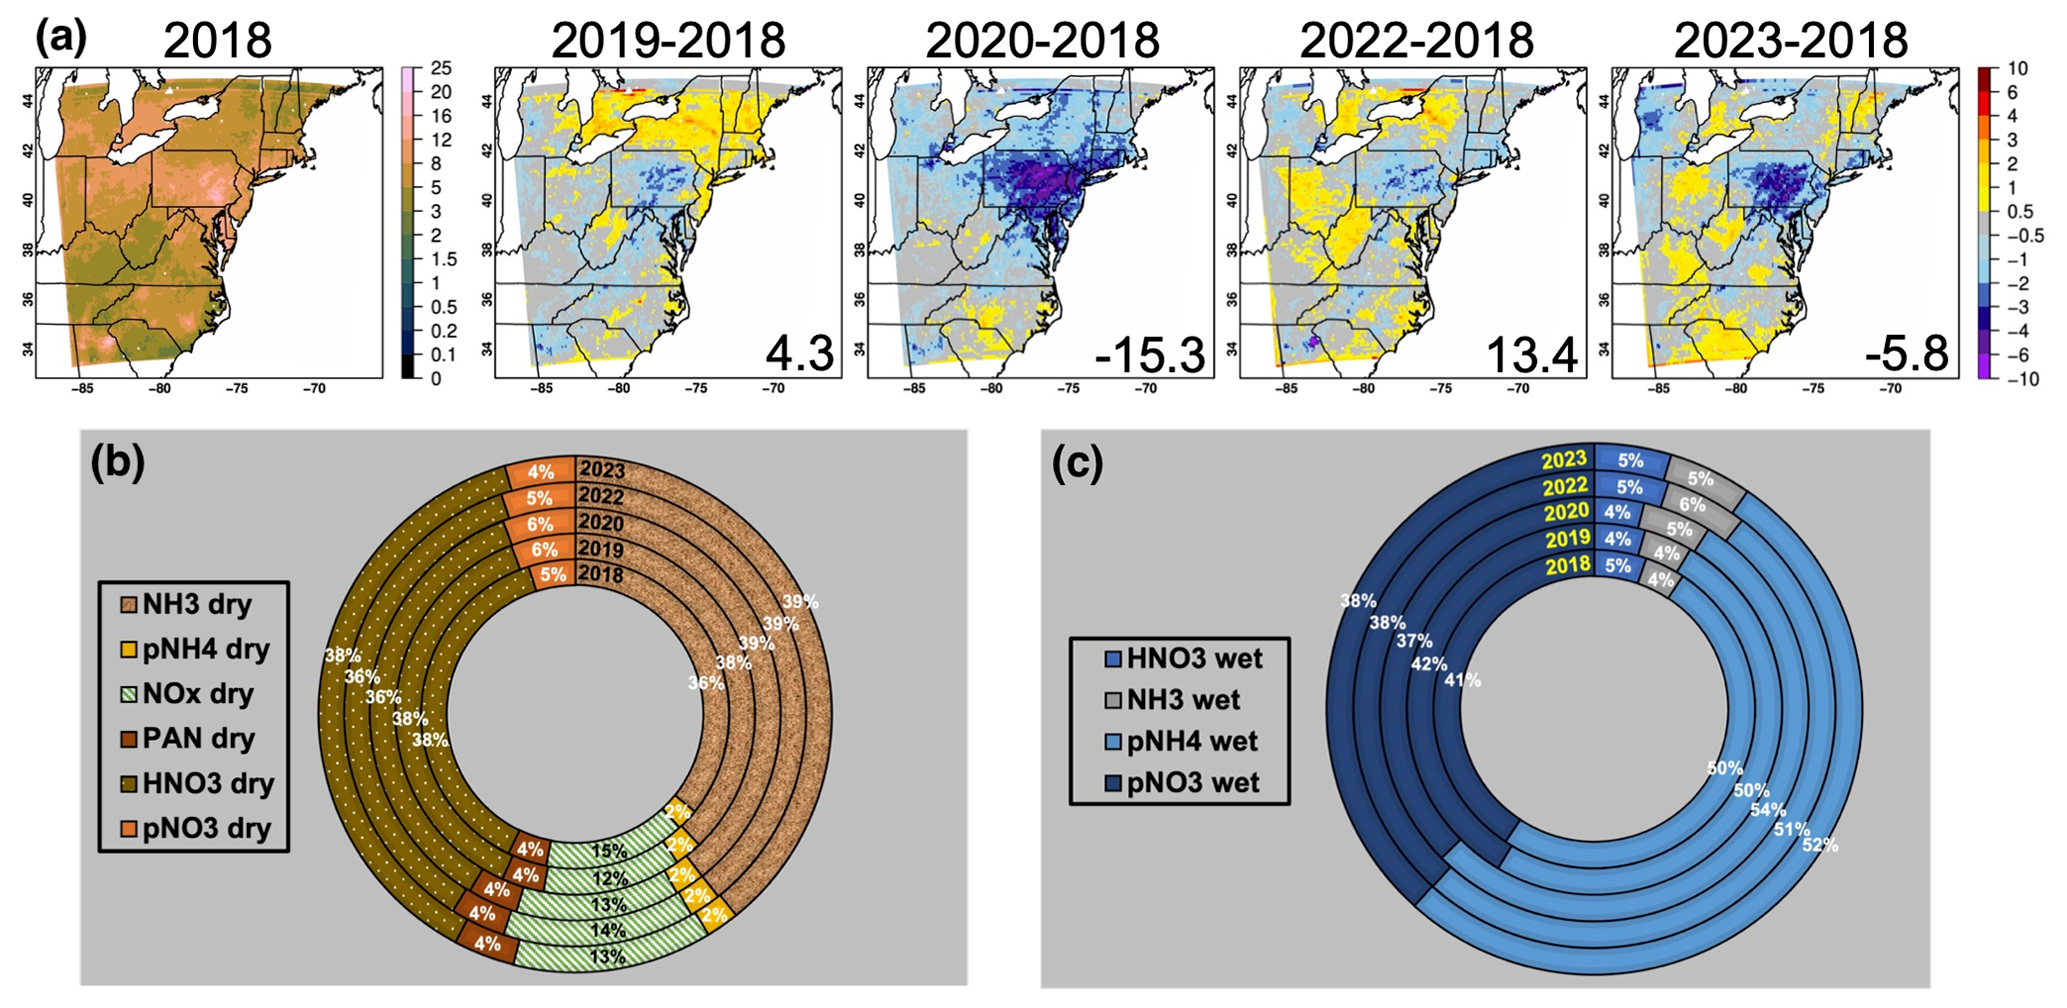
Figure 8(a) Modeled MJJ 2018 total Nr deposition over land and differences between MJJ values for each of the following years and 2018 (kgN ha−1 yr−1). Speciation of modeled (b) dry and (c) wet deposition fluxes by year, where the prefix “p” indicates particle.
Drought conditions, as well as the opposite directions of NOy and NH3 emission and concentration changes, helped shape the interannual variability in the total Nr deposition fluxes (Fig. 8a). Over land, the modeled Nr wet deposition fluxes often contributed to nearly or lower than 30 % of the total Nr deposition. These contributions are smaller than earlier estimates for this area (e.g., <60 % in Tan et al., 2018, where wet deposition based on 11 global models was overestimated), due in part to WRF-Chem wet deposition being underestimated and referring to the NADP/NTN measurements (Table S2 and Fig. S11). This underestimation in wet deposition can be attributed to known limitations in the WRF-Chem wet deposition scheme (Ryu and Min, 2022; Yao et al., 2023). The underestimated model precipitation rates and inaccurate model precipitation patterns on event to seasonal scales (Figs. 4b, S5, and S11; Sect. 3.3.1 case study), as well as observation representation errors, have also caused negative biases in wet deposition fluxes and positive biases in aerosol concentrations, especially for NH4 and NO3 (Figs. S11–S14). Such precipitation biases in WRF have also been reported in previous studies, and they can indirectly impact dry deposition modeling.
Dry NOy deposition fluxes decreased evidently (i.e., by 5 %–16 % overall and >50 % in some populated areas), whereas NHx dry deposition fluxes show up to ±3 % of overall interannual variability and rose by >20 % over certain agricultural lands (Fig. S15) where NH3 emissions have been climbing. Due to not applying a bidirectional approach (Zhang et al., 2010; Massad et al., 2010; Pleim et al., 2019), these NH3 fluxes may be overestimated over source regions by a few percent (Zhu et al., 2015; Liu et al., 2020a), contributing to the model's minor negative NH3 biases relative to the NADP/AMoN data (Table S2 and Fig. S13). Nevertheless, the contrasting directions of change in NOy and NHx deposition fluxes as well as the importance of NHx deposition in total deposition corroborate results from other studies for earlier periods (e.g., Schwede and Lear, 2014; Y. Li et al., 2016; Jia et al., 2016; Geddes and Martin, 2017; Liu et al., 2020b, and references therein). With interannual differences of several percent in flux partitioning (Fig. 8b–c), in MJJ for all years, HNO3 and NH3 contributions (>35 %) dominated the Nr dry deposition fluxes. NO dry deposition is negligible due to extremely high surface resistance and in figures is combined with NO2 into NOx fluxes that contribute to 12 %–15 % of Nr dry deposition fluxes. Unlike most other species, surface resistance of HNO3 is nearly zero, whose dry deposition variability is therefore driven dominantly by aerodynamic resistance and quasi-laminar sublayer resistance and responds differently to drought conditions than the other Nr species and O3 (Sect. 3.2). The modeled HNO3 daytime dry deposition velocities over most forested areas fall within 4–8 cm s−1, close to the measurements reported in the literature for similar land cover types in the eastern US (e.g., Nguyen et al., 2015). These are about a factor of 10 higher than the dry deposition velocities of NO2 and PAN, similar to the results in Wu et al. (2011), also based on a photosynthesis-based dry deposition model and the flux measurements summarized by Delaria and Cohen (2023).
Many global models have provided estimates of total and speciated Nr deposition fluxes for previous decades (e.g., Dentener et al., 2006; Paulot et al., 2018; Tan et al., 2018; Rubin et al., 2023). Here, our regional model results present more details which could be beneficial for estimating CL exceedances on relatively smaller spatial scales. They are overall of a lower magnitude, reflecting the impacts of declining NOy and Nr emissions, which are anticipated to continue into the coming decades. This may also be attributed to the impact of the changing climate and the model uncertainty relevant to scales, deficits in deposition schemes and inputs, and uncounted deposition of certain organic Nr species due to our chosen chemistry and aerosol schemes. Possibly also for these reasons, a little over 50 % of the surface Nr emissions were estimated to be removed via deposition in this area for all years (Fig. 6a), slightly lower than the estimates in previous modeling studies.
Comparing our WRF-Chem Nr deposition fluxes to the CL thresholds in Simkin et al. (2016) for herbaceous plants that range from 7.4 to 19.6 kg ha−1 yr−1, from 2018 to 2023, the high likelihoods of CL exceedances in Pennsylvania dropped, whereas those in parts of North Carolina may have remained high. The Nr deposition fluxes stayed below these CL thresholds over most of the northern forests, a region where primary productivity has been determined to be nitrogen-limited (Du et al., 2020) and can be highly sensitive to the interannual variability in Nr deposition (Fig. S16). The empirical CL thresholds of >3–8 kg ha−1 yr−1 for the eastern US forests in Pardo et al. (2011) are higher than the modeled Nr deposition fluxes over the forests in New England states and West Virginia, whereas for the other forests they are roughly close to or lower than the modeled fluxes. These results help explain the findings in Horn et al. (2018) that tree growth and survival have increasing and flat to slightly decreasing relationships with Nr deposition for New England and West Virginia forests and other eastern US forests, respectively. For lichen, WRF-Chem suggests that widespread CL exceedances occurred throughout the study period, according to the static CL thresholds of 3.5, 3.1, 1.9, and 1.3 kgN ha−1 yr−1 for total species richness, sensitive species richness, forage lichen abundance, and cyanolichen abundance, respectively (Geiser et al., 2019). Note that these lichen CL thresholds are likely to be conservative for the eastern US as they were derived partially from biased model deposition fields, and further assessments of the uncertainty of these thresholds are necessary.
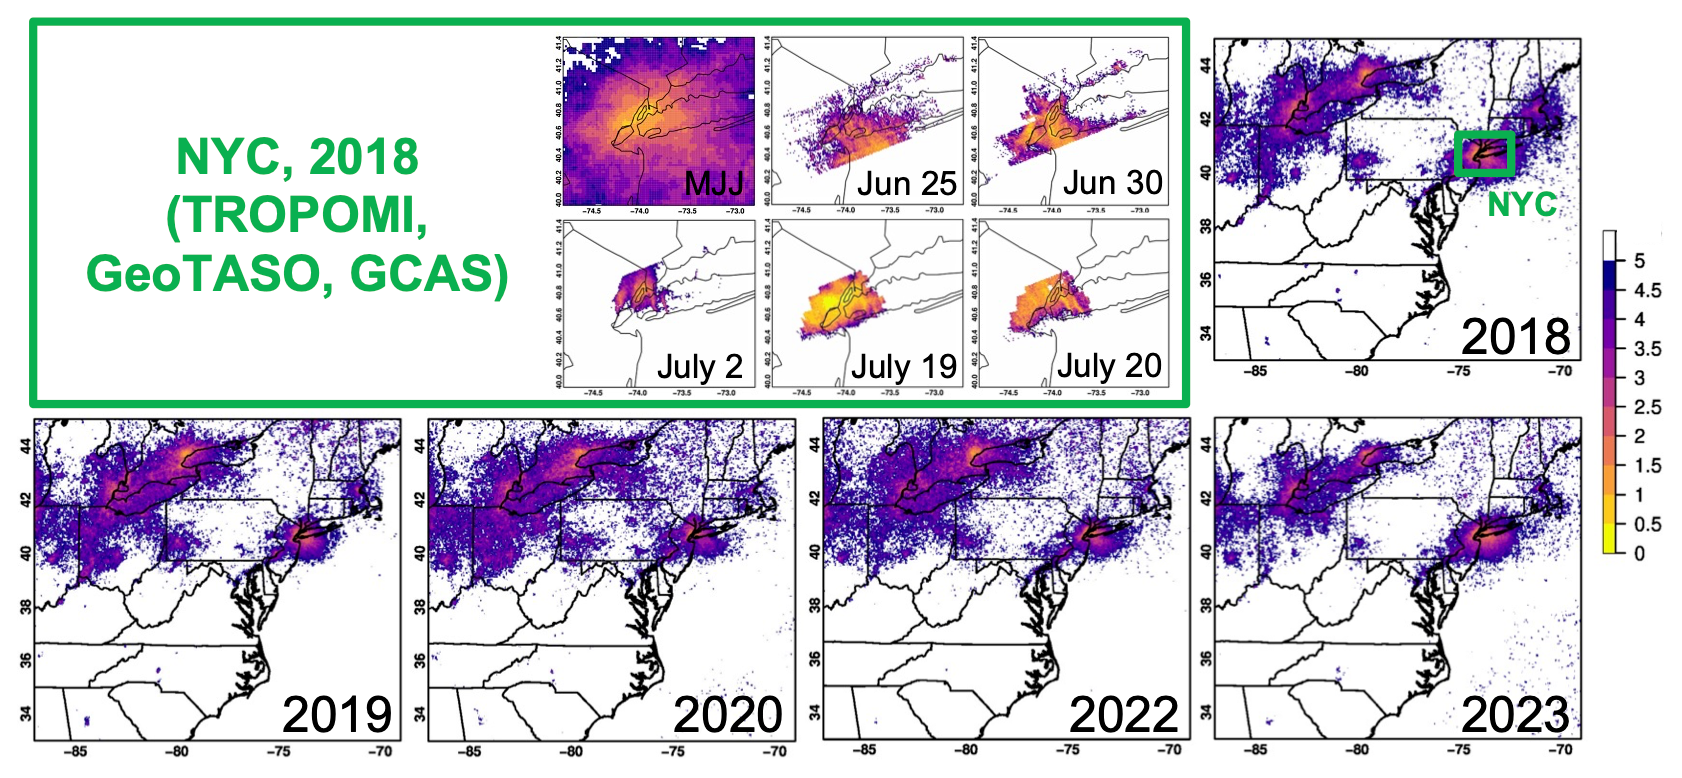
Figure 9TROPOMI (MJJ 2018–2023), GeoTASO (25 and 30 June 2018), and GCAS (2, 19, and 20 July 2018) HCHO NO2 ratios. GeoTASO and GCAS both took measurements over the greater New York City (NYC) area several times during the sampling days, which indicate subdaily variability in HCHO, NO2, and their ratio. Their measurements closest to 19:00 UTC are used here.
3.2 Spatiotemporal variability of Nr and O3 concentrations and deposition fluxes
The interannual, day-by-day, and subdaily variabilities in HCHO NO2 ratios derived from TROPOMI and airborne GCAS and GeoTASO data indicate the variable photochemical environments driven by the changing meteorology and emissions but, as noted in a number of prior studies (e.g., Duncan et al., 2010; Jin et al., 2017; Tao et al., 2022; Souri et al., 2023), can also be affected by retrieval uncertainty and several other types of errors. Yet, they indicate that much of the study area belonged to NOx-sensitive or transitional chemical regimes during 2018–2023 (i.e., HCHO NO2 higher than empirical thresholds of 2–4; Fig. 9) except for a few megacities such as the greater New York City area and Toronto (Canada), and for those urban regions, O3 formation continues the trends of turning sensitive to NOx.
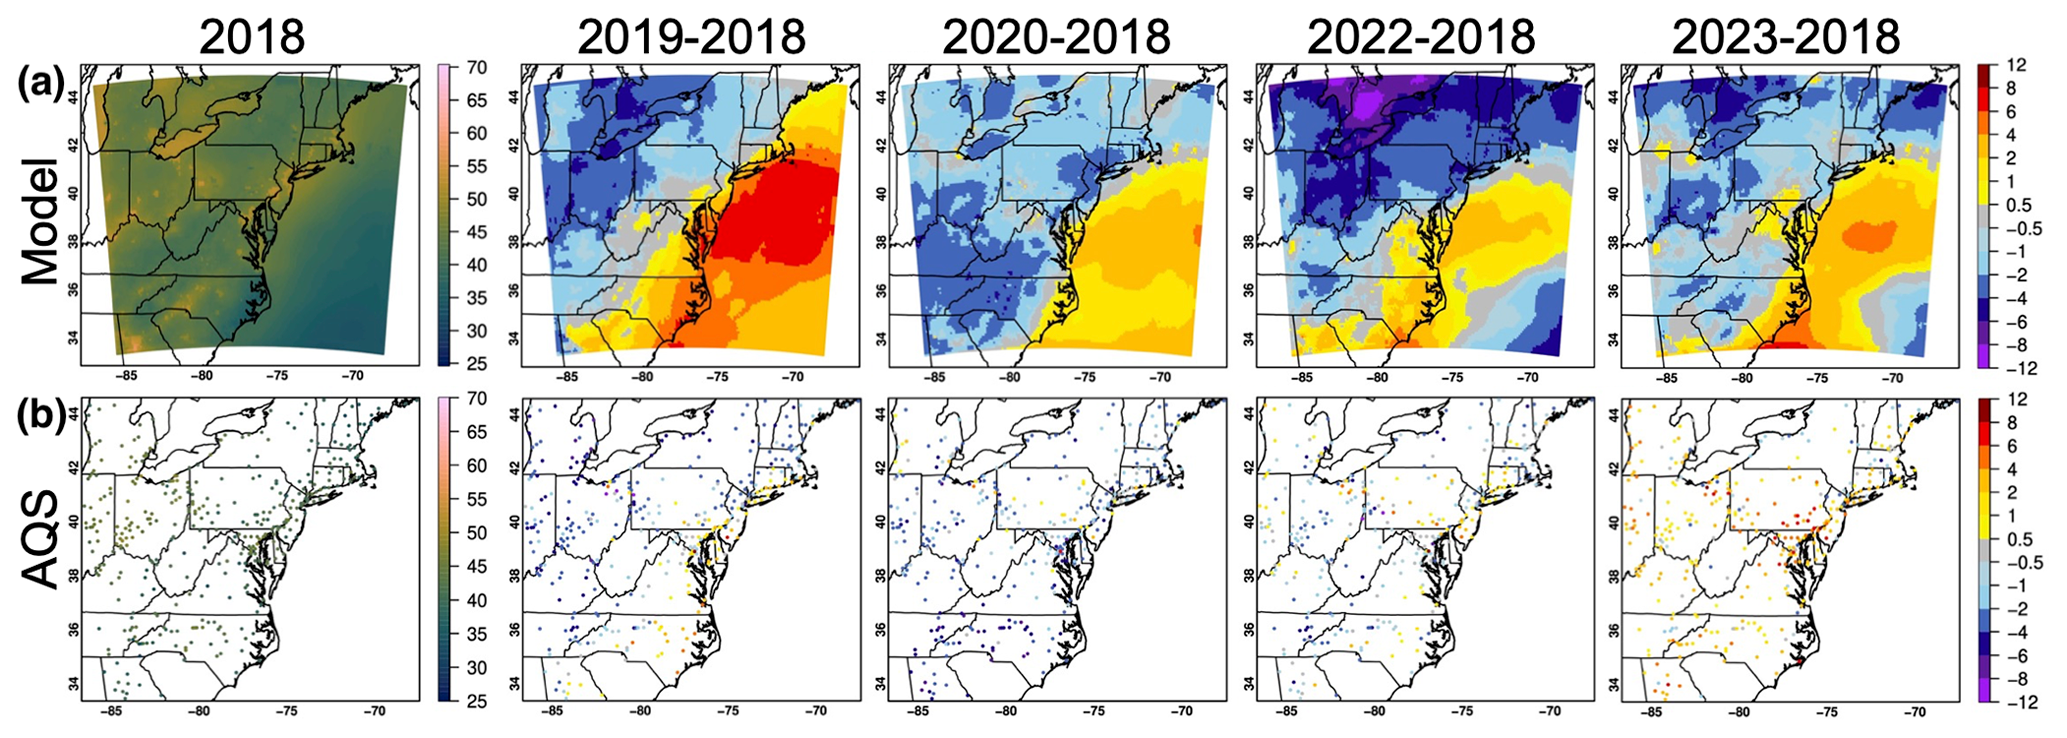
Figure 10(a) WRF-Chem-modeled and (b) AQS daytime surface O3. Results are averaged for MJJ 2018, shown together with the differences between MJJ values for each of the following years and 2018 (all in parts per billion by volume). Observations from the AQS sites having <10 % missing data for each year were used for evaluation. Model vs. AQS RMSEs (number of grids having collocated observations) for 2018, 2019, 2020, 2022, and 2023 are 5.6 (375), 6.5 (377), 5.9 (373), 4.8 (370), and 4.0 (381), respectively.
Largely explainable by the changing NOy emissions and NOx-sensitive chemical regimes, the spatial patterns of the modeled interannual differences in column NO2 and surface O3 concentrations roughly resemble one another. Both NO2 and O3 display downward changes over the majority of terrestrial areas, whereas we see the opposite direction of changes over the Atlantic Ocean (Figs. 7b and 10a). In more than half of the terrestrial model grids, the interannual variability of 19:00 UTC NO2 columns and daytime surface O3 is moderately correlated (r>0.6), with the r value of 0.57 averaged across all overland grids and 0.92 for grids where the p values of the correlation tests are lower than 0.05. Figure 11 indicates the connection between early afternoon (19:00 UTC) NO2 columns and daytime surface O3 as well as the dependency of this connection on column HCHO NO2 ratios. HCHO NO2 values that are larger than 2 dominate the study region where the overall surface O3–NO2 column spatial correlation is high (r=0.54). Daytime surface O3 concentrations exhibit the most robust spatial correlation with early afternoon NO2 columns in 2020 (r=0.62 versus 0.47–0.56 for other years), when the domain-wide median and mean HCHO NO2 ratios are larger than in the other years by at least 0.5. These model results suggest that NOx-sensitive or transitional regimes dominated this region during 2018–2023 and point to a potential of inferring surface O3 variability across this area from high-quality remote sensing NO2 and HCHO column data.
The reduction in NOy emissions contributed to the domain-average changes in median (−0.7 ppbv) and mean (−1.0 ppbv) daytime surface O3 concentrations over land from 2018 to 2023, which are much smaller than that in 95th percentile O3 (by −3.5 ppbv). The lowering NOy emissions also resulted in less titration and, consequently, the slightly increased 5th percentile O3 (by 0.3 ppbv). Such modeled general directions of O3 temporal changes in this area over the past ∼5 years are qualitatively consistent with Cooper et al. (2012) for springs and summers of 1990–2010 as well as follow-on studies (Simon et al., 2015; Lin et al., 2017; Gaudel et al., 2018) and the US EPA's periodically updated O3 trend summary (https://www.epa.gov/air-trends/ozone-trends, last access: 12 July 2024). The model captured the COVID-induced daytime surface O3 reductions in 2020 (i.e., over land, ∼0.8 ppbv lower than in 2019 on average) that have also been reported in numerous independent studies (e.g., Keller et al., 2021; Steinbrecht et al., 2021; Putero et al., 2023). The interannual variability of imported O3 and its precursors from other regions, as well as the interconnected environmental and plant physiological conditions (e.g., via soil–vegetation–atmosphere interactions whose strengths vary in space and time), modulated biogenic VOC emissions, deposition, chemical reactions, transport, and mixing and also drove the O3 changes on regional to subregional scales.
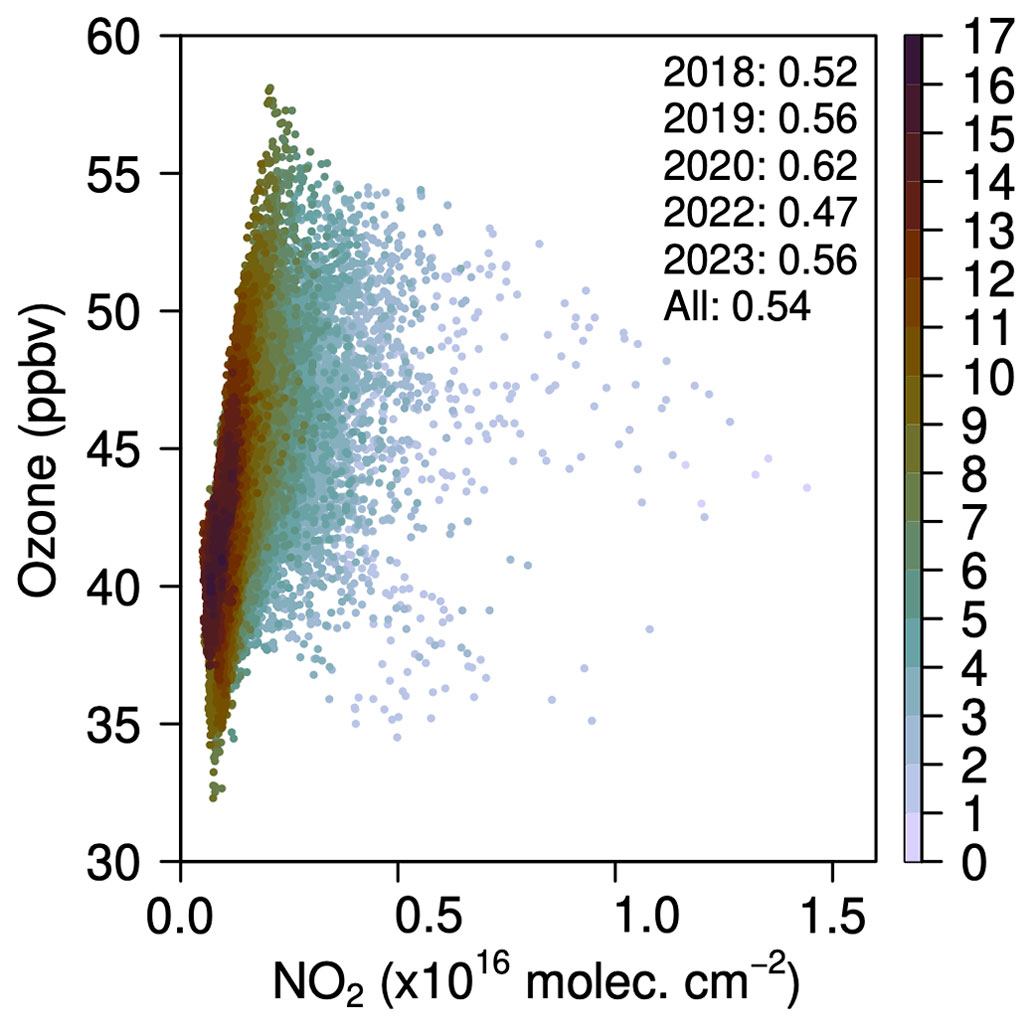
Figure 11Scatterplot indicating the relationships between WRF-Chem-modeled daytime surface O3 and the 19:00 UTC NO2 column during MJJ 2018–2023 for all terrestrial model grids, colored by column HCHO NO2 ratios. Their correlation coefficients (p≪0.01) are indicated in the corner legend by year.
The spatial patterns of WRF-Chem-modeled surface O3 broadly match the AQS observations for most of the years (Fig. 10), with root mean square errors (RMSEs) ranging from 4.0 to 6.5 ppbv, which are significantly lower than the magnitudes of tens of parts per billion by volume in many earlier modeling studies for similar regions. The better performance may have substantially benefited from the advancements in model parameterizations and the updated anth emission inputs. Although WRF-Chem surface and column NO2 temporal changes agree well with those observed, the model struggled to capture the observed deviations of surface O3 in 2023 from previous years, likely due to its failure to represent the particularly strong influences of stratospheric O3 and/or other extra-regional sources on (near-)surface O3 in 2023 (Figs. 3b and S2). Later in a case study, the dependency of WRF-Chem O3 performance on how well transboundary pollution as well as regional climatic conditions and their driving processes are represented in the model will be investigated further.
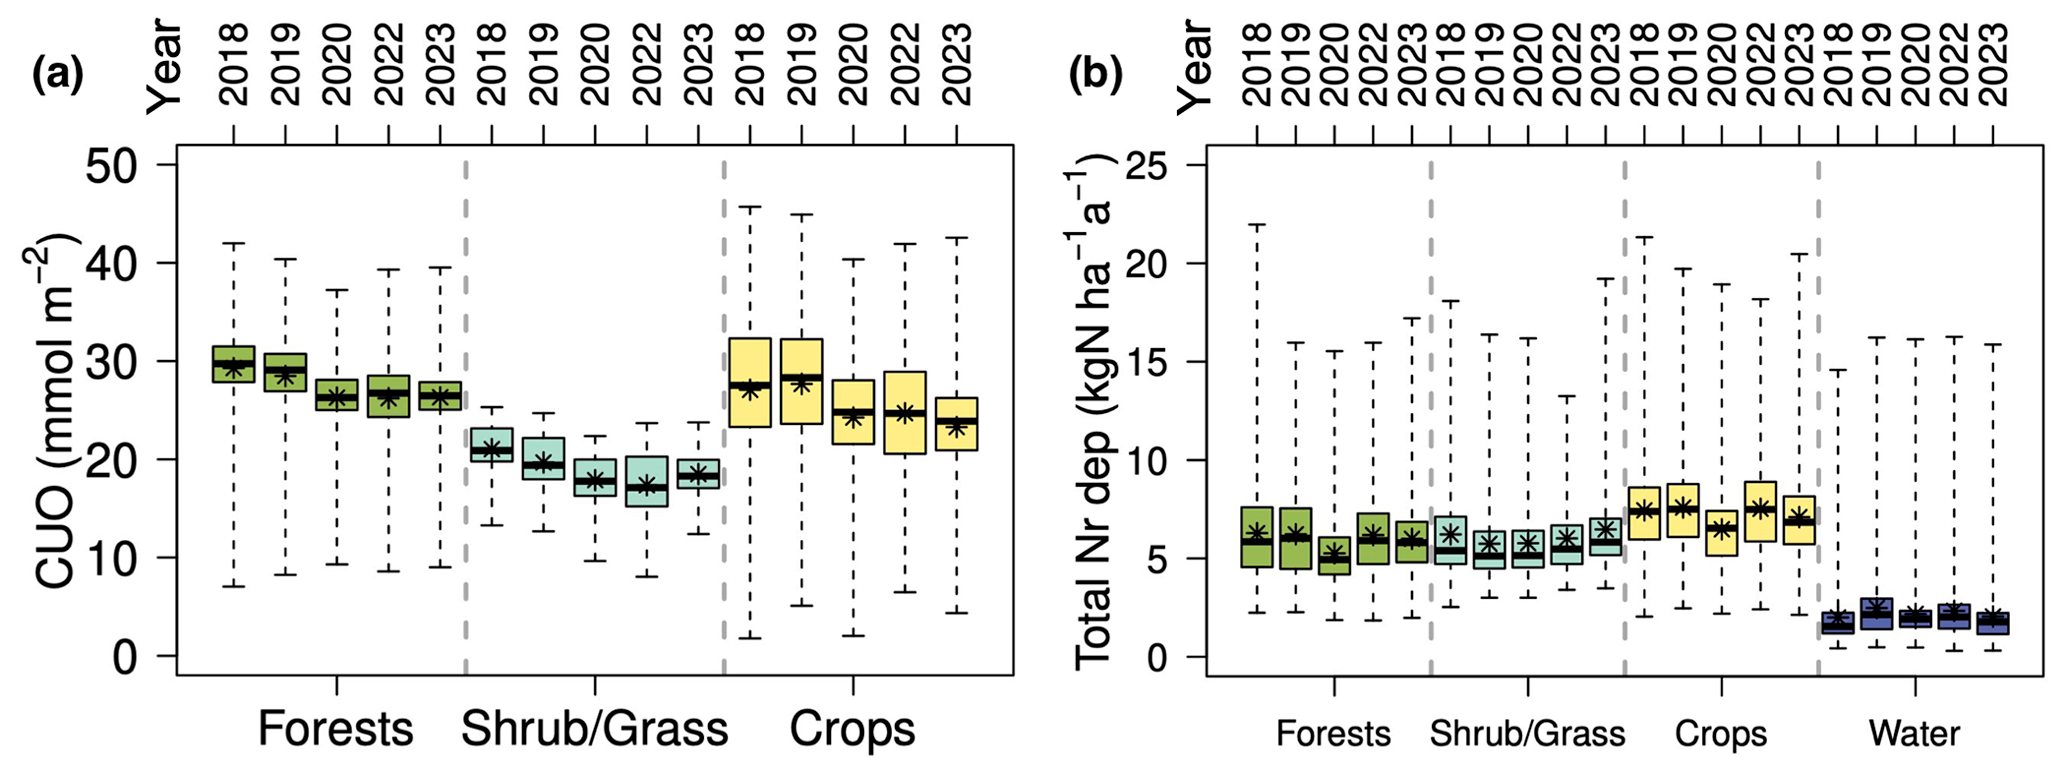
Figure 12Box-and-whisker plots of (a) CUO and (b) mean total Nr deposition fluxes for MJJ 2018–2023 by the grouped surface types defined in Fig. 1b.
Similar to dry deposition of Nr species and conclusions from Huang et al. (2022), the spatiotemporal variability of O3 dry deposition velocities is closely linked with land cover types and environmental and vegetation conditions, with their highest daytime average values ( cm s−1) seen over moist forests and >30 % lower daytime average values over croplands experiencing drier conditions (Figs. S7 and S15). Cumulative stomatal O3 uptake (CUO), a recommended metric for assessing the potential O3 vegetation impact, which is affected by stomatal conductance, boundary layer resistance, and surface O3 levels, also appears to be high over the croplands in Ohio and Indiana (∼40 mmol m−2) where surface O3 concentrations are high, while they are much lower over drier croplands in the Carolinas (<30 mmol m−2). Except for regions influenced by wetter-than-normal conditions and/or increasing surface O3 concentrations, the CUO fields show declining trends (i.e., overall dropped by ∼10 % from 2018 to 2023). Our results are qualitatively consistent with those in Clifton et al. (2020) for the northeastern US, where based on a global model, stomatal O3 uptake that accumulated through MJJ 2010 with no detoxification threshold was estimated to be ∼35 mmol m−2. Their modeled flux was projected to decrease under the Representative Concentration Pathway 8.5 future scenario, under which soil may be drier than present-day conditions over the eastern US (Cook et al., 2020). As indicated in Fig. 12a, our modeled CUO values are higher over croplands and forests than shrub/grass on average and more spatially variable. These CUO fluxes display clearer trends in most grids than the total Nr deposition fluxes due to NOy and NHx deposition fluxes having competing directions of changes through the past years (Figs. 8b–c and S15). The potential impacts of Nr deposition are strongest and weakest on croplands and water, respectively (Fig. 12b).
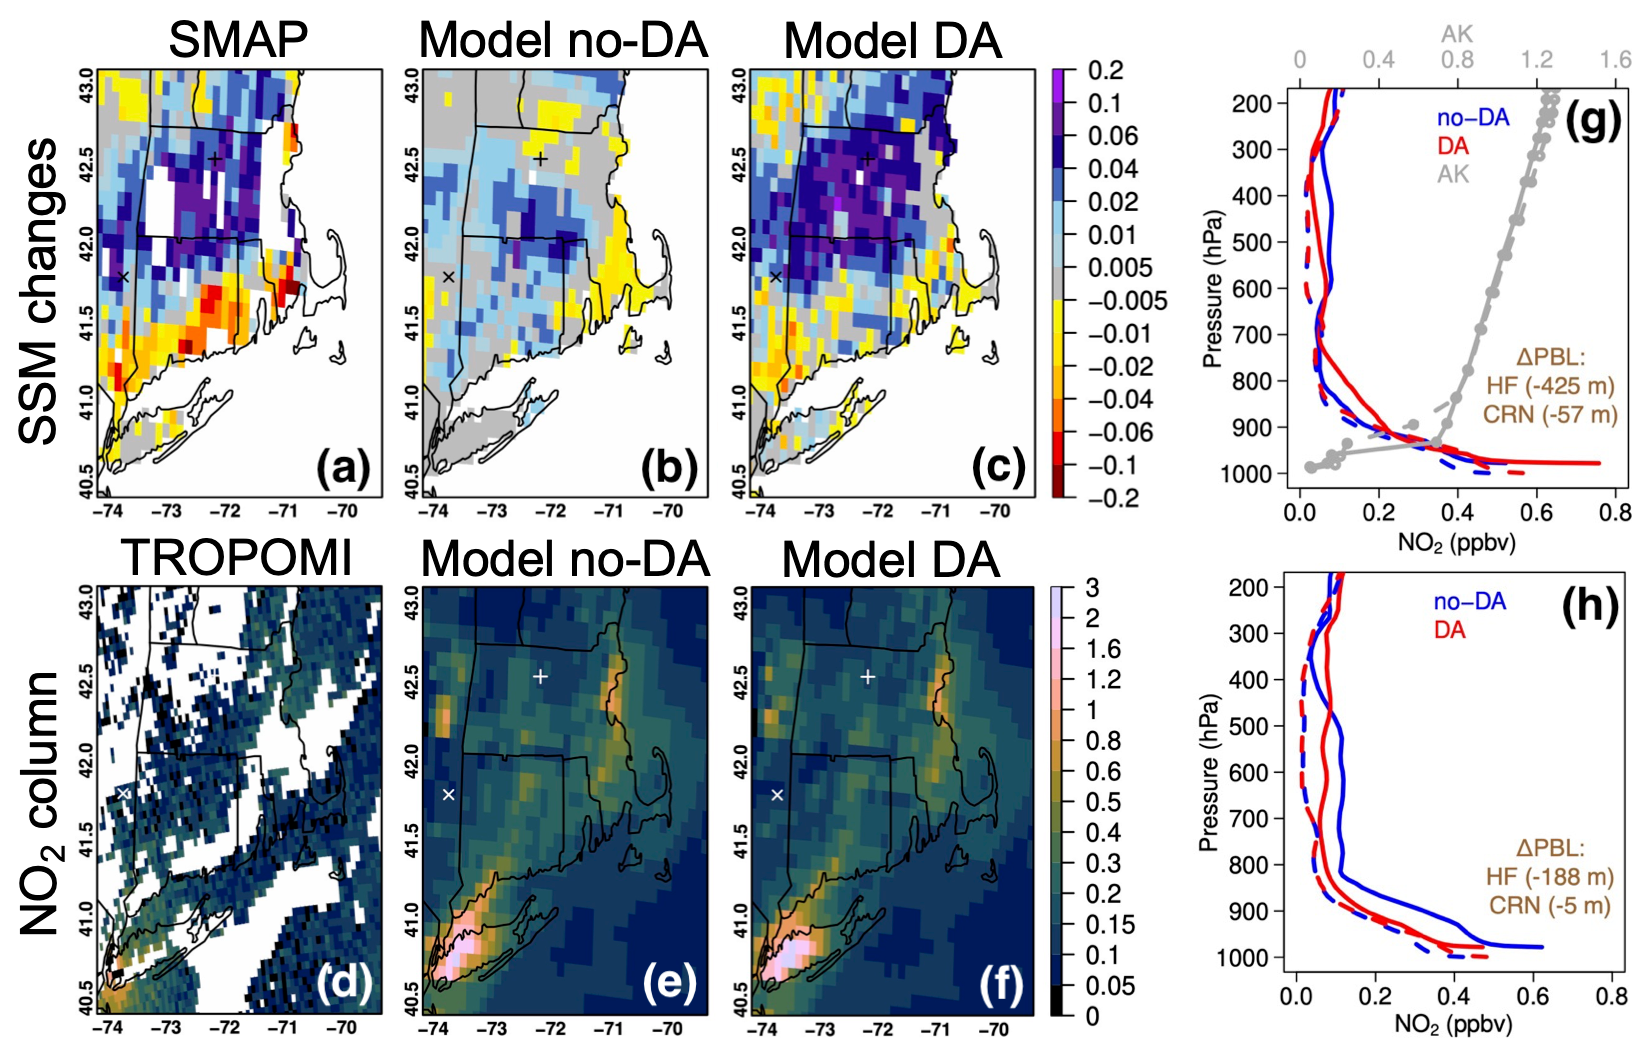
Figure 13(a–c) The 14–11 July SSM (m3 m−3) changes indicated by bias-corrected SMAP as well as free-running and SMAP-constrained Noah-MP results. (d–f) The 14 July TROPOMI NO2 columns (×1016 molec. cm−2) collected between 18:00–19:00 UTC, along with free-running and SMAP-constrained WRF-Chem results at 18:00 UTC, NO2 vertical profiles from free-running and SMAP-constrained WRF-Chem at Harvard Forest (HF, solid line) and CRN-Millbrook (dashed line) at (g) 18:00 UTC and (h) 19:00 UTC, and the impact of SMAP data assimilation (DA) on modeled boundary layer height (PBL) as well as TROPOMI averaging kernels (AKs) on TROPOMI's a priori model grid. The white + and × signs in (a)–(f) denote the locations of HF and CRN-Millbrook where in situ precipitation and SSM data are also analyzed. Ground-based SSM measurements on 11 and 14 July near SMAP overpasses are 0.170±0.059 and 0.245±0.080 m3 m−3 at HF and 0.067 and 0.086 at CRN-Millbrook, respectively. Precipitation and ground-based O3 fields on 11 and 14 July are shown in Fig. S17.
3.3 Three case studies
3.3.1 Land DA
Satellite (i.e., GPM, SMAP, and TROPOMI) and in situ observations collected at and around Harvard Forest and the CRN-Millbrook site during the SMAPVEX22 campaign were analyzed along with WRF-Chem results during a precipitating event associated with a frontal passage that occurred from late 13 to early 14 July 2022. This event caused sharp increases in SSM around 14 July in Massachusetts (by >0.06 m3 m−3) and parts of eastern New York (by ∼0.02 m3 m−3), as well as drastic changes in air temperature (up to ∼5 K decreases at the surface) and other meteorological fields. These changes in SSM and meteorological conditions contributed to abrupt O3 reductions of up to 30 ppbv. The baseline simulation without DA failed to reproduce the strong daily SSM variability at site to regional scales (Fig. 13b). After enabling the SMAP DA, Noah-MP SSM in Massachusetts and eastern New York increased remarkably on 14 July (Fig. 13c), better matching the observed quantities. Along the southern New York–Connecticut and the northern New York–Vermont borders, the slightly drier conditions on 14 July are also better represented in Noah-MP with the implementation of SMAP DA (Fig. 13a–c). The enhancements in soil wetness resulted in altered precipitation characteristics, a bit cooler surface soil and air, a thinner atmospheric boundary layer, and suppressed biogenic VOC and soil NOy emissions as well as O3 formation, while deposition accelerated. Lightning emissions were also sensitive to the DA-induced SM changes. Consequently, above many Connecticut River watershed areas, WRF-Chem NO2 columns dropped (Fig. 13e–f). Due to increased upwind pollution contributions being combined with the effects of weakened local emissions and production, both enhancements and reductions by up to ∼4 ppbv in daytime surface O3 levels (not shown in figures) are found in the New England region (40.5–43.1° N, 70.0–74.0° W). Across the New England region, WRF-Chem daytime surface O3 performance for 14 July was improved in 31 out of 50 of the model grids where AQS data were available, with the largest improvement of nearly 2 ppbv. It is also highlighted that the various processes SM can impact help shape the vertical profiles of NO2 and other chemical species, which are critical ancillary data for calculating the air mass factor that is needed to convert slant columns to vertical columns in satellite retrievals (Lorente et al., 2017) and derive averaging kernels (AKs; Eskes and Boersma, 2003). At Harvard Forest, the vertical distributions of NO2 as well as their responses to SMAP DA changed rapidly during this event (Fig. 13g–h), despite the minor change in the NO2 column. It is suggested that caution be taken when attributing the mismatches between TROPOMI and models (with AKs that indicate lower TROPOMI sensitivity towards the surface) over the scenes where NOx near the surface and aloft may both be significant. Also, productions, interpretations, and applications of satellite NO2 retrievals could benefit from evaluating and tuning their model-based a priori profiles with in situ measurements of NO2 vertical distributions under various environments.
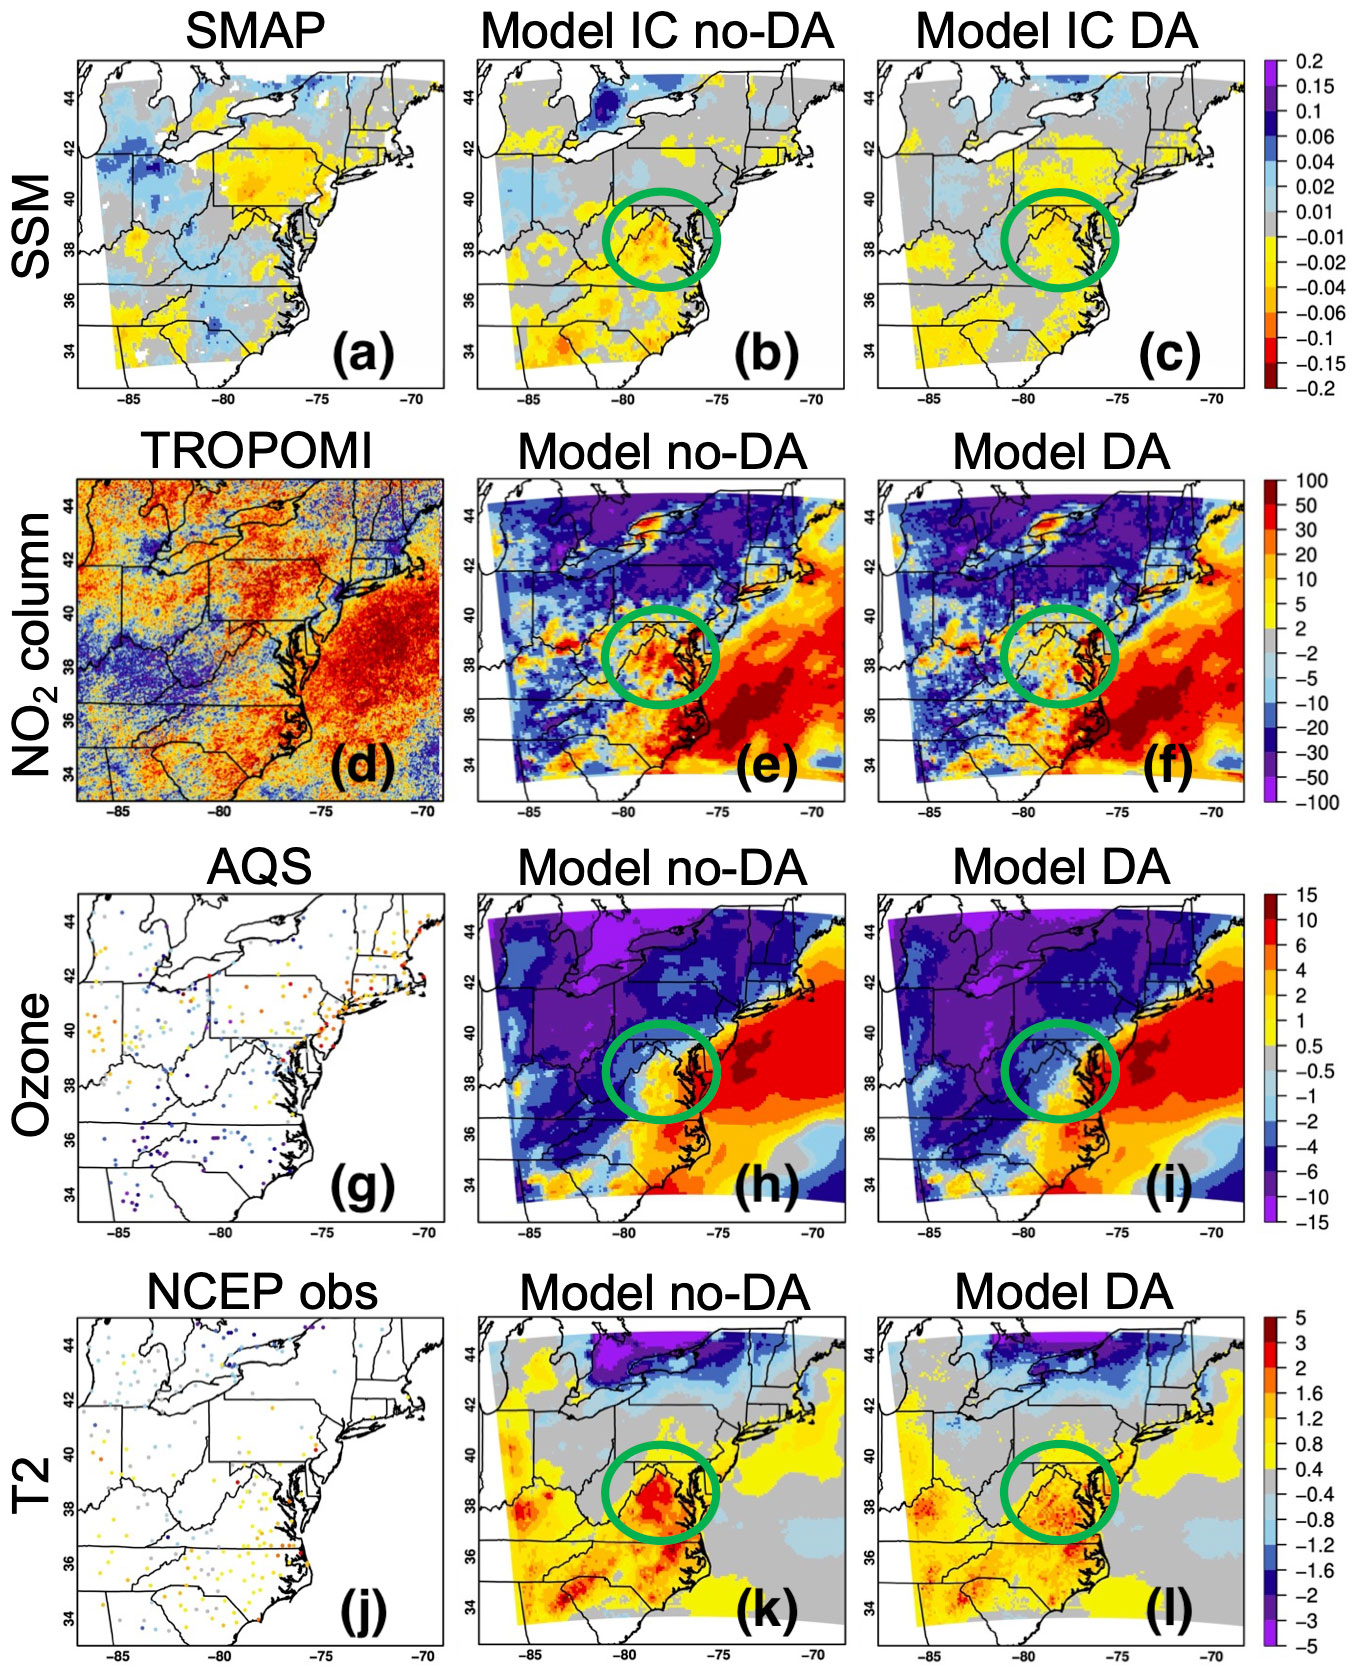
Figure 14July 2022–July 2018 monthly differences in (a–c) SSM (m3 m−3) indicated by bias-corrected SMAP, as well as free-running and SMAP-constrained WRF-Chem initial conditions (ICs). (d–f) Early afternoon NO2 columns (%) based on TROPOMI, as well as free-running and SMAP-constrained WRF-Chem results. (g–i) Daytime surface O3 concentrations (ppbv) based on AQS observations, as well as free-running and SMAP-constrained WRF-Chem results. (j–l) Daytime surface air temperature (K) based on the National Centers for Environmental Prediction (NCEP) Surface Observational Weather Data product, as well as free-running and SMAP-constrained WRF-Chem results. Green circles highlight areas in and around Virginia where improvements in WRF-Chem land ICs notably improved the weather, NO2, and O3 fields. Additional information on the SMAP data assimilation (DA) impacts is included in Fig. S18.
Figure 14a–c illustrate that, on a larger timescale, SMAP DA effectively narrowed the Noah-MP wet biases in July 2022–July 2018 SSM differences in Ontario (Canada) (croplands) as well as the dry biases in Virginia (forests) that may have resulted from inaccurate representations of meteorological drought conditions. WRF-Chem weather fields, biogenic VOC, soil NOy and lightning emissions, and deposition processes all responded to the DA-induced changes in the model's land ICs. The July 2022–July 2018 differences of WRF-Chem NO2 columns and surface O3 over these regions became closer to (by as high as ∼50 % and >4 ppbv, respectively) what TROPOMI and AQS observations indicate (Fig. 14d–i). Notably, the SMAP DA flipped the sign of surface O3 interannual differences over northern Virginia, a region for which the DA had strong impacts on the modeled surface O3 in both July 2018 and July 2022 (Fig. S18). The remaining modeled–observed NO2 and O3 discrepancies over some of the northern states and coastal North Carolina, which are highly correlated because of the dominating NOx-limited regime, can also be explained by uncertainties in the model's chemical BCs and wind fields.
These analyses demonstrate that microwave satellite SM DA can improve the modeled SM dynamics at daily to interannual timescales. Similar findings were previously reported by Draper and Reichle (2015) where SM from the X-band (sensitive to top ∼1 cm soil) Advanced Microwave Scanning Radiometer–Earth Observing System was assimilated at only four sites, but not on regional scales for forested regions where SM retrievals have been considered challenging and need validation. It is also shown in this work that the DA adjustments to LSMs' SM fields can positively impact weather and chemistry fields from their coupled atmospheric models, benefiting our interpretations and prediction skills of air pollutant distributions and temporal changes, which in turn can help advance satellite retrievals. It is important to note that SSM–atmosphere coupling strengths vary strongly in space and time, influenced by the evolution of local hydrological regimes. As 2022–2018 SSM and surface air temperature differences show strong negative correlations of −0.78 (Fig. S19), the land DA impacts on WRF-Chem's atmospheric chemistry fields were partly through adjusting the weather, as indicated in Figs. 14j–l and S18. For the times and locations that SSM and atmosphere coupling strengths are weak, land DA is anticipated to impact the modeled atmospheric chemistry fields mostly via the direct control of land surface on natural emissions and deposition.
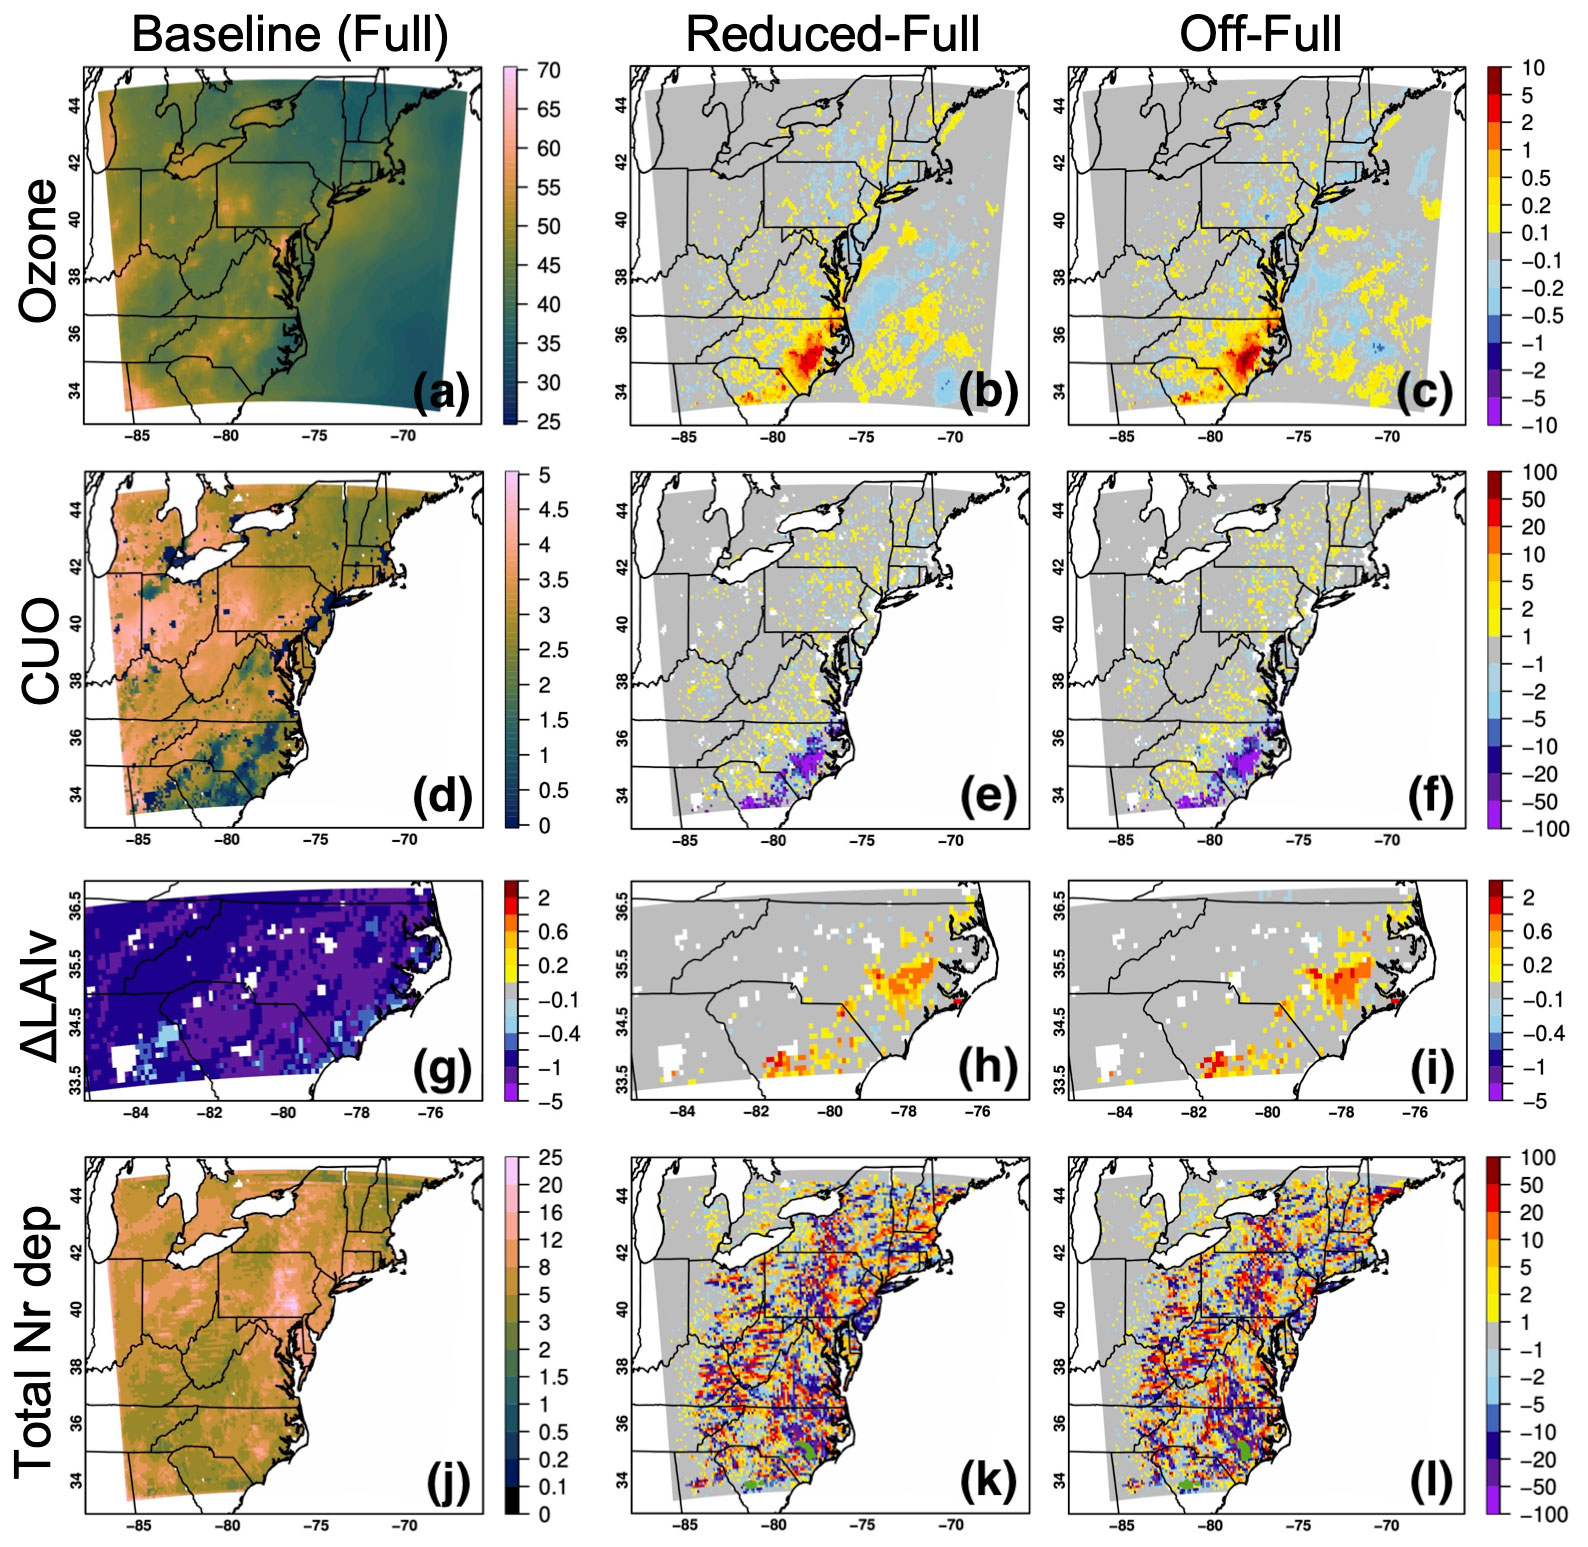
Figure 15(a) Daytime surface O3 concentration (ppbv, with the RMSE relative to AQS data of ∼5.6 ppbv). (d) Period-accumulated O3 stomatal uptake (mmol m−2). (g) O3 impacts on leaf biomass (%) over irrigated areas in and around the Carolinas. (h) Total Nr deposition over land (kgN ha−1 yr−1) from the baseline simulation during 21–30 June 2022 and (b, c, e, f, h, i, k, l) sensitivities to adjustments in irrigation schemes. Sensitivity results are in parts per billion by volume for surface O3 concentration and in percent for all other plots. Green areas in (k) and (l) mark the grids where Student's t tests comparing Nr deposition from the baseline and sensitivity simulations gave p values that are smaller than 0.05.
3.3.2 Irrigation approaches
Based on the three sets of simulations representing full-, reduced-, and no-irrigation scenarios (Sect. 2.3.2), the impacts of irrigation on surface O3 concentrations, CUO, and O3 damage to vegetation, as well as Nr deposition, were quantified (Fig. 15). Across the domain, O3 perturbs gross primary productivity more strongly (up to 20 %–30 %) than transpiration (mostly <10 %) and therefore reduces the vegetation water use efficiency. Its reductions to leaf biomass over the stressed irrigated lands in the Carolinas in late June 2022 are estimated to be <5 % under all three scenarios. Under the limited- and no-irrigation conditions, O3-induced crop yield losses were reduced over irrigated areas by up to ∼2 %, a result of lowered SM (Fig. S20) and deposition fluxes despite the enhanced soil and air temperatures, soil NOy emissions, and surface O3 concentrations (by up to ∼10 ppbv). This result supports and extends the findings from previous coarse-resolution modeling (Mills et al., 2018) and observational (Harmens et al., 2019) studies. The period-integrated O3 stomatal uptake increased slightly outside of the irrigated land due to more O3 being transported away from the irrigated areas. Over and near the irrigated areas, the estimated total Nr deposition would also be lower under reduced- and no-irrigation scenarios by more than 50 %, which would be below possible CL thresholds, as less irrigation would result in stronger atmospheric mixing and reduced SM although soil NOy emissions would increase. These impacts on Nr deposition over most of the irrigated lands are also important according to Student's t tests comparing the base and sensitivity simulations (p<0.05). The impacts of irrigation on Nr deposition over non-irrigated areas are rather noisy and more intense than on O3, where Student's t tests comparing Nr deposition from different simulations gave p values larger than 0.05. These sensitivities away from irrigated lands still highlight the complex net effects of irrigation-induced changes in land surface and meteorological conditions on a group of species with substantially different properties undergoing various atmospheric processes.
Compared with long-term offline LSM simulations forced by independently produced O3 data, evaluations of O3 vegetation impacts using coupled modeling systems like WRF-Chem with land surface feedback to regional weather and atmospheric chemistry being accounted for are more realistic. Nevertheless, such approaches are hundreds of times more computationally expensive and may be subject to uncertainty from the atmospheric model. Survey- and satellite-based irrigation types and water use information, including wastewater use that may impact plant growth, nutrient supply, and soil environments (Aman et al., 2018); direct stationary and/or airborne measurements of water, carbon, energy, air pollutant concentrations and fluxes; and plant traits within and outside of irrigated areas for variable hydroclimatic conditions, would help evaluate and improve irrigation modeling and the model-based holistic assessments of irrigation impacts on regional environments that could assist with forming pollution mitigation and ecosystem adaptation strategies for the future.
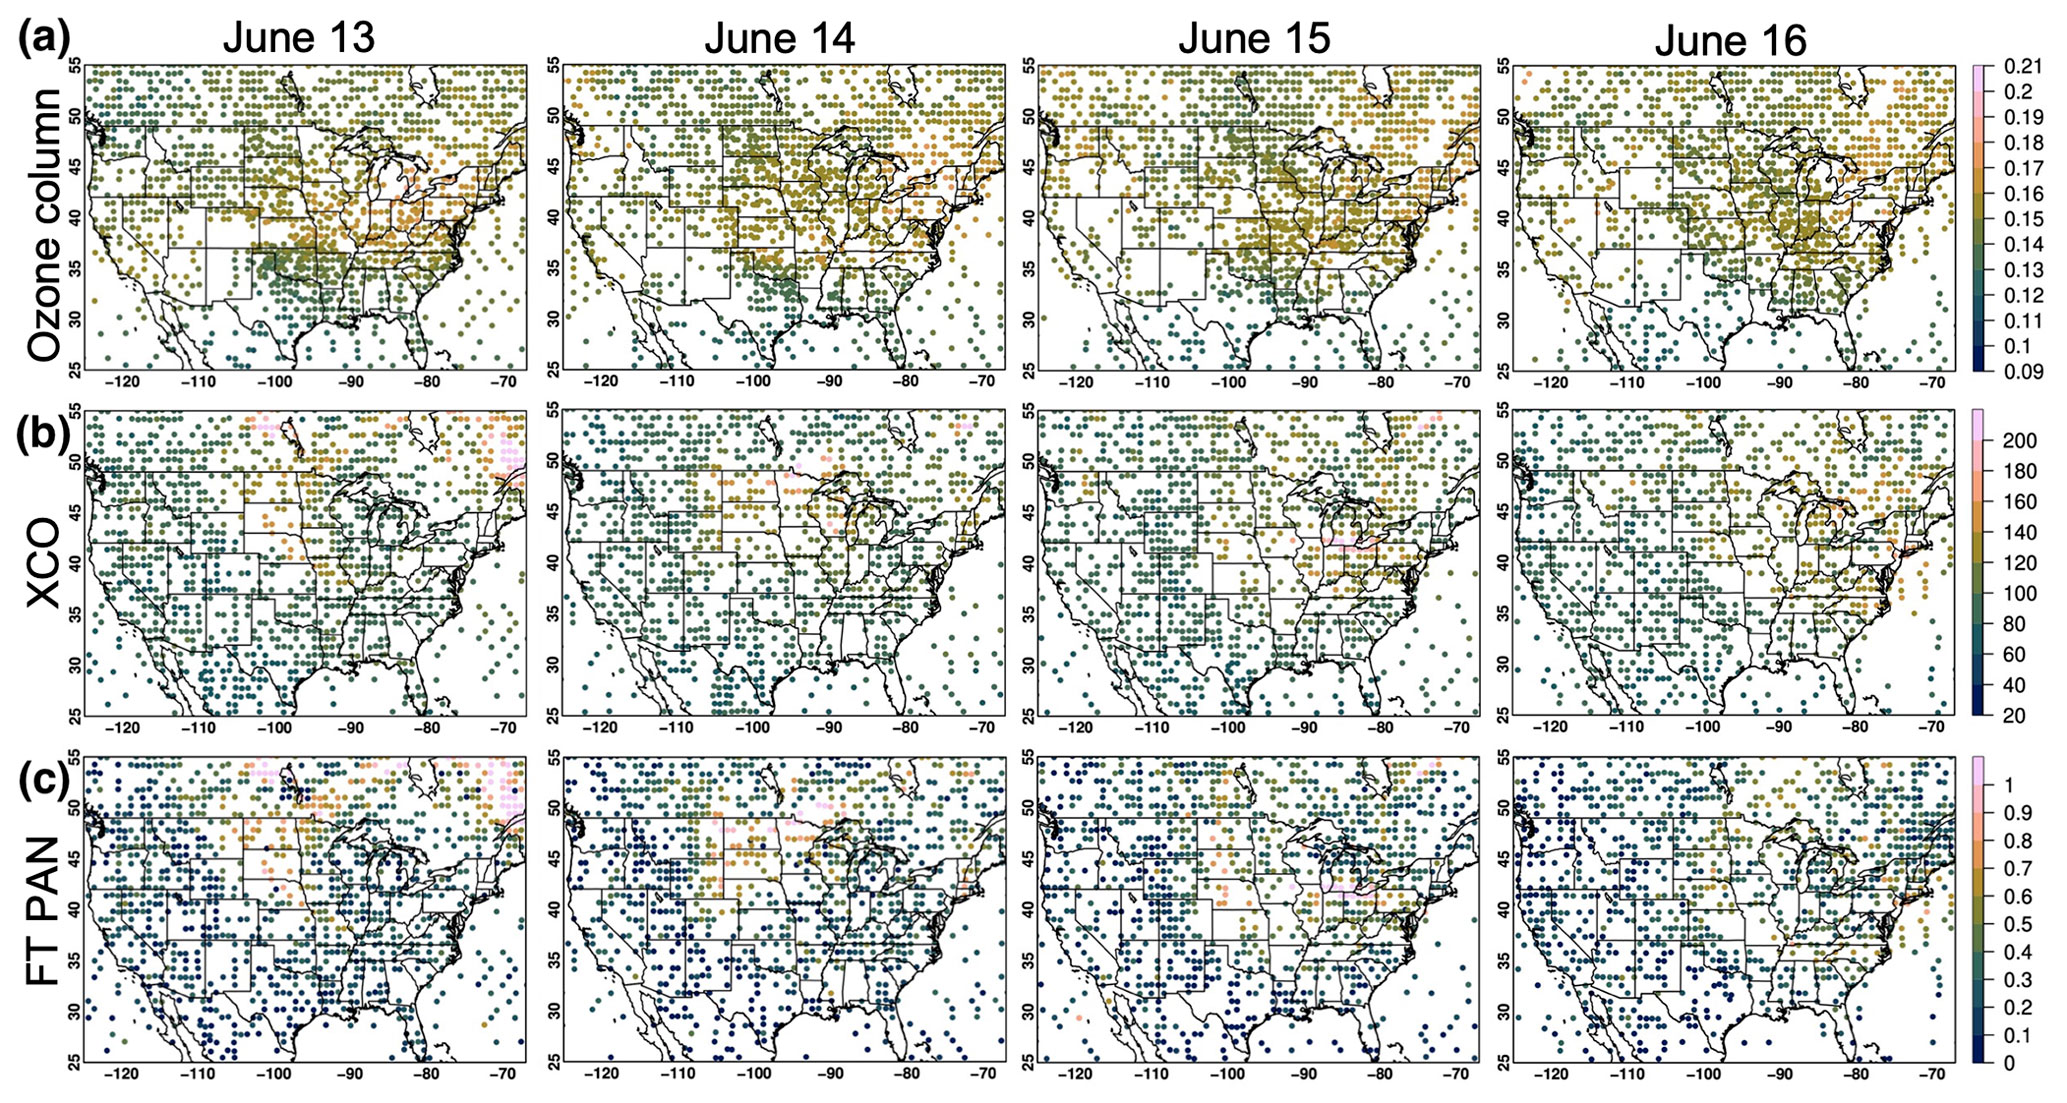
Figure 16JPSS-1/CrIS-observed (a) O3 columns (mol m−2). (b) Column-averaged CO mixing ratios (ppbv). (c) Column-averaged PAN mixing ratios (ppbv) for the free troposphere between 825 and 215 hPa during 13–16 June 2023.
3.3.3 Transboundary pollution
Periodically, distant pollution sources make strong environmental impacts on the northeast and mid-Atlantic US states. For example, during the 2023 SARP-East campaign, JPSS-1/CrIS observed high O3 and low CO on 13 June and high O3, CO, and PAN on the following days of the same week (Fig. 16) when elevated NH3 columns and aerosol optical depths were also observed from space by multiple instruments (not shown). These data suggest that long-range-transported stratospheric air and Canadian wildfire plumes reached the eastern US.
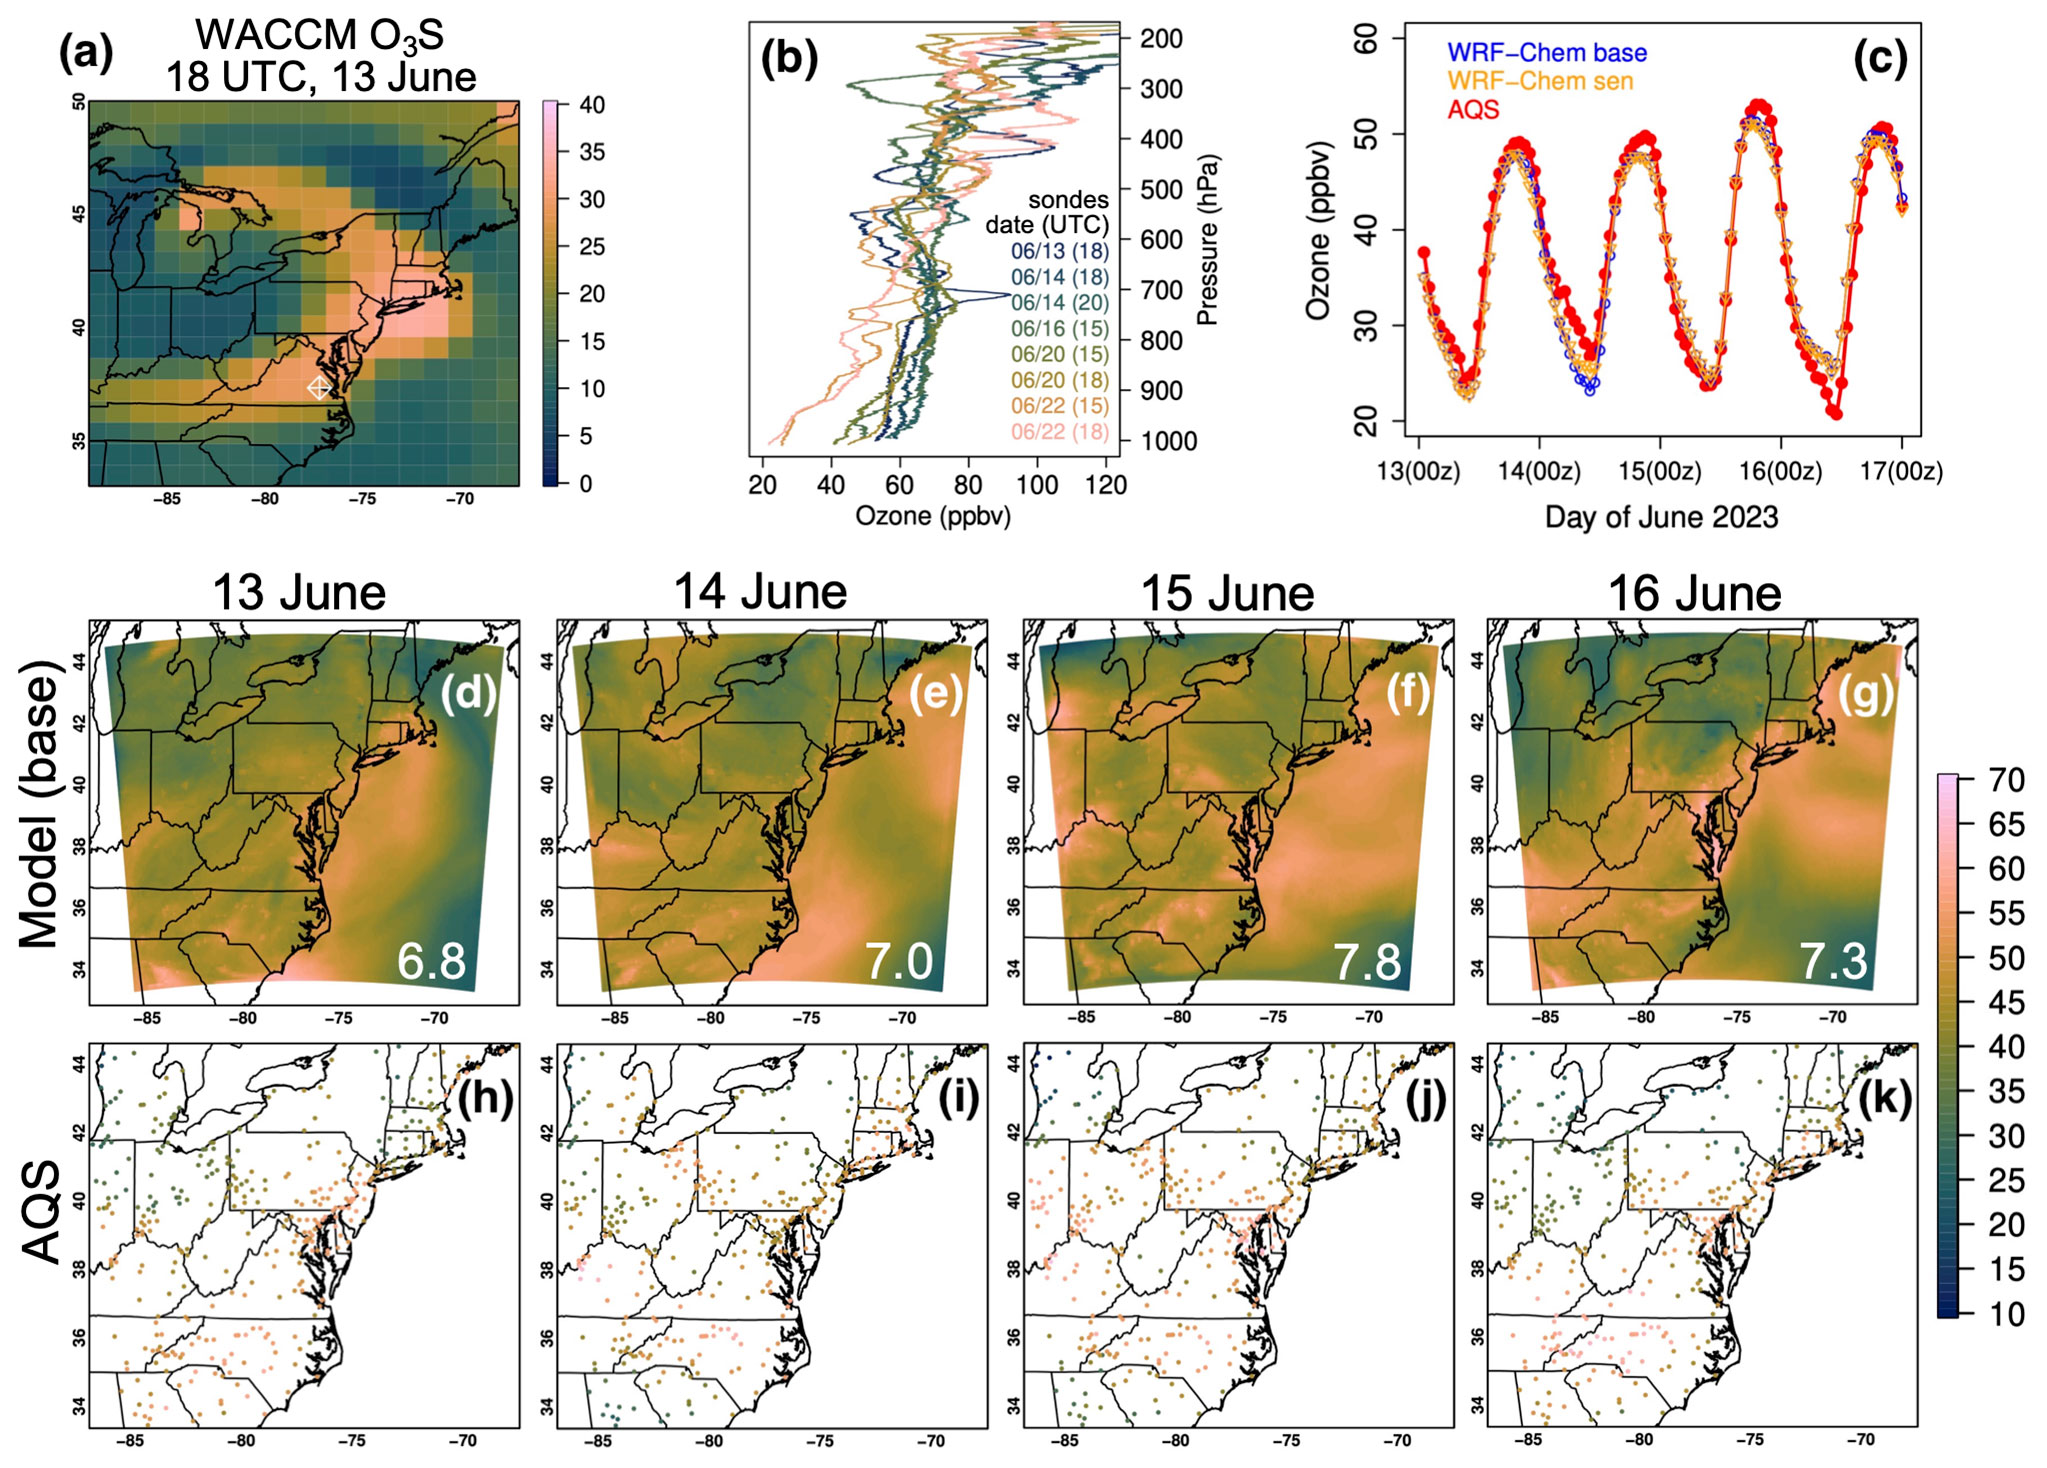
Figure 17(a) WACCM stratospheric O3 tracer (ppbv) results at ∼700 hPa at 18:00 UTC on 13 June 2023, with the location of the RRC site being indicated by a white diamond. (b) Ozonesonde profiles launched from the RRC. (c) Time series of the domain mean observed and WRF-Chem-modeled hourly surface O3 during 13–16 June 2023 at AQS sites, as well as daytime surface O3 concentrations (ppbv) on 13–16 June 2023 from (d–g) the WRF-Chem baseline simulation and (h–k) AQS sites. WRF-Chem vs. AQS RMSEs (ppbv) are indicated in the lower-right corners of (d)–(g).
As indicated by the stratospheric O3 tracer of the chemical BC model WACCM, the 13 June stratospheric intrusion event associated with a frontal passage enhanced lower-tropospheric O3 by as much as 30–40 ppbv along the northeast corridor, which helps explain the spike at ∼700 hPa (>30 ppbv O3 enhancement) in the SARP-East RRC ozonesonde profile for that day (Fig. 17a–b). The WACCM-estimated stratospheric impact on surface O3 in our WRF-Chem domain is only half to one-third of its impact on free-tropospheric O3 (Fig. S21), consistent with prior knowledge that stratospheric impacts on the US east are often confined at higher altitudes while surface O3 remains low (Ott et al., 2016). Thick Canadian wildfire plumes that moved into the study region dramatically enhanced O3, spanning a wide altitude range (i.e., from >900 to ∼600 hPa) above the RRC site on several days of that week (Fig. 17b). Under the strong influences of Canadian fires, O3 in the US outflows during that week was close to that in the air sampled approximately 2 decades ago along the east coast (Cooper et al., 2005). Ozonesondes also indicate that air quality improved remarkably in the following week, with O3 from the surface to ∼700 hPa nearly 40 ppbv lower (Fig. 17b).
The WRF-Chem baseline and Sen sensitivity simulations were evaluated with O3 observations during 13–16 June 2023. Overall, the baseline and Sen simulations reproduced the daytime surface O3 patterns and diurnal cycles observed at AQS sites moderately well during the events, with RMSEs of ∼7 ppbv (Figs. 17c–k and S21). The negative mean biases of 1–2 ppbv in the modeled daytime peak O3 (Fig. 17c) can be explained by the model's incapability to accurately represent the stratospheric O3 influences. The choice of WACCM's fire emission input had minor impacts on WRF-Chem daytime surface O3 averaged across the domain throughout the episode but enhanced or reduced WRF-Chem's daily daytime surface O3 by up to ∼10 ppbv on the grid scale (Figs. S21–S22).
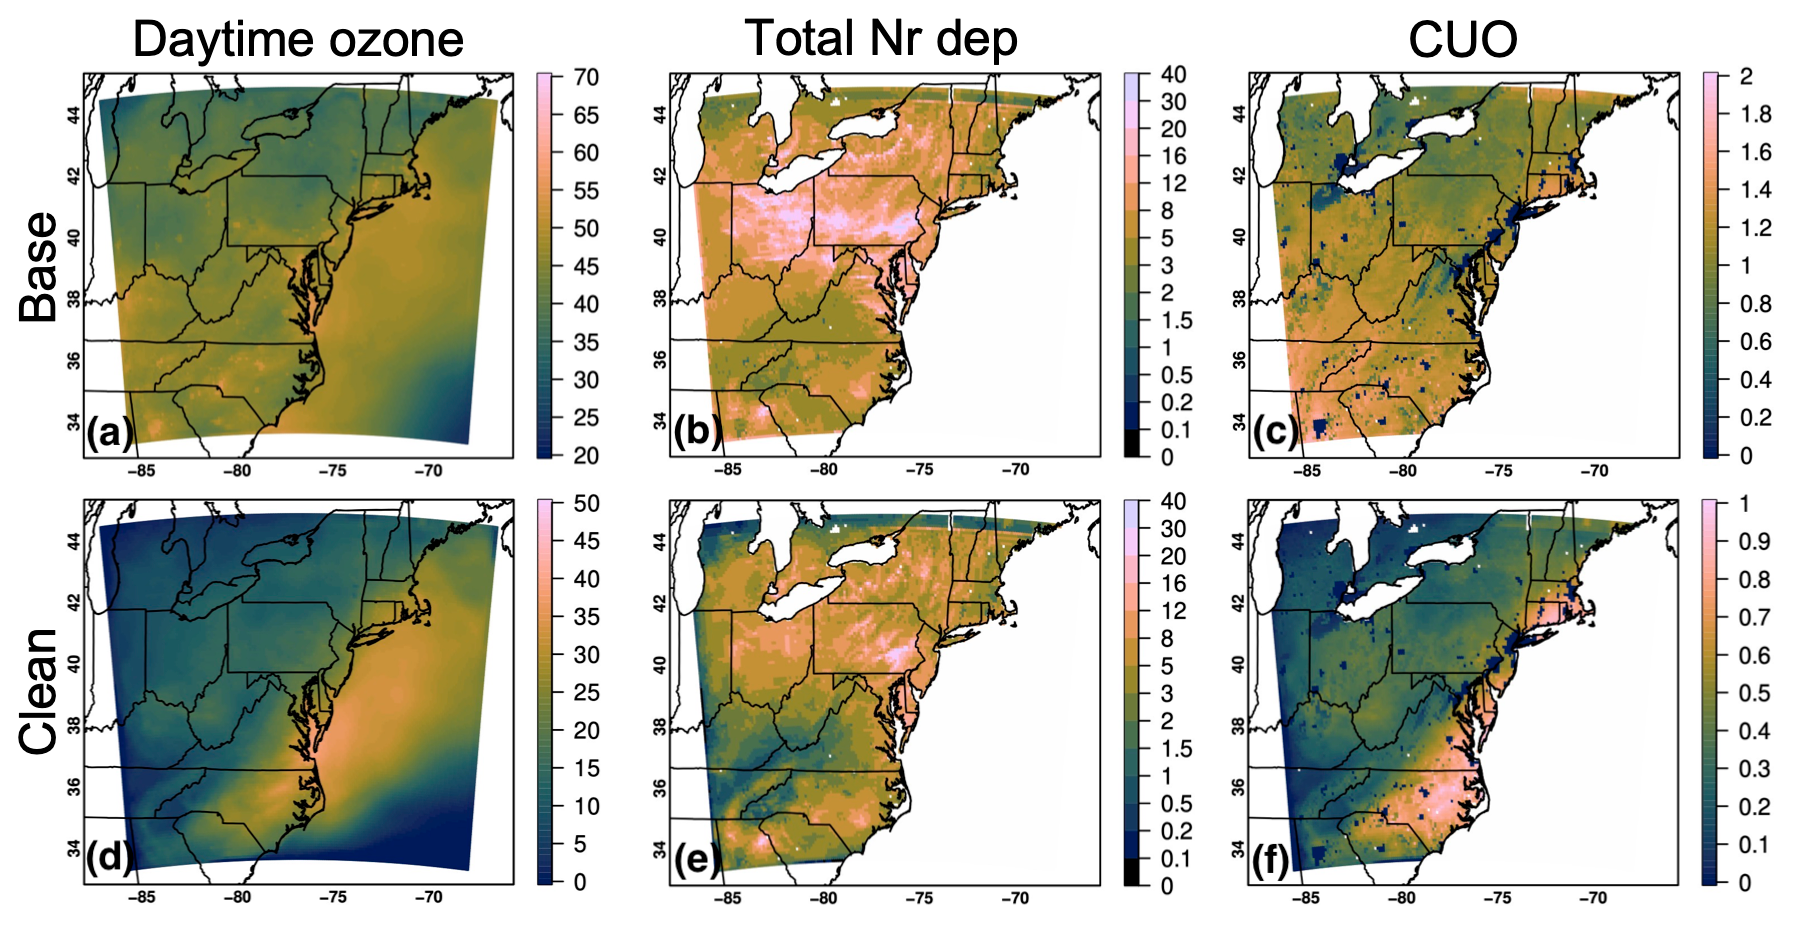
Figure 18(a, d) Daytime surface O3 concentrations (ppbv). (b, e) Total Nr deposition over land (kgN ha−1 yr−1). (c, f) Period-accumulated O3 stomatal uptake (mmol m−2) during 13–16 June 2023 from the (a–c) baseline simulation and (d–f) sensitivity simulation with clean chemical BCs.
The extremely high quantity of transported background aerosols and their precursors due to Canadian wildfires, along with upwind US pollution, interacted with meteorological and land surface fields (e.g., radiation, temperature, clouds, precipitation, and surface wetness) that are relevant to evapotranspiration and photosynthesis (see also discussions on Asian anth pollution impacts in Huang et al., 2020, and references therein), dry deposition velocity and the wet deposition coefficient, and secondary pollutant formation. The baseline and “Clean BC” cases together indicate that, although under highly polluted conditions, dry deposition velocities are overall reduced (Fig. S23) and photochemistry activities are weakened, and the period-integrated CUO and mean total Nr deposition fluxes are enhanced as the excessive amount of imported pollution significantly elevated surface O3 and Nr concentrations (Fig. 18). During this period, daily O3 stomatal uptake and the mean total Nr deposition over land are ∼2 % and ∼26 % higher than their 2023 seasonal mean values, respectively. Comparisons of baseline and Sen simulation results show that the modeled grid-scale O3 stomatal uptake and total Nr deposition are sensitive to the choice of WACCM fire emission input (Fig. S22). This set of sensitivity analyses not only supports the findings about fire emission impacts on deposition from offline air quality modeling studies (e.g., Koplitz et al., 2021), but also stresses the importance of accounting for aerosol radiative effects in assessing the ecosystem impacts of pollutants from biomass burning and other sources, which will be investigated further on multiple spatiotemporal scales in a Hemispheric Transport of Air Pollution phase 3 multimodel experiment (Whaley et al., 2024).
Previous work has focused strongly on the impacts of the long-range transport of pollution from Asia and the stratosphere, as well as regional pollution transport, on the western US O3 trends (e.g., Cooper et al., 2012; Huang et al., 2013; Lin et al., 2017; Miyazaki et al., 2022). This case study demonstrates that extra-regional pollution can also compromise efforts to improve air quality by controlling local and regional emissions over the eastern US. Possibly linked to climate change, such highly polluted events occurred more frequently during the 2023 warm season. For example, driven by hot and dry conditions, the Canadian 2023 wildfire season had the largest area burned in history (https://cwfis.cfs.nrcan.gc.ca/ha/nfdb, last access: 23 July 2024). Due to Canadian wildfire impacts, there were at least two other known extreme air pollution events over the eastern US in June 2023 and more in the other months of the season (Fig. S24). Such events exerted controls on surface–atmosphere exchange processes and perturb the long-term changes in O3, Nr, and other chemical compounds. More accurate and consistently configured chemical BC models or reanalysis products, preferably at higher resolutions with a more complete list of prognostic and diagnostic variables, are essential for further regional-scale modeling investigations of such events and their contributions to trends and variability. The addition of stratospheric tracers and accurate, time-varying upper chemical boundary conditions to regional models, assisted with O3 profile measurements from commercial aircraft, sondes, and lidar networks, is expected to also be helpful for diagnosing and/or reducing errors in the simulations of some of such events.
Based on WRF-Chem model simulations and multiplatform observations, this paper discussed Nr and O3 concentrations and fluxes during 2018–2023 in the northeastern and mid-Atlantic US, most of which fell into NOx-limited and transitional chemical regimes. Effective local emission controls resulted in evident decreases in NO2 and surface O3 concentrations, with reduced human activities during the COVID lockdowns also contributing to their low values and the overall stronger surface O3–NO2 column correlations in 2020. Current polar-orbiting satellites take snapshots of NO2 columns only at a particular time of day, such as in the early afternoon when surface NO2 experiences daily lows. With this sparse temporal sampling, TROPOMI did not miss the general NO2 interannual and seasonal variability and filled in the extremely large horizontal gaps between surface AQS observations, most of which are in and near urban regions and positively biased. The WRF-Chem simulation described here has been extended into 2024, running on a routine basis, to support refined analyses concerning the subdaily variability of NO2 and other variables along with data from geostationary satellite missions such as the TEMPO.
The declines in NOy emissions and concentrations were roughly consistent with the temporal changes in NOy deposition, which were balanced out by the overall rising agricultural and total NHx emissions and deposition. The changes in NOy and NHx deposition together shaped the interannual variability in Nr deposition, in contrast to the clearer downward trends in O3 vegetation uptake that reduced plant water use efficiency and caused biomass and crop yield losses of a few percent. Certain hotspots of Nr deposition in North Carolina may have continued to exceed the CL thresholds for herbaceous plants and trees in the literature, while the productivity of northern forests may have remained nitrogen-limited. Referring to the conservative lichen CL thresholds in the literature, widespread lichen CL exceedances likely occurred persistently. Integrating nitrogen dynamics into LSMs could help improve their performance for land surface states as well as carbon, water, and energy fluxes and, further, the representations of Nr and O3 deposition processes and their interactions in coupled modeling systems. Standard versions of Noah-MP, including what was used in this work, represent nitrogen stress by applying constant foliage nitrogen factors (<1) in maximum carboxylation rate calculations (Niu et al., 2011). Following the Joint UK Land Environment Simulator and the Community Land Model, Cai et al. (2016) started to add nitrogen dynamics to Noah-MP. Running offline, their updated model yielded more accurate net primary productivity and evapotranspiration, and that may also be embedded into Earth system models in future, with the magnitudes and spatiotemporal variability of its Nr inputs (e.g., from deposition and fertilizer applications) being improved with the aid of atmospheric chemistry model routines and/or observations. Other areas for improvements include assimilating additional Earth observations (e.g., root zone SM and terrestrial water storage); developing and applying high-quality, spatially and temporally varying CO2 forcings for Noah-MP; and tuning parameters that represent O3 vegetation impacts for various types of plants at different growth stages.
With updated model parameterizations and anth emissions, the WRF-Chem system used performed stably and remarkably better for the eastern US surface O3 than many systems in the literature. This paper highlights that temporal variabilities of Nr and O3 concentrations and fluxes on subregional to local scales were partially driven by hydrological variability that can be influenced by precipitation and controllable human activities such as irrigation. Like deposition processes, biogenic soil Nr and VOC emissions that are highly sensitive to various climatic factors and plant physiological conditions, as well as extra-regional sources (e.g., dense wildfire plumes from the western US and Canada, and O3-rich stratospheric air), have been playing increasingly important roles in controlling pollutant budgets in this area as local emissions go down. These outcomes based on this particular WRF-Chem system have implications for updating other modeling systems.
It is worth noting that urban emissions and air pollutants can be transported to and deposited into rural and remote regions, which may better be modeled at finer resolutions (e.g., urban scale at 1–4 km or street to building scales) with urban landscapes and human influences on urban vegetation and soil properties being more carefully handled. Finer model resolutions may also allow more processes, such as convection, to be explicitly resolved, potentially leading to more accurate precipitation and deposition results. Successful finer-resolution simulations would require accurate inputs and observational constraints at similar resolutions. To better inform the designs of mitigation and adaptation strategies, it is highly recommended to continue evaluating and improving the parameterizations and inputs relevant to various sources and processes in seamlessly coupled multiscale Earth system models using laboratory and field experiments in combination with satellite DA. Further improved Earth system model results are expected to in turn benefit remote sensing communities, for example, by serving as the retrieval a priori profiles for different types of environments.
The NASA-Unified Weather Research and Forecasting model (https://nuwrf.gsfc.nasa.gov/software, NASA, 2019) output of O3 and other key variables can be found in Huang (2025) (https://doi.org/10.5281/zenodo.14703647). Remote sensing and in situ datasets can be downloaded from https://doi.org/10.5067/4DQ54OUIJ9DL (O'Neill et al., 2021), https://doi.org/10.5067/GPM/IMERGDF/DAY/07 (Huffman et al., 2023), https://doi.org/10.5067/MHH8R0UZ5BMJ (Bowman, 2022a), https://doi.org/10.5067/JL1HT3NGEAW3 (Bowman, 2022b), https://doi.org/10.5067/6HTQB4F81S08 (Bowman, 2022c), https://www-air.larc.nasa.gov/cgi-bin/ArcView/listos (Janz, 2020), https://doi.org/10.5065/4F4P-E398 (NCEP, 2004), and https://aqs.epa.gov/aqsweb/airdata/download_files.html (US EPA, 2024). Gridded TROPOMI data are available in the TOAR-II Tropospheric Ozone Precursors Focus Group repository (https://usf.app.box.com/s/lskz9z3cuxqgv0ckaxxxi8attcuckxxd/folder/157070671575, De Smedt, 2023).
The supplement related to this article is available online at: https://doi.org/10.5194/acp-25-1449-2025-supplement.
Overall study design and paper writing: MH leading, with all participating in review and editing. Design, execution, or discussions of model simulations: MH, GRC, SVK, ABG. Satellite data production, validation, delivery, and analysis: KWB, IDS, AC, MHC, MH. Field campaign deployments and data analysis: AC, MHC, SJJ, RMS, AMT, NMF, RJS, JDB, ATJ, MH.
The contact author has declared that none of the authors has any competing interests.
Publisher’s note: Copernicus Publications remains neutral with regard to jurisdictional claims made in the text, published maps, institutional affiliations, or any other geographical representation in this paper. While Copernicus Publications makes every effort to include appropriate place names, the final responsibility lies with the authors.
This article is part of the special issue “Tropospheric Ozone Assessment Report Phase II (TOAR-II) Community Special Issue (ACP/AMT/BG/GMD inter-journal SI)”. It is a result of the Tropospheric Ozone Assessment Report, Phase II (TOAR-II, 2020–2024).
A contribution was made to this work at the Jet Propulsion Laboratory, California Institute of Technology, under a contract with NASA. We acknowledge the excellent leadership of the TOAR-II Tropospheric Ozone Precursors and Deposition Focus Group leads. We thank Antonin Soulie and team for helping with the CAMS global anth emissions and Kyle DeLong for participating in collecting SM data in Harvard Forest during SMAPVEX22 that are used in this study. Color palettes in Crameri et al. (2020) are used in this paper.
This research has been partially supported by the following programs of the National Aeronautics and Space Administration: SMAP, SMAPVEX, and LDAS.
This paper was edited by Suvarna Fadnavis and reviewed by three anonymous referees.
Aman, M. S., Jafari, M., Reihan, M. K., Motesharezadeh, B., and Zare, S.: Assessing the Effect of Industrial Wastewater on Soil Properties and Physiological and Nutritional Responses of Robinia Pseudoacacia, Cercis Siliquastrum and Caesalpinia Gilliesii Seedlings, J. Environ. Manag., 217, 718–726, https://doi.org/10.1016/j.jenvman.2018.03.087, 2018.
Bowman, K. W.: TROPESS CrIS-JPSS1 L2 Ozone for Forward Stream Summary Product, Version 1, Greenbelt, MD, USA, Goddard Earth Sciences Data and Information Services Center (GES DISC) [data set], Greenbelt, Maryland, USA, https://doi.org/10.5067/MHH8R0UZ5BMJ, 2022a.
Bowman, K. W.: TROPESS CrIS-JPSS1 L2 Carbon Monoxide for Forward Stream Summary Product, Version 1, Greenbelt, MD, USA, Goddard Earth Sciences Data and Information Services Center (GES DISC) [data set], Greenbelt, Maryland, USA, https://doi.org/10.5067/JL1HT3NGEAW3, 2022b.
Bowman, K. W.: TROPESS CrIS-JPSS1 L2 Peroxyacetyl Nitrate for Forward Stream Summary Product, Version 1, Greenbelt, MD, USA, Goddard Earth Sciences Data and Information Services Center (GES DISC) [data set], Greenbelt, Maryland, USA, https://doi.org/10.5067/6HTQB4F81S08, 2022c.
Cai, X., Yang, Z.-L., Fisher, J. B., Zhang, X., Barlage, M., and Chen, F.: Integration of nitrogen dynamics into the Noah-MP land surface model v1.1 for climate and environmental predictions, Geosci. Model Dev., 9, 1–15, https://doi.org/10.5194/gmd-9-1-2016, 2016.
Carlton, A. G., Pinder, R. W., Bhave, P. V., and Pouliot, G. A.: To What Extent Can Biogenic SOA be Controlled? Environ. Sci. Technol., 44, 3376–3380, https://doi.org/10.1021/es903506b, 2010.
Chai, T., Carmichael, G. R., Tang, Y., Sandu, A., Hardesty, M., Pilewskie, P., Whitlow, S., Browell, E. V., Avery, M. A., Nédélec, P., Merrill, J. T., Thompson, A. M., and Williams, E.: Four-dimensional data assimilation experiments with International Consortium for Atmospheric Research on Transport and Transformation ozone measurements, J. Geophys. Res., 112, D12S15, https://doi.org/10.1029/2006JD007763, 2007.
Chai, T., Kim, H.-C., Lee, P., Tong, D., Pan, L., Tang, Y., Huang, J., McQueen, J., Tsidulko, M., and Stajner, I.: Evaluation of the United States National Air Quality Forecast Capability experimental real-time predictions in 2010 using Air Quality System ozone and NO2 measurements, Geosci. Model Dev., 6, 1831–1850, https://doi.org/10.5194/gmd-6-1831-2013, 2013.
Clifton, O. E., Lombardozzi, D. L., Fiore, A. M., Paulot, F., and Horowitz, L. W.: Stomatal conductance influences interannual variability and long-term changes in regional cumulative plant uptake of ozone, Environ. Res. Lett., 15, 114059, https://doi.org/10.1088/1748-9326/abc3f1, 2020.
Colarco, P. R., Schoeberl, M. R., Doddridge, B. G., Marufu, L. T., Torres, O., and Welton, E. J.: Transport of smoke from Canadian forest fires to the surface near Washington, D.C.: Injection height, entrainment, and optical properties, J. Geophys. Res., 109, D06203, https://doi.org/10.1029/2003JD004248, 2004.
Cook, B. I., Mankin, J. S., Marvel, K., Williams, A. P., Smerdon, J. E., and Anchukaitis, K. J.: Twenty-first century drought projections in the CMIP6 forcing scenarios, Earth's Future, 8, e2019EF001461, https://doi.org/10.1029/2019EF001461, 2020.
Cooper, O. R., Stohl, A., Eckhardt, S., Parrish, D. D., Oltmans, S. J., Johnson, B. J., Nédélec, P., Schmidlin, F. J., Newchurch, M. J., Kondo, Y., and Kita, K.: A springtime comparison of tropospheric ozone and transport pathways on the east and west coasts of the United States, J. Geophys. Res., 110, D05S90, https://doi.org/10.1029/2004JD005183, 2005.
Cooper, O. R., Gao, R.-S., Tarasick, D., Leblanc, T., and Sweeney, C.: Long-term ozone trends at rural ozone monitoring sites across the United States, 1990–2010, J. Geophys. Res., 117, D22307, https://doi.org/10.1029/2012JD018261, 2012.
Crameri, F., Shephard, G. E., and Heron, P. J.: The misuse of colour in science communication, Nat. Commun., 11, 5444, https://doi.org/10.1038/s41467-020-19160-7, 2020.
Darmenov, A. and da Silva, A.: The Quick Fire Emissions Dataset (QFED): Documentation of versions 2.1, 2.2 and 2.4, NASA Technical Report Series, Global Modeling and Data Assimilation, NASA TM-2015-104606/Volume 38, http://gmao.gsfc.nasa.gov/pubs/docs/Darmenov796.pdf (last access: 12 January 2023), 2015.
De Smedt, I.: Gridded TROPOMI data at TOAR-II Tropospheric Ozone Precursors Focus Group repository, University of South Florida Box, St. Petersburg, Florida, USA, https://usf.app.box.com/s/lskz9z3cuxqgv0ckaxxxi8attcuckxxd/folder/157070671575 (last access: 12 January 2024), 2023.
De Smedt, I., Pinardi, G., Vigouroux, C., Compernolle, S., Bais, A., Benavent, N., Boersma, F., Chan, K.-L., Donner, S., Eichmann, K.-U., Hedelt, P., Hendrick, F., Irie, H., Kumar, V., Lambert, J.-C., Langerock, B., Lerot, C., Liu, C., Loyola, D., Piters, A., Richter, A., Rivera Cárdenas, C., Romahn, F., Ryan, R. G., Sinha, V., Theys, N., Vlietinck, J., Wagner, T., Wang, T., Yu, H., and Van Roozendael, M.: Comparative assessment of TROPOMI and OMI formaldehyde observations and validation against MAX-DOAS network column measurements, Atmos. Chem. Phys., 21, 12561–12593, https://doi.org/10.5194/acp-21-12561-2021, 2021.
Dentener, F., Drevet, J., Lamarque, J. F., Bey, I., Eickhout, B., Fiore, A. M., Hauglustaine, D., Horowitz, L. W., Krol, M., Kulshrestha, U. C., Lawrence, M., Galy-Lacaux, C., Rast, S., Shindell, D., Stevenson, D., Van Noije, T., Atherton, C., Bell, N., Bergman, D., Butler, T., Cofala, J., Collins, B., Doherty, R., Ellingsen, K., Galloway, J., Gauss, M., Montanaro, V., Müller, J. F., Pitari, G., Rodriguez, J., Sanderson, M., Solmon, F., Strahan, S., Schultz, M., Sudo, K., Szopa, S., and Wild, O.: Nitrogen and sulfur deposition on regional and global scales: A multimodel evaluation, Global Biogeochem. Cy., 20, GB4003, https://doi.org/10.1029/2005GB002672, 2006.
Delaria, E. R. and Cohen, R. C.: Measurements of Atmosphere–Biosphere Exchange of Oxidized Nitrogen and Implications for the Chemistry of Atmospheric NOx, Acc. Chem. Res., 56, 1720–1730, https://doi.org/10.1021/acs.accounts.3c00090, 2023.
Dix, B., Francoeur, C., Li, M., Serrano-Calvo, R., Levelt, P. F., Veefkind, J. P., McDonald, B. C., and de Gouw, J.: Quantifying NOx Emissions from U.S. Oil and Gas Production Regions Using TROPOMI NO2, ACS Earth and Space Chem., 6, 403–414, https://doi.org/10.1021/acsearthspacechem.1c00387, 2022.
Doumbia, T., Granier, C., Elguindi, N., Bouarar, I., Darras, S., Brasseur, G., Gaubert, B., Liu, Y., Shi, X., Stavrakou, T., Tilmes, S., Lacey, F., Deroubaix, A., and Wang, T.: Changes in global air pollutant emissions during the COVID-19 pandemic: a dataset for atmospheric modeling, Earth Syst. Sci. Data, 13, 4191–4206, https://doi.org/10.5194/essd-13-4191-2021, 2021.
Draper, C. and Reichle, R.: The impact of near-surface soil moisture assimilation at subseasonal, seasonal, and inter-annual timescales, Hydrol. Earth Syst. Sci., 19, 4831–4844, https://doi.org/10.5194/hess-19-4831-2015, 2015.
Du, E., Terrer, C., Pellegrini, A. F. A., Ahlström, A., van Lissa, C. J., Zhao, X., Xia, N., Wu, X., and Jackson, R. B.: Global patterns of terrestrial nitrogen and phosphorus limitation, Nat. Geosci., 13, 221–226, https://doi.org/10.1038/s41561-019-0530-4, 2020.
Duncan, B. N., Yoshida, Y., Olson, J. R., Sillman, S., Martin, R. V., Lamsal, L., Hu, Y., Pickering, K. E., Retscher, C., Allen, D. J., and Crawford, J. H.: Application of OMI observations to a space-based indicator of NOx and VOC controls on surface ozone formation, Atmos. Environ., 44, 2213–2223, https://doi.org/10.1016/j.atmosenv.2010.03.010, 2010.
Dunlea, E. J., Herndon, S. C., Nelson, D. D., Volkamer, R. M., San Martini, F., Sheehy, P. M., Zahniser, M. S., Shorter, J. H., Wormhoudt, J. C., Lamb, B. K., Allwine, E. J., Gaffney, J. S., Marley, N. A., Grutter, M., Marquez, C., Blanco, S., Cardenas, B., Retama, A., Ramos Villegas, C. R., Kolb, C. E., Molina, L. T., and Molina, M. J.: Evaluation of nitrogen dioxide chemiluminescence monitors in a polluted urban environment, Atmos. Chem. Phys., 7, 2691–2704, https://doi.org/10.5194/acp-7-2691-2007, 2007.
Elguindi, N., Granier, C., Stavrakou, T., Darras, S., Bauwens, M., Cao, H., Chen, C., Denier van der Gon, H. A. C., Dubovik, O., Fu, T. M., Henze, D. K., Jiang, Z., Keita, S., Kuenen, J. J. P., Kurokawa, J., Liousse, C., Miyazaki, K., Müller, J. F., Qu, Z., Solmon, F., and Zheng, B.: Intercomparison of Magnitudes and Trends in Anthropogenic Surface Emissions From Bottom-Up Inventories, Top-Down Estimates, and Emission Scenarios, Earth's Future, 8, e2020EF001520, https://doi.org/10.1029/2020EF001520, 2020.
Emberson, L.: Effects of ozone on agriculture, forests and grasslands, Philos. T. R. Soc. A., 378, 20190327, https://doi.org/10.1098/rsta.2019.0327, 2020.
Erisman, J. W., Van Pul, A., and Wyers, P.: Parameterization of surface resistance for the quantification of atmospheric deposition of acidifying pollutants and ozone, Atmos. Environ., 28, 2595–2607, https://doi.org/10.1016/1352-2310(94)90433-2, 1994.
Eskes, H. J. and Boersma, K. F.: Averaging kernels for DOAS total-column satellite retrievals, Atmos. Chem. Phys., 3, 1285–1291, https://doi.org/10.5194/acp-3-1285-2003, 2003.
Felzer, B. S., Cronin, T. W., Melillo, J. M., Kicklighter, D. W., and Schlosser, C. A.: Importance of carbon-nitrogen interactions and ozone on ecosystem hydrology during the 21st century, J. Geophys. Res., 114, G01020, https://doi.org/10.1029/2008JG000826, 2009.
Fiore, A. M., Dentener, F. J., Wild, O., Cuvelier, C., Schultz, M. G., Hess, P., Textor, C., Schulz, M., Doherty, R. M., Horowitz, L. W., MacKenzie, I. A., Sanderson, M. G., Shindell, D. T., Stevenson, D. S., Szopa, S., van Dingenen, R., Zeng, G., Atherton, C., Bergmann, D., Bey, I., Carmichael, G., Collins, W. J., Duncan, B. N., Faluvegi, G., Folberth, G., Gauss, M., Gong, S., Hauglustaine, D., Holloway, T., Isaksen, I. S. A., Jacob, D. J., Jonson, J. E., Kaminski, J. W., Keating, T. J., Lupu, A., Marmer, E., Montanaro, V., Park, R. J., Pitari, G., Pringle, K. J., Pyle, J. A., Schroeder, S., Vivanco, M. G., Wind, P., Wojcik, G., Wu, S., and Zuber, A.: Multimodel estimates of intercontinental source-receptor relationships for ozone pollution, J. Geophys. Res., 114, D04301, https://doi.org/10.1029/2008JD010816, 2009.
Fu, J. S., Carmichael, G. R., Dentener, F., Aas, W., Andersson, C., Barrie, L. A., Cole, A., Galy-Lacaux, C., Geddes, J., Itahashi, S., Kanakidou, M., Labrador, L., Paulot, F., Schwede, D., Tan, J., and Vet, R.: Improving Estimates of Sulfur, Nitrogen, and Ozone Total Deposition through Multi-Model and Measurement-Model Fusion Approaches, Environ. Sci. Technol., 56, 2134–2142, https://doi.org/10.1021/acs.est.1c05929, 2022.
Galloway, J. N., Aber, J. D., Erisman, J. W., Seitzinger, S. P., Howarth, R. W., Cowling, E. B., and Cosby, B. J.: The nitrogen cascade, Bioscience, 53, 341–356, https://doi.org/10.1641/0006-3568(2003)053[0341:TNC]2.0.CO;2, 2003.
Galloway, J. N., Dentener, F. J., Capone, D. G., Boyer, E. W., Howarth, R. W., Seitzinger, S. P., Asner, G. P., Cleveland, C. C., Green, P. A., Holland, E. A., Karl, D. M., Michaels, A. F., Porter, J. H., Townsend, A. R., and Vorosmarty, C. J.: Nitrogen cycles: past, present, and future, Biogeochemistry, 70, 153–226, https://doi.org/10.1007/s10533-004-0370-0, 2004.
Gaudel, A., Cooper, O. R., Ancellet, G., Barret, B., Boynard, A., Burrows, J. P., Clerbaux, C., Coheur, P. F., Cuesta, J., Cuevas, E., Doniki, S., Dufour, G., Ebojie, F., Foret, G., Garcia, O., Granados-Munoz, M. J., Hannigan, J. W., Hase, F., Hassler, B., Huang, G., Hurtmans, D., Jaffe, D., Jones, N., Kalabokas, P., Kerridge, B., Kulawik, S., Latter, B., Leblanc, T., Le Flochmoen, E., Lin, W., Liu, J., Liu, X., Mahieu, E., McClure-Begley, A., Neu, J. L., Osman, M., Palm, M., Petetin, H., Petropavlovskikh, I., Querel, R., Rahpoe, N., Rozanov, A., Schultz, M. G., Schwab, J., Siddans, R., Smale, D., Steinbacher, M., Tanimoto, H., Tarasick, D. W., Thouret, V., Thompson, A. M., Trickl, T., Weatherhead, E., Wespes, C., Worden, H. M., Vigouroux, C., Xu, X., Zeng, G., and Ziemke, J.: Tropospheric Ozone Assessment Report: Present-day distribution and trends of tropospheric ozone relevant to climate and global atmospheric chemistry model evaluation, Elementa-Sci. Anthrop., 6, 39, https://doi.org/10.1525/elementa.291, 2018.
Geddes, J. A. and Martin, R. V.: Global deposition of total reactive nitrogen oxides from 1996 to 2014 constrained with satellite observations of NO2 columns, Atmos. Chem. Phys., 17, 10071–10091, https://doi.org/10.5194/acp-17-10071-2017, 2017.
Geiser, L. H., Nelson, P. R., Jovan, S. E., Root, H. T., and Clark, C. M.: Assessing Ecological Risks from Atmospheric Deposition of Nitrogen and Sulfur to US Forests Using Epiphytic Macrolichens, Diversity, 11, 87, https://doi.org/10.3390/d11060087, 2019.
Georgoulias, A. K., Boersma, K. F., van Vliet, J., Zhang, X., van der A, R., Zanis, P., and de Laat, J.: Detection of NO2 pollution plumes from individual ships with the TROPOMI/S5P satellite sensor, Environ. Res. Lett., 15, 124037, https://doi.org/10.1088/1748-9326/abc445, 2020.
Goldberg, D. L., Anenberg, S. C., Kerr, G. H., Mohegh, A., Lu, Z., and Streets, D. G.: TROPOMI NO2 in the United States: A detailed look at the annual averages, weekly cycles, effects of temperature, and correlation with surface NO2 concentrations, Earth's Future, 9, e2020EF001665, https://doi.org/10.1029/2020EF001665, 2021.
Granier, C., Darras, S., Denier van der Gon, H., Doubalova, J., Elguindi, N., Galle, B., Gauss, M., Guevara, M., Jalkanen, J.-P., Kuenen, J., Liousse, C., Quack, B., Simpson, D., and Sindelarova, K.: The Copernicus Atmosphere Monitoring Service global and regional emissions, Copernicus Atmosphere Monitoring Service report, https://doi.org/10.24380/d0bn-kx16, 2019.
Grell, G., Freitas, S. R., Stuefer, M., and Fast, J.: Inclusion of biomass burning in WRF-Chem: impact of wildfires on weather forecasts, Atmos. Chem. Phys., 11, 5289–5303, https://doi.org/10.5194/acp-11-5289-2011, 2011.
Griffin, D., McLinden, C. A., Dammers, E., Adams, C., Stockwell, C. E., Warneke, C., Bourgeois, I., Peischl, J., Ryerson, T. B., Zarzana, K. J., Rowe, J. P., Volkamer, R., Knote, C., Kille, N., Koenig, T. K., Lee, C. F., Rollins, D., Rickly, P. S., Chen, J., Fehr, L., Bourassa, A., Degenstein, D., Hayden, K., Mihele, C., Wren, S. N., Liggio, J., Akingunola, A., and Makar, P.: Biomass burning nitrogen dioxide emissions derived from space with TROPOMI: methodology and validation, Atmos. Meas. Tech., 14, 7929–7957, https://doi.org/10.5194/amt-14-7929-2021, 2021.
Harmens, H., Hayes, F., Sharps, K., Radbourne, A., and Mills, G.: Can Reduced Irrigation Mitigate Ozone Impacts on an Ozone-Sensitive African Wheat Variety?, Plants, 8, 220, https://doi.org/10.3390/plants8070220, 2019.
Holt, J., Selin, N. E., and Solomon, S.: Changes in Inorganic Fine Particulate Matter Sensitivities to Precursors Due to Large-Scale US Emissions Reductions, Environ. Sci. Technol., 49, 4834–4841, https://doi.org/10.1021/acs.est.5b00008, 2015.
Horn, K. J., Thomas, R. Q., Clark, C. M., Pardo, L. H., Fenn, M. E., Lawrence, G. B., Perakis, S. S., Smithwick, E. A. H., Baldwin, D., Braun, S., Nordin, A., Perry, C. H., Phelan, J. N., Schaberg, P. G., St. Clair, S. B., Warby, R., and Watmough, S.: Growth and survival relationships of 71 tree species with nitrogen and sulfur deposition across the conterminous U.S., PLoS ONE, 13, e0205296, https://doi.org/10.1371/journal.pone.0205296, 2018.
Huang, M.: Ozone and other key fields (2018–2024) over the northeastern and mid-Atlantic US modeled by WRF-Chem, relevant to the TOAR-II activity, Version 1, Zenodo [data set], https://doi.org/10.5281/zenodo.14703647, 2025.
Huang, M., Bowman, K. W., Carmichael, G. R., Pierce, R. B., Worden, H. M., Luo, M., Cooper, O. R., Pollack, I. B., Ryerson, T. B., and Brown, S. S.: Impact of Southern California anthropogenic emissions on ozone pollution in the mountain states: Model analysis and observational evidence from space, J. Geophys. Res.-Atmos., 118, 12784–12803, https://doi.org/10.1002/2013JD020205, 2013.
Huang, M., Carmichael, G. R., Pierce, R. B., Jo, D. S., Park, R. J., Flemming, J., Emmons, L. K., Bowman, K. W., Henze, D. K., Davila, Y., Sudo, K., Jonson, J. E., Tronstad Lund, M., Janssens-Maenhout, G., Dentener, F. J., Keating, T. J., Oetjen, H., and Payne, V. H.: Impact of intercontinental pollution transport on North American ozone air pollution: an HTAP phase 2 multi-model study, Atmos. Chem. Phys., 17, 5721–5750, https://doi.org/10.5194/acp-17-5721-2017, 2017a.
Huang, M., Carmichael, G. R., Crawford, J. H., Wisthaler, A., Zhan, X., Hain, C. R., Lee, P., and Guenther, A. B.: Biogenic isoprene emissions driven by regional weather predictions using different initialization methods: case studies during the SEAC4RS and DISCOVER-AQ airborne campaigns, Geosci. Model Dev., 10, 3085–3104, https://doi.org/10.5194/gmd-10-3085-2017, 2017b.
Huang, M., Crawford, J. H., Carmichael, G. R., Santanello, J. A., Kumar, S. V., Stauffer, R. M., Thompson, A. M., Weinheimer, A. J., and Park, J. D.: Impact of aerosols from urban and shipping emission sources on terrestrial carbon uptake and evapotranspiration: A case study in east Asia, J. Geophys. Res.-Atmos., 125, e2019JD030818, https://doi.org/10.1029/2019JD030818, 2020.
Huang, M., Crawford, J. H., DiGangi, J. P., Carmichael, G. R., Bowman, K. W., Kumar, S. V., and Zhan, X.: Satellite soil moisture data assimilation impacts on modeling weather variables and ozone in the southeastern US – Part 1: An overview, Atmos. Chem. Phys., 21, 11013–11040, https://doi.org/10.5194/acp-21-11013-2021, 2021.
Huang, M., Crawford, J. H., Carmichael, G. R., Bowman, K. W., Kumar, S. V., and Sweeney, C.: Satellite soil moisture data assimilation impacts on modeling weather variables and ozone in the southeastern US – Part 2: Sensitivity to dry-deposition parameterizations, Atmos. Chem. Phys., 22, 7461–7487, https://doi.org/10.5194/acp-22-7461-2022, 2022.
Hudman, R. C., Moore, N. E., Mebust, A. K., Martin, R. V., Russell, A. R., Valin, L. C., and Cohen, R. C.: Steps towards a mechanistic model of global soil nitric oxide emissions: implementation and space based-constraints, Atmos. Chem. Phys., 12, 7779–7795, https://doi.org/10.5194/acp-12-7779-2012, 2012.
Huffman, G. J., Stocker, E. F., Bolvin, D. T., Nelkin, E. J., and Tan, J.: GPM IMERG Final Precipitation L3 1 day 0.1 degree × 0.1 degree, Version 7, Goddard Earth Sciences Data and Information Services Center (GES DISC) [data set], Greenbelt, Maryland, USA, https://doi.org/10.5067/GPM/IMERGDF/DAY/07, 2023.
Ibebuchi, C. C., Lee, C. C., Silva, A., and Sheridan, S. C.: Evaluating apparent temperature in the contiguous United States from four reanalysis products using Artificial Neural Networks, J. Geophys. Res.-Machine Learning and Computation, 1, e2023JH000102, https://doi.org/10.1029/2023JH000102, 2024.
Janz, S.: Long Island Sound Tropospheric Ozone Study GCAS and GeoTASO measurements of NO2 and CH2O, Version R1, NASA Langley Research Center Airborne Science Data for Atmospheric Composition, Hampton, Virginia, USA, https://www-air.larc.nasa.gov/missions/listos/index.html (last access: 6 February 2024), 2020.
Jia, Y., Yu, G., Gao, Y., He, N., Wang, Q., Jiao, C., and Zuo, Y.: Global inorganic nitrogen dry deposition inferred from ground- and space-based measurements, Sci. Rep., 6, 19810, https://doi.org/10.1038/srep19810, 2016.
Jiang, X., Guenther, A., Potosnak, M., Geron, C., Seco, R., Karl, T., Kim, S., Gu, L., and Pallardy, S.: Isoprene emission response to drought and the impact on global atmospheric chemistry, Atmos. Environ., 183, 69–83, https://doi.org/10.1016/j.atmosenv.2018.01.026, 2018.
Jin, X., Fiore, A. M., Murray, L. T., Valin, L. C., Lamsal, L. N., Duncan, B., Boersma, K. F., De Smedt, I., Abad, G. G., Chance, K., and Tonnesen, G. S.: Evaluating a Space-Based Indicator of Surface Ozone-NOx-VOC Sensitivity Over Midlatitude Source Regions and Application to Decadal Trends, J. Geophys. Res.-Atmos., 122, 10439–10461, https://doi.org/10.1002/2017JD026720, 2017.
Judd, L. M., Al-Saadi, J. A., Szykman, J. J., Valin, L. C., Janz, S. J., Kowalewski, M. G., Eskes, H. J., Veefkind, J. P., Cede, A., Mueller, M., Gebetsberger, M., Swap, R., Pierce, R. B., Nowlan, C. R., Abad, G. G., Nehrir, A., and Williams, D.: Evaluating Sentinel-5P TROPOMI tropospheric NO2 column densities with airborne and Pandora spectrometers near New York City and Long Island Sound, Atmos. Meas. Tech., 13, 6113–6140, https://doi.org/10.5194/amt-13-6113-2020, 2020.
Karion, A., Callahan, W., Stock, M., Prinzivalli, S., Verhulst, K. R., Kim, J., Salameh, P. K., Lopez-Coto, I., and Whetstone, J.: Greenhouse gas observations from the Northeast Corridor tower network, Earth Syst. Sci. Data, 12, 699–717, https://doi.org/10.5194/essd-12-699-2020, 2020.
Keller, C. A., Evans, M. J., Knowland, K. E., Hasenkopf, C. A., Modekurty, S., Lucchesi, R. A., Oda, T., Franca, B. B., Mandarino, F. C., Díaz Suárez, M. V., Ryan, R. G., Fakes, L. H., and Pawson, S.: Global impact of COVID-19 restrictions on the surface concentrations of nitrogen dioxide and ozone, Atmos. Chem. Phys., 21, 3555–3592, https://doi.org/10.5194/acp-21-3555-2021, 2021.
Koplitz, S. N., Nolte, C. G., Sabo, R. D., Clark, C. M., Horn, K. J., Thomas, R. Q., and Newcomer-Johnson, T. A.: The contribution of wildland fire emissions to deposition in the US: Implications for tree growth and survival in the Northwest, Environ. Res. Lett., 16, 024028, https://doi.org/10.1088/1748-9326/abd26e, 2021.
Koplitz, S., Simon, H., Henderson, B., Liljegren, J., Tonnesen, G., Whitehill, A., and Wells, B.: Changes in Ozone Chemical Sensitivity in the United States from 2007 to 2016, ACS Environ. Au, 2, 206–222, https://doi.org/10.1021/acsenvironau.1c00029, 2022.
Kumar, S. V., Reichle, R. H., Koster, R. D., Crow, W. T., and Peters-Lidard, C. D.: Role of subsurface physics in the assimilation of surface soil moisture observations, J. Hydrometeorol., 10, 1534–1547, https://doi.org/10.1175/2009JHM1134.1, 2009.
Lapina, K., Henze, D. K., Milford, J. B., Huang, M., Lin, M., Fiore, A. M., Carmichael, G., Pfister, G. G., and Bowman, K.: Assessment of source contributions to seasonal vegetative exposure to ozone in the U.S., J. Geophys. Res.-Atmos., 119, 324–340, https://doi.org/10.1002/2013JD020905, 2014.
Li, C., Martin, R. V., Cohen, R. C., Bindle, L., Zhang, D., Chatterjee, D., Weng, H., and Lin, J.: Variable effects of spatial resolution on modeling of nitrogen oxides, Atmos. Chem. Phys., 23, 3031–3049, https://doi.org/10.5194/acp-23-3031-2023, 2023.
Li, J., Mahalov, A., and Hyde, P.: Simulating the impacts of chronic ozone exposure on plant conductance and photosynthesis, and on the regional hydroclimate using WRF/Chem, Environ. Res. Lett., 11, 114017, https://doi.org/10.1088/1748-9326/11/11/114017, 2016.
Li, Y., Schichtel, B. A., Walker, J. T., Schwede, D. B., Chen, X., Lehmann, C. M. B., Puchalski, M. A., Gay, D. A., and Collett Jr., J. L.: Increasing importance of deposition of reduced nitrogen in the United States, P. Natl. Acad. Sci. USA, 113, 5874–5879, https://doi.org/10.1073/pnas.1525736113, 2016.
Lin, M., Horowitz, L. W., Payton, R., Fiore, A. M., and Tonnesen, G.: US surface ozone trends and extremes from 1980 to 2014: quantifying the roles of rising Asian emissions, domestic controls, wildfires, and climate, Atmos. Chem. Phys., 17, 2943–2970, https://doi.org/10.5194/acp-17-2943-2017, 2017.
Liu, J., Clark, L. P., Bechle, M., Hajat, A., Kim, S.-Y., Robinson, A., Sheppard, Lianne, Szpiro, A. A., and Marshall, J. D.: Disparities in air pollution exposure in the United States by race-ethnicity and income, 1990–2010, Environ. Health Persp., 129, 127005, https://doi.org/10.1289/EHP8584, 2021.
Liu, L., Zhang, X., Xu, W., Liu, X., Wei, J., Wang, Z., and Yang, Y.: Global estimates of dry ammonia deposition inferred from space-measurements, Sci. Total Environ., 730, 139189, https://doi.org/10.1016/j.scitotenv.2020.139189, 2020a.
Liu, L., Zhang, X., Xu, W., Liu, X., Lu, X., Wei, J., Li, Y., Yang, Y., Wang, Z., and Wong, A. Y. H.: Reviewing global estimates of surface reactive nitrogen concentration and deposition using satellite retrievals, Atmos. Chem. Phys., 20, 8641–8658, https://doi.org/10.5194/acp-20-8641-2020, 2020b.
Lombardozzi, D., Levis, S., Bonan, G., Hess, P. G., and Sparks, J. P.: The Influence of Chronic Ozone Exposure on Global Carbon and Water Cycles, J. Climate, 28, 292–305, https://doi.org/10.1175/JCLI-D-14-00223.1, 2015.
Lorente, A., Folkert Boersma, K., Yu, H., Dörner, S., Hilboll, A., Richter, A., Liu, M., Lamsal, L. N., Barkley, M., De Smedt, I., Van Roozendael, M., Wang, Y., Wagner, T., Beirle, S., Lin, J.-T., Krotkov, N., Stammes, P., Wang, P., Eskes, H. J., and Krol, M.: Structural uncertainty in air mass factor calculation for NO2 and HCHO satellite retrievals, Atmos. Meas. Tech., 10, 759–782, https://doi.org/10.5194/amt-10-759-2017, 2017.
Massad, R.-S., Nemitz, E., and Sutton, M. A.: Review and parameterisation of bi-directional ammonia exchange between vegetation and the atmosphere, Atmos. Chem. Phys., 10, 10359–10386, https://doi.org/10.5194/acp-10-10359-2010, 2010.
Mills, G., Sharps, K., Simpson, D., Pleijel, H., Broberg, M., Uddling, J., Jaramillo, F., Davies, W. J., Dentener, F., van den Berg, M., Agrawal, M., Agrawal, S. B., Ainsworth, E. A., Buker, P., Emberson, L., Feng, Z., Harmens, H., Hayes, F., Kopbayashi, K., Paoletti, E., and Van Dingenen, R.: Ozone pollution will compromise efforts to increase global wheat production, Glob. Change Biol., 24, 3560–3574, https://doi.org/10.1111/gcb.14157, 2018.
Miyazaki, K., Neu, J. L., Osterman, G., and Bowman, K.: Changes in US background ozone associated with the 2011 turnaround in Chinese NOx emissions, Environ. Res. Commun., 4, 045003, https://doi.org/10.1088/2515-7620/ac619b, 2022.
Monfreda, C., Ramankutty, N., and Foley, J. A.: Farming the planet: 2. Geographic distribution of crop areas, yields, physiological types, and net primary production in the year 2000, Global Biogeochem. Cy., 22, GB1022, https://doi.org/10.1029/2007GB002947, 2008.
Monks, P. S., Ravishankara, A. R., von Schneidemesser, E., and Sommariva, R.: Opinion: Papers that shaped tropospheric chemistry, Atmos. Chem. Phys., 21, 12909–12948, https://doi.org/10.5194/acp-21-12909-2021, 2021.
NASA: NASA-Unified WRF Source Code and Data, NASA Goddard Space Flight Center [software], Greenbelt, Maryland, USA, https://nuwrf.gsfc.nasa.gov/software (last access: 6 February 2024), 2019.
NCEP: NCEP ADP Global Surface Observational Weather Data, October 1999 – continuing, updated daily, Research Data Archive at the National Center for Atmospheric Research, Computational and Information Systems Laboratory [data set], Boulder, Colorado, USA, https://doi.org/10.5065/4F4P-E398, 2004.
Nguyen, T. B., Crounse, J. D., Teng, A. P., Clair, J. M. S., Paulot, F., Wolfe, G. M., and Wennberg, P. O.: Rapid deposition of oxidized biogenic compounds to a temperate forest, P. Natl. Acad. Sci. USA, 112, E392–E401, https://doi.org/10.1073/pnas.1418702112, 2015.
Niu, G. Y., Yang, Z. L., Mitchell, K. E., Chen, F., Ek, M. B., Barlage, M., Kumar, A., Manning, K., Niyogi, D., Rosero, E., Tewari, M., and Xia, Y.: The community Noah land surface model with multiparameterization options (Noah-MP): 1. Model description and evaluation with local-scale measurements, J. Geophys. Res.-Atmos., 116, D12109, https://doi.org/10.1029/2010JD015139, 2011.
O'Neill, P. E., Chan, S., Njoku, E. G., Jackson, T., Bindlish, R., Chaubell, J., and Colliander, A.: SMAP Enhanced L3 Radiometer Global and Polar Grid Daily 9 km EASE-Grid Soil Moisture, Version 5, NASA National Snow and Ice Data Center Distributed Active Archive Center [data set], Boulder, Colorado, USA, https://doi.org/10.5067/4DQ54OUIJ9DL, 2021.
Oswald, R., Behrendt, T., Ermel, M., Wu, D., Su, H., Cheng, Y., Breuninger, C., Moravek, A., Mougin, E., Delon, C., Loubet, B., Pommerening-Röser, A., Sörgel, M., Pöschl, U., Hoffmann, T., Andreae, M. O., Meixner, F. X., and Trebs, I.: HONO emissions from soil bacteria as a major source of atmospheric reactive nitrogen, Science, 341, 1233–1235, https://doi.org/10.1126/science.1242266, 2013.
Ott, L. E., Duncan, B. N., Thompson, A. M., Diskin, G., Fasnacht, Z., Langford, A. O., Lin, M., Molod, A. M., Nielsen, J. E., Pusede, S. E., Wargan, K., Weinheimer, A. J., and Yoshida, Y.: Frequency and impact of summertime stratospheric intrusions over Maryland during DISCOVER-AQ (2011): New evidence from NASA's GEOS-5 simulations, J. Geophys. Res.-Atmos., 121, 3687–3706, https://doi.org/10.1002/2015JD024052, 2016.
Pardo, L. H., Fenn, M.E., Goodale, C. L., Geiser, L. H., Driscoll, C. T., Allen, E. B., Baron, J. S., Bobbink, R., Bowman, W. D., Clark, C. M., Emmett, B., Gilliam, F. S., Greaver, T. L., Hall, S. J., Lilleskov, E. A., Liu, L., Lynch., J. A., Nadelhoffer, K. J., Perakis, S. S., Robin-Abbott, M. J., Stoddard, J. L., Weathers, K. C., and Dennis, R. L.: Effects of nitrogen deposition and empirical nitrogen critical loads for ecoregions of the United States, Ecol. Appl., 21, 3049–3082, https://doi.org/10.1890/10-2341.1, 2011.
Pleim, J. E., Ran, L., Appel, W., Shephard, M. W., and Cady-Pereira, K.: New bidirectional ammonia flux model in an air quality model coupled with an agricultural model, J. Adv. Model. Earth Sy., 11, 2934–2957, https://doi.org/10.1029/2019MS001728, 2019.
Putero, D., Cristofanelli, P., Chang, K.-L., Dufour, G., Beachley, G., Couret, C., Effertz, P., Jaffe, D. A., Kubistin, D., Lynch, J., Petropavlovskikh, I., Puchalski, M., Sharac, T., Sive, B. C., Steinbacher, M., Torres, C., and Cooper, O. R.: Fingerprints of the COVID-19 economic downturn and recovery on ozone anomalies at high-elevation sites in North America and western Europe, Atmos. Chem. Phys., 23, 15693–15709, https://doi.org/10.5194/acp-23-15693-2023, 2023.
Rasool, Q. Z., Bash, J. O., and Cohan, D. S.: Mechanistic representation of soil nitrogen emissions in the Community Multiscale Air Quality (CMAQ) model v 5.1, Geosci. Model Dev., 12, 849–878, https://doi.org/10.5194/gmd-12-849-2019, 2019.
Rogers, H. M., Ditto, J. C., and Gentner, D. R.: Evidence for impacts on surface-level air quality in the northeastern US from long-distance transport of smoke from North American fires during the Long Island Sound Tropospheric Ozone Study (LISTOS) 2018, Atmos. Chem. Phys., 20, 671–682, https://doi.org/10.5194/acp-20-671-2020, 2020.
Rubin, H. J., Fu, J. S., Dentener, F., Li, R., Huang, K., and Fu, H.: Global nitrogen and sulfur deposition mapping using a measurement–model fusion approach, Atmos. Chem. Phys., 23, 7091–7102, https://doi.org/10.5194/acp-23-7091-2023, 2023.
Ryu, Y.-H. and Min, S.-K.: Improving wet and dry deposition of aerosols in WRF-Chem: Updates to below-cloud scavenging and coarse-particle dry deposition, J. Adv. Model. Earth Sy., 14, e2021MS002792. https://doi.org/10.1029/2021MS002792, 2022.
Paulot, F., Jacob, D. J., and Henze, D. K.: Sources and Processes Contributing to Nitrogen Deposition: An Adjoint Model Analysis Applied to Biodiversity Hotspots Worldwide, Environ. Sci. Technol., 47, 3226–3233, https://doi.org/10.1021/es3027727, 2013.
Paulot, F., Malyshev, S., Nguyen, T., Crounse, J. D., Shevliakova, E., and Horowitz, L. W.: Representing sub-grid scale variations in nitrogen deposition associated with land use in a global Earth system model: implications for present and future nitrogen deposition fluxes over North America, Atmos. Chem. Phys., 18, 17963–17978, https://doi.org/10.5194/acp-18-17963-2018, 2018.
Sadiq, M., Tai, A. P. K., Lombardozzi, D., and Val Martin, M.: Effects of ozone–vegetation coupling on surface ozone air quality via biogeochemical and meteorological feedbacks, Atmos. Chem. Phys., 17, 3055–3066, https://doi.org/10.5194/acp-17-3055-2017, 2017.
Salmon, J. M., Friedl, M. A., Frolking, S., Wisser, D., and Douglas, E. M.: Global rain-fed, irrigated, and paddy croplands: A new high resolution map derived from remote sensing, crop inventories and climate data, Int. J. Appl. Earth Obs., 38, 321–334, https://doi.org/10.1016/j.jag.2015.01.014, 2015.
Schwede, D. B. and Lear, G. G.: A novel hybrid approach for estimating total deposition in the United States, Atmos. Environ., 92, 207–220, https://doi.org/10.1016/j.atmosenv.2014.04.008, 2014.
Seinfeld, J. H. and Pandis, S. N.: Atmospheric chemistry and physics: from air pollution to climate change, Third edition, John Wiley & Sons, Inc., Hoboken, New Jersey, ISBN 978-1118947401, 2016.
Seneviratne, S. I., Corti, T., Davin, E. L., Hirschi, M., Jaeger, E. B., Lehner, I., Orlowsky, B., and Teuling, A. J.: Investigating soil moisture-climate interactions in a changing climate: A review, Earth-Sci. Rev., 99, 125–161, https://doi.org/10.1016/j.earscirev.2010.02.004, 2010.
Simkin, S. M., Allen, E. B., Bowman, W. D., Clark, C. M., Belnap, J., Brooks, M. L., Cade, B. S., Collins, S. L., Geiser, L. H., Gilliam, F. S., Jovan, S. E., Pardo, L. H., Schulz, B. K., Stevens, C. J., Suding, K. N., Throop, H. L., and Waller, D. M.: Conditional vulnerability of plant diversity to atmospheric nitrogen deposition across the United States, P. Natl. Acad. Sci. USA, 113, 4086–4091, https://doi.org/10.1073/pnas.1515241113, 2016.
Simon, H., Reff, A., Wells, B., Xing, J., and Frank, N.: Ozone Trends Across the United States over a Period of Decreasing NOx and VOC Emissions, Environ. Sci. Technol., 49, 186–195, https://doi.org/10.1021/es504514z, 2015.
Simpson, D. and Darras, S.: Global soil NO emissions for Atmospheric Chemical Transport Modelling: CAMS-GLOB-SOIL v2.2, Earth Syst. Sci. Data Discuss. [preprint], https://doi.org/10.5194/essd-2021-221, 2021.
Simpson, D., Arneth, A., Mills, G., Solberg, S., and Uddling, J.: Ozone–the persistent menace: interactions with the N cycle and climate change, Curr. Opin. Env. Sust., 9–10, 9–19, https://doi.org/10.1016/j.cosust.2014.07.008, 2014.
Soulie, A., Granier, C., Darras, S., Zilbermann, N., Doumbia, T., Guevara, M., Jalkanen, J.-P., Keita, S., Liousse, C., Crippa, M., Guizzardi, D., Hoesly, R., and Smith, S. J.: Global anthropogenic emissions (CAMS-GLOB-ANT) for the Copernicus Atmosphere Monitoring Service simulations of air quality forecasts and reanalyses, Earth Syst. Sci. Data, 16, 2261–2279, https://doi.org/10.5194/essd-16-2261-2024, 2024.
Souri, A. H., Johnson, M. S., Wolfe, G. M., Crawford, J. H., Fried, A., Wisthaler, A., Brune, W. H., Blake, D. R., Weinheimer, A. J., Verhoelst, T., Compernolle, S., Pinardi, G., Vigouroux, C., Langerock, B., Choi, S., Lamsal, L., Zhu, L., Sun, S., Cohen, R. C., Min, K.-E., Cho, C., Philip, S., Liu, X., and Chance, K.: Characterization of errors in satellite-based HCHO NO2 tropospheric column ratios with respect to chemistry, column-to-PBL translation, spatial representation, and retrieval uncertainties, Atmos. Chem. Phys., 23, 1963–1986, https://doi.org/10.5194/acp-23-1963-2023, 2023.
Steinbrecht, W., Kubistin, D., Plass-Dülmer, C., Davies, J., Tarasick, D. W., von der Gathen, P., Deckelmann, H., Jepsen, N., Kivi, R., Lyall, N., Palm, M., Notholt, J., Kois, B., Oelsner, P., Allaart, M., Piters, A., Gill, M., Van Malderen, R., Delcloo, A. W., Sussmann, R., Mahieu, E., Servais, C., Romanens, G., Stübi, R., Ancellet, G., Godin-Beekmann, S., Yamanouchi, S., Strong, K., Johnson, B., Cullis, P., Petropavlovskikh, I., Hannigan, J. W., Hernandez, J.-L., Rodriguez, A. D., Nakano, T., Chouza, F., Leblanc, T., Torres, C., Garcia, O., Röhling, A. N., Schneider, M., Blumenstock, T., Tully, M., Paton-Walsh, C., Jones, N., Querel, R., Strahan, S., Stauffer, R. M., Thompson, A. M., Inness, A., Engelen, R., Chang, K.-L., and Cooper, O. R.: COVID-19 Crisis Reduces Free Tropospheric Ozone Across the Northern Hemisphere, Geophys. Res. Lett., 48, e2020GL091987, https://doi.org/10.1029/2020GL091987, 2021.
Steinkamp, J. and Lawrence, M. G.: Improvement and evaluation of simulated global biogenic soil NO emissions in an AC-GCM, Atmos. Chem. Phys., 11, 6063–6082, https://doi.org/10.5194/acp-11-6063-2011, 2011.
Sun, S., Tai, A. P. K., Yung, D. H. Y., Wong, A. Y. H., Ducker, J. A., and Holmes, C. D.: Influence of plant ecophysiology on ozone dry deposition: comparing between multiplicative and photosynthesis-based dry deposition schemes and their responses to rising CO2 level, Biogeosciences, 19, 1753–1776, https://doi.org/10.5194/bg-19-1753-2022, 2022.
Tao, M., Fiore, A. M., Jin, X., Schiferl, L. D., Commane, R., Judd, L. M., Janz, S., Sullivan, J. T., Miller, P. J., Karambelas, A., Davis, S., Tzortziou, M., Valin, L., Whitehill, A., Civerolo, K., and Tian, Y.: Investigating Changes in Ozone Formation Chemistry during Summertime Pollution Events over the Northeastern United States, Environ. Sci. Technol., 56, 15312–15327, https://doi.org/10.1021/acs.est.2c02972, 2022.
Tan, J., Fu, J. S., Dentener, F., Sun, J., Emmons, L., Tilmes, S., Sudo, K., Flemming, J., Jonson, J. E., Gravel, S., Bian, H., Davila, Y., Henze, D. K., Lund, M. T., Kucsera, T., Takemura, T., and Keating, T.: Multi-model study of HTAP II on sulfur and nitrogen deposition, Atmos. Chem. Phys., 18, 6847–6866, https://doi.org/10.5194/acp-18-6847-2018, 2018.
United Nations Economic Commission for Europe: Guidance documents and other methodological materials for the implementation of the 1999 Protocol to Abate Acidification, Eutrophication and Ground-level Ozone (Gothenburg Protocol), https://unece.org/gothenburg-protocol (last access: 12 January 2023), 1999.
US Environmental Protection Agency (EPA): Nonattainment Areas for Criteria Pollutants (Green Book), https://www.epa.gov/green-book (last access: 1 October 2024), 2023.
US EPA: AQS Data, US EPA Office of Air Quality Planning and Standards/Outreach and Information Division/National Air Data Group, Research Triangle Park, North Carolina, USA, https://aqs.epa.gov/aqsweb/airdata/download_files.html (last access: 1 October 2024), 2024.
US Global Change Research Program: Fifth National Climate Assessment, edited by: Crimmins, A. R., Avery, C. W., Easterling, D. R., Kunkel, K. E., Stewart, B. C., and Maycock, T. K., US. Global Change Research Program, Washington, DC, USA, https://doi.org/10.7930/NCA5.2023, 2023.
van der Velde, I. R., van der Werf, G. R., Houweling, S., Eskes, H. J., Veefkind, J. P., Borsdorff, T., and Aben, I.: Biomass burning combustion efficiency observed from space using measurements of CO and NO2 by the TROPOspheric Monitoring Instrument (TROPOMI), Atmos. Chem. Phys., 21, 597–616, https://doi.org/10.5194/acp-21-597-2021, 2021.
Veira, A., Kloster, S., Schutgens, N. A. J., and Kaiser, J. W.: Fire emission heights in the climate system – Part 2: Impact on transport, black carbon concentrations and radiation, Atmos. Chem. Phys., 15, 7173–7193, https://doi.org/10.5194/acp-15-7173-2015, 2015.
Vinken, G. C. M., Boersma, K. F., Maasakkers, J. D., Adon, M., and Martin, R. V.: Worldwide biogenic soil NOx emissions inferred from OMI NO2 observations, Atmos. Chem. Phys., 14, 10363–10381, https://doi.org/10.5194/acp-14-10363-2014, 2014.
Walker, J. T., Beachley, G., Amos, H. M., Baron, J. S., Bash, J., Baumgardner, R., Bell, M. D., Benedict, K. B., Chen, X., Clow, D. W., Cole, A., Coughlin, J. G., Cruz, K., Daly, R. W., Decina, S. M., Elliott, E. M., Fenn, M. E., Ganzeveld, L., Gebhart, K., Isil, S. S., Kerschner, B. M., Larson, R. S., Lavery, T., Lear, G. G., Macy, T., Mast, M. A., Mishoe, K., Morris, K. H., Padgett, P. E., Pouyat, R. V., Puchalski, M., Pye, H., Rea, A. W., Rhodes, M. F., Rogers, C. M., Saylor, R., Scheffe, R., Schichtel, B. A., Schwede, D. B., Sexstone, G. A., Sive, B. C., Sosa, R., Templer, P. H., Thompson, T., Tong, D., Wetherbee, G. A., Whitlow, T. H., Wu, Z., Yu, Z., and Zhang, L.: Toward the improvement of total nitrogen deposition budgets in the United States, Sci. Total Environ., 691, 1328–1352, https://doi.org/10.1016/j.scitotenv.2019.07.058, 2019.
Wang, Y., Ge, C., Garcia, L. C., Jenerette, G. D., Oikawa, P. Y., and Wang, J.: Improved modelling of soil NOx emissions in a high temperature agricultural region: role of background emissions on NO2 trend over the US, Environ. Res. Lett., 16, 084061, https://doi.org/10.1088/1748-9326/ac16a3, 2021.
Whaley, C. H., Butler, T., Adame, J. A., Ambulkar, R., Arnold, S. R., Buchholz, R. R., Gaubert, B., Hamilton, D. S., Huang, M., Hung, H., Kaiser, J. W., Kaminski, J. W., Knote, C., Koren, G., Kouassi, J.-L., Lin, M., Liu, T., Ma, J., Manomaiphiboon, K., Bergas Masso, E., McCarty, J. L., Mertens, M., Parrington, M., Peiro, H., Saxena, P., Sonwani, S., Surapipith, V., Tan, D., Tang, W., Tanpipat, V., Tsigaridis, K., Wiedinmyer, C., Wild, O., Xie, Y., and Zuidema, P.: HTAP3 Fires: Towards a multi-model, multi-pollutant study of fire impacts, Geosci. Model Dev. Discuss. [preprint], https://doi.org/10.5194/gmd-2024-126, in review, 2024.
Wiedinmyer, C., Kimura, Y., McDonald-Buller, E. C., Emmons, L. K., Buchholz, R. R., Tang, W., Seto, K., Joseph, M. B., Barsanti, K. C., Carlton, A. G., and Yokelson, R.: The Fire Inventory from NCAR version 2.5: an updated global fire emissions model for climate and chemistry applications, Geosci. Model Dev., 16, 3873–3891, https://doi.org/10.5194/gmd-16-3873-2023, 2023.
Wong, J., Barth, M. C., and Noone, D.: Evaluating a lightning parameterization based on cloud-top height for mesoscale numerical model simulations, Geosci. Model Dev., 6, 429–443, https://doi.org/10.5194/gmd-6-429-2013, 2013.
Wu, Z., Wang, X., Chen, F., Turnipseed, A. A., Guenther, A. B., Niyogi, D., Charusombat, U., Xia, B., Munger, J. W., and Alapaty, K.: Evaluating the calculated dry deposition velocities of reactive nitrogen oxides and ozone from two community models over a temperate deciduous forest, Atmos. Environ., 45, 2663–2674, https://doi.org/10.1016/j.atmosenv.2011.02.063, 2011.
Yao, L., Kong, S., Nemitz, E., Vieno, M., Cheng, Y., Zheng, H., Wang, Y., Chen, N., Hu, Y., Liu, D., Zhao, T., Bai, Y., and Qi, S.: Improving below-cloud scavenging coefficients of sulfate, nitrate, and ammonium in PM2.5 and implications for numerical simulation and air pollution control, J. Geophys. Res.-Atmos., 129, e2023JD039487, https://doi.org/10.1029/2023JD039487, 2023.
Zhang, L., Wright, L. P., and Asman, W. A. H.: Bi-directional air-surface exchange of atmospheric ammonia: A review of measurements and a development of a big-leaf model for applications in regional-scale air-quality models, J. Geophys. Res., 115, D20310, https://doi.org/10.1029/2009JD013589, 2010.
Zhu, J. and Liang, X.-Z.: Impacts of the Bermuda High on regional climate and ozone over the United States, J. Climate, 26, 1018–1032, https://doi.org/10.1175/JCLI-D-12-00168.1, 2013.
Zhu, L., Henze, D., Bash, J., Jeong, G.-R., Cady-Pereira, K., Shephard, M., Luo, M., Paulot, F., and Capps, S.: Global evaluation of ammonia bidirectional exchange and livestock diurnal variation schemes, Atmos. Chem. Phys., 15, 12823–12843, https://doi.org/10.5194/acp-15-12823-2015, 2015.