the Creative Commons Attribution 4.0 License.
the Creative Commons Attribution 4.0 License.
 | 30 Oct 2025
Inversion-based assessment of anthropogenic NOx emission changes in Ukraine during the 2022–2023 war using TROPOMI satellite data
Weimin Ju
Hengmao Wang
Liangyun Liu
Haikun Wang
Shuzhuang Feng
Mengwei Jia
The outbreak of the Russia–Ukraine war in 2022 brought a huge impact on the Ukrainian society. We utilized TROPOMI nitrogen dioxide (NO2) observations to constrain the Emissions Database for Global Atmospheric Research (EDGAR) inventory and inverted daily anthropogenic nitrogen oxides (NOx) emissions in Ukraine from 2019 to 2023. Our results reveal a 15 % reduction in NOx emissions during the 2022 war and an 8 % reduction in 2023, both substantially exceeding the decrease caused by the COVID-19 pandemic. Emission anomalies closely tracked the timing and location of major military actions, highlighting the sensitivity of NOx emissions to conflict-related disruptions. Regionally, Eastern Ukraine experienced larger reductions in NOx emissions in both 2022 and 2023 by 29 % and 17 %, respectively, due to direct damage from frontline military operations. In contrast, Western Ukraine experienced a relatively modest emission reduction of only 8 % in 2022 with emissions increasing in some regions. In 2023, the emissions increased in most western regions. After the outbreak of the war, the industrial sector experienced the largest reductions in NOx emissions, with decreases of 34 % and 24 % in 2022 and 2023, respectively, followed by the residential sector, which declined by 23 % and 18 % respectively. War activities also emitted large amounts of NOx, and such emissions partially offset the emission reduction caused by the impact of war on socio-economic. By filtering out high-frequency emission fluctuations induced by wartime activities through Locally Estimated Scatterplot Smoothing, our results indicate that war-related emissions may have offset approximately 8 % and 10 % of the anthropogenic NOx reductions in 2022 and 2023, respectively. After removing the war-related emissions, the inverted emission declines exhibit strong agreement with bottom-up emission inventories and reported economic performance metrics. These findings provide new insights into the environmental and socio-economic impacts of armed conflict.
- Article
(3706 KB) - Full-text XML
-
Supplement
(4429 KB) - BibTeX
- EndNote


In recent years, localized conflicts have proliferated, posing persistent challenges to economic stability, infrastructure, and social sustainability (Esteban et al., 2012; Gutierrez et al., 2024; Hou et al., 2024) . Accurately and swiftly assessing the immediate and long-term impacts of modern warfare on human society has become increasingly critical. The ongoing Russia–Ukraine war, one of Europe's most significant conflicts since World War II (Adekoya et al., 2022), provides a unique lens for studying the consequences of contemporary warfare.
Since its outbreak on 24 February 2022, this conflict has profoundly disrupted Ukraine's economy, environment, and societal well-being (Ialongo et al., 2023; Kussul et al., 2023; Malarvizhi et al., 2023; Shumilova et al., 2023). Preliminary assessments of the damage caused by the conflict have already been made by a number of organizations. As of early 2023, the Office of the United Nations High Commissioner for Human Rights reported nearly 22 000 civilian casualties (OHCHR, 2023). The war has significantly impacted all sectors, with the destruction of infrastructure, residential areas, and industrial facilities particularly severe. The resulting disruptions have not only affected Ukraine but also had global repercussions, including food shortages and energy export restrictions, which have in turn altered global energy and food systems (Carriquiry et al., 2022; Chen et al., 2023; Huang et al., 2023; Mottaleb et al., 2022; Rawtani et al., 2022). These events have also contributed to the expansion of global cropland and the loss of biodiversity (Chai et al., 2024). However, the accuracy and completeness of the available assessment data remain uncertain. This uncertainty stems from significant challenges in acquiring reliable and up-to-date statistics due to the deteriorating information environment during the conflict, making it difficult to assess the spatial and temporal dynamics of the war's impacts (Dando et al., 2023; Hou et al., 2024; Mueller et al., 2021). Consequently, there is an urgent need for remote, real-time quantitative methods to assess the extent of destruction across various regions at different stages of the conflict. Such approaches are crucial for supporting the well-being of civilians affected by the war.
Nitrogen oxides (NOx = NO + NO2) are significant air pollutants that reflect shifts in energy consumption, thereby serving as indicators of economic growth (Bilgen, 2014). Anthropogenic NOx emissions primarily arise from fossil fuel combustion activities (Miyazaki et al., 2012; Zhang et al., 2023b). Emissions sources include energy consumption in residential settings (e.g., natural gas) (Lebel et al., 2022), industrial production (Gholami et al., 2020; Li et al., 2023b; Zhu et al., 2023), energy supply (e.g., power plants) (Islam et al., 2023; Liu et al., 2015; Tang et al., 2019), and agriculture (Chen et al., 2018; Liu et al., 2018). With increasing motorization and urbanization, the transportation has emerged as the largest contributor to NOx emissions (Wu et al., 2017), accounting for approximately 42 % of total NOx emissions in Europe (Sun et al., 2018). Consequently, NOx emissions often represent changes in the intensity of activities in various economic sectors. As a short-lived gas, directly emitted nitric oxide (NO) can be rapidly oxidized to form nitrogen dioxide (NO2), which, in the presence of sunlight and volatile organic compounds (VOCs), contributes to net ozone (O3) generation and secondary particulate matter formation (Atkinson, 2000). This short-lived nature typically results in a strong correlation between atmospheric NO2 concentrations and NOx emissions in localized regions (Richter et al., 2005). According to the Emissions Database for Global Atmospheric Research (EDGAR) v8.1 (Crippa et al., 2024), the annual NOx emissions in Ukraine were rather stable before the Russia–Ukraine war, with relative changes in the range of −5 % to 3 % from 2015 to 2019. This characteristics provide a theoretical basis for the grid-scale inversion of NOx emissions from satellite-observed atmospheric NO2 data (Reuter et al., 2014) and evaluating relative changes induced by the war.
The characteristics of satellite data, including their large-scale coverage and timeliness, ensure effective data support even under unforeseen circumstances, providing valuable insights into the spatial pattern and scale of global NOx emissions through top-down inversion (Li et al., 2023a). Various inversion techniques, including plume, Gaussian, and box models, permit the estimation of surface NOx emissions directly from satellite-derived NO2 vertical column density (VCD) (Beirle et al., 2011; de Foy et al., 2014; Duncan et al., 2013). Moreover, approaches that integrate satellite observations with atmospheric chemistry transport models (CTM), such as mass balance method, four-dimensional Variational method, and ensemble Kalman filtering methods, facilitate a more accurate characterization of spatial and seasonal emission trends (Gu et al., 2016; Martin et al., 2003; Miyazaki et al., 2012; Qu et al., 2017; Stavrakou et al., 2013; Xu et al., 2013). Studies have revealed the impact of the COVID-19 pandemic on human activity and the spatial and temporal dynamics of regional economies based on inverted NOx emissions from satellite observations (Feng et al., 2020; Mao et al., 2024; Miyazaki et al., 2021; Zheng et al., 2021; Guevara et al., 2021; Li et al., 2023a; Li and Zheng, 2023; Luo et al., 2023). Previous studies have also demonstrated that satellite-based NO2 observations can serve as effective indicators of the societal impacts induced by regional conflicts. For instance, Lelieveld et al. (2015) analyzed a decade of NO2 data from the Ozone Monitoring Instrument (OMI) satellite and reported that widespread displacement caused by armed conflicts in the Middle East resulted in significant deviations in anthropogenic NOx emissions from their typical interannual trends. More recently, Zhang et al. (2023a) further observed pronounced fluctuations in NO2 concentrations over Ukraine between February and July 2022, driven by changes in anthropogenic emissions, as revealed by TROPOspheric Monitoring Instrument (TROPOMI) satellite measurements combined with a machine learning approach. In light of the limitations of existing bottom-up inventories and the challenges of obtaining timely and reliable ground-based data during conflicts, there remains a critical need for robust, satellite-driven top-down approaches to accurately quantify changes in NOx emissions in Ukraine during the war period as an indicator of the impact of the war on society.
In this study, we optimise the inversion framework we previously published (Mao et al., 2024) to invert changes in anthropogenic NOx emissions during the war from 2022 to 2023 in Ukraine using satellite observations of NO2 VCD from the TROPOMI satellite (Van Geffen et al., 2022). The framework utilizes the anthropogenic NOx emission inventory from EDGAR (Crippa et al., 2024) as the prior emission and simulates the atmospheric NO2 physical and chemical processes using the GEOS-Chem atmospheric chemistry model (Sulprizio, 2022). We employ the finite-difference mass-balance (FDMB) method (East et al., 2022) to establish a linear relationship between anthropogenic NOx emissions and satellite-derived NO2 VCD observations, enabling us to invert anthropogenic NOx emissions during the war in Ukraine. Our analysis captures the spatial and temporal variability of NOx emissions across the industrial, agricultural, transportation, and residential sectors in Ukraine from 2019 to 2023. This approach allows us to assess the changing intensity of the war's impact on various economic activities within Ukraine. For comparison, we also analyzed NOx emissions in 2020, which were affected by the pandemic. In addition, we divided Ukraine into eastern and western regions based on the scope of the war and estimated the NOx emissions from different sectors in each region. By conducting a comparative analysis of NOx emission changes across regions and sectors during the war, we identified the driving factors behind these changes, revealing the profound economic disruptions caused by the war. This analysis underscores the importance of sustainable development strategies and resilience planning in mitigating the impacts of such crises on modern society.
2.1 Atmospheric Chemical Transport Model
We utilized version 14.0.0 of the GEOS-Chem model (Sulprizio, 2022), to conduct forward simulations of NO2 VCDs in the troposphere over Ukraine, which has been widely used in the inversions of surface Carbon Dioxide (CO2) flux (Wang et al., 2022), Methane (CH4) (Shen et al., 2023) and NOx (Zheng et al., 2020). Specifically, the simulations for the European region were conducted within the geographical bounds of 10° W–45° E longitude and 35–65° N latitude. The boundary conditions were derived from global simulations conducted using the same version of the GEOS-Chem model. The model was operated at a horizontal resolution of 0.25° (latitude) × 0.3125° (longitude), corresponding to approximately 17 km × 35 km over Ukraine, and a vertical resolution of 47 layers. Meteorological data from the GEOS forward processing (GEOS-FP) was employed to drive the model.
2.2 Prior emissions
The anthropogenic NOx emissions inventory utilized in this study was derived from the EDGAR v8.1, developed by the European Commission's Joint Research Centre (Crippa et al., 2024). This inventory estimates national total emissions by sector based on international energy and activity statistics combined with emission factors, following the same methodology as earlier versions of EDGAR (Crippa et al., 2018). Emissions are spatially distributed at a resolution of 0.1° × 0.1° using dynamic spatial proxies. For point sources such as power plants and industrial facilities, location information is obtained from the Global Energy Monitor database, and missing data are supplemented using non-residential building surface data from the Global Human Settlement Layer. Line sources, such as international shipping, are derived from the Ship Traffic Emission Assessment Model. Area sources, particularly residential combustion, are distributed based on population density (GHS-POP R2023A) weighted by heating degree days to account for temperature-dependent fuel consumption.
In addition, we also used emissions from natural sources, including biomass burning and soil. The biomass burning NOx emissions data was derived from the Global Fire Emissions Database Version 4.1s (GFED4.1s) inventory (Randerson et al., 2017). GFED4.1s provides global data on monthly burned area at a 0.25° spatial resolution, using a combination of Moderate-resolution Imaging Spectroradiometer (MODIS) burned area maps, active fire data from the Tropical Rainfall Measuring Mission, and the Along-Track Scanning Radiometer sensor family (Giglio et al., 2013). This inventory offers significant improvements over previous versions by incorporating a higher spatial resolution and more accurate fire mapping, which is critical for estimating emissions from biomass burning. The GFED4.1s inventory accounts for the dynamics of biomass burning and the associated emissions, including NOx, by mapping burned areas at fine spatial and temporal scales. This allows for the assessment of interannual variability and long-term trends in biomass burning. The inclusion of biomass burning emissions is essential for understanding the contributions of wildfires and other biomass combustion sources to global NOx levels, especially in regions affected by seasonal fires.
The soil NOx emissions used in this study are based on a modified version of the Berkeley-Dalhousie Soil Nitrogen Oxide Parameterization, originally developed by Hudman et al. (2012) and implemented in GEOS-Chem. This emission inventory represents a significant advancement over previous parameterizations by adopting a more mechanistic approach to modeling soil NOx emissions. The BDSNP accounts for the persistent dependence of emissions on soil moisture and temperature, as well as the pulsed emissions following soil wetting events, which are critical for capturing the temporal variability of soil NOx emissions. The inventory also includes detailed spatiotemporal representations of nitrogen inputs from fertilizers, manure, and atmospheric deposition.
2.3 Satellite NO2 VCD observations
Currently, the TROPOMI satellite provides high-quality NO2 VCD data with enhanced spatial resolution and signal-to-noise ratio, which are beneficial for NOx emission studies (Sekiya et al., 2022; Veefkind et al., 2012). In this study, we employed the most recent versions of the TROPOMI NO2 product to provide optimal observational constraints for the inversion framework. Specifically, we used the v2.4.0 official reprocessed (RPRO) dataset for the period from 1 January 2019 to 25 July 2022, the v2.4.0 official offline (OFFL) dataset from 26 July 2022 to 12 March 2023, the v2.5.0 OFFL dataset from 13 March to 26 November 2023, and the v2.6.0 OFFL dataset for the remaining days of 2023. Different versions of the dataset were used for different time periods because each version only covers a specific time period (see https://www.temis.nl/airpollution/no2col/tropomi_no2_data_versions.php, last access: 8 September 2025). These products incorporate improved and consistent Level-1b processing and retrieval algorithms, with only minor adjustments between versions (Table S1 in the Supplement), representing the most up-to-date and accurate TROPOMI NO2 dataset available. All data were obtained from the TEMIS portal (TEMIS, 2025).
TROPOMI, launched in October 2017 onboard the European Space Agency (ESA) S5P spacecraft, provides high-quality global daily observations that exhibit a strong correlation with ground-based data (Ialongo et al., 2020) and demonstrate relative stability in statistical uncertainty (van Geffen et al., 2020). TROPOMI is an Ultraviolet–visible spectrometer aboard the Sentinel-5P satellite in a sun-synchronous polar orbit, crossing the equator at approximately 13:30 local time. We screened GEOS-Chem simulations that overlapped with the transit time of the TROPOMI grid to participate in the inversion. This process ensured that the data quality threshold exceeded 0.5. TROPOMI data were gridded using the HARP toolkit of the Coordinated Toolkit for Scientific Earth Observation Data, which facilitated the amalgamation of daily global observations and their alignment to the same spatial resolution as the simulated concentrations. We synchronized the concentration values for each grid of the simulated concentrations with the moment of TROPOMI transit to ensure spatial and temporal coherence between the two datasets.
In this study, we quantified relative changes in TROPOMI NO2 VCDs between the wartime period in 2022 and full year of 2023 and the corresponding periods in pre-war baseline (mean of 2019 and 2021; excluding 2020 due to COVID-19 anomalies, same thereafter) (Fig. 1). Results demonstrate that satellite NO2 VCDs effectively capture spatiotemporal variability of air pollution during the war, though their representation of ground-level emissions remains limited given their tropospheric column nature.
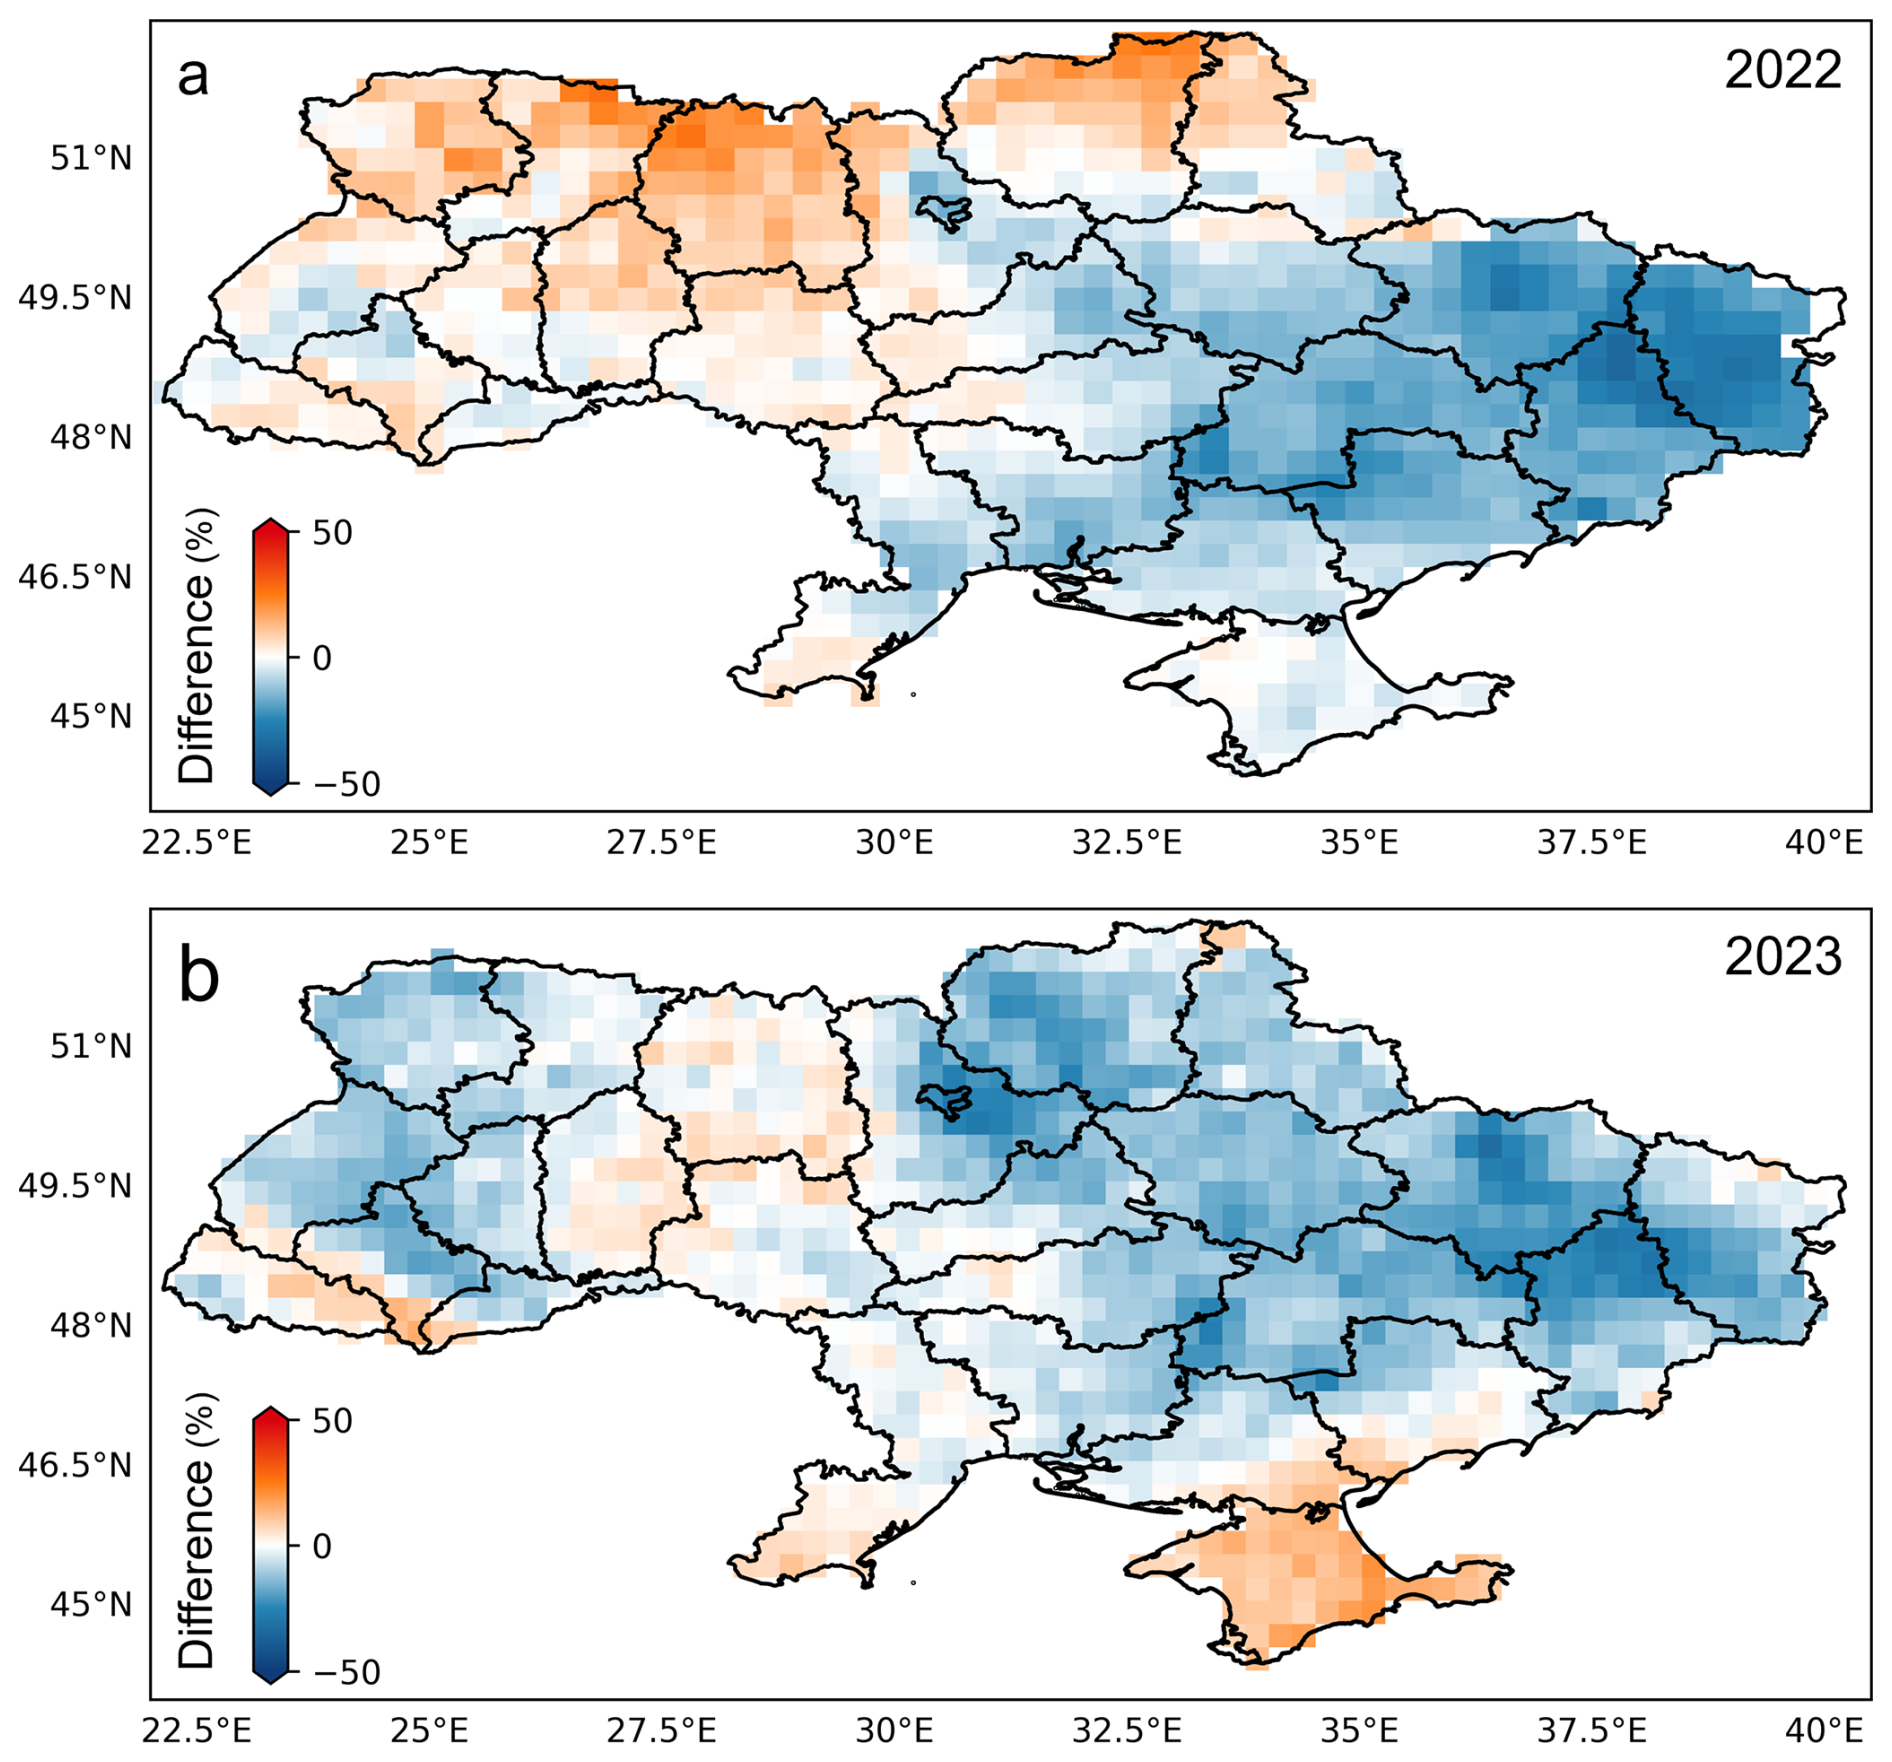
Figure 1The Spatial changes in satellite-observed NO2 VCDs are illustrated (a) during the war (March to December) in 2022 and (b) in 2023 relative to the corresponding periods of baseline (average of 2019 and 2021).
Furthermore, when using TROPOMI NO2 VCD as observational constraints for inversion, the quality of satellite observations directly impacts the inversion accuracy. In Ukraine, the lack of sufficient valid pixels severely hampers the reliability of daily inversions. We applied a multi-day moving average window to constrain the daily simulated concentrations to address this limitation. The effectiveness of this approach has been demonstrated in previous studies (e.g., Zheng et al., 2020). We evaluated the number of valid TROPOMI observation pixels over Ukraine using different moving average window lengths during the study period (Fig. S1a in the Supplement). When the window size reached 7 d, the data loss significantly decreased, and the proportion of valid grid cells exceeded 90 %. However, applying a multi-day average may suppress short-term fluctuations in NO2 concentrations, potentially limiting the ability to capture rapid changes associated with wartime dynamics. We compared the NO2 VCDs over Ukraine using 7 and 11 d moving averages (Fig. S1b). The results showed no substantial difference between the two, but the 11 d average tended to smooth out peak concentrations more strongly. Based on this assessment, we adopted the 7 d moving average of TROPOMI NO2 VCDs to constrain the model simulations in this study.
2.4 Inversion method
In the previous study, we developed a two-step inversion framework for estimating global anthropogenic NOx emissions (Mao et al., 2024). In this study, we optimized this framework by incorporating the treatment of NOx emissions from natural sources and used them to invert daily anthropogenic NOx emissions in Ukraine from 2019 to 2023. This inversion framework is based on the FDMB method and draws on the framework developed by Zheng et al. (2020), which optimizes the prior anthropogenic NOx emissions by fitting the simulated NO2 concentrations to satellite NO2 VCD observations and interannual variability.
We output hourly NO2 concentrations from the GEOS-Chem model and sampled the values corresponding to the satellite overpass times. Using pressure of each model layer, we vertically regridded the model output to match the vertical resolution of the TROPOMI satellite. Following the recommendations in the TROPOMI User Manual (van Geffen et al., 2019), based on the vertical level of the tropopause provided in the satellite product and the tropospheric averaging kernel, we integrated the tropospheric NO2 profiles to calculate the simulated NO2 VCD for each model grid cell.
The FDMB method optimizes NOx emissions by coupling simulated atmospheric NO2 VCD driven by prior emission inventories, with satellite observations through a specific scaling factor. This scaling factor is derived by comparing simulated NO2 VCDs under identical meteorological conditions using prior and reduced-emission scenarios within the CTM framework. It quantifies the sensitivity of NO2 VCDs to NOx emission perturbations and establishes a localized relationship between the two. This enables the transformation of discrepancies between satellite-retrieved and model-simulated NO2 VCDs into estimates of errors in the prior emissions.
In this study, for the simulation in 2019–2022, we used the “bottom-up” EDGAR NOx emission inventory as the prior emissions and simulated both the prior and 40 % emission reduced NO2 VCDs using the GEOS-Chem model. From this, we estimated the daily emission scaling factor β1 (Eq. 1):
where ΔΩ = Ωbase−Ωsens, with Ωbase being the prior simulated VCD and Ωsens the scaled simulation of VCD. Using the scaling factor β1, we constrained the prior emission in 2019–2022 (Eprior) using TROPOMI observations to obtain the posterior NOx emissions (Epost) (Eq. 2):
where ΔΩbias = represents the relative bias between the prior VCD simulations and satellite VCD observations. Due to the reduced TROPOMI observation coverage on specific days, as discussed in Sect. 2.3, we employed 7 d moving averages of satellite NO2 observations for comparison with daily simulated VCDs in this study. Specifically, for each day during the study period, the simulated NO2 VCDs were constrained using the quality-filtered TROPOMI NO2 VCD observations. This approach has been demonstrated to be effective by Zheng et al. (2020).
For the inversion of 2023, which is not covered by the prior inventory, we applied the previously developed two-step inversion framework. We used the 2022 prior emission inventory, combined with 2023 meteorological fields and natural source emissions, to simulate the prior NO2 VCDs for 2023 (Ωsimu,2023) using the GEOS-Chem model. This setup implies that the interannual variation in simulated NO2 concentrations is primarily driven by non-anthropogenic factors (Zheng et al., 2020). Since the variations in satellite-observed NO2 VCD represent the total changes, we calculated the interannual changes in NO2 VCD caused by anthropogenic NOx emissions (ΔΩannu) (Eq. 3) and converted these changes into interannual variations in anthropogenic NOx emissions using scaling factor of 2022, β2022. This allowed us to extend the 2022 prior inventory to 2023 (Eprior,2023) (Eq. 4).
where Ωsate,2023 and Ωsate,2022 are the satellite-observed NO2 VCDs in 2023 and 2022. The inherent uncertainties in the prior inventory were not optimized and may propagate into the emission inventory for 2023. As a result, we repeated the inversion process for 2019–2022 and simulated two scenarios for the 2023 NO2 VCDs. With Eq. (2), we obtained the posterior daily anthropogenic NOx emissions in 2023.
For sectoral emissions, we allocated grid-level totals based on the sectoral distribution ratios provided in the EDGAR inventory. For the year 2023, due to the absence of updated sector-specific data, we assumed that the sectoral proportions in 2022 remained unchanged and applied them to the 2023 total emissions.
In this study, a key advancement of our framework is the explicit decoupling of natural and anthropogenic sources. Unlike conventional approaches that fix natural emissions as static inputs, we simulated scenarios with a 40 % curtailment of emissions with the same percentage of curtailment of natural source emissions and applied the same inversion constraints to both source categories during inversion, ensuring unbiased attribution of observed NO2 changes. Subsequently, its prior inventory scaling was used to differentiate NOx emissions from natural and anthropogenic sources, effectively reducing crosstalk between natural variability and anthropogenic signals.
2.5 Uncertainty
To quantify the uncertainty remaining in the inversion system, we conducted an observing system simulation experiment (OSSE) (Atlas, 1997). In the OSSE, we used the EDGAR emissions in 2022 as the prior, assuming that the true emissions in 2022 were 0.5 times the prior, and the true emissions in 2023 were 1.25 times the true values in 2022. The assumed true emissions for 2022 were informed by the average uncertainty of NOx emissions over the European Union as reported by the EDGAR inventory, which is approximately 51.7 % (Crippa et al., 2018). The assumed true emissions for 2023 were guided by the interannual variability of TROPOMI NO2 VCDs, which showed that monthly NO2 concentrations in 2023 differed from those in 2022 by more than 25 % in certain months. The pseudo-true values were simulated using the GEOS-Chem model and processed into the same grid distribution as the TROPOMI observations described in Sect. 2.3, serving as pseudo-observations. These pseudo-observations were then used to constrain the prior emissions in the inversion framework, allowing us to quantify the reduction in prior bias achievable by the inversion system. For comparison, we also applied the same pseudo-observations to constrain the inversion framework from our previous study (Mao et al., 2024) to evaluate the impact of including natural source emissions on the accuracy of anthropogenic NOx emissions. Another major source of uncertainty in our results is the uncertainty in the satellite observations. The specified random uncertainty for individual TROPOMI tropospheric NO2 VCD measurements is between 25 % and 50 %, with a precision of 0.7 × 10¹⁵ molec. cm−2 (Malytska et al., 2024). And TROPOMI NO2 observations provide precision estimates for each grid.
In our results, we converted the precision range of NO2 VCD observations for each grid into a corresponding precision range for the anthropogenic NOx emission constraints using the conversion factor β. We then summed the remaining uncertainty for each grid, as computed in the OSSE, to determine the uncertainty range in the inversion results.
2.6 Evaluation of the inverted anthropogenic NOx emissions
Validating the accuracy of the inverted anthropogenic NOx emissions is challenging due to the limited availability of independent anthropogenic NOx emission inventories and surface observations specifically for Ukraine. To assess the robustness and reliability of the inversion results, we used a multi-pronged approach. First, we performed simulations for both prior and posterior tropospheric NO2 VCDs using the GEOS-Chem model, which accounts for atmospheric chemistry and transport processes. These simulated concentrations were then compared to the TROPOMI satellite-observed NO2 VCDs. This comparison allowed us to assess the temporal and spatial consistency of the inversion framework against high-resolution satellite observations.
Additionally, as the scope of our inversion extended over the European land area, we leveraged independent in-situ observations of surface NO2 concentrations from the European Environment Agency (EEA, 2025). These ground-based observations served as a critical reference to validate the simulated surface concentrations corresponding to the posterior NOx emissions. Specifically, we compared the simulated surface NO2 concentrations with the time series of in-situ measurements for multiple stations across Europe, facilitating an evaluation of how well the prior and posterior simulations captured the observed NO2 variability. To quantify the accuracy of these simulations, we performed a linear regression analysis by comparing the time-averaged surface concentrations from the modeled grid cells with the in-situ measurements. We then evaluated the fitting accuracy by examining the R2 values and root mean square errors (RMSE) between the simulated and observed concentrations.
Moreover, to assess the temporal stability and robustness of the inversion framework, we compared the interannual variations in the relative deviations between the posterior results and both satellite and ground-based observations. By examining how the relative biases evolved over time, we were able to ensure that the posterior emissions remained consistent with observational trends.
3.1 National decline
To ascertain the impact of the Russia–Ukraine war on anthropogenic NOx emissions in Ukraine, we compared the temporal variations in anthropogenic NOx emissions during the war with the pre-war level (baseline emissions). We derived baseline emissions by averaging the emissions in 2019 and 2021, excluding 2020 owing to the influence of the COVID-19 pandemic. Figure 2 depicts the seasonal variations in NOx emissions in 2022 and 2023 and their changes relative to the baseline. In 2022, Ukraine exhibited a 12 % (±2.1 %) reduction in NOx emissions compared with the baseline, and the reduction during the war period (starting on 24 February) was 15 % (±2.7 %). The first sharp decline of 25 % (±4.6 %) occurred in March, coinciding with the start of the full-scale Russian invasion in late February 2022, indicating a significant short-term societal disruption. Subsequently, the rate of decline in emissions slowed, stabilizing at approximately 7 % (±1.2 %) from June to August. This stabilization was due to the stalemate of the war in eastern regions of Ukraine, which suggests a rapid societal adaptation within a month of the war's outbreak, with partial restoration of social functions. After September, the NOx emissions showed a new round of decline of 23.8 % (±4.3 %), reaching a peak decline of 30.5 % (±5.5 %) in December. This was primarily due to the increased energy demand in the baseline years and intensified energy shortages in 2022 during the cold season. Notably, although we cannot precisely quantify the contribution of population displacement to emission reductions, the continued outflow of residents due to the ongoing impacts of the war likely contributed to the enhanced decrease in wintertime NOx emissions.
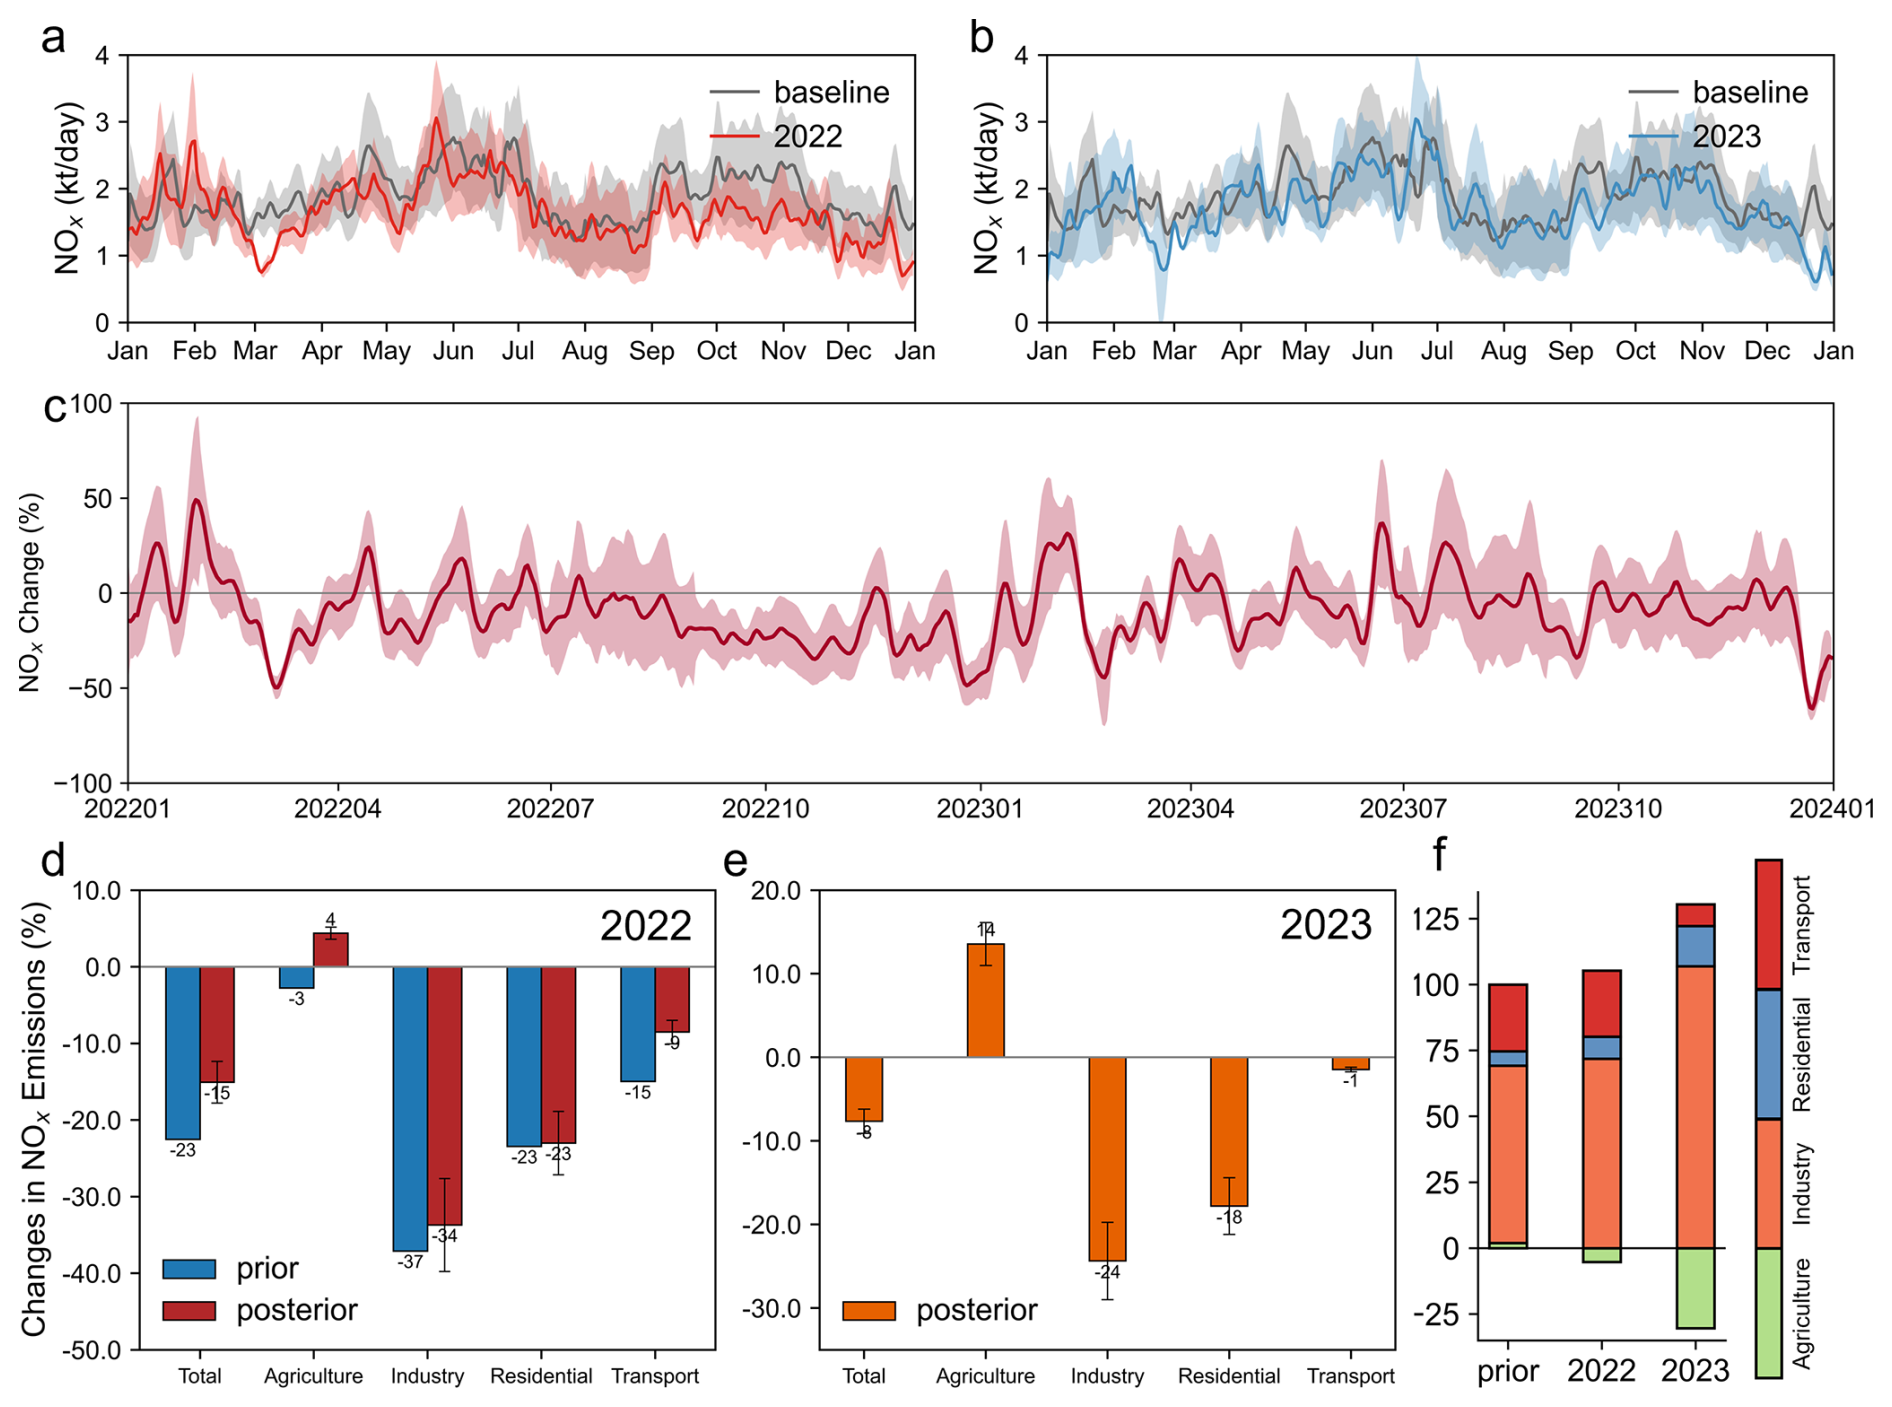
Figure 2Changes in anthropogenic NOx emissions in Ukraine during 2022 and 2023 and their deviations from the baseline period. (a) Daily anthropogenic NOx emissions in 2022 (red) and the baseline period (black). (b) Daily anthropogenic NOx emissions in 2023 (blue) and the baseline period (blue). (c) Relative differences in daily emissions in 2022 and 2023 compared to the corresponding days in the baseline period. (d) Sectoral contributions of prior (blue) and posterior (red) emissions in 2022 relative to the baseline. (e) Sectoral contributions of posterior emissions in 2023 (orange) relative to the baseline. (f) Contribution of each sector to the total reduction in emissions in 2022 (prior and posterior) and 2023, compared with the baseline year.
In 2023, anthropogenic NOx emissions in Ukraine declined by 7.6 % (±1.4 %) relative to the baseline (Fig. 2b, c, e). The most pronounced reductions were observed in February, April, September, and December. Notably, unlike the sustained emission decline throughout 2022, 2023 exhibited intermittent increases, with higher emissions than the baseline observed in March and from May to July. From a seasonal perspective, persistent energy shortages during the cold season remained a critical constraint in early spring (before March) and late autumn (after September), contributing to continued emission reductions during these periods.
We examined the reductions in anthropogenic NOx emissions across different sectors following the outbreak of war in 2022 based on both the prior and posterior estimates, as well as the sectoral changes in 2023 derived from the inversion (Fig. 2d, e), and the contribution of each sector to the total emission reduction (Fig. 2f). The inversion indicates that the industrial sector experienced the most significant impact from the war. Compared to the baseline, industrial emissions declined by 34 % (±6.1 %) in 2022 and by 24 % (±4.4 %) in 2023, accounting for 72 % and 106 % of the total annual reductions, respectively. These declines are comparable to those estimated from the prior inventory for 2022 and can largely be attributed to the heavy fighting and infrastructure disruption in the eastern industrial regions of Ukraine. Residential emissions also showed substantial reductions of 23 % (±4.1 %) in 2022 and 18 % (±3.5 %) in 2023. Despite contributing less to the total reduction due to their relatively smaller share of emissions, the residential sector was the only sector in 2023 that did not exhibit a notable alleviation in its reduction rate. This persistence is likely associated with the population loss. The transport sector was a significant contributor to land-based anthropogenic NOx emissions in Ukraine, but the observed decline was not as pronounced as that observed in the residential and industrial sectors. The reduction in transport emissions may have been partially offset by increased emissions from population displacement and logistical movements. Moreover, compared to the prior inventory, the inversion suggests a smaller reduction in transport emissions in 2022. This discrepancy could be due to the underestimation of military and emergency transport activities in energy-based inventories. In contrast to the prior inventory, which suggests a 3 % decline in agricultural emissions in 2022, the inversion results indicate a 4 % (±0.7 %) increase in 2022 and a more pronounced 15 % (±2.7 %) increase in 2023. This discrepancy likely arises from the limitations of statistical data used in the prior inventory, which may have underestimated additional NOx emissions from traditional farming practices and irregular land management under war conditions. The inversion results also suggest that the increase in agricultural emissions may partly reflect an overestimation of emissions in the central and western regions due to the assumption of fixed sectoral emission allocation.
We compared the seasonal variations in sectoral emissions during the war period with those of the baseline (Fig. S2). Emissions across all sectors exhibited increased or comparatively smaller decline during the summer months. In 2022, the industrial emissions exhibited a notable decline of 38 % (±6.8 %) in March, followed by a relatively stable period. A significant 17 % (±3.1 %) decline was observed in emissions from the residential sector during the first three months of the war. Furthermore, a further decline in emissions occurred during the winter months owing to energy shortages. The transportation sector demonstrated notable responsiveness to increased transportation demand during the war, with a 24 % (±4.3 %) decline in emissions observed in March, followed by a slight rebound. Owing to military transport activities, humanitarian logistics, and evacuation-related movement, the transport emissions were smaller than others in 8 % (±1.4 %). During the summer of 2023, agricultural emissions were approximately 6 % higher than in 2022, indicating a gradual economic recovery in the central and western agricultural regions of Ukraine one year after the outbreak of the war. In contrast, the industrial sector exhibited substantial fluctuations in its emission reductions in 2023, likely reflecting repeated military operations in the eastern conflict zones. Transport-related NOx emissions increased by 4.3 % compared to 2022, indicating a gradual recovery in domestic mobility.
3.2 Decline in different regions
We examined the spatial distribution of total emissions (Fig. 3a, b) and daily NOx emissions (Figs. S3–S4) during the war relative to the baseline. Most regions of Ukraine exhibited a reduction in NOx emissions of approximately 15 % (Fig. 3a) during the war in 2022. This reduction was more pronounced in eastern regions of Ukraine than in the central and western regions. A slight increase in emission was observed in parts of the Zhytomyr, Rivne, and Sumy oblasts (Fig. 3a). Increases in the NO2 VCDs in these regions were also observed by the TROPOMI satellite (Fig. 1a), which were mainly from the agricultural and transportation sectors (Fig. S5), possibly because these regions are located far away from the front of the war around the Ukrainian capital and Eastern Ukraine where a larger population has gathered. After April 2022, the primary theater of the Russia–Ukraine war was concentrated in the eastern oblasts bordering Russia. The central and western regions exhibited a weaker impact than the eastern regions. In terms of the spatial distribution of sectoral variations (Fig. S5), the most pronounced decline in agricultural emissions was observed in eastern and southern Ukraine. This may be attributed to the region's importance as a winter wheat-producing area (Lin et al., 2023) and the disruption of cultivation caused by the Russian army's control, which caused a reduction in fertilizer application and agricultural NOx emissions. Spatially, industrial emissions exhibited a notable decline throughout Ukraine, particularly in Luhansk Oblast. The war has had and continues to have direct and indirect impacts on industrial production across Ukraine, with the most pronounced damage observed in conflict zones. The outbreak of the war during this period led to widespread destruction of residential infrastructure and the mass displacement of civilians. Large numbers of refugees relocated to central and Western Ukraine or fled abroad, resulting in a sharp decline in residential NOx emissions. NOx emissions in Crimea showed a slight decrease in the western region and a modest increase in the east, primarily due to the concentration of Russian military logistics and air force operations in the eastern part of the peninsula. In 2023, NOx emissions in central and Western Ukraine increased compared to the baseline, while emissions in the eastern regions remained suppressed due to ongoing localized conflict (Fig. 3b). Emissions increased further across the Crimea in 2023, reflecting the growing role as a long-term base for Russian troop deployment and logistical support. Sectoral analysis reveals varying degrees of recovery in agriculture, industry, and transportation across central and Western Ukraine. In contrast, residential emissions in 2023 remained at levels comparable to those in 2022, consistent with the national trend. These findings suggest that while efforts to reestablish agricultural and industrial activity have taken hold in the rear regions of the battlefield, residential activity has yet to recover, likely due to continued population displacement.
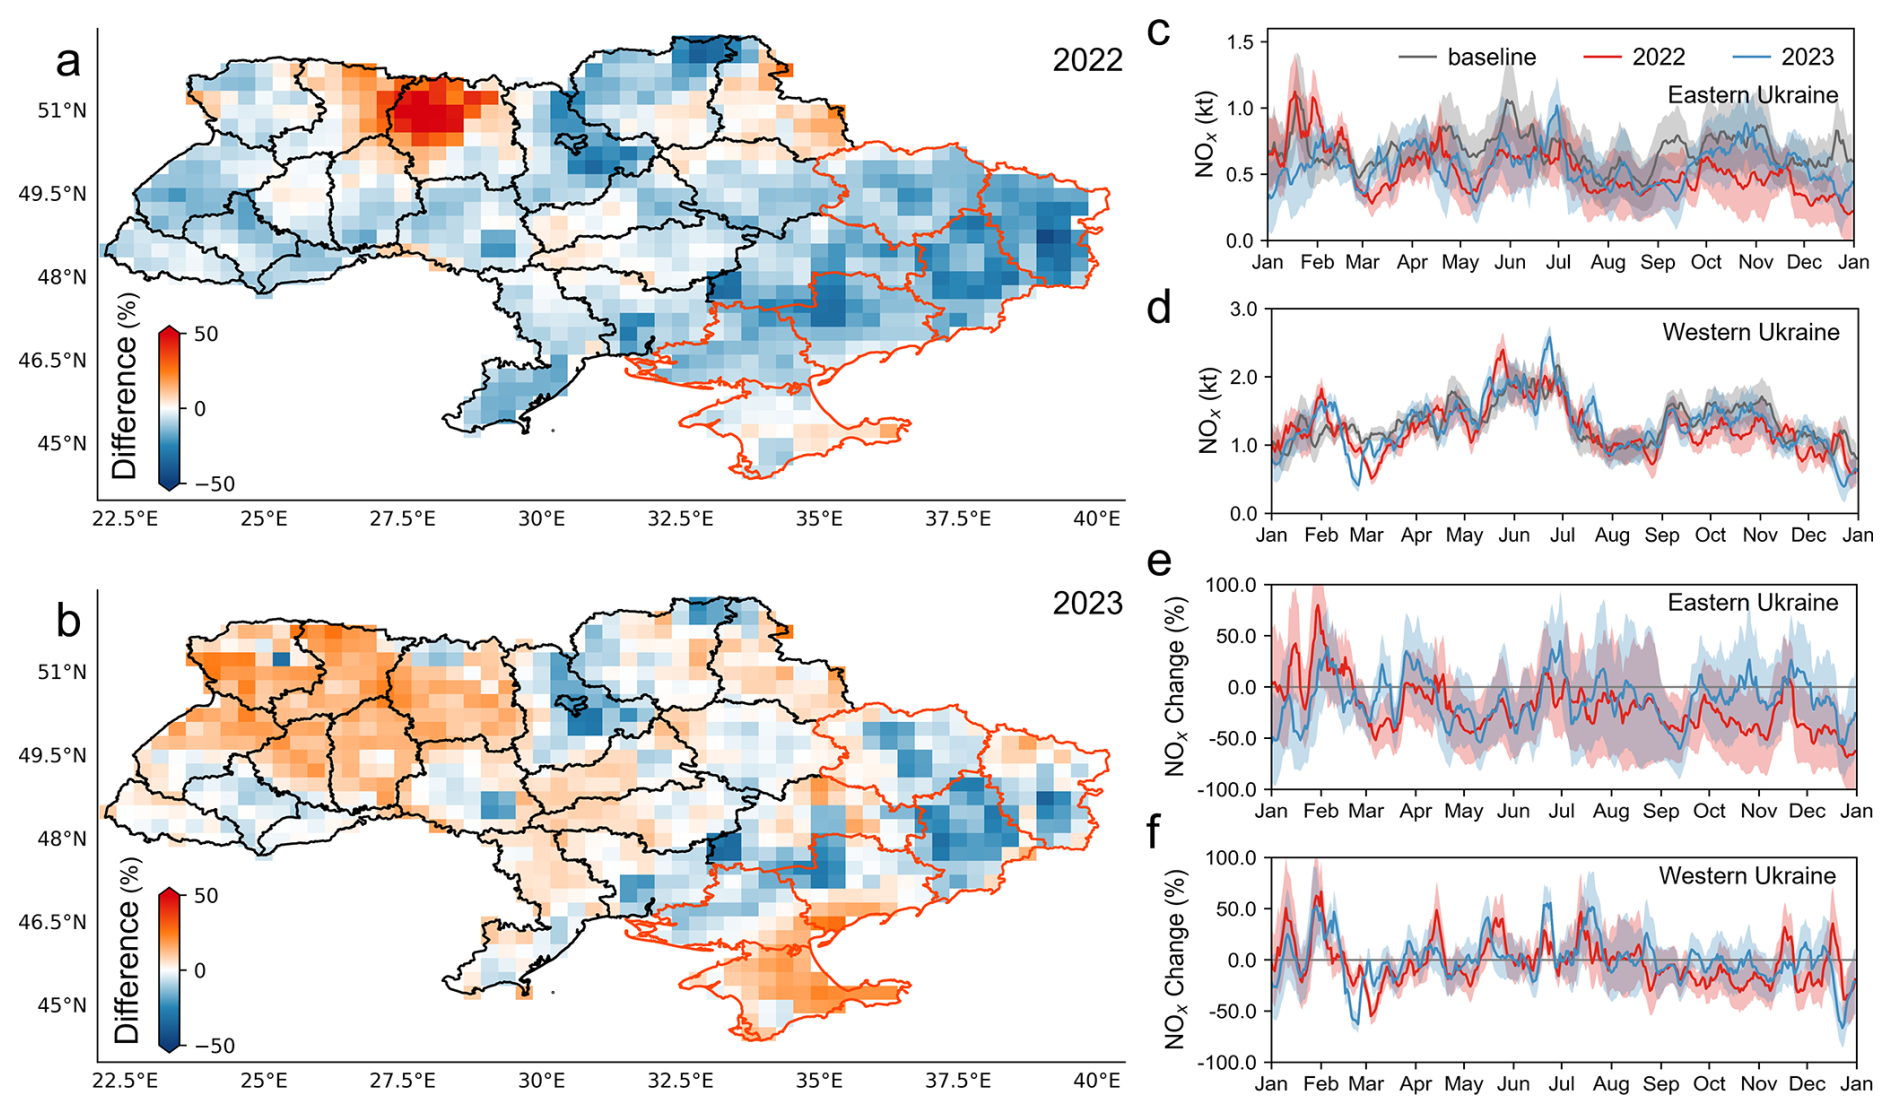
Figure 3NOx emissions changes in different regions. (a–b) Spatial distributions of NOx emissions changes in Ukraine during war in (a) 2022 and (b) 2023 relative to the baseline. Eastern Ukraine is marked with red lines, and Western Ukraine is in black. (c–d) Daily NOx emissions in 2022, 2023 and the baseline years in (c) Eastern Ukraine and (d) Western Ukraine. (e–f) Relative changes in daily NOx emissions in 2022 and 2023 relative to the baseline in, (e) Eastern Ukraine, and (f) Western Ukraine.
To assess the geographical difference in NOx emissions during the war in Ukraine, we categorized Ukraine into Eastern Ukraine and Western Ukraine based on the scope of the war (Fig. 3a, b). Subsequently, we calculated the seasonal fluctuations in anthropogenic NOx emissions in comparison with the baseline for different regions (Fig. 3c–f). During the 2022 wartime period, anthropogenic NOx emissions in Eastern and Western Ukraine decreased by 28.8 % (±5.2 %) and 8.4 % (±1.5 %), respectively. Both the Eastern and Western Ukraine's emissions exhibited a notable decline in March, with reductions of 30.9 % (±5.6 %) and 25.8 % (±4.6 %), respectively, caused by a large-scale attack that began in late February 2022. Subsequently, Western Ukraine emissions exhibited a gradual recovery from April to August, whereas Eastern Ukraine emissions remained low in the subsequent months, reaching their lowest (32 ± 5.9 %) in May. This discrepancy may be attributed to the initial direct impact of the war on the Western Ukraine in March, which resulted in a rapid decline in emissions. The Eastern Ukraine, with its smaller population and dominant industrial sector, did not minimize emissions in the first month. However, as the war continued, emissions continued to decline due to population loss, energy shortages, and infrastructure damage. In both regions, the decline in emissions intensified concurrently after November, likely because of the inability of energy shortages to meet increased demand during the winter months.
In 2023, anthropogenic NOx emissions in Ukraine also exhibited a marked spatial divergence between the eastern and western regions. The Eastern Ukraine experienced a sustained emission decline of 17.0 % (±3.1 %) compared to the baseline, largely attributed to industrial inactivity under Russian control, destruction of power infrastructure, and ongoing population displacement. In contrast, emissions in the Western Ukraine declined by only 2.9 % (±0.5 %), reflecting greater resilience due to the westward relocation of industry, influx of international assistance, and support from adaptive agricultural practices. Seasonal trends reveal that eastern emissions reached their lowest points in January (−35.8 ± 6.4 %) due to exacerbated energy shortages, in April (−16.2 ± 2.9 %) during intensified military offensives, and in September (−31.7 ± 5.7 %) following a second collapse of the power grid. The smallest reduction (11.9 ± 2.1 %) was observed in June, likely driven by intensified military activity during Ukraine's counteroffensive. In the west, the most substantial reduction occurred in February (10.0 ± 1.8 %) and December (22.9 ± 4.1 %), primarily due to gas supply disruptions by Russia and regional power grid failures. Emissions in other months remained comparable to or slightly above the baseline.
3.3 Comparison With the COVID-19 Pandemic
To provide a more comprehensive representation of the impact of the war in Ukraine, we further analyzed changes in NOx emissions during the 2020 COVID-19 pandemic. NOx emissions in Ukraine during the pandemic (May–December) in 2020 decreased by 3.9 % (±0.6 %) compared with those in the baseline year. After decreasing by 8.5 % (±1.5 %) for the first time in May, NOx emissions in Ukraine in 2020 returned to levels comparable to the baseline, with a decline of only 2 % (±0.4 %) (Fig. S6). During the pandemic, the main declining sectors were agriculture (−0.8 ± 0.1 %) and transportation (−2.6 ± 0.5 %). The changes in anthropogenic NOx emissions during the pandemic are detailed in Sect. S1 of the Supplement.
The decline in NOx emissions owing to the war substantially exceeded the impact of the pandemic. Throughout most months after May 2020, NOx emission levels remained comparable to the baseline year, which were less reduction pronounced than those observed in 2022. The emission decline was primarily concentrated in the transport sector, fundamentally driven by mobility restrictions imposed under lockdown measures. This comparison highlights the more profound and enduring impact of the war on Ukraine compared to the pandemic. The pandemic slowed national human activity without causing far-reaching damage.
Our study inverts changes in anthropogenic NOx emissions during the Russia-Ukraine war in 2022 and 2023 based on satellite observations. We explore the capacity of satellite-based NOx emission inventories to monitor economic production activities within Ukraine-affected regions amid the backdrop of frequent localized conflicts.
4.1 Evaluation
We conducted a comprehensive validation to ensure the reliability of the inverted NOx emissions in Ukraine. Compared with the satellite-observations, the accuracy of NO2 VCDs simulated using posterior emissions significantly improved, with the RMSE of the prior and posterior simulated NO2 VCDs being 0.57 and 0.40 Pmolec. cm−2, respectively (Fig. S7). The posterior emissions more accurately reflect the seasonal fluctuations in NO2 VCDs in Ukraine (Fig. S8). Prior simulated NO2 VCDs exhibited an underestimation of 11.6 % at the national level, with the greatest discrepancy observed in the southwest and northeast regions. Furthermore, we used surface in situ observations over Europe to assess the accuracy of the simulated NO2 concentrations with prior and posterior emissions. The simulated concentrations with posterior emissions exhibited higher R2 and lower RMSE values at most sites across Europe (Fig. S9a, b). Furthermore, the simulated values of a posteriori emissions exhibited greater accuracy in fitting between sites than the prior emissions (Fig. S9c).
Despite the improvement over the prior inventory, some discrepancies between the posterior simulations and both satellite and surface in situ observations remain. To assess the impact of these discrepancies on the interannual variability of the results, we calculated the relative deviation between the simulated and observed values across different years and computed the seasonal variations in the relative deviations on a daily (with satellite) or monthly (with surface in situ) basis (Fig. S10). The results indicate that large fluctuations in the relative deviation were occurred from January to March, with deviations stabilizing within ±30 % for the remaining months. The annual relative differences were stable at 1.4 %–4.2 %. In contrast, when comparing with surface in situ observations, the relative deviations were concentrated between −40 % and −70 %. Although these results did not exhibit the same seasonal fluctuations observed in the satellite comparison, they demonstrated lower overall variability compared to the satellite observations. Given that the relative deviations between the posterior simulated concentrations and satellite observations remained within a consistent range across different years, we can conclude that the inverted NOx emission changes maintain high consistency across the years.
4.2 Comparison with other results
According to the World Bank's Ukraine Rapid Damage and Needs Assessment (The World Bank, 2023), Ukraine's GDP declined by 29.2 % in 2022 and 26 % in 2023. This drop is consistent with the 23 % reduction in anthropogenic NOx emissions estimated by the bottom-up EDGAR inventory (prior emissions) but significantly exceeds the 15 % and 8 % decrease in 2022 and 2023 inferred from TROPOMI observations in this study. Further analysis using the data from State Statistics Service of Ukraine (SSSU, 2025) reveals that oil and natural gas consumption in Ukraine decreased by 15 % and 34 % in 2022, and by 13 % and 32 % in 2023, respectively (Table 1). Given that oil consumption is primarily associated with the transportation sector and natural gas consumption predominantly reflects residential activities, the observed reductions in oil consumption align well with the bottom-up estimates for transport emissions but are larger than the corresponding decreases captured by our satellite-based inversion. In contrast, the decline in natural gas use far exceeds the reduction in total anthropogenic NOx emissions from both approaches. Agricultural GDP dropped by 5 % in 2022 and increased by 5 % in 2023, while satellite-derived emissions indicate a stronger recovery in agricultural NOx emissions. For the industrial sector, the Industrial Production Index (IPI) declined by 38 % in 2022 and 33 % in 2023, which is largely consistent with the emission reductions inferred from our inversion framework.
Table 1Comparison for the relative changes in 2022 and 2023 between the inverted NOx emissions and the prior emissions, the GCP CO2 emissions and the statistics from State Statistics Service of Ukraine (SSSU).
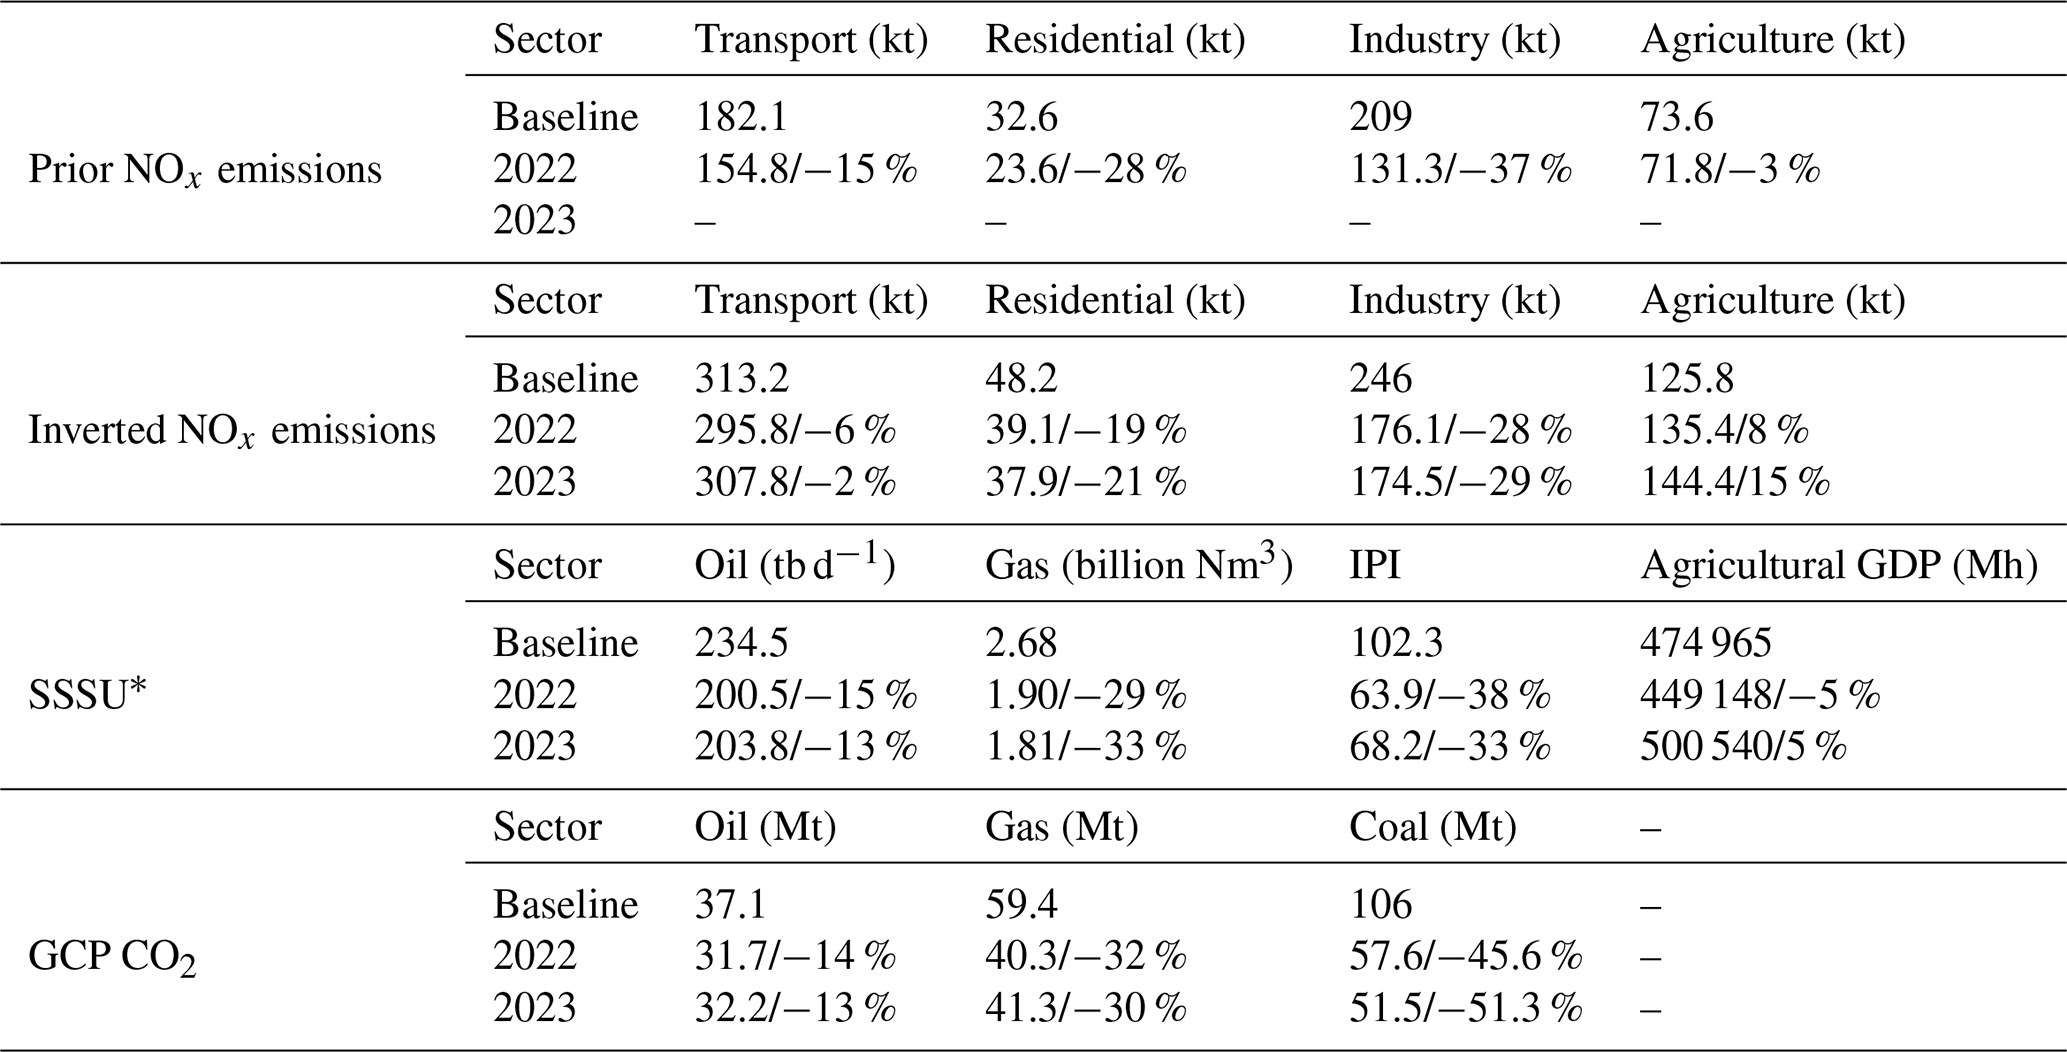
* Oil data of SSSU in 1000 barrels per day (tb d−1), Gas data of SSSU in billion Nm3, IPI calculated using 2016 as 100. Agricultural GDP in Ukraine in Millions of Ukrainian hryvnias.
In addition, we compared the changes in anthropogenic NOx emissions with fossil fuel CO2 emissions reported by the Global Carbon Project (GCP) (Friedlingstein et al., 2023; Jones et al., 2021) (Table 1). The GCP inventory attributes CO2 emissions by fuel type. Consistent with previous assumptions, we considered oil and natural gas to primarily reflect emissions from the transport and residential sectors, respectively, while coal combustion is assumed to dominate industrial emissions. The results show that GCP-reported emissions from oil, natural gas, and coal declined by 14 %, 32 %, and 46 % in 2022, and by 13 %, 30.4 %, and 51.3 % in 2023, respectively. The reductions in oil and gas-related CO2 emissions are consistent with national energy consumption statistics, reflecting the common bottom-up data sources used in both GCP and national energy reporting. However, the decline in coal-related emissions reported by GCP is substantially larger than that indicated by both the inversion-derived NOx emissions and energy statistics. This discrepancy may be attributed to a reduction in coal utilization efficiency or structural changes in industrial energy use during the war period.
The closer alignment between energy statistics and the bottom-up EDGAR and GCP inventory is expected, as EDGAR and GCP rely directly on national statistical reports for activity data, resulting in high consistency with macroeconomic trends. In contrast, the satellite-based inversion incorporates spatial heterogeneity and seasonal variability, enabling pixel-level adjustments and rebalancing of sectoral contributions based on EDGAR's original distribution. This leads to systematic deviations in sector-level trends from national statistics. Additionally, discrepancies between the inversion results and energy statistics may stem from the satellite's ability to capture unconventional sources of NOx emissions during wartime – such as those from military vehicles and artillery. Moreover, widespread damage to conventional energy infrastructure (e.g., electrical grids) necessitated the use of temporary power generation (e.g., diesel generators), which is likely not reflected in official energy consumption reports (Wang et al., 2024). Therefore, under the extraordinary conditions of armed conflict, satellite-based inversions offer a valuable complement to traditional statistical assessments by capturing both conventional and conflict-induced NOx emissions.
4.3 War-related NOx emissions
As mentioned above, war itself may also lead to large amounts of NOx emissions, including military vehicles and artillery. Thus, we further discuss the war-related NOx emissions. We firstly applied Locally Estimated Scatterplot Smoothing (LOESS) and residual analysis to quantify the spatial heterogeneity of significant emission anomalies in the 2022 wartime period and 2023 (Fig. 4a, b). Significant emission anomalies were identified by calculating the cumulative significant residuals (exceeded three times the standard deviation) of daily grid-level emissions relative to the corresponding 30 d LOESS-smoothed values. The results indicate localized positive residual anomalies (red hotspots) were observed along conflict frontlines and logistical hubs, suggesting that military operations and emergency responses significantly elevated emissions in these areas. This is consistent with the severely damaged areas identified by Gupta and Shukla (2024) using NASA MODIS Fire Information for Resource Management System active fire detections. We retrieved daily anthropogenic NOx emissions alongside verified reports of military activity in Ukraine (2022–2023) from Figs. 2a–c, S3, and S4, Broadcasting Corporation (BBC, 2025) and Reuters (2025), and found strong correspondences between emission anomalies and key military events. In Kyiv and Kharkiv, emissions sharply declined following the outbreak of war on 24 February 2022, reaching minima during periods of civilian shutdown. Emissions rebounded during March as military logistics and emergency operations intensified. Kharkiv and Luhansk showed short-term positive anomalies during Ukrainian counteroffensives and Russian reinforcements, while Donetsk experienced sustained negative anomalies due to prolonged conflict and infrastructure damage. Crimea, as a logistical hub, showed persistent emission increases linked to military operations. These findings highlight the potential of high-frequency NOx emissions as a proxy for monitoring the intensity and evolution of wartime activities.
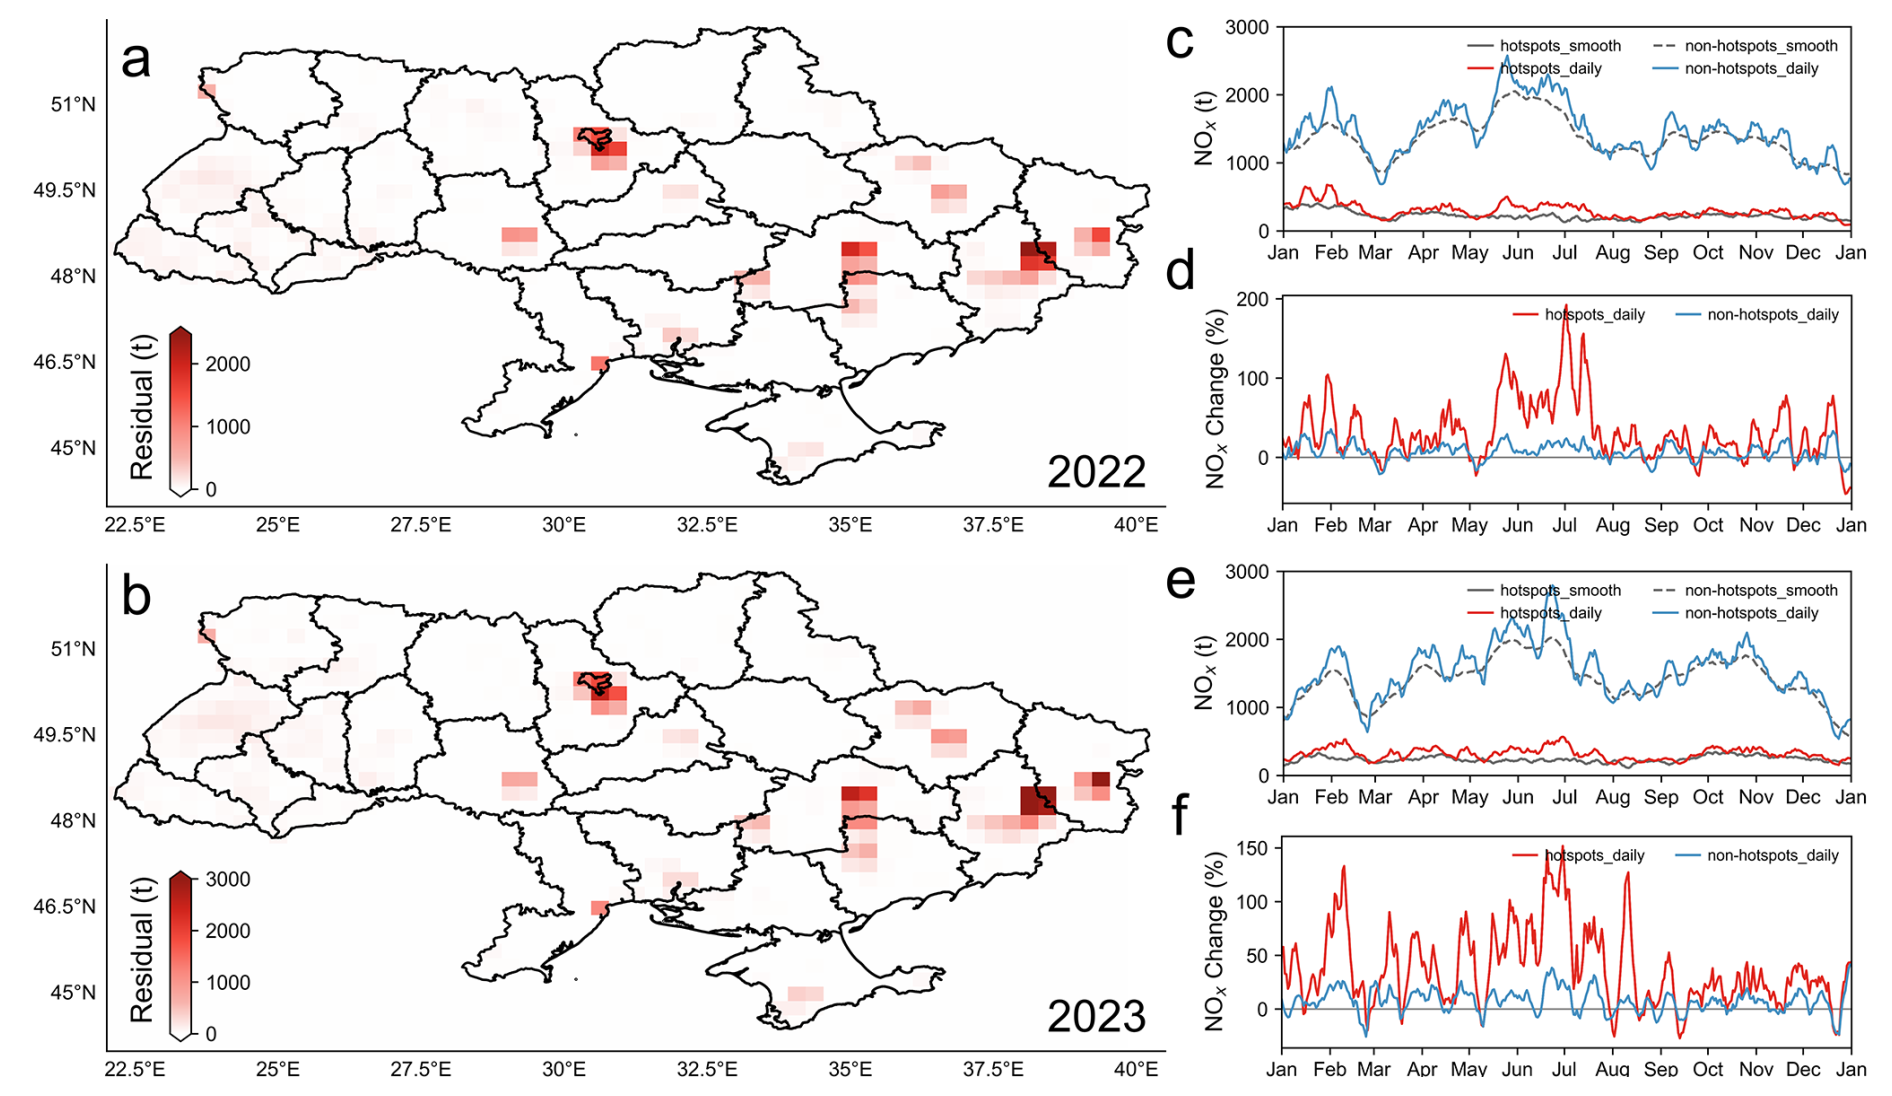
Figure 4Spatiotemporal distribution of significant daily anthropogenic NOx emission anomalies in Ukraine during the 2022 war period (after 24 February) and 2023. (a, b) Spatial distribution of daily cumulative significant emission anomalies relative to the LOESS-smoothed emissions in (a) 2022 and (b) 2023. (c, d) Seasonal variation of daily emissions and (c) LOESS-smoothed emissions, and (d) corresponding relative differences, for 2022 in war-affected hotspots (grid cells with daily anomalies > 3σ) and non-hotspot regions. (e, f) Same as (c, d), but for 2023.
The emission anomalies observed in the inversion results suggest that wartime activities made a non-negligible contribution to overall NOx emissions. By comparing daily emissions with their corresponding LOESS-smoothed values, we classified each day's spatial emissions into war-affected hotspots (grid cells with daily anomalies > 3σ) and non-hotspot regions. Results show that during the war periods of 2022 and 2023, the smoothed emissions in hotspot areas were 30.8 % and 35.6 % lower than the corresponding daily emissions, respectively. In contrast, differences in non-hotspot regions were only 6.7 % and 8.2 %. This indicates that smoothing effectively filtered out the high-frequency variability associated with military activities in hotspot areas. With this method, we further estimated the relative deviation of the smoothed emissions from the pre-war baseline, finding reductions of 23 % in 2022 and 18 % in 2023, which closely matching the emission decreases reported by the EDGAR inventory. This suggests that military-related activities offset approximately 8 % and 10 % of the overall emission reductions in 2022 and 2023, respectively, which partially explains the lower reductions in our inversion than those from bottom-up inventories and independent economic data. However, quantifying the exact compensatory effect of direct war emissions on emission reductions remains methodologically challenging. Because these sources are inherently episodic and spatially concentrated, complicating their separation from background variability in sectoral inventories. These findings highlight warfare as a distinct emission modulator that can temporarily reshape regional source profiles, though its aggregate contribution remains secondary to economy-wide suppression effects in determining net emission trajectories.
4.4 Uncertainty analysis
The inversion emissions increased by 39.9 % (±7.2 %) compared to the prior inventory, which is within the 50 % uncertainty range of EDGAR (Crippa et al., 2018). The primary sources of uncertainty in our inversion framework can be attributed to two main factors: the quality of satellite observations and the inherent limitations of the inversion process. To enhance data reliability, we utilized TROPOMI NO2 VCD observations processed using the more accurate processor versions. Despite this improvement, TROPOMI observations still substantially underestimate tropospheric NO2 levels (East et al., 2022). Based on the grid-level error distribution provided with the satellite product, we estimate that uncertainties of observations contribute an average of ±6.7 % uncertainty to the inversion results. In addition, the use of different product versions (i.e., v2.4.0, v2.5.0, and v2.6.0) across the study period may introduce further uncertainties. While these versions are largely consistent with each other and share the same retrieval algorithm framework, minor differences exist due to bug fixes and updates in quality assurance flagging in v2.5.0 and improvements in cloud pressure retrievals affecting air-mass factor calculations in v2.6.0 (Table S1). These differences may lead to small regional or temporal shifts in retrieved NO2 VCDs, potentially propagating into the inversion results.
Due to the fixed overpass time of TROPOMI at approximately 13:30 local time, the inversion is constrained to reflect emissions around this midday window, limiting its sensitivity to nocturnal emission variations. This temporal sampling introduces a limitation in capturing potential shifts in emission timing, particularly under wartime conditions. During the Russia–Ukraine war, especially in high-risk zones, there may have been a redistribution of human and industrial activities toward nighttime hours due to safety concerns, power rationing, or tactical considerations such as avoiding aerial detection. While such behavioral shifts could potentially increase nocturnal emissions, the current inversion system is unable to capture these changes due to the absence of nighttime satellite data. Thus, while our results provide a robust estimate of daytime anthropogenic NOx emissions, they may overestimate total emission changes if substantial nocturnal activity occurred. Future work integrating ground-based measurements, high-temporal-resolution modeling, or geostationary satellite data (e.g., the Tropospheric Emissions: Monitoring of Pollution, Sentinel-4) could help address this temporal limitation.
Further, the inversion framework itself introduces uncertainty, which stems from both the missing data of satellite, particularly during the winter months at high latitudes such as in Ukraine, and the process used to derive emissions, and we quantified this part of the uncertainty using the OSSE. The OSSE results show that the inversion framework effectively reduces the uncertainty in the prior and maintains high spatiotemporal consistency with the assumed true values (Fig. S11). The bias between the posterior emissions and the true values was 3.9 %, an 88.3 % reduction from the bias in the prior. Additionally, the posterior uncertainty without considering natural sources was 6.4 %, reducing the prior uncertainty by 80.8 %. Seasonally, by accounting for natural source emissions, the inversion uncertainty for anthropogenic NOx emissions decreased 2.5 % for the year-round, with the largest improvement observed from May to October when natural emissions are higher, with an average improvement of 51.4 %. However, the OSSE also revealed that despite the model's effectiveness in reducing prior error, 11.7 % of uncertainty remained. Thus, after combining the uncertainties from both sources, the total uncertainty in the reduction of emissions during the war period in the inversion results is estimated to be approximately 18.4 %. The uncertainties across different stages, sectors, and regions are provided in the results. In addition, the inversion was conducted at a spatial resolution of 0.25° × 0.3125°, which may smooth or omit localized emission signals, leading to potential biases in the estimated NOx emissions.
Our results indicate a notable reduction in NOx emissions during the war, highlighting the severe impact of the war on the Ukraine's socioeconomic activities. Sector-specific analysis revealed the most significant declines in the industrial and residential sectors. And the Eastern Ukraine experiencing more severe disruptions. Additionally, the energy shortages during winter exacerbated the decline in emissions, illustrating the compounded effects of infrastructure damage and resource scarcity. The stalemated war has led to substantial declines in Ukraine's energy and industrial production levels, causing significant damage to housing and transportation infrastructure. By capturing daily emission anomalies, NOx serves as an effective indicator of fluctuations in emissions caused by war-related destruction and military activities, providing a direct and timely metric for monitoring armed conflict dynamics. In comparison, the 2020 COVID-19 pandemic resulted in less severe and shorter-term reductions in NOx emissions, primarily affecting industry and transportation due to home quarantine policies. This reduction was temporary and primarily driven by public health measures that aimed to protect lives while allowing for a relatively quick economic rebound post-lockdown. Conversely, the destruction during the war of industrial capacity, residential areas, and transportation infrastructure, coupled with energy shortages, has not only disrupted current activities but has also compromised future development potential.
This study emphasizes the interconnectedness of environmental sustainability and socio-economic stability. Changes in NOx emissions can only partially quantify the economic impacts of the war, and the actual socioeconomic impacts of the war are likely to be far greater than estimates derived from satellite observations. While our analysis is only a snapshot of the impacts of war, the findings have far-reaching implications for further research and for informing post-war reconstruction planning, energy security strategies, and emission mitigation policies.
The TROPOMI NO2 VCDs data are available at https://www.temis.nl/ (last access: 8 September 2025). The full versions of the GEOS-Chem model and the driver data are available at https://doi.org/10.5281/zenodo.7254984 (The International GEOS-Chem User Community, 2022). Data of energy consumption and IPI are from the SSSU at https://www.ukrstat.gov.ua/ (last access: 28 July 2025). CO2 emissions of GCP (GCP-GridFEDv2023.1) are available at https://doi.org/10.5281/zenodo.8386803 (Jones et al., 2023). The inversion of anthropogenic NOx emissions in this paper are available at https://doi.org/10.5281/zenodo.16597564 (Mao, 2025). All relevant codes used in this study are available upon request from the corresponding author.
The supplement related to this article is available online at https://doi.org/10.5194/acp-25-14187-2025-supplement.
YM and FJ conceptualized the study. YM, HMW, and FJ developed the methodology. YM, SZF, and MWJ conducted the investigation. YM performed the visualization. WMJ and FJ supervised the project. The original draft was written by YM, and LYL, HKW, and WMJ contributed to the review.
The contact author has declared that none of the authors has any competing interests.
The authors remain neutral with respect to any political or military positions regarding the war in Ukraine. The descriptions and analyses presented in this paper are intended solely for scientific purposes. The maps included in this study may contain disputed territories; their depiction does not imply any judgment on the legal status of those areas.
Publisher's note: Copernicus Publications remains neutral with regard to jurisdictional claims made in the text, published maps, institutional affiliations, or any other geographical representation in this paper. While Copernicus Publications makes every effort to include appropriate place names, the final responsibility lies with the authors. Views expressed in the text are those of the authors and do not necessarily reflect the views of the publisher.
The authors gratefully acknowledge the ESA and the TROPOMI team for providing the TROPOMI NO2 data used in this study. The authors also acknowledge the High-Performance Computing Center of Nanjing University for performing the numerical calculations in this paper on its blade cluster system.
This work was supported by the National Key Research and Development Program of China (Grant No: 2023YFB3907404), the National Natural Science Foundation of China (Grant No: 42377102, 42305116), Fengyun Application Pioneering Project (Grant No: FY-APP-2022.0505), and the Research Funds for the Frontiers Science Center for Critical Earth Material Cycling, Nanjing University (Grant No: 090414380031).
This paper was edited by Jayanarayanan Kuttippurath and reviewed by three anonymous referees.
Adekoya, O. B., Oliyide, J. A., Yaya, O. O. S., and Al-Faryan, M. A. S.: Does oil connect differently with prominent assets during war Analysis of intra-day data during the Russia-Ukraine saga, Resour. Policy, 77, 102728, https://doi.org/10.1016/j.resourpol.2022.102728, 2022.
Atkinson, R.: Atmospheric chemistry of VOCs and NOx, Atmos. Environ., 34, 2063–2101, 2000.
Atlas, R.: Atmospheric observations and experiments to assess their usefulness in data assimilation, J. Meteorol. Soc. Japan, 75, 111–130, https://doi.org/10.2151/jmsj1965.75.1B_111, 1997.
Beirle, S., Boersma, K. F., Platt, U., Lawrence, M. G., and Wagner, T.: Megacity emissions and lifetimes of nitrogen oxides probed from space, Science, 333, 1737–1739, https://doi.org/10.1126/science.1207824, 2011.
Bilgen, S.: Structure and environmental impact of global energy consumption, Renew. Sustain. Energy Rev., 38, 890–902, https://doi.org/10.1016/j.rser.2014.07.004, 2014.
BBC: News: War in Ukraine, https://www.bbc.com/news/war-in-ukraine, last access: 4 September 2025.
Carriquiry, M., Dumortier, J., and Elobeid, A.: Trade scenarios compensating for halted wheat and maize exports from Russia and Ukraine increase carbon emissions without easing food insecurity, Nat. Food, 3, 847–850, https://doi.org/10.1038/s43016-022-00600-0, 2022.
Chai, L., Liu, A., Li, X., Guo, Z., He, W., Huang, J., Bai, T., and Liu, J.: Telecoupled impacts of the Russia–Ukraine war on global cropland expansion and biodiversity, Nat. Sustain., 7, 432–441, https://doi.org/10.1038/s41893-024-01292-z, 2024.
Chen, J., Lü, S., Zhang, Z., Zhao, X., Li, X., Ning, P., and Liu, M.: Environmentally friendly fertilizers: A review of materials used and their effects on the environment, Sci. Total Environ., 613–614, 829–839, https://doi.org/10.1016/j.scitotenv.2017.09.186, 2018.
Chen, S., Bouteska, A., Sharif, T., and Abedin, M. Z.: The Russia–Ukraine war and energy market volatility: A novel application of the volatility ratio in the context of natural gas, Resour. Policy, 85, 103792, https://doi.org/10.1016/j.resourpol.2023.103792, 2023.
Crippa, M., Guizzardi, D., Muntean, M., Schaaf, E., Dentener, F., van Aardenne, J. A., Monni, S., Doering, U., Olivier, J. G. J., Pagliari, V., and Janssens-Maenhout, G.: Gridded emissions of air pollutants for the period 1970–2012 within EDGAR v4.3.2, Earth Syst. Sci. Data, 10, 1987–2013, https://doi.org/10.5194/essd-10-1987-2018, 2018.
Crippa, M., Guizzardi, D., Pagani, F., Schiavina, M., Melchiorri, M., Pisoni, E., Graziosi, F., Muntean, M., Maes, J., Dijkstra, L., Van Damme, M., Clarisse, L., and Coheur, P.: Insights into the spatial distribution of global, national, and subnational greenhouse gas emissions in the Emissions Database for Global Atmospheric Research (EDGAR v8.0), Earth Syst. Sci. Data, 16, 2811–2830, https://doi.org/10.5194/essd-16-2811-2024, 2024.
Dando, B. D. E., Goertz-Allmann, B. P., Brissaud, Q., Köhler, A., Schweitzer, J., Kværna, T., and Liashchuk, A.: Identifying attacks in the Russia–Ukraine conflict using seismic array data, Nature, 621, 767–772, https://doi.org/10.1038/s41586-023-06416-7, 2023.
de Foy, B., Wilkins, J. L., Lu, Z., Streets, D. G., and Duncan, B. N.: Model evaluation of methods for estimating surface emissions and chemical lifetimes from satellite data, Atmos. Environ., 98, 66–77, https://doi.org/10.1016/j.atmosenv.2014.08.051, 2014.
Duncan, B. N., Yoshida, Y., De Foy, B., Lamsal, L. N., Streets, D. G., Lu, Z., Pickering, K. E., and Krotkov, N. A.: The observed response of Ozone Monitoring Instrument (OMI) NO2 columns to NOx emission controls on power plants in the United States: 2005–2011, Atmos. Environ., 81, 102–111, https://doi.org/10.1016/j.atmosenv.2013.08.068, 2013.
East, J. D., Henderson, B. H., Napelenok, S. L., Koplitz, S. N., Sarwar, G., Gilliam, R., Lenzen, A., Tong, D. Q., Pierce, R. B., and Garcia-Menendez, F.: Inferring and evaluating satellite-based constraints on NOx emissions estimates in air quality simulations, Atmos. Chem. Phys., 22, 15981–16001, https://doi.org/10.5194/acp-22-15981-2022, 2022.
EEA: Air Quality e-Reporting (AQ e-Reporting) Database: https://eeadmz1-downloads-webapp.azurewebsites.net/, last access: 4 September 2025.
Esteban, J., Mayoral, L., and Ray, D.: Ethnicity and Conflict: Theory and Facts, Science, 336, 858–865, 2012.
Feng, S., Jiang, F., Wang, H., Wang, H., Ju, W., Shen, Y., Zheng, Y., Wu, Z., and Ding, A.: NOx Emission Changes Over China During the COVID-19 Epidemic Inferred From Surface NO2 Observations, Geophys. Res. Lett., 47, e2020GL090080, https://doi.org/10.1029/2020GL090080, 2020.
Friedlingstein, P., O'Sullivan, M., Jones, M. W., Andrew, R. M., Bakker, D. C. E., Hauck, J., Landschützer, P., Le Quéré, C., Luijkx, I. T., Peters, G. P., Peters, W., Pongratz, J., Schwingshackl, C., Sitch, S., Canadell, J. G., Ciais, P., Jackson, R. B., Alin, S. R., Anthoni, P., Barbero, L., Bates, N. R., Becker, M., Bellouin, N., Decharme, B., Bopp, L., Brasika, I. B. M., Cadule, P., Chamberlain, M. A., Chandra, N., Chau, T.-T.-T., Chevallier, F., Chini, L. P., Cronin, M., Dou, X., Enyo, K., Evans, W., Falk, S., Feely, R. A., Feng, L., Ford, D. J., Gasser, T., Ghattas, J., Gkritzalis, T., Grassi, G., Gregor, L., Gruber, N., Gürses, Ö., Harris, I., Hefner, M., Heinke, J., Houghton, R. A., Hurtt, G. C., Iida, Y., Ilyina, T., Jacobson, A. R., Jain, A., Jarníková, T., Jersild, A., Jiang, F., Jin, Z., Joos, F., Kato, E., Keeling, R. F., Kennedy, D., Klein Goldewijk, K., Knauer, J., Korsbakken, J. I., Körtzinger, A., Lan, X., Lefèvre, N., Li, H., Liu, J., Liu, Z., Ma, L., Marland, G., Mayot, N., McGuire, P. C., McKinley, G. A., Meyer, G., Morgan, E. J., Munro, D. R., Nakaoka, S.-I., Niwa, Y., O'Brien, K. M., Olsen, A., Omar, A. M., Ono, T., Paulsen, M., Pierrot, D., Pocock, K., Poulter, B., Powis, C. M., Rehder, G., Resplandy, L., Robertson, E., Rödenbeck, C., Rosan, T. M., Schwinger, J., Séférian, R., Smallman, T. L., Smith, S. M., Sospedra-Alfonso, R., Sun, Q., Sutton, A. J., Sweeney, C., Takao, S., Tans, P. P., Tian, H., Tilbrook, B., Tsujino, H., Tubiello, F., van der Werf, G. R., van Ooijen, E., Wanninkhof, R., Watanabe, M., Wimart-Rousseau, C., Yang, D., Yang, X., Yuan, W., Yue, X., Zaehle, S., Zeng, J., and Zheng, B.: Global Carbon Budget 2023, Earth Syst. Sci. Data, 15, 5301–5369, https://doi.org/10.5194/essd-15-5301-2023, 2023.
Gholami, F., Tomas, M., Gholami, Z., and Vakili, M.: Technologies for the nitrogen oxides reduction from flue gas: A review, Sci. Total Environ., 714, 136712, https://doi.org/10.1016/j.scitotenv.2020.136712, 2020.
Giglio, L., Randerson, J. T., and Van Der Werf, G. R.: Analysis of daily, monthly, and annual burned area using the fourth-generation global fire emissions database (GFED4), J. Geophys. Res.-Biogeo., 118, 317–328, https://doi.org/10.1002/jgrg.20042, 2013.
Gu, D., Wang, Y., Yin, R., Zhang, Y., and Smeltzer, C.: Inverse modelling of NOx emissions over eastern China: uncertainties due to chemical non-linearity, Atmos. Meas. Tech., 9, 5193–5201, https://doi.org/10.5194/amt-9-5193-2016, 2016.
Guevara, M., Jorba, O., Soret, A., Petetin, H., Bowdalo, D., Serradell, K., Tena, C., Denier van der Gon, H., Kuenen, J., Peuch, V.-H., and Pérez García-Pando, C.: Time-resolved emission reductions for atmospheric chemistry modelling in Europe during the COVID-19 lockdowns, Atmos. Chem. Phys., 21, 773–797, https://doi.org/10.5194/acp-21-773-2021, 2021.
Gupta, P. and Shukla, D. P.: Implications of Russia–Ukraine war on land surface temperature and air quality: long-term and short-term analysis, Environ. Sci. Pollut. Res., 31, 46357–46375, https://doi.org/10.1007/s11356-024-32800-5, 2024.
Gutierrez, D. A., Acosta, E., Zagheni, E., and Williams, N. E.: The long-lasting effect of armed conflicts deaths on the living: Quantifying family bereavement, Sci. Adv., 1–12, https://doi.org/10.1126/sciadv.ado6951, 2024.
Hou, Z., Qu, Y., Zhang, L., Liu, J., Wang, F., Yu, Q., Zeng, A., Chen, Z., Zhao, Y., Tang, H., Wang, Y., Li, X., Li, Y., Peng, S., Ran, J., Yao, X., Meng, X., Liu, S., and Zhou, C.: War city profiles drawn from satellite images, Nat. Cities, 1, 359–369, https://doi.org/10.1038/s44284-024-00060-6, 2024.
Huang, H., Zhao, J., Liu, H., Ren, S., Liu, M., Liu, H., An, F., Guo, Y., and An, H.: Research on the crisis propagation in the global coal trade under the Russia-Ukraine conflict, Sci. Rep., 13, 15954, https://doi.org/10.1038/s41598-023-42643-8, 2023.
Hudman, R. C., Moore, N. E., Mebust, A. K., Martin, R. V., Russell, A. R., Valin, L. C., and Cohen, R. C.: Steps towards a mechanistic model of global soil nitric oxide emissions: implementation and space based-constraints, Atmos. Chem. Phys., 12, 7779–7795, https://doi.org/10.5194/acp-12-7779-2012, 2012.
Ialongo, I., Virta, H., Eskes, H., Hovila, J., and Douros, J.: Comparison of TROPOMI/Sentinel-5 Precursor NO2 observations with ground-based measurements in Helsinki, Atmos. Meas. Tech., 13, 205–218, https://doi.org/10.5194/amt-13-205-2020, 2020.
Ialongo, I., Bun, R., Hakkarainen, J., Virta, H., and Oda, T.: Satellites capture socioeconomic disruptions during the 2022 full-scale war in Ukraine, Sci. Rep., 13, 1–12, https://doi.org/10.1038/s41598-023-42118-w, 2023.
The International GEOS-Chem User Community: GEOS-Chem Classic 14.0.0, Zenodo [code], https://doi.org/10.5281/zenodo.7254984, 2022.
Islam, A., Teo, S. H., Ng, C. H., Taufiq-Yap, Y. H., Choong, S. Y. T., and Awual, M. R.: Progress in recent sustainable materials for greenhouse gas (NOx and SOx) emission mitigation, Prog. Mater. Sci., 132, 101033, https://doi.org/10.1016/j.pmatsci.2022.101033, 2023.
Jones, M. W., Andrew, R. M., Peters, G. P., Janssens-Maenhout, G., De-Gol, A. J., Ciais, P., Patra, P. K., Chevallier, F., and Le Quéré, C.: Gridded fossil CO2 emissions and related O2 combustion consistent with national inventories 1959–2018, Sci. Data, 8, 2, https://doi.org/10.1038/s41597-020-00779-6, 2021.
Jones, M. W., Andrew, R. M., Peters, G. P., Janssens-Maenhout, G., De-Gol, A. J., Dou, X., Liu, Z., Pickers, P., Ciais, P., Patra, P. K., Chevallier, F., and Le Quéré, C.: Gridded fossil CO2 emissions and related O2 combustion consistent with national inventories, Version GCP-GridFEDv2023.1, Zenodo [data set], https://doi.org/10.5281/zenodo.8386803, 2023.
Kussul, N., Drozd, S., Yailymova, H., Shelestov, A., Lemoine, G., and Deininger, K.: Assessing damage to agricultural fields from military actions in Ukraine: An integrated approach using statistical indicators and machine learning, Int. J. Appl. Earth Obs. Geoinf., 125, 103562, https://doi.org/10.1016/j.jag.2023.103562, 2023.
Lebel, E. D., Finnegan, C. J., Ouyang, Z., and Jackson, R. B.: Methane and NOx Emissions from Natural Gas Stoves, Cooktops, and Ovens in Residential Homes, Environ. Sci. Technol., 56, 2529–2539, https://doi.org/10.1021/acs.est.1c04707, 2022.
Lelieveld, J., Beirle, S., Hörmann, C., Stenchikov, G., and Wagner, T.: Abrupt recent trend changes in atmospheric nitrogen dioxide over the Middle East, Sci. Adv., 1, 2–6, https://doi.org/10.1126/sciadv.1500498, 2015.
Li, H. and Zheng, B.: TROPOMI NO2 Shows a Fast Recovery of China's Economy in the First Quarter of 2023, Environ. Sci. Technol. Lett., 10, 635–641, https://doi.org/10.1021/acs.estlett.3c00386, 2023.
Li, H., Zheng, B., Ciais, P., Boersma, K. F., Riess, T. C. V. W., Martin, R. V., Broquet, G., van der A, R., Li, H., Hong, C., Lei, Y., Kong, Y., Zhang, Q., and He, K.: Satellite reveals a steep decline in China's CO2 emissions in early 2022, Sci. Adv., 9, 1–10, https://doi.org/10.1126/sciadv.adg7429, 2023a.
Li, S., Wang, S., Wu, Q., Zhang, Y., Ouyang, D., Zheng, H., Han, L., Qiu, X., Wen, Y., Liu, M., Jiang, Y., Yin, D., Liu, K., Zhao, B., Zhang, S., Wu, Y., and Hao, J.: Emission trends of air pollutants and CO2 in China from 2005 to 2021, Earth Syst. Sci. Data, 15, 2279–2294, https://doi.org/10.5194/essd-15-2279-2023, 2023b.
Lin, F., Li, X., Jia, N., Feng, F., Huang, H., Huang, J., Fan, S., Ciais, P., and Song, X. P.: The impact of Russia-Ukraine conflict on global food security, Glob. Food Secur.-Agr., 36, 100661, https://doi.org/10.1016/j.gfs.2022.100661, 2023.
Liu, F., Zhang, Q., Tong, D., Zheng, B., Li, M., Huo, H., and He, K. B.: High-resolution inventory of technologies, activities, and emissions of coal-fired power plants in China from 1990 to 2010, Atmos. Chem. Phys., 15, 13299–13317, https://doi.org/10.5194/acp-15-13299-2015, 2015.
Liu, Q., Zhang, Y., Liu, B., Amonette, J. E., Lin, Z., Liu, G., Ambus, P., and Xie, Z.: How does biochar influence soil N cycle? A meta-analysis, Plant Soil, 426, 211–225, https://doi.org/10.1007/s11104-018-3619-4, 2018.
Luo, Z., Xu, H., Zhang, Z., Zheng, S., and Liu, H.: Year-round changes in tropospheric nitrogen dioxide caused by COVID-19 in China using satellite observation, J. Environ. Sci. (China), 132, 162–168, https://doi.org/10.1016/j.jes.2022.01.013, 2023.
Malarvizhi, A. S., Liu, Q., Trefonides, T. S., Hasheminassab, S., Smith, J., Huang, T., Marlis, K. M., Roberts, J. T., Wang, Z., Sha, D., Beatriz Moura Pereira, A., Podar, H., Cain, J., and Yang, C.: The spatial dynamics of Ukraine air quality impacted by the war and pandemic, Int. J. Digit. Earth, 16, 3680–3705, https://doi.org/10.1080/17538947.2023.2239762, 2023.
Malytska, L., Ladstätter-Weißenmayer, A., Galytska, E., and Burrows, J. P.: Assessment of environmental consequences of hostilities: Tropospheric NO2 vertical column amounts in the atmosphere over Ukraine in 2019–2022, Atmos. Environ., 318, 120281, https://doi.org/10.1016/j.atmosenv.2023.120281, 2024.
Mao, Y., Wang, H., Jiang, F., Feng, S., Jia, M., and Ju, W.: Anthropogenic NOx emissions of China, the U.S. and Europe from 2019 to 2022 inferred from TROPOMI observations, Environ. Res. Lett., 108, 4537, https://doi.org/10.1088/1748-9326/ad3cf9, 2024.
Mao, Y.: Ukrainian anthropogenic NOx emission inversion based on TROPOMI satellite observations and GEOS-Chem modeling from 2019 to 2023, Zenodo [data set], https://doi.org/10.5281/zenodo.16597564, 2025.
Martin, R. V., Jacob, D. J., Chance, K., Kurosu, T. P., Palmer, P. I., and Evans, M. J.: Global inventory of nitrogen oxide emissions constrained by space-based observations of NO2 columns, J. Geophys. Res.-Atmos., 108, 1–12, https://doi.org/10.1029/2003jd003453, 2003.
Miyazaki, K., Eskes, H. J., and Sudo, K.: Global NOx emission estimates derived from an assimilation of OMI tropospheric NO2 columns, Atmos. Chem. Phys., 12, 2263–2288, https://doi.org/10.5194/acp-12-2263-2012, 2012.
Miyazaki, K., Bowman, K., Sekiya, T., Takigawa, M., Neu, J. L., Sudo, K., Osterman, G., and Eskes, H.: Global tropospheric ozone responses to reduced NOx emissions linked to the COVID-19 worldwide lockdowns, Sci. Adv., 7, 1–15, https://doi.org/10.1126/sciadv.abf7460, 2021.
Mottaleb, K. A., Kruseman, G., and Snapp, S.: Potential impacts of Ukraine-Russia armed conflict on global wheat food security: A quantitative exploration, Glob. Food Secur.-Agr., 35, 100659, https://doi.org/10.1016/j.gfs.2022.100659, 2022.
Mueller, H., Groeger, A., Hersh, J., Matranga, A., and Serrat, J.: Monitoring war destruction from space using machine learning, P. Natl. Acad. Sci. USA, 118, https://doi.org/10.1073/pnas.2025400118, 2021.
OHCHR: Civilian casualties in Ukraine from 24 February 2022 to 15 February 2023, Office of the United Nations High Commissioner for Human Rights, https://ukraine.un.org/en/219519-civilian-casualties-ukraine-24-february-2022-15-february-2023 (last access: 28 July 2025), 2023.
Qu, Z., Henze, D. K., Capps, S. L., Wang, Y., Xu, X., Wang, J., and Keller, M.: Monthly top-down NOx emissions for China (2005–2012): A hybrid inversion method and trend analysis, J. Geophys. Res., 122, 4600–4625, https://doi.org/10.1002/2016JD025852, 2017.
Randerson, J. T., Werf, G. R. van der, Giglio, L., Collatz, G. J., and Kasibhatla, P. S.: Global Fire Emissions Database, Version 4.1 (GFEDv4), ORNL DAAC, Oak Ridge, Tennessee, USA [data set], https://doi.org/10.3334/ORNLDAAC/1293, 2017.
Rawtani, D., Gupta, G., Khatri, N., Rao, P. K., and Hussain, C. M.: Environmental damages due to war in Ukraine: A perspective, Sci. Total Environ., 850, 157932, https://doi.org/10.1016/j.scitotenv.2022.157932, 2022.
Reuter, M., Buchwitz, M., Hilboll, A., Richter, A., Schneising, O., Hilker, M., Heymann, J., Bovensmann, H., and Burrows, J. P.: Decreasing emissions of NOx relative to CO2 in East Asia inferred from satellite observations, Nat. Geosci., 7, 792–795, https://doi.org/10.1038/ngeo2257, 2014.
Reuters: Ukraine and Russia at War, https://www.reuters.com/world/ukraine-russia-war/, last access: 4 September 2025.
Richter, A., Burrows, J. P., Nüß, H., Granier, C., and Niemeier, U.: Increase in tropospheric nitrogen dioxide over China observed from space, Nature, 437, 129–132, https://doi.org/10.1038/nature04092, 2005.
Sekiya, T., Miyazaki, K., Eskes, H., Sudo, K., Takigawa, M., and Kanaya, Y.: A comparison of the impact of TROPOMI and OMI tropospheric NO2 on global chemical data assimilation, Atmos. Meas. Tech., 15, 1703–1728, https://doi.org/10.5194/amt-15-1703-2022, 2022.
Shen, L., Jacob, D. J., Gautam, R., Omara, M., Scarpelli, T. R., Lorente, A., Zavala-Araiza, D., Lu, X., Chen, Z., and Lin, J.: National quantifications of methane emissions from fuel exploitation using high resolution inversions of satellite observations, Nat. Commun., 14, https://doi.org/10.1038/s41467-023-40671-6, 2023.
Shumilova, O., Tockner, K., Sukhodolov, A., Khilchevskyi, V., De Meester, L., Stepanenko, S., Trokhymenko, G., Hernández-Agüero, J. A., and Gleick, P.: Impact of the Russia–Ukraine armed conflict on water resources and water infrastructure, Nat. Sustain., 6, 578–586, https://doi.org/10.1038/s41893-023-01068-x, 2023.
SSSU (State Statistics Service of Ukraine): Official website, https://ukrstat.gov.ua/, last access: 4 September 2025.
Stavrakou, T., Müller, J.-F., Boersma, K. F., van der A, R. J., Kurokawa, J., Ohara, T., and Zhang, Q.: Key chemical NOx sink uncertainties and how they influence top-down emissions of nitrogen oxides, Atmos. Chem. Phys., 13, 9057–9082, https://doi.org/10.5194/acp-13-9057-2013, 2013.
Sulprizio, M.: GEOS-Chem 14.0.0, Zenodo [code], https://doi.org/10.5281/zenodo.7254288, 2022.
Sun, D., Zhang, K., and Shen, S.: Analyzing spatiotemporal traffic line source emissions based on massive didi online car-hailing service data, Transport. Res. D-Tr. E., 62, 699–714, https://doi.org/10.1016/j.trd.2018.04.024, 2018.
Tang, L., Qu, J., Mi, Z., Bo, X., Chang, X., Anadon, L. D., Wang, S., Xue, X., Li, S., Wang, X., and Zhao, X.: Substantial emission reductions from Chinese power plants after the introduction of ultra-low emissions standards, Nat. Energy, 4, 929–938, https://doi.org/10.1038/s41560-019-0468-1, 2019.
TEMIS (Tropospheric Emission Monitoring Internet Service): https://www.temis.nl/airpollution/no2col/tropomi_no2_data_versions.php, last access: 4 September 2025.
The World Bank: Ukraine Rapid Damage and Needs Assessment, https://doi.org/10.1596/37988, 2023.
van Geffen, J., Boersma, K. F., Eskes, H., Sneep, M., ter Linden, M., Zara, M., and Veefkind, J. P.: S5P TROPOMI NO2 slant column retrieval: method, stability, uncertainties and comparisons with OMI, Atmos. Meas. Tech., 13, 1315–1335, https://doi.org/10.5194/amt-13-1315-2020, 2020.
van Geffen, J. H. G. M., Eskes, H. J., Boersma, K. F., Maasakkers, J. D., and Veefkind, J. P.: TROPOMI ATBD of the total and tropospheric NO2 data products, S5p/TROPOMI, 1–76, https://www.tropomi.eu/documents-and-information (last access: 28 July 2025), 2019.
Van Geffen, J. H. G. M., Eskes, H. J., Boersma, K. F., and Veefkind, J. P.: TROPOMI ATBD of the total and tropospheric NO2 data products document number: S5P-KNMI-L2-0005-RP, https://www.tropomi.eu/documents-and-information (last access: 28 July 2025), 2022.
Veefkind, J. P., Aben, I., McMullan, K., Förster, H., de Vries, J., Otter, G., Claas, J., Eskes, H. J., de Haan, J. F., Kleipool, Q., van Weele, M., Hasekamp, O., Hoogeveen, R., Landgraf, J., Snel, R., Tol, P., Ingmann, P., Voors, R., Kruizinga, B., Vink, R., Visser, H., and Levelt, P. F.: TROPOMI on the ESA Sentinel-5 Precursor: A GMES mission for global observations of the atmospheric composition for climate, air quality and ozone layer applications, Remote Sens. Environ., 120, 70–83, https://doi.org/10.1016/j.rse.2011.09.027, 2012.
Wang, H., Jiang, F., Liu, Y., Yang, D., Wu, M., He, W., Wang, J., Wang, J., Ju, W., and Chen, J. M.: Global Terrestrial Ecosystem Carbon Flux Inferred from TanSat XCO2 Retrievals, J. Remote Sens. (United States), 2022, https://doi.org/10.34133/2022/9816536, 2022.
Wang, Q., Zhang, C., and Li, R.: Impact of different geopolitical factors on the energy transition: The role of geopolitical threats, geopolitical acts, and geopolitical risks, J. Environ. Manage., 352, 119962, https://doi.org/10.1016/j.jenvman.2023.119962, 2024.
Wu, Y., Zhang, S., Hao, J., Liu, H., Wu, X., Hu, J., Walsh, M. P., Wallington, T. J., Zhang, K. M., and Stevanovic, S.: On-road vehicle emissions and their control in China: A review and outlook, Sci. Total Environ., 574, 332–349, https://doi.org/10.1016/j.scitotenv.2016.09.040, 2017.
Xu, X., Wang, J., Henze, D. K., Qu, W., and Kopacz, M.: Constraints on aerosol sources using GEOS-Chem adjoint and MODIS radiances, and evaluation with multisensor (OMI, MISR) data, J. Geophys. Res.-Atmos., 118, 6396–6413, https://doi.org/10.1002/jgrd.50515, 2013.
Zhang, C., Hu, Q., Su, W., Xing, C., and Liu, C.: Satellite spectroscopy reveals the atmospheric consequences of the 2022 Russia-Ukraine war, Sci. Total Environ., 869, 161759, https://doi.org/10.1016/j.scitotenv.2023.161759, 2023a.
Zhang, Q., Boersma, K. F., Zhao, B., Eskes, H., Chen, C., Zheng, H., and Zhang, X.: Quantifying daily NOx and CO2 emissions from Wuhan using satellite observations from TROPOMI and OCO-2, Atmos. Chem. Phys., 23, 551–563, https://doi.org/10.5194/acp-23-551-2023, 2023b.
Zheng, B., Geng, G., Ciais, P., Davis, S. J., Martin, R. V., Meng, J., Wu, N., Chevallier, F., Broquet, G., Boersma, F., van der A, R. J., Lin, J., Guan, D., Lei, Y., He, K., and Zhang, Q.: Satellite-based estimates of decline and rebound in China's CO2 emissions during COVID-19 pandemic, Sci. Adv., 6, https://doi.org/10.1126/sciadv.abd4998, 2020.
Zheng, B., Zhang, Q., Geng, G., Chen, C., Shi, Q., Cui, M., Lei, Y., and He, K.: Changes in China's anthropogenic emissions and air quality during the COVID-19 pandemic in 2020, Earth Syst. Sci. Data, 13, 2895–2907, https://doi.org/10.5194/essd-13-2895-2021, 2021.
Zhu, T., Liu, X., Wang, X., and He, H.: Technical Development and Prospect for Collaborative Reduction of Pollution and Carbon Emissions from Iron and Steel Industry in China, Engineering, 31, 37–49, https://doi.org/10.1016/j.eng.2023.02.014, 2023.