the Creative Commons Attribution 4.0 License.
the Creative Commons Attribution 4.0 License.
 | 30 Oct 2025
Evaluation of the uncertainty of the spectral UV irradiance measured by double- and single-monochromator Brewer spectrophotometers
José M. Vilaplana
Alberto Redondas
Javier López-Solano
José M. San Atanasio
Richard Kift
Andrew R. D. Smedley
Pavel Babal
Ana Díaz
Nis Jepsen
Guisella Gacitúa
Antonio Serrano
Brewer instruments are robust, widely used instruments that have been monitoring global solar ultraviolet (UV) irradiance since the 1990s, playing a key role in UV research. Unfortunately, the uncertainties of these measurements are rarely evaluated due to the difficulties involved in characterising the instruments. This evaluation is essential to determine the quality of the measurements as well as their comparability to other datasets. In this study, eight double- and two single-monochromator Brewers are characterised, and the uncertainty of their global UV measurements is estimated using the Monte Carlo method. This methodology is selected because it provides reliable uncertainty estimations and considers the nonlinearity of certain steps in the UV processing algorithm. The combined standard uncertainty depends on the Brewer instrument, varying between 2.5 % and 4 % between 310 and 350 nm. These uncertainties arise primarily from radiometric stability, cosine correction, and the uncertainty of the lamp used during calibration. At shorter wavelengths, the differences between single- and double-monochromator Brewers increase. For example, at 296 nm and a solar zenith angle (SZA) of 40°, the relative uncertainties of single Brewers range between 11 % and 23 %, whereas double Brewers have uncertainties of 3 %–5 %. As the measured wavelength decreases, the correction of stray light (for single Brewers), dark counts, and noise become the dominant sources of uncertainty. These results indicate that the accuracy of fully characterised double Brewers is sufficient for biological studies and trend detection, whereas single Brewers might be limited to wavelengths and SZAs below 305 nm and 70°, respectively.
- Article
(2063 KB) - Full-text XML
- BibTeX
- EndNote


Brewer spectrophotometers (Brewer, 1973; Kerr, 2010) were initially developed in the 1970s for supplementing the ozone measurements of the Dobson spectrophotometer (Dobson, 1931). These first Brewers were single-monochromator spectrometers and are usually referred to as single Brewers. Towards the 1980s, they were modified to also measure solar ultraviolet (UV) irradiance (Bais et al., 1996). During this time, double-monochromator Brewers (also known as double Brewers) were developed to reduce the stray light in UV measurements. Thanks to the robustness and stability of Brewer spectrophotometers, the early instruments continue in operation, and the Brewer network has steadily increased in number. Today, more than 200 Brewers are deployed worldwide, providing measurements of total ozone column (TOC), global UV irradiance, sulfur dioxide, aerosol optical depth in the UV, and nitrogen dioxide. All these measurements contribute to a better understanding of long-term UV variations (Fountoulakis et al., 2016a; Simic et al., 2008; Smedley et al., 2012; Zerefos et al., 2012) and the dynamics of the Earth's atmosphere (Arola et al., 2003; Estupiñán et al., 1996; Fioletov et al., 1998). Furthermore, Brewer spectral UV data have also been used to monitor the increase in surface UV-B levels due to the depletion of stratospheric ozone (Fioletov et al., 2001; Kerr and McElroy, 1993; Lakkala et al., 2003). Therefore, Brewer spectrophotometers have greatly contributed to the study of solar UV for more than 30 years.
To ensure the quality of Brewer UV measurements, quality assurance (QA) and quality control (QC) procedures must be performed. QC evaluates the uncertainty of the measurement provided by an instrument by (a) identifying the error sources, (b) determining the model that relates these sources with the output quantity (i.e. the UV irradiance), and (c) propagating the uncertainty using a numeric or analytical approach (e.g. Garane et al., 2006; González et al., 2023, 2024b; Webb et al., 1998). This is essential to determine the quality of the measurement and ensure its comparability to other measurements (BIPM et al., 2008a). On the other hand, QA can be performed using two methods (Webb et al., 2003). In the first one (inductive), the instrument's performance is assessed through intercomparison campaigns. As for the second (deductive) method, the user deduces the instrument's quality through a meticulous description of the calibration process as well as the instrumental characteristics, such as its linearity and angular response. For QA purposes, the general principles established by Webb et al. (1998) should be followed, expanded, and refined so that the user can report reliable uncertainties for any measurement, not limiting the analysis for a typical measurement at the station (Webb et al., 2003). Unfortunately, for Brewer measurements, there is no consensus on how QAQC should be performed, and as a result, the data processing, uncertainty evaluation, and calibration practices vary from station to station. In this context, EuBrewNet (European Brewer Network), originally developed through COST Action 1207 and currently operational thanks to AEMET (Spanish State Meteorological Agency), is working on harmonising and developing coherent practices for Brewer QAQC (Redondas et al., 2018; Rimmer et al., 2018). All Brewers used in this study are part of EuBrewNet, and as a result, their UV measurements are obtained following their processing algorithms.
The QA performed for the instruments used in this work corresponds to the inductive method described by Webb et al. (2003). It is carried out during the campaigns performed by the Regional Brewer Calibration Center–Europe (RBCC-E), where Brewer spectrophotometers are compared to the European reference spectroradiometer, the QASUME unit (e.g. Gröbner et al., 2010; Lakkala et al., 2008). These intercomparison campaigns meet the main requirements laid out by Webb et al. (2003), i.e. transparency and objective comparison algorithms (see the campaign reports at the PMOD/WRC website, https://www.pmodwrc.ch/en/world-radiation-center-2/wcc-uv/qasume-site-audits/, last access: 17 October 2025; the report of the 18th intercomparison campaign, Hülsen, 2023; and an overview of EuBrewNet's algorithms, López-Solano et al., 2024). However, this QA procedure is not currently implemented in terms of uncertainty estimates. This is not surprising, as QC is a pending task for the Brewer network. In fact, it remains one of the main challenges for Brewer sites measuring ozone (Fioletov et al., 2008) and UV irradiance. Although the main errors and uncertainties affecting spectral UV irradiance measurements are well-known (Bais, 1997; Bernhard and Seckmeyer, 1999; Webb et al., 1998), their proper characterisation is difficult and requires specialised equipment (such as tuneable lasers, portable unit systems, or devices to measure angular response) that is not available to most UV site operators. Furthermore, the calculation of the uncertainty propagation is complicated due to the nonlinearity of the UV irradiance model.
Brewer sites performing QC for UV measurements usually approach the uncertainty propagation following the recommendations of the Guide to the Expression of Uncertainty in Measurement (GUM) (BIPM et al., 2008a). In particular, the GUM uncertainty framework (hereafter “GUF”) is applied by assuming that the UV irradiance model is linear (e.g. Garane et al., 2006). Although this assumption is generally valid for Brewer spectrophotometers, the GUF provides less accurate estimations than other uncertainty propagation techniques (González et al., 2024b), such as the Monte Carlo method (hereafter “MCM”) and the Unscented transformation (hereafter “UT”). The UT is an efficient technique that evaluates the uncertainty by applying the nonlinear model to a reduced set of points, referred to as sigma points (Julier et al., 1995; Julier and Uhlmann, 1997). These sigma points are carefully chosen using several parameters to ensure their statistics (first and second order) match those of the measurand. However, if these points are not selected properly, the UT fails to obtain a correct estimate and its corresponding uncertainty. While recommended values usually work, they may not be optimal in some cases (Straka et al., 2012; Turner and Rasmussen, 2010; Wang and Ding, 2020). Although the UT method provided accurate results for a specific double Brewer (González et al., 2024b), it is unclear whether those results can be extended to single Brewers and other double Brewers. Therefore, in this work, the MCM was selected, as it has a broader range of validity than the UT and GUF, provided that a sufficient number of simulations are performed (usually 106 iterations) (BIPM et al., 2008b).
The original contribution of this article is the characterisation and uncertainty evaluation of 10 single and double Brewer spectrophotometers (MkIV and MkIII type, respectively) using the methodology set by González et al. (2023) and its subsequent comparison. In this way, the MCM is implemented to evaluate the uncertainty of the Brewer UV network. All the necessary uncertainty sources considered by Webb et al. (1998) have been included in the uncertainty evaluation presented in this work, plus some highly recommended and additional sources such as stray light and wavelength alignment. Moreover, a sensitivity analysis has also been performed to examine the influence of every uncertainty source on each Brewer spectrophotometer. The UV scans used for the uncertainty analysis were recorded under clear skies during the 18th RBCC-E intercomparison campaign at the El Arenosillo Observatory (37.1° N, 6.7° W, 41 m a.s.l., Huelva, Spain).
The paper is organised as follows. First, the specifications of single and double Brewer spectrophotometers as well as an overview of the intercomparison campaign are given in Sect. 2. Next, Sect. 3 describes the uncertainty evaluation, i.e. the characterisation of the uncertainty sources, the UV irradiance model, and the MCM approach. Then, in Sect. 4, the results obtained from the sensitivity and uncertainty analysis are discussed. Furthermore, Sect. 5 discusses several applications of the uncertainty evaluation of Brewer spectrophotometers. Finally, Sect. 6 summarises the main conclusions of this study.
2.1 Brewer spectrophotometers
In this study, the uncertainty of the spectral UV measurements performed by 10 Brewer instruments is evaluated. Two different types of Brewer spectrophotometers are included in the study: MkIV (single monochromator) and MkIII (double monochromator). The serial number and information of each instrument are shown in Table 1.
The optical path is similar for both Brewer types, i.e. global UV irradiance enters through the entrance optics, consisting of a Teflon diffuser covered by a quartz dome, and is redirected into the fore-optics using two prisms (UV-B and zenith prisms). The incoming radiation is then focused and collimated by the Iris. Then, the intensity of the beam is adjusted before entering the spectrometer, using a set of filters installed on two wheels. The first filter wheel has an open hole (open position) for UV measurements, a ground-quartz disc (pos. 1) for direct-Sun measurements, and an opaque disc (pos. 2) for dark signal tests (Kipp & Zonen, 2007, 2015). The second filter wheel contains five neutral density filters to adjust the intensity level of the incoming light. After passing through the filters, the light is focused onto the spectrometer's entrance slit. This spectrometer is a modified Ebert grating type that disperses the light into a spectrum using a diffraction grating. At the exit of the spectrometer, there is a cylindrical slit mask. For ozone, dead time, and dark signal observations, the diffraction grating is fixed while the slit mask rotates, selecting in this way the wavelength. On the other hand, for the measuring of UV irradiance, the slit mask remains fixed, and the diffraction grating rotates (using a micrometre) to select the wavelength. In MkIV Brewers, the emerging light passes through a third filter wheel, which has several filters to block undesired radiation: (1) in the ozone mode, a UG-11/NiSO4 filter combination is used, (2) in the UV mode, the filter switches to a UG-11 filter, and (3) in the NO2 mode, a BG-12 filter is used to block UV radiation (Kipp & Zonen, 2007). Finally, the photons are detected by a photomultiplier tube (PMT). A diagram of the MkIV and MkIII Brewers can be found in Kerr (2010) and González et al. (2023), respectively.
Table 1Information for each Brewer spectrophotometer used in this study.
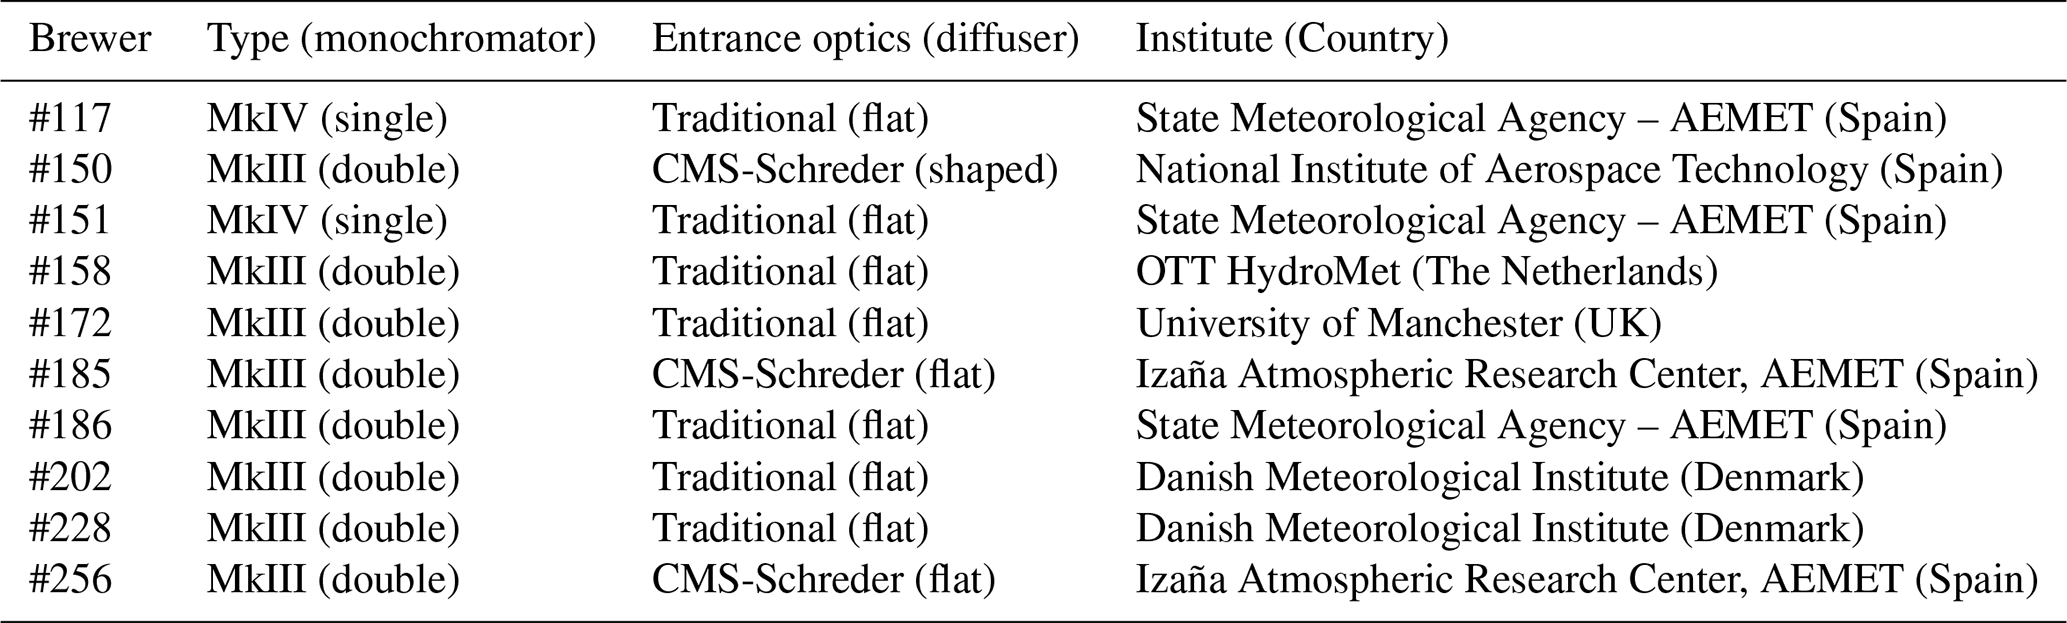
The difference between the two types of Brewers lies in the number of monochromators and the type of diffraction gratings. MkIV Brewers are single monochromators, and the diffraction grating of the spectrometer is operated in the third order and has a line density of 1200 lines mm−1. On the other hand, the spectrometer system in MkIII Brewers consists of a pair of monochromators and gratings to reduce the stray light of the system. Both diffraction gratings have a line density of 3600 lines mm−1 and are operated in the first order.
The entrance optics for both types of Brewer spectrophotometer consists of a Teflon diffuser covered by a quartz dome. Traditionally, the diffuser was flat, but the angular response of such an entrance optic can deviate substantially from the ideal cosine response (Bais et al., 2005; Lakkala et al., 2018). Therefore, a correction is needed to mitigate such deviation, as will be described later in Sect. 3.1.3. On the other hand, new designs have been developed to improve the Brewer angular response (Gröbner, 2003). Brewer #150 has this novel entrance optic developed by CMS-Schreder (model UV-J1015) with a shaped Teflon diffuser. On the other hand, Brewers #185 and #256 have a flat diffuser mounted on the CMS-Schreder optic. The remaining seven Brewers have the standard flat diffuser originally mounted in these spectrometers.
For spectral UV irradiance measurements, the operational wavelength range of the Brewers under study is 290–363 nm with a step of 0.5 nm. The shape of the slit function is trapezoidal, and the full width at half maximum (FWHM) ranges from 0.55 to 0.65 nm, depending on the instrument. Brewer spectrophotometers are operated within a weather-proof housing and have electrical heaters to prevent operation at low temperatures. If the internal temperature of the instrument falls below 10 or 20 °C (Kipp & Zonen, 2015), these heaters are automatically switched on. Nevertheless, the Brewer internal temperature is not fully stabilised and can fluctuate throughout the day. As for their calibration, the instrument is calibrated using reference lamps (usually 1000 W lamps) with the input optics positioned towards the UV-B port. The calibration is performed during the RBCC-E campaign, and the Brewer UV measurements are processed using EuBrewNet's algorithms. Both are described in the following sections.
2.2 Intercomparison campaign at the El Arenosillo Observatory
The data used are the UV scans performed during the 18th Regional Brewer Calibration Center for Europe (RBCC-E) intercomparison held at the El Arenosillo Observatory (37.1° N, 6.7° W, 41 m a.s.l.) in Huelva, Spain, from 5 to 15 September 2023 (WMO, 2024). This campaign is organised biennially as an essential activity to ensure the quality of Brewer measurements, and the El Arenosillo Observatory, belonging to the National Institute of Aerospace Technology (INTA), is chosen due to its extremely good sky conditions. During the campaign, all instruments were installed on the roof of the station, where the horizon is free up to solar zenith angles (SZAs) of 85°.
The first 5 days of the campaign, 6–10 September, were dedicated to assessing the status of the participating Brewers (by comparing their ozone measurements with those of the reference, Brewer #185), to performing the necessary maintenance, and, finally, to gathering data for the instruments' calibration. The angular characterisation and the UV comparison were carried out during the final 4 days of the campaign, 11–14 September. It should be mentioned that the angular response characterisation was available for five MkIII Brewers (#150, #185, #186, #158, and #256). Four of them (#150, #185, #186, and #256) were characterised using the Brewer Angular Tester (BAT), described later in Sect. 3.1.3. The remaining Brewer (#158) was characterised in the laboratory of its operating site, using a lamp mounted on an arm that turns by steps of 5°.
The protocol to measure global spectral UV irradiance consisted of scanning one UV spectrum from sunrise to sunset every 30 min. The wavelength increment and time step were set to 0.5 nm and 3 s, respectively. This setting was chosen to obtain simultaneous measurements between the 16 Brewer spectrophotometers (eight MkIII, six MkIV, and two MkII) participating in the campaign and the travelling reference QASUME (Gröbner et al., 2005; Hülsen et al., 2016) from the Physikalisch-Meteorologisches Observatorium Davos/World Radiation Center (PMOD/WRC). The results from this intercomparison, along with other QASUME site audits, are published on the web page of PMOD/WRC (https://www.pmodwrc.ch/en/world-radiation-center-2/wcc-uv/qasume-site-audits/, last access: 25 July 2025).
In this work, the UV irradiances and the corresponding uncertainties of MkIII and MkIV Brewers (see Table 1) have been calculated using their raw UV signal, calibration files, slit functions, dead time, dark signal, reference lamp certificates, and angular response measurements. This information is available at EuBrewNet (Rimmer et al., 2018), except for the lamp certificates and some calibration records, which were provided by the Brewer and QASUME operators. In the following section, the UV processing algorithm and the uncertainty propagation techniques implemented are described.
The combined standard uncertainty of the global UV irradiance measured by MkIII and MkIV Brewers has been calculated following the guidelines established by the Guide to the Expression of Uncertainty in Measurement (GUM). In particular, the uncertainty analysis has been carried out using a numerical propagation technique: the MCM (BIPM et al., 2008b). The UV measurements used for the uncertainty evaluation were performed under cloud-free conditions during the 18th RBCC-E intercomparison campaign (described in detail in Sect. 2.2). Furthermore, a sensitivity analysis has been performed to identify the main sources of uncertainty in the Brewer UV measurement procedure. To carry out the uncertainty evaluation, the uncertainty sources and the model relating these sources to the measured irradiance must first be characterised. Unfortunately, there are no standard procedures for these tasks. In the present work, the UV irradiance model used is the one implemented in the RBCC-E campaigns. This processing is performed by EuBrewNet (https://eubrewnet.aemet.es/dokuwiki/doku.php?id=codes:uvaccess, last access: 20 May 2025). An overview of these processing algorithms can also be found in López-Solano et al. (2024). In the following subsections, the irradiance model and the uncertainty sources are described.
3.1 Characterisation of the uncertainty sources
The spectral irradiance measured by a Brewer spectrophotometer is affected by several error sources that need to be corrected (e.g. Kerr, 2010; Lakkala et al., 2008). Error sources are usually separated into random and systematic components. Random errors produce variations in repeated measurements and, as such, are usually reduced by increasing the number of observations (BIPM et al., 2008a). On the other hand, systematic errors can be compensated for by applying a correction factor to the irradiance measured. Even if all errors are appropriately characterised and corrected, there still remains doubt, an uncertainty, about the accuracy of the reported result (BIPM et al., 2008b). In the following, the term “error” will denote the imperfections in a measurement result, while the term “uncertainty” will be used to reflect the existing doubt regarding the value of the measured spectral UV irradiance. In this way, it is important to differentiate between the source of error (for example, cosine error) and the uncertainty associated with its correction.
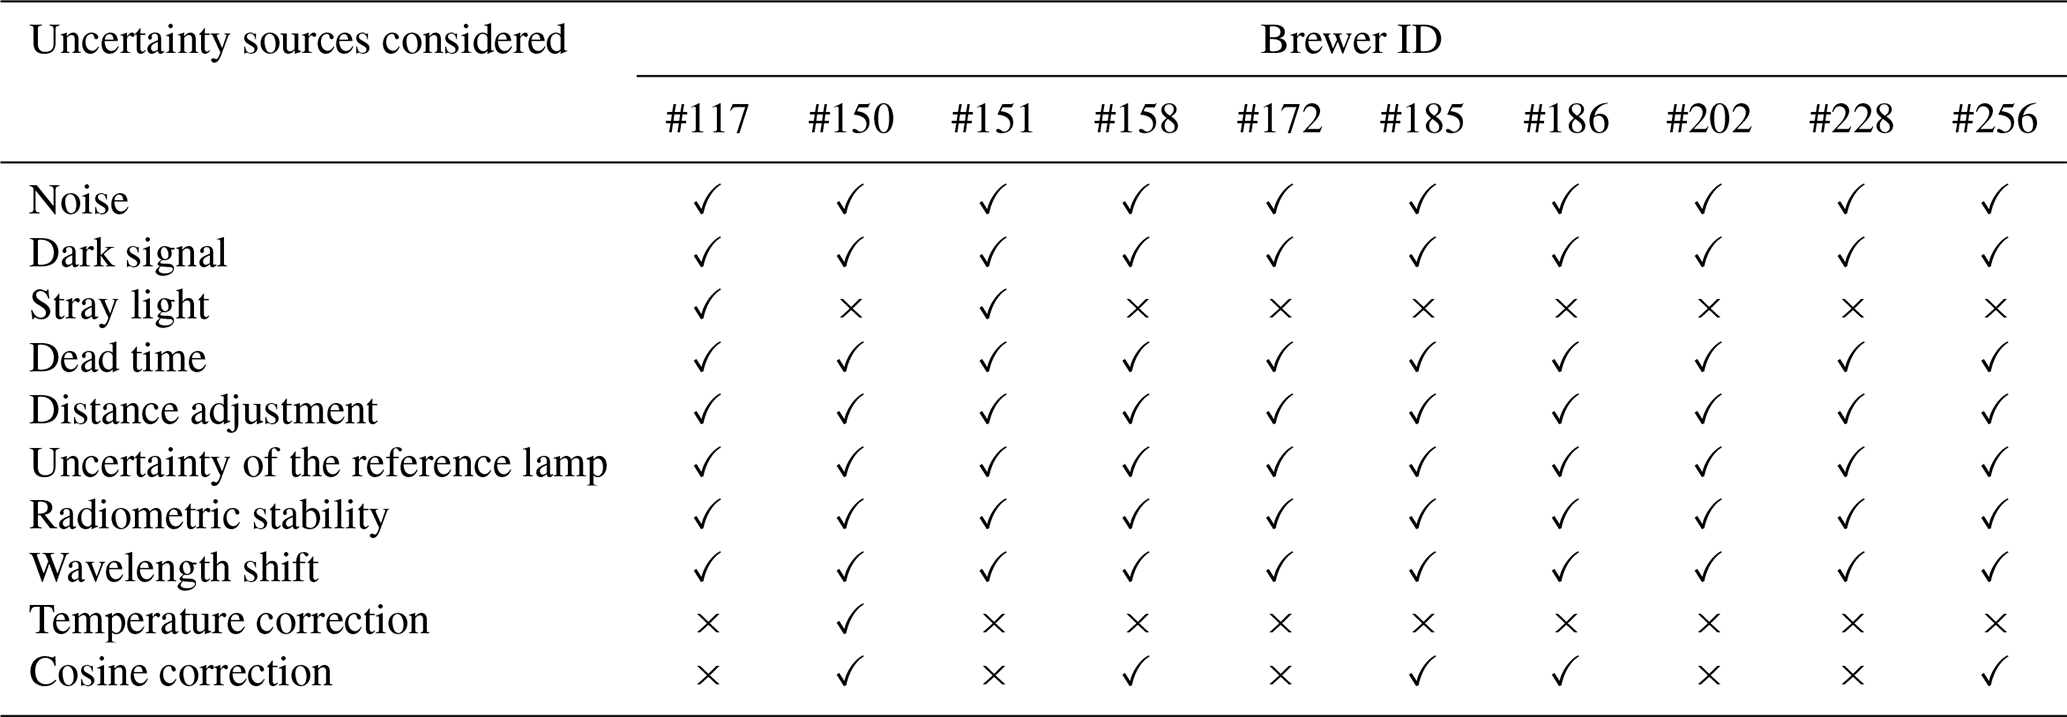
In this study, the main uncertainty sources in solar radiometry have been considered (Webb et al., 1998). They have been characterised following the methodologies of Bernhard and Seckmeyer (1999) and González et al. (2023, 2024b). It should be noted that some of the uncertainties (such as those related to noise, stray light correction, or radiometric stability) have not been determined thoroughly, as the data used for their estimation are insufficient to obtain appropriate statistics. Nevertheless, in all these cases, typical uncertainty estimates have been assumed and included in the Monte Carlo simulation. The uncertainty sources affecting the Brewer UV measurement procedure can be divided into three groups, depending on whether they affect (1) the signal measured by the instrument (see Sect. 3.1.1), (2) the radiometric calibration (see Sect. 3.1.2), or (3) the absolute irradiance (see Sect. 3.1.3). All these sources and their corresponding corrections have been applied to the Brewer UV measurements during the 18th RBCC-E campaign, whenever possible. As will be described in the following, some of the participating Brewers were not fully characterised, lacking information regarding their temperature and cosine correction. The uncertainty sources included in the uncertainty evaluation of each Brewer are summarised in Table 2.
Table 2Summary of the uncertainty sources considered for each Brewer under study. Squares with a cross mark (×) represent the uncertainty sources not included in the evaluation, while squares with a check mark (✓) indicate those uncertainty sources considered.
3.1.1 Uncertainty in Brewer raw signal (counts)
The signal measured by any Brewer spectrometer is affected by stray light, noise, dark signals, and dead time.
Stray light is the radiation coming from wavelengths other than the one being measured. This undesired light is able to reach the detector due to scatter inside the instrument and dust particles inside the spectrometer. The presence of stray light is larger in single Brewers (such as MkIV Brewers) and results in an overestimation of the measured global UV irradiance at short wavelengths (Bais et al., 1996; Davies, 1996). Therefore, EuBrewNet applies a correction only for single Brewers, as the stray light present in double Brewers is very low (Bais et al., 1996; Karppinen et al., 2015; Savastiouk et al., 2023). While this correction is implemented for ozone measurements (Redondas et al., 2018), for UV measurements, further characterisation is needed. It is usual to estimate stray light as the average signal recorded below 292 nm (e.g. Arola and Koskela, 2004; Lakkala et al., 2008; Mäkelä et al., 2016), and the correction is carried out by subtracting this average value from the signal measured at all wavelengths. The uncertainty of this method was estimated by comparing the corrected irradiance to the QASUME from 290 to 292 nm. This estimation also includes the effects of temperature and cosine errors, as the single Brewers under study are not corrected for these two sources of error. Nevertheless, because the effect of these two sources is expected to be small below 292 nm, the uncertainty determined might be only a slight overestimation. Furthermore, the standard deviation from the measurements of the five wavelengths (from 290 to 292 nm) was also derived and combined with the uncertainty obtained from the QASUME comparison.
Noise can be characterised by studying the signal-to-noise ratio (SNR) (e.g. Bernhard and Seckmeyer, 1999; Cordero et al., 2012). However, this ratio can be determined only if all conditions, such as the incoming radiation, remain stable. For CCD-array spectroradiometers, this is easy, as the instrument can record several spectra in a few seconds. In contrast, Brewer spectrophotometers take approximately 5–6 min to measure a single UV spectrum. As a result, characterising the noise in Brewer measurements is straightforward only during the radiometric calibration, when the emitting lamp is stable. During the RBCC-E campaign, the measurement of the irradiance of the reference lamp was acquired four times. With this information, the SNR for the radiometric calibration is calculated. Because it was proportional to the root of the raw signal recorded, the methodology proposed by Bernhard and Seckmeyer (1999) could be applied, and the SNR for the signal measured under the Sun was obtained as
where and are the raw signal measured under the Sun and lamp (calibration), respectively, and SNRS(λ) and SNRR(λ) are the signal-to-noise ratios of the outdoor and calibration measurements, respectively.
A dark signal is the counts recorded when no light is entering the instrument. Brewer spectrophotometers are programmed to measure the dark signal before every observation (UV scan, direct-Sun measurement, etc.) by blocking the incoming radiation. The dark signal of the Brewers under study increased as the internal temperature of the instrument rose. To estimate the uncertainty of the dark signal, the dark signal measured at each temperature reached by the instrument was averaged, and the corresponding standard uncertainty was calculated. The number of available measurements depended on the instrument, but on average, more than 2500 dark signal measurements were recorded by each Brewer during the intercomparison campaign.
Dead time is the time after a photon has been recorded during which the photomultiplier tube (PMT) is unable to detect a second one. This causes the nonlinearity in the Brewer response, as any photons arriving during the dead time of the PMT are not taken into account. Similarly to the dark signal, dead time determination is also included in the schedule of Brewer spectrophotometers (DT test). Each instrument records it daily by measuring and comparing high and low intensities of an internal quartz-halogen 20 W lamp (standard lamp). Initially, the dead time of the instrument is stored in the B-files (instrument constants). Then, using the DT tests, this constant is frequently checked and updated during calibration audits. The dead time is characteristic of each Brewer, as it depends on the type of PMT used. For the Brewers under study, the dead time varied from 25 to 36 ns, and the uncertainties ranged from 0.3 to 3 ns. These values were derived from the instrument constant files and the DT tests carried out during the campaign. The dead time uncertainties found using the previous methodology are similar to those reported by Fountoulakis et al. (2016b). They determined standard deviations of 1–2 ns for the Brewer dead time using direct-Sun measurements. Moreover, the uncertainties estimated for dead time also agree with the ones applied in other uncertainty evaluation studies for Brewer spectrophotometers (Diémoz et al., 2014).
3.1.2 Uncertainty in radiometric calibration
Brewer spectrophotometers were calibrated during the campaign using one or two reference DXW-1000 W tungsten-filament incandescent halogen lamps. These lamps had been previously calibrated in the laboratories of PMOD/WRC and the Finnish Metrology Research Institute, belonging to Aalto University and MIKES. The calibrations performed by PMOD/WRC are traceable to the primary standard of the Physikalisch-Technische Bundesanstalt (PTB) (Gröbner and Sperfeld, 2005). On the other hand, the Metrology Research Institute is the national standard laboratory for optical quantities in Finland and is part of the CIPM Mutual Recognition Arrangement (CIPM MRA), a framework in which metrology institutes prove the international equivalence of their calibrations and certificates. These calibrations guarantee that the spectral irradiances of the lamps are the ones stated in their calibration certificate when operated at the specified distance and electrical current. To ensure the latter, the radiometric calibration was performed with a mobile system that places the lamp on top of the Brewer diffuser at the required distance. This setup also stabilised and monitored the electrical current at its nominal value using a multimeter. Then, the signal under the lamp is recorded several times and corrected for dark counts, dead time, and stray light (see Sect. 3.1.1). The responsivity of the instrument is derived by dividing the corrected signal by the irradiance of the reference lamp. However, this responsivity is also affected by other sources of uncertainty produced during the radiometric calibration, such as the distance adjustment between the lamp and the diffuser, the radiometric stability, and the uncertainty of the spectral irradiance emitted by the reference lamp. Small fluctuations in the electrical current of the lamp can also produce errors in the calibration. Based on the findings of Webb et al. (1994), the standard practice is to assume that a 1 % change in the current of the reference lamp leads to a 10 % change in the spectral irradiance measured by the instrument (e.g. Bernhard and Seckmeyer, 1999; Webb et al., 1998). According to the previous rule, the expected change in the irradiance of the Brewers under study would be 0.125 %, as the electrical current was stabilised to within 0.0125 % during their calibration. However, this source could not be included in the Monte Carlo simulation, as it requires the determination of the lamp's operating temperature (Schinke et al., 2020), and this could not be carried out during the campaign.
In the RBCC-E campaigns hosted at the El Arenosillo, the distance between the plane of the reference lamp and the Brewer's diffuser is adjusted using a ruler with a precision of 1 mm. According to the GUM, this precision error translates to an uncertainty of 0.58 mm (BIPM et al., 2008a). Because 1000 W lamps are usually placed at 50 cm, for most Brewer spectrophotometers, the lamps were set at (500.00 ± 0.58) mm. The exceptions are Brewers #158 and #150: their lamps were set at (412.5 ± 0.58) mm and (500.0 ± 0.59) mm, respectively. The reference lamp used to calibrate Brewer #158 needed to be placed at 412.5 mm, as indicated in its calibration certificate. Brewer #150, on the other hand, has an additional source of uncertainty because the position of its diffuser's reference plane needs to be determined as well (González et al., 2023), resulting in an uncertainty of 0.59 mm. This plane determination was carried out by placing an ultra-stabilised lamp at several distances and measuring its emitted spectrum. The data showed that the diffuser's reference plane is placed (0.234 ± 0.015) cm below the reference used for calibration, i.e. the metal ring of the quartz dome covering the Brewer's diffuser (a schematic drawing of this reference can be found in González et al. (2023)).
Regarding the reference lamps, their emitted irradiances and their corresponding expanded uncertainties (coverage factor of k=2) are specified in their calibration certificates. These uncertainties depend on the lamp and the wavelength, slightly decreasing from 2 %–3 % at 290 nm to 1 %–2 % at 360 nm.
Even if a Brewer spectrophotometer is regularly calibrated, the responsivity of the instrument varies with time. This drift is caused by several factors such as transportation, storage, and ageing of the instrument, as well as the instability of the photomultiplier tube (PMT). For example, for Brewers #150 and #185, their responsivity at 320 ± 5 nm decreased at a rate of 2.8 % and 2.2 % yr−1, respectively. To characterise the radiometric stability of every Brewer, several studies recommend studying the difference between consecutive calibration factors over a significant period (e.g. a year) (Bernhard and Seckmeyer, 1999; Webb et al., 1998). These methods require that the instrument is calibrated frequently to derive reliable statistics. Unfortunately, not all Brewers studied had enough calibration files. Some of them had been operating for less than 2 years, others had undergone several modifications that greatly affected their responsivity (such as replacement of the PMT or change of the entrance optics), and the rest were not calibrated frequently enough. As a result, Brewers #150 and #185 were the only ones characterised following the methodology of Bernhard and Seckmeyer (1999), i.e. by deriving the standard deviation of the difference between consecutive calibrations. For the remaining instruments, a 3 % uncertainty was assumed, as several Brewer spectrophotometers (both double and single) exhibit uncertainties of that order (Garane et al., 2006; Lakkala et al., 2008). It should be noted that this value, derived from long-term monitoring, might not be a large overestimation for the newly calibrated Brewer (#256), as this instrument showed large instabilities during its first year of operation. On the other hand, the uncertainty assumed (3 %) is also similar to the average uncertainty found for Brewers #150 and #185, i.e. 2.9 % and 2.4 %, respectively. For Brewer #150, the radiometric uncertainty was derived using the yearly calibration files from 2005 to 2023, while for Brewer #185, the uncertainty was calculated using the monthly calibration files recorded from 2021 to 2024. As mentioned earlier, no data from prior years could be used, as the entrance optics of Brewers #150 and #185 were replaced in 2005 and 2021, respectively.
3.1.3 Uncertainty in absolute irradiance
Even if error sources affecting the Brewer signal and the radiometric calibration are characterised (as indicated in the sections above), there are still some uncertainty sources affecting the UV irradiance, specifically wavelength misalignment, temperature dependence, and cosine error.
Wavelength misalignment refers to a mismatch between the wavelength desired and the one being measured. It is usually corrected by determining the wavelength shift for every wavelength measured. Although this shift is small for Brewer spectrophotometers, it still leads to important errors, especially in the UV-B (280–315 nm) due to the marked variability in the solar irradiance in this region. For instance, a shift of less than 0.05 nm can produce an uncertainty in the UV irradiance of a few percent for wavelengths below 305 nm (Bais, 1997; González et al., 2024b).
Wavelength shifts can be determined using specific software like SHICrivm (Slaper et al., 1995) or MatSHIC (Hülsen et al., 2016). There are other options (as explained by Bernhard and Seckmeyer (1999)), but these are the most straightforward, and these detection algorithms also derive a shift for every wavelength and irradiance level measured. In this study, the wavelength shifts were obtained using SHICrivm, as it is the algorithm implemented in EuBrewNet. This software estimates the wavelength shift by comparing the structure of the spectrum measured by the ground-based instrument with the extraterrestrial spectrum. The latter is simulated using the SUSIM extraterrestrial spectrum (Slaper et al., 1995). Therefore, the shifts determined by SHICrivm include the wavelength misalignment produced by the resolution of the micrometre, i.e. the system setting the wavelengths measured by a Brewer spectrophotometer. This resolution (smallest wavelength increment) is approximately 8 pm (Gröbner et al., 1998). These shifts were also estimated during the RBCC-E campaign and can be checked in the report elaborated by the PMOD/WRC (Hülsen, 2023).
Brewer spectrophotometers, no matter the type, have no temperature stabilisation system. Thus, the internal temperature fluctuates throughout the day, resulting in a temperature dependency in Brewer global UV measurements. This fact is well-documented (Fountoulakis et al., 2017; Garane et al., 2006; Lakkala et al., 2008; Weatherhead et al., 2001), but there is no standard methodology for its characterisation in global UV irradiance measurements. Therefore, EuBrewNet lets the Brewer operators characterise this source in the way they see fit. As a recommendation, the work of Lakkala et al. (2008) is indicated.
No temperature characterisation was performed during the campaign. As a result, this uncertainty source was included only in the uncertainty evaluation of Brewer #150. This instrument was characterised on 3 separate days in 2022, using 100 and 1000 W lamps. The instrument temperature increased gradually from 23 to 38 °C while it measured the irradiance emitted by the lamps. Then, the relationship between the internal temperature of Brewer #150 and its change in responsivity with respect to a reference value (31 °C) was studied. The results showed that the instrument's responsivity decreases linearly with temperature as
where r(λ, T) is the responsivity measured at wavelength λ and internal temperature T, r(λ, Tref) is the responsivity measured at the reference temperature Tref=31 °C, and cT is the slope of the linear fit. The latter is the temperature correction factor, and for Brewer #150, it has a value of °C−1 (González et al., 2023). Therefore, the UV measurements of Brewer #150 were corrected for temperature by considering this correction factor and the difference between the temperature of the UV scan and the reference temperature (31 °C), as indicated later in Eq. (9).
The angular response of a Brewer spectrophotometer deviates considerably from the ideal angular behaviour. This deviation is mainly caused by imperfections in the entrance optics and is called cosine error, after the ideal behaviour. For single Brewers, the cosine error varies between 8 % and 12 % (Bais et al., 2005; Garane et al., 2006), while for double Brewers, it ranges between 4 % and 11 % (Antón et al., 2008; Bais et al., 2005; Lakkala et al., 2018). Although cosine correction is one of the most important uncertainty sources (Garane et al., 2006; González et al., 2024b), it is rarely characterised in RBCC-E campaigns (e.g. Lakkala et al., 2018). During the 18th RBCC-E campaign, five MkIII Brewer spectrophotometers characterised their angular response error. For this selection of Brewers, the cosine correction factor was calculated as (Gröbner et al., 1996)
where fd and fr are the diffuse and direct cosine errors, respectively, fg is the cosine correction factor, and DIR and GLO are the direct and global irradiances.
In Eq. (3), , where is the angular response of the Brewer diffuser. For most Brewers, this was measured using the Brewer Angular Tester (BAT), which measures the north–south and west–east planes using a 150 W Xe lamp placed at fixed angles (from −85 to 85° by steps of 5°). The standard uncertainty of the direct cosine error was derived from repeated measurements of Brewer #150, resulting in values varying from 0.002 at 5° to 0.006 at 85°.
The diffuse cosine error was estimated by assuming an isotropic sky radiance and integrating numerically the angular response . This factor is specific for each instrument; for the Brewers studied, it ranged from 0.908 (Brewer #186) to 0.986 (Brewer #150). Its uncertainty was estimated as indicated by Bernhard and Seckmeyer (1999), based on the findings of Gröbner et al. (1996):
where is 0.883 (the diffuse error found by Gröbner et al. (1996)) and ΔDG is the difference found by Gröbner et al. (1996) between and the diffuse error derived for an inhomogeneous sky radiance distribution.
Finally, the ratio DIR GLO was calculated using the radiative transfer model libRadtran (Emde et al., 2016) for a variety of SZAs. Other inputs to the model were the average Angström's turbidity coefficient (0.039) and Angström's exponent (1.371) derived from the El Arenosillo CIMEL measurements and mean TOC recorded by Brewer #150 during the campaign (295 DU), as well as the surface albedo (0.05), determined with a Li-Cor spectroradiometer. The uncertainty of this quantity at every SZA was estimated from all ratios measured within the desired SZA 1° (angular variability). Cloud optical thickness was not considered in the model, limiting the study to cloud-free conditions.
3.2 UV processing algorithm
Spectral UV irradiance measured at wavelength λ was obtained following the standard processing of EuBrewNet, except for those Brewers with cosine correction. This uncertainty source was estimated using a different methodology, as the one currently implemented in EuBrewNet could not be easily included in the Monte Carlo simulation. The processing algorithm entails a series of corrections, as the UV irradiance measured is affected by several error sources (see Sect. 3.1). The first step is to correct the raw signal registered C0(λ) for stray light, the dark signal, and dead time (UV level 1 in EuBrewNet).
Stray light is calculated by averaging the signal recorded below 292 nm and is then subtracted from the raw signal (only for single Brewers):
where S is the stray light.
Then, the dark signal and dead time are corrected according to the practices established by the manufacturer (Kipp & Zonen, 2015). The dark signal is simply subtracted from the UV signal as
where C1(λ) denotes the counts corrected for stray light and D is the dark signal.
On the other hand, dead time is corrected iteratively (n=1…10) by assuming Poisson statistics:
In Eq. (7), C2(λ) is the observed count rate (corrected for the dark signal and stray light) at wavelength λ, τ is the dead time, and C3(λ) is the true count rate. As a first guess, .
Then, the absolute irradiance is obtained by dividing the corrected count rates by the response of the instrument:
where is the corrected signal (stray light, dark signal, and dead time) measured outdoors and r(λ) is the responsivity of the Brewer. The latter is determined by performing a radiometric calibration (see Sect. 3.1.2).
The resulting UV irradiances need further processing to correct the temperature dependence, wavelength shifts, and cosine error.
First, they are corrected for temperature dependence by assuming a linear relationship:
where is the irradiance measured at wavelength λ, is the irradiance corrected for temperature, cT is the temperature correction factor, and Tref is the reference temperature.
Second, the cosine correction is carried out using the methodology set by Gröbner et al. (1996). This derives a correction factor for each wavelength measured using Eq. (3) and corrects the irradiance by
where is the irradiance corrected for the temperature dependence, fg(λ,θ) is the cosine correction factor, and is the corrected irradiance for the temperature and cosine error.
Finally, the irradiance is further corrected for the wavelength shifts using the SHICrivm software (Slaper et al., 1995). Only spectra recorded at SZAs smaller than 90° were used in this study. Larger SZA values have not been considered, as the UV irradiance recorded in these conditions is small, close to the detection threshold of the Brewer spectrophotometers.
3.3 Monte Carlo method
The Monte Carlo method estimates the uncertainty of the measurement by propagating the distribution of the input quantities, i.e. the uncertainty sources. Following the GUM guidelines, the uncertainties arising from random and systematic errors have been treated identically (BIPM et al., 2008b). These are determined by drawing from the probability density function (PDF) of the error sources. In this study, two types of PDFs have been considered: Gaussian and rectangular. Following the recommendations of the GUM, Gaussian distributions are assigned to those variables that can be characterised by a best estimate and a standard uncertainty, such as dead time, dark signal, or noise. On the other hand, rectangular distributions are appropriate for those sources that are best described by a lower and upper limit, i.e. the probability that the true value of the variable lies within the fixed interval is constant and is 0 outside this interval. This is the case for the uncertainty in the distance adjustment or the wavelength shift.
Once the distributions are known, the MCM can be implemented. To carry out this task, the number of times the model will be evaluated (Monte Carlo trials, M) must be first selected. In this study, M=106 because this value is expected to deliver a 95 % coverage interval for the spectral irradiance (BIPM et al., 2008b). Then, at every trial, the uncertainty sources are varied according to their PDFs, forming an M-sized vector for every source. For each of the M draws, the irradiance model is evaluated, obtaining a M×λ matrix of the output irradiance. Then, the average and the standard deviation of these irradiances are taken as the best estimate and its standard uncertainty, respectively.
The procedure described above is the one implemented to calculate the combined standard uncertainty. However, the MCM can also estimate the contribution of each uncertainty source to the total uncertainty budget. This is performed by running the M trials while varying only one uncertainty source and fixing the rest at their best estimate (BIPM et al., 2008b). In this way, the dominant uncertainty sources can be identified.
The uncertainty evaluation was performed for all the UV scans measured during the campaign under cloud-free conditions, obtaining very similar results in all cases. Therefore, only the estimations corresponding to 13 September 2023 are shown in this section. This day was selected because most Brewers measured uninterruptedly (no maintenance or calibrations were performed) and under clear sky scenarios. Under cloudy conditions, the methodology for calculating the cosine correction and noise must be adapted accordingly. As the cosine correction depends on the cloudiness, the cloud cover must be considered when modelling the direct-to-global ratio. Furthermore, clouds strongly affect the surface UV irradiance and can lead to short-time variations. As a result, noise needs to be thoroughly characterised, e.g. by studying the variability of groups of data measured very close in time. For Brewer spectrophotometers, this can be difficult, as the instrument does not have enough temporal resolution to detect fast fluctuations of solar UV irradiance.
To present the results, the Brewers studied have been separated into two groups, depending on their degree of characterisation. Ideally, all instruments would be fully characterised. Unfortunately, this is not the case, as there are no standard protocols for studying the cosine error and temperature dependence of the global UV irradiance measured by Brewer spectrophotometers. Consequently, most Brewers worldwide lack both temperature and angular characterisation. This situation is expected to improve, as the Brewer community has recognised the importance of temperature and cosine errors and is making efforts to systematically correct these two sources (e.g. Lakkala et al., 2018).
Within this framework, the first group used in this work includes the five Brewers whose angular responses had been measured (#150, #158, #185, #186, and #256). The remaining five Brewers were gathered into a second set, as their characterisation is less complete. Therefore, the second group has two single (#117 and #151) and three double (#172, #202, and #228) Brewers. The uncertainty evaluation of the Brewer spectrophotometers in this second group is limited, as the cosine correction, which is one of the key uncertainty sources in solar radiometry, is missing. As a result, the uncertainties determined are underestimated. Nevertheless, the inclusion of these Brewers is of interest, as it allows both the comparison with fully corrected ones and the determination of uncertainties that, although underestimated, are representative for most Brewers worldwide.
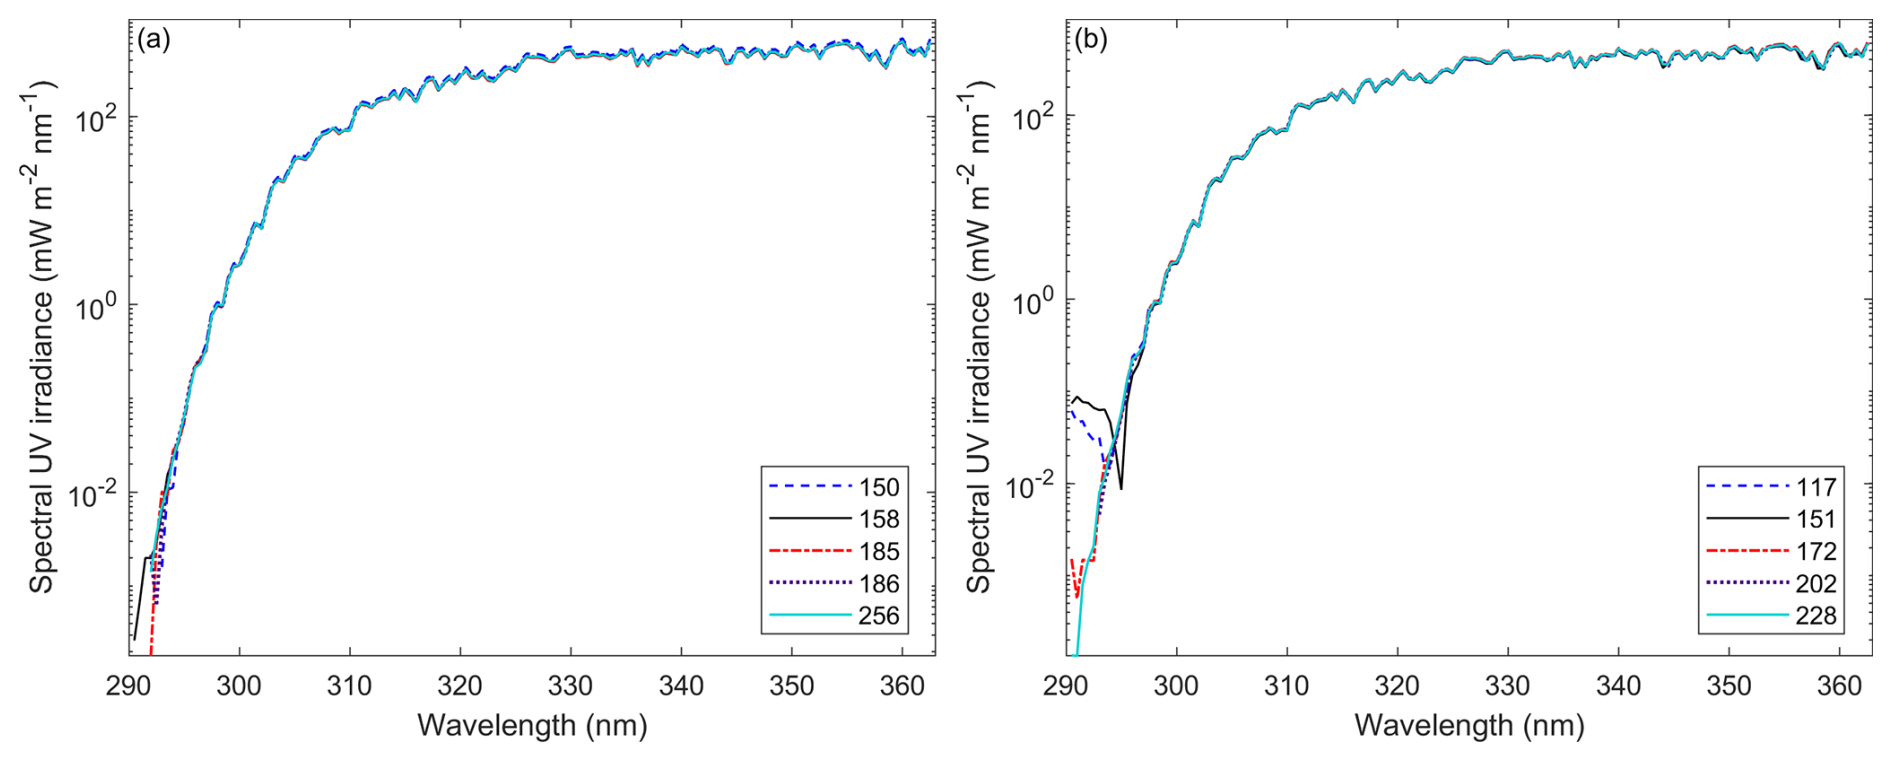
Figure 1Spectral UV irradiance recorded at 14:00 UTC on 13 September 2023 by all the Brewer spectrophotometers studied. (a) First group formed by double Brewers with cosine correction (#150, #158, #185, # 186, and #256). (b) Second group formed by two single (#117 and #151) and three double (#172, #202, and #228) Brewers with no cosine correction.
Figure 1 illustrates one of the UV spectra recorded on 13 September 2023. This will help explain the behaviour of the combined standard uncertainty presented in the following section. As can be seen from Fig. 1, the spectral UV irradiance increases rapidly between 290 and 310 nm (due to the decrease of the ozone absorption). Then, from 315 nm onwards, it levels off. For wavelengths shorter than 300 nm, the single Brewers (#117 and #151) are unable to measure UV irradiance with the same accuracy as the double-monochromator instruments.
4.1 Combined standard uncertainty
The absolute combined standard uncertainty (in mW m−2 nm−1) of all Brewer spectrophotometers depends on the wavelength and the solar zenith angle (SZA), in a similar way to the spectral UV irradiance (see Fig. 1). That is, the absolute uncertainty increases as the wavelength grows and SZA decreases. Below 300 nm, the differences between double and single Brewers increase greatly, with single Brewers (#117 and #151) having absolute uncertainties that are at least triple those of double Brewers. This was expected, as single Brewers are affected greatly by stray light and the effect of its correction is more pronounced in the UV-B region. On the other hand, there are slight variations between the absolute uncertainties of double Brewers, mostly caused by the correction of (a) the dark signal and noise at short wavelengths and (b) the dead time and cosine error at larger wavelengths. The influence of these uncertainty sources will be studied in the following section (sensitivity analysis).
To better understand the magnitude of the combined standard uncertainty, it is interesting to study its relative values (in %). The relative combined standard uncertainty (the absolute combined standard uncertainty divided by the UV irradiance measured) is instrument-specific because it depends on the Brewer individual components as well as on the frequency of maintenance and calibration (wavelength and radiometric) procedures. In this way, for the Brewers belonging to the first group (cosine correction implemented), the relative uncertainty ranges from 2.5 to 4 % for wavelengths between 310 and 360 nm. On the other hand, the remaining Brewers (whose cosine error could not be characterised) show relative uncertainty values from 3 % to 5 % for wavelengths between 310 and 360 nm. Furthermore, the relative combined standard uncertainty of all Brewers depends on both the wavelength and the SZA.
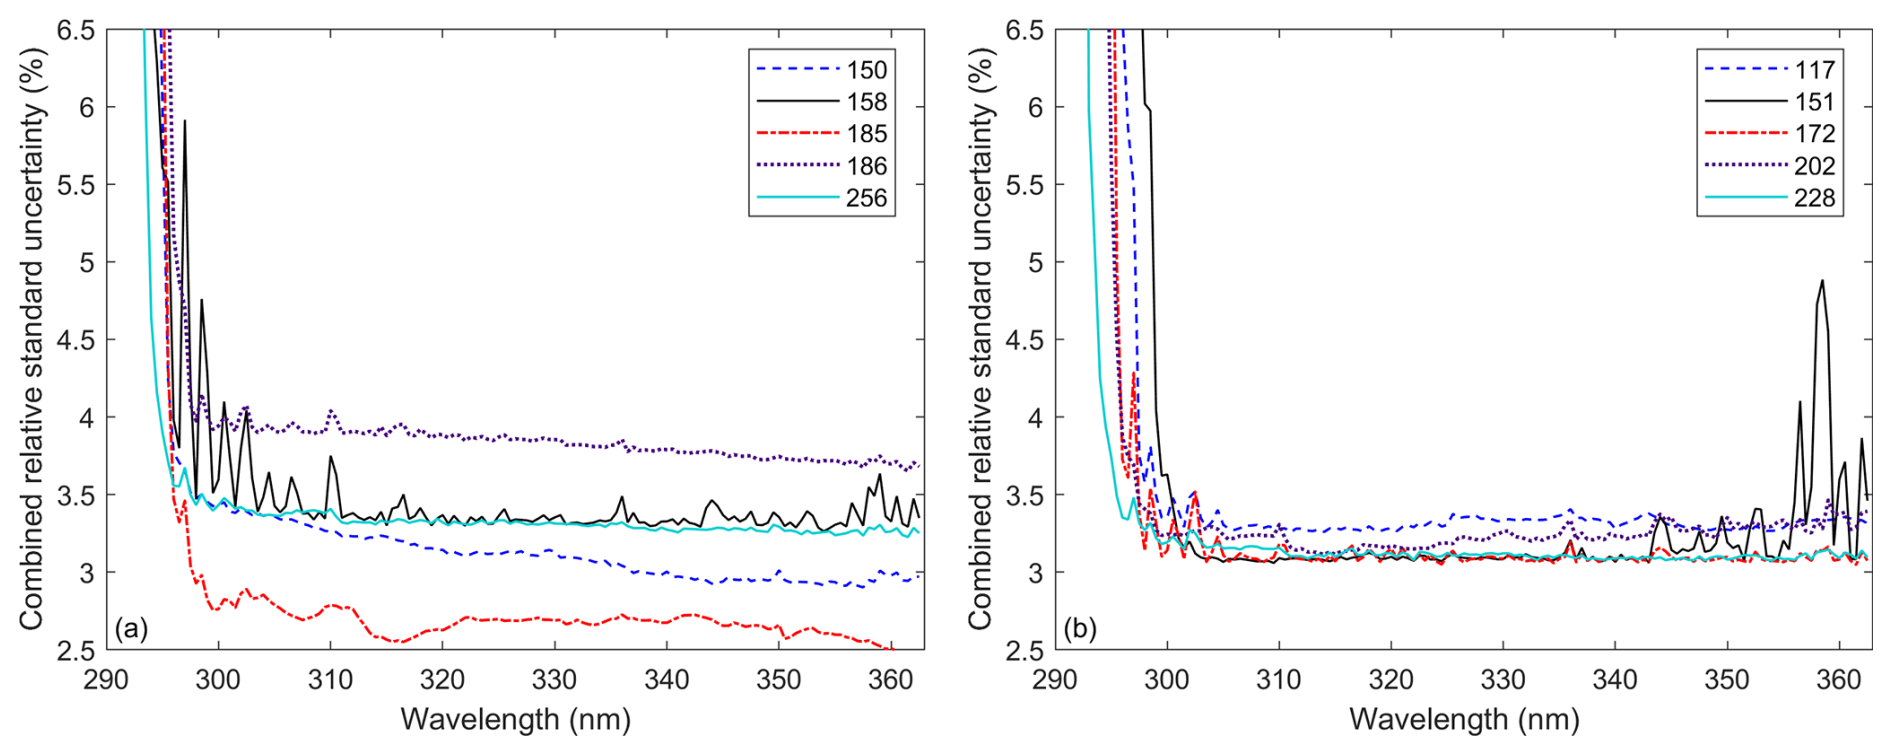
Figure 2Relative combined standard uncertainties of the UV irradiances shown in Fig. 1. (a) First group (double Brewers with cosine correction). (b) Second group (two single and three double Brewers with no cosine correction implemented).
To illustrate the wavelength dependency, the relative uncertainties of the UV scan performed on 13 September 2023 at 14:00 UTC (40° SZA) are shown in Fig. 2. It should be noted that the relative uncertainties of all Brewers increase significantly below 300 nm, as the UV irradiances measured are very small, close to 0 W m−2 nm−1. Between 300 and 360 nm, the relative combined standard uncertainty of some Brewer spectrophotometers (a) decreases slightly with wavelength (#150 and #186), (b) increases gradually with wavelength (#202), (c) fluctuates significantly (#158 at short wavelengths and #151 at large wavelengths), and (d) is approximately constant (#117, #172, #185, #228, and #256). The reason for these behaviours will be discussed later in Section 4.3 (sensitivity analysis).
Regarding the angular dependency, Fig. 3 represents all the relative uncertainty values derived on 13 September at 305 nm. This wavelength was selected because its analysis is interesting for studying ozone variability and biological effects. Figure 3 shows that the relative combined standard uncertainty of the Brewers studied increases with SZA at short wavelengths. This increase is more marked for the Brewers in the second group (no cosine correction), especially for the single Brewers, due to the uncertainty in stray light correction.
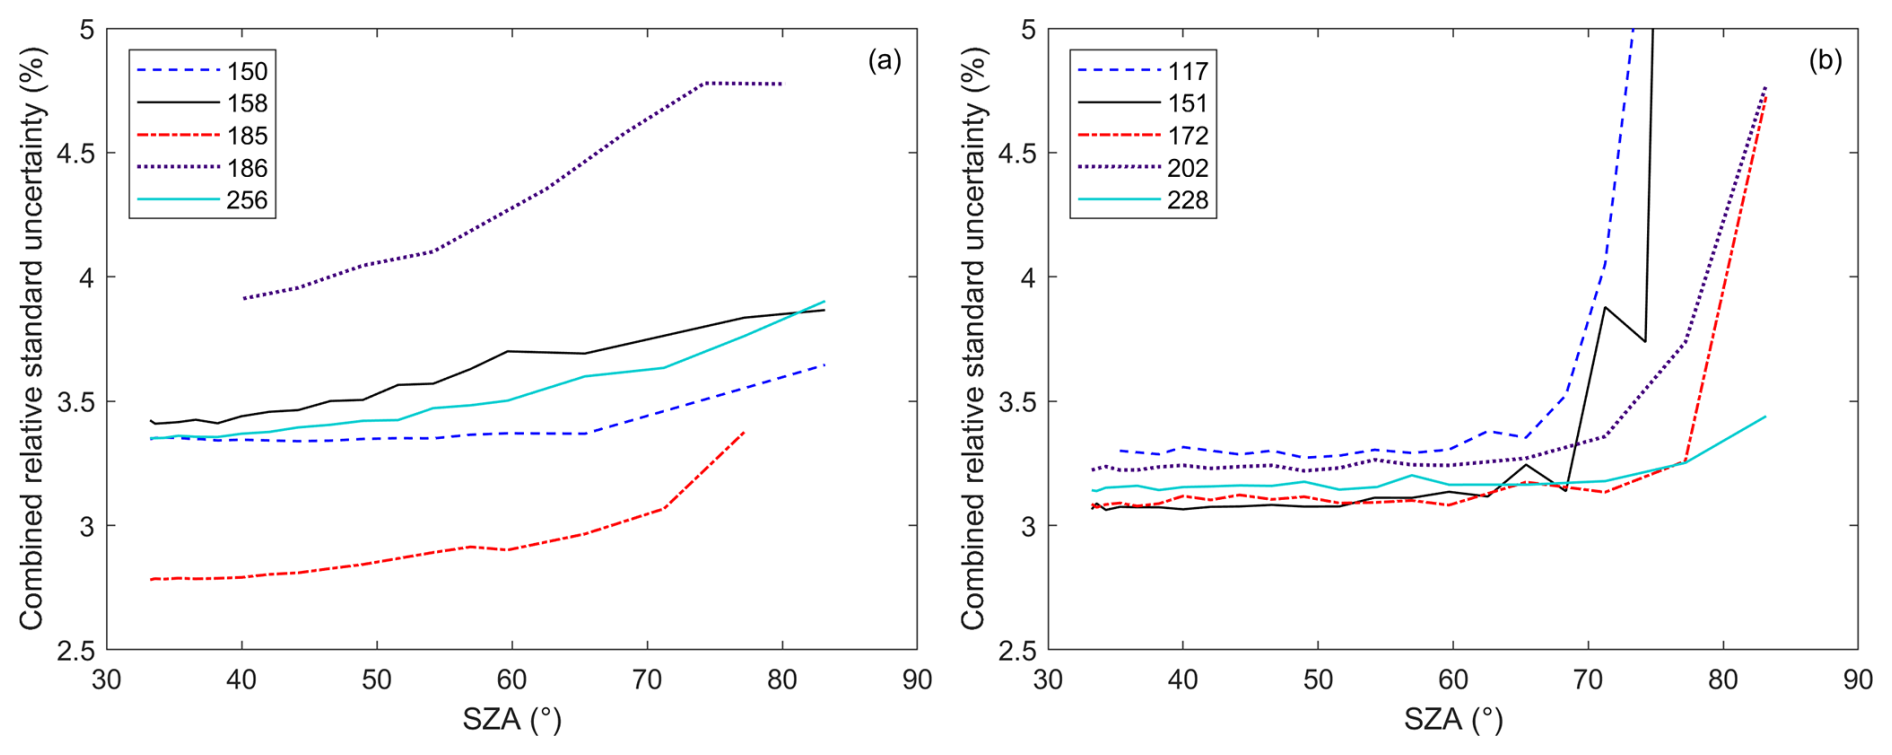
Figure 3Relative combined standard uncertainties of all UV irradiances measured on 13 September 2023 at 305 nm. (a) First group (double Brewers with cosine correction). (b) Second group (two single and three double Brewers with no cosine correction implemented).
4.2 Comparison against the QASUME
The corrections applied to the measured irradiance (described in Sect. 3.2) are recommended by numerous studies to improve the quality of the measurements (e.g. Fountoulakis et al., 2016b; Garane et al., 2006; Kerr, 2010; Lakkala et al., 2008, 2018). This was also verified during the 18th RBCC-E campaign. The results reported by López-Solano et al. (2024) showed that including the cosine correction improves considerably the comparison to the QASUME, in agreement with the findings of Hülsen (2023). Although the campaign report shows the ratio of each participating Brewer to the QASUME (see Hülsen, 2023), it is interesting to represent the ratio of all studied Brewers together. In this way, Fig. 4 displays the global irradiance ratio to the QASUME obtained by dividing the irradiances shown in Fig. 1 by the irradiance recorded by the QASUME unit.
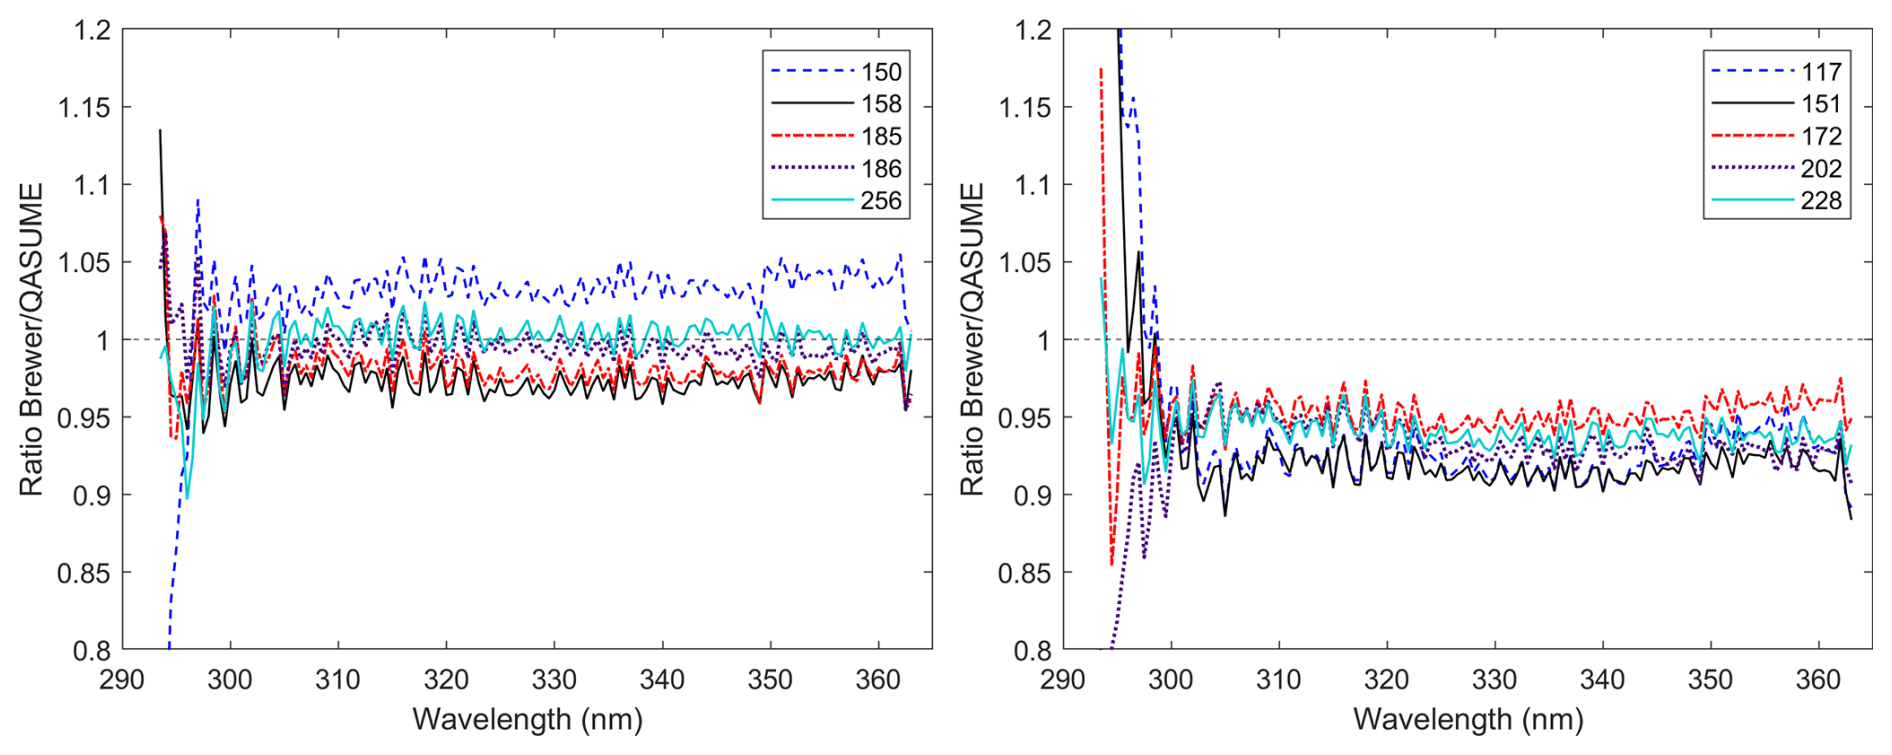
Figure 4Global irradiance ratio to the QASUME recorded on 13 September at 14:00 UTC. (a) First group (double Brewers with cosine correction). (b) Second group (two single and three double Brewers with no cosine correction implemented).
Figure 4 shows the effectiveness of the cosine correction, as Brewers with such correction implemented (Fig. 4a) report irradiances more similar to the one measured by the QASUME. Nevertheless, the agreement between all Brewer spectrophotometers and the QASUME is within ±10 % for wavelengths above 310 nm. This target agreement (10 %) has been used in previous intercomparison campaigns to assess the performance of the participating instruments (e.g. Bais et al., 2001; Diémoz et al., 2011).
Furthermore, the irradiance uncertainty found for each Brewer in the previous section can be used to derive the uncertainty of their ratio to the QASUME. Table 3 summarises the combined standard uncertainty of the average Brewer/QASUME ratio measured on 13 September between 310 and 360 nm. These uncertainties were computed by combining the irradiance uncertainty of each Brewer and the one from the QASUME, provided by Hülsen et al. (2016).
Table 3Number of simultaneous scans (N), mean ratio to the QASUME, and its combined standard uncertainty (both absolute and relative) determined between 310 and 360 nm on 13 September.
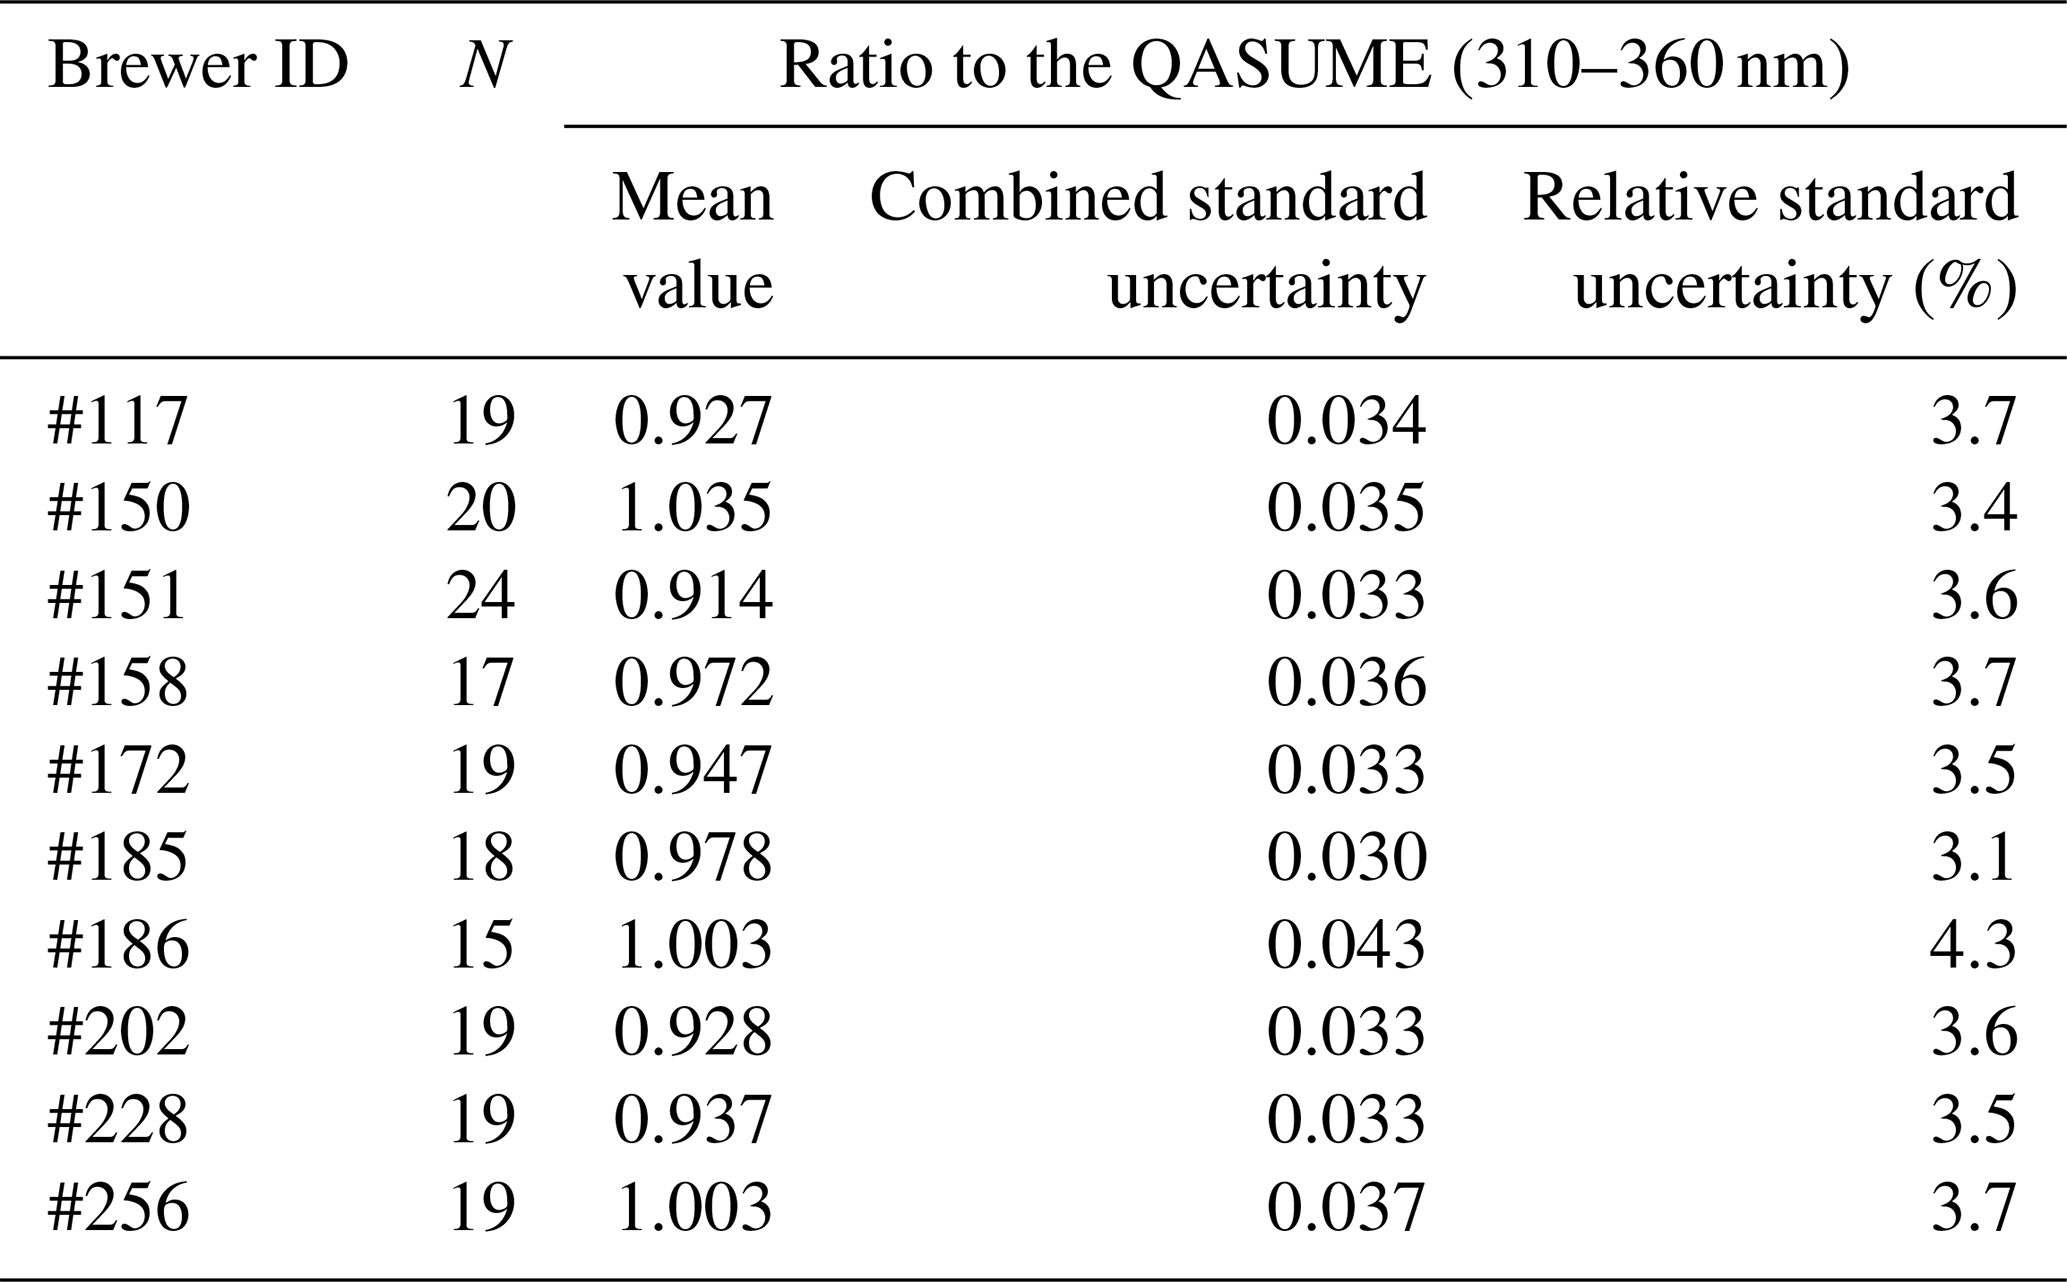
Table 3 shows that only those Brewer spectrophotometers with a cosine correction implemented (#150, #158, #185, #186, and #256) include the ideal value of the ratio (unity) within their uncertainty interval. The remaining Brewers (second group) underestimate the UV irradiance and deviate from unity. This is likely caused by the cosine and temperature errors of the instruments, which could not be corrected (there was no available information regarding their characterisation). Therefore, to further improve the performance of these uncorrected Brewers, these two sources must be characterised and corrected.
4.3 Sensitivity analysis
To clarify which uncertainty sources are responsible for the different behaviours found for each Brewer, a sensitivity analysis has been performed. Generally, for wavelengths above 300 nm, the dominant uncertainty sources are radiometric stability, cosine correction (if implemented), and the uncertainty of the reference lamp. As an example, the contribution of each uncertainty source to the combined standard uncertainty is shown in Fig. 5 for a single (#117) Brewer and in Fig. 6 for a double (#185) Brewer spectrophotometer. As the intensity of the incoming UV radiation decreases, i.e. as the wavelength decreases and SZA rises, the uncertainty associated with the correction of the dark signal, stray light (if the Brewer is a single monochromator), and noise begins to gain influence. In fact, for wavelengths below 295 nm, they become the dominant sources (see Figs. 5 and 6). However, there were exceptions to this behaviour (mainly Brewers #117, #151, #158, and #202), showing that the uncertainties in noise and wavelength shift can also become dominant uncertainty sources in the UV-A region (315–400 nm). Regarding the calibration of the instrument (uncertainty sources affecting the responsivity and the signal measured under the reference lamp), it leads to irradiance uncertainties that range from 2.3 % (Brewer #185) to 3.8 % (Brewer #150).
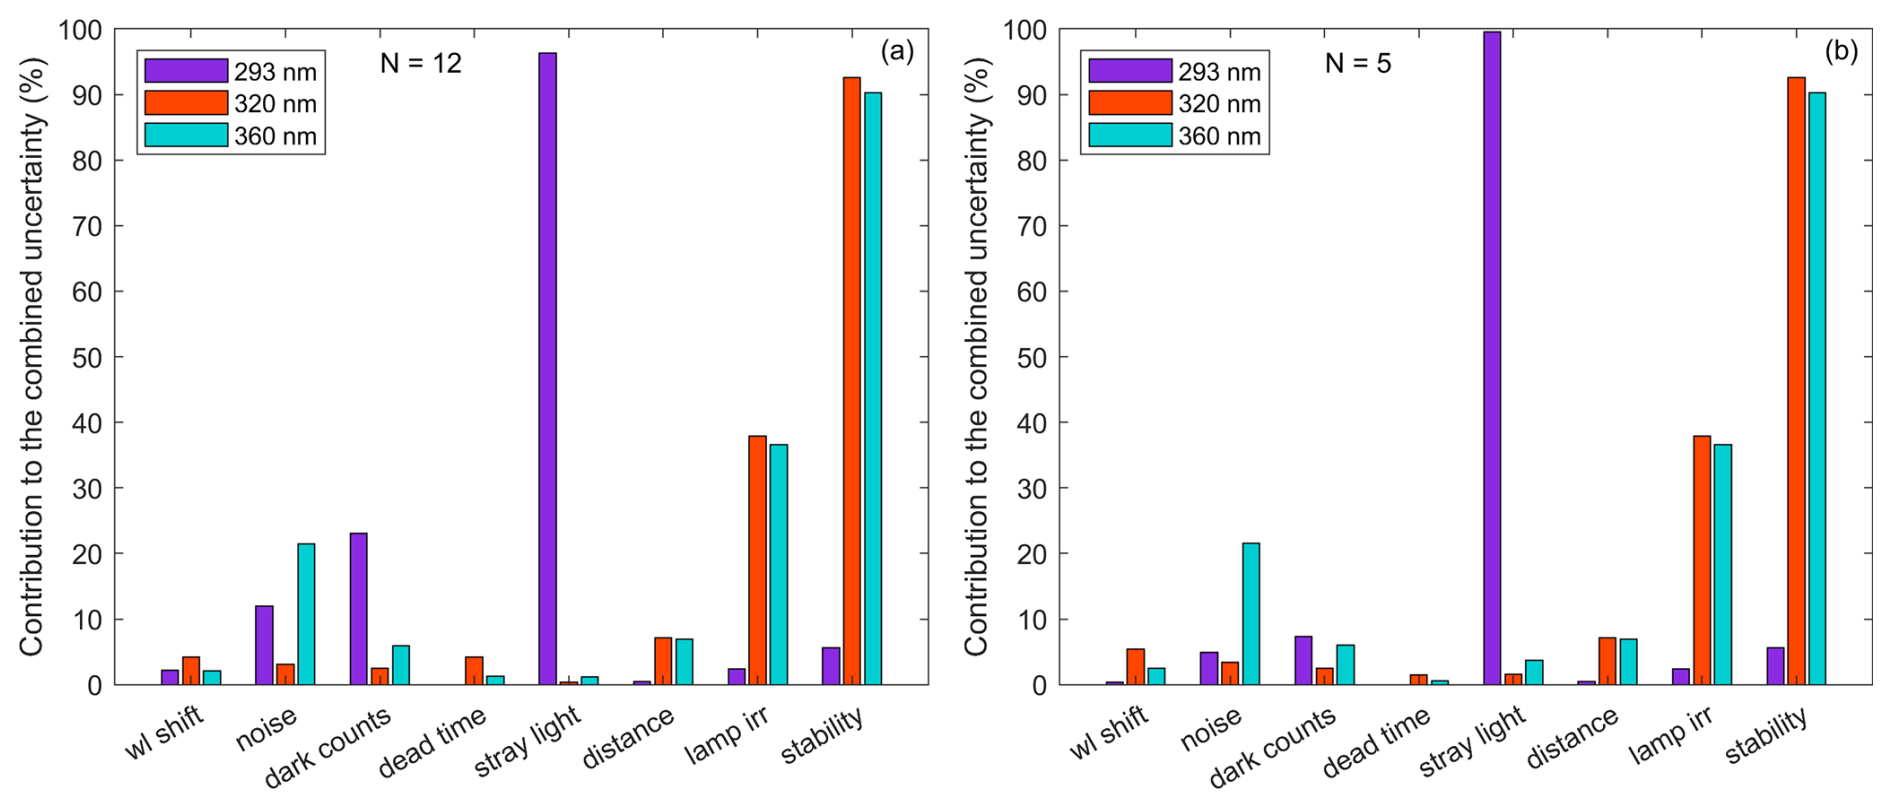
Figure 5Relative contribution of the uncertainty sources of a single-monochromator Brewer (#117) to the combined standard uncertainty of the UV spectrum measured at three wavelengths (293, 320, and 360 nm) and two SZAs: (a) 35 and (b) 63°. Each contribution was calculated from the average over a ±1° SZA band, with N being the number of measurements considered for the average.
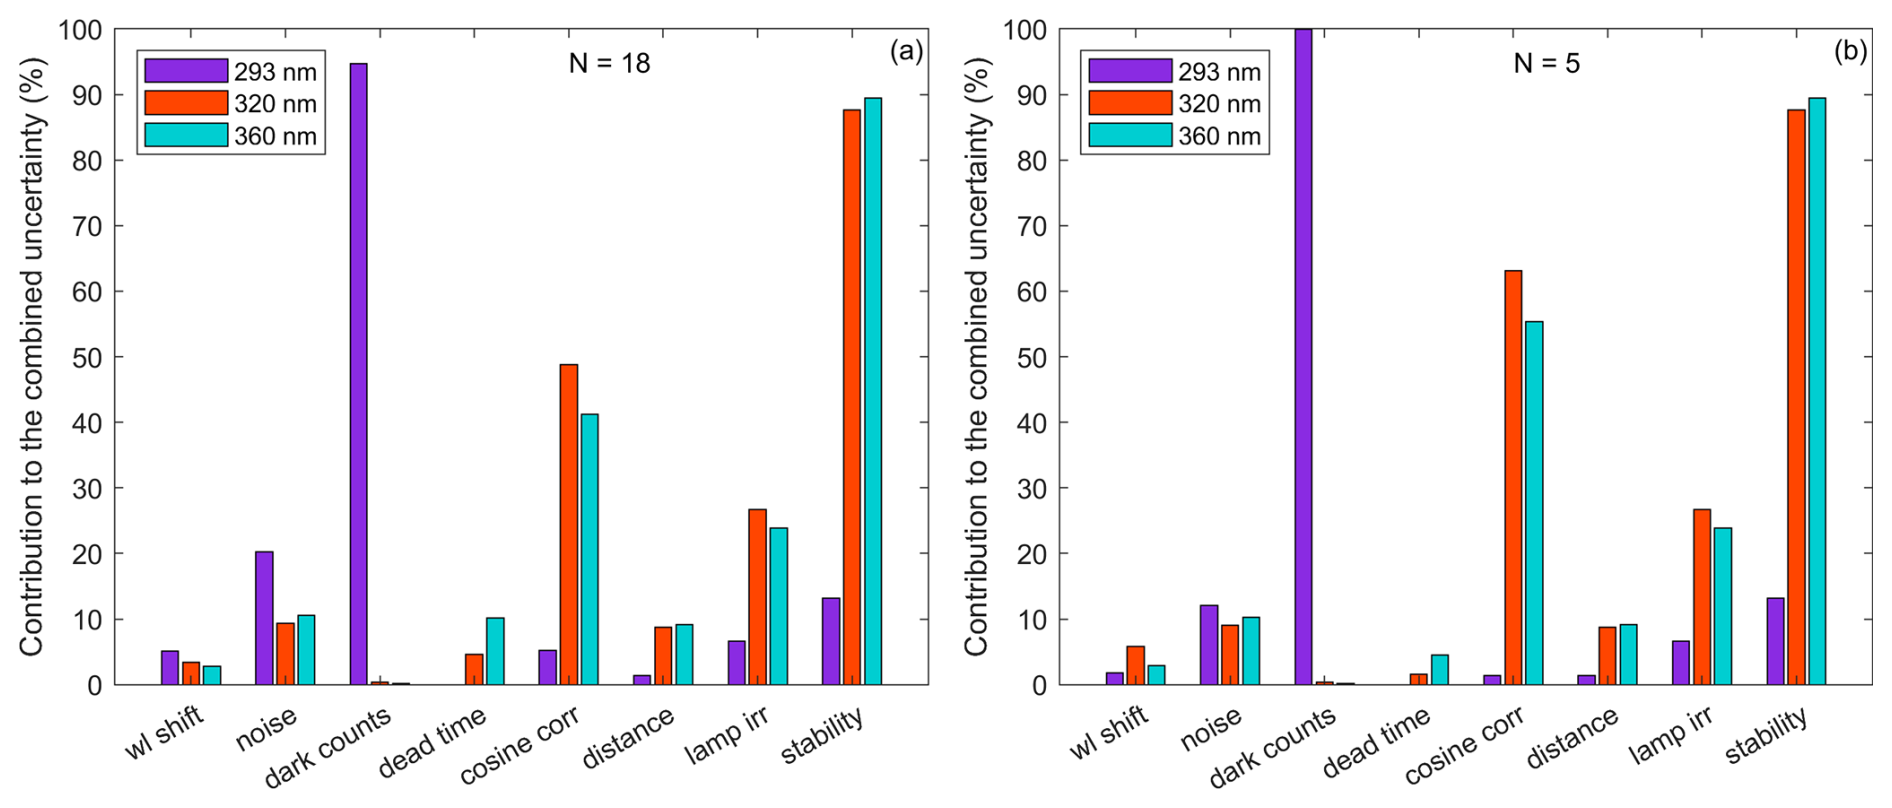
Figure 6Relative contribution of the uncertainty sources of a double-monochromator Brewer (#185) to the combined standard uncertainty of the UV spectrum measured at three wavelengths (293, 320, and 360 nm) and two SZAs: (a) 33 and (b) 63°. Each contribution was calculated from the average over a ±1° SZA band, with N being the number of measurements considered for the average.
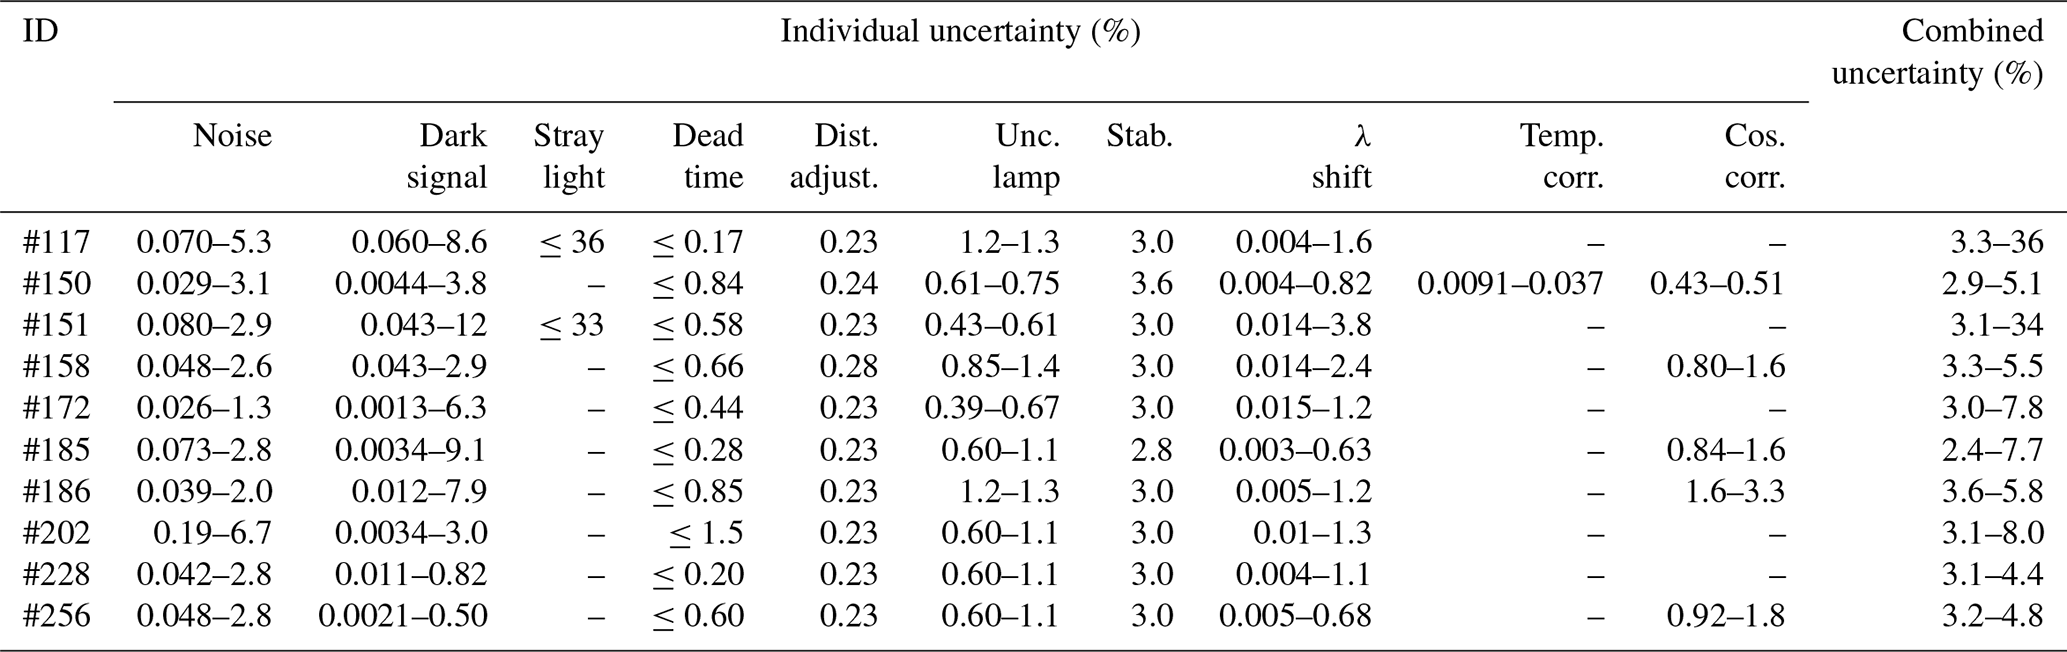
As a summary, Table 4 shows the relative individual and combined standard uncertainties for each Brewer under study at SZAs below 80° and wavelengths larger than 300 nm. Larger SZAs and shorter wavelengths have not been included in this table, as the relative uncertainties increase greatly because the UV irradiance measured approaches 0 (see Fig. 1).
Table 4Range of the irradiance uncertainties produced by each uncertainty source individually and the combined standard uncertainty for SZAs below 80° and wavelengths larger than 302 nm for each of the Brewers studied.
In the following, the influence of each uncertainty source on the total uncertainty budget will be described in greater detail.
4.3.1 Noise
For most Brewers, the irradiance uncertainty produced by noise was most dominant (second or third most influential source of uncertainty) for wavelengths below 300 nm. At larger wavelengths, above 310 nm, this source loses influence, resulting in an uncertainty of less than 0.6 % in the UV irradiance measured, regardless of the intensity of the incoming radiation. Brewer #117 was an exception: with an SNR of 0.1, noise led to irradiance uncertainties of up to 0.9 %. In this case, noise was the third most dominant source for wavelengths larger than 330 nm (see Fig. 5). This indicates that more efforts should be made to thoroughly characterise the measurement noise of the instruments during the intercomparison campaigns.
4.3.2 Dark signal
The irradiance uncertainty caused by dark signal correction is important solely at wavelengths smaller than 295 nm. For larger wavelengths, its impact can be disregarded, as dark signal correction leads to irradiance uncertainties of less than 0.06 % in double-monochromator Brewers. It is interesting to note that single Brewer spectrophotometers showed larger dark signal contributions. For example, for wavelengths above 310 nm, the dark signal caused irradiance uncertainties of 0.3 %. These two Brewers (Brewers #117 and #151) recorded during the campaign larger dark signals than double Brewers. As a result, the standard deviation obtained is greater as well (see Sect. 3.1.1), resulting in a larger contribution.
4.3.3 Stray light
Stray light was considered only for the uncertainty evaluation of single-monochromator Brewers, i.e. Brewers #117 and #151. The sensitivity analysis shows that the irradiance uncertainty produced by stray light correction increases rapidly as wavelength decreases. Furthermore, it also increases with SZA, as shown in Fig. 5. For single Brewers and at wavelengths below 300 nm, stray light is the dominant source, accounting for more than 95 % of the total uncertainty budget.
4.3.4 Dead time
The dead time contribution increases with the number of UV photons recorded, i.e. as SZA declines and wavelength rises. Most of the Brewers used in this study have an uncertainty of 1 ns in their dead time, which results in a maximum uncertainty in the irradiance measured of 0.2 % at 68° SZA and 0.8 % at 33° SZA. Therefore, dead time is not a dominant uncertainty source as long as the instrument is properly maintained and becomes significant only at small SZAs (fourth or fifth most influential source). However, this is not true for larger dead time uncertainties, as is the case of Brewer #202. Because its dead time uncertainty is 3 ns, the maximum uncertainty produced in the irradiance measured is 0.8 % at 57° and 1.5 % at 33°. This larger uncertainty is likely caused by the replacement and voltage adjustment of the standard lamp during the RBCC-E campaign (WMO, 2024). Thus, for this Brewer, the dead time correction is the second most influential uncertainty source for wavelengths larger than 320 nm. This shows the importance of (a) monitoring the voltage of the PMT, (b) maintaining the DT of the instrument within 2 ns, and (c) the maintenance procedures performed during the RBCC-E campaigns.
Finally, the irradiance uncertainties previously estimated can be compared to the ones reported by Fountoulakis et al. (2016b). Their study shows that if the DT ranges from 15 to 45 s and has an error of 2 ns, it leads to irradiance uncertainties of 0.12–0.13, 0.25–0.28, and 0.69–1.13 % for signals of 1, 2, and 5 million counts s−1, respectively. These values are similar to the ones found for all Brewers, except Brewer #202, which has an uncertainty larger than 2 ns. For these Brewers, the irradiance uncertainty is less than 0.15, 0.35, and 0.9 % for signals of 1, 2, and 5 million counts s−1, respectively.
4.3.5 Distance adjustment
An uncertainty of 0.58 mm when placing the reference lamp at 500 mm results in a 0.23 % uncertainty in irradiance. On the other hand, Brewers #150 and #158 display slightly different results, as their reference lamps were placed at 413 and 497.7 mm with uncertainties of 0.58 and 0.59 mm, respectively (see Sect. 3.1.2). For these Brewers, the distance adjustment leads to uncertainties of 0.24 % (#150) and 0.28 % (#158). According to Webb et al. (1998), if the nominal distance is d and its uncertainty is ud, the percentage uncertainty can be calculated using the inverse square law (1/r2, where r is the distance between the lamp and instrument) as . Therefore, the previous results agree with the formula proposed by Webb et al. (1998). It should be noted that all uncertainty sources involved in the calibration of the instrument (distance, uncertainty of the reference lamp, and radiometric stability) have no angular dependency. As they affect only the responsivity of the instrument, they have the same influence on all UV measurements, as shown in Eq. (8). Furthermore, the uncertainty produced by the distance adjustment has no spectral dependency. Because the reference lamp can be regarded as a point source, the UV irradiance follows the inverse square law. Therefore, a change in distance has the same effect on all wavelengths measured.
4.3.6 Uncertainty of the reference lamp
The uncertainty of the 1000 W lamps used during the calibration is the second most dominant uncertainty source in the UV-A region. The irradiance uncertainty depends on the lamp used and the wavelength measured, ranging from 0.6 %–1.4 % at 290 nm to 0.4 %–1.2 % at 360 nm. The Brewer spectrophotometers least affected by this uncertainty source had been calibrated using two reference lamps during the intercomparison campaign (such as Brewers #172 and #151). Therefore, a calibration protocol of Brewer spectrophotometers should be defined to include the usage of more than one reference lamp so as to reduce the overall uncertainty of the instrument. This agrees with the recommendations of Webb et al. (1998), who suggest calibrating the instruments using three reference lamps.
4.3.7 Radiometric stability
Radiometric instability is the dominant uncertainty source for all Brewer spectrophotometers for wavelengths larger than 300 nm (see Figs. 5 and 6). For most Brewers, this uncertainty source leads to irradiance uncertainties of 3 %. This was expected, as the UV irradiance is inversely proportional to the responsivity (as shown in Eq. 8), and a 3 % uncertainty in the responsivity was assumed for most Brewers, in agreement with the findings of Garane et al. (2006) and Lakkala et al. (2008) (see Sect. 3.1.2.). On the other hand, Brewers #150 and #185 had their instability characterised using their calibration records and reported irradiance uncertainties of up to 3.6 % and 2.5 %, respectively. Brewer #150 is calibrated yearly using 1000 W lamps, while Brewer #185 is calibrated approximately every 2–3 months using 200 W lamps and yearly with 1000 W lamps. Therefore, strict calibration protocols must be defined and followed, and the current calibration frequency of most of the participating Brewers should be increased (from annual to monthly) to reduce the instrument's combined standard uncertainty.
4.3.8 Wavelength shift
Wavelength shifts are responsible for the rapid fluctuations of the relative uncertainties of Brewers #151 and #158 (see Fig. 2). The spikes were larger for Brewer #151, as the wavelength shifts of this instrument, for wavelengths above 350 nm, were 10 times larger than the ones of the other Brewers. For Brewer #151, a wavelength shift of 0.12 nm at 355 nm resulted in a relative irradiance uncertainty of 4 %, becoming the dominant uncertainty source in this region. This is interesting because it shows the influence wavelength shifts can have on the UV-A irradiance measured. On the other hand, Brewer #158 has shifts of 0.05 nm, resulting in a 1 % uncertainty in the irradiance for wavelengths between 310 and 360 nm. Furthermore, these large wavelength shifts indicate that the dispersion function of these instruments might be outdated. Therefore, special attention should be paid to the wavelength scale of the instrument by performing frequent and accurate wavelength calibrations.
For the remaining Brewers, the contribution of wavelength shift is negligible for wavelengths above 300 nm (less than 0.3 %). At shorter wavelengths, shifts of 0.03 nm can produce up to 20 % irradiance uncertainty. Nevertheless, they are not a dominant uncertainty source regardless of the wavelength and SZA measured (see Figs. 5 and 6).
4.3.9 Temperature correction
Although temperature correction has an important effect on the UV irradiance measured, its uncertainty has no significant impact on the overall uncertainty of Brewer #150. In fact, it leads to an irradiance uncertainty of less than 0.2 % for SZAs below 75°. However, because the dependency on temperature is specific for each instrument (Fountoulakis et al., 2017), different results may be found for other Brewers.
4.3.10 Cosine correction
As mentioned earlier, this uncertainty source could be studied only for Brewers #150, #158, #185, #186, and #256, as they are the only ones with a characterised angular response. Figure 7 shows that the uncertainty in cosine correction has a great impact on the uncertainty budget of most Brewers, leading to an average irradiance uncertainty that ranges from 0.4 % (#150) to 1.9 % (#186) at 33° SZA. Brewer spectrophotometers #158, #185, and #256 present an intermediate situation, with uncertainties of around 1.4 % in the irradiance measured. These differences are likely due to the entrance optics. Brewers #185, #186, #256, and #158 have a flat diffuser, whereas Brewer #150 has a shaped diffuser. Furthermore, the irradiance uncertainty caused by cosine correction increases gradually with SZA for all Brewers except #150. Consequently, this uncertainty source is responsible for the increase in the relative combined uncertainty standard with SZA observed in Fig. 3a.
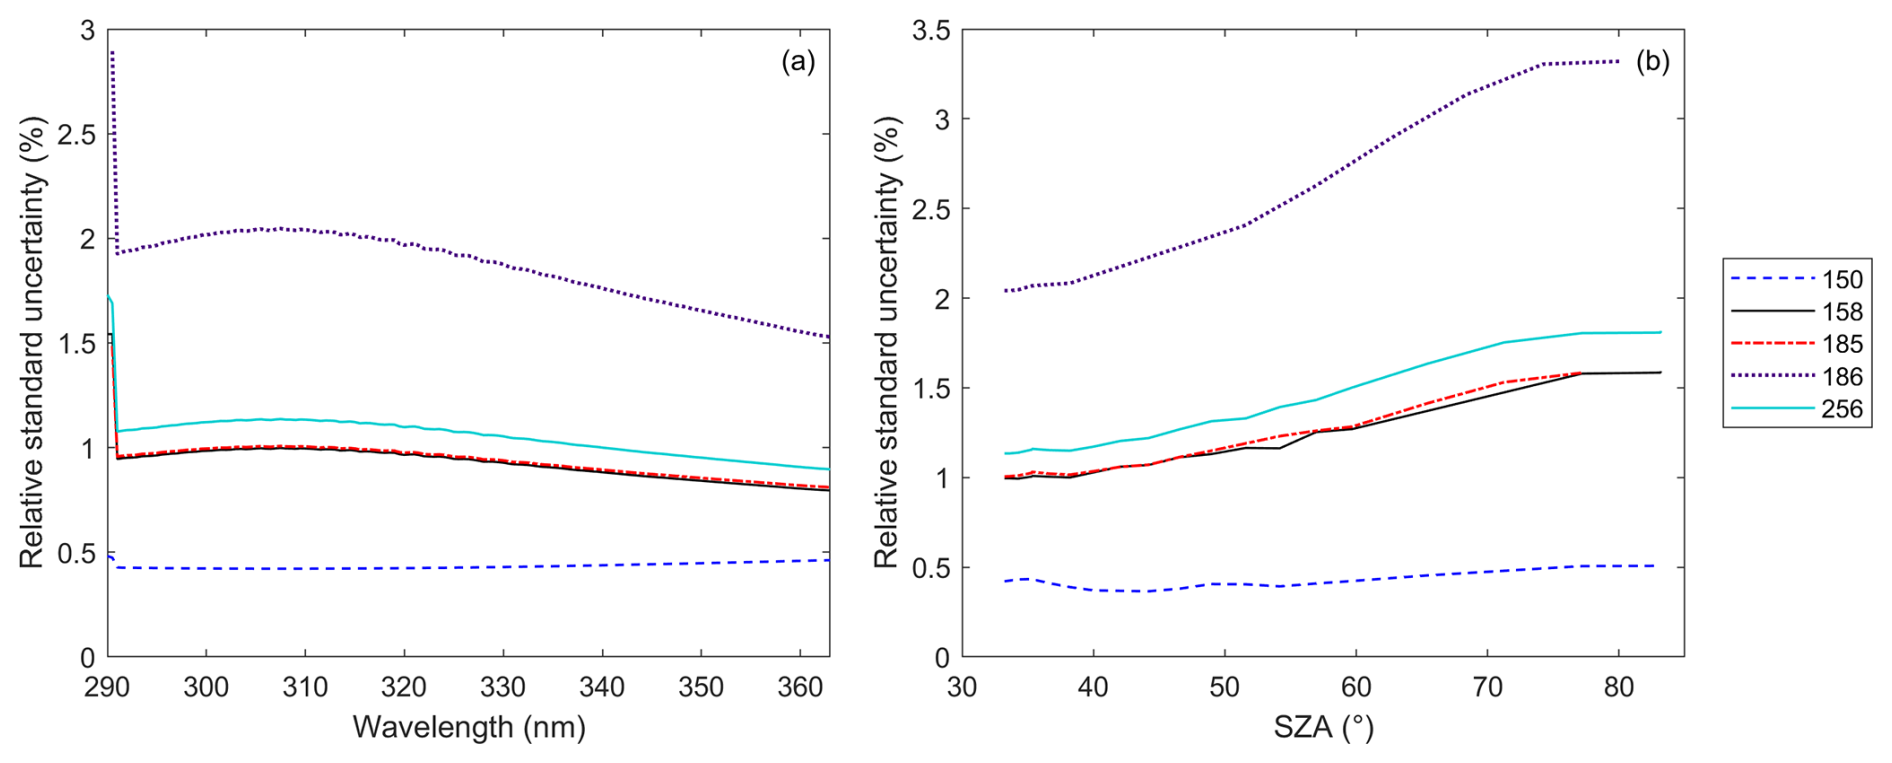
Figure 7Relative standard uncertainty on 13 September 2023 caused by the cosine correction implemented. (a) Spectral dependency at 12:30 UTC. (b) SZA dependency at 305 nm.
The uncertainties shown in Fig. 7 are mostly produced by the uncertainties of the diffuse (fd) and direct (fr) cosine errors. In fact, these factors account for more than 98 % of the total irradiance uncertainty caused by cosine correction. As for the direct-to-global irradiance ratio, its impact on the uncertainty budget is negligible, as only cloud-free conditions have been considered in the analysis. This would likely change if overcast or mixed sky conditions were to be included in the uncertainty evaluation. Therefore, under cloud-free conditions, the main sources of uncertainty in the cosine correction are the errors committed in the angular characterisation and in the assumption of isotropic sky radiance to calculate the diffuse cosine error.
For Brewer spectrophotometers #158, #185, #186, and #256, the correction of the cosine error is the second most important source of uncertainty for wavelengths larger than 300 nm, regardless of the SZA. For Brewer #150, thanks to its improved angular response, this source has less impact, being the third most influential uncertainty source for SZAs larger than 50°.
In the previous section, the combined standard uncertainty and the main sources of uncertainty of single and double Brewer spectrophotometers have been determined. These aspects are of great interest for identifying the types of studies for which Brewers are most suitable, given that the required uncertainty in global UV irradiance measurements depends on the intended use of the data.
One of the key applications of spectral UV measurements is the computation of effective irradiance for various biological effects, such as erythema, vitamin D synthesis, melanoma risk, and DNA damage, through the integration of the spectral irradiance weighted by different action spectra (Webb et al., 2011). The findings benefit regulatory applications, supporting evidence-based UV exposure limits for outdoors workers (ICNIRP, 2010) and improving standards for Sun protection products (Young et al., 2017). For these types of studies, the standard procedure is to use instruments with relative erythemal and UV irradiances of less than 7 % in the UV-B region (e.g. Bilbao and de Migue, 2020; Cede et al., 2002; McKenzie et al., 1991). Therefore, double Brewer spectrophotometers are suitable for biological studies. However, single Brewers might be limited, as their relative uncertainty rises rapidly with SZA (see Fig. 3), up to ∼30 % at 302 nm. This increase is mainly produced by the uncertainty in stray light correction (see Fig. 5 and Table 4), which indicates that the five-wavelength method implemented (described in Sect. 3.1.1) might need improvement.
Furthermore, spectral UV measurements are also used for the validation of satellite-based UV products from instruments such as OMI, TROPOMI, and TEMPO. In these validation studies, the standard uncertainty of the ground-based instruments used is on the order of 4 %–10 % (e.g. Klotz et al., 2025; Weihs et al., 2008; Zempila et al., 2016). Consequently, the UV data from both MkIV and MkIII Brewer spectrophotometers are reliable for satellite validation for wavelengths above 305 and 302 nm, respectively.
The more demanding application of spectral UV measurements is trend detection. It requires high-quality and long-term measurements (Bernhard, 2011; Glandorf et al., 2005; Weatherhead et al., 1998), as the trends are expected to be small. For example, between the 1990s and 2010s, long-term trends in the UV index (UVI), global UV, and erythemal irradiance have typically been a few percent per decade, generally from 2 % to 10 % per decade (Bernhard and Stierle, 2020; Bilbao et al., 2011; De Bock et al., 2014; Fitzka et al., 2012; Fountoulakis et al., 2016a, 2018). This indicates that double Brewers are able to detect the current changes in UV irradiance above 305 nm as long as they are properly maintained and their irradiances are corrected. On the other hand, the single Brewers studied can also reliably detect these changes at SZAs below 70° and wavelengths above 305 nm.
Finally, an even more ambitious goal is to detect the long-term change in spectral UV irradiance caused by a 1 % change in ozone (Seckmeyer et al., 2001). Bernhard and Seckmeyer (1999) calculated that a 1 % change in ozone results in a 4 % change in global UV irradiance at 300 nm (30° SZA and 300 DU). Since the expanded uncertainty (k=2) of the Brewers studied (single and double) ranges from 5.5 % to 7.8 % at 33° and 300 nm, the detection of such a trend might be beyond their capabilities. This holds even if the Brewer spectrophotometer is fully corrected and properly maintained, indicating that a substantial reduction of its uncertainty is required (the recommendations for this task are outlined in Sect. 6). If the trend detection threshold were relaxed from a 1 % to a 3 % change in total ozone, then the instruments studied in the first group (cosine correction implemented) would be able to reliably detect the resulting change in spectral UV irradiance at 300 nm and SZAs below 70°. The remaining Brewers would be able to detect such change at 300 nm for SZAs below 60°.
The uncertainties of the UV spectra measured by eight double- and two single-monochromator Brewer spectrometers have been estimated using a Monte Carlo method. The UV scans studied were performed under cloud-free conditions during the 18th RBCC-E intercomparison campaign at the El Arenosillo Observatory (Huelva, Spain).
Using the information provided by participating operators and EuBrewNet, the uncertainty sources of the 10 Brewers were characterised. This was difficult because the available data for many uncertainty sources were either limited (such as radiometric stability, stray light, and noise) or unavailable (cosine error and temperature dependence). Therefore, further work is needed to characterise the Brewer network thoroughly. Furthermore, this study also shows the necessity of establishing coherent QC procedures. The results obtained in this work may vary from the QC performed by other Brewer operators, as their instrument characterisation and processing algorithms can differ.
Once characterised, the combined standard uncertainty (absolute and relative values) was derived, and a sensitivity analysis was performed to identify the most influential uncertainty sources.
The absolute combined standard uncertainty (in mW m−2 nm−1) of single- and double-monochromator Brewers increases with increasing wavelength and decreasing SZA. For single Brewers, the absolute values are 3 times higher than those of double Brewers due to the uncertainty in stray light correction. Small differences between double Brewers are observed, due to the influence of the correction of (a) the dark signal and noise below 300 nm and (b) the dead time and cosine error at larger wavelengths. Regarding the relative values (the absolute combined standard uncertainty divided by the UV irradiance measured) of all Brewers (single and double), they are instrument-specific and depend on both the instrument's individual characteristics and its calibration and maintenance protocols. Thus, a well-maintained Brewer can reach relative uncertainties of 2 %–3 % for wavelengths above 310 nm. On the other hand, instruments not following strict calibration and maintenance protocols can have large fluctuations in their uncertainties, due to operational issues. As a result, they show larger uncertainties, 3 %–5 % for wavelengths above 310 nm, and higher deviations from the QASUME (the European reference unit). For the Brewers studied, the relative uncertainty (in %) increases with SZA at short wavelengths. The increase is more marked for Brewers with no cosine correction implemented, especially for single Brewers. This behaviour is linked to wavelength shifts, noise, and the correction of stray light, cosine error, and dark counts. Furthermore, spikes in the relative combined standard uncertainty are expected if the wavelength shift is large enough. Thus, it is important to monitor the wavelength calibration of the instrument to keep wavelength shifts below 0.1 nm, as this shift leads to uncertainties of 3 % in the UV-A region.
For the 10 Brewer spectrophotometers analysed in this study, the average combined standard uncertainty in erythemal spectral irradiance ranges between 2.7 % and 3.9 %, with maximum values varying from 17 % for a single Brewer to 3.4 % for a double Brewer for wavelengths above 310 nm. This variability indicates the need of characterising each Brewer spectrophotometer individually rather than relying on generic values, which may not fully represent the precision these instruments can achieve (Gröbner et al., 2006). When integrating erythemal spectral irradiance to compute the UVI, the resulting uncertainty ranges from 2.7 % to 6.2 %. The UVI, along with cumulative erythemal irradiance doses, represents a fundamental metric for informing the public about the potential adverse effects of UV radiation (Lucas et al., 2019).
The sensitivity analysis performed shows that the sources of uncertainty in the Brewer signal (noise, dark signal, stray light, and dead time) are important for wavelengths below 300 nm and large SZAs. However, they can also become significant above 310 nm and for SZAs below 50° if the uncertainties of dead time and SNR are larger than 3 ns and 10 %, respectively. For wavelengths above 300 nm, cosine correction (when implemented), radiometric stability, and the uncertainty of the reference lamp are usually the most dominant sources, regardless of the SZA. Radiometric stability is the most influential out of these three uncertainty sources, causing an irradiance uncertainty of 3 %. This shows the importance of the maintenance of the instrument. Brewer spectrophotometers must be operated following stringent procedures and calibration schedules.
Based on the findings of this sensitivity analysis, to reduce the overall uncertainty of a Brewer spectrophotometer, it is recommended to (a) monitor the instrument's stability by calibrating it more than once a year, (b) calibrate the reference lamps periodically to ensure up-to-date calibration certificates, (c) monitor the dead time to ensure uncertainties of less than 2 ns, (d) monitor wavelength shifts and reduce them below 0.05 nm through frequent wavelength calibrations and accurate determinations of the instrument wavelength scale, and (e) calibrate the instrument using two or more reference lamps. Regarding the angular response of the instrument, it should be studied and the existing data reprocessed with the corresponding cosine correction. This correction is necessary to ensure the reliability of the Brewer UV data, as Brewer spectrophotometers with no cosine correction underestimate the spectral UV irradiance. Furthermore, this study is also essential to accurately determine the overall measurement uncertainty and to guarantee the instrument's suitability for detecting long-term UV trends.
The relative combined standard uncertainties of the Brewers used in this study can be compared with the ones obtained in previous studies. Garane et al. (2006) determined a combined standard uncertainty of 5.3 % at 320 nm for a single Brewer (MkII version). This value is slightly larger than the one obtained in our work at 320 nm (3.1 %–3.3 %). This is likely produced by cosine correction. While Garane et al. (2006) included this uncertainty source in their evaluation, none of the single Brewers participating in the RBCC-E campaign had their cosine error characterised. Regarding the double Brewers studied, their UV irradiance uncertainty ranges between 2.5 % and 5 % for wavelengths larger than 300 nm. These values are similar to the uncertainty found by Garane et al. (2006). They reported a relative uncertainty of 4.8 % for their double Brewer. Furthermore, the uncertainty of the double Brewers studied is also comparable to the European reference units, QASUME I and QASUME II. Hülsen et al. (2016) found relative uncertainties of 3.85 % and 3.67 % at 300 nm for QASUME and QASUME II, respectively. Moreover, the irradiance uncertainties determined in this work are similar to the ones described in other publications (Bernhard and Seckmeyer, 1999; Fountoulakis et al., 2020). Therefore, the relative combined standard uncertainties determined in this study are comparable to those of other UV spectroradiometers. This also applies to the uncertainties of erythemal irradiance and the UV index, as the values estimated are also similar to the ones found for other instruments (Bernhard and Seckmeyer, 1999; Cordero et al., 2007).
Finally, it should be noted that further work is needed to ensure that the uncertainty of all UV scans measured by Brewer spectrophotometers is evaluated. The Monte Carlo method used in this study is easy to implement, but it requires a large number of trials to provide reliable results. Considering the number of uncertainty sources in the Brewer measurement procedure, this results in a heavy calculation cost. On a standard laptop, it took around 8 h per UV scan measured to calculate the combined standard uncertainty and the sensitivity analysis (106 iterations). Although this execution time could be reduced by optimising the code or using a computer with better performance, the MCM can be impractical to evaluate the uncertainty of Brewers' long UV records.
The data used for this study are available at EuBrewNet (http://eubrewnet.aemet.es/, Agencia Estatal de Meteorología, 2025), and the code used was based on the algorithm available on Zenodo (https://doi.org/10.5281/zenodo.10973560, González et al., 2024a). The aerosol optical depth measured at INTA/El Arenosillo station was used for the cosine correction and can be downloaded from AERONET (Holben et al., 1998).
Conceptualisation, CG, JMV, and AS; Methodology, CG and AS; Software, CG and AS; Validation, CG, JMV, AR, JLS, JMSA, and AS; Formal analysis, CG and JLS; Investigation, CG and JMV; Resources, JMV, AR, JLS, JMSA, RK, ARDS, PB, AD, NJ, and GG; Data Curation, CG, JMV, AR, JLS, and AS; Writing – Original Draft, CG; Writing – Review & Editing, JMV, AR, JLS, JMSA, RK, ARDS, PB, AD, NJ, GG, and AS; Visualisation, CG; Supervision, JMV, AR, and AS; Funding acquisition, AS.
The contact author has declared that none of the authors has any competing interests.
Publisher’s note: Copernicus Publications remains neutral with regard to jurisdictional claims made in the text, published maps, institutional affiliations, or any other geographical representation in this paper. While Copernicus Publications makes every effort to include appropriate place names, the final responsibility lies with the authors. Views expressed in the text are those of the authors and do not necessarily reflect the views of the publisher.
The authors thank the European Brewer Network (http://eubrewnet.aemet.es/, last access: 17 October 2025) for providing access to the data. Furthermore, the authors are grateful to Vladimir Savastiouk, who provided most of the calibration records of the Brewers as well as insight on how to include the stray light in the uncertainty evaluation. Gregor Hülsen is also to be thanked for providing the slit functions of the Brewers. Julian Gröbner is to be acknowledged for insight on the precision of the micrometre step and the cosine correction methodology. Finally, we also thank Victoria E. Cachorro Revilla and Margarita Yela González for their effort in establishing and maintaining the AERONET El Arenosillo/Huelva site.
This work is part of the PID2023-149390OB-C21 and PID2023-149390OB-C22 R+D+I projects, funded by MICIU/AEI/10.13039/501100011033/ and “ERDF A Way of Doing Europe”.
This paper was edited by Stelios Kazadzis and reviewed by three anonymous referees.
Agencia Estatal de Meteorología: European Brewer Network, http://eubrewnet.aemet.es/(last access: 17 October 2025), 2025.
Antón, M., Serrano, A., Cancillo, M. L., Vilaplana, JoséM., Cachorro, V. E., and Gröbner, J.: Correction of Angular Response Error in Brewer UV Irradiance Measurements, J. Atmospheric Ocean. Technol., 25, 2018–2027, https://doi.org/10.1175/2008JTECHA1040.1, 2008.
Arola, A. and Koskela, T.: On the sources of bias in aerosol optical depth retrieval in the UV range, J. Geophys. Res.-Atmos., 109, D08209, https://doi.org/10.1029/2003JD004375, 2004.
Arola, A., Lakkala, K., Bais, A., Kaurola, J., Meleti, C., and Taalas, P.: Factors affecting short- and long-term changes of spectral UV irradiance at two European stations, J. Geophys. Res.-Atmos., 108, 2003JD003447, https://doi.org/10.1029/2003JD003447, 2003.
Bais, A. F.: Spectrometers: Operational Errors and Uncertainties, in: Solar Ultraviolet Radiation, edited by: Zerefos, C. S. and Bais, A. F., Springer Berlin Heidelberg, Berlin, Heidelberg, 165–173, https://doi.org/10.1007/978-3-662-03375-3_12, 1997.
Bais, A. F., Zerefos, C. S., and McElroy, C. T.: Solar UVB measurements with the double- and single-monochromator Brewer ozone spectrophotometers, Geophys. Res. Lett., 23, 833–836, https://doi.org/10.1029/96GL00842, 1996.
Bais, A. F., Gardiner, B. G., Slaper, H., Blumthaler, M., Bernhard, G., McKenzie, R., Webb, A. R., Seckmeyer, G., Kjeldstad, B., Koskela, T., Kirsch, P. J., Gröbner, J., Kerr, J. B., Kazadzis, S., Leszczynski, K., Wardle, D., Josefsson, W., Brogniez, C., Gillotay, D., Reinen, H., Weihs, P., Svenoe, T., Eriksen, P., Kuik, F., and Redondas, A.: SUSPEN intercomparison of ultraviolet spectroradiometers, J. Geophys. Res.-Atmos., 106, 12509–12525, https://doi.org/10.1029/2000JD900561, 2001.
Bais, A. F., Kazadzis, S., Garane, K., Kouremeti, N., Gröbner, J., Blumthaler, M., Seckmeyer, G., Webb, A. R., Koskela, T., Görts, P., and Schreder, J.: Portable device for characterizing the angular response of UV spectroradiometers, Appl. Opt., 44, 7136, https://doi.org/10.1364/AO.44.007136, 2005.
Bernhard, G.: Trends of solar ultraviolet irradiance at Barrow, Alaska, and the effect of measurement uncertainties on trend detection, Atmos. Chem. Phys., 11, 13029–13045, https://doi.org/10.5194/acp-11-13029-2011, 2011.
Bernhard, G. and Seckmeyer, G.: Uncertainty of measurements of spectral solar UV irradiance, J. Geophys. Res.-Atmos., 104, 14321–14345, https://doi.org/10.1029/1999JD900180, 1999.
Bernhard, G. and Stierle, S.: Trends of UV Radiation in Antarctica, Atmosphere, 11, 795, https://doi.org/10.3390/atmos11080795, 2020.
Bilbao, J. and de Migue, A.: Erythemal Solar Irradiance, UVER, and UV Index from Ground-Based Data in Central Spain, Appl. Sci.-Basel, 10, 6589, https://doi.org/10.3390/app10186589, 2020.
Bilbao, J., Román, R., De Miguel, A., and Mateos, D.: Long-term solar erythemal UV irradiance data reconstruction in Spain using a semiempirical method, J. Geophys. Res.-Atmos., 116, D22211, https://doi.org/10.1029/2011jd015836, 2011.
BIPM, IEC, and IFCC: Evaluation of Measurement Data – Guide to the Expression of Uncertainty in Measurement, https://doi.org/10.59161/JCGM100-2008E, 2008a.
BIPM, IEC, and IFCC: Evaluation of Measurement Data – Supplement 1 to the Guide to the Expression of Uncertainty in Measurement – Propagation of distributions using a Monte Carlo method, https://doi.org/10.59161/JCGM101-2008, 2008b.
Brewer, A. W.: A replacement for the Dobson spectrophotometer?, Pure Appl. Geophys., 106–108, 919–927, https://doi.org/10.1007/BF00881042, 1973.
Cede, A., Luccini, E., Nuñez, L., Piacentini, R. D., and Blumthaler, M.: Monitoring of erythemal irradiance in the Argentine ultraviolet network, J. Geophys. Res.-Atmos., 107, AAC 1-1–AAC 1-10, https://doi.org/10.1029/2001JD001206, 2002.
Cordero, R. R., Seckmeyer, G., Pissulla, D., and Labbe. F.: Uncertainty of experimental integrals: application to the UV index calculation, Metrologia, 45, 1–10, https://doi.org/10.1088/0026-1394/45/1/001, 2007.
Cordero, R. R., Seckmeyer, G., Riechelmann, S., Damiani, A., and Labbe, F.: Monte Carlo-based uncertainty analysis of UV array spectroradiometers, Metrologia, 49, 745–755, https://doi.org/10.1088/0026-1394/49/6/745, 2012.
Davies, J. A.: Correcting for Stray Light in Brewer Spectroradiometers, Environ. Technol., 17, 421–426, https://doi.org/10.1080/09593331708616402, 1996.
De Bock, V., De Backer, H., Van Malderen, R., Mangold, A., and Delcloo, A.: Relations between erythemal UV dose, global solar radiation, total ozone column and aerosol optical depth at Uccle, Belgium, Atmos. Chem. Phys., 14, 12251–12270, https://doi.org/10.5194/acp-14-12251-2014, 2014.
Diémoz, H., Siani, A. M., Casale, G. R., di Sarra, A., Serpillo, B., Petkov, B., Scaglione, S., Bonino, A., Facta, S., Fedele, F., Grifoni, D., Verdi, L., and Zipoli, G.: First national intercomparison of solar ultraviolet radiometers in Italy, Atmos. Meas. Tech., 4, 1689–1703, https://doi.org/10.5194/amt-4-1689-2011, 2011.
Diémoz, H., Siani, A. M., Redondas, A., Savastiouk, V., McElroy, C. T., Navarro-Comas, M., and Hase, F.: Improved retrieval of nitrogen dioxide (NO2) column densities by means of MKIV Brewer spectrophotometers, Atmos. Meas. Tech., 7, 4009–4022, https://doi.org/10.5194/amt-7-4009-2014, 2014.
Dobson, G. M. B.: A photoelectric spectrophotometer for measuring the amount of atmospheric ozone, Proc. Phys. Soc., 43, 324–339, https://doi.org/10.1088/0959-5309/43/3/308, 1931.
Emde, C., Buras-Schnell, R., Kylling, A., Mayer, B., Gasteiger, J., Hamann, U., Kylling, J., Richter, B., Pause, C., Dowling, T., and Bugliaro, L.: The libRadtran software package for radiative transfer calculations (version 2.0.1), Geosci. Model Dev., 9, 1647–1672, https://doi.org/10.5194/gmd-9-1647-2016, 2016.
Estupiñán, J. G., Raman, S., Crescenti, G. H., Streicher, J. J., and Barnard, W. F.: Effects of clouds and haze on UV-B radiation, J. Geophys. Res.-Atmos., 101, 16807–16816, https://doi.org/10.1029/96JD01170, 1996.
Fioletov, V. E., Griffioen, E., Kerr, J. B., Wardle, D. I., and Uchino, O.: Influence of volcanic sulfur dioxide on spectral UV irradiance as measured by Brewer Spectrophotometers, Geophys. Res. Lett., 25, 1665–1668, https://doi.org/10.1029/98GL51305, 1998.
Fioletov, V. E., McArthur, L. J. B., Kerr, J. B., and Wardle, D. I.: Long-term variations of UV-B irradiance over Canada estimated from Brewer observations and derived from ozone and pyranometer measurements, J. Geophys. Res.-Atmos., 106, 23009–23027, https://doi.org/10.1029/2001JD000367, 2001.
Fioletov, V. E., Labow, G., Evans, R., Hare, E. W., Köhler, U., McElroy, C. T., Miyagawa, K., Redondas, A., Savastiouk, V., Shalamyansky, A. M., Staehelin, J., Vanicek, K., and Weber, M.: Performance of the ground-based total ozone network assessed using satellite data, J. Geophys. Res.-Atmos., 113, 2008JD009809, https://doi.org/10.1029/2008JD009809, 2008.
Fitzka, M., Simic, S., and Hadzimustafic, J.: Trends in spectral UV radiation from long-term measurements at Hoher Sonnblick, Austria, Theor. Appl. Climatol., 110, 585–593, https://doi.org/10.1007/s00704-012-0684-0, 2012.
Fountoulakis, I., Bais, A. F., Fragkos, K., Meleti, C., Tourpali, K., and Zempila, M. M.: Short- and long-term variability of spectral solar UV irradiance at Thessaloniki, Greece: effects of changes in aerosols, total ozone and clouds, Atmos. Chem. Phys., 16, 2493–2505, https://doi.org/10.5194/acp-16-2493-2016, 2016a.
Fountoulakis, I., Redondas, A., Bais, A. F., Rodriguez-Franco, J. J., Fragkos, K., and Cede, A.: Dead time effect on the Brewer measurements: correction and estimated uncertainties, Atmos. Meas. Tech., 9, 1799–1816, https://doi.org/10.5194/amt-9-1799-2016, 2016b.
Fountoulakis, I., Redondas, A., Lakkala, K., Berjon , A., Bais, A. F., Doppler, L., Feister, U., Heikkila, A., Karppinen, T., Karhu, J. M., Koskela, T., Garane, K., Fragkos, K., and Savastiouk, V.: Temperature dependence of the Brewer global UV measurements, Atmos. Meas. Tech., 10, 4491–4505, https://doi.org/10.5194/amt-10-4491-2017, 2017.
Fountoulakis, I., Zerefos, C. S., Bais, A. F., Kapsomenakis, J., Koukouli, M.-E., Ohkawara, N., Fioletov, V., De Backer, H., Lakkala, K., Karppinen, T., and Webb, A. R.: Twenty-five years of spectral UV-B measurements over Canada, Europe and Japan: Trends and effects from changes in ozone, aerosols, clouds, and surface reflectivity, C. R. Geosci., 350, 393–402, https://doi.org/10.1016/j.crte.2018.07.011, 2018.
Fountoulakis, I., Diémoz, H., Siani, A. M., Hülsen, G., and Gröbner, J.: Monitoring of solar spectral ultraviolet irradiance in Aosta, Italy, Earth Syst. Sci. Data, 12, 2787–2810, https://doi.org/10.5194/essd-12-2787-2020, 2020.
Garane, K., Bais, A. F., Kazadzis, S., Kazantzidis, A., and Meleti, C.: Monitoring of UV spectral irradiance at Thessaloniki (1990–2005): data re-evaluation and quality control, Ann. Geophys., 24, 3215–3228, https://doi.org/10.5194/angeo-24-3215-2006, 2006.
Glandorf, M., Arola, A., Bais, A., and Seckmeyer, G.: Possibilities to detect trends in spectral UV irradiance, Theor. Appl. Climatol., 81, 33–44, https://doi.org/10.1007/s00704-004-0109-9, 2005.
González, C., Vilaplana, J. M., and Serrano, A.: Monte Carlo Evaluation of Uncertainties of UV Spectra Measured With Brewer Spectroradiometers, J. Geophys. Res.-Atmos., 128, e2023JD039500, https://doi.org/10.1029/2023JD039500, 2023.
González, C., Vilaplana, J. M., Parra-Rojas, F. C., and Serrano, A.: GUM uncertainty framework, Unscented transformation, and Monte Carlo approaches for the uncertainty evaluation of Brewer UV measurements, Zenodo [code], https://doi.org/10.5281/ZENODO.10973560, 2024a.
González, C., Vilaplana, J. M., Parra-Rojas, F. C., and Serrano, A.: Validation of the GUM uncertainty framework and the Unscented transformation for Brewer UV irradiance measurements using the Monte Carlo method, Measurement, 239, 115466, https://doi.org/10.1016/j.measurement.2024.115466, 2024b.
Gröbner, J.: Improved entrance optic for global irradiance measurements with a Brewer spectrophotometer, Appl. Opt., 42, 3516, https://doi.org/10.1364/AO.42.003516, 2003.
Gröbner, J. and Sperfeld, P.: Direct traceability of the portable QASUME irradiance scale to the primary irradiance standard of the PTB, Metrología, 42, 134–139, https://doi.org/10.1088/0026-1394/42/2/008, 2005.
Gröbner, J., Blumthaler, M., and Ambach, W.: Experimental investigation of spectral global irradiance measurement errors due to a non ideal cosine response, Geophys. Res. Lett., 23, 2493–2496, https://doi.org/10.1029/96GL02380, 1996.
Gröbner, J., Blumthaler, M., Kazadzis, S., Bais, A., Webb, A., Schreder, J., Seckmeyer, G., and Rembges, D.: Quality assurance of spectral solar UV measurements: results from 25 UV monitoring sites in Europe, 2002 to 2004, Metrologia, 43, S66–S71, https://doi.org/10.1088/0026-1394/43/2/S14, 2006.
Gröbner, J., Hülsen, G., Wuttke, S., Schrems, O., De Simone, S., Gallo, V., Rafanelli, C., Petkov, B., Vitale, V., Edvardsen, K., and Stebel, K.: Quality assurance of solar UV irradiance in the Arctic, Photochem. Photobiol. Sci., 9, 384–391, https://doi.org/10.1039/b9pp00170k, 2010.
Gröbner, J., Schreder, J., Kazadzis, S., Bais, A. F., Blumthaler, M., Görts, P., Tax, R., Koskela, T., Seckmeyer, G., Webb, A. R., and Rembges, D.: Traveling reference spectroradiometer for routine quality assurance of spectral solar ultraviolet irradiance measurements, Appl. Opt., 44, 5321–-5331, https://doi.org/10.1364/AO.44.005321, 2005
Gröbner, J., Wardle, D. I., McElroy, C. T., and Kerr, J. B.: Investigation of the wavelength accuracy of Brewer spectrophotometers, Appl. Opt., 37, 8352, https://doi.org/10.1364/AO.37.008352, 1998.
Holben, B. N., Eck, T. F., Slutsker, I., Tanré, D., Buis, J. P., Setzer, A., Vermote, E., Reagan, J. A., Kaufman, Y. J., Nakajima, T., Lavenu, F., Jankowiak, I., and Smirnov, A.: AERONET – A Federated Instrument Network and Data Archive for Aerosol Characterization, Remote Sens. Environ., 66, 1–16, https://doi.org/10.1016/S0034-4257(98)00031-5, 1998.
Hülsen, G., Gröbner, J., Nevas, S., Sperfeld, P., Egli, L., Porrovecchio, G., and Smid, M.: Traceability of solar UV measurements using the Qasume reference spectroradiometer, Appl. Opt., 55, 7265, https://doi.org/10.1364/AO.55.007265, 2016.
Hülsen, G.: Protocol of the solar UV intercomparison at INTA, El Arenosillo, Spain from September 4 to September 14, 2023, with the travelling reference spectroradiometer QASUME from PMOD/WRC, Tech. rep., Physikalisch-Meteorologisches Observatorium Davos World Radiation Center, https://www.pmodwrc.ch/wcc_uv/qasume_audit/reports/2023_09_spain_INTA_RBCCE18.pdf (last access: 26 May 2025), 2023.
International Commission on Non-Ionizing Radiation Protection (ICNIRP): ICNIRP statement–Protection of workers against ultraviolet radiation, Health Phys., 99, 66–87, https://doi.org/10.1097/HP.0b013e3181d85908, 2010
Julier, S. J. and Uhlmann, J. K.: New extension of the Kalman filter to nonlinear systems, AeroSense '97, Orlando, FL, USA, 182, https://doi.org/10.1117/12.280797, 1997.
Julier, S. J., Uhlmann, J. K., and Durrant-Whyte, H. F.: A new approach for filtering nonlinear systems, in: Proceedings of 1995 American Control Conference – ACC'95, 1995 American Control Conference – ACC'95, Seattle, WA, USA, 1628–1632, https://doi.org/10.1109/ACC.1995.529783, 1995.
Karppinen, T., Redondas, A., García, R. D., Lakkala, K., McElroy, C. T., and Kyrö, E.: Compensating for the Effects of Stray Light in Single-Monochromator Brewer Spectrophotometer Ozone Retrieval, Atmosphere-Ocean, 53, 66–73, https://doi.org/10.1080/07055900.2013.871499, 2015.
Kerr, J. B.: The Brewer Spectrophotometer, in: UV Radiation in Global Climate Change, edited by: Gao, W., Slusser, J. R., and Schmoldt, D. L., Springer Berlin Heidelberg, Berlin, Heidelberg, 160–191, https://doi.org/10.1007/978-3-642-03313-1_6, 2010.
Kerr, J. B. and McElroy, C. T.: Evidence for Large Upward Trends of Ultraviolet-B Radiation Linked to Ozone Depletion, Science, 262, 1032–1034, https://doi.org/10.1126/science.262.5136.1032, 1993.
Kipp & Zonen: MkIV Brewer Spectrophotometer Instruction Manual, Revision F., https://www.kippzonen.com/Download/164/Brewer-MKIV-Operator-s-Manual-for-Single-Board?ShowInfo=true (last access: 17 October 2025), 2007.
Kipp & Zonen: Brewer MkIII Spectrophotometer Operator's Manual, Revision F., https://www.kippzonen.com/Download/207/Brewer-MkIII-Operator-s-Manual?ShowInfo=true (last access: 17 October 2025), 2015.
Klotz, B., Gradl, R., Schenzinger, V., Schwarzmann, M., Schreder, J., Lorenz, S., Grobner, J., Hulsen, G., and Kreuter, A.: UV Map Nowcasting and Comparison with Ground-Based UV Measurements for the DACH Region, Remote Sens-Basel, 17, 629, https://doi.org/10.3390/rs17040629, 2025.
Lakkala, K., Kyrö, E., and Turunen, T.: Spectral UV Measurements at Sodankylä during 1990–2001, J. Geophys. Res.-Atmos., 108, 2002JD003300, https://doi.org/10.1029/2002JD003300, 2003.
Lakkala, K., Arola, A., Heikkilä, A., Kaurola, J., Koskela, T., Kyrö, E., Lindfors, A., Meinander, O., Tanskanen, A., Gröbner, J., and Hülsen, G.: Quality assurance of the Brewer spectral UV measurements in Finland, Atmos. Chem. Phys., 8, 3369–3383, https://doi.org/10.5194/acp-8-3369-2008, 2008.
Lakkala, K., Arola, A., Gröbner, J., León-Luis, S. F., Redondas, A., Kazadzis, S., Karppinen, T., Karhu, J. M., Egli, L., Heikkilä, A., Koskela, T., Serrano, A., and Vilaplana, J. M.: Performance of the FMI cosine error correction method for the Brewer spectral UV measurements, Atmos. Meas. Tech., 11, 5167–-5180, https://doi.org/10.5194/amt-11-5167-2018, 2018.
López-Solano, J., Redondas, A., Carreño, V., Berjón, A., Serrano, A., Vilaplana, J. M., González, C., Gröbner, J., Egli, L., Hülsen, G., Zeilinger, F., Lakkala, K., and Keskinen, A.: UV processing in EUBREWMET: results of the 18th RBCC-E campaign, Quadrennial Ozone Symposium, Boulder, USA, 15–19 July 2024, https://doi.org/10.31978/QOS.english_2024, 2024.
Lucas, R. M., Yazar, S., Young, A. R., Norval, M., de Gruijl, F. R., Takizawa, Y., Rhodes, L. E., Sinclair, C. A., and Neale, R. E.: Human health in relation to exposure to solar ultraviolet radiation under changing stratospheric ozone and climate. Photoch. Photobio. Sci., 18, 641–680, https://doi.org/10.1039/c8pp90060d, 2019.
Mäkelä, J. S., Lakkala, K., Koskela, T., Karppinen, T., Karhu, J. M., Savastiouk, V., Suokanerva, H., Kaurola, J., Arola, A., Lindfors, A. V., Meinander, O., de Leeuw, G., and Heikkilä, A.: Data flow of spectral UV measurements at Sodankylä and Jokioinen, Geosci. Instrum. Method. Data Syst., 5, 193–203, https://doi.org/10.5194/gi-5-193-2016, 2016.
McKenzie, R. L., Matthews, W. A., and Johnston, P. V.: The relationship between erythemal UV and ozone, derived from spectral irradiance measurements, Geophys. Res. Lett., 18, 2269–2272, https://doi.org/10.1029/91GL02786, 1991.
Redondas, A., Carreño, V., León-Luis, S. F., Hernández-Cruz, B., López-Solano, J., Rodriguez-Franco, J. J., Vilaplana, J. M., Gröbner, J., Rimmer, J., Bais, A. F., Savastiouk, V., Moreta, J. R., Boulkelia, L., Jepsen, N., Wilson, K. M., Shirotov, V., and Karppinen, T.: EUBREWNET RBCC-E Huelva 2015 Ozone Brewer Intercomparison, Atmos. Chem. Phys., 18, 9441–9455, https://doi.org/10.5194/acp-18-9441-2018, 2018.
Rimmer, J. S., Redondas, A., and Karppinen, T.: EuBrewNet – A European Brewer network (COST Action ES1207), an overview, Atmos. Chem. Phys., 18, 10347–10353, https://doi.org/10.5194/acp-18-10347-2018, 2018.
Savastiouk, V., Diémoz, H., and McElroy, C. T.: A physically based correction for stray light in Brewer spectrophotometer data analysis, Atmos. Meas. Tech., 16, 4785–4806, https://doi.org/10.5194/amt-16-4785-2023, 2023.
Schinke, C., Pollex, H., Hinken, D., Wolf, M., Bothe, K., Kröger, I., Nevas, S., and Winter, S.: Calibrating spectrometers for measurements of the spectral irradiance caused by solar radiation, Metrologia, 57, 065027, https://doi.org/10.1088/1681-7575/abafc5, 2020.
Seckmeyer, G., Bais, A., Bernhard, G., Blumthaler, M., Booth, C., Disterhoft, P., Eriksen, P., McKenzie, R., Miyauchi, M., and Roy, C.: Instruments to measure solar ultraviolet irradiance – Part 1: Spectral instruments, World Meteorological Organization (WMO), Geneva, Switzerland, 30 pp., https://library.wmo.int/idurl/4/41123 (last access: 27 October 2025), 2001
Simic, S., Weihs, P., Vacek, A., Kromp-Kolb, H., and Fitzka, M.: Spectral UV measurements in Austria from 1994 to 2006: investigations of short- and long-term changes, Atmos. Chem. Phys., 8, 7033–7043, https://doi.org/10.5194/acp-8-7033-2008, 2008.
Slaper, H., Reinen, H. A. J. M., Blumthaler, M., Huber, M., and Kuik, F.: Comparing ground-level spectrally resolved solar UV measurements using various instruments: A technique resolving effects of wavelength shift and slit width, Geophys. Res. Lett., 22, 2721–2724, https://doi.org/10.1029/95GL02824, 1995.
Smedley, A. R. D., Rimmer, J. S., Moore, D., Toumi, R., and Webb, A. R.: Total ozone and surface UV trends in the United Kingdom: 1979–2008, Int. J. Climatol., 32, 338–346, https://doi.org/10.1002/joc.2275, 2012.
Straka, O., Dunik, J., and Simandl, M.: Scaling parameter in unscented transform: Analysis and specification, in: 2012 American Control Conference (ACC), 2012 American Control Conference – ACC 2012, Montreal, QC, 5550–5555, https://doi.org/10.1109/ACC.2012.6315031, 2012.
Turner, R. and Rasmussen, C. E.: Model based learning of sigma points in unscented Kalman filtering, in: 2010 IEEE International Workshop on Machine Learning for Signal Processing, 2010 IEEE International Workshop on Machine Learning for Signal Processing (MLSP), Kittila, Finland, 178–183, https://doi.org/10.1109/MLSP.2010.5589003, 2010.
Wang, L. and Ding, R.: A parameter determination method of unscented transformation and its approximate ability analysis in the precision estimation of nonlinear measurement adjustment, Measurement, 166, 108065, https://doi.org/10.1016/j.measurement.2020.108065, 2020.
Weatherhead, E. C., Reinsel, G. C., Tiao, G. C., Meng, X., Choi, D., Cheang, W., Keller, T., DeLuisi, J., Wuebbles, D. J., Kerr, J. B., Miller, A. J., Oltmans, S. J., and Frederick, J. E.: Factors affecting the detection of trends: Statistical considerations and applications to environmental data, J. Geophys. Res.-Atmos., 103, 17149–17161, https://doi.org/10.1029/98jd00995, 1998.
Weatherhead, E., Theisen, D., Stevermer, A., Enagonio, J., Rabinovitch, B., Disterhoft, P., Lantz, K., Meltzer, R., Sabburg, J., DeLuisi, J., Rives, J., and Shreffler, J.: Temperature dependence of the Brewer ultraviolet data, J. Geophys. Res.-Atmos., 106, 34121–34129, https://doi.org/10.1029/2001JD000625, 2001.
Webb, A. R., Gardiner, B .G., Blumthaler, M., Forster, P., Huber, M., and Kirsch, P. J.: A laboratory investigation of two ultraviolet spectroradiometers, Photochem. Photobiol., 60, 84–90, https://doi.org/10.1111/j.1751-1097.1994.tb03947.x, 1994
Webb, A. R., Gardiner, B. G., Martin, T. J., Leszczynski, K., and Mohnen, V. A.: Guidelines for Site Quality Control of UV Monitoring (GAW Report No. 126), World Meteorological Organization (WMO), https://library.wmo.int/idurl/4/41126 (last access: 27 October 2025), 1998.
Webb, A. R., Gardiner, B. G., Lescynski, K., Metzdorf, J., Mohnen, V., Johnston, P., Harrison, N., and Bigelow, D.: Quality Assurance in Monitoring Solar Ultraviolet Radiation: the State of the Art (GAW Report No. 146), World Meteorological Organization (WMO), https://library.wmo.int/idurl/4/41194 (last access: 27 October 2025), 2003.
Webb, A. R., Kift, R., Durkin, M. T., O'Brien, S. J., Vail, A., Berry, J. L., and Rhodes, L. E.: The role of sunlight exposure in determining the vitamin D status of the UK white adult population, Brit. J. Dermatol., 164, 1050–1055, https://doi.org/10.1111/j.1365-2133.2010.09975.x, 2011.
Weihs, P., Blumthaler, M., Rieder, H. E., Kreuter, A., Simic, S., Laube, W., Schmalwieser, A. W., Wagner, J. E., and Tanskanen, A.: Measurements of UV irradiance within the area of one satellite pixel, Atmos. Chem. Phys., 8, 5615–5626, https://doi.org/10.5194/acp-8-5615-2008, 2008.
World Meteorological Organization (WMO): Eighteenth Intercomparison Campaign of the Regional Brewer Calibration Centre Europe (GAW Report No. 302), WMO, Geneva, https://doi.org/10.31978/666-20-018-3, 2024.
Young, A. R., Claveau, J., and Rossi, A. B.: Ultraviolet radiation and the skin: Photobiology and sunscreen photoprotection, J. Am. Acad. Dermatol., 76, S100–S109, https://doi.org/10.1016/j.jaad.2016.09.038, 2017.
Zempila, M.-M., Koukouli, M.-E., Bais, A., Fountoulakis, I., Arola, A., Kouremeti, N., and Balis, D.: OMI/Aura UV product validation using NILU-UV ground-based measurements in Thessaloniki, Greece, Atmos. Environ., 140, 283–297, https://doi.org/10.1016/j.atmosenv.2016.06.009, 2016.
Zerefos, C. S., Tourpali, K., Eleftheratos, K., Kazadzis, S., Meleti, C., Feister, U., Koskela, T., and Heikkilä, A.: Evidence of a possible turning point in solar UV-B over Canada, Europe and Japan, Atmos. Chem. Phys., 12, 2469–2477, https://doi.org/10.5194/acp-12-2469-2012, 2012.