the Creative Commons Attribution 4.0 License.
the Creative Commons Attribution 4.0 License.
 | 28 Oct 2025
The sources and diurnal variations of submicron aerosols in a coastal–rural environment near Houston, US
Jing Li
Jiaoshi Zhang
Xianda Gong
Steven Spielman
Chongai Kuang
Ashish Singh
Maria A. Zawadowicz
Aerosol properties were characterized at a rural site southwest of Houston from May to September 2022 during the intensive operation periods (IOPs) of the Tracking Aerosol Convection Interactions ExpeRiment (TRACER). Backward trajectory analysis reveals three major air mass types: marine air mass from the Gulf, urban air mass influenced by urban emissions, and regional air mass. Marine aerosols typically show a bimodal size distribution and have the lowest particle number and mass concentrations of PM1 (particulate matter with an aerodynamic diameter of less than 1 µm), while aerosols from air masses strongly influenced by urban emissions exhibit the highest concentrations. Organic aerosol (OA) accounts for more than 50 % of PM1 for urban and regional air masses, whereas sulfate is comparable to OA in marine air masses. Positive matrix factorization (PMF) analysis of aerosol mass spectra identifies 6 OA factors: hydrocarbon-like OA (HOA), OA from the oxidation of monoterpenes (MT-SOA), OA from the reactive uptake of isoprene epoxydiols by acidic sulfate particles (isoprene-SOA), oxygenated OA arising from shipping emissions (shipping-OOA), and two oxygenated OA factors with high O : C ratios (OOA1 and OOA2). OOA2 has the highest O : C ratio and exhibits elevated mass concentration in the afternoon. Similar diurnal variation of highly oxidized OA factors was commonly observed in the Houston area during previous studies and attributed to the SOA formation by photochemistry and mixing from aloft. Here, using air mass backward trajectories and a 1-D box model, we show the diurnal trend of OOA2 mass concentration is instead driven by changes in air mass arriving at the rural site. The air mass changes are likely caused by the shift between land breezes and sea/bay breezes. Within the same air mass type (e.g., either urban or marine air mass), OOA2 mass concentration is largely independent of wind direction and shows essentially no diurnal variation, suggesting OOA2 is related to aged OA with minimal influence by local emissions. This study helps identify the major sources of OA in the Houston region and highlights the impacts of both atmospheric chemistry and meteorology on aerosol properties in the coastal–rural environment.
- Article
(11542 KB) - Full-text XML
-
Supplement
(3705 KB) - BibTeX
- EndNote


Aerosol particles can affect Earth's radiation budget by absorbing and scattering radiation in the atmosphere (direct effect) and affecting cloud albedo and lifetime via serving as cloud condensation nuclei and ice nuclei (indirect effects) (Albrecht, 1989; Charlson et al., 1992; Twomey, 1977). Aerosol can also influence convective clouds and precipitation (Andreae et al., 2004; Fan et al., 2007a, b; Heever et al., 2006; Rosenfeld et al., 2008). The effects of aerosols on clouds are among the most significant uncertainties in the simulation of climate change since pre-industrial time (IPCC, 2023). In addition, aerosols are air pollutants and pose severe health risks when inhaled, contributing to respiratory and cardiovascular diseases (Lelieveld et al., 2015; Pope and Dockery, 2006). Quantifying these effects of aerosols on climate and human health requires the knowledge of the physical and chemical properties of aerosols, which are spatiotemporally diverse. Understanding the sources, precursors, and evolution of aerosols is essential to quantifying the properties and effects of aerosols and their temporal and spatial variations.
Houston is the fourth-largest city in the US and has active energy and chemical sectors. The Port of Houston is one of the busiest seaports in the US, with significant emissions from ships and heavy-duty diesel engines. The areas around Houston have abundant vegetation, including large forested areas to the north of the city. Isolated convective systems are common in the Houston region. The circulation of land and sea/bay breezes also plays an important role in shaping the atmospheric environment in the Houston area (Caicedo et al., 2019; Li et al., 2020; Wang et al., 2022). As a result, Houston experiences a spectrum of aerosol conditions, from those strongly influenced by urban, forested, and/or industrial emissions to significantly lower aerosol concentrations southwest of the city. Previous studies showed that OA and sulfate are the most abundant aerosol components in the Houston region during the summertime (Al-Naiema et al., 2018; Cleveland et al., 2012; Dai et al., 2019; Dunker et al., 2019; Leong et al., 2017; Schulze et al., 2018; Wallace et al., 2018; Yoon et al., 2020, 2021), similar to aerosol compositions in other coastal cities (Hersey et al., 2011; Kompalli et al., 2020; Lei et al., 2020; Liu et al., 2019; Wong et al., 2022). PMF analysis has been widely used to investigate OA sources in Houston, identifying a diverse range of contributing factors (Al-Naiema et al., 2018; Bean et al., 2016; Brown et al., 2013; Cleveland et al., 2012; Dai et al., 2019; Schulze et al., 2018; Wallace et al., 2018; Yoon et al., 2020, 2021; Zhou et al., 2023). Primary organic aerosol (POA) factors are predominately associated with anthropogenic emissions. Major sources of POA include fossil fuel combustion from vehicular traffic (Al-Naiema et al., 2018; Cleveland et al., 2012; Wallace et al., 2018) and shipping activities (Schulze et al., 2018). Additionally, other sources such as cooking emissions and biomass burning emissions (Dai et al., 2019; Wallace et al., 2018) were identified. Less oxidized secondary organic aerosol (SOA) factors have been linked to the oxidation product of biogenic emissions (Brown et al., 2013), based on their characteristic mass spectral signatures. Highly oxidized SOA factors were consistently observed in Houston, often accounting for a substantial fraction of the OA mass concentrations (Al-Naiema et al., 2018; Dai et al., 2019; Schulze et al., 2018). However, the sources and formation mechanisms of these highly oxidized SOAs remain uncertain as the mass spectral features become increasingly similar with atmospheric aging. The diurnal variations of the PMF factors have been analyzed to provide insights into source identification. Driving factors of the diurnal variations of PMF factors include the emission sources, secondary chemical production/loss, boundary layer dynamics, deposition removal processes, and horizontal transport (Janssen et al., 2012; Stefenelli et al., 2019; Takegawa et al., 2006; Zheng et al., 2014). Previous studies conjectured that highly oxidized OAs in Houston are related to daytime photochemistry and mixing from aloft by the boundary layer expansion (Al-Naiema et al., 2018; Bates et al., 2008; Dai et al., 2019). However, the impacts on the diurnal trend by other factors, such as depositional removal and horizontal advection, were not systematically accounted for. For example, given the change of wind direction driven by land–sea breeze, horizontal advection may contribute substantially to the diurnal variations of the aerosol mass concentrations observed in coastal regions.
Most previous studies focused on aerosol properties in the Houston urban area. In comparison, aerosols in the rural areas around Houston are not well understood. Depending on wind direction, the rural areas can experience a range of aerosol conditions, including urban, industrial, marine, and regional background aerosols. The knowledge of aerosol properties and their temporal variations in rural areas allows for an improved understanding of regional aerosol dynamics and representations of aerosols in models. Here, we present the aerosol properties and sources using comprehensive measurements at a rural site southwest of Houston from May to September 2022 during the intensive operation periods (IOPs) of the Tracking Aerosol Convection Interactions ExpeRiment (TRACER) campaign (Jensen et al., 2022, 2025). Different air masses, including those originating from the Gulf of Mexico and strongly influenced by urban emissions, were sampled at the site. The aerosol properties and their temporal variations were characterized for representative air masses. PMF analysis of organic aerosol mass spectra was conducted to identify key OA factors. The sources of OA factors are investigated using (1) the comparative analysis of OA factor mass spectra with those reported in prior studies; (2) the correlation analysis between OA factors and inorganic species (e.g., sulfate, nitrate, ammonium); (3) the dependences of mass concentrations on air mass backward trajectories and local wind patterns; and (4) a box model that includes photochemistry, particle deposition, and horizontal and vertical transport. The aerosol properties observed at the rural site are also compared to previous measurements in the Houston region. These analyses help improve our understanding of aerosol properties and processes in rural coastal environments near Houston.
2.1 Sampling site and measurements
During the TRACER campaign, meteorological parameters, trace gases, and aerosol properties were measured at a rural site (ANC site, 29.37° N, 95.75° W) in Guy, Texas during the IOP from 29 May to 29 September 2022 (Fig. 1). The ANC site, located on a privately owned farm, is situated approximately 80 km southwest of Houston urban center, 80 km west of the Houston Ship Channel, and 80 km north of the Gulf of Mexico. The Sam Houston National Forest, which borders the Houston metropolitan area, is about 120 km northeast of the ANC site.
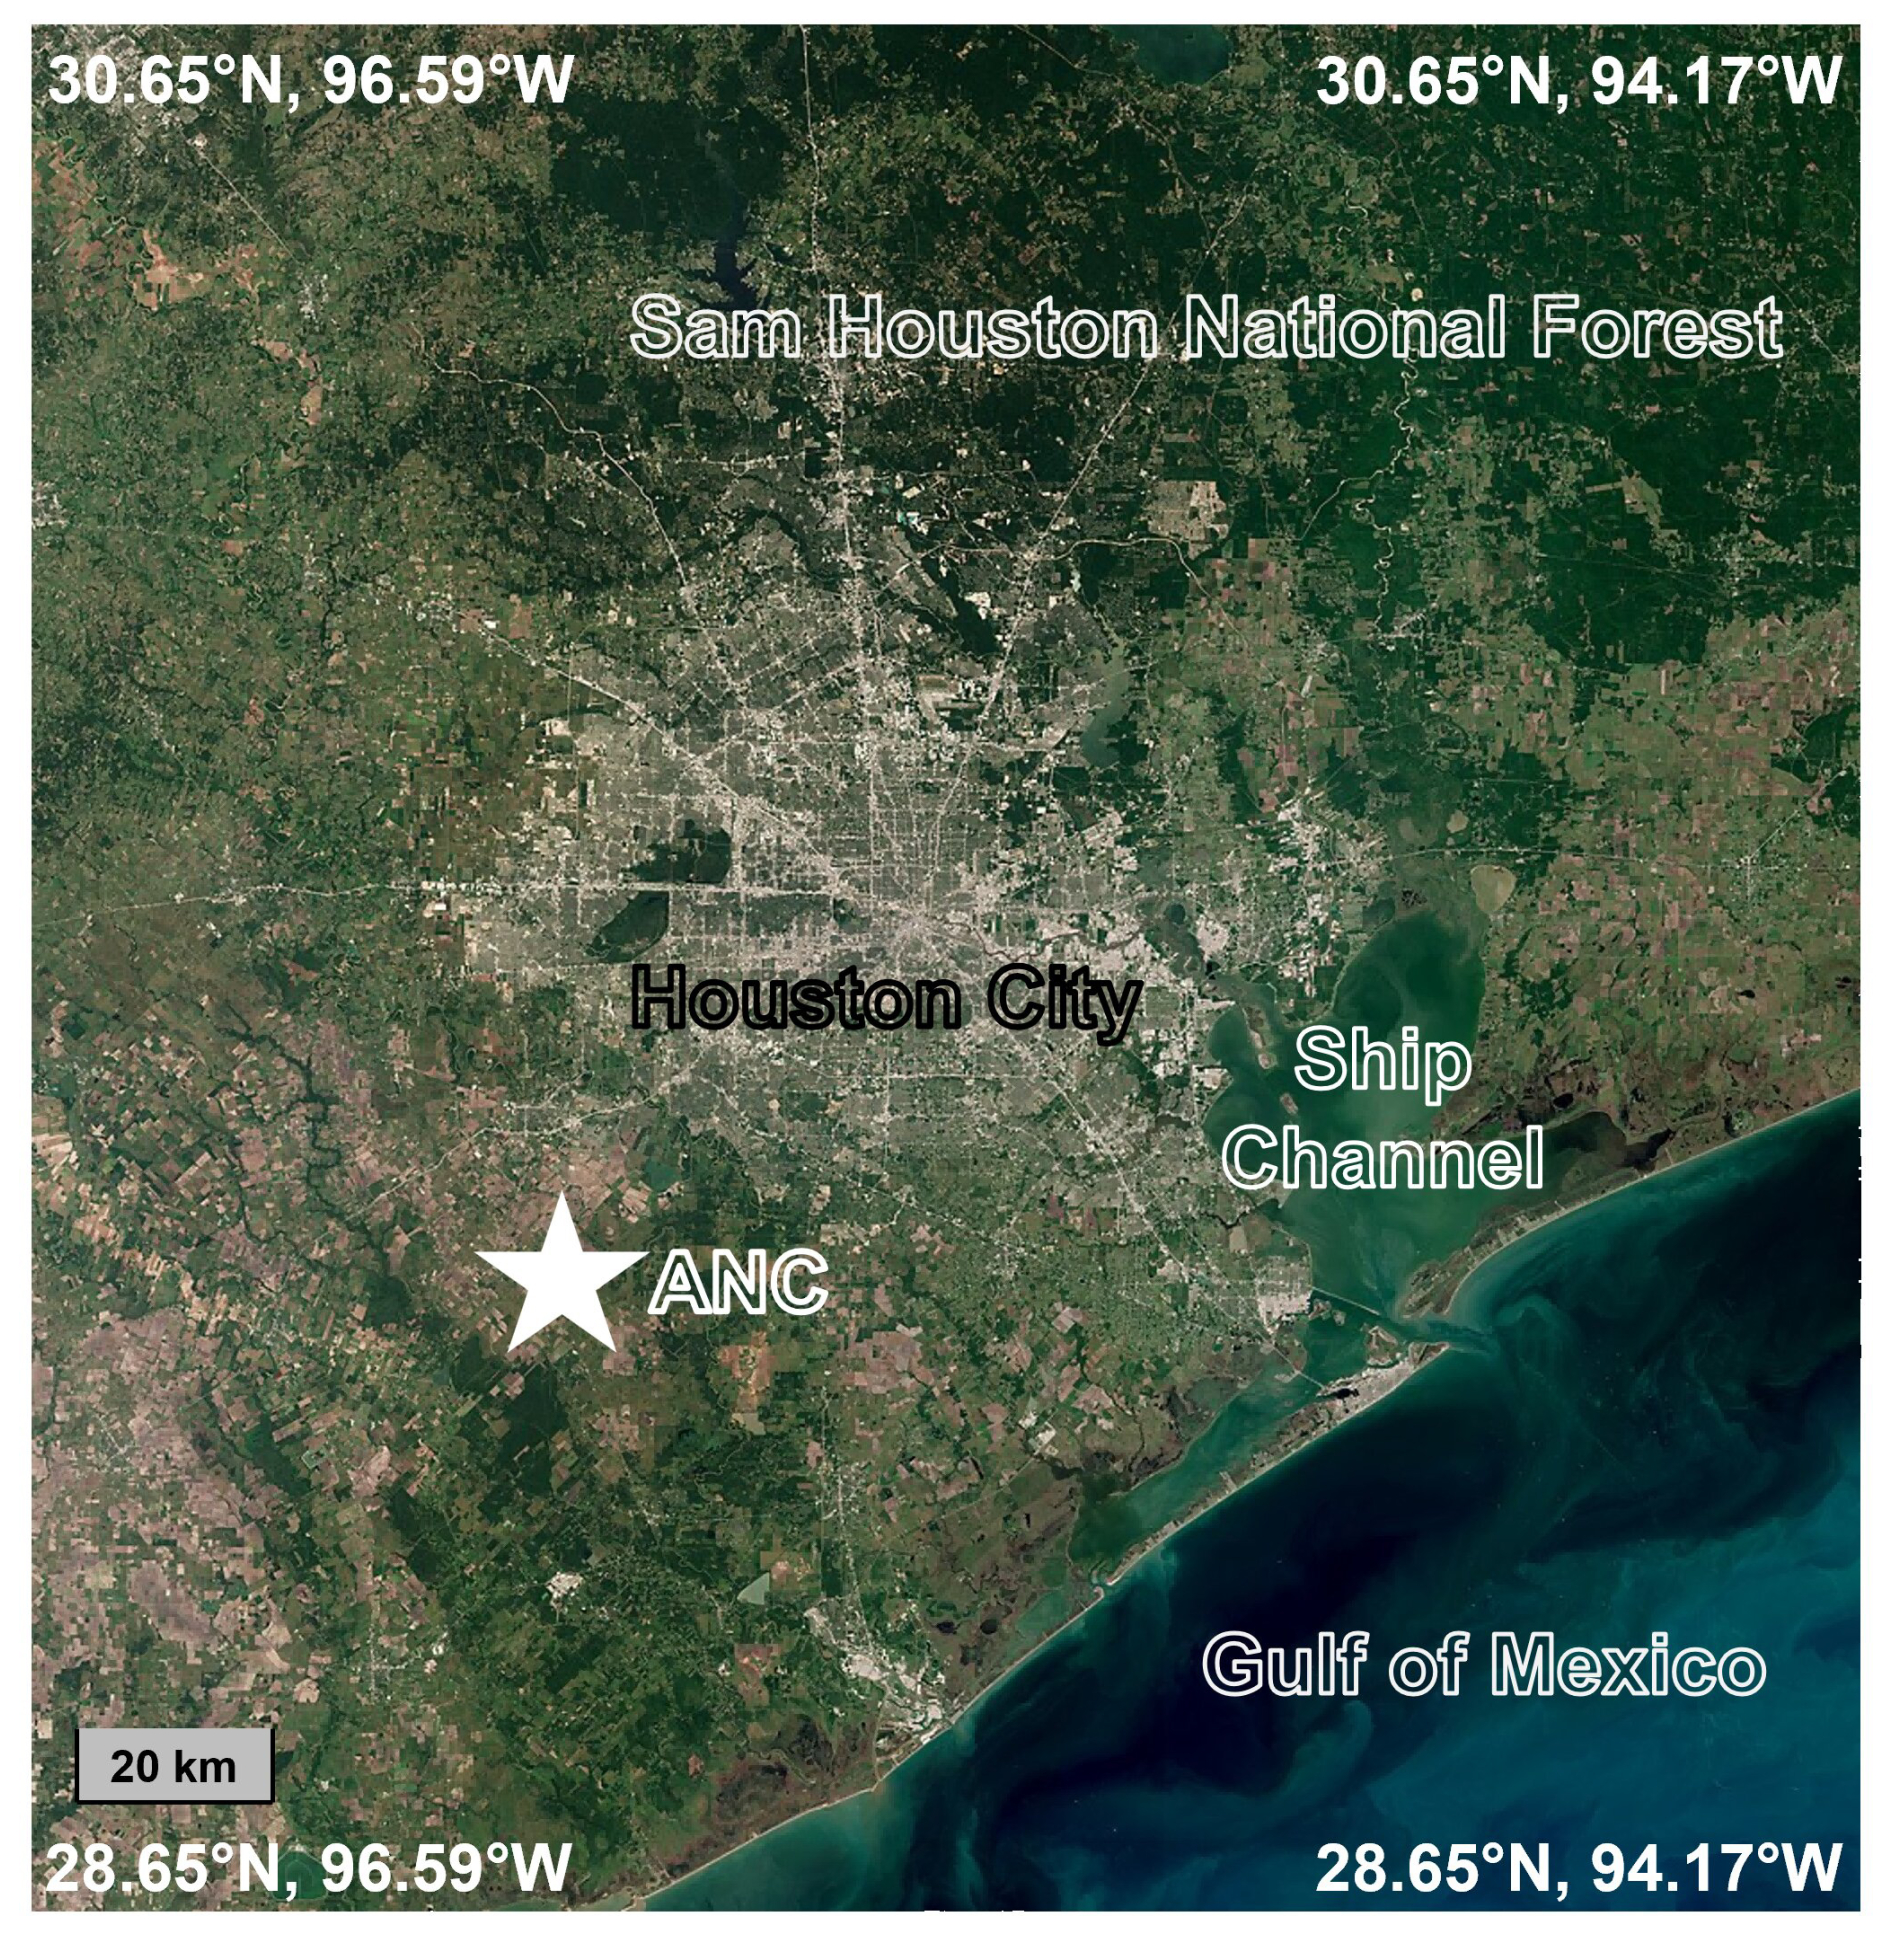
Figure 1Map showing the location of the rural site (ANC site) during the TRACER campaign (map is from Sentinel-2 cloudless map of the world by EOX, https://s2maps.eu/, last access: 1 February 2024).
The instruments deployed at the ANC site and the corresponding measurements are described in Table S1 in the Supplement. The ANC site had a mixture of Atmospheric Radiation Measurement (ARM)-supported observations (Vaisala automatic weather station, ceilometer, Aerosol Chemical Speciation Monitor (ACSM)) and PI-supported (non-ARM) observations (e.g., Scanning Mobility Particle Sizer (SMPS), Condensation Particle Counter (CPC)). Aerosol and trace gas instruments were housed inside an Aerosol Observing Systems (AOS). The configuration of the AOS is detailed in Uin et al. (2019). The meteorological parameters (surface wind speed, wind direction, air temperature, RH, and air pressure) were measured by an automated weather station (Vaisala). The aerosol inlet was mounted on a mast, 10 m above ground level (m a.g.l.), to minimize the influence of local dust and vehicle emissions. The RH of aerosol samples was reduced to below 20 % using a Nafion dryer (Perma Pure) before being introduced into the instruments. The aerosol size distribution ranging from 10 to 500 nm and total particle number concentration were measured by a Scanning Mobility Particle Sizer (SMPS, Model 3082, TSI) and a Condensation Particle Counter (CPC, Model 3772, TSI), respectively. The chemical composition of NR-PM1 was measured using a Time of Flight – Aerosol Chemical Speciation Monitor (ToF-ACSM, Aerodyne Research) with a standard vaporizer (Fröhlich et al., 2013; Watson, 2017). A cyclone with a cut size of 2.5 µm was installed upstream of the ACSM inlet. Inside ToF-ACSM, the ambient aerosol samples were first focused into a narrow particle beam, passed through a vacuum chamber and then flash-vaporized at approximately 600 °C. The vaporized species were immediately ionized by 70 eV electron impact, and the resulting ions were analyzed by a time-of-flight mass analyzer. The measured components included organics (Org), sulfate (SO4), nitrate (NO3), ammonium (NH4), and chloride (Chl), and the data have a time resolution of 10 min.
2.2 PMF analysis
PMF analysis was conducted on the ToF-ACSM mass spectra to identify the key OA components and investigate their sources (Paatero, 1997; Paatero and Tapper, 1994). This methodology operates on the premise that the time series of organic mass spectra can be dissected into several distinct, temporally invariant components. These components, each characterized by their consistent mass spectra, contribute varying quantities of mass concentration to the overall organic signal at each given point in time.
We applied the “rolling PMF” strategy (Canonaco et al., 2021) in this study. To guide the constrained rolling PMF analysis, we first conducted an unconstrained PMF analysis to explore the variability in potential factor profiles and identify suitable candidates for constraints. Multiple solutions with varying numbers of factors were tested, and repeated runs with random seeds were performed to evaluate solution stability. The results were clustered using the k-means methods, and silhouette analysis was used to assess the consistency of profiles within each solution. Based on this evaluation, three factors were selected as reference profiles: hydrocarbon-like OA (HOA), OA from the oxidation of monoterpenes (MT-SOA), and OA from the reactive uptake of isoprene epoxydiols by acidic sulfate particles (isoprene-SOA). These factors were consistently observed across solutions and were chemically interpretable. Using these three factors as constraints, we then performed the rolling PMF analysis. For each rolling window, a random a value between 0.1 and 0.6 was used to allow flexibility in the factor profiles. We evaluated three different rolling solutions: (1) a 4-factor solution with constrained HOA, MT-SOA, and isoprene-SOA factors and 1 unconstrained OOA factor; (2) a 5-factor solution with the same constrained factors and 2 unconstrained OOA factors; and (3) a 6-factor solution with the same constrained factors and 3 unconstrained OOA factors.
We consider the 6-factor solution optimal based on the mass spectral profiles and the correlations of the components with time series for tracer species. The interpretation of these 6 factors will be discussed in Sect. 3.2. Detailed information on the PMF resolution procedures and solution comparison is presented in the Supplement, Sect. S1.
In this study, the O : C ratios of each PMF factor are calculated using the equation from Canagaratna et al. (2015):
where f44 is the ratio of 44 to the total OA signal in the factor mass spectrum. All instruments, including SMPS, CPC, and ToF-ACSM, were deployed from the end of the May to the end of the September (Table S1).
2.3 Classification of air masses and concentration-weighted trajectory (CWT) analysis
To classify the sampled air masses, we first simulated 24 h backward trajectories originating at a height of 100 m a.g.l. at the ANC site. These trajectories were computed hourly throughout the IOP using the Hybrid Single-Particle Lagrangian Integrated Trajectory (HYSPLIT) model (Stein et al., 2015). The air masses arriving at the site were then classified into three different types according to the backward trajectories following the approach illustrated in Fig. S14 in the Supplement. Air masses were classified as “marine” if the backward trajectories were over the Gulf of Mexico more than 80 % of the 24 h. Air masses spending less than 80 % of the 24 h over the ocean were considered either “urban” or “regional”, depending on whether the air masses had passed over urban regions. For the air mass classification, the identified urban regions include Corpus Christi (Texas), Houston (Texas), Lafayette (Louisiana), and New Orleans (Louisiana). Aerosols in the “urban” air masses are expected to be substantially influenced by recent anthropogenic emissions. Aerosols in the regional air masses classified here are influenced by continental but not recent urban emissions; therefore they may reflect regional backgrounds. During the IOP from May to September 2022, the predominant air mass type observed at the ANC site is marine, accounting for approximately 60 % of all air masses.
The concentration-weighted trajectory (CWT) model (Hsu et al., 2003) was used to investigate the potential source areas of major aerosol components (e.g., sulfate, nitrate, organics, ammonium) observed at the ANC site. The analysis domain was chosen between 10–60° N and 150–50° W based on the farthest distance traveled by 24 h HYSPLIT backward trajectories. This domain was divided into 5000 grid cells with each grid cell of 1° × 1° in size. A weighted concentration was assigned to each grid cell and was derived by averaging sample concentrations with associated trajectories crossing the grid cell. The CWT values were calculated as follows:
where CWTi,j is the CWT value of grid i,j (i: latitude, j: longitude), Ck is the hourly averaged concentration measured at the ANC site at the start time of trajectory k, K is the total number of hourly back trajectories, and is the number of trajectory points from back trajectory k in grid i,j. Here the trajectory point represents the latitude and longitude at each hour. Therefore, each 24 h trajectory consists of 24 trajectory points.
3.1 General characteristics of the submicron particles
The campaign average NR-PM1 mass concentration is 5.2 µg m−3. On average, OA is the largest component and represents 53 % of NR-PM1 mass concentrations. At the ANC site, marine air mass dominated during June, July, and August, while urban air mass was frequently observed in September. On average, NR-PM1 mass concentration within urban air masses (gray shaded periods in Fig. 2) is approximately 3 times greater than that observed in marine air masses (blue shaded periods in Fig. 2). The difference in NR-PM1 mass concentration is largely attributed to strong anthropogenic emissions in the Houston's urban area (Bahreini et al., 2009; Brock et al., 2003; Brown et al., 2013). In urban air masses, OA dominates and represents 66 % of NR-PM1 mass concentration (Fig. 3f). In contrast, the mass fraction of sulfate becomes comparable to OA in marine air masses (Fig. 3d), likely due to shipping emissions in the Gulf of Mexico (Schulze et al., 2018; Sullivan et al., 2013; Wallace et al., 2018; Zhou et al., 2023).
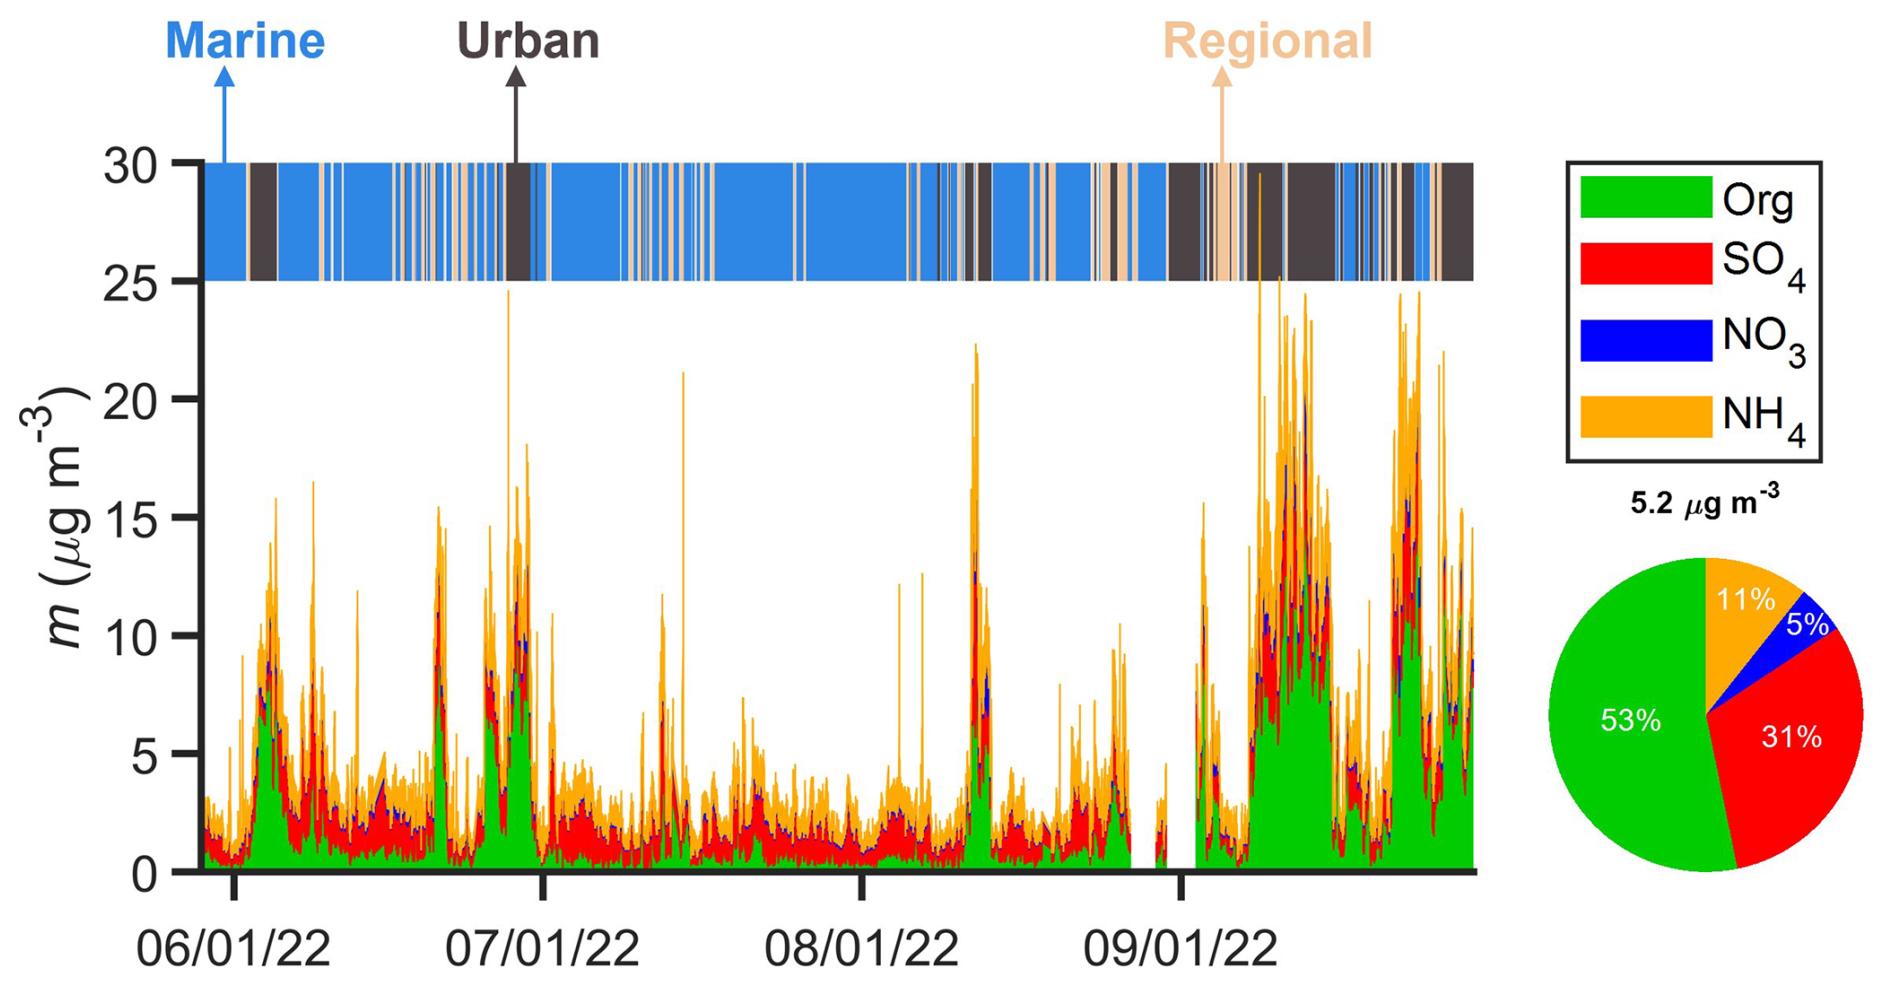
Figure 2Time series of NR-PM1 mass concentrations measured by the ToF-ACSM at the ANC site from 29 May to 29 September 2022. All time in this paper is local time (UTC−5 h). The marine, urban, and regional air masses are indicated by shades of blue, gray, and light orange, respectively. Also shown are the mass fractions averaged over the 4-month IOP. The mass concentration of chloride represents less than 1 % of the NR-PM1 mass concentration and is neglected.
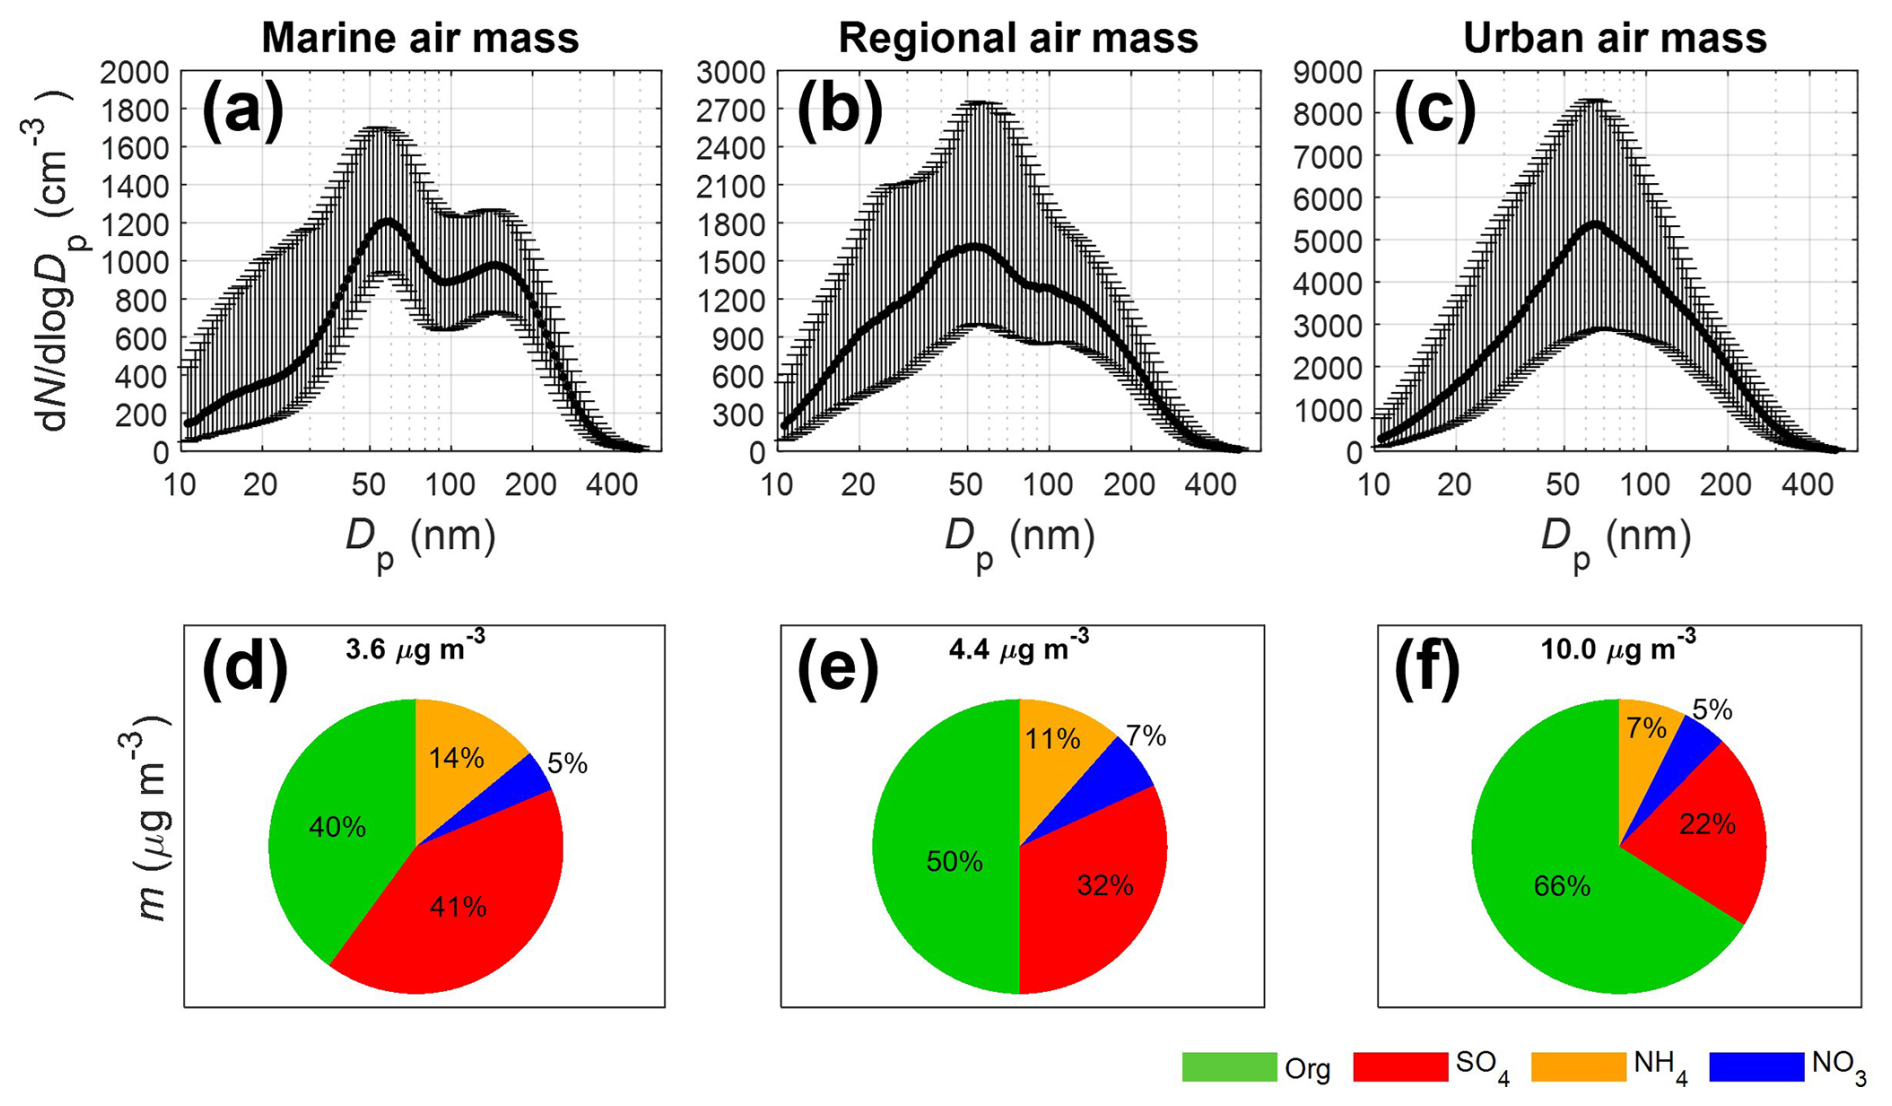
Figure 3First row (a–c): averaged aerosol size distributions during IOP in (a) marine, (b) regional, and (c) urban air masses. The solid line represents the median values, and the error bars indicate the 25th and 75th percentiles. Second row (d–f): averaged NR-PM1 mass concentrations and fractions in (d) marine, (e) regional, and (f) urban air masses.
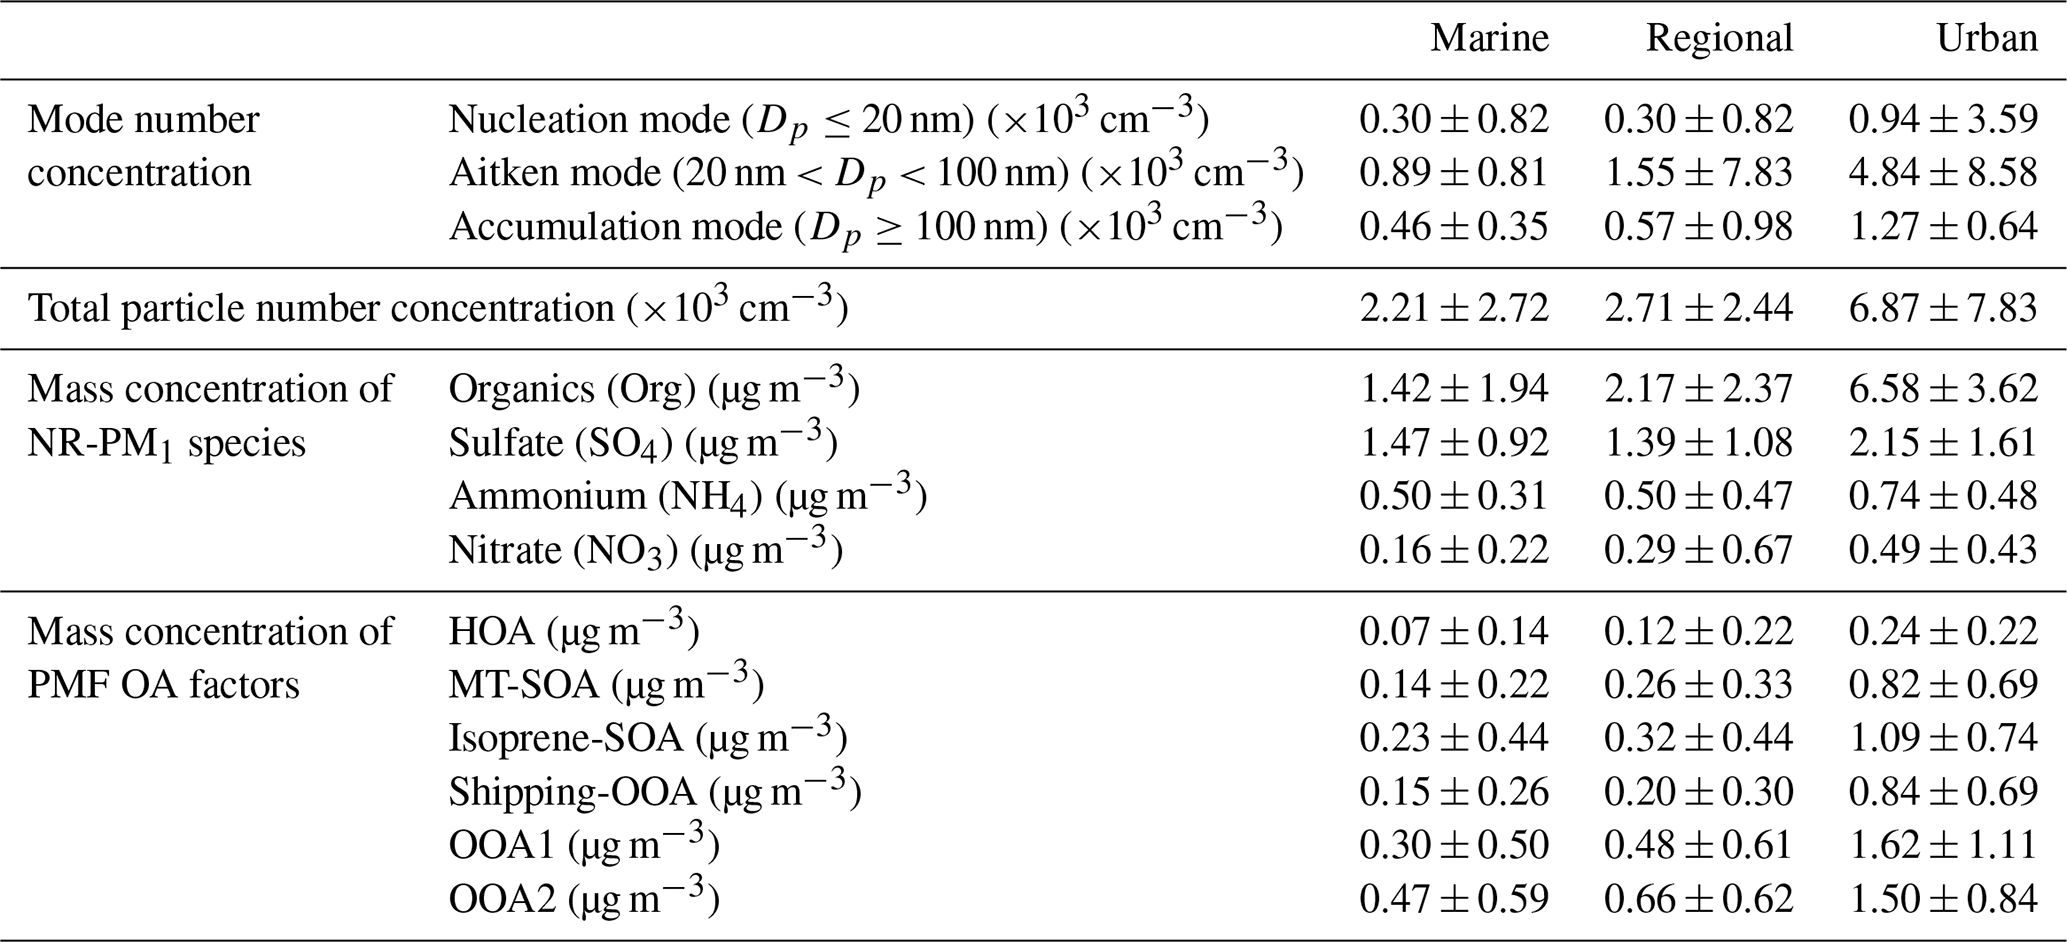
The aerosol size distributions in the three air mass types are shown in Fig. 3 and Table 1. The average total particle number concentration in the urban air mass is 3 times that in marine air mass. Aerosol size distribution in marine air masses shows a bimodal spectral shape (Fig. 3a), a common feature attributed to in-cloud processing (Gong et al., 2023; Hoppel et al., 1986). In contrast, urban air masses exhibit a unimodal aerosol size distribution, consistent with previous measurements in urban areas (Chen et al., 2022; Dall'Osto et al., 2012; Hussein et al., 2004). The observed modal diameters in marine (60 and 150 nm) and urban (65 nm) air masses are consistent with previous observations in Houston (Levy et al., 2013; Schwarz et al., 2008). The diurnal variations of aerosol size distribution reveal elevated concentrations of particles smaller than 30 nm around noon in both marine and urban air masses (Fig. S15). The elevated nucleation-mode particle concentrations are consistent with previous field observations in the Houston region (Russell et al., 2004, Levy et al., 2013) and are attributed to new particle formation (Fan et al., 2006). New particle formation around noon is commonly observed in urban environments (Brines et al., 2015; Minguillón et al., 2015; Reche et al., 2011) and is likely due to elevated gas-phase concentrations of sulfuric acid and low-volatility organic compounds resulting from photochemistry.
Table 1Averages and standard deviations of number concentrations for different aerosol modes, total particle number concentration, mass concentrations of NR-PM1 species and PMF OA factors in marine, regional, and urban air masses observed at the ANC site during IOP.
To investigate the origins of different aerosol components, we examined the correlation between each chemical component, conducted the CWT analysis, and examined the dependence of component concentrations on local wind speed and direction. Strong correlations were observed between nitrate and organics (R2=0.54) and between sulfate and ammonium (R2=0.83) (Table S2). Both the CWT analysis and wind-rose plots indicate elevated organic mass concentration in air masses passing over urban and forested areas (Figs. 4 and 1). In contrast, sulfate has contributions from both urban area and Gulf of Mexico, similar to findings in previous studies (Al-Naiema et al., 2018; Cleveland et al., 2012; Dai et al., 2019; Schulze et al., 2018). Ammonium exhibits a similar spatial distribution to sulfate. However, because marine emissions are unlikely a major source of ammonia, the similarity likely reflects the formation of ammonium sulfate or bisulfate through atmospheric neutralization processes involving anthropogenic sulfate and terrestrial ammonia (Schiferl et al., 2014; Weber et al., 2016). The similar CWT and wind-rose patterns for nitrate and organics suggest that nitrate may contain organic nitrate (Fig. 4). Unfortunately, the resolution of the ACSM deployed at the ANC site is insufficient to differentiate organic and inorganic nitrates.
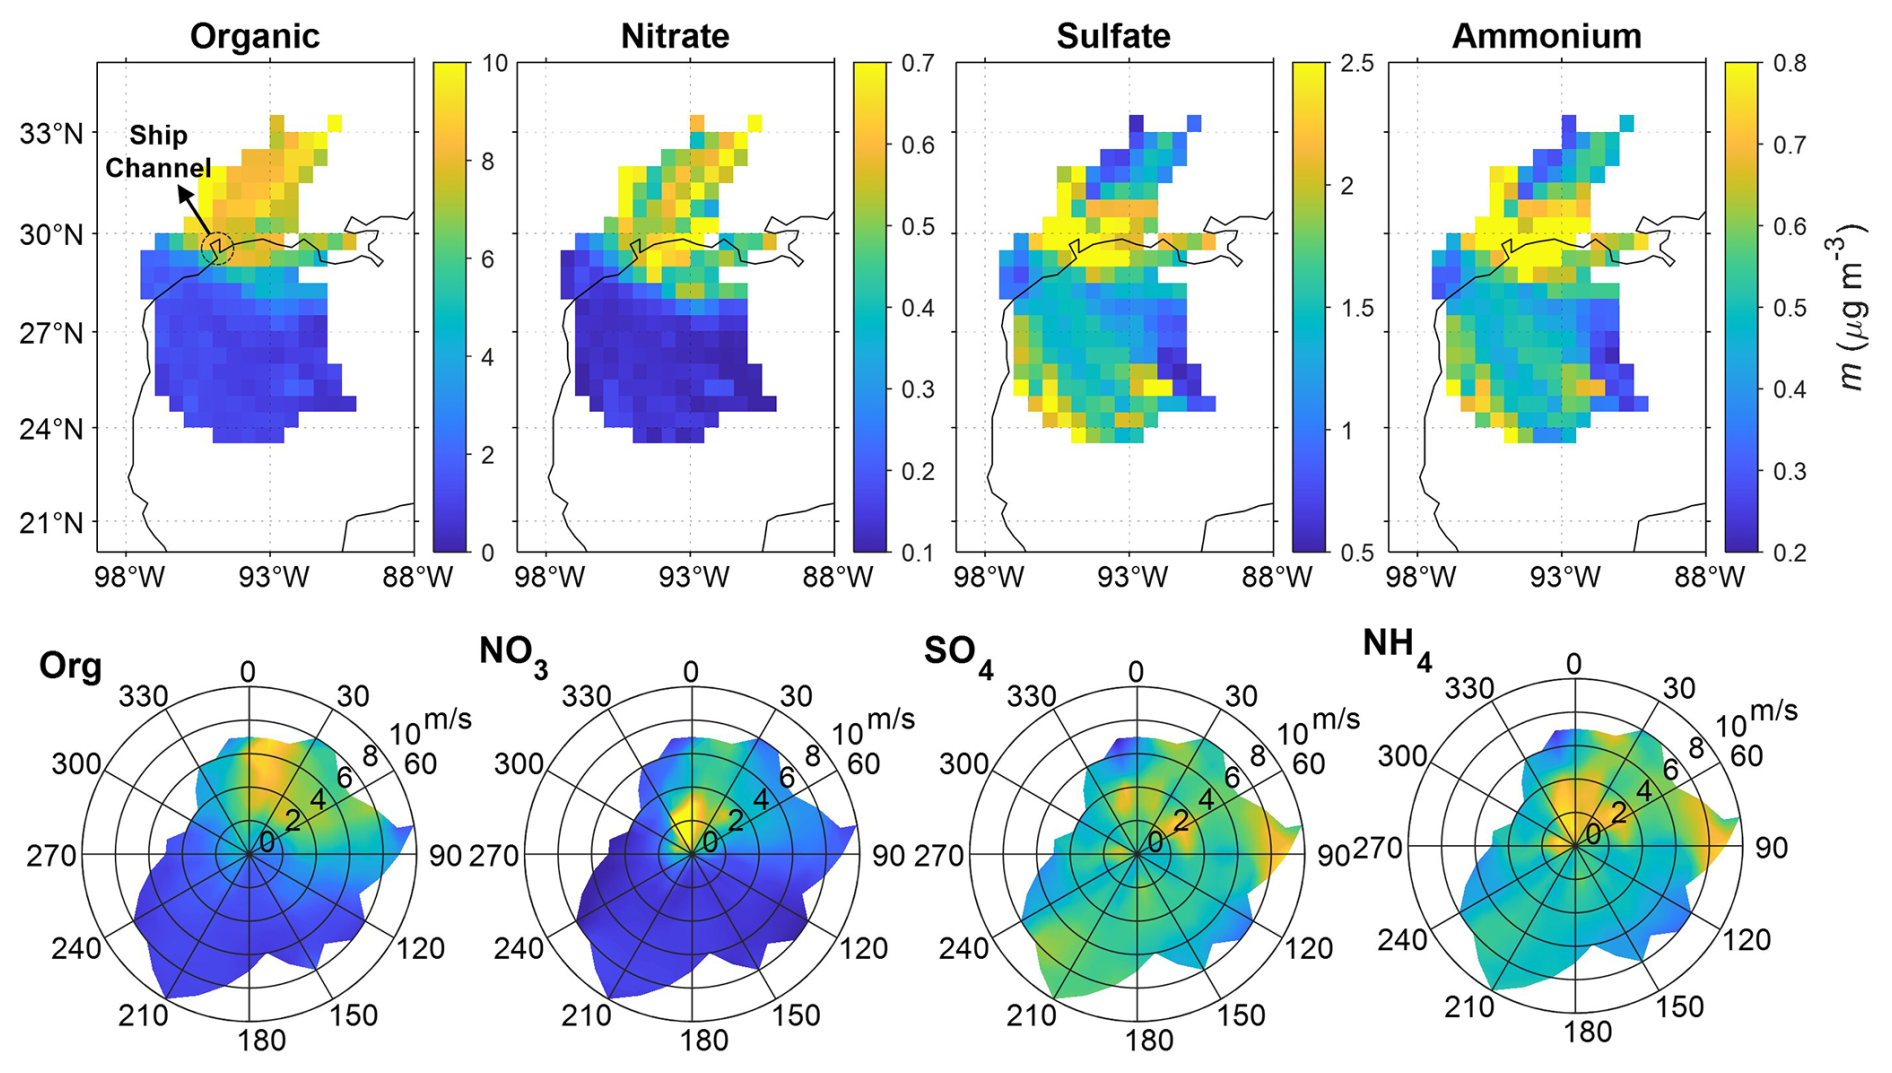
Figure 4First row: CWT analysis of mass concentrations of NR-PM1 species. Second row: wind-rose plots showing the variations of mass concentrations of NR-PM1 species with wind direction and speed.
3.2 Positive matrix factorization (PMF) analysis of OA
We applied PMF analysis to classify OA into 6 factors: hydrocarbon-like OA (HOA), monoterpene-derived secondary OA (MT-SOA), isoprene-derived secondary OA (isoprene-SOA), shipping-emission-related OOA (shipping-OOA), oxidized OA-1 (OOA1), and oxidized OA-2 (OOA2) (Fig. 5). On average, these factors contribute 6 %, 12 %, 17 %, 12 %, 25 %, and 28 %, respectively, to the OA mass concentrations during the IOP (Fig. 6a). In the following sections, we examine the potential sources of the OA factors by comparing the mass spectra of the factors with those reported in previous studies (Jeon et al., 2023) and by analyzing the correlations between OA factors and inorganic species, the air mass backward trajectories, and the dependence of OA factor mass concentrations on wind direction and speed.
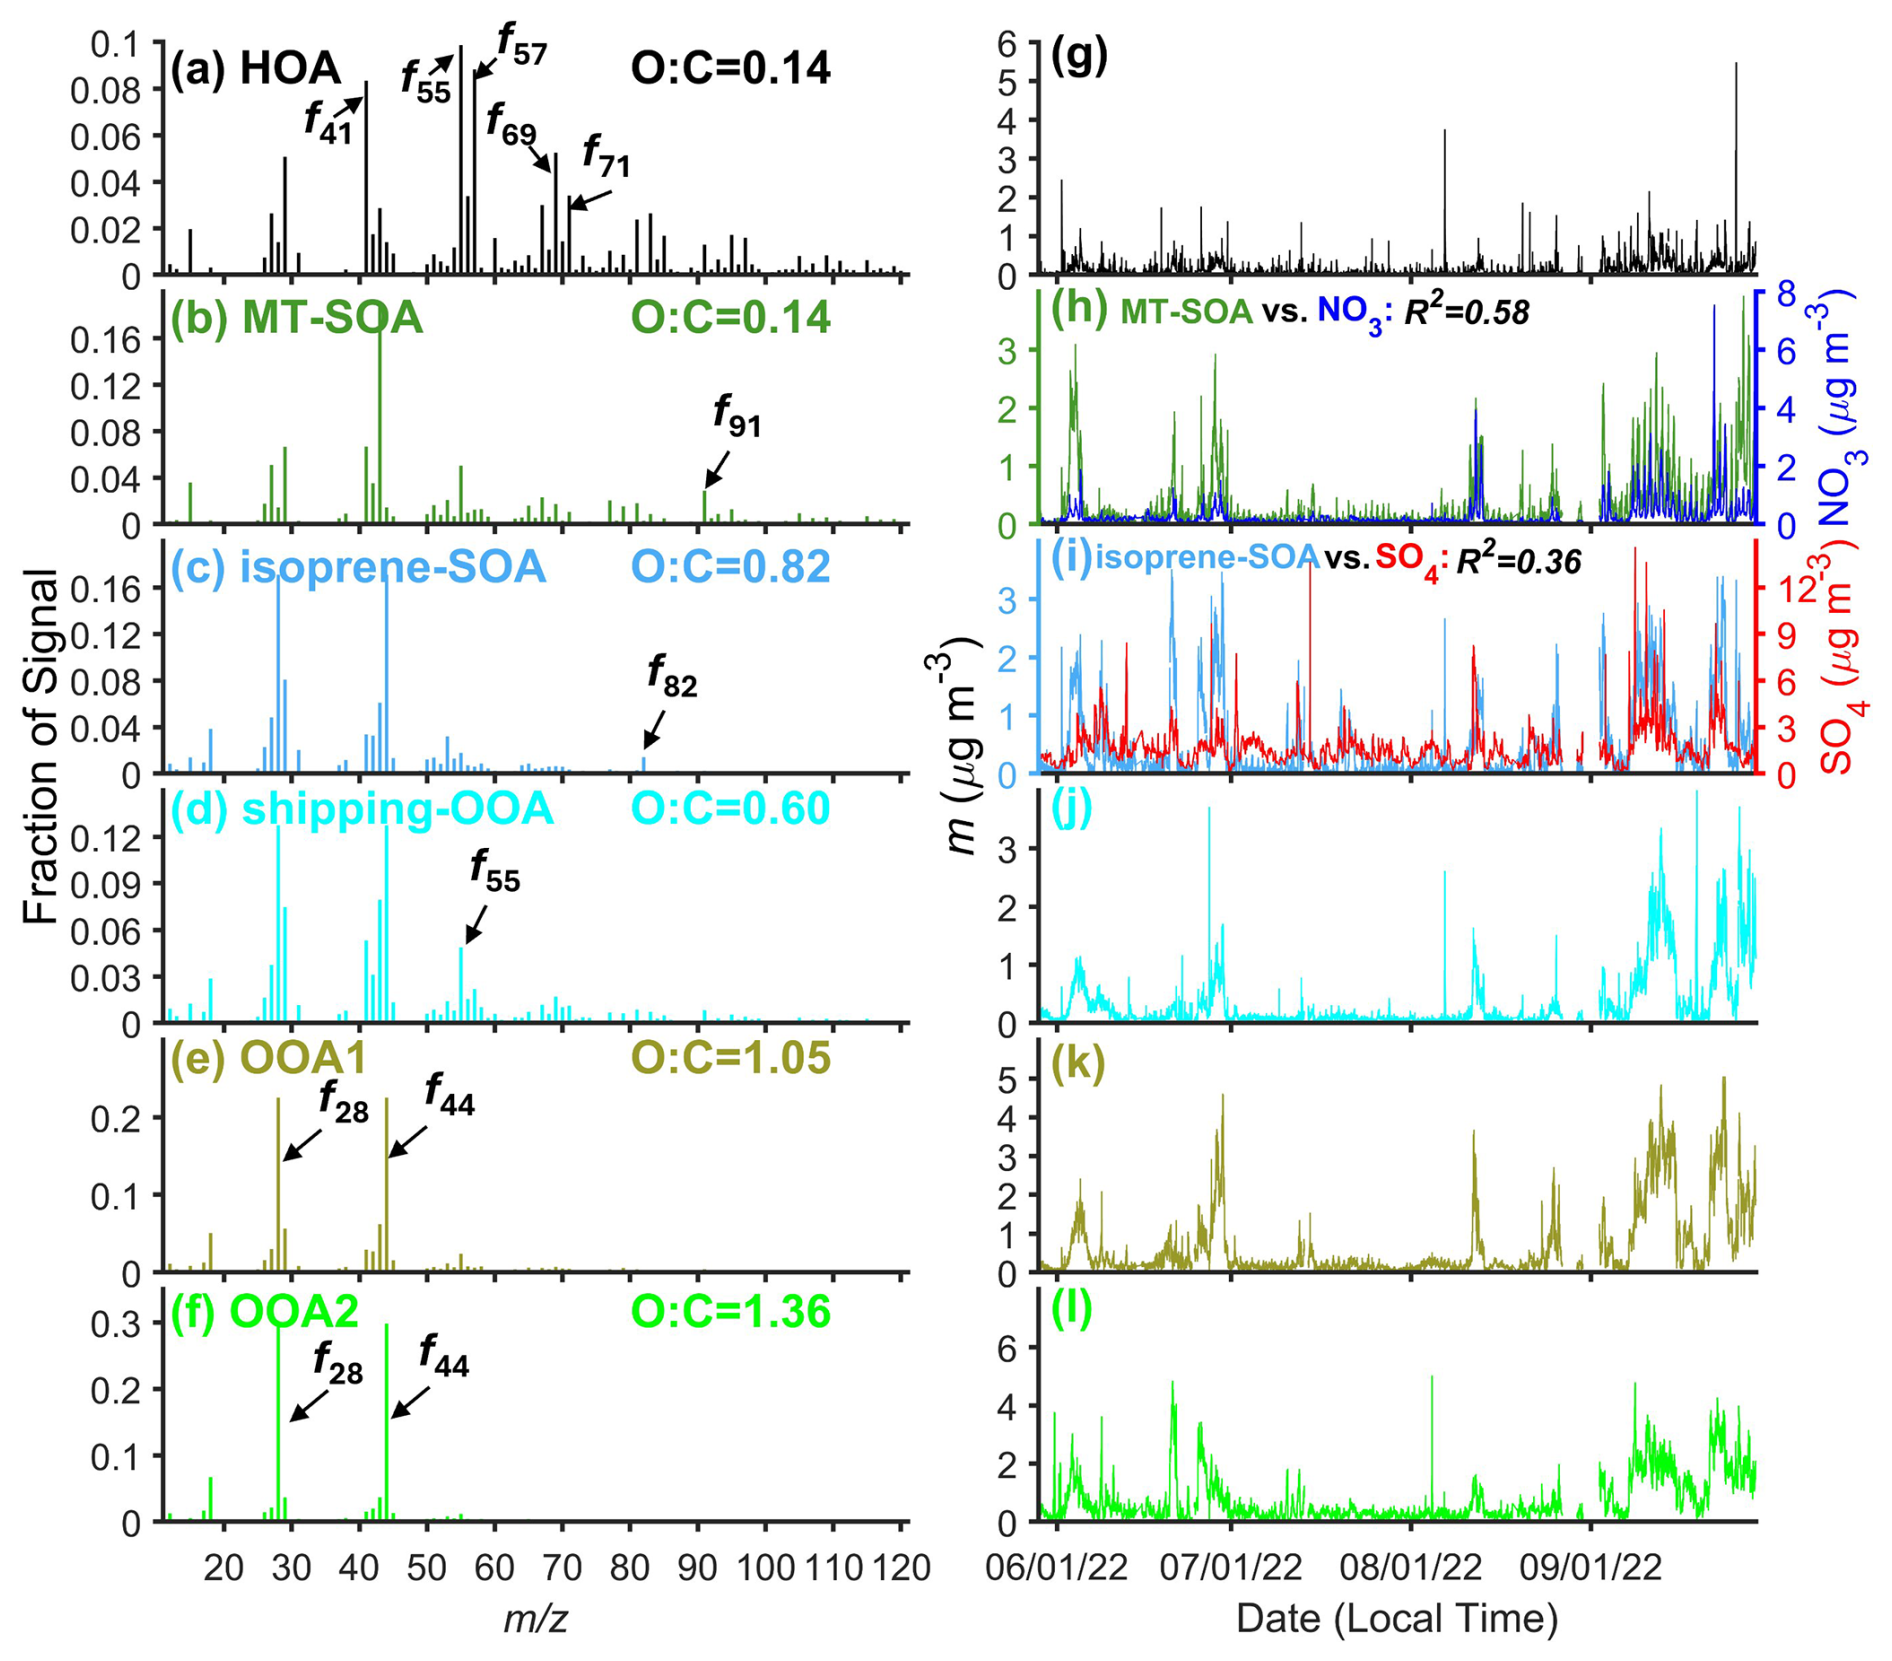
Figure 5(a–f) Mass spectra of PMF OA factors and (g–l) time series of OA factors. The correlations between OA factors and relevant species are also shown (h, i).
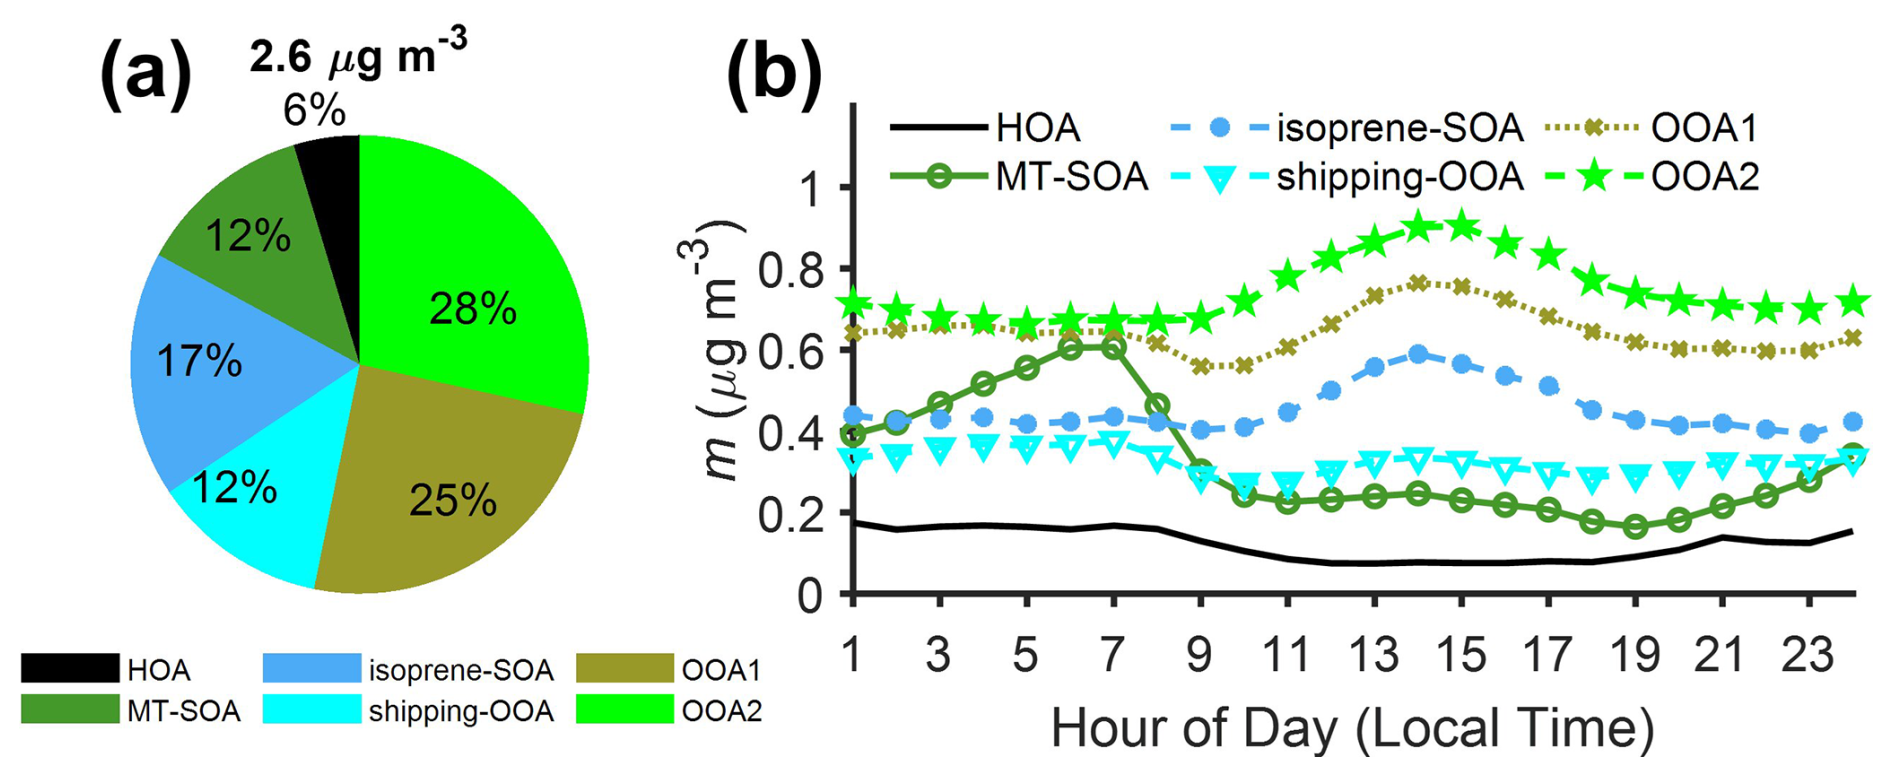
Figure 6(a) Mass fractions of PMF OA factors over IOP. (b) Diurnal variations of OA factors mass concentrations during the IOP.
3.2.1 HOA, MT-SOA, and isoprene-SOA
The HOA profile is dominated by fragments of aliphatic hydrocarbons, including 41 (C3H), 55 (C4H), 57 (C4H), 69 (C5H), and 71 (C5H) (Fig. 5a). These chemical formulas are based on measurements of high-resolution aerosol mass spectrometers (HR-AMSs) from previous studies. The HOA mass spectrum in this study exhibits a strong correlation (R2=0.83) with the spectrum of HOA factors identified in Mohr et al. (2012) and Docherty et al. (2011) (Table S3). The lower mass concentration of HOA during daytime (Fig. 6b) is attributed to increased planetary boundary layer height (PBLH) and the negligible contribution of secondary species. Figure S17 shows that HOA mass concentration becomes elevated when the wind is from the northeast, i.e., the direction of the Houston Ship Channel, suggesting that shipping emissions likely represent a major source of HOA at the site.
Among all 6 OA factors, MT-SOA has the highest f91 (i.e., ratio of 91 to total OA signal in the factor mass spectrum, Figs. 5b and S18b). A high f91 value is characteristic of SOA from the oxidation of monoterpenes, as shown by previous laboratory studies (Boyd et al., 2015; He et al., 2021; Takeuchi et al., 2022). The mass spectrum of the MT-SOA factor closely matches spectra of laboratory SOA produced from the nitrate radical oxidation of limonene (Boyd et al., 2015) and a mixture of α-pinene and limonene (Takeuchi et al., 2022), with R2 values of 0.90 and 0.92, respectively (Table S3). In addition, MT-SOA correlates with NO3, with R2=0.58 (Fig. 5h and Table S4). A similar correlation has been observed in previous field studies (Budisulistiorini et al., 2015; Hao et al., 2014; Kiendler-Scharr et al., 2016; Xu et al., 2015) and suggests a substantial contribution of organic nitrates to MT-SOA. Elevated MT-SOA mass concentration was observed with north and northeast winds (Fig. S17) from the Sam Houston National Forest, where there are strong emissions of monoterpenes (Brown et al., 2013). We note that OA with a high f91 can be associated with aged biomass-burning OA (BBOA) (Robinson et al., 2011). However, similar to observations in the southeastern US (Budisulistiorini et al., 2015, 2016), MT-SOA in this study does not show strong signals at 60 or 73, which are characteristic of levoglucosan (Alfarra et al., 2007; Schneider et al., 2006). Additionally, signals at 18, 29, and 44, which are used as tracers for BBOA in some studies (Bougiatioti et al., 2014), are also negligible for the MT-SOA. Therefore, we attribute MT-SOA to SOA from the oxidation of monoterpenes.
As high f82 is characteristic of isoprene SOA from the reactive uptake of isoprene epoxydiols in the presence of acidic sulfate particles (Hu et al., 2015; Lin et al., 2011; Lv et al., 2019; Riva et al., 2016; Xu et al., 2015), the OA factor with the highest f82 is denoted as isoprene-SOA (Figs. 5c and S5a). The mass spectrum of isoprene-SOA factor in this study agrees well with spectra of the Fac82 factor observed in the Borneo rainforest (Robinson et al., 2011) (R2=0.93) and the IEPOX-SOA factor during the SOAS campaign (Hu et al., 2015) (R2=0.88). The dominant land cover in the immediate vicinity of the ANC site is grassland. Global estimates suggest that grasses and herbaceous plants emit much less isoprene than trees, contributing less than 4 % of the total annual global isoprene emissions (Bai et al., 2006). Isoprene-SOA shows elevated mass concentration when the wind is from the northeast, the direction of Sam Houston National Forest (Fig. S17a). Therefore, while isoprene is emitted from grasslands nearby, forest emissions are likely the dominant isoprene source for the isoprene-SOA observed at the site. The mass concentrations of isoprene-SOA factor and sulfate are positively correlated, with an R2 value of 0.36 (Fig. 5i and Table S4). This R2 value is comparable to that observed in the Amazon rainforest (R2=0.37; de Sá et al., 2017) but slightly lower than values reported in the southeastern US (0.48–0.6) (Budisulistiorini et al., 2013, 2015; Hu et al., 2015; Xu et al., 2015). Unlike previous studies, where sampling sites were located in forested areas with broadly distributed isoprene emissions, isoprene at our ANC site primarily originates from the Sam Houston National Forest to the broad north, while a major source of sulfate is Houston Ship Channel to the northeast (Fig. 4). The spatial separation of isoprene and sulfate sources may contribute to the relatively lower R2 value in this study. This spatial separation is further supported by wind-dependent trends of isoprene-SOA, with elevated concentrations occurring when winds are from the north and northeast (Fig. S17a).
3.2.2 Shipping-OOA
One OOA factor exhibits the highest f55 among all OOA factors, with a ratio greater than 2 (Fig. 7c). OA factors with similar mass spectra were observed in previous studies in the Houston area and attributed to OA from cooking emissions (Al-Naiema et al., 2018; Wallace et al., 2018). The attribution to cooking emissions was mainly based on the high f55 signal and ratio (Mohr et al., 2012). However, in this study, as well as in the previous studies in Houston (Al-Naiema et al., 2018; Wallace et al., 2018), the diurnal variations of the factors with high f55 signals and do not show elevated mass concentrations around meal times, when cooking emissions peak (Fig. 6b). In addition, there are no major cooking activities near the ANC site. Cooking is not the only source for OA with high f55 signals and values above 2. OA from shipping emissions could have similar features (Schulze et al., 2018). The mass spectrum of this factor agrees well with that of organics during periods of heavy shipping emissions reported by Schulze et al. (2018), with an R2 value of 0.91 (Fig. S20), suggesting that this factor is likely associated with shipping emissions instead. Observations from 04:00 to 08:00 (all times in the paper are in central daylight time) on 19 September provide additional evidence that relates this factor to shipping emissions. At 04:00, the concentration of this factor increased (Fig. 7a and b) as the air mass started to pass over Freeport, a ship port (Fig. 7d and e). The concentration remained elevated until 08:00, when the air mass trajectory began to move away from the port area. Collectively, we identify and refer to this factor as shipping-OOA. High shipping-OOA mass concentration was observed when the wind is from the northeast, i.e., the direction of Houston Ship Channel (Fig. S17a), supporting the finding that shipping emissions are the dominant source of shipping-OOA. In addition, the CWT analysis shows shipping-OOA hotspots over Freeport for the marine air mass (Fig. S21). During the IOP, shipping-OOA observed at the ANC site accounts for 12 % of the total OA (Fig. 6a), compared with 8.6 %–32 % in previous studies (Al-Naiema et al., 2018; Wallace et al., 2018). These earlier studies may have underestimated the contribution of shipping emissions while overestimating the contribution of cooking emissions to the OA in Houston.
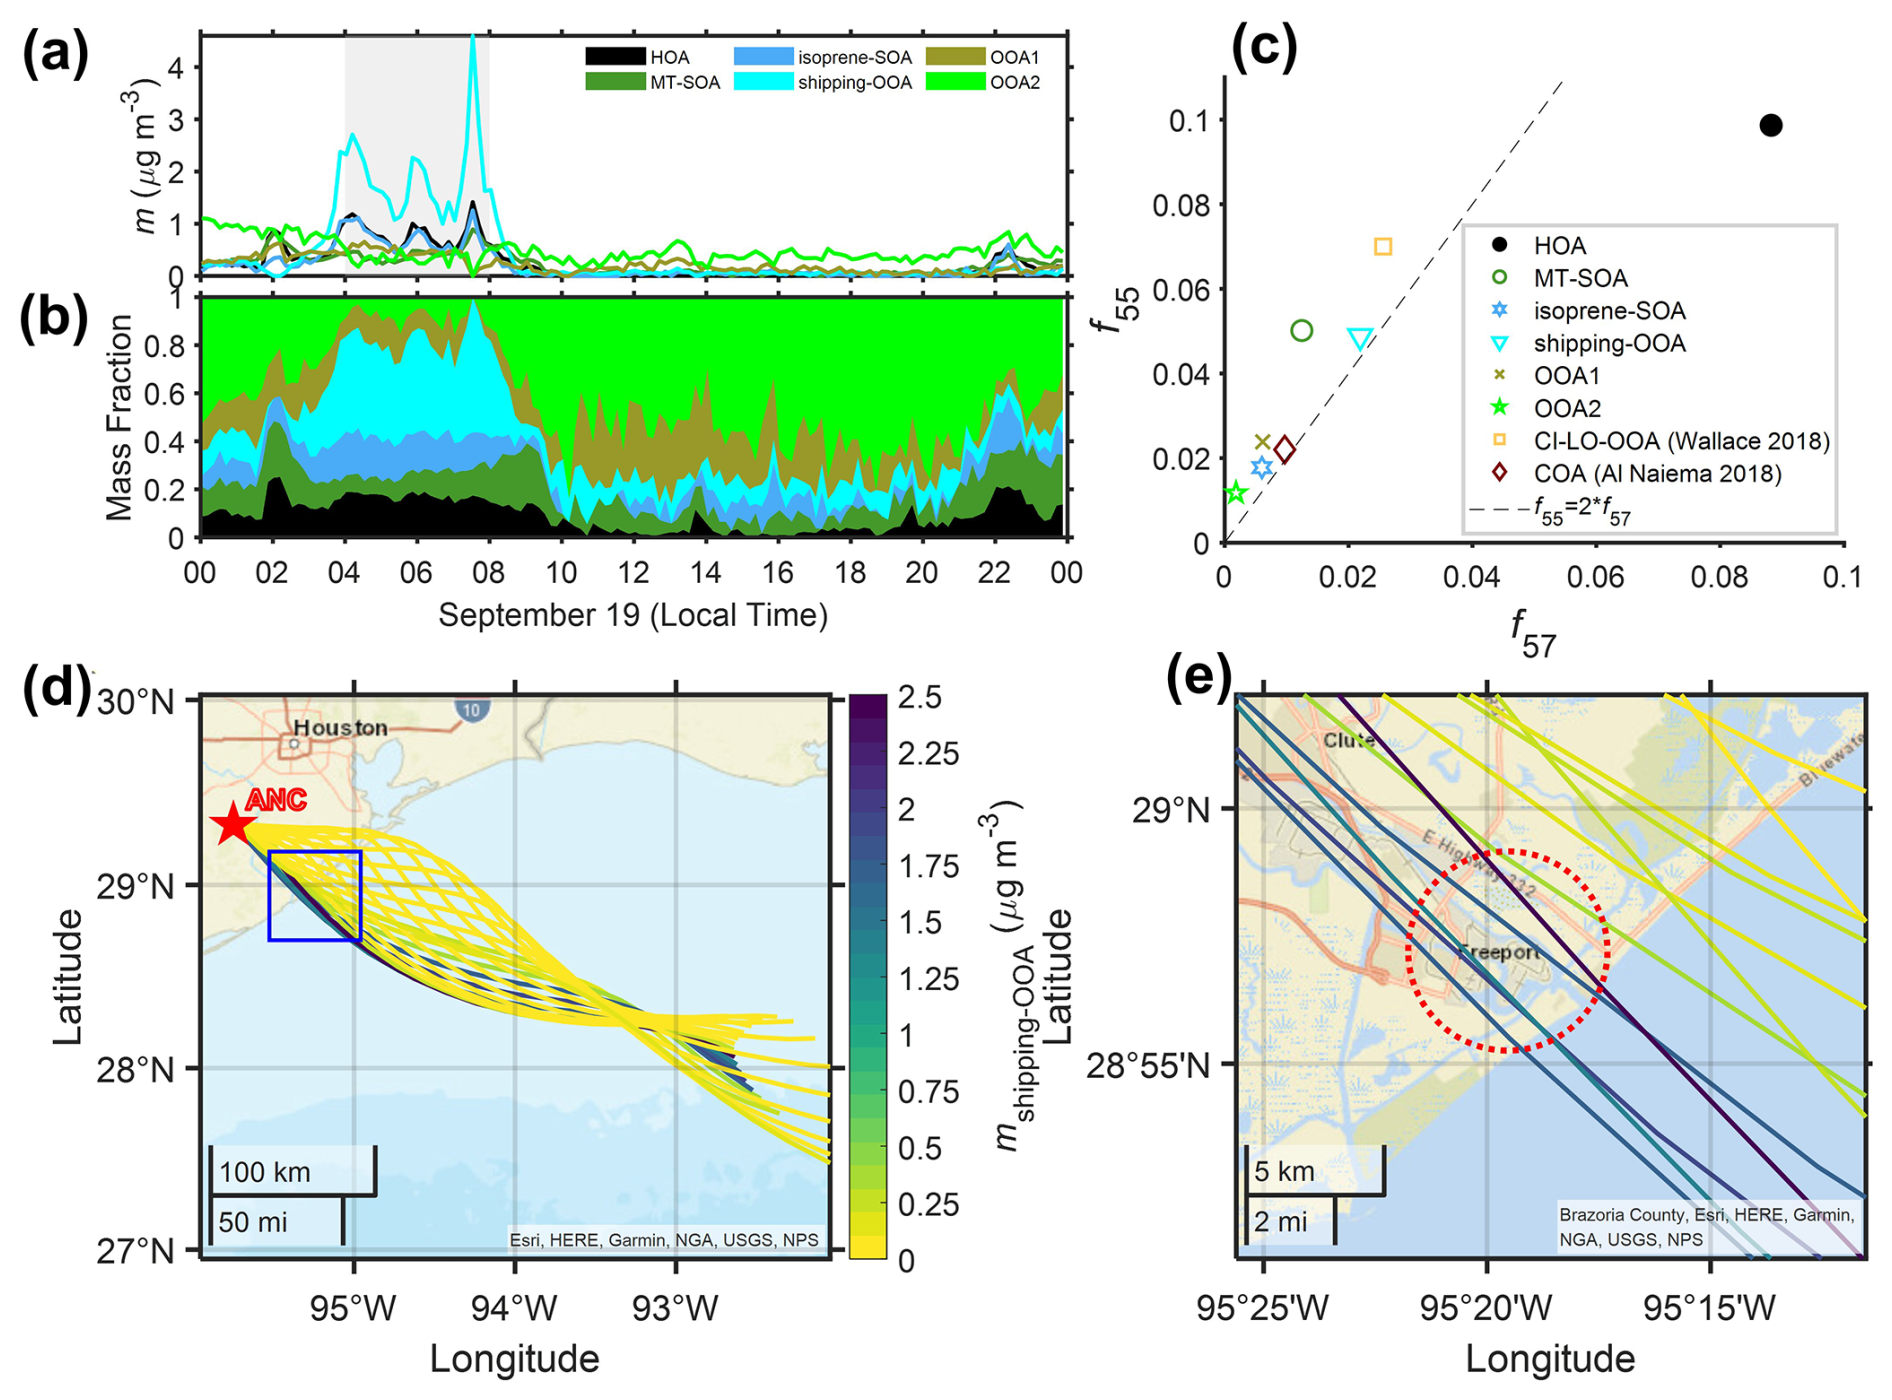
Figure 7A shipping-OOA pollution event from local time 04:00 to 08:00 on 19 September 2022. Time series of OA factors (a) mass concentrations and (b) mass fractions. (c) f55 vs. f57 of PMF factors from this study and prior studies. (d, e) Backward trajectories originating from 100 m above ground at the ANC site on 19 September 2022, colored according to shipping-OOA mass concentration; the area marked by the blue box in (d) is shown in (e).
3.2.3 OOA1 and OOA2
Two oxygenated OA factors with different O : C ratios (1.05 and 1.36 for OOA1 and OOA2, respectively) were identified, collectively accounting for 53 % of OA mass concentration (Fig. 6a). As the OA mass spectra become increasingly similar through the aging process, separating OOA factors and identifying their precursors and sources is more challenging compared to other OA factors (Hass-Mitchell et al., 2024; Ng et al., 2011; Zhang et al., 2011). OOA1 accounts for 25 % of OA mass concentration and has an O : C ratio of 1.05, between the ratios of shipping-OOA and OOA2. The O : C ratio falls within the range of highly oxidized OAs observed in urban areas (Aiken et al., 2008; Al-Naiema et al., 2018). The much higher OOA1 mass concentration in urban air masses than in the marine air masses suggests the precursors are mostly from emissions over the land (Table 1). The CWT analysis for urban air mass shows OOA1 hotspots over downtown Houston and the Houston Ship Channel, suggesting the influence from local urban emissions. In contrast, OOA2 displays a more spatially uniform distribution, indicating a more regional source (Fig. S22). This interpretation is further supported by the variations of OOA1 and OOA2 mass concentrations with wind direction (Fig. S17).
OOA2 has the highest oxidation level and represents the largest fraction of OA mass concentration (28 %, Fig. 6a). The mass spectrum of OOA2 matches spectra of highly aged OA in the literature (Lanz et al., 2007; Zhang et al., 2005). Wind-rose plots show that the OOA2 mass concentration in either marine or urban air mass is largely independent of the wind direction (Fig. S17), suggesting minimal influence from local emissions. At the ANC site, the mass concentration of OOA2 shows an increase starting in the morning (09:00) followed by a decrease starting in the early afternoon (14:00–15:00) (Fig. 6b). Highly oxidized OA factors with similar diurnal variations were commonly observed in the Houston area during previous studies (Al-Naiema et al., 2018; Bates et al., 2008; Dai et al., 2019; Schulze et al., 2018; Wallace et al., 2018). The midday elevated mass concentration of the highly oxidized OA factors was previously attributed to SOA formation driven by photochemical reactions and mixing from aloft (Al-Naiema et al., 2018; Bates et al., 2008; Dai et al., 2019). Here we find that the diurnal trend of OOA2 at the ANC site is primarily controlled by the change in air masses. For each individual air mass type (i.e., marine or urban), the OOA2 mass concentration largely remains constant throughout the day (Fig. 8a), in contrast to the diurnal variation of OOA2 in all air masses (referred to as “unseparated air masses” thereafter). To investigate the influence of air masses on the diurnal variation of OOA2 mass concentration, we first examined the time of air mass spent over the land during the 24 hours before arriving at the site using backward trajectories. The time of air mass spent over the land shows a similar diurnal variation as OOA2 mass concentration (Fig. 8b). The percentage of urban air mass observed at the site also shows a midday enhancement (Fig. 8c). This enhancement is likely due to diurnal variation of wind direction under the influence of land breezes and sea/bay breezes in Houston. Specifically, the wind alternates between northerly and southerly directions, with northerly winds prevailing in the evening with lower wind speed (land breezes) and southerly winds dominating during the daytime with higher wind speed (sea/bay breezes) (Fig. S25a). We calculated the backward trajectories of air masses arriving at the site in the early afternoon (i.e., 13:00) and evening (i.e., 21:00) using wind direction and speed averaged over days during the IOP on which air mass change was observed (Fig. S25c and d). The result clearly shows that the air mass observed at 13:00 spends a higher fraction of time over the land (and is more likely to be influenced by urban emissions) than the air mass observed at 21:00 (Fig. S25b). Given the higher OOA2 mass concentration in the urban air mass (Table 1), the elevated urban air mass fraction leads to enhanced OOA2 mass concentration at the ANC site midday.
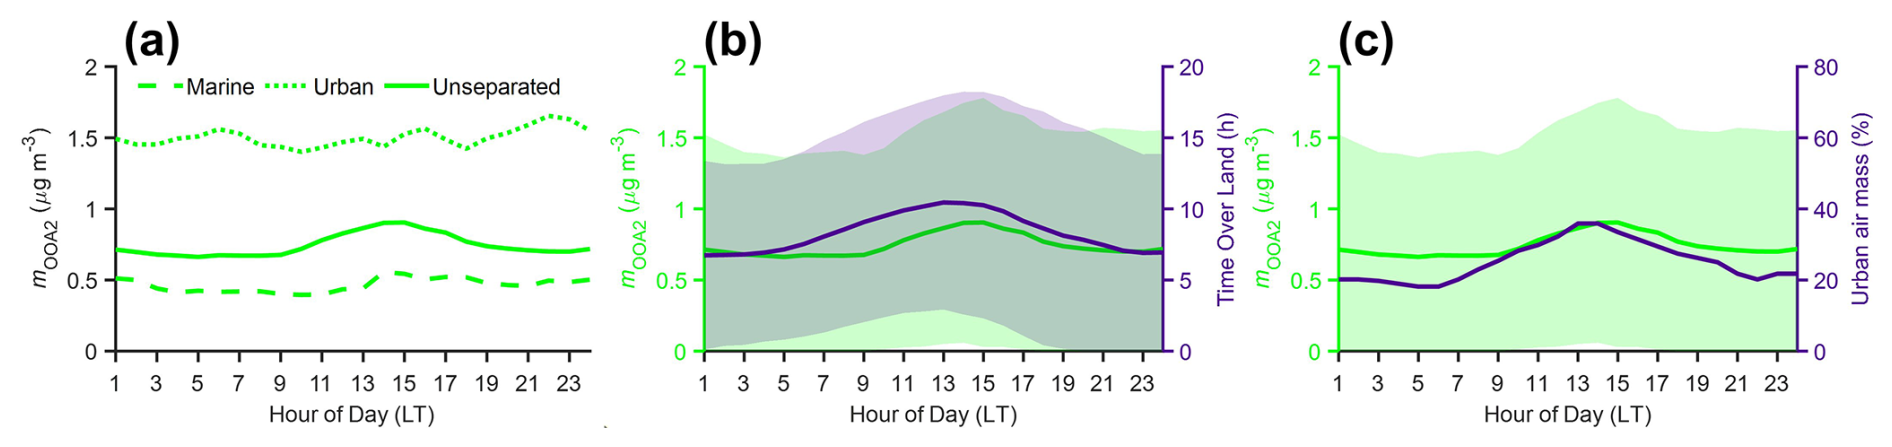
Figure 8(a) Diurnal variations of observed OOA2 mass concentrations in marine, urban, and unseparated air mass. (b) Diurnal variations of observed OOA2 mass concentrations and the time spent by the air mass over land during the 24 h before arriving at the site. (c) Diurnal variations of observed OOA2 mass concentration and the percentage of the urban air mass. The shaded areas in (b) and (c) represent ± 1 standard deviation.
To further investigate the processes driving the diurnal variation of OOA2, we employed a box model as described in Chen et al. (2021). The model considers direct emission, chemical reaction, depositional loss, horizontal advection, and vertical transport, and the temporal variation of the concentration of species i (ci) is given by
where H(t) is the PBLH and is derived from ceilometer measurements, qi is the emission rate, Ri is the chemical production and loss rate, is the deposition velocity, u is the wind speed in the constant Δx direction, is the background concentration of species i, and is the concentration of species i aloft.
The model applies the following key assumptions for marine and urban air masses. First, there is no direct emission of OOA2 because it is an aged SOA factor. Second, the net effect of horizontal advection is negligible within the same air mass type. This assumption is based on the weak dependence of OOA2 mass concentration with wind direction for the same air mass type (Fig. S17). Third, the chemical production term includes the oxidation of isoprene-SOA and OOA1. The further oxidation of OOA2 represents a sink. With these assumptions, Eq. (3) can be written as
The reaction rates k1, k2, and k3 were set to , , and cm3 molec.−1 s−1, respectively (Chen et al., 2021). Sensitivity tests for these rate constants were conducted, with k1, k2, and k3 reduced by 50 % (Fig. S23) and increased by 50 % (Fig. S24). The results indicate that these changes have minimal impact on the overall model outcomes. The OH was not measured at the ANC site during the IOP. Li et al. (2012) suggested that OH concentrations in rural areas around Houston are approximately 2–10 times lower than those in downtown. We divided the OH concentrations measured in downtown Houston (Ren et al., 2013) by a factor of 5 to estimate the OH concentration at the rural ANC site. Vd was calculated based on the diurnal variation of aerosol volume average diameter, wind speed, and temperature (Emerson et al., 2020). The OOA2 concentration () aloft was assumed to be constant and derived by fitting the diurnal variation predicted by Eq. (4) to the measured. The derived values of are 0.43 and 1.45 µg m−3 for marine and urban air masses, respectively.
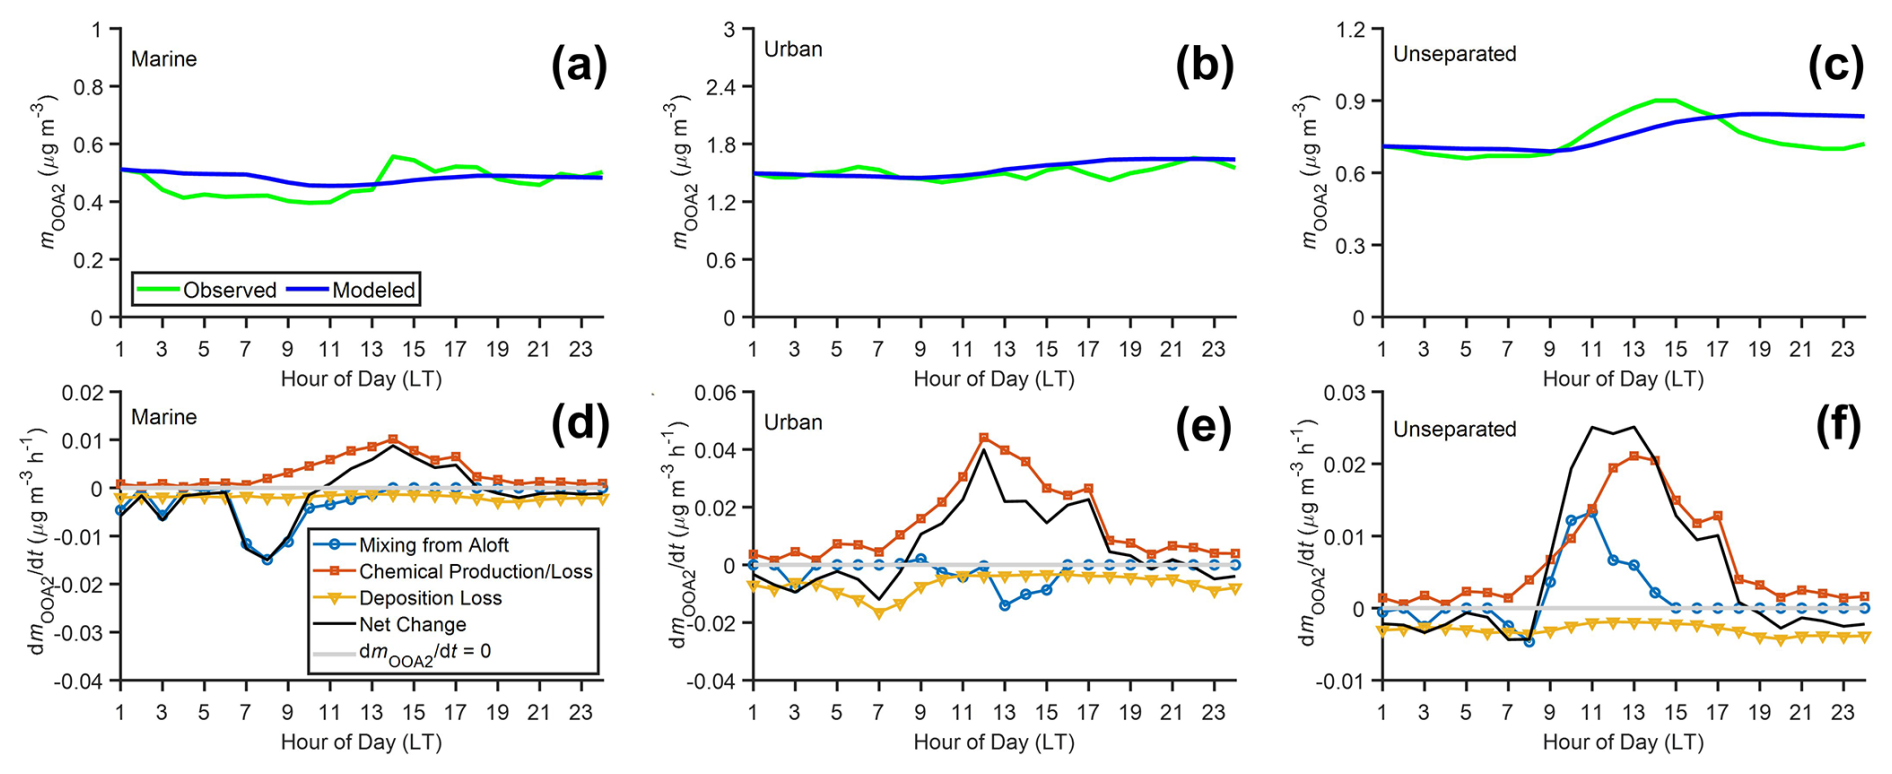
Figure 91-D box model results. (a, b, c) Diurnal variations of observed and modeled OOA2 mass concentrations in (a) marine, (b) urban, and (c) unseparated air masses, (d, e, f) Simulated contributions from different processes (mixing from aloft, chemical production/loss, deposition loss) and the net change rate of OOA2 mass concentration within the PBLH in the (d) marine, (e) urban, and (f) unseparated air masses.
The model successfully captures the observed OOA2 diurnal trends in both marine and urban air masses (Fig. 9a and b). Figure 9d and e show the diurnal variations of the overall change rate of OOA2 mass concentration and contributions from chemical production/loss, deposition, and mixing from aloft for marine and urban air masses. “Mixing from aloft” represents the vertical transport of OOA2 between the boundary layer and the free troposphere as the PBLH changes. The planetary boundary layer is shallow at night and grows during the daytime (Fig. S16). When the PBLH increases, free troposphere air entrains into the boundary layer, leading to dilution of OOA2 if the concentration aloft is low or enrichment if the concentration aloft is high. In contrast, when the PBLH decreases, there is no mixing between the boundary layer and the free troposphere. Therefore, the decreasing PBLH has no impact on OOA2 concentration at the surface. “Chemical production/loss” refers to the production and loss of OOA2 through OH oxidation. “Deposition loss” represents the removal of OOA2 via dry deposition.
Figure 9d and e show the contributions of each process to the change in OOA2 mass concentration for marine and urban air masses, respectively. Overall, chemical reactions lead to an increase in OOA2 mass concentration throughout the day, with the highest production rate around noon due to elevated OH concentrations. Deposition loss is higher at night due to the shallower PBLH. The mixing from aloft influences OOA2 concentration from early morning to early afternoon when the PBLH increases. In the late afternoon, the PBLH starts to decrease, but this process does not directly affect the OOA2 concentration. The change rates of OOA2 concentration due to these three processes are quite small, less than 0.02 µg m−3 h−1 for marine air mass and 0.04 µg m−3 h−1 for urban air mass. Combined, these processes result in a negligible net change rate, and therefore, OOA2 concentrations are largely constant throughout the day for both marine and urban air masses. These box model results further support that the OOA2 is highly aged, minimally influenced by local emissions, and represents a uniform background within the same air mass type.
We also modeled the diurnal variation of OOA2 mass concentration for unseparated air masses using the 1-D box model with the same assumptions described above (Fig. 9c and f). We initially assumed a constant OOA2 concentration aloft, but the model was not able to capture the observed diurnal variation. We then derived an altitude-dependent OOA2 aloft concentration by correlating the observed OOA2 concentration with PBLH (Fig. S19), as in Chen et al. (2021). While an altitude-dependent OOA2 improves the agreement between the model results and observations to some extent, the 1-D model still fails to capture the diurnal trend of OOA2 in unseparated air masses (Fig. 9c). First, the modeled increase in OOA2 concentration during daytime is much more gradual than the observed. Second, at around 15:00 local time, the observed OOA2 concentrations begin to decrease, whereas the simulated concentrations remain constant. These discrepancies are probably due to the 1-D model neglecting the impact of horizontal advection. For the same air mass type, the effect of horizontal advection is likely negligible, as supported by the observation that OOA2 mass concentration is largely wind-direction independent. However, given the contrasting OOA2 mass concentrations in different air mass types (Table 1), the impact of horizontal advection can be substantial when the air mass type observed at the ANC site shifts. As discussed earlier, the air masses observed at midday tend to have spent more time over land compared to those observed in morning and evening, and they are more likely influenced by urban emissions (i.e., a higher percentage of the urban air mass, Fig. 8b, and c). Given the higher mOOA2 in the urban air mass, the elevated mOOA2 during midday is attributed to the higher percentage of urban air masses arriving at the site. Previous studies have observed similar diurnal variations of highly oxidized OA in the Houston area (Al-Naiema et al., 2018; Bates et al., 2008; Dai et al., 2019), and attributed the variations to secondary aerosol formation by photochemical reactions and mixing from aloft. Our analysis indicates that the variation observed at the ANC site is likely dominated by the shifting in air mass (i.e., aerosol sources), and the influence of secondary formation and mixing from aloft is relatively minor.
Figure 10 and Table S5 summarize the NR-PM1 mass concentrations and mass fractions at various locations in the greater Houston region, based on this study and previous studies. Caution is needed when comparing these results as these studies were conducted in different months over several years. In general, the total aerosol mass concentration in the greater Houston area influenced by urban air masses (10.8 µg m−3 at Manchester St.; 10.9 µg m−3 at the University of Houston; 9.8 µg m−3 within the urban air mass at Southwest of Galveston; 9.96 µg m−3 within the urban air mass at Guy) is approximately 3 times higher than that influenced by marine air masses (3.82 µg m−3 within the marine air mass at Southwest of Galveston; 3.55 µg m−3 within the marine air mass at Guy) (Table S5). The major local aerosol sources in the greater Houston area include the industrial and traffic emissions in and around the Houston urban area and shipping emissions near the coastal line. To visualize their impacts on major aerosol components, we generate heatmaps illustrating the variations of sulfate, SOA, HOA mass concentrations and sulfate mass fractions with distances to the urban center and the coastal line (Fig. 10b, d, e, and c). Here, SOA is defined as the sum of all PMF factors except for the primary organic aerosol factors. The urban center is defined as the University of Houston.
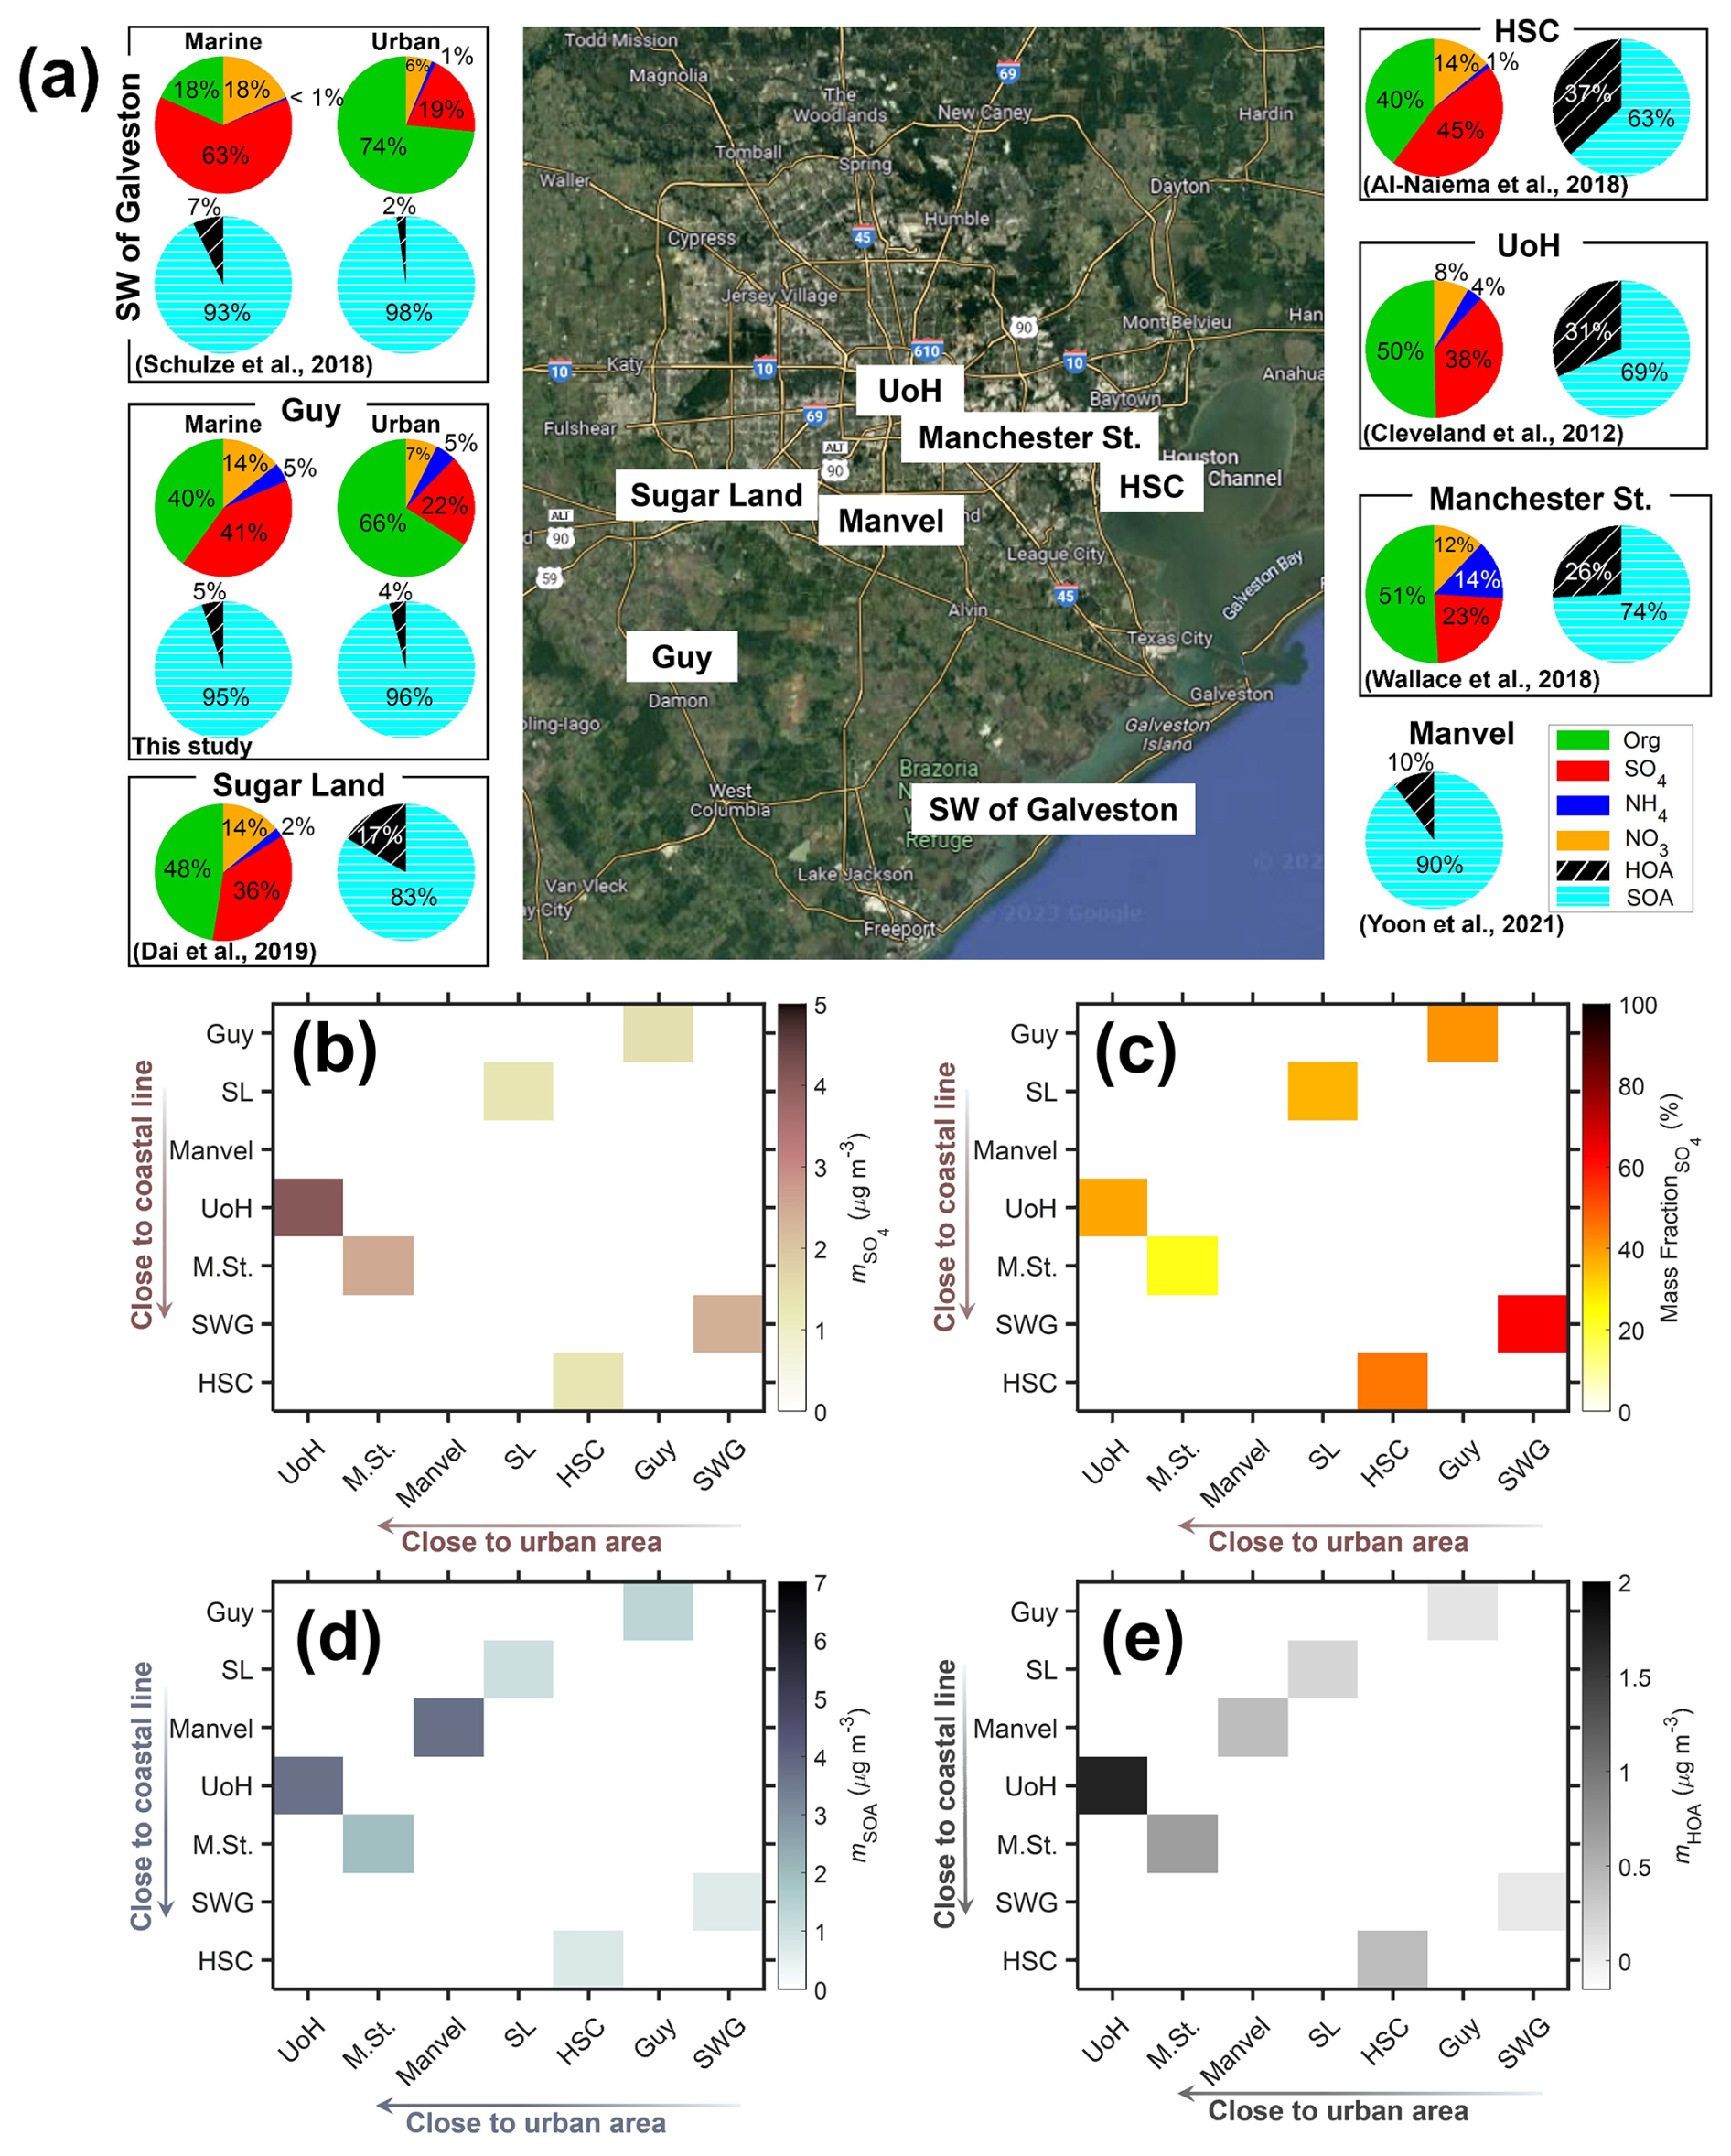
Figure 10(a) Sample locations and aerosol compositions measured by ACSM/AMS during this and previous field studies in the Houston region (© Google Maps 2022). Pie charts show the average mass fractions of NR-PM1 species and PMF-resolved OA factors. (b) Mass concentration of sulfate, (c) mass fraction of sulfate, (d) mass concentration of SOA, and (e) mass concentration of HOA. The mass concentrations and fractions in (b), (c), (d), and (e) are from marine air mass for locations Guy and HSC. HSC: Houston Ship Channel. UoH: University of Houston. Manchester St./M. St.: Manchester Street. SL: Sugar Land. SW of Galveston/SWG: Southwest of Galveston.
Sulfate exhibits higher mass concentrations near both the urban center and the coastal line (Fig. 10b). Cleveland et al. (2012) reported the highest sulfate concentration of 4.1 µg m−3 (Fig. 10b and Table S5) at the University of Houston. The second-highest sulfate concentration, 2.5 µg m−3, was observed at a sampling site approximately 6.5 km from the University of Houston and surrounded by industrial and petrochemical complexes (Wallace et al., 2018). Due to the proximity of the two sampling locations, the 1.64-fold difference in sulfate concentrations may be due to temporal variations rather than spatial differences, suggesting a decline in anthropogenic emissions in Houston. At the southwest of Galveston, near the coastal line, sulfate concentration was observed as 2.4 µg m−3 in marine air mass (Schulze et al., 2018), comparable to that in downtown Houston. While sulfate concentrations in both areas are similar, the sulfate mass fraction near the coastline is substantially higher (63 %) than that near the urban center (23 %) (Fig. 10c), suggesting different aerosol sources and processes. In downtown Houston, the primary source of sulfate is refinery emissions (Wallace et al., 2018), whereas the sulfate near the coastal regions is mainly from the shipping emission (Schulze et al., 2018; Zhou et al., 2023). The lower sulfate fraction near the urban center is largely driven by higher SOA mass concentration near the urban center (Fig. 10d), which is attributed to the abundant volatile organic compounds (VOCs; Bahreini et al., 2009) and oxidizing agents (such as ozone, OH, and nitrate radicals) (Paraschiv et al., 2020) from industrial and traffic emissions. HOA exhibits higher mass concentrations near both the urban center and coastal line (Fig. 10e), suggesting significant contributions from primary emissions related to fossil fuel combustion, including vehicular traffic, industrial activities, and shipping emissions.
The above comparison shows that the aerosol mass concentrations and compositions observed in urban and marine air masses at the ANC site are consistent with earlier results. Together, the measurements at the ANC site and other locations show that the industrial and traffic emissions in the urban center, as well as shipping emissions along the coastal line, are among the important aerosol sources in the Houston region, including the rural area where the ANC site is located.
In this study, we present a comprehensive analysis of aerosol properties measured at a coastal–rural site (i.e., ANC site) near Houston, Texas, during the TRACER campaign. Based on 24 h backward trajectories, air masses arriving at the site are classified into three different types: marine air mass from the Gulf, urban air mass influenced by urban emissions, and regional air mass. Marine air masses typically exhibit bimodal aerosol size distribution due to cloud processing and have the lowest particle number and PM1 mass concentrations among all three air mass types, whereas urban air masses show the highest number and PM1 mass concentrations. On average, particle number and mass concentrations in urban air masses are 3 times higher than those in marine air masses.
Using PMF analysis on aerosol mass spectra, we identified 6 OA factors, including hydrocarbon-like OA (HOA), OA from the oxidation of monoterpenes (MT-SOA), OA from the reactive uptake of isoprene epoxydiols by acidic sulfate particles (isoprene-SOA), oxygenated OA arising from shipping emissions (shipping-OOA), and two oxygenated OA factors with high O : C ratios (OOA1 and OOA2). On average, these factors contribute 6 %, 12 %, 17 %, 12 %, 25 %, and 28 %, respectively, to the OA mass concentration during the IOP. The dependence of HOA mass concentration on wind direction suggests that shipping emissions are its major source. Based on mass spectra signature and wind direction dependence, MT-SOA and isoprene-SOA are attributed to the oxidation of monoterpenes emitted from Sam Houston National Forest and reactive uptake of isoprene epoxydiols in the presence of acidic sulfate particles, respectively. Shipping-OOA factor has the highest f55 among all OOA factors, with an ratio exceeding 2. Our analysis indicates that this factor is likely associated with shipping emissions rather than cooking emissions suggested by previous studies.
Collectively, two oxygenated OA factors with high O : C ratios (1.05 and 1.36 for OOA1 and OOA2, respectively) accounting for 53 % of OA mass concentration are observed at the site. The O : C ratios of both OOA1 and OOA2 fall within the range of highly oxidized OA typically observed in urban areas. As the OA mass spectra become increasingly similar through the aging process, identifying specific precursors and sources of OOA1 and OOA2 proves challenging. The CWT analysis for the urban air mass indicates the potential contribution of local emissions in downtown Houston and the Houston Ship Channel areas to OOA1. The weak dependence of mass concentrations on wind direction in marine or urban air mass suggests that local sources have relatively minor contributions to OOA2. OOA2 has the highest oxidation level and represents the largest fraction of OA mass (28 %). At the ANC site, the OOA2 mass concentration peaks midday (i.e., ∼ 11:00 to ∼ 16:00). Highly oxidized OA factors with similar diurnal variations have been commonly observed in the Houston area during prior studies, where the midday peak was attributed to SOA formation driven by photochemical reactions and mixing from aloft. Utilizing air mass backward trajectories and a 1-D box model, we demonstrate that the diurnal trend of OOA2 at the ANC site is predominantly influenced by the change of air masses instead. Both the duration of air masses over land and the fraction of urban air mass observed at the site show a midday enhancement, which is likely due to the diurnal variation of wind direction under the influence of land breezes and sea/bay breezes in the Houston area. Given the higher OOA2 mass concentration in urban air masses, the high urban air mass fraction in midday leads to elevated OOA2 mass concentration at the ANC site.
The aerosol mass concentrations and compositions in urban and marine air masses observed at the ANC site are consistent with results from previous studies in the Houston region. Together, the measurements at the ANC site and other locations consistently show that shipping emissions along the coastal line, as well as the industrial emissions and traffic emissions in the urban center are among the important aerosol sources in the Houston region, including at the rural area where the ANC site is located. This study quantifies aerosol properties in representative air masses; identifies the major sources of OA in the Houston region; and highlights the impacts of emissions, atmospheric chemistry, and meteorology on aerosol properties in the coastal–rural environment.
TRACER observational datasets are available at https://www.arm.gov/data/ (Atmospheric Radiation Measurement User Facility, 2025). HYSPLIT data are accessible from the NOAA READY website (https://www.ready.noaa.gov/HYSPLIT.php, NOAA Air Resources Laboratory, 2022). The code used to generate the figures is available upon request.
The supplement related to this article is available online at https://doi.org/10.5194/acp-25-13975-2025-supplement.
JW, LX, and JL designed the study. JL, JZ, XG, SS, CK, AS, and MZ carried out the measurements. MZ resolved the PMF factors. JL, JW, and LX led the data analysis and preparation of the manuscript, with contributions from all authors.
The contact author has declared that none of the authors has any competing interests.
Publisher's note: Copernicus Publications remains neutral with regard to jurisdictional claims made in the text, published maps, institutional affiliations, or any other geographical representation in this paper. While Copernicus Publications makes every effort to include appropriate place names, the final responsibility lies with the authors. Views expressed in the text are those of the authors and do not necessarily reflect the views of the publisher.
We thank Daniel Bahrt and Ana Gabriela Pessoa, technicians from Atmospheric Radiation Measurement (ARM) Climate Research Facility, for their help on the facilities and instruments maintenance during IOP.
This research was conducted with funding from the Atmospheric Radiation Measurement (ARM) Climate Research Facility (Office of Biological and Environmental Research of the U.S. Department of Energy, Climate and Environmental Science Division) under contract DE-SC0021017.
This paper was edited by Sergio Rodríguez and reviewed by two anonymous referees.
Aiken, A. C., DeCarlo, P. F., Kroll, J. H., Worsnop, D. R., Huffman, J. A., Docherty, K. S., Ulbrich, I. M., Mohr, C., Kimmel, J. R., Sueper, D., Sun, Y., Zhang, Q., Trimborn, A., Northway, M., Ziemann, P. J., Canagaratna, M. R., Onasch, T. B., Alfarra, M. R., Prevot, A. S. H., Dommen, J., Duplissy, J., Metzger, A., Baltensperger, U., and Jimenez, J. L.: and Ratios of Primary, Secondary, and Ambient Organic Aerosols with High-Resolution Time-of-Flight Aerosol Mass Spectrometry, Environ. Sci. Technol., 42, 4478–4485, https://doi.org/10.1021/es703009q, 2008.
Albrecht, B. A.: Aerosols, Cloud Microphysics, and Fractional Cloudiness, Science, 245, 1227–1230, https://doi.org/10.1126/science.245.4923.1227, 1989.
Alfarra, M. R., Prevot, A. S. H., Szidat, S., Sandradewi, J., Weimer, S., Lanz, V. A., Schreiber, D., Mohr, M., and Baltensperger, U.: Identification of the Mass Spectral Signature of Organic Aerosols from Wood Burning Emissions, Environ. Sci. Technol., 41, 5770–5777, https://doi.org/10.1021/es062289b, 2007.
Al-Naiema, I. M., Hettiyadura, A. P. S., Wallace, H. W., Sanchez, N. P., Madler, C. J., Cevik, B. K., Bui, A. A. T., Kettler, J., Griffin, R. J., and Stone, E. A.: Source apportionment of fine particulate matter in Houston, Texas: insights to secondary organic aerosols, Atmos. Chem. Phys., 18, 15601–15622, https://doi.org/10.5194/acp-18-15601-2018, 2018.
Andreae, M. O., Rosenfeld, D., Artaxo, P., Costa, A. A., Frank, G. P., Longo, K. M., and Silva-Dias, M. A. F.: Smoking Rain Clouds over the Amazon, Science, 303, 1337–1342, https://doi.org/10.1126/science.1092779, 2004.
Atmospheric Radiation Measurement User Facility: TRACER observational datasets, Atmospheric Radiation Measurement User Facility [data set], https://www.arm.gov/data/ (last access: 12 December 2024), 2025.
Bahreini, R., Ervens, B., Middlebrook, A. M., Warneke, C., de Gouw, J. A., DeCarlo, P. F., Jimenez, J. L., Brock, C. A., Neuman, J. A., Ryerson, T. B., Stark, H., Atlas, E., Brioude, J., Fried, A., Holloway, J. S., Peischl, J., Richter, D., Walega, J., Weibring, P., Wollny, A. G., and Fehsenfeld, F. C.: Organic aerosol formation in urban and industrial plumes near Houston and Dallas, Texas, Journal of Geophysical Research: Atmospheres, 114, https://doi.org/10.1029/2008JD011493, 2009.
Bai, J., Baker, B., Liang, B., Greenberg, J., and Guenther, A.: Isoprene and monoterpene emissions from an Inner Mongolia grassland, Atmospheric Environment, 40, 5753–5758, https://doi.org/10.1016/j.atmosenv.2006.05.019, 2006.
Bates, T. S., Quinn, P. K., Coffman, D., Schulz, K., Covert, D. S., Johnson, J. E., Williams, E. J., Lerner, B. M., Angevine, W. M., Tucker, S. C., Brewer, W. A., and Stohl, A.: Boundary layer aerosol chemistry during TexAQS/GoMACCS 2006: Insights into aerosol sources and transformation processes, Journal of Geophysical Research: Atmospheres, 113, https://doi.org/10.1029/2008JD010023, 2008.
Bean, J. K., Faxon, C. B., Leong, Y. J., Wallace, H. W., Cevik, B. K., Ortiz, S., Canagaratna, M. R., Usenko, S., Sheesley, R. J., Griffin, R. J., and Hildebrandt Ruiz, L.: Composition and Sources of Particulate Matter Measured near Houston, TX: Anthropogenic-Biogenic Interactions, Atmosphere, 7, 73, https://doi.org/10.3390/atmos7050073, 2016.
Bougiatioti, A., Stavroulas, I., Kostenidou, E., Zarmpas, P., Theodosi, C., Kouvarakis, G., Canonaco, F., Prévôt, A. S. H., Nenes, A., Pandis, S. N., and Mihalopoulos, N.: Processing of biomass-burning aerosol in the eastern Mediterranean during summertime, Atmos. Chem. Phys., 14, 4793–4807, https://doi.org/10.5194/acp-14-4793-2014, 2014.
Boyd, C. M., Sanchez, J., Xu, L., Eugene, A. J., Nah, T., Tuet, W. Y., Guzman, M. I., and Ng, N. L.: Secondary organic aerosol formation from the β-pinene+NO3 system: effect of humidity and peroxy radical fate, Atmos. Chem. Phys., 15, 7497–7522, https://doi.org/10.5194/acp-15-7497-2015, 2015.
Brines, M., Dall'Osto, M., Beddows, D. C. S., Harrison, R. M., Gómez-Moreno, F., Núñez, L., Artíñano, B., Costabile, F., Gobbi, G. P., Salimi, F., Morawska, L., Sioutas, C., and Querol, X.: Traffic and nucleation events as main sources of ultrafine particles in high-insolation developed world cities, Atmos. Chem. Phys., 15, 5929–5945, https://doi.org/10.5194/acp-15-5929-2015, 2015.
Brock, C. A., Trainer, M., Ryerson, T. B., Neuman, J. A., Parrish, D. D., Holloway, J. S., Nicks Jr., D. K., Frost, G. J., Hübler, G., Fehsenfeld, F. C., Wilson, J. C., Reeves, J. M., Lafleur, B. G., Hilbert, H., Atlas, E. L., Donnelly, S. G., Schauffler, S. M., Stroud, V. R., and Wiedinmyer, C.: Particle growth in urban and industrial plumes in Texas, Journal of Geophysical Research: Atmospheres, 108, https://doi.org/10.1029/2002JD002746, 2003.
Brown, S. S., Dubé, W. P., Bahreini, R., Middlebrook, A. M., Brock, C. A., Warneke, C., de Gouw, J. A., Washenfelder, R. A., Atlas, E., Peischl, J., Ryerson, T. B., Holloway, J. S., Schwarz, J. P., Spackman, R., Trainer, M., Parrish, D. D., Fehshenfeld, F. C., and Ravishankara, A. R.: Biogenic VOC oxidation and organic aerosol formation in an urban nocturnal boundary layer: aircraft vertical profiles in Houston, TX, Atmos. Chem. Phys., 13, 11317–11337, https://doi.org/10.5194/acp-13-11317-2013, 2013.
Budisulistiorini, S. H., Canagaratna, M. R., Croteau, P. L., Marth, W. J., Baumann, K., Edgerton, E. S., Shaw, S. L., Knipping, E. M., Worsnop, D. R., Jayne, J. T., Gold, A., and Surratt, J. D.: Real-Time Continuous Characterization of Secondary Organic Aerosol Derived from Isoprene Epoxydiols in Downtown Atlanta, Georgia, Using the Aerodyne Aerosol Chemical Speciation Monitor, Environ. Sci. Technol., 47, 5686–5694, https://doi.org/10.1021/es400023n, 2013.
Budisulistiorini, S. H., Li, X., Bairai, S. T., Renfro, J., Liu, Y., Liu, Y. J., McKinney, K. A., Martin, S. T., McNeill, V. F., Pye, H. O. T., Nenes, A., Neff, M. E., Stone, E. A., Mueller, S., Knote, C., Shaw, S. L., Zhang, Z., Gold, A., and Surratt, J. D.: Examining the effects of anthropogenic emissions on isoprene-derived secondary organic aerosol formation during the 2013 Southern Oxidant and Aerosol Study (SOAS) at the Look Rock, Tennessee ground site, Atmos. Chem. Phys., 15, 8871–8888, https://doi.org/10.5194/acp-15-8871-2015, 2015.
Budisulistiorini, S. H., Baumann, K., Edgerton, E. S., Bairai, S. T., Mueller, S., Shaw, S. L., Knipping, E. M., Gold, A., and Surratt, J. D.: Seasonal characterization of submicron aerosol chemical composition and organic aerosol sources in the southeastern United States: Atlanta, Georgia,and Look Rock, Tennessee, Atmos. Chem. Phys., 16, 5171–5189, https://doi.org/10.5194/acp-16-5171-2016, 2016.
Caicedo, V., Rappenglueck, B., Cuchiara, G., Flynn, J., Ferrare, R., Scarino, A. J., Berkoff, T., Senff, C., Langford, A., and Lefer, B.: Bay Breeze and Sea Breeze Circulation Impacts on the Planetary Boundary Layer and Air Quality From an Observed and Modeled DISCOVER-AQ Texas Case Study, Journal of Geophysical Research: Atmospheres, 124, 7359–7378, https://doi.org/10.1029/2019JD030523, 2019.
IPCC: Climate Change 2023: Synthesis Report. Contribution of Working Groups I, II and III to the Sixth Assessment Report of the Intergovernmental Panel on Climate Change, edited by: Core Writing Team, Lee, H., and Romero, J., IPCC, Geneva, Switzerland, Intergovernmental Panel on Climate Change (IPCC), https://doi.org/10.59327/IPCC/AR6-9789291691647, 2023.
Canagaratna, M. R., Jimenez, J. L., Kroll, J. H., Chen, Q., Kessler, S. H., Massoli, P., Hildebrandt Ruiz, L., Fortner, E., Williams, L. R., Wilson, K. R., Surratt, J. D., Donahue, N. M., Jayne, J. T., and Worsnop, D. R.: Elemental ratio measurements of organic compounds using aerosol mass spectrometry: characterization, improved calibration, and implications, Atmos. Chem. Phys., 15, 253–272, https://doi.org/10.5194/acp-15-253-2015, 2015.
Canonaco, F., Tobler, A., Chen, G., Sosedova, Y., Slowik, J. G., Bozzetti, C., Daellenbach, K. R., El Haddad, I., Crippa, M., Huang, R.-J., Furger, M., Baltensperger, U., and Prévôt, A. S. H.: A new method for long-term source apportionment with time-dependent factor profiles and uncertainty assessment using SoFi Pro: application to 1 year of organic aerosol data, Atmos. Meas. Tech., 14, 923–943, https://doi.org/10.5194/amt-14-923-2021, 2021.
Charlson, R. J., Schwartz, S. E., Hales, J. M., Cess, R. D., Coakley, J. A., Hansen, J. E., and Hofmann, D. J.: Climate Forcing by Anthropogenic Aerosols, Science, 255, 423–430, https://doi.org/10.1126/science.255.5043.423, 1992.
Chen, L., Zhang, F., Collins, D., Ren, J., Liu, J., Jiang, S., and Li, Z.: Characterizing the volatility and mixing state of ambient fine particles in the summer and winter of urban Beijing, Atmos. Chem. Phys., 22, 2293–2307, https://doi.org/10.5194/acp-22-2293-2022, 2022.
Chen, Y., Guo, H., Nah, T., Tanner, D. J., Sullivan, A. P., Takeuchi, M., Gao, Z., Vasilakos, P., Russell, A. G., Baumann, K., Huey, L. G., Weber, R. J., and Ng, N. L.: Low-Molecular-Weight Carboxylic Acids in the Southeastern U.S.: Formation, Partitioning, and Implications for Organic Aerosol Aging, Environ. Sci. Technol., 55, 6688–6699, https://doi.org/10.1021/acs.est.1c01413, 2021.
Cleveland, M. J., Ziemba, L. D., Griffin, R. J., Dibb, J. E., Anderson, C. H., Lefer, B., and Rappenglück, B.: Characterization of urban aerosol using aerosol mass spectrometry and proton nuclear magnetic resonance spectroscopy, Atmospheric Environment, 54, 511–518, https://doi.org/10.1016/j.atmosenv.2012.02.074, 2012.
Dai, Q., Schulze, B. C., Bi, X., Bui, A. A. T., Guo, F., Wallace, H. W., Sanchez, N. P., Flynn, J. H., Lefer, B. L., Feng, Y., and Griffin, R. J.: Seasonal differences in formation processes of oxidized organic aerosol near Houston, TX, Atmos. Chem. Phys., 19, 9641–9661, https://doi.org/10.5194/acp-19-9641-2019, 2019.
Dall'Osto, M., Beddows, D. C. S., Pey, J., Rodriguez, S., Alastuey, A., Harrison, R. M., and Querol, X.: Urban aerosol size distributions over the Mediterranean city of Barcelona, NE Spain, Atmos. Chem. Phys., 12, 10693–10707, https://doi.org/10.5194/acp-12-10693-2012, 2012.
de Sá, S. S., Palm, B. B., Campuzano-Jost, P., Day, D. A., Newburn, M. K., Hu, W., Isaacman-VanWertz, G., Yee, L. D., Thalman, R., Brito, J., Carbone, S., Artaxo, P., Goldstein, A. H., Manzi, A. O., Souza, R. A. F., Mei, F., Shilling, J. E., Springston, S. R., Wang, J., Surratt, J. D., Alexander, M. L., Jimenez, J. L., and Martin, S. T.: Influence of urban pollution on the production of organic particulate matter from isoprene epoxydiols in central Amazonia, Atmos. Chem. Phys., 17, 6611–6629, https://doi.org/10.5194/acp-17-6611-2017, 2017.
Docherty, K. S., Aiken, A. C., Huffman, J. A., Ulbrich, I. M., DeCarlo, P. F., Sueper, D., Worsnop, D. R., Snyder, D. C., Peltier, R. E., Weber, R. J., Grover, B. D., Eatough, D. J., Williams, B. J., Goldstein, A. H., Ziemann, P. J., and Jimenez, J. L.: The 2005 Study of Organic Aerosols at Riverside (SOAR-1): instrumental intercomparisons and fine particle composition, Atmos. Chem. Phys., 11, 12387–12420, https://doi.org/10.5194/acp-11-12387-2011, 2011.
Dunker, A. M., Koo, B., and Yarwood, G.: Source apportionment of organic aerosol and ozone and the effects of emission reductions, Atmospheric Environment, 198, 89–101, https://doi.org/10.1016/j.atmosenv.2018.10.042, 2019.
Emerson, E. W., Hodshire, A. L., DeBolt, H. M., Bilsback, K. R., Pierce, J. R., McMeeking, G. R., and Farmer, D. K.: Revisiting particle dry deposition and its role in radiative effect estimates, Proceedings of the National Academy of Sciences, 117, 26076–26082, https://doi.org/10.1073/pnas.2014761117, 2020.
Fan, J., Zhang, R., Collins, D., and Li, G.: Contribution of secondary condensable organics to new particle formation: A case study in Houston, Texas, Geophysical Research Letters, 33, https://doi.org/10.1029/2006GL026295, 2006.
Fan, J., Zhang, R., Li, G., and Tao, W.-K.: Effects of aerosols and relative humidity on cumulus clouds, Journal of Geophysical Research: Atmospheres, 112, https://doi.org/10.1029/2006JD008136, 2007a.
Fan, J., Zhang, R., Li, G., Tao, W.-K., and Li, X.: Simulations of cumulus clouds using a spectral microphysics cloud-resolving model, Journal of Geophysical Research: Atmospheres, 112, https://doi.org/10.1029/2006JD007688, 2007b.
Fröhlich, R., Cubison, M. J., Slowik, J. G., Bukowiecki, N., Prévôt, A. S. H., Baltensperger, U., Schneider, J., Kimmel, J. R., Gonin, M., Rohner, U., Worsnop, D. R., and Jayne, J. T.: The ToF-ACSM: a portable aerosol chemical speciation monitor with TOFMS detection, Atmos. Meas. Tech., 6, 3225–3241, https://doi.org/10.5194/amt-6-3225-2013, 2013.
Gong, X., Wang, Y., Xie, H., Zhang, J., Lu, Z., Wood, R., Stratmann, F., Wex, H., Liu, X., and Wang, J.: Maximum Supersaturation in the Marine Boundary Layer Clouds Over the North Atlantic, AGU Advances, 4, e2022AV000855, https://doi.org/10.1029/2022AV000855, 2023.
Hao, L. Q., Kortelainen, A., Romakkaniemi, S., Portin, H., Jaatinen, A., Leskinen, A., Komppula, M., Miettinen, P., Sueper, D., Pajunoja, A., Smith, J. N., Lehtinen, K. E. J., Worsnop, D. R., Laaksonen, A., and Virtanen, A.: Atmospheric submicron aerosol composition and particulate organic nitrate formation in a boreal forestland–urban mixed region, Atmos. Chem. Phys., 14, 13483–13495, https://doi.org/10.5194/acp-14-13483-2014, 2014.
Hass-Mitchell, T., Joo, T., Rogers, M., Nault, B. A., Soong, C., Tran, M., Seo, M., Machesky, J. E., Canagaratna, M., Roscioli, J., Claflin, M. S., Lerner, B. M., Blomdahl, D. C., Misztal, P. K., Ng, N. L., Dillner, A. M., Bahreini, R., Russell, A., Krechmer, J. E., Lambe, A., and Gentner, D. R.: Increasing Contributions of Temperature-Dependent Oxygenated Organic Aerosol to Summertime Particulate Matter in New York City, ACS EST Air, 1, 113–128, https://doi.org/10.1021/acsestair.3c00037, 2024.
He, Q., Tomaz, S., Li, C., Zhu, M., Meidan, D., Riva, M., Laskin, A., Brown, S. S., George, C., Wang, X., and Rudich, Y.: Optical Properties of Secondary Organic Aerosol Produced by Nitrate Radical Oxidation of Biogenic Volatile Organic Compounds, Environ. Sci. Technol., 55, 2878–2889, https://doi.org/10.1021/acs.est.0c06838, 2021.
Heever, S. C. van den, Carrió, G. G., Cotton, W. R., DeMott, P. J., and Prenni, A. J.: Impacts of Nucleating Aerosol on Florida Storms. Part I: Mesoscale Simulations, Journal of the Atmospheric Sciences, 63, 1752–1775, https://doi.org/10.1175/JAS3713.1, 2006.
Hersey, S. P., Craven, J. S., Schilling, K. A., Metcalf, A. R., Sorooshian, A., Chan, M. N., Flagan, R. C., and Seinfeld, J. H.: The Pasadena Aerosol Characterization Observatory (PACO): chemical and physical analysis of the Western Los Angeles basin aerosol, Atmos. Chem. Phys., 11, 7417–7443, https://doi.org/10.5194/acp-11-7417-2011, 2011.
Hoppel, W. A., Frick, G. M., and Larson, R. E.: Effect of nonprecipitating clouds on the aerosol size distribution in the marine boundary layer, Geophysical Research Letters, 13, 125–128, https://doi.org/10.1029/GL013i002p00125, 1986.
Hsu, Y.-K., Holsen, T. M., and Hopke, P. K.: Comparison of hybrid receptor models to locate PCB sources in Chicago, Atmospheric Environment, 37, 545–562, https://doi.org/10.1016/S1352-2310(02)00886-5, 2003.
Hu, W. W., Campuzano-Jost, P., Palm, B. B., Day, D. A., Ortega, A. M., Hayes, P. L., Krechmer, J. E., Chen, Q., Kuwata, M., Liu, Y. J., de Sá, S. S., McKinney, K., Martin, S. T., Hu, M., Budisulistiorini, S. H., Riva, M., Surratt, J. D., St. Clair, J. M., Isaacman-Van Wertz, G., Yee, L. D., Goldstein, A. H., Carbone, S., Brito, J., Artaxo, P., de Gouw, J. A., Koss, A., Wisthaler, A., Mikoviny, T., Karl, T., Kaser, L., Jud, W., Hansel, A., Docherty, K. S., Alexander, M. L., Robinson, N. H., Coe, H., Allan, J. D., Canagaratna, M. R., Paulot, F., and Jimenez, J. L.: Characterization of a real-time tracer for isoprene epoxydiols-derived secondary organic aerosol (IEPOX-SOA) from aerosol mass spectrometer measurements, Atmos. Chem. Phys., 15, 11807–11833, https://doi.org/10.5194/acp-15-11807-2015, 2015.
Hussein, T., Puustinen, A., Aalto, P. P., Mäkelä, J. M., Hämeri, K., and Kulmala, M.: Urban aerosol number size distributions, Atmos. Chem. Phys., 4, 391–411, https://doi.org/10.5194/acp-4-391-2004, 2004.
Janssen, R. H. H., Vilà-Guerau de Arellano, J., Ganzeveld, L. N., Kabat, P., Jimenez, J. L., Farmer, D. K., van Heerwaarden, C. C., and Mammarella, I.: Combined effects of surface conditions, boundary layer dynamics and chemistry on diurnal SOA evolution, Atmos. Chem. Phys., 12, 6827–6843, https://doi.org/10.5194/acp-12-6827-2012, 2012.
Jensen, M. P., Flynn, J. H., Judd, L. M., Kollias, P., Kuang, C., Mcfarquhar, G., Nadkarni, R., Powers, H., and Sullivan, J.: A Succession of Cloud, Precipitation, Aerosol, and Air Quality Field Experiments in the Coastal Urban Environment, Bulletin of the American Meteorological Society, 103, 103–105, https://doi.org/10.1175/BAMS-D-21-0104.1, 2022.
Jensen, M. P., Flynn, J. H., Gonzalez-Cruz, J. E., Judd, L. M., Kollias, P., Kuang, C., McFarquhar, G. M., Powers, H., Ramamurthy, P., Sullivan, J., Aiken, A. C., Alvarez, S. L., Argay, P., Argrow, B., Bell, T. M., Boyer, D., Brooks, S. D., Bruning, E. C., Brunner, K., Butterworth, B., Calmer, R., Cappa, C. D., Chakrabarty, R. K., Chandrasekar, V., Chao, C.-Y., Chen, B., China, S., Collins, D. R., Collis, S. M., Crowell, S., Porto, R. D., Boer, G. de, Deng, M., Dexheimer, D., Drager, A. J., Du, X., Dubey, M. K., Dzambo, A. M., Etten-Bohm, M., Fan, J., Farley, R., Feng, Y.-C., Feng, Y., Fenn, M., Ferrare, R. E., Flusche, S., Fridlind, A. M., Galewsky, J., Gamarro, H., Gardner, S., Ghate, V. P., Giangrande, S. E., Griffin, R. J., Griggs, T., Gronoff, G. P., Grover, M., Gaugenti, M., Guo, F., Gupta, S., Hu, J., Huang, Y., Jackson, R. C., Hair, J. W., Johnson, K. L., Kasparoglu, S., Klein, P., Kotsakis, A. E., Kumar, J., Kumjian, M. R., Lamer, K., Lappin, F. M., Lei, Z., Li, J., Li, R., Li, Y., Logan, T., Lombardo, K., Luke, E. P., Mages, Z., Matthews, A. A., Matthews, B. H., Mayol-Bracero, O., Matsui, T., McKeown, K. E., Mehra, M., Mei, F., Meskidzhe, N., Nguyen, C., Nielsen, E. R., Nowotarski, C. J., Oaks, D., Oktem, R., Oue, M., Park, J. M., Partida, N., Patil, S., Pena, J. C., Petters, M. D., Phoenix, D. B., Puthserry, J. V., Rapp, A. D., Romps, D. M., Roots, M., Rosenfeld, D., Saleeby, S. M., Savala, P., Sedlacek, A. J., Sharma, M., Sheesley, R., Shingler, T. J., Shrestha, S., Singh, A., Smith, E. N., Smith, J. N., Smith, S., Snyder, J., Spicer, E., Spinei, E., Spychala, M., Steir, P., Storm, M. R., Subba, T., Treserras, B. P., Trojanowski, R., Theisen, A., Thompson, S. A., Twigg, L., Uin, J., Ulinski, A. R., Heever, S. van den, Lier-Walqui, M. van, Varble, A. C., Wagner, T. J., Wakeen, J., Wales, N. A., Walter, P. J., Wang, D., Wang, J., Wood, L., Wang, Y., Wolde, M., Yoon, S., Young, M. H., Zawadowicz, M. A., Zhang, Q., Zhou, A., Zhu, Z., and Zhu, Z.: Studying Aerosol, Clouds, and Air Quality in the Coastal Urban Environment of Southeastern Texas, 2025, Bulletin of the American Meteorological Society., https://doi.org/10.1175/BAMS-D-23-0331.1, 2025.
Jeon, S., Walker, M. J., Sueper, D. T., Day, D. A., Handschy, A. V., Jimenez, J. L., and Williams, B. J.: A searchable database and mass spectral comparison tool for the Aerosol Mass Spectrometer (AMS) and the Aerosol Chemical Speciation Monitor (ACSM), Atmos. Meas. Tech., 16, 6075–6095, https://doi.org/10.5194/amt-16-6075-2023, 2023.
Kiendler-Scharr, A., Mensah, A. A., Friese, E., Topping, D., Nemitz, E., Prevot, A. S. H., Äijälä, M., Allan, J., Canonaco, F., Canagaratna, M., Carbone, S., Crippa, M., Dall Osto, M., Day, D. A., De Carlo, P., Di Marco, C. F., Elbern, H., Eriksson, A., Freney, E., Hao, L., Herrmann, H., Hildebrandt, L., Hillamo, R., Jimenez, J. L., Laaksonen, A., McFiggans, G., Mohr, C., O'Dowd, C., Otjes, R., Ovadnevaite, J., Pandis, S. N., Poulain, L., Schlag, P., Sellegri, K., Swietlicki, E., Tiitta, P., Vermeulen, A., Wahner, A., Worsnop, D., and Wu, H.-C.: Ubiquity of organic nitrates from nighttime chemistry in the European submicron aerosol, Geophysical Research Letters, 43, 7735–7744, https://doi.org/10.1002/2016GL069239, 2016.
Kompalli, S. K., Suresh Babu, S. N., Satheesh, S. K., Krishna Moorthy, K., Das, T., Boopathy, R., Liu, D., Darbyshire, E., Allan, J. D., Brooks, J., Flynn, M. J., and Coe, H.: Seasonal contrast in size distributions and mixing state of black carbon and its association with PM1.0 chemical composition from the eastern coast of India, Atmos. Chem. Phys., 20, 3965–3985, https://doi.org/10.5194/acp-20-3965-2020, 2020.
Lanz, V. A., Alfarra, M. R., Baltensperger, U., Buchmann, B., Hueglin, C., and Prévôt, A. S. H.: Source apportionment of submicron organic aerosols at an urban site by factor analytical modelling of aerosol mass spectra, Atmos. Chem. Phys., 7, 1503–1522, https://doi.org/10.5194/acp-7-1503-2007, 2007.
Lei, L., Xie, C., Wang, D., He, Y., Wang, Q., Zhou, W., Hu, W., Fu, P., Chen, Y., Pan, X., Wang, Z., Worsnop, D. R., and Sun, Y.: Fine particle characterization in a coastal city in China: composition, sources, and impacts of industrial emissions, Atmos. Chem. Phys., 20, 2877–2890, https://doi.org/10.5194/acp-20-2877-2020, 2020.
Lelieveld, J., Evans, J. S., Fnais, M., Giannadaki, D., and Pozzer, A.: The contribution of outdoor air pollution sources to premature mortality on a global scale, Nature, 525, 367–371, https://doi.org/10.1038/nature15371, 2015.
Leong, Y. J., Sanchez, N. P., Wallace, H. W., Karakurt Cevik, B., Hernandez, C. S., Han, Y., Flynn, J. H., Massoli, P., Floerchinger, C., Fortner, E. C., Herndon, S., Bean, J. K., Hildebrandt Ruiz, L., Jeon, W., Choi, Y., Lefer, B., and Griffin, R. J.: Overview of surface measurements and spatial characterization of submicrometer particulate matter during the DISCOVER-AQ 2013 campaign in Houston, TX, Journal of the Air & Waste Management Association, 67, 854–872, https://doi.org/10.1080/10962247.2017.1296502, 2017.
Levy, M. E., Zhang, R., Khalizov, A. F., Zheng, J., Collins, D. R., Glen, C. R., Wang, Y., Yu, X.-Y., Luke, W., Jayne, J. T., and Olaguer, E.: Measurements of submicron aerosols in Houston, Texas during the 2009 SHARP field campaign, Journal of Geophysical Research: Atmospheres, 118, 10518–10534, https://doi.org/10.1002/jgrd.50785, 2013.
Li, J., Zhang, H., and Ying, Q.: Comparison of the SAPRC07 and SAPRC99 photochemical mechanisms during a high ozone episode in Texas: Differences in concentrations, OH budget and relative response factors, Atmospheric Environment, 54, 25–35, https://doi.org/10.1016/j.atmosenv.2012.02.034, 2012.
Li, W., Wang, Y., Bernier, C., and Estes, M.: Identification of Sea Breeze Recirculation and Its Effects on Ozone in Houston, TX, During DISCOVER-AQ 2013, Journal of Geophysical Research: Atmospheres, 125, e2020JD033165, https://doi.org/10.1029/2020JD033165, 2020.
Lin, Y.-H., Zhang, Z., Docherty, K. S., Zhang, H., Budisulistiorini, S. H., Rubitschun, C. L., Shaw, S. L., Knipping, E. M., Edgerton, E. S., Kleindienst, T. E., Gold, A., and Surratt, J. D.: Isoprene Epoxydiols as Precursors to Secondary Organic Aerosol Formation: Acid-Catalyzed Reactive Uptake Studies with Authentic Compounds, Environmental science & technology, 46, 250, https://doi.org/10.1021/es202554c, 2011.
Liu, Y., Wu, Z., Huang, X., Shen, H., Bai, Y., Qiao, K., Meng, X., Hu, W., Tang, M., and He, L.: Aerosol Phase State and Its Link to Chemical Composition and Liquid Water Content in a Subtropical Coastal Megacity, Environ. Sci. Technol., 53, 5027–5033, https://doi.org/10.1021/acs.est.9b01196, 2019.
Lv, S.-Y., Liu, Q.-Y., Chen, J.-J., and He, S.-G.: Oxidation of Isoprene by Neutral Iron Oxide Nanoclusters in the Gas Phase, J. Phys. Chem. C, 123, 25949–25956, https://doi.org/10.1021/acs.jpcc.9b06275, 2019.
Minguillón, M. C., Brines, M., Pérez, N., Reche, C., Pandolfi, M., Fonseca, A. S., Amato, F., Alastuey, A., Lyasota, A., Codina, B., Lee, H.-K., Eun, H.-R., Ahn, K.-H., and Querol, X.: New particle formation at ground level and in the vertical column over the Barcelona area, Atmospheric Research, 164–165, 118–130, https://doi.org/10.1016/j.atmosres.2015.05.003, 2015.
Mohr, C., DeCarlo, P. F., Heringa, M. F., Chirico, R., Slowik, J. G., Richter, R., Reche, C., Alastuey, A., Querol, X., Seco, R., Peñuelas, J., Jiménez, J. L., Crippa, M., Zimmermann, R., Baltensperger, U., and Prévôt, A. S. H.: Identification and quantification of organic aerosol from cooking and other sources in Barcelona using aerosol mass spectrometer data, Atmos. Chem. Phys., 12, 1649–1665, https://doi.org/10.5194/acp-12-1649-2012, 2012.
Ng, N. L., Canagaratna, M. R., Jimenez, J. L., Zhang, Q., Ulbrich, I. M., and Worsnop, D. R.: Real-Time Methods for Estimating Organic Component Mass Concentrations from Aerosol Mass Spectrometer Data, Environ. Sci. Technol., 45, 910–916, https://doi.org/10.1021/es102951k, 2011.
NOAA Air Resources Laboratory: HYSPLIT data, NOAA [data set], https://www.ready.noaa.gov/HYSPLIT.php (last access: 1 December 2022), 2022.
Paatero, P.: Least squares formulation of robust non-negative factor analysis, Chemometrics and Intelligent Laboratory Systems, 37, 23–35, https://doi.org/10.1016/S0169-7439(96)00044-5, 1997.
Paatero, P. and Tapper, U.: Positive matrix factorization: A non-negative factor model with optimal utilization of error estimates of data values, Environmetrics, 5, 111–126, https://doi.org/10.1002/env.3170050203, 1994.
Paraschiv, S., Barbuta-Misu, N., and Paraschiv, S. L.: Influence of NO2, NO and meteorological conditions on the tropospheric O3 concentration at an industrial station, Energy Reports, 6, 231–236, https://doi.org/10.1016/j.egyr.2020.11.263, 2020.
Pope, C. A. and Dockery, D. W.: Health effects of fine particulate air pollution: lines that connect, J. Air Waste Manag. Assoc., 56, 709–742, https://doi.org/10.1080/10473289.2006.10464485, 2006.
Reche, C., Querol, X., Alastuey, A., Viana, M., Pey, J., Moreno, T., Rodríguez, S., González, Y., Fernández-Camacho, R., de la Rosa, J., Dall'Osto, M., Prévôt, A. S. H., Hueglin, C., Harrison, R. M., and Quincey, P.: New considerations for PM, Black Carbon and particle number concentration for air quality monitoring across different European cities, Atmos. Chem. Phys., 11, 6207–6227, https://doi.org/10.5194/acp-11-6207-2011, 2011.
Ren, X., van Duin, D., Cazorla, M., Chen, S., Mao, J., Zhang, L., Brune, W. H., Flynn, J. H., Grossberg, N., Lefer, B. L., Rappenglück, B., Wong, K. W., Tsai, C., Stutz, J., Dibb, J. E., Thomas Jobson, B., Luke, W. T., and Kelley, P.: Atmospheric oxidation chemistry and ozone production: Results from SHARP 2009 in Houston, Texas, Journal of Geophysical Research: Atmospheres, 118, 5770–5780, https://doi.org/10.1002/jgrd.50342, 2013.
Riva, M., Budisulistiorini, S. H., Chen, Y., Zhang, Z., D'Ambro, E. L., Zhang, X., Gold, A., Turpin, B. J., Thornton, J. A., Canagaratna, M. R., and Surratt, J. D.: Chemical Characterization of Secondary Organic Aerosol from Oxidation of Isoprene Hydroxyhydroperoxides, Environ. Sci. Technol., 50, 9889–9899, https://doi.org/10.1021/acs.est.6b02511, 2016.
Robinson, N. H., Hamilton, J. F., Allan, J. D., Langford, B., Oram, D. E., Chen, Q., Docherty, K., Farmer, D. K., Jimenez, J. L., Ward, M. W., Hewitt, C. N., Barley, M. H., Jenkin, M. E., Rickard, A. R., Martin, S. T., McFiggans, G., and Coe, H.: Evidence for a significant proportion of Secondary Organic Aerosol from isoprene above a maritime tropical forest, Atmos. Chem. Phys., 11, 1039–1050, https://doi.org/10.5194/acp-11-1039-2011, 2011.
Rosenfeld, D., Lohmann, U., Raga, G. B., O'Dowd, C. D., Kulmala, M., Fuzzi, S., Reissell, A., and Andreae, M. O.: Flood or Drought: How Do Aerosols Affect Precipitation?, Science, 321, 1309–1313, https://doi.org/10.1126/science.1160606, 2008.
Russell, M., Allen, D. T., Collins, D. R., and Fraser, M. P.: Daily, Seasonal, and Spatial Trends in PM2.5 Mass and Composition in Southeast Texas Special Issue of Aerosol Science and Technology on Findings from the Fine Particulate Matter Supersites Program, Aerosol Science and Technology, 38, 14–26, https://doi.org/10.1080/02786820390229318, 2004.
Schiferl, L. D., Heald, C. L., Nowak, J. B., Holloway, J. S., Neuman, J. A., Bahreini, R., Pollack, I. B., Ryerson, T. B., Wiedinmyer, C., and Murphy, J. G.: An investigation of ammonia and inorganic particulate matter in California during the CalNex campaign, Journal of Geophysical Research: Atmospheres, 119, 1883–1902, https://doi.org/10.1002/2013JD020765, 2014.
Schneider, J., Weimer, S., Drewnick, F., Borrmann, S., Helas, G., Gwaze, P., Schmid, O., Andreae, M. O., and Kirchner, U.: Mass spectrometric analysis and aerodynamic properties of various types of combustion-related aerosol particles, International Journal of Mass Spectrometry, 258, 37–49, https://doi.org/10.1016/j.ijms.2006.07.008, 2006.
Schulze, B. C., Wallace, H. W., Bui, A. T., Flynn, J. H., Erickson, M. H., Alvarez, S., Dai, Q., Usenko, S., Sheesley, R. J., and Griffin, R. J.: The impacts of regional shipping emissions on the chemical characteristics of coastal submicron aerosols near Houston, TX, Atmos. Chem. Phys., 18, 14217–14241, https://doi.org/10.5194/acp-18-14217-2018, 2018.
Schwarz, J. P., Gao, R. S., Spackman, J. R., Watts, L. A., Thomson, D. S., Fahey, D. W., Ryerson, T. B., Peischl, J., Holloway, J. S., Trainer, M., Frost, G. J., Baynard, T., Lack, D. A., de Gouw, J. A., Warneke, C., and Del Negro, L. A.: Measurement of the mixing state, mass, and optical size of individual black carbon particles in urban and biomass burning emissions, Geophysical Research Letters, 35, https://doi.org/10.1029/2008GL033968, 2008.
Stefenelli, G., Pospisilova, V., Lopez-Hilfiker, F. D., Daellenbach, K. R., Hüglin, C., Tong, Y., Baltensperger, U., Prévôt, A. S. H., and Slowik, J. G.: Organic aerosol source apportionment in Zurich using an extractive electrospray ionization time-of-flight mass spectrometer (EESI-TOF-MS) – Part 1: Biogenic influences and day–night chemistry in summer, Atmos. Chem. Phys., 19, 14825–14848, https://doi.org/10.5194/acp-19-14825-2019, 2019.
Stein, A. F., Draxler, R. R., Rolph, G. D., Stunder, B. J. B., Cohen, M. D., and Ngan, F.: NOAA's HYSPLIT Atmospheric Transport and Dispersion Modeling System, Bulletin of the American Meteorological Society, 96, 2059–2077, https://doi.org/10.1175/BAMS-D-14-00110.1, 2015.
Sullivan, D. W., Price, J. H., Lambeth, B., Sheedy, K. A., Savanich, K., and Tropp, R. J.: Field study and source attribution for PM2.5 and PM10 with resulting reduction in concentrations in the neighborhood north of the Houston Ship Channel based on voluntary efforts, Journal of the Air & Waste Management Association, 63, 1070–1082, https://doi.org/10.1080/10962247.2013.775972, 2013.
Takegawa, N., Miyakawa, T., Kondo, Y., Jimenez, J. L., Zhang, Q., Worsnop, D. R., and Fukuda, M.: Seasonal and diurnal variations of submicron organic aerosol in Tokyo observed using the Aerodyne aerosol mass spectrometer, Journal of Geophysical Research: Atmospheres, 111, https://doi.org/10.1029/2005JD006515, 2006.
Takeuchi, M., Berkemeier, T., Eris, G., and Ng, N. L.: Non-linear effects of secondary organic aerosol formation and properties in multi-precursor systems, Nat. Commun., 13, 7883, https://doi.org/10.1038/s41467-022-35546-1, 2022.
Twomey, S.: The Influence of Pollution on the Shortwave Albedo of Clouds, Journal of Atmospheric Sciences, 34, 1149–1152, https://doi.org/10.1175/1520-0469(1977)034<1149:TIOPOT>2.0.CO;2, 1977.
Uin, J., Aiken, A. C., Dubey, M. K., Kuang, C., Pekour, M., Salwen, C., Sedlacek, A. J., Senum, G., Smith, S., Wang, J., Watson, T. B., and Springston, S. R.: Atmospheric Radiation Measurement (ARM) Aerosol Observing Systems (AOS) for Surface-Based In Situ Atmospheric Aerosol and Trace Gas Measurements, Journal of Atmospheric and Oceanic Technology, 36, 2429–2447, https://doi.org/10.1175/JTECH-D-19-0077.1, 2019.
Wallace, H. W., Sanchez, N. P., Flynn, J. H., Erickson, M. H., Lefer, B. L., and Griffin, R. J.: Source apportionment of particulate matter and trace gases near a major refinery near the Houston Ship Channel, Atmospheric Environment, 173, 16–29, https://doi.org/10.1016/j.atmosenv.2017.10.049, 2018.
Wang, D., Jensen, M. P., Taylor, D., Kowalski, G., Hogan, M., Wittemann, B. M., Rakotoarivony, A., Giangrande, S. E., and Park, J. M.: Linking Synoptic Patterns to Cloud Properties and Local Circulations Over Southeastern Texas, Journal of Geophysical Research: Atmospheres, 127, e2021JD035920, https://doi.org/10.1029/2021JD035920, 2022.
Watson, T. B.: Aerosol Chemical Speciation Monitor (ACSM) Instrument Handbook, U.S. Department of Energy, Office of Science, Office of Biological and Environmental Research, https://doi.org/10.2172/1375336, 2017.
Weber, R. J., Guo, H., Russell, A. G., and Nenes, A.: High aerosol acidity despite declining atmospheric sulfate concentrations over the past 15 years, Nature Geosci., 9, 282–285, https://doi.org/10.1038/ngeo2665, 2016.
Wong, Y. K., Liu, K. M., Yeung, C., Leung, K. K. M., and Yu, J. Z.: Measurement report: Characterization and source apportionment of coarse particulate matter in Hong Kong: insights into the constituents of unidentified mass and source origins in a coastal city in southern China, Atmos. Chem. Phys., 22, 5017–5031, https://doi.org/10.5194/acp-22-5017-2022, 2022.
Xu, L., Guo, H., Boyd, C. M., Klein, M., Bougiatioti, A., Cerully, K. M., Hite, J. R., Isaacman-VanWertz, G., Kreisberg, N. M., Knote, C., Olson, K., Koss, A., Goldstein, A. H., Hering, S. V., de Gouw, J., Baumann, K., Lee, S.-H., Nenes, A., Weber, R. J., and Ng, N. L.: Effects of anthropogenic emissions on aerosol formation from isoprene and monoterpenes in the southeastern United States, Proceedings of the National Academy of Sciences, 112, 37–42, https://doi.org/10.1073/pnas.1417609112, 2015.
Yoon, S., Usenko, S., and Sheesley, R. J.: Fine and Coarse Carbonaceous Aerosol in Houston, TX, during DISCOVER-AQ, Atmosphere, 11, 482, https://doi.org/10.3390/atmos11050482, 2020.
Yoon, S., Ortiz, S. M., Clark, A. E., Barrett, T. E., Usenko, S., Duvall, R. M., Ruiz, L. H., Bean, J. K., Faxon, C. B., Flynn, J. H., Lefer, B. L., Leong, Y. J., Griffin, R. J., and Sheesley, R. J.: Apportioned primary and secondary organic aerosol during pollution events of DISCOVER-AQ Houston, Atmospheric Environment, 244, 117954, https://doi.org/10.1016/j.atmosenv.2020.117954, 2021.
Zhang, Q., Alfarra, M. R., Worsnop, D. R., Allan, J. D., Coe, H., Canagaratna, M. R., and Jimenez, J. L.: Deconvolution and Quantification of Hydrocarbon-like and Oxygenated Organic Aerosols Based on Aerosol Mass Spectrometry, Environ. Sci. Technol., 39, 4938–4952, https://doi.org/10.1021/es048568l, 2005.
Zhang, Q., Jimenez, J. L., Canagaratna, M. R., Ulbrich, I. M., Ng, N. L., Worsnop, D. R., and Sun, Y.: Understanding atmospheric organic aerosols via factor analysis of aerosol mass spectrometry: a review, Anal. Bioanal. Chem., 401, 3045–3067, https://doi.org/10.1007/s00216-011-5355-y, 2011.
Zheng, M., Zhao, X., Cheng, Y., Yan, C., Shi, W., Zhang, X., Weber, R. J., Schauer, J. J., Wang, X., and Edgerton, E. S.: Sources of primary and secondary organic aerosol and their diurnal variations, Journal of Hazardous Materials, 264, 536–544, https://doi.org/10.1016/j.jhazmat.2013.10.047, 2014.
Zhou, S., Guo, F., Chao, C.-Y., Yoon, S., Alvarez, S. L., Shrestha, S., Flynn, J. H. I., Usenko, S., Sheesley, R. J., and Griffin, R. J.: Marine Submicron Aerosols from the Gulf of Mexico: Polluted and Acidic with Rapid Production of Sulfate and Organosulfates, Environ. Sci. Technol., https://doi.org/10.1021/acs.est.2c05469, 2023.