the Creative Commons Attribution 4.0 License.
the Creative Commons Attribution 4.0 License.
 | 24 Oct 2025
Role of in situ-excited planetary waves in polar vortex splitting during the 2002 Southern Hemisphere sudden stratospheric warming event
Ji-Hee Yoo
Hye-Yeong Chun
On 25 September 2002, the Southern Hemisphere experienced its first and only major sudden stratospheric warming (SSW02) since routine upper-atmospheric observations commenced in 1957. This event was marked by a sudden splitting of the polar vortex. While previous studies focused on tropospheric waves and vortex preconditioning, the role of in situ-excited planetary waves (PWs) remains unexplored. The current study addressed this gap by examining the impact of in situ-generated PWs on SSW02. As the onset approached, the displaced polar vortex elongated and split into two. The explosive amplification of zonal wavenumber (ZWN) 2 PWs (PW2) at 10 hPa was driven not only by upward-propagating PW2 from below but also by westward- and downward-propagating PW2 excited in the mid-to-upper stratosphere. This spontaneous PW2 generation was associated with barotropic–baroclinic instability, triggered by easterlies descending from the polar lower mesosphere. An unusual poleward shift of the polar vortex facilitated the development of easterlies by directing ZWN1 PWs (PW1) into the polar stratosphere, where they deposited strong westward momentum. This poleward displacement was attributed to anomalous easterlies in the equatorial upper stratosphere. PW2 amplification via instability involved two mechanisms: (i) PW1 breaking generated smaller-scale waves through a nonlinear energy cascade while inducing instability that amplified those waves, and (ii) over-reflection of upward-propagating PW2. A nonlinear energy cascade initiated PW2 amplification, with over-reflection contributing immediately before the onset. Instability-driven wave growth and equatorial easterlies in the upper stratosphere also appear in other vortex-splitting SSWs, suggesting their broader significance in SSW dynamics.
- Article
(10179 KB) - Full-text XML
-
Supplement
(24690 KB) - BibTeX
- EndNote


On 25 September 2002, the first major sudden stratospheric warming (SSW) event (hereafter referred to as SSW02) was recorded in the Southern Hemisphere (SH), marking an unprecedented occurrence in Antarctic stratospheric observations since 1957. Although minor warmings have occasionally been observed in the SH, a major warming event characterized by the complete breakdown of the polar vortex during spring has only been documented in this instance. The rarity of SSW in the SH has been attributed to several factors, including the less mountainous terrain; weak longitudinal land–sea contrasts; and the nearly zonally symmetric, cold, elevated Antarctic surface (Gray et al., 2005). These factors collectively suppress SSW in the SH by weakening planetary wave (PW) forcing and strengthening the polar-night jet (PNJ). However, SSW02 was distinguished by a record-breaking weakening of the PNJ and extremely high temperatures, both of which remain unparalleled in the SH climate.
Notably, SSW02, the first observed major SSW event in the SH, was of the split type, a phenomenon far less common than displacement-type warmings in the Northern Hemisphere (NH, Charlton et al., 2005). The vortex split significantly impacted the typically quiescent Antarctic ozone hole, causing it to divide into two separate regions (Allen et al., 2003; Baldwin et al., 2003). Using a mechanistic model, Manney et al. (2005) demonstrated that the vortex split could be simulated exclusively with zonal wavenumber (ZWN) 2 waves at the 100 hPa pressure level without requiring vortex preconditioning. This finding suggests that anomalously strong wave forcing in the lower stratosphere was the primary driver of the major warming. Krüger et al. (2005) attributed the intense stratospheric wave forcing to unusually strong tropospheric wave pulses, collectively formed by the quasi-stationary PWs of ZWNs 1–3. However, unlike Manney et al. (2005), they emphasized that the substantial weakening of the PNJ during early winter (July–August 2002) served as a crucial preconditioning factor that significantly amplified the upward propagation of tropospheric waves into the stratosphere (see also Baldwin et al., 2003).
Newman and Nash (2005) observed that the PNJ was preconditioned not only to weaken significantly but also to shift unusually poleward, thereby directing tropospheric waves toward the pole across a broad altitude range into the middle stratosphere. This abnormally poleward-shifted vortex structure was accompanied by the westerly quasi-biennial oscillation (QBO) in the lower stratosphere (30–50 hPa) and anomalous easterlies in the equatorial upper stratosphere (1–10 hPa), where the semiannual oscillation (SAO) dominates (Gray et al., 2005; Newman and Nash, 2005). Given that the westerly QBO is generally unfavorable for initiating SSWs (Holton and Tan, 1982) and that SSWs typically begin with wind reversal in the upper stratosphere and lower mesosphere, Gray et al. (2005) examined the influence of anomalous equatorial easterlies in the upper stratosphere on the onset of SSW02. Their analysis revealed that this wind structure could have contributed to triggering SSW02 by confining equatorward-propagating PWs toward the pole during early and midwinter. Meanwhile, Charlton et al. (2005) emphasized that the vortex split dynamics involved complex nonlinear interactions within the coupled troposphere–stratosphere system, suggesting that the conventional framework of lower atmospheric forcing may be insufficient to comprehensively account for this event.
While previous research on SSW02 primarily focused on the role of tropospheric waves and vortex preconditioning in directing these waves toward the polar stratosphere, recent studies on SSWs in the NH have increasingly highlighted the role of in situ-excited PWs within the stratosphere or mesosphere. Regarding the split SSW event in January 2009, Song et al. (2020) suggested that the eastward-propagating PWs of ZWN2 (PW2) excited by gravity wave drag in the lower mesosphere partially contributed to vortex splitting at 10 hPa through downward propagation. With regard to the mechanisms driving the eastward-traveling PW2, Iida et al. (2014) proposed wind shear instability as a localized source, whereas Rhodes et al. (2021) attributed it to the over-reflection of upward-propagating tropospheric PW2. Yoo et al. (2023, hereafter YCK23) demonstrated that unstable PW2, spontaneously generated within the stratosphere, played a significant role in vortex splitting during the SSW event in 2021 (hereafter, SSW21).
This study examines whether in situ-excited PWs contributed to the polar vortex split during the first and only SSW event in the SH, as observed in several NH SSWs. Specifically, this research identifies the spontaneous excitation of PWs in the mid-to-upper stratosphere and their subsequent downward propagation toward 10 hPa – a feature overlooked in previous studies on SSW02, which focused on altitudes at or below 10 hPa. Thus, building on the approach adopted in YCK23, this study seeks to determine the in situ source of these waves and clarify the underlying preconditioning mechanism. In this context, we draw a comparison with SSW21, the focus of YCK23, to examine similarities and differences in the governing dynamics. As we are aware, this study is the first to investigate the role of locally generated PWs in the development of SSW02, offering deeper insight into the processes driving its occurrence.
2.1 Modern-Era Retrospective analysis for Research and Applications, version 2 (MERRA-2) data
This study utilizes MERRA-2 reanalysis data at 42 standard pressure levels ranging from 1000 to 0.1 hPa (Gelaro et al., 2017). The data are provided at a horizontal resolution of 0.625° × 0.5° (longitude × latitude) and a 3 h temporal resolution. We use 44 years of data (1980–2023) for the analysis, and all results presented are based on daily averages.
2.2 Analysis methods
2.2.1 Eliassen–Palm flux (EP-flux) and its divergence
The EP-flux and its divergence (EPFD), which represent wave activity flux and wave forcing, respectively, are calculated as follows (Andrews et al., 1987):
In the above equations, ϕ and z denote latitude and log-pressure height, respectively. ρ0 represents the reference density, a denotes Earth's mean radius, and f denotes the Coriolis parameter. The parameters u, v, and w correspond to the zonal, meridional, and vertical wind components, respectively, while θ denotes potential temperature. The overbar () and prime (′) denote the zonal mean and deviations from the zonal mean, respectively. The EP-flux vector, denoted by F, consists of meridional (Fϕ) and vertical (Fz) components. EPFD is defined as .
2.2.2 Barotropic (BT)-baroclinic (BC) instability
The evaluation of BT–BC instability is based on the meridional gradient of the quasi-geostrophic potential vorticity (QGPV) in spherical coordinates (Andrews et al., 1987):
where is the zonal-mean QGPV. Ω and N denote the rotation rate of Earth and the Brunt–Väisälä frequency, respectively. The first term on the right-hand side corresponds to the meridional gradient of f. In Sect. 3 and Text S1, we define the second term on the right-hand side as the barotropic term, while the third term is designated as the baroclinic term. One of the Charney-Stern-Pedlosky (CSP) necessary conditions for BT–BC instability is that the meridional gradient of the zonal-mean QGPV (hereinafter where y=aϕ) changes sign somewhere within the domain. Since wintertime is typically positive, negative indicates such a sign reversal; we therefore use it as a practical diagnostic that the CSP necessary condition is met in this study (Salby, 1996). Under typical midlatitude conditions, however, the instability criterion is generally satisfied through both positive and positive at the lower boundary (see Vallis, 2017 for details).
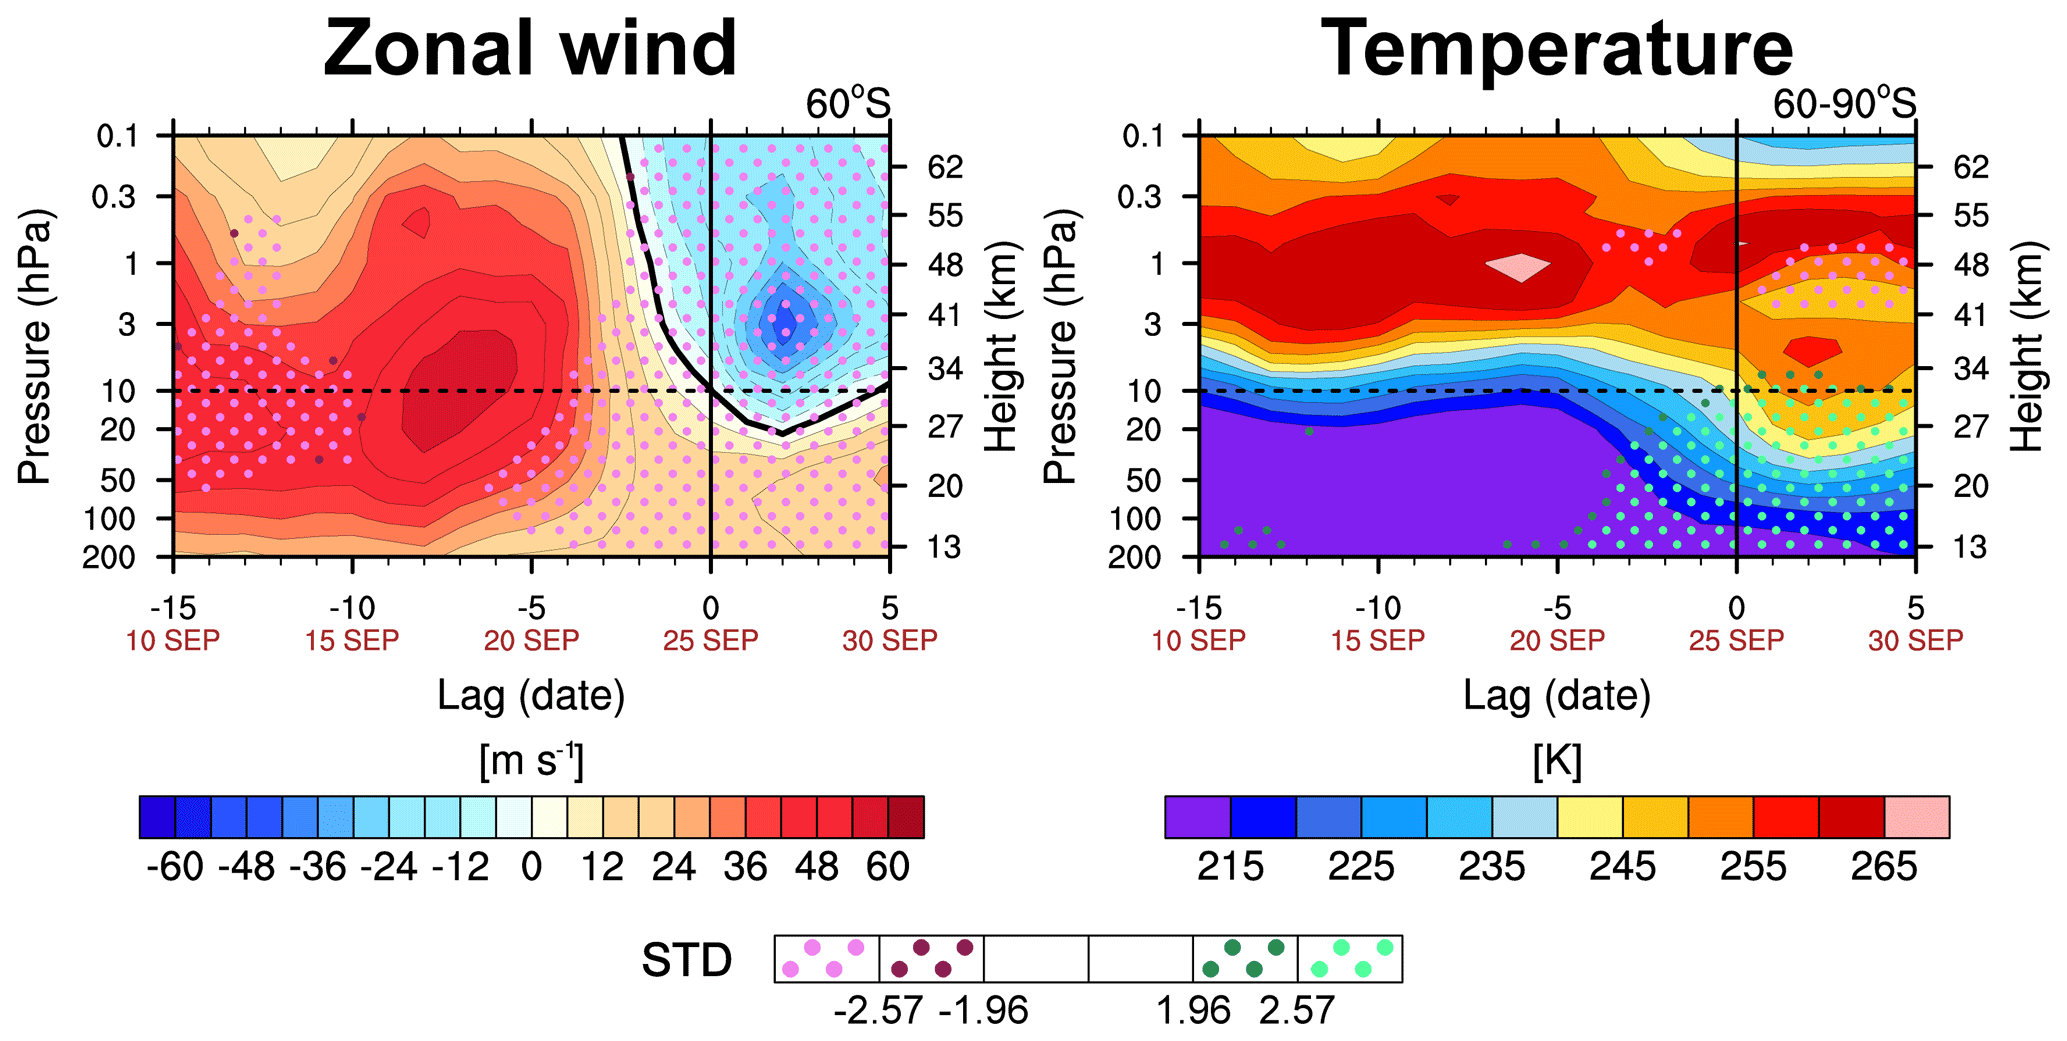
Figure 1Time–height cross sections of the zonal-mean zonal wind at 60° S (left) and polar cap temperature averaged over 60–90° S (right). Dark and bright pink (green) dots indicate regions where the analyzed variable is algebraically smaller (larger) than its 44-year climatology by more than 1.96 and 2.57 standard deviations (STD), corresponding to values below the 2.5th and 0.5th percentiles (above the 97.5th and 99.5th percentiles), respectively.
2.2.3 Linearized disturbance QGPV equation
In log-pressure coordinates, the linearized disturbance QGPV equation is expressed as follows (Matsuno, 1970):
In the above equations, λ denotes longitude, and q′ represents the QGPV perturbation. The perturbations of the zonal and meridional components of gravity wave drag (GWD) from their zonal mean are represented by X′ and Y′, respectively. Q′ denotes the perturbation diabatic heating rate and Φ′ represents the geopotential height perturbation (GHP). On the right-hand side of Eq. (4), the first bracketed term represents the nonconservative forcing term of the QGPV perturbation associated with GWD (Song et al., 2020). We investigate whether the nonconservative GWD forcing, defined as Z′ below, contributed to the vortex split using the zonal and meridional components of the parameterized GWD data (McFarlane, 1987; Molod et al., 2015).
2.2.4 Squared refractive index
To investigate PW propagation, we use the squared refractive index, defined as Andrews et al. (1987)
where k denotes the nondimensional ZWN, and Cx represents the zonal phase speed of the wave. PWs can propagate in regions where n2 is positive, whereas their propagation is impeded in regions where n2 is small or negative (Karoly and Hoskins, 1982).
3.1 Variations in wind and temperature during SSW02
Figure 1 presents the temporal evolution of the zonal-mean zonal wind at 60° S and the polar cap temperature over 60–90° S during SSW02 development. The reversal of zonal-mean westerlies to easterlies began in the lower mesosphere on 22 September and progressed down to 10 hPa within three days, marking the onset of major SSW02 (Charlton and Polvani, 2007). Over the following week (18–25 September), the PNJ weakened dramatically by more than 57 m s−1, accompanied by a sudden temperature increase of approximately 20 K at 10 hPa. The deceleration and eventual reversal of the westerlies fall below the 0.5th percentile of the 44-year record of zonal-mean zonal wind, while the associated temperature rise exceeds the 99.5th percentile of the corresponding temperature data.
3.2 Dynamical features of the vortex split and associated PW activities
Figure 2a offers an overview of the polar vortex split during the onset of SSW02 by illustrating GHP and horizontal wind fields at 10 hPa. By 21 September, the vortex had weakened and shifted away from the pole, and from 23 September, it elongated and ultimately split into two distinct vortices. The associated PW activities are analyzed by examining the evolution of ZWN1 and ZWN2 PW amplitudes at 60° S (Fig. 2b). In the days leading up to the onset, ZWN1 PW (PW1) had a greater amplitude than PW2 until 23 September, after which it rapidly weakened. Conversely, PW2 intensified and surpassed the amplitude of PW1 at 10 hPa for two days following the onset. This anticorrelation between PW1 and PW2 is a common feature of split-type SSW events, including SSW21. However, PW activity during SSW02 differed markedly from that during SSW21. Specifically, during SSW02, PW2 was enhanced from the upper troposphere with its amplitude exceeding the 97.5th percentile of the 44-year climatology. In contrast, during SSW21, PW2 strengthened within the mid-stratosphere (Fig. 1b of YCK23). This suggests that PW2, originating from the troposphere, played a crucial role in the vortex split during SSW02, aligning with previous findings (Krüger et al., 2005; Manney et al., 2005).
However, further insight is provided by the GHP of PW2 in the longitude–height cross sections depicted in Fig. 2c, which reveals an eastward tilt of the phase with increasing altitude above 3 hPa during the PW2 amplification period (21–25 September). This suggests downward-propagating PW2 from the mid-to-upper stratosphere, potentially contributing to PW2 intensification at 10 hPa.
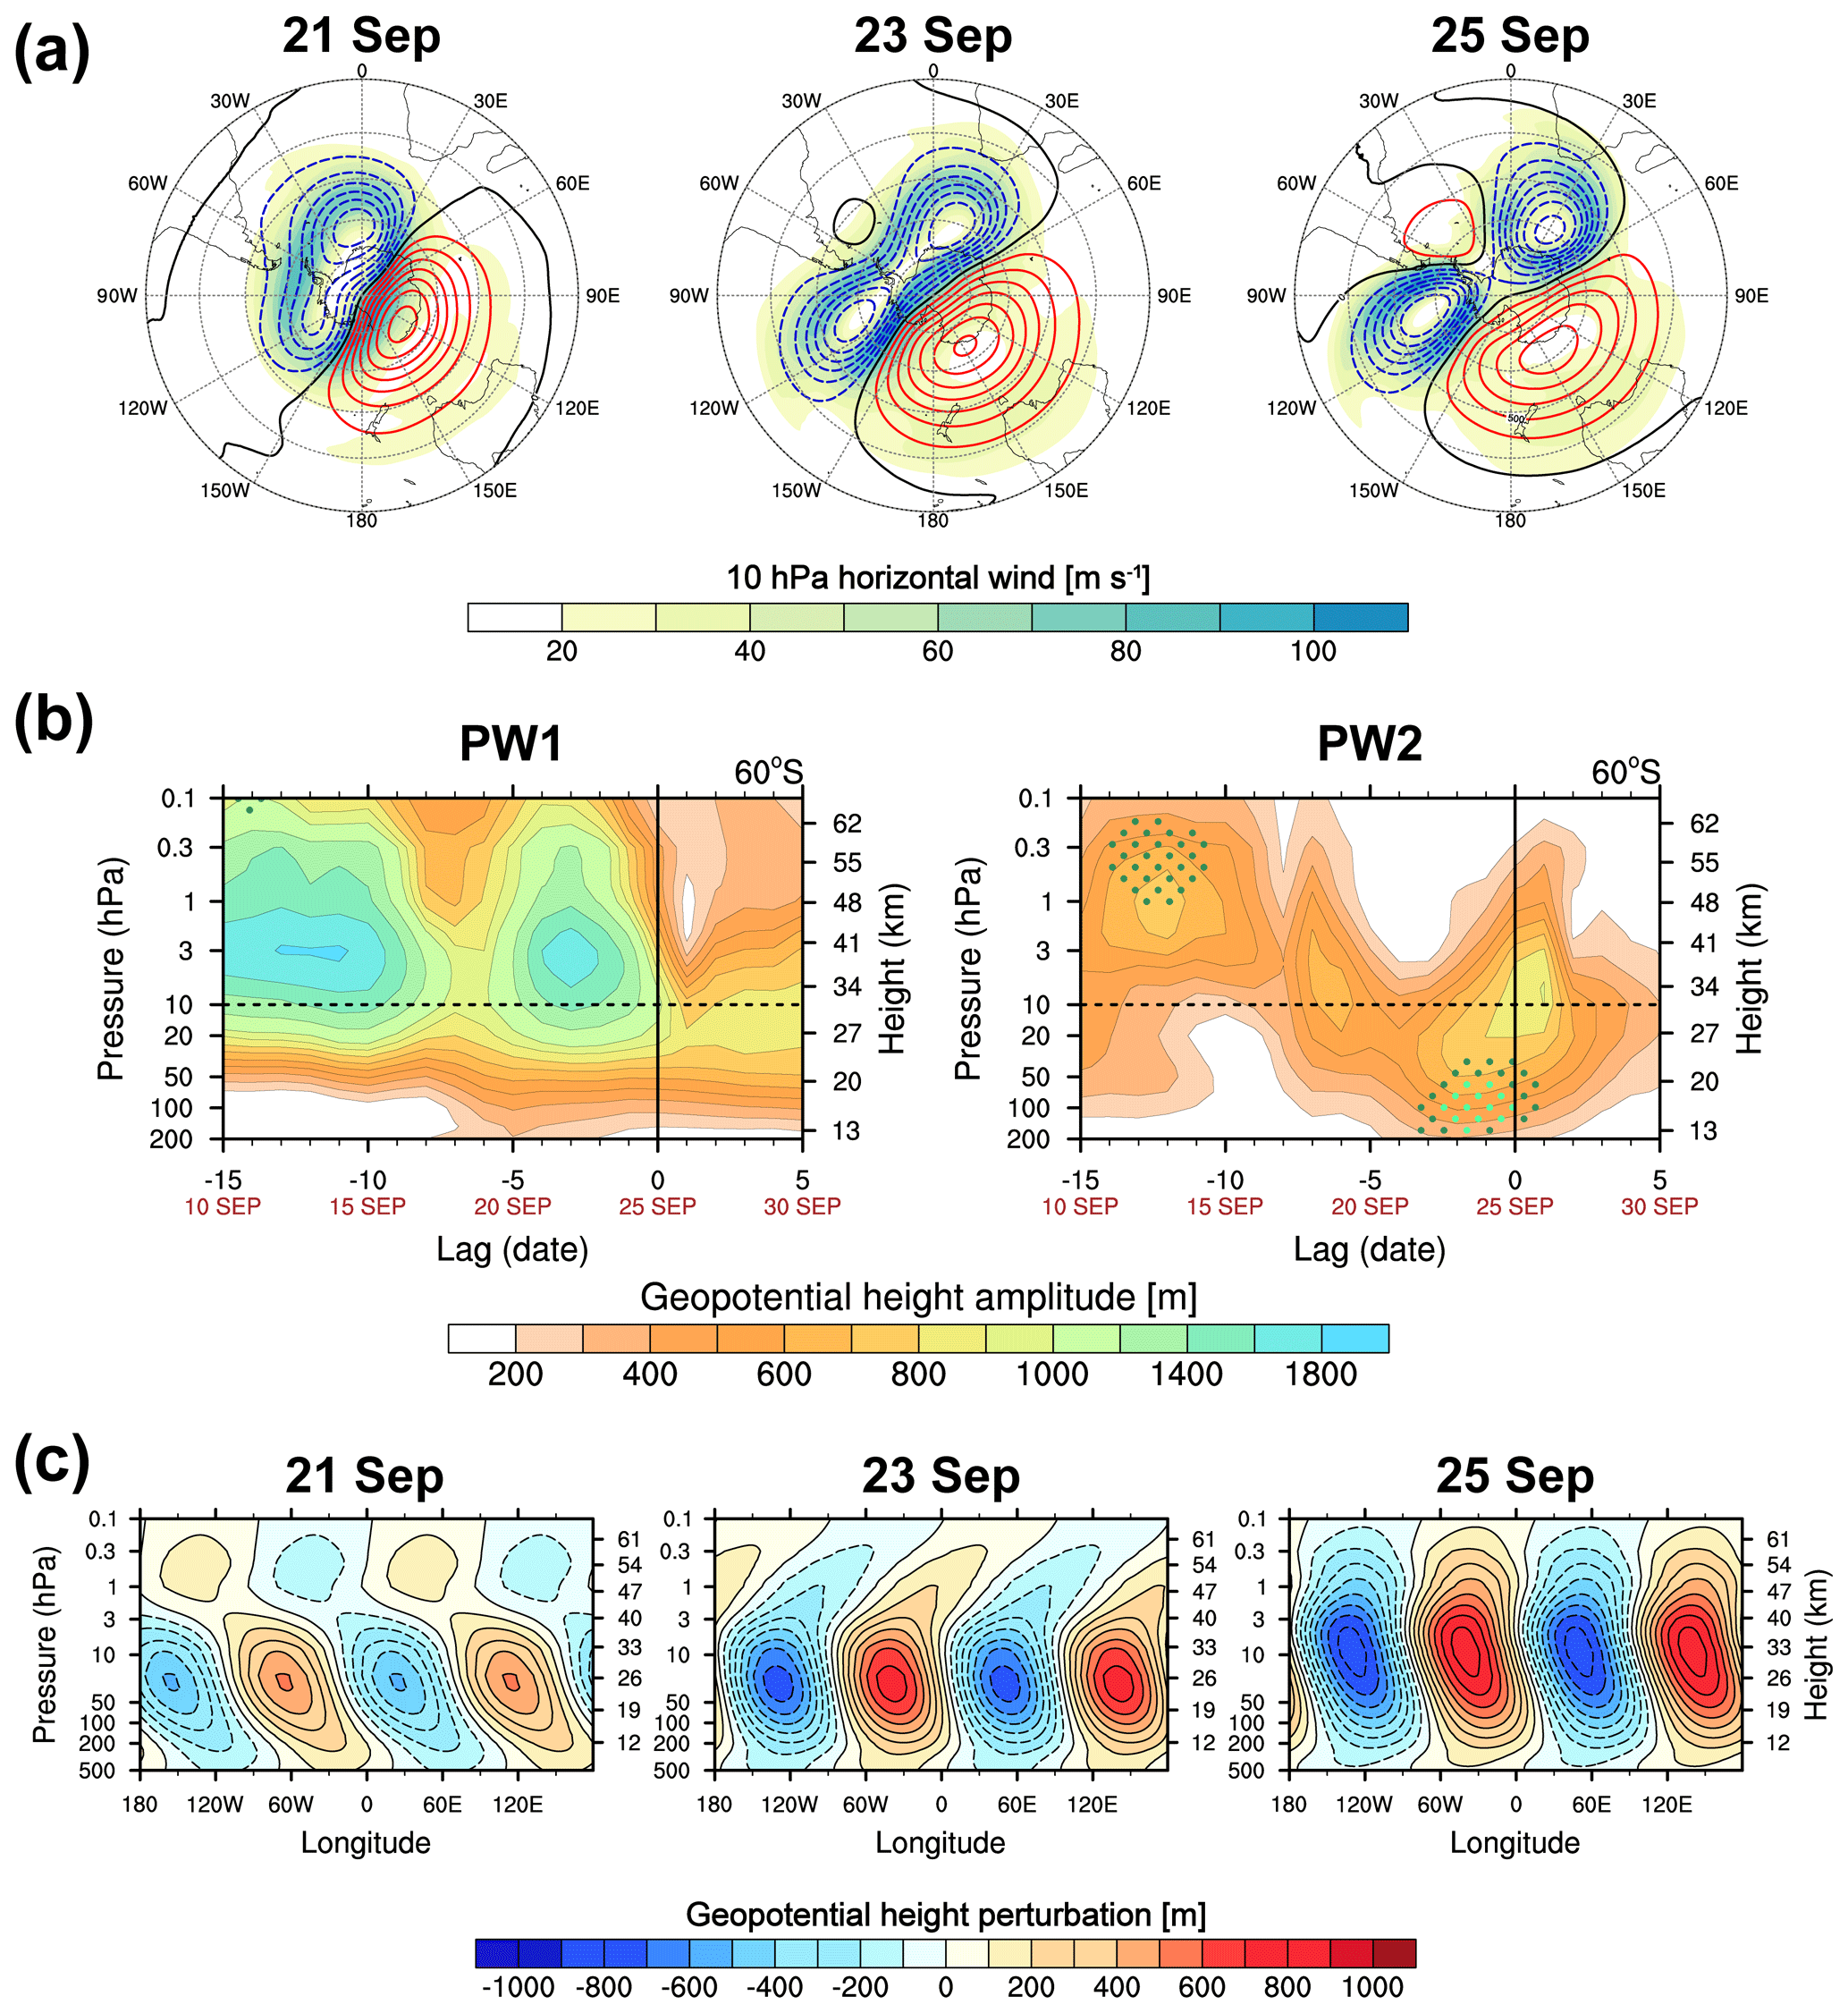
Figure 2(a) Polar stereographic series showing horizontal wind speed (shading) and GHP relative to the zonal mean (contours) at 10 hPa on 21, 23, and 25 September 2002. Red (blue) contours denote positive (negative) values. (b) GHP amplitude of PWs with ZWN1 (PW1, left) and 2 (PW2, right) at 60° S. (c) Longitude–height cross sections of PW2 GHP on 21, 23, and 25 September 2002.
3.3 In situ source of the downward propagating PW2 in the mid-to-upper stratosphere
The downward-propagating signal of stratospheric PW2 is more evident in the EP-flux and EPFD, as depicted in Fig. 3a. Beginning on 22 September, downward EP-fluxes emerged from the region of positive EPFD (70–50° S above 10 hPa), which substantially overlapped with the easterlies descending from the polar mesosphere by 23 September. As the easterlies intensified and extended toward the equator, the positive EPFD also strengthened, reaching amplitudes above the 97.5th percentile. This indicates in situ PW2 excitation within the stratosphere and its dependence on the background atmospheric conditions. The downward- and equatorward-propagating stratospheric PW2 converged with upward-propagating tropospheric PW2 near 10 hPa and 60° S, leading to a significant negative EPFD falling below the 0.5th percentile.
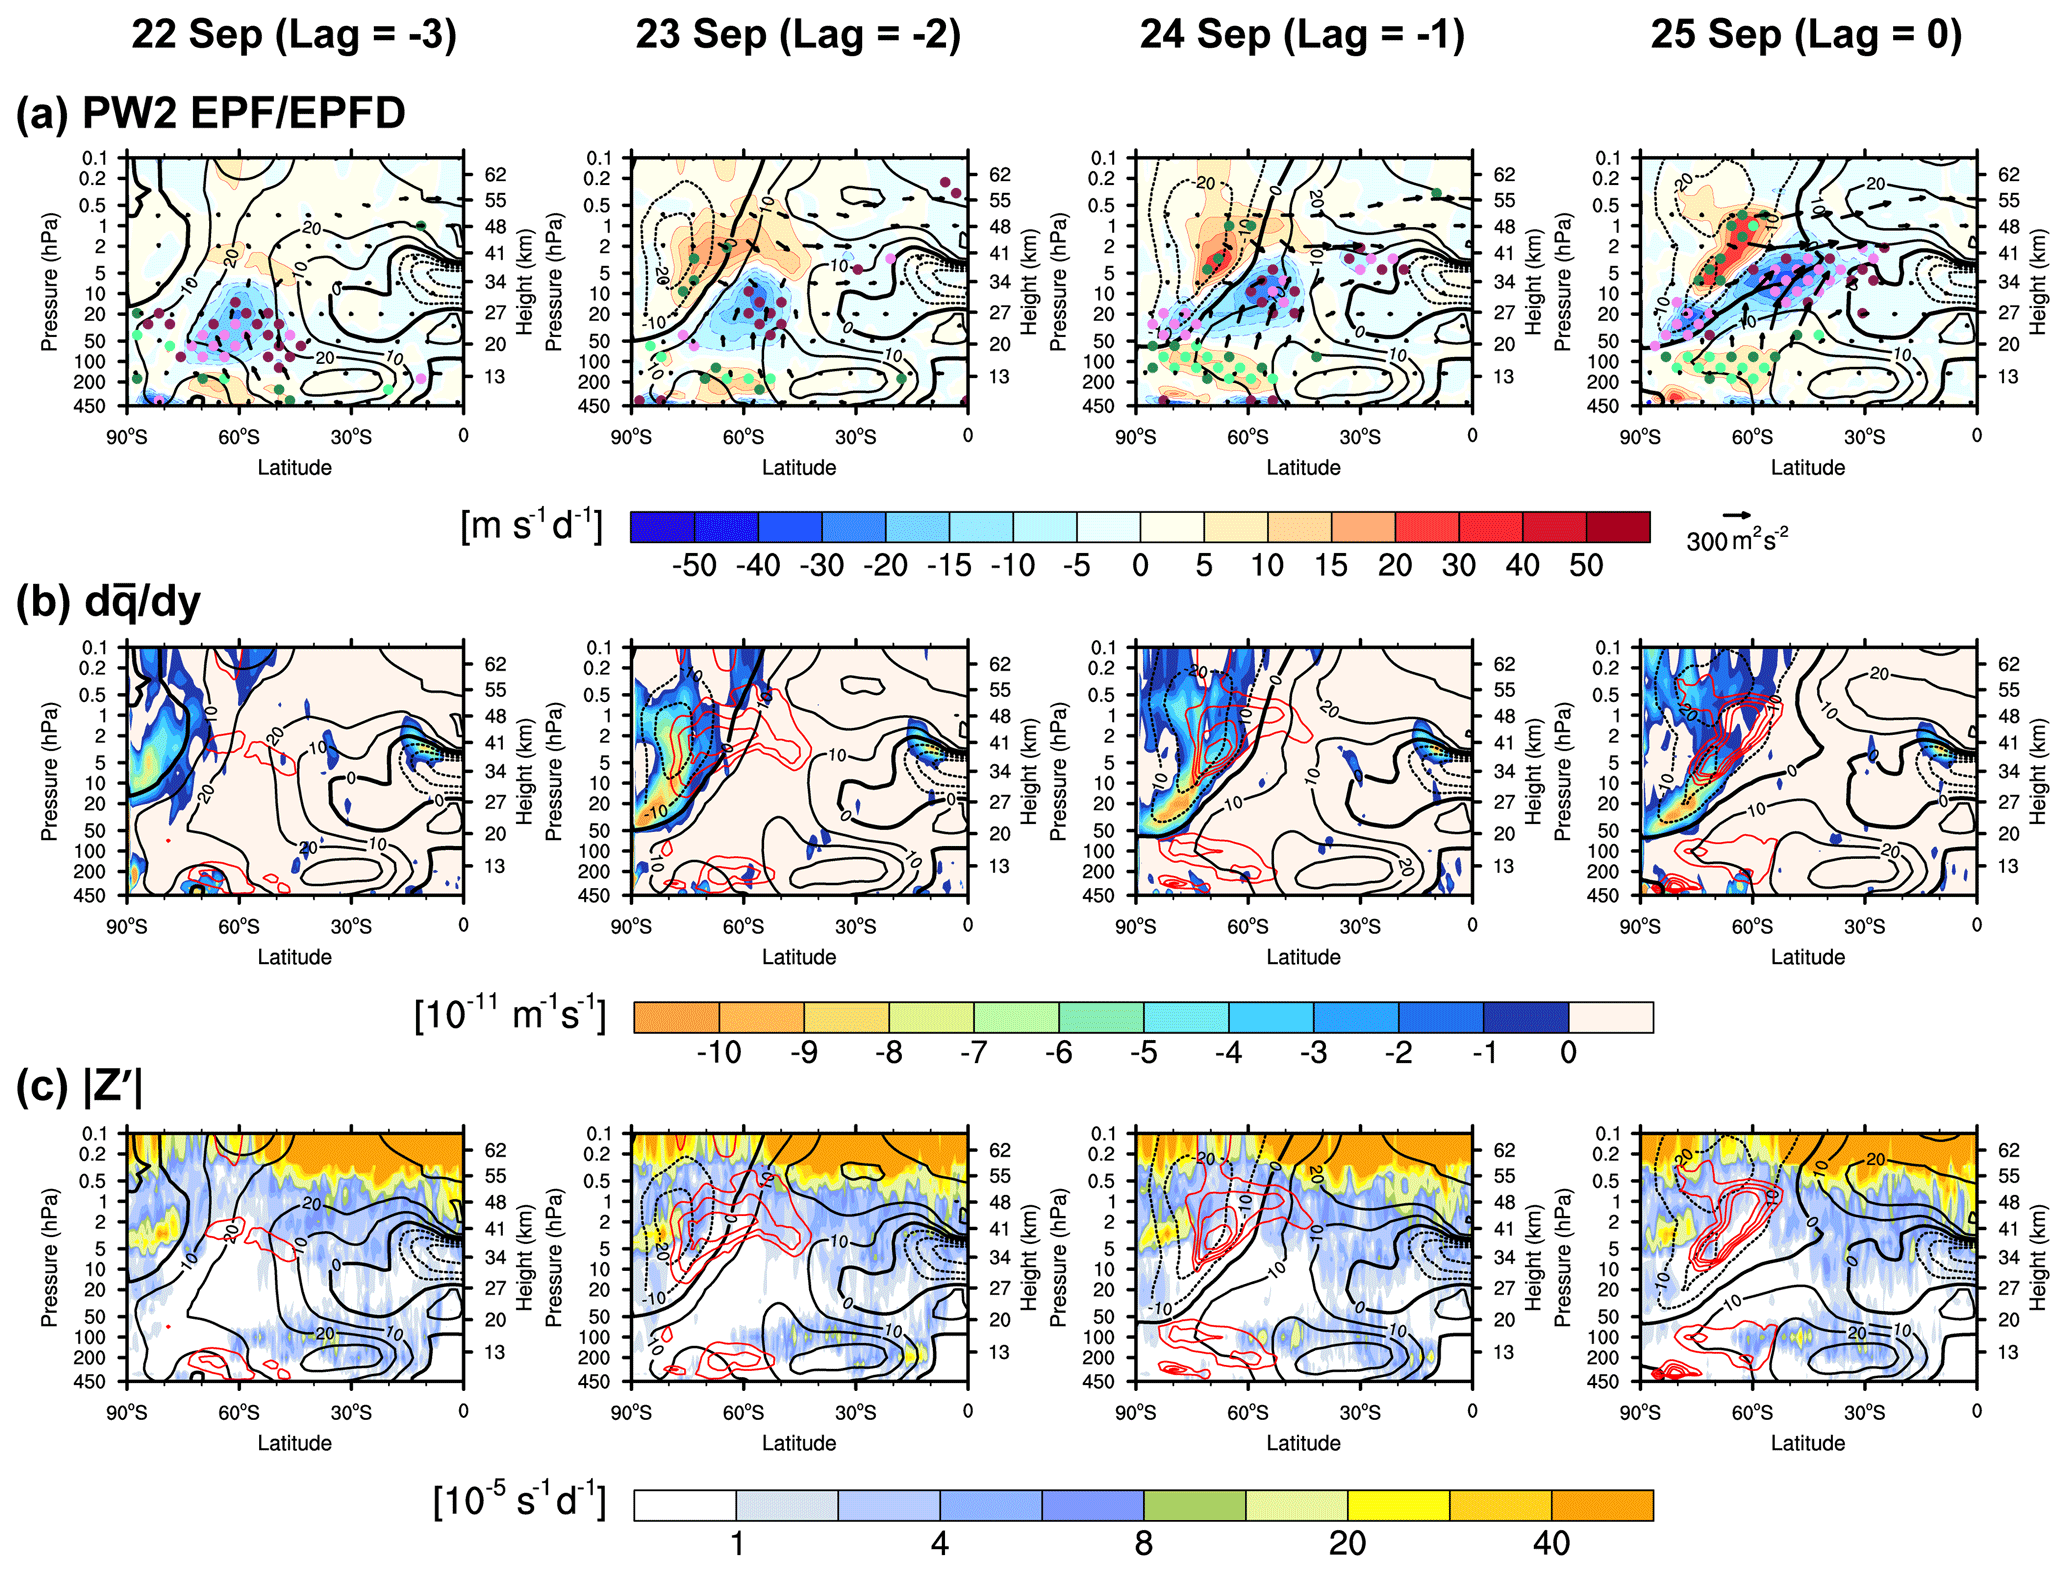
Figure 3Latitude–height cross sections of (a) the EP-flux (vectors) overlaid on its divergence (EPFD, shading) for PW2, (b) negative meridional gradient of the zonal-mean quasi-geostrophic potential vorticity (, shading) overlaid with the positive EPFD of PW2 (red contours), and (c) magnitude of the ZWN2 component of nonconservative GWD forcing on the quasi-geostrophic potential vorticity perturbation (Z′, shading) overlaid with the positive EPFD of PW2 (red contours) from 22 to 25 September 2002. Black contours represent zonal-mean zonal wind, with solid, dashed, and thick solid lines indicating positive, negative, and zero wind, respectively. For visualization, EP-flux vectors in (a) are scaled using Eq. (18) and Table 2 of Jucker (2021), and additionally divided by the square of Earth's radius.
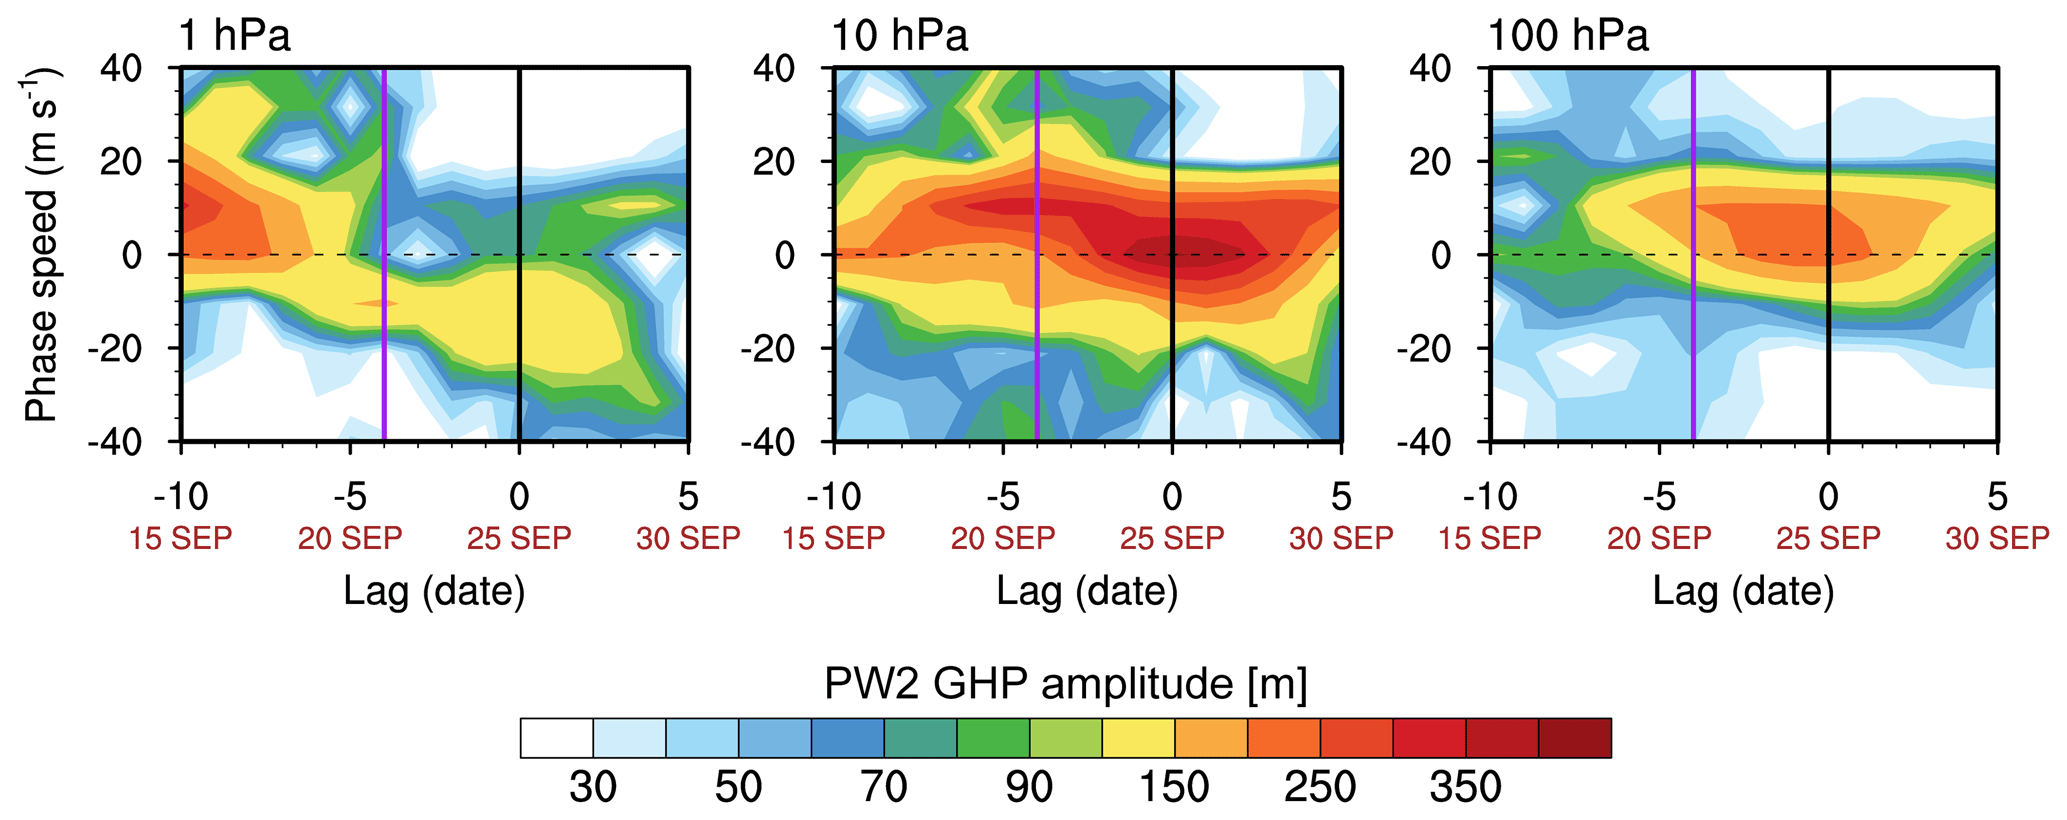
Figure 4Time–zonal phase speed cross sections of PW2 GHP amplitude averaged over 60° S at 1, 10, and 100 hPa, derived from 2D (zonal, time) Fourier decomposition of GHP using an 11 d sliding window (Song et al., 2020). Prior to the decomposition, a symmetric 3 d raised-cosine (Tukey) taper is applied to the GHP within each 11 d window to reduce edge effects (spectral leakage), with weights for t=1, 2, 3 and for t=9, 10, 11, and wt=1 otherwise (Harris, 1978). The zonal phase speed (Cx) is calculated as , where ω is frequency and k is zonal wavenumber. The purple and black vertical lines indicate the start date of PW2 amplification and the onset date, respectively.
The wave fluxes and forcings observed during SSW02 closely resembled those during SSW21 (Fig. 3a of YCK23), where BT–BC instability was the primary source of stratospheric in situ PW2 excitation. Accordingly, we examined the potential role of instability as a source by analyzing (Fig. 3b). Negative appeared within the easterly region and intensified as it expanded equatorward, mirroring the evolution of easterlies. Recognizing a similar pattern, YCK23 attributed the onset of instability to the strengthening easterlies, as follows: The positive meridional curvature of the easterlies (barotropic term) exceeded the beta effect, rendering the sum of the two terms negative. Simultaneously, the negative shear and positive curvature of the easterlies caused the baroclinic term to turn negative. These factors collectively led to negative (see Figs. 3 and 4 in YCK23 for further details). The same diagnostic framework applied to the present case shows consistent results (see Fig. S1 and Text S1). The region of instability partially overlapped with the area of PW2 generation. All these features, consistent with YCK23, indicate that strong shear instabilities driven by strengthening easterlies promoted unstable PW2 growth within the stratosphere during SSW02.
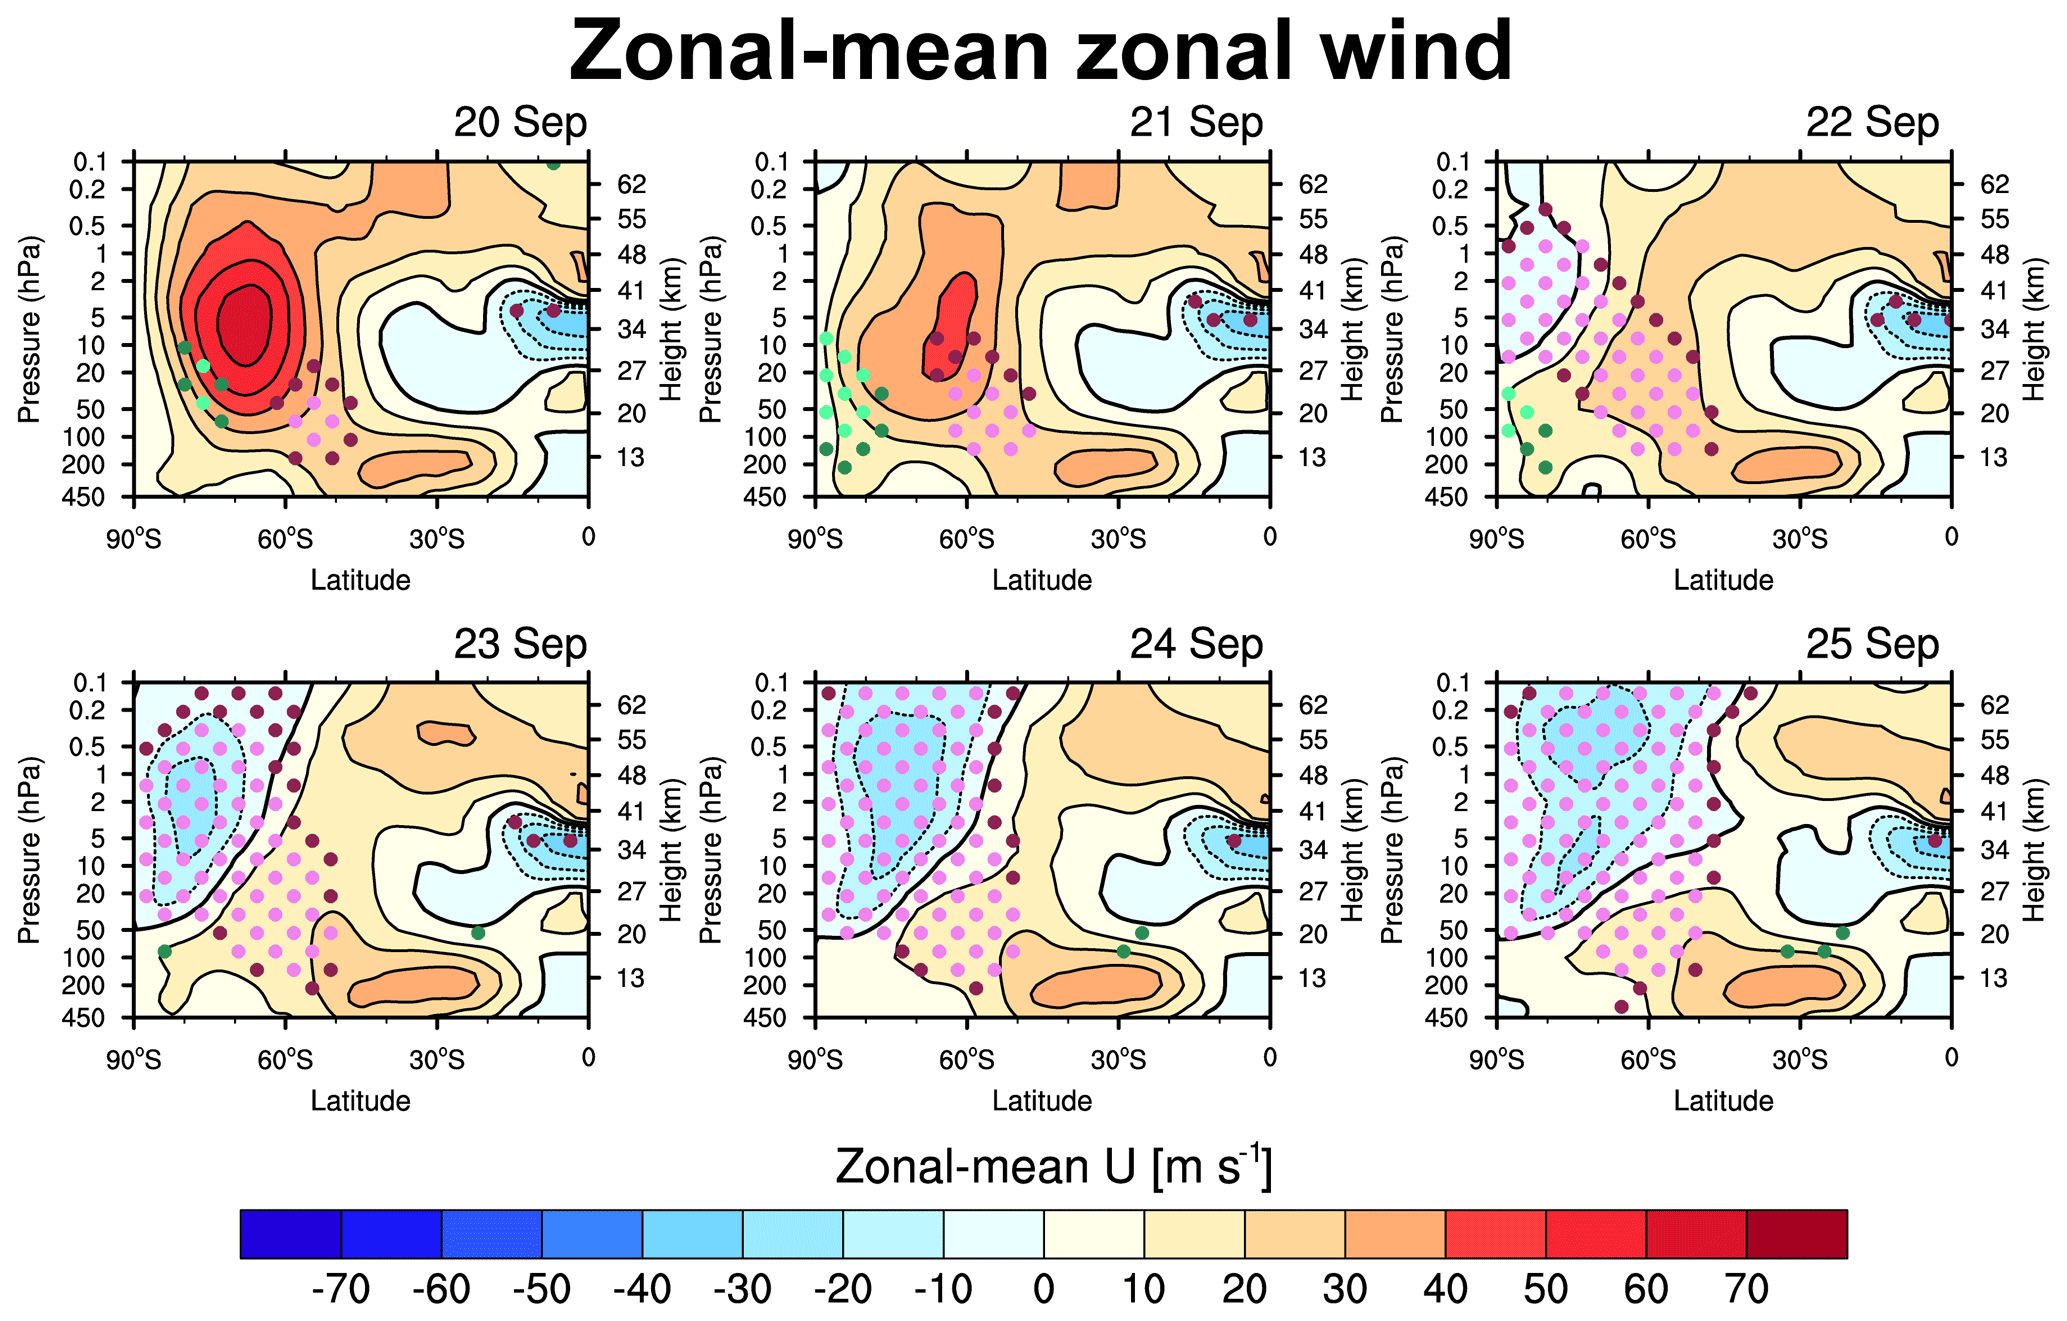
Figure 5Latitude–height cross sections of zonal-mean zonal wind in the SH from 20 to 25 September 2002.
Zonally asymmetric GWD could also generate PWs in situ in the upper stratosphere and lower mesosphere through the nonconservative forcing (Z′) of the linearized disturbance QGPV (Eq. 4–6). Song et al. (2020) reported that the significant PW2 amplification at 10 hPa, which led to the splitting of the polar vortex during the 2009 SSW, was partially attributed to the downward-propagating PW2 generated in situ by ZWN2-patterned GWD in the lower mesosphere. Yoo et al. (2024) revisited this excitation mechanism using an idealized general circulation model and demonstrated that PWs induced by Z′ led to substantial fluctuations and forcings as they propagated. To examine whether stratospheric PW2 is associated with GWD via Z′, we analyzed the magnitude of ZWN2 Z′ along with the divergence of PW2 EP-fluxes (Fig. 3c). Notably, ZWN2 Z′ showed a large amplitude primarily in the upper stratosphere and lower mesosphere (0.3–0.1 hPa), where PW2 generation by GWD occurred during the 2009 SSW, as identified by Song et al. (2020). However, these areas did not coincide with the key region of PW2 excitation (5–1 hPa) during SSW02. Even within the lower mesosphere, Z′ in the 60–70° S region, where positive EPFD appeared, was weaker than that in other latitudinal regions. Therefore, as in SSW21, instability was identified as the most likely source of PW2 in this case.
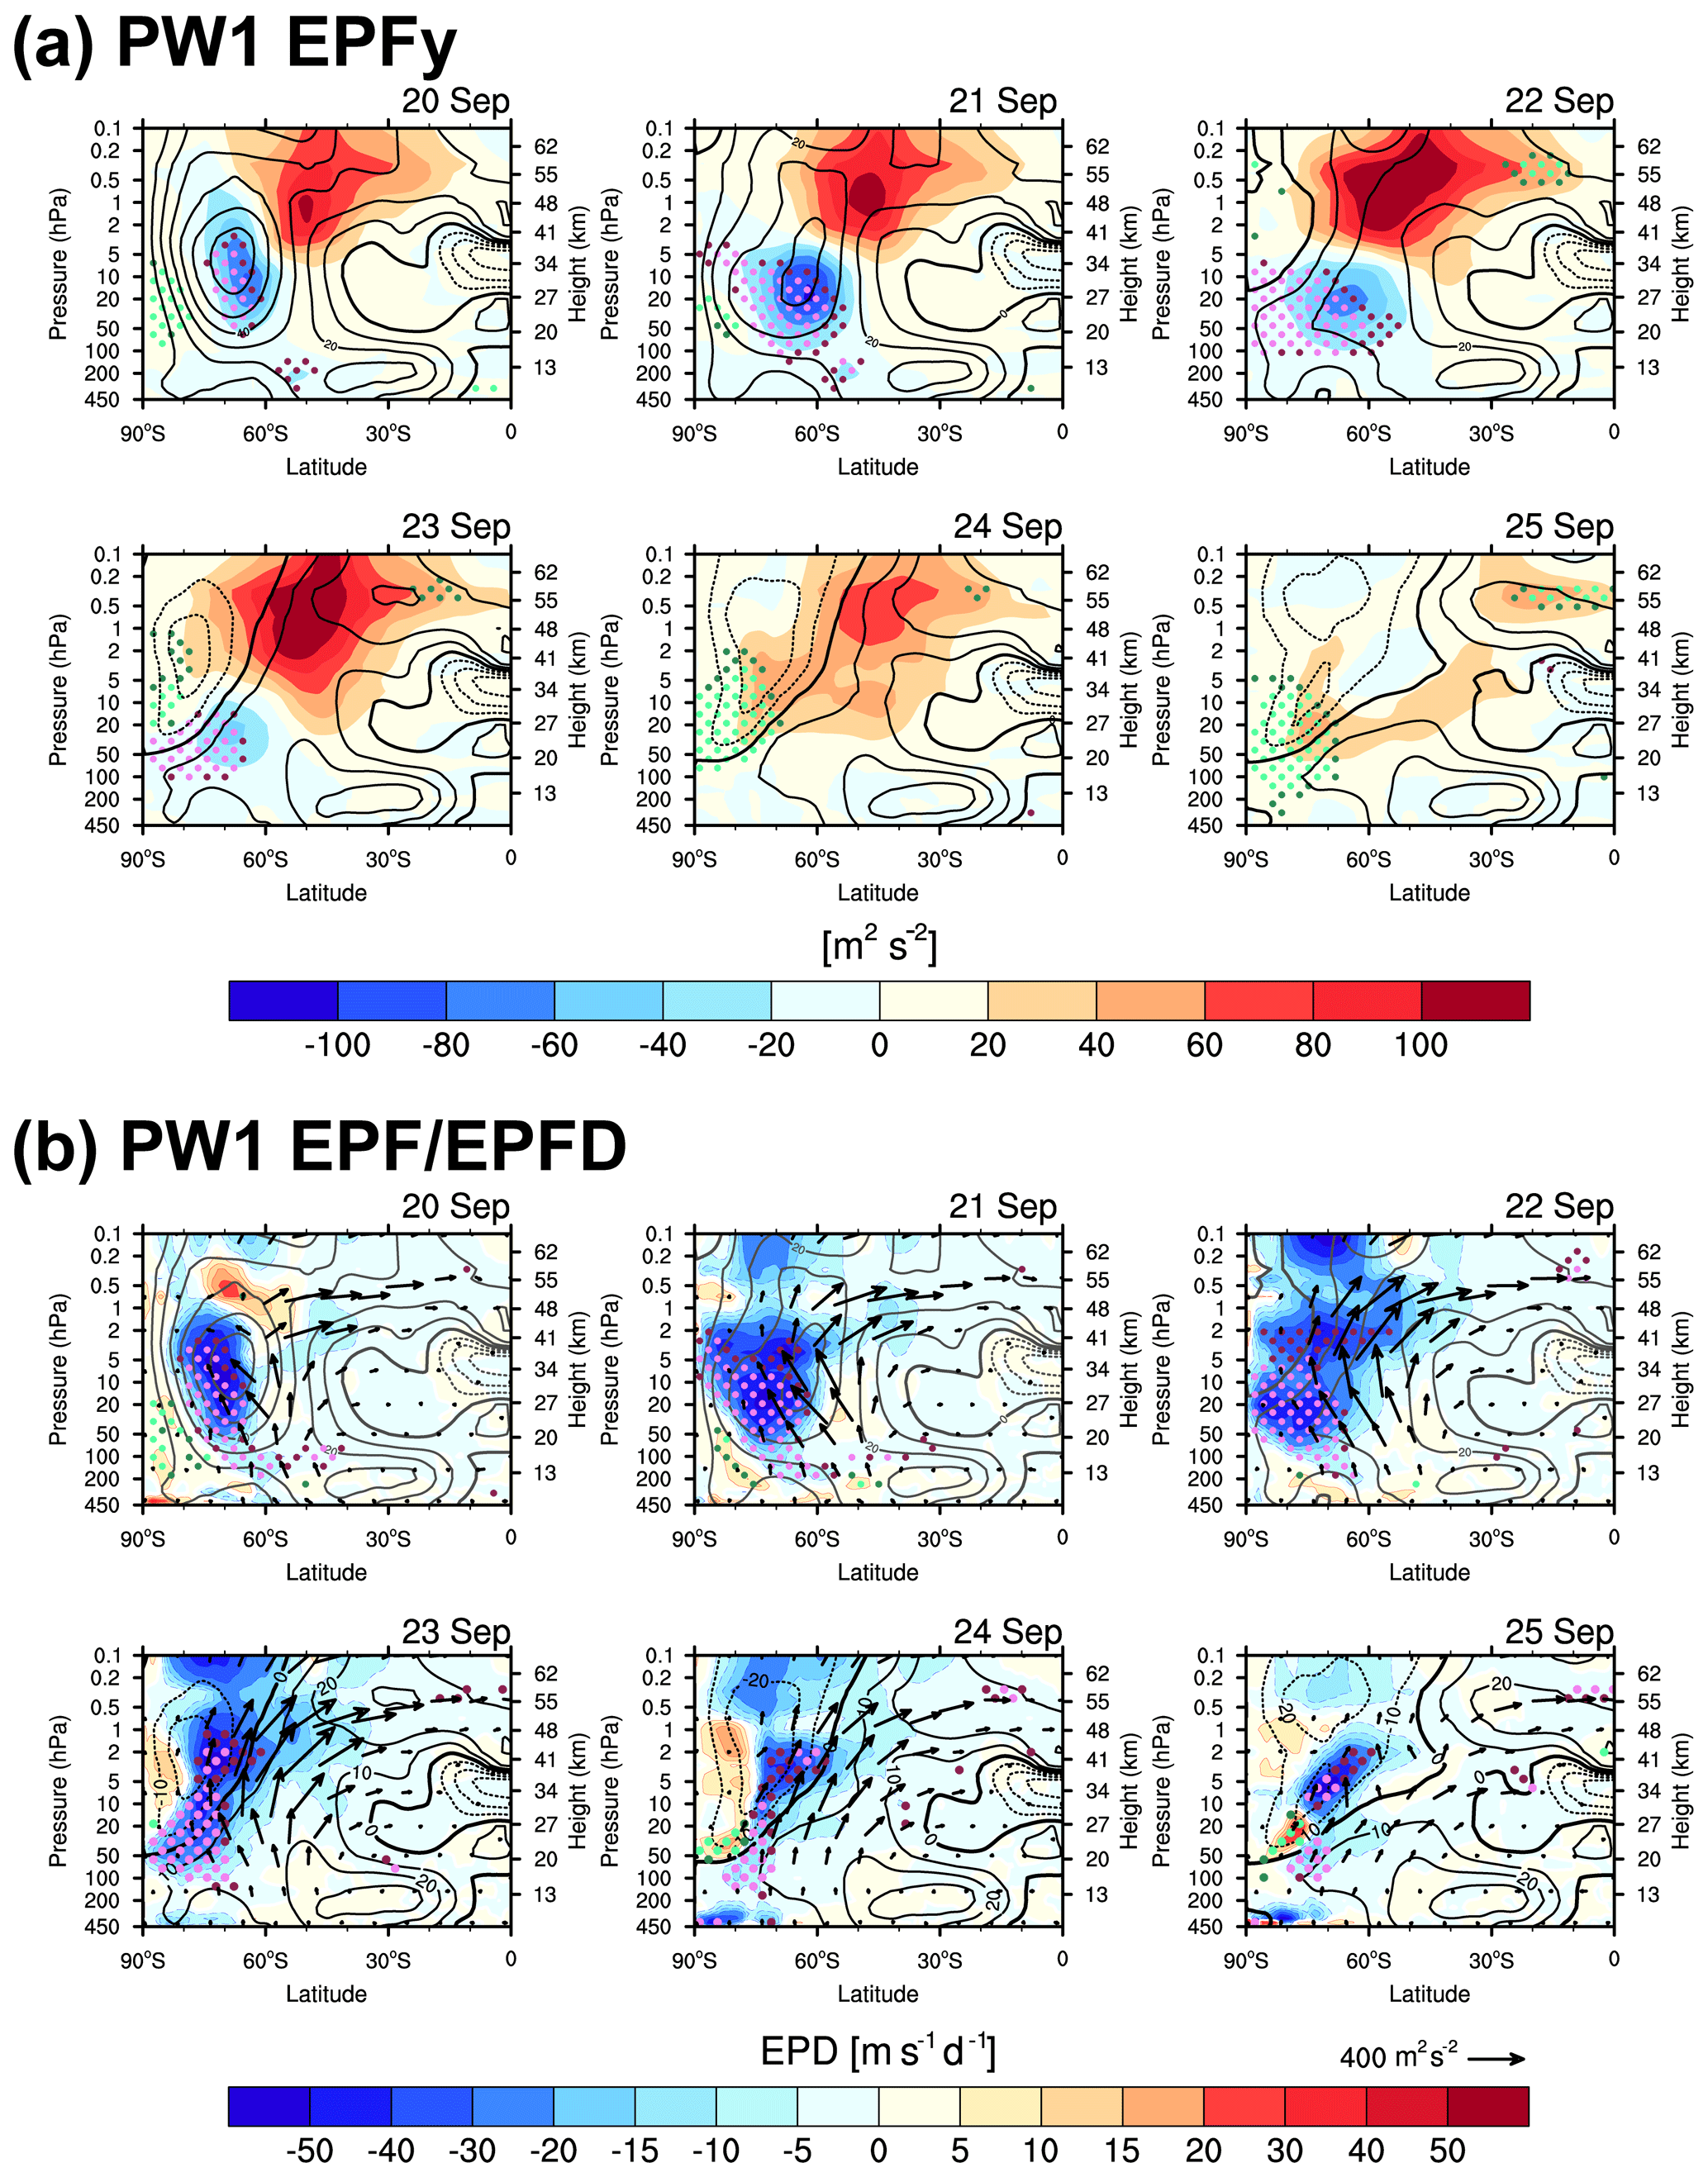
Figure 6Latitude–height cross sections of (a) the meridional component of EP-flux (EPFy, shading) and (b) EP-flux (vectors) overlaid on EPFD (shading) for PW1 from 20 to 25 September 2002. EP-flux vectors are scaled following the same method as in Fig. 3. Black contours indicate zonal-mean zonal wind, with the contour specifications identical to those in Fig. 3.
An inspection of the zonal phase speed of in situ-excited PW2 supports this hypothesis. Instability destabilizes PWs whose zonal phase speed matches the zonal wind speed in the instability region (Dickinson, 1973). Figure 4 illustrates the time–zonal phase speed cross sections of the PW2 GHP amplitude at 1, 10, and 100 hPa. In line with Dickinson's argument, the 1 hPa PW2 predominantly exhibited westward phase speeds during the generation period of mid-to-upper stratospheric PW2 (22–25 September). Furthermore, its dominant phase speed range of −5 to −25 m s−1 aligns well with the easterlies in the instability region (−25–0 m s−1; Fig. 3b). However, the possibility that these waves originate from below cannot be entirely ruled out. Although westward-propagating PW2 (WPW2) exhibit smaller amplitude at 100 hPa (accounting for ∼ 29 % of total GHP amplitude), they can propagate up to 1 hPa under the prevailing wind structure, featuring a transition from westerlies to easterlies with height (Fig. 3a), in accordance with the Charney and Drazin (1961) criterion [ where l and f0 represent the meridional wavenumber and Coriolis parameter at latitude ϕ0, respectively]. It contrasts with the dominant eastward-propagating PW2 at 100 hPa, whose upward propagation is prevented by the vertical wind reversal. Nonetheless, the 1 hPa WPW2 is unlikely to be a simple continuation of those from below, given the distinct positive EPFD indicative of local wave amplification (Fig. 3a). All accumulated evidence suggests that stratospheric WPW2 arose spontaneously from their critical levels within the instability region.
These in situ-excited WPW2 influenced the enhancement of PW2 at 10 hPa through downward propagation. This is evidenced by the phase speed range of WPW2 across different altitudes. While the phase speed of WPW2 at 100 hPa was largely below 10 m s−1, it increased to above 30 m s−1 at 10 hPa, aligning with the phase speed range observed at 1 hPa. These findings confirm that in situ-excited WPW2 at 1 hPa contributed to amplifying PW2 at 10 hPa. Notably, this contribution persisted even after the onset date.
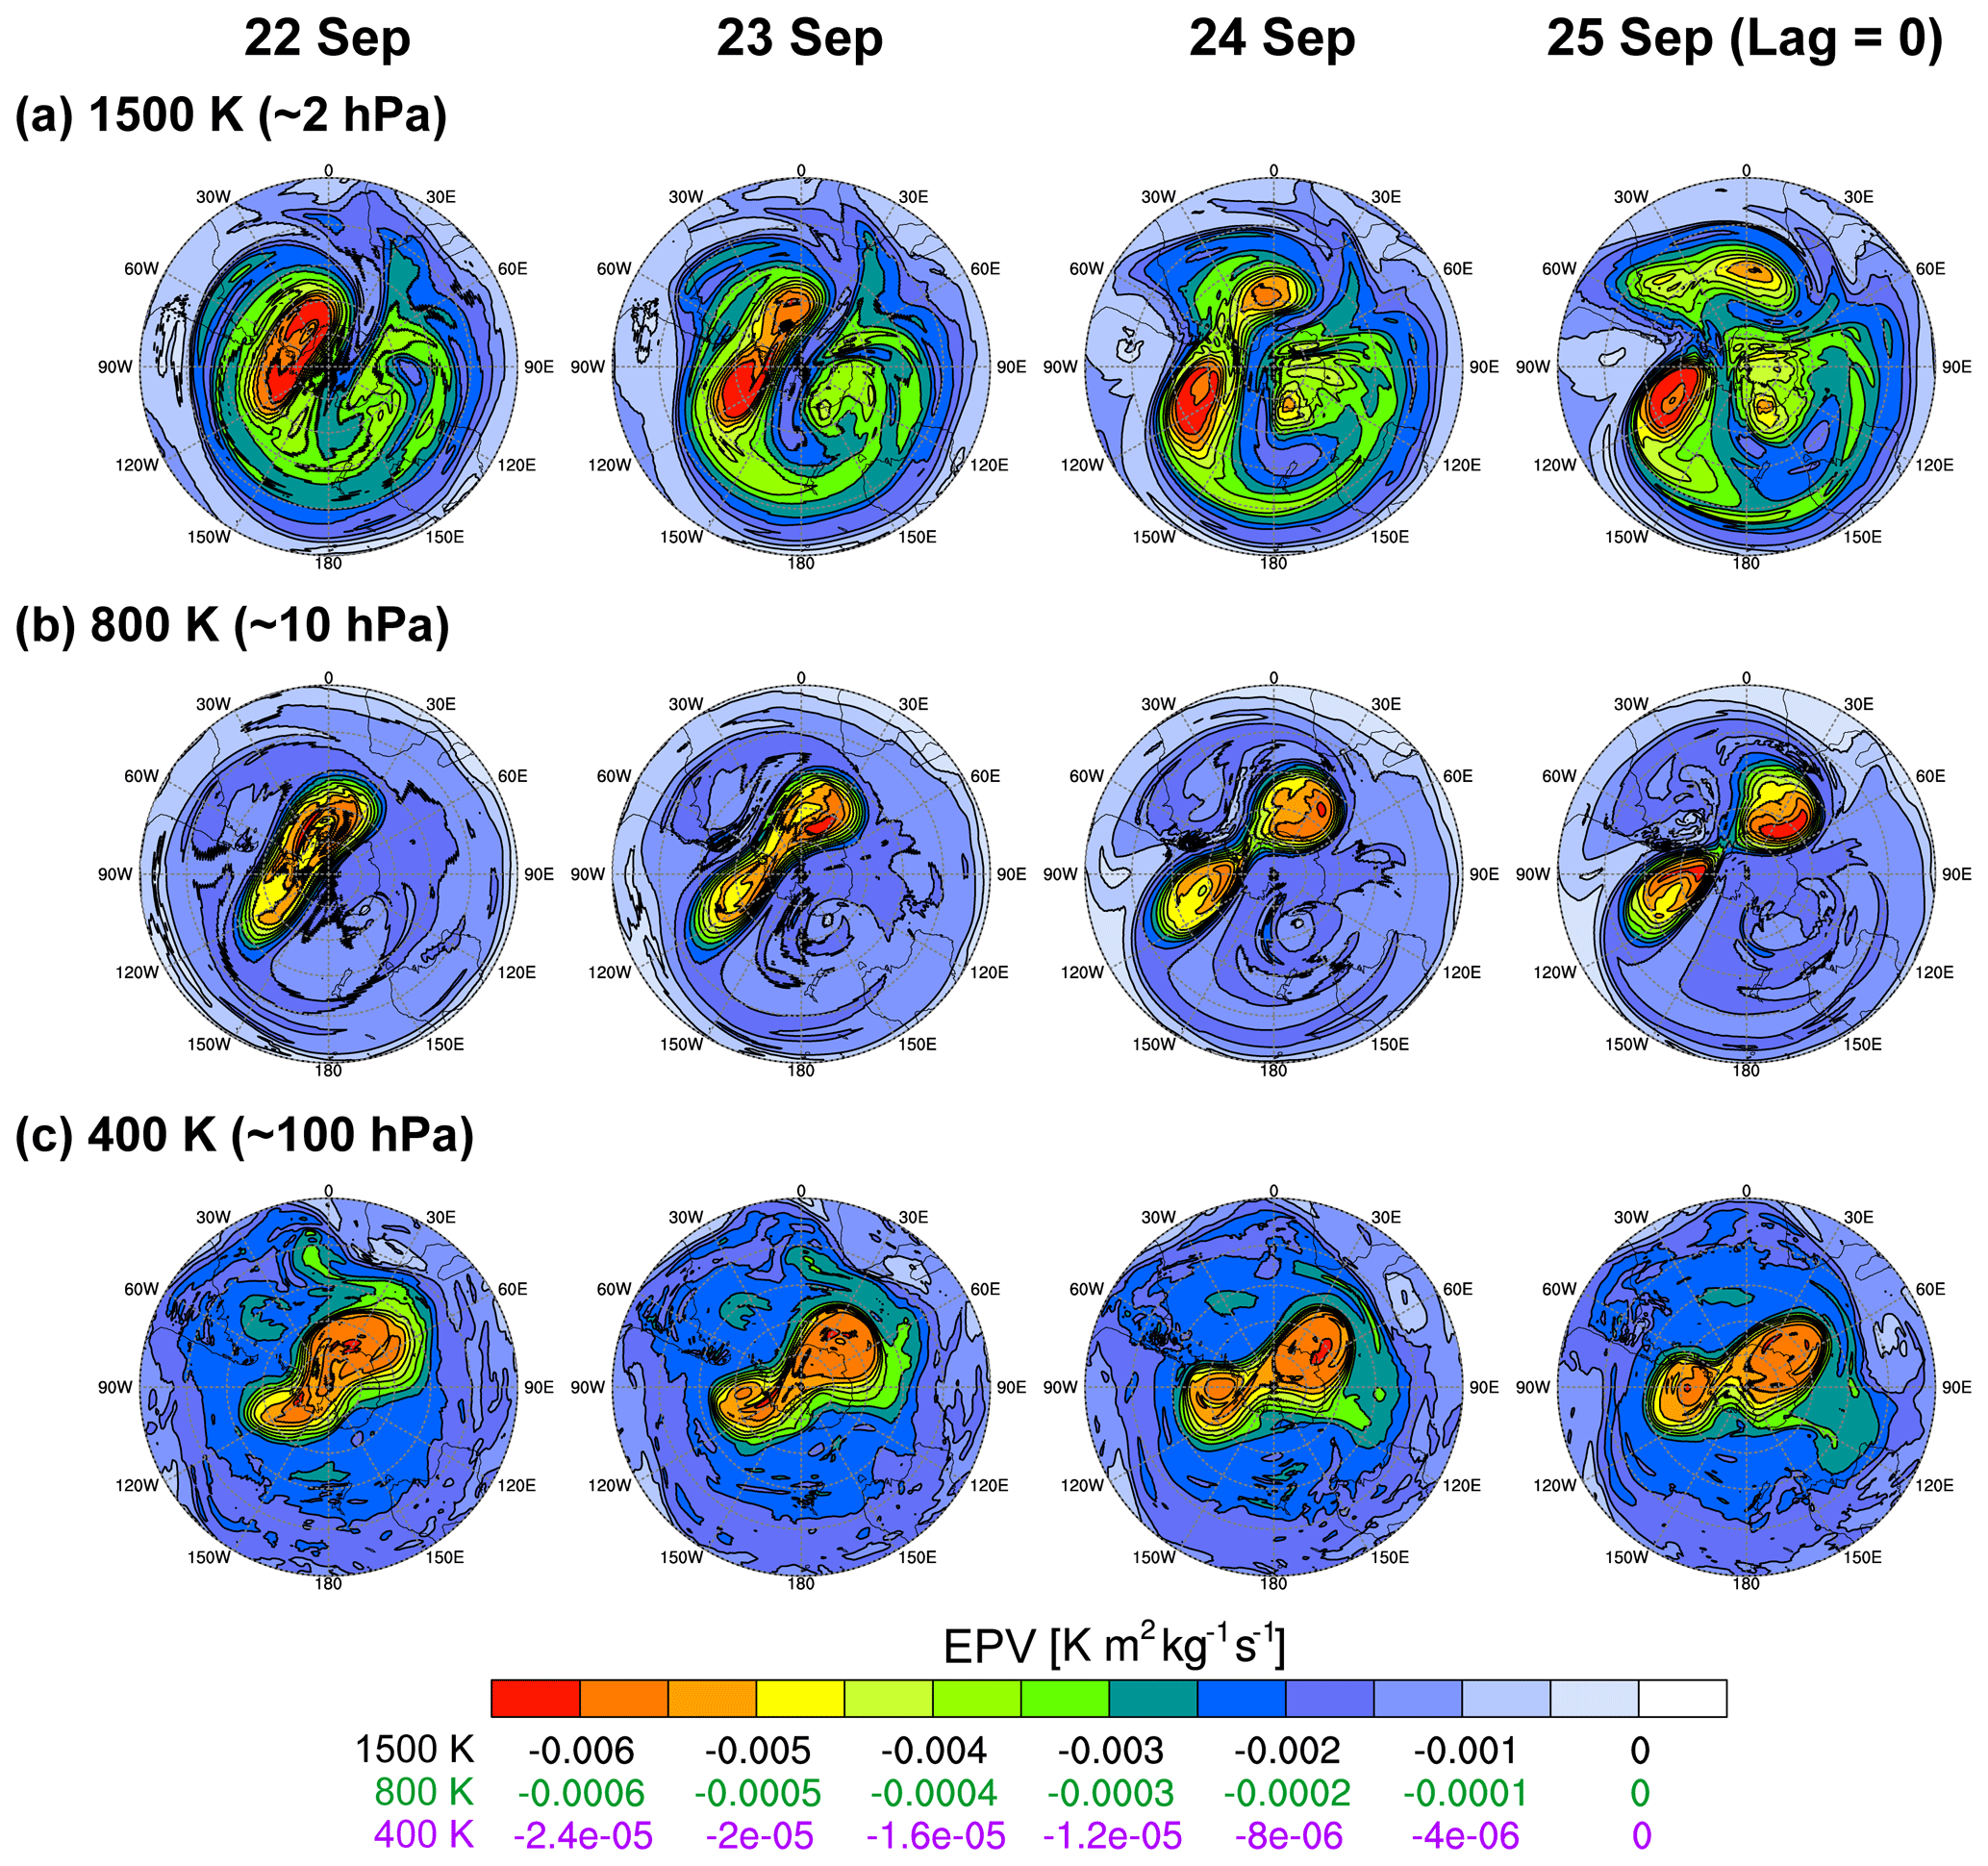
Figure 7Time series of EPV on the (a) 1500, (b) 800, and (c) 400 K isentropic surfaces from 22 to 25 September 2002.
3.4 Vortex preconditioning: poleward shift of the polar vortex
Consistent with SSW21, the evolution of easterlies within the polar stratosphere drove the vortex toward BT–BC instability during SSW02. This raises the question of whether SSW02 was also preceded by double-westerly jets and their critical-level interaction with tropospheric PWs, which led to zonal wind reversal and associated instability during SSW21. To address this, we analyzed the evolution of zonal-mean zonal winds from 20 September to the onset date (Lag = −5 to 0), as shown in Fig. 5. A double-westerly jet–like configuration evident on 21 September, with one core in the polar stratosphere and another in the subtropical mesosphere, had been present since early September (not shown). However, the equatorial stratospheric easterlies that propagated toward the polar stratopause along the path between the two cores and eventually dominated the polar stratosphere – a phenomenon observed in SSW21 (see Fig. 7 of YCK23) – were not identified in SSW02. Instead, easterlies emerged from the polar mesosphere on 21 September (Lag = −3) and rapidly descended into the lower stratosphere.
An abrupt development of easterlies was preceded by an abnormal increase (decrease) in the zonal-mean zonal wind on the poleward (equatorial) side of the jet streak on 20–21 September. This is consistent with the poleward shift of the PNJ relative to climatology, as documented by Newman and Nash (2005), although they noted that this shift had begun as early as April. Throughout the winter period, this shift guided irregular bursts of tropospheric waves toward higher latitudes, enhancing westward momentum transfer into the polar region. While Fig. 5 focuses on the period of rapid wind transition, a feature supporting this argument is evident in the meridional component of EP-flux (Fϕ) and EPFD of PWs during this period (Fig. 6). The focus here is on PW1, which predominantly induced negative PW forcing, facilitating the transition from westerlies to easterlies (Fig. S2). From 20 to 21 September, Fϕ exhibited significant negative values along the vortex center, falling below the 0.5th percentile. This confirms an unusual progression of PW1 toward higher latitudes, guided by the poleward-displaced vortex. Following the rapid weakening and transition of the PNJ into easterlies, a substantial negative Fϕ value gradually extended to lower altitudes by 23 September. These waves deposited significant negative EPFD, ranked below the 0.5th percentile, with a maximum of approximately 50 m s−1 d−1 near the jet maximum on 21 September (Fig. 6b). Exceptionally strong westward momentum from PW1 facilitated the transition of westerlies to easterlies from the polar mesosphere. Positive feedback via critical-level interaction between the zero-wind line and subsequent tropospheric PW1 further enhanced the downward expansion of polar easterlies with increasing intensity.
The next key question concerns the mechanisms driving the unusual poleward displacement of the vortex. Newman and Nash (2005) and Gray et al. (2005) identified anomalous easterlies in the equatorial upper stratosphere (1–10 hPa) as a potential factor contributing to the poleward vortex shift. Gray et al. (2005) proposed that these upper stratospheric easterlies over the equator generated strong horizontal wind shear and steep PV gradients in the SH subtropics during early winter, effectively confining equatorward-propagating PWs to the polar upper stratosphere. In this context, they suggested that the tropical stratopause's SAO as a favorable precursor to SSW.
3.5 Destabilization of ZWN2 waves
During SSW21, irreversible PV mixing driven by an exceptionally strong PW1 breaking led to the formation of a secondary cyclone and BT–BC instability, suggesting the destabilization of WPW2 in the mid-stratosphere (YCK23). This aligns with McIntyre's (1982) proposal that large-amplitude wave breaking disrupts the basic equator-to-pole PV gradient, creating an atmosphere characterized by scattered pieces of high and low PV. Under such conditions, energy cascades from low to high wavenumbers across the PV and height fields to preserve enstrophy and energy. The abnormal PW1 breaking (Fig. 6b) and the temporally out-of-phase relationship, wherein PW1 weakened as PW2 strengthened (Fig. 2b), suggest that a similar phenomenon may have occurred during SSW02.
The evolution of Ertel's PV (EPV) on the 1500 K isentropic surface (approximately 2 hPa) in Fig. 7a closely resembles that observed during SSW21 (Fig. 8 of YCK23). On 22 September, significant PW1 breaking and the resulting irreversible mixing strongly deformed the vortex, ultimately forming an additional cyclone in its trailing region (90–180° E). Simultaneously, low-magnitude PV extended deeply into higher latitudes, crossing the pole between two high-magnitude PV cores. This indicates a localized reversal of the meridional PV gradient, destabilizing the flow. These features suggest that PW1 breaking triggered smaller-scale wave generation through energy cascading and initiated BT–BC instability, which could further amplify these smaller-scale waves. This process likely contributed to PW2 enhancement in the mid-to-upper stratosphere.
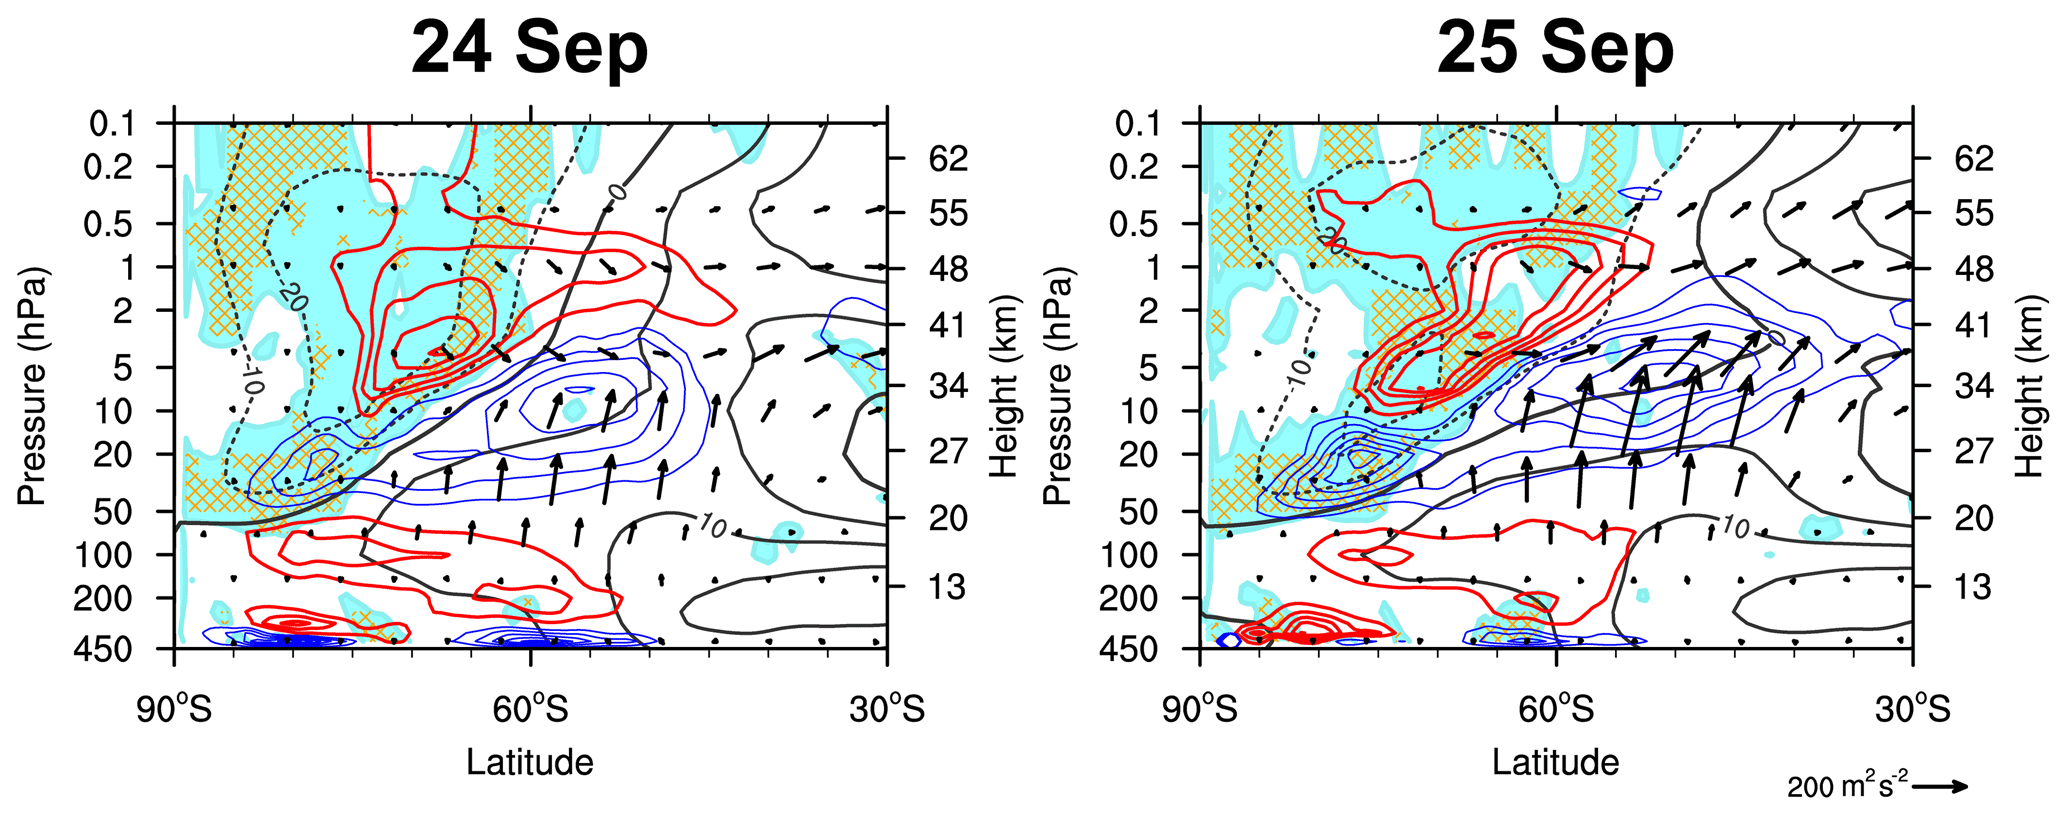
Figure 8Latitude–height cross sections of the negative (mint shading) and negative squared refractive index (n2, orange hatching) within the instability region, overlaid with PW2 EP-flux (vectors) and EPFD (contours, where red and blue indicate positive and negative values, respectively) on 24–25 September 2002. Black contours represent zonal-mean zonal wind, with contour specifications matching those in Fig. 3. The contour intervals for the red and blue lines are identical to those shown in the color bar of Fig. 3a. EP-flux vectors are scaled following the same method as in Fig. 3.
Unlike SSW21, SSW02 involved the separation of the primary cyclone, which began on 23 September. Wavenumber decomposition revealed that this separation accounted for the substantial amplification of PW2 from 24 September (not shown). The formation of the secondary cyclone and its subsequent eastward migration at the 1500 K isentropic surface can be traced back through the 800 K isentropic surface (approximately 10 hPa, Fig. 7b) to structures originating in the lower stratosphere near 400 K (approximately 100 hPa, Fig. 7c). The GPH at 100, 10, and 2 hPa in the supplementary material (Fig. S3) supports this interpretation: At 100 hPa, a clear ZWN2 pattern appears from 22 September, while at 10 hPa, the primary cyclone evolves into a peanut-like structure on 23 September, followed by a vortex split on 24 September. A similar sequence occurs at 2 hPa with a one-day delay, indicating the vertical extension of PW2 features. Based on earlier evidence supporting in situ WPW2 generation in the mid-to-upper stratosphere via BT–BC instability, this upward-propagating signal suggests that unstable WPW2 excitation is associated with the incident PW2 from below. This seemingly counterintuitive interpretation can be understood in the context of the over-reflection of waves from below.
The concept of over-reflection relates incident PWs to the in situ PW excitation through BT–BC instability (Rhodes et al., 2021). As previously mentioned, a critical layer embedded within an unstable region (with ) can be a source for unstable PW growth (Dickinson, 1973). If incident PWs can tunnel from the turning level (where waves first become evanescent) to the critical level (where ) through the evanescent region (where n2<0 owing to and ), these waves can grow by extracting energy from the mean flow. From this perspective, the growth of unstable PWs is initiated by PWs tunneling beyond the turning level and amplifying at the critical level (e.g., Harnik and Heifetz, 2007). Over-reflection occurs when an incident PW is reflected from the turning level, gaining more energy than it originally had (Rhodes et al., 2021), and the divergence of EP-flux represents this energy growth. Figure 1 and the related discussion in the paper by Rhodes et al. (2023) provide further details.
The possibility of over-reflection is explored in Fig. 8, which presents latitude–height sections of PW2 EP-fluxes and EPFD along with the evanescent region (negative n2, orange hatching) within the destabilized area (negative , cyan shading). This figure focuses on 24–25 September, when the primary cyclone became fully detached. Here, n2 is calculated by setting ZWN k=2 with a zonal phase speed Cx of −20 m s−1. As the magnitude of negative Cx increases, the evanescent region expands toward the easterly core due to the increasing area where , leading to n2<0. Thus, the negative n2 with the selected Cx (−20 m s−1) roughly encompasses the evanescent region derived from the major Cx range of WPW2 propagating upward from 100 hPa (−20–0 m s−1, Fig. 4), which are subject to over-reflection in the destabilized polar stratosphere dominated by easterlies. Some of the upward-propagating PW2, whose westward components increase with height (as discussed in Sect. 3), encountered the lower boundary of the WPW2 evanescent region, where the incident WPW2 were able to tunnel through. From the critical levels above the evanescent region, downward and equatorward PW2 fluxes emerged, increasing in magnitude with distance, thereby creating a positive EPFD. All these features suggest that the growth of stratospheric WPW2 was associated with the westward component of incident PW2 tunneling to their critical levels through the evanescent region and subsequent amplification at those levels. As such, the downward propagation of PW2, opposite to the upward-propagating incident PW2, is interpreted as over-reflection, with the positive EPFD indicating that these waves had greater energy than the incident ones. While the positive EPFD region extends farther equatorward, the area of potential PW generation via instability remained largely confined to higher latitudes on 24 September (Fig. 8), reflecting a similar pattern observed on 23 September (Fig. 3b). This is likely because , calculated using zonal-mean variables, does not fully capture the longitudinally varying instability extending into lower latitudes. Such instability, inferred from the negative meridional gradient of EPV on the 1500 K isentropic surface (Fig. S4), appears over broad longitudinal bands, although it is not zonally continuous. These spatially extensive unstable regions suggest a potential for amplifying even planetary-scale waves, though idealized modeling studies are needed to substantiate this inference.
The nonlinear wave–wave interaction process – the development of easterlies resulting from PW1 dissipation (Fig. 6b), the associated onset of instability (Fig. 3b), and the emergence of an additional cyclone in the tailing region of the parent cyclone (Fig. 7a) – was active by 22 September and persisted through 25 September. In contrast, as shown in Fig. 3a–b, over-reflection was unlikely until 23 September, as upward-propagating PW2 did not reach their critical levels within the unstable region, which was confined to high latitudes (poleward of 60° S). From 24 September onward, however, the easterlies extended downward and equatorward, coinciding with intensified upward-propagating PW2 – as indicated by the enhanced EP-flux – such that the waves reached the turning level and over-reflection occurred (Fig. 8). This suggests that wave–wave interactions appear to dominate the early phase of wave generation, whereas over-reflection likely contributed to the later phase. Determining which mechanism played the dominant role would require a quantitative comparison, which remains beyond the scope of this study.
Since the initiation of routine upper-atmospheric observations, only one SSW has been recorded in the SH, occurring on 25 September 2002. This SSW event was marked by the splitting of the polar vortex, a phenomenon rarely observed even in the NH. Early studies in the 2000s primarily examined the role of tropospheric PWs and vortex preconditioning, which direct these waves toward the polar stratosphere, in triggering SSW02. However, the influence of spontaneously generated waves within the stratosphere remains unexplored. Building on the recent findings of YCK23, which highlighted the critical role of instability-induced stratospheric waves in vortex splitting during the 2021 NH SSW, this study revisits SSW02, focusing on the potential contribution of in situ-excited PWs to the vortex split.
Consistent with previous studies, the substantial amplification of PW2 at 10 hPa, which led to the sudden split of the polar vortex, can be traced back to anomalous bursts of ZWN2 waves in the troposphere. However, this study also identifies the simultaneous descent of WPW2 from the mid-to-upper stratosphere to 10 hPa, suggesting their contribution to the vortex split. These WPW2s were generated in situ within the polar stratosphere, which was driven toward BT–BC instability as the zonal wind reversal progressed downward from the lower mesosphere, including the WPW2 critical layer. These in situ-excited WPW2 contributed to PW2 intensification at 10 hPa through downward propagation.
Instability amplified PW2 through two distinct mechanisms: nonlinear wave–wave interactions – similar to the process observed during SSW21 (YCK23) – and the over-reflection of upward-propagating PW2. Nonlinear wave–wave interaction involves PW1 breaking, which cascades energy into smaller-scale waves and simultaneously triggers instability, leading to the in-situ PW2 excitation. In the case of over-reflection, unstable PW2 growth occurred as upward-propagating PW2 tunneled through the evanescent layer and encountered a critical level embedded within the instability region. While these mechanisms operated through distinct pathways, nonlinear interaction induced stratospheric instability that was favorable for over-reflection when incident PW2 was present – implying that the former may conditionally facilitate the latter. For SSW02, nonlinear interaction initiated the stratospheric PW2 amplification, setting up favorable conditions for over-reflection, which played a role nearer the onset. Meanwhile, a double-jet configuration, previously proposed as a vortex preconditioning mechanism for inducing instability during SSW21 (YCK23), also preceded SSW02. However, unlike in SSW21, the critical-level interaction between the double-jet and tropospheric PW1 was absent in SSW02. Instead, an anomalous poleward shift of the polar vortex led to zonal wind reversal and vortex destabilization by confining PW1 to the polar stratosphere and enhancing westward momentum deposition in that region.
Common insights emerge from this study and YCK23, which examined SSW events across different hemispheres: Anomalous PW1 breaking leads to zonal wind transitions to easterlies, destabilizing the stratosphere during major SSW development. The subsequent growth of unstable PW2 contributes to polar vortex splitting. Among the 11 wave-2-type major SSW events exhibiting vortex split characteristics in the NH over the 44-year period from 1980 to 2023 (classified by Ryoo and Chun, 2005; Table S1), six cases present the simultaneous occurrence of PW1 dissipation, BT–BC instability, and PW2 generation within the stratosphere (Figs. S5–10). Although this assessment is based on a preliminary visual inspection disregarding time lags among these phenomena, it suggests that in situ PW2 generation via instability could have contributed to approximately half of vortex-splitting SSW events. This highlights the role of explosive unstable PW growth within the stratosphere in vortex splitting, though this mechanism is not exclusive to split cases. Given the influence of in situ PW2 excitation via instability on vortex morphology – a key factor in shaping SSW characteristics and its downward influence – incorporating this mechanism into SSW research could provide a more comprehensive understanding of SSW dynamics.
Anomalous easterlies in the equatorial upper stratosphere are another shared feature between SSW02 and SSW21. The occurrence of both events during the westerly phase of the QBO in the lower stratosphere (50 hPa) – a condition that typically suppresses SSWs according to the Holton–Tan effect – supports the role of equatorial upper-stratospheric winds in triggering SSWs. Notably, similar vortex shifts linked to equatorial upper stratospheric easterlies were also observed during the 2019 SH minor warming event. Additionally, Koushik et al. (2022) reported that equatorial easterlies in the upper stratosphere were present in approximately 70 % of 29 NH SSW events from 1979 to 2021. They further highlighted a growing frequency of SSWs preceded by this wind structure since 2000, suggesting a shift in the system's dynamics. In this context, further research is warranted in two key areas: (1) the processes governing the development of anomalous equatorial upper stratospheric easterlies that trigger SSWs, particularly their connection to equatorial waves and lower stratospheric mean flows; (2) the reason underlying the increasing frequency of SSWs with these easterlies since 2000, including the possibility of a contribution from radiatively forced climate change. Considering the observational limitations in the equatorial upper stratosphere, a numerical modeling approach could help address these questions.
Two additional aspects deserve discussion – one concerning the data, the other the analytical approach. First, our analysis involves the upper stratosphere and lower mesosphere, where reanalysis reliability is limited due to the sparse assimilated observations; In MERRA-2, satellite temperature profiles above ∼ 60 km are constrained only by the Aura Microwave Limb Sounder, available since 2004 (McCarty et al., 2016). Although the Advanced Microwave Sounding Unit-A channel 14 is assimilated (McCarty et al., 2016), its sensitivity peaks in the upper stratosphere (∼ 30–45 km), leaving the pre-2004 upper stratosphere/lower mesosphere state weakly constrained and therefore uncertain. This limitation is particularly important because the key arguments in our study involve the downward propagation of both zonal wind and PWs from higher altitudes. To support the validity of our results, we supplemented our analysis using two additional reanalysis datasets: the fifth generation of the European Centre for Medium-Range Weather Forecasts (ECMWF) Reanalysis re-run for 2000–2006 (ERA5.1, Simmons et al., 2020) and the Japanese Reanalysis for Three Quarters of a Century (JRA-3Q; Kosaka et al., 2024) (Text S2 and Figs. S11–13). While minor structural differences arise from the different resolutions and upper limit of the datasets – mainly in variables involving latitudinal or vertical derivatives such as EP-flux – all three reanalyses show broadly consistent zonal-mean flow and wave behavior. Despite limitations in representing the upper stratosphere and lower mesosphere, the consistency across reanalysis datasets suggests that our results reflect actual phenomena at those altitudes rather than dataset-specific artifacts.
Second, this study is primarily based on the classical wave–mean flow interaction framework. However, under highly distorted vortex conditions (as shown in Figs. 2 and 7), this approach may lead to oversimplification. This perspective was raised by O'Neill et al. (2017), who analyzed the same event. They showed that polar vortex splitting occurred as the vortex was already elongated and a sub-planetary-scale closed cyclone (approximately zonal wavenumber 4) developed in the troposphere, barotropically aligned with one of the vortex tips. Under linear, steady-state atmospheric conditions, such a scale would not be expected to propagate upward into the stratosphere (Charney and Drazin, 1961), indicating that vortex splitting involves processes beyond the upward propagation of PW2, including dynamical upscaling from the sub-planetary-scale cyclogenesis to planetary-scale responses. Therefore, interpreting this event based solely on PW components and non-local diagnostics, such as the EP-flux, may not fully capture the complex dynamics involved. While our EPV-based analysis (Fig. 7) focused on identifying nonlinear processes and interpreting the cyclone's vertical structure through delocalized PW2 upward propagation, further investigation into nonlinear PV advection and vortex–vortex interactions may provide additional insight into the dynamics of vortex splitting.
MERRA-2 data are provided by the Global Modeling and Assimilation Office (GMAO) at NASA Goddard Space Flight Center and are available from the NASA GES DISC online archive (https://doi.org/10.5067/QBZ6MG944HW0 and https://doi.org/10.5067/CWV0G3PPPWFW; GMAO, 2015a, b). ERA5.1 reanalysis data were retrieved via the ECMWF MARS catalogue (https://apps.ecmwf.int/mars-catalogue/?type=an&class=ea&stream=oper&expver=51, last access: 20 October 2025) under authorised access. JRA-3Q reanalysis data were obtained from the NCAR Research Data Archive (https://rda.ucar.edu/datasets/d640000/dataaccess/, last access: 20 October 2025). Other data supporting the findings of this study are available from the corresponding author upon reasonable request.
The supplement related to this article is available online at https://doi.org/10.5194/acp-25-13651-2025-supplement.
JHY and HYC conceived the study. JHY conducted the formal analysis and visualized the results. JHY drafted the manuscript with contributions from HYC.
The contact author has declared that neither of the authors has any competing interests.
Publisher’s note: Copernicus Publications remains neutral with regard to jurisdictional claims made in the text, published maps, institutional affiliations, or any other geographical representation in this paper. While Copernicus Publications makes every effort to include appropriate place names, the final responsibility lies with the authors. Also, please note that this paper has not received English language copy-editing. Views expressed in the text are those of the authors and do not necessarily reflect the views of the publisher.
We thank the three anonymous reviewers for their constructive and helpful comments. We also thank Dr. Han-Chang Ko for his assistance with ERA5.1 data collection.
This research was supported by a National Research Foundation of Korea grant funded by the South Korean government (2021R1A2C100710212). The first author (Ji-Hee Yoo) was supported by the by the National Research Foundation of Korea BK21 FOUR (Fostering Outstanding Universities for Research) Program, Institute of Earth Atmosphere Astronomy, Yonsei University (grant no. 4120200513819).
This paper was edited by William Ward and reviewed by three anonymous referees.
Allen, D. R., Bevilacqua, R. M., Nedoluha, G. E., Randall, C. E., and Manney, G. L.: Unusual stratospheric transport and mixing during the 2002 Antarctic winter, Geophys. Res. Lett., 30, https://doi.org/10.1029/2003GL017117, 2003.
Andrews, D. G., Holton, J. R., and Leovy, C. B.: Middle Atmosphere Dynamics. Academic Press, San Diego, CA, 489 pp., ISBN 9780120585762, 1987.
Baldwin, M., Hirooka, T., O'Neill, A., and Yoden, S: Major stratospheric warming in the Southern Hemisphere in 2002: Dynamical aspects of the ozone hole split, SPARC Newsl., 20, 24–26, 2003.
Charlton, A. J. and Polvani, L. M.: A new look at stratospheric sudden warmings, Part I: climatology and modeling benchmarks, J. Climate, 20, 449–469, https://doi.org/10.1175/JCLI3996.1, 2007.
Charlton, A. J., O'Neill, A., Lahoz, W. A., and Berrisford, P.: The splitting of the stratospheric polar vortex in the Southern Hemisphere, September 2002: Dynamical evolution, J. Atmos. Sci., 62, 590–602, https://doi.org/10.1175/JAS-3318.1, 2005.
Charney, J. G. and Drazin, P. G.: Propagation of planetary-scale disturbances from the lower into the upper atmosphere, J. Geophys. Res., 66, 83–109, https://doi.org/10.1029/JZ066i001p00083, 1961.
Gray, L., Norton, W., Pascoe, C., and Charlton, A.: A possible influence of equatorial winds on the September 2002 Southern Hemisphere sudden warming event, J. Atmos. Sci., 62, 651–667, https://doi.org/10.1175/JAS-3339.1, 2005.
Dickinson, R. E.: Baroclinic instability of an unbounded zonal shear flow in a compressible atmosphere, J. Atmos. Sci., 30, 1520–1527, https://doi.org/10.1175/1520-0469(1973)030<1520:BIOAUZ>2.0.CO;2, 1973.
Gelaro, R., McCarty, W., Suarez, M. J., Todling, R., Molod, A., Takacs, L., Randles, C. A., Darmenov, A., Bosilovich, M. G., Reichle, R., Wargan, K., Coy, L., Cullather, R., Draper, C., Akella, S., Buchard, V., Conaty, A., da Silva, A. M., Gu, W., Kim, G.-K., Koster, R., Lucchesi, R., Merkova, D., Nielsen, J. E., Partyka, G., Pawson, S., Putman, W., Rienecker, M., Schubert, S. D., Sienkiewicz, M., and Zhao, B.: The Modern-Era Retrospective Analysis for Research and Applications, Version 2 (MERRA-2), J. Climate, 30, 5419–5454, https://doi.org/10.1175/JCLI-D-16-0758.1, 2017.
GMAO (Global Modeling and Assimilation Office): MERRA-2 inst3_3d_asm_Np: 3d,3-Hourly, Instantaneous, Pressure-Level, Assimilation, Assimilated Meteorological Fields V5.12.4, Greenbelt, MD, USA, Goddard Earth Sciences Data and Information Services Center (GES DISC) [data set], https://doi.org/10.5067/QBZ6MG944HW0, 2015a.
GMAO (Global Modeling and Assimilation Office): MERRA-2 tavg3_3d_udt_Np: 3d,3-Hourly, Time-Averaged,Pressure-Level,Assimilation, Wind Tendencies V5.12.4, Greenbelt, MD, USA, Goddard Earth Sciences Data and Information Services Center (GES DISC), [data set], https://doi.org/10.5067/CWV0G3PPPWFW, 2015b.
Harnik, N. and Heifetz, E.: Relating overreflection and wave geometry to the counterpropagating Rossby wave perspective: Toward a deeper mechanistic understanding of shear instability, J. Atmos. Sci., 64, 2238–2261, https://doi.org/10.1175/JAS3944.1, 2007.
Harris, F. J.: On the use of windows for harmonic analysis with the discrete Fourier transform, Proc. IEEE, 66, 51–83, https://doi.org/10.1109/PROC.1978.10837, 1978.
Holton, J. R. and Tan, H.-C.: The quasi-biennial oscillation in the Northern Hemisphere lower stratosphere, J. Meteorol. Soc. Jpn., 60, 140–148, https://doi.org/10.2151/jmsj1965.60.1_140, 1982.
Iida, C., Hirooka, T., and Eguchi, N.: Circulation changes in the stratosphere and mesosphere during the stratospheric sudden warming event in January 2009, J. Geophys. Res.-Atmos., 119, 7104–7115, https://doi.org/10.1002/2013JD021252, 2014.
Jucker, M.: Scaling of Eliassen–Palm flux vectors, Atmos. Sci. Lett., 22, e1020, https://doi.org/10.1002/asl.1020, 2021.
Karoly, D. J. and Hoskins, B. J.: Three-dimensional propagation of planetary waves, J. Meteorol. Soc. Jpn., 60, 109–122, https://doi.org/10.2151/jmsj1965.60.1_109, 1982.
Kosaka, Y., Kobayashi, S., Harada, Y., Kobayashi, C., Naoe, H., Yoshimoto, K., and Onogi, K.: The JRA-3Q reanalysis, J. Meteorol. Soc. Jpn. Ser. II, 102, 49–109, https://doi.org/10.2151/jmsj.2024-004, 2024.
Koushik, N., Kumar, K. K., and Pramitha, M.: A tropical stratopause precursor for sudden stratospheric warmings, Sci. Rep., 12, 2937, https://doi.org/10.1038/s41598-022-06864-7, 2022.
Krüger, K., Naujokat, B., and Labitzke, K.: The unusual midwinter warming in the Southern Hemisphere stratosphere 2002: A comparison to Northern Hemisphere phenomena, J. Atmos. Sci., 62, 603–613, https://doi.org/10.1175/JAS-3316.1, 2005.
McFarlane, N. A.: The effect of orographically excited gravity wave drag on the general circulation of the lower stratosphere and troposphere, J. Atmos. Sci., 44, 1775–1800, https://doi.org/10.1175/1520-0469(1987)044<1775:TEOOEG>2.0.CO;2, 1987.
Manney, G. L., Sabutis, J. L., Allen, D. R., Lahoz, W. A., Scaife, A. A., Randall, C. E., Pawson, S., Naujokat, B., and Swinbank, R.: Simulations of dynamics and transport during the September 2002 Antarctic major warming, J. Atmos. Sci., 62, 690–707, https://doi.org/10.1175/JAS-3313.1, 2005.
Matsuno, T.: Vertical propagation of stationary planetary waves in the winter Northern Hemisphere, J. Atmos. Sci., 27, 871–883, https://doi.org/10.1175/1520-0469(1970)027<0871:VPOSPW>2.0.CO;2, 1970.
McCarty, W., Coy, L., Gelaro, R., Huang, A., Merkova, D., Smith, E. B., Sienkiewicz, M., and Wargan, K.: MERRA-2 input observations: Summary and assessment, NASA Technical Report Series on Global Modeling and Data Assimilation, NASA/TM–2016–104606, Vol. 46, NASA Goddard Space Flight Center, Greenbelt, MD, USA, 64 pp., https://ntrs.nasa.gov/citations/20160014544 (last access: 10 September 2025), 2016.
McIntyre, M. E.: How well do we understand the dynamics of stratospheric warmings? J. Meteorol. Soc. Jpn. Ser. II, 60, 37–65, https://doi.org/10.2151/jmsj1965.60.1_37, 1982.
Molod, A., Takacs, L., Suarez, M., and Bacmeister, J.: Development of the GEOS-5 atmospheric general circulation model: Evolution from MERRA to MERRA-2, Geosci. Model Dev., 8, 1339–1356, https://doi.org/10.5194/gmd-8-1339-2015, 2015.
Newman, P. A. and Nash, E. R.: The unusual Southern Hemisphere stratosphere winter of 2002, J. Atmos. Sci., 62, 614–628, https://doi.org/10.1175/JAS-3323.1, 2005.
O'Neill, A., Oatley, C. L., Charlton-Perez, A. J., Mitchell, D. M., and Jung, T.: Vortex splitting on a planetary scale in the stratosphere by cyclogenesis on a subplanetary scale in the troposphere, Q. J. R. Meteorol. Soc., 143, 691–705, https://doi.org/10.1002/qj.2957, 2017.
Rhodes, C. T., Limpasuvan, V., and Orsolini, Y. J.: Eastward-propagating planetary waves prior to the January 2009 sudden stratospheric warming, J. Geophys. Res.-Atmos., 126, e2020JD033696, https://doi.org/10.1029/2020JD033696, 2021.
Rhodes, C. T., Limpasuvan, V., and Orsolini, Y.: The composite response of traveling planetary waves in the middle atmosphere surrounding sudden stratospheric warmings through an overreflection perspective, J. Atmos. Sci., 80, 2635–2652, https://doi.org/10.1175/JAS-D-22-0266.1, 2023.
Ryoo, J. M. and Chun, H. Y.: Stratospheric major sudden warmings revealed in NCEP reanalysis data for 41 years (1958–1999), Asia-Pac. J. Atmos. Sci., 41, 173–190, 2005.
Salby, M. L.: Fundamentals of Atmospheric Physics, Int. Geophys. Ser. 61, Academic Press, San Diego, CA, 648 pp., ISBN 9780080532158, 1996.
Simmons, A., Hersbach, H., Dee, D., and Berrisford, P.: Global stratospheric temperature bias and other stratospheric aspects of ERA5 and ERA5.1, ECMWF Tech. Rep., https://doi.org/10.21957/rcxqfmg0, 2020.
Song, B. G., Chun, H. Y., and Song, I. S.: Role of gravity waves in a vortex-split sudden stratospheric warming in January 2009, J. Atmos. Sci., 77, 3321–3342, https://doi.org/10.1175/JAS-D-20-0039.1, 2020.
Vallis, G. K.: Atmospheric and Oceanic Fluid Dynamics, Cambridge University Press, Cambridge, https://doi.org/10.1017/9781107588417, 2017.
Yoo, J. H., Chun, H. Y., and Kang, M. J.: Vortex preconditioning of the 2021 sudden stratospheric warming: Barotropic–baroclinic instability associated with the double westerly jets, Atmos. Chem. Phys., 23, 10869–10881, https://doi.org/10.5194/acp-23-10869-2023, 2023.
Yoo, J. H., Chun, H. Y., and Song, I. S.: In situ generation of planetary waves in the mesosphere by zonally asymmetric gravity wave drag: A revisit, J. Atmos. Sci., 81, 1617–1639, https://doi.org/10.1175/JAS-D-24-0026.1, 2024.