the Creative Commons Attribution 4.0 License.
the Creative Commons Attribution 4.0 License.
 | 22 Oct 2025
Assessing BC and CO emissions from China using EMeRGe aircraft observations and WRF/CMAQ modelling
Phuc Thi Minh Ha
Yugo Kanaya
Kazuyo Yamaji
Syuichi Itahashi
Satoru Chatani
Takashi Sekiya
Maria Dolores Andrés Hernández
John Philip Burrows
Hans Schlager
Michael Lichtenstern
Mira Poehlker
Bruna Holanda
Accurate estimates of short-lived climate forcer emissions are essential for effective climate change mitigation, yet large uncertainties remain across Asia. This study integrates the Weather Research and Forecasting/Community Multiscale Air Quality version 5.0.2 (WRF/CMAQv5.0.2) simulations with Effect of Megacities on the Transport and Transformation of Pollutants at Regional and Global Scales (EMeRGe) airborne observations from spring 2018 to refine combustion-related emissions of black carbon (BC) and CO over East Asia. Aircraft observations, which are less affected by near-surface processes, confirmed the accuracy of the Global Fire Emissions Database (GFEDv4.1s) inventory near Thailand. In contrast, anthropogenic BC and CO from the Regional Emission Inventory for Asia (REASv2.1) in the Philippines showed negative biases. For Chinese air masses, the Hemispheric Transport of Air Pollution with corrections (HTAPv2.2z) resulted in overestimation for BC and underestimation for CO, agreeing with our prior ground-based findings on Fukue Island. Scaling Chinese BC emissions using an observation/model ratio (0.48 ± 0.13) gave our best estimate of 0.65 ± 0.25 Tg BC yr−1. Chinese emissions were further estimated at 166 ± 65 Tg CO yr−1 and 12.4 ± 4.8 Pg CO2 yr−1 using the and ratios from observations. These results suggest HTAPv2.2z requires revisions of 50 % downward for BC and 20 % upward for CO, particularly over central East China during spring. Other inventories including Community Emissions Data System (CEDSv2021_02_05) remain notably biased, while Evaluating the Climate and Air Quality Impacts of Short-Lived Pollutants (ECLIPSEv6b) and Tropospheric Chemistry Reanalysis (TCR2) estimates fall within our identified uncertainty ranges.
- Article
(9657 KB) - Full-text XML
-
Supplement
(1876 KB) - BibTeX
- EndNote


Short-lived climate forcers (SLCFs) are atmospheric gases or particles that persist for days to months, with some lasting up to two decades. Similar to long-lived greenhouse gases, SLCFs alter the energy balance of the Earth, making their mitigation crucial for addressing human-induced climate change (Myhre et al., 2013; Szopa et al., 2021; IPCC AR6 WG1 Ch6). Carbon monoxide (CO) remains in the atmosphere for 1–4 months and indirectly contributes to warming by removing hydroxyl radicals (OH), which is the dominant oxidizing agent for methane (CH4) oxidation. CO also facilitates ozone (O3) formation in the presence of sufficient nitrogen oxides ().
Black carbon (BC) is primarily released through the incomplete combustion of carbon-based fuels in boilers, cooking stoves, and heating stoves that use raw coal. BC drives radiative heating by absorbing sunlight and altering snow and ice albedo, thereby intensifying climate forcing. As nanometre-sized particles, BC poses severe health risks in megacities (Shindell et al., 2012; WHO, 2021).
A deeper understanding of SLCFs is essential for devising strategies to reduce air pollution, limit human-made climate change, and support sustainable development (Szopa et al., 2021). However, the complexity of SLCFs and their interactions with physical and chemical atmospheric processes poses significant challenges.
Incomplete combustion from human activities results in significant BC and CO emissions. Since Asia accounts for more than 50 % of global BC and CO emissions (Hoesly et al., 2018; Szopa et al., 2021), getting precise emission data in this part of the world is essential. However, both emission estimates and our understanding of BC and CO sources need improvement (Kurokawa et al., 2013). The changes in national SLCF emissions due to the potentially uneven adoption of emission reduction techniques across fast-growing Asian economies over the past two decades are not well understood (Chen and Chen, 2019; Kanaya et al., 2020; Ikeda et al., 2023; Zhang et al., 2022). Moreover, biomass burning in Southeast Asia has become the primary source of carbon emissions from forest fires in spring (Reid et al., 2013; Heald et al., 2003; Palmer et al., 2006; Johnston et al., 2012), driven by the regional reliance on biomass for residential and agricultural purposes. Fires result from both lightning strikes and human activities.
Assessments of combustion-related BC and CO emissions benefit from airborne measurements. Compared to ground-based measurements, aircraft observations are less affected by local emissions and near-surface processes. The EMeRGe airborne campaign, conducted over East Asia on the High Altitude and Long range (HALO) aircraft in March and April 2018 (Andrés Hernández et al., 2022), captured pollution outflows that offer valuable input for such emission assessments. The EMeRGe aircraft campaign contributed to the evaluation of the Chemical Atmospheric General Circulation Model for the Study of Atmospheric Environment and Radiative Forcing (CHASER) v4.0, revealing large negative biases in daytime HONO concentrations over East Asian coastal regions (Ha et al., 2023). Comparisons of Asian and European outflows revealed underestimation of BC and CO outflows from the Manila plume in the Philippines, as well as overestimation of the ratio for overall Asia (4.1 ) in multi-model simulations (Deroubaix et al., 2024a, b). However, detailed region-specific emissions have not been explored. The captured pollution plumes from the EMeRGe campaign with a typical travel time of less than 5 d from the source enable the careful selection of air masses unaffected by precipitation and provide information about emissions of the airborne observed species including CO2. Estimations of the emissions from urban areas in Asia can then be compared with previous studies (Suntharalingam et al., 2004; Tohjima et al., 2010; Wada et al., 2011). These studies of outflows from Asia have highlighted the roles of deep convection (Folkins et al., 1997), middle-latitude cyclone cold fronts (Liu et al., 2003; Sawa et al., 2007), and orographic effects (Liu et al., 2003) in pollutant transport.
Bottom-up emission inventories for Asia, particularly China, have improved markedly in recent years, e.g. reducing the uncertainty range for BC emissions to ±208 % (Kurokawa et al., 2013; Lei et al., 2011; Li et al., 2017a; Lu et al., 2011; Zhao et al., 2011, 2013; Zhang et al., 2009; Zheng et al., 2018). Despite this progress, independent observational verification is still required to refine the uncertainty ranges further. Chinese CO2 emission uncertainties range from −10 % to +9 % across all sectors in 2010 (Zhao et al., 2013), 31 % for REAS v2.1 in 2010 (Kurokawa et al., 2013; Li et al., 2017b), and 19 % for REAS v3.2 in 2015 (Kurokawa and Ohara, 2020). Meanwhile, CO emissions in China exhibit an uncertainty range of ±86 % (Kurokawa et al., 2013; Li et al., 2017a, b; Zhang et al., 2009; Zhao et al., 2013; Zheng et al., 2018). Uncertainties in primary particle emissions, such as BC, are subject to more uncertain emission factors in residential fuel combustion than gaseous species (Bond et al., 2002; Zhao et al., 2013; Zhi et al., 2008). Bottom-up estimates often diverge from observation-based (top-down) estimates when local contexts are not adequately incorporated in a timely manner (Choi et al., 2020; Kanaya et al., 2020; Suntharalingam et al., 2004; Zhao et al., 2013). Therefore, emission inventories must be tested using independent observations to improve accuracy.
This study aims to improve the understanding of BC, CO, and CO2 emissions in Asia to refine regional emission inventories. The key objectives of this study are (1) to compare aircraft observations with model simulations for four key regions: fire emissions (including biomass burning) near the Gulf of Thailand (THL) and urban pollution in the Philippines (PHL), Japan (JPN), and China (CHN); (2) to evaluate residual ratios against emission ratios in inventories across distinct air masses using a multi-species analysis; and (3) to estimate CHN emissions of BC, CO, and CO2 using a combined model–observation framework integrating WRF/CMAQ and EMeRGe aircraft data. Previous studies (Choi et al., 2020; Kanaya et al., 2020; Zhao et al., 2013) evaluated the WRF/CMAQ performance at ground level, where transport/deposition uncertainties for near-ground levels may arise. Incorporating EMeRGe airborne BC and CO data improves confidence in prior ground-level assessments of the CHN case. Additionally, CO2 observation data, largely unaffected by vegetation interactions (i.e. CO2 uptake during photosynthesis and losses through respiration), enabled precise BC and CO emission factor calculations for combustion sources.
The text is structured as follows: Sect. 2 details the observational data, model configuration settings, and applied methods; Sect. 3.1 examines three polluted cases of THL, PHL, and JPN, focusing on comparisons of concentrations and emission ratios; Sect. 3.2 focuses on the CHN case and covers concentration comparisons, emission ratios, emission estimates, and an assessment of analysis uncertainties; and Sect. 4 summarizes the key findings and conclusions.
In the following, aircraft observation (Sect. 2.1), modelling system (Sect. 2.2), HYSPLITT backward trajectory model, and VIIRS active fire data (Sect. 2.3) are described. In Sect. 2.4 and 2.5, the methodology using residual ratios of co-emitted pollutants (, , and ) to identify emission sources and the introduction of a combined model–observation method are detailed. Additionally, the long-term, ground-based observations from Fukue Island (32.75° N, 128.68° E; Kanaya et al., 2020) are also used to support the analysis of CHN air masses.
2.1 Airborne observations in Asia during the EMeRGe campaign
The EMeRGe campaign (https://www.iup.uni-bremen.de/emerge/home/, last access: 30 May 2023; Andrés Hernández et al., 2022) conducted two field experiments: one over Europe in summer 2017 and another in East Asia during the inter-monsoon period in spring 2018. This study focuses on the data obtained during the Asia experiment, when peak biomass burning in Southeast Asia and continental outflow from China transported pollution to the observable regions. Measurements on board the German HALO aircraft, which is operated by the German Aerospace Center (Deutsches Zentrum für Luft- und Raumfahrt – DLR), covered a wide region from Taiwan north and southward. Pollution plumes from major population centres near Gulf of Thailand (THL case), Manila (Philippines) (PHL case), Osaka (Japan) (JPN case), and central East China (including Beijing, Hebei, Henan, Shanghai) (CHN case) were detected during flights E-AS-03 (12 March), E-AS-06 (20 March), E-AS-08 (24 March), E-AS-09 (26 March), E-AS-10 (28 March), and E-AS-13 (4 April). Flight altitudes during the measurements ranged from ground level to ∼12 km, with ranges around ∼0.3–2 km specifically evaluated for designated polluted areas.
This study analyses combustion-related SLCFs: BC, CO, and CO2. BC was measured using a single-particle soot photometer (SP2, Droplet Measurement Techniques, USA) (HALO-CNN by the Max Planck Institute for Chemistry in Mainz) (Holanda et al., 2020), with an uncertainty of ∼10 % according to Ohata et al. (2021). SP2 detects BC cores with mass-equivalent diameters of 70–500 nm by measuring time-dependent scattering and incandescence signals as particles cross a Gaussian-shaped laser beam (λ=1064 nm) (Schwarz et al., 2006). Avalanche photo-diode detectors capture scattering and incandescence at high/low gain across two wavelength ranges (350–800 nm and 630–880 nm). BC-containing particles absorb laser energy, heating to ∼4000 °C and emitting incandescence proportional to their mass, which is determined after applying a correction factor (Laborde et al., 2013). BC concentrations were normalized to standard temperature and pressure (STP, T0=273.15 K, p0=1013.25 hPa). The SP2 incandescence signal was calibrated using size-selected fullerene soot particles at the beginning, during, and end of the campaign (Holanda et al., 2020).
CO was measured by UV photometry (AMTEX, Institute of Atmospheric Physics, DLR), with a detection limit (3σ) of 5 ppb at 30 s resolution, precision 2 ppb or 1 %, and errors of 4 % (Gerbig et al., 1996). CO2 was measured using cavity ring-down spectroscopy (CATS by the Institute of Atmospheric Physics, DLR), with a total uncertainty of 0.14 ppm and accuracy better than 0.05 ppm (Chen et al., 2010).
Other atmospheric constituents, including ozone, its precursors, volatile organic compounds (VOCs, including oxygenated VOCs), and NOx, additionally measured on HALO (Andrés Hernández et al., 2022), were beyond the scope of this study. A custom merged dataset of 15 s averages (until flight E-AS-07) or 30 s averages (from flight E-AS-08 onward) was compiled.
2.2 WRF/CMAQ modelling system
The CMAQ modelling system version 5.0.2 (Byun and Schere, 2006) is suitable for accurately simulating regional concentrations of pollutant gases and particulates in Asia, including JPN. The model configuration is shown in Table 1 (Ikeda et al., 2014; Yamaji et al., 2020; Chatani et al., 2018, 2020). CMAQ was coupled with the Weather Research and Forecasting, Advanced Research Weather Research and Forecasting (WRF-ARW) model version 3.7.1 (Skamarock et al., 2008), nudged by the US National Centers for Environmental Prediction Final Operational Model Global Tropospheric Analyses (ds083.2) at a 1°×1° resolution (Gemmill et al., 2007). It was also supplemented with a real-time global sea surface temperature high-resolution analysis at a resolution.
Table 1Weather Research and Forecasting/Community Multiscale Air Quality (WRF/CMAQ) model configurations.
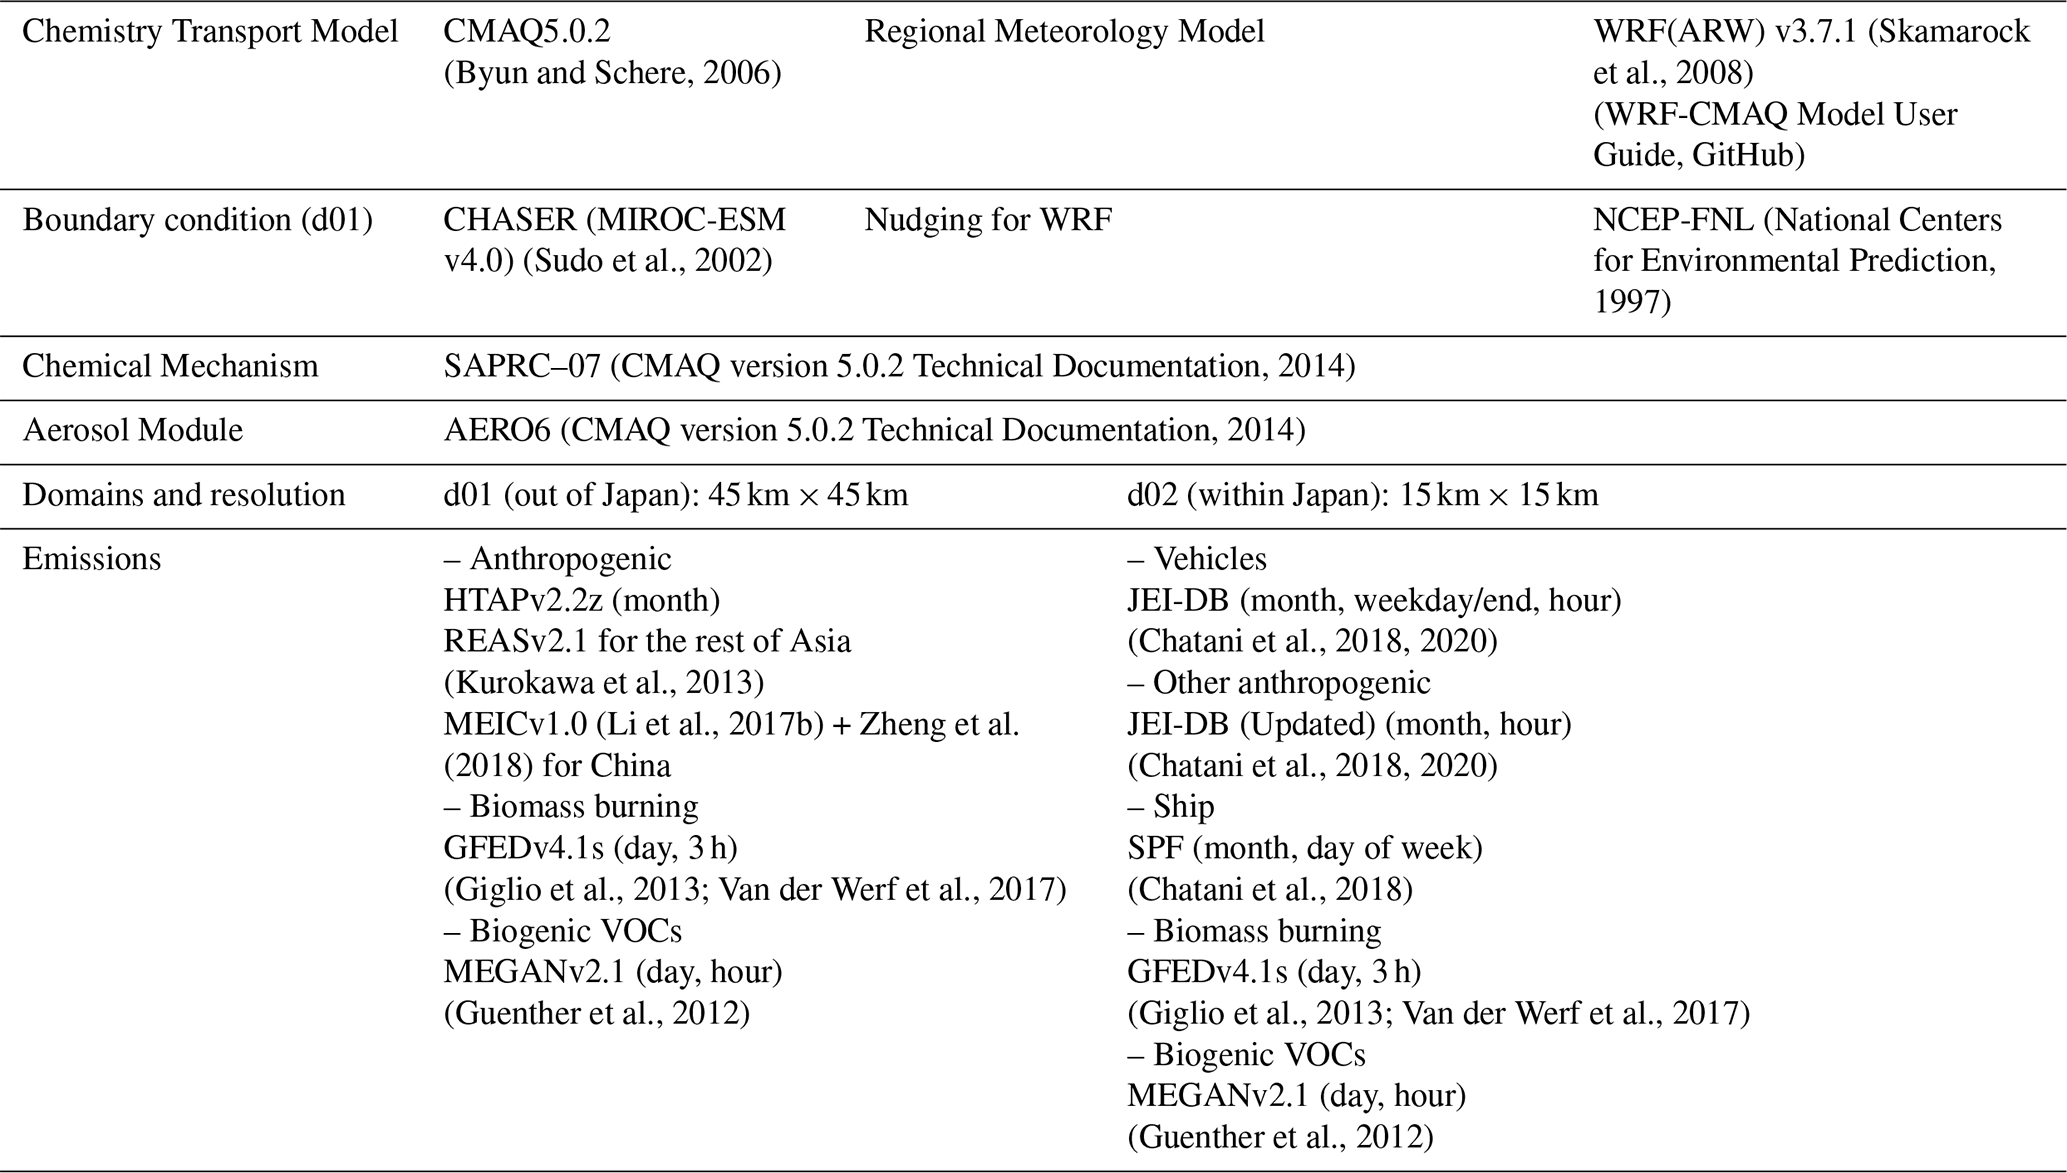
CHASER(MIROC-ESM) = Circulation Model for the Study of Atmospheric Environment and Radiative Forcing coupled with the Model for Interdisciplinary Research on Climate–Earth System Model, NCEP-FNL = US National Centers for Environmental Prediction Final, SAPRC-07 = Statewide Air Pollution Research Center model version 07, AERO6 = sixth-generation CMAQ aerosol module, HTAP = Hemispheric Transport of Air Pollution emission inventory, JEI-DB = Japan Clean Air Program and Japan Auto-Oil Program emission inventory database module, REAS = Regional Emission Inventory for Asia, MEIC = Multi-resolution Emission Inventory for China, GFED = Global Fire Emissions Database, SPF = Sasakawa Peace Foundation, VOCs = volatile organic compounds, MEGAN = Model of Emissions of Gases and Aerosols from Nature, AeroCom = Aerosol Comparison between Observations and Models.
Two target nested domains in this campaign were considered: the following outer domain covering East Asia (d01; 45 km×45 km) and the inner domain covering JPN (d02; 15 km×15 km) (Fig. 1b). The model extends vertically through 27 layers to 50 hPa. Initial concentrations followed the default conditions of the Statewide Air Pollution Research Center model version 07 (SAPRC07) chemical category, for which spin-up calculations were performed for several months. Boundary concentrations were derived from CHASER simulation (Sudo et al., 2002) using the HTAPv2.2 emission inventory (Huang et al., 2017; Janssens-Maenhout et al., 2015). BC simulations were performed using the sixth-generation CMAQ aerosol module AERO6. In this module, BC concentration is unaffected by chemical or heterogeneous reactions, while coagulation alters particle size without affecting BC mass. Dry deposition loss has been shown to be negligible over a ∼3 d transport period (see Fig. 6, Kanaya et al., 2016).
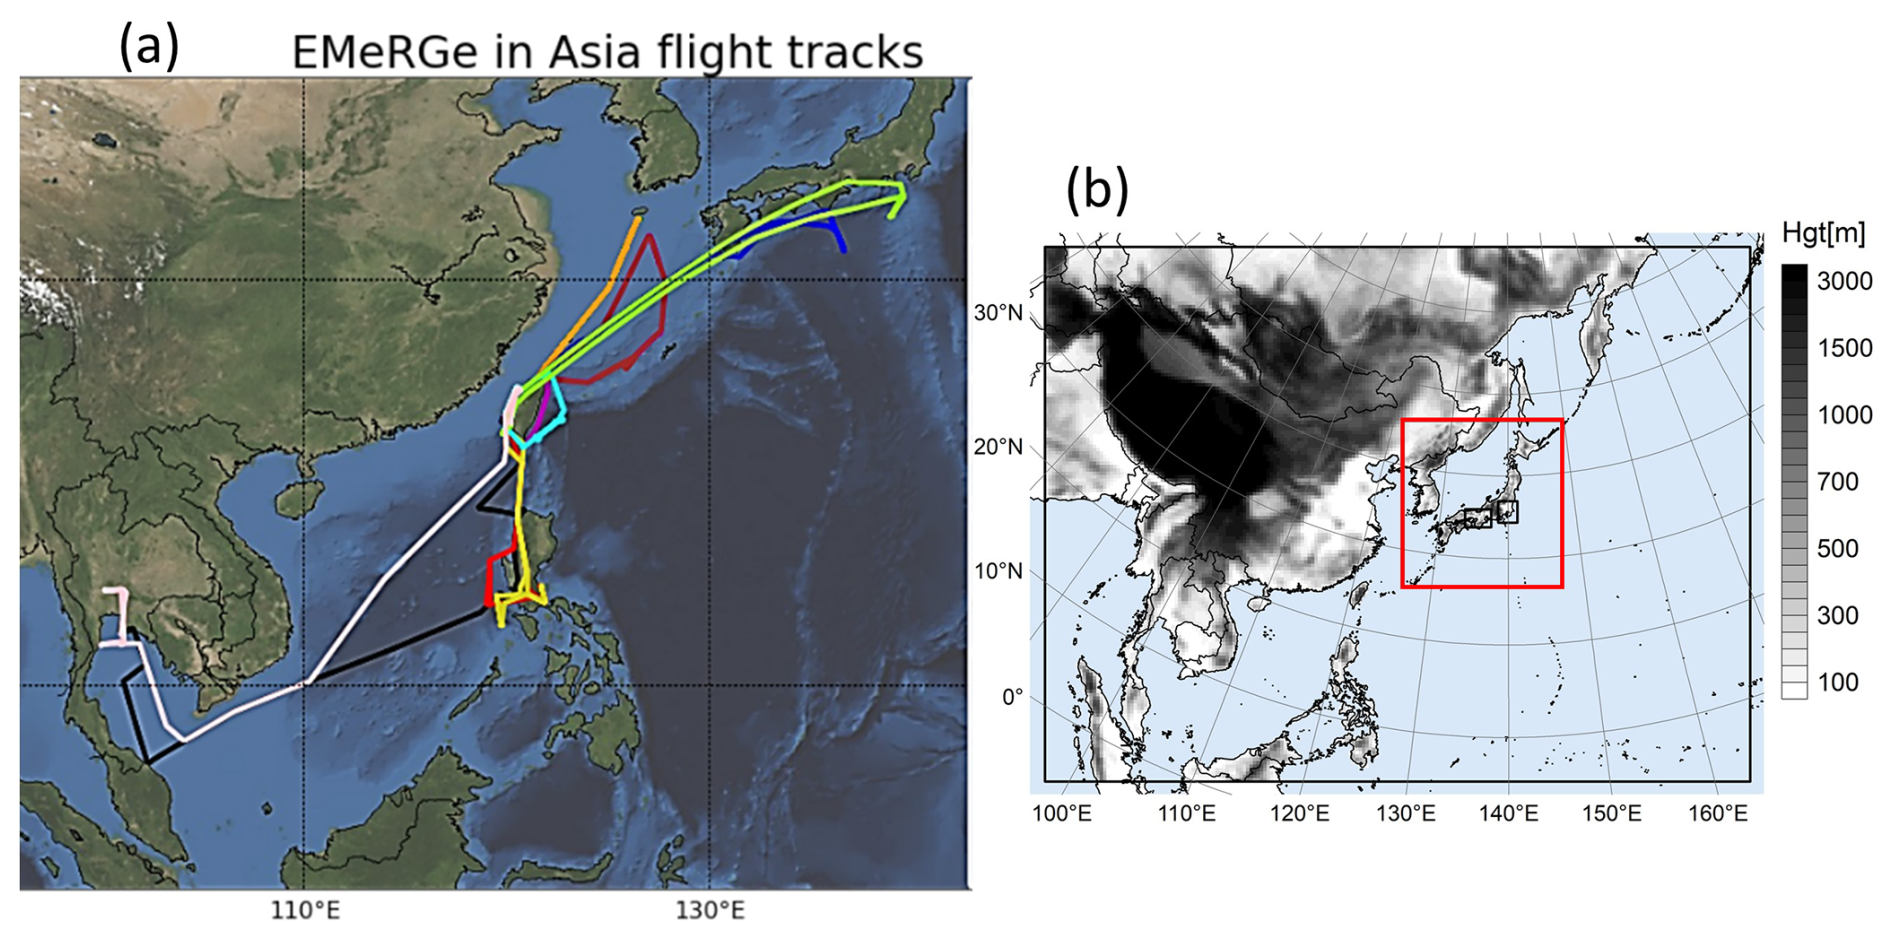
Figure 1(a) EMeRGe flight tracks across Asia, colour-coded by mission: E-AS-03 (black), E-AS-04 (purple), E-AS-05 (brown), E-AS-06 (red), E-AS-08 (orange) (overlapped with E-AS-09), E-AS-10 (yellow), E-AS-11 (blue), E-AS-12 (cyan), E-AS-13 (light green), E-AS-14 (white). (b) WRF/CMAQ model target domains: d01 (entire figure) and d02 (red box).
For domain d01 (East Asia, excluding JPN), monthly anthropogenic emissions were sourced from HTAPv2.2 with a reference year of 2010 unless otherwise stated. The HTAPv2.2 inventory integrated the mosaic Asian anthropogenic emission inventory MIX version 1.1, which couples the Multi-resolution Emission Inventory for China (MEICv1.0) developed by Tsinghua University (http://meicmodel.org.cn/, last access: 15 May 2023) (Li et al., 2017b), local emission inventories from Korea and India, and the REASv2.1 for the rest of Asia (Kurokawa et al., 2013). MEICv1.0 provides gridded month-to-month emissions at a 0.25° resolution for five sectors (http://meicmodel.org.cn/, last access: 15 May 2023). Sectoral annual emissions in the MEICv1.0 were multiplied by selected factors to represent recent changes in precursor emissions, as described by Zheng et al. (2018), to form the HTAPv2.2z inventory. Open biomass burning emissions were obtained from the GFEDv4.1s as 3-hourly data (Giglio et al., 2013; Van der Werf et al., 2017).
For domain d02 (JPN), anthropogenic emissions were taken from the updated Japan Clean Air Program and Japan Auto-Oil Program emission inventory database module (updated JEI-DB, Formulation Committee for PM2.5 Emission Inventory and Source Profile, 2019; Japan Petroleum Energy Center, 2017), except for vehicle emissions (2010). Ship emissions ( resolution) were provided by the Sasakawa Peace Foundation and were estimated from activities determined using an automatic identification system, with averaging performed on an hourly and daily basis. The JEI-DB and ship emissions data have advanced air quality modelling research in JPN (Chatani et al., 2018, 2023; Li et al., 2017b; Kurokawa et al., 2013; Shibata and Morikawa, 2021). Biogenic VOC emissions were derived from the Model of Emissions of Gases and Aerosols from Nature (MEGANv2.1) for both domains as hourly data (Guenther et al., 2012). The d01 simulation period covered 3 years (2016–2018).
Over the less than 5 d of transport, CO, CO2, and BC are, to first approximation, inert. CO undergoes slow oxidation with OH, given its several-week atmospheric lifetime. As a stable gas, CO2 is highly inert, particularly when transported at high altitudes without vegetation contact, and deposition is negligible. Although BC can be influenced by wet deposition, precipitation was minimal during the study periods (Sect. 2.3). While the model wet deposition scheme may require testing and refinement, its impact on this analysis is minimal. VOCs, including biogenic, undergo NOx-driven photochemical oxidation forming O3 and secondary organic aerosol (SOA), potentially accelerating BC ageing, but this effect was minor due to strong emission sources and negligible wet deposition. Although biogenic VOC oxidation produces CO, this contribution was minor given that the plumes analysed originated from metropolitan areas. In this study, model uncertainties in the aircraft observation range will be demonstrated in Sect. 3.2.4.
2.3 Backward trajectories and active fire data
We performed backward trajectory analyses using the US National Oceanic and Atmospheric Association Hybrid Single Particle Lagrangian Integrated Trajectory (HYSPLIT) 4 model (Draxler et al., 2018; Stein et al., 2015) to identify pollutant emission sources. HYSPLIT is an extensive system for computing simple air parcel trajectories (https://www.arl.noaa.gov/hysplit/, last access: 30 May 2023). Back trajectories for the investigated flight segments were traced for 120 h (5 d) from individual three-dimensional locations with a resolution of 15–30 s, which matched the averaging steps of the aircraft data. A 120 h range is generally employed for back-trajectory analyses in long-range transport studies, capturing key atmospheric transport dynamics, and ensures source coverage for studied events (travelling time to the aircraft was estimated to be 40–120 h from CHN, 0–10 h (E-AS-03 S2) and 0–24 h (E-AS-06 and E-AS-10) from Manila (PHL), 10–120 h from the broad fire region near THL, 0–36 h from JPN) with an extra margin to identify additional influences. This approach agrees with prior studies (Choi et al., 2020; Kanaya et al., 2016, 2020; Miyakawa et al., 2017; Zhu et al., 2019). The meteorological field used in HYSPLIT was the Global Data Assimilation System at 1°×1° resolution.
Active fire data were incorporated to validate emission types and back-trajectory results. Near-real-time hotspot data were obtained from the US NASA Fire Information for Resource Management System (NASA FIRMS; https://firms.modaps.eosdis.nasa.gov/map/, last access: 30 May 2023) via the Visible Infrared Imaging Radiometer Suite (VIIRS) sensors aboard the Suomi National Polar-orbiting Partnership and US National Oceanic and Atmospheric Association 20 satellites (bright_ti5).
Since the flights were conducted away from rain events, the accumulated precipitation along the trajectories (APT), derived from HYSPLIT rainfall data, helps exclude data significantly affected by wet removal. A detailed analysis of APT was conducted, applying the APT criterion during their travel time to the aircraft for the air masses from CHN, THL (APT 72 h<1 mm), PHL E-AS-06 and E-AS-10 (APT 24 h=0 mm), PHL E-AS-03 S2 (APT 10 h=0 mm), and JPN (APT 36 h=0 mm). The APT 72 h<1 mm criterion showed minimal influence of wet deposition on the emission–concentration relationship (Kanaya et al., 2016, 2020), while the APT=0 mm criterion excludes the effects of rain entirely. Compared to the full dataset, the APT-based analysis reduced data availability in all cases except PHL E-AS-03 S2 and JPN (Table S6 in the Supplement). In CHN and PHL E-AS-06, statistical metrics changed only marginally (Table S7). For PHL E-AS-10, great data loss affected the statistical metrics, though residual ratios remained largely stable. In the THL case, a decline in the observed ratio was noted (Sect. 3.1.1). The full dataset was retained for the main analysis.
Moreover, the measured relative humidity remained below 100 % and observed and simulated water concentrations showed strong correlations (Fig. S1 in the Supplement). In addition, we carefully discuss deposition, dilution, convection effects, as well as the representativeness of the air masses, in Sect. 2.5 and for each case in Sect. 3.
2.4 Residual ratios for co-emitted pollutants
The EMeRGe-Asia campaign successfully collected pollution samples across CHN, JPN, PHL, and near THL, assessing spatiotemporal pollutant transport within the planetary boundary layer and determining residual ratios. These ratios () between co-emitted pollutants, target species X, and tracer species Y are derived from enhancements (Δ) above baseline concentrations. In this study, the residual ratios were obtained from regression slopes fitted to concentration scatter plots (, , and ) for each polluted case, similar to previous aircraft-based studies (e.g. Takegawa et al., 2004; Tang et al., 2018). These residual ratios from rain-free transport cases can be used to identify emission sources and changes in combustion technology (Choi et al., 2020; Kanaya et al., 2020, 2021).
Because CO2 is a major product of combustion processes, it serves as an ideal reference gas for tracking fresh and aged anthropogenic plumes, although biogenic interactions complicate source attribution (Takegawa et al., 2004). CO and CO2 ratios have been used to assess incomplete combustion in developing and developed countries (Chandra et al., 2016; Palmer et al., 2006; Suntharalingam et al., 2004; Takegawa et al., 2004; Tang et al., 2018; Wang et al., 2010). BC and CO are byproducts of incomplete combustion of carbon-based fuels and serve as valuable indicators for characterizing emission sources and validating BC estimates in bottom-up inventories (Choi et al., 2020; Guo et al., 2017; Zhu et al., 2019; Kondo et al., 2006, 2011). , , and emission ratios differ among combustion sources, techniques, and environmental influences (related to biogenic CO2 sinks). Depending on fire type, ratios vary widely (1.7–29.8 ), while ranges from 1.5 %–22.2 % (Akagi et al., 2011; Chi et al., 2013; Cristofanelli et al., 2013; Kondo et al., 2011). ratios from CHN anthropogenic sources span 1.8–7.9 (ground/ship-based: Choi et al., 2020; Guo et al., 2017; Kanaya et al., 2020), while ranges 28–60 ppb ppm−1 (airborne: Takegawa et al., 2004; Tang et al., 2018; Suntharalingam et al., 2004). Emission inventories have reported from 15.5 ppb ppm−1 (Emissions Database for Global Atmospheric Research inventory – EDGARv6.1) to 23.2 ppb ppm−1 (CEDS v_2021_02_05).
Residual ratios in the polluted cases were slightly influenced by wet deposition, as shown by the APT analysis (Sect. 2.3). The exception was the THL case, though this resulted from air mass selection rather than the APT criterion (Sect. 3.1.1). In the CHN case, residual ratios remained consistent even under stricter APT criteria at 72 h (Sect. 3.2.2). In this study, observed and simulated residual ratios are compared to access model performance against aircraft measurements and to evaluate emission ratios in frequently used inventories for potential improvement (Sects. 3.1 and 3.2.2). Observed residual ratios enable the CO and CO2 retrieval from BC emission estimates (Sect. 3.2.3). Residual ratios in plumes must be interpreted with caution when assessing long-range transport, convective transport to the lower stratosphere, or interactions with different ecosystems, as noted by Yokelson et al. (2013).
2.5 Combined model–observation approach for estimating Chinese emissions
A combined model–observation approach was used to estimate emission correction factors for pollutants in the HTAPv2.2z inventory used in the CMAQ model (E(x)HTAPv2.2z or E(x) for short, where x is BC or CO). This was achieved by calculating observed-to-modelled concentration ratios by dividing the mean observed value by the mean simulated value for plumes.
As wet deposition and dry deposition during the transport from CHN have been analysed and found negligible (Kanaya et al., 2016, 2020), linear responses between emissions and concentrations were assumed for both observed and simulated BC and enhanced CO (from the baseline levels; ΔCO), which has been verified by Ikeda et al. (2022). The observation-to-model ratios derived from Eqs. (1) and (2) are discussed for each case (Sect. 3.1 and 3.2.1), most deeply in the emission estimate for CHN (Sect. 3.2.3). Similarly, emission estimates for BC, CO, and CO2 were achieved based on linear emission-to-enhanced-concentration relationships using correction factors (i.e. observation-to-model ratios derived from Eqs. 1 and 2), assuming the geographic distribution in HTAPv2.2z was accurate.
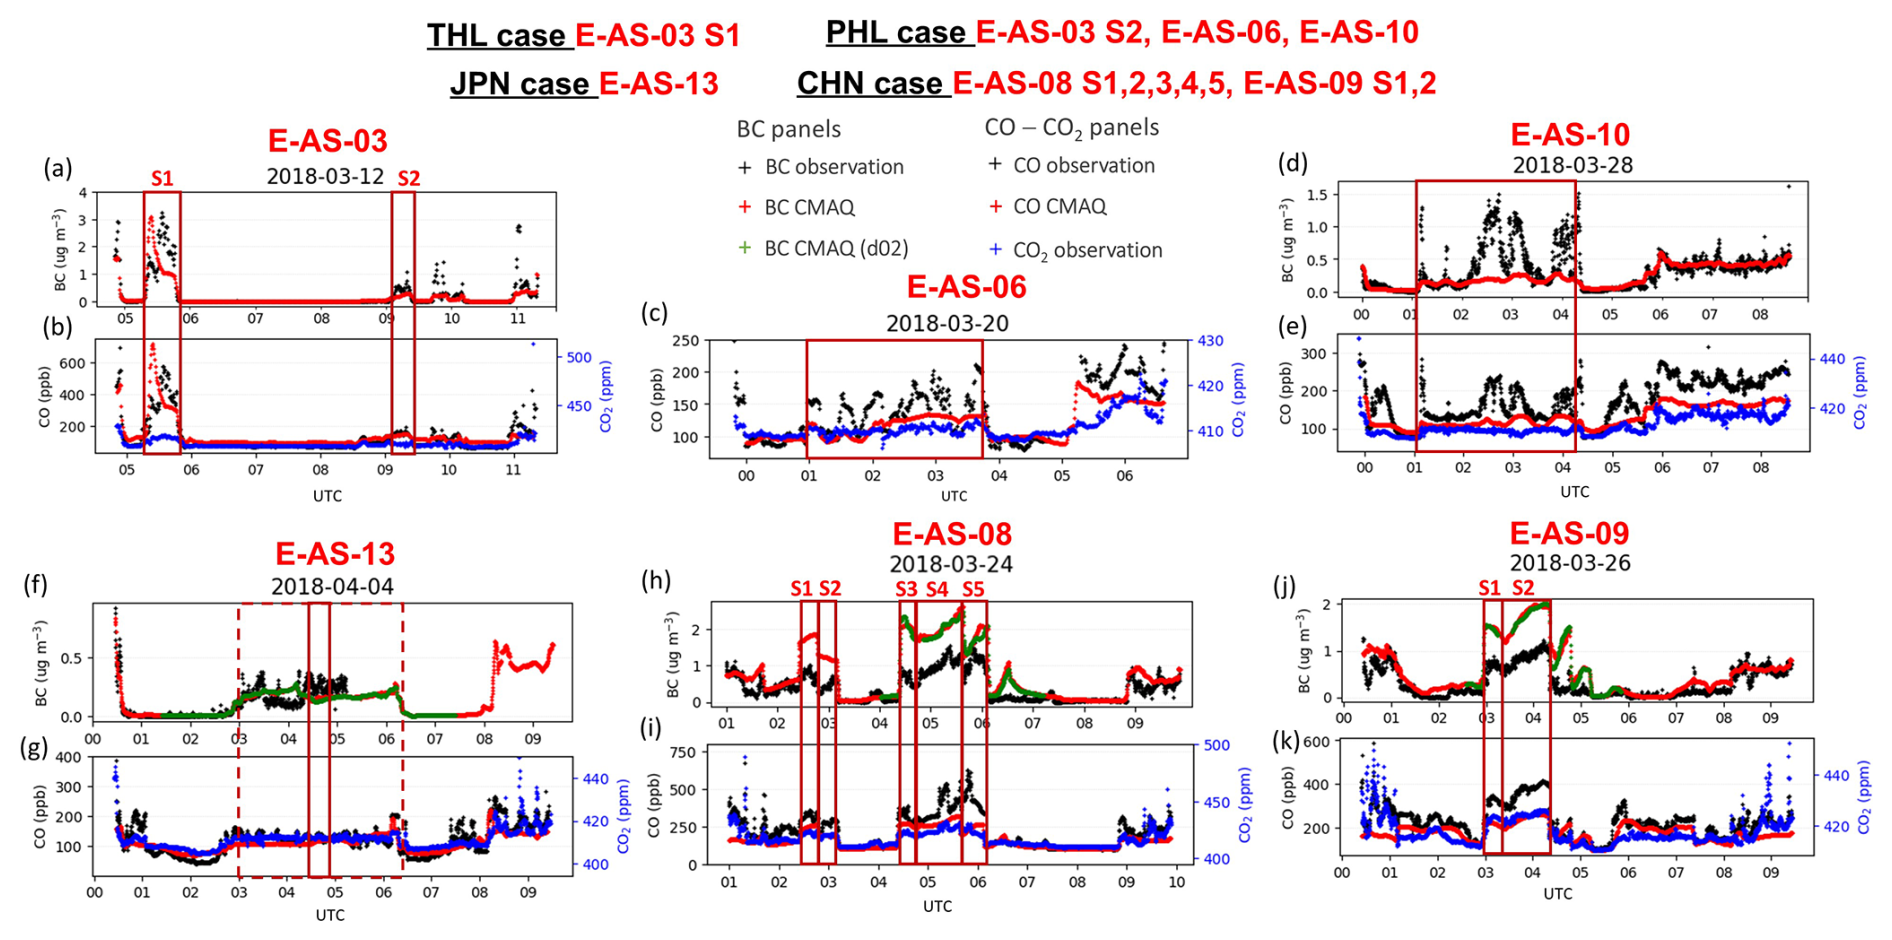
Figure 2Black carbon (BC), CO, and CO2 concentrations during selected EMeRGe flights. Polluted cases highlighted by red boxes include THL (E-AS-03 S1; a, b), PHL (E-AS-03 S2 in a, b; E-AS-06 in c; E-AS-10 in d, e), JPN (E-AS-13; f, g), and CHN (E-AS-08 S1–S5 in h, i; E-AS-09 S1, S2 in j, k). Observed BC and CO (black) are compared with CMAQ simulations from domain d01 (45 km×45 km, red) and domain d02 (15 km×15 km, green). Observed CO2 is shown in blue.
For enhanced concentrations, BC baseline concentrations were assumed to be zero, while nonzero CO baselines were considered (hence [ΔCO] was used in Eq. 2) (Kondo et al., 2011; Kanaya et al., 2016, 2020). Several methods are available for estimating CO baseline concentration (Matsui et al., 2011; Miyakawa et al., 2017; Oshima et al., 2012; Takegawa et al., 2004; Verma et al., 2011), including the 5th percentile of a 14 d moving dataset (Choi et al., 2020; Kanaya et al., 2020). However, this method is challenging for aircraft data due to rapid altitude and location variations. In this study, the baseline CO concentration was determined from the slope and intercept of the linear regression fitted to the scatter plots.
Estimated BC and CO emissions (Est(x)) were derived by multiplying E(BC) and E(CO), respectively, by the total CHN emission value from the HTAPv2.2z inventory (Eq. 3). Given the uniformity of emission structures across China, as evidenced by long-term ground-based observations capturing various air masses from CHN (e.g. Kanaya et al., 2020, 2021), applying the correction factor to the entire region of CHN is a reasonable approach. Estimated emissions of other pollutants (Est∗(x)) were translated from BC and CO estimates using observed residual ratios of and (Sect. 2.4) (Eqs. 4–6).
In the CHN case, the air mass footprint spans two major emission regions – north- and south-central East China (NS-CEC; Fig. S7) – covering complex anthropogenic sources. Chinese emissions were well-mixed before reaching the aircraft, as sector-specific sources exhibited largely spatial and temporal overlap in emission inventories. To ensure a nationally representative estimate by mitigating local transport and source biases, we used the averaged observed residual ratios and correction factors applied to inventory-prescribed national emissions. To minimize discrepancies in measured by aircraft, we applied the spring-averaged 2018 ratio obtained from Fukue Island to Eqs. (4) and (5). This long-term surface observation, ongoing since 2009, frequently captures air masses from CHN, including those during the EMeRGe campaign (Kanaya et al., 2020).
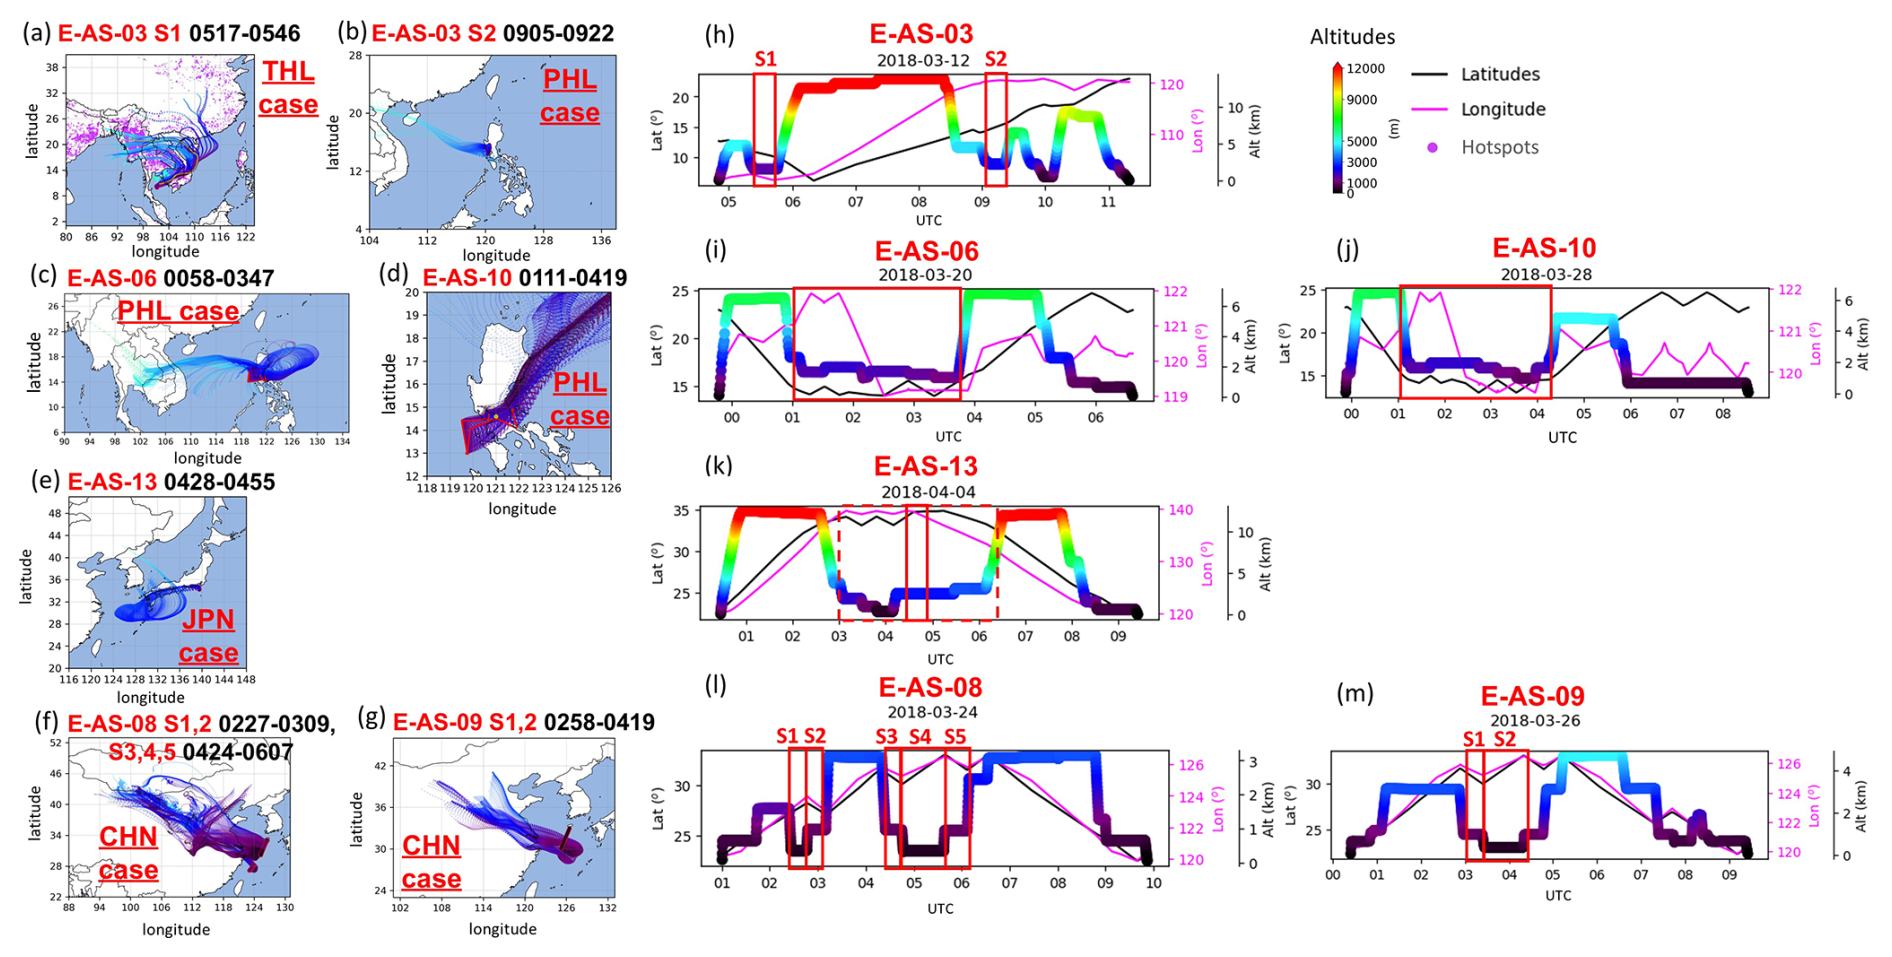
Figure 3120 h back trajectories (a–g) and flight coordinates (h–m) highlighting selected polluted cases. Trajectory altitudes in (a)–(g) are colour-coded using the top-right bar. In (a), magenta dots mark VIIRS hotspots (760 m2 fires; dot size for visibility). Panels (h)–(m) show latitudes (black, left axis), longitudes (magenta, right axis), and altitudes (colour-coded, second right axis; colour-scaled at top right). Red boxes highlight selected cases.
The data analysis comprises (1) comparison of observational and model datasets, (2) assessment of emission ratios, and (3) combination of model and observations to estimate emissions. The following subsections will discuss the results of four pollution events by region (THL, PHL, JPN, and CHN). The corresponding figures and tables, however, are organized by analysis objectives: (1) Figs. 2–4 and Table 2, (2) Figs. 5 and 6, and (3) Figs. 7–9 and Table S2.
3.1 Fire emission near THL and anthropogenic emissions from PHL and JPN
3.1.1 THL case study: fire emissions from fresh flaming fires in the GFEDv4.1s inventory
The pollutant peak for the THL case during flight E-AS-03 S1 (12 March 2018, 05:17–05:46 UTC) was caused by emissions from fires (Figs. 2a and b, 3a). The HYSPLIT model indicated that the sources were in Cambodia, Vietnam, and Myanmar, with 9116 fire hotspots on 11 March identified using the VIIRS. The highest concentrations at an altitude of 1.5 km were 3.26 µg m−3 for BC (mean 1.63 µg m−3, σ 0.80 µg m−3), 580 ppbv for CO (mean 374 ppbv, σ 106 ppbv), and 420 ppm for CO2 (Fig. 2a and b). The model predicted similar maximum BC of 3.11 µg m−3 (mean 1.40 µg m−3, σ 0.76 µg m−3) and CO of 722 ppbv (mean 398 ppbv, σ 147 ppbv) during the flight, though peaks occurred 10 min earlier than observed, likely due to spatial and temporal limitations in model inputs and outputs. While maximum and mean concentrations agreed, correlation coefficients were affected by timing discrepancies (Table 2, Fig. 4a and b). The agreement for THL suggests the GFEDv4.1s inventory is suitable for fire emissions in Southeast Asia, as it incorporates small fires with increased carbon and CO emissions, which is not included in GFEDv4.0 (Van der Werf et al., 2017).
Table 2Statistical summary of observed (Obs.) and simulated (Mod.) BC and CO concentrations for THL (Thailand), PHL (the Philippines), JPN (Japan), and CHN (China), including correlation coefficient (R), data count (N), p values, maximum (Max.), mean, and standard deviation (σ).
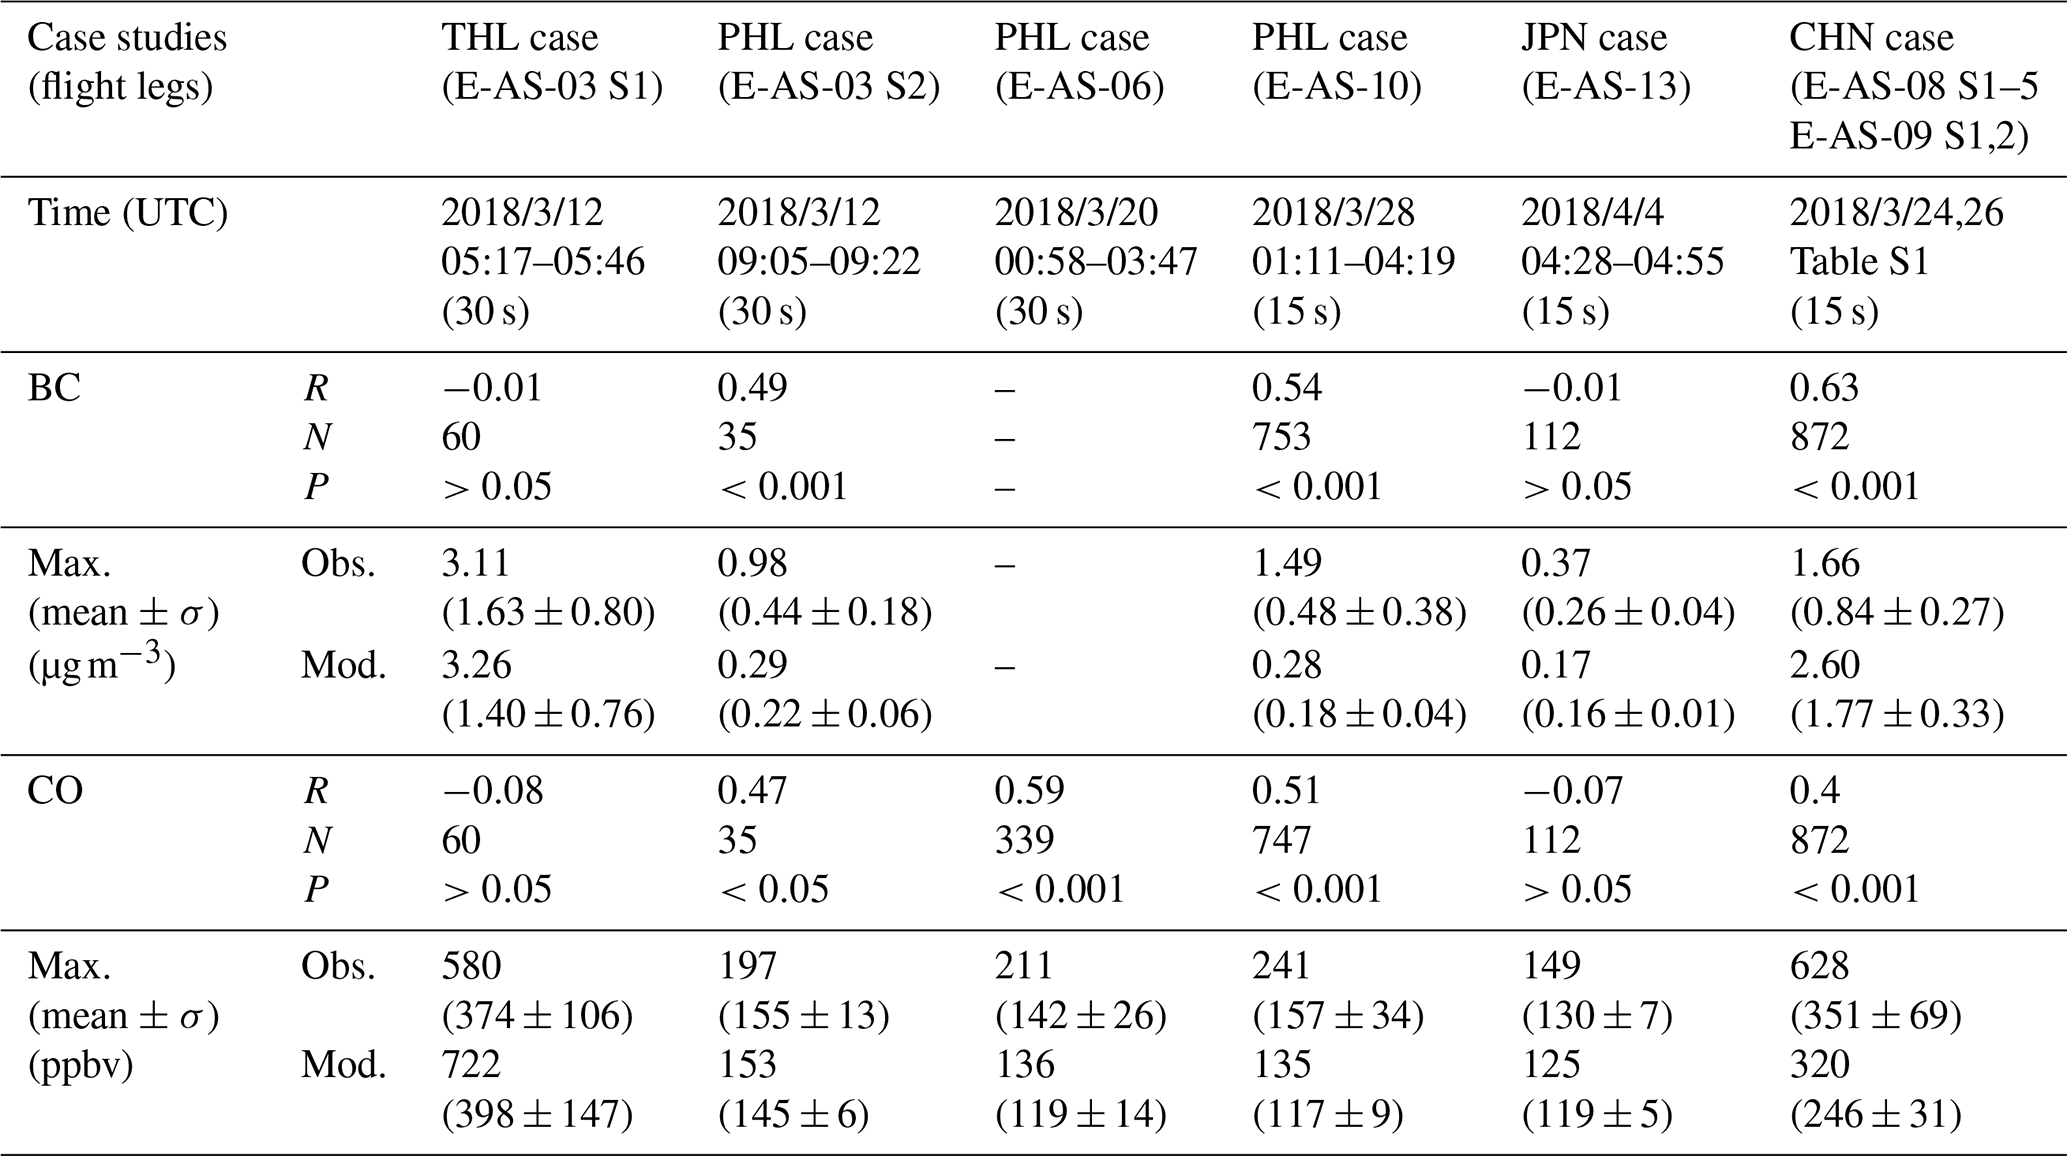
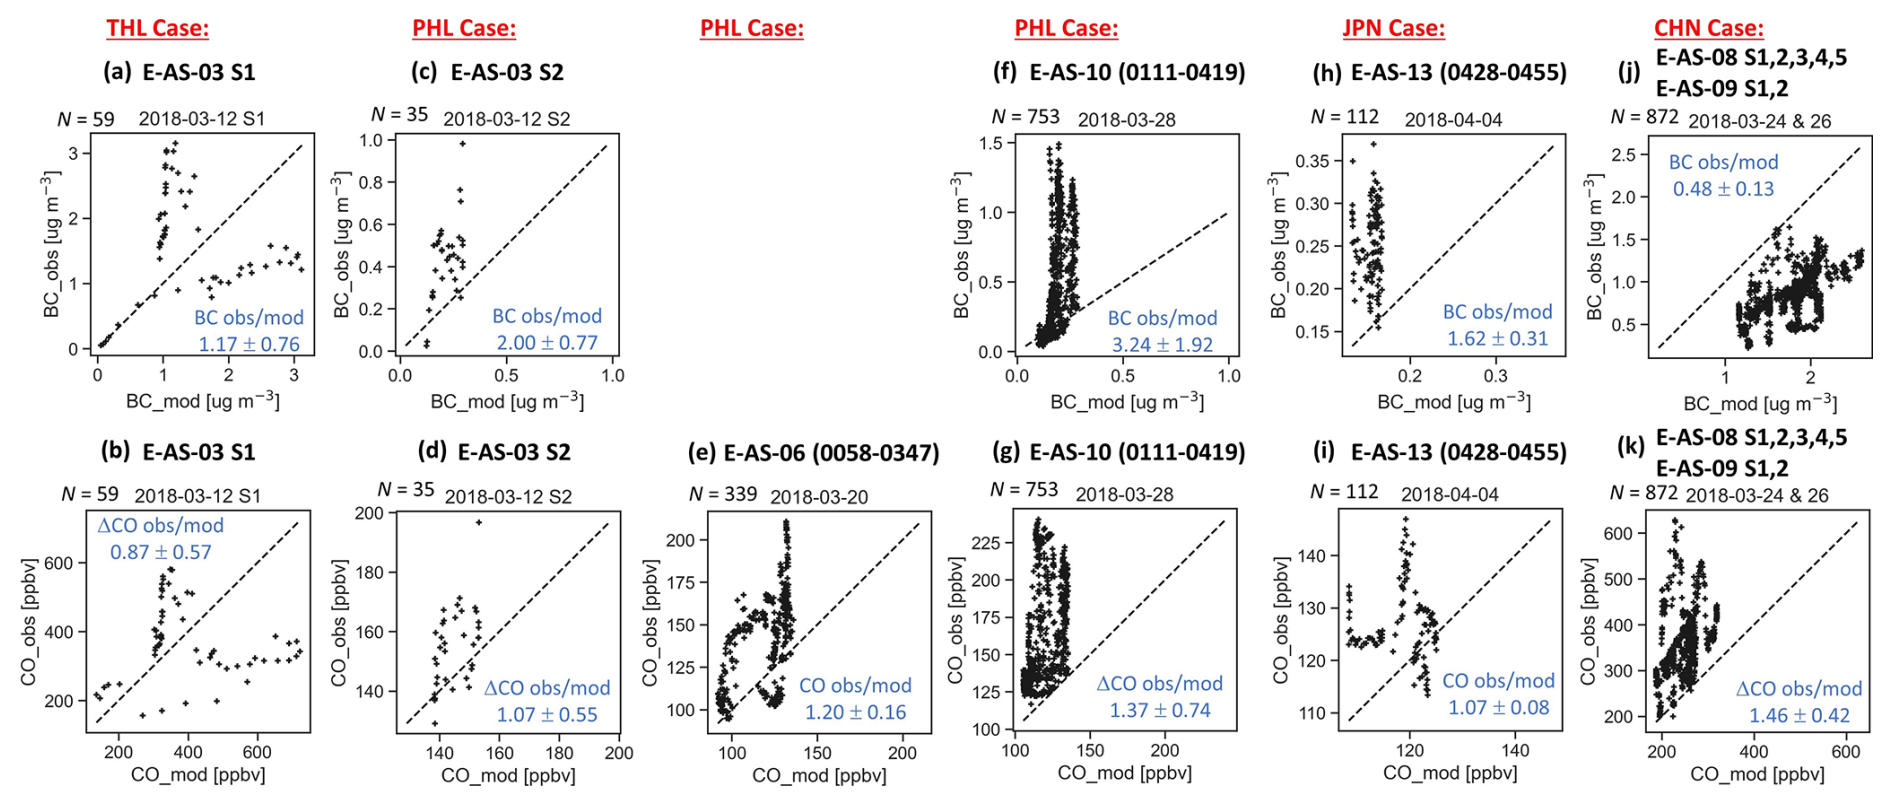
Figure 4Observed vs. simulated black carbon (BC; upper panels a, c, f, h, j) and CO (lower panels b, d, e, g, i, k) concentrations. Dashed black lines indicate 1:1 agreement. Observation/model ratios for BC and ΔCO (Eqs. 1 and 2) and standard errors are shown in blue text. N denotes data counts. For (e) and (i), CO ratios are used in place of ΔCO due to unavailable baseline CO. Standard errors are based on full data unless invalid, including (a, b) E-AS-03 S1 (2 min averages), (e) E-AS-06 (5 min averages), and (f, g) E-AS-10 (filtered with APT 72 h≤1 mm). Obs. = observed; Mod. = simulated. Reduced model variability relative to observations in PHL, JPN, and CHN likely stemmed from coarse model resolution (∼0.5° vs. ∼0.01° per 15 s), limited temporal resolution in HTAPv2.2z (CHN) and REASv2.1 (PHL), atmospheric mixing limitations which might reduce spatial contrasts near emission hotspots (PHL), and meteorological mismatches affecting air masses detection (JPN).
In the THL case, fire emission resulted in maxima of 7.1 ± 0.3 for , 39.5 ± 4.1 ppb ppm−1 (∼4 %) for , and 281 ± 33 for , with strong correlations (, , and , p values<0.0001) (Fig. 5a–c), indicating a common source for these species. The CMAQ model showed a comparable ratio (5.20 ± 0.04 ) with . The simulated ratio was slightly lower than the observed one, corresponding to higher CO concentrations modelled (Fig. 2b). However, the spatial mean emission ratio in the model for the THL domain (13–18° N, 100–113° E, sparsely dashed box in Fig. S5) was 8.2 across CMAQ sectors and 7.3 using GFEDv4.1s, which agreed more with observations. Moreover, the APT analysis (Sect. 2.3) excluded long-range transport from Myanmar and southern China via the East Ocean while retaining more regional air masses from Cambodia, Thailand, and southern Laos (Fig. S5e and f). This lowered the observed ratio to 5.21 ± 0.68 (Table S7), agreeing more closely with modelled values. Although observed BC, CO, and CO2 concentrations decreased under this criterion, simulated values remained unchanged, suggesting that air mass selection rather than APT threshold accounts for the improved model–observation agreement.
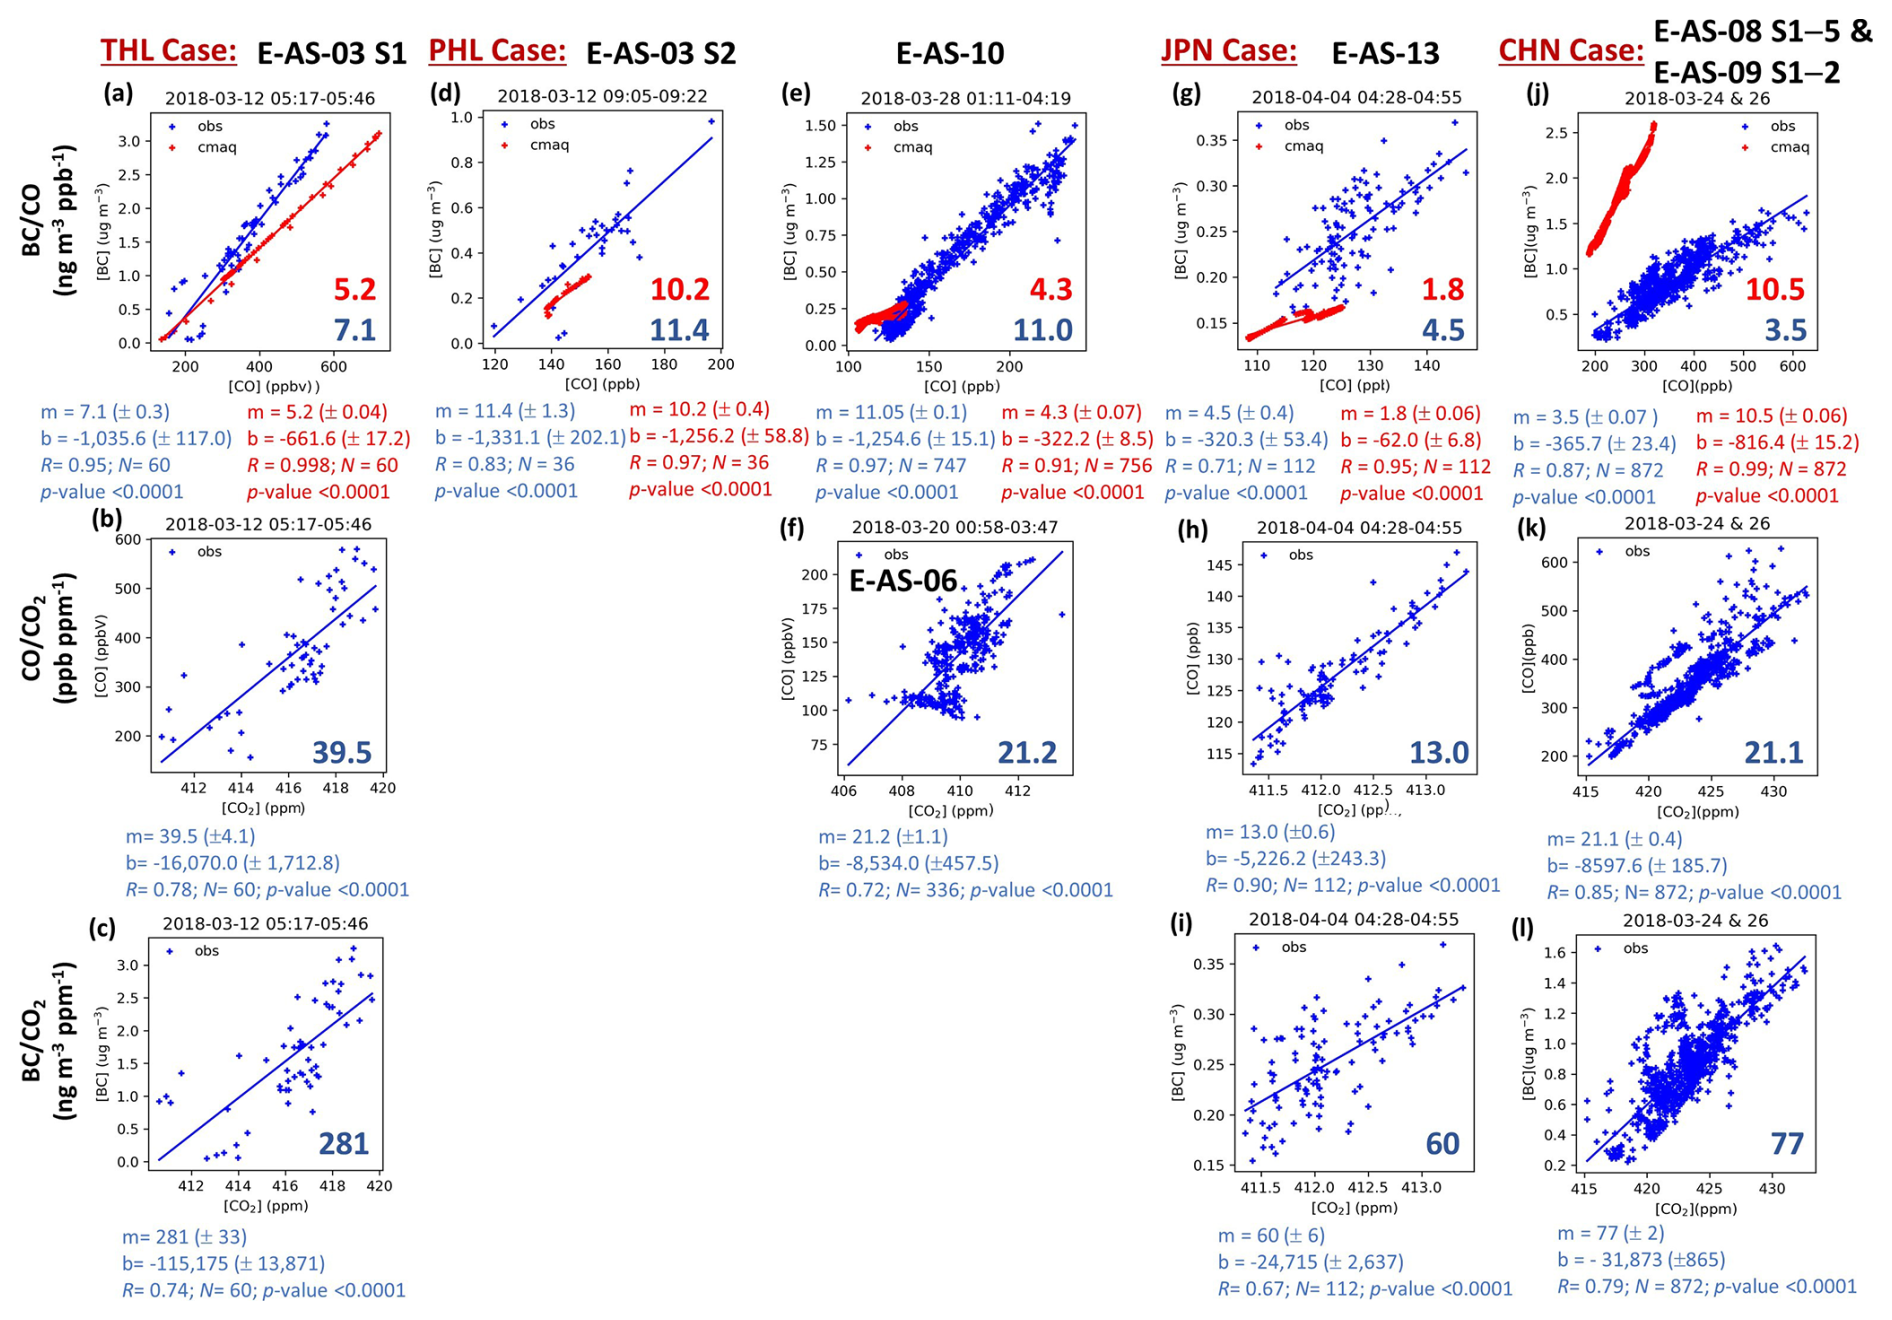
Figure 5Residual , , and ratios, expressed as regression slopes, for (a–c) Thailand (THL), (d–f) the Philippines (PHL), (g–i) Japan (JPN), and (j–l) China (CHN). Blue (observed) and red (simulated) lines show linear fits for regression slopes (m), intercepts (b), correlation coefficients (R), data counts (N), and p values. CMAQ simulations are shown only for .
The emission ratio from the aircraft-based measurements (7.1 ± 0.3 ) closely matches previous studies, including emission factor databases (Akagi et al., 2011), WRF-Chem (FINNv1.5) simulations (Lee et al., 2018), airborne observations (Kondo et al., 2011; Warneke et al., 2009), and ground-based biomass burning studies (Zhu et al., 2019) (Table S5). High and low ratios have also been found in earlier studies (Chi et al., 2013, Cristofanelli et al., 2013; Kondo et al., 2011; Paris et al., 2009; Vasileva et al., 2017; Warneke et al., 2009), with Asia showing higher values than North America due to increased modified combustion efficiencies, inversely proportional to ratios during the flame phase (Kondo et al., 2011). ratios tend to be lower and ratios tend to be higher in the smouldering phase (higher CO emissions), whereas BC and CO2 emissions rise in the flame phase (Laursen et al., 1992; Ward et al., 1992; Nance et al., 1993; Le Canut et al., 1996; Yokelson et al., 1999; Goode et al., 2000). However, ranges vary by fire type and may not be explicit from observations (Table S5). The ratios in aircraft-based measurements and the low ratio for fires (∼4 %), even with changes in the APT analysis (Table S7), indicate that the THL fires were dominated by very fresh Asian spring savanna flaming fires, consistent with the GFEDv4.1s classification (Andela et al., 2019; Van der Werf et al., 2017).
3.1.2 PHL case study: anthropogenic emissions in the REASv2.1 inventory
In the PHL case, maximum BC and CO concentrations of 1.51 µg m−3 and 241 ppbv, respectively, were found for flight E-AS-10 (01:11–04:19 UTC), while CO peaked at 211 ppbv for flight E-AS-06 (00:58–03:47 UTC), and maximum BC and CO concentrations of 0.98 µg m−3 and 197 ppbv, respectively, were found for flight E-AS-03 S2 (09:05–09:22 UTC) over PHL at ∼1–2 km altitude (S2 boxes in Fig. 2a and b, and red boxes in c–e). The primary BC and CO source was Manila (Fig. 3b–d). The BC and CO concentrations were lower than those in THL and CHN (Sects. 3.1.1 and 3.2.1). CMAQ simulations underestimated the observed maxima, with biases of −23 % to −30 % for BC (maxima of 0.25–0.29 µg m−3) and −5 % to −23 % for CO (maxima of 135–153 ppbv). The CMAQ BC underestimations agreed with simulations by CAMchem–CESM2.1 and WRFchem v4.3.3 (Deroubaix et al., 2024a), while the IFS-CAMS simulation better predicted the CO maxima (Deroubaix et al., 2024a), possibly due to its use of the CAMS-GLOB-ANTv4.2 inventory (Granier et al., 2019). In our study, correlation coefficients between observations and simulations were RBC=0.49–0.54 and RCO=0.51–0.59 (p values≤0.001), except for RCO_E-AS-03 (0.47; p values>0.001) (Table 2). Observation/model ratios (Eqs. 1 and 2) were 2.00 ± 0.77 and 3.24 ± 1.92 for BC and 1.07 ± 0.55, 1.20 ± 0.16, and 1.37 ± 0.74 for CO (Fig. 4c–g), indicating REASv2.1 underestimated BC more than CO emissions for PHL, likely due to underestimated residential sector emissions (contributing 76 % BC, 63 % CO). The lower concentration variability of the model (Fig. 4c–g) most probably resulted from the coarse resolution (∼0.5° grid vs. ∼0.01° per 15 s), limited temporal resolution in REASv2.1, and the model biases in dispersion and mixing, which might smooth out concentration contrasts near emission hotspots in PHL.
Kurokawa et al. (2013) identified large uncertainties in REASv2.1 BC (±257 %) and CO (±131 %) emissions for Southeast Asia. These uncertainties were primarily related to gaps in the residential sector (±351 % for BC and ±208 % for CO) due to insufficient data of emission factors, removal efficiency, and road emissions. BC emissions in REASv2.1 were half of those in the EDGARv4.2, while CO amounts were similar (Lee et al., 2018). Lee et al. (2018) also found that the underestimated fine particulate (PM2.5) concentrations in Manila in the REASv2.1 may stem from missing aerosol sources (e.g. roads, construction, and industrial dust). In our study, BC and CO discrepancies likely related to combustion sources. Our CMAQ simulations assumed the un-changed 2010 emissions, despite a 65 % increase in PHL's national carbon budget from 2010–2018 (Friedlingstein et al., 2020). BC, CO, and CO2 emissions in 2015 were 13 %, 14 %, and 32 % higher, respectively, in the newer version REASv3.2 (Kurokawa and Ohara, 2020) and other bottom-up inventories, probably more appropriate for PHL.
During flights E-AS-03 S2 and E-AS-10, CO2 concentrations from the Manila area were not positively correlated with BC and CO, probably due to variations in biogenic fluxes (Fig. 2a and b (segment S2), c–e). However, other combinations are of interest. The observed ratios converged around 11.4 ± 1.3 for flight E-AS-03 (R=0.83) and 11 ± 0.1 for flight E-AS-10 (R=0.97), suggesting that BC emissions are higher relative to CO emissions in PHL than in other investigated urban areas. CMAQ simulations for E-AS-03 S2 (10.2 ± 0.4 , R=0.97) agreed well with observations, validating the emission ratio in REASv2.1 for Manila. In contrast, the simulation for E-AS-10 (4.3 ± 0.1 , R=0.91) underestimated the ratio because of differing biases in the BC and CO concentrations. The CMAQ (REASv2.1) model estimated a ratio of 8.0 for PHL, still underestimating observations by ∼30 % (Fig. 6a). The low simulated ratio in E-AS-10 may have resulted from mixing of multiple sources, inferred from an unusually low CO intercept (∼75 ppb on x axis, Fig. 5e). The observed ratio for E-AS-06 was 21.2 ± 1.1 ppb ppm−1, which was 34 % lower than the lowest ratio among bottom-up inventories (28 ppb ppm−1 in ECLIPSEv6b interpolated for 2018).
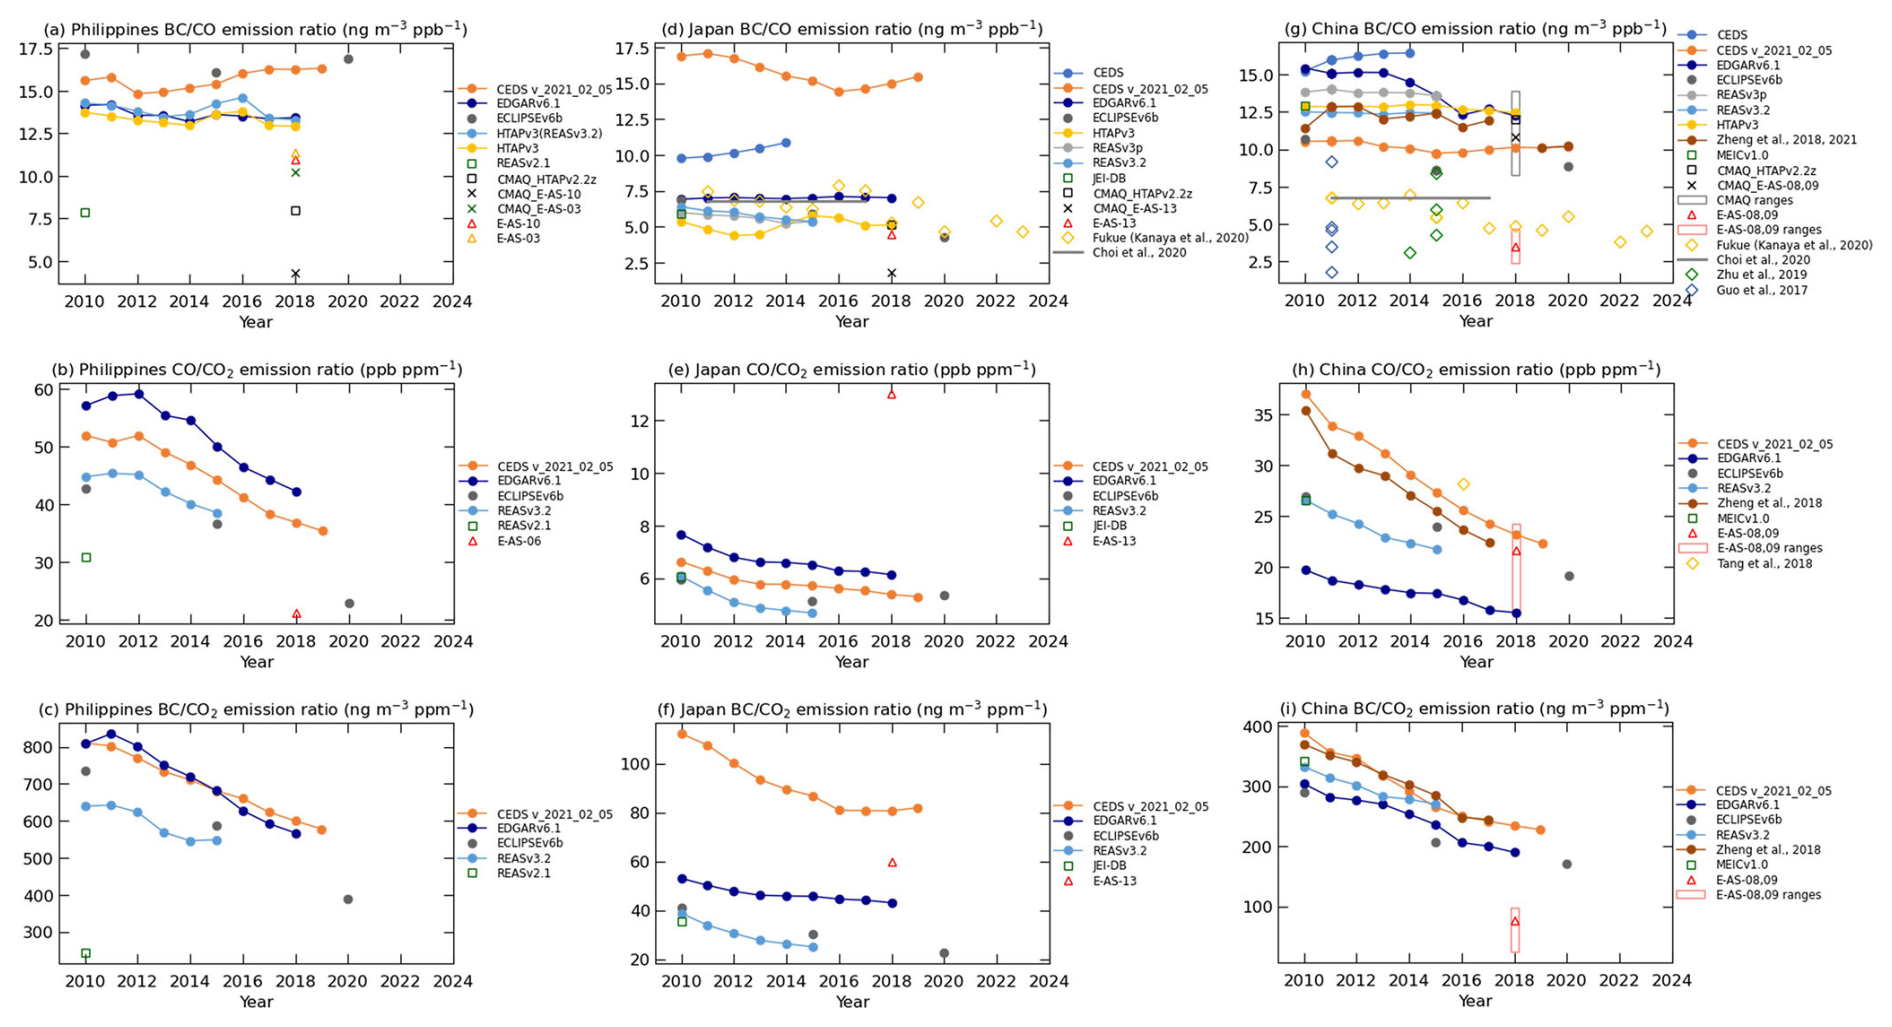
Figure 6Residual , , and ratios for (a–c) the Philippines (PHL), (d–f) Japan (JPN), and (g–i) China (CHN) based on aircraft-based observations (red triangles) and CMAQ model simulations (crosses). In panels (g–i), boxes represent the observed (red) and simulated (black) ratio ranges in sub-air masses. Decadal trends of these ratios based on previous observations (diamonds, grey lines) and bottom-up inventories including MIX (green squares), HTAPv2.2z (black squares), and other inventories (solid markers, with or without connecting lines) are presented. These panels show that and ratios have declined in these regions, while ratios have remained largely unchanged except in the EDGARv6.1 inventory. The ratio agreement in (a) for E-AS-03 likely reflects accurate emission factors but underestimated activity levels in REASv2.1. Reasonable variations in deposition parameters cannot account for this match, as modelled BC and CO distributions showed no evidence of enhanced emissions, with rapid removal below the flight altitudes (not shown).
In conclusion, CMAQ (REASv2.1) simulations gave insufficient BC and CO emissions for PHL, with BC emissions more inadequate than CO emissions, though the ratio remained appropriate. Adjusting the REASv2.1 activity data upward by 1.2 for both BC and CO, based on the observation/model ratios for E-AS-03 S2 (Fig. 4c and d) and the constraint of a good relationship between the modelled and observed ratios for E-AS-03 S2 (Fig. 5d), could improve the agreement of the model with the observations. Unlike the emission gaps, concentration ratio gaps primarily stem from emission factors or pollutant activity levels, where specific sectoral activity levels require more detailed characterization. Other bottom-up inventories, including REASv3.2, require and ratios that are 10 %–30 % and 25 %–50 % lower, respectively, to match observations (Fig. 6a and b). The underestimation of REASv2.1 CO emission and the overestimation of ratios suggest that the CO2 emission rates in the PHL inventory may need to be higher.
3.1.3 JPN case study: evaluating emissions in JEI-DB inventory
For the JPN case, higher BC and CO concentrations were observed during flight E-AS-13 (4 April 2018) between approximately 03:00 and 06:00 UTC. The CMAQ model predicted this period well (the dashed box in Fig. 2f and g). However, the observed BC concentration fluctuated, resulting in weaker correlations with the simulation. A subsegment (04:28–04:55 UTC, the black box in Fig. 2f and g) at an altitude of ∼2.5 km over Sagami Bay and Suruga Bay (112 data points) was selected (Fig. 3k). In this subsegment, the observed CO and CO2 concentrations correlated best (R=0.90). The maximum BC concentration was 0.37 µg m−3 (mean 0.26 ± 0.04 µg m−3), and back trajectory indicated transport across Kagoshima, Osaka, Nagoya, and Tokyo (Fig. 3e). CMAQ model underestimated the maximum BC concentration by maintaining 0.13–0.17 µg m−3 (mean 0.16 ± 0.01 µg m−3). The observations did not contain a clear maximum CO concentration (mean 130 ± 7 ppbv) and it was slightly underestimated by CMAQ (mean 119 ± 5 ppbv), resulting in low correlation coefficients. Similar to THL, the poor correlations were attributed to the spatial and temporal limitations of the CMAQ model inputs and outputs. CMAQ overestimated BC concentrations below ∼1.5 km but underestimated BC at ∼2–4 km over Sagami Bay and Suruga Bay (33–35° N, 138–140° E), as shown in Fig. S2b. A previous study found that CMAQ (version 4.7) underestimated BC over Fukue Island when air masses passed over Japan's main islands (Kanaya et al., 2020). While it is unclear whether the JEI-DB inventory contributed to the underestimation of BC in this study, JEI-DB has been found to underestimate BC emissions in Tokyo (Shibata and Morikawa, 2021).
The observed , , and ratios were 4.5 ± 0.4 (R=0.71), 13.0 ± 0.6 ppb ppm−1 (R=0.90), and 60 ± 6 (R=0.67), respectively. However, the CMAQ model failed to capture the observed BC maximum at an altitude of ∼2.5 km, underestimating the ratio to 1.8 ± 0.06 (R=0.95). An unacceptably low x axis intercept (34 ppb, which corresponded to CO baseline concentration) suggested a mixing of two sources rather than a valid emission ratio in the simulation. The measured ratio was slightly lower than the values reported in other ground-based (6.8 ± 0.2 for 2010–2016, Choi et al., 2020, 5.9 ± 3.4 for 2009–2015, Kanaya et al., 2016; yellow diamonds in Fig. 6d, 5.7 ± 0.9 for 2003–2005, Kondo et al., 2006) and aircraft-based (6.3 ± 0.5 for 2003, Kondo et al., 2006) studies. The observed ratio closely matched the values from HTAPv2.2z (JEI-DB) (5.15 , open black square in Fig. 6d), the ECLIPSEv6b inventory (dark grey circles in Fig. 6d), and EDGARv6.1 (dark blue line with circles in Fig. 6d), in which updated transport activity and shipping emission data were used (Klimont et al., 2017; https://edgar.jrc.ec.europa.eu/index.php/dataset_ap61, last access: 22 February 2024). However, the observed ratios were clearly overestimated in CEDS (CMIP6) (Hoesly et al., 2018) (blue line with circles in Fig. 6d) and CEDS v_2021_02_05 (O'Rourke et al., 2021) (∼15 , orange line with circles in Fig. 6d).
The observed high ratio (13.0 ± 0.6 ppb ppm−1), which exceeded the Yokosuka (JPN) 2022 value (∼5.8 ppb ppm−1), suggests unusual sources such as engineering vessels (Zhang et al., 2016; Wu et al., 2022). Historical observations of 14–18 ppb ppm−1 (Takegawa et al., 2004), 11.2 ± 0.4 ppb ppm−1, and 12.6 ± 0.7 ppb ppm−1 (Kondo et al., 2006) were 2 to 3 times higher than the ratio for Yokosuka. The narrow range of CO2 concentrations (411–413 ppm) and the shallow mixing depth (determined from the HYSPLIT results, data not shown) suggest that the air masses were from mixing of multiple background sources via convective transport (Yokelson et al., 2013) or long-range transport (over 5 d) from North China. Due to these uncertainties (high ratios, narrow CO2 variability, and shallow mixing depths during transport), this air mass lacked sufficient emission information to be considered a typical JPN air mass, despite the agreement for the ratio with other observations and emission inventories. Accurate analysis of national emission ratios depends on selecting representative air masses, which are assessed through concentrations of co-emitted species and relevant meteorological parameters.
3.2 Comprehensive reassessment of CHN emissions from the HTAPv2.2z inventory
Taking advantage of the long-range transport from China captured by aircraft and supported by long-term, ground-based observations at Fukue Island (Kanaya et al., 2020), the observed CHN air masses are explored in greater detail, including an observation–model comparison, assessment of emission ratios (Sect. 2.4), and an estimate of emissions using a combined model–observation approach (Sect. 2.5).
3.2.1 Observed and simulated BC, CO, and CO2 concentrations in CHN anthropogenic emissions
During flights E-AS-08 (24 March 2018, 02:27–03:09 and 04:24–06:07 UTC) and E-AS-09 (26 March 2018, 02:58–04:19 UTC), air masses with peak BC and CO concentrations were observed near Taiwan, Jeju (South Korea), and Okinawa (JPN), which originated in central East China (CEC) (Fig. 3f and g) and totalled 872 data points. These flights captured pollution plumes characteristic of dominant Chinese anthropogenic sources and seasonal patterns. Fire activity, typically peaking in March and April, contributed only ∼10 % of CHN anthropogenic emissions (7 % BC, 13 % CO; according to GFED and HTAPv2.2z used in CMAQ). Trajectory analysis showed plumes originating from Chinese source regions around 22 March 2018 (Thursday), with transport time of 40–120 h. The air mass was likely influenced by typical weekday emissions from the transportation sector. This plume represented a significant pollution transport event with a typical transport route and negligible deposition loss (via APT analysis; see Sect. 2.3 and Fig. S6). Under the high-pressure system, low specific humidity (mean 3.6 ± 1.1 g kg−1) and relative humidity (mean 57 % ± 13 %) over 72 h of transport from the HYSPLIT model suggested negligible cloud formation and high moisture influence.
The maximum observed BC and CO concentrations were 1.66 µg m−3 and 628 ppbv, respectively, with CO2 increased from 419 to 433 ppm. The correlation coefficients between the modelled and observed concentrations were moderate (RBC=0.63 and RCO=0.40, p values<0.001; see Table 2). The model overestimated BC by maxima of +1.62 µg m−3 and underestimated CO by maxima of −400 ppbv, predicting maximum concentrations of 2.60 µg m−3 for BC and 320 ppbv for CO (Fig. 2h–k). Kanaya et al. (2020) reported similar tendencies for CMAQv4.7.1 (REASv2.1) at Fukue Island (JPN), including for E-AS-08 and E-AS-09 periods. The observation/simulation ratios (Eqs. 1 and 2) were 0.48 ± 0.13 for BC and 1.46 ± 0.42 for ΔCO (Figs. 4j and 6k). Although the HTAPv2.2z inventory considers recent reductions in Chinese emissions (Chatani et al., 2020; Zheng et al., 2018), these updates may still be insufficient for accurately predicting BC concentrations.
CHN air masses were investigated separately for two groups of origin (Table S1). The S-CEC (southern CEC) group included flights E-AS-08 S1–S3 and E-AS-09 S2 (mean BC=0.73 µg m−3 and mean ΔCO=181 ppbv). The NS-CEC (northern and southern CEC) group included flights E-AS-08 S4–S5 and E-AS-09 S1 (mean BC=0.85 µg m−3 and mean ΔCO=338 ppbv). Kanaya et al. (2020) recorded similar peaks for N-CEC (northern CEC) and S-CEC on Fukue Island on 24–26 and 26–28 March. Our mean S-CEC results closely matched those of Kanaya et al. (2020) (0.67 µg m−3 BC and 190 ppbv ΔCO). Our NS-CEC mean values were similar to the N-CEC values on Fukue Island (0.92 µg m−3 BC and 254 ppbv ΔCO) (Table S4). The largest model biases occurred for flight E-AS-08 S3 and S5 (+1.18 µg m−3 BC and −364 ppbv CO, respectively), both at an altitude of ∼900 m.
3.2.2 CHN emission ratios of , , and
The observed residual ratios for CHN air masses were 3.5 ± 0.1 (R=0.87) for , 21.1 ± 0.4 ppb ppm−1 for (R=0.85), and 77 ± 2 for (R=0.79). These ratios remained largely unchanged despite slight rainfall, shown by the APT analysis (Sect. 2.3; Table S7) and minimal variation (1.5 %–2.3 %) between the full dataset and APT-filtered subsets (APT 72 h=0 mm; Fig. S6), supporting their robustness for diagnosing CHN anthropogenic emissions (p value<0.0001). In contrast, the CMAQ model overestimated the ratio (10.5 ± 0.1 ; R=0.99). The observed ratio agreed with the lower end of ground- and ship-based measurements, ranging (6.2–7.9) ± 0.7 (Choi et al., 2020), 3.8–7.0 (Kanaya et al., 2020), 1.8–3.5 (Guo et al., 2017), and 3–6 (Zhu et al., 2019). Note that the Aethalometer-based value (Zhu et al., 2019) required correction for the non-BCBC mass ratio. Figure 6g–i compare observed ratios (red triangles) and CHN sub-air-mass ranges (red boxes) to other observations and bottom-up inventories. The observed ratios were less than one-third of the HTAPv2.2z value (12 ; black square) and half of other inventories (8.4–16.4 ). Even the lowest inventory estimate, CEDS v_2021_02_05 (10.1 ; O'Rourke et al., 2021), exceeds observations, despite reductions from its predecessor (CEDS CMIP6), indicating a positive bias in CHN ratios in bottom-up inventories, consistent with REASv2.1 analyses (Choi et al., 2020).
The observed ratio (21.6 ppb ppm−1) closely matched the CEDS v_2021_02_05 value (23.2 ppb ppm−1), though it was lower than the 2016 KORUS-AQ measurement (28.2 ppb ppm−1) (Tang et al., 2018). CHN sub-air-mass ratios (15.5–23.2 ppb ppm−1) agreed well with the 2018 REASv3.2 and ECLIPSEv6b (Fig. 6h), confirming the reliability of ratios in bottom-up inventories for CHN. Given the lower uncertainties in CO2 emissions in these inventories than CO and BC (Zhao et al., 2013), this agreement supported the reasonable CO emissions for 2018 in inventories. The decline in the ratio compared to past airborne measurements (28–60 ppb ppm−1) taken ∼20 years ago (Takegawa et al., 2004; Suntharalingam et al., 2004) reflected dramatically improved combustion efficiencies in CHN (Wang et al., 2010; Tang et al., 2018). Conversely, the observed ratio (77 ) was less than half the inventory range (190–234 ) (Fig. 6i), indicating BC emissions are overestimated in bottom-up inventories.
HTAPv2.2z identifies the residential sector as the dominant source of BC (59 %) and CO (54 %) emissions in CHN. Other inventories, such as ECLIPSEv6b, also overestimate BC emissions. A detailed review of ECLIPSEv6b revealed the likely cause: high assumed emission factors for raw coal in traditional stoves (0.06–5.76 g kg−1), which represent the largest activity share (51 %) and contributed 80 % of BC emissions (Zbigniew Klimont, personal communications, 2021; Table S3). Emission factors are highly sensitive to fuel quality and combustion conditions (Li et al., 2017a; Zhao et al., 2013). For example, medium-volatile bituminous raw coal has higher emission factors (>10.1 g kg−1) than other fuels (Chen et al., 2006, 2009; Sun et al., 2017; Zhang et al., 2008; Zhi et al., 2008). However, such emissions were expected to decline following the 2013 National Air Quality Action Plan and 2015 Clean Coal Technology Policies (Chen and Chen et al., 2019; Zhang et al., 2022), with cleaner technologies like honeycomb-coal briquette. While BC emissions from this source were projected at 16.7 Gg in 2020 (Chen et al., 2009), ECLIPSEv6b assigns 401 Gg, indicating substantial overestimation.
BC emissions showed greater spatial and temporal heterogeneity than CO and CO2. NS-CEC air masses exhibited ratios <2.9 (2.4–2.7 ), while S-CEC air masses had higher ratios (3.5 , ranging 3.6–4.7 ) (Figs. S3 and S4). This likely reflected different regional emission changes between 2010 and 2018, with greater reductions in ratios in N-CEC than in S-CEC (Kanaya et al., 2020). The airborne ratios for S-CEC agreed with Fukue Island values during the same episode (3.5 ; Table S4), confirming for the first time the stability of the ratio during transport, proving that the emissions are reliable. However, these ratios were markedly lower than Fukue's spring means for N-CEC (4.4 ) and S-CEC (5.2 ). While airborne ratios may not fully capture national-scale variability, the data demonstrated vertical consistency from the ground to flight altitude. Future airborne measurements with larger footprints will further improve national emission estimates.
While emission ratios reflect source characteristics and support national-scale diagnostics, this observation alone cannot attribute emissions to specific sectors. However, the ratio implies that model BC and CO emissions should be respectively reduced and increased. Although indirectly, typical dominant sources, e.g. coal-fuel stoves, can be potential contributors. A thorough review is essential to identify outdated input and incorporate recent policy shifts or experimental data.
3.2.3 Estimates of BC, CO, and CO2 emissions from CHN using the combined model–observation approach
The combined model–observation approach (Sect. 2.5) was applied to CHN air masses using either E(BC) or E(CO) values as a basis. The HTAPv2.2z inventory prescribed Chinese emissions of 1.36 Tg yr−1 for BC and 134 Tg yr−1 for CO (Fig. 7) to use in Eq. (3). The other CHN emission rates (Eqs. 4–6) were translated using the mean ratio from Fukue Island observations (Kanaya et al., 2020) in spring 2018 (4.9 ± 0.1 ) and the airborne ratio (21.1 ± 0.4 ppb ppm−1) (Fig. 7). The method used to estimate uncertainties is discussed later (Sect. 3.2.4).
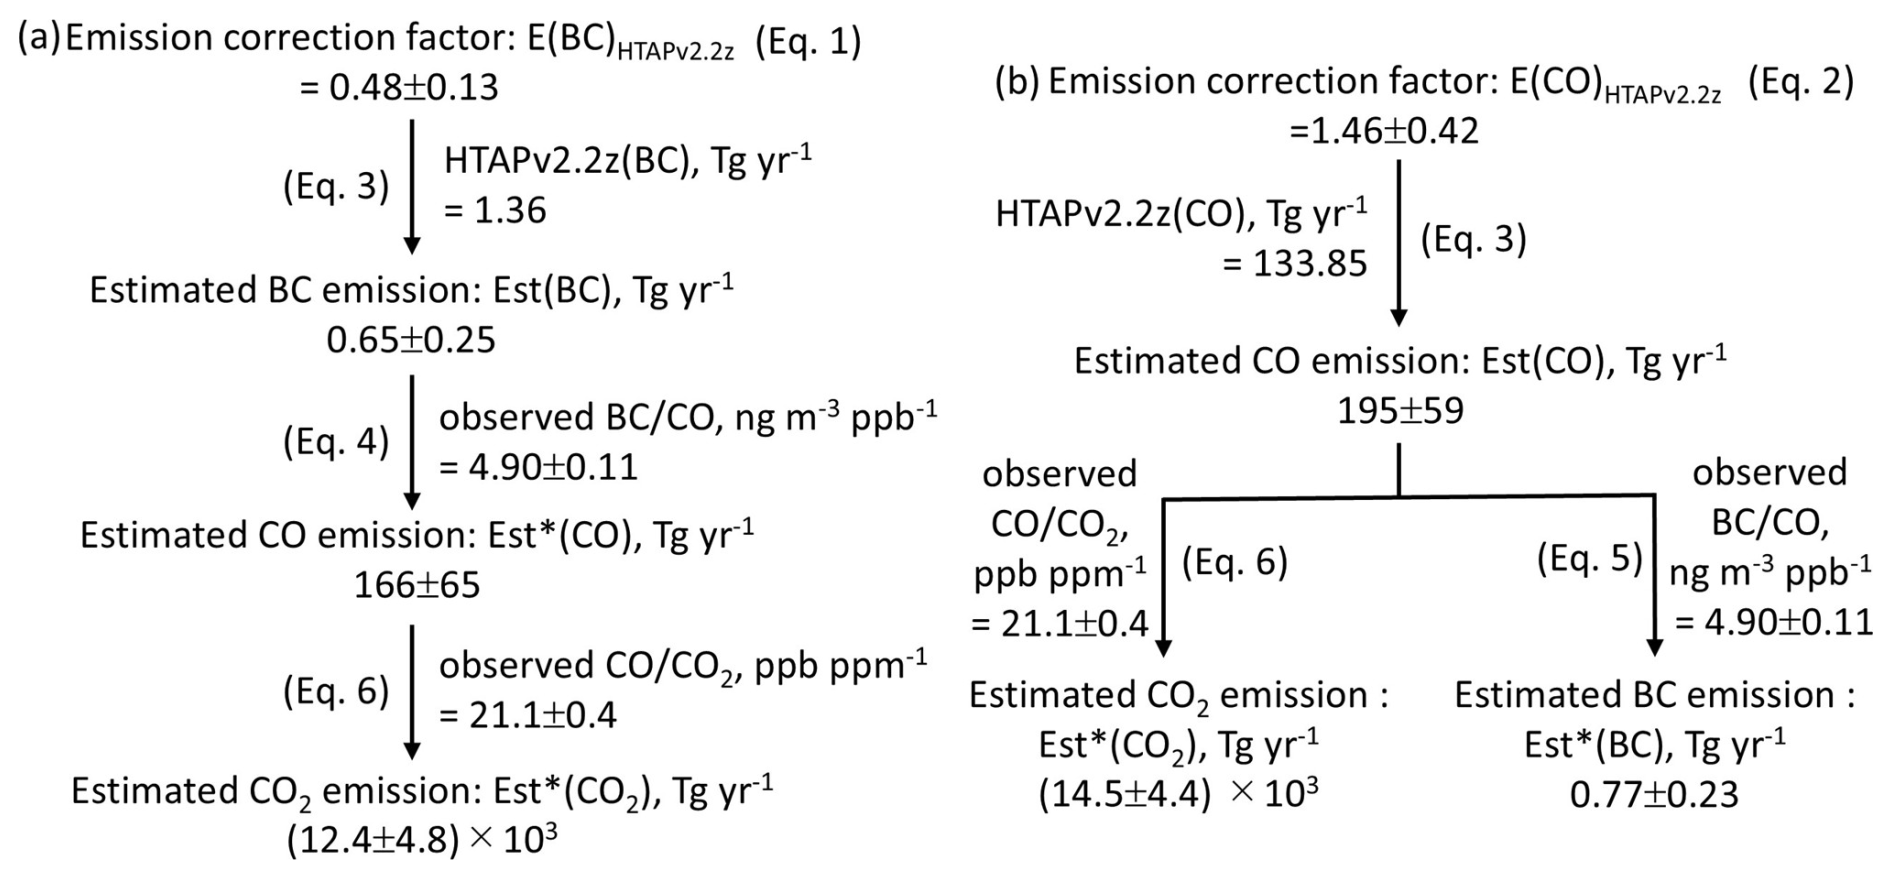
Figure 7Combined model–observation approach for estimating black carbon (BC), CO, and CO2 emissions using emission correction factors (a) E(BC) and (b) E(CO) applied to aircraft-based observations relative to the HTAPv2.2z inventory.
Using E(BC)HTAPv2.2z as a basis to estimate emissions
Equation (1) yielded an emission correction factor E(BC)HTAPv2.2z=0.48 ± 0.13 (Fig. 7a). The estimation results and uncertainty ranges (Sect. 3.2.4) are shown in Fig. 8 (red triangles and boxes) for comparison with previous studies. The calculated BC emission rate was 0.65 ± 0.25 Tg yr−1, which was ∼52 % lower than the HTAPv2.2z inventory value of 1.36 (Tg BC) yr−1 (this study, marked with a black cross in Fig. 8a). Similar to recent estimates made using observations on Fukue Island and in the Noto region (Kanaya et al., 2020; Ikeda et al., 2022, 2023; Miyakawa et al., 2023), our estimated BC emission rate was lower than bottom-up inventory values. Our BC emission rate was 38 % lower than emission rates estimated using the long-term surface observations on Fukue Island during 2009–2018 (1.06 ± 0.29 Tg yr−1; Kanaya et al., 2020; green line and shade in Fig. 8a). This difference may in part arise from different selections of the CHN air mass. The ECLIPSEv6b BC emission rate (0.96 Tg yr−1; dark grey circles in Fig. 8a) incorporating CHN air quality improvements under the 12th Five-Year plan (Klimont et al., 2017) closely matched our estimated uncertainty range (0.4–0.9 Tg yr−1; red box in Fig. 8a). The CEDS (CMIP6) BC rate (2.54 Tg yr−1 for 2014; blue line with circles in Fig. 8a) significantly decreased in CEDS v_2021_02_05 (1.58 Tg yr−1 for 2014, 1.22 Tg yr−1 for 2018; orange line with circles in Fig. 8a), reflecting updated International Energy Agency energy data with less biomass consumed after 2000 and improved BC and OC industrial emissions from CHN (O'Rourke et al., 2021). Despite the reductions, the CEDS v_2021_02_05 BC rate remained higher than our estimate.
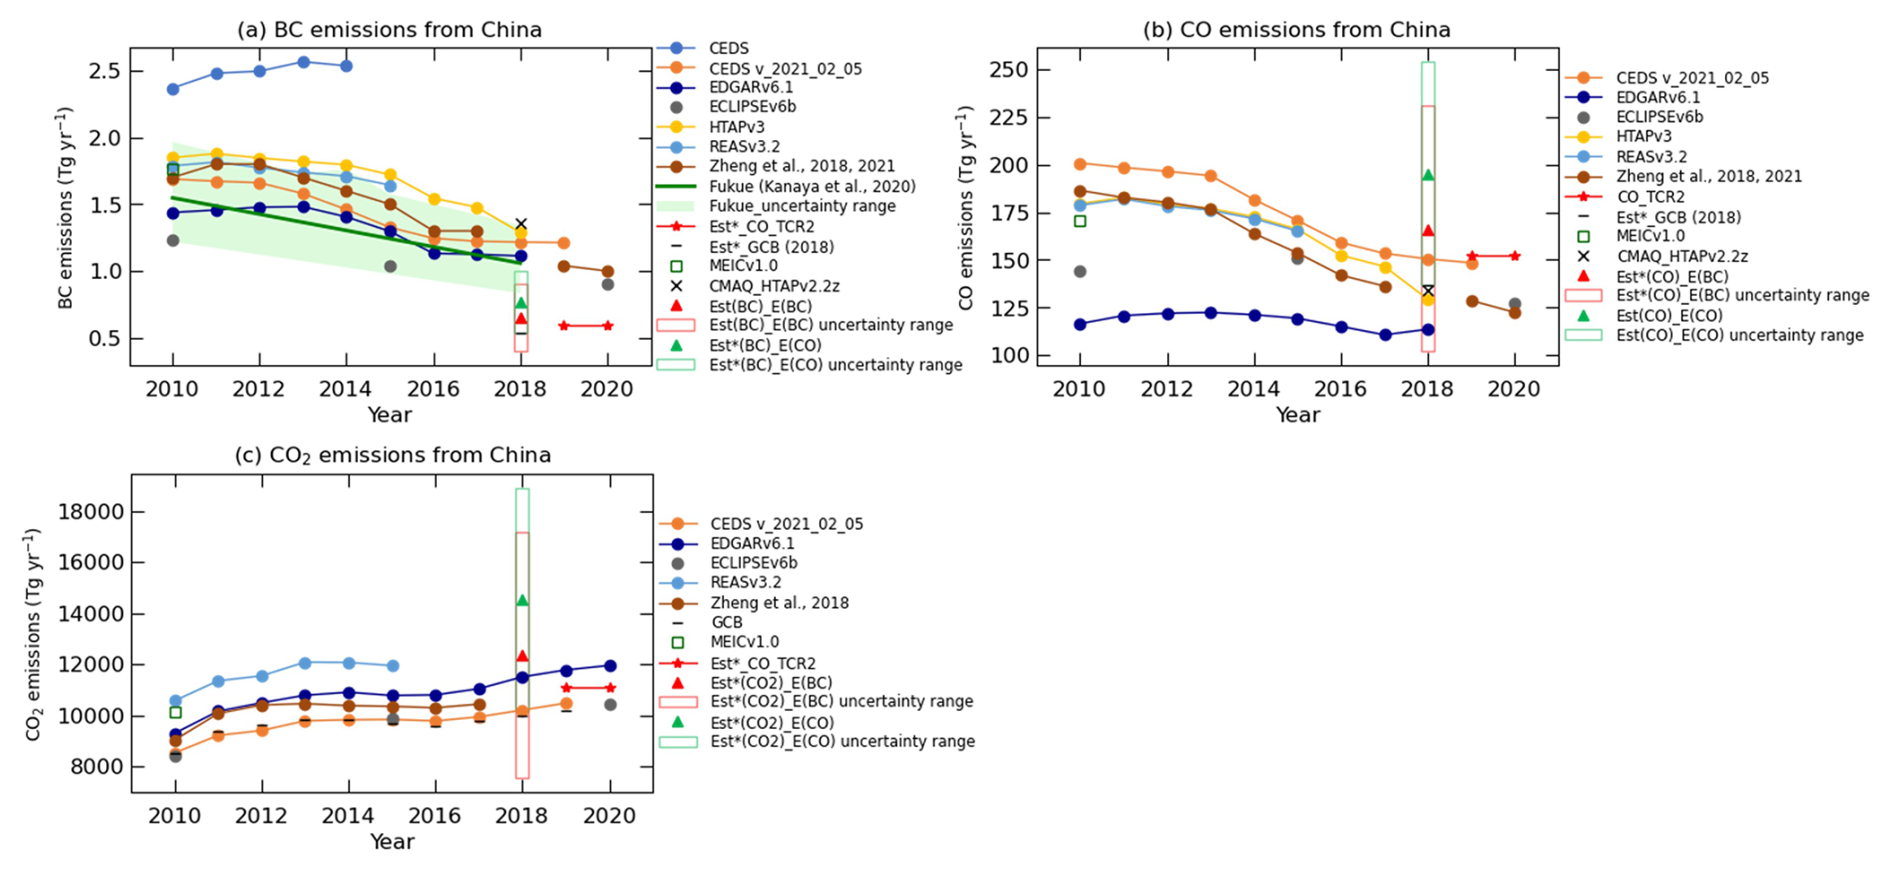
Figure 8Estimated Chinese (a) BC, (b) CO, and (c) CO2 emissions based on E(BC)HTAPv2.2z (solid red triangles) and E(CO)HTAPv2.2z (solid green triangles), with uncertainty ranges (Sect. 3.2.4) shown as red and green boxes. Comparative data are included from bottom-up inventories and databases, MEIC v1.0 (open green squares), HTAPv2.2z (black crosses), the global carbon budget (Friedlingstein et al., 2020; black dashes), TCR2 (Miyazaki et al., 2020; red lines with stars), and BC estimates from Fukue Island (Kanaya et al., 2020; green) along with its uncertainty range (light green shade). Full references are provided in Table S2.
The estimated CO emission rate was 166 ± 65 Tg yr−1, which was ∼24 % higher than the value in the HTAPv2.2z inventory (134 Tg yr−1; this study, marked with a black cross in Fig. 8b). Our estimate was 10 %–32 % higher than those of other inventories, including the highest (CEDS v_2021_02_05: 150 Tg yr−1; orange line with circles, Fig. 8b) and lowest (EDGARv6.1: 114 Tg yr−1; dark blue line with circles, Fig. 8b). These values in CEDS v_2021_02_05 and EDGARv6.1 relied on activity data and emission factors without observation-based corrections (Crippa et al., 2018). The top-down TCR2 CO rate of 153 Tg yr−1 for 2019–2020 (red line with stars in Fig. 8b) was close to our estimate. Our estimated CO2 emission rate was (12.4 ± 4.8) × 103 Tg yr−1, which was similar to the rates estimated by EDGARv6.1 (11.5×10³ Tg yr−1; dark blue line with circles in Fig. 8c) and CEDS v_2021_02_05 (10.2×10³ Tg yr−1; orange line with circles in Fig. 8c) to take our uncertainty into account. All inventories indicated an increase in CO2 emissions from 2010 to 2020 that exceeded the reported 2018 carbon budget for CHN of 9.9×10³ Tg yr−1 (black dashes in Fig. 8c) (Friedlingstein et al., 2020).
Using E(CO)HTAPv2.2z as a basis to estimate emissions
Equation (2) resulted in a correction factor of E(CO)HTAPv2.2z=1.46 ± 0.42 (Fig. 7b). The results and uncertainty ranges are shown as green triangles and boxes in Fig. 8. The estimated CO emission rate was 195 ± 59 Tg yr−1; the HTAPv2.2z inventory value was 46 % lower, yet it was still close to the edge of our uncertainty range (black cross and green box in Fig. 8b). Only the CEDS v_2021_02_05 CO rate (orange line with circles in Fig. 8b) among other inventories fell within this range. This method yielded a higher BC emission rate (0.77 ± 0.23 Tg yr−1) and lower uncertainty than the E(BC)-based method due to reduced instrument and model-specific transport errors (Sect. 3.2.4). However, the BC rate remained 44 % lower than the HTAPv2.2z inventory value (black cross in Fig. 8a). The estimated CO2 emission rate was (14.5 ± 4.4) × 103 Tg yr−1, which covered the EDGARv6.1 (11.5×10³ Tg yr−1; dark blue line with circles in Fig. 8c) and CEDS v_2021_02_05 (10.2×10³ Tg yr−1; orange line with circles in Fig. 8c). Our CO2 estimates remained higher than those of previous studies. An extra 7 % of CO2 emissions from humans and livestock respiration in CHN (Cai et al., 2022), which is typically excluded from bottom-up inventories, could partially explain this high CO2 emission rate. When compared to the CO and CO2 emission reference ranges, the E(CO)-based method produced worse estimates of CO and CO2 than the E(BC)-based method.
Overall, this multi-species analysis using the E(BC) and E(CO) method underscores the necessity of adjusting CHN emission inventories. The HTAPv2.2z (this study), EDGARv6.1, and CEDS_2021_02_05 inventories require downward corrections for BC emissions and upward revisions for CO emissions to better agree with observed data. BC emissions in HTAPv2.2z require a 45 %–54 % reduction, while BC emissions in the EDGARv6.1, HTAPv3, and CEDS v_2021_02_05 inventories require a 31 %–49 % decrease to agree with our estimates. Lower BC emission rates would more accurately reflect bottom-up CO2 emissions, which have been confirmed for the first time. CO emissions in HTAPv2.2z require a 24 %–46 % increase, and CO emissions in the EDGARv6.1, HTAPv3, and CEDS v_2021_02_05 inventories require a 10 %–42 % increase to agree with our estimates (see Table S2).
3.2.4 Uncertainty quantification in CHN emission estimates
The uncertainties in emission estimates were propagated from four sources. (1) Error in observation-to-model ratios and multi-species emission ratios was ∼26 % for the E(BC)-based method, including standard errors. (2) Systematic instrument error was 10 % for the SP2 (Ohata et al., 2021). We estimated (3) representation errors as ±4 % due to limited opportunities for aircraft observations to be made in terms of seasonal and spatial variabilities, estimated by comparing spring and annual data across the CEC region and large footprint for CHN recorded at Fukue Island, assuming CEC emissions dominate BC sources (69.7 %) (Fig. S5; Kanaya et al., 2020). (4) A model-specific transport error (26 %) was determined by comparing CMAQ-simulated BC concentrations with the Comprehensive Air Quality Model with eXtensions (CAMx) system simulations using identical emission data (Chatani et al., 2018) for the model comparison framework (Itahashi et al., 2018; Yamaji et al., 2020). Despite differences in meteorology and aerosol components, CAMx produced a correction factor of 0.54, closely matching CMAQ's E(BC) of 0.48. This result indicated small transport and meteorology errors, suggesting that the discrepancies between model and observations primarily stemmed from the underlying emission inventory. Overall, the estimated uncertainties in the E(BC)-based emission rates were ∼39 % (0.25 Tg yr−1 for BC, 65 Tg yr−1 for CO, and 4.8×10³ Tg yr−1 for CO2). The BC emission uncertainty (±0.25 Tg yr−1) closely matched the surface-based estimates at Fukue Island (±0.29 Tg yr−1), although they were studied for a longer period (2009–2018) (Kanaya et al., 2020).
For emissions estimated using E(CO), the uncertainties include (1) observation-to-model errors (∼28 %), (2) instrument errors (4 % for the UV photometer; Gerbig et al., 1996), (3) representation errors (±4 %), and (4) transport errors (7 %). These contributed to an overall uncertainty of ∼30 % (0.23 Tg yr−1 for BC, 59 Tg yr−1 for CO, and (4.4×10³) Tg yr−1 for CO2).
Figure 9 illustrates the consistency of BC, CO, and CO2 emission rates using the E(BC) (orange triangles) and E(CO) (green triangles) method. Estimate uncertainties (orange and green lines with circles) were compared to reference values for CO (113–150 (Tg CO) yr−1) and CO2 ((9.9–11.5) × 103 (Tg CO2) yr−1; red lines). The E(BC) method yielded CO and CO2 estimates that agreed more with references, while its BC estimate deviated further from the reference range (1.11–1.29 Tg yr−1; red line on BC axis) than E(CO). As uncertainties in CO2 emissions across emission inventories are lower than those in BC and CO, the strong ratio agreement (Sect. 3.2.2) suggested that bottom-up inventories provide more accurate CO than BC emissions. Thus, the E(BC)-based was the superior estimation method, producing more reliable CO and CO2 estimates with smaller uncertainties (standard errors of 26 % vs. 31 %; Fig. 7). Large variations were also found in CO baselines calculated from ratio of the sub-air masses, as well as E(CO) between NS-CEC and S-CEC sub-air masses (1.93 vs. 1.29).
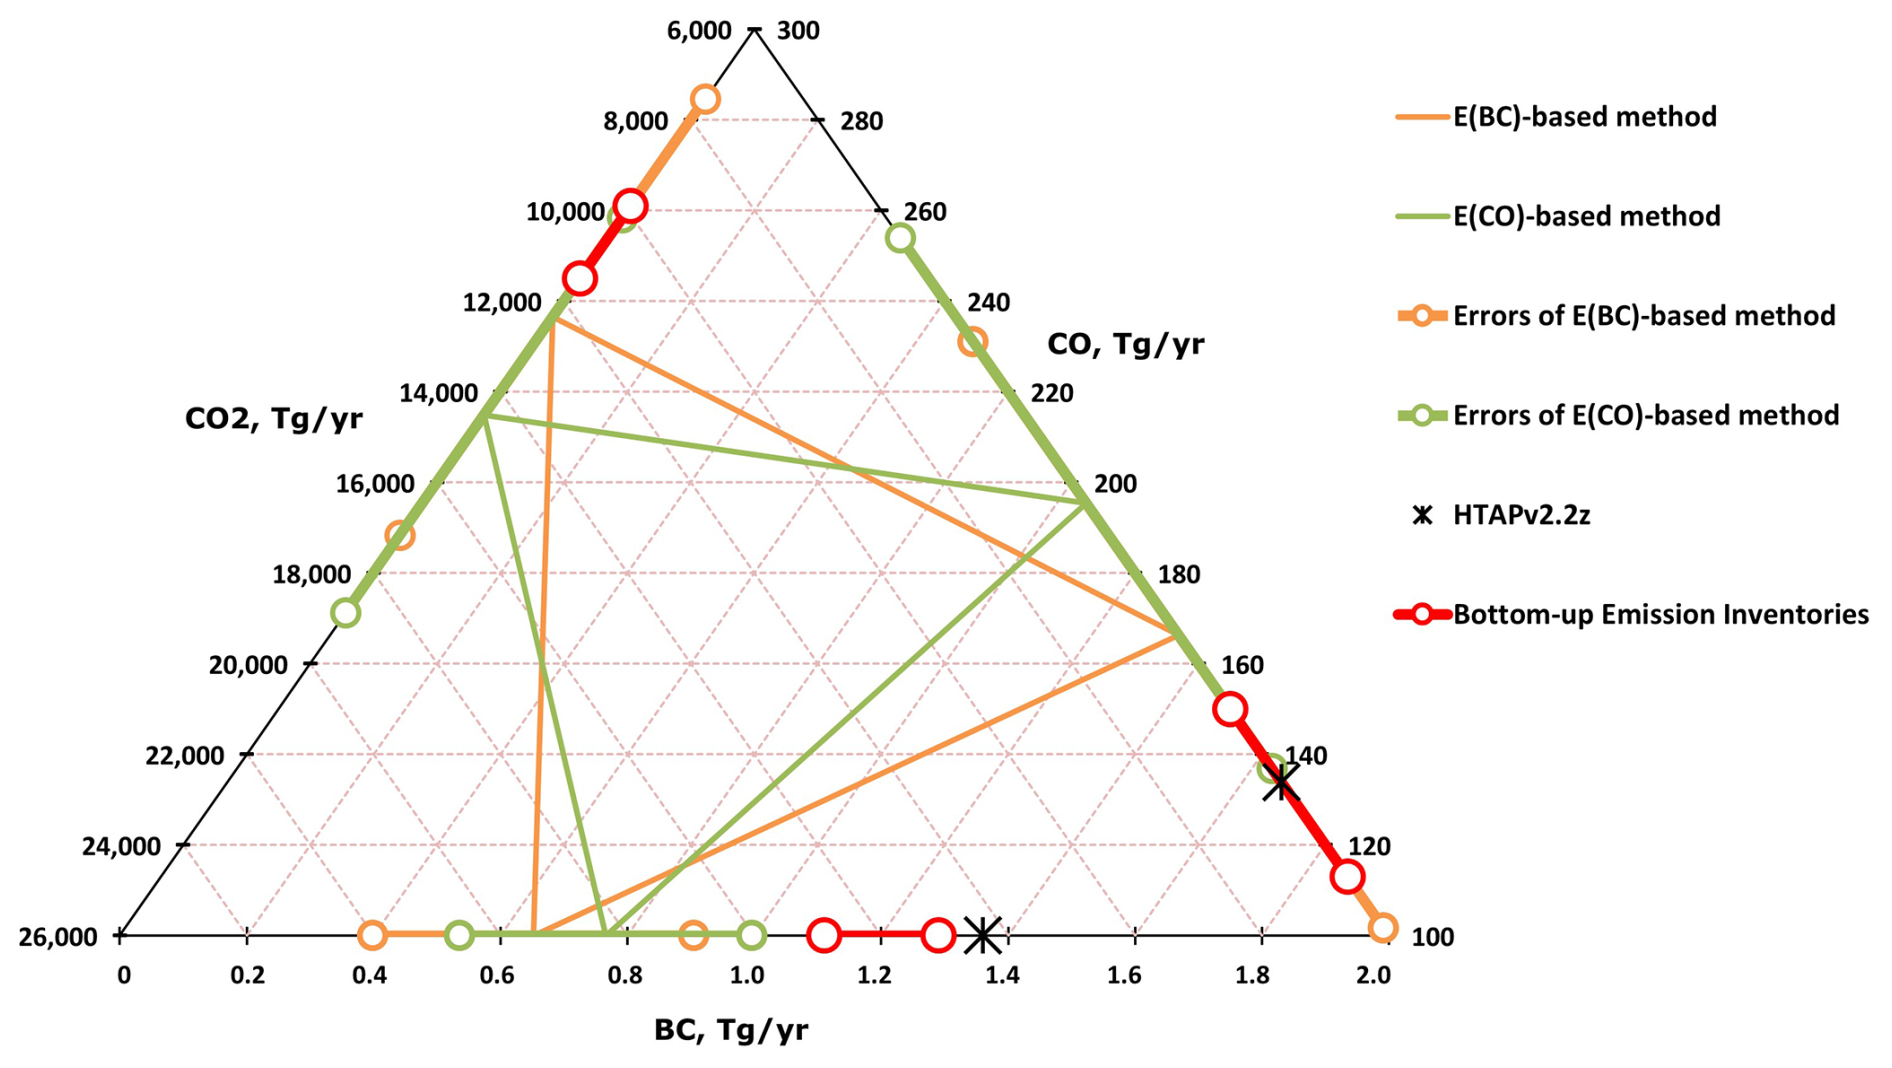
Figure 9Cross-species consistency of estimated BC, CO, and CO2 emissions. Orange and green triangles denote E(BC)HTAPv2.2z- and E(CO)HTAPv2.2z-based estimates, respectively, with associated uncertainty ranges shown as orange and green lines with circles. Red lines with circles indicate reference values from bottom-up inventories, while black stars represent HTAPv2.2z emissions.
This study focuses on total national emissions rather than sector-specific contributions. Although the event footprint was limited, it covered key emission regions, i.e. the CEC region which accounts for ∼69.7 % of CHN BC sources. To support the extrapolation to annual, nationwide emission estimates, a long-term ground-based analysis with a broader spatial footprint (Kanaya et al., 2020) was utilized. Temporal, spatial, and model-specific uncertainties were effectively incorporated, ensuring the estimates are representative for China in 2018. Given the consistent regional emission patterns across inventories exhibiting near-linear concentration–emission response (Ikeda et al., 2022), the choice of emission inventory does not affect the finding of this study.
Refining emission inventories for BC can be achieved by targeting major sources based on emission factors and activity levels. For CO and CO2, where source attribution is more challenging, improving accuracy may involve updating emission factors in BC-associated sectors and identifying additional potential missing sources.
In conclusion, multi-species analysis suggested that bottom-up emission estimates for CHN in the HTAPv2.2z emission inventory need to be decreased by ∼50 % for BC and increased by ∼20 % for CO to minimize the differences from measured data based on the E(BC) method. This implies broader trends showing a decline in BC emissions since 2010 (Kanaya et al., 2020), with levels remaining low in 2019–2020 (∼0.6 Tg BC yr−1) according to the translation from TCR2 CO data. However, inventories such as CEDS v2021-02-05 and MEICv1.0 (Zheng et al., 2021) still report BC emissions over 1 Tg yr−1 for 2018–2020, reinforcing the need for downward adjustment. The decreasing trend and overestimations of BC emissions in CHN suggest a smaller warming effect than previously estimated in the CMIP6 model (Ikeda et al., 2023). Post-2018 changes in China such as promoted biomass energy use (IEA Bioenergy ExCo, 2021; CETO project team, 2023) and major pollution from vehicles despite advances in electrification and emissions control, however, may shift BC, CO, and CO2 trends unpredictably, warranting future investigations. Nevertheless, the inventory revision for 2018 suggested in this study remains worth considering.
This study integrated EMeRGe aircraft measurements with WRF/CMAQ model simulations to assess combustion-related SLCF emissions (BC, CO, and CO2) in East Asia. Four pollution events from March–April 2018 were investigated: biomass burning near the Gulf of Thailand (THL) and urban pollution in the Philippines (PHL), Japan (JPN), and China (CHN). Distinctive emission inventories were used for each pollution case. Our analyses included (1) model–observation comparisons, (2) assessment of residual and emission ratios across air masses, and (3) estimation of CHN emissions using a combined model–observation approach. The analysis results led to following main conclusions.
- (a)
The GFEDv4.1s inventory of fire emissions in the THL case provided accurate BC and CO emissions. Residual ratios of co-emitted pollutants were used to assess emission characteristics. The concentration ratio was found to be 7.1 ± 0.3 for flaming-dominant combustion over the Indochina Peninsula.
- (b)
Simulations of PHL air masses showed that REASv2.1 (2010) underestimated the concentrations of BC and CO in Manila. The concentration ratio for urban emissions was 11.4 ± 1.3 , whereas REASv2.1 also gave a good range (10.2 ± 0.4 ). This suggests that the underestimation in REASv2.1 is likely linked to the activity data.
- (c)
The JPN air masses exhibited a high ratio, which may not be representative of typical JPN emissions, despite the fact that ratios agree with bottom-up inventories and previous observations.
- (d)
Aircraft observations of CHN air masses confirmed that the CMAQ model using the HTAPv2.2z inventory overestimated BC concentrations by +1.62 µg m−3 and underestimated CO concentrations by −400 ppbv, supporting ground-based findings (Kanaya et al., 2020). For the first time, the ratio for CHN air masses found in Kanaya et al. (2020) was validated using aircraft-based measurements (3.5 ± 0.1 ). This ratio agreed with other ground- and ship-based observations, but it was markedly lower than CMAQ (HTAPv2.2z) simulations (10.5 ± 0.1 ) and other inventories. This implied that BC emissions were overestimated and CO emissions were underestimated in HTAPv2.2z and other inventories. This discrepancy may be due to the rapid decrease in BC emissions from coal combustion and the use of old-fashioned heating stoves in CHN during the decade leading up to 2018.
- (e)
A combined model–observation approach was applied to estimate BC, CO, and CO2 emission for CHN. The best estimates were based on the E(BC)HTAPv2.2z correction factor using the spring mean residual ratio (4.9 ± 0.1 ) and the aircraft-measured ratio (21.1 ± 0.4 ppb ppm−1). The estimated emission rates were 0.65 ± 0.25 Tg BC yr−1, 166 ± 65 Tg CO yr−1, and (12.4 ± 4.8) × 103 Tg CO2 yr−1. The BC and CO emission estimates were tied to the CO2 estimates to reduce uncertainty. The low BC emission rate implies that BC emission in the HTAPv2.2z inventory for CHN needs to be decreased by ∼50 %, while CO emission requires a ∼20 % increase to improve agreement with airborne measurements.
The findings highlight the need to verify bottom-up emission inventories and identify gaps to improve air quality simulations and climate impact mitigation strategies. Updated observational and experimental data might support inventory developers to refine and update BC and CO emission factors and adjust the activity levels of dominant BC sources. The overestimations of BC emissions in CHN suggest a smaller warming effect than previously estimated in the CMIP6 model (Ikeda et al., 2023).
The primary data collected by HALO aircraft during the EMeRGe campaign are publicly available and can be requested from the HALO database (https://halo-db.pa.op.dlr.de/, last access: 30 May 2023). The data simulated using the CMAQ model can be acquired upon request to Kazuyo Yamaji (kazuyo@maritime.kobe-u.ac.jp).
The supplement related to this article is available online at https://doi.org/10.5194/acp-25-13429-2025-supplement.
PTMH conducted all the analysis and composed the text. YK supervised the findings of this study and contributed significantly to manuscript revisions. KY owns the CMAQ model code and provides the model's inputs and results. SI provided Comprehensive Air quality Model with eXtensions data of BC and CO concentrations, which were used to calculate the error estimate for the transport. SC provided the model-ready emission inputs. TS provided the CO_TCR2 data. YK, KY, and TS thoroughly discussed the analysis results before and during the manuscript writing. MDAH, JPB, HS, ML, MP, and BH provided the EMeRGe-Asia campaign's data used in the study. All authors have contributed to the manuscript, corrections, post-writing formatting, and revisions in reviewing and interpreting the results presented.
At least one of the (co-)authors is a member of the editorial board of Atmospheric Chemistry and Physics. The peer-review process was guided by an independent editor, and the authors also have no other competing interests to declare.
Publisher's note: Copernicus Publications remains neutral with regard to jurisdictional claims made in the text, published maps, institutional affiliations, or any other geographical representation in this paper. While Copernicus Publications makes every effort to include appropriate place names, the final responsibility lies with the authors. Views expressed in the text are those of the authors and do not necessarily reflect the views of the publisher.
We thank Z. Klimont for the calculation details in the ECLIPSEv6b inventory for BC emissions used in Sect. 3.2.2. Earth Simulator was used for the data assimilation calculation of CO_TCR2 data via the Japan Agency for Marine-Earth Science and Technology support. We thank Gareth Thomas from Edanz (https://jp.edanz.com/home, last access: 17 October 2025) for editing a draft of this manuscript.
This study is supported by the Environmental Research and Technology Development Fund (ERTDF) from the Ministry of the Environment, Japan (grant nos. 2-2201: JPMEERF20222001 and S-22: JPMEERF24S12200). The ERTDF grant has supported the simulations using the CMAQ model no. 5-1601: JPMEERF20165001 and JSPS KAKENHI grant no. 23K25011. The HALO deployment during EMeRGe was funded by a consortium comprising the German Research Foundation (DFG) Priority Program HALO-SPP 1294, the Institute of Atmospheric Physics of DLR, the Max Planck Society (MPG), the Helmholtz Association, and the RCEC Academia Sinica in Taiwan. The University of Bremen supported in part the EMeRGe measurements and the contributions made by Maria Dolores Andrés Hernández and John Philip Burrows.
This paper was edited by Andreas Hofzumahaus and reviewed by Sagar Rathod and one anonymous referee.
Akagi, S. K., Yokelson, R. J., Wiedinmyer, C., Alvarado, M. J., Reid, J. S., Karl, T., Crounse, J. D., and Wennberg, P. O.: Emission factors for open and domestic biomass burning for use in atmospheric models, Atmos. Chem. Phys., 11, 4039–4072, https://doi.org/10.5194/acp-11-4039-2011, 2011.
Andela, N., Morton, D. C., Giglio, L., Paugam, R., Chen, Y., Hantson, S., van der Werf, G. R., and Randerson, J. T.: The Global Fire Atlas of individual fire size, duration, speed and direction, Earth Syst. Sci. Data, 11, 529–552, https://doi.org/10.5194/essd-11-529-2019, 2019.
Andrés Hernández, M. D., Hilboll, A., Ziereis, H., Förster, E., Krüger, O. O., Kaiser, K., Schneider, J., Barnaba, F., Vrekoussis, M., Schmidt, J., Huntrieser, H., Blechschmidt, A.-M., George, M., Nenakhov, V., Harlass, T., Holanda, B. A., Wolf, J., Eirenschmalz, L., Krebsbach, M., Pöhlker, M. L., Kalisz Hedegaard, A. B., Mei, L., Pfeilsticker, K., Liu, Y., Koppmann, R., Schlager, H., Bohn, B., Schumann, U., Richter, A., Schreiner, B., Sauer, D., Baumann, R., Mertens, M., Jöckel, P., Kilian, M., Stratmann, G., Pöhlker, C., Campanelli, M., Pandolfi, M., Sicard, M., Gómez-Amo, J. L., Pujadas, M., Bigge, K., Kluge, F., Schwarz, A., Daskalakis, N., Walter, D., Zahn, A., Pöschl, U., Bönisch, H., Borrmann, S., Platt, U., and Burrows, J. P.: Overview: On the transport and transformation of pollutants in the outflow of major population centres – observational data from the EMeRGe European intensive operational period in summer 2017, Atmos. Chem. Phys., 22, 5877–5924, https://doi.org/10.5194/acp-22-5877-2022, 2022.
Bond, T. C., Covert, D. S., Kramlich J. C., Larson, T. V., and Charlson, R. J.: Primary particle emissions from residential coal burning: Optical properties and size distributions, J. Geophys. Res., 107, 8347, https://doi.org/10.1029/2001JD000571, 2002.
Byun, D. and Schere, K. L.: Review of the Governing Equations, Computational Algorithms, and Other Components of the Models-3 Community Multiscale Air Quality (CMAQ) Modeling System, Appl. Mech. Rev., 59, 51–77, https://doi.org/10.1115/1.2128636, 2006.
Cai, Q., Zeng, N., Zhao, F., Han, P., Liu, D., Lin, X., and Chen, J.: The impact of human and livestock respiration on CO2 emissions from 14 global cities, Carbon Balance and Management, 17, 17, https://doi.org/10.1186/s13021-022-00217-7, 2022.
CETO project team: China Energy Transformation Outlook 2023, Energy Research Institute of Chinese Academy of Macroeconomic Research, https://www.cet.energy/2023/12/14/china-energy-transformation-outlook-2023/ (last access: 20 October 2025), 2023.
Chandra, N., Lal, S., Venkataramani, S., Patra, P. K., and Sheel, V.: Temporal variations of atmospheric CO2 and CO at Ahmedabad in western India, Atmos. Chem. Phys., 16, 6153–6173, https://doi.org/10.5194/acp-16-6153-2016, 2016.
Chatani, S., Yamaji, K., Sakurai, T., Itahashi, S., Shimadera, H., Kitayama, K., and Hayami, H.: Overview of Model Inter-Comparison in Japan's Study for Reference Air Quality Modeling (J-STREAM), Atmosphere, 9, 19, https://doi.org/10.3390/atmos9010019, 2018.
Chatani, S., Shimadera, H., Itahashi, S., and Yamaji, K.: Comprehensive analyses of source sensitivities and apportionments of PM2.5 and ozone over Japan via multiple numerical techniques, Atmos. Chem. Phys., 20, 10311–10329, https://doi.org/10.5194/acp-20-10311-2020, 2020.
Chatani, S., Kitayama, K., Itahashi, S., Irie, H., and Shimadera, H.: Effectiveness of emission controls implemented since 2000 on ambient ozone concentrations in multiple timescales in Japan: An emission inventory development and simulation study, Science of the Total Environment, 894, 165058, https://doi.org/10.1016/j.scitotenv.2023.165058, 2023.
Chen, H. and Chen, W.: Potential impact of shifting coal to gas and electricity for building sectors in 28 major northern cities of China, Applied Energy, 236, 1049–1061, https://doi.org/10.1016/j.apenergy.2018.12.051, 2019.
Chen, H., Winderlich, J., Gerbig, C., Hoefer, A., Rella, C. W., Crosson, E. R., Van Pelt, A. D., Steinbach, J., Kolle, O., Beck, V., Daube, B. C., Gottlieb, E. W., Chow, V. Y., Santoni, G. W., and Wofsy, S. C.: High-accuracy continuous airborne measurements of greenhouse gases (CO2 and CH4) using the cavity ring-down spectroscopy (CRDS) technique, Atmos. Meas. Tech., 3, 375–386, https://doi.org/10.5194/amt-3-375-2010, 2010.
Chen, Y., Zhi, G., Feng, Y., Fu, J., Feng, J., Sheng, G., and Simoneit, B. R. T.: Measurements of emission factors for primary carbonaceous particles from residential raw-coal combustion in China, Geophysical Research Letters, 33, L20815, https://doi.org/10.1029/2006GL026966, 2006.
Chen, Y., Zhi, G., Feng, Y., Liu, D., Zhang, G., Li, J., Sheng, G., and Fu, J.: Measurements of Black and Organic Carbon Emission Factors for Household Coal Combustion in China: Implication for Emission Reduction, Environ. Sci. Technol., 43, 9495–9500, 2009.
Chi, X., Winderlich, J., Mayer, J.-C., Panov, A. V., Heimann, M., Birmili, W., Heintzenberg, J., Cheng, Y., and Andreae, M. O.: Long-term measurements of aerosol and carbon monoxide at the ZOTTO tall tower to characterize polluted and pristine air in the Siberian taiga, Atmos. Chem. Phys., 13, 12271–12298, https://doi.org/10.5194/acp-13-12271-2013, 2013.
Choi, Y., Kanaya, Y., Park, S.-M., Matsuki, A., Sadanaga, Y., Kim, S.-W., Uno, I., Pan, X., Lee, M., Kim, H., and Jung, D. H.: Regional variability in black carbon and carbon monoxide ratio from long-term observations over East Asia: assessment of representativeness for black carbon (BC) and carbon monoxide (CO) emission inventories, Atmos. Chem. Phys., 20, 83–98, https://doi.org/10.5194/acp-20-83-2020, 2020.
CMAQ version 5.0.2 Technical Documentation: CMASWIKI, https://cmascenter.org/cmaq/wiki/airqualitymodeling.org/index.php/CMAQ_version_5.0.2_(April_2014_release)_Technical_Documentation (last access: 3 June 2025), 2014.
Crippa, M., Guizzardi, D., Muntean, M., Schaaf, E., Dentener, F., van Aardenne, J. A., Monni, S., Doering, U., Olivier, J. G. J., Pagliari, V., and Janssens-Maenhout, G.: Gridded emissions of air pollutants for the period 1970–2012 within EDGAR v4.3.2, Earth Syst. Sci. Data, 10, 1987–2013, https://doi.org/10.5194/essd-10-1987-2018, 2018.
Cristofanelli, P., Fierli, F., Marinoni, A., Calzolari, F., Duchi, R., Burkhart, J., Stohl, A., Maione, M., Arduini, J., and Bonasoni, P.: Influence of biomass burning and anthropogenic emissions on ozone, carbon monoxide and black carbon at the Mt. Cimone GAW-WMO global station (Italy, 2165 m a.s.l.), Atmos. Chem. Phys., 13, 15–30, https://doi.org/10.5194/acp-13-15-2013, 2013.
Deroubaix, A., Vountas, M., Gaubert, B., Andrés Hernández, M. D., Borrmann, S., Brasseur, G., Holanda, B., Kanaya, Y., Kaiser, K., Kluge, F., Krüger, O. O., Labuhn, I., Lichtenstern, M., Pfeilsticker, K., Pöhlker, M., Schlager, H., Schneider, J., Siour, G., Swain, B., Tuccella, P., Vinjamuri, K. S., Vrekoussis, M., Weyland, B., and Burrows, J. P.: Air quality model assessment in city plumes of Europe and East Asia, EGUsphere [preprint], https://doi.org/10.5194/egusphere-2024-516, 2024a.
Deroubaix, A., Vountas, M., Gaubert, B., Andrés Hernández, M. D., Borrmann, S., Brasseur, G., Holanda, B., Kanaya, Y., Kaiser, K., Kluge, F., Krüger, O. O., Labuhn, I., Lichtenstern, M., Pfeilsticker, K., Pöhlker, M., Schlager, H., Schneider, J., Siour, G., Swain, B., Tuccella, P., Vinjamuri, K. S., Vrekoussis, M., Weyland, B., and Burrows, J. P.: Proportional relationships between carbonaceous aerosols and trace gases in city plumes of Europe and East Asia, EGUsphere [preprint], https://doi.org/10.5194/egusphere-2024-521, 2024b.
Draxler, R., Stunder, B., Rolph, G., Stein, A., and Taylor, A.: HYSPLIT4 user's guide, version 4, http://www.arl.noaa.gov/documents/reports/hysplit_user_guide.pdf (last access: 27 June 2019), 2018.
Folkins, I., Chatfield, R. B., Baumgardner, D., and Proffitt, M.: Biomass burning and deep convection in Southeast Asia: results from ASHOE/MAESA, Journal of Geophysical Research, 102, 13291–13299, https://doi.org/10.1029/96JD03711, 1997.
Formulation Committee for PM2.5 Emission Inventory and Source Profile: PM2.5 Emission Inventory and Source Profile, Social Systems Planning and Research Group, 380, in press, http://id.ndl.go.jp/bib/029742667 (last access: 20 October 2025), 2019 (in Japanese).
Friedlingstein, P., O'Sullivan, M., Jones, M. W., Andrew, R. M., Hauck, J., Olsen, A., Peters, G. P., Peters, W., Pongratz, J., Sitch, S., Le Quéré, C., Canadell, J. G., Ciais, P., Jackson, R. B., Alin, S., Aragão, L. E. O. C., Arneth, A., Arora, V., Bates, N. R., Becker, M., Benoit-Cattin, A., Bittig, H. C., Bopp, L., Bultan, S., Chandra, N., Chevallier, F., Chini, L. P., Evans, W., Florentie, L., Forster, P. M., Gasser, T., Gehlen, M., Gilfillan, D., Gkritzalis, T., Gregor, L., Gruber, N., Harris, I., Hartung, K., Haverd, V., Houghton, R. A., Ilyina, T., Jain, A. K., Joetzjer, E., Kadono, K., Kato, E., Kitidis, V., Korsbakken, J. I., Landschützer, P., Lefèvre, N., Lenton, A., Lienert, S., Liu, Z., Lombardozzi, D., Marland, G., Metzl, N., Munro, D. R., Nabel, J. E. M. S., Nakaoka, S.-I., Niwa, Y., O'Brien, K., Ono, T., Palmer, P. I., Pierrot, D., Poulter, B., Resplandy, L., Robertson, E., Rödenbeck, C., Schwinger, J., Séférian, R., Skjelvan, I., Smith, A. J. P., Sutton, A. J., Tanhua, T., Tans, P. P., Tian, H., Tilbrook, B., van der Werf, G., Vuichard, N., Walker, A. P., Wanninkhof, R., Watson, A. J., Willis, D., Wiltshire, A. J., Yuan, W., Yue, X., and Zaehle, S.: Global Carbon Budget 2020, Earth Syst. Sci. Data, 12, 3269–3340, https://doi.org/10.5194/essd-12-3269-2020, 2020.
Gemmill, W., Katz, B., and Li, X.: The Daily Real-Time, Global Sea Surface Temperature – High Resolution Analysis: RTG_SST_HR, NOAA/NWS/NCEP/EMC/MMAB, Science Application International Corporation, and Joint Center for Satellite Data Assimilation Technical Note Nr. 260, Environmental Modeling Center, Camp Springs, MD, USA, https://polar.ncep.noaa.gov/mmab/papers/tn260/MMAB260.pdf (last access: 30 May 2023), 2007.
Gerbig, C., Kley, D., Volz-Thomas, A., Kent, J., Dewey, K., and McKenna, D. S.: Fast response resonance fluorescence CO measurements aboard the C-130: Instrument characterization and measurements made during North Atlantic Regional Experiment 1993, J. Geophys. Res., 101, 29229–29238, https://doi.org/10.1029/95JD03272, 1996.
Giglio, L., Randerson, J. T., and van der Werf, G. R.: Analysis of daily, monthly, and annual burned area using the fourth-generation global fire emissions database (GFED4), J. Geophys. Res. Biogeosci., 118, 317–328, https://doi.org/10.1002/jgrg.20042, 2013.
Goode, J. G., Yokelson, R. J., Ward, D. E., Susott, R. A., Babbitt, R. E., Davies, M. A., and Hao, W. M.: Measurements of excess O3, CO2, CH4, C2H4, C2H2, HCN, NO, NH3, HCOOH, CH3COOH, HCHO, and CH3H in 1997 Alaskan biomass burning plumes by airborne Fourier transform infrared spectroscopy (AFTIR), J. Geophys. Res.-Atmos., 105, 22147–22166, https://doi.org/10.1029/2000JD900287, 2000.
Granier, C., Darras, S., van der Gon, H. D., Doubalova, J., Elguindi, N., Galle, B., Gauss, M., Guevara, M., Jalkanen, J.-P., Kuenen, J., Liousse, C., Quack, B., Simpson, D., and Sindelarova, K.: The Copernicus Atmosphere Monitoring Service global and regional emissions (April 2019 version), Copernicus Atmosphere Monitoring Service, https://doi.org/10.24380/d0bn-kx16, 2019.
Guenther, A. B., Jiang, X., Heald, C. L., Sakulyanontvittaya, T., Duhl, T., Emmons, L. K., and Wang, X.: The Model of Emissions of Gases and Aerosols from Nature version 2.1 (MEGAN2.1): an extended and updated framework for modeling biogenic emissions, Geosci. Model Dev., 5, 1471–1492, https://doi.org/10.5194/gmd-5-1471-2012, 2012.
Guo, Q., Hu, M., Guo, S., Wu, Z., Peng, J., and Wu, Y.: The variability in the relationship between black carbon and carbon monoxide over the eastern coast of China: BC aging during transport, Atmos. Chem. Phys., 17, 10395–10403, https://doi.org/10.5194/acp-17-10395-2017, 2017.
Ha, P. T. M., Kanaya, Y., Taketani, F., Andrés Hernández, M. D., Schreiner, B., Pfeilsticker, K., and Sudo, K.: Implementation of HONO into the chemistry–climate model CHASER (V4.0): roles in tropospheric chemistry, Geosci. Model Dev., 16, 927–960, https://doi.org/10.5194/gmd-16-927-2023, 2023.
Heald, C. L., Jacob, D. J., Palmer, P. I., Evans, M. J., Sachse, G. W., Singh, H. B., and Blake, D. R.: Biomass burning emission inventory with daily resolution: Application to aircraft observations of Asian outflow, J. Geophys. Res., 108, 8811, https://doi.org/10.1029/2002JD003082, 2003.
Hoesly, R. M., Smith, S. J., Feng, L., Klimont, Z., Janssens-Maenhout, G., Pitkanen, T., Seibert, J. J., Vu, L., Andres, R. J., Bolt, R. M., Bond, T. C., Dawidowski, L., Kholod, N., Kurokawa, J.-I., Li, M., Liu, L., Lu, Z., Moura, M. C. P., O'Rourke, P. R., and Zhang, Q.: Historical (1750–2014) anthropogenic emissions of reactive gases and aerosols from the Community Emissions Data System (CEDS), Geosci. Model Dev., 11, 369–408, https://doi.org/10.5194/gmd-11-369-2018, 2018.
Holanda, B. A., Pöhlker, M. L., Walter, D., Saturno, J., Sörgel, M., Ditas, J., Ditas, F., Schulz, C., Franco, M. A., Wang, Q., Donth, T., Artaxo, P., Barbosa, H. M. J., Borrmann, S., Braga, R., Brito, J., Cheng, Y., Dollner, M., Kaiser, J. W., Klimach, T., Knote, C., Krüger, O. O., Fütterer, D., Lavrič, J. V., Ma, N., Machado, L. A. T., Ming, J., Morais, F. G., Paulsen, H., Sauer, D., Schlager, H., Schneider, J., Su, H., Weinzierl, B., Walser, A., Wendisch, M., Ziereis, H., Zöger, M., Pöschl, U., Andreae, M. O., and Pöhlker, C.: Influx of African biomass burning aerosol during the Amazonian dry season through layered transatlantic transport of black carbon-rich smoke, Atmos. Chem. Phys., 20, 4757–4785, https://doi.org/10.5194/acp-20-4757-2020, 2020.
Huang, M., Carmichael, G. R., Pierce, R. B., Jo, D. S., Park, R. J., Flemming, J., Emmons, L. K., Bowman, K. W., Henze, D. K., Davila, Y., Sudo, K., Jonson, J. E., Tronstad Lund, M., Janssens-Maenhout, G., Dentener, F. J., Keating, T. J., Oetjen, H., and Payne, V. H.: Impact of intercontinental pollution transport on North American ozone air pollution: an HTAP phase 2 multi-model study, Atmos. Chem. Phys., 17, 5721–5750, https://doi.org/10.5194/acp-17-5721-2017, 2017.
IEA Bioenergy ExCo: IEA Bioenergy Countries’ Report – update 2021, Implementation of bioenergy in China, IEA Bioenergy, ISBN 978-1-910154-93-9, 2021.
Ikeda, K., Yamaji, K., Kanaya, Y., Taketani, F., Pan, X., Komazaki, Y., Kurokawa, J., and Ohara, T.: Sensitivity analysis of source regions to PM2.5 concentration at Fukue Island, Japan, J. Air Waste Manage. Assoc., 64, 445–452, https://doi.org/10.1080/10962247.2013.845618, 2014.
Ikeda, K., Tanimoto, H., Kanaya, Y., and Taketani, F.: Evaluation of anthropogenic emissions of black carbon from East Asia in six inventories: constraints from model simulations and surface observations on Fukue Island, Japan, Environ. Sci.: Atmos., 2, 416, https://doi.org/10.1039/d1ea00051a, 2022.
Ikeda, K., Tanimoto, H., Kanaya, Y., Taketani, F., and Matsuki, A.: Evaluation of Black Carbon Concentration Levels and Trends in East Asia from CMIP6 Climate Models: Comparison to Long-Term Observations in Japan and Biases Due to Chinese Emissions, SOLA, 19, 239–245, https://doi.org/10.2151/sola.2023-031, 2023.
Itahashi, S., Yamaji, K., Chatani, S., Hisatsune, K., Saito, S., and Hayami, H.: Model performance differences in sulfate aerosol in winter over Japan based on regional chemical transport models of CMAQ and CAMx, Atmosphere, 9, 488, https://doi.org/10.3390/atmos9120488, 2018.
Janssens-Maenhout, G., Crippa, M., Guizzardi, D., Dentener, F., Muntean, M., Pouliot, G., Keating, T., Zhang, Q., Kurokawa, J., Wankmüller, R., Denier van der Gon, H., Kuenen, J. J. P., Klimont, Z., Frost, G., Darras, S., Koffi, B., and Li, M.: HTAP_v2.2: a mosaic of regional and global emission grid maps for 2008 and 2010 to study hemispheric transport of air pollution, Atmos. Chem. Phys., 15, 11411–11432, https://doi.org/10.5194/acp-15-11411-2015, 2015.
Japan Petroleum Energy Center: PM2.5 Emission Inventory and Source Profile, 277, Tokyo: Petroleum and Energy Technology Center Automobile & New Fuel Department in press, http://id.ndl.go.jp/bib/028345411 (last access: 20 October 2025), 2017 (in Japanese).
Johnston, F. H., Henderson, S. B., Chen, Y., Randerson, J. T., Marlier, M., DeFries, R. S., Kinney, P., Bowman, D. M. J. S., and Brauer, M.: Estimated global mortality attributable to smoke from landscape fires, Environ. Health Perspect., 120, 695–701, https://doi.org/10.1289/ehp.1104422, 2012.
Kanaya, Y., Pan, X., Miyakawa, T., Komazaki, Y., Taketani, F., Uno, I., and Kondo, Y.: Long-term observations of black carbon mass concentrations at Fukue Island, western Japan, during 2009–2015: constraining wet removal rates and emission strengths from East Asia, Atmos. Chem. Phys., 16, 10689–10705, https://doi.org/10.5194/acp-16-10689-2016, 2016.
Kanaya, Y., Yamaji, K., Miyakawa, T., Taketani, F., Zhu, C., Choi, Y., Komazaki, Y., Ikeda, K., Kondo, Y., and Klimont, Z.: Rapid reduction in black carbon emissions from China: evidence from 2009–2019 observations on Fukue Island, Japan, Atmos. Chem. Phys., 20, 6339–6356, https://doi.org/10.5194/acp-20-6339-2020, 2020.
Kanaya, Y., Yamaji, K., Miyakawa, T., Taketani, F., Zhu, C., Choi, Y., Ikeda, K., Tanimoto, H., Yamada, D., Narita, D., Kondo, Y., and Klimont, Z.: Dominance of the residential sector in Chinese black carbon emissions as identified from downwind atmospheric observations during the COVID-19 pandemic, Scientific Reports, 11, 23378, https://doi.org/10.1038/s41598-021-02518-2, 2021.
Klimont, Z., Kupiainen, K., Heyes, C., Purohit, P., Cofala, J., Rafaj, P., Borken-Kleefeld, J., and Schöpp, W.: Global anthropogenic emissions of particulate matter including black carbon, Atmos. Chem. Phys., 17, 8681–8723, https://doi.org/10.5194/acp-17-8681-2017, 2017.
Kondo, Y., Komazaki, Y., Miyazaki, Y., Moteki, N., Takegawa, N., Kodama, D., Deguchi, S., Nogami, M., Fukuda, M., Miyakawa, T., Morino, Y., Koike, M., Sakurai, H., and Ehara, K.: Temporal variations of elemental carbon in Tokyo, J. Geophys. Res.-Atmos., 111, D12205, https://doi.org/10.1029/2005JD006257, 2006.
Kondo, Y., Matsui, H., Moteki, N., Sahu, L., Takegawa, N., Kajino, M., Zhao, Y., Cubison, M. J., Jimenez, J. L., Vay, S., Diskin, G. S., Anderson, B., Wisthaler, A., Mikoviny, T., Fuelberg, H. E., Blake, D. R., Huey, G., Weinheimer, A. J., Knapp, D. J., and Brune, W. H.: Emissions of black carbon, organic, and inorganic aerosols from biomass burning in North America and Asia in 2008, J. Geophys. Res.-Atmos., 116, D08204, https://doi.org/10.1029/2010JD015152, 2011.
Kurokawa, J. and Ohara, T.: Long-term historical trends in air pollutant emissions in Asia: Regional Emission inventory in ASia (REAS) version 3, Atmos. Chem. Phys., 20, 12761–12793, https://doi.org/10.5194/acp-20-12761-2020, 2020.
Kurokawa, J., Ohara, T., Morikawa, T., Hanayama, S., Janssens-Maenhout, G., Fukui, T., Kawashima, K., and Akimoto, H.: Emissions of air pollutants and greenhouse gases over Asian regions during 2000–2008: Regional Emission inventory in ASia (REAS) version 2, Atmos. Chem. Phys., 13, 11019–11058, https://doi.org/10.5194/acp-13-11019-2013, 2013.
Laborde, M., Crippa, M., Tritscher, T., Jurányi, Z., Decarlo, P. F., Temime-Roussel, B., Marchand, N., Eckhardt, S., Stohl, A., Baltensperger, U., Prévôt, A. S. H., Weingartner, E., and Gysel, M.: Black carbon physical properties and mixing state in the European megacity Paris, Atmos. Chem. Phys., 13, 5831–5856, https://doi.org/10.5194/acp-13-5831-2013, 2013.
Laursen, K. K., Hobbs, P. V., Radke, L. F., and Rasmussen, R. A.: Some trace gas emissions from North American biomass fires with an assessment of regional and global fluxes from biomass burning, J. Geophys. Res.-Atmos., 97, 20687–20701, https://doi.org/10.1029/92JD02168, 1992.
Le Canut, P., Andreae, M. O., Harris, G. W., Wienhold, F. G., and Zenker, T.: Airborne studies of emissions from savanna fires in southern Africa: 1. Aerosol emissions measured with a laser optical particle counter, J. Geophys. Res.-Atmos., 101, 23615–23630, https://doi.org/10.1029/95JD02610, 1996.
Lee, H.-H., Iraqui, O., Gu, Y., Yim, S. H.-L., Chulakadabba, A., Tonks, A. Y.-M., Yang, Z., and Wang, C.: Impacts of air pollutants from fire and non-fire emissions on the regional air quality in Southeast Asia, Atmos. Chem. Phys., 18, 6141–6156, https://doi.org/10.5194/acp-18-6141-2018, 2018.
Lei, Y., Zhang, Q., He, K. B., and Streets, D. G.: Primary anthropogenic aerosol emission trends for China, 1990–2005, Atmos. Chem. Phys., 11, 931–954, https://doi.org/10.5194/acp-11-931-2011, 2011.
Li, M., Liu, H., Geng, G., Hong, C., Liu, F., Song, Y., Tong, D., Zheng, B., Cui, H., Man, H., Zhang, Q., and He, K.: Anthropogenic emission inventories in China: a review, National Science Review, 4, 834–866, https://doi.org/10.1093/nsr/nwx150, 2017a.
Li, M., Zhang, Q., Kurokawa, J.-I., Woo, J.-H., He, K., Lu, Z., Ohara, T., Song, Y., Streets, D. G., Carmichael, G. R., Cheng, Y., Hong, C., Huo, H., Jiang, X., Kang, S., Liu, F., Su, H., and Zheng, B.: MIX: a mosaic Asian anthropogenic emission inventory under the international collaboration framework of the MICS-Asia and HTAP, Atmos. Chem. Phys., 17, 935–963, https://doi.org/10.5194/acp-17-935-2017, 2017b.
Liu, H. Y., Jacob, D. J., Bey, I., Yantosca, R. M., Duncan, B. N., and Sachse, G. W.: Transport pathways for Asian combustion outflow over the Pacific: interannual and seasonal variations, Journal of Geophysical Research, 108, 8786, https://doi.org/10.1029/2002JD003102, 2003.
Lu, Z., Zhang, Q., and Streets, D. G.: Sulfur dioxide and primary carbonaceous aerosol emissions in China and India, 1996–2010, Atmos. Chem. Phys., 11, 9839–9864, https://doi.org/10.5194/acp-11-9839-2011, 2011.
Matsui, H., Kondo, Y., Moteki, N., Takegawa, N., Sahu, L. K., Zhao, Y., Fuelberg, H. E., Sessions, W. R., Diskin, G., Blake, D. R., Wisthaler, A., and Koike, M.: Seasonal variation of the transport of black carbon aerosol from the Asian continent to the Arctic during the ARCTAS aircraft campaign, J. Geophys. Res.-Atmos., 116, D05202, https://doi.org/10.1029/2010JD015067, 2011.
Miyakawa, T., Oshima, N., Taketani, F., Komazaki, Y., Yoshino, A., Takami, A., Kondo, Y., and Kanaya, Y.: Alteration of the size distributions and mixing states of black carbon through transport in the boundary layer in east Asia, Atmos. Chem. Phys., 17, 5851–5864, https://doi.org/10.5194/acp-17-5851-2017, 2017.
Miyakawa, T., Mordovskoi, P., and Kanaya, Y.: Evaluation of black carbon mass concentrations using a miniaturized aethalometer: Intercomparison with a continuous soot monitoring system (COSMOS) and a single-particle soot photometer (SP2), Aerosol Science and Technology, 54, 811–825, https://doi.org/10.1080/02786826.2020.1724870, 2020.
Miyakawa, T., Ito, A., Zhu, C., Shimizu, A., Matsumoto, E., Mizuno, Y., and Kanaya, Y.: Trace elements in PM2.5 aerosols in East Asian outflow in the spring of 2018: emission, transport, and source apportionment, Atmos. Chem. Phys., 23, 14609–14626, https://doi.org/10.5194/acp-23-14609-2023, 2023.
Miyazaki, K., Bowman, K., Sekiya, T., Eskes, H., Boersma, F., Worden, H., Livesey, N., Payne, V. H., Sudo, K., Kanaya, Y., Takigawa, M., and Ogochi, K.: Updated tropospheric chemistry reanalysis and emission estimates, TCR-2, for 2005–2018, Earth Syst. Sci. Data, 12, 2223–2259, https://doi.org/10.5194/essd-12-2223-2020, 2020.
Myhre, G., Shindell, D., Bréon, F.-M., Collins, W., Fuglestvedt, J., Huang, J., Koch, D., Lamarque, J.-F., Lee, D., Mendoza, B., Nakajima, T., Robock, A., Stephens, G., Takemura, T., and Zhang, H.: Anthropogenic and Natural Radiative Forcing, in: Climate Change 2013: The Physical Science Basis, Contribution of Working Group I to the Fifth Assessment Report of the Inter-governmental Panel on Climate Change, Cambridge University Press, Cambridge, United Kingdom and New York, NY, USA, 659–740, https://doi.org/10.1017/CBO9781107415324.018, 2013.
Nance, J. D., Hobbs, P. V., Radke, L. F., and Ward, D. E.: Airborne measurements of gases and particles from an Alaskan wildfire, J. Geophy. Res.-Atmos., 98, 14873–14882, https://doi.org/10.1029/93JD01196, 1993.
National Centers for Environmental Prediction: National Weather Service, NOAA, U. S. Department of Commerce: NCEP FNL Operational Model Global Tropospheric Analyses, April 1997 through June 2007. Research Data Archive at the National Center for Atmospheric Research, Computational and Information Systems Laboratory, https://doi.org/10.5065/D6FB50XD, 1997.
Ohata, S., Mori, T., Kondo, Y., Sharma, S., Hyvärinen, A., Andrews, E., Tunved, P., Asmi, E., Backman, J., Servomaa, H., Veber, D., Eleftheriadis, K., Vratolis, S., Krejci, R., Zieger, P., Koike, M., Kanaya, Y., Yoshida, A., Moteki, N., Zhao, Y., Tobo, Y., Matsushita, J., and Oshima, N.: Estimates of mass absorption cross sections of black carbon for filter-based absorption photometers in the Arctic, Atmos. Meas. Tech., 14, 6723–6748, https://doi.org/10.5194/amt-14-6723-2021, 2021.
O'Rourke, P. R., Smith, S. J., Mott, A., Ahsan, H., McDuffie, E. E., Crippa, M., Klimont, Z., McDonald, B., Wang, S., Nicholson, M. B., Feng, L., and Hoesly, R. M.: CEDS v_2021_02_05 Release Emission Data (v_2021_02_05), Zenodo [data set], https://doi.org/10.5281/zenodo.4509372, 2021.
Oshima, N., Kondo, Y., Moteki, N., Takegawa, N., Koike, M., Kita, K., Matsui, H., Kajino, M., Nakamura, H., Jung, J. S., and Kim, Y. J.: Wet removal of black carbon in Asian outflow: Aerosol Radiative Forcing in East Asia (A-FORCE) aircraft campaign, J. Geophys. Res.-Atmos., 117, D03204, https://doi.org/10.1029/2011JD016552, 2012.
Palmer, P. I., Suntharalingam, P., Jones, D. B. A., Jacob, D. J., Streets, D. G., Fu, Q., Vay, S. A., and Sachse, G. W.: Using CO2:CO correlations to improve inverse analyses of carbon fluxes, J. Geophys. Res., 111, D12318, https://doi.org/10.1029/2005JD006697, 2006.
Paris, J.-D., Stohl, A., Nédélec, P., Arshinov, M. Yu., Panchenko, M. V., Shmargunov, V. P., Law, K. S., Belan, B. D., and Ciais, P.: Wildfire smoke in the Siberian Arctic in summer: source characterization and plume evolution from airborne measurements, Atmos. Chem. Phys., 9, 9315–9327, https://doi.org/10.5194/acp-9-9315-2009, 2009.
Reid, J. S., Hyer, E. J., Johnson, R. S., Holben, B. N., Yokelson, R. J., Zhang, J., Campbell, J. R., Christopher, S. A., Girolamo, L. D., Giglio, L., Holz, R. E., Kearney, C., Miettinen, J., Reid, E. A., Turk, F. J., Wang, J., Xian, P., Zhao, G., Balasubramanian, R., Chew, B. N., Janae, S., Lagos's, N., Lestari, P., Lin, N. H., Mahmud, M., Nguyen, A. X., Norris, B., Oanh, N. T. K., Oo, M., Salinas, S. V., Welton, E. J., and Liew, S. C.: Observing and understanding the Southeast Asian aerosol system by remote sensing: An initial review and analysis for the Seven Southeast Asian Studies (7SEAS) program, Atmos. Res., 122, 403–468, https://doi.org/10.1016/j.atmosres.2012.06.005, 2013.
Sawa, Y., Tanimoto, H., Yonemura, S., Matsueda, M., Mukai, H., Wada, A., Taguchi, S., Hayasaka, T., Tsuruta, H., Tohjima, Y., Mukai, H., Kikuchi, N., Katagiri, S., and Tsuboi, K.: Widespread pollution events of carbon monoxide observed over the western North Pacific during the East Asian Regional Experiment (EAREX) 2005 campaign, J. Geophys. Res.-Atmos, 112, D22S26, https://doi.org/10.1029/2006JD008055, 2007.
Schwarz, J. P., Gao, R. S., Fahey, D. W., Thomson, D. S., Watts, L. A., Wilson, J. C., Reeves, J. M., Darbeheshti, M., Baumgardner, D. G., Kok, G. L., Chung, S. H., Schulz, M., Hendricks, J., Lauer, A., Kärcher, B., Slowik, J. G., Rosenlof, K. H., Thompson, T. L., Langford, A. O., Loewenstein, M., and Aikin, K. C.: Single-particle measurements of midlatitude black carbon and light-scattering aerosols from the boundary layer to the lower stratosphere, J. Geophys. Res.-Atmos., 111, 1–15, https://doi.org/10.1029/2006JD007076, 2006.
Shibata, Y. and Morikawa, T.: Review of the JCAP/JATOP Air Quality Model Study in Japan, Atmosphere, 12, 943, https://doi.org/10.3390/atmos12080943, 2021.
Shindell, D., Kuenstler, J. C. I., Vignati, E., van Dineen, R., Amann, M., Kimono, Z., Anenberg, S. C., Muller, N., Janssens-Maenhout, G., Raes, F., Schwartz, J., Flavia, G., Pozzoli, L., Kupiainen, K., Höglund-Isaksson, L., Emberson, L., Streets, D., Ramanathan, V., Hicks, K., Oanh, N. T. K., Milly, G., Williams, M., Demines, V., and Fowler, D.: Simultaneously Mitigating Near-Term Climate Change and Improving Human Health and Food Security, Science, 335, 183–189, https://doi.org/10.1126/science.1210026, 2012.
Skamarock, W. C., Klemp, J. B., Dudhia, J., Gill, D. O., Barker, D. M., Duda, M. G., Huang, X. Y., Wang, W., and Power, J. G.: A Description of the Advanced Research WRF Version 3 (NCAR/TN-475+STR), University Corporation for Atmospheric Research, https://doi.org/10.5065/D68S4MVH, 2008.
Stein, A. F., Draxler, R. R., Rolph, G. D., Stunder, B. J. B., Cohen, M. D., and Ngan, F.: NOAA's HYSPLIT Atmospheric Transport and Dispersion Modeling System, Bulletin of the American Meteorological Society, 96, 2059–2077, https://doi.org/10.1175/BAMS-D-14-00110.1, 2015.
Sudo, K., Takahashi, M., Kurokawa, J., and Akimoto, H.: CHASER: A global chemical model of the troposphere – 1. Model description. J. Geophys. Res. Atmos., 107, https://doi.org/10.1029/2001JD001113, 2002.
Sun, J., Zhi, G., Hitzenberger, R., Chen, Y., Tian, C., Zhang, Y., Feng, Y., Cheng, M., Zhang, Y., Cai, J., Chen, F., Qiu, Y., Jiang, Z., Li, J., Zhang, G., and Mo, Y.: Emission factors and light absorption properties of brown carbon from household coal combustion in China, Atmos. Chem. Phys., 17, 4769–4780, https://doi.org/10.5194/acp-17-4769-2017, 2017.
Suntharalingam, P., Jacob, D. J., Palmer, P. I., Logan, J. A., Yantosca, R. M., Xiao, Y., Evans, M. J., Streets, D. G., Vay, S. L., and Sachse, G. W.: Improved quantification of Chinese carbon fluxes using CO2/CO correlations in Asian outflow, J. Geophys. Res., 109, D18S18, https://doi.org/10.1029/2003JD004362, 2004.
Szopa, S., Naik, V., Adhikary, B., Artaxo, P., Berntsen, T., Collins, W. D., Fuzzi, S., Gallardo, L., Kiendler-Scharr, A., Klimont, Z., Liao, H., Unger, N., and Zanis, P.: Short-Lived Climate Forcers, in: Climate Change 2021: The Physical Science Basis. Contribution of Working Group I to the Sixth Assessment Report of the Intergovernmental Panel on Climate Change, edited by: Masson-Delmotte, V., Zhai, P., Pirani, A., Connors, S. L., Péan, C., Berger, S., Caud, N., Chen, Y., Goldfarb, L., Gomis, M. I., Huang, M., Leitzell, K., Lonnoy, E., Matthews, J. B. R., Maycock, T. K., Waterfield, T., Yelekçi, O., Yu, R., and Zhou, B., Cambridge University Press, Cambridge, United Kingdom and New York, NY, USA, 817–922, https://doi.org/10.1017/9781009157896.008, 2021.
Takegawa, N., Kondo, Y., Koike, M., Chen, G., Machida, T., Watai, T., Blake, D. R., Streets, D. G., Woo, J.-H., Carmichael, G. R., Kita, K., Miyazaki, Y., Shirai, T., Liley, J. B., and Ogawa, T.: Removal of NOx and NOy in Asian outflow plumes: Aircraft measurements over the western Pacific in January 2002, J. Geophys. Res., 109, D23S04, https://doi.org/10.1029/2004JD004866, 2004.
Tang, W., Arellano, A. F., DiGangi, J. P., Choi, Y., Diskin, G. S., Agustí-Panareda, A., Parrington, M., Massart, S., Gaubert, B., Lee, Y., Kim, D., Jung, J., Hong, J., Hong, J.-W., Kanaya, Y., Lee, M., Stauffer, R. M., Thompson, A. M., Flynn, J. H., and Woo, J.-H.: Evaluating high-resolution forecasts of atmospheric CO and CO2 from a global prediction system during KORUS-AQ field campaign, Atmos. Chem. Phys., 18, 11007–11030, https://doi.org/10.5194/acp-18-11007-2018, 2018.
Tohjima, Y., Mukai, H., Hashimoto, S., and Patra, P. K.: Increasing synoptic scale variability in atmospheric CO2 at Hateruma Island associated with increasing East-Asian emissions, Atmos. Chem. Phys., 10, 453–462, https://doi.org/10.5194/acp-10-453-2010, 2010.
van der Werf, G. R., Randerson, J. T., Giglio, L., van Leeuwen, T. T., Chen, Y., Rogers, B. M., Mu, M., van Marle, M. J. E., Morton, D. C., Collatz, G. J., Yokelson, R. J., and Kasibhatla, P. S.: Global fire emissions estimates during 1997–2016, Earth Syst. Sci. Data, 9, 697–720, https://doi.org/10.5194/essd-9-697-2017, 2017.
Vasileva, A., Moiseenko, K., Skorokhod, A., Belikov, I., Kopeikin, V., and Lavrova, O.: Emission ratios of trace gases and particles for Siberian forest fires on the basis of mobile ground observations, Atmos. Chem. Phys., 17, 12303–12325, https://doi.org/10.5194/acp-17-12303-2017, 2017.
Verma, R. L., Kondo, Y., Oshima, N., Matsui, H., Kita, K., Sahu, L. K., Kato, S., Kajii, Y., Takami, A., and Miyakawa, T.: Seasonal variations of the transport of black carbon and carbon monoxide from the Asian continent to the western Pacific in the boundary layer, J. Geophys. Res.-Atmos., 116, D21307, https://doi.org/10.1029/2011JD015830, 2011.
Wada, A., Matsueda, H., Sawa, Y., Tsuboi, K., and Okubo, S.: Seasonal variation of enhancement ratios of trace gases observed over 10 years in the western North Pacific, Atmospheric Environment, 45, 2129–2137, https://doi.org/10.1016/j.atmosenv.2011.01.043, 2011.
Wang, Y., Munger, J. W., Xu, S., McElroy, M. B., Hao, J., Nielsen, C. P., and Ma, H.: CO2 and its correlation with CO at a rural site near Beijing: implications for combustion efficiency in China, Atmos. Chem. Phys., 10, 8881–8897, https://doi.org/10.5194/acp-10-8881-2010, 2010.
Ward, D. E., Susott, R. A., Kauffman, J. B., Babbitt, R. E., Cummings, D. L., Dias, B., Holben, B. N., Kaufman, Y. J., Rasmussen, R. A., and Setzer, A. W.: Smoke and fire characteristics for cerrado and deforestation burns in Brazil: BASEB Experiment, J. Geophys. Res.-Atmos., 97, 14601–14619, https://doi.org/10.1029/92JD01218, 1992.
Warneke, C., Bahreini, R., Brioude, J., Brock, C. A., de Gouw, J. A., Fahey, D. W., Froyd, K. D., Holloway, J. S., Middlebrook, A., Miller, L., Montzka, S., Murphy, D. M., Peischl, J., Ryerson, T. B., Schwarz, J. P., Spackman, J. R., and Veres, P.: Biomass burning in Siberia and Kazakhstan as an important source for haze over the Alaskan Arctic in April 2008, Geophys. Res. Lett., 36, L02813, https://doi.org/10.1029/2008GL036194, 2009.
World Health Organization: WHO global air quality guidelines. Particulate matter (PM2.5 and PM10), ozone, nitrogen dioxide, sulfur dioxide and carbon monoxide, Geneva, 290 pp., ISBN 978-92-4-003422-8, 2021.
Wu, D., Liu, J., Wennberg, P. O., Palmer, P. I., Nelson, R. R., Kiel, M., and Eldering, A.: Towards sector-based attribution using intra-city variations in satellite-based emission ratios between CO2 and CO, Atmos. Chem. Phys., 22, 14547–14570, https://doi.org/10.5194/acp-22-14547-2022, 2022.
Yamaji, K., Chatani, S., Itahashi, S., Saito, M., Takigawa, M., Morikawa, T., Kanda, I., Miya, Y., Komatsu, H., Sakurai, T., Morino, Y., Kitayama, K., Nagashima, T., Shimadera, H., Uranishi, K., Fujiwara, Y., Hashimoto, T., Sudo, K., Misaki, T., and Hayami, H.: Model Inter-Comparison for PM2.5 Components over urban Areas in Japan in the J-STREAM Framework, Atmosphere, 11, 222, https://doi.org/10.3390/atmos11030222, 2020.
Yokelson, R. J., Goode, J., Ward, D. E., Susott, R. A., Babbitt, R. E., Wade, D. D., Bertschi, I., Griffith, D. W. T., and Hao, W. M.: Emissions of formaldehyde, acetic acid, methanol, and other trace gases from biomass fires in North Carolina measured by airborne Fourier transform infrared spectroscopy, J. Geophys. Res.-Atmos., 104, 30109–30125, https://doi.org/10.1029/1999JD900817, 1999.
Yokelson, R. J., Andreae, M. O., and Akagi, S. K.: Pitfalls with the use of enhancement ratios or normalized excess mixing ratios measured in plumes to characterize pollution sources and aging, Atmos. Meas. Tech., 6, 2155–2158, https://doi.org/10.5194/amt-6-2155-2013, 2013.
Zhang, B., Wang, S., Wang, D., Wang, Q., Yang, X., and Tong, R.: Air quality changes in China 2013–2020: Effectiveness of clean coal technology policies, Journal of Cleaner Production, 366, 132961, https://doi.org/10.1016/j.jclepro.2022.132961, 2022.
Zhang, F., Chen, Y., Tian, C., Lou, D., Li, J., Zhang, G., and Matthias, V.: Emission factors for gaseous and particulate pollutants from offshore diesel engine vessels in China, Atmos. Chem. Phys., 16, 6319–6334, https://doi.org/10.5194/acp-16-6319-2016, 2016.
Zhang, Q., Streets, D. G., Carmichael, G. R., He, K. B., Huo, H., Kannari, A., Klimont, Z., Park, I. S., Reddy, S., Fu, J. S., Chen, D., Duan, L., Lei, Y., Wang, L. T., and Yao, Z. L.: Asian emissions in 2006 for the NASA INTEX-B mission, Atmos. Chem. Phys., 9, 5131–5153, https://doi.org/10.5194/acp-9-5131-2009, 2009.
Zhang, Y., Schauer, J. J., Zhang, Y., Zeng, L., Wei, Y., Liu, Y., and Shao, M.: Characteristics of Particulate Carbon Emissions from Real-World Chinese Coal Combustion, Environ. Sci. Technol., 42, 5068–5073, 2008.
Zhao, Y., Nielsen, C. P., Lei, Y., McElroy, M. B., and Hao, J.: Quantifying the uncertainties of a bottom-up emission inventory of anthropogenic atmospheric pollutants in China, Atmos. Chem. Phys., 11, 2295–2308, https://doi.org/10.5194/acp-11-2295-2011, 2011.
Zhao, Y., Zhang, J., and Nielsen, C. P.: The effects of recent control policies on trends in emissions of anthropogenic atmospheric pollutants and CO2 in China, Atmos. Chem. Phys., 13, 487–508, https://doi.org/10.5194/acp-13-487-2013, 2013.
Zheng, B., Tong, D., Li, M., Liu, F., Hong, C., Geng, G., Li, H., Li, X., Peng, L., Qi, J., Yan, L., Zhang, Y., Zhao, H., Zheng, Y., He, K., and Zhang, Q.: Trends in China's anthropogenic emissions since 2010 as the consequence of clean air actions, Atmos. Chem. Phys., 18, 14095–14111, https://doi.org/10.5194/acp-18-14095-2018, 2018.
Zheng, B., Zhang, Q., Geng, G., Chen, C., Shi, Q., Cui, M., Lei, Y., and He, K.: Changes in China's anthropogenic emissions and air quality during the COVID-19 pandemic in 2020, Earth Syst. Sci. Data, 13, 2895–2907, https://doi.org/10.5194/essd-13-2895-2021, 2021.
Zhi, G., Chen, Y., Feng, Y., Xiong, S., Li, J., Zhang, G., Sheng, G., and Fu, J.: Emission characteristics of carbonaceous particles from various residential coal-stoves in China, Environ. Sci. Technol., 42, 3310–3315, https://doi.org/10.1021/es702247q, 2008.
Zhu, C., Kanaya, Y., Yoshikawa-Inoue, H., Irino, T., Seki, O., and Tohjima, Y.: Sources of atmospheric black carbon and related carbonaceous components at Rishiri Island, Japan: The roles of Siberian wildfires and of crop residue burning in China, Environmental Pollution, 247, 55–63, https://doi.org/10.1016/j.envpol.2019.01.003, 2019.