the Creative Commons Attribution 4.0 License.
the Creative Commons Attribution 4.0 License.
 | 21 Oct 2025
Contributions of primary anthropogenic sources and rapid secondary transformations to organic aerosol pollution in Nanchang, Central China
Wei Guo
Zicong Li
Renguo Zhu
Zhongkui Zhou
Hongwei Xiao
Huayun Xiao
Due to the complex composition of organic aerosols (OAs), identifying their sources and understanding their dynamics remain challenging, particularly in urban environments of China where natural and anthropogenic influences to OAs intersect. This study aimed to clarify the relative contributions of primary emissions and secondary formation to urban OAs and confirm the sources and influencing factors of OA pollution. We analyzed major polar organic compounds in fine particulate matter (PM2.5) collected over one year in Nanchang, Central China. Specific biomarkers and diagnostic ratios were applied to characterize OA sources and distribution patterns, while chemical mass balance (CMB) models and tracer-based approaches were used to estimate source contributions. Statistical analyses were conducted to investigate OA characteristics and drivers during winter pollution episodes. Notably, fatty acids, fatty alcohols, and saccharides predominated over lignin, resin products, sterols, glycerol, hydroxy acids, and aromatic acids, with molecular profiles indicating both anthropogenic and biogenic origins. Source apportionment results showed that primary organic carbon (POC) and primary OAs (POAs) contributed 58 % of total organic carbon and 23 % of PM2.5 mass, respectively, compared with 8 % and 4 % from secondary organic carbon (SOC) and secondary OAs (SOAs). Anthropogenic sources dominated, accounting for approximately 90 % of POC and POAs as well as 60 % of SOC and SOAs. Seasonal patterns revealed stronger biogenic influences in spring–summer, whereas anthropogenic emissions dominated in autumn–winter. Short-term winter episodes were characterized by rapid secondary formation, facilitated by elevated primary emissions and favorable oxidation conditions, including enhanced light intensity and nitrogen oxides.
- Article
(4040 KB) - Full-text XML
-
Supplement
(3524 KB) - BibTeX
- EndNote


Fine particulate matter (PM), specifically PM with an aerodynamic diameter of < 2.5 µm (PM2.5), affects the environment and climate, posing severe threats to human health (Huebert et al., 2003; Kanakidou et al., 2005; Riipinen et al., 2012; Shiraiwa et al., 2017; Yazdani et al., 2021). This is evident in China, which has become a focal point for PM2.5 pollution, characterized by recurrent haze episodes that have intensified since 2011 (Cao et al., 2012; Zhang et al., 2012; Huang et al., 2014). To tackle this pressing challenge, the Chinese government has implemented various measures, including the Air Pollution Prevention and Control Action Plan in 2013, revisions to the Air Pollution Prevention and Control Law in 2014, and the Three-year Action Plan for Winning the Blue Sky Defense War in 2018. Such initiatives have remarkably reduced PM2.5 levels, with concentrations below 35 µg m−3 as of 2020 (Fig. S1a in the Supplement). However, the challenge persists, particularly during winter, as exemplified by the winter of 2023–2024 when PM2.5 concentrations in many cities exceeded the national air quality standards (Fig. S1b and c). This underscores an urgent need for effective air quality management strategies (An et al., 2019; Cao and Cui, 2021; Chen et al., 2021; Wu et al., 2021; Zhang et al., 2024a). To address urban PM2.5 pollution, comprehensive investigation of pollutant components, identification of pollution sources, and evaluation of influencing factors are required.
Organic components constitute an important part of PM2.5, accounting for 30 %–50 % of its mass, with primary and secondary sources (Huang et al., 2014; Zhang et al., 2016; Haque et al., 2022). Primary organic carbon (POC) or primary organic aerosol (POA) is directly emitted from various sources, including biomass burning, coal combustion, vehicle exhaust, cooking, plant debris, and fungal spores (Guo et al., 2012; Yazdani et al., 2021). Secondary organic carbon (SOC) or secondary organic aerosol (SOA) forms in the atmosphere through the photooxidation of biogenic and anthropogenic volatile organic compounds (BVOCs and AVOCs, respectively) (Lewandowski et al., 2008; Stone et al., 2009). Common biogenic precursors include hemiterpenes, monoterpenes, and sesquiterpenes, whereas typical anthropogenic precursors include toluene and polycyclic aromatic hydrocarbons (PAHs) (Claeys et al., 2004; Al-Naiema and Stone, 2017; Jaoui et al., 2019). Owing to the complex composition of OAs, their diverse emission sources, and the impact of meteorological conditions and photochemical oxidation processes, OA source identification is complicated (Ding et al., 2013; Zhang et al., 2024b). For years, research on the composition and source apportionment of OAs has attracted considerable attention. However, a unified conclusion regarding OA sources, particularly in China's intricate urban environments influenced by natural and anthropogenic factors, remains elusive (Wang et al., 2006; Fu et al., 2008; Guo et al., 2012; Ding et al., 2014; Xu et al., 2022). Various source apportionment methods have been employed. Such methods include the elemental carbon-based and water soluble OC-based methods (EC-based and WSOC-based methods, respectively; Xu et al., 2021), the compound tracer method (tracer-based method; Ding et al., 2014; Ren et al., 2021; Haque et al., 2023), the isotope signature method (Tang et al., 2022; Xu et al., 2022, 2023; Zhang et al., 2024b), and the use of source apportionment models, such as the chemical mass balance (CMB) and positive matrix factorization models (Xu et al., 2021; Zhang et al., 2023). However, these methods yielded different source contributions. The relative significance of primary emissions versus secondary formation in urban OAs continues to be controversial. Further investigation is required to clarify the sources of OA pollution and the influencing factors.
Thus, this research presents a comprehensive assessment of OAs in Nanchang, a city in Central China characterized by moderate PM2.5 pollution levels that reflect broad urban atmospheric conditions across China (Fig. S1). Employing the CMB model and tracer-based method, as well as EC-based method, we quantitatively evaluated the contributions of POC and SOC to OC, as well as the contributions of the corresponding POA and SOA to the mass of PM2.5. Results showed that urban OAs were predominantly influenced by anthropogenic sources, with primary contributions exceeding secondary contributions. Based on a continuous year-long observation (1 November 2020 to 31 October 2021, 365 daily samples), we discovered that the anthropogenic contributions significantly increased in autumn and winter. However, the biogenic contributions increased in spring and summer. Short-term winter pollution episodes were promoted by rapid secondary transformation, primarily due to high primary emissions and favorable oxidation conditions, including increased light intensity and nitrogen oxides (NOx). This study integrates multiple source apportionment methods and accounts for the seasonal characteristics of OA pollution, providing a robust framework for understanding urban air quality dynamics. The findings have implications for governmental strategies for mitigating air pollution and preventing haze episodes in Nanchang and its environs. The insights obtained serve as a future reference for investigating the impacts of organic compounds in PM2.5 on visibility, public health, and climate change.
2.1 Sampling sites and sample collection
The study area was Nanchang, Central China, with sampling at the East China University of Technology located in the northwest region of the city (28.72° N, 115.83° E). As detailed in our previous investigations (Guo et al., 2024a, b), the sampling site was in a mixed-use area characterized by educational, commercial, transportation, and residential activities, devoid of significant local pollution sources. The sampler was strategically placed on the rooftop of a six-story building, approximately 20 m in height, ensuring an unobstructed sampling environment.
Sampling was conducted from 1 November 2020, to 31 October 2021, with daily PM2.5 sample collections. An 8-inch × 10-inch quartz fiber filter (Pall Tissuquartz, USA) was employed in a high-volume air sampler at a flow rate of 1.05 ± 0.03 m3 min−1 for sample collection. The meteorological parameters and gaseous pollutant data for the sampling period were obtained from publicly available online monitoring platforms (https://weatherandclimate.info, last access: 10 August 2024, and http://www.aqistudy.cn/, last access: 12 August 2024). In particular, the meteorological data were retrieved from the ground meteorological observation station at Nanchang Changbei Airport, and gaseous pollutant data were obtained from the air quality monitoring station operated by the Jiangxi Academy of Forestry. These stations are the closest to the sampling site, located approximately 10 and 2 km away, respectively. Both stations are ground-based, equipped with online monitoring instruments, and situated on open, flat terrain without surrounding buildings or obstructions. A detailed summary of the prevailing meteorological conditions and air quality during the sampling period is provided in Sect. S1 and Fig. S2 in the Supplement.
2.2 Chemical analyses
The OC and EC concentrations in the PM2.5 samples were quantified using the Desert Research Institute Model 2001 Carbon Analyzer, following the thermal/optical reflectance protocol established by the Interagency Monitoring of Protected Visual Environments (IMPROVE) (Chow et al., 2007). A 1.0 cm2 filter sample was placed in a quartz boat in the analyzer and subjected to incremental heating at predetermined temperatures: 140 °C for OC1, 280 °C for OC2, 480 °C for OC3, and 580 °C for OC4 in a non-oxidizing helium atmosphere; and 580 °C for EC1, 740 °C for EC2, and 840 °C for EC3 in an oxidizing atmosphere containing 2 % oxygen in helium. Repeated analyses were performed, demonstrating an analytical uncertainty of ±10 %.
We employed methodologies outlined by Wang et al. (2006) and Fu et al. (2008, 2010) for the extraction and derivatization of organic compounds. The involved filter samples underwent three consecutive ultrasonic extractions using a dichloromethane–methanol mixture (), followed by the concentration and drying of the resulting extracts. Prior to instrumental analyses, N,O-bis-(trimethylsilyl) trifluoroacetamide and pyridine were introduced to derivatize the polar compounds in the extract. The extract species included polar and non-polar organic compounds, and they were simultaneously detected by the involved instrument. We used non-polar C13 n-alkanes as internal standards for quantitative analyses.
The identification and quantification of organic compounds were achieved via gas chromatography–mass spectrometry (GC–MS) using a Thermo Scientific TRACE GC system coupled to a Thermo Scientific ISQ QD single quadrupole mass spectrometer. GC separation was performed using a DB-5MS fused silica capillary column. Section S2 and Table S1 in the Supplement present the parameters for GC–MS analysis, including temperature elevation procedures, qualitative and quantitative methods for the compounds, and quality assurance and control protocols. Polar and nonpolar organic compounds in the extracts were simultaneously analyzed; however, this study focused on the results regarding the polar compounds; the findings related to nonpolar compounds are provided in our earlier publications (Guo et al., 2024a, b).
2.3 Source apportionment methods
To quantify the contributions of various primary sources to OC and PM2.5, i.e., the POC and POA, we utilized the CMB model (version 8.2), a widely accepted source apportionment method developed by the United States Environmental Protection Agency (Lewandowski et al., 2008; Stone et al., 2009; Guo et al., 2012; Wu et al., 2020; Xu et al., 2021). The model assumes that the chemical composition of pollutants remains unchanged during transport, allowing measured chemical species at the receptor to be expressed as the linear sum of contributions from individual source categories. Accurate CMB results depend critically on the selection of representative emission sources and chemical tracers. These must include all major contributors and feature chemical markers that are stable during transport and distinct among sources (Stone et al., 2009). To meet these requirements, we first identified four major primary OC sources: biomass burning, coal combustion, vehicular exhaust, and cooking emissions, based on China's atmospheric PM and gaseous pollutant emission inventories (Huang et al., 2015; Li et al., 2019a; Tong et al., 2020), We also considered the contributions of plant debris and fungal spores to OC, base on the regional studies on OC sources (Fan et al., 2020; Xu et al., 2020; Wu et al., 2020). Representative source profiles and tracers of these sources were compiled from recent local and regional reports. For example, biomass burning releases substantial amounts of levoglucosan, accounting for ∼ 8.3 % of OC in local profiles (Zhang et al., 2007), and was therefore chosen as its marker compound. For coal combustion and vehicular exhaust, both characterized by complex mixtures include n-alkanes, polycyclic aromatic hydrocarbons (PAHs), and hopanes (Rogge et al., 1993a; Oros and Simoneit, 2000; Zhang et al., 2008; Cai et al., 2017). Local emission profiles indicated coal combustion tends to emit a higher proportion of 3- to 4-ring PAHs (Zhang et al., 2008), whereas vehicular exhaust is characterized by higher contributions from C20–C22 n-alkanes (Cai et al., 2017). Consequently, we selected 3- to 4-ring PAHs and C20–C22 n-alkanes as the representative organic markers for local coal combustion and vehicle emissions, respectively. Cooking emissions are dominated by fatty acids, particularly saturated palmitic acid (C16:0) and stearic acid (C18:0), as well as unsaturated fatty acids like palmitoleic acid (C16:1) and oleic acid (C18:1). Given the instability of unsaturated fatty acids in ambient air (Kawamura and Gagosian, 1987; Rudich et al., 2007), only the more stable saturated fatty acids – palmitic and stearic acids – were used as characteristic markers for local cooking emissions (He et al., 2004; Zhao et al., 2007, 2015). For plant debris, emission profiles from Los Angeles area indicate that plants release considerable quantities of long-chain odd-carbon-number n-alkanes (e.g., C25, C27, C29) (Rogge et al., 1993b); however, many local studies indicate that biomass burning, coal combustion, and vehicle exhaust also emit long-chain n-alkanes to some extent (Zhang et al., 2007, 2008; Cai et al., 2017). Overlap among sources diminishes the diagnostic value of long-chain n-alkanes, some investigations have consequently proposed glucose as a more selective tracer for plant debris (Fan et al., 2020; Xu et al., 2021). Puxbaum and Tenze-Kunit (2003) report that glucose comprises approximately 5.2 % of plant-derived organic carbon, whereas other sources other than plants rarely emit glucose. On this basis, glucose was adopted here as the plant emission biomarker. Additionally, certain fungal spores contribute to OC in ambient air; literature reports indicate that particles originating from fungal spores contain abundant mannitol and arabitol, accounting for roughly 13 % and 19 % of OC, respectively (Bauer et al., 2002, 2008). Accordingly, mannitol and arabitol were chosen as the marker compounds representing fungal spores in this study. Detailed source profile information used in CMB model is provided in Fig. S3 of the Supplement. It should be noted that the local source profile dataset subdivides major sources – such as coal combustion, vehicle exhaust, and cooking – into multiple categories (for example, industrial versus residential coal burning, gasoline versus diesel exhaust, and regional cooking styles such as Guangdong versus Sichuan). For each major source category, we represented typical source characteristics by using either the mean profile of its subcategories or the average profile derived from multiple observational studies. Similarly, using the proportions of characteristic species in PM2.5 from these emission source profiles, the CMB model subsequently estimated each source's contribution to PM2.5. In the primary emission profiles applied here, the PM-to-OC ratio ranged from 1.42 to 2.15.
To assess the contributions of various secondary sources to OC and PM2.5, i.e., SOC and SOA concentrations, we employed tracer-based method, a well-established method for SOC and SOA source apportionment. The tracer-based method operates on principles analogous to those involved in the CMB model, relying on the mass fractions of characteristic tracers in SOC (fSOC) and SOAs (fSOA) from emission sources to ascertain the contributions of different sources. The SOC and SOA tracer-based method was first proposed and utilized by Kleindienst et al. (2007 and 2012). Its specific calculation procedure is as follows:
where ∑i[tri] is the total concentration of the selected tracers in the sample, denoting representative compounds from specific emission categories; fSOC and fSOA are the mass fractions of the tracers in OC and PM2.5 from secondary emissions, respectively. The values of fSOC and fSOA are determined according to the chamber experiments conducted, in which gaseous precursors are transformed into SOC and SOAs under oxidative and illuminative conditions. Herein, we employed six compounds associated with hemiterpenes, four compounds related to monoterpenes, as well as β-caryophyllinic acid, 2,3-dihydroxy-4-oxopentanoic acid, and phthalic acid as marker compounds to indicate the contributions of different biogenic (hemiterpenes, monoterpenes, and sesquiterpenes) and anthropogenic (toluene and naphthalene) sources to SOC and SOA. We adopted the fSOC and fSOA values used by Kleindienst et al. (2007, 2012). to calculate the SOC and SOA concentrations originating from various sources. All marker selections, f-values, and the conversion coefficients between fSOA and fSOC derived from chamber studies are listed in Table S2, and the calculations assume that the chamber-derived SOC and SOA relationships are representative of the relevant atmospheric oxidation regimes, acknowledging associated uncertainties.
Furthermore, we employed the EC-based method to estimate the total POC and SOC concentrations, enabling a comparison with the POC and SOC concentrations obtained using the tracer-based method. This method uses EC as a tracer for POC and approximates the observed minimum ratio of OC to EC ()min as an equivalent to the primary emission value ()pri (Turpin and Huntzicker, 1995; Castro et al., 1999). The equation used for estimating SOC is
where the minimum values observed in spring, summer, autumn, and winter were 2.01, 2.20, 2.15, and 2.31, respectively.
3.1 Carbonaceous components
The OC and EC concentrations were in ranges of 1.01–13.66 (mean: 5.88 ± 2.57 µg m−3) and 0.27–4.55 µg m−3 (mean: 1.75 ± 0.88 µg m−3), respectively. Seasonal variations in the OC and EC concentrations closely mirrored those observed for PM2.5, with elevated levels in autumn and winter and diminished levels in spring and summer (Fig. 1a). Owing to its stability and resistance to chemical transformations in the atmosphere, EC is frequently employed as a tracer for primary emissions. The ratio is a useful tool for assessing the relative contributions of primary and secondary sources (Castro et al., 1999; Turpin and Huntzicker, 1995). Generally, an value above 2 indicates a predominant contribution of secondary sources to OC, whereas values below 2 suggest greater contributions from primary sources (Kunwar and Kawamura, 2014). Here, the majority of the values exceeded 2 (Fig. 1b), implying that the OC may have been significantly influenced by secondary sources. The values were relatively high in summer (4.33 ± 2.07) and winter (4.18 ± 2.57) compared with those observed in spring (3.36 ± 1.98) and autumn (3.59 ± 1.22). This indicates an increased contribution to OC from secondary sources during the summer and winter.
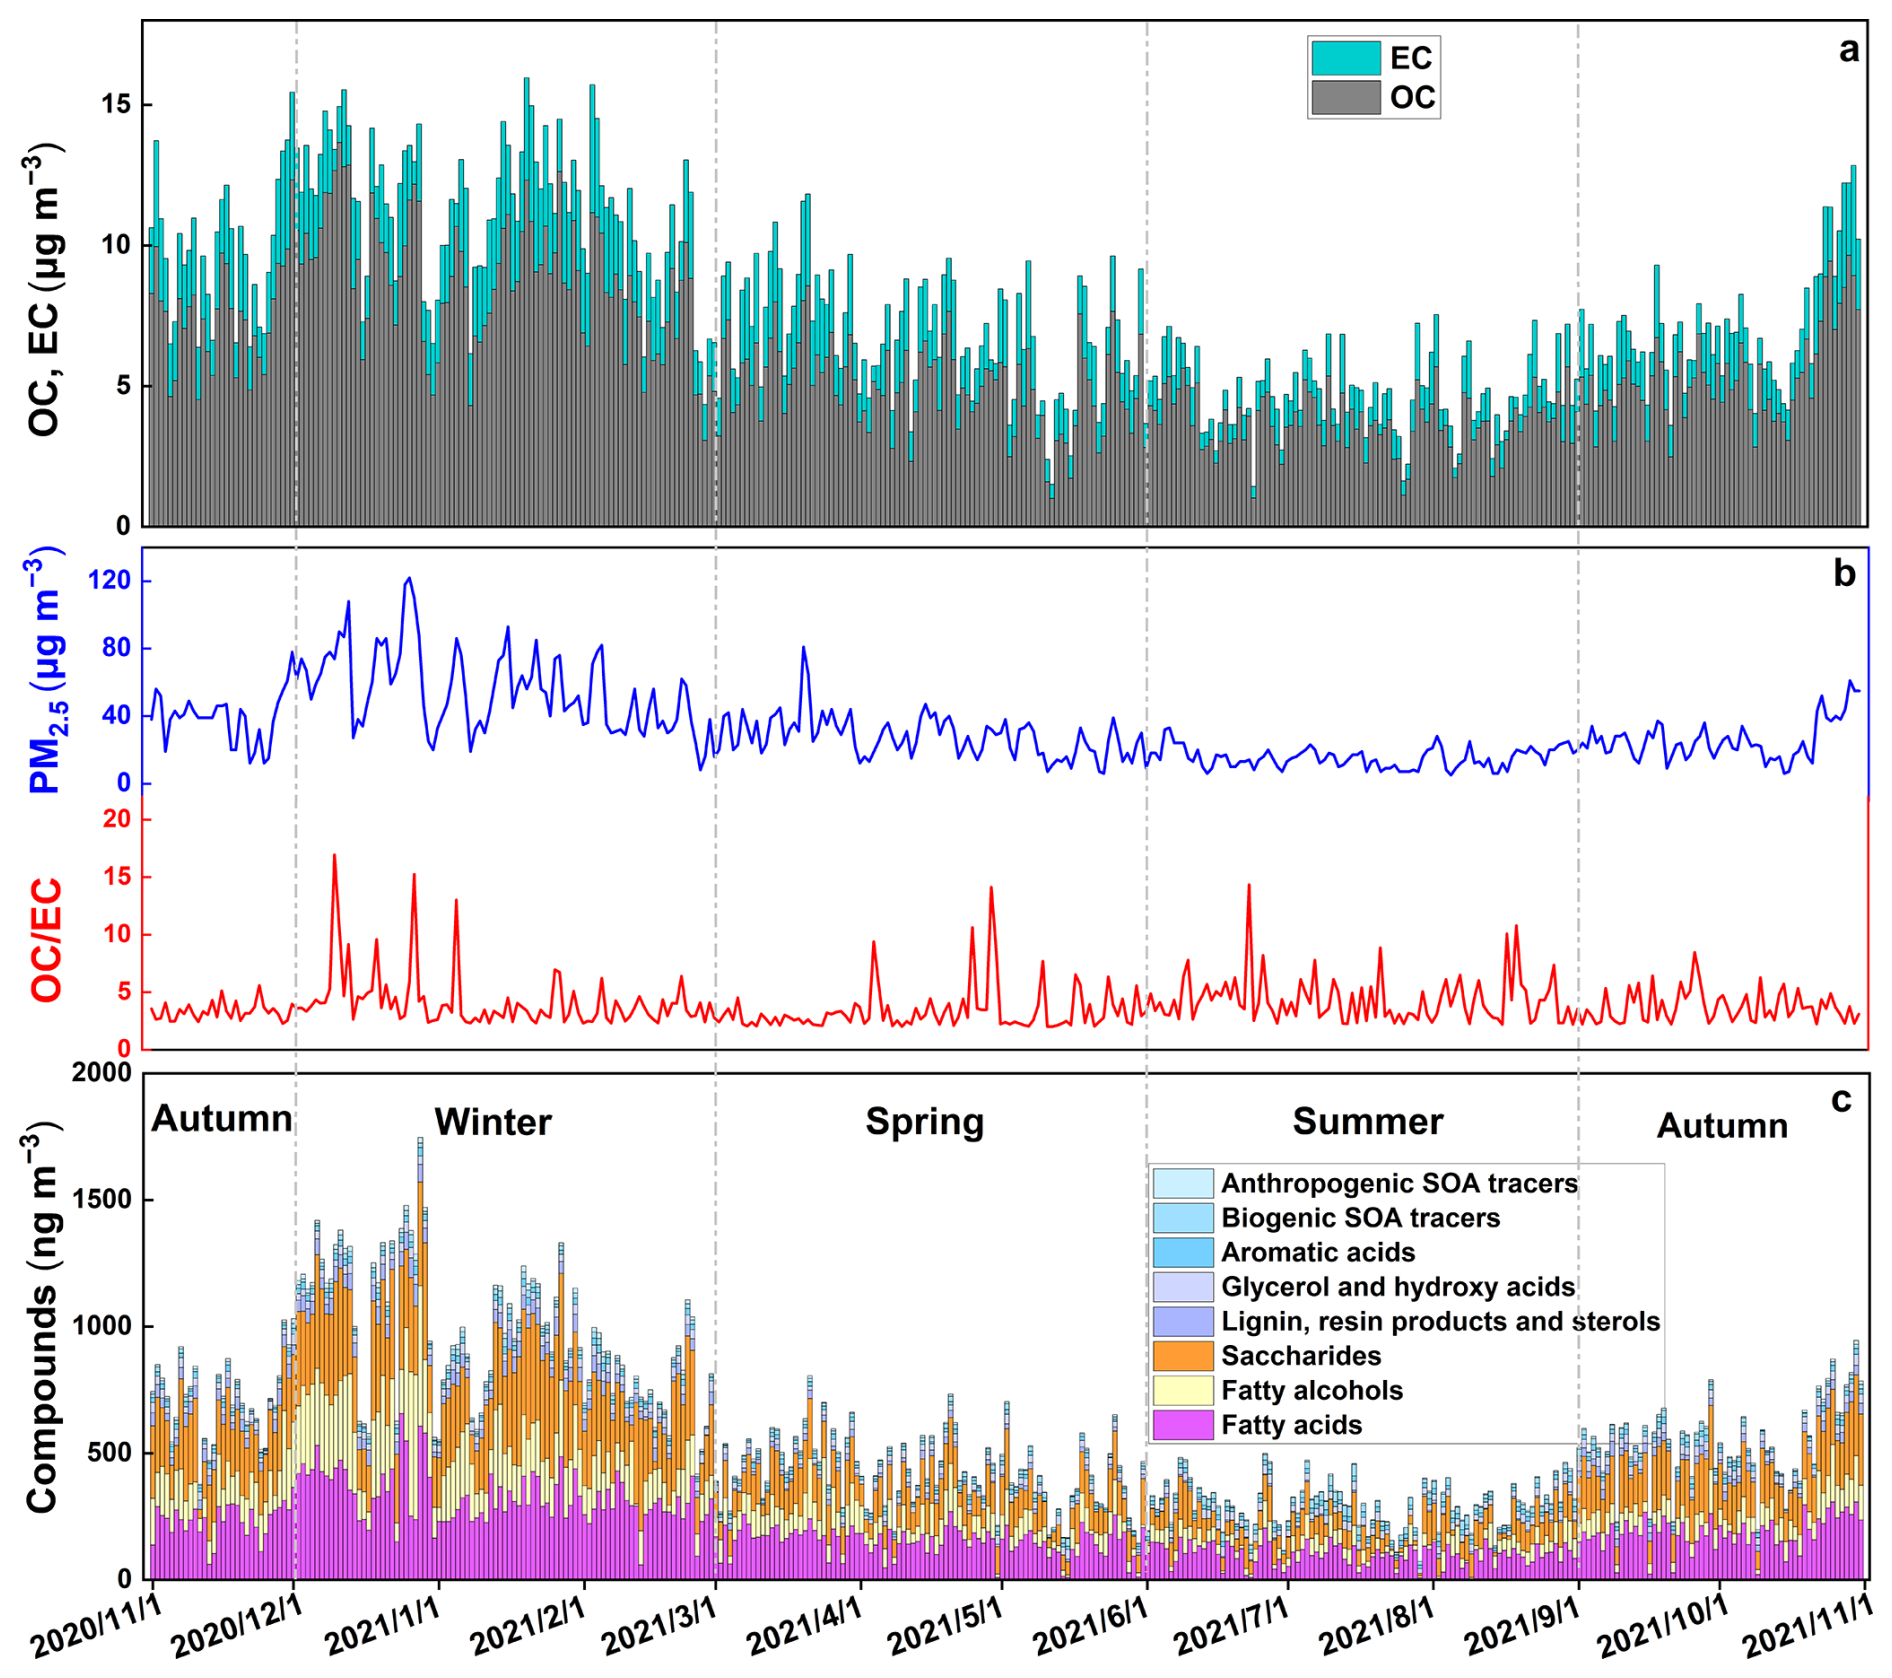
Figure 1One-year time series of organic carbon (OC), elemental carbon (EC), ratios, PM2.5 levels, and concentrations of polar organic compounds.
3.2 Major polar components
3.2.1 Fatty acids
A range of homologous straight-chain C10:0–C32:0 fatty acids (FAs) and unsaturated C16:1 and C18:1 FAs were detected in the PM2.5 samples (Figs. 1c and 2a). Their distribution exhibited a strong even-carbon-number predominance, as indicated by a carbon preference index (CPI) of 7.59 ± 7.42 (Fig. S4a), with peaks at C16:0 and C18:0. The total FA concentration was in a range of 3–658 ng m−3, with an average concentration of 197 ± 111 ng m−3. Similar molecular distribution patterns and concentrations have been documented in urban aerosol studies across China (59–2090 ng m−3; He et al., 2004, 2006; Wang et al., 2006; Haque et al., 2019; Fan et al., 2020). In these Chinese cities, FAs are primarily influenced by biogenic sources, including plant releases and biomass burning, as well as fossil fuel combustion and residential cooking. This average concentration generally exceeds those observed for coastal and marine aerosol samples (0.1–160 ng m−3; Kawamura et al., 2003; Wang et al., 2007; Fu et al., 2011), which are primarily influenced by marine biological activities and long-range transport of continental sources. High-molecular-weight FAs (HFAs, ≥ C20:0) are typically derived from the waxes of terrestrial higher plants or biomass burning, whereas low-molecular-weight FAs (LFAs, < C20:0) originate from more diverse sources, including vascular plants, microorganisms, marine phytoplankton, and kitchen emissions (Fu et al., 2008 and 2010). Consequently, the ratio of LFAs to HFAs (LFA HFA ratio) is an indicator of the relative contributions from various sources. Here, the LFA HFA range was 0.34–10.67, with an average of 2.45 ± 1.53 (Fig. S4b), suggesting that the FAs may have originated from a mixture of natural and anthropogenic sources. The specific FAs C16:0 and C18:0 are associated with different sources. C16:0 is primarily derived from biomass burning or plant emissions, whereas C18:0 predominantly originates from vehicle exhaust, cooking emissions, or road dust (Wang et al., 2007; Fu et al., 2010). Thus, the ratio of C18:0 to C16:0 () is frequently employed to assess the FA source. A ratio below 0.25 suggests a primary contribution from biomass burning or plant emissions, whereas ratios between 0.25 and 0.5 indicate a predominant influence from vehicle exhaust. ratios within a range of 0.5–1 suggest a significant contribution from cooking emissions or road dust (Rogge et al., 2006). Here, the ratio varied from 0.05 to 9.53, with an average value of 0.59 ± 0.88 (Fig. S3c), indicating that the FAs in Nanchang originated from a mixture of sources.
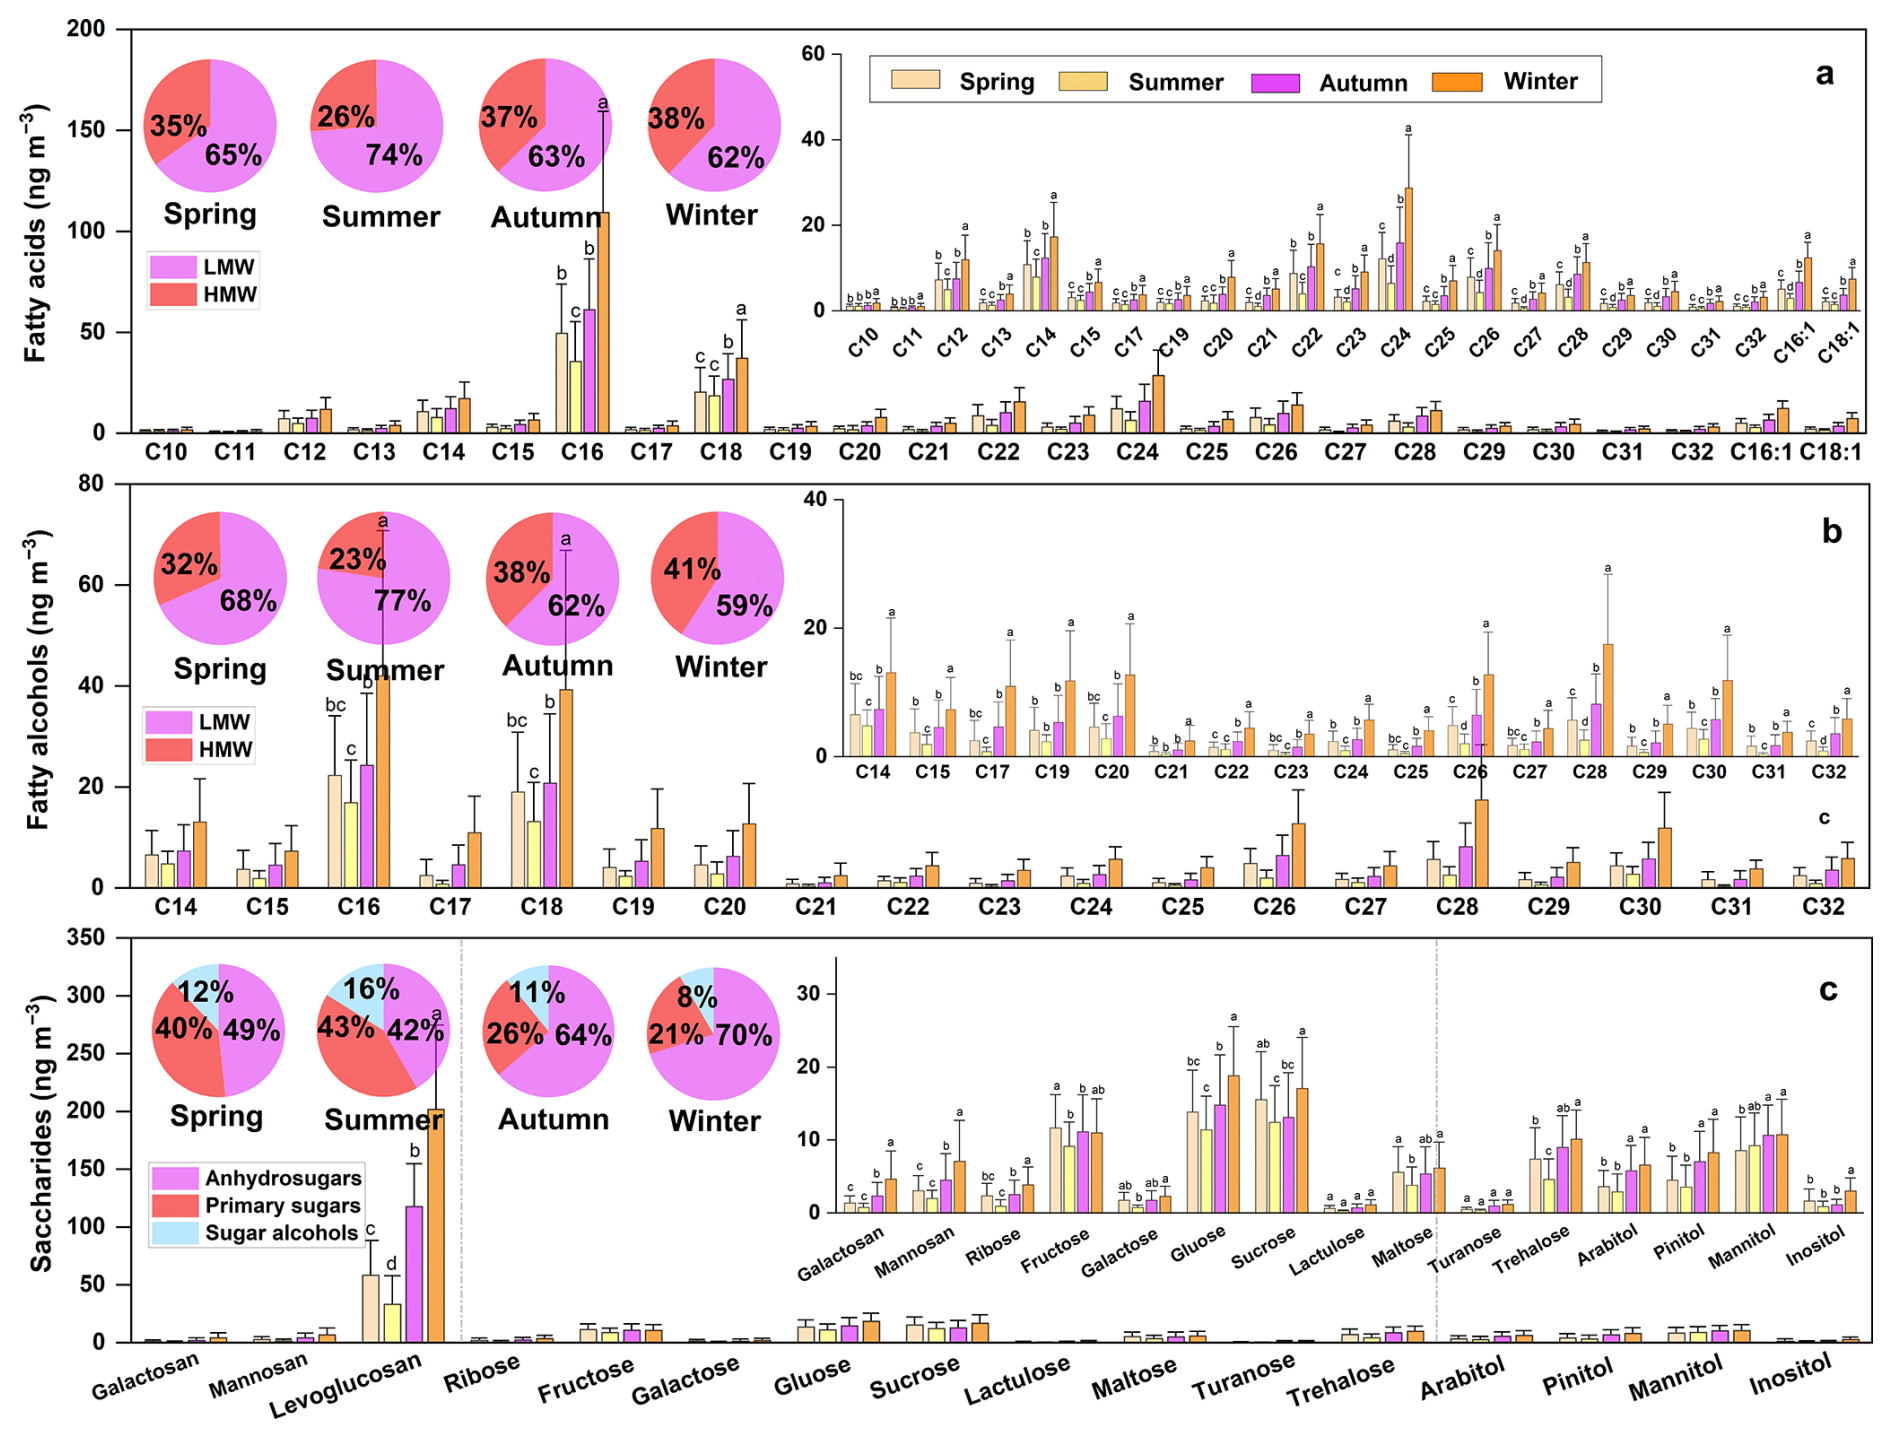
Figure 2Molecular characteristics and seasonal variations of the major polar compounds in PM2.5. The bars in the figure show the average concentrations of different compounds for each season, while the caps on the bars represent the standard deviations of these averages. The letters a, b, c, and d above the caps indicate whether the average concentrations differ significantly between seasons. Data points that do not share the same letter are significantly different, whereas those with the same letter are not significantly different, at the 95 % confidence level. The Tukey test was used to assess the statistical significance of these differences. It should be noted that the same method was used to compare the statistical significance of differences between the data in the other figures presented later in the article.
The average concentrations of unsaturated FAs, specifically C16:1 and C18:1, were 7 ± 4 and 4 ± 3 ng m−3, respectively. Such unsaturated FAs are primarily derived from biomass burning, plant leaf emissions, cooking activities, and release from marine organisms (Kawamura and Gagosian, 1987; Rogge et al., 1993b; Nolte et al., 1999). Upon emission into the atmosphere, unsaturated FAs undergo rapid oxidation by ozone (O3), hydrogen peroxide (H2O2), or hydroxyl (OH) radicals. Consequently, the ratio of unsaturated FAs to saturated FAs, represented as , is an indicator of the reactivity and degree of aging of unsaturated FAs (Rudich et al., 2007; Kawamura and Gagosian, 1987). Here, this ratio was 0.12 ± 0.06 (Fig. S3d), indicating that the unsaturated FAs underwent significant photochemical degradation and that secondary organic compounds may be common in PM2.5.
The average concentrations of most FAs were significantly (p < 0.05) higher in autumn and winter than in spring and summer (Fig. 2a), indicating a substantial increase in fatty acid emissions during autumn and winter. The LFA HFA and ratios were lower in autumn and winter than in summer (Fig. S4b and c). This indicated that in autumn and winter, FAs were significantly influenced by terrestrial plant or biomass burning, whereas in summer, they were more influenced by vehicular emissions, marine phytoplankton, and cooking emissions. Conversely, the values were higher in winter than in summer (Fig. S4d). This suggested that unsaturated FAs experienced a greater degree of photochemical degradation during the warm seasons. Unsaturated FAs can be rapidly oxidized by ozone or OH radicals. The higher temperatures, relatively stronger solar radiation, and higher concentrations of O3 and OH radicals in the summer season will facilitate the oxidative decomposition of unsaturated FAs (Wang et al., 2006; Fan et al., 2020).
3.2.2 Fatty alcohols
Several straight-chain n-alkanols (C14–C32) were detected (Figs. 1c and 2b), exhibiting a predominance of even carbon numbers, as indicated by a CPI of 10.28 ± 17.05 (Fig. S4e). Low-molecular-weight alcohols (LMWalc, ≤ C20) exhibited peaks at C16 and C18, and high-MW alcohols (HMWalc, > C20) exhibited peaks at C26, C28, and C30 (Fig. 2b). The total concentration of n-alkanols was in a range of 6–572 ng m−3 (average = 114 ± 93 ng m−3). This concentration fell within the range of reported n-alkanol concentrations in urban aerosols in China (3–1301 ng m−3; Wang et al., 2006; Haque et al., 2019; Fan et al., 2020) and generally exceeded that of coastal and marine aerosol samples (0.1–19.7 ng m−3; Kawamura et al., 2003; Fu et al., 2011). In urban aerosols of China, fatty alcohols are primarily derived from vegetation releases, biomass burning, and resuspension of soil particles. The fatty alcohols in coastal and marine aerosols are primarily attributed to the long-range transport of terrestrial soil and biomass burning as well as marine biogenic sources. HMWalc primarily originates from higher plant leaf waxes, loess deposits, or biomass burning, and LMWalc primarily originates from soil and marine microorganisms (Simoneit, 2002; Kawamura et al., 2003). Here, the LMWalc concentration (75 ± 61 ng m−3) exceeded that of HMWalc (39 ± 34 ng m−3), yielding an average LMW HMW ratio of 2.50 ± 1.73 (Fig. S4f), indicating a mixture of n-alkanols from soil, marine organisms, and biomass burning.
The average concentrations of most fatty alcohols were significantly (p < 0.05) higher in autumn and winter than in summer (Fig. 2b), indicating a substantial increase in fatty alcohols emissions during autumn and winter. The LMW HMW values were relatively low in autumn and winter and higher in spring and summer (Fig. S4f). This suggests an increased contribution of soil and marine organisms to n-alkanols in spring and summer. Contributions from plant or biomass burning increased in autumn and winter. In Chinese cities, rising temperatures in spring increase soil microbial activity, with marine air masses exerting a stronger influence during summer, potentially increasing emissions from soil and marine organisms in these seasons. In contrast, autumn and winter coincide with the crop harvest and increased winter heating, leading to likely increases in biomass burning emissions during these periods (Wang et al., 2006; Haque et al., 2019; Fan et al., 2020).
3.2.3 Saccharides
We investigated three saccharide classes: anhydrosugars, primary sugars, and sugar alcohols. Among the anhydrosugars, levoglucosan had the highest concentration (102 ± 79 ng m−3). We observed markedly lower concentrations of mannosan (4 ± 4 ng m−3) and galactosan (2 ± 3 ng m−3) (Fig. 2c). Levoglucosan – a prominent biomarker for biomass burning – has been extensively investigated in urban aerosol samples, with concentrations in a range of 22–2,706 ng m−3 (Wang and Kawamura, 2005; Wang et al., 2006; Fu et al., 2010; Haque et al., 2019; Fan et al., 2020), indicating the significant influence of biomass burning on the urban atmosphere. The widespread detection of levoglucosan in various environments – including suburban (10–482 ng m−3; Yttri et al., 2007; Fu et al., 2008), marine (0.2–30 ng m−3; Simoneit et al., 2004a; Fu et al., 2011), and polar regions (0–3 ng m−3; Stohl et al., 2007; Fu et al., 2009) – indicates its potential for long-range atmospheric transport. Compared to those of the major polar organic compounds found in marine environments, such as FAs, fatty alcohols, and saccharides, the concentrations of these substances in urban PM2.5 are substantially higher. This is primarily attributed to the substantial impact of anthropogenic activities in urban environments – such as vehicle emissions, industrial processes, and residential heating and cooking – all of which can release these major polar components (Wang et al., 2006; Fu et al., 2008; Haque et al., 2019; Fan et al., 2020). In contrast, the organic matter in marine PM2.5 originates from relatively simpler sources with lower emissions, mainly influenced by natural processes, including marine biological activity and the long-range transport of continental pollutants (Kawamura et al., 2003; Simoneit et al., 2004a; Wang et al., 2007; Fu et al., 2011).
Seasonal variations of anhydrosugars exhibited consistent patterns, with elevated concentrations in autumn and winter and reduced levels in spring and summer (Fig. 2c). This indicated increased biomass burning during the cold months. The sources were characterized using levoglucosan-to-mannosan () and mannosan-to-galactosan () ratios. Research suggests distinct ranges for different biomass burning sources: softwood (3–10), hardwood (13–35), and agricultural crop burning (40–56) (Oros and Simoneit, 2001; Sheesley et al., 2003; Engling et al., 2014). Coal combustion can produce significant amounts of levoglucosan (Sheesley et al., 2003; Fabbri et al., 2009), typically with higher values (12–189) because of the lower cellulose content compared with that of plant materials (Rybicki et al., 2020a, b). Conversely, values are generally higher for softwood and hardwood combustion at 3.6–7.0 and 1.2–2.0, respectively. However, values are relatively low for agricultural crop burning (0.3–0.6) (Oros and Simoneit, 2001; Sheesley et al., 2003). Here, most samples exhibited relatively high ratios (4.63–466.61, average = 40.22 ± 49.82) and relatively low ratios (0.30–9.41, average = 2.34 ± 1.36). The and ratios were similar to those of previous observations in the urban area of Nanchang ( = 7.9–359.1; average = 59.9; Zhu et al., 2022) and fell within the ranges for crop residue burning and coal combustion. This suggests that the dehydrosugars in the PM2.5 of Nanchang were likely primarily derived from crop residue burning and coal combustion. In autumn and winter, the contributions of crop residue burning and coal combustion were more prominent, as evidenced by the higher ratios and lower ratios observed compared with those in spring and summer (Fig. S4g and h).
Primary sugars and sugar alcohols serve as tracers for primary biological aerosol particles, originating from biogenic emissions, including the release of microorganisms, plants, and flowers, as well as the resuspension of surface soils and unpaved road dust containing biological materials (Graham et al., 2003; Simoneit et al., 2004b; Yttri et al., 2007). Furthermore, biomass burning is a notable source of primary sugars and sugar alcohols (Fu et al., 2012). We identified nine primary sugars (ribose, fructose, galactose, glucose, sucrose, lactulose, maltose, turanose, and trehalose; Fig. 2c). Glucose (15 ± 7 ng m−3) and sucrose (15 ± 6 ng m−3) exhibited the highest concentrations, followed by fructose (11 ± 5 ng m−3), trehalose (8 ± 4 ng m−3), and maltose (5 ± 3 ng m−3). The concentrations of galactose (2 ± 1 ng m−3), ribose (3 ± 2 ng m−3), turanose (1 ± 1 ng m−3), and lactulose (1 ± 1 ng m−3) were comparatively low. We detected four sugar alcohols (mannitol, arabitol, pinitol, and inositol). Mannitol (10 ± 5 ng m−3) exhibited the highest concentration, followed by pinitol (6 ± 4 ng m−3) and arabitol (5 ± 3 ng m−3). The concentration of inositol (2 ± 2 ng m−3) was low.
Levoglucosan serves as a specific biomarker for biomass burning, enabling the assessment of biomass burning contributions to sugar compounds through the ratio of levoglucosan to OC (Lev OC) and the proportion of levoglucosan in the total sugar compounds (Lev %). Typically, a Lev OC ratio of > 0.048 and a Lev % of > 68 % indicate a dominance of biomass burning. Conversely, values below these thresholds suggest that in addition to biomass burning, other sources, such as biogenic emissions, significantly contribute to the presence of sugar compounds (Yan et al., 2019 and references therein). Here, the Lev % and Lev OC values were 53.57 % ± 17.93 % and 0.016 ± 0.009 (Fig. S4i and j), respectively, indicating that the sugar compounds were influenced by biomass burning and biogenic emissions, particularly the primary sugars and sugar alcohols. Primary sugars, such as glucose and trehalose, as well as the mannitol in sugar alcohol, positively correlated with levoglucosan (Fig. S5a). This confirmed that biomass burning may be a potential source of primary sugars and sugar alcohols. However, the correlation was not statistically significant, suggesting that biological sources remain an important contributor to these compounds in Nanchang. The Lev OC and Lev % values were higher in autumn and winter than in spring and summer (Fig. S4i and j), further indicating that biomass burning contributions increased during the cold months. As previously noted, the primary reason for increased biomass burning emissions during the cold season is that autumn marks the crop harvest in China, leading to more straw burning. Furthermore, the temperature decrease in winter results in additional biomass burning for heating purposes.
3.3 Minor polar components
3.3.1 Lignin, resin products, and sterols
Here, we detected four types of lignin and resin-derived compounds: 4-hydroxybenzoic acid, dehydroabietic acid, vanillic acid, and syringic acid (Figs. 1c and 3a). These are generally considered to originate from natural plant release and burning. The burning of coniferous trees, such as pine, releases higher concentrations of dehydroabietic acid than other lignin and resin-derived compounds (Simoneit, 2002). Here, the concentrations of 4-hydroxybenzoic acid (5 ± 4 ng m−3) and dehydroabietic acid (3 ± 2 ng m−3) were high, whereas those of vanillic acid (2 ± 1 ng m−3) and syringic acid (2 ± 1 ng m−3) were relatively low. A significant positive correlation was observed between the total concentration of lignin and resin-derived compounds and levoglucosan (r = 0.80, p < 0.01, Fig. S5a), suggesting that biomass burning was a potential source of lignin and resin-derived compounds. The concentration of dehydroabietic acid was significantly lower than that of 4-hydroxybenzoic acid, similar to the pattern observed for Nanjing aerosols (Haque et al., 2019). This implies that coniferous tree combustion may not be the primary source of lignin and resin acids in this region.
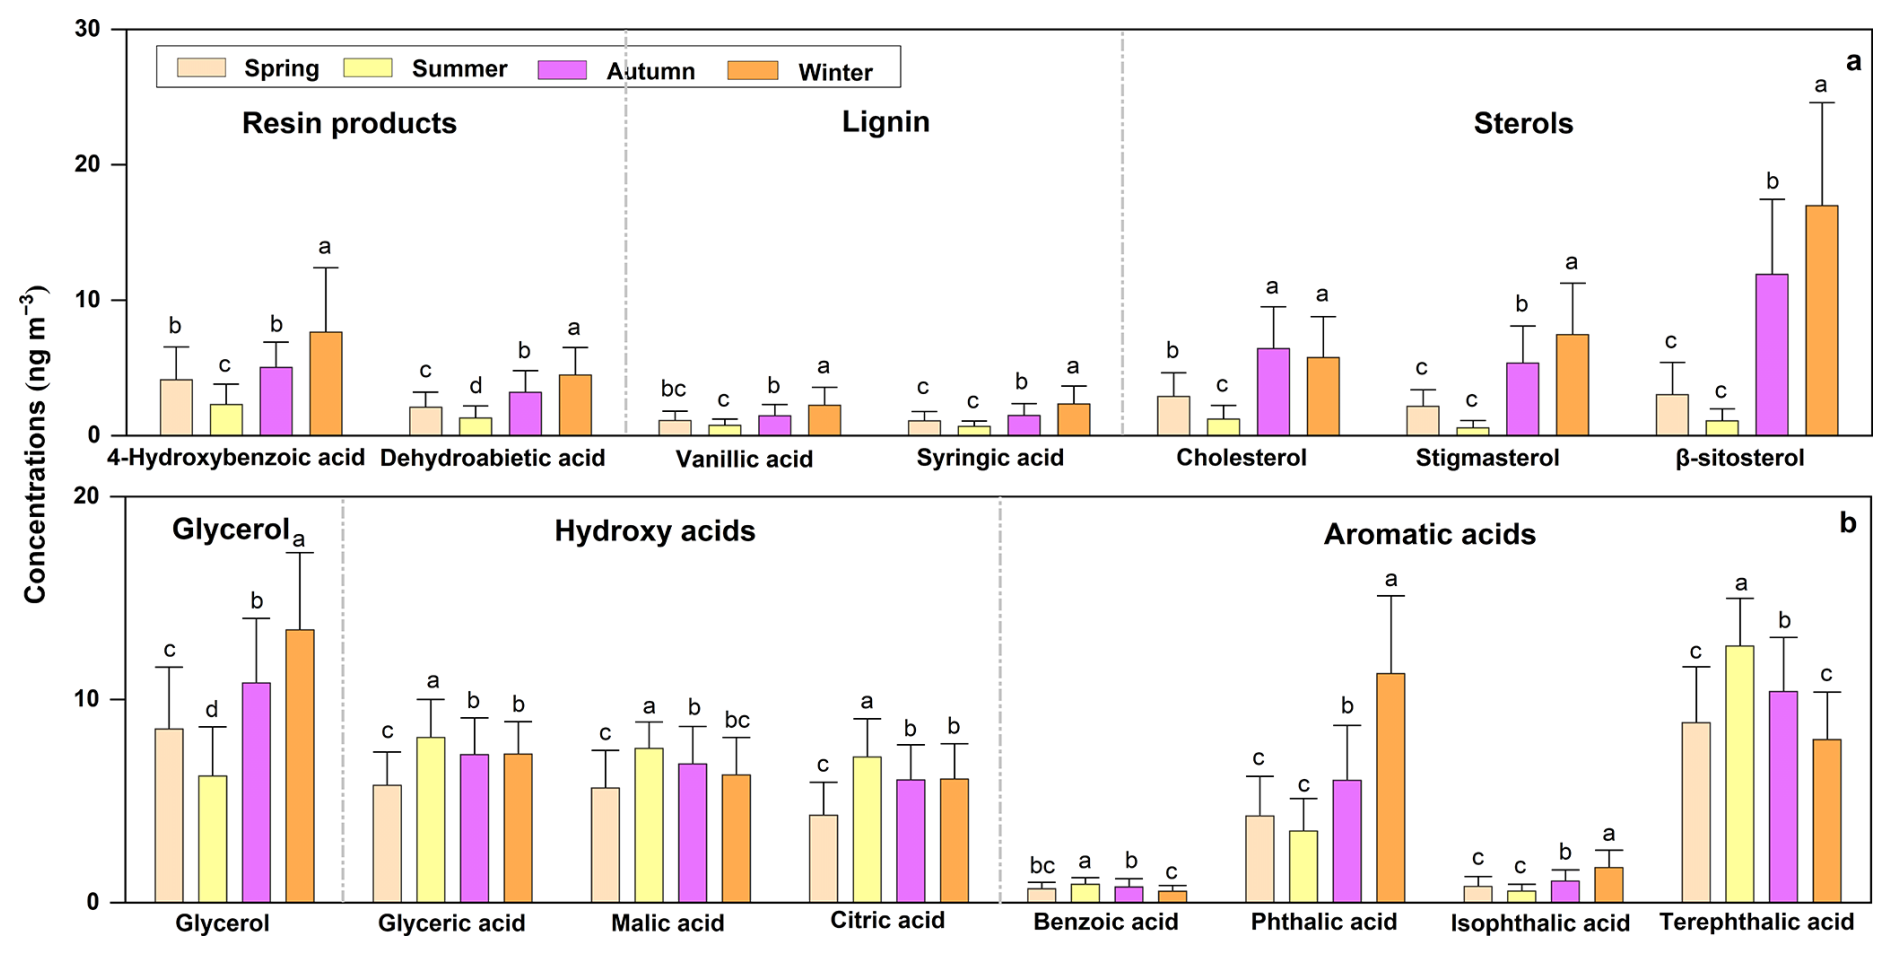
Figure 3Molecular characteristics and seasonal variations of the minor polar compounds in PM2.5. The explanations for the letters a, b, c, and d on the bars are provided in the caption of Fig. 2.
We identified several sterols (cholesterol, stigmasterol, and β-sitosterol; average concentrations = 5 ± 3, 5 ± 4, and 10 ± 8 ng m−3, respectively; Fig. 3a). These sterols originate from distinct sources. Cholesterol, an animal-derived sterol, is primarily associated with meat cooking in the atmosphere (Rogge et al., 1991; Nolte et al., 1999; He et al., 2004). Contrarily, stigmasterol and β-sitosterol are plant-derived sterols, typically originating from plant leaves, cooking, or biomass burning (Nolte et al., 2001; He et al., 2004; Zhao et al., 2007). Here, stigmasterol and β-sitosterol exhibited a significant positive correlation with levoglucosan (Fig. S5a). This suggests that biomass burning may be a potential source of plant-derived sterols. The concentrations of stigmasterol and β-sitosterol were higher in autumn and winter than in spring and summer, indicating an increased contribution of biomass burning to sterols in autumn and winter.
3.3.2 Glycerol, hydroxy acids, and aromatic acids
Glycerol and three hydroxy acids, glycolic acid, malic acid, and citric acid, were detected in the PM2.5 samples (Figs. 1c and 3b). The concentration of glycerol was relatively high (10 ± 4 ng m−3), whereas the three hydroxy acids exhibited comparable and relatively low concentrations: glycolic acid (7 ± 2 ng m−3), malic acid (7 ± 2 ng m−3), and citric acid (6 ± 2 ng m−3). These concentrations aligned with reported ranges for urban aerosols (2–146 and 1–180 ng m−3 for glycerol and hydroxy acids, respectively; Wang et al., 2006; Fu et al., 2010; Haque et al., 2019; Fan et al., 2020). The source of glycerol in urban aerosols is similar to that of sugar alcohols, primarily originating from the emission from plants, the resuspension of surface soils and unpaved road dust containing biological materials, and biomass burning (Simoneit et al., 2004a, b; Fu et al., 2008), whereas glycolic, malic, and citric acids mainly originate from the secondary photooxidation of organic compounds in the atmosphere, such as biogenic unsaturated FAs, cyclic olefins, and isoprene (Kawamura and Ikushima, 1993; Kawamura and Sakaguchi, 1999; Claeys et al., 2004, Haque et al., 2019). No significant correlation was observed between glycerol and the hydroxy acids; however, a notable correlation was observed among the hydroxy acids (r = 0.49–0.66, p < 0.01, Fig. S5b). This confirmed the divergent sources of glycerol and hydroxy acids and similar origins for the hydroxy acids. In summer, the concentrations of the hydroxy acids exceeded those in other seasons (Fig. 3b). A positive correlation was observed between the polyacids and temperature (r = 0.35–0.51, p < 0.01), suggesting enhanced secondary photochemical oxidation in the warm months. The secondary formation of hydroxy acids in the atmosphere is suggested to be related to the ozone-driven oxidation of organic compounds. Elevated ozone levels and stronger solar radiation during the summer season create more favorable conditions for the secondary production of hydroxy acids (Kawamura and Ikushima, 1993; Kawamura and Sakaguchi, 1999; Claeys et al., 2004).
We detected four aromatic acids in the PM2.5 samples: benzoic acid, phthalic acid, isophthalic acid, and terephthalic acid at concentrations of 0.8 ± 0.3, 6.4 ± 4.1, 1.1 ± 0.7, and 10.1 ± 3.1 ng m−3, respectively (Fig. 3b). Aromatic acids significantly contribute to the formation of atmospheric particles. Benzoic acid is recognized as a major pollutant in vehicle exhaust and the secondary photochemical oxidation product of aromatic hydrocarbons from vehicle emissions (Kawamura and Kaplan, 1987; Rogge et al., 1993a; Kawamura et al., 2000). Phthalic acid typically originates from the secondary transformation of PAHs, including naphthalene and other PAHs. Terephthalic acid is primarily produced through terephthalate hydrolysis during the combustion of urban plastics (Fu et al., 2010; Haque et al., 2019). Here, phthalic and terephthalic acids jointly accounted for approximately 90 % of the total detected aromatic acids. A significant positive correlation was observed between phthalic acid and PAHs (r = 83, p < 0.01), as well as between terephthalic acid and the total phthalates (r = 0.72, p < 0.01). The PAH and phthalate data have been published by Guo et al. (2024a, b). This suggests that the secondary conversion of PAHs and the hydrolysis of phthalates (specifically terephthalate) during plastic burning significantly contribute to aromatic acid levels. The phthalic acid concentrations were higher in autumn and winter, whereas terephthalic acid levels peaked in spring and summer (Fig. 3b). This indicates that the secondary transformation of PAHs was more pronounced during the cold months, whereas high temperatures in spring and summer promoted the volatilization and transformation of phthalates from plastic sources. Phthalates are employed as plasticizers in resins and polymers. Because they are not chemically bound to the polymer matrix, they can be easily released into the air through evaporation. Higher ambient temperatures in spring and summer favor phthalate release from the matrix (Wang et al., 2006; Fu et al., 2010).
3.4 SOA tracers in PM2.5
3.4.1 Biogenic SOA tracers
Biogenic and anthropogenic SOAs are critical in influencing the atmospheric radiation balance and regional air quality (Ding et al., 2014). Biogenic SOA tracers include oxidation products from isoprene, monoterpenes, sesquiterpenes, and other oxygenated hydrocarbons. Isoprene is the dominant component of BVOC emissions, accounting for ∼ 45 % of the total emissions (annual release estimated at 600 Tg C) (Piccot et al., 1992; Guenther et al., 1995; Sharkey et al., 2008). Here, we detected six isoprene oxidation products (2-methylglyceric acid (2-MGA), three C5-alkene triols, and two 2-methyltetrols (MTLs) at concentrations of 1.8 ± 1.1, 2.8 ± 1.9, and 4.1 ± 3.3 ng m−3, respectively; Fig. 4). The concentrations of the C5-alkene triols and MTLs exceeded that of 2-MGA. Generally, These isoprene-derived oxidation products are formed via acid-catalyzed ring-opening reactions and isomerization of isoprene epoxydiols (IEPOX), a reactive intermediate produced by the gas-phase oxidation of biogenic isoprene emitted by vegetation (Surratt et al., 2006 and 2010; Fu et al., 2010, 2014; Shiraiwa et al., 2017). Throughout the sampling period, a strong linear correlation was observed between the MTLs and C5-alkene triols (R2=0.82, p < 0.01), indicating their similar sources. Both species are sensitive to aerosol acidity and NOx levels, with lower aerosol pH and reduced NOx concentrations favoring their formation (Surratt et al., 2010; Lin et al., 2013). Nevertheless, certain differences were observed in the formation processes of C5-alkene triols and MTLs. For example, some studies have reported that, compared to MTLs, C5-alkene triols are more susceptible to degradation under high temperature and intense solar radiation, resulting in reduced C5 MTLs ratios in summer versus winter (Yee et al., 2020; Haque et al., 2023; Zhang et al., 2024a). A similar seasonal decrease in the C5 MTLs ratio is observed in summer in our dataset (Fig. S6a). C5-alkene triols and MTLs are believed to form via isoprene oxidation under low-NOx conditions. Contrarily, high concentrations of NOx favor further isoprene oxidation to yield 2-MGA (Lin et al., 2013; Nguyen et al., 2015). Here, the 2-MGA MTL ratios in winter exceeded those observed in other seasons (Fig. S6b), indicating that elevated NOx concentrations in winter (Fig. S2) may enhance 2-MGA formation. In MTLs, 2-methylthreitol and 2-methylerythritol (MTL1 and MTL2) exhibited a significant linear correlation (R2=0.68, p < 0.01), indicating that they may originate from similar sources and/or share similar formation pathways. The ratio of MTL2 to MTLs (MTL2 MTL ratio) can reflect the transformation pathways of MTLs. The ratio of MTL2 MTLs = 0.35, 0.61, 0.76, and 0.90 corresponded to isoprene secondary transformation from biogenic sources, OH-rich conditions (low NOx), NOx-rich conditions, and liquid-phase oxidation by H2O2, respectively (Kleindienst et al., 2009; Nozière et al., 2011). The results showed that the MTL2 MTL values in spring (0.64 ± 0.12) and summer (0.59 ± 0.11) were relatively low and closer to the values for biogenic sources and OH-rich secondary transformation. However, the values in autumn and (0.66 ± 0.10) winter (0.69 ± 0.06) were relatively high, approaching those for NOx-rich secondary transformation and liquid-phase oxidation by H2O2 (Figure S6c). This indicates that in spring and summer, MTLs were more likely derived from biogenic sources and OH-rich secondary transformation, whereas in autumn and winter, a shift was observed toward NOx-rich secondary transformations and liquid-phase oxidation by H2O2. This relatively high C5 MTL, 2-MGA MTL, or MTL2 MTL ratio observed during the cold season compared to that in the warm season is also commonly reported in urban environments across China, including Beijing (Liu et al., 2023), Tianjin (Wang et al., 2019; Fan et al., 2020), Nanjing (Yang et al., 2022), Shanghai (Yang et al., 2022), and Guangzhou (Yuan et al., 2018). Notably, the C5-alkene triols detected in our study predominantly exist as double-bonded “triol” compounds, including cis-2-methyl-1,3,4-trihydroxy-1-butene, 3-methyl-2,3,4-trihydroxy-1-butene, and trans-2-methyl-1,3,4-trihydroxy-1-butene. In fact, acid-catalyzed ring-opening reactions and isomerization of particle-phase IEPOX can also produce various “diol” compounds, which typically exist as cyclic structures, such as trans-3-methyltetrahydrofuran-3,4-diol and cis-3-methyltetrahydrofuran-3,4-diol. These “diols” are also important components of C5-alkene triols (Li et al., 2013; Frauenheim et al., 2022). Recent work, however, indicates that C5-alkene triols detected via GC–MS are unlikely to originate solely from the acid-catalyzed ring-opening reactions and isomerization of IEPOX; instead, they may largely be artifacts produced by thermal decomposition during GC–MS analysis, with roughly 90 % of the detected “triol” signal attributable to such artifacts (Frauenheim et al., 2022). If such artifacts indeed exist in the GC–MS measurements, it implies that the C5-alkene triol levels reported in our results are overestimated, potentially leading to an overall overestimation of isoprene-derived SOA tracers by approximately 30 %. Despite the potential artifact issue in GC–MS detection, the contribution of C5-alkene triols to SOA should not be underestimated (Frauenheim et al., 2022, 2024).
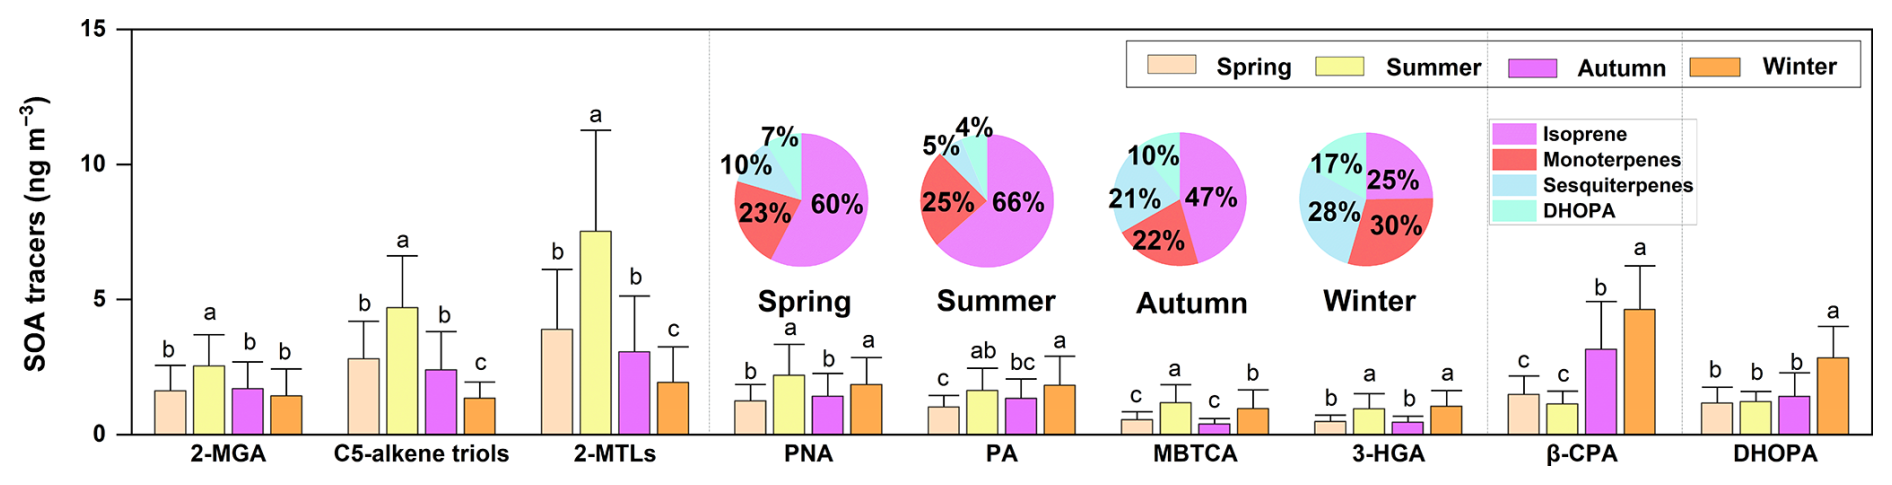
Figure 4Molecular characteristics and seasonal variations of the SOA tracers in PM2.5. The explanations for the letters a, b, c, and d on the bars are provided in the caption of Fig. 2.
Monoterpenes represent a crucial component of BVOC emissions, accounting for ∼ 11 % of the annual emissions, with an annual emission of 110 Tg C (Guenther et al., 1995). Here, we identified four oxidation products of monoterpene: pinonic acid (PNA); pinic acid (PA); 3-methyl-1,2,3-butanetricarboxylic acid (MBTCA); and 3-hydroxyglutaric acid (3-HGA), at concentrations of 1.7 ± 1.0, 1.5 ± 0.9, 0.8 ± 0.6, and 0.8 ± 0.5 ng m−3, respectively (Fig. 4). The concentrations of PNA and PA exceeded those of MBTCA and 3-HGA. PNA and PA are produced via the oxidation of -pinene via reactions with O3 and OH radicals, and the -pinene detected in the aerosol samples is primarily derived from biomass burning and higher plant release (Hallquist et al., 2009; Eddingsaas et al., 2012; Zhang et al., 2015; Iyer et al., 2021). The predominance of PNA over PA is attributable to its relatively high vapor pressure, consistent with previous findings (Fu et al., 2008, 2010). PNA and PA are recognized as first-generation oxidation products of -pinene, whereas MBTCA represents a second-generation oxidation product formed via the further photooxidation of PNA and PA with OH radicals. The relative concentrations of such first- and second-generation oxidation products () reflect the oxidation degree and aging status of monoterpene compounds (Ding et al., 2014). Here, the values were higher in spring (0.25 ± 0.11) and summer (0.32 ± 0.10) than in autumn (0.16 ± 0.09) and winter (0.24 ± 0.10). This suggests that higher temperatures and/or stronger radiation in spring and summer promoted the oxidation of monoterpene compounds (Fig. S6d). The formation of 3-HGA is considered to occur via a ring-opening mechanism, probably linked to heterogeneous reactions of monoterpenes with irradiation in NOx-rich environments (Jaoui et al., 2005; Claeys et al., 2007). The ratio of MBTCA to 3-HGA (MBTCA 3-HGA) can be employed to distinguish monoterpenes as the secondary transformation of α-pinene yields MBTCA at significantly higher rates relative to 3-HGA compared with β-pinene (Jaoui et al., 2005). Here, the annual MBTCA 3-HGA value was 1.18 ± 0.65 (Fig. S6e), close to those observed in urban environments in the United States (0.81 ± 0.32) and other cities in China (0.68 ± 0.65) (Lewandowski et al., 2013; Ding et al., 2014). This suggests that monoterpenes in these urban environments have similar sources. The MBTCA 3-HGA value was higher in spring (1.31 ± 0.66) and summer (1.45 ± 0.70) than in autumn (1.09 ± 0.72) and winter (0.88 ± 0.32) (Fig. S6e). This suggests that the contribution of α-pinene to monoterpene was higher in spring and summer than in autumn and winter. This phenomenon can be attributed to the association of 3-HGA formation with NOx-rich environments, where the relatively high NOx concentrations in autumn and winter (Fig. S2) may enhance 3-HGA production. The ratio of the total isoprene to monoterpene oxidation products (Iso/Pine) was lower in autumn and winter than in summer (Fig. S6f). This pattern is also commonly observed in other urban environments of China, suggesting that the higher temperatures in summer favored isoprene release (Li et al., 2018; Fan et al., 2020; Liu et al., 2023).
BVOC emissions include a class of sesquiterpene compounds, among which β-caryophyllene is the most abundant and frequently reported (Ding et al., 2014; Fan et al., 2020). β-caryophyllinic acid, a product of the ozonolysis or photooxidation of β-caryophyllene, predominantly originates from biomass burning and natural plant emissions, including those from pine and birch trees (Helmig et al., 2006; Duhl et al., 2008). Here, β-caryophyllinic acid was detected at a concentration of 2.7 ± 1.9 ng m−3. The β-caryophyllinic acid concentrations in autumn (3.2 ± 1.8 ng m−3) and winter (4.6 ± 1.6 ng m−3) exceeded those observed in spring (1.5 ± 0.7 ng m−3) and summer (1.1 ± 0.5 ng m−3) (Fig. 4). The higher concentrations of caryophyllinic acid in autumn and winter may be associated with increased biomass burning and subsequent secondary transformation of β-caryophyllene. During the sampling period, a significant positive linear correlation was observed between β-caryophyllinic acid and levoglucosan, supporting this inference (R2=0.66, p < 0.01).
3.4.2 Anthropogenic SOA tracers
Anthropogenic SOA tracers include hydroxy and aromatic acids, which primarily originate from the secondary transformation of AVOCs. Although global AVOC emissions are relatively modest at 110 Tg C yr−1 (Piccot et al., 1992) compared with BVOC emissions, which reach 1150 Tg C yr−1 (Guenther et al., 1995), the contribution of anthropogenic sources to SOA is frequently more pronounced in urban environments because of the impact of human activities (von Schneidemesser et al., 2010; Ding et al., 2012; Li et al., 2019b). AVOC emissions in urban settings can enhance BVOC oxidation, promoting SOA formation (Carlton et al., 2010; Hoyle et al., 2011). Here, we identified two primary anthropogenic SOA tracers, 2,3-dihydroxy-4-oxopentanoic acid (DHOPA) and phthalic acid, at concentrations of 1.7 ± 1.1 and 6.4 ± 4.1 ng m−3, respectively (Figs. 3 and 4). DHOPA and phthalic acid are recognized as important markers for anthropogenic SOAs, produced via the oxidation of toluene and PAHs, such as naphthalene (Kawamura and Ikushima, 1993; Kleindienst et al., 2007, 2012). Their concentrations were higher in autumn and winter than in spring and summer (Figs. 3 and 4). This indicated a marked increase in the contribution of anthropogenic sources to SOA during the cold months. As typical anthropogenic SOA tracers, DHOPA and phthalic acid have been reported to exhibit significantly higher concentrations in urban areas than in suburban and remote regions, with higher levels in the cold season than in the warm season in China (Ding et al., 2014; Fan et al., 2020; Yang et al., 2022). SOAs in urban environments and in the cold season in China are more strongly influenced by anthropogenic emissions, such as those from fossil fuel combustion and biomass burning (Ding et al., 2012; Yuan et al., 2018; Fan et al., 2020).
3.5 Source apportionment of OC and aerosol
Employing the CMB model and tracer-based approach, we quantified the contributions of POC and SOC to the total OC (Fig. 5). The results showed that the POC and SOC concentrations were 3.66 ± 2.47 and 0.50 ± 0.32 µg m−3 (Fig. 5a–c), accounting for 57.66 % ± 18.35 % and 8.25 % ± 3.23 % of the measured OC, respectively (Fig. 5f). Our results indicate that POC continues to be the main contributor to OC. These results were within the reported ranges of POC (5 %–76 %) and SOC (3 %–56 %) (Stone et al., 2009; Guo et al., 2012; Fan et al., 2020; Xu et al., 2021; Haque et al., 2023). Notably, anthropogenic sources, including biomass burning, coal combustion, motor vehicle emissions, and cooking, contributed the majority of POC (3.35 ± 2.38 µg m−3, accounting for 88.93 % ± 6.88 %). Natural sources, such as plant debris and fungal spores, contributed relatively little (0.32 ± 0.17 µg m−3, accounting for 11.07 % ± 6.88 %). For SOC, anthropogenic contributions (0.33 ± 0.25 µg m−3, accounting for 60.67 % ± 21.29 %), including toluene and naphthalene, exceeded biogenic contributions (0.17 ± 0.09 µg m−3, accounting for 39.33 % ± 21.15 %), which included isoprene, -pinene, and β-caryophyllene. The relative abundances of anthropogenic POC and SOC were higher in autumn and winter, whereas biogenic POC and SOC exhibited greater relative abundances during spring and summer (Fig. 5d–f). These results underscore the significant influence of biogenic emissions during the warm months, whereas anthropogenic emissions exert a pronounced effect during the cold months. This situation is primarily attributed to the elevated temperatures, and increased solar radiation during the warm months facilitates VOC release from vegetation, thereby promoting biogenic POC emissions and SOC formation. Contrarily, the rise in anthropogenic POC emissions during the cold months fosters the development of anthropogenic SOC in the atmosphere. During winter, including both pollution episodes (Winter-P) and the remainder period (Winter-R), the contribution proportions of three main anthropogenic POC sources (biomass burning, coal combustion, and vehicle exhaust, 55 %–62 %) and anthropogenic SOC precursors (toluene and naphthalene, 6 %–7 %) were consistently higher than the annual averages (40 % for these anthropogenic POC and 5 % for anthropogenic SOC) (Fig. 5f). This trend was even more pronounced during individual pollution episodes (Fig. S7), with these anthropogenic POC contributions reaching 51 %–71 % and anthropogenic SOC contributions increasing to 6 %–8 % (Fig. S7f). These findings suggest that POC from biomass burning, coal combustion, and vehicle exhaust, along with SOC originating from toluene and naphthalene, may be key drivers of wintertime organic aerosol pollution.
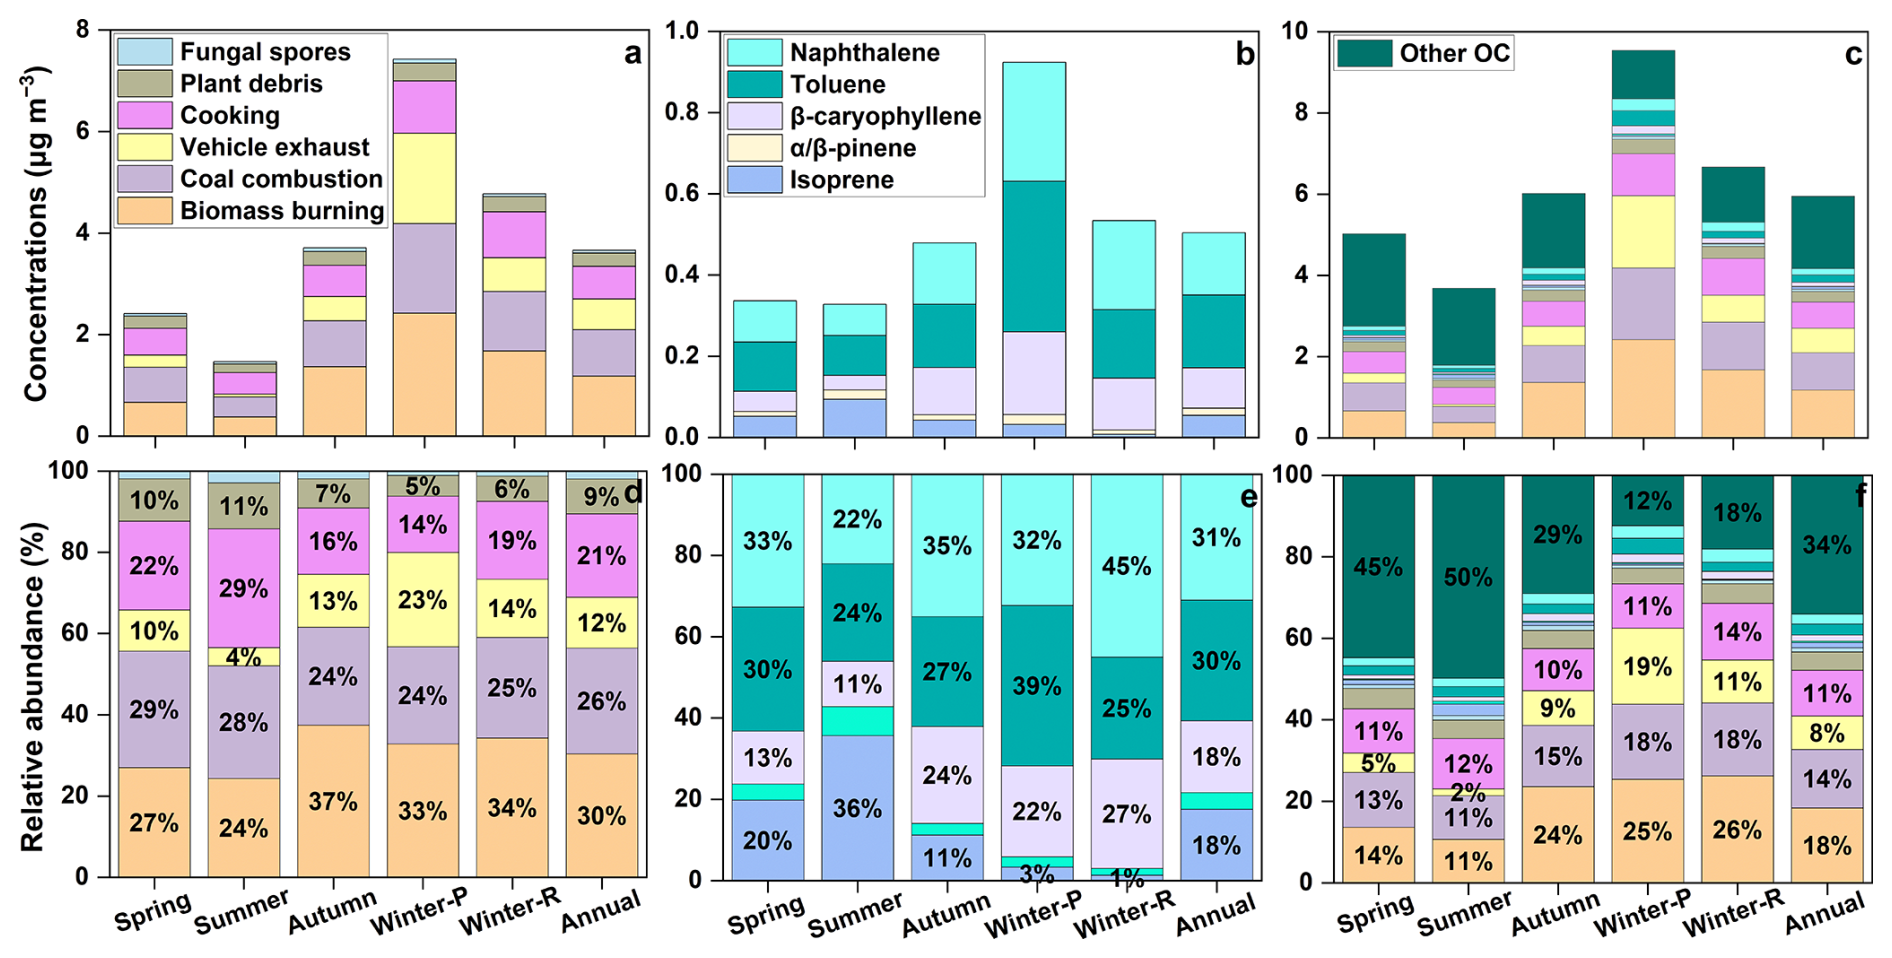
Figure 5Concentrations and relative abundances of primary organic carbon (POC) from biomass burning, coal combustion, vehicle exhaust, cooking, plant debris, and fungal spores, as well as secondary organic carbon (SOC) from isoprene, -pinene, β-caryophyllene, toluene, and naphthalene. POC and SOC concentrations were estimated using a tracer-based method, while other organic carbon (Other OC) was calculated by subtracting the estimated OC from the measured OC. Winter-P refers to winter pollution periods, and Winter-R denotes the winter remainder.
The fraction of OC that remains unexplained by the CMB model and tracer-based methods and is therefore classified as “other OC”. This component is defined as the difference between measured OC and the summed contributions of POC and SOC from all apportioned sources estimated by the CMB model and tracer approaches. On average, other OC accounts for ∼ 34 % of measured OC (Fig. 5c, f). The presence of other OC likely reflects limitations in source identification: some OC forms (e.g., liquid-phase OC or aged primary OC) are difficult to capture with either the CMB model or tracer techniques (Ding et al., 2014; Fan et al., 2020; Wu et al., 2020; Xu et al., 2021). Although absolute concentrations of other OC are lower in spring and summer than in autumn and winter, its fractional contribution shows the opposite seasonal pattern – about 45 %–50 % in spring and summer versus 12 %–29 % in autumn and winter (Fig. 5c, f). Similar patterns have been reported elsewhere in other citie of China, e.g., Beijing, where estimated concentrations of other OC are higher in winter but its proportion is greater in summer (∼ 44 % vs. 22 %–25 % in winter) (Wang et al., 2009; Wu et al., 2020; Xu et al., 2021). Previous studies indicate that this “other OC” is likely dominated by SOC (Guo et al., 2012; Wu et al., 2020; Xu et al., 2021). To assess whether other OC is predominantly primary or secondary, we used an EC-based method to estimate total POC and SOC; unlike tracer methods, the EC approach simply partitions OC into POC and SOC and therefore can include unapportioned components. Accordingly, the POC calculated via EC-based method minus the POC calculated via CMB model yields the “other POC” (unapportioned POC), and similarly, SOC calculated via EC-based method minus the tracer-based SOC yields the “other SOC” (Fig. S8). Our results show that, across all four seasons, the concentration of other SOC exceeds that of other POC (Fig. S8a, b), indicating that these unidentified other OC components are likely predominantly SOC. The concentration of other SOC is substantially higher in autumn and winter – especially during pollution periods in winter – highlighting the critical role of SOC in aerosol pollution during these seasons (Fig. S8c, d). Conversely, the proportion of other SOC during summer is the highest among all seasons (around 32 %) (Fig. S8b), suggesting that elevated temperatures and intense radiation during summer enhance SOC formation efficiency (Wu et al., 2020; Xu et al., 2021). Although the other SOC fraction exceeds other POC, EC-based estimates of total SOC remain smaller than total POC in all seasons. Similarly, SOC estimated by the tracer method is markedly lower than POC apportioned by the CMB model. These results together indicate that primary emissions play a significant role in urban OC pollution, with substantial POC contributions forming the basis for elevated OC concentrations. However, the influence of SOC should not be overlooked. Numerous studies have shown that even minor increases in SOC during winter pollution episodes can exacerbate OA pollution (Li et al., 2019b; Xu et al., 2021; Haque et al., 2023).
Using the CMB model and tracer-based methods, we also quantified the contributions of POA and SOA to PM2.5 (Fig. S9). The findings indicated that POA and SOA contributed 6.86 ± 4.55 and 1.02 ± 0.63 µg m−3, accounting for 22.84 % ± 9.71 % and 3.47 % ± 1.41 % of the observed PM2.5 mass in Nanchang, respectively. The anthropogenic POA (6.26 ± 4.37 µg m−3, accounting for 89.38 % ± 8.26 %) and SOA (0.65 ± 0.48 µg m−3, accounting for 58.79 % ± 21.30 %) exceeded the natural POA (0.60 ± 0.33 µg m−3, accounting for 10.34 % ± 6.83 %) and SOA (0.37 ± 0.20 µg m−3, accounting for 41.21 % ± 21.30 %), respectively. The POA and SOA exhibited patterns analogous to those of POC and SOC, with greater contributions recorded in autumn and winter compared with spring and summer.
The calculation of POC and SOC contributions based on the CMB model and tracer-based method inherently involves uncertainties. For the CMB model, a primary source of uncertainty is the variability of tracer mass fractions within OC (fOC) from the same primary emission sources across various observational studies. For example, reported levoglucosan/OC fractions range from 12 % (Andreae and Merlet, 2001; Andreae, 2019) to 13 % (Zheng et al., 2002) and 16 % (Fine et al., 2004), whereas the local source profile we reference suggests 8.3 % (Zhang et al., 2007). Since recent, site-specific emission data are often unavailable, the choice of source profile and corresponding fOC values can strongly influence apportionment outcomes. Secondly, a fundamental assumption of the CMB model is that the selected markers representing various sources remain stable during atmospheric transport and do not undergo significant chemical transformation. However, truly conservative species are rare. For example, levoglucosan, commonly used as a biomass-burning marker and generally considered relatively stable (Wang et al., 2021), has nonetheless been shown to decrease during long-range transport through wet and dry deposition (Fu et al., 2011) and by photodegradation (Holmes and Petrucci, 2006; Stohl et al., 2007; Hoffmann et al., 2010). Analogous loss or alteration of other source tracers can bias CMB results, tending to underestimate contributions from sources whose markers are degraded or removed during transport. For tracer-based methods, the appropriateness of the selected fSOC and fSOA values is also crucial to the accuracy of the results. Compared with primary source profiles, direct observational information on secondary source profiles is sparse. This paucity reflects the experimental difficulty of reproducing atmospheric oxidation and photochemical ageing under representative light and precursor conditions in laboratory or chamber systems. Most studies employing tracer-based methods to estimate SOC and SOA contributions have relied on fSOC and fSOA values reported by Kleindienst et al. (2007, 2012), which are now relatively dated. SOC and SOA formation are influenced not only by oxidants and sunlight but also by factors such as relative humidity, precursor concentrations, NOx levels, and other ambient variables. The chamber conditions cannot fully reproduce the complexity of real atmospheres, leading to inevitable discrepancies in fSOC and fSOA values between chamber-derived results and ambient air (Fu et al., 2009; Guo et al., 2012; Ding et al., 2012, 2014; Haque et al., 2023). Additionally, the fSOC and fSOA values used were average, and their inherent standard deviations could result in deviations of 21 % to 48 % in the calculated SOC contributions from different sources (Kleindienst et al., 2007, 2012). Despite the inherent uncertainties associated with both the CMB model and tracer-based method, these approaches remain convenient tools for estimating the contributions of various POC and SOC, yielding relatively reasonable results (Stone et al., 2009; Ding et al., 2012, 2014; Al-Naiema and Stone, 2017; Ren et al., 2021; Xu et al., 2021; Haque et al., 2023). However, further efforts are needed to reduce these uncertainties. One critical step will be to conduct more extensive, site-specific observational studies of different types of primary and secondary emission sources. Such data are essential for identifying representative tracers within different sources and accurately determining their mass fractions in OC and OAs. Additionally, when fSOC and fSOA values are applied in both CMB model and tracer-based calculations, using the most recent, locally relevant emission source profile to minimize uncertainties is advisable.
3.6 Characteristics of OAs during winter pollution
From an annual timescale perspective, anthropogenic POC and SOC are synchronous with the measured OC and observed PM2.5 mass (Fig. S10). Correlation analysis revealed that anthropogenic POC (biomass burning, coal combustion, and vehicle exhaust) and SOC exhibited a significant positive correlation (r = 0.72–0.84, p < 0.01) with the measured OC (Fig. 6a). Redundancy analysis revealed that anthropogenic POC and SOC significantly contributed (54 %–65 %, p < 0.01) to the variations in OC concentration (Fig. 6a). This suggests that anthropogenic OC and SOC are important factors influencing changes in the OC and PM2.5 mass throughout the sampling period. Variations in POC, SOC, OC, and PM2.5 mass were associated with specific meteorological conditions and gaseous pollutant concentrations. For instance, high POC, SOC, OC, and PM2.5 concentrations corresponded to elevated atmospheric pressure, reduced precipitation, and increased NO2 concentrations (Fig. S2). This suggests that meteorological conditions and gaseous pollutant concentrations could also influence POC, SOC, OC, and PM2.5 mass.
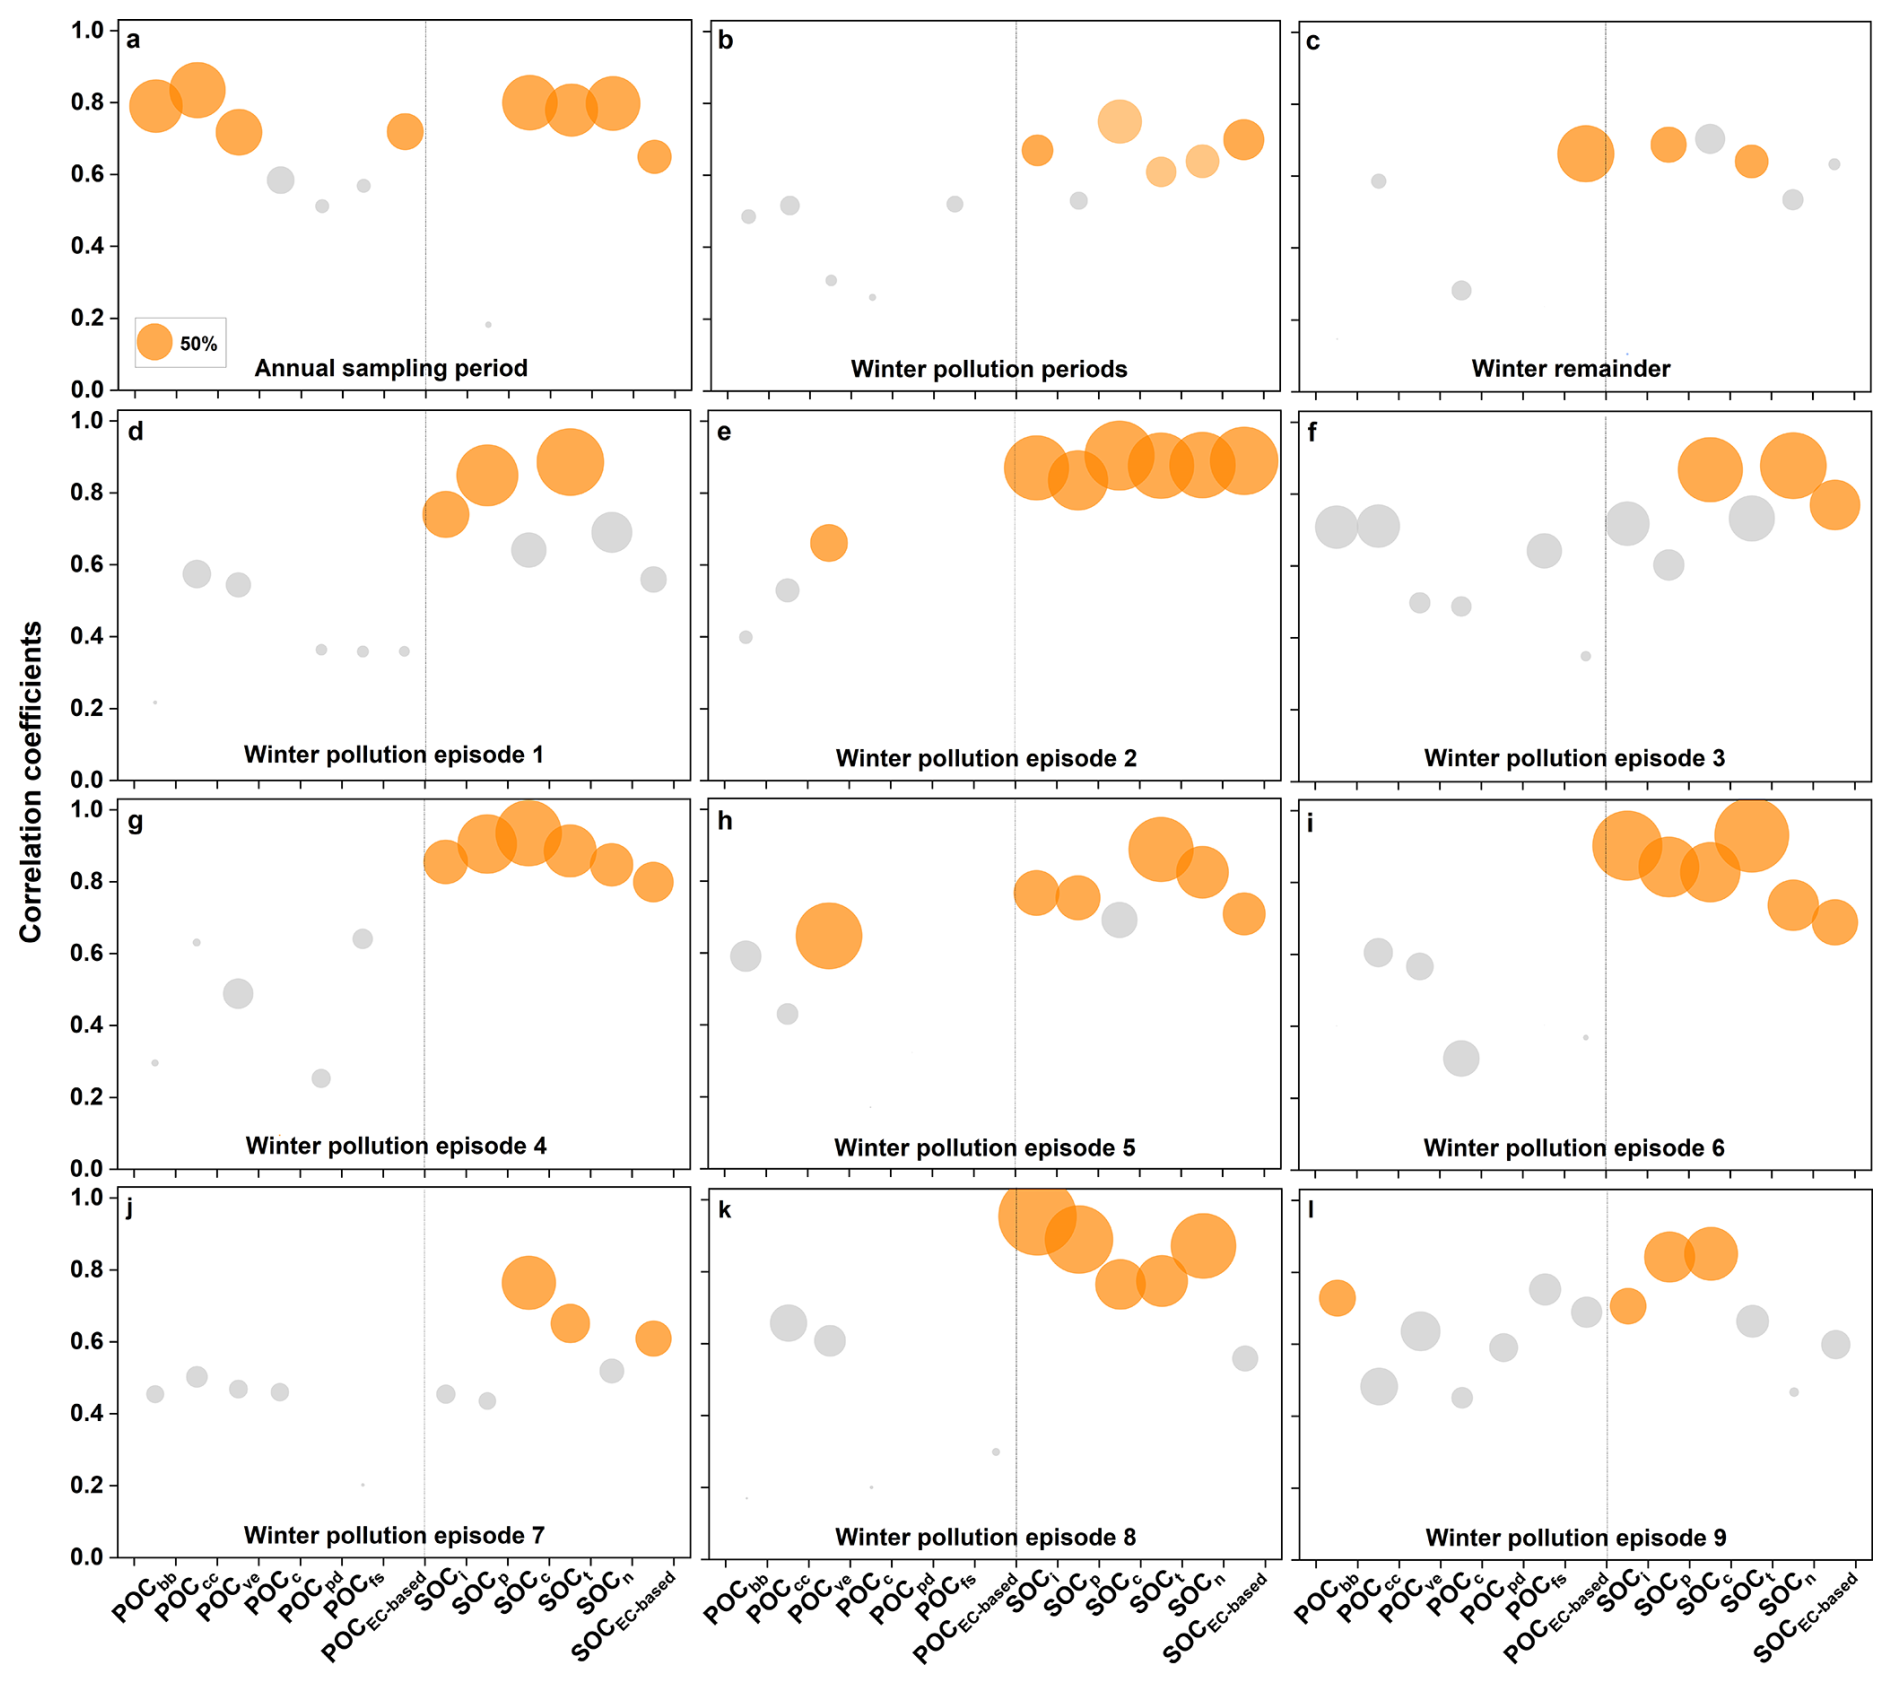
Figure 6Pearson correlations between measured OC and each individual POC and SOC source for the annual sampling period (a), winter pollution periods (b), winter remainder (c), and individual pollution episodes in winter (d–l). The size of each circle represents the contribution (%) of POC and SOC to the variation in measured OC, as determined by redundancy analysis. Orange circles indicate p-values from correlation and redundancy analyses less than 0.05, while gray circles denote p-values greater than 0.05. Definitions: POCbb (biomass burning), POCcc (coal combustion), POCve (vehicle exhaust), POCc (cooking), POCpd (plant debris), POCfs (fungal spores), and POCEC-based (based on the EC method). SOCi, SOCp, SOCc, SOCt, SOCn, and SOCEC-based correspond to SOC from isoprene, -pinene, β-caryophyllene, toluene, naphthalene, and EC-based methods, respectively.
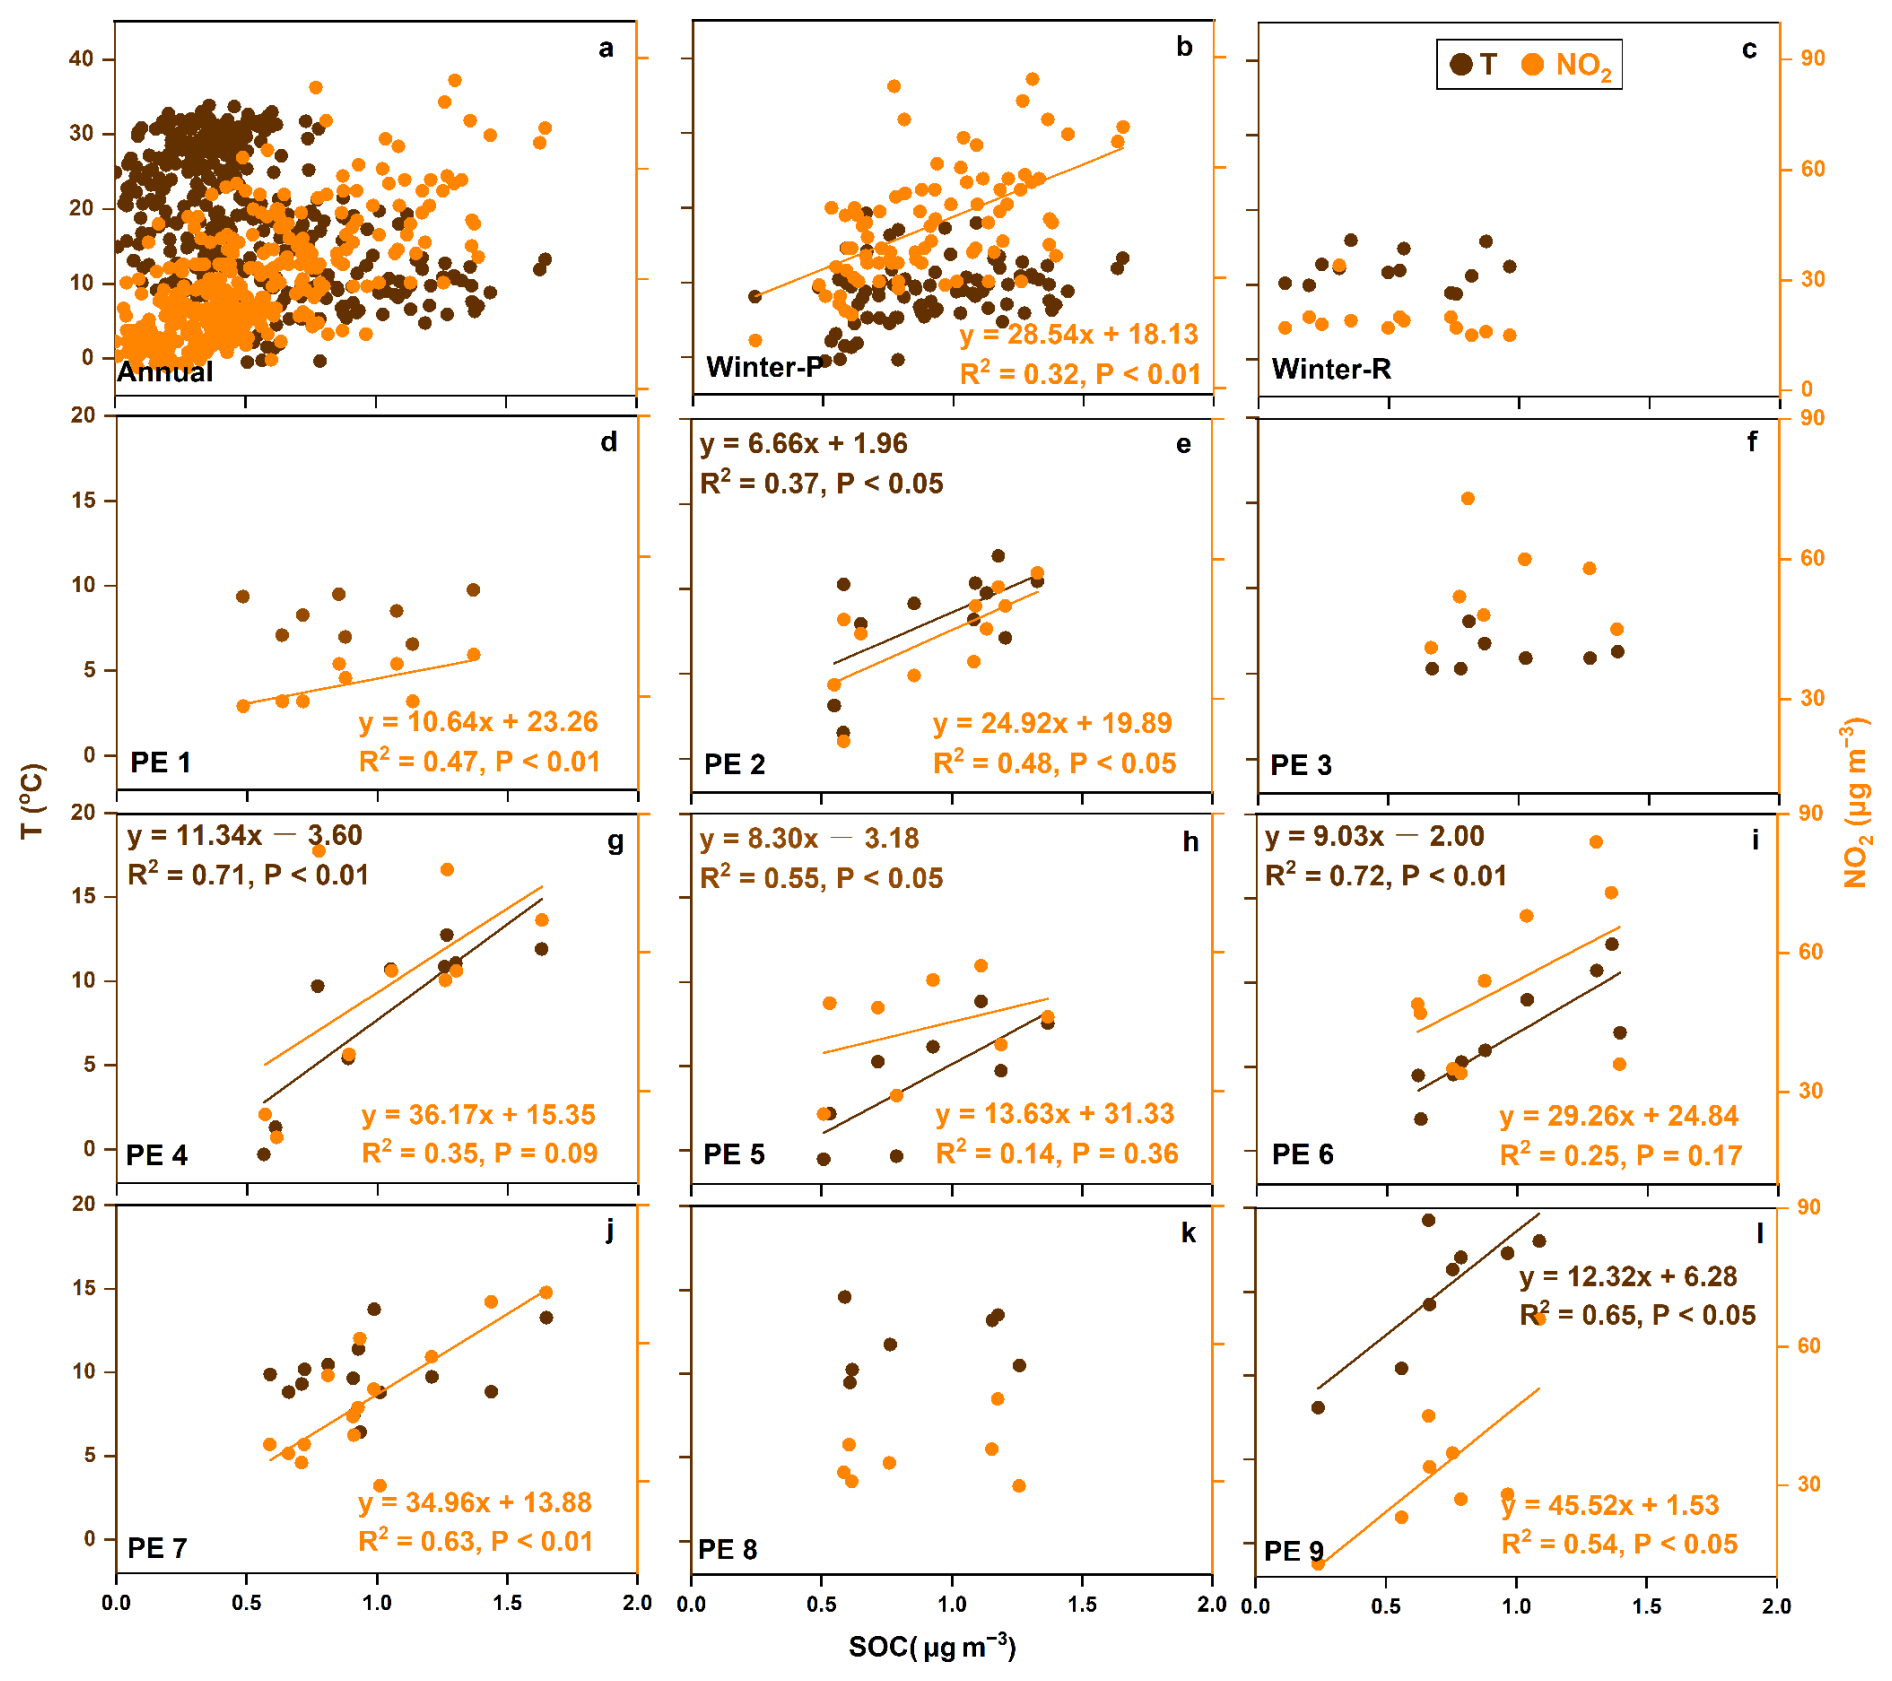
Figure 7Linear correlations between temperature, NO2, and SOC for the annual sampling periods (a), winter pollution periods (b), winter remainder (c), and individual winter pollution episodes (d–l). SOC concentrations were estimated using a tracer-based method. Winter-P refers to the winter pollution periods, while Winter-R denotes the winter remainder. PE1–PE9 correspond to winter pollution episodes 1–9. Before conducting linear correlation analyses, the Shapiro-Wilk test was used to assess the normality of the data, and linear correlations were conducted only for datasets significantly conforming to a normal distribution (p>0.05).
However, winter presents a different scenario. Regardless of whether it is during the winter pollution periods or other times in winter, POC did not maintain good consistency with the changes in the total OC content and PM2.5 mass, whereas SOC remained synchronized with their variations (Fig. S11). This phenomenon is particularly pronounced during individual pollution episodes in winter (Fig. S11). Correlation and redundancy analyses further revealed that source-specific SOC, derived using the tracer methods, and the total SOC, calculated using the EC-based method, exhibited significant positive correlations with the measured OC (r > 0.6, p < 0.05) and significantly contributed (> 40 %, p < 0.05) to their variations in entire winter pollution periods and individual pollution episodes (Fig. 6b and d–l). Given the relatively small number of nonpolluted days in winter and their scattered distribution across different dates, the correlations and contribution levels were not as evident during the remainder of the winter season (Fig. 6c). These findings indicate that on shorter timescales, particularly during brief PM pollution episodes lasting several days, SOC was a critical factor influencing the total OC content and PM2.5 mass.
The increased SOC concentration may be associated with elevated temperatures and NOx concentrations during winter pollution episodes. This inference was supported by a significant linear positive correlation between temperature, NO2 concentrations, and SOC concentrations observed during entire winter pollution periods and individual pollution episodes (Fig. 7b and d–l). Before conducting linear correlation analyses, the Shapiro-Wilk test was used to assess the normality of the data, and linear correlations were conducted only for datasets significantly conforming to a normal distribution (p>0.05). An increase in short-term solar radiation intensity and oxidant levels have been shown to accelerate SOC formation (Fry et al., 2009; Ng et al., 2017; Li et al., 2018; Ren et al., 2019). Nevertheless, the contribution of POC should not be underestimated as its levels remained relatively high throughout the winter. This elevated POC concentration can also promote SOC transformation (Weber et al., 2007; Carlton et al., 2010; Hoyle et al., 2011; Srivastava et al., 2022). Outside pollution periods in winter, variations in temperature and NO2 concentrations are minimal, which limits their promoting effect on SOC concentration increases (Fig. 7c). Additionally, we analyzed the linear correlations between other meteorological factors and SOC. In particular, we examined the relations between wind speed, relative humidity, and SOC (Fig. S12). The results indicated that no clear relation existed between wind speed and SOC. Although relative humidity showed some linear association with SOC during a few isolated pollution episodes, this relation was weak, with relatively large p-values and lacking statistical significance. These findings suggest that temperature and NO2 concentrations are likely the main meteorological and oxidative factors driving the increase of SOC during winter pollution periods in the Nanchang region.
We investigated the composition and concentration of major polar organic compounds in PM2.5 samples collected over a year in Nanchang, Central China. The results revealed relatively high concentrations of FAs, fatty alcohols, and saccharides, whereas lignin, resin products, sterols, glycerol, hydroxy acids, and aromatic acids were detected at low levels.
The study findings indicate that the organic components in the PM2.5 of Nanchang are predominantly derived from anthropogenic and natural sources. Anthropogenic sources were the primary contributors to OC and OA, and primary sources contributed more than secondary sources. Throughout the sampling period, we observed that the anthropogenic contributions significantly increased during autumn and winter, whereas biogenic contributions increased in spring and summer.
This study highlights the critical role of anthropogenic POC and SOC in influencing atmospheric PM2.5 pollution over an annual sampling period. During short-term pollution episodes in winter (lasting several days), the rapid secondary transformation emerged as the primary driver of OC increment and PM2.5 pollution. Elevated primary emissions and favorable oxidation conditions, such as increased light intensity and NOx levels, were identified as key factors facilitating the rapid secondary transformation of OC during the winter pollution episodes.
The study findings underscore the necessity for targeted management strategies that consider primary and secondary anthropogenic emission sources across different seasons and pollution periods. Although the CMB model and tracer-based method provided preliminary insights into the OC and OA from diverse sources, the study encountered several inherent limitations. First, the primary emission source profiles employed in the CMB model exhibit variability across different studies and regions, making it challenging to establish standardized source characteristic parameters and potentially affecting the accuracy of source apportionment. Second, the proportions of SOC tracers obtained from laboratory chamber experiments are influenced by various factors, and incorporating these proportions into tracer-based methods may introduce potential biases or uncertainties in the estimates. To address these issues, future research should prioritize comprehensive observational studies of primary emission sources to obtain high-resolution, region-specific emission data, thereby improving the applicability of source profiles. Combining field observations with laboratory simulations can also provide a more accurate characterization of secondary emissions, ultimately reducing the uncertainties associated with tracer-based estimates of SOC contributions.
The dataset associated with this paper is available upon request from the corresponding author (xiaohuayun@sjtu.edu.cn).
The supplement related to this article is available online at https://doi.org/10.5194/acp-25-13221-2025-supplement.
HX conceptualized and designed the research. Sampling was conducted by ZL, and laboratory analyses were conducted by WG, ZL, and RZ. Data interpretation was supported by ZZ and HX. The manuscript was primarily written by WG, with contributions and consultations from all other authors.
The contact author has declared that none of the authors has any competing interests.
Publisher’s note: Copernicus Publications remains neutral with regard to jurisdictional claims made in the text, published maps, institutional affiliations, or any other geographical representation in this paper. While Copernicus Publications makes every effort to include appropriate place names, the final responsibility lies with the authors. Also, please note that this paper has not received English language copy-editing. Views expressed in the text are those of the authors and do not necessarily reflect the views of the publisher.
We thank Ziyue Zhang and Liqin Cheng for their help with sampling and laboratory work. This study was supported by the National Natural Science Foundation of China (grant number 41863002); the Jiangxi Provincial Natural Science Foundation (grant number 20242BAB25193); the Open Foundation of Jiangxi Province Key Laboratory of the Causes and Control of Atmospheric Pollution, East China University of Technology (grant number AE2209); and the Open Foundation of Yunnan Province Key Laboratory of Earth System Science, Yunnan University (grant number ESS2024002).
This research has been supported by the National Natural Science Foundation of China (grant no. 41863002), the Natural Science Foundation of Jiangxi Province (grant no. 20242BAB25193), the Open Foundation of Jiangxi Province Key Laboratory of the Causes and Control of Atmospheric Pollution, East China University of Technology (grant no. AE2209), and the Open Foundation of Yunnan Province Key Laboratory of Earth System Science, Yunnan University (grant no. ESS2024002).
This paper was edited by Frank Keutsch and reviewed by three anonymous referees.
Al-Naiema, I. M. and Stone, E. A.: Evaluation of anthropogenic secondary organic aerosol tracers from aromatic hydrocarbons, Atmos. Chem. Phys., 17, 2053–2065, https://doi.org/10.5194/acp-17-2053-2017, 2017.
An, Z. S., Huang, R. J., Zhang, R. Y., Tie, X. X., Li, G. H., Cao, J. J., Zhou, W. J., Shi, Z. G., Han, Y. M., Gu, Z. L., and Ji, Y. M.: Severe haze in northern China: A synergy of anthropogenic emissions and atmospheric processes, Proc. Natl. Acad. Sci. U.S.A., 116, 8657–8666, https://doi.org/10.1073/pnas.1900125116, 2019.
Andreae, M. O.: Emission of trace gases and aerosols from biomass burning – an updated assessment, Atmos. Chem. Phys., 19, 8523–8546, https://doi.org/10.5194/acp-19-8523-2019, 2019.
Andreae, M. O. and Merlet, P.: Emission of trace gases and aerosols from biomass burning, Global Biogeochem. Cy., 15, 955–966, https://doi.org/10.1029/2000GB001382, 2001.
Bauer, H., Kasper-Giebl, A., Zibuschka, F., Hitzenberger, R., Kraus, G. F., and Puxbaum, H.: Determination of the Carbon Content of Airborne Fungal Spores, Anal. Chem., 74, 91–95, https://doi.org/10.1021/ac010331+, 2002.
Bauer, H., Claeys, M., Vermeylen, R., Schueller, E., Weinke, G., Berger, A., and Puxbaum, H.: Arabitol and mannitol as tracers for the quantification of airborne fungal spores, Atmos. Environ., 42, 588–593, https://doi.org/10.1016/j.atmosenv.2007.10.013, 2008.
Cai, T., Zhang, Y., Fang, D., Shang, J., Zhang, Y., and Zhang, Y.: Chinese vehicle emissions characteristic testing with small sample size: Results and comparison, Atmos. Pollut. Res., 8, 154–163, https://doi.org/10.1016/j.apr.2016.08.007, 2017.
Cao, J. J. and Cui, L.: Current Status, Characteristics and Causes of Particulate Air Pollution in the Fenwei Plain, China: A Review, J. Geophys.Res-Atmos., 126, e2020JD034472, https://doi.org/10.1029/2020JD034472, 2021.
Cao, J. J, Xu, H. M, Xu, Q., Chen, B. H., and Kan, H. D.: Fine particulate matter constituents and cardiopulmonary mortality in a heavily polluted Chinese city, Environ. Health Perspect., 120, 373–378, https://doi.org/10.1289/ehp.1103671, 2012.
Carlton, A. G., Pinder, R. W., Bhave, P. V., and Pouliot, G. A.: To What Extent Can Biogenic SOA be Controlled?, Environ. Sci. Technol., 44, 3376–3380, https://doi.org/10.1021/es903506b, 2010.
Castro, L. M., Pio, C. A., Harrison, R. M., and Smith, D. J. T.: Carbonaceous aerosol in urban and rural European atmospheres: estimation of secondary organic carbon concentrations, Atmos. Environ., 33, 2771–2781, https://doi.org/10.1016/S1352-2310(98)00331-8, 1999.
Chen, C. R., Zhang, H. X., Yan, W. J., Wu, N. N., Zhang, Q., and He, K. B.: Aerosol water content enhancement leads to changes in the major formation mechanisms of nitrate and secondary organic aerosols in winter over the North China Plain, Environ. Pollut., 287, 117625, https://doi.org/10.1016/j.envpol.2021.117625, 2021.
Chow, J. C., Watson, J. G., Chen, L. W. A., Chang, M. C. O., Robinson, N. F., Trimble, D., and Kohl, S.: The IMPROVE_A Temperature Protocol for Thermal/Optical Carbon Analysis: Maintaining Consistency with a Long-Term Database, J. Air Waste Manage., 57, 1014–1023, https://doi.org/10.3155/1047-3289.57.9.1014, 2007.
Claeys, M., Graham, B., Vas, G., Wang, W., Vermeylen, R., Pashynska, V., Cafmeyer, J., Guyon, P., Andreae, M. O., Artaxo, P., and Maenhaut, W.: Formation of Secondary Organic Aerosols Through Photooxidation of Isoprene, Science, 303, 1173–1176, https://doi.org/10.1126/science.1092805, 2004.
Claeys, M., Szmigielski, R., Kourtchev, I., Van der Veken, P., Vermeylen, R., Maenhaut, W., Jaoui, M., Kleindienst, T. E., Lewandowski, M., Offenberg, J. H., and Edney, E. O.: Hydroxydicarboxylic Acids: Markers for Secondary Organic Aerosol from the Photooxidation of α-Pinene, Environ. Sci. Technol., 41, 1628–1634, https://doi.org/10.1021/es0620181, 2007.
Ding, X., Wang, X. M., Gao, B., Fu, X. X., He, Q. F., Zhao, X. Y., Yu, J. Z., and Zheng, M.: Tracer-based estimation of secondary organic carbon in the Pearl River Delta, south China, J. Geophys. Res-Atmos., 117, https://doi.org/10.1029/2011JD016596, 2012.
Ding, X., Wang, X. M., Xie, Z. Q., Zhang, Z., and Sun, L. G.: Impacts of Siberian Biomass Burning on Organic Aerosols over the North Pacific Ocean and the Arctic: Primary and Secondary Organic Tracers, Environ. Sci. Technol., 47, 3149–3157, https://doi.org/10.1021/es3037093, 2013.
Ding, X., He, Q. F., Shen, R. Q., Yu, Q. Q., and Wang, X. M.: Spatial distributions of secondary organic aerosols from isoprene, monoterpenes, β-caryophyllene, and aromatics over China during summer, J. Geophys. Res-Atmos., 119, 11877–811891, https://doi.org/10.1002/2014JD021748, 2014.
Duhl, T. R., Helmig, D., and Guenther, A.: Sesquiterpene emissions from vegetation: a review, Biogeosciences, 5, 761–777, https://doi.org/10.5194/bg-5-761-2008, 2008.
Eddingsaas, N. C., Loza, C. L., Yee, L. D., Chan, M., Schilling, K. A., Chhabra, P. S., Seinfeld, J. H., and Wennberg, P. O.: α-pinene photooxidation under controlled chemical conditions – Part 2: SOA yield and composition in low- and high-NOx environments, Atmos. Chem. Phys., 12, 7413–7427, https://doi.org/10.5194/acp-12-7413-2012, 2012.
Engling, G., He, J., Betha, R., and Balasubramanian, R.: Assessing the regional impact of indonesian biomass burning emissions based on organic molecular tracers and chemical mass balance modeling, Atmos. Chem. Phys., 14, 8043–8054, https://doi.org/10.5194/acp-14-8043-2014, 2014.
Fabbri, D., Torri, C., Simoneit, B. R. T., Marynowski, L., Rushdi, A. I., and Fabiańska, M. J.: Levoglucosan and other cellulose and lignin markers in emissions from burning of Miocene lignites, Atmos. Environ., 43, 2286–2295, https://doi.org/10.1016/j.atmosenv.2009.01.030, 2009.
Fan, Y., Liu, C.-Q., Li, L., Ren, L., Ren, H., Zhang, Z., Li, Q., Wang, S., Hu, W., Deng, J., Wu, L., Zhong, S., Zhao, Y., Pavuluri, C. M., Li, X., Pan, X., Sun, Y., Wang, Z., Kawamura, K., Shi, Z., and Fu, P.: Large contributions of biogenic and anthropogenic sources to fine organic aerosols in Tianjin, North China, Atmos. Chem. Phys., 20, 117–137, https://doi.org/10.5194/acp-20-117-2020, 2020.
Fine, P. M., Cass, G. R., and Simoneit, B. R. T.: Chemical Characterization of Fine Particle Emissions from the Fireplace Combustion of Wood Types Grown in the Midwestern and Western United States, Environ. Eng. Sci., 21, 387–409, https://doi.org/10.1089/109287504323067021, 2004.
Frauenheim, M., Offenberg, J., Zhang, Z., Surratt, J. D., and Gold, A.: The C5–Alkene Triol Conundrum: Structural Characterization and Quantitation of Isoprene-Derived C5H10O3 Reactive Uptake Products, Environ. Sci. Tech. Let., 9, 829–836, https://doi.org/10.1021/acs.estlett.2c00548, 2022.
Frauenheim, M., Offenberg, J., Zhang, Z., Surratt, J. D., and Gold, A.: Chemical Composition of Secondary Organic Aerosol Formed from the Oxidation of Semivolatile Isoprene Epoxydiol Isomerization Products, Environ. Sci. Technol., 58, 22571–22582, https://doi.org/10.1021/acs.est.4c06850, 2024.
Fry, J. L., Kiendler-Scharr, A., Rollins, A. W., Wooldridge, P. J., Brown, S. S., Fuchs, H., Dubé, W., Mensah, A., dal Maso, M., Tillmann, R., Dorn, H.-P., Brauers, T., and Cohen, R. C.: Organic nitrate and secondary organic aerosol yield from NO3 oxidation of β-pinene evaluated using a gas-phase kinetics/aerosol partitioning model, Atmos. Chem. Phys., 9, 1431–1449, https://doi.org/10.5194/acp-9-1431-2009, 2009.
Fu, P. Q., Kawamura, K., Okuzawa, K., Aggarwal, S. G., Wang, G., Kanaya, Y., and Wang, Z.: Organic molecular compositions and temporal variations of summertime mountain aerosols over Mt. Tai, North China Plain, J. Geophys. Res-Atmos., 113, https://doi.org/10.1029/2008JD009900, 2008.
Fu, P. Q., Kawamura, K., and Barrie, L. A.: Photochemical and other sources of organic compounds in the Canadian high arctic aerosol pollution during winter-spring, Environ. Sci. Technol., 43, 286–292, https://doi.org/10.1021/es803046q, 2009.
Fu, P. Q., Kawamura, K., Pavuluri, C. M., Swaminathan, T., and Chen, J.: Molecular characterization of urban organic aerosol in tropical India: contributions of primary emissions and secondary photooxidation, Atmos. Chem. Phys., 10, 2663–2689, https://doi.org/10.5194/acp-10-2663-2010, 2010.
Fu, P. Q., Kawamura, K., and Miura, K.: Molecular characterization of marine organic aerosols collected during a round-the-world cruise, J. Geophys. Res-Atmos., 116, https://doi.org/10.1029/2011JD015604, 2011.
Fu, P. Q., Kawamura, K., Kobayashi, M., and Simoneit, B. R. T.: Seasonal variations of sugars in atmospheric particulate matter from Gosan, Jeju Island: Significant contributions of airborne pollen and Asian dust in spring, Atmos. Environ., 55, 234–239, https://doi.org/10.1016/j.atmosenv.2012.02.061, 2012.
Fu, P. Q., Kawamura, K., Chen, J., and Miyazaki, Y.: Secondary Production of Organic Aerosols from Biogenic VOCs over Mt. Fuji, Japan, Environ. Sci. Technol., 48, 8491–8497, https://doi.org/10.1021/es500794d, 2014.
Graham, B., Guyon, P., Taylor, P. E., Artaxo, P., Maenhaut, W., Glovsky, M. M., Flagan, R. C., and Andreae, M. O.: Organic compounds present in the natural Amazonian aerosol: Characterization by gas chromatography–mass spectrometry, J. Geophys. Res.-Atmos., 108, https://doi.org/10.1029/2003JD003990, 2003.
Guenther, A., Hewitt, C. N., Erickson, D., Fall, R., Geron, C., Graedel, T., Harley, P., Klinger, L., Lerdau, M., Mckay, W. A., Pierce, T., Scholes, B., Steinbrecher, R., Tallamraju, R., Taylor, J., and Zimmerman, P.: A global model of natural volatile organic compound emissions, J. Geophys. Res.-Atmos., 100, 8873–8892, https://doi.org/10.1029/94JD02950, 1995.
Guo, S., Hu, M., Guo, Q., Zhang, X., Zheng, M., Zheng, J., Chang, C. C., Schauer, J. J., and Zhang, R.: Primary Sources and Secondary Formation of Organic Aerosols in Beijing, China, Environ. Sci. Technol., 46, 9846–9853, 10.1021/es2042564, 2012.
Guo, W., Li, Z. C., Zhang, Z. Y., Zhu, R. G., Xiao, H. W., and Xiao, H. Y.: Sources and influences of atmospheric nonpolar organic compounds in Nanchang, central China: Full-year monitoring with a focus on winter pollution episodes, Sci. Total Environ., 912, 169216, https://doi.org/10.1016/j.scitotenv.2023.169216, 2024a.
Guo, W., Zhang, Z. Y., Zhu, R. G., Li, Z. C., Liu, C., Xiao, H. W., and Xiao, H. Y.: Pollution characteristics, sources, and health risks of phthalate esters in ambient air: A daily continuous monitoring study in the central Chinese city of Nanchang, Chemosphere, 353, 141564, https://doi.org/10.1016/j.chemosphere.2024.141564, 2024b.
Hallquist, M., Wenger, J. C., Baltensperger, U., Rudich, Y., Simpson, D., Claeys, M., Dommen, J., Donahue, N. M., George, C., Goldstein, A. H., Hamilton, J. F., Herrmann, H., Hoffmann, T., Iinuma, Y., Jang, M., Jenkin, M. E., Jimenez, J. L., Kiendler-Scharr, A., Maenhaut, W., McFiggans, G., Mentel, Th. F., Monod, A., Prévôt, A. S. H., Seinfeld, J. H., Surratt, J. D., Szmigielski, R., and Wildt, J.: The formation, properties and impact of secondary organic aerosol: current and emerging issues, Atmos. Chem. Phys., 9, 5155–5236, https://doi.org/10.5194/acp-9-5155-2009, 2009.
Haque, Md. M., Kawamura, K., Deshmukh, D. K., Fang, C., Song, W., Mengying, B., and Zhang, Y.-L.: Characterization of organic aerosols from a Chinese megacity during winter: predominance of fossil fuel combustion, Atmos. Chem. Phys., 19, 5147–5164, https://doi.org/10.5194/acp-19-5147-2019, 2019.
Haque, Md. M., Zhang, Y., Bikkina, S., Lee, M., and Kawamura, K.: Regional heterogeneities in the emission of airborne primary sugar compounds and biogenic secondary organic aerosols in the East Asian outflow: evidence for coal combustion as a source of levoglucosan, Atmos. Chem. Phys., 22, 1373–1393, https://doi.org/10.5194/acp-22-1373-2022, 2022.
Haque, M. M., Verma, S. K., Deshmukh, D. K., Kunwar, B., and Kawamura, K.: Seasonal characteristics of biogenic secondary organic aerosol tracers in a deciduous broadleaf forest in northern Japan, Chemosphere, 311, 136785, https://doi.org/10.1016/j.chemosphere.2022.136785, 2023.
He, L. Y., Hu, M., Huang, X. F., Yu, B. D., Zhang, Y. H., and Liu, D. Q.: Measurement of emissions of fine particulate organic matter from Chinese cooking, Atmos. Environ., 38, 6557–6564, https://doi.org/10.1016/j.atmosenv.2004.08.034, 2004.
He, L. Y., Hu, M., Huang, X. F., Zhang, Y. H., and Tang, X. Y.: Seasonal pollution characteristics of organic compounds in atmospheric fine particles in Beijing, Sci. Total Environ., 359, 167–176, https://doi.org/10.1016/j.scitotenv.2005.05.044, 2006.
Helmig, D., Ortega, J., Guenther, A., Herrick, J. D., and Geron, C.: Sesquiterpene emissions from loblolly pine and their potential contribution to biogenic aerosol formation in the Southeastern US, Atmos. Environ., 40, 4150–4157, https://doi.org/10.1016/j.atmosenv.2006.02.035, 2006.
Holmes, B. J. and Petrucci, G. A.: Water-soluble oligomer formation from acid-catalyzed reactions of levoglucosan in proxies of atmospheric aqueous aerosols, Environ. Sci. Technol., 40, 4983–4989, https://doi.org/10.1021/es060646c, 2006.
Hoffmann, D., Tilgner, A., Iinuma, Y., and Herrmann, H.: Atmospheric stability of levoglucosan: a detailed laboratory and modeling study, Environ. Sci. Technol., 44, 694–699, https://doi.org/10.1021/es902476f, 2010.
Hoyle, C. R., Boy, M., Donahue, N. M., Fry, J. L., Glasius, M., Guenther, A., Hallar, A. G., Huff Hartz, K., Petters, M. D., Petäjä, T., Rosenoern, T., and Sullivan, A. P.: A review of the anthropogenic influence on biogenic secondary organic aerosol, Atmos. Chem. Phys., 11, 321–343, https://doi.org/10.5194/acp-11-321-2011, 2011.
Huang, R. J., Zhang, Y., Bozzetti, C., Ho, K. F., Cao, J. J., Han, Y., Daellenbach, K. R., Slowik, J. G., Platt, S. M., Canonaco, F., Zotter, P., Wolf, R., Pieber, S. M., Bruns, E. A., Crippa, M., Ciarelli, G., Piazzalunga, A., Schwikowski, M., Abbaszade, G., Schnelle-Kreis, J., Zimmermann, R., An, Z., Szidat, S., Baltensperger, U., El Haddad, I., and Prevot, A. S.: High secondary aerosol contribution to particulate pollution during haze events in China, Nature, 514, 218–222, https://doi.org/10.1038/nature13774, 2014.
Huang, Y., Shen, H., Chen, Y., Zhong, Q., Chen, H., Wang, R., Shen, G., Liu, J., Li, B., and Tao, S.: Global organic carbon emissions from primary sources from 1960 to 2009, Atmos. Environ., 122, 505–512, https://doi.org/10.1016/j.atmosenv.2015.10.017, 2015.
Huebert, B., Bates, T., Russell, P., Shi, G., Kim, Y., Kawamura, K., Carmichael, G., and Nakajima, T.: An overview of ACE-Asia: Strategies for quantifying the relationships between Asian aerosols and their climatic impacts, J. Geophys. Res-Atmos., 108, https://doi.org/10.1029/2003JD003550, 2003.
Iyer, S., Rissanen, M. P., Valiev, R., Barua, S., Krechmer, J. E., Thornton, J., Ehn, M., and Kurtén, T.: Molecular mechanism for rapid autoxidation in α-pinene ozonolysis, Nat. Commun., 12, 878, 10.1038/s41467-021-21172-w, 2021.
Jaoui, M., Kleindienst, T. E., Lewandowski, M., Offenberg, J. H., and Edney, E. O.: Identification and Quantification of Aerosol Polar Oxygenated Compounds Bearing Carboxylic or Hydroxyl Groups. 2. Organic Tracer Compounds from Monoterpenes, Environ. Sci. Technol., 39, 5661–5673, 10.1021/es048111b, 2005.
Jaoui, M., Szmigielski, R., Nestorowicz, K., Kolodziejczyk, A., Sarang, K., Rudzinski, K. J., Konopka, A., Bulska, E., Lewandowski, M., and Kleindienst, T. E.: Organic Hydroxy Acids as Highly Oxygenated Molecular (HOM) Tracers for Aged Isoprene Aerosol, Environ. Sci. Technol., 53, 14516–14527, 10.1021/acs.est.9b05075, 2019.
Kanakidou, M., Seinfeld, J. H., Pandis, S. N., Barnes, I., Dentener, F. J., Facchini, M. C., Van Dingenen, R., Ervens, B., Nenes, A., Nielsen, C. J., Swietlicki, E., Putaud, J. P., Balkanski, Y., Fuzzi, S., Horth, J., Moortgat, G. K., Winterhalter, R., Myhre, C. E. L., Tsigaridis, K., Vignati, E., Stephanou, E. G., and Wilson, J.: Organic aerosol and global climate modelling: a review, Atmos. Chem. Phys., 5, 1053–1123, https://doi.org/10.5194/acp-5-1053-2005, 2005.
Kawamura, K. and Gagosian, R. B.: Implications of ω-oxocarboxylic acids in the remote marine atmosphere for photo-oxidation of unsaturated fatty acids, Nature, 325, 330–332, https://doi.org/10.1038/325330a0, 1987.
Kawamura, K. and Ikushima, K.: Seasonal changes in the distribution of dicarboxylic acids in the urban atmosphere, Environ. Sci. Technol., 27, 2227–2235, https://doi.org/10.1021/ES00047A033, 1993.
Kawamura, K. and Kaplan, I. R.: Motor exhaust emissions as a primary source for dicarboxylic acids in Los Angeles ambient air, Environ. Sci. Technol., 21, 105–110, https://doi.org/10.1021/es00155a014, 1987.
Kawamura, K. and Sakaguchi, F.: Molecular distributions of water soluble dicarboxylic acids in marine aerosols over the Pacific Ocean including tropics, J. Geophys. Res-Atmos., 104, 3501–3509, https://doi.org/10.1029/1998JD100041, 1999.
Kawamura, K., Steinberg, S., and Kaplan, I. R.: Homologous series of C1–C10 monocarboxylic acids and C1–C6 carbonyls in Los Angeles air and motor vehicle exhausts, Atmos. Environ., 34, 4175–4191, https://doi.org/10.1016/S1352-2310(00)00212-0, 2000.
Kawamura, K., Ishimura, Y., and Yamazaki, K.: Four years' observations of terrestrial lipid class compounds in marine aerosols from the western North Pacific, Global Biogeochem. Cy., 17, 1003, https://doi.org/10.1029/2001GB001810, 2003.
Kleindienst, T. E., Jaoui, M., Lewandowski, M., Offenberg, J. H., Lewis, C. W., Bhave, P. V., and Edney, E. O.: Estimates of the contributions of biogenic and anthropogenic hydrocarbons to secondary organic aerosol at a southeastern US location, Atmos. Environ., 41, 8288–8300, https://doi.org/10.1016/j.atmosenv.2007.06.045, 2007.
Kleindienst, T. E., Lewandowski, M., Offenberg, J. H., Jaoui, M., and Edney, E. O.: The formation of secondary organic aerosol from the isoprene + OH reaction in the absence of NOx, Atmos. Chem. Phys., 9, 6541–6558, https://doi.org/10.5194/acp-9-6541-2009, 2009.
Kleindienst, T. E., Jaoui, M., Lewandowski, M., Offenberg, J. H., and Docherty, K. S.: The formation of SOA and chemical tracer compounds from the photooxidation of naphthalene and its methyl analogs in the presence and absence of nitrogen oxides, Atmos. Chem. Phys., 12, 8711–8726, https://doi.org/10.5194/acp-12-8711-2012, 2012.
Kunwar, B. and Kawamura, K.: One-year observations of carbonaceous and nitrogenous components and major ions in the aerosols from subtropical Okinawa Island, an outflow region of Asian dusts, Atmos. Chem. Phys., 14, 1819–1836, https://doi.org/10.5194/acp-14-1819-2014, 2014.
Lewandowski, M., Jaoui, M., Offenberg, J. H., Kleindienst, T. E., Edney, E. O., Sheesley, R. J., and Schauer, J. J.: Primary and secondary contributions to ambient PM in the midwestern United States, Environ. Sci. Technol., 42, 3303–3309, https://doi.org/10.1021/es0720412, 2008.
Lewandowski, M., Piletic, I. R., Kleindienst, T. E., Offenberg, J. H., Beaver, M. R., Jaoui, M., Docherty, K. S., and Edney, E. O.: Secondary organic aerosol characterisation at field sites across the United States during the spring–summer period, Int. J. Environ. An. Ch., 93, 1084–1103, https://doi.org/10.1080/03067319.2013.803545, 2013.
Li, H., Cheng, J., Zhang, Q., Zheng, B., Zhang, Y., Zheng, G., and He, K.: Rapid transition in winter aerosol composition in Beijing from 2014 to 2017: response to clean air actions, Atmos. Chem. Phys., 19, 11485–11499, https://doi.org/10.5194/acp-19-11485-2019, 2019a.
Li, J. J., Wang, G. H., Cao, J. J., Wang, X. M., and Zhang, R. J.: Observation of biogenic secondary organic aerosols in the atmosphere of a mountain site in central China: temperature and relative humidity effects, Atmos. Chem. Phys., 13, 11535–11549, https://doi.org/10.5194/acp-13-11535-2013, 2013.
Li, J. J., Wang, G. H., Wu, C., Cao, C., Ren, Y.Q., Wang, J. Y., Li, J., Cao, J. J., Zeng, L. M., and Zhu, T.: Characterization of isoprene-derived secondary organic aerosols at a rural site in North China Plain with implications for anthropogenic pollution effects, Sci. Rep.-UK, 8, 535, https://doi.org/10.1038/s41598-017-18983-7, 2018.
Li, J., Wang, G., Zhang, Q., Li, J., Wu, C., Jiang, W., Zhu, T., and Zeng, L.: Molecular characteristics and diurnal variations of organic aerosols at a rural site in the North China Plain with implications for the influence of regional biomass burning, Atmos. Chem. Phys., 19, 10481–10496, https://doi.org/10.5194/acp-19-10481-2019, 2019b.
Lin, Y.-H., Knipping, E. M., Edgerton, E. S., Shaw, S. L., and Surratt, J. D.: Investigating the influences of SO2 and NH3 levels on isoprene-derived secondary organic aerosol formation using conditional sampling approaches, Atmos. Chem. Phys., 13, 8457–8470, https://doi.org/10.5194/acp-13-8457-2013, 2013.
Liu, D., Xu, S. F., Lang, Y. C., Hou, S. J., Wei, L. F., Pan, X. L., Sun, Y. L., Wang, Z. F., Kawamura, K., and Fu, P. Q.: Size distributions of molecular markers for biogenic secondary organic aerosol in urban Beijing, Environ. Pollut., 327, 121569, https://doi.org/10.1016/j.envpol.2023.121569, 2023.
Ng, N. L., Brown, S. S., Archibald, A. T., Atlas, E., Cohen, R. C., Crowley, J. N., Day, D. A., Donahue, N. M., Fry, J. L., Fuchs, H., Griffin, R. J., Guzman, M. I., Herrmann, H., Hodzic, A., Iinuma, Y., Jimenez, J. L., Kiendler-Scharr, A., Lee, B. H., Luecken, D. J., Mao, J., McLaren, R., Mutzel, A., Osthoff, H. D., Ouyang, B., Picquet-Varrault, B., Platt, U., Pye, H. O. T., Rudich, Y., Schwantes, R. H., Shiraiwa, M., Stutz, J., Thornton, J. A., Tilgner, A., Williams, B. J., and Zaveri, R. A.: Nitrate radicals and biogenic volatile organic compounds: oxidation, mechanisms, and organic aerosol, Atmos. Chem. Phys., 17, 2103–2162, https://doi.org/10.5194/acp-17-2103-2017, 2017.
Nguyen, T. B., Bates, K. H., Crounse, J. D., Schwantes, R. H., Zhang, X., Kjaergaard, H. G., Surratt, J. D., Lin, P., Laskin, A., Seinfeld, J. H., and Wennberg, P. O.: Mechanism of the hydroxyl radical oxidation of methacryloyl peroxynitrate (MPAN) and its pathway toward secondary organic aerosol formation in the atmosphere, Chem. Phys., 17, 17914–17926, https://doi.org/10.1039/c5cp02001h, 2015.
Nolte, C. G., Schauer, J. J., Cass, G. R., and Simoneit, B. R. T.: Highly Polar Organic Compounds Present in Meat Smoke, Environ. Sci. Technol., 33, 3313–3316, https://doi.org/10.1021/es990122v, 1999.
Nolte, C. G., Schauer, J. J., Cass, G. R., and Simoneit, B. R. T.: Highly Polar Organic Compounds Present in Wood Smoke and in the Ambient Atmosphere, Environ. Sci. Technol., 35, 1912–1919, https://doi.org/10.1021/es001420r, 2001.
Nozière, B., González, N. J. D., Borg-Karlson, A. K., Pei, Y. X., Redeby, J. P., Krejci, R., Dommen, J., Prévôt, A. S. H., and Anthonsen, T.: Atmospheric chemistry in stereo: A new look at secondary organic aerosols from isoprene, Geophys. Res. Lett., 38, https://doi.org/10.1029/2011GL047323, 2011.
Oros, D. R. and Simoneit, B. R. T.: Identification and emission rates of molecular tracers in coal smoke particulate matter, Fuel, 79, 515–536, https://doi.org/10.1016/S0016-2361(99)00153-2, 2000.
Oros, D. R. and Simoneit, B. R. T.: Identification and emission factors of molecular tracers in organic aerosols from biomass burning Part 2. Deciduous trees, Appl. Geochem., 16, 1545–1565, https://doi.org/10.1016/S0883-2927(01)00022-1, 2001.
Piccot, S. D., Watson, J. J., and Jones, J. W.: A global inventory of volatile organic compound emissions from anthropogenic sources, J. Geophys. Res., 97, 9897–9912, https://doi.org/10.1029/92JD00682, 1992.
Puxbaum, H. and Tenze-Kunit, M.: Size distribution and seasonal variation of atmospheric cellulose, Atmos. Environ., 37, 3693–3699, https://doi.org/10.1016/S1352-2310(03)00451-5, 2003.
Ren, H., Hu, W., Wei, L., Yue, S., Zhao, J., Li, L., Wu, L., Zhao, W., Ren, L., Kang, M., Xie, Q., Su, S., Pan, X., Wang, Z., Sun, Y., Kawamura, K., and Fu, P.: Measurement report: Vertical distribution of biogenic and anthropogenic secondary organic aerosols in the urban boundary layer over Beijing during late summer, Atmos. Chem. Phys., 21, 12949–12963, https://doi.org/10.5194/acp-21-12949-2021, 2021.
Ren, Y. Q., Wang, G. H., Tao, J., Zhang, Z. S., Wu, C., Wang, J. Y., Li, J. J, Wei, J., Li, H., and Meng, F.: Seasonal characteristics of biogenic secondary organic aerosols at Mt. Wuyi in Southeastern China: Influence of anthropogenic pollutants, Environ. Pollut., 252, 493–500, https://doi.org/10.1016/j.envpol.2019.05.077, 2019.
Riipinen, I., Yli-Juuti, T., Pierce, J. R., Petaja, T., Worsnop, D. R., Kulmala, M., and Donahue, N. M.: The contribution of organics to atmospheric nanoparticle growth, Nat. Geosci., 5, 453–458, https://doi.org/10.1038/ngeo1499, 2012.
Rogge, W. F., Hildemann, L. M., Mazurek, M. A., Cass, G. R., and Simoneit, B. R. T.: Sources of fine organic aerosol. 1. Charbroilers and meat cooking operations, Environ. Sci. Technol., 25, 1112–1125, https://doi.org/10.1021/es00018a015, 1991.
Rogge, W. F., Hildemann, L. M., Mazurek, M. A., Cass, G. R., Simoneit, B. R. T. J. E. S., and Technology: Sources of fine organic aerosol. 2. Noncatalyst and catalyst-equipped automobiles and heavy-duty diesel trucks, Environ. Sci. Technol., 27, 636–651, https://doi.org/10.1021/es00041a007, 1993a.
Rogge, W. F., Hildemann, L. M., Mazurek, M. A., Cass, G. R., and Simoneit, B. R. T.: Sources of fine organic aerosol. 4. Particulate abrasion products from leaf surfaces of urban plants, Environ. Sci. Technol., 27, 2700–2711, https://doi.org/10.1021/es00049a008, 1993b.
Rogge, W. F., Medeiros, P. M., and Simoneit, B. R. T.: Organic marker compounds for surface soil and fugitive dust from open lot dairies and cattle feedlots, Atmos. Environ., 40, 27–49, https://doi.org/10.1016/j.atmosenv.2005.07.076, 2006.
Rudich, Y., Donahue, N. M., and Mentel, T. F.: Aging of organic aerosol: bridging the gap between laboratory and field studies, Annu. Rev. Phys. Chem., 58, 321–352, https://doi.org/10.1146/annurev.physchem.58.032806.104432, 2007.
Rybicki, M., Marynowski, L., Bechtel, A., and Simoneit, B. R. T.: Variations in δ13C values of levoglucosan from low-temperature burning of lignite and biomass, Sci. Total Environ., 733, 138991, https://doi.org/10.1016/j.scitotenv.2020.138991, 2020a.
Rybicki, M., Marynowski, L., and Simoneit, B. R. T.: Composition of organic compounds from low-temperature burning of lignite and their application as tracers in ambient air, Chemosphere, 249, 126087, https://doi.org/10.1016/j.chemosphere.2020.126087, 2020b.
Sharkey, T. D., Wiberley, A. E., and Donohue, A. R.: Isoprene emission from plants: why and how, Annals of Botany, 101, 5–18, https://doi.org/10.1093/aob/mcm240, 2008.
Sheesley, R. J., Schauer, J. J., Chowdhury, Z., Cass, G. R., and Simoneit, B. R. T.: Characterization of organic aerosols emitted from the combustion of biomass indigenous to South Asia, J. Geophys. Res-Atmos., 108, https://doi.org/10.1029/2002JD002981, 2003.
Shiraiwa, M., Ueda, K., Pozzer, A., Lammel, G., Kampf, C. J., Fushimi, A., Enami, S., Arangio, A. M., Fröhlich-Nowoisky, J., Fujitani, Y., Furuyama, A., Lakey, P. S. J., Lelieveld, J., Lucas, K., Morino, Y., Pöschl, U., Takahama, S., Takami, A., Tong, H., Weber, B., Yoshino, A., and Sato, K.: Aerosol Health Effects from Molecular to Global Scales, Environ. Sci. Technol., 51, 13545–13567, https://doi.org/10.1021/acs.est.7b04417, 2017.
Simoneit, B. R. T.: Biomass burning – a review of organic tracers for smoke from incomplete combustion, Applied Geochemistry, 17, 129–162, https://doi.org/10.1016/S0883-2927(01)00061-0, 2002.
Simoneit, B. R. T., Kobayashi, M., Mochida, M., Kawamura, K., and Huebert, B. J.: Aerosol particles collected on aircraft flights over the northwestern Pacific region during the ACE-Asia campaign: Composition and major sources of the organic compounds, J. Geophys. Res-Atmos., 109, https://doi.org/10.1029/2004JD004565, 2004a.
Simoneit, B. R., Elias, V. O., Kobayashi, M., Kawamura, K., Rushdi, A. I., Medeiros, P. M., Rogge, W. F., and Didyk, B. M.: Sugars-dominant water-soluble organic compounds in soils and characterization as tracers in atmospheric particulate matter, Environ. Sci. Technol., 38, 5939–5949, https://doi.org/10.1021/es0403099, 2004b.
Srivastava, D., Vu, T. V., Tong, S., Shi, Z., and Harrison, R. M.: Formation of secondary organic aerosols from anthropogenic precursors in laboratory studies, Npj. Clim. Atmos. Sci., 5, 22, https://doi.org/10.1038/s41612-022-00238-6, 2022.
Stohl, A., Berg, T., Burkhart, J. F., Fjǽraa, A. M., Forster, C., Herber, A., Hov, Ø., Lunder, C., McMillan, W. W., Oltmans, S., Shiobara, M., Simpson, D., Solberg, S., Stebel, K., Ström, J., Tørseth, K., Treffeisen, R., Virkkunen, K., and Yttri, K. E.: Arctic smoke – record high air pollution levels in the European Arctic due to agricultural fires in Eastern Europe in spring 2006, Atmos. Chem. Phys., 7, 511–534, https://doi.org/10.5194/acp-7-511-2007, 2007.
Stone, E. A., Zhou, J., Snyder, D. C., Rutter, A. P., Mieritz, M., and Schauer, J. J.: A comparison of summertime secondary organic aerosol source contributions at contrasting urban locations, Environ. Sci. Technol., 43, 3448–3454, https://doi.org/10.1021/es8025209, 2009.
Surratt, J. D., Murphy, S. M., Kroll, J. H., Ng, N. L., Hildebrandt, L., Sorooshian, A., Szmigielski, R., Vermeylen, R., Maenhaut, W., Claeys, M., Flagan, R. C., and Seinfeld, J. H.: Chemical Composition of Secondary Organic Aerosol Formed from the Photooxidation of Isoprene, J. Phys. Chem. A, 110, 9665–9690, 10.1021/jp061734m, 2006.
Surratt, J. D., Chan, A. W. H., Eddingsaas, N. C., Chan, M., Loza, C. L., Kwan, A. J., Hersey, S. P., Flagan, R. C., Wennberg, P. O., and Seinfeld, J. H.: Reactive intermediates revealed in secondary organic aerosol formation from isoprene, Proc. Natl. Acad. Sci. U.S.A., 107, 6640–6645, https://doi.org/https://doi.org/10.1073/pnas.0911114107, 2010.
Tang, T. G., Cheng, Z. N., Xu, B. Q., Zhang, B. L., Li, J., Zhang, W., Wang, K. L., and Zhang, G.: Source Diversity of Intermediate Volatility n-Alkanes Revealed by Compound-Specific δ13C−δD Isotopes, Environ. Sci. Technol., 56, 14262–14271, https://doi.org/10.1021/acs.est.2c02156, 2022.
Tong, D., Cheng, J., Liu, Y., Yu, S., Yan, L., Hong, C., Qin, Y., Zhao, H., Zheng, Y., Geng, G., Li, M., Liu, F., Zhang, Y., Zheng, B., Clarke, L., and Zhang, Q.: Dynamic projection of anthropogenic emissions in China: methodology and 2015–2050 emission pathways under a range of socio-economic, climate policy, and pollution control scenarios, Atmos. Chem. Phys., 20, 5729–5757, https://doi.org/10.5194/acp-20-5729-2020, 2020.
Turpin, B. J. and Huntzicker, J. J.: Identification of secondary organic aerosol episodes and quantitation of primary and secondary organic aerosol concentrations during SCAQS, Atmos. Environ., 29, 3527–3544, https://doi.org/10.1016/1352-2310(94)00276-Q, 1995.
von Schneidemesser, E., Zhou, J., Stone, E. A., Schauer, J. J., Shpund, J., Brenner, S., Qasrawi, R., Abdeen, Z., and Sarnat, J. A.: Spatial Variability of Carbonaceous Aerosol Concentrations in East and West Jerusalem, Environ. Sci. Technol., 44, 1911–1917, https://doi.org/10.1021/es9014025, 2010.
Wang, G. H. and Kawamura, K.: Molecular Characteristics of Urban Organic Aerosols from Nanjing: A Case Study of A Mega-City in China, Environ. Sci. Technol., 39, 7430–7438, https://doi.org/10.1021/es051055, 2005.
Wang, G. H., Kawamura, K., Lee, S., Ho, K., and Cao, J. J.: Molecular, Seasonal, and Spatial Distributions of Organic Aerosols from Fourteen Chinese Cities, Environ. Sci. Technol., 40, 4619–4625, https://doi.org/10.1021/es060291x, 2006.
Wang, G. H., Kawamura, K., Hatakeyama, S., Takami, A., Li, H., and Wang, W.: Aircraft Measurement of Organic Aerosols over China, Environ. Sci. Technol., 41, 3115–3120, https://doi.org/10.1021/es062601h, 2007.
Wang, Q., Shao, M., Zhang, Y., Wei, Y., Hu, M., and Guo, S.: Source apportionment of fine organic aerosols in Beijing, Atmos. Chem. Phys., 9, 8573–8585, https://doi.org/10.5194/acp-9-8573-2009, 2009.
Wang, Y., Pavuluri, C. M., Fu, P. Q,, Li, P. S., Dong, Z. C., Xu, Z. J,, Ren, H., Fan, Y. B., Li, L. J,, Zhang, Y. L., and Liu, C. Q.: Characterization of Secondary Organic Aerosol Tracers over Tianjin, North China during Summer to Autumn, ACS Earth Space Chem., 3, 2339–2352, 10.1021/acsearthspacechem.9b00170, 2019.
Wang, Z., Wu, D., Li, Z., Shang, X., Li, Q., Li, X., Chen, R., Kan, H., Ouyang, H., Tang, X., and Chen, J.: Measurement report: Saccharide composition in atmospheric fine particulate matter during spring at the remote sites of southwest China and estimates of source contributions, Atmos. Chem. Phys., 21, 12227–12241, https://doi.org/10.5194/acp-21-12227-2021, 2021.
Weber, R. J., Sullivan, A. P., Peltier, R. E., Russell, A. G., Yan, B., Zheng, M., Gouw, J. d., Warneke, C., Brock, C. A., Holloway, J. S., Atlas, E. L., and Edgerton, E. S.: A study of secondary organic aerosol formation in the anthropogenic-influenced southeastern United States, J. Geophys. Res-Atmos., 112, https://doi.org/10.1029/2007JD008408, 2007.
Wu, J., Bei, N., Wang, Y., Li, X., Liu, S., Liu, L., Wang, R., Yu, J., Le, T., Zuo, M., Shen, Z., Cao, J., Tie, X., and Li, G.: Insights into particulate matter pollution in the North China Plain during wintertime: local contribution or regional transport?, Atmos. Chem. Phys., 21, 2229–2249, https://doi.org/10.5194/acp-21-2229-2021, 2021.
Wu, X., Chen, C., Vu, T. V., Liu, D., Baldo, C., Shen, X., Zhang, Q., Cen, K., Zheng, M., He, K., Shi, Z., and Harrison, R. M.: Source apportionment of fine organic carbon (OC) using receptor modelling at a rural site of Beijing: Insight into seasonal and diurnal variation of source contributions, Environ. Pollut., 266, 115078, https://doi.org/10.1016/j.envpol.2020.115078, 2020.
Xu, B., Tang, J., Tang, T., Zhao, S., Zhong, G., Zhu, S., Li, J., and Zhang, G.: Fates of secondary organic aerosols in the atmosphere identified from compound-specific dual-carbon isotope analysis of oxalic acid, Atmos. Chem. Phys., 23, 1565–1578, https://doi.org/10.5194/acp-23-1565-2023, 2023.
Xu, B. Q., Zhang, G., Gustafsson, Ö., Kawamura, K., Li, J., Andersson, A., Bikkina, S., Kunwar, B., Pokhrel, A., Zhong, G. C., Zhao, S. Z., Li, J., Huang, C., Cheng, Z. N., Zhu, S. Y., Peng, P. A., and Sheng, G. Y.: Large contribution of fossil-derived components to aqueous secondary organic aerosols in China, Nat. Commun., 13, 5115, https://doi.org/10.1038/s41467-022-32863-3, 2022.
Xu, J., Liu, D., Wu, X., Vu, T. V., Zhang, Y., Fu, P., Sun, Y., Xu, W., Zheng, B., Harrison, R. M., and Shi, Z.: Source apportionment of fine organic carbon at an urban site of Beijing using a chemical mass balance model, Atmos. Chem. Phys., 21, 7321–7341, https://doi.org/10.5194/acp-21-7321-2021, 2021.
Xu, S., Ren, L., Lang, Y., Hou, S., Ren, H., Wei, L., Wu, L., Deng, J., Hu, W., Pan, X., Sun, Y., Wang, Z., Su, H., Cheng, Y., and Fu, P.: Molecular markers of biomass burning and primary biological aerosols in urban Beijing: size distribution and seasonal variation, Atmos. Chem. Phys., 20, 3623–3644, https://doi.org/10.5194/acp-20-3623-2020, 2020.
Yan, C. C., Sullivan, A. P., Cheng, Y., Zheng, M., Zhang, Y. H., Zhu, T., and Collett, J. L.: Characterization of saccharides and associated usage in determining biogenic and biomass burning aerosols in atmospheric fine particulate matter in the North China Plain, Sci. Total Environ., 650, 2939–2950, https://doi.org/10.1016/j.scitotenv.2018.09.325, 2019.
Yang, C., Hong, Z. Y., Chen, J. S., Xu, L. L., Zhuang, M. Z., and Huang, Z.: Characteristics of secondary organic aerosols tracers in PM2.5 in three central cities of the Yangtze river delta, China, Chemosphere, 293, 133637, https://doi.org/10.1016/j.chemosphere.2022.133637, 2022.
Yazdani, A., Dudani, N., Takahama, S., Bertrand, A., Prévôt, A. S. H., El Haddad, I., and Dillner, A. M.: Characterization of primary and aged wood burning and coal combustion organic aerosols in an environmental chamber and its implications for atmospheric aerosols, Atmos. Chem. Phys., 21, 10273–10293, https://doi.org/10.5194/acp-21-10273-2021, 2021.
Yee, L. D., Isaacman-VanWertz, G., Wernis, R. A., Kreisberg, N. M., Glasius, M., Riva, M., Surratt, J. D., de Sá, S. S., Martin, S. T., Alexander, M. L., Palm, B. B., Hu, W., Campuzano-Jost, P., Day, D. A., Jimenez, J. L., Liu, Y., Misztal, P. K., Artaxo, P., Viegas, J., Manzi, A., de Souza, R. A. F., Edgerton, E. S., Baumann, K., and Goldstein, A. H.: Natural and Anthropogenically Influenced Isoprene Oxidation in Southeastern United States and Central Amazon, Environ. Sci. Technol., 54, 5980–5991, https://doi.org/10.1021/acs.est.0c00805, 2020.
Yttri, K. E., Dye, C., and Kiss, G.: Ambient aerosol concentrations of sugars and sugar-alcohols at four different sites in Norway, Atmos. Chem. Phys., 7, 4267–4279, https://doi.org/10.5194/acp-7-4267-2007, 2007.
Yuan, Q., Lai, S. C., Song, J. W., Ding, X., Zheng, L. S., Wang, X. M., Zhao, Y., Zheng, J. Y., Yue, D. L., Zhong, L. J., Niu, X. J., and Zhang, Y. Y.: Seasonal cycles of secondary organic aerosol tracers in rural Guangzhou, Southern China: The importance of atmospheric oxidants, Environ. Pollut., 240, 884–893, https://doi.org/10.1016/j.envpol.2018.05.009, 2018.
Zhang, Q., He, K. B., and Huo, H.: Cleaning China's air, Nature, 484, 161–162, https://doi.org/10.1038/484161a, 2012.
Zhang, Q., Hu, W., Ren, H., Yang, J. B., Deng, J. J., Wang, D. W., Sun, Y. L., Wang, Z. F., Kawamura, K., and Fu, P. Q.: Diurnal variations in primary and secondary organic aerosols in an eastern China coastal city: The impact of land-sea breezes, Environ. Pollut., 319, 121016, https://doi.org/10.1016/j.envpol.2023.121016, 2023.
Zhang, S., Gong, D., Wu, G., Li, Y., Ding, Y., Wang, B., and Wang, H.: Molecular characteristics and formation mechanisms of biogenic secondary organic aerosols in the mountainous background atmosphere of southern China, Atmos. Environ., 329, 120540, https://doi.org/10.1016/j.atmosenv.2024.120540, 2024a.
Zhang, X., McVay, R. C., Huang, D. D., Dalleska, N. F., Aumont, B., Flagan, R. C., and Seinfeld, J. H.: Formation and evolution of molecular products in α-pinene secondary organic aerosol, Proc. Natl. Acad. Sci. U. S. A., 112, 14168–14173, https://doi.org/10.1073/pnas.1517742112, 2015.
Zhang, Y. X., Cao, F., Song, W. H., Jia, X. F., Xie, T., Wu, C.L., Yan, P., Yu, M. Y., Rauber, M., Salazar, G., Szidat, S., and Zhang, Y. L.: Fossil and Nonfossil Sources of Winter Organic Aerosols in the Regional Background Atmosphere of China, Environ. Sci. Technol., 58, 1244–1254, https://doi.org/10.1021/acs.est.3c08491, 2024b.
Zhang, Y. X., Schauer, J. J., Zhang, Y. H., Zeng, L. M., Wei, Y. J., Liu, Y., and Shao, M.: Characteristics of Particulate Carbon Emissions from Real-World Chinese Coal Combustion, Environ. Sci. Technol., 42, 5068–5073, https://doi.org/10.1021/es7022576, 2008.
Zhang, Y. L., Kawamura, K., Agrios, K., Lee, M., Salazar, G., and Szidat, S.: Fossil and Nonfossil Sources of Organic and Elemental Carbon Aerosols in the Outflow from Northeast China, Environ. Sci. Technol., 50, 6284–6292, https://doi.org/10.1021/acs.est.6b00351, 2016.
Zhang, Y. X., Shao, M., Zhang, Y. H., Zeng, L. M., He, L.Y., Zhu, B., Wei, Y. J., and Zhu, X. L.: Source profiles of particulate organic matters emitted from cereal straw burnings, J. Environ. Sci., 19, 167–175, https://doi.org/10.1016/S1001-0742(07)60027-8, 2007.
Zhao, X., Hu, Q., Wang, X., Ding, X., He, Q., Zhang, Z., Shen, R., Lü, S., Liu, T., Fu, X., and Chen, L.: Composition profiles of organic aerosols from Chinese residential cooking: case study in urban Guangzhou, south China, J. Atmos. Chem., 72, 1–18, https://doi.org/10.1007/s10874-015-9298-0, 2015.
Zhao, Y. L., Hu, M., Slanina, S., and Zhang, Y. H.: Chemical Compositions of Fine Particulate Organic Matter Emitted from Chinese Cooking, Environ. Sci. Technol., 41, 99–105, https://doi.org/10.1021/es0614518, 2007.
Zheng, M., Cass, G. R., Schauer, J. J., and Edgerton, E. S.: Source apportionment of PM2.5 in the Southeastern United States using solvent-extractable organic compounds as tracers, Environ. Sci. Technol., 36, 2361–2371, https://doi.org/10.1021/es011275x, 2002.
Zhu, R.-G., Xiao, H.-Y., Cheng, L., Zhu, H., Xiao, H., and Gong, Y.: Measurement report: Characterization of sugars and amino acids in atmospheric fine particulates and their relationship to local primary sources, Atmos. Chem. Phys., 22, 14019–14036, https://doi.org/10.5194/acp-22-14019-2022, 2022.