the Creative Commons Attribution 4.0 License.
the Creative Commons Attribution 4.0 License.
 | 21 Oct 2025
Interhemispheric Anti-Phase Variability in Mesospheric Climate Driven by Summer Polar Upwelling During Solstice Months
Liang Zhang
Zhongfang Liu
Brian Tinsley
The upper mesosphere, a transition region between Earth's atmosphere and space, is characterized by complex interactions among water vapor (H2O), atomic hydrogen (H), ozone (O3), atomic oxygen (O), and temperatures. Using MLS, SABER, and SOFIE satellite data, we explore the upwelling-driven interannual variability of temperatures near 90 km (T90) and atmospheric constituents during solstice months, revealing a bottom-up control mechanism of “upwelling–H2O(H)–O3(O)–T90” in the two hemispheres. First, summer polar upwelling transports H2O upward, which is then transported toward the winter hemisphere by meridional winds. Subsequently, the hydration increases H via photolysis and depletes O3 in the winter hemisphere through H-driven catalytic loss. The O varies in pace with O3 due to chemical equilibrium, and the radiative and chemical heating by O/O3 reactions reduces the T90 in the winter hemisphere (T90W). Second, upwelling-induced cooling promotes polar mesospheric cloud (PMC) formation, with ice particle growth blocking H2O transport and dehydrating heights above PMCs. This dehydration reduces H abundance, thereby decreasing H-driven O3 loss. Meanwhile, the colder temperatures directly increase O3 through ozone kinetics. The enhanced O3, together with the coupled O, collectively increase the summer polar temperatures above 90 km (T90S). This anti-phase interannual variability between hemispheres, mediated by PMC microphysics and H2O-O3 chemistry, establishes summer polar upwelling as a fundamental driver of mesospheric climate and highlights the importance of dynamical-chemical coupling in the upper mesosphere.
- Article
(20712 KB) - Full-text XML
- BibTeX
- EndNote


The summer upper mesosphere is the coldest region on Earth's atmosphere, with temperatures as low as 130 K due to the adiabatic cooling of gravity wave-driven upwelling (Plane et al., 2023). During solstice months, zonal winds are westward below ∼ 90 km and eastward above, and meridional winds flow from summer to winter hemispheres (Ramesh et al., 2024). Despite recent advances in mesospheric wind observations, direct measurements of vertical winds remain challenging (Lee et al., 2024; Vincent et al., 2019; Zhang et al., 2020). The upper mesosphere exhibits complex couplings between dynamics and chemistry, particularly through H2O and O3 interactions that remain incompletely understood.
1.1 Water vapor and PMC dynamics
Upwelling and methane oxidation are primary H2O sources in the upper mesosphere (Lübken et al., 2018; Shi et al., 2023). The rapid decrease of H2O with altitude in the upper mesosphere (Fig. 1a) is mainly caused by the photolysis of solar ultraviolet (UV) radiation, particularly in the summer polar region under continuous illumination. Figure 1 demonstrates how summer polar upwelling creates concurrently temperature minima and H2O maxima in the summer hemisphere. These conditions promote PMC formation between 80 and 90 km (Rapp and Thomas, 2006), which subsequently redistributes H2O through the well-established freeze-drying effect (Hervig et al., 2015; von Zahn and Berger, 2003). This top-down process, involving ice particle nucleation, growth, sedimentation, and sublimation, produces dehydration above PMCs and subsequently hydration below (Hultgren and Gumbel, 2014), with clear H2O depletion visible above 60–80° S PMCs in Fig. 1a. Siskind et al. (2018) successfully simulated the dehydration and hydration above and below PMCs, which extend to midlatitudes due to meridional circulations (Fig. 1 therein). Current PMC models systematically overestimate the dehydration/hydration magnitudes (Bardeen et al., 2010; Lübken et al., 2009), suggesting an incomplete understanding of PMC formation. PMC variability is modulated by various dynamical processes, including gravity waves (Gao et al., 2018), planetary waves (Liu et al., 2015), tides (Fiedler and Baumgarten, 2018), and inter-hemispheric coupling (Gumbel and Karlsson, 2011). While solar UV theoretically influences H2O and thus PMCs (Remsberg et al., 2018), the 11-year solar signal is insignificant over the past two decades (Hervig et al., 2019; Vellalassery et al., 2023), highlighting the need to identify alternative drivers.
1.2 Ozone chemistry and variability
In the upper mesosphere, the O concentrations increase sharply with altitude due to solar photolysis of O2 (Mlynczak et al., 2013), and the three-body recombination reaction of O produces a secondary ozone layer near 90 km (O+O2+M→O3+M) (Smith et al., 2013). The O exhibits a long photochemical lifetime near the mesopause (days to months), consequently, its daily and seasonal variability is governed by vertical transport processes, including tides and downwelling of the mean circulation (Smith et al., 2010b). O3 is primarily destroyed by photolysis (O3+hν→O(1D,3P)+O2) during daylight with ∼ 2 min lifetime, and by reaction with hydrogen (H+O3→OH+O2) and oxygen (O+O3→2O2) at night (Huang et al., 2008; Smith and Marsh, 2005). The ozone photochemical equilibrium assumption, i.e., ozone loss is balanced by ozone production, is crucial for retrieving O and H concentrations (Kulikov et al., 2018; Mlynczak et al., 2007). The secondary ozone layer exhibits strong seasonal dependence, with peak O3 mixing ratios occurring in winter (Fig. 1b) when reduced sunlight minimizes photolysis and lower H2O limits H availability. Temperature further modulates ozone kinetics, with colder conditions enhancing O3 by accelerating production rate and inhibiting loss rates (Smith et al., 2018).
Despite these advances in understanding ozone chemistry, key questions remain regarding ozone variability drivers. Solar activity appears to suppress ozone via production of odd hydrogen and odd nitrogen species (Jia et al., 2024), with solar cycle signals and long-term trends occasionally documented (Huang et al., 2014; Lee and Wu, 2020). PMCs may enhance ozone through dehydration, which is expected to reduce the H above PMCs (Siskind et al., 2008, 2018; Siskind and Stevens, 2006). The secondary ozone layer impacts mesospheric energy budgets through competing processes, including solar radiative heating, chemical heating, and infrared cooling (Ramesh et al., 2015), and the total (radiative and chemical) heating of O and O3 is of great importance for the energy budget of upper mesosphere (Mlynczak et al., 2018; Mlynczak and Solomon, 1993).
1.3 Temperature trends and variability
Mesospheric temperatures display complex variability patterns across multiple timescales. Interannual variations (4–5 K), outweigh the 11-year solar signal (1–3 K/100 solar flux unit) and the long-term cooling trend (−1 to −2 K/decade) (French et al., 2020a; French et al., 2020b). In the summer polar mesopause, solar signals are unexpectedly absent in temperature, presumably due to a compensating dynamical cooling effect (Karlsson and Kuilman, 2018; Qian et al., 2019). A well-established CO2-induced cooling trend prevails throughout most of the middle atmosphere, with a rate exceeding tropospheric warming magnitudes (Feofilov and Kutepov, 2012; Laštovička, 2017; Roble and Dickinson, 1989). This strong cooling is regarded as a potential indicator of climate change (Liu et al., 2024; Solomon et al., 2018). However, the summer polar mesopause presents a notable exception, exhibiting an unexpected warming trend that contradicts the dominant CO2 cooling. Proposed explanations include shrinking effect (Bailey et al., 2021; Dawkins et al., 2023; Lübken et al., 2013) and long-period vertical oscillations of temperature profile (Kalicinsky et al., 2018; Offermann et al., 2021), though the primary mechanism remains elusive. Stratospheric ozone recovery further complicates this picture by modulating gravity wave propagation, which subsequently affects mesospheric winds and temperatures (Smith et al., 2010a; Venkateswara Rao et al., 2015).
These interconnected physical and chemical processes create substantial challenges for a comprehensive understanding of the climate in upper mesosphere. This paper elucidates a systematic bottom-up mechanism, linking summer polar upwelling to interannual variability in H2O, H, O3, O, and temperatures. Section 2 details the satellite datasets (MLS, SABER, SOFIE) and theoretical framework, Sect. 3 quantifies the hemispheric climate patterns during solstice months (December/June), Sect. 4 discusses variability mechanism, and Sect. 5 summarizes key conclusions.
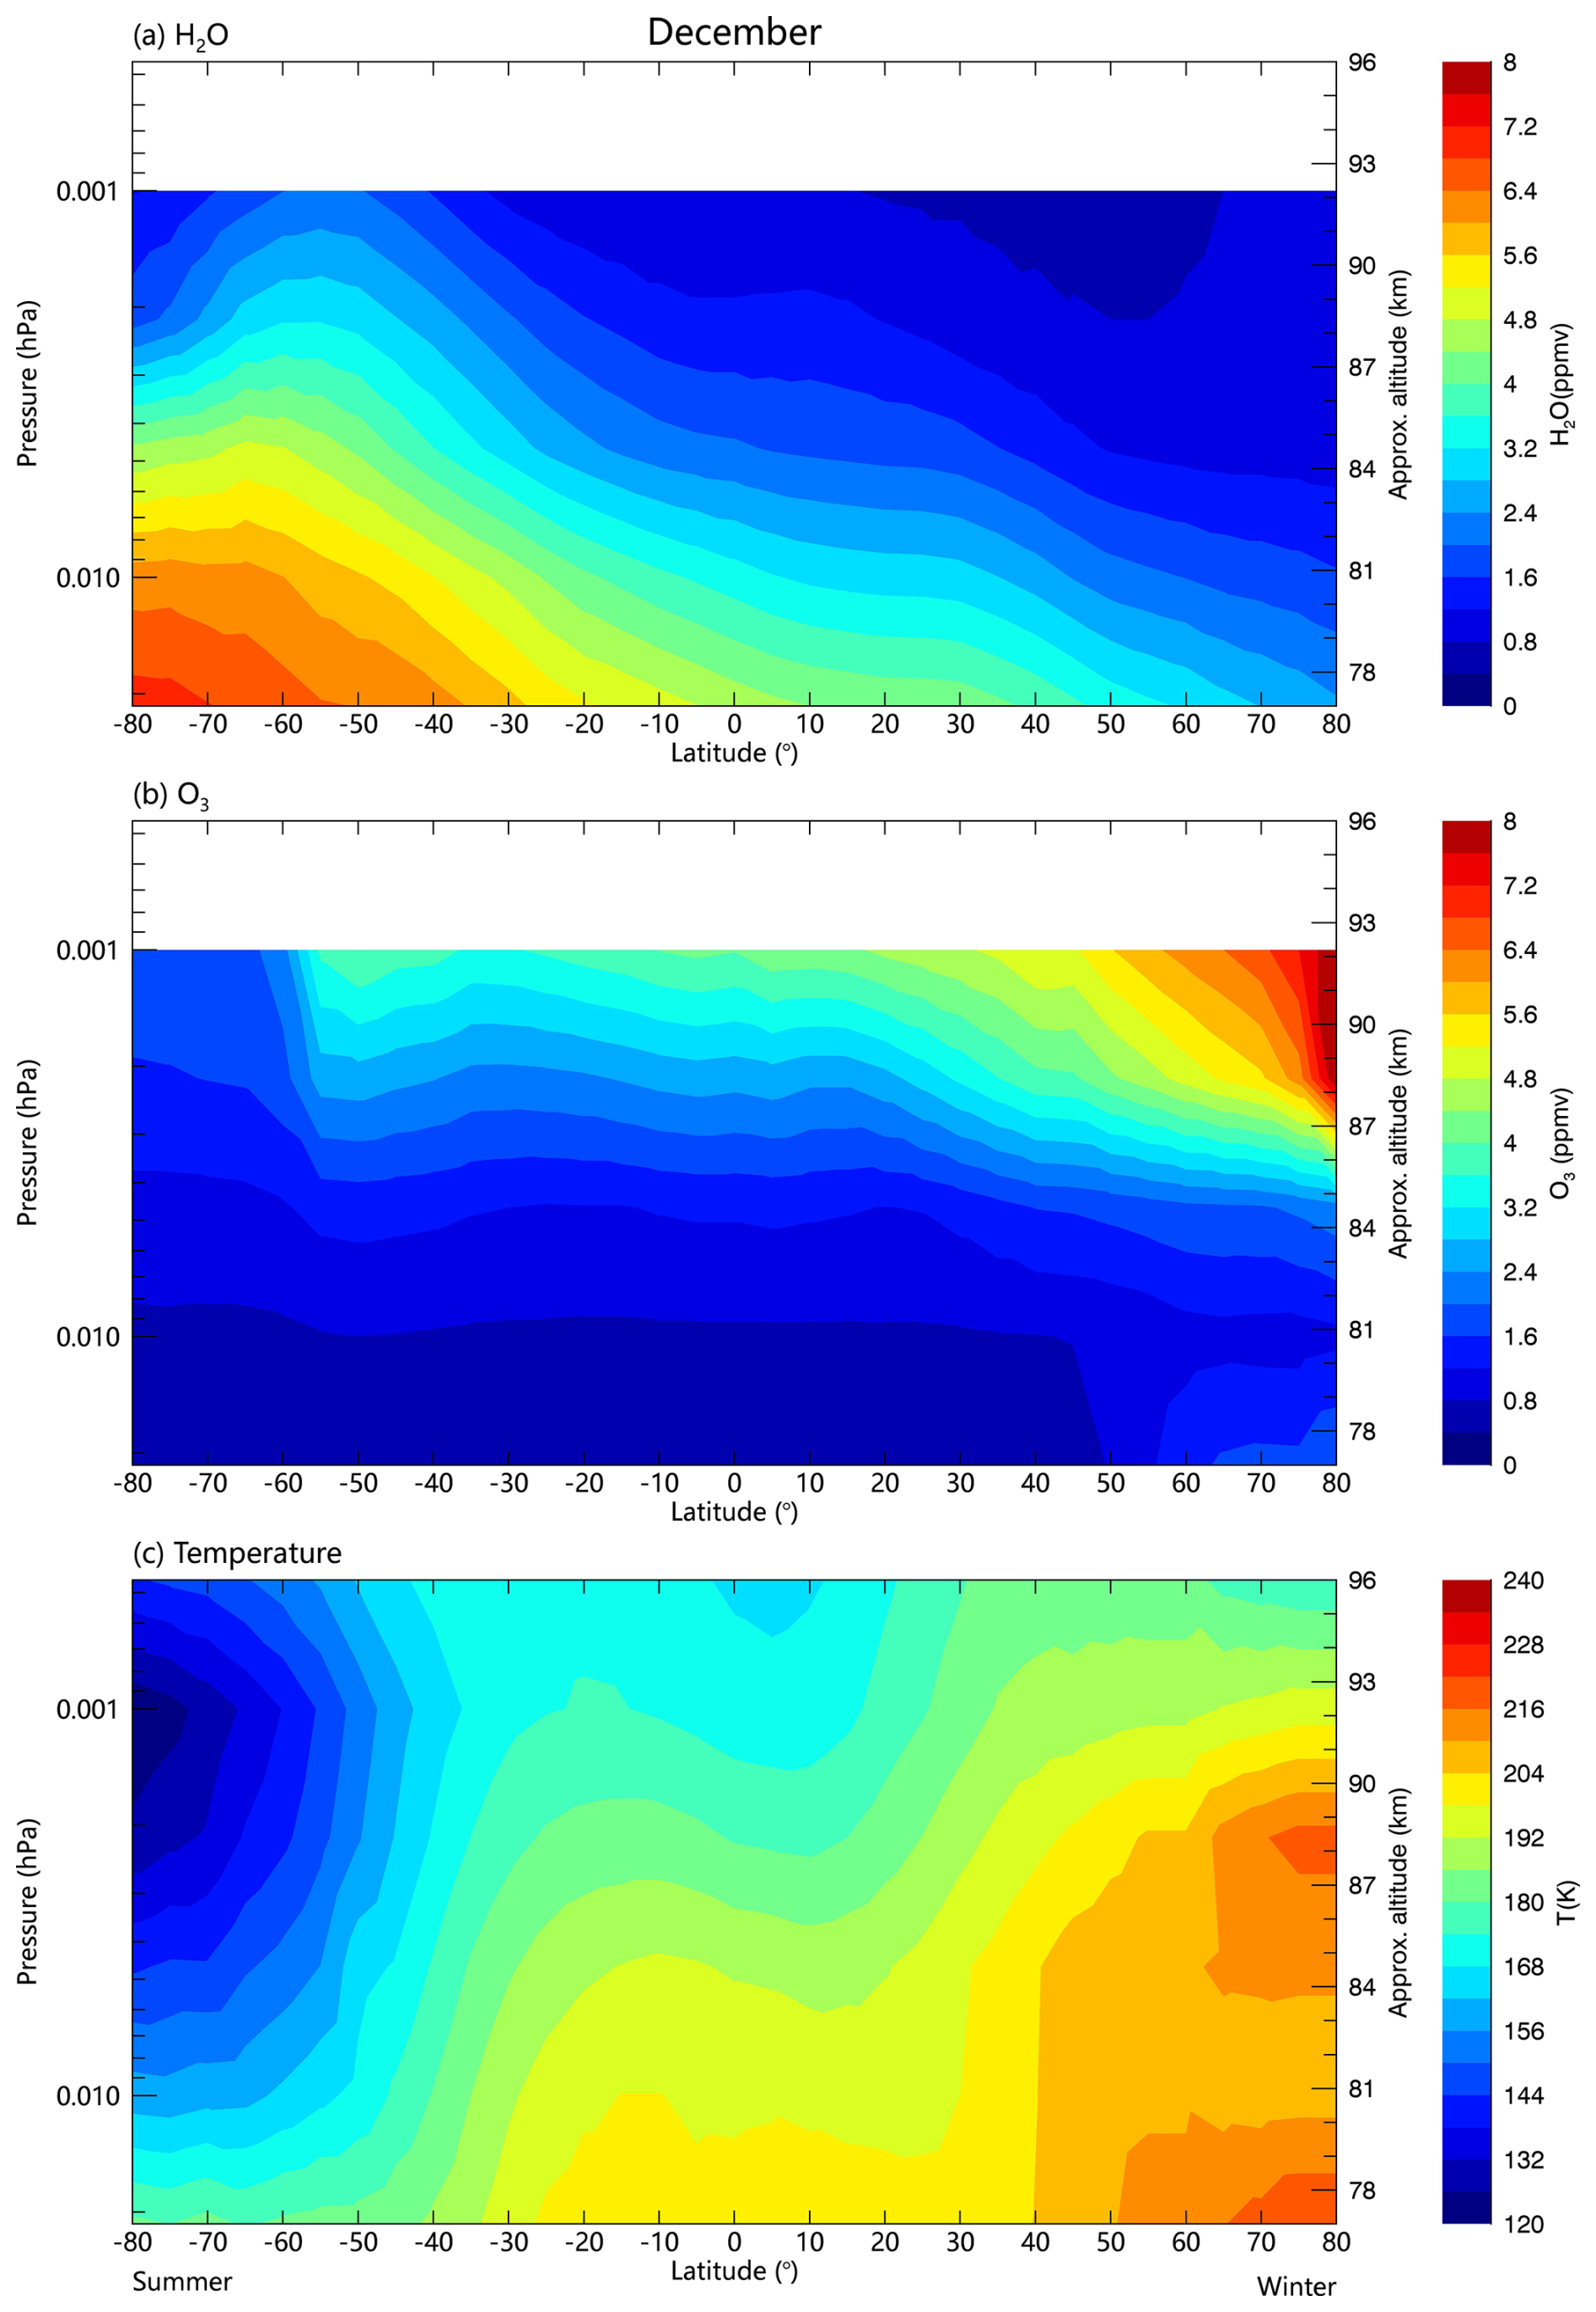
Figure 1December climatology of (a) water vapor mixing ratio, (b) ozone mixing ration, and (c) temperature in the upper mesosphere. Data represent monthly means from MLS/Aura observations during 2004–2022.
2.1 Multi-satellite Data
This study utilizes measurements from three satellite instruments to investigate upper mesospheric climate variability. The Microwave Limb Sounder (MLS) aboard NASA's Aura satellite, launched in July 2004, provides global atmospheric measurements between 82° N and 82° S (Jiang et al., 2007). Operating in a sun-synchronous orbit with equatorial crossings at 01:30 (ascending) and 13:30 (descending) local time, MLS delivers vertical profiles of H2O (0.001 hPa top level recommended, 7–9 km vertical resolution, 30 % precision), O3 (0.001 hPa, 5–7 km, 35 %), and temperature (0.00046 hPa, 6–12 km, 3 K). Daily mean values were generated by averaging ascending and descending orbits, focusing on zonal (5° gridded) and monthly means for interannual variability studies. Figure 1 shows the December climatology of H2O, O3, and temperature observed by MLS.
The Sounding of the Atmosphere using Broadband Emission Radiometry (SABER) instrument aboard the Thermosphere, Ionosphere, Mesosphere Energetics, and Dynamics (TIMED) satellite was launched in December 2001. With an orbital inclination of 74.1°, SABER's limb scan provides latitude coverage alternating between 83° N to 52° S (during June) and 52 to 83° S (during December) due to its 60 d yaw cycle (Russell et al., 1999). This 60 d yaw cycle allows interannual comparison by maintaining stable latitude and local time coverage for a given month across different years. We used TIMED/SABER version 2.07 data between 0.01 and 0.003 hPa from 2002 to 2019, including temperature (Remsberg et al., 2008), ozone (Rong et al., 2009; Smith et al., 2013), atomic oxygen (Mlynczak et al., 2013, 2018), and atomic hydrogen (Mlynczak et al., 2014).
The Solar Occultation for Ice Experiment (SOFIE) instrument onboard the Aeronomy of Ice in the Mesosphere (AIM) satellite was launched on 25 April 2007 into a sun-synchronous polar orbit (Russell III et al., 2009). SOFIE covers latitudes between 65 and 82°, with particular focus on ∼ 70° latitude during PMC seasons. Using solar occultation measurements, SOFIE obtains vertical profiles of PMC properties, temperature, water vapor, and ozone (Gordley et al., 2009; Hervig et al., 2009). SOFIE provides datasets for 8 PMC seasons (from 2007 to 2014) in the northern hemisphere (NH) and 7 PMC seasons (from 2007/2008 to 2013/2014) in the southern hemisphere (SH), after which SOFIE measurements shifted to lower latitudes where PMCs typically do not form.
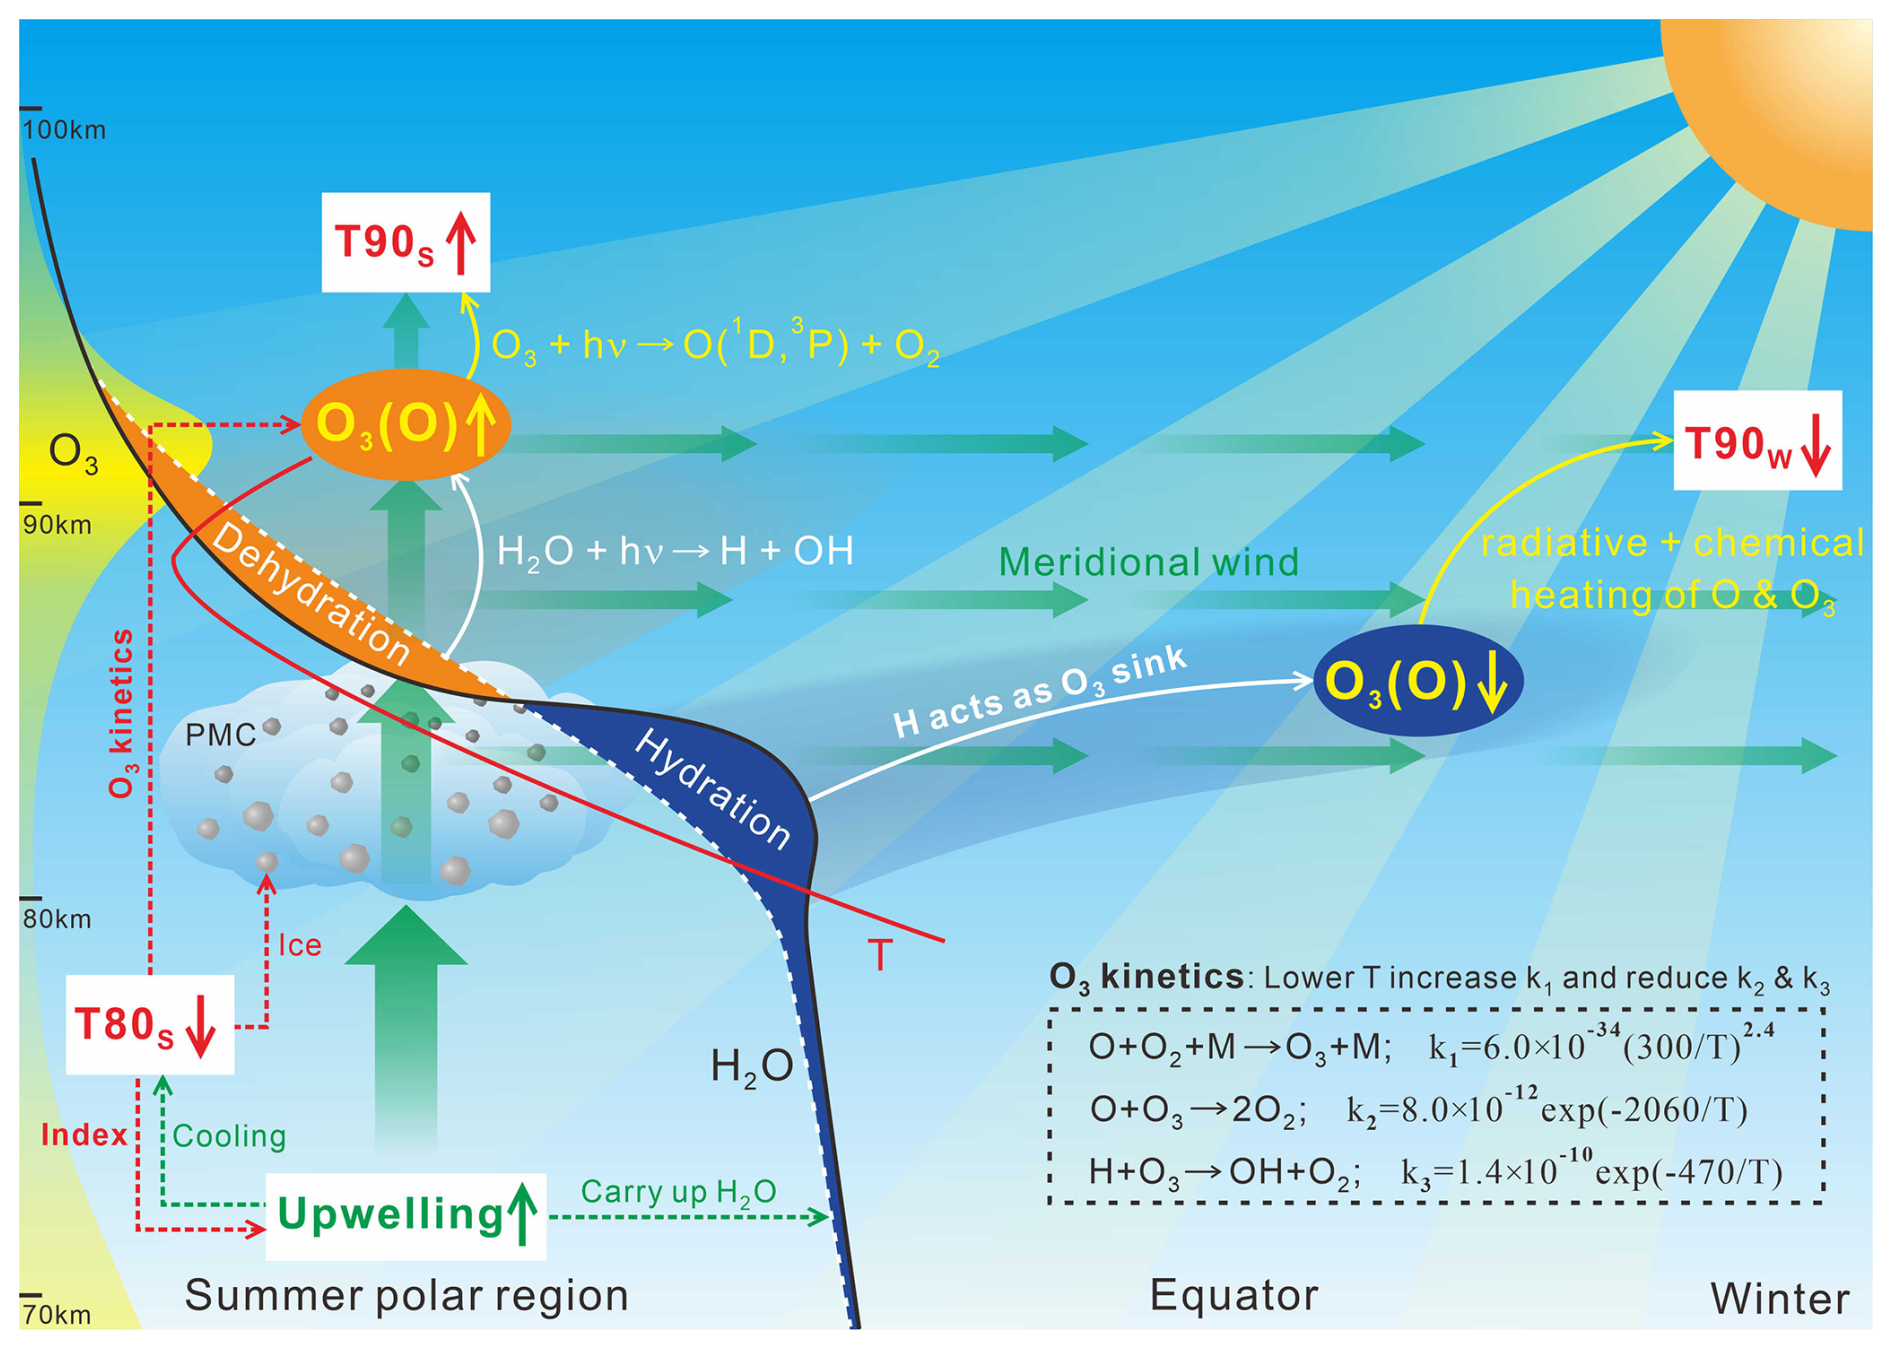
Figure 2Schematic diagram of the bottom-up control mechanism in solstice months, showing how summer polar upwelling controls interhemispheric climate variability through coupled dynamical and chemical processes. Key pathways include: (1) winter-hemisphere hydration is induced by summer polar upwelling in combination with meridional transport, and summer-hemisphere dehydration is governed by the cold-trap effect; (2) subsequent modulation of O3 through H-driven ozone loss and temperature-dependent ozone kinetics, with O varying in pace with O3 due to the ozone photochemical equilibrium assumption; and (3) resulting temperature (T90) variations via radiative and chemical heating of O3/O.
2.2 Bottom-up control mechanism framework
Our methodology examines the responses of mesospheric variables (H2O, H, O3, O, T90) to upwelling on interannual timescales. Since direct observations of summer polar upwelling are unavailable, we use temperature at ∼ 80 km (T80S) as a proxy, based on its relationship with adiabatic cooling. Figure 2 illustrates the conceptual framework for how summer polar upwelling drives interannual climate variability during solstice months through the interconnected pathways in the “upwelling–H2O(H)–O3(O)–T90” chain:
-
H2O/H variability. Upwelling produces both hydration that occurs below PMCs through direct transport of H2O by upwelling, and dehydration above PMCs through a “cold-trap effect”. Explicitly, adiabatic cooling from upwelling lowers T80S promotes water vapor condensation into ice particles, thereby reduces upward H2O transport and causes dehydration above PMCs (Zhang et al., 2025a). While similar to the conventional freeze-drying effect, the cold-trap effect shows distinct characteristics that we discuss later in Sect. 4.1. Meridional winds then transport both the hydration and dehydration toward the winter hemisphere. Atomic hydrogen H, produced through H2O photolysis, consequently varies in synchrony with H2O in both hemispheres.
-
O3/O responses. O3 abundance is negatively influenced by H2O through H acting as a primary O3 sink (Zhang et al., 2025b). Upwelling therefore enhances summer-hemisphere O3 through dehydration while it inhibits winter-hemisphere O3 through hydration. Additionally, the adiabatic cooling of upwelling directly enhances summer-hemisphere O3 through temperature-dependent ozone kinetics. Following the ozone photochemical equilibrium assumption, the O varies in phase with O3 and is similarly controlled by summer polar upwelling.
-
Temperature modulation. In the upper mesosphere, the total (radiative and chemical) heating of O and O3 significantly influences the energy budget, creating a positive correlation between O/O3 and T90. Since upwelling oppositely controls O3/O in the two hemispheres, it produces an anti-phase temperature response: T90S in the summer polar region shows a negative correlation with T80S, while T90W in winter hemisphere exhibits a positive correlation with T80S.
This theoretical framework enables a quantitative evaluation of variable sensitivities to T80S through inter-satellite comparisons, to establish robust causal relationships in the observed climate variability.
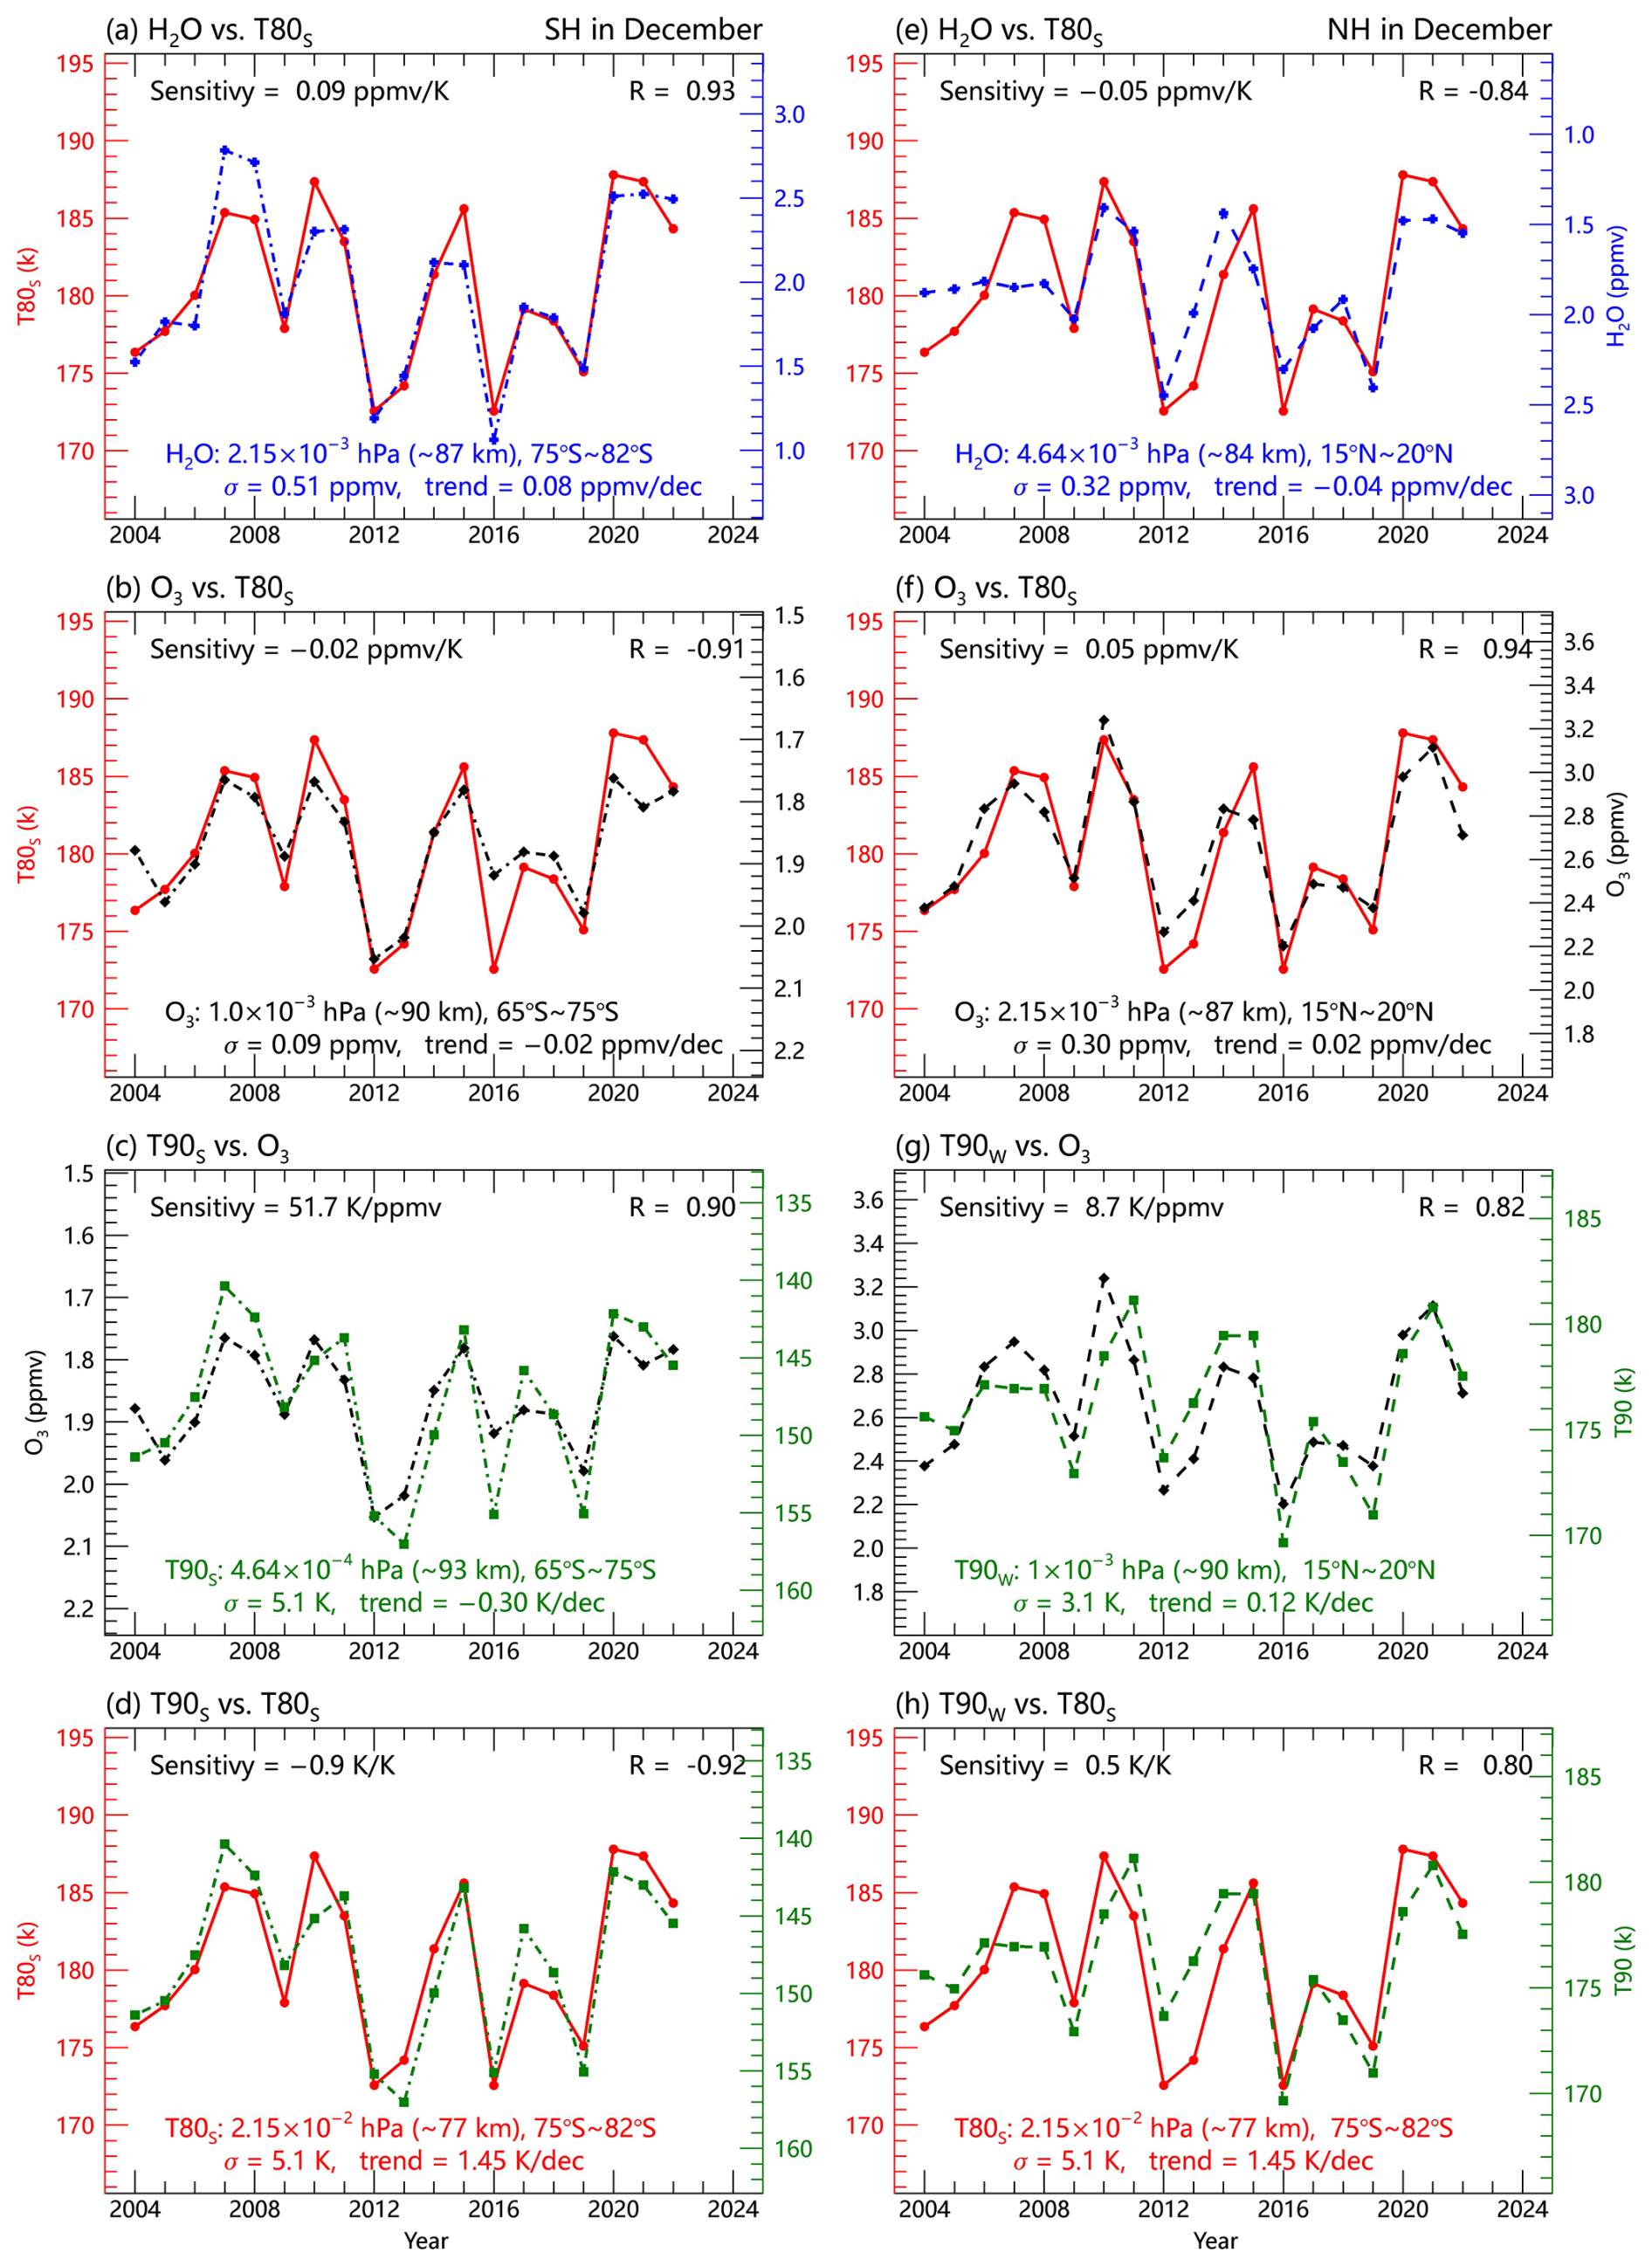
Figure 3Hemispheric responses of mesospheric (a, e) H2O, (b, f) O3, and (d, h) T90 to upwelling variability (indicated by T80S) during December, showing anti-phase behavior between (left) summer and (right) winter hemispheres. Panels (c), (g) show O3-T90 correlations. All plots display monthly and zonal means from MLS/Aura observations during 2004–2022, with correlation coefficients (R), sensitivities, standard deviations (σ), and trends derived from linear regression analysis. The opposing H2O responses reflect hydration (winter hemisphere, negative correlation) and dehydration (summer hemisphere, positive corelation), while O3 and T90 variations demonstrate the consequent chemical and thermal feedbacks.
3.1 Climate patterns in December
Our analysis of MLS/Aura data reveals distinct interannual variability patterns during December (Fig. 3). Using T80S as an upwelling proxy, we observe opposing H2O responses between hemispheres: dehydration in the summer polar mesopause (75–82° S) indicated by positive correlations with T80S (R=0.93, Fig. 3a), and hydration at low latitudes (15–20° N) in the NH indicated by negative correlations (, Fig. 3e). The H2O patterns drive corresponding O3 variations through chemical interaction, with T80S showing negative correlations () with O3 at 0.001 hPa (65–75° S, Fig. 3b) but positive correlations (R=0.94) at 0.002 hPa (15–20° N, Fig. 3f). Temperature responses exhibit clear hemispheric anti-symmetry, with T90S at 0.0046 hPa (65–75° S) negatively correlated (, Fig. 3d) and T90W at 0.001 hPa (15–20° N) positive correlated (R=0.80, Fig. 3h) with T80S. In addition, the standard deviations of these variables significantly exceed their linear trends, potentially masking long-term signals.
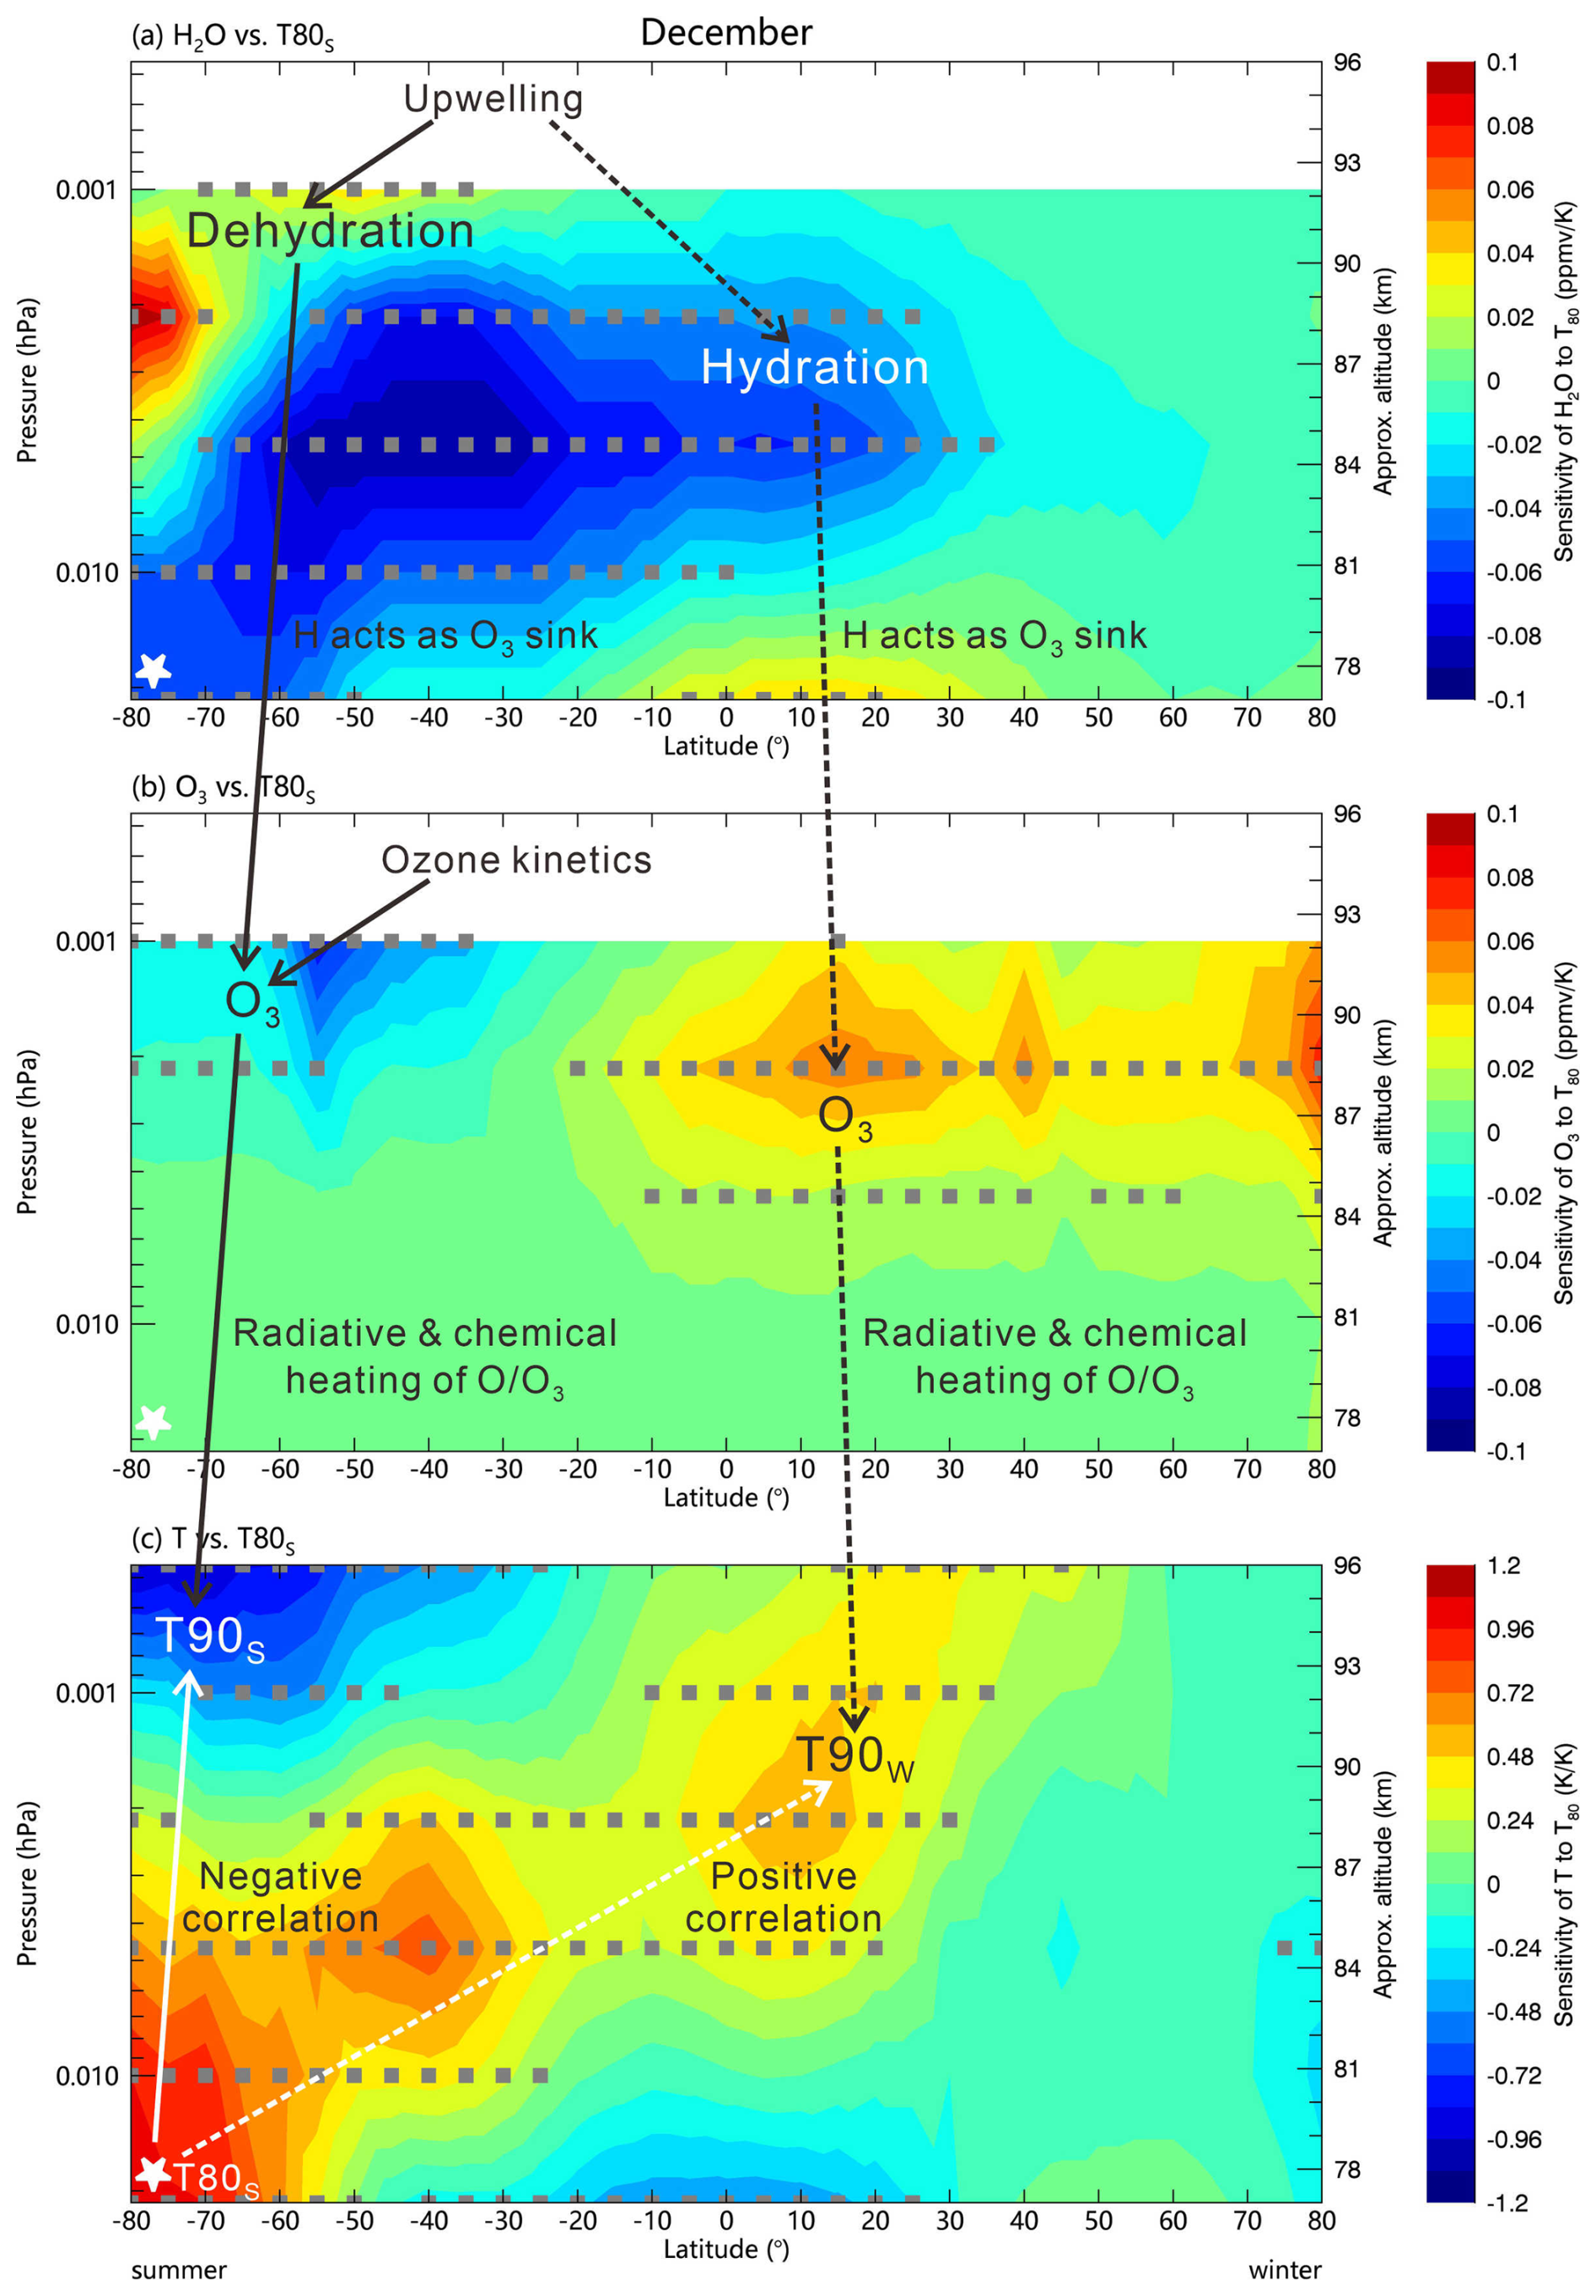
Figure 4Spatial patterns of bottom-up control processes during December showing (a) H2O hydration (blue) and dehydration (red) response to upwelling (indicated by T80S, white stars), (b) corresponding O3 variations in both hemispheres, and (c) resultant temperature (T90) changes driven by radiative and chemical heating. Sensitivities of variables to T80S derived from linear regression of MLS/Aura data during 2004–2022 show significant anti-phase relationships between hemispheres. Gray points make the 0.95 significance level.
Figure 4 shows the latitudinal extent of these relationships, with sensitivities derived from linear regression. Meridional transport extends dehydration signature to 35° S (beyond the PMC coverage) and hydration to 35° N (Fig. 4a), while O3 responses show comparable latitudinal ranges (Fig. 4b). SABER observations corroborate these findings (Fig. 5), though atomic hydrogen data gaps at summer high latitudes (Fig. 5a) prevent complete verification of dehydration effects. The ozone photochemical equilibrium assumption holds well, with atomic oxygen O varying in pace with O3 (Fig. 5b, c). Mlynczak et al. (2018) showed that the total (radiative and chemical) heating rate of O and O3 is ∼ 10 K d−1 on global and annual scale (Fig. 3 therein). The relative variations of O and O3 to T80S in Fig. 5 are both ∼ 4 % K−1, therefore the sensitivity of O/O3 total heating rate to T80S is roughly estimated to be ∼ 0.4 K d−1 K−1, which partly explain the ∼ 1 K K−1 (Fig. 5d) response of T90 to T80S.
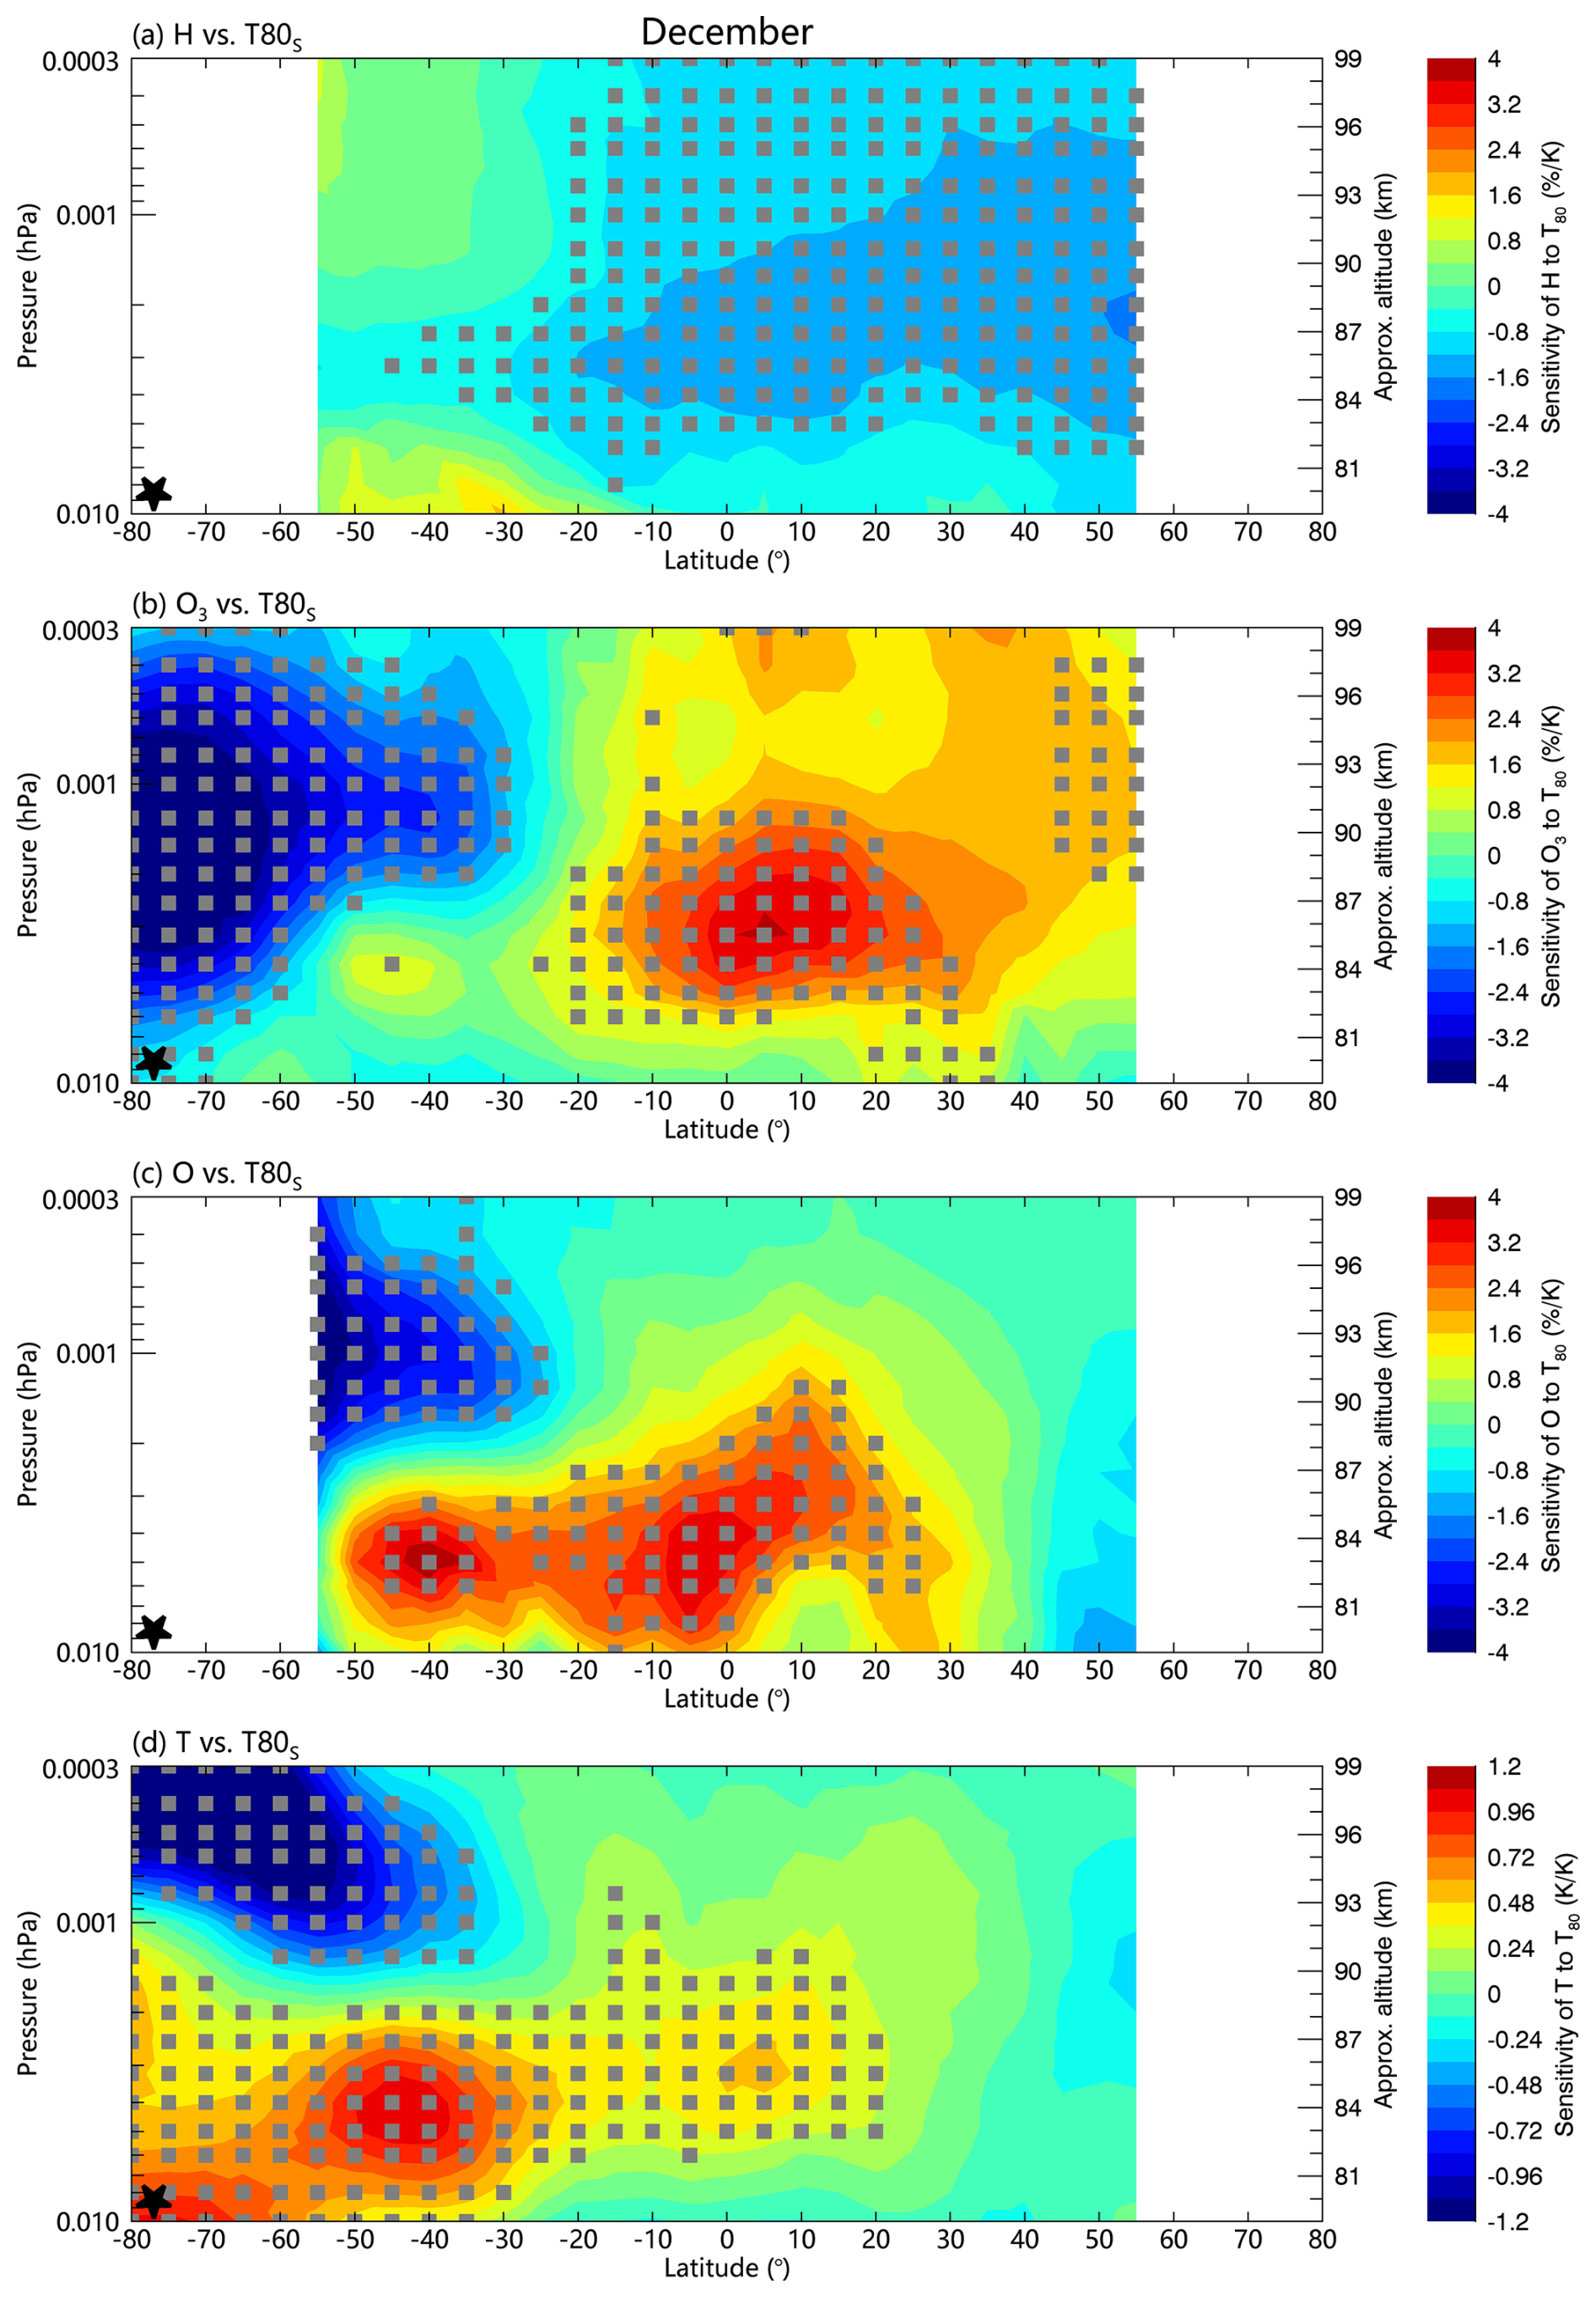
Figure 5Bottom-up control of atmospheric constituents in December from SABER observations during 2002–2019. (a) H response to upwelling (indicated by T80S, black stars at 75–83° S, 0.01 hPa level). (b) O3 and (c) O variations, both demonstrating hemispheric anti-symmetry in their sensitivity to T80S. (d) Resultant temperature responses showing a positive correlation between T90W and T80S and a negative correlation between T90S and T80S through the radiative and chemical heating of O and O3. All sensitivities (relative responses in unit of % K−1) have been derived from linear regression analysis of monthly data, with consistent upwelling-driven patterns across variables.
Daily-scale SOFIE observations provide further insights (Figs. 6–8). Figure 6 shows that O3 at 90 km is bottom-up controlled by the T80S at 79 km. It is noteworthy that in November, during which PMCs are weak and dehydration is absent, the negative correlation between O3 and T80S remains significant, possibly due to the temperature-dependent ozone kinetics. Summer polar O3 near 0.01 hPa (Fig. 5b) or 80 km (Fig. 7c) is negatively correlated to T80S, which should be attributed to ozone kinetics. As shown in Fig. 8b, O3 below 90 km lags T80S by zero days possibly through ozone kinetics, while O3 above 90 km lags T80S by ∼ 3 d, suggesting combined kinetic and dehydration influences. However, for upper-level O3, the relative contribution of ozone kinetics and dehydration (depletion of H) is unclear.
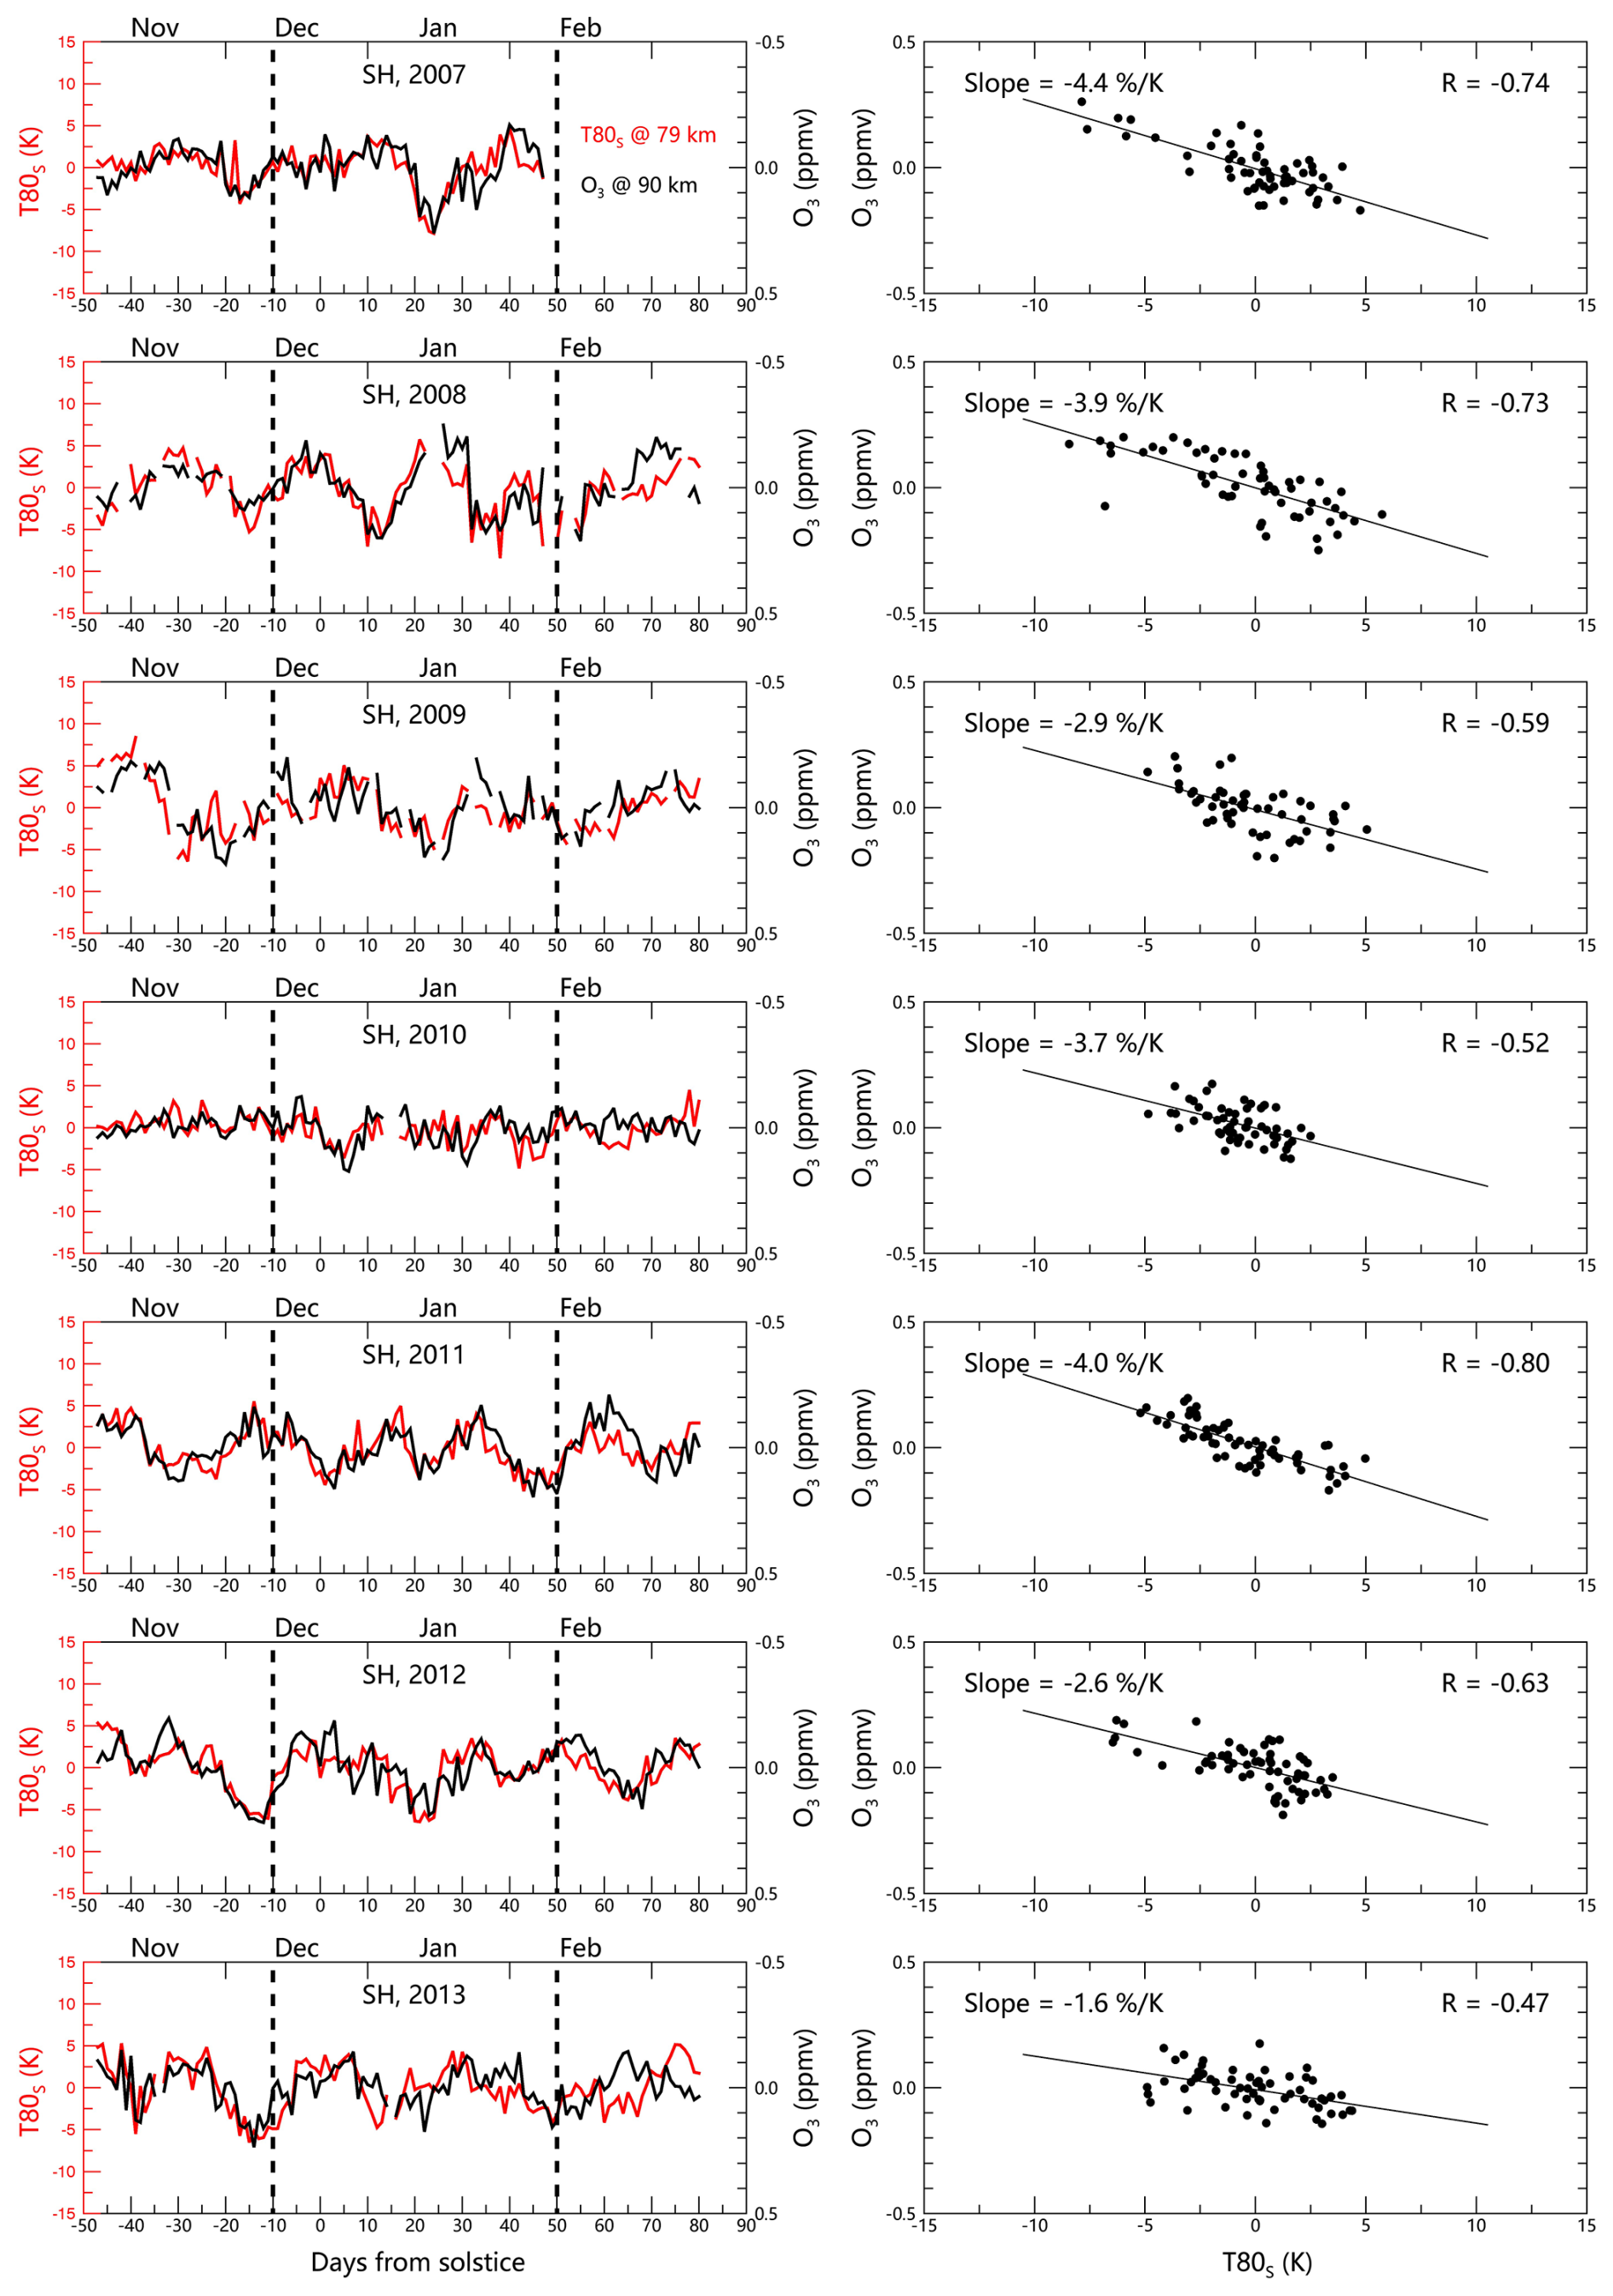
Figure 6Temporal relationship between T80S and O3 variations from SOFIE/AIM observations for the SH PMC seasons during 2007–2013. (Left) Daily time series of T80S at 79 km (red) and O3 at 90 km (black) at ∼ 70° S, with 35 d running mean removed. (Right) Correlation coefficients between T80S and O3 for each PMC season during −10 to 50 d relative to solstice, demonstrating consistent negative relationships (mean ) that highlight the bottom-up control of upwelling on ozone chemistry.
Figure 7Daily-scale bottom-up control processes observed by SOFIE at ∼ 70° S for the SH PMC seasons during 2007–2013. (a) H2O above and below 83 km are both subject to the control of T80S rather than local temperatures. (b) Combined H2O and ice content demonstrate similar T80S dependence. (c) Anti-correlation between O3 and T80S, accompanied by positive O3-T90 relationship. (d) Negative correlation between T90S and T80S. Correlation coefficients are calculated for −10 to 50 d relative to solstice (35 d running mean removed), with the 0.95 significance level marked by dots.
Figure 7a, b shows that the H2O above and below PMCs is both bottom-up controlled by T80S rather than the temperature above PMC, which supports the cold-trap effect. Figure 8a further shows that the hydration and dehydration both lag behind T80S by about zero days, consistent with the cold-trap effect. In contrast, according to the conventional freeze-drying effect, the dehydration tends to occur prior to the hydration, with the time interval roughly equal to the lifetime of ice particle which is up to two days in simulations (not consider transport and diffusion of ice particles). In addition, T90 is positively correlated to O3 (Fig. 7c) and negatively correlated to T80S (Fig. 7d), with lag time of about ∼ 3 d, matching the radiative and chemical heating of O3/O.
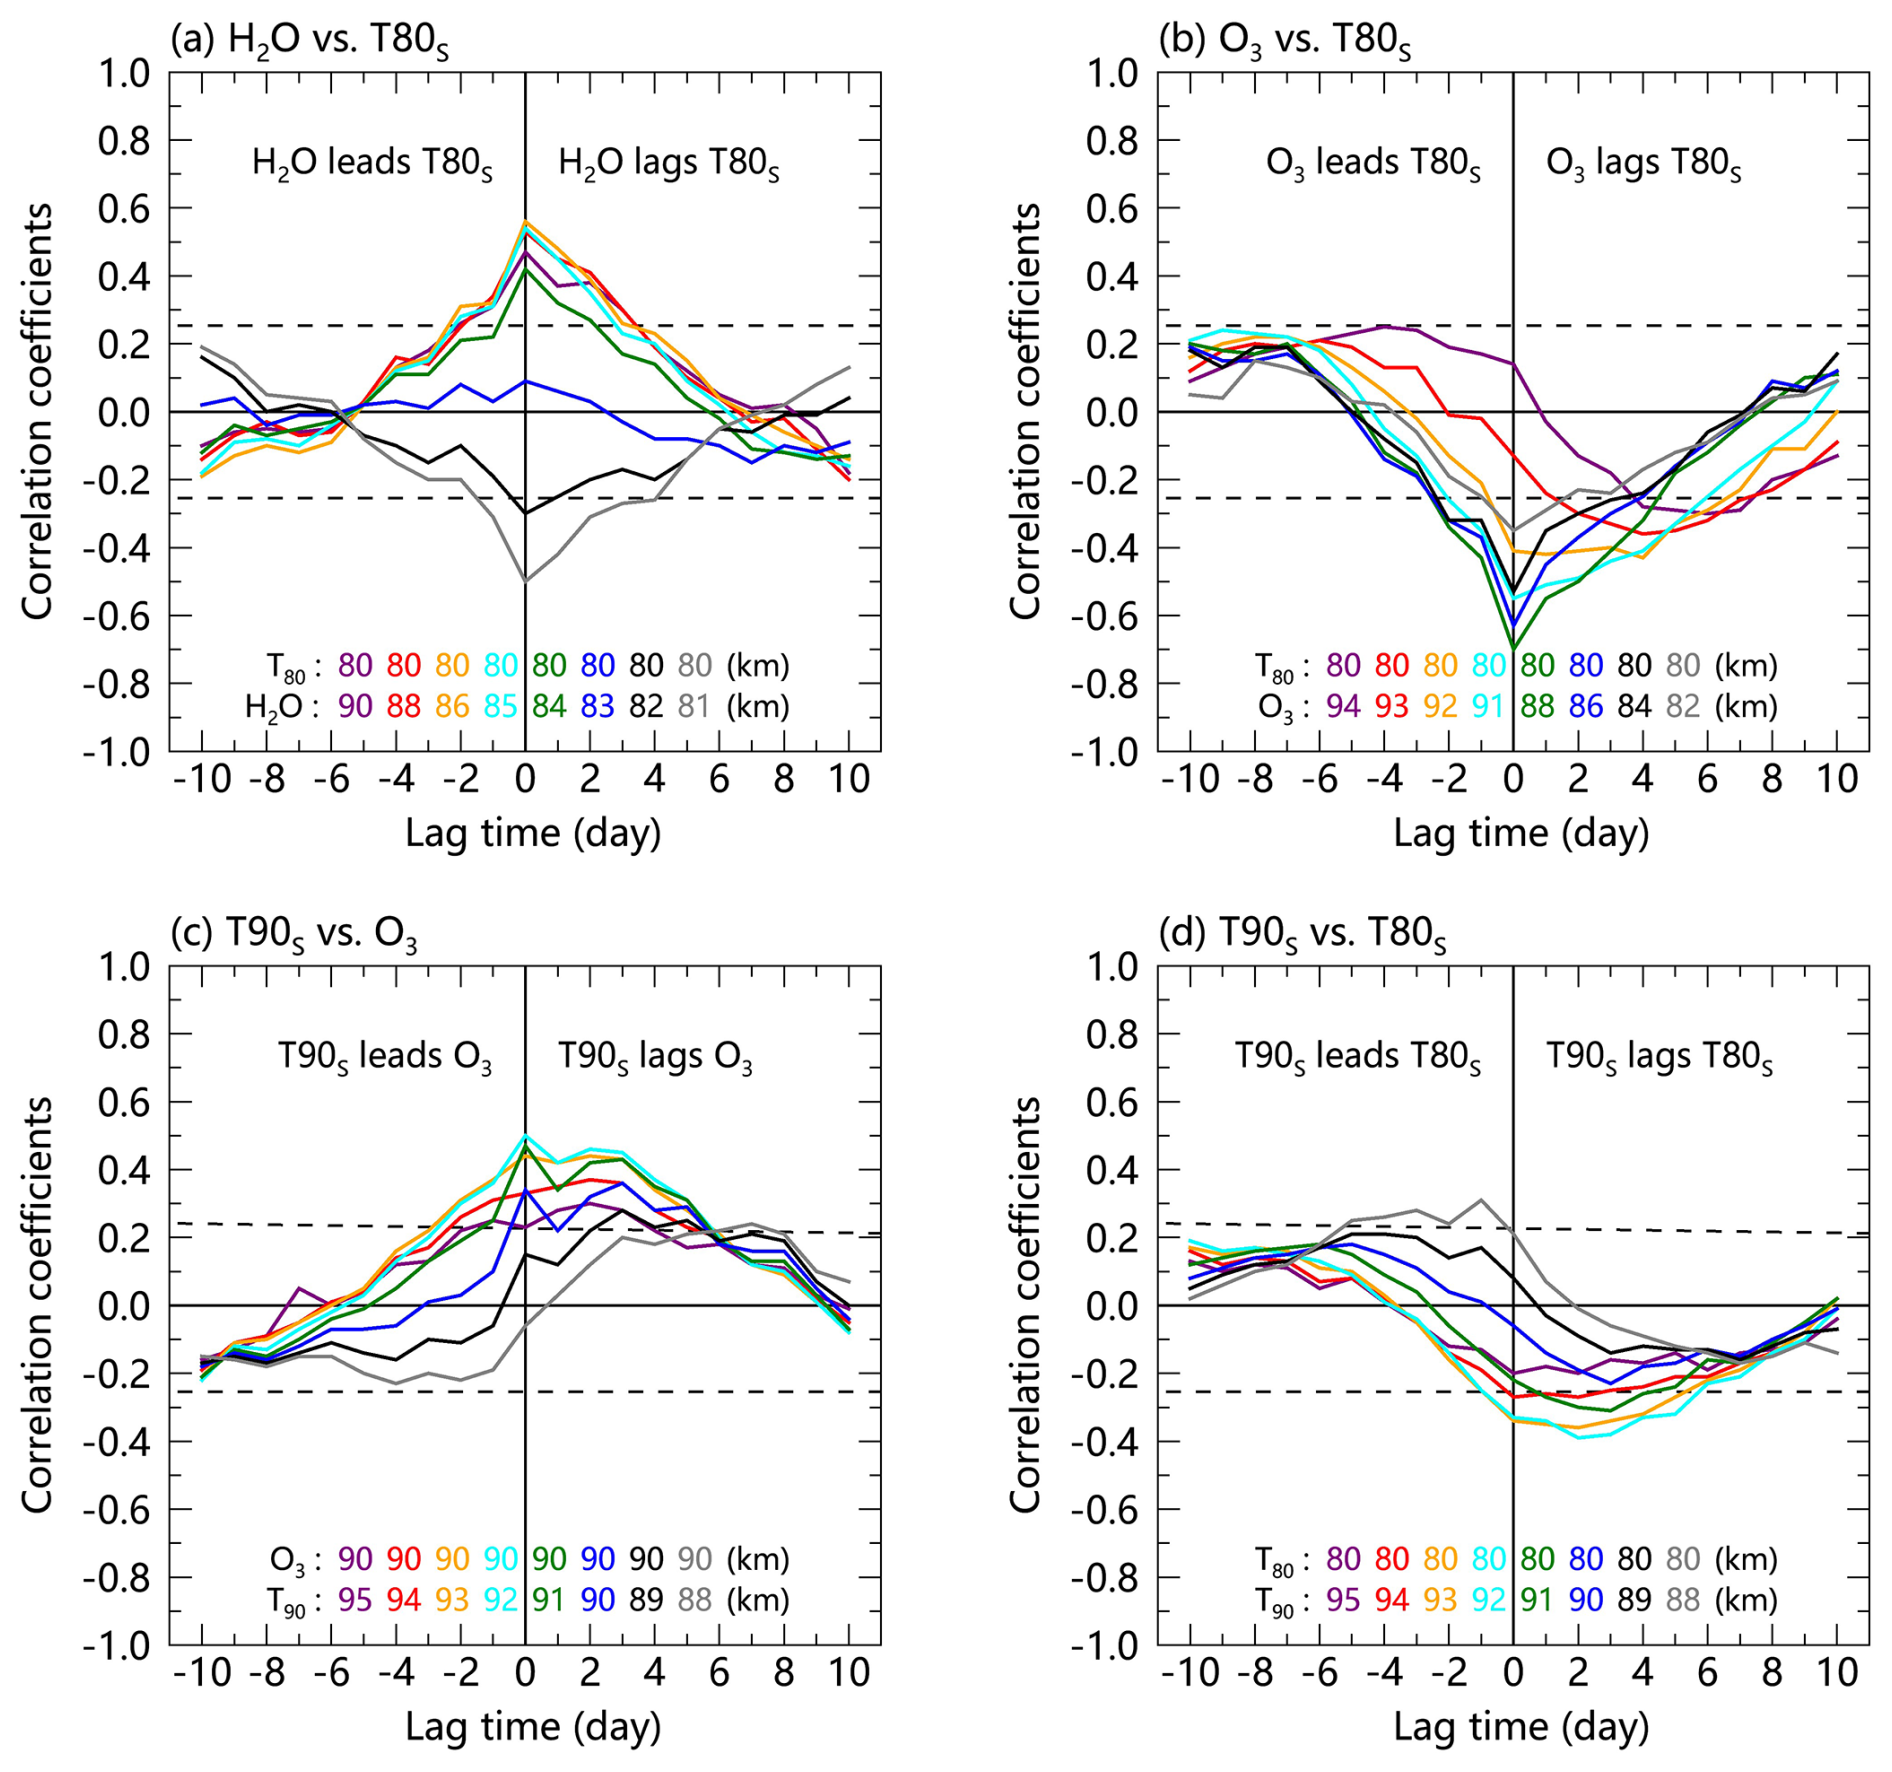
Figure 8Time-lag analysis of bottom-up control processes from SOFIE observations at ∼ 70° S for the SH PMC seasons during 2007–2013. (a) Immediate response (zero-day lag) of both hydration (negative H2O-T80S correlation) and dehydration (positive H2O-T80S correlation) to upwelling. (b) O3 response showing altitude-dependent lags to T80S. (c) T90S lags behind O3 by ∼ 3 d, possibly due to the radiative and chemical heating. (d) T90S lags after T80S by ∼ 3 d, indicating the cumulative response time of the full upwelling-H2O-O3-T90S chain. Correlation coefficients are calculated similar to Figs. 6–7, with dashed lines marking the 0.95 significance level.
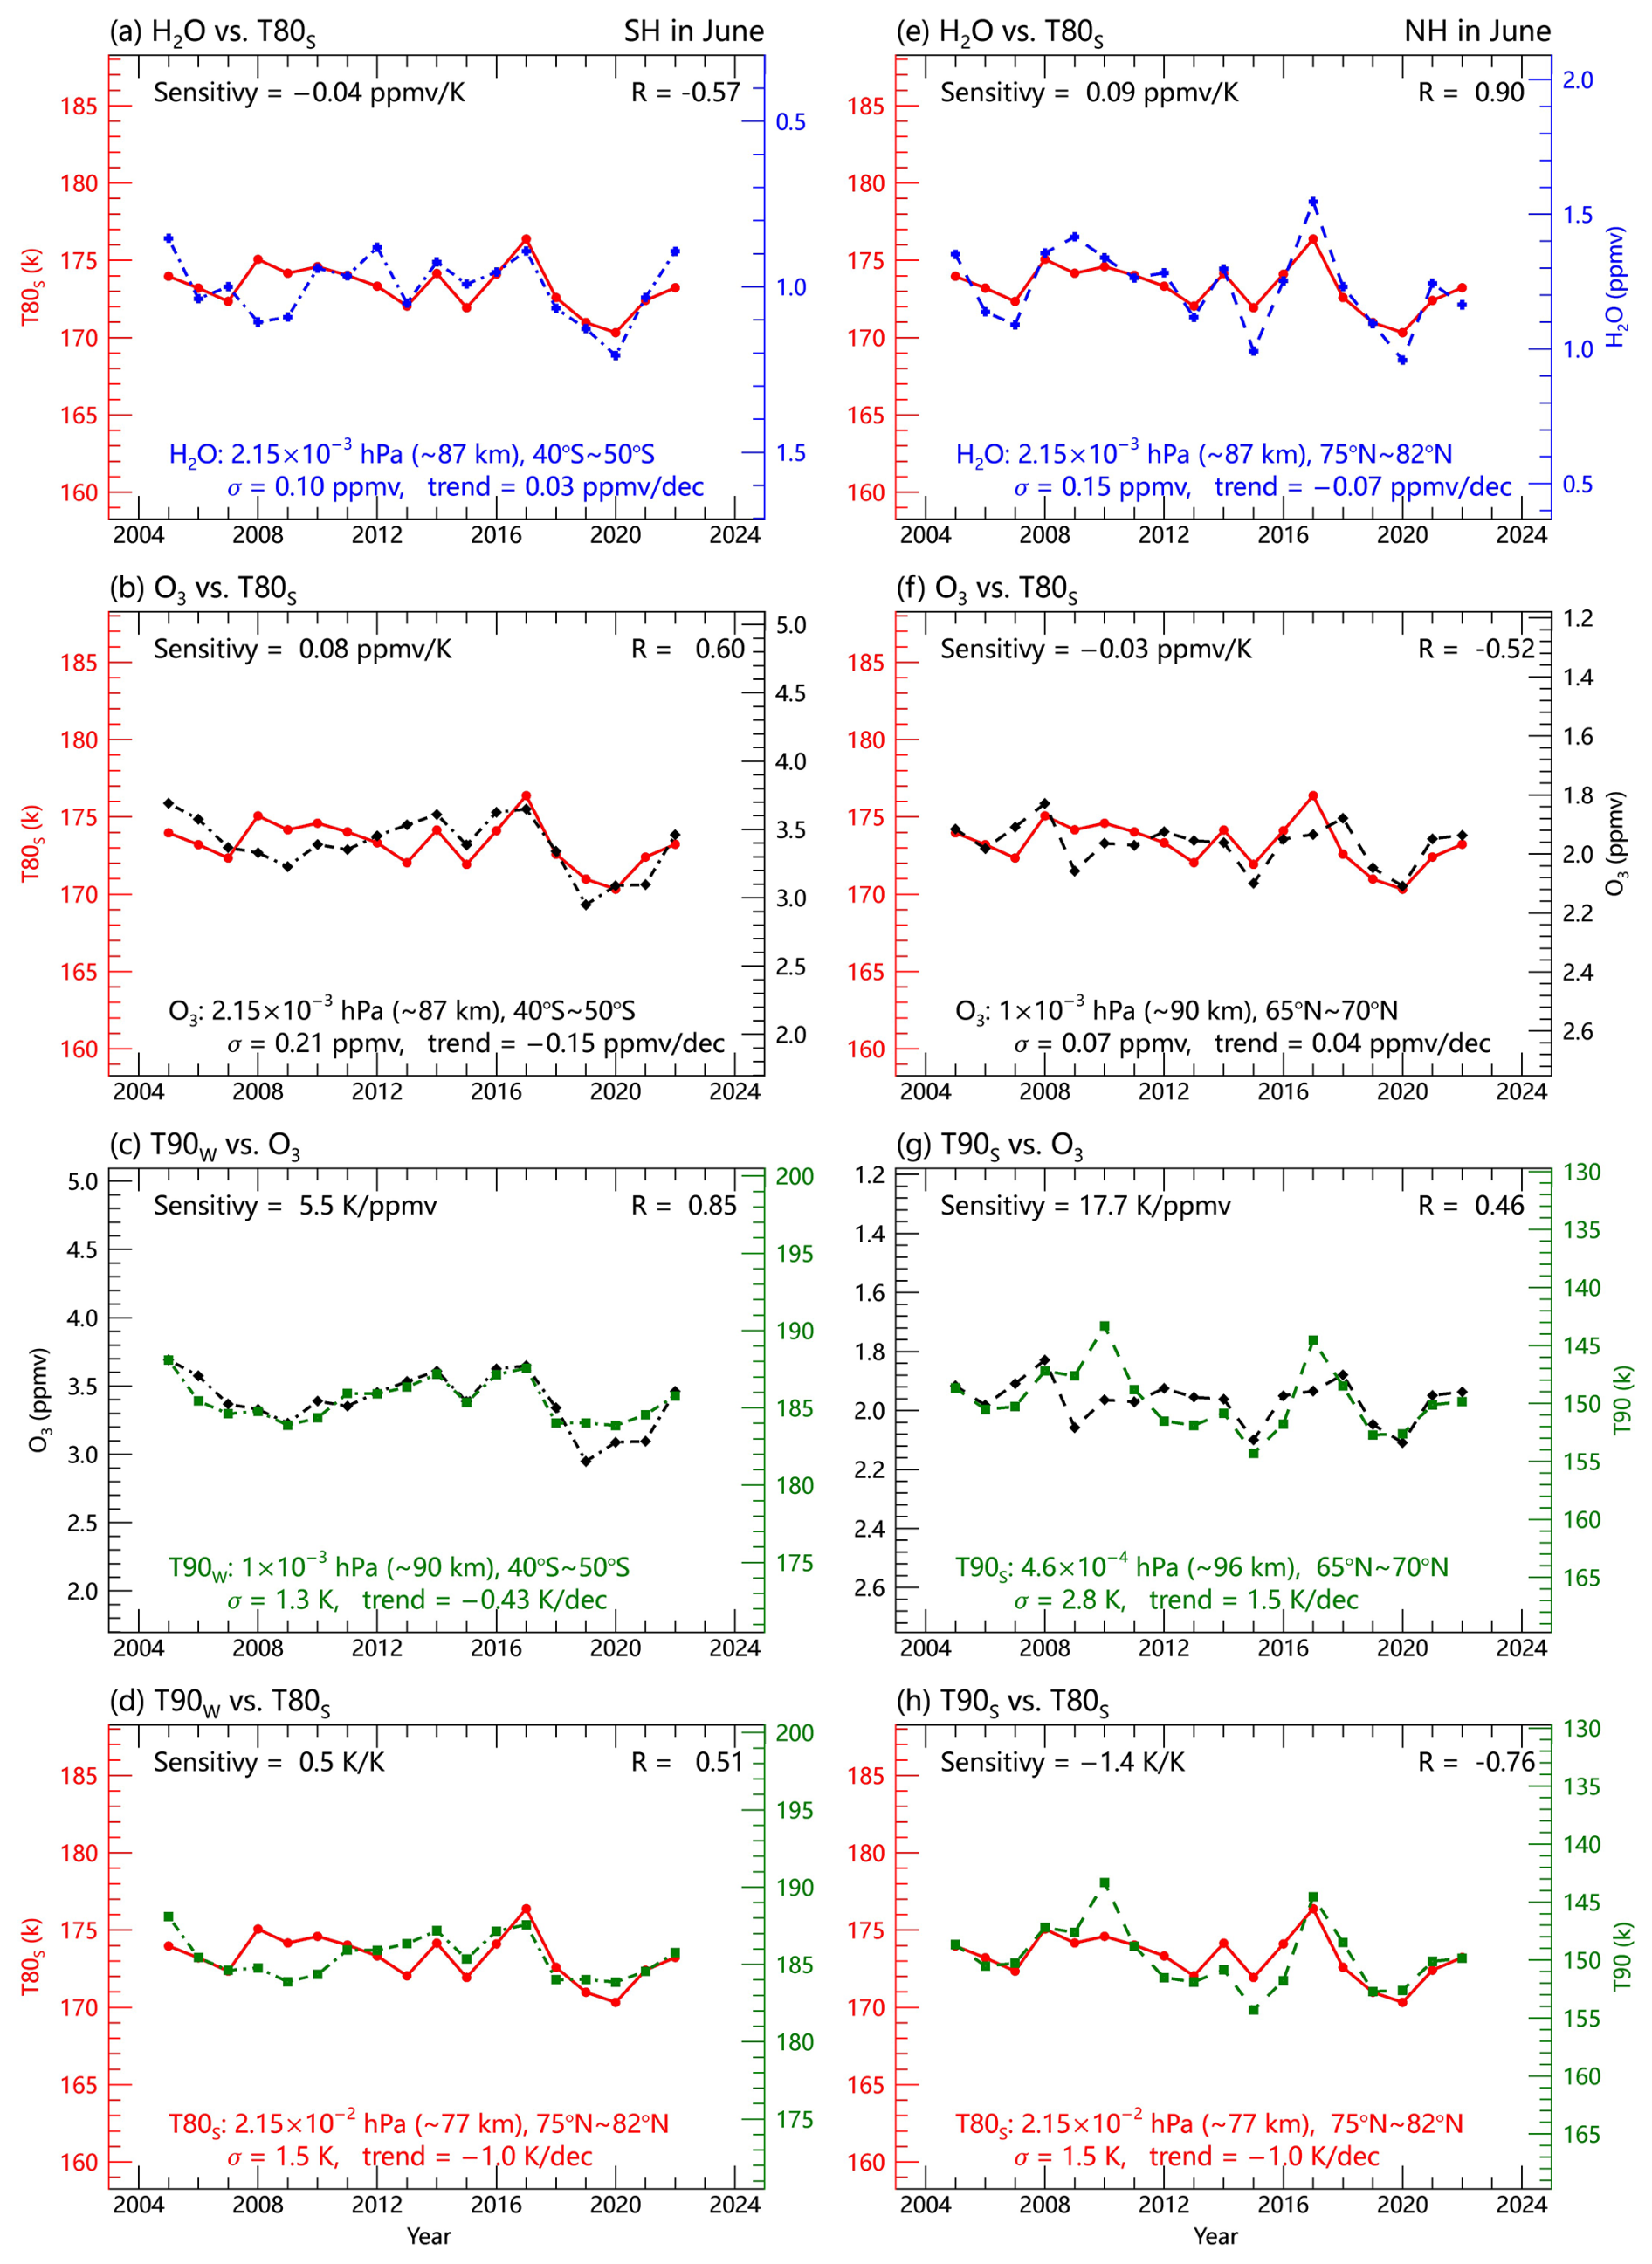
Figure 9Hemispheric responses of mesospheric (a, e) H2O, (b, f) O3, (d, h) T90 to upwelling variability (indicated by T80S) during June, showing analogous but weaker anti-phase behavior compared to December (Fig. 3). Panels (c), (g) show O3-T90 correlations. Note the reduced amplitude of T80S standard deviation (1.5 K in June vs. 5.1 K in December) and weaker correlations in the June patterns.
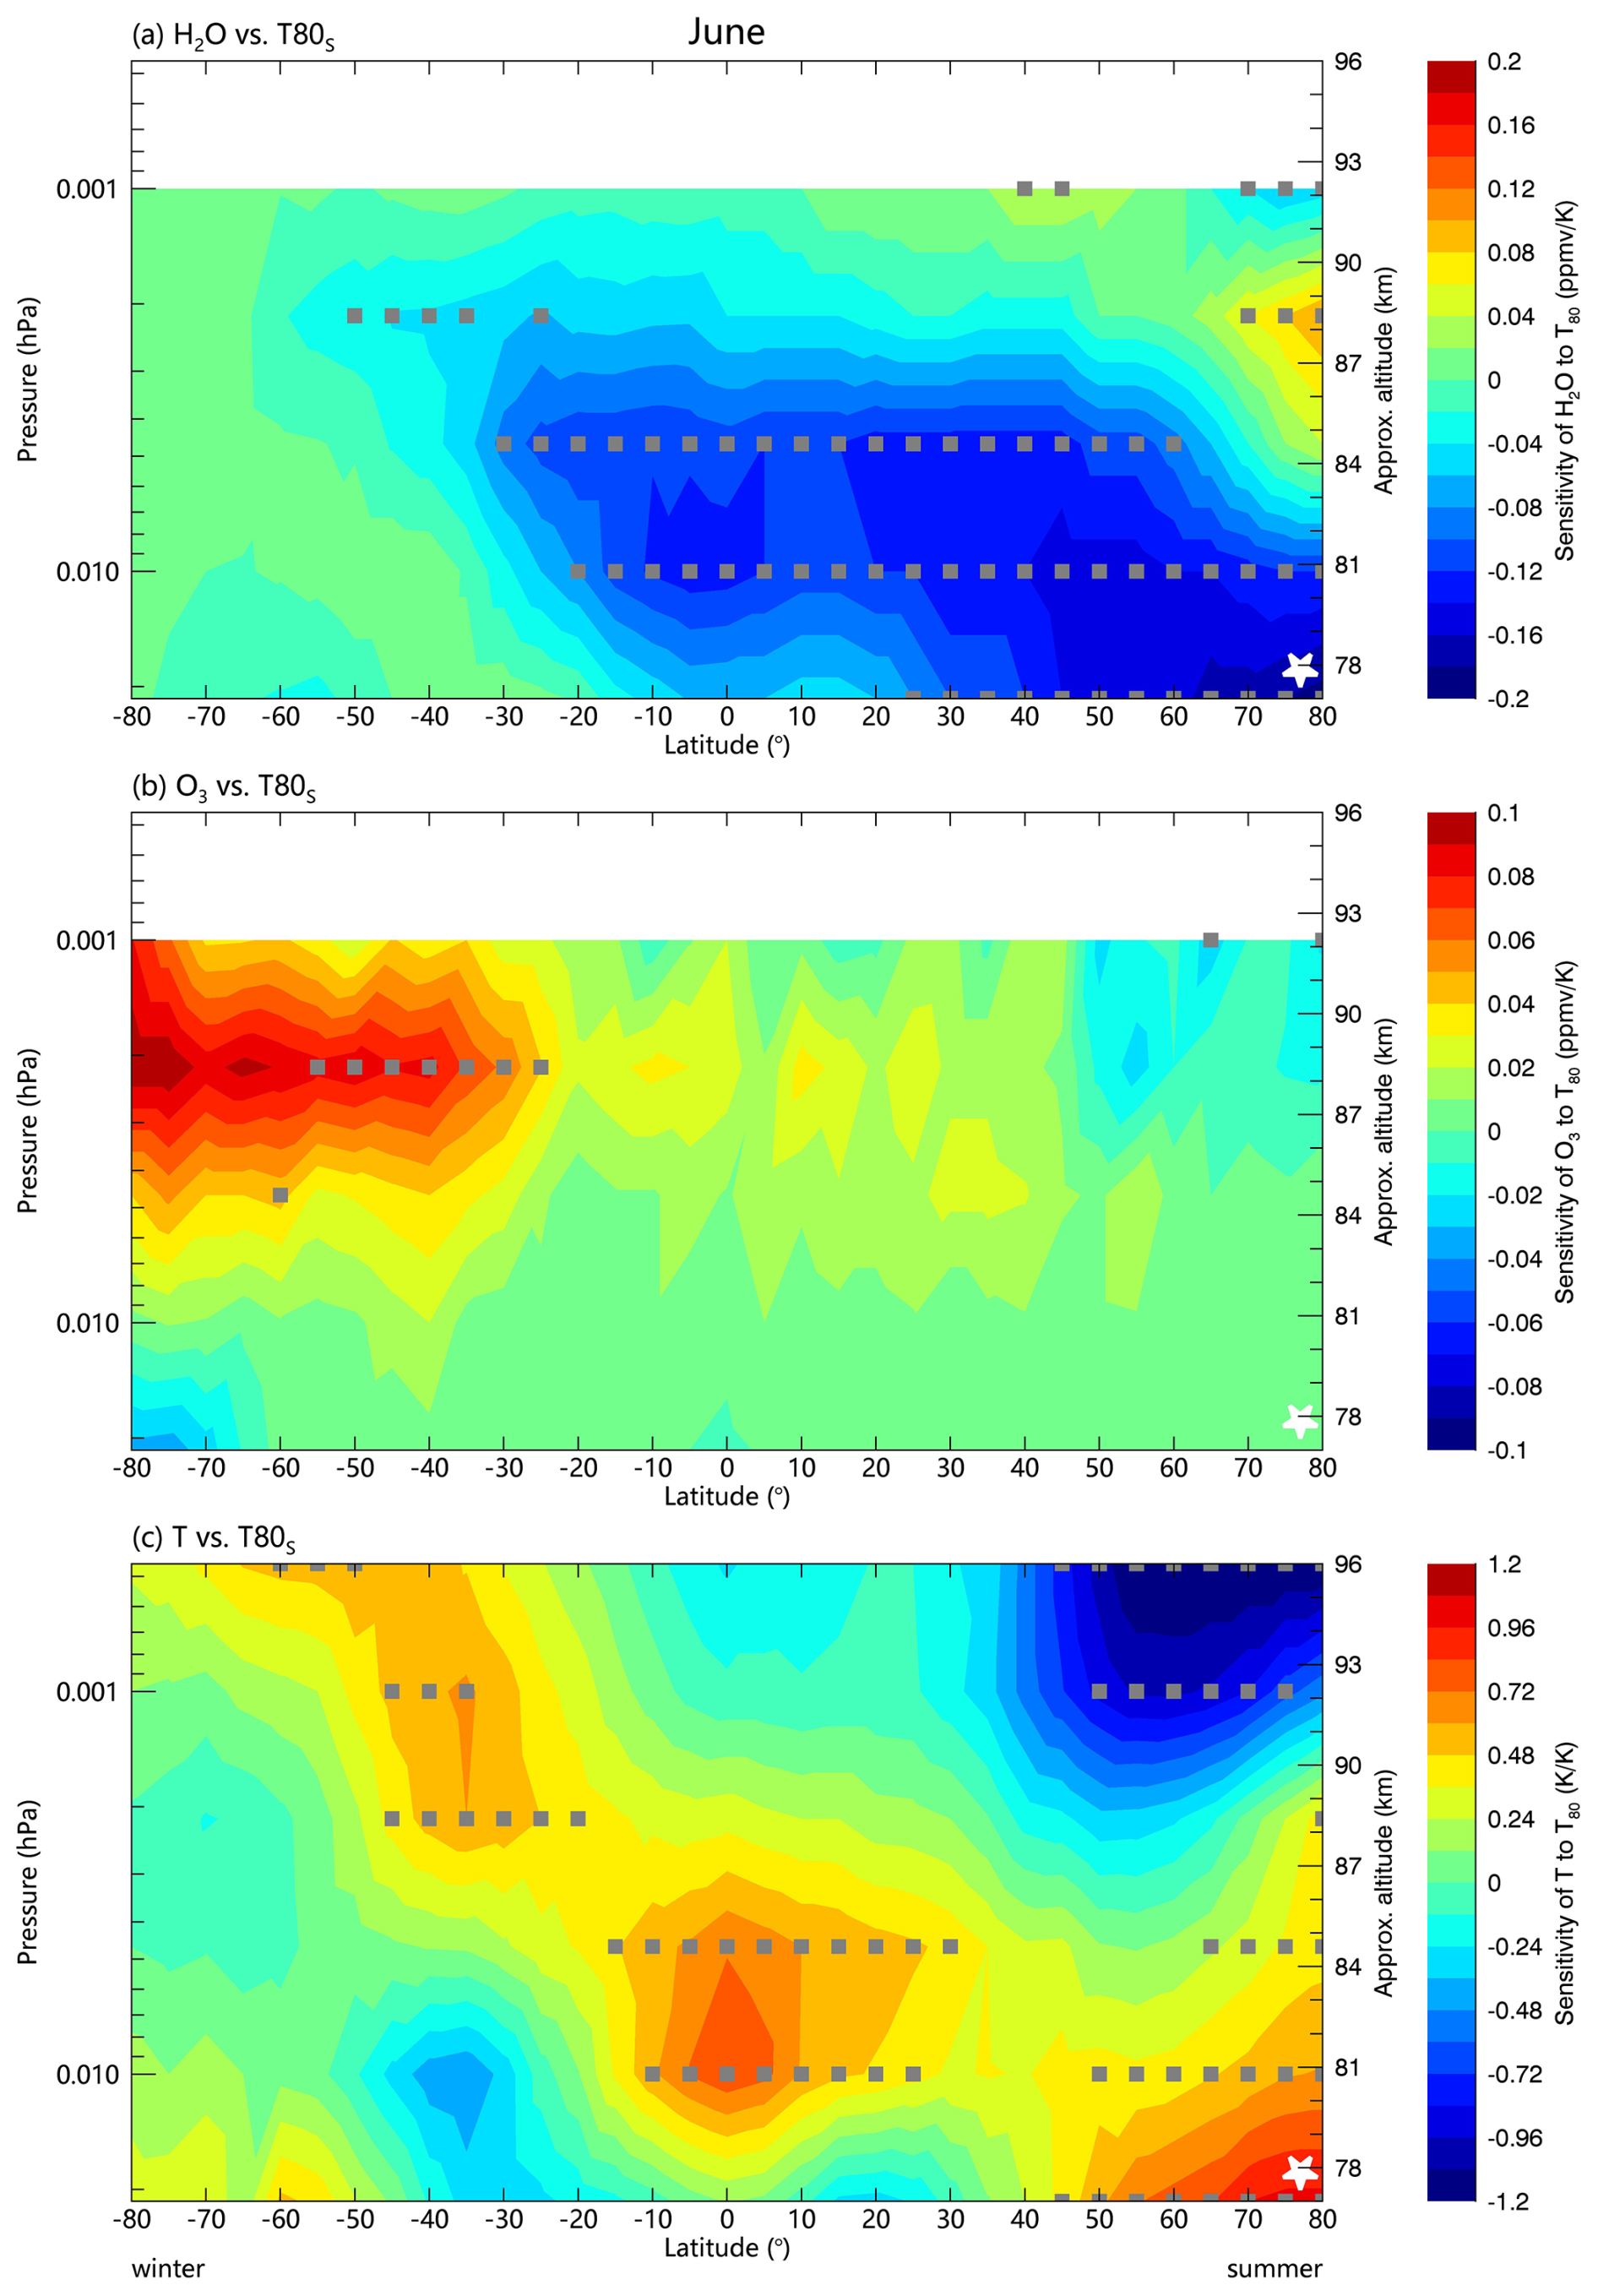
Figure 10Spatial patterns of bottom-up control processes during June showing (a) H2O, (b) O3, and (c) temperature responses to upwelling (indicated by T80S, white stars), analogous to but weaker than December patterns (Fig. 4). Sensitivities derived from linear regression of MLS/Aura data (2004–2022) show reduced but still significant anti-phase relationships between hemispheres compared to December. Gray dots mark the 0.95 significance level. Note the responses of variables in winter hemisphere extend to ∼ 50° S in June.
3.2 Climate patterns in June
The climate patterns in June (Figs. 9–12) mirror those of December, but with reduced amplitudes. The T80S variability is weaker (1.5 K vs. 5.1 K in December), yielding smaller constituent variations and lower significance (Figs. 3, 9). SABER H responses are insignificant (Fig. 11a), while T90S correlations weaken or disappear (Figs. 11d, 12d). MLS data show a localized hydration signal at 0.001 hPa between 70–80° N (Fig. 10a), possibly from PMC sublimation due to higher T90S.
Interhemispheric transports are more pronounced in June than in December due to differences in gravity wave forcing of the circulation (Smith et al., 2011). The enhanced meridional transport extends H2O influences to 40–50° S, affecting O3 and T90W in the winter high-latitudes (Fig. 10). Downward winds in the winter polar region generally result in the lowest H2O levels near solstice, although vertical winds and diffusion can increase winter polar H2O above 90 km (Lossow et al., 2009). Whether the summer polar upwelling in June could influence the winter high-latitude climate through interhemispheric H2O transport is an interesting question.
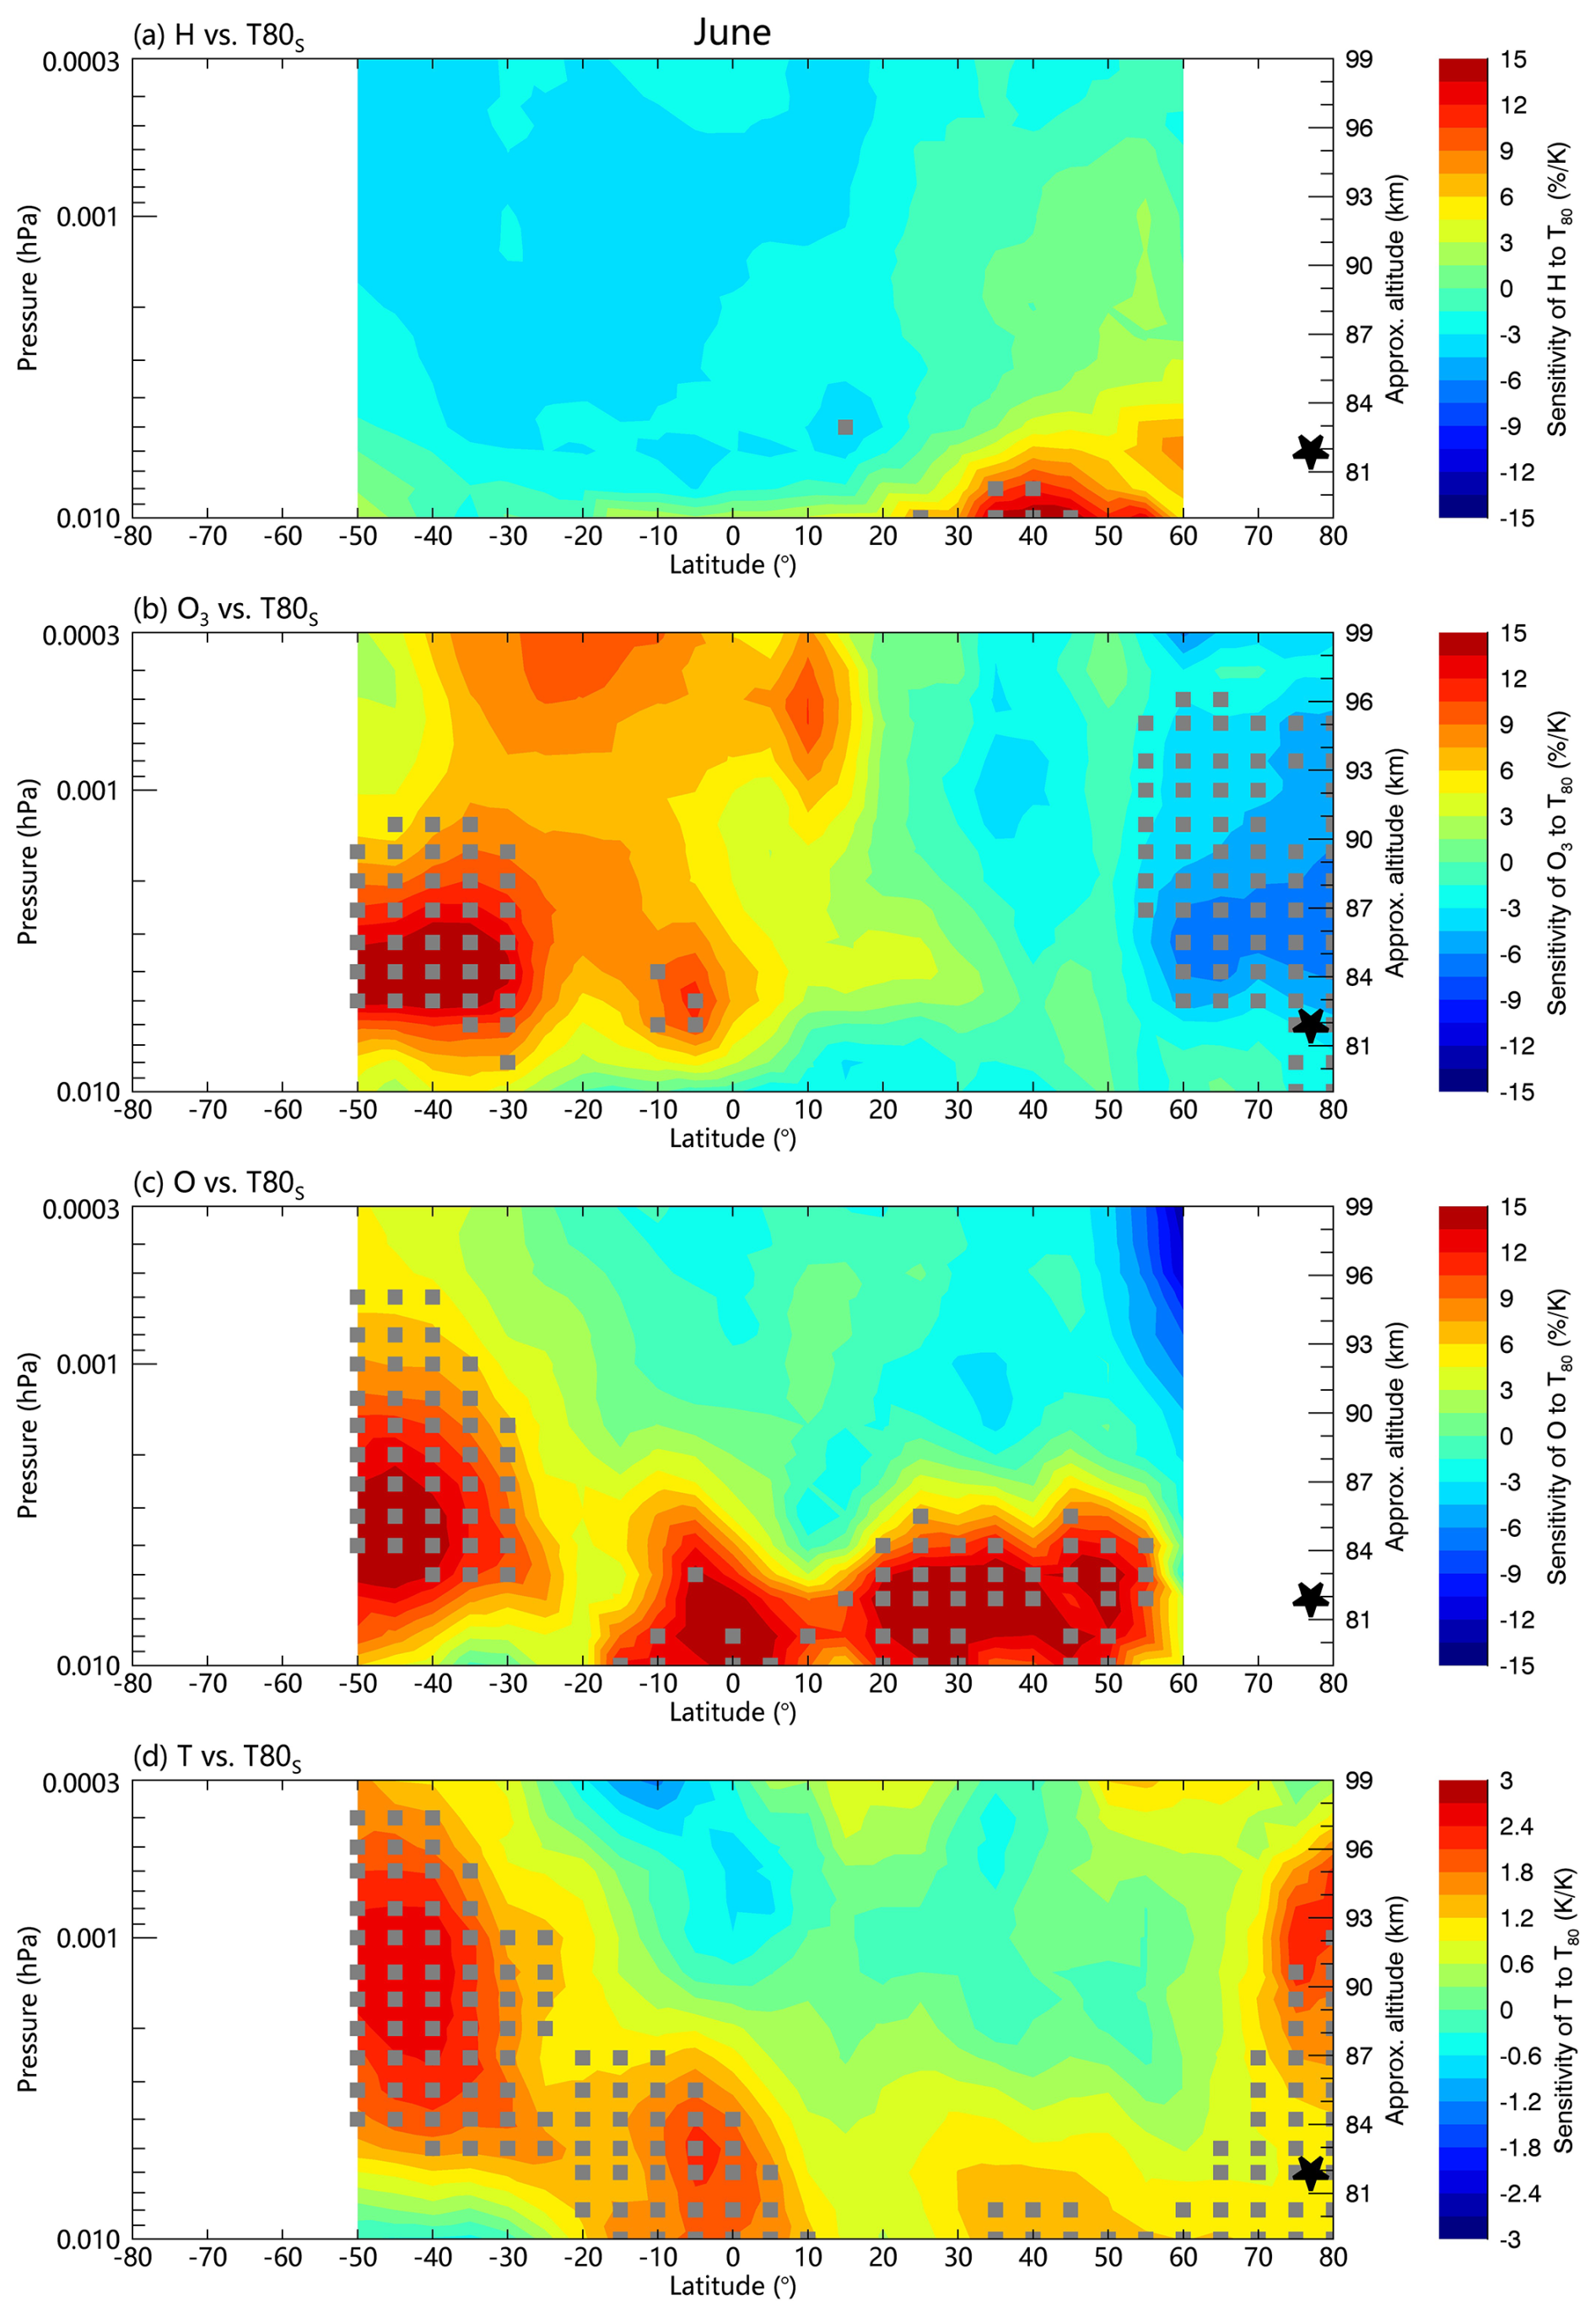
Figure 11Bottom-up control of atmospheric constituents in June from SABER observations (2002–2019), showing analogous but weaker responses than December (Fig. 5). (a) H shows insignificant response to upwelling (indicated by T80S, black stars at 75–83° N, 0.006 hPa). (b) O3 and (c) O variations exhibit reduced hemispheric anti-symmetry in sensitivity to T80S. (d) The positive T90W responses in wither hemisphere maintain, but the negative T90S responses disappear. All sensitivities have been derived from linear regression analysis of monthly data.
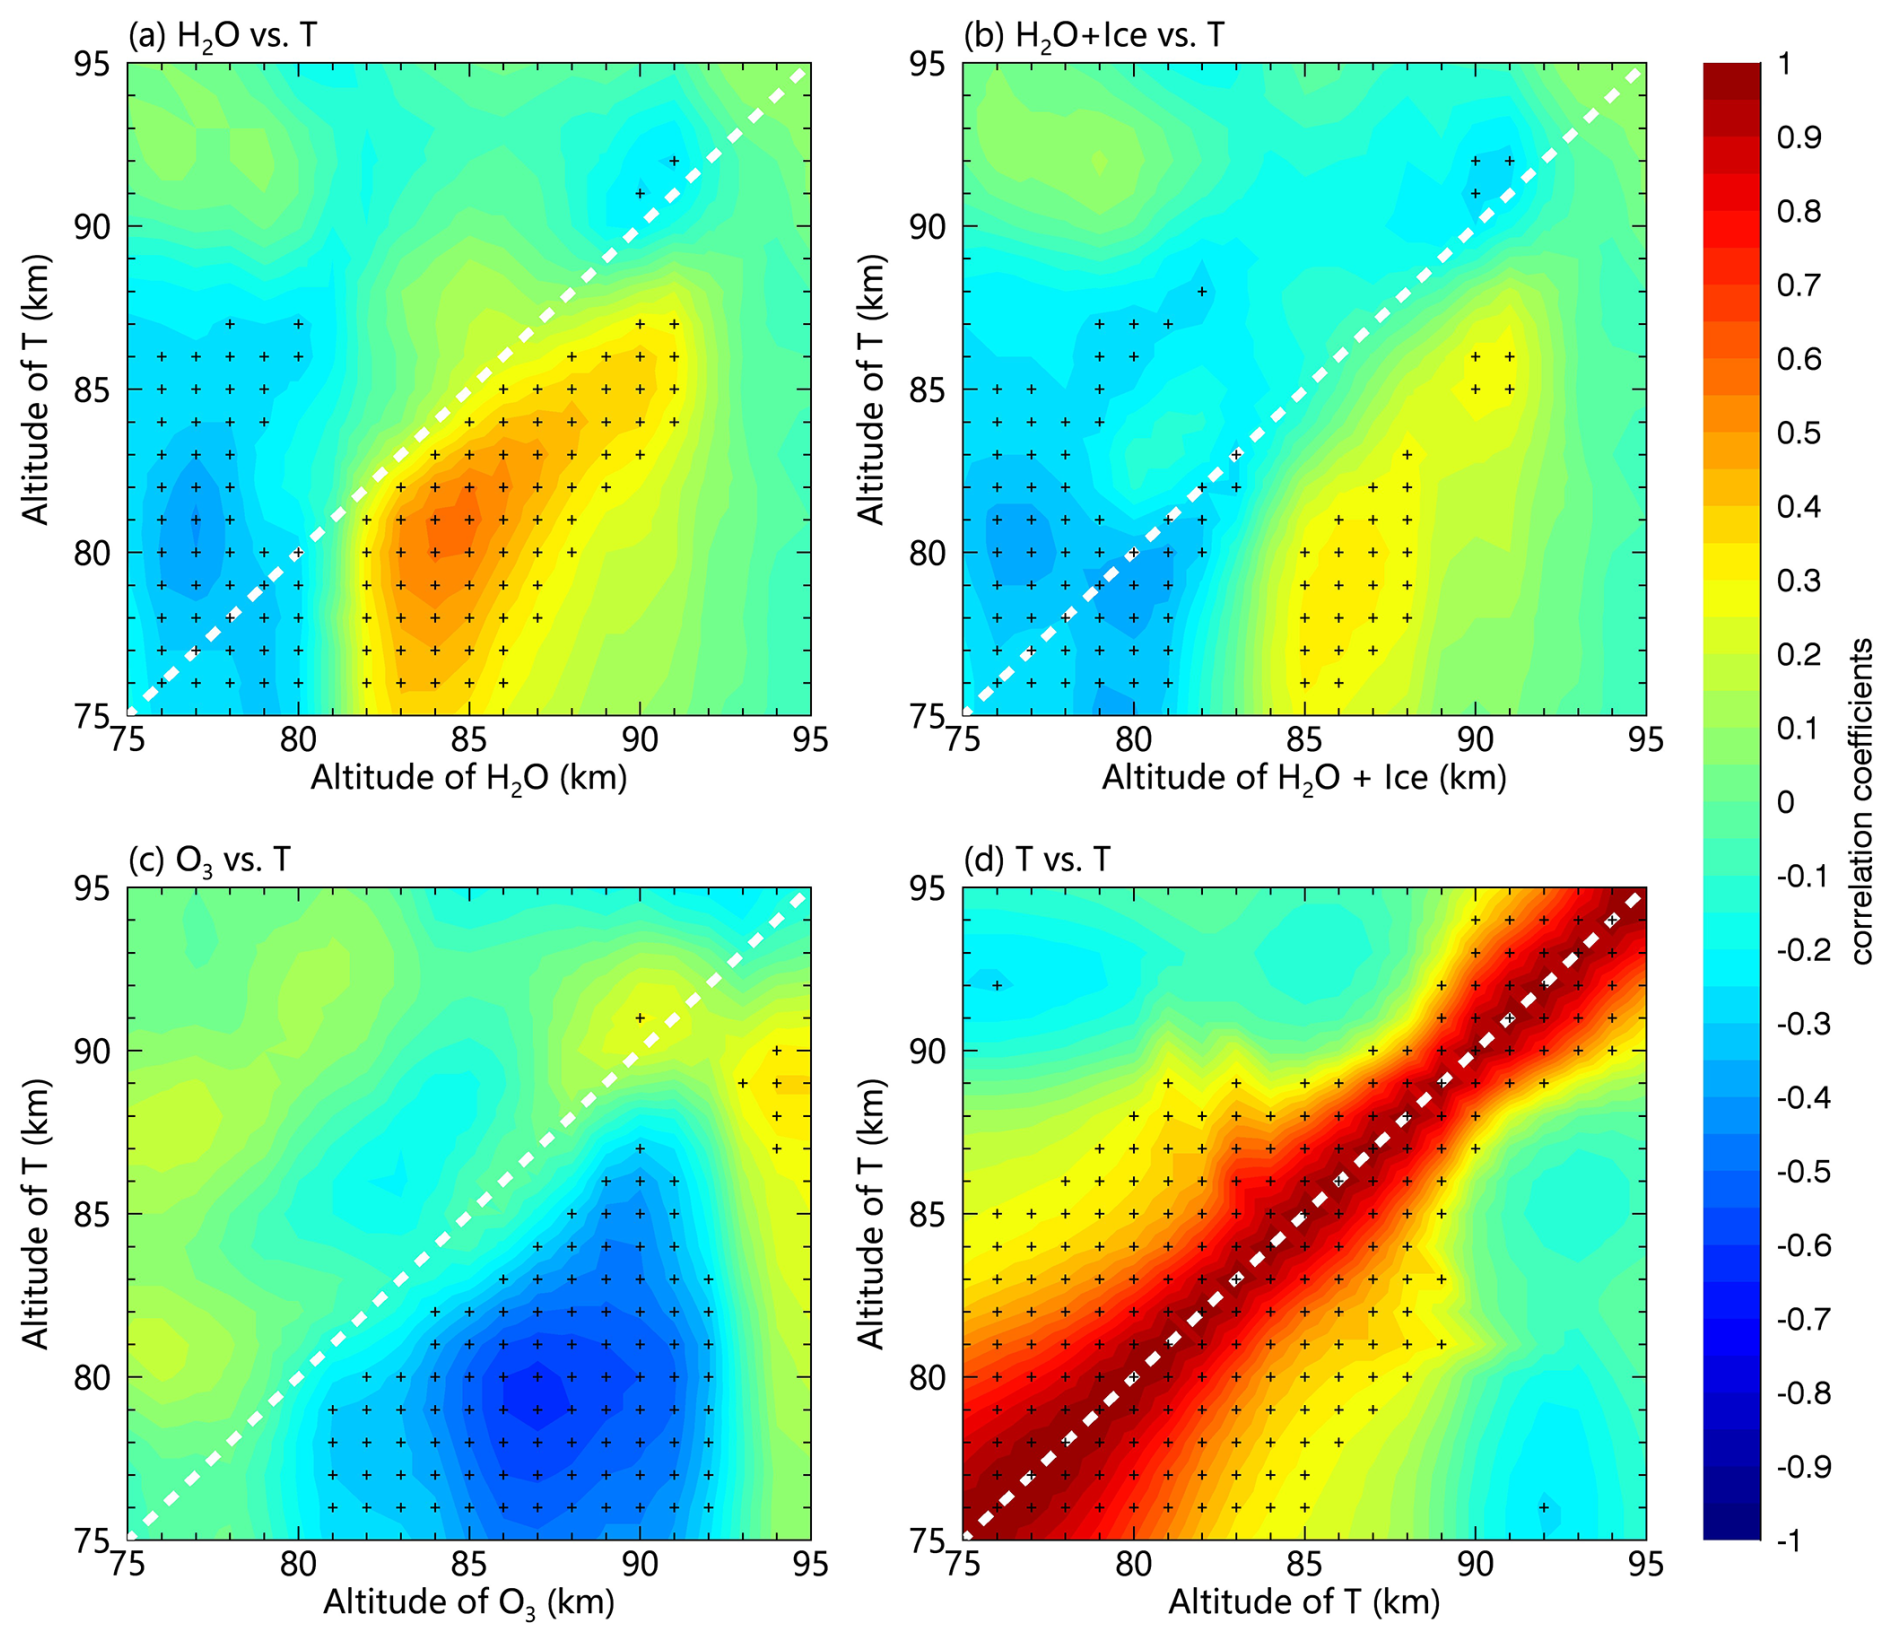
Figure 12Daily-scale bottom-up control processes from SOFIE/AIM observations for the NH PMC seasons during 2007–2014. (a) H2O in NH shows weaker control by T80S compared to that in SH (Fig. 7). (b) Combined H2O and ice content demonstrating similar but less pronounced T80S dependence. (c) Anti-correlation between O3 and T80S with reduced O3-T90S relationship. (d) Weaker negative relationship between T90S and T80S. Correlation coefficients calculated for −10 to 50 d relative to solstice (35 d running mean removed), with black dots marking the 0.95 significance level. Note the generally weaker responses compared to SH observations in Fig. 7.
4.1 H2O/H variability mechanisms
Our results demonstrate it is the summer polar upwelling that fundamentally drives the interannual variability of both hydration and dehydration through two distinct pathways: (1) direct upward transport of H2O by upwelling combined with meridional wind transport creates hydration in the winter hemisphere; and (2) adiabatic cooling associated with upwelling enhances ice particle growth that blocks upward H2O transport, causing dehydration above PMC in the summer hemisphere.
The cold-trap effect differs from the conventional freeze-drying effect in several ways. While freeze-drying effect describes a top-down process dominated by ice particle sedimentation, the cold-trap effect represents a bottom-up process driven primarily by upwelling dynamics. Sedimentation of ice particles plays a dominant role in the freeze-drying effect, however, it is unnecessary in the cold-trap effect (Zhang et al., 2025a). Importantly, the cold-trap effect produces simultaneous hydration and dehydration. In contrast, the freeze-drying effect involves dehydration prior to hydration, with a time lag (estimated as the ice particle lifetime) of up to two days. Particularly, if PMCs are weak or absent and ice particles could not block upward H2O transport, hydration could even occur in the absence of dehydration, inconsistent with the freeze-drying effect.
It should be emphasized that we are not attempting to demonstrate that the freeze-drying effect is incorrect. Instead, the two mechanisms should be complementary rather than contradictory. The freeze-drying effect has been verified by simulations for describing PMC microphysical processes at local scales, while the cold-trap effect better explains the global-scale H2O redistribution patterns, especially the H2O in the winter hemisphere. Additionally, the parameterization of freeze-drying effect is unavailable until now, due to the complexity in PMC simulations. In contrast, the cold-trap effect is much simpler, the interannual variability of hydration/dehydration is only dependent on the T80S. The limited H variability detected in SABER data (Figs. 5a, 11a) may reflect both measurement uncertainties in H retrieval and gaps in spatial coverage in high-latitude regions where dehydration effects are strongest.
4.2 O3/O response pathways
Upwelling forcing drives distinct hemispheric patterns in O3 variations. In the winter hemisphere, hydration-driven increases in H abundance lead to enhanced O3 destruction. In the summer hemisphere, however, O3 increases via two pathways: reduced H abundance due to dehydration and temperature-dependent ozone kinetics caused by adiabatic cooling.
Our vertical analysis shows that these processes operate at different altitudes (Figs. 5b, 7c). Below 85 km, where dehydration is absent, temperature-dependent ozone kinetics dominate O3 abundance, while above 85 km both dehydration and ozone kinetics contribute, with their relative contribution remaining unclear. In addition, the lag time of O3 to T80S differs for varying altitudes (Fig. 8b), which may be useful for identifying the two pathways.
4.3 Temperature modulation processes
The anti-phase temperature responses between hemispheres (T90W and T90S) reflect the combined effect of dynamical processes and O/O3 heating. In the winter hemisphere, based on the known radiative and chemical heating rate (∼ 10 K d−1 on global and annual scale) of O/O3, the 3∼ 4 % K−1 sensitivity of O3 and O in low latitudes to T80S (Fig. 5b, c) approximately explains the observed ∼ 0.5 K K−1 sensitivity of T90W to T80S (Fig. 5d).
The summer hemisphere presents a more complex scenario involving competing processes. The O3 concentration in summer polar region is very low due to the destruction by sunlight and H2O (Fig. 1b), while the O concentrations do not differ much between the summer and winter hemispheres. The high sensitivity of T90S to O3 (51.7 K ppmv−1, Fig. 3c) in December is likely unrealistic. O-heating likely dominates the interannual variability of T90S, with O3-heating playing a minor role.
Another explanation is that a potential downwelling may result in higher T90S by adiabatic heating and higher O concentration by downward transports, which further increase O3. The zonal winds change direction above the mesopause height, and gravity waves that induce upwelling near 80 km tend to cause downwelling at altitudes above the mesopause. In this scenario, the positive correlation between T90S and O/O3 results from vertical winds rather than solar or chemical heating. However, Fig. 8c, d shows that the T90S lags behind O3 and T80S by ∼ 3 d, ruling out pure dynamical explanations. Figures 4c and 5d show that the T90S at latitudes as low as 30° S are negatively correlated with T80S, which should not be attributed to the adiabatic heating of downwelling. Moreover, shrinking effect may explain the negative correlation between T90S and T80S through the vertical shift of the temperature profile. However, the MLS and SABER results are presented on pressure levels rather than geometric heights, not supporting a shrinking effect as the major driver for the interannual variability of T90S. In addition, T90S lags behind T80S by ∼ 3 d (Fig. 8d), inconsistent with the shrinking effect on the daily scale.
This study establishes that summer polar upwelling serves as the primary driver of interannual variability in the upper mesospheric H2O(H), O3(O), and T90 through a bottom-up mechanism. Our findings build a simple picture for understanding the interhemispheric anti-phase climate of the upper mesosphere, revealing three key aspects of dynamical-chemical interactions: First, we demonstrate that the summer polar upwelling drives the global-scale interannual H2O variability, namely the hydration in the winter hemisphere and dehydration in the summer hemisphere. Second, owing to the negative modulation of O3 by H2O and the ozone photochemical equilibrium assumption, the winter-hemisphere O3/O decreases due to the hydration-induced depletion of H, while the summer-hemisphere O3/O increases due to combined effects of dehydration and temperature-dependent ozone kinetics. Third, because of the radiative and chemical heating of O3/O, there is a positive correlation between the winter-hemisphere T90W and T80S, and a negative correlation between the summer-hemisphere T90S and T80S.
Several important questions remain unresolved and need further investigation. Summer polar upwelling plays a pivotal role in the bottom-up control mechanism, while the pronounced hemispheric difference in the interannual T80S variability (5.1 K in December, 1.5 K in June) lacks a detailed explanation. Given the importance of H2O for mesospheric climate, the relationship between our proposed cold-trap effect and conventional, well-established freeze-drying effect should be a priority for further study. Similarly, the relative contribution of dehydration versus ozone kinetics to summer-hemisphere O3 enhancement require quantification. Alternative explanations for the interannual T90S variability, including shrinking effect and adiabatic heating of gravity wave-driven downwelling, cannot fully account for the observed patterns, but may make some contribution. These advances will further elucidate mesospheric climate variability while improving the physical basis for interpreting long-term trends in this intricate atmospheric region.
The MLS Level 2, version 5 data are available for download from the NASA GES DISC website. Specifically, the MLS water vapor data can be accessed at https://doi.org/10.5067/Aura/MLS/DATA2508 (Lambert et al., 2020), the ozone data at https://doi.org/10.5067/Aura/MLS/DATA2516 (Schwartz et al., 2020a), and the temperature data at https://doi.org/10.5067/Aura/MLS/DATA2520 (Schwartz et al., 2020b). The SABER data version 2.07 of temperature, ozone, atomic oxygen, and atomic hydrogen can be download from https://data.gats-inc.com/saber/Version2_0/SABER_atox/ (Mlynczak et al., 2023). The PMC data from SOFIE/AIM are available from the SOFIE website (http://sofie.gats-inc.com/getdata, SOFIE, 2023).
LZ, ZL, and BT conceived the idea together. LZ analyzed the data and drafted the manuscript. ZL and BT revised the paper.
The contact author has declared that none of the authors has any competing interests.
Publisher’s note: Copernicus Publications remains neutral with regard to jurisdictional claims made in the text, published maps, institutional affiliations, or any other geographical representation in this paper. While Copernicus Publications makes every effort to include appropriate place names, the final responsibility lies with the authors. Views expressed in the text are those of the authors and do not necessarily reflect the views of the publisher.
We are especially grateful to the MLS, SABER, and SOFIE program for providing us with the long-range and high-quality data.
This research has been supported by the National Natural Science Foundation of China (grant nos. 42025602 and 41905059).
This paper was edited by John Plane and reviewed by two anonymous referees.
Bailey, S. M., Thurairajah, B., Hervig, M. E., Siskind, D. E., Russell, J. M., and Gordley, L. L.: Trends in the polar summer mesosphere temperature and pressure altitude from satellite observations, J. Atmos. Sol.-Terr. Phy., 220, 105650, https://doi.org/10.1016/j.jastp.2021.105650, 2021.
Bardeen, C. G., Toon, O. B., Jensen, E. J., Hervig, M. E., Randall, C. E., Benze, S., Marsh, D. R., and Merkel, A.: Numerical simulations of the three-dimensional distribution of polar mesospheric clouds and comparisons with Cloud Imaging and Particle Size (CIPS) experiment and the Solar Occultation For Ice Experiment (SOFIE) observations, J. Geophys. Res.-Atmos., 115, https://doi.org/10.1029/2009JD012451, 2010.
Dawkins, E. C. M., Stober, G., Janches, D., Carrillo-Sánchez, J. D., Lieberman, R. S., Jacobi, C., Moffat-Griffin, T., Mitchell, N. J., Cobbett, N., Batista, P. P., Andrioli, V. F., Buriti, R. A., Murphy, D. J., Kero, J., Gulbrandsen, N., Tsutsumi, M., Kozlovsky, A., Kim, J. H., Lee, C., and Lester, M.: Solar Cycle and Long-Term Trends in the Observed Peak of the Meteor Altitude Distributions by Meteor Radars, Geophys. Res. Lett., 50, e2022GL101953, https://doi.org/10.1029/2022GL101953, 2023.
Feofilov, A. G. and Kutepov, A. A.: Infrared Radiation in the Mesosphere and Lower Thermosphere: Energetic Effects and Remote Sensing, Surv. Geophys., 33, 1231–1280, https://doi.org/10.1007/s10712-012-9204-0, 2012.
Fiedler, J. and Baumgarten, G.: Solar and lunar tides in noctilucent clouds as determined by ground-based lidar, Atmos. Chem. Phys., 18, 16051–16061, https://doi.org/10.5194/acp-18-16051-2018, 2018.
French, W. J. R., Klekociuk, A. R., and Mulligan, F. J.: Analysis of 24 years of mesopause region OH rotational temperature observations at Davis, Antarctica – Part 2: Evidence of a quasi-quadrennial oscillation (QQO) in the polar mesosphere, Atmos. Chem. Phys., 20, 8691–8708, https://doi.org/10.5194/acp-20-8691-2020, 2020a.
French, W. J. R., Mulligan, F. J., and Klekociuk, A. R.: Analysis of 24 years of mesopause region OH rotational temperature observations at Davis, Antarctica – Part 1: long-term trends, Atmos. Chem. Phys., 20, 6379–6394, https://doi.org/10.5194/acp-20-6379-2020, 2020b.
Gao, H., Li, L., Bu, L., Zhang, Q., Tang, Y., and Wang, Z.: Effect of Small-Scale Gravity Waves on Polar Mesospheric Clouds Observed From CIPS/AIM, J. Geophys. Res.-Space, 123, 4026–4045, https://doi.org/10.1029/2017JA024855, 2018.
Gordley, L. L., Hervig, M. E., Fish, C., Russell III, J. M., Bailey, S., Cook, J., Hansen, S., Shumway, A., Paxton, G., Deaver, L., Marshall, T., Burton, J., Magill, B., Brown, C., Thompson, E., and Kemp, J.: The solar occultation for ice experiment, J. Atmos. Sol.-Terr. Phy., 71, 300–315, https://doi.org/10.1016/j.jastp.2008.07.012, 2009.
Gumbel, J. and Karlsson, B.: Intra- and inter-hemispheric coupling effects on the polar summer mesosphere, Geophys. Res. Lett., 38, https://doi.org/10.1029/2011GL047968, 2011.
Hervig, M. E., Gordley, L. L., Stevens, M. H., Russell III, J. M., Bailey, S. M., and Baumgarten, G.: Interpretation of SOFIE PMC measurements: Cloud identification and derivation of mass density, particle shape, and particle size, J. Atmos. Sol.-Terr. Phy., 71, 316–330, https://doi.org/10.1016/j.jastp.2008.07.009, 2009.
Hervig, M. E., Siskind, D. E., Bailey, S. M., and Russell III, J. M.: The influence of PMCs on water vapor and drivers behind PMC variability from SOFIE observations, J. Atmos. Sol.-Terr. Phy., 132, 124–134, https://doi.org/10.1016/j.jastp.2015.07.010, 2015.
Hervig, M. E., Siskind, D. E., Bailey, S. M., Merkel, A. W., DeLand, M. T., and Russell III, J. M.: The Missing Solar Cycle Response of the Polar Summer Mesosphere, Geophys. Res. Lett., 46, 10132–10139, https://doi.org/10.1029/2019GL083485, 2019.
Huang, F. T., Mayr, H. G., Russell III, J. M., Mlynczak, M. G., and Reber, C. A.: Ozone diurnal variations and mean profiles in the mesosphere, lower thermosphere, and stratosphere, based on measurements from SABER on TIMED, J. Geophys. Res.-Space, 113, https://doi.org/10.1029/2007JA012739, 2008.
Huang, F. T., Mayr, H. G., Russell III, J. M., and Mlynczak, M. G.: Ozone and temperature decadal trends in the stratosphere, mesosphere and lower thermosphere, based on measurements from SABER on TIMED, Ann. Geophys., 32, 935–949, https://doi.org/10.5194/angeo-32-935-2014, 2014.
Hultgren, K. and Gumbel, J.: Tomographic and spectral views on the lifecycle of polar mesospheric clouds from Odin/OSIRIS, J. Geophys. Res.-Atmos., 119, 14129-114143, https://doi.org/10.1002/2014JD022435, 2014.
Jia, J., Murberg, L. E., Løvset, T., Orsolini, Y. J., Espy, P. J., Zeller, L. C. G., Salinas, C. C. J. H., Lee, J. N., Wu, D., and Zhang, J.: Energetic particle precipitation influences global secondary ozone distribution, Communications Earth & Environment, 5, 270, https://doi.org/10.1038/s43247-024-01419-2, 2024.
Jiang, Y. B., Froidevaux, L., Lambert, A., Livesey, N. J., Read, W. G., Waters, J. W., Bojkov, B., Leblanc, T., McDermid, I. S., Godin-Beekmann, S., Filipiak, M. J., Harwood, R. S., Fuller, R. A., Daffer, W. H., Drouin, B. J., Cofield, R. E., Cuddy, D. T., Jarnot, R. F., Knosp, B. W., Perun, V. S., Schwartz, M. J., Snyder, W. V., Stek, P. C., Thurstans, R. P., Wagner, P. A., Allaart, M., Andersen, S. B., Bodeker, G., Calpini, B., Claude, H., Coetzee, G., Davies, J., De Backer, H., Dier, H., Fujiwara, M., Johnson, B., Kelder, H., Leme, N. P., König-Langlo, G., Kyro, E., Laneve, G., Fook, L. S., Merrill, J., Morris, G., Newchurch, M., Oltmans, S., Parrondos, M. C., Posny, F., Schmidlin, F., Skrivankova, P., Stubi, R., Tarasick, D., Thompson, A., Thouret, V., Viatte, P., Vömel, H., von Der Gathen, P., Yela, M., and Zablocki, G.: Validation of Aura Microwave Limb Sounder Ozone by ozonesonde and lidar measurements, J. Geophys. Res.-Atmos., 112, https://doi.org/10.1029/2007JD008776, 2007.
Kalicinsky, C., Peters, D. H. W., Entzian, G., Knieling, P., and Matthias, V.: Observational evidence for a quasi-bidecadal oscillation in the summer mesopause region over Western Europe, J. Atmos. Sol.-Terr. Phy., 178, 7–16, https://doi.org/10.1016/j.jastp.2018.05.008, 2018.
Karlsson, B. and Kuilman, M.: On How the Middle Atmospheric Residual Circulation Responds to the Solar Cycle Close to the Solstices, Journal of Climate, 31, 401–421, https://doi.org/10.1175/JCLI-D-17-0202.1, 2018.
Kulikov, M. Y., Belikovich, M. V., Grygalashvyly, M., Sonnemann, G. R., Ermakova, T. S., Nechaev, A. A., and Feigin, A. M.: Nighttime Ozone Chemical Equilibrium in the Mesopause Region, J. Geophys. Res.-Atmos., 123, 3228–3242, https://doi.org/10.1002/2017JD026717, 2018.
Lambert, A., Read, W., and Livesey, N.: MLS/Aura Level 2 Water Vapor (H2O) Mixing Ratio V005, Greenbelt, MD, USA, Goddard Earth Sciences Data and Information Services Center (GES DISC) [data set], https://doi.org/10.5067/Aura/MLS/DATA2508, 2020.
Laštovička, J.: A review of recent progress in trends in the upper atmosphere, J. Atmos. Sol.-Terr. Phy., 163, 2–13, https://doi.org/10.1016/j.jastp.2017.03.009, 2017.
Lee, J., Kwak, Y.-S., Kam, H., Kil, H., Park, J., Kim, J., Yang, T.-Y., and Lee, C.: Vertical Wind Profiles in the Mesosphere and Lower Thermosphere Driven by Meteor Radar and Ionospheric Connection Explorer Observations Over the Korean Peninsula, Geophys. Res. Lett., 51, e2023GL106450, https://doi.org/10.1029/2023GL106450, 2024.
Lee, J. N. and Wu, D. L.: Solar Cycle Modulation of Nighttime Ozone Near the Mesopause as Observed by MLS, Earth and Space Science, 7, e2019EA001063, https://doi.org/10.1029/2019EA001063, 2020.
Liu, X., Yue, J., Xu, J., Yuan, W., Russell III, J. M., and Hervig, M. E.: Five-day waves in polar stratosphere and mesosphere temperature and mesospheric ice water measured by SOFIE/AIM, J. Geophys. Res.-Atmos., 120, 3872–3887, https://doi.org/10.1002/2015JD023119, 2015.
Liu, X., Xu, J., Yue, J., Liu, Y., and Andrioli, V. F.: Trends in the high-latitude mesosphere temperature and mesopause revealed by SABER, Atmos. Chem. Phys., 24, 10143–10157, https://doi.org/10.5194/acp-24-10143-2024, 2024.
Lossow, S., Urban, J., Schmidt, H., Marsh, D. R., Gumbel, J., Eriksson, P., and Murtagh, D.: Wintertime water vapor in the polar upper mesosphere and lower thermosphere: First satellite observations by Odin submillimeter radiometer, J. Geophys. Res.-Atmos., 114, https://doi.org/10.1029/2008JD011462, 2009.
Lübken, F. J., Berger, U., and Baumgarten, G.: Stratospheric and solar cycle effects on long-term variability of mesospheric ice clouds, J. Geophys. Res.-Atmos., 114, https://doi.org/10.1029/2009JD012377, 2009.
Lübken, F.-J., Berger, U., and Baumgarten, G.: Temperature trends in the midlatitude summer mesosphere, J. Geophys. Res.-Atmos., 118, 13347–13360, https://doi.org/10.1002/2013JD020576, 2013.
Lübken, F.-J., Berger, U., and Baumgarten, G.: On the Anthropogenic Impact on Long-Term Evolution of Noctilucent Clouds, Geophys. Res. Lett., 45, 6681–6689, https://doi.org/10.1029/2018GL077719, 2018.
Mlynczak, M. G. and Solomon, S.: A detailed evaluation of the heating efficiency in the middle atmosphere, J. Geophys. Res.-Atmos., 98, 10517–10541, https://doi.org/10.1029/93JD00315, 1993.
Mlynczak, M. G., Marshall, B. T., Martin-Torres, F. J., Russell Iii, J. M., Thompson, R. E., Remsberg, E. E., and Gordley, L. L.: Sounding of the Atmosphere using Broadband Emission Radiometry observations of daytime mesospheric O2(1Δ) 1.27 μm emission and derivation of ozone, atomic oxygen, and solar and chemical energy deposition rates, J. Geophys. Res.-Atmos., 112, https://doi.org/10.1029/2006JD008355, 2007.
Mlynczak, M. G., Hunt, L. A., Mast, J. C., Marshall, B. T., Russell III, J. M., Smith, A. K., Siskind, D. E., Yee, J.-H., Mertens, C. J., Martin-Torres, F. J., Thompson, R. E., Drob, D. P., and Gordley, L. L.: Atomic oxygen in the mesosphere and lower thermosphere derived from SABER: Algorithm theoretical basis and measurement uncertainty, J. Geophys. Res.-Atmos., 118, 5724–5735, https://doi.org/10.1002/jgrd.50401, 2013.
Mlynczak, M. G., Hunt, L. A., Marshall, B. T., Mertens, C. J., Marsh, D. R., Smith, A. K., Russell, J. M., Siskind, D. E., and Gordley, L. L.: Atomic hydrogen in the mesopause region derived from SABER: Algorithm theoretical basis, measurement uncertainty, and results, J. Geophys. Res.-Atmos., 119, 3516–3526, https://doi.org/10.1002/2013JD021263, 2014.
Mlynczak, M. G., Hunt, L. A., Russell Iii, J. M., and Marshall, B. T.: Updated SABER Night Atomic Oxygen and Implications for SABER Ozone and Atomic Hydrogen, Geophys. Res. Lett., 45, 5735–5741, https://doi.org/10.1029/2018GL077377, 2018.
Mlynczak, M. G., Marshall, B. T., Garcia, R. R., Hunt, L., Yue, J., Harvey, V. L., Lopez-Puertas, M., Mertens, C., and Russell, J.: Algorithm stability and the long-term geospace data record from TIMED/SABER, Geophys. Res. Lett., 50, 1–7, https://doi.org/10.1029/2022GL102398, 2023 (data available at: https://data.gats-inc.com/saber/Version2_0/SABER_atox/, last access: 15 October 2025).
Offermann, D., Kalicinsky, C., Koppmann, R., and Wintel, J.: Very long-period oscillations in the atmosphere (0–110 km), Atmos. Chem. Phys., 21, 1593–1611, https://doi.org/10.5194/acp-21-1593-2021, 2021.
Plane, J. M. C., Gumbel, J., Kalogerakis, K. S., Marsh, D. R., and von Savigny, C.: Opinion: Recent developments and future directions in studying the mesosphere and lower thermosphere, Atmos. Chem. Phys., 23, 13255–13282, https://doi.org/10.5194/acp-23-13255-2023, 2023.
Qian, L., Jacobi, C., and McInerney, J.: Trends and Solar Irradiance Effects in the Mesosphere, J. Geophys. Res.-Space, 124, 1343–1360, https://doi.org/10.1029/2018JA026367, 2019.
Ramesh, K., Sridharan, S., and Vijaya Bhaskara Rao, S.: Influence of solar cycle and chemistry on tropical (10° N–15° N) mesopause variabilities, J. Geophys. Res.-Space, 120, 4038–4051, https://doi.org/10.1002/2014JA020930, 2015.
Ramesh, K., Mitchell, N. J., Hindley, N. P., and Moffat-Griffin, T.: Long-Term Variability and Tendencies in Mesosphere and Lower Thermosphere Winds From Meteor Radar Observations Over Esrange (67.9° N, 21.1° E), J. Geophys. Res.-Atmos., 129, e2023JD040404, https://doi.org/10.1029/2023JD040404, 2024.
Rapp, M. and Thomas, G. E.: Modeling the microphysics of mesospheric ice particles: Assessment of current capabilities and basic sensitivities, J. Atmos. Sol.-Terr. Phy., 68, 715–744, https://doi.org/10.1016/j.jastp.2005.10.015, 2006.
Remsberg, E., Damadeo, R., Natarajan, M., and Bhatt, P.: Observed Responses of Mesospheric Water Vapor to Solar Cycle and Dynamical Forcings, J. Geophys. Res.-Atmos., 123, 3830–3843, https://doi.org/10.1002/2017JD028029, 2018.
Remsberg, E. E., Marshall, B. T., Garcia-Comas, M., Krueger, D., Lingenfelser, G. S., Martin-Torres, J., Mlynczak, M. G., Russell III, J. M., Smith, A. K., Zhao, Y., Brown, C., Gordley, L. L., Lopez-Gonzalez, M. J., Lopez-Puertas, M., She, C.-Y., Taylor, M. J., and Thompson, R. E.: Assessment of the quality of the Version 1.07 temperature-versus-pressure profiles of the middle atmosphere from TIMED/SABER, J. Geophys. Res.-Atmos., 113, https://doi.org/10.1029/2008JD010013, 2008.
Roble, R. G. and Dickinson, R. E.: How will changes in carbon dioxide and methane modify the mean structure of the mesosphere and thermosphere?, Geophys. Res. Lett., 16, 1441–1444, https://doi.org/10.1029/GL016i012p01441, 1989.
Rong, P. P., Russell Iii, J. M., Mlynczak, M. G., Remsberg, E. E., Marshall, B. T., Gordley, L. L., and López-Puertas, M.: Validation of Thermosphere Ionosphere Mesosphere Energetics and Dynamics/Sounding of the Atmosphere using Broadband Emission Radiometry (TIMED/SABER) v1.07 ozone at 9.6 μm in altitude range 15–70 km, J. Geophys. Res.-Atmos., 114, https://doi.org/10.1029/2008JD010073, 2009.
Russell, J., Mlynczak, M., Gordley, L., Tansock, J., and Esplin, R.: Overview of the SABER experiment and preliminary calibration results, SPIE Proceedings, 3756, 277–288, https://doi.org/10.1117/12.366382, 1999.
Russell III, J. M., Bailey, S. M., Gordley, L. L., Rusch, D. W., Horányi, M., Hervig, M. E., Thomas, G. E., Randall, C. E., Siskind, D. E., Stevens, M. H., Summers, M. E., Taylor, M. J., Englert, C. R., Espy, P. J., McClintock, W. E., and Merkel, A. W.: The Aeronomy of Ice in the Mesosphere (AIM) mission: Overview and early science results, J. Atmos. Sol.-Terr. Phy., 71, 289–299, https://doi.org/10.1016/j.jastp.2008.08.011, 2009.
Schwartz, M., Froidevaux, L., Livesey, N., and Read, W.: MLS/Aura Level 2 Ozone (O3) Mixing Ratio V005, Greenbelt, MD, USA, Goddard Earth Sciences Data and Information Services Center (GES DISC) [data set], https://doi.org/10.5067/Aura/MLS/DATA2516, 2020a.
Schwartz, M., Livesey, N., and Read, W.: MLS/Aura Level 2 Temperature V005, Greenbelt, MD, USA, Goddard Earth Sciences Data and Information Services Center (GES DISC) [data set], https://doi.org/10.5067/Aura/MLS/DATA2520, 2020b.
Shi, G., Krochin, W., Sauvageat, E., and Stober, G.: Ozone and water vapor variability in the polar middle atmosphere observed with ground-based microwave radiometers, Atmos. Chem. Phys., 23, 9137–9159, https://doi.org/10.5194/acp-23-9137-2023, 2023.
Siskind, D. E., Marsh, D. R., Mlynczak, M. G., Martin-Torres, F. J., and Russell III, J. M.: Decreases in atomic hydrogen over the summer pole: Evidence for dehydration from polar mesospheric clouds?, Geophys. Res. Lett., 35, https://doi.org/10.1029/2008GL033742, 2008.
Siskind, D. E., Merkel, A. W., Marsh, D. R., Randall, C. E., Hervig, M. E., Mlynczak, M. G., and Russell III, J. M.: Understanding the effects of polar mesospheric clouds on the environment of the upper mesosphere and lower thermosphere, J. Geophys. Res.-Atmos., 123, 11705–11719, https://doi.org/10.1029/2018JD028830, 2018.
Siskind, D. E. and Stevens, M. H.: A radiative feedback from an interactive polar mesospheric cloud parameterization in a two dimensional model, Adv. Space Res., 38, 2383–2387, https://doi.org/10.1016/j.asr.2005.03.094, 2006.
Smith, A. K. and Marsh, D. R.: Processes that account for the ozone maximum at the mesopause, J. Geophys. Res.-Atmos., 110, https://doi.org/10.1029/2005JD006298, 2005.
Smith, A. K., Garcia, R. R., Marsh, D. R., Kinnison, D. E., and Richter, J. H.: Simulations of the response of mesospheric circulation and temperature to the Antarctic ozone hole, Geophys. Res. Lett., 37, https://doi.org/10.1029/2010GL045255, 2010a.
Smith, A. K., Marsh, D. R., Mlynczak, M. G., and Mast, J. C.: Temporal variations of atomic oxygen in the upper mesosphere from SABER, J. Geophys. Res.-Atmos., 115, https://doi.org/10.1029/2009JD013434, 2010b.
Smith, A. K., Garcia, R. R., Marsh, D. R., and Richter, J. H.: WACCM simulations of the mean circulation and trace species transport in the winter mesosphere, J. Geophys. Res.-Atmos., 116, https://doi.org/10.1029/2011JD016083, 2011.
Smith, A. K., Harvey, V. L., Mlynczak, M. G., Funke, B., García-Comas, M., Hervig, M., Kaufmann, M., Kyrölä, E., López-Puertas, M., McDade, I., Randall, C. E., Russell III, J. M., Sheese, P. E., Shiotani, M., Skinner, W. R., Suzuki, M., and Walker, K. A.: Satellite observations of ozone in the upper mesosphere, J. Geophys. Res.-Atmos., 118, 5803–5821, https://doi.org/10.1002/jgrd.50445, 2013.
Smith, A. K., Espy, P. J., López-Puertas, M., and Tweedy, O. V.: Spatial and Temporal Structure of the Tertiary Ozone Maximum in the Polar Winter Mesosphere, J. Geophys. Res.-Atmos., 123, 4373–4389, https://doi.org/10.1029/2017JD028030, 2018.
SOFIE: The Solar Occultation for Ice Experiment data (level 2), SOFIE [data set], http://sofie.gats-inc.com/getdata (last access: 15 October 2025), 2023.
Solomon, S. C., Liu, H.-L., Marsh, D. R., McInerney, J. M., Qian, L., and Vitt, F. M.: Whole Atmosphere Simulation of Anthropogenic Climate Change, Geophys. Res. Lett., 45, 1567–1576, https://doi.org/10.1002/2017GL076950, 2018.
Vellalassery, A., Baumgarten, G., Grygalashvyly, M., and Lübken, F.-J.: Greenhouse gas effects on the solar cycle response of water vapour and noctilucent clouds, Ann. Geophys., 41, 289–300, https://doi.org/10.5194/angeo-41-289-2023, 2023.
Venkateswara Rao, N., Espy, P. J., Hibbins, R. E., Fritts, D. C., and Kavanagh, A. J.: Observational evidence of the influence of Antarctic stratospheric ozone variability on middle atmosphere dynamics, Geophys. Res. Lett., 42, 7853–7859, https://doi.org/10.1002/2015GL065432, 2015.
Vincent, R. A., Kovalam, S., Murphy, D. J., Reid, I. M., and Younger, J. P.: Trends and Variability in Vertical Winds in the Southern Hemisphere Summer Polar Mesosphere and Lower Thermosphere, J. Geophys. Res.-Atmos., 124, 11070–11085, https://doi.org/10.1029/2019JD030735, 2019.
von Zahn, U. and Berger, U.: Persistent ice cloud in the midsummer upper mesosphere at high latitudes: Three-dimensional modeling and cloud interactions with ambient water vapor, J. Geophys. Res.-Atmos., 108, https://doi.org/10.1029/2002JD002409, 2003.
Zhang, L., Liu, Z., and Tinsley, B.: Altitude-dependent formation of polar mesospheric clouds: charged nucleation and in situ ice growth on zonal and daily scales, Atmos. Chem. Phys., 25, 12701–12719, https://doi.org/10.5194/acp-25-12701-2025, 2025a.
Zhang, L., Liu, Z., and Tinsley, B.: Height-Latitude Patterns of Interannual Climate Variability in the Upper Mesosphere and Lower Thermosphere During Spring and Autumn Months, Geophys. Res. Lett., 52, e2025GL116281, https://doi.org/10.1029/2025GL116281, 2025b.
Zhang, W., Chen, G., Zhang, S., Gong, W., Chen, F., He, Z., Huang, K., Wang, Z., and Li, Y.: Statistical Study of the Midlatitude Mesospheric Vertical Winds Observed by the Wuhan and Beijing MST Radars in China, J. Geophys. Res.-Atmos., 125, e2020JD032776, https://doi.org/10.1029/2020JD032776, 2020.