the Creative Commons Attribution 4.0 License.
the Creative Commons Attribution 4.0 License.
 | 21 Oct 2025
Impact of cirrus on extratropical tropopause structure
Annette K. Miltenberger
Peter M. Hoor
Andreas Petzold
Diabatic processes are essential in shaping the thermodynamic and chemical structure of the extratropical transition layer (ExTL). Cirrus may play a vital role due to associated latent heating and its influence on radiative and turbulent properties. Here we present for the first time a combination of in situ observations of the ExTL thermodynamic structure inside and outside cirrus using a dual-platform approach during the AIRTOSS-ICE campaign and a Lagrangian analysis based on high-resolution simulations. Earlier analysis by Müller et al. (2015) suggests cirrus formation in stratospherically influenced air based on measured N2O mixing ratios. The dual-platform approach reveals substantial disturbances in the vertical profile of potential temperature with a weakened stratification inside the cirrus and sharpening above.
Lagrangian analysis based on high-resolution ICON simulations suggests that cirrus-related radiative cooling and latent heating are essential for the formation of the observed perturbed potential temperature profile. Radiative cooling and to a lesser degree turbulent heat and momentum transport result in substantial potential vorticity (PV) production in the upper part of the cirrus and a steepening of the vertical potential vorticity gradient. The simulation reproduces key aspects of the observations and the larger-scale evolution as evident from satellite and radiosonde data. Our analysis further indicates that the cirrus particles formed in an already moist ExTL air mass over southern Germany about 12 h before being sampled over the North Sea.
Our findings underline the importance of diabatic cloud processes for the thermodynamic structure of the ExTL and potential cross-tropopause exchange.
- Article
(12732 KB) - Full-text XML
-
Supplement
(3966 KB) - BibTeX
- EndNote


The upper troposphere/lower stratosphere (UTLS) region plays an important role for the radiation budget of the atmosphere. Riese et al. (2012) and Forster and Shine (2002) showed the high sensitivity of this region to changes in composition, especially in ozone and water vapor, which is affected by irreversible exchange processes between the troposphere and the stratosphere. Subject to these exchange processes is the formation of the extratropical transition layer (ExTL, WMO (World Meteorological Organization), 2002) or “mixing layer” (Danielsen, 1968; Hoor et al., 2002; Fischer et al., 2000). The ExTL constitutes a layer above the extratropical dynamical tropopause (typically identified as the 2 pvu isoline of potential vorticity), i.e., around the thermal tropopause, where the composition is directly influenced by the extratropical troposphere (Hoor et al., 2004; Pan et al., 2004; Hegglin et al., 2009; Zahn et al., 2014; Petzold et al., 2020). It is affected by transient and frequent mixing events leading to varying strengths of gradients in composition, connecting typical tropospheric and stratospheric values of various trace gases. Transport into this layer occurs mainly through three different pathways (e.g., Holton et al., 1995; Gettelman et al., 2011) with seasonally varying contributions (Hoor et al., 2005; Bönisch et al., 2009): (i) quasi-isentropic exchange from the tropical upper troposphere across the subtropical jets (e.g., Ray et al., 1999; Haynes and Shuckburgh, 2000), (ii) diabatic downward transport from the stratospheric overworld as part of the global stratospheric overturning circulation (Brewer–Dobson circulation, BDC, Butchart, 2014), and (iii) stratosphere–troposphere exchange (STE) across the extratropical tropopause (e.g., Sprenger and Wernli, 2003; Škerlak et al., 2014; Stohl et al., 2003; Engel et al., 2006). STE can be diagnosed by analysis of the chemical composition. Various trace gases with sources in either the troposphere or the stratosphere such as N2O, H2O, CO, or O3 exhibit sharp vertical gradients in the ExTL as do aerosol or cirrus particles, and therefore varying strength of the gradients potentially indicates STE (Joppe et al., 2024; Pan and Munchak, 2011).
Notably, isentropic composition gradients potentially indicate the effect of irreversible transport and subsequent mixing (Kunkel et al., 2019; Lachnitt et al., 2023). Since potential temperature and potential vorticity are conserved quantities under adiabatic conditions, the processes involved in the formation of the ExTL have to be of diabatic nature, i.e., related to turbulence, latent heating, or radiative processes. Turbulence at the dynamical tropopause can result in STE due to the associated irreversible mixing. Waves on planetary and synoptic scales, as well as the breaking of gravity waves, can lead to horizontal and vertical wind shear, thereby favoring the occurrence of turbulence in the tropopause region (Kunkel et al., 2019; Kaluza et al., 2021). Convection also may generate gravity-wave-induced shear, turbulence, and mixing across the tropopause (e.g., Mullendore et al., 2005; Homeyer, 2015; Homeyer et al., 2017) and thereby transport of large amounts of water into the UTLS. Latent heating due to phase changes of water during cloud formation alters local temperatures, thermal stratification, and potential vorticity (PV). Radiative processes likewise alter the local temperature, and in regions with vertical gradients in optical properties of the atmosphere, e.g., through gradients in chemical composition or at cloud boundaries (Forster and Shine, 2002), they impact the thermal stratification and PV. The alteration of thermal stratification and PV can result in the transfer of air between the stratosphere and the troposphere or vice versa. Furthermore, local temperature changes through latent or radiative heating can foster buoyancy-driven turbulence (e.g., Spichtinger, 2014) and promote mixing. The occurrence of turbulence and cirrus clouds in the region of the dynamical tropopause may therefore be key to quantifying STE (Spreitzer et al., 2019) and to understanding the spatiotemporal variability of ExTL properties.
The dynamical environment and microphysical properties of cirrus clouds impact cirrus latent and radiative heating profiles and therefore their role in STE and the ExTL structure. In particular, the microphysical properties of cirrus clouds have been suggested to depend on the cirrus formation mechanism, which can be divided into (at least) two categories (Krämer et al., 2016). (i) Liquid-origin cirrus forms by freezing of liquid cloud droplets transported to cold temperatures from the lower, much warmer troposphere. This type of cirrus tends to form in updrafts extending over a large fraction of the tropospheric depth (e.g., warm conveyor belts, Wernli et al., 2016, or deep convection). In contrast, (ii) in situ cirrus forms by ice nucleation at temperatures below 235 K without the air becoming saturated with respect to liquid water. Hence, in situ cirrus is typically encountered at very cold temperatures and slow to moderate updrafts. Thus, in situ cirrus is more likely to be found in close proximity to the dynamical tropopause than liquid-origin cirrus. The properties of in situ cirrus can further vary according to updraft speed (Krämer et al., 2016): slow updrafts associated with frontal systems lead to low ice water content and long lifetimes, while fast updraft causes higher ice water content and shorter lifetime.
There have been few observations of ice particles above the dynamical or thermal tropopause (e.g., Keckhut et al., 2005; Pan and Munchak, 2011; Müller et al., 2015; Rolf et al., 2012). Cirrus particles in the ExTL could be the result of extratropical stratosphere–troposphere exchange. However, they could also form from previous water vapor injections and subsequent adiabatic cooling by further uplift or advection to colder regions. Long range transport from low latitudes is highly unlikely since temperatures at the tropical tropopause layer (TTL) are lower than in the midlatitudes, and saturated air passing the TTL would not be saturated anymore once it reaches the midlatitudes (Newell, 1982; Dessler et al., 1995). Satellite-based observations of ExTL cirrus have been made (Zou et al., 2020), for example, with Lidar (CALIOP; Avery et al., 2012) or limb sounding measurements (MIPAS, Fischer et al., 2008; CRISTA, Spang et al., 2015). Despite the fast spatiotemporal coverage of the observations, an essential disadvantage of these remote sensing methods is the low vertical resolution and the reliance on reanalysis models to determine the tropopause height, which makes it difficult to analyze STE associated with small-scale processes.
In contrast, Müller et al. (2015) presented a case showing extratropical cirrus occurrence in (chemically) stratospheric air utilizing simultaneous aircraft-based in situ measurements of ice particles and N2O mixing ratios. The measurements were taken during the AIRTOSS-ICE campaign in 2013 over northern Germany. For the localization of the observed ice particles in the ExTL, Müller et al. (2015) use N2O measurements to determine a chemical tropopause. They argue that negative deviations from the tropospheric background mixing ratios in N2O can only be explained by irreversible mixing with stratospheric air. On one occasion, measurements of ice particles coincided with N2O levels below the tropospheric background values. Backward air mass trajectories calculated on the basis of ECMWF operational analysis data suggest an uplift across the 2 pvu isosurface in the 3 h before the measurements. The Lagrangian analysis further indicated that the ice particle formation occurred during slow ascent in the upper troposphere and subsequent transport into the lower stratosphere.
In this study we extend the analysis of Müller et al. (2015) by newly available Lagrangian diagnostics with much higher temporal and especially vertical resolution based on ICON simulations (Miltenberger et al., 2020). The simulations include diabatic tendencies to gain insight into the formation of the observed stratospheric cirrus as well as its impact on the tropopause and ExTL structure.
Corresponding to the higher model resolution we extended the measurement data presented in Müller et al. (2015) by simultaneous measurement data from a second platform (the TOSS, Frey et al., 2009; Klingebiel et al., 2017). These additional data allow for the calculation of vertical gradients of temperature and potential temperature, i.e., static stability.
The model-based hypothesis about cirrus formation and cirrus impact on ExTL structure are supported by comparison with the in situ measurements as well as additional observational data, i.e., satellite observations of cirrus evolution and radiosonde measurements of the thermodynamic structure at upstream locations.
In particular, the research presented in this study addresses the following questions:
- 1.
What is the thermodynamic structure associated with ExTL cirrus occurrence?
- 2.
Where and how do the observed stratospheric cirrus particles form?
- 3.
Does the cirrus cloud modify the local ExTL (thermo)dynamical structure?
The paper is structured as follows. We will first give a short overview about the observations and model tools in Sect. 2. Section 3 contains a short overview of the synoptic situation, presents observations of the thermodynamic structure and the cirrus occurrence with respect to the tropopause on the basis of the simultaneous observations from the TOSS and the aircraft, and compares the ICON model thermodynamic structure in the measurement region to the in situ data. In Sect. 4 the model-based Lagrangian history of the measured air mass, the cirrus formation mechanism, and the cirrus impact on the ExTL thermodynamic structure are discussed. Section 5 presents satellite observations and radiosonde data in locations upstream of the measurement region to provide evidence for the plausibility of the modeled air mass history. Finally, we close with a summary and brief discussion of our main findings in Sect. 6.
2.1 In situ measurements
Measurements were carried out during the AIRTOSS-ICE campaign with a Learjet G35A of the Gesellschaft für Flugzieldarstellung (GFD) from Hohn, Germany. The aircraft was equipped with the University of Mainz Airborne QCL Spectrometer (UMAQS), an infrared absorption spectrometer which provided N2O and CO data with a total uncertainty of 0.39 ppbv for N2O and 1.40 ppbv for CO at a measurement frequency of 1 Hz. Details regarding the UMAQS instrument can be found in Müller et al. (2015).
As a unique extension of the measurement setup the aircraft is equipped with the AIRcraft TOwed Sensor Shuttle (AIRTOSS, namesake of the campaign, in the following abbreviated as TOSS). The TOSS constitutes a second measurement platform towed by the Learjet with a vertical distance of typically between 70 and 180 m. The TOSS was released at the first level after takeoff and carries additional lightweight measurement devices, which are partly redundant to the instrumentation on the Learjet and therefore allow the calculation of vertical gradients of the measured quantities as schematically depicted in Fig. 1. These redundant measurements include in particular temperatures and cloud particle number concentrations as well as size distributions. The particles at the TOSS were measured by the Cloud Combination Probe and Cloud Droplet Probe (CCP–CDP) instrument in a size range between 2 and 50 µm (Klingebiel et al., 2017). Particle measurements on board the Learjet were taken by a FSSP (Forward Scattering Spectrometer Probe) in a size range between 2 and 47 µm (Dye and Baumgardner, 1984). In this study both instruments will be used as cloud indicators. Temperature and humidity measurements were taken by two capacitive hygrometers on the Learjet and TOSS, respectively (ICH sensors) (Neis et al., 2015b). This sensor type is part of the IAGOS measurement instrumental packages and has been evaluated in Neis et al. (2015a, b), with estimates of accuracy and precision for temperature and humidity of ±0.5 K and 5 % RHliquid.
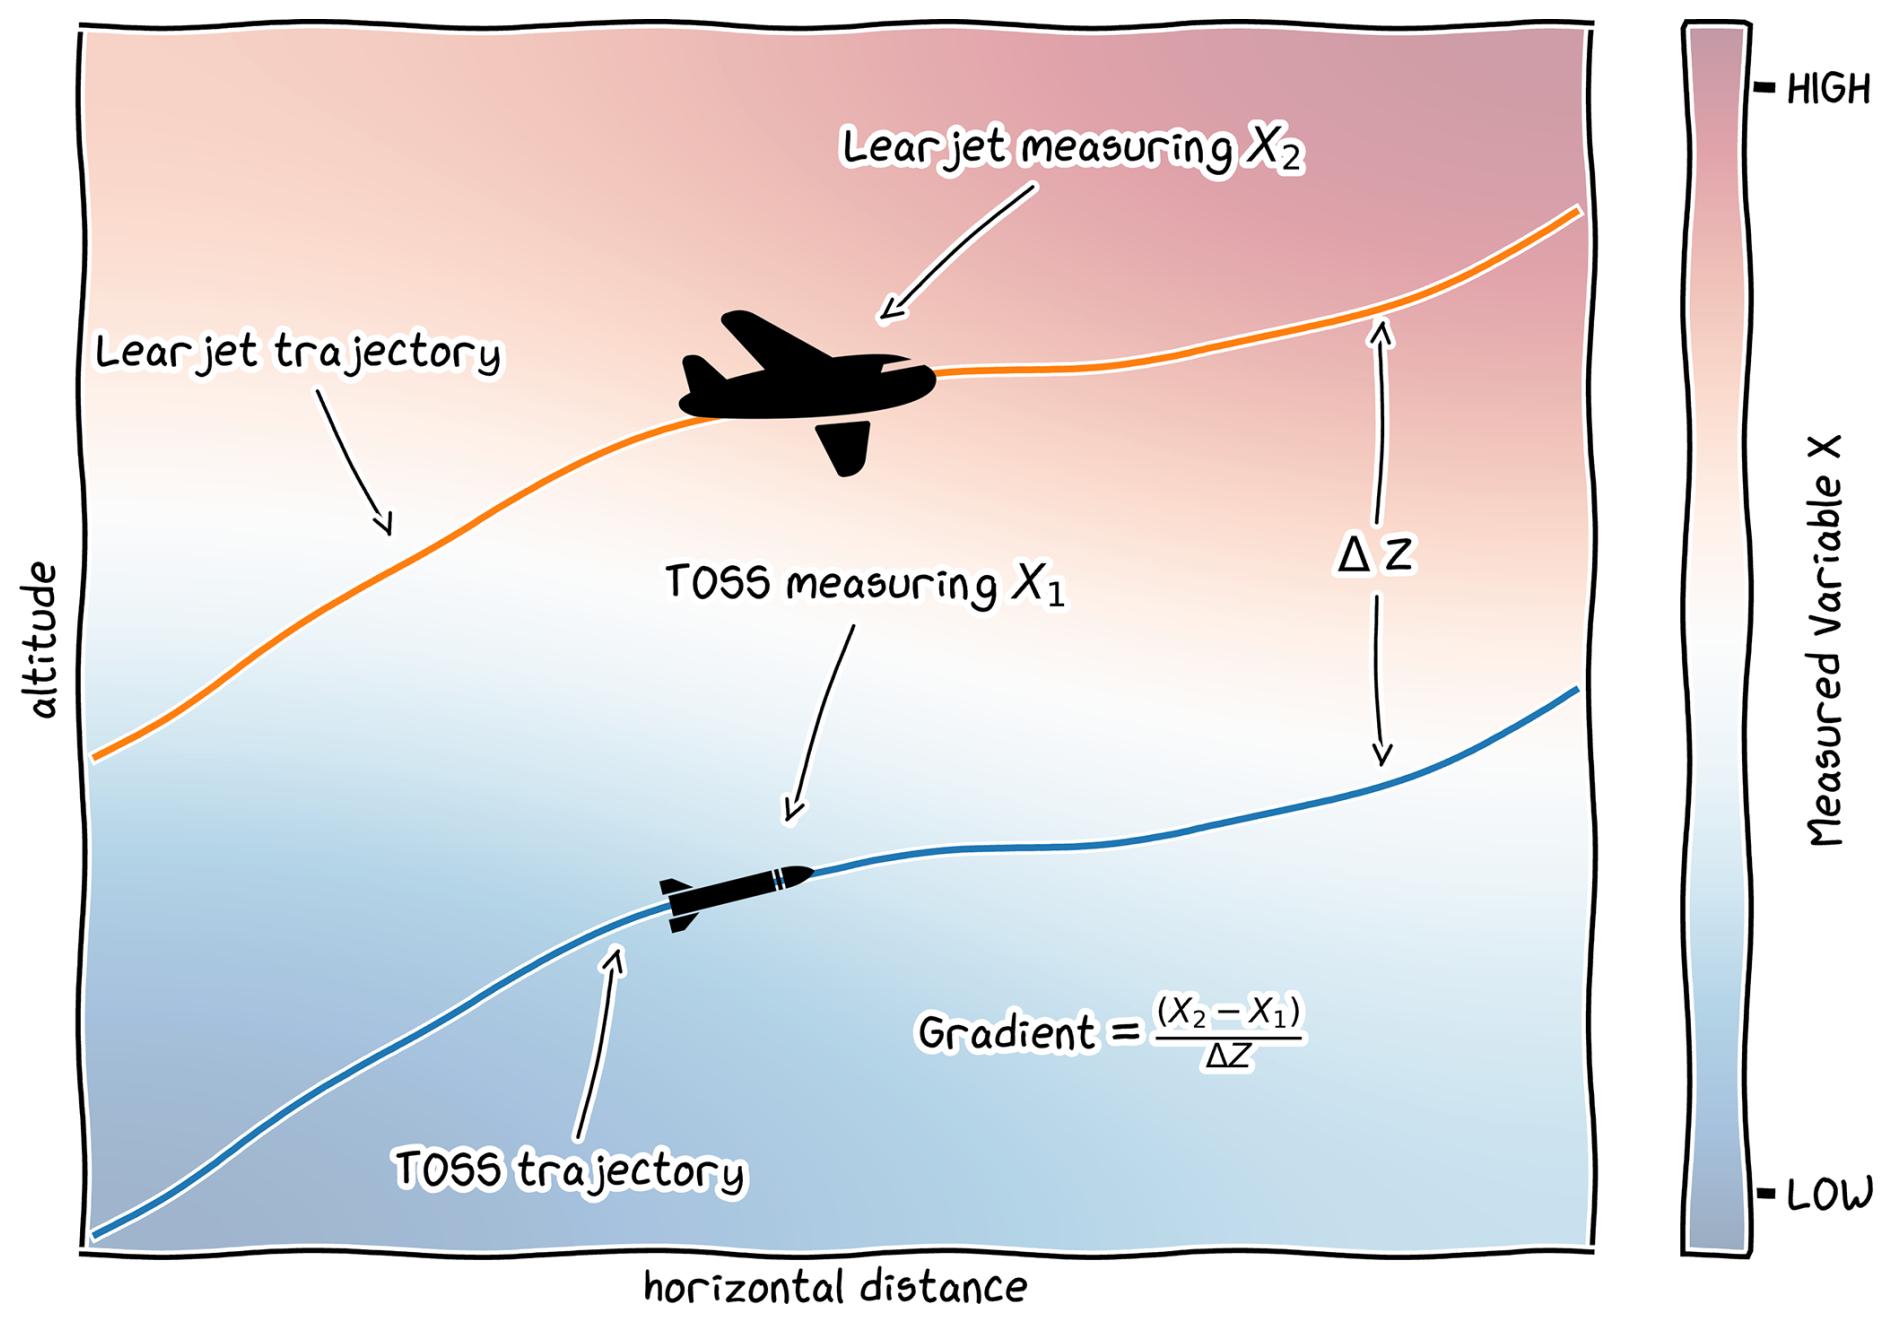
Figure 1Schematic representation of the dual-platform approach for the simultaneous measurement at two levels and calculation of vertical gradients. Background colors represent an arbitrary air mass property changing from low to high values at the tropopause, which can be measured simultaneously by the two platforms.
Potential temperature at the Learjet is calculated from the temperature measurements of the ICH sensor and the static pressure from the altimeter of the Learjet. The pressure at the TOSS was not measured directly and had to be calculated under the assumption of hydrostatic equilibrium from the pressure at the Learjet and the vertical distance between the two platforms derived from GPS data. Relative humidity was derived from the H2O mixing ratios measured by the SEALDH-II instrument with an uncertainty of ±1 ppmv H2O for the condition encountered in this study (Buchholz and Ebert, 2018). During flight level changes and turns, the airstream towards the TOSS inlets is perturbed and subject to turbulence. This leads to flow conditions outside the envelope of the normal flight operation and unknown effects on temperature and humidity measurements. In the following we therefore only use data from horizontal flight legs with well-defined flow around the sensors.
2.2 Model simulations
For a detailed analysis of the water vapor distribution, transport pathways, and cloud formation, simulations with the numerical weather prediction model ICON version 2.6.2 have been conducted (Zängl et al., 2015). Two model simulations have been conducted and were initialized from the ECMWF (IFS) operational analysis at 12:00 UTC on 6 May 2013 and 00:00 UTC on 7 May 2013, respectively. Integration stops at 00:00 UTC on 8 May 2013. A global simulation on a R3B7 grid (effective grid spacing ≈ 13 km) is refined with two two-way interactive nested grids over central Europe (Zängl et al., 2022). The two nests use R3B8 and R3B9 grids with effective grid spacings of ≈ 6.5 and ≈ 3.25 km, respectively. In the vertical, 150 model levels between the surface and 23 km altitude are used, the spacing of which follows terrain-following smooth level vertical (SLEVE) coordinates (Leuenberger et al., 2010). This results in a vertical grid spacing of about 165 m (200 m) at 10 km (12 km) altitude. A time step of 12 s (6 s; 3 s) is used for the integration of the model on the three grids. Sub-grid-scale processes are described by the following parameterizations: the Tiedtke–Bechtold convection scheme (deep convection in the global domain only, Tiedtke, 1989; Bechtold et al., 2008; ECMWF, 2016), turbulence following Raschendorfer (2018), sub-grid-scale orographic drag following Lott and Miller (1997), non-orographic gravity wave drag following Orr et al. (2010), cloud processes by the double-moment scheme from Seifert and Beheng (2006), and radiation by the ecRad scheme (Hogan and Bozzo, 2018).
Lagrangian analysis is facilitated by the computation of online trajectories during the simulation (Miltenberger et al., 2020; Oertel et al., 2023). Online trajectories are calculated based on the resolved wind field on the native grid and time step of the ICON model in the best-resolved nest at a given geolocation. Trajectories are started at model initialization at all grid points and vertical levels between 500 m and 15 km in three sub-regions: −2 to 5° E and 47 to 52° N, 3 to 12° E and 43 to 48.5° N, and 10 to 18° E and 46 to 50° N. The regions have been selected on the basis of backward offline trajectories calculated from the ICON wind fields at 15 min resolution with LAGRANTO (Sprenger and Wernli, 2015). In total about 6.1 million online trajectories have been computed. Output of (thermo)dynamic variables as well as integrated potential vorticity (PV), potential temperature (θ), and selected moisture tendencies are available every 10 min along the trajectories. For further analysis, we have selected trajectories that pass through the area of Learjet measurements (6.5 to 7.5° E and 54.2 to 55.2° N, 8 to 12 km altitude) between 14:00 and 16:00 UTC on 7 May 2013.
3.1 Synoptic situation
The synoptic situation on the day before the flight, i.e., 6 May 2013, is characterized by southerly flow over Germany associated with a ridge and weak trough at its western flank. Until the time of measurement the ridge shifted slightly towards the east, but southerly flow still prevailed over Germany. The trough developed into a filament accompanied by streamers of stratospheric air and filaments of dry air between an approaching weak cyclonic system from the west and the eastward-shifted ridge. An associated elongated PV filament extended southwards to central Italy. In connection with the southerly flow at the western flank of the ridge high humidity is transported to the north, just adjacent to the dry filament, leading to strong humidity gradients in the upper troposphere over western Germany. Satellite images suggest that optically thin cirrus clouds form in the humid southeasterly flow at the western edge of the ridge over southern Germany and are advected to the North Sea region (see Sect. 5). Convective activity in the afternoon of 6 May and the morning of 7 May over eastern Germany and eastern Europe extending northwards from the Baltics may have contributed to the moistening of the ridge, albeit likely with no direct contribution to the ExTL cirrus discussed here (see also Sect. 4). However, the optically thick upper-tropospheric cirrus below the ExTL is likely partly linked to this convection (see Fig. A2). Furthermore, in the early morning of 7 May some deep clouds formed over the Benelux region, likely influencing upper-tropospheric humidity westwards of the stratospheric filament.
3.2 Observed temperature, humidity, and cloud structure of the UTLS
The section of the flight path considered in this study is depicted in Fig. 2, with the occurrence of cirrus particles marked in orange for the TOSS platform and yellow for the Learjet. The measurements show an extended cirrus deck, with its upper edge initially localized between the two measurement platforms until the Learjet also reaches the cloud top at around 55.0° N, 7.2° E. We focus on a short section from 15:08:00 UTC, when ice particles are first measured at the TOSS, to 15:16:00 UTC, before the Learjet changes altitude to the next, higher, flight leg. This section of the flight took place on a pressure level of 250 hPa and is considered to be in the stratosphere since N2O mixing ratios never reached tropospheric values of 325.9 ppbv (Fig. 3a, upper panel) as also discussed in Müller et al. (2015). This is consistent with PV values of 2–4 pvu indicated by ERA5 analysis at the location of the aircraft (Fig. 3a, second panel). The thermal tropopause, derived from the temperature profile during the descent of the Learjet as depicted in Fig. 3b, left panel, had an altitude of 10.35 km, which is below the level of cirrus measurements at the Learjet with an altitude of 10.4 km. Note, however, that the temperature profile was recorded several minutes after the cirrus occurrence. The third panel in Fig. 3a shows the potential temperature measured by the Learjet (blue) and TOSS (green) along the flight segment and an indication of observed ice particles by the gray and black circles. Over the entire considered time period, cirrus particles were measured at the TOSS at a potential temperature of up to θ = 320 K. At the beginning of this flight section the Learjet was located above the cirrus deck at a potential temperature of θ = 322 K. During the horizontal (i.e., isobaric) flight leg, the potential temperature at the position of the Learjet decreased slowly over time, while the potential temperature at the TOSS varied around θ = 320 K. At the time when cirrus particles were also measured at the Learjet, the potential temperature reached θ = 320 K as well.
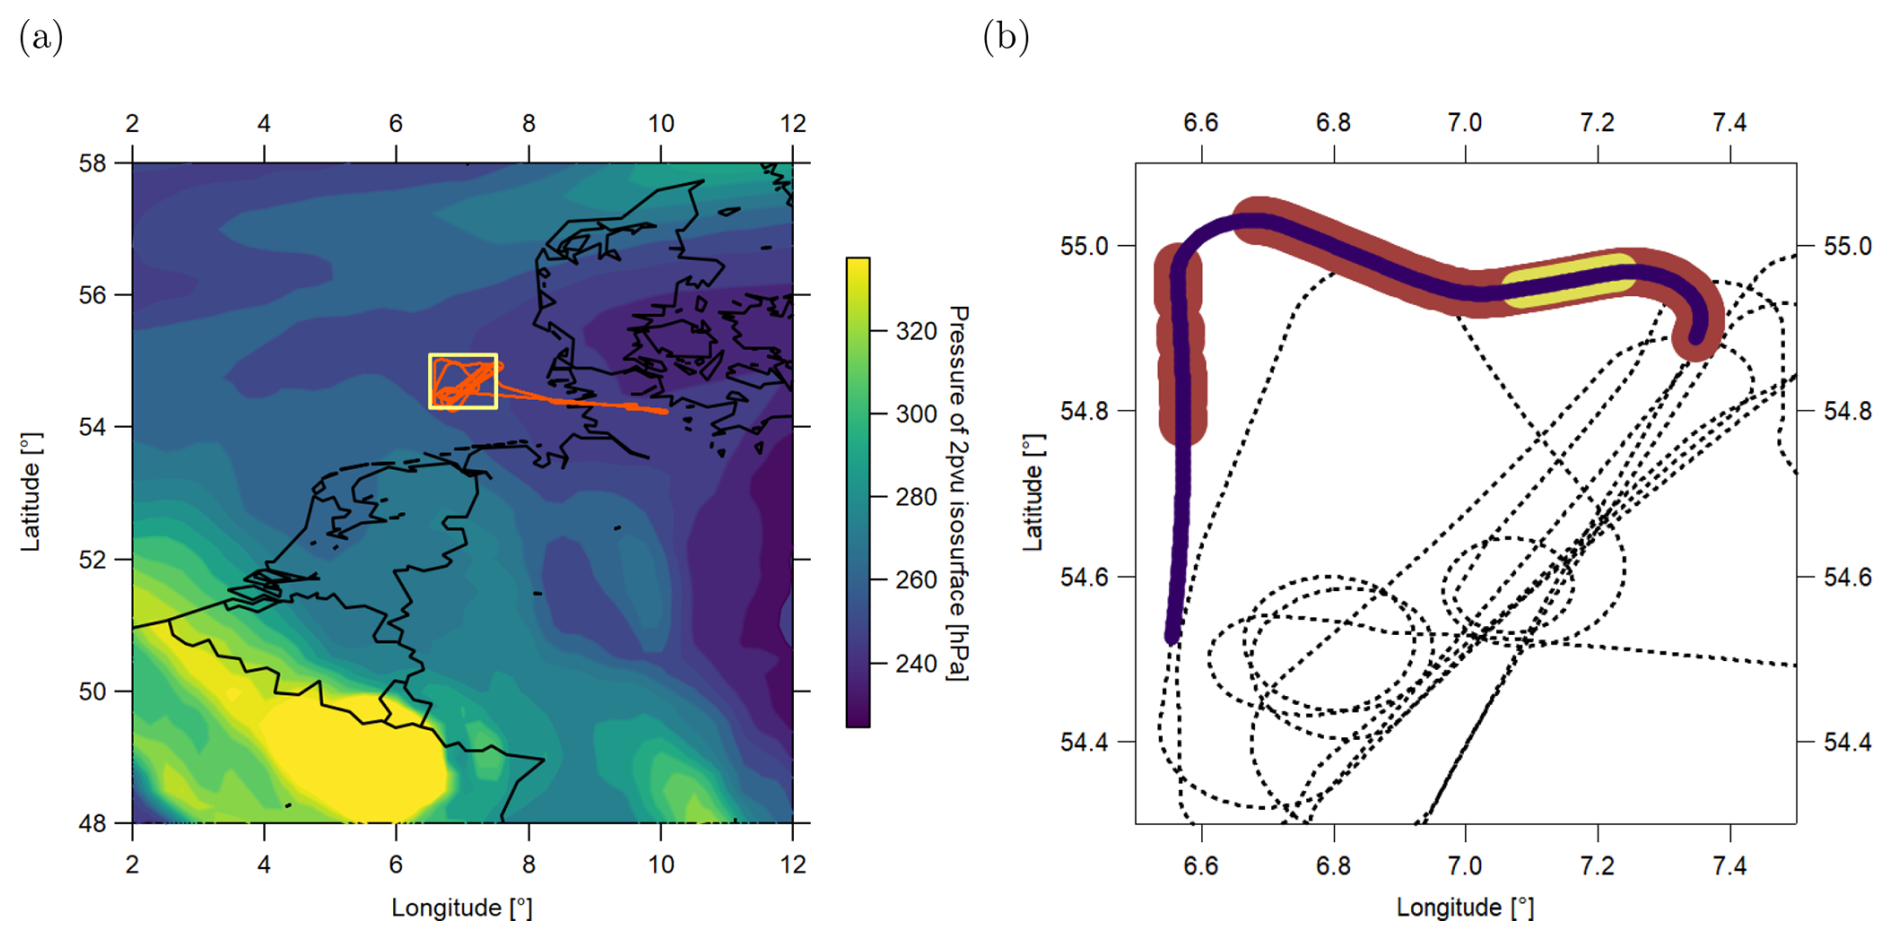
Figure 2(a) Geographic location of the flight path (orange) on 7 May 2013. Measurement area (between 6.5–7.6° E and 54.3–55.1° N) marked in yellow. Colors: pressure on 2 pvu isosurface at time of measurement (ERA5). (b) Flight path for the analyzed flight limited to the measurement area. The flight section considered in this analysis is highlighted in purple. Cirrus occurrence measured at the Learjet (TOSS) is marked in yellow (orange).
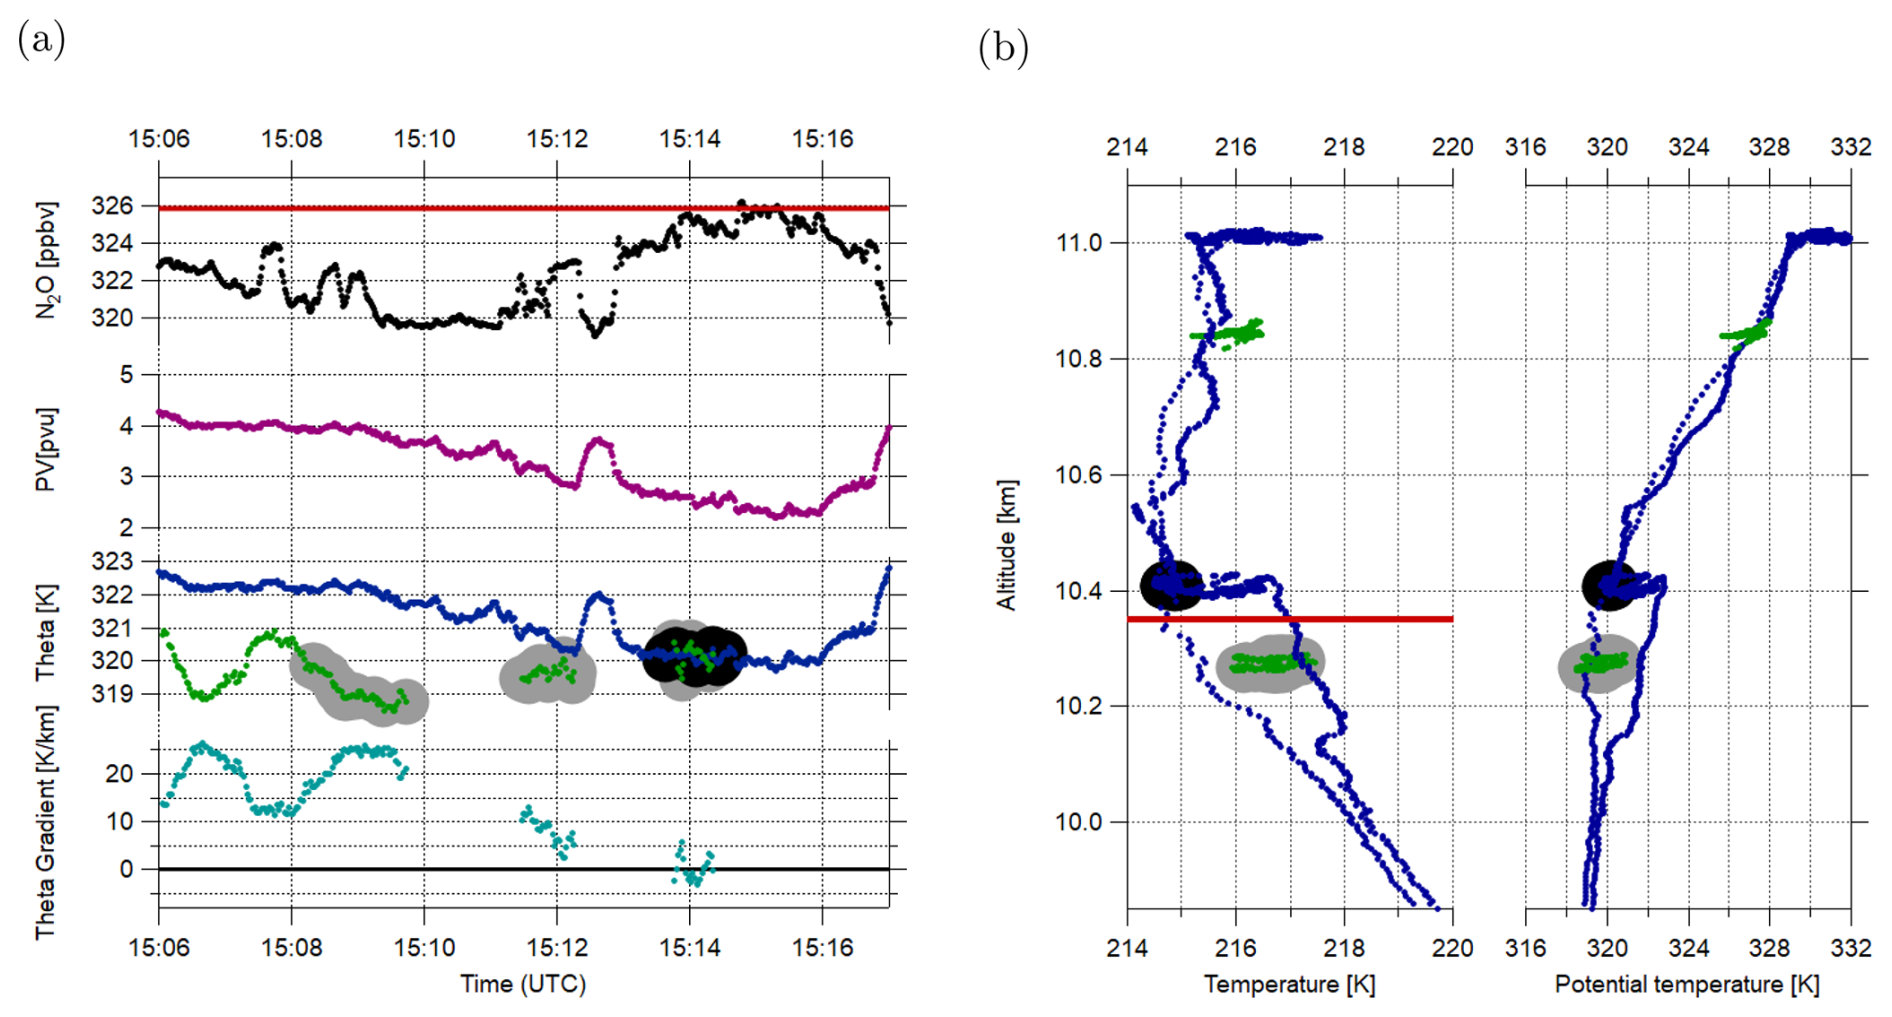
Figure 3(a) Time series of N2O at the Learjet (black) with the chemical N2O tropopause indicated by the red line; PV at the Learjet, interpolated on the flight track from ERA5 reanalysis data (magenta); and potential temperature at the Learjet (blue) and TOSS (green) and gradient of potential temperature Θ (teal). Gray (black) underlay shows the encounter of ice particles at the TOSS (Learjet). (b) Vertical profiles of temperature (left) and potential temperature (right) for the Learjet (blue) and TOSS (green). Gray (black) underlay shows the encounter of ice particles at the TOSS (Learjet). The thermal tropopause, derived from the descent temperature profile, is marked in red.
The combined TOSS and Learjet measurements allow for the derivation of the vertical temperature gradient above and in the cirrus, which is shown in the bottom panel of Fig. 3a. Over the considered flight section, the vertical distance between the TOSS and the Learjet was constant. At 15:08:00 UTC a positive vertical gradient of potential temperature was measured, i.e., higher potential temperatures above the cirrus deck then within, as expected in the stratosphere and consistent with the vertical profile (Fig. 3b, right panel). However, inside the cirrus (at ≈ 15:14:00 UTC, where both platforms measured cirrus particles) the gradient of potential temperature vanishes. Hence, the measurements indicate different regimes of static stability: neutral stratification inside the cirrus and, starting at the cirrus top, high static stability above the cirrus.
Correlations of CO and N2O measurements are shown in Fig. 4, colored with potential temperature (a) and relative humidity with respect to ice (b). The two species show compact mixing lines typical for the ExTL, connecting typical values of mixing ratios for the troposphere with such typical for a reservoir deeper in the stratosphere for both species, thereby indicating irreversible mixing. The mixing line with lower N2O mixing ratios corresponds to the western part of the flight section at about 6.6° E, which is not influenced by the cirrus at the Learjet level, albeit showing cirrus occurrence at the TOSS (see Fig. 2). Values of relative humidity with respect to ice based on measurements of H2O mixing ratios, temperature, and pressure at the Learjet do not exceed 70 % in this segment of the flight (Fig. 4b). However, on the mixing line with higher N2O mixing ratios, corresponding to the flight segment with cirrus occurrence at the Learjet level, relative humidity exceeds saturation (RHice ≥ 100 %) inside the cirrus and reaches up to RHice = 140 % in close vicinity to the cirrus in clear air. The highest values of relative humidity coincide with the lowest potential temperature (Fig. 4a) during the entire flight leg. The presence of two distinct mixing lines suggests a different air mass history in terms of the occurrence of mixing events and contributing air masses for air above and in the cirrus layer.
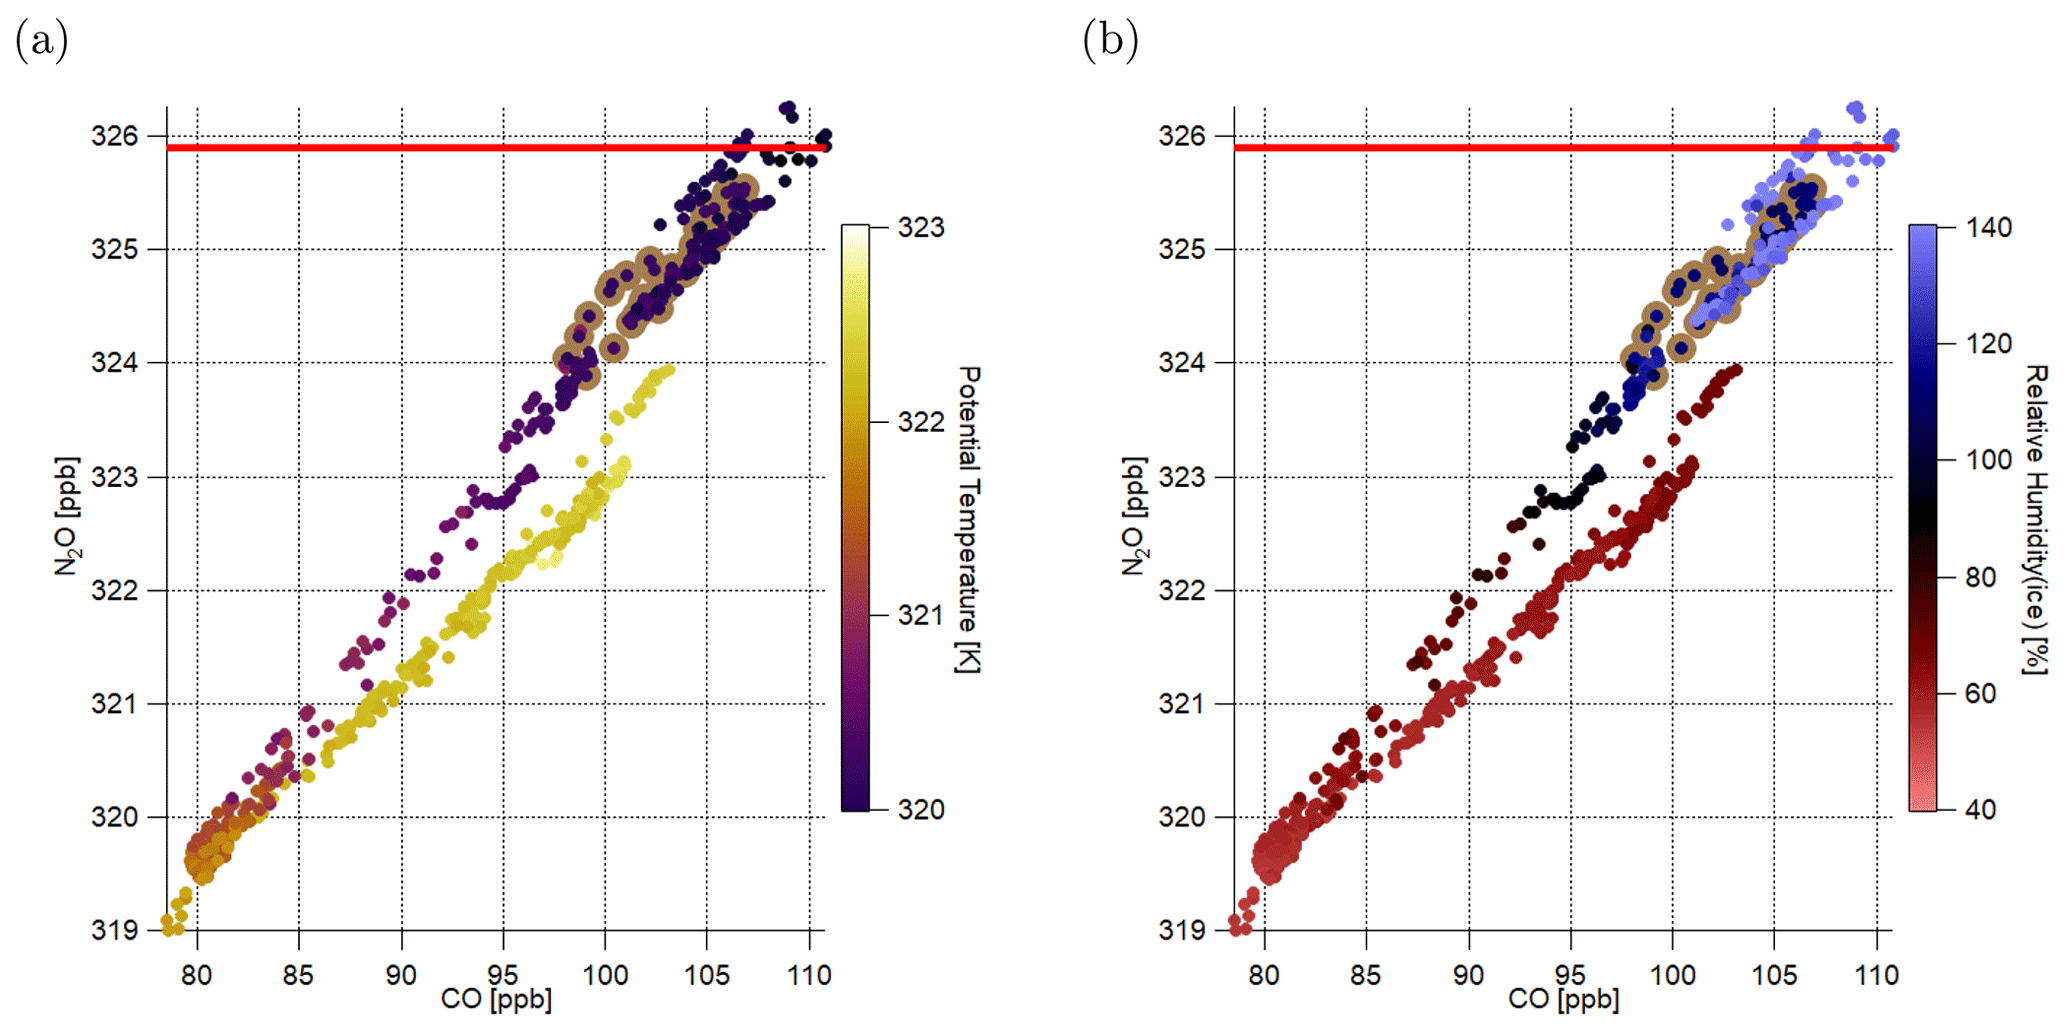
Figure 4Scatterplots of N2O versus CO color coded with (a) potential temperature and (b) relative humidity with respect to ice. Brown circles indicate cirrus occurrence. Each quantity measured at the Learjet level. The N2O-defined tropopause at 325.9 ppbv is marked as a red line with lower N2O mixing ratios implying stratospheric air.
In summary, during AIRTOSS-ICE, observations of a cirrus cloud located in an air mass with a distinct stratospheric chemical signature were obtained. The direct measurement of stratification inside the cirrus and in the surroundings with the dual-platform approach suggests reduced stability inside and strong stratification above the cirrus. The occurrence of cirrus particles in this air mass is accompanied by high relative humidity with respect to ice.
3.3 Modeled temperature, humidity, and cloud structure in the UTLS in the measurement region
We analyze the structure of the UTLS as represented in the ICON simulation in a 2 h window around the observations presented in Sect. 3.2 and at the geographic location of the aircraft measurement (6.5–7.5 and 54.3–55.1° E; see also Fig. 2), which we will refer to as “measurement area” in the following. Exact spatiotemporal matching of ICON and aircraft is not attempted, as the finite horizontal and vertical grid spacing as well as initial condition and model uncertainty make a perfect forecast of features on the scale discussed in Sect. 3.2 extremely unlikely. Nevertheless, as we will demonstrate in the following, the model is able to capture some key features of the observed UTLS and cirrus structure. This section focuses on the UTLS structure in the simulation started at 00:00 UTC on 7 May 2013; equivalent metrics for the simulation started 12 h earlier are shown in Appendix A. The latter simulation is also discussed in Sect. 5.
The modeled UTLS structure (potential temperature, potential vorticity, water content, and ice content) and its evolution in the area targeted by the flight is shown in Fig. 5. At the altitude of the aircraft measurements (Sect. 3.2) the model locates the transition region between tropospheric, low-PV, and weakly stratified air and stratospheric, high-PV, and strongly stratified air (Fig. 5a, b). The simulated vertical profile of potential temperature (Fig. 5a) matches the transition from tropospheric to stratospheric stability at the aircraft location as observed (Fig. 3). PV in the two model levels closest to the aircraft altitude increases rapidly from below 2 to 3 pvu on average, i.e., suggesting the location of the dynamical tropopause at around the altitude of the aircraft (Fig. 5b). This is consistent with ICON data interpolated to the Learjet position, which shows PV values in the range of 2–3 pvu (not shown), which is slightly lower than in ERA5. However, it should be noted that a vertical displacement less than the distance between two successive model levels suffices to significantly improve the consistency of ICON and ERA5. A slightly higher position of the modeled tropopause than in observations is supported by potential temperature at the aircraft altitude being about 1.5 K colder in the model (not shown). Over the considered time period from 14:00 to 16:00 UTC the vertical PV and potential temperature gradient at around 10.5 km altitude slightly increases.
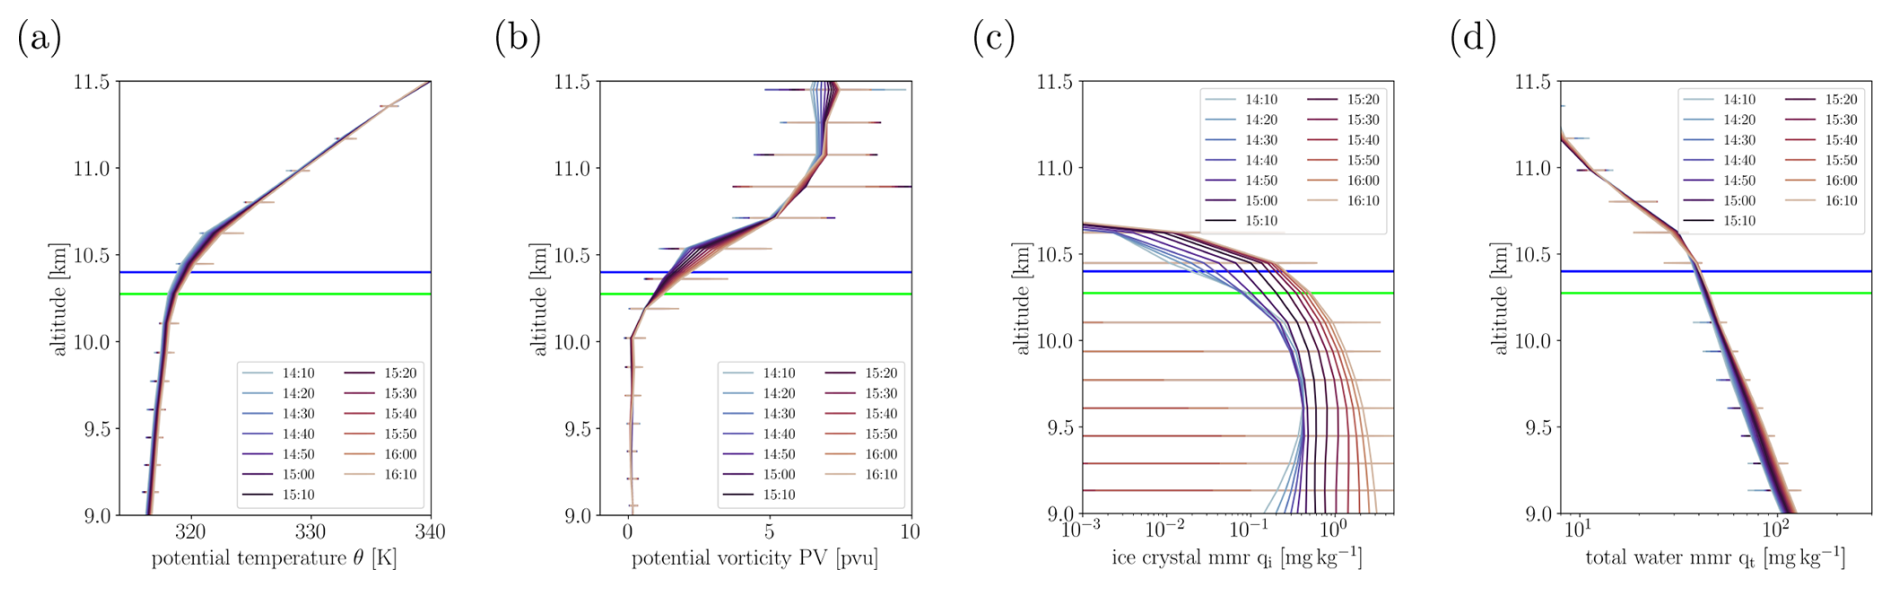
Figure 5Height profiles of the average (a) potential temperature, (b) potential vorticity, (c) total water mass mixing ratio, and (d) ice mass mixing ratio from the ICON simulation. The different line colors represent profiles sampled at different times between 14:10:00 and 16:10:00 UTC on 7 May 2013. Averages are taken over all grid points within 6.5–7.5 and 54.3–55.1° E; spatial variability as represented by the maximum and minimum value at a particular altitude is shown by the horizontal bars. The average altitude of the Learjet leg discussed in Sect. 3.2 is indicated by the dark-blue horizontal line and that of the TOSS by the green horizontal line. The simulation starting at 00:00 UTC on 7 May 2013 is shown.
The ice mass mixing ratio profiles suggest a cirrus cloud extending up to about 10.7 km in the model (Fig. 5c). Near-constant mass mixing ratios are simulated between 9.0 and about 10.0 km, with an increasingly rapid drop in the four model levels above. Over the analyzed 2 h time window the mass mixing ratio of ice gradually increases (Fig. 5c). Ice mass mixing ratios of around 0.1 mg kg−1 are found up to PV values of about 4 pvu, which suggests the presence of ExTL cirrus consistent with observations (Fig. 6a). Vertical profiles subsampled for model columns with and without cirrus indicate that the potential temperature gradient in upper part of the cirrus layer is smaller than in the surrounding air and above the cirrus (Fig. 6b). Note, however, that the modeled stratification is substantially larger than the neutral stratification observed by the Learjet–TOSS platform. Consistent with the smaller vertical potential temperature gradient, PV values in the cirrus column are smaller than in the surrounding air (Fig. 6c).
The total water content, i.e., the sum of specific humidity and cloud condensate, remains almost constant throughout the considered 2 h time period (Fig. 5d). The humidity gradient changes rapidly at about 10.6 km altitude to larger values at higher altitudes. Hence, the tropospheric humidity gradient is continuing beyond the dynamical tropopause, consistent with the Learjet observations and the presence of a mixing-influenced ExTL.
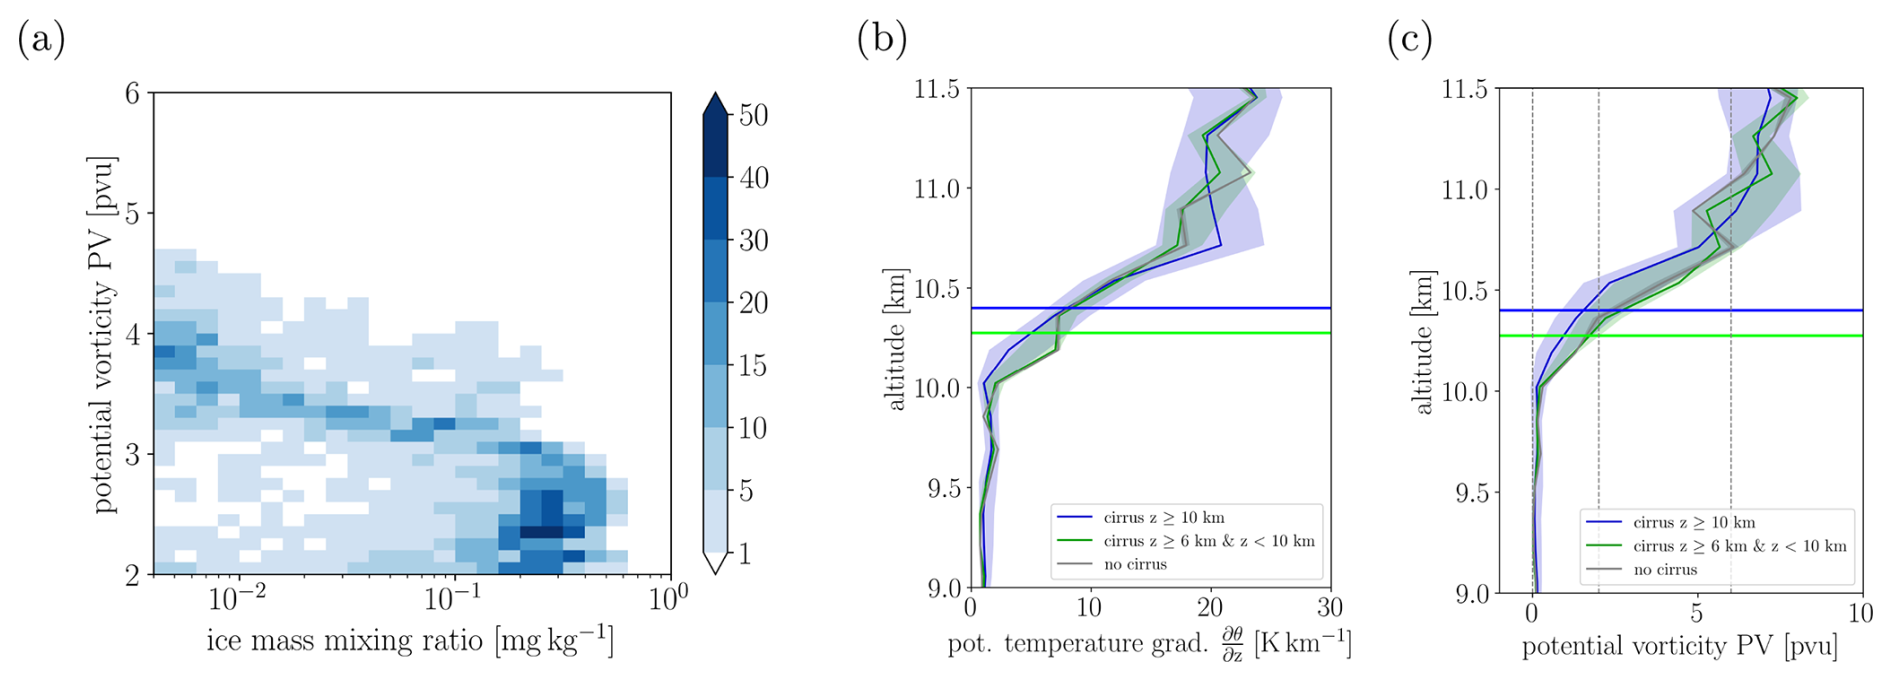
Figure 6(a) Ice mass mixing ratio as a function of the potential vorticity in the region 6.5–7.5 and 54.3–55.1° E and times between 14:10:00 and 16:10:00 UTC on 7 May 2013. The color coding indicates the potential temperature gradient at the respective grid points. Only grid points at altitudes above 10 km are considered. Composite profiles of (b) potential temperature gradient and (c) potential vorticity PV in the measurement area for times and location with cloud tops above 10 km (blue), cloud tops below 10 km (green), and no clouds (gray) being present.
The simulation with the earlier start time has a much higher tropopause with less sharp gradients. Therefore, the cirrus layer is found predominantly at tropospheric PV values (Fig. A1). Hence, the match with observation is not as good as in the simulation with the later initialization date. Nonetheless, contrasting the two simulations provides insight into the processes leading to the cirrus formation and moisture content of the lower stratosphere as well as potential model deficiencies in the representation of diabatic PV production, as discussed in more detail in Sect. 5.
In summary, the model simulation contains an ExTL cirrus expanding to well above the local dynamical tropopause as well as reduced stratification in the cirrus. This structure of the UTLS is qualitatively consistent with the observations, although there are some small quantitative differences, e.g., concerning tropopause altitude.
4.1 Air mass origin
The UTLS structure as observed with the Learjet/TOSS framework and captured by the ICON model emerges due to advection and diabatic processes in the hours and days before arrival over the North Sea. To investigate these processes we analyze high-resolution air mass trajectories from the ICON model simulations.
The path as well as the temporal evolution of PV and ice mass mixing ratio for trajectories arriving in the measurement area is shown in Fig. 7. The different rows show different subsets of trajectories: the first two rows show trajectories passing through areas with tropospheric (557 trajectories) and stratospheric (309 trajectories) air mass composition based on the Learjet/TOSS N2O measurements, respectively. The last row shows trajectories arriving in the measurement area with PV values larger than 2 pvu and ice mass mixing ratios larger than 10−3 mg kg−1 (1511 trajectories). The PV values in tropospheric air are predominantly smaller than 2 pvu, with a few exceptions at the lowest pressures, which may be due to inconsistencies in the location of the local tropopause in the model and observations (fraction of trajectories with PV ≥ 2 pvu ≈ 7 %). The tropospheric air mass contains a thick cirrus layer consistent with the profiles shown in Sect. 3.3, which forms in slowly ascending air masses over southeastern Germany about 12 h before arrival in the measurement area (Fig. 7a–c). The ice mass mixing ratio displays strong temporal variability likely induced by gravity waves associated with the passage over the small mountain ranges in central Germany. These wave motions are superimposed on the general slow ascent as already discussed in Müller et al. (2015). As will be discussed later, the cirrus evolution is consistent with the indication of cirrus presence from MSG satellite data (see Sect. 5).
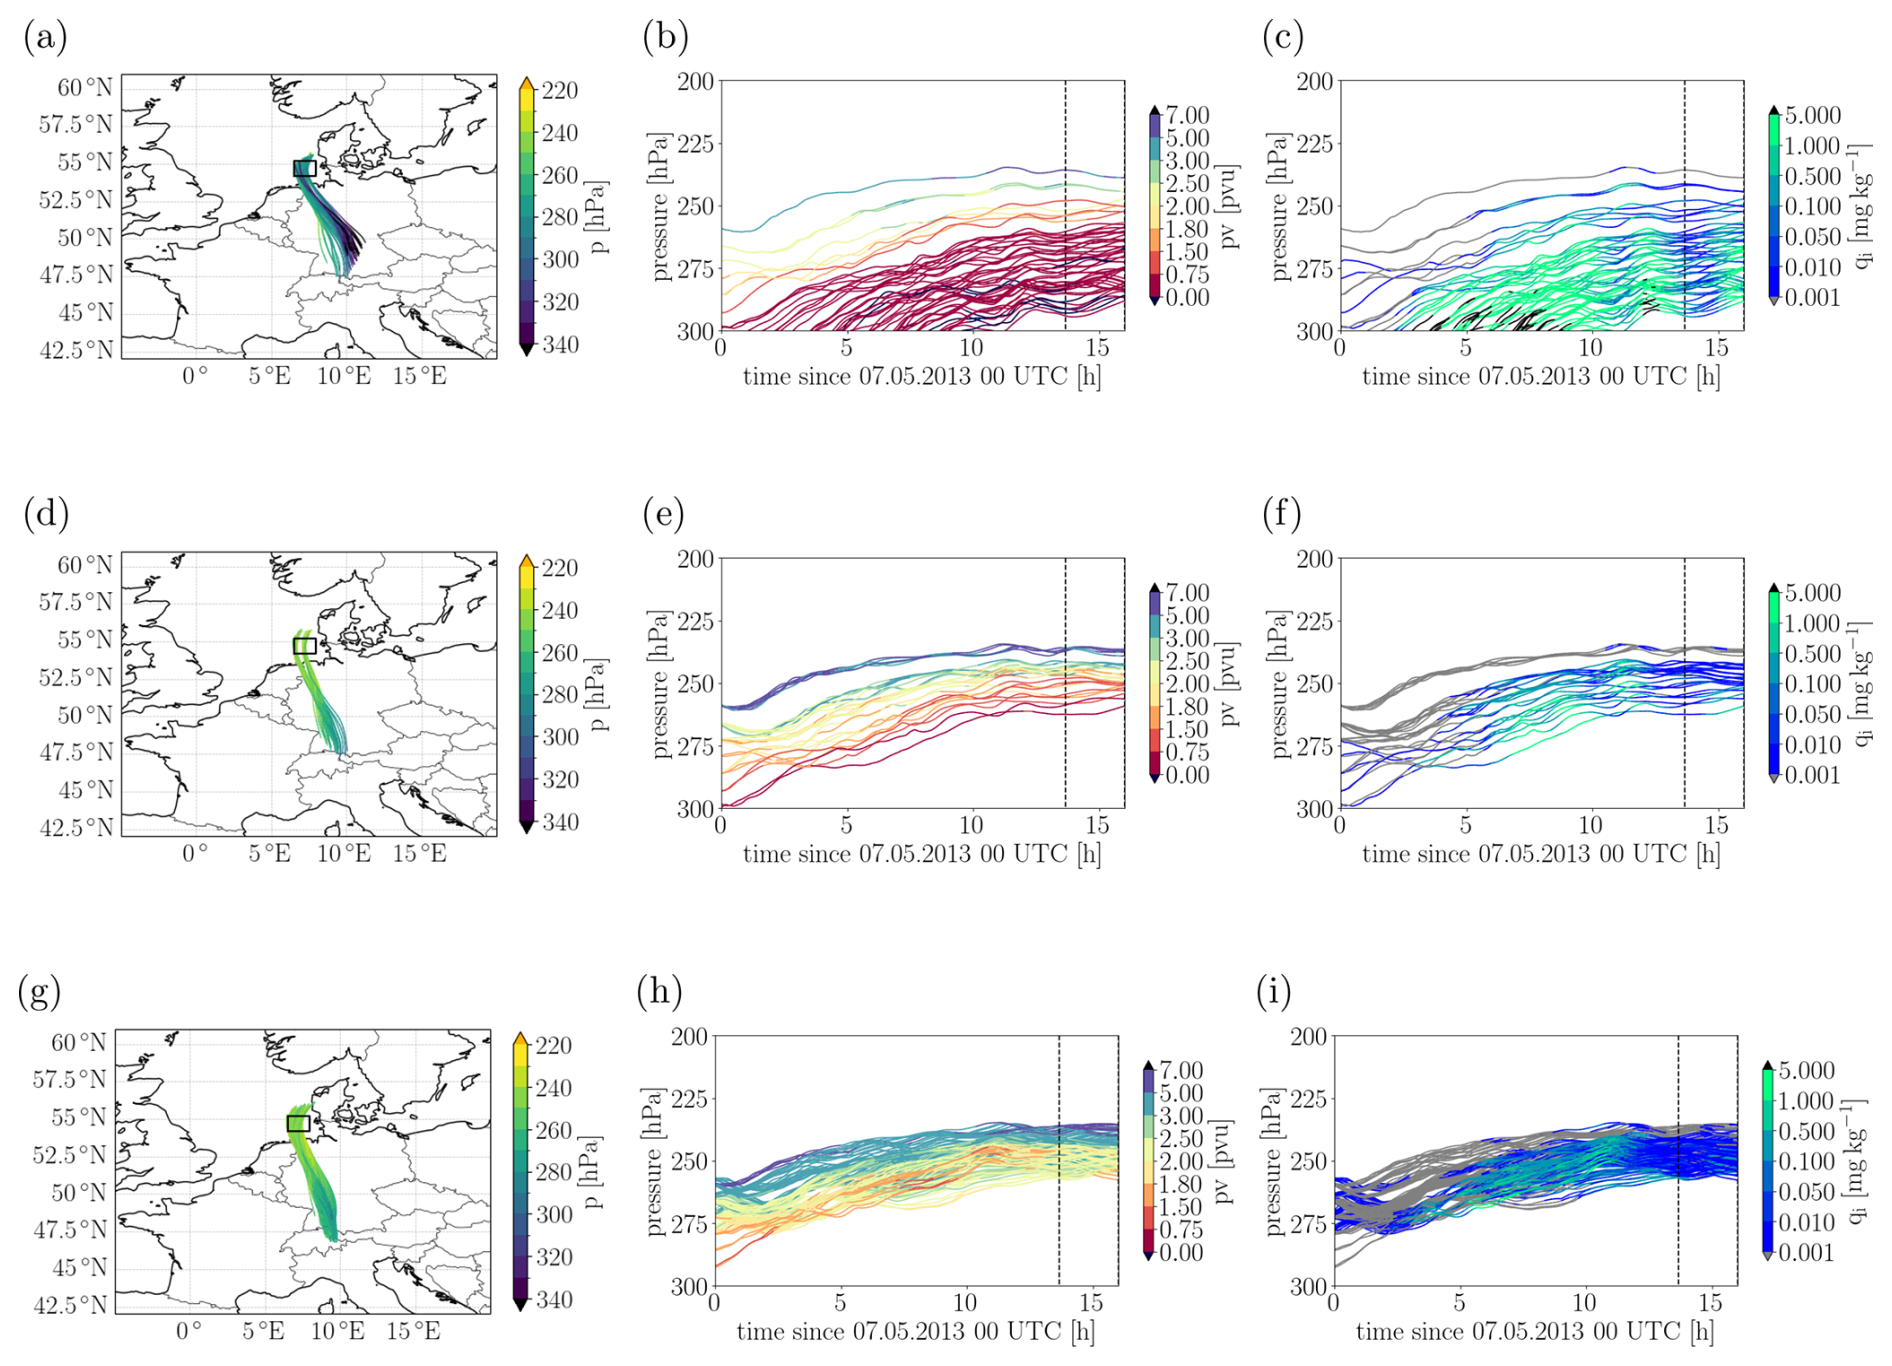
Figure 7Path of trajectories arriving in the measurement area between 13:40:00 and 16:00:00 UTC with (a–c) tropospheric marker (557 trajectories), (d–f) stratospheric marker (309 trajectories), and (g–i) PV ≥ 2 pvu and qi ≥ 10−3 mg kg−1 (1511 trajectories). Panels (a), (d), and (g) show the geographic path of the trajectories and the color represents the pressure at which they are located. Panels (b, e, h) and (c, f, i) show the temporal evolution of the pressure of the air parcels, and the line color represents (b, e, h) potential vorticity and (c, f, i) ice mass mixing ratio, respectively.
The trajectories arriving in the area with stratospheric air mass characteristics according to the observations are located on average at slightly higher altitudes, slightly further west (Fig. 7d–f), and arrive in the measurement area predominantly in the later half of the considered time interval (not shown). They also contain an extensive cirrus cloud, but PV values are predominantly around 2 pvu. Again some spatiotemporal inconsistency between model simulation and observed situation may explain the presence of some trajectories with PV values below 2 pvu. The cirrus structure and the general characteristics of the vertical motions are not systematically different from the trajectories traveling through the area with observed tropospheric characteristics. Importantly, this also holds when considering the subset of trajectories with stratospheric PV values and cirrus content in the model (Fig. 7g–i). The major differences are a shift towards even lower pressures and the dismissal of the easternmost origin region. As the general characteristics of the evolution do not differ substantially for the last two trajectory subsets, we focus in the following analysis on the trajectories with PV ≥ 2 pvu and qi > 10−3 mg kg−1. This offers a physically consistent picture on the emergence of the observed ExTL cirrus.
4.2 Cirrus cloud formation mechanism
The extensive cirrus cloud seen in Fig. 7 emerges in the 12 h before the arrival of the trajectories in the measurement area and arises by a combination of moist ExTL air over southern Germany (see discussion of Fig. 8 and Sect. 5) and strong lifting of up to 25 hPa, which corresponds to a vertical displacement of about 1000 m (median: ≈ 500 m) (not shown), during its northward propagation. Cirrus clouds are formed in the model by deposition nucleation as indicated by the process rates from the different ice formation parameterizations in ICON traced along the trajectories, which are zero for all processes except deposition nucleation (not shown). Deposition nucleation may be overestimated by the used parameterization as it was developed for dust outbreak cases over central Europe. Relative humidity over ice RHice in the cirrus layer, which is completely below the homogeneous freezing temperature, peaks at around 120 %, consistent with deposition nucleation being the dominant mode of nucleation (Fig. 8a). If only cirrus clouds along trajectories with substantial deposition nucleation rates are considered, the small RHice values are not present anymore, because air parcels acquiring ice through sedimentation are excluded (compare filled and unfilled histograms in Fig. 8a). This distribution of relative humidity is consistent with observed relative humidity in cirrus clouds from IAGOS measurements (Petzold et al., 2017).
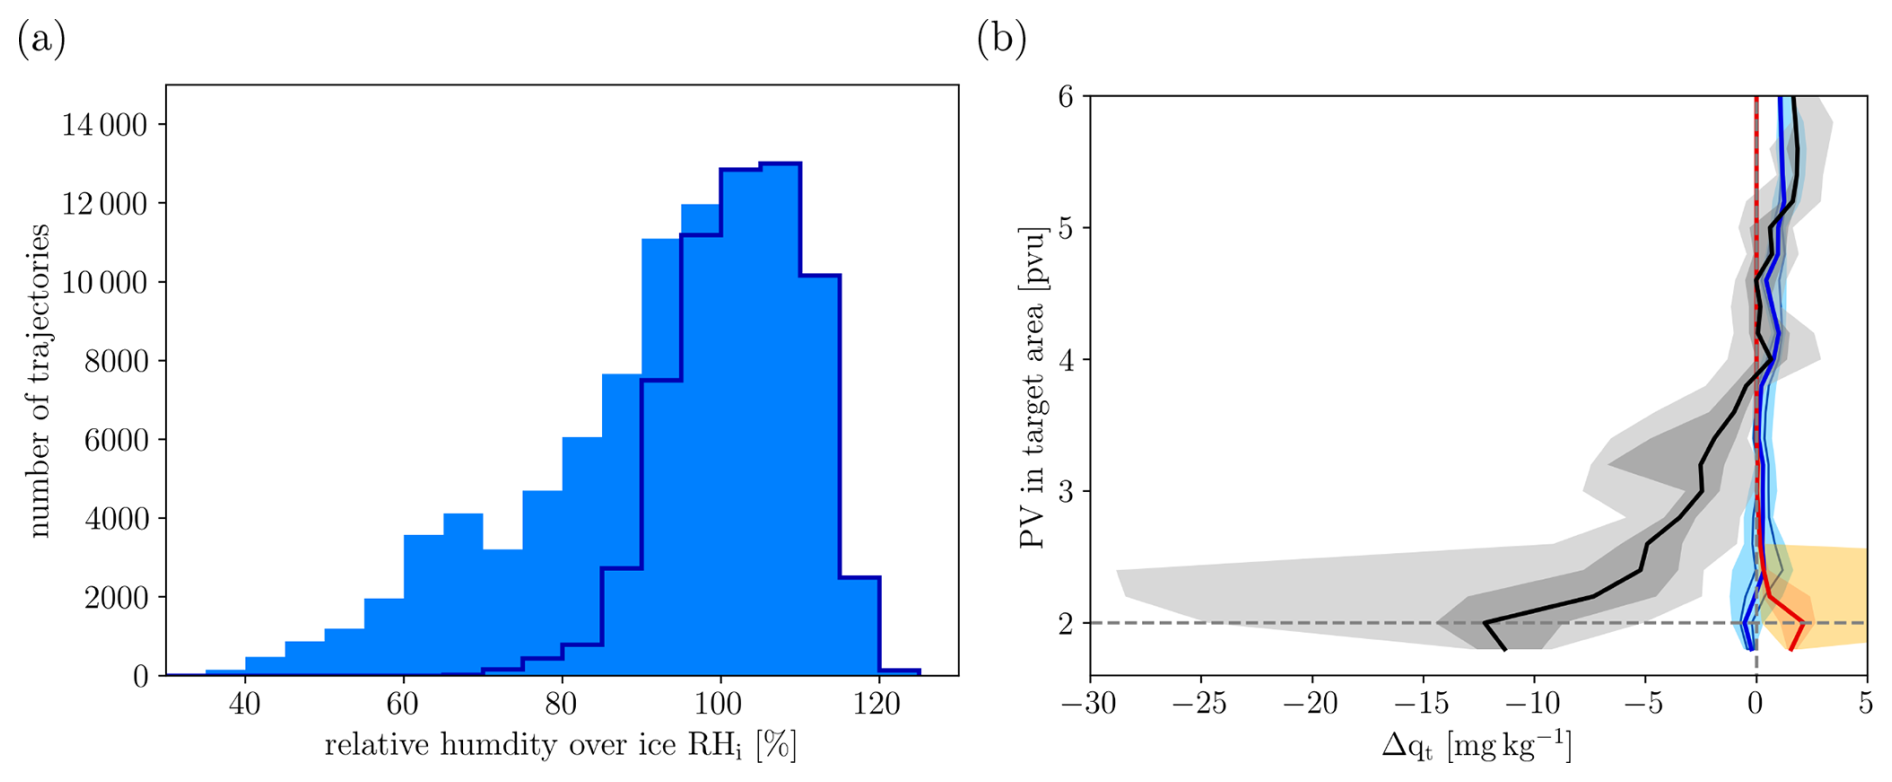
Figure 8(a) Distribution of RHice values in cirrus clouds forming along the trajectories arriving in the measurement area. The dark-blue histogram shows the distribution if only parcels with substantial accumulated ice nucleation rates (> 10−8 kg kg−1) are taken into account. (b) Change in parcel total water content Δqt from the start of the simulation, i.e., 00:00 UTC on 7 May 2013, until the parcel arrives in the measurement area. The black line shows the median Δqt; the gray shading shows the 25th–75th and 5th–95th percentile range. Similarly the change in total water from the turbulence parameterization is shown in blueish colors and that from sedimentation into the parcels by warm colors.
The Lagrangian diagnostics allow us to assess the change in humidity during the transport. Figure 8b shows the Lagrangian change in total water content from 00:00 UTC on 7 May 2013 until the arrival of the trajectories in the measurement area. The dominant feature is a loss of total moisture of air parcels with less than 4 pvu, which coincides with the vertical extent of the cirrus deck. Hence, there is no indication that the ExTL air mass located between 2 and 6 pvu gained substantial moisture in the 12 h preceding its arrival in the measurement area. If considering the parcel's initial PV for constructing the vertical profile, the same structure emerges with small variations (not shown). This suggest that vertical scrambling of air parcels and non-uniformity of Lagrangian PV change does not affect our diagnostics of moisture change. The relatively high moisture content in the source region is consistent with evidence from MSG satellite data and radiosonde data over southern Germany (as discussed in detail later; see Sect. 5).
4.3 Cirrus impact on the PV structure and potential STE
The Lagrangian diagnostics further allow us to assess when the air parcels obtained their stratospheric characteristics at least in terms of their PV. Consistent with the visual perception of the data in Fig. 7 only a small fraction cirrus-forming trajectories passed the dynamical tropopause in the 12 h before the arrival in the measurement area (Fig. 9a): of the fraction of trajectories that contain ExTL cirrus in the measurement areas, only 12.5 % transition from below to above 2 pvu values in the considered time period and only 7.7 % do so after the formation of cirrus. These trajectories that undergo troposphere-to-stratosphere exchange arrive in the measurement area with PV values only slightly larger than 2 pvu (mean: 2.24; maximum 2.89 pvu). This is consistent with the relatively small ΔPV for parcels located close to the dynamical tropopause in Fig. 9a). Further, this implies that the majority of trajectories form cirrus in dynamically stratospheric air and cirrus is not “mixed in” from dynamically tropospheric air.
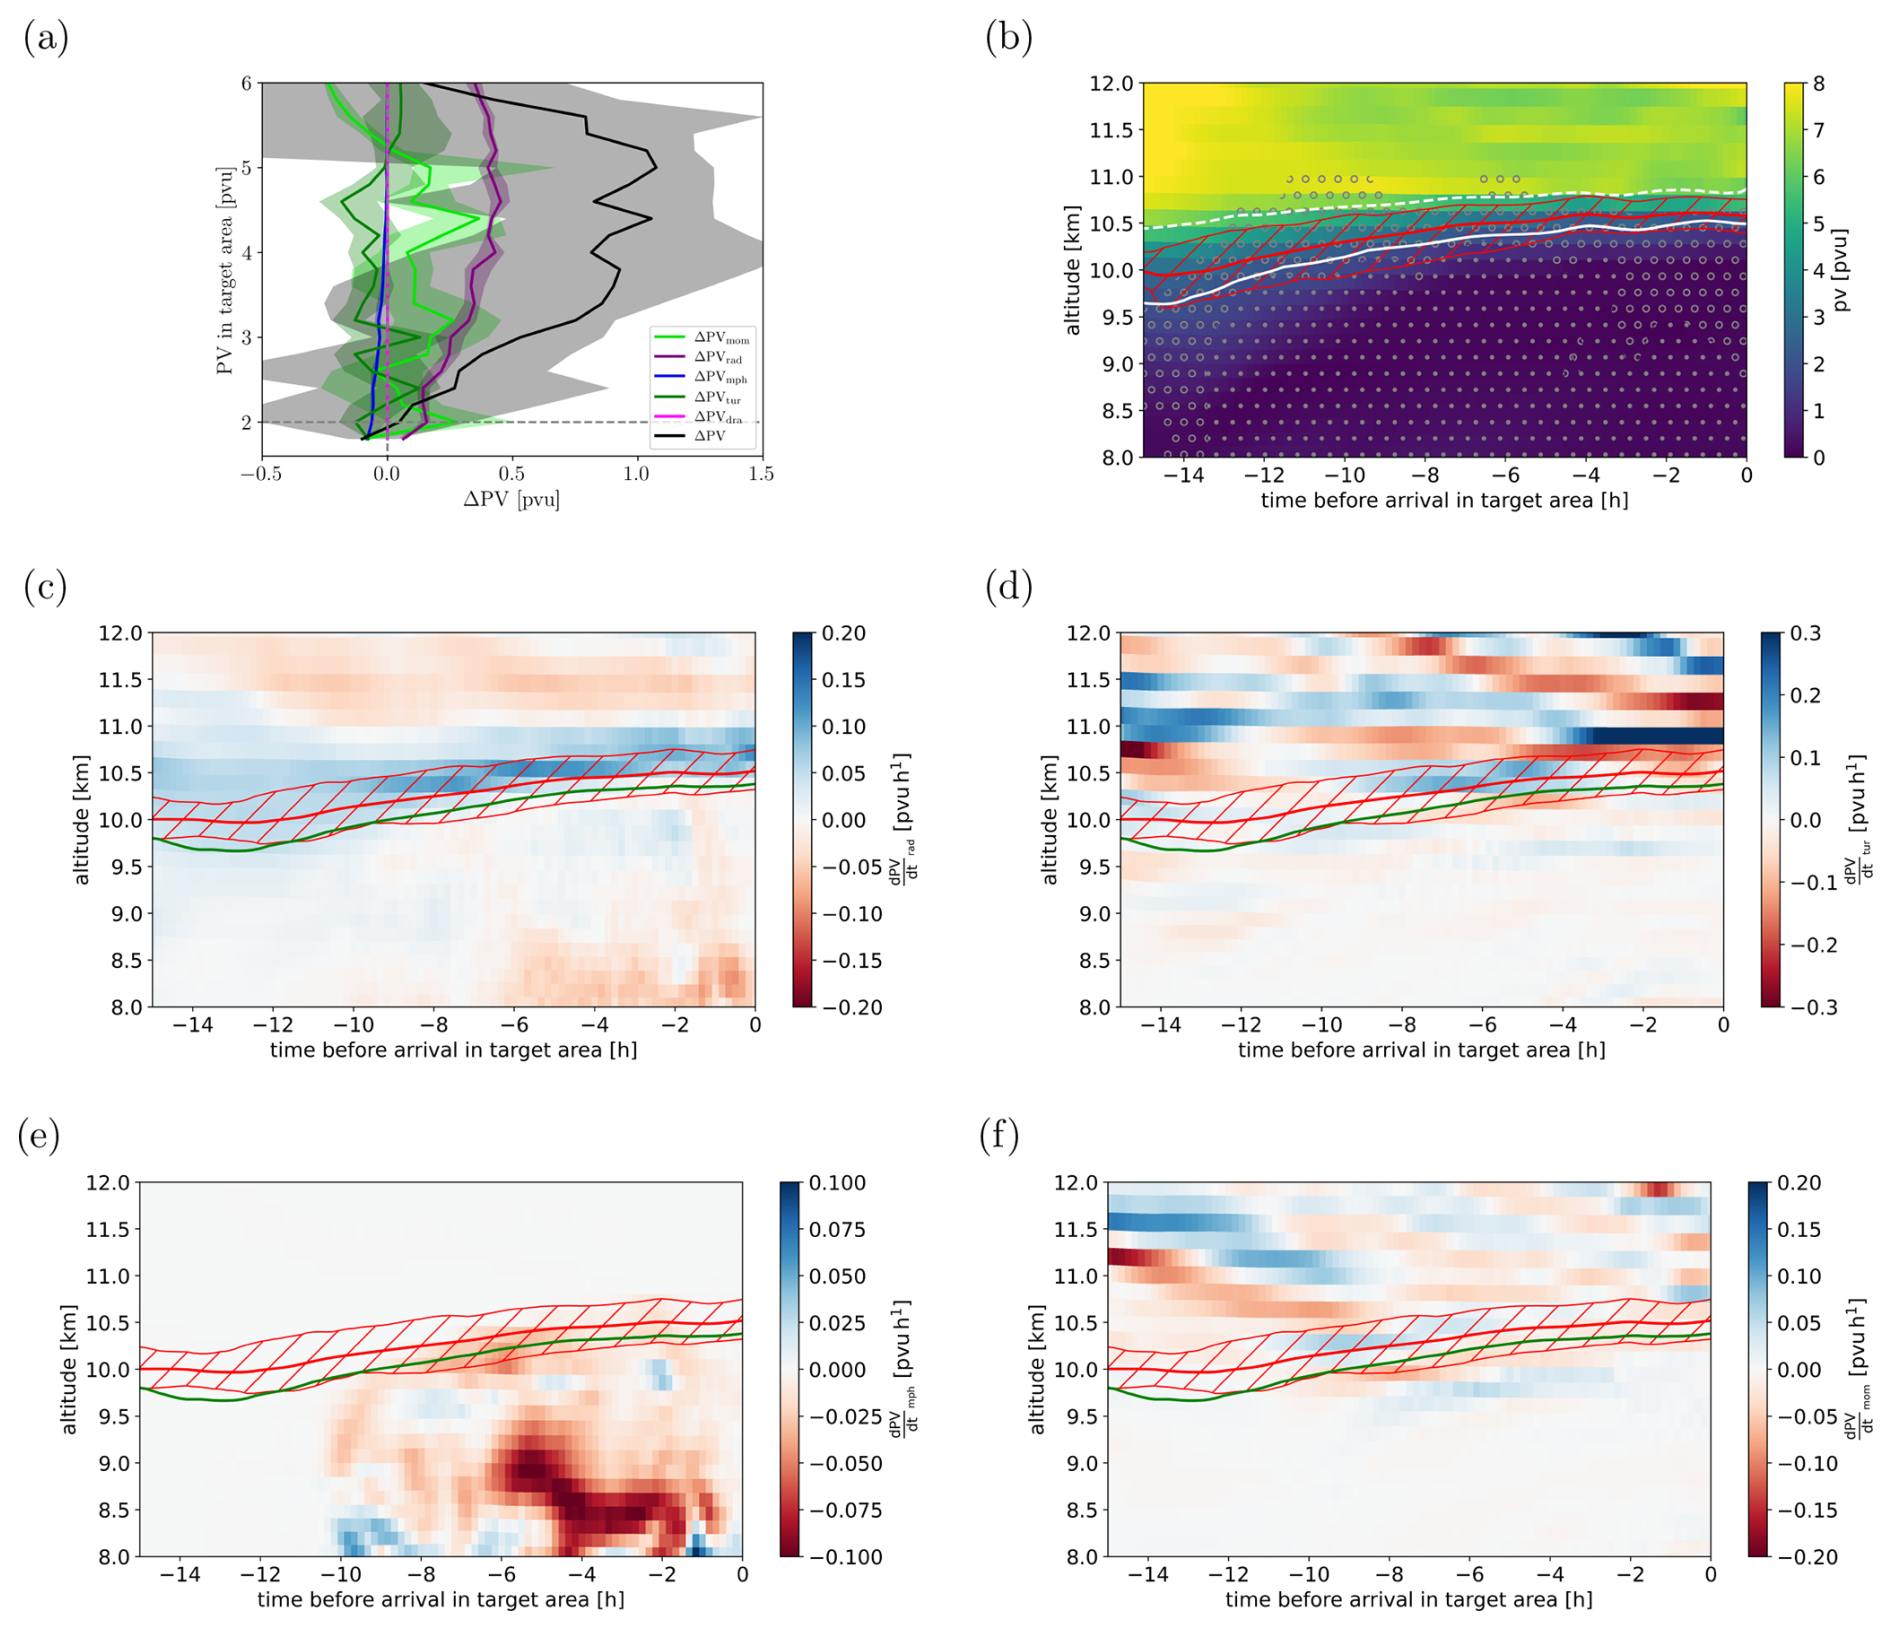
Figure 9(a) Change in parcel potential vorticity ΔPV from the start of the simulation, i.e., 00:00 UTC on 7 May 2013, until its arrival in the measurement area. The black line shows the median ΔPV; the gray shading indicates the 25th–75th percentile range. ΔPV due to temperature changes from the radiation, microphysics, turbulence, and orographic drag parameterization are shown by the purple, blue, dark-green, and magenta lines (plus shading). The light-green line (plus shading) shows ΔPV from vertical momentum flux (turbulence and orographic drag parameterizations). (b–f) Composite profile along air parcels arriving in the measurement area with PV ≥ 2 pvu and qi ≥ 10−3 mg kg−1: variables shown are (b) PV, (c) PV tendency from radiation parameterization, (d) PV tendency from temperature changes by the turbulence parameterization, (e) PV tendency from microphysics parameterization, and (f) PV tendency from momentum transport by the turbulence parameterization. The thick solid black (white) line shows the position of the 2 pvu isoline in panels (c)–(f) (b) and the respective dashed lines the 6 pvu isoline. The red hatching illustrates the vertical position of trajectories containing an ExTL cirrus in the measurement region. The hatching with open (closed) dots in panel (b) illustrates the presence of ice mass mixing ratios larger than 10−9 kg kg−1 (10−6 kg kg−1). Profiles have been retrieved from 10 min Eulerian output at the native ICON grid and have been interpolated to the horizontal location of the air parcels.
Diabatic PV modification becomes more important for parcels deeper into the ExTL: those arriving with PV values between 3 and 4 pvu gained about 1 pvu in the preceding 12 h (Fig. 9a). However, due to their larger initial PV values, these trajectories did not pass the dynamical tropopause in the considered time period. Evaluation of the PV budget along trajectories indicates the strongest contribution from changes in thermal stratification by radiative processes (red line) followed by changes in thermal stratification and momentum by turbulent processes (light- and dark-green lines). Below 3 pvu some negative PV tendency due to latent heating from cloud microphysics is evident (blue line). Note that the Lagrangian PV budget is difficult to close likely due to the reconstruction of PV and vorticity gradients on the staggered vertical grid followed by interpolation to the parcel positions. In particular, the turbulent PV tendency field is relatively noisy on the native model grid spacing (Δx ≈ 3.25 km), as has been noted by previous studies (Oertel et al., 2023). Composite profiles of the PV and PV modification terms along the trajectories are therefore more useful in discerning the key physical mechanisms (note that the results are qualitatively consistent with the statistics along the trajectories). The compact nature of the trajectory bundle contributing to the ExTL cirrus and the limited vertical and horizontal shear allow a physical meaningful analysis of composite profiles, which are shown in Fig. 9b–f. Composites are constructed for different times t before the arrival of trajectories in the measurement area. The PV profile indicates a narrowing of the geometric vertical extent of the ExTL, if defined as the layer between the 2 and 6 pvu isoline (Fig. 9b). The trajectories forming the cirrus cloud in the measurement area (red hatching) travel in the ExTL, and the ExTL coincides with the top of the extensive cirrus deck (dots). The composite analysis suggests that the narrowing of the ExTL is mainly driven by increasing PV in the upper part of the ExTL, i.e., the highest-altitude parcels. Radiative PV modification provides a consistent source of increasing PV values close to the top of the cirrus deck, consistent with the expected PV change above a cooling maximum (from longwave emission) (Fig. 9c). Additionally, PV modification by turbulent processes is of similar amplitude but much more localized (Fig. 9d, f). Therefore, the overall impact of turbulence on the PV of the considered trajectories is smaller than that of the radiative processes. The (partly) compensating negative PV tendency from turbulent mixing at t = ≈ −8 to −4 h and positive PV tendency from turbulent mixing at t > −2 h contribute additionally to a reduction in the total impact of turbulence on the PV structure. In general, contributions from turbulent stratification changes are larger than but of similar sign to those from turbulent momentum transport. However, the momentum transport terms are still substantial and are an important, albeit often not quantified, contribution to the PV budget. PV modification from cloud microphysical processes, i.e., latent heating and cooling, in the ExTL is generally small and decreases PV (Fig. 9e). This is consistent with the PV modification expected above a latent heating maximum associated with the cirrus formation and ice crystal growth. The largest contributions are found around t = −6 h at the lower edge of the ExTL and appear to contribute to the narrowing of the ExTL by increasing PV on the tropospheric side. Note that this time period is also associated with the strongest radiative PV modification and is well aligned with the largest ice water content along the trajectories (Fig. 7c, f, i).
Overall, the ICON model simulations suggest that the observed cirrus cloud formed by slantwise lifting and gravity wave activity (see Fig. 7) in an already moist ExTL air mass originating over southern Germany (≈ 12 h before arrival in the measurement area). The model provides no indication of moisture transport into the ExTL from the troposphere or evidence for substantial STE. However, the model suggests that the extensive cirrus deck results in an enhanced PV gradient and therefore a narrowing of the ExTL in terms of its geometric depths. This results from cloud microphysical PV destruction at the bottom of the ExTL as well as radiative and turbulent PV production at the top of the ExTL. Note that the modeled PV structure is consistent with the observed vertical potential temperature gradients by the Learjet/TOSS, i.e., near zero in the cirrus deck and much larger across the cloud top. Further, note that the observations suggest a much sharper cloud top than can be represented on the model vertical grid. This likely makes the discussed processes even more efficient in the real atmosphere.
The Lagrangian analysis of the ICON simulation provides insight into the history of the observed cirrus and its role in shaping the observed UTLS temperature and moisture structure. To corroborate these model hypotheses we here use MSG satellite data and radiosonde data from Switzerland and southern Germany, which provide observational evidence for the cloud evolution and UTLS humidity structure in the area of interest. Secondly, to further corroborate the impact of the cirrus on the UTLS thermodynamic structure from a model perspective, we discuss our second ICON simulation (initialized 12 h earlier than that discussed in Sect. 4) that fails to reproduce the ExTL thermodynamic structure and cirrus observed by the Learjet/TOSS measurements over the North Sea (Sect. 3.3 and Appendix A).
Satellite data from MSG provide some information on the spatiotemporal evolution of upper-tropospheric humidity (proxy: channel at 6.2 µm), cloud extent and cloud top heights (proxy: channel at 10.8 µm), and the presence of thin cirrus clouds (proxy: difference between channels at 10.8 and 8.7 µm). In the latter, optically thin cirrus clouds are shown in whitish colors. MSG images for all these channel (combinations) are shown for 01:00, 07:00, and 13:00:00 UTC on 7 May 2013 in Fig. 10. In addition, the position of trajectories arriving between 10.5 and 11.0 km altitude in the North Sea observation area is shown: orange contours indicate the position of trajectories calculated based on the simulation started at 00:00 UTC on 7 May 2013. In the early morning of 7 May 2013, trajectories are located along the western edge of a moist area extending from northern Italy to the English Channel (Fig. 10a). To the west the moist region borders on a relatively dry filament. There is some indication of convection over the Netherlands (Fig. 10b) and more tenuous cirrus further east (Fig. 10c), which is included in the northernmost part of the trajectory source region. In the following hours the moist air mass propagates further north, and consistently the trajectories propagate on the moist side of the relatively strong gradient in upper-tropospheric humidity located over western Germany (Fig. 10d, g). In this air mass the tenuous cirrus clouds present in the early morning persist and continue to coincide with the northern half of the trajectory bundle (Fig. 10f, i). Increasingly the cirrus clouds cover the entire area in which trajectories are found. From about 10:00 UTC onward optically thick clouds appear in the area covered by the trajectories, likely at slightly lower altitudes (hourly MSG images: Fig. A2). Furthermore, the time at which the thicker cirrus appears roughly agrees with larger ice water content at altitudes below 10 km in the ICON cross-sections along the trajectory (Fig. 9) and enhanced radiative cooling at the upper edge of the cirrus cloud. Albeit there is some indication of deep convection over eastern Germany and the Czech Republic, the optically thick cloud over western Germany is not influenced by this directly, and the optically thick cirrus rather seems to form in situ – again consistent with the ICON-based Lagrangian analysis. Hence, the available satellite data confirm the model simulation in the sense that (i) the observed cirrus formed many hours before it being sampled over the North Sea, (ii) the air mass in which it formed was already very humid about 15 h prior to the observation, and (iii) the presence of an optically thick cirrus from about 6–8 h prior to the observation likely resulted in strong cloud top cooling.
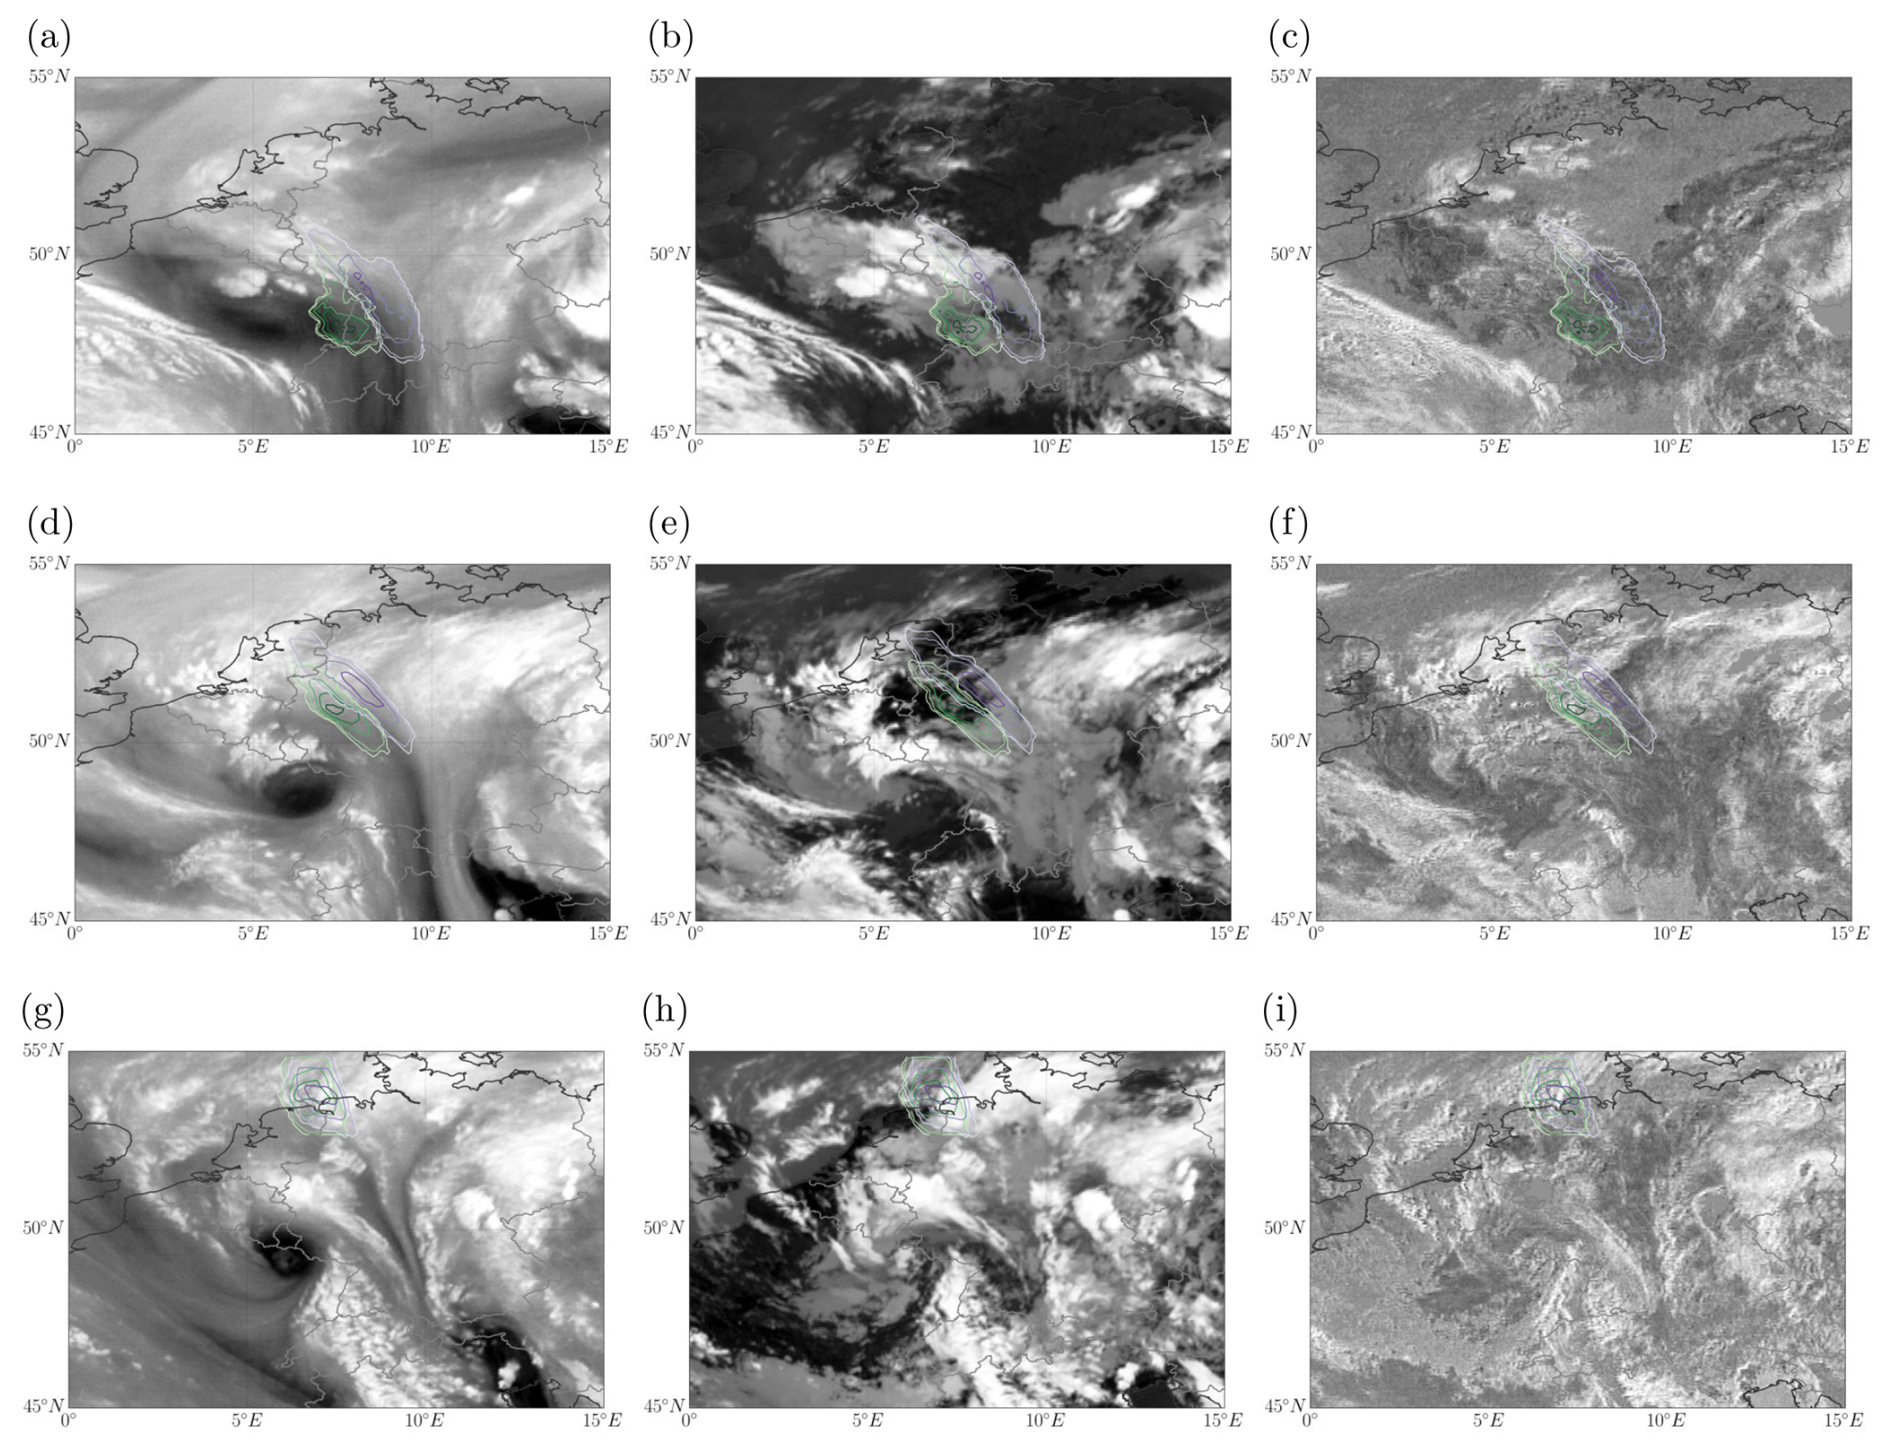
Figure 10Meteosat Second Generation (MSG) satellite images at 6.2 µm (a, d, g) and 10.8 µm (b, e, h), as well as the difference signal between the 10.8 and 8.7 µm channel (c, f, i). The rows from top to bottom correspond to observations times of about 01:00, 07:00, and 13:00 UTC on 7 May 2013. The contours indicate the position of back trajectories from the measurement area based on the simulation initialized at 00:00 UTC on 7 May 2013 (purple) and 12:00 UTC on 6 May 2013 (green), respectively.
The model analysis suggests that a key aspect for the formation of the observed ExTL cirrus is relatively high moisture content in the UTLS over southern Germany in the early hours of 7 May 2013. Satellite analysis generally supports this idea, but for more quantitative insight we include radiosonde data from Payerne, Stuttgart, and Oberschleißheim, i.e., three operational stations in southern Germany and Switzerland (for location see Fig. 11a). The temperature and humidity structure of the UTLS as observed by the operational radiosondes released at 00:00 UTC on 7 May 2013 is shown in Figs. 11b and A4. The sounding data confirm a large horizontal gradient in specific humidity below and around the tropopause from west (Payerne) to east (Oberschleißheim). The Stuttgart sounding is closest to the diagnosed origin of the air mass later observed in the North Sea measurement area. The modeled specific humidity profile agrees well with the observed specific humidity data from the Stuttgart sounding, in particular with respect to the enhanced specific humidity values between 318 and 320 K. The moist layer is not as sharply capped at its upper boundary in the model as in the observations, which likely is due to coarser vertical grid resolution (also in the analysis data used for initializing the model simulation). The Oberschleißheim sounding suggests very humid conditions up to about 328 K, but the lapse-rate tropopause is also substantially higher at this more eastern location. The Payerne sounding shows less humid conditions in the upper troposphere, although there is some indication of a local increase in humidity above 330 K. It is unlikely that this structure influenced the observed ExTL cirrus due to it being at a much higher isentrope. It may arise due to the northeast advection of the radiosonde during its ascent and a weak moist filament ahead of the main gradient over central Switzerland visible in the MSG data. However, in general the vertical profile information confirms the modeled UTLS humidity and temperature structure in the air mass origin region, in particular a large east–west gradient in UTLS humidity and relatively moist conditions around the tropopause in the air mass origin region.
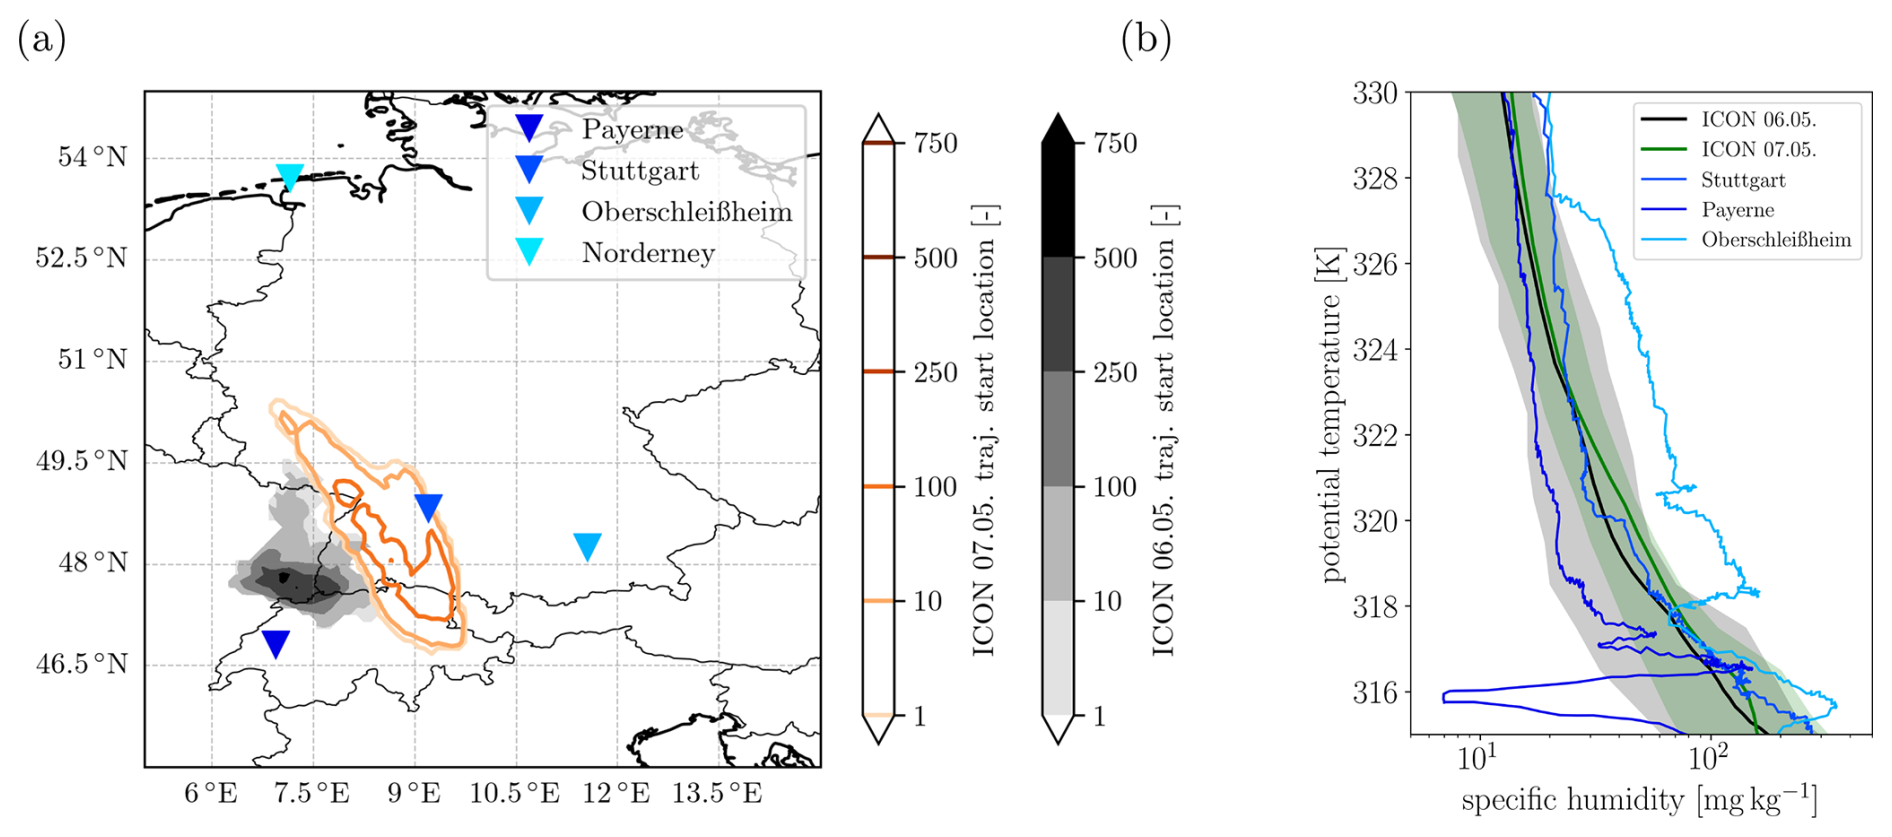
Figure 11(a) Location of air parcels at 00:00 UTC on 7 May 2013. Only parcels arriving in the measurement area at altitudes between 10.5 and 11.0 km are considered between 14:00 and 16:00 UTC on 7 May 2013. The gray shading indicates the location of air parcels propagated using the ICON wind fields from the simulation initialized at 12:00 UTC on 6 May 2013 and the orange contours those using the ICON wind fields from the simulation initialized at 00:00 UTC on 7 May 2013. The blue triangles indicate the location of nearby radiosonde release locations. (b) Specific humidity as a function of potential temperature at 00:00 UTC on 7 May 2013 from three radio sounding sides (blue) and the ICON model simulations sampled over the origin region of the trajectories (shown in the left panel). Black and green colors correspond to ICON initialization dates of 12:00 UTC on 6 May 2013 and 00:00 UTC on 7 May 2013, respectively. Note that both simulations have been sampled in the trajectory origin region form the simulation initialized at 00:00 UTC on 7 May 2013. The figure with profiles sampled over the respective origin regions from each simulation is shown in Fig. A3. The solid line shows the median profile, and the shading indicates the 5th to 95th percentile range.
Finally, we compare the two ICON simulations initialized at 12:00 UTC on 6 May 2013 and 00:00 UTC on 7 May 2013. As discussed in Sect. 3.3, the former fails to reproduce the observed ExTL cirrus and has a much higher tropopause in the measurement region than observed, analyzed in ERA5, and modeled by the other ICON simulation. Trajectories arriving in the North Sea measurement area have a broadly similar path in the preceding 14–16 h both in terms of horizontal and vertical propagation: both sets of trajectories originate over southern Germany and experience a slow lifting while traveling north (compare Figs. 7 and A5). However, the cirrus cloud forms much later, with lower ice water content and much smaller horizontal and vertical extent in the simulation initiated at 12:00 UTC on 6 May 2013. This is consistent with a slight westward shift in the air mass origin into the region of dry upper-tropospheric air (as seen, e.g., in the satellite data, Fig. 10a). However, even if one assumes the same origin region in both data sets, the ICON simulation with the earlier start date has lower specific humidity values between 318 and 320 K compared to the second ICON simulation and also compared to the Stuttgart radio sounding (Fig. 11b). As the ExTL cirrus forms in this altitude range, the delayed formation of more tenuous cirrus cloud is not surprising. Interestingly the evolution of the ExTL and diabatic PV tendencies differs strongly between the two simulations (compare Figs. 9 and A6): in both simulations the ExTL (2–6 pvu) is about 1 km deep about 15 h before the air mass arrives in the measurement area. While it becomes substantially less deep in the ICON simulation initialized at 00:00 UTC on 7 May 2013, the geometric ExTL depth decreases only slightly in the ICON simulation initialized at 12:00 UTC on 6 May 2013. The decomposition of the diabatic PV tendencies into contributions from different physical processes suggests that the main difference is a less vertically focused radiative PV production (at z = ≈ 10.0 to 10.5 km and t ≈ −10 to −4 h) and simultaneously stronger turbulent PV destruction (at z = ≈ 10.5 to 11.0 km and t ≈ −10 to −4 h). These changes are consistent with the absence of an ExTL cirrus. Note that the optically thick cirrus layer in the upper troposphere is present in both simulations, although the trajectories destined for the North Sea measurement region only move above this cirrus deck at later times (at t ≈ −10 h compared to t ≈ −12 h) and over a shorter time period (until about t ≈ −7 h compared to t ≈ −4 h) (Figs. 9b and A6a). In Fig. 12 we compare the trajectory path for those air masses arriving between 10.5 and 11.0 km in the North Sea area, as well as the PV and wind difference field at 10.5 km between the two simulations. Interestingly, from about 07:00 UTC (≈ 7–9 h before arrival in the measurement area) a negative PV anomaly (i.e., difference) develops (in the area around 52° N, 7° E, at 07:00 UTC, propagating to ≈ 53.5° N, 7° E, at 13:00 UTC), which goes along with a stronger eastwards wind component (anticyclonic rotation) in the simulation initialized at 12:00 UTC on 6 May 2013. While the two trajectory bundles propagate almost parallel to each other in the early part of the simulation, they converge into the North Sea measurement area in the final hours, consistent with the wind field difference (explaining the more westerly source area). Given the overall better agreement of the ICON simulation initialized at 00:00 UTC on 7 May 2013 with the Learjet/TOSS observations, MSG satellite data, and radiosonde profiles over southern Germany, one may speculate whether the difference between the simulations provides evidence for the (local) importance of radiative PV modification for the flow within the ExTL and the (thermo)dynamical vertical structure of the ExTL.
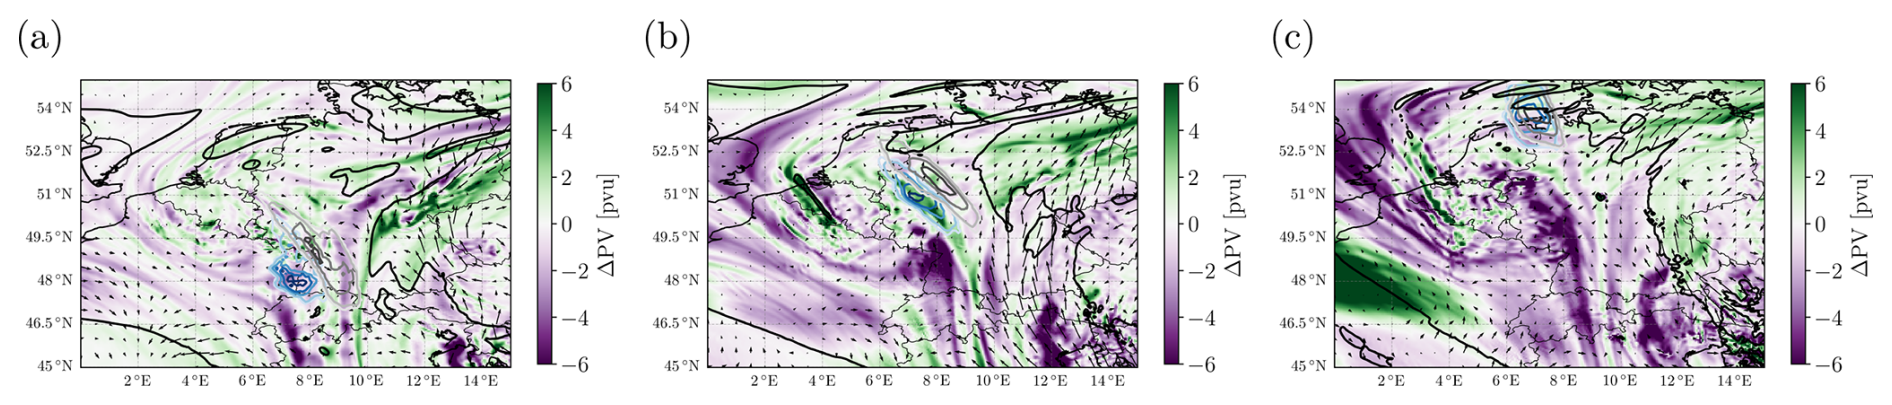
Figure 12Difference in PV at 10.5 km altitude between the ICON simulations initialized at 12:00 UTC on 6 May 2013 and 00:00 UTC on 7 May 2013. The three panels correspond to valid times (a) 01:00 UTC, (b) 07:00 UTC, and (c) 13:00 UTC on 7 May 2013, respectively. The arrows indicate the difference wind field at the same altitude. The contours show the position of back trajectories from the measurement area calculated with the wind field data from 00:00 UTC on 7 May 2013 (gray) and 12:00 UTC on 6 May 2013 (blue), respectively.
The extratropical UTLS is a transition region (ExTL) between the troposphere and the stratosphere, which are characterized by very different chemical composition as well as very different thermodynamic and dynamic properties. The ExTL structure, its spatiotemporal variability, and long-term changes therein are important for our understanding of exchange processes between the troposphere and stratosphere (STE) as well as the climate state in general. Due to large potential temperature and potential vorticity gradients, exchange between the stratosphere and the troposphere at the extratropical tropopause has to be facilitated by diabatic processes. Cirrus clouds frequently occur in the tropopause region and have even been reported to exist in the lowermost stratosphere. Due to the associated latent heating, modified radiative transfer, and turbulence characteristics, cirrus clouds may be one key component shaping the ExTL structure and STE. In this study, we combine observational data from various platforms with high-resolution model simulations and Lagrangian diagnostics to gain insight into the formation of a cirrus cloud observed over the North Sea in chemically and dynamically stratospheric air (Müller et al., 2015) and its impact on the ExTL structure. This specific case of an ExTL cirrus was observed by aircraft-based in situ measurements during the AIRTOSS-ICE campaign in May 2013 and was described previously in Müller et al. (2015).
The AIRTOSS-ICE measurements allow for a unique characterization of the thermodynamic structure of an ExTL cirrus due to the cloud being probed in situ with a dual-platform approach. The observations on a second platform below the aircraft allow us to derive the vertical gradient of potential temperature from measurements as well as its change at the tropopause and in the region of ExTL cirrus. Based on these observations we found a significant difference of gradients in potential temperature inside and outside the cirrus (Sect. 3.2). Inside the cirrus we found weaker (neutral) stability compared to the surrounding, which indicates an influence of the cirrus on the thermodynamical structure of the sampled air masses in the ExTL. This finding could be reproduced in the model simulations, although the simulated gradient of potential temperature inside the cirrus was slightly higher than in the measurements (Sect. 3.3).
High-resolution model simulations (Δx ≈ 3.2 km, Δz ≈ 150–200 m in the ExTL) suggest that the disturbed temperature profile can be explained by radiative cooling towards the cirrus top and weak latent heating within the cirrus. Further, the Lagrangian PV diagnostics show a strong contribution of radiative cooling to the ExTL PV structure in the upper part of the cirrus (Sect. 4.3). This contribution persists throughout the lifetime of the cirrus cloud and overall leads to a significant increase in potential vorticity for trajectories passing close to the cirrus top. Further inside the cirrus layer, however, microphysical (latent) heating causes a (small) decrease in PV consistent with a weakening stratification. Combined with smaller, but still substantial, PV modifications due to turbulent momentum and heat transfer, the radiative PV modification causes a sharpening of the PV gradient in the considered region of the ExTL (Sect. 4.3), diminishing the geometric distance between the 2 and 6 pvu isosurfaces. However, only a small fraction of trajectories transitioned from PV values smaller than to such larger than 2 pvu during the considered time period (≈ 15 h prior to in situ measurements, Sect. 4.3). There is no indication in the model that the ExTL air mass gained additional moisture during this transit through exchange with the troposphere. Most importantly there is no indication of substantial STE of ice particles during the transit. The model rather indicates already relatively humid ExTL conditions in the origin region over southern Germany. High observed relative humidity in close vicinity to the cirrus in chemically stratospheric air is consistent with the already moist ExTL air mass. Moistening through sublimation of the cirrus particles is therefore not required or even unlikely (Sects. 3.2, 4.2). Satellite measurements and radiosonde data confirm the presence of an already moist air mass in the formation region extending into the ExTL. Consistent with the satellite data, the model suggest a persistent existence of cirrus particles since their formation over southern Germany around 12 h before the observation, albeit with varying ice content. During the transit to the measurement area, the air mass was subject to gravity wave activity over central Germany and was steadily lifted by up to 1000 m (Sects. 4.2, 5). The formation conditions match the slow updraft type of in situ cirrus.
Note that these results slightly differ from the results by Müller et al. (2015), where trajectory analysis indicated ice particle formation slightly before the measurements during slow ascent to the measurement region. However, these results were deduced from a coarser analysis data set. Satellite data are consistent with an earlier cirrus formation as seen in our model data, but there remains some uncertainty regarding the representation of ice nucleation via deposition nucleation and homogeneous nucleation in the ICON model. The model may have too active deposition nucleation, which is expected to favor cirrus formation at (slightly) earlier times in the thermodynamic evolution seen along the trajectories in our study. Furthermore, note that the in situ gradient information as measured by the TOSS is new in our study. The decrease in stratification inside the cirrus layer is less pronounced in the model than in the observations. Shallow cirrus convection as proposed by Spichtinger (2014) could be a plausible process responsible for the stronger redistribution of potential temperature since the vertical model resolution does not allow for the explicit representation of convection at these small scales. Neither does the vertical model resolution allow for the representation of the strong vertical temperature gradient at the cloud top as evident in the observation due to only two to three model levels in the relevant area.
Regarding the diabatic impact of the cirrus layer on the tropopause structure, we found a strong contribution from radiation on the PV change for our case – even higher than the impact from turbulence. These results differ from Spreitzer et al. (2019), who found a stronger contribution by turbulence. In our case, trajectories indicate very high values of humidity in the lower stratosphere 12 h prior to the measurements, with high values of relative humidity with respect to ice also outside the cirrus layer. It is noteworthy that the cirrus particles persisted during the transit in (over)saturated air, while only a few of the corresponding trajectories changed from tropospheric to stratospheric PV values. The model does not indicate cirrus particles in the ExTL at the start of the simulation, which implies the in situ formation of the ice particles in the ExTL during the transit time. The conditions permitting cirrus formation (i.e., sufficient humidity) were present in this particular region of the ExTL. The source process that transported the high amounts of humidity into the lower stratospheric layer where the cirrus particles were measured could not conclusively be identified. A model simulation with an earlier start date failed to reproduce the ExTL cirrus cloud and therefore did not allow us to trace the air mass history over a larger time horizon. In the shorter simulation, the origin of the comparatively high amounts of water vapor could be traced back to an already humid air mass around the transition layer prior to the measurements. Processes that can contribute to enhanced near-tropopause humidity in the extratropics have been suggested to include WCB outflow and convective activity. ERA5-based WCB diagnostics suggest some influence of (aged) WCB outflow in the source region, while satellite data show convective activity over eastern Germany in the 36 h preceding the observations. Hence, both meteorological features could have influenced the ExTL humidity in the source area over southern Germany; however, our analysis provides no definite proof of the influence and importance of either feature. This study might point towards a relevant process for cross-tropopause exchange and diabatic PV modification, which has been underestimated so far due to the limited capability of models and analysis data to resolve the underlying processes.
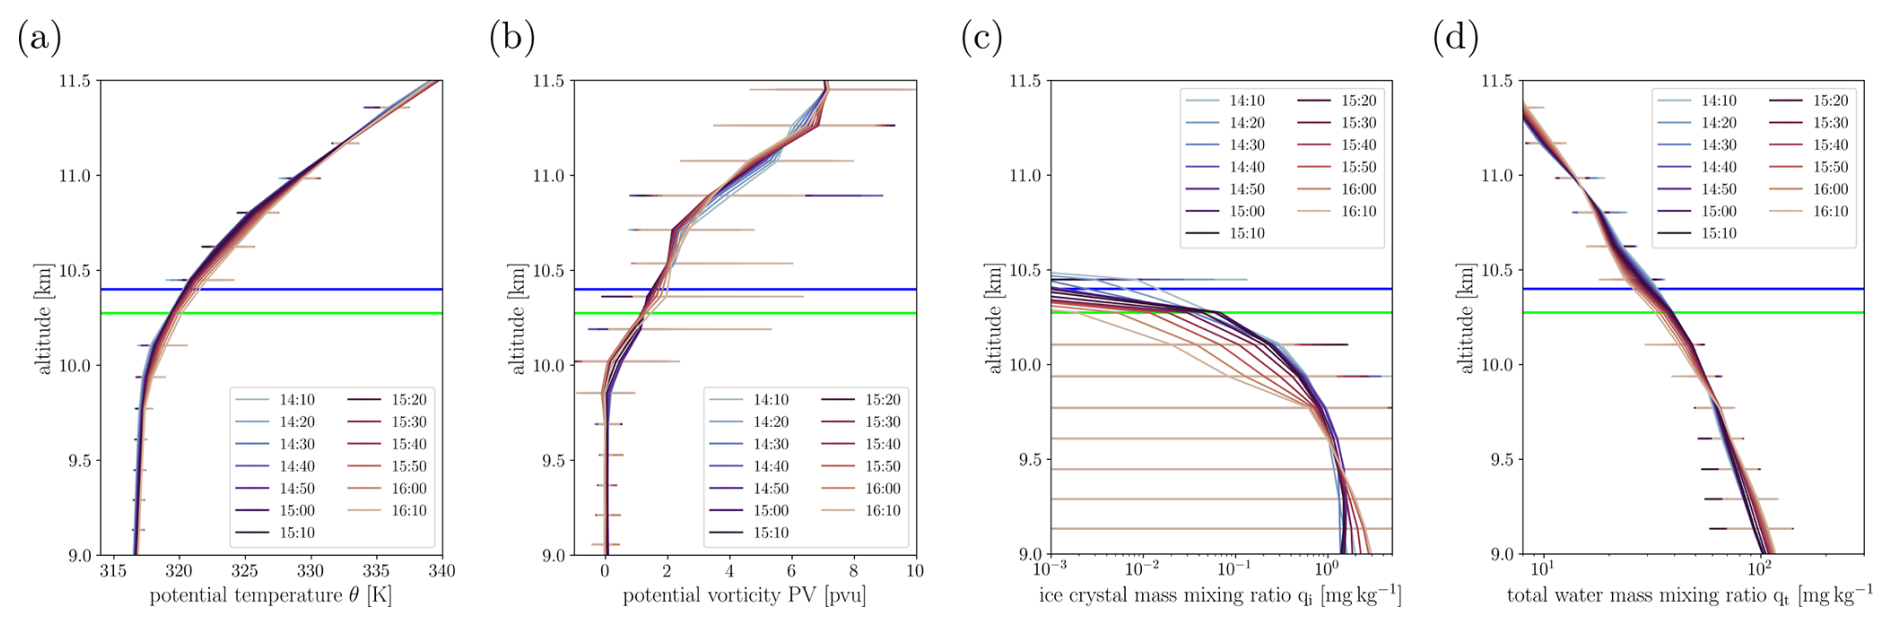
Figure A1Height profiles of the average (a) potential temperature, (b) potential vorticity, (c) total water mass mixing ratio, and (d) ice mass mixing ratio from the ICON simulation. The different line colors represent profiles sampled at different times between 14:10 and 16:10 UTC on 7 May 2013. Averages are taken over all grid points within 6.5–7.5 and 54.3–55.1° E; spatial variability as represented by the maximum and minimum value at a particular altitude is shown in the bars. The average altitude of the Learjet leg discussed in Sect. 3.2 is indicated by the dark-blue horizontal line and that of the TOSS by the green horizontal line. The simulation starting at 12:00 UTC on 6 May 2013 is shown.
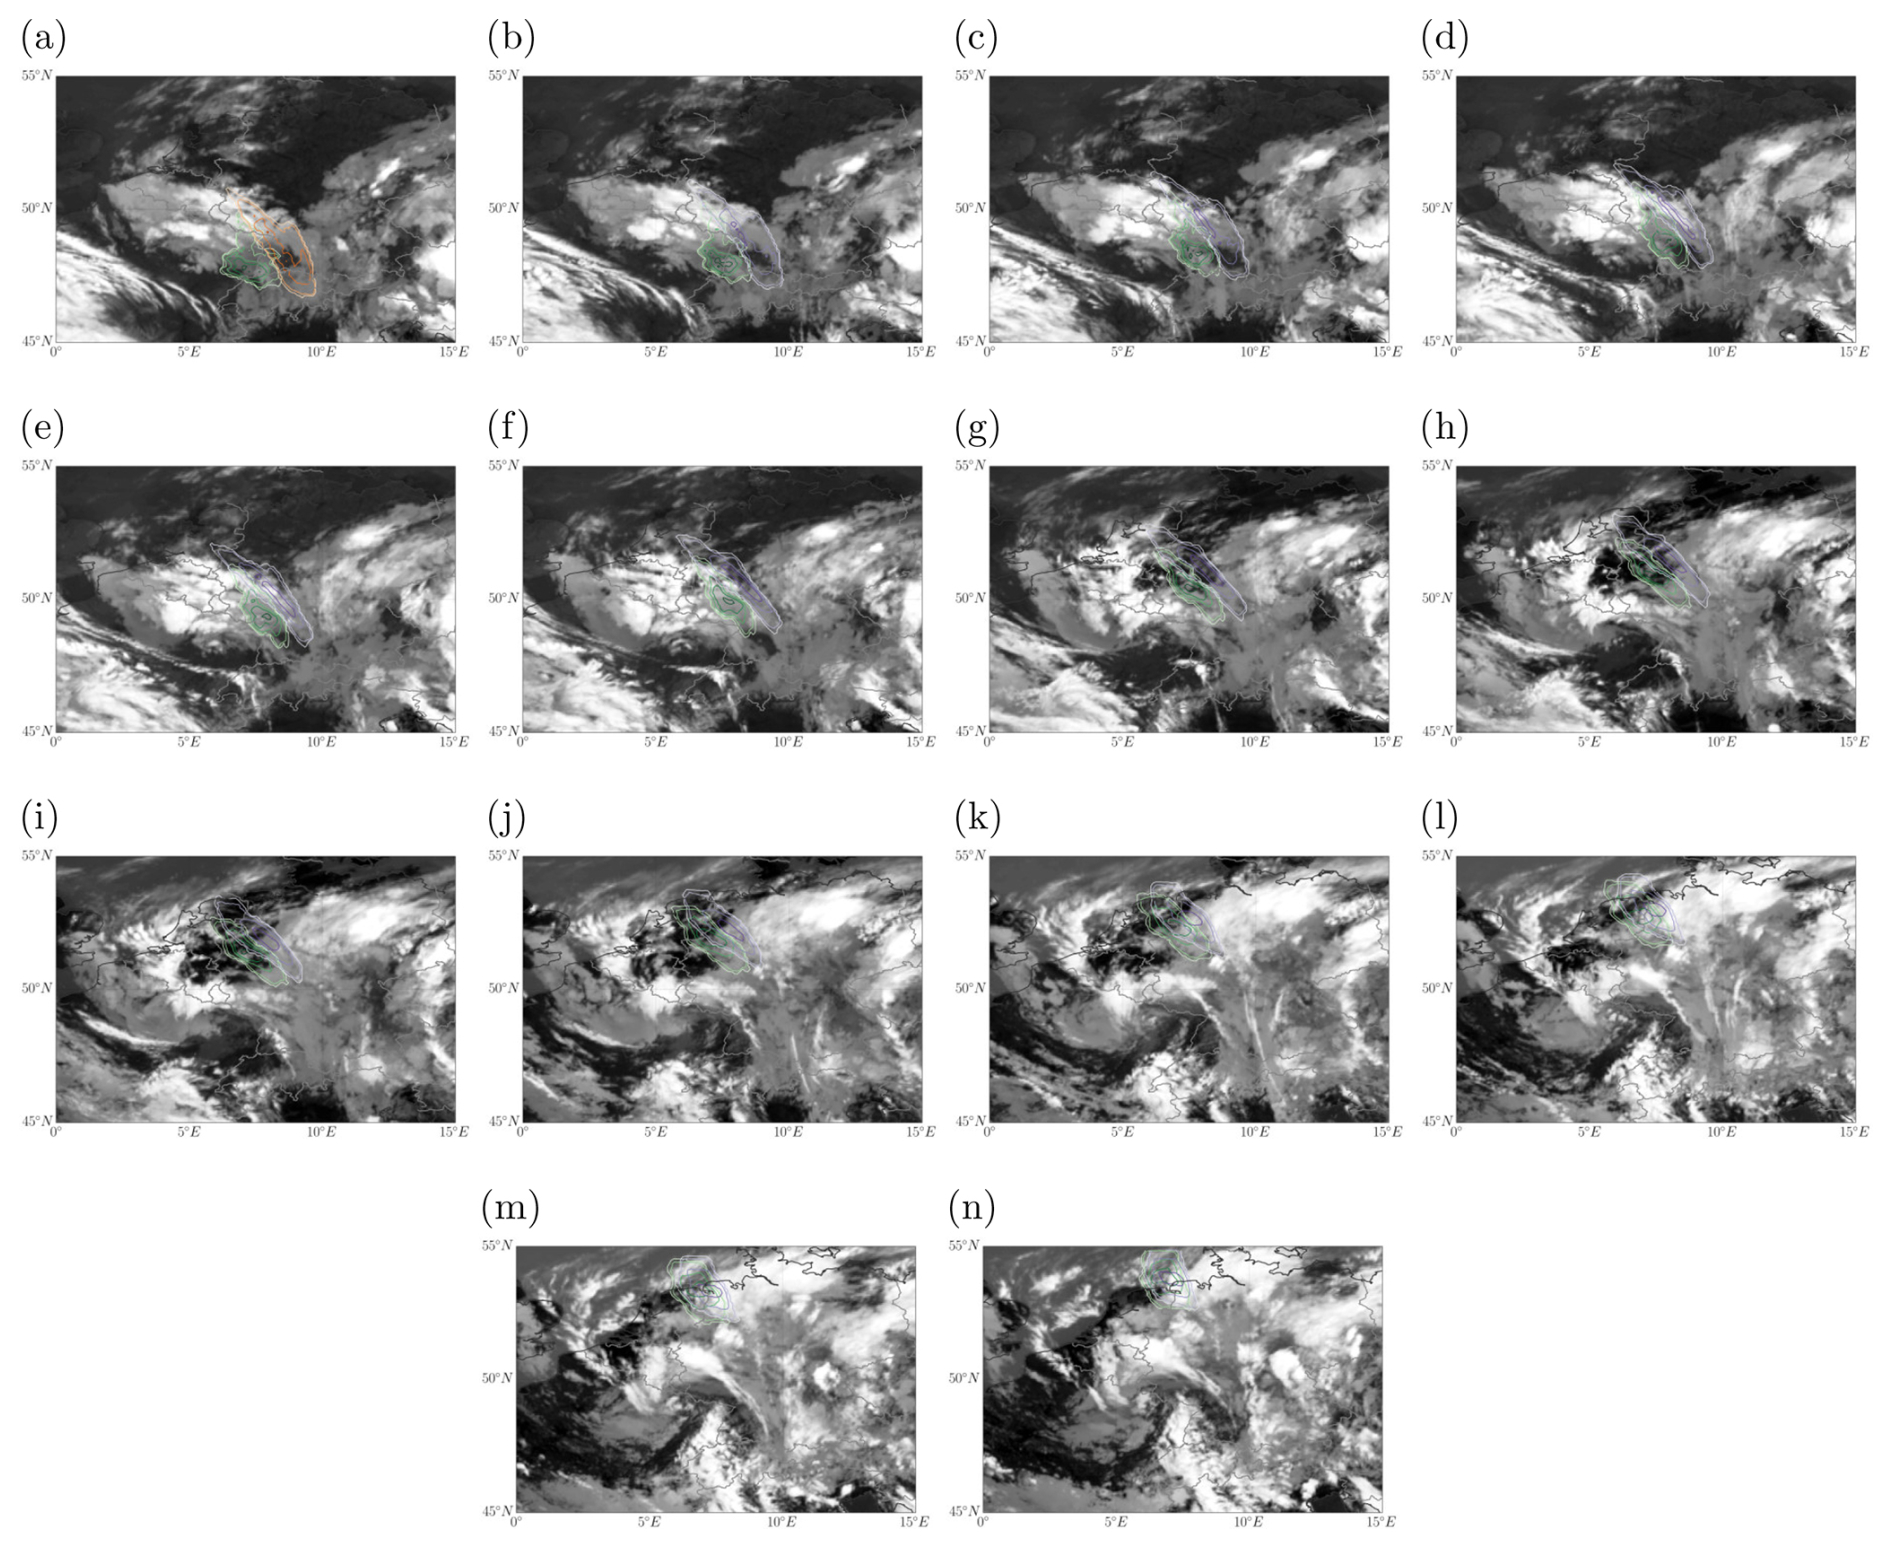
Figure A2Meteosat Second Generation (MSG) satellite images at 10.8 µm. The observation time increases from top left to bottom right from 00:00 to 13:00 UTC on 7 May 2013. The contours indicate the position of back trajectories from the measurement area based on the simulation initialized at 00:00 UTC on 7 May 2013 (purple) and 12:00 UTC on 6 May 2013 (green), respectively.
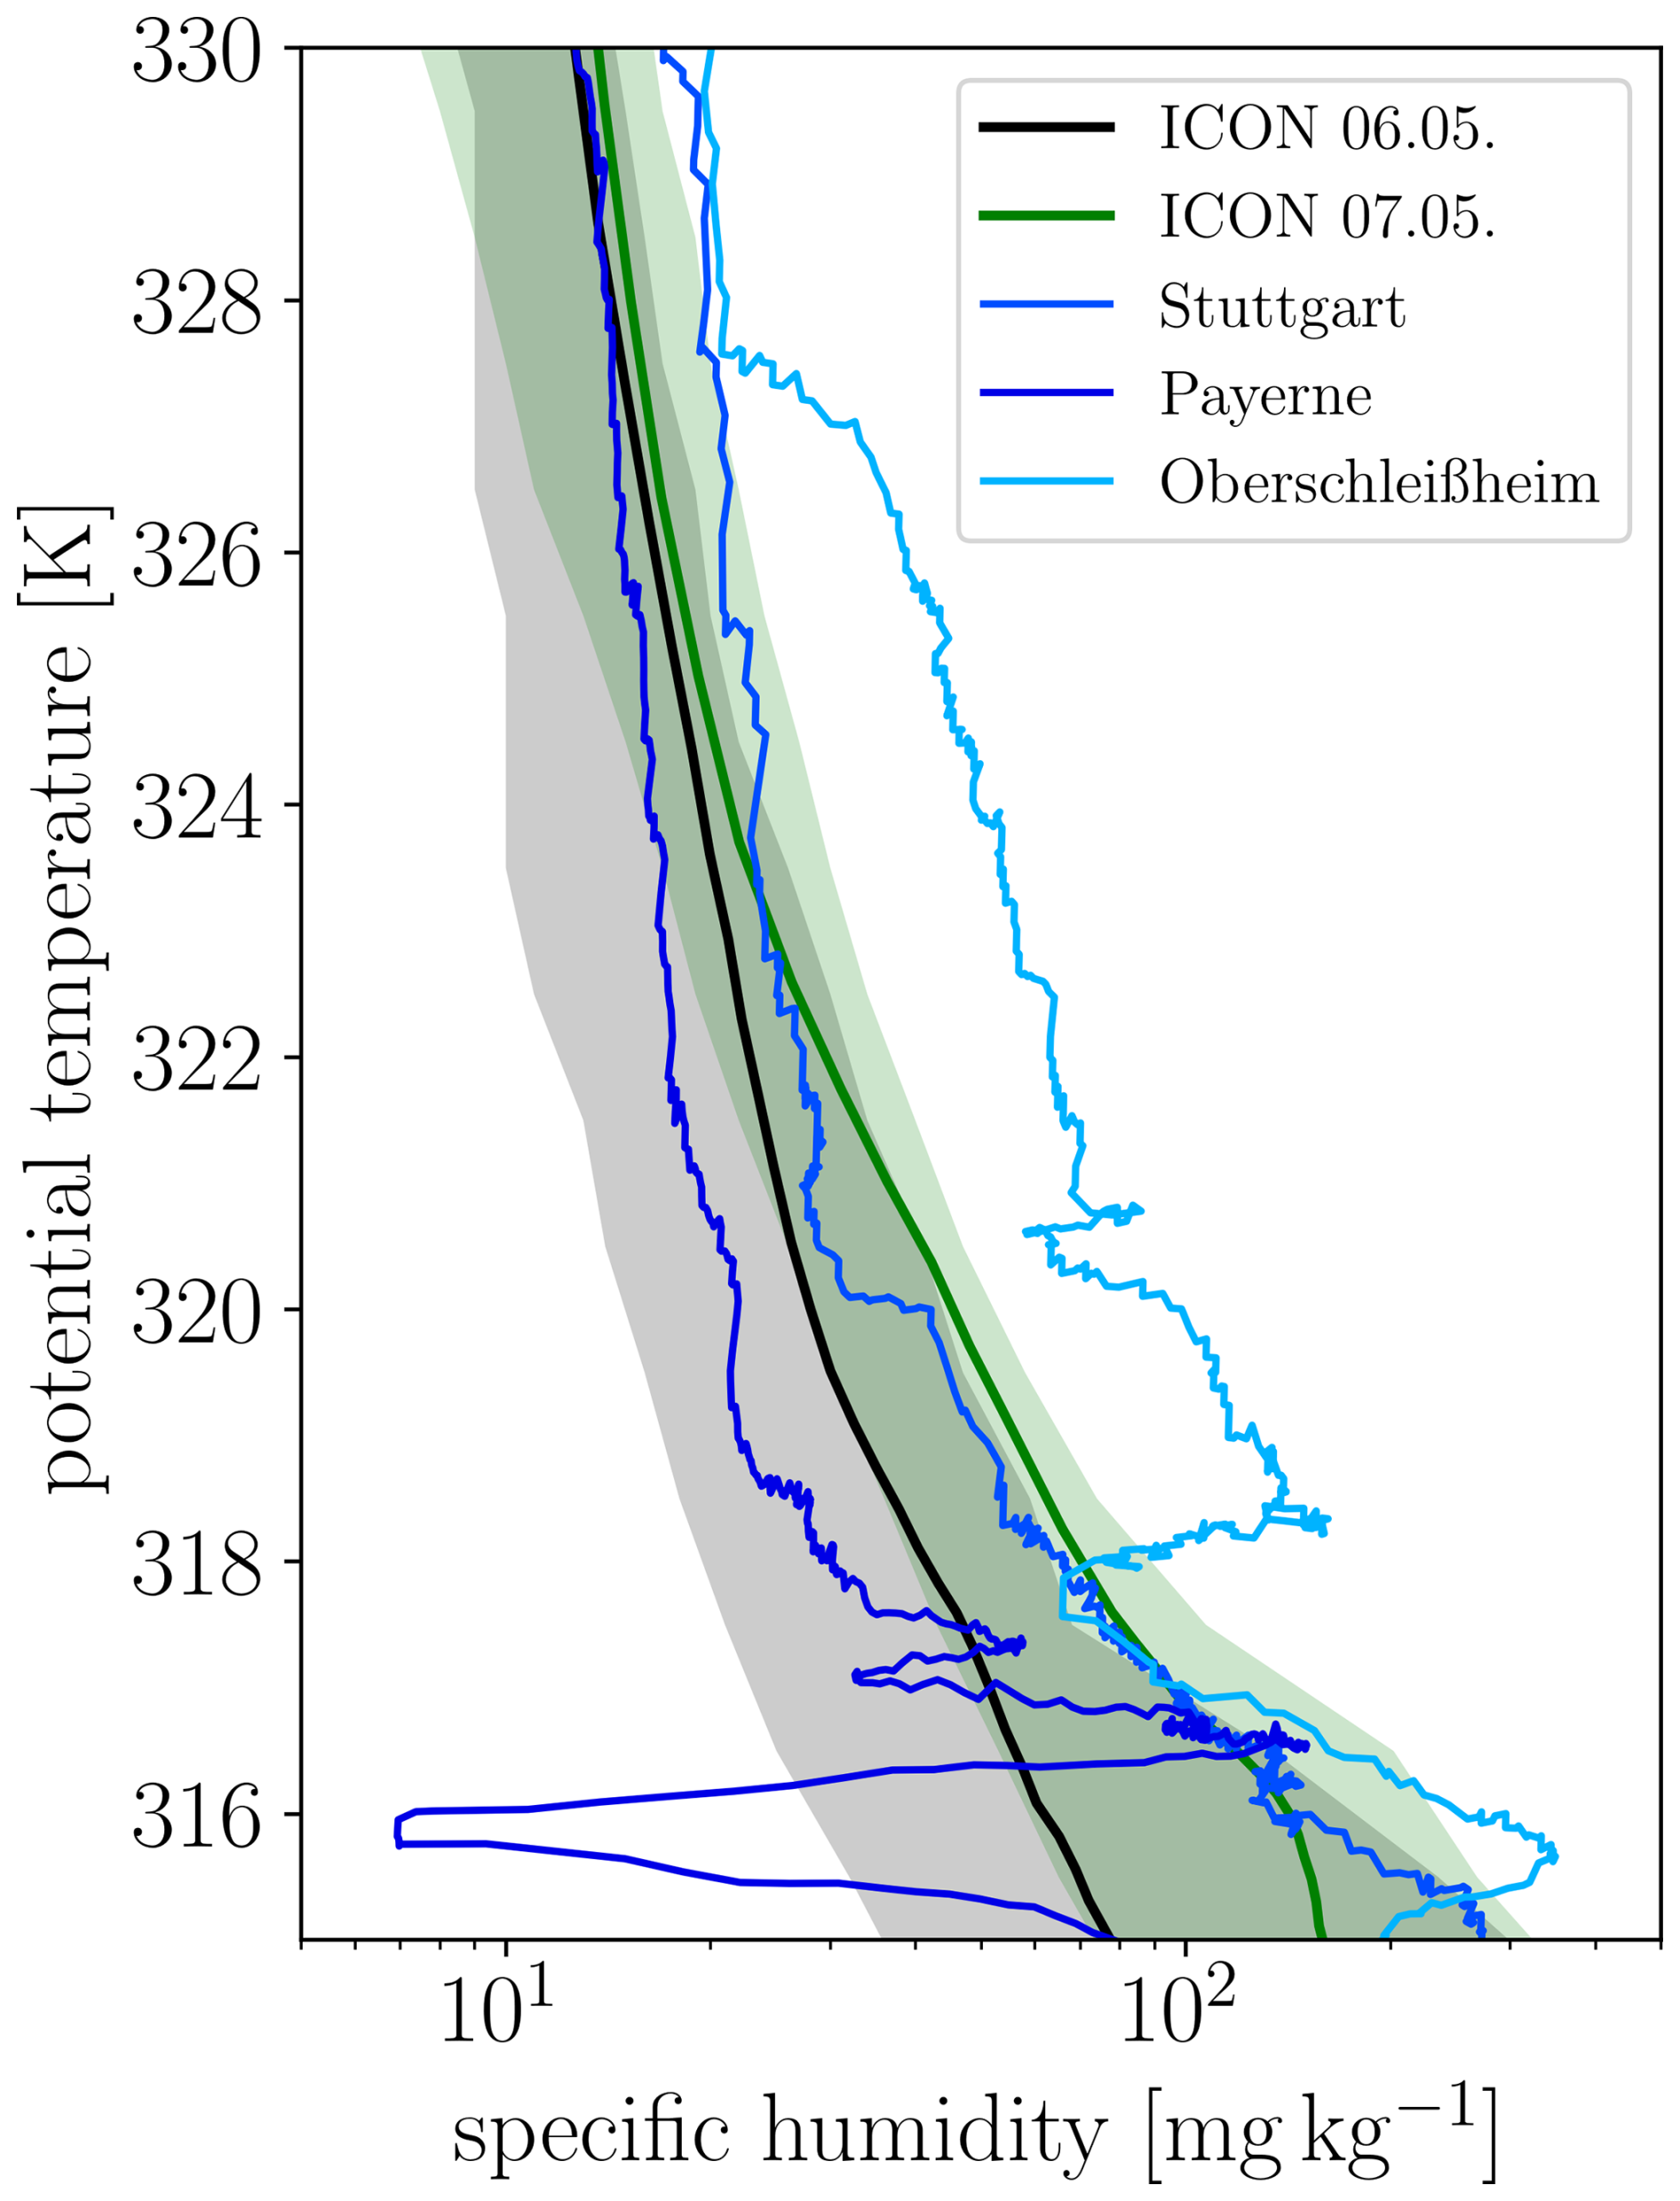
Figure A3Specific humidity profile as a function of potential temperature at 00:00 UTC on 7 May 2013 from three radio sounding sides (red) and the ICON model simulations sampled over the origin region of the trajectories (shown in the left panel). Black and green colors correspond to ICON initialization dates of 12:00 UTC on 6 May 2013 and 00:00 UTC on 7 May 2013, respectively. In contrast to Fig. 11 the simulations have been sampled in their respective trajectory source areas. The solid line shows the median profile, and the shading indicates the 5th to 95th percentile range.
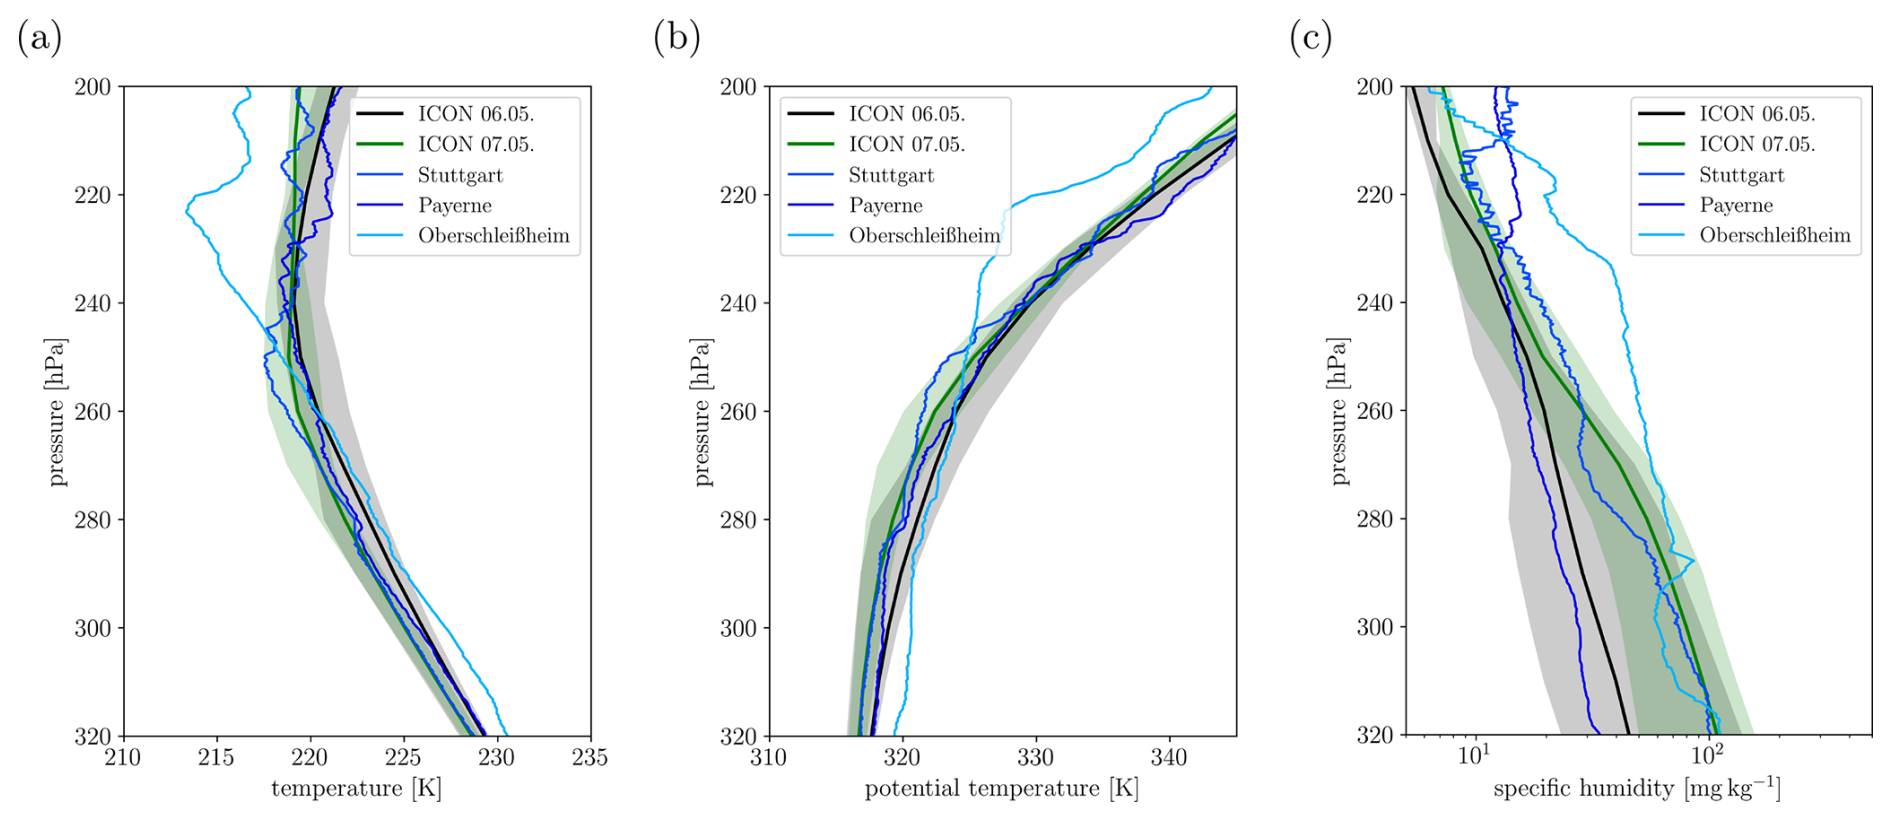
Figure A4(a) Temperature, (b) potential temperature, and (c) specific humidity as a function of pressure from three radio sounding sides (red) and the ICON model simulations sampled over the origin region of the trajectories (shown in Fig. 11). Black and green colors correspond to ICON initialization dates of 12:00 UTC on 6 May 2013 and 00:00 UTC on 7 May 2013, respectively. In contrast to Fig. 11 the simulations have been sampled in their respective trajectory source areas. The solid line shows the median profile, and the shading indicates the 5th to 95th percentile range.
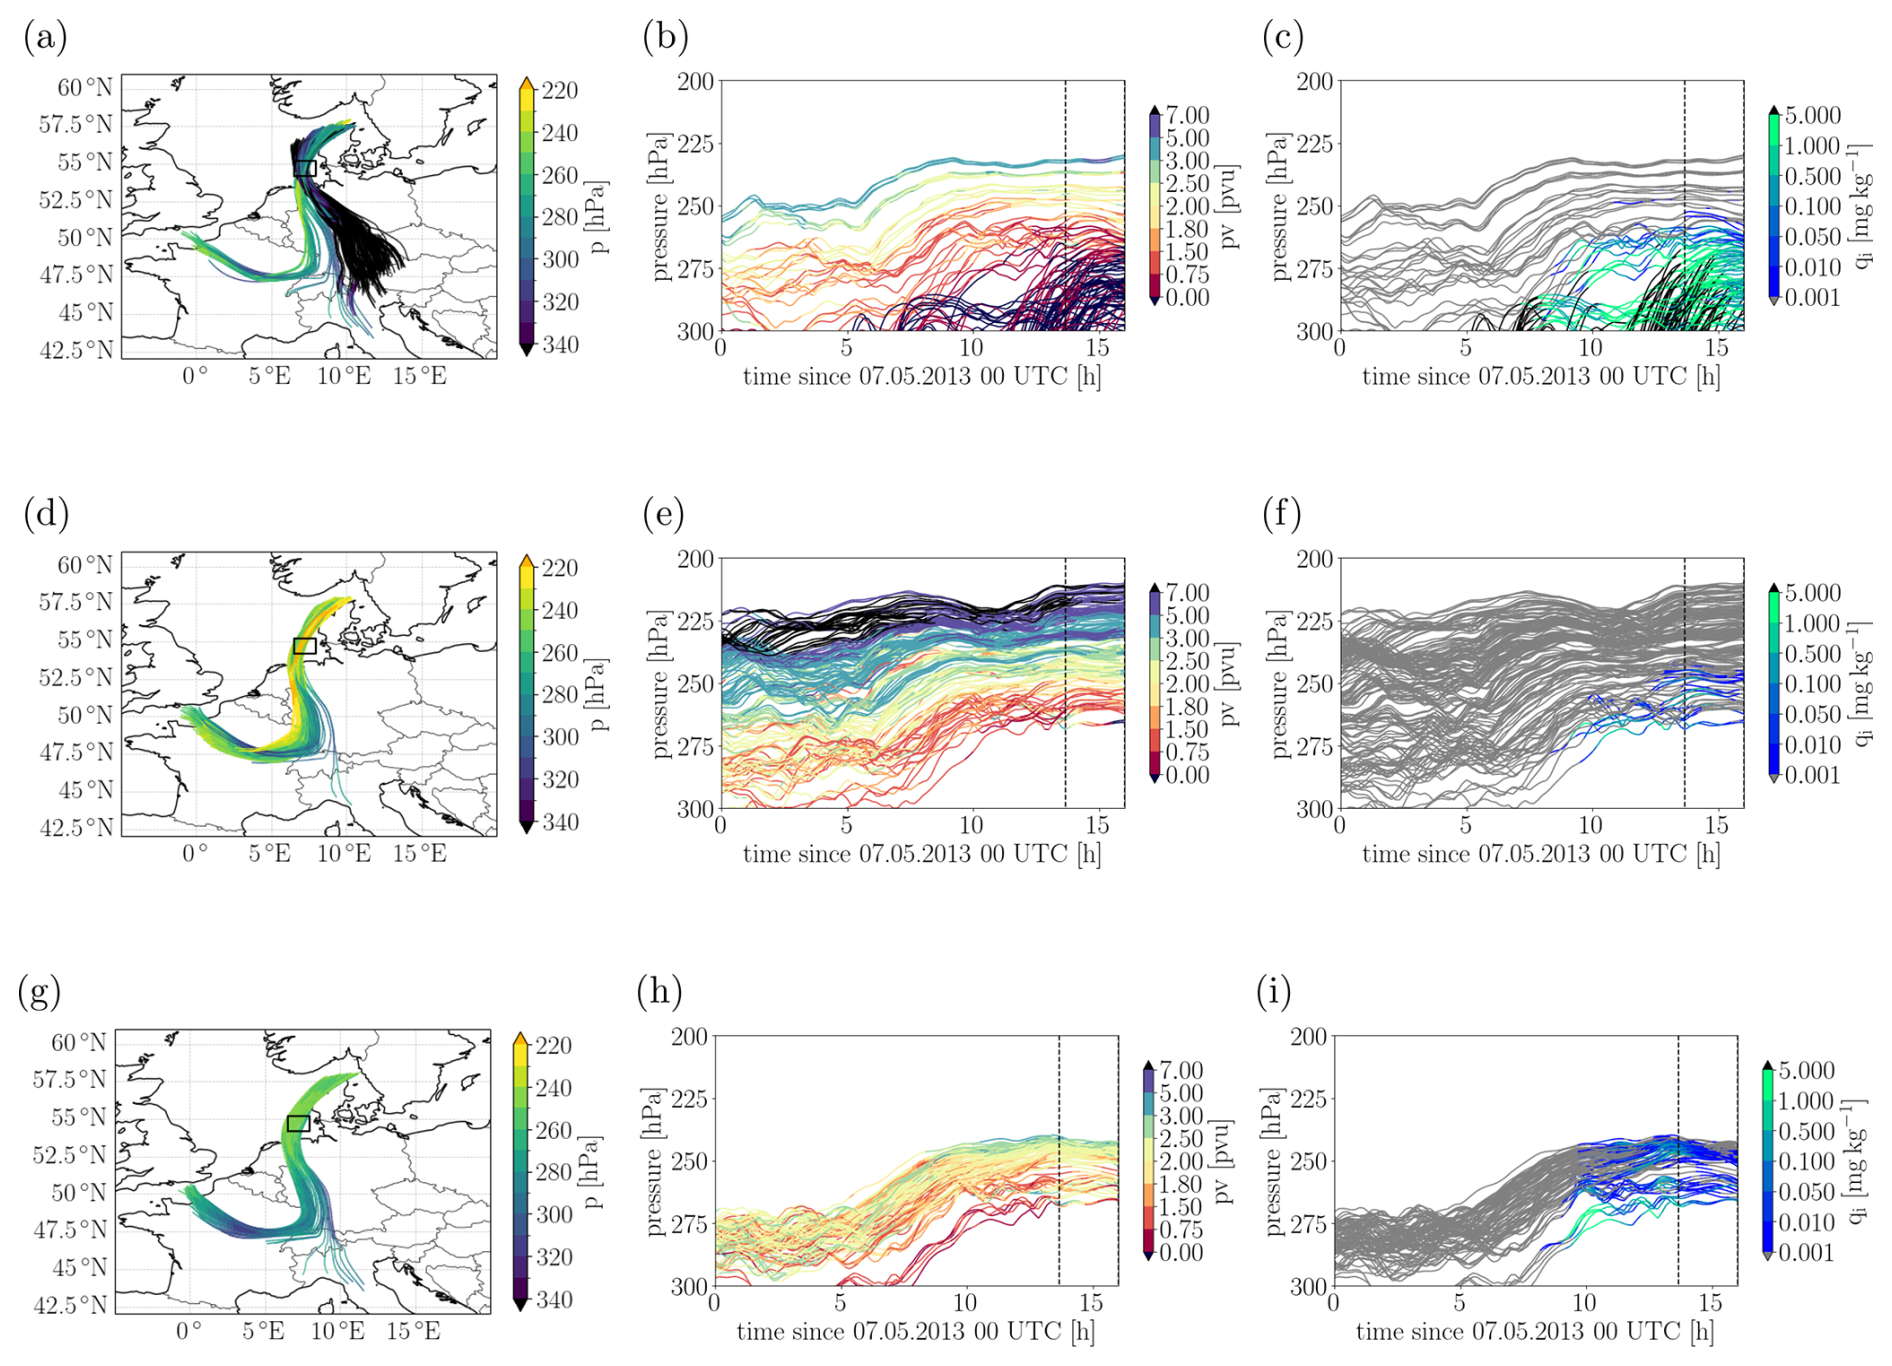
Figure A5Path of trajectories arriving in the measurement area between 13:40:00 and 16:00:00 UTC with (a, b, c) tropospheric marker, (d, e, f) stratospheric marker, and (g, h, i) PV ≥ 2 pvu and qi ≥ 10−3 mg kg−1. Simulation starts at 12:00 UTC on 6 May 2013.
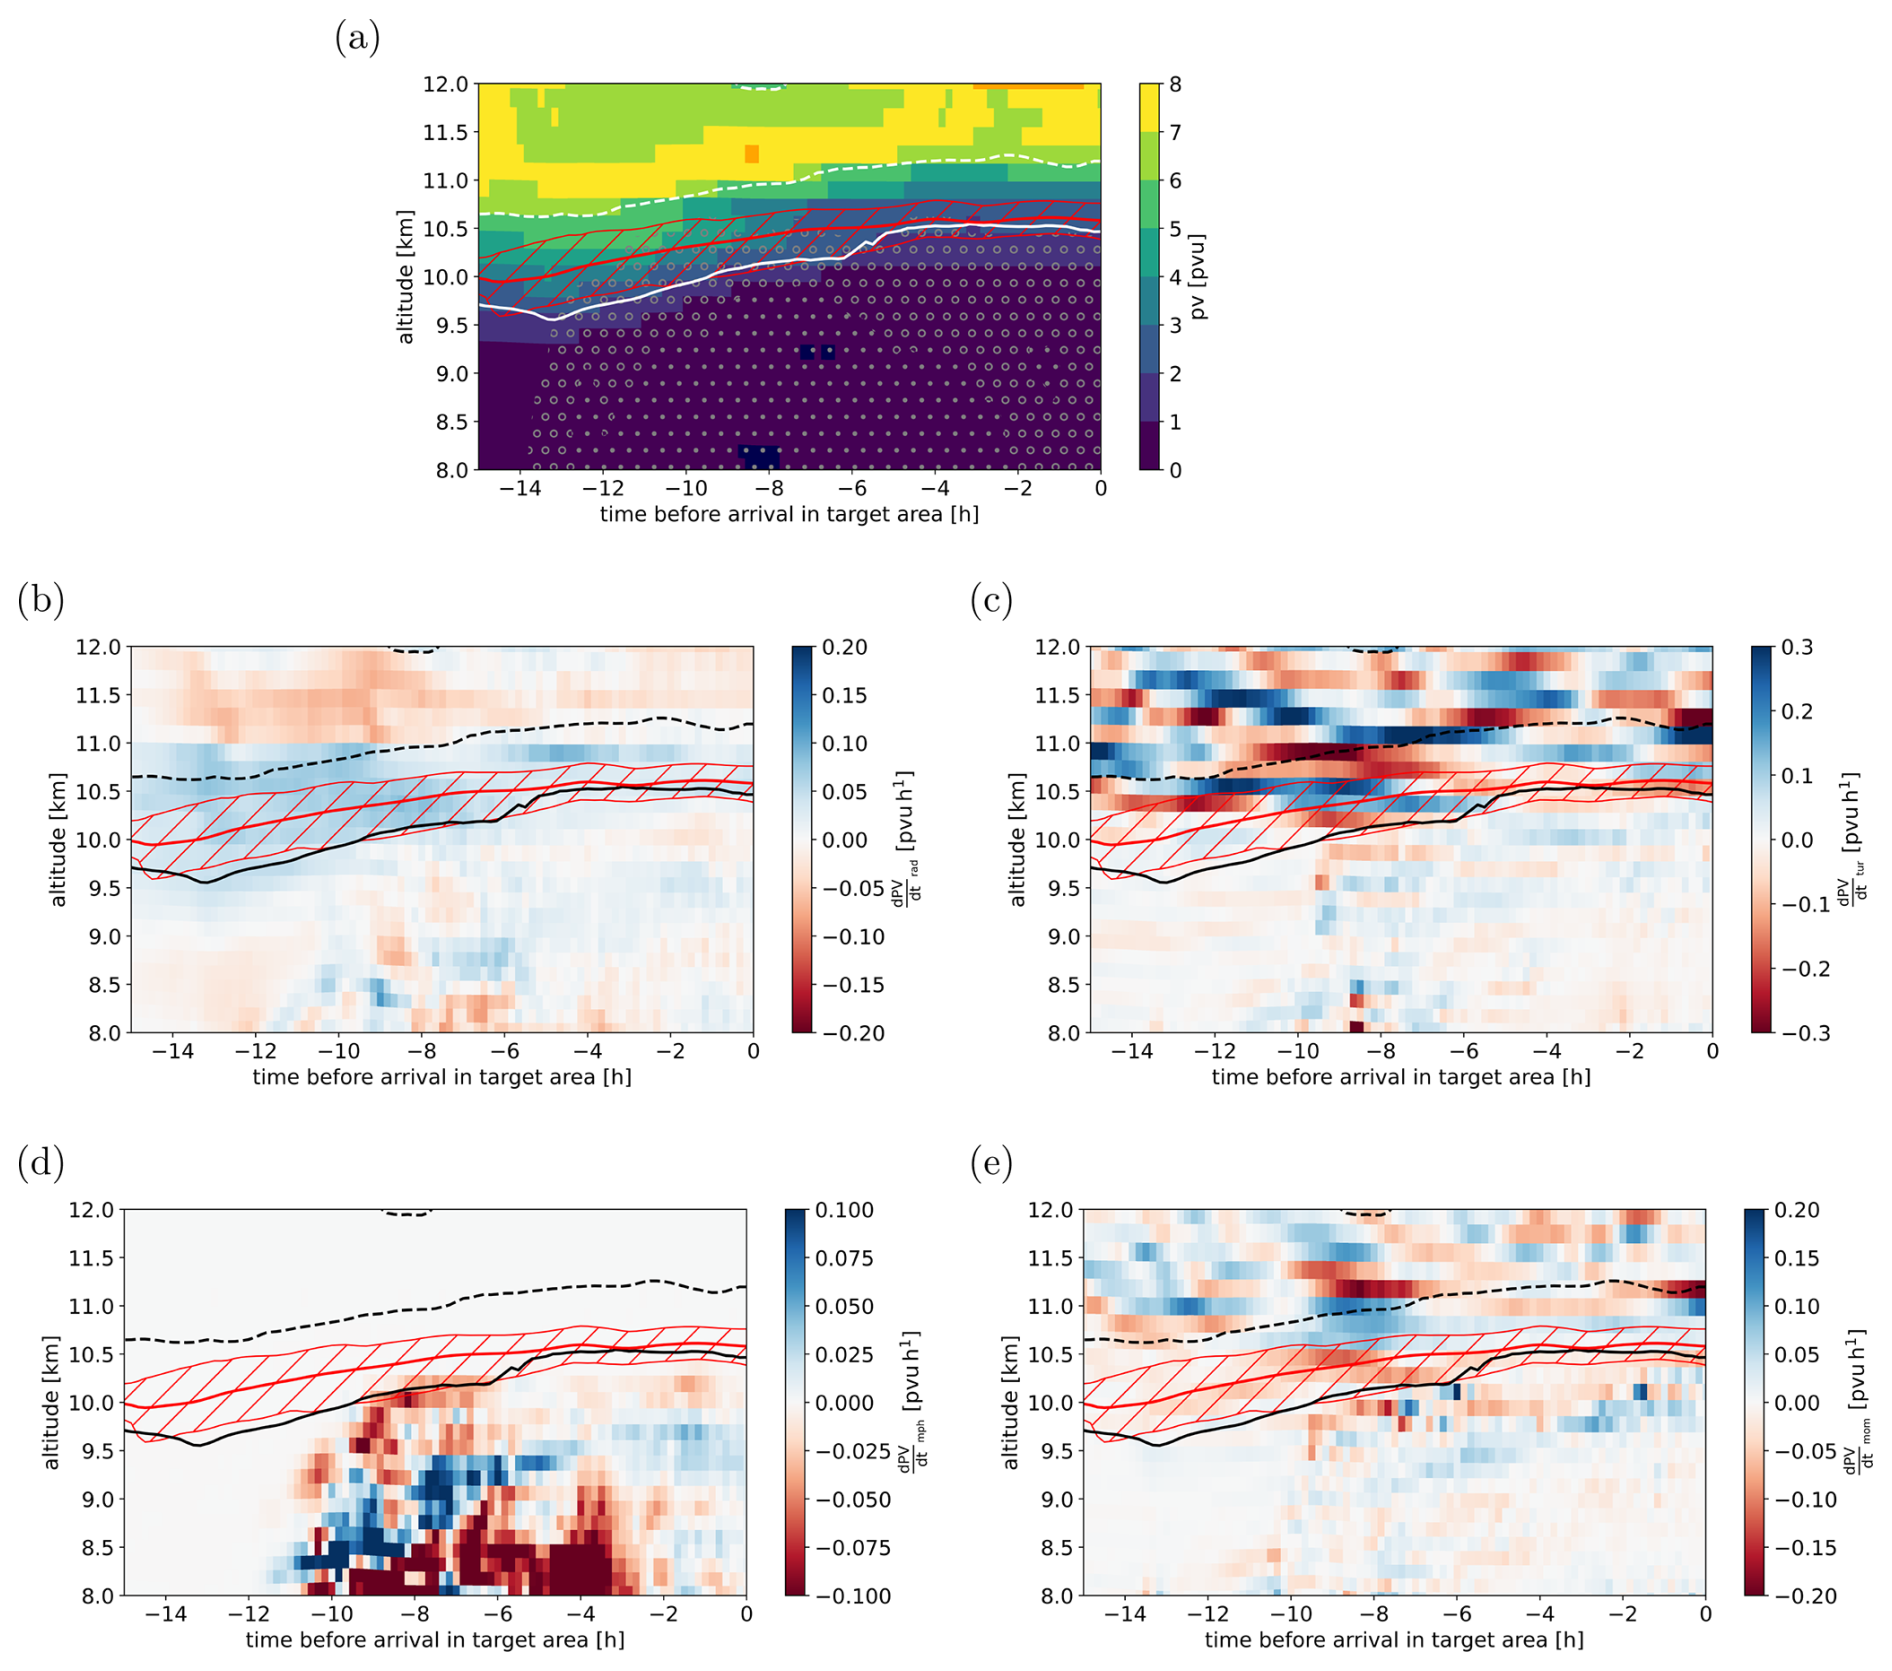
Figure A6Composite profile along air parcels arriving in the measurement area with PV ≥ 2 pvu and qi ≥ 10−3 mg kg−1 from the simulation started at 12:00 UTC on 6 May 2013: variables shown are (a) PV, (b) PV tendency from radiation parameterization, (c) PV tendency from latent heating by turbulence parameterization, (d) PV tendency from microphysics parameterization, and (e) PV tendency from momentum transport by turbulence parameterization. The columns have been retrieved from 10 min Eulerian output at the native ICON grid and have been interpolated to the horizontal location of the air parcels.
The observational data from Learjet and TOSS as well as derived time series are published on Zenodo https://doi.org/10.5281/zenodo.14235063, Emig (2024). The main model data used in this paper as well as all programs used for postprocessing and visualizing model data are also published on Zenodo https://doi.org/10.5281/zenodo.15396795, Miltenberger (2025). The ICON model code is not published, as the model version used here predates the open-source release of ICON. The radiosonde data from the German stations Oberschleißheim, Stuttgart, and Norderney were obtained from https://opendata.dwd.de/climate_environment/CDC/observations_germany/radiosondes/high_resolution/historical/, last access: 12 September 2025. The high-resolution radio sounding data from Payerne were kindly provided by Philipp Bättig from MeteoSwiss. MSG satellite data were accessed through EUMETSAT. IFS analysis data for model initialization were obtained from ECMWF.
The supplement related to this article is available online at https://doi.org/10.5194/acp-25-13077-2025-supplement.
NE analyzed the observational data. AM conducted and analyzed the ICON simulations. All authors contributed to the design and writing of the manuscript.
At least one of the (co-)authors is a member of the editorial board of Atmospheric Chemistry and Physics. The peer-review process was guided by an independent editor, and the authors also have no other competing interests to declare.
Publisher’s note: Copernicus Publications remains neutral with regard to jurisdictional claims made in the text, published maps, institutional affiliations, or any other geographical representation in this paper. While Copernicus Publications makes every effort to include appropriate place names, the final responsibility lies with the authors.
This article is part of the special issue “The tropopause region in a changing atmosphere (TPChange) (ACP/AMT/GMD/WCD inter-journal SI)”. It is not associated with a conference.
Funded by the Deutsche Forschungsgemeinschaft (DFG, German Research Foundation), TRR 301, project ID 428312742, projects B01, B08, and Z01. The authors gratefully acknowledge the computing time granted on the supercomputer MOGON 2 at Johannes Gutenberg University Mainz (https://hpc.uni-mainz.de/, last access: 12 September 2025), which is a member of the AHRP (Alliance for High Performance Computing in Rhineland Palatinate, https://www.ahrp.info/, last access: 12 September 2025) and the Gauss Alliance e.V. Figures 10 and A2 contain modified EUMETSAT Meteosat Second Generation HRSEVIRI data. The native HRSEVIRI data have been download via EUMDAC in February 2024. Philipp Bättig from MeteoSwiss kindly provided the high-resolution sounding data from Payerne. Hans-Christoph Lachnitt provided the interpolated ERA5 PV data at the Learjet position.
This research has been supported by the Deutsche Forschungsgemeinschaft (grant no. 428312742).
This open-access publication was funded by Johannes Gutenberg University Mainz.
This paper was edited by Aurélien Podglajen and reviewed by two anonymous referees.
Avery, M., Winker, D., Heymsfield, A., Vaughan, M., Young, S., Hu, Y., and Trepte, C.: Cloud ice water content retrieved from the CALIOP space-based lidar, Geophys. Res. Lett., 39, L05808, https://doi.org/10.1029/2011GL050545, 2012. a
Bechtold, P., Koehler, M., Jung, T., Doblas-Reyes, F., Leutbecher, M., Rodwell, M. J., Vitart, F., and Balsamo, G.: Advances in simulating atmospheric variability with the ECMWF model: From synoptic to decadal time-scales, Q. J. Roy. Meteor. Soc., 134, 1337–1351, https://doi.org/10.1002/qj.289, 2008. a
Bönisch, H., Engel, A., Curtius, J., Birner, Th., and Hoor, P.: Quantifying transport into the lowermost stratosphere using simultaneous in-situ measurements of SF6 and CO2, Atmos. Chem. Phys., 9, 5905–5919, https://doi.org/10.5194/acp-9-5905-2009, 2009. a
Buchholz, B. and Ebert, V.: Absolute, pressure-dependent validation of a calibration-free, airborne laser hygrometer transfer standard (SEALDH-II) from 5 to 1200 ppmv using a metrological humidity generator, Atmos. Meas. Tech., 11, 459–471, https://doi.org/10.5194/amt-11-459-2018, 2018. a
Butchart, N.: The Brewer-Dobson circulation, Rev. Geophys., 52, 157–184, https://doi.org/10.1002/2013RG000448, 2014. a
Danielsen, E. F.: Stratospheric-Tropospheric Exchange Based on Radioactivity, Ozone and Potential Vorticity, J. Atmos. Sci., 25, 502–518, https://doi.org/10.1175/1520-0469(1968)025<0502:STEBOR>2.0.CO;2, 1968. a
Dessler, A. E., Hintsa, E. J., Weinstock, E. M., Anderson, J. G., and Chan, K. R.: Mechanisms controlling water vapor in the lower stratosphere: “A tale of two stratospheres”, J. Geophys. Res.-Atmos., 100, 23167–23172, https://doi.org/10.1029/95JD02455, 1995. a
Dye, J. E. and Baumgardner, D.: Evaluation of the Forward Scattering Spectrometer Probe. Part I: Electronic and Optical Studies, J. Atmos. Ocean. Tech., 1, 329–344, https://doi.org/10.1175/1520-0426(1984)001<0329:EOTFSS>2.0.CO;2, 1984. a
ECMWF: IFS Documentation CY43R1 – Part IV: Physical processes, ECMWF Rep., https://doi.org/10.21957/sqvo5yxja, 2016. a
Emig, N.: AIRTOSS-ICE may 7th 2013 observational data [Data set], Zenodo https://doi.org/10.5281/zenodo.14235063, 2024. a
Engel, A., Bönisch, H., Brunner, D., Fischer, H., Franke, H., Günther, G., Gurk, C., Hegglin, M., Hoor, P., Königstedt, R., Krebsbach, M., Maser, R., Parchatka, U., Peter, T., Schell, D., Schiller, C., Schmidt, U., Spelten, N., Szabo, T., Weers, U., Wernli, H., Wetter, T., and Wirth, V.: Highly resolved observations of trace gases in the lowermost stratosphere and upper troposphere from the Spurt project: an overview, Atmos. Chem. Phys., 6, 283–301, https://doi.org/10.5194/acp-6-283-2006, 2006. a
Fischer, H., Wienhold, F. G., Hoor, P., Bujok, O., Schiller, C., Siegmund, P., Ambaum, M., Scheeren, H. A., and Lelieveld, J.: Tracer correlations in the northern high latitude lowermost stratosphere: Influence of cross-tropopause mass exchange, Geophys. Res. Lett., 27, 97–100, 2000. a
Fischer, H., Birk, M., Blom, C., Carli, B., Carlotti, M., von Clarmann, T., Delbouille, L., Dudhia, A., Ehhalt, D., Endemann, M., Flaud, J. M., Gessner, R., Kleinert, A., Koopman, R., Langen, J., López-Puertas, M., Mosner, P., Nett, H., Oelhaf, H., Perron, G., Remedios, J., Ridolfi, M., Stiller, G., and Zander, R.: MIPAS: an instrument for atmospheric and climate research, Atmos. Chem. Phys., 8, 2151–2188, https://doi.org/10.5194/acp-8-2151-2008, 2008. a
Forster, P. M. d. F. and Shine, K. P.: Assessing the climate impact of trends in stratospheric water vapor, Geophys. Res. Lett., 29, 10-1–10-4, https://doi.org/10.1029/2001GL013909, 2002. a, b
Frey, W., Eichler, H., de Reus, M., Maser, R., Wendisch, M., and Borrmann, S.: A new airborne tandem platform for collocated measurements of microphysical cloud and radiation properties, Atmos. Meas. Tech., 2, 147–158, https://doi.org/10.5194/amt-2-147-2009, 2009. a
Gettelman, A., Hoor, P., Pan, L. L., Randel, W. J., Hegglin, M. I., and Birner, T.: The extratropical upper troposphere and lower stratosphere, Rev. Geophys., 49, RG3003, https://doi.org/10.1029/2011RG000355, 2011. a
Haynes, P. H. and Shuckburgh, E.: Effective diffusivity as a diagnostic of atmospheric transport: 1. Stratosphere, J. Geophys. Res.-Atmos., 105, 22777–22794, https://doi.org/10.1029/2000JD900093, 2000. a
Hegglin, M. I., Boone, C. D., Manney, G. L., and Walker, K. A.: A global view of the extratropical tropopause transition layer from Atmospheric Chemistry Experiment Fourier Transform Spectrometer O3, H2O, and CO, J. Geophys. Res., 114, D00B11, https://doi.org/10.1029/2008JD009984, 2009. a
Hogan, R. J. and Bozzo, A.: A Flexible and Efficient Radiation Scheme for the ECMWF Model, J. Adv. Model. Earth Sy., 10, 1990–2008, https://doi.org/10.1029/2018MS001364, 2018. a
Holton, J. R., Haynes, P. H., McIntyre, M. E., Douglass, A. R., Rood, R. B., and Pfister, L.: Stratosphere-troposphere exchange, Rev. Geophys., 33, 403–439, https://doi.org/10.1029/95RG02097, 1995. a
Homeyer, C. R.: Numerical simulations of extratropical tropopause penetrating convection: Sensitivities to grid resolution, J. Geophys. Res., 120, 7174–7188, https://doi.org/10.1002/2015JD023356, 2015. a
Homeyer, C. R., McAuliffe, J. D., and Bedka, K. M.: On the development of above-anvil cirrus plumes in extratropical convection, J. Atmos. Sci., 74, 1617–1633, https://doi.org/10.1175/JAS-D-16-0269.1, 2017. a
Hoor, P., Fischer, H., Lange, L., Lelieveld, J., and Brunner, D.: Seasonal variations of a mixing layer in the lowermost stratosphere as identified by the CO-O3 correlation from in situ measurements, J. Geophys. Res.-Atmos., 107, ACL 1-1–ACL 1–11, https://doi.org/10.1029/2000JD000289, 2002. a
Hoor, P., Gurk, C., Brunner, D., Hegglin, M. I., Wernli, H., and Fischer, H.: Seasonality and extent of extratropical TST derived from in-situ CO measurements during SPURT, Atmos. Chem. Phys., 4, 1427–1442, https://doi.org/10.5194/acp-4-1427-2004, 2004. a
Hoor, P., Fischer, H., and Lelieveld, J.: Tropical and extratropical tropospheric air in the lowermost stratosphere over Europe: A CO-based budget, Geophys. Res. Lett., 32, L07802, https://doi.org/10.1029/2004GL022018, 2005. a
Joppe, P., Schneider, J., Kaiser, K., Fischer, H., Hoor, P., Kunkel, D., Lachnitt, H.-C., Marsing, A., Röder, L., Schlager, H., Tomsche, L., Voigt, C., Zahn, A., and Borrmann, S.: The influence of extratropical cross-tropopause mixing on the correlation between ozone and sulfate aerosol in the lowermost stratosphere, Atmos. Chem. Phys., 24, 7499–7522, https://doi.org/10.5194/acp-24-7499-2024, 2024. a
Kaluza, T., Kunkel, D., and Hoor, P.: On the occurrence of strong vertical wind shear in the tropopause region: a 10-year ERA5 northern hemispheric study, Weather Clim. Dynam., 2, 631–651, https://doi.org/10.5194/wcd-2-631-2021, 2021. a
Keckhut, P., Hauchecorne, A., Bekki, S., Colette, A., David, C., and Jumelet, J.: Indications of thin cirrus clouds in the stratosphere at mid-latitudes, Atmos. Chem. Phys., 5, 3407–3414, https://doi.org/10.5194/acp-5-3407-2005, 2005. a
Klingebiel, M., Ehrlich, A., Finger, F., Röschenthaler, T., Jakirlić, S., Voigt, M., Müller, S., Maser, R., Wendisch, M., Hoor, P., Spichtinger, P., and Borrmann, S.: A tandem approach for collocated measurements of microphysical and radiative cirrus properties, Atmos. Meas. Tech., 10, 3485–3498, https://doi.org/10.5194/amt-10-3485-2017, 2017. a, b
Krämer, M., Rolf, C., Luebke, A., Afchine, A., Spelten, N., Costa, A., Meyer, J., Zöger, M., Smith, J., Herman, R. L., Buchholz, B., Ebert, V., Baumgardner, D., Borrmann, S., Klingebiel, M., and Avallone, L.: A microphysics guide to cirrus clouds – Part 1: Cirrus types, Atmos. Chem. Phys., 16, 3463–3483, https://doi.org/10.5194/acp-16-3463-2016, 2016. a, b
unkel, D., Hoor, P., Kaluza, T., Ungermann, J., Kluschat, B., Giez, A., Lachnitt, H.-C., Kaufmann, M., and Riese, M.: Evidence of small-scale quasi-isentropic mixing in ridges of extratropical baroclinic waves, Atmos. Chem. Phys., 19, 12607–12630, https://doi.org/10.5194/acp-19-12607-2019, 2019. a, b
Lachnitt, H.-C., Hoor, P., Kunkel, D., Bramberger, M., Dörnbrack, A., Müller, S., Reutter, P., Giez, A., Kaluza, T., and Rapp, M.: Gravity-wave-induced cross-isentropic mixing: a DEEPWAVE case study, Atmos. Chem. Phys., 23, 355–373, https://doi.org/10.5194/acp-23-355-2023, 2023. a
Leuenberger, D., Koller, M., Fuhrer, O., and Schar, C.: A Generalization of the SLEVE Vertical Coordinate, Mon. Weather Rev., 138, 3683–3689, https://doi.org/10.1175/2010MWR3307.1, 2010. a
Lott, F. and Miller, M.: A new subgrid-scale orographic parameterization: its formulation and testing, Q. J. Roy. Meteor. Soc., 123, 101–127, 1997. a
Miltenberger, A. K., Siewert, C., and Lüttmer, T.: Secondary ice formation in idealised deep convection: source of primary ice and impact on glaciation, Atmosphere, 11, 542, https://doi.org/10.3390/atmos11050542, 2020. a, b
Miltenberger, A.: Impact of cirrus on extratropical tropopause structure [code], Zenodo, https://doi.org/10.5281/zenodo.15396795, 2025. a
Mullendore, G. L., Durran, D. R., and Holton, J. R.: Cross-tropopause tracer transport in midlatitude convection, J. Geophys. Res.-Atmos., 110, D06113, https://doi.org/10.1029/2004JD005059, 2005. a
Müller, S., Hoor, P., Berkes, F., Bozem, H., Klingebiel, M., Reutter, P., Smit, H. G. J., Wendisch, M., Spichtinger, P., and Borrmann, S.: In situ detection of stratosphere-troposphere exchange of cirrus particles in the midlatitudes, Geophys. Res. Lett., 42, 949–955, https://doi.org/10.1002/2014GL062556, 2015. a, b, c, d, e, f, g, h, i, j, k, l
Neis, P., Smit, H. G. J., Krämer, M., Spelten, N., and Petzold, A.: Evaluation of the MOZAIC Capacitive Hygrometer during the airborne field study CIRRUS-III, Atmos. Meas. Tech., 8, 1233–1243, https://doi.org/10.5194/amt-8-1233-2015, 2015a. a
Neis, P., Smit, H. G., Rohs, S., Bundke, U., Krämer, M., Spelten, N., Ebert, V., Buchholz, B., Thomas, K., and Petzold, A.: Quality assessment of MOZAIC and IAGOS capacitive hygrometers: Insights from airborne field studies, Tellus B, 67, 28320, https://doi.org/10.3402/tellusb.v67.28320, 2015b. a, b
Newell, R. E.: Why is the stratosphere dry, Nature, 300, 686–687, https://doi.org/10.1038/300686a0, 1982. a
Oertel, A., Miltenberger, A. K., Grams, C. M., and Hoose, C.: Interaction of microphysics and dynamics in a warm conveyor belt simulated with the ICOsahedral Nonhydrostatic (ICON) model , Atmos. Chem. Phys., 23, 8553–8581, https://doi.org/10.5194/acp-23-8553-2023, 2023. a, b
Orr, A., Bechtold, P., Scinocca, J., Ern, M., and Janiskova, M.: Improved Middle Atmosphere Climate and Forecasts in the ECMWF Model through a Nonorographic Gravity Wave Drag Parameterization, J. Climate, 23, 5905–5926, https://doi.org/10.1175/2010JCLI3490.1, 2010. a
Pan, L. L. and Munchak, L. A.: Relationship of cloud top to the tropopause and jet structure from CALIPSO data, J. Geophys. Res.-Atmos., 116, D12201, https://doi.org/10.1029/2010JD015462, 2011. a, b
Pan, L. L., Randel, W. J., Gary, B. L., Mahoney, M. J., and Hintsa, E. J.: Definitions and sharpness of the extratropical tropopause: A trace gas perspective, J. Geophys. Res.-Atmos., 109, D23103, https://doi.org/10.1029/2004JD004982, 2004. a
Petzold, A., Krämer, M., Neis, P., Rolf, C., Rohs, S., Berkes, F., Smit, H. G. J., Gallagher, M., Beswick, K., Lloyd, G., Baumgardner, D., Spichtinger, P., Nédélec, P., Ebert, V., Buchholz, B., Riese, M., and Wahner, A.: Upper tropospheric water vapour and its interaction with cirrus clouds as seen from IAGOS long-term routine in situ observations, Faraday Discuss., 200, 229–249, https://doi.org/10.1039/C7FD00006E, 2017. a
Petzold, A., Neis, P., Rütimann, M., Rohs, S., Berkes, F., Smit, H. G. J., Krämer, M., Spelten, N., Spichtinger, P., Nédélec, P., and Wahner, A.: Ice-supersaturated air masses in the northern mid-latitudes from regular in situ observations by passenger aircraft: vertical distribution, seasonality and tropospheric fingerprint, Atmos. Chem. Phys., 20, 8157–8179, https://doi.org/10.5194/acp-20-8157-2020, 2020. a
Raschendorfer, M.: The new turbulence parameterization of LM, Cosmo news letter no. 1, Consortium for Small-Scale Modelling, http://www.cosmo-model.org/content/model/documentation/newsLetters/newsLetter01/newsLetter_01.pdf (last access: 12 September 2025), 2018. a
Ray, E. A., Moore, F. L., Elkins, J. W., Dutton, G. S., Fahey, D. W., Vömel, H., Oltmans, S. J., and Rosenlof, K. H.: Transport into the northern hemisphere lowermost stratosphere revealed by in situ tracer measurements, J. Geophys. Res.-Atmos., 104, 26565–26580, https://doi.org/10.1029/1999JD900323, 1999. a
Riese, M., Ploeger, F., Rap, A., Vogel, B., Konopka, P., Dameris, M., and Forster, P.: Impact of uncertainties in atmospheric mixing on simulated UTLS composition and related radiative effects, J. Geophys. Res.-Atmos., 117, D16305, https://doi.org/10.1029/2012JD017751, 2012. a
Rolf, C., Krämer, M., Schiller, C., Hildebrandt, M., and Riese, M.: Lidar observation and model simulation of a volcanic-ash-induced cirrus cloud during the Eyjafjallajökull eruption, Atmos. Chem. Phys., 12, 10281–10294, https://doi.org/10.5194/acp-12-10281-2012, 2012. a
Seifert, A. and Beheng, K. D.: A two-moment cloud microphysics parameterization for mixed-phase clouds. Part I: Model description, Meteorol. Atmos. Phys., 92, 45–66, 2006. a
Škerlak, B., Sprenger, M., and Wernli, H.: A global climatology of stratosphere–troposphere exchange using the ERA-Interim data set from 1979 to 2011, Atmos. Chem. Phys., 14, 913–937, https://doi.org/10.5194/acp-14-913-2014, 2014. a
Spang, R., Günther, G., Riese, M., Hoffmann, L., Müller, R., and Griessbach, S.: Satellite observations of cirrus clouds in the Northern Hemisphere lowermost stratosphere, Atmos. Chem. Phys., 15, 927–950, https://doi.org/10.5194/acp-15-927-2015, 2015. a
Spichtinger, P.: Shallow cirrus convection – a source for ice supersaturation, Tellus A, 66, 19937, https://doi.org/10.3402/tellusa.v66.19937, 2014. a, b
Spreitzer, E., Attinger, R., Boettcher, M., Forbes, R., Wernli, H., and Joos, H.: Modification of potential vorticity near the tropopause by nonconservative processes in the ECMWF model, J. Atmos. Sci., 76, 1709–1726, https://doi.org/10.1175/JAS-D-18-0295.1, 2019. a, b
Sprenger, M. and Wernli, H.: A Northern Hemispheric climatology of cross-tropopause exchange for the ERA15 time period (1979–1993), J. Geophys. Res.-Atmos., 108, 8521, https://doi.org/10.1029/2002JD002636, 2003. a
Sprenger, M. and Wernli, H.: The LAGRANTO Lagrangian analysis tool – version 2.0, Geosci. Model Dev., 8, 2569–2586, https://doi.org/10.5194/gmd-8-2569-2015, 2015. a
Stohl, A., Bonasoni, P., Cristofanelli, P., Collins, W., Feichter, J., Frank, A., Forster, C., Gerasopoulos, E., Gäggeler, H., James, P., Kentarchos, T., Kromp-Kolb, H., Krüger, B., Land, C., Meloen, J., Papayannis, A., Priller, A., Seibert, P., Sprenger, M., Roelofs, G. J., Scheel, H. E., Schnabel, C., Siegmund, P., Tobler, L., Trickl, T., Wernli, H., Wirth, V., Zanis, P., and Zerefos, C.: Stratosphere-troposphere exchange: A review, and what we have learned from STACCATO, J. Geophys. Res.-Atmos., 108, 8516, https://doi.org/10.1029/2002JD002490, 2003. a
Tiedtke, M.: A Comprehensive Mass Flux Scheme for Cumulus Parameterization in Large-Scale Models, Mon. Weather Rev., 117, 1779–1800, https://doi.org/10.1175/1520-0493(1989)117<1779:ACMFSF>2.0.CO;2, 1989. a
Wernli, H., Boettcher, M., Joos, H., Miltenberger, A. K., and Spichtinger, P.: A trajectory-based classification of ERA-Interim ice clouds in the region of the North Atlantic storm track, Geophys. Res. Lett., 43, 6657–6664, https://doi.org/10.1002/2016GL068922, 2016. a
WMO (World Meteorological Organization): Scientific Assessment of Ozone Depletion: 2002, in: WMO Scientific Assessment of Ozone Depletion: 2002, Global Ozone Research and Monitoring Project, Report no. 47, Geneva, 2003, WMO, Geneva, Switzerland, 498 pp., ISBN 92-807-2261-1, 2002. a
Zahn, A., Christner, E., van Velthoven, P. F. J., Rauthe-Schöch, A., and Brenninkmeijer, C. A. M.: Processes controlling water vapor in the upper troposphere/lowermost stratosphere: An analysis of 8 years fo monthly measurements by the IAGOS-CARIBIC observatory, J. Geophys. Res.-Atmos., 119, 11505–11525, https://doi.org/10.1002/2014JD021687, 2014. a
Zängl, G., Reinert, D., Rípodas, P., and Baldauf, M.: The ICON (ICOsahedral Non-hydrostatic) modelling framework of DWD and MPI-M: Description of the non-hydrostatic dynamical core, Q. J. Roy. Meteor. Soc., 141, 563–579, https://doi.org/10.1002/qj.2378, 2015. a
Zängl, G., Reinert, D., and Prill, F.: Grid refinement in ICON v2.6.4, Geosci. Model Dev., 15, 7153–7176, https://doi.org/10.5194/gmd-15-7153-2022, 2022. a
Zou, L., Griessbach, S., Hoffmann, L., Gong, B., and Wang, L.: Revisiting global satellite observations of stratospheric cirrus clouds, Atmos. Chem. Phys., 20, 9939–9959, https://doi.org/10.5194/acp-20-9939-2020, 2020. a
- Abstract
- Introduction
- Methods
- UTLS structure in the measurement region
- Lagrangian perspective on the emergence of the modeled UTLS structure
- Observational evidence for moisture structure in the source region and modeled Lagrangian evolution of the UTLS structure
- Summary and conclusions
- Appendix A
- Code and data availability
- Author contributions
- Competing interests
- Disclaimer
- Special issue statement
- Acknowledgements
- Financial support
- Review statement
- References
- Supplement