the Creative Commons Attribution 4.0 License.
the Creative Commons Attribution 4.0 License.
 | 17 Oct 2025
Modelling anthropogenic aerosol sources and secondary organic aerosol formation: a wintertime study in central Europe
Roland Schrödner
Ralf Wolke
Marie L. Luttkus
Shubhi Arora
Laurent Poulain
Radek Lhotka
Petr Vodička
Jaroslav Schwarz
Petra Pokorna
Jakub Ondráček
Vladimir Ždímal
Hartmut Herrmann
Ina Tegen
Anthropogenic aerosol particles remain a significant air quality concern in central Europe, particularly during winter months. This study employs the chemistry transport model COSMO–MUSCAT (COnsortium for Small scale MOdelling coupled with the MUltiScale Chemistry Aerosol Transport) to investigate particulate matter sources, with a focus on emissions from residential heating. The model results are compared with winter measurements from one site in Germany and two sites in the Czech Republic, where solid fuels are commonly used for heating. A non-reactive tagging method tracking primary organic matter (OM) reveals a high contribution from residential heating. Although the magnitude and temporal changes of the model results mostly agree with total OM values at two measuring stations, it appears to underestimate measurements at a site in the central Czech Republic. This underestimation is partly attributed to the inadequate representation of secondary organic aerosol (SOA) emitted from wood combustion. The study highlights the impact of anthropogenic volatile organic compounds (AVOCs) on SOA formation, which are currently underrepresented in air quality models. Sensitivity tests adjusting SOA yields and AVOC emissions increase OM concentrations by up to 40 % at the measurement sites. These findings emphasise the need for accurate parameterisation of AVOC-derived SOA formation and residential heating emissions to better tackle wintertime air quality challenges in central Europe.
- Article
(10427 KB) - Full-text XML
- BibTeX
- EndNote


According to the European Environment Agency's air quality report, 238 000 premature deaths in the European Union (EU) in 2020 could be attributed to exposure to particulate matter with an aerodynamic diameter of 2.5 µm or smaller (PM2.5) (EEA, 2022). In a review summarising multiple decades of research, Anderson et al. (2011) emphasise that exposure to PM significantly increases the risk of cardiovascular and respiratory diseases, posing a major global public health challenge. A report by the World Bank Group (2022) estimates that the societal cost of ambient fine particulate matter pollution in the European and central Asian regions reached 4.6 % of gross domestic product (GDP) in 2019. This estimate reflects the economic impact of PM2.5-related health outcomes, including premature mortality, morbidity, and lost productivity. The target of the EU's Air Pollution Action Plan is a 55 % reduction in premature mortality due to PM2.5 by 2030 compared to 2005 levels (EEA, 2022). However, based on self-reported data, 19 EU Member States still fell at least 30 % short of their 2030 PM2.5 emission reduction targets in 2021. A study by Beloconi and Vounatsou (2023) found that as of 2021, 47.5 % of Europeans were living in areas where annual mean PM2.5 concentrations exceeded the new EU limit of 10 µg m−3, which will come into force in 2030. Ground level measurements of PM2.5 from the European Air Quality Monitoring Network for 2021 and 2022 show a striking gradient between clean and polluted areas. Eastern European regions and the Po Valley in Italy have the highest annual mean concentrations, while central and western Europe have much lower PM levels (EEA, 2019). Simulations of PM2.5 exposure and PM2.5-related mortality for the year 2015 by Gu et al. (2023) also indicate higher concentrations and associated health risks in eastern Europe.
In this transition zone between less and more polluted regions, the rural background station Melpitz in eastern Germany recorded the highest annual mean PM10 concentration in 2021 as reported by the European Monitoring and Evaluation Programme (EMEP) (Fagerli et al., 2023). Previous studies in Germany have shown that long-range transport from eastern Europe, particularly from combustion processes, is a major contributor to regional background particle concentrations (van Pinxteren et al., 2019, 2016). The inflow of air masses from the east was associated with PM10 concentration peaks, leading to an increase in exceedances of the current daily limit value of 50 µg m−3 (van Pinxteren et al., 2019). However, the relative contributions of multiple combustion sources to primary and secondary particles, as well as their transboundary transport, remain insufficiently quantified. This needs to be better characterised to enable effective and better targeted mitigation strategies to address the prevailing air quality challenges.
Source apportionment (SA) studies aim to link ambient concentrations of pollutants to their emission sources. Within chemical transport models (CTMs), two main methods can be used to do this: the emission reduction impact method and the mass transfer method. The emission reduction impact method, or brute-force approach, assesses how pollutant concentrations respond to specific emission changes (Thunis et al., 2019). An extreme case, the “zero-out” method, sets emissions from selected sources to zero and estimates their maximum possible impact on ambient concentrations. This approach helps to assess the potential impact of emission reductions on air quality (Clappier et al., 2017). Despite its conceptual simplicity, this method is computationally intensive, and the results are highly sensitive to the reference scenario chosen.
The mass transfer method, implemented in CTMs as the tagged species approach, estimates contributions from different source sectors and regions by tracing the mass transport of pollutants from emission sources to local concentrations (Thunis et al., 2019). In this method, new tracers are introduced for the pollutants of interest and labelled according to their emission sources, allowing them to be monitored throughout the model run (Kranenburg et al., 2013). This approach facilitates the study of source contributions across both spatial and temporal scales, with source definitions directly linked to the emission inventories used as model inputs (Mircea et al., 2020). Tagged species modules for particulate source apportionment are implemented in several chemistry transport models: e.g. LOTUS-EUROS (Kranenburg et al., 2013), DEHM (Brandt et al., 2013), Particulate Matter Source Apportionment Technology (PSAT) in CAMx (Yarwood et al., 2007), Tagged Species Source Apportionment (TSSA) (Wang et al., 2009), and the Integrated Source Apportionment Method (ISAM) (Kwok et al., 2013) in CMAQ (US EPA Office of Research and Development, 2024). Tagging approaches are not designed to assess the effectiveness of mitigation measures or the impact of emission reductions because they do not consider indirect chemical effects (Thunis et al., 2019). However, they do provide a direct, additive source attribution of pollutant mass concentrations.
The Transport and Transformation of Atmospheric Aerosol over Central Europe with an Emphasis on Anthropogenic Sources (TRACE) project aims to develop a comprehensive understanding of the contribution of transported anthropogenic aerosols relative to local emissions, integrating expertise in synergistic measurement methods and modelling tools. As part of this effort, this study aims to improve the understanding of the interaction between dispersion and transformation processes by investigating an area of large PM2.5 concentration gradients in central Europe. Therefore, we implemented a non-reactive tagged species approach into the COSMO–MUSCAT model (COnsortium for Small scale MOdelling coupled with the MUltiScale Chemistry Aerosol Transport) (Wolke et al., 2012). The tagging approach is applied to identify primary PM sources with a focus on winter combustion emissions. Online and offline measurements from an extensive campaign in 2021 are used to validate the simulations and to improve the understanding of the local air quality.
2.1 Sampling sites
The TRACE winter campaign took place from 5 February to 24 March 2021 at three measurement sites in central Europe: two of the stations, Melpitz (DE) and Košetice (CZ), were already well established as part of the Aerosol, Clouds and Trace Gases Research Infrastructure (ACTRIS) and the European Monitoring and Evaluation Programme (EMEP), while the third (Frýdlant, CZ) was specifically installed for this project. The sites were selected to capture an important area of transition between polluted and less polluted regions in central Europe (see Fig. 1).
The research observatory Melpitz (51.54° N, 12.93° E; 86 m a.s.l.) is located 50 km east of Leipzig, Germany, observing atmospheric background conditions in central Europe. It has been operated by TROPOS for more than 30 years (Spindler et al., 2001; Poulain et al., 2011). The station is surrounded by grassland and flat agricultural land without any notable wind obstacles. About 60 % of the time throughout the year, the prevailing wind direction is south-west. These air masses are of maritime origin and reach Melpitz after having crossed western Europe and, in the immediate vicinity, the city of Leipzig. Easterly winds occur 17 % of the time throughout the year, bringing dry continental air masses affected by long-range transport from Poland, Belarus, Ukraine, Slovakia, and the Czech Republic (Spindler et al., 2001, 2012, 2013).
The National Atmospheric Observatory Košetice (49.35° N, 15.05° E; 534 m a.s.l.) is situated 60 km south-east of the Prague metropolitan area in the Czech Republic. There are several small settlements in the vicinity of the station; however, the district is one of the least populated in the country (Zíková and Ždímal, 2013). Surrounded mainly by agricultural land and some woodland, a medium-sized timber factory equipped with a biomass furnace is located 7.5 km from the site (Schwarz et al., 2016). In winter, air masses reaching the site predominantly originate from the south-west (44 %), passing over central Europe (Pokorná et al., 2022). Similarly, Lhotka et al. (2025) observed that the contribution of continental air masses was higher in winter compared to other seasons, highlighting a distinct seasonal difference.
The Frýdlant temporary measurement site (50.94° N, 15.07° E; 366 m a.s.l.) was set up 2 km north of the centre of Frýdlant, Czech Republic, close to the Polish border. The station is located on the north-western edge of the Jizera Mountains and is surrounded by forests and farmland. The Turów coal mine, a large Polish open-pit mine, is about 10 km south-west of the site. Lignite from the Turów mine is used to fuel the nearby Turów power station.
During the campaign period, the COVID-19 pandemic continued to affect Europe, with containment measures still in place. In Germany, there was a lockdown from 13 December 2020 to 3 March 2021. Non-essential businesses, schools, and childcare facilities were closed, and employees were required to work from home wherever possible. Essential services, such as supermarkets, pharmacies, and healthcare facilities, remained open. From 3 March 2021, restrictions were adjusted locally based on infection rates and other factors (BMG, 2023). In the Czech Republic, strict restrictions were in place until 11 April 2021 (Slabá, 2022). In Poland, a partial lockdown was enforced from 28 December 2020 to 14 February 2021. Some restrictions were eased on 1 January 2021, allowing shops in shopping centres and cultural institutions to reopen. However, on 20 March 2021, stricter measures were reintroduced until 9 April (A3M Global Monitoring GmbH, 2023).
2.2 Measurement data
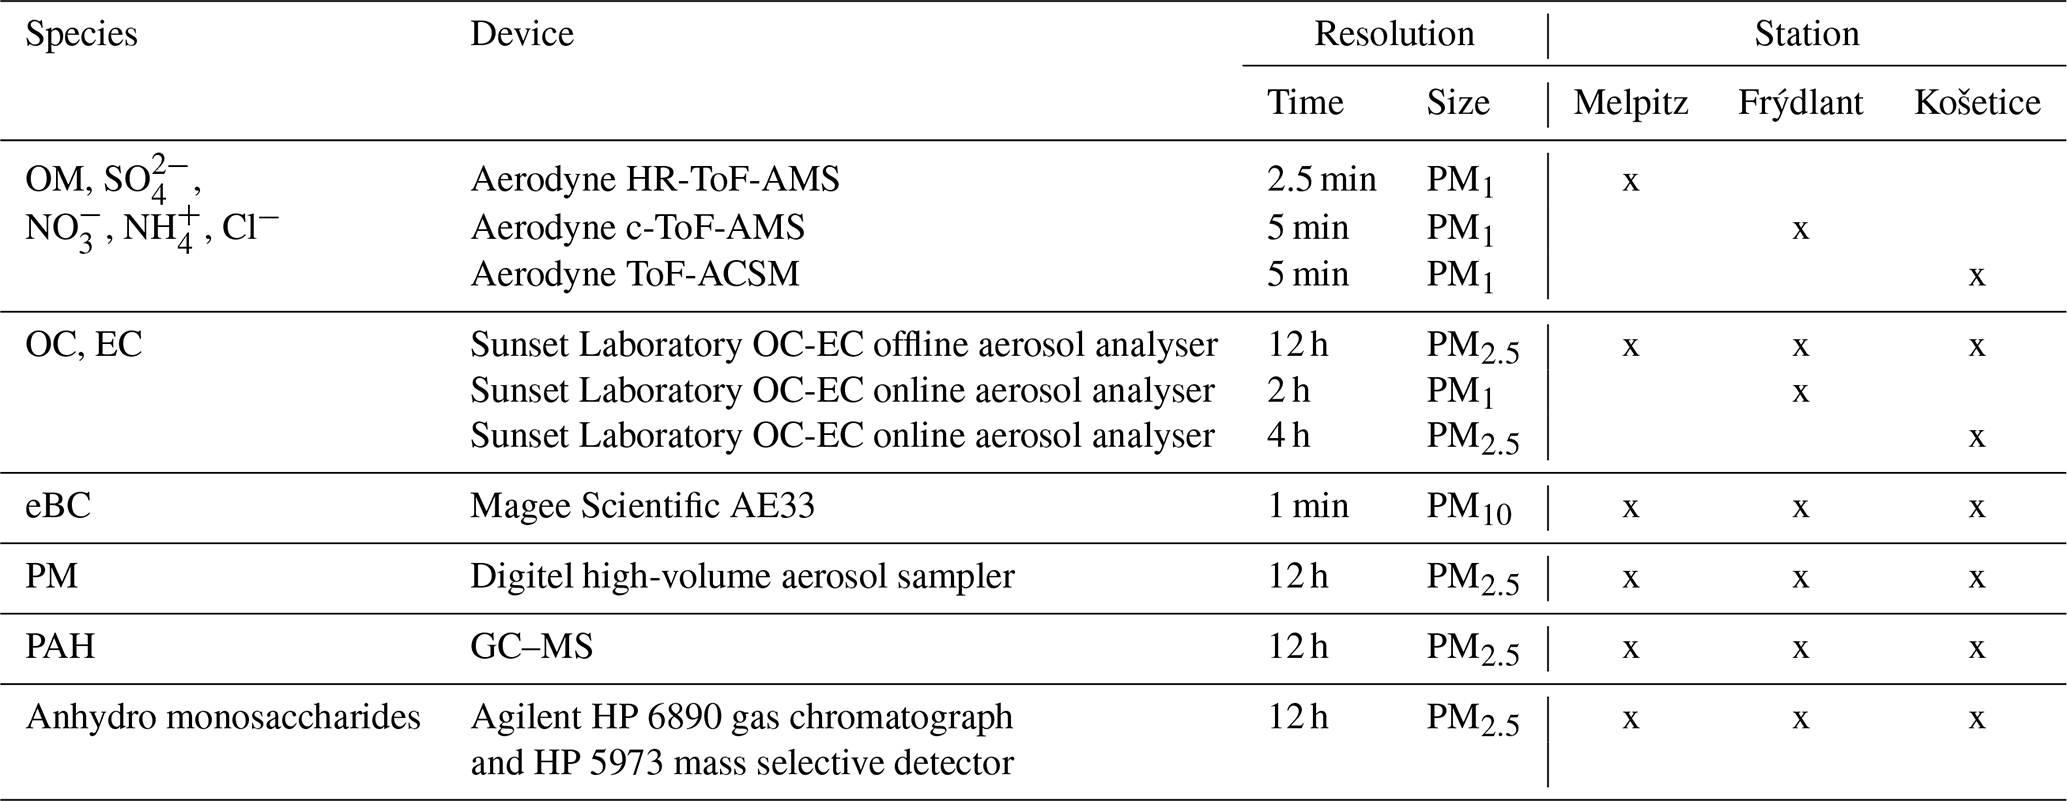
A multi-device setup for data acquisition was in place at all three stations. The data presented in this study were measured with the instruments listed in Table 1. The instrumentation included an aerosol mass spectrometer for measuring the non-refractory near-PM1 chemical composition (organic, nitrate, sulfate, ammonium, and non-sea-salt chloride) and a multi-wavelength Aethalometer for measuring the equivalent black carbon (eBC), connected to a dry PM10 inlet. The mass concentration of PM2.5 was measured by gravimetric filter sampling using a Digitel high-volume aerosol sampler with pre-heated quartz fibre filters. Samples were collected for 12 h, covering daytime (05:00 to 17:00 UTC) and nighttime (17:00 to 05:00 UTC). The filters were further analysed with a Sunset Laboratory thermal–optical transmittance (TOT) instrument according to the EUSAAR2 temperature protocol (Cavalli et al., 2010). Online Sunset Laboratory OC–EC data are also available for Frýdlant and Košetice. Carbon parallel-plate diffusion denuders were used to remove volatile organic compounds to prevent positive sampling artefacts caused by adsorption of gas-phase organics onto the filter (Turpin et al., 2000). An aerosol chemical speciation monitor (ACSM) was used for aerosol mass spectrometry in Košetice, while aerosol mass spectrometer (AMS) instruments were used in Melpitz and Frýdlant. Hereafter, we use AMS/ACSM to refer collectively to measurements from all three instruments deployed at the sites. The AMS/ACSM instruments measure total organic matter (OM), which we can compare directly with our model output, while the two Sunset Laboratory instruments detect organic carbon (OC). For better comparability, OC was converted to OM using an OMOC ratio from the literature. Poulain et al. (2011) estimated an OMOC ratio of 1.64 at the Melpitz station in winter 2009, with almost no diurnal variation. For a winter campaign in 2020 in Košetice, Pokorná et al. (2022) found a ratio of 1.51 (±0.36). In this study, we have applied a factor of 1.6 to the conversion of all Sunset Laboratory data. Polycyclic aromatic hydrocarbons (PAHs) were detected on the filters by gas chromatography–mass spectrometry (GC–MS).
Table 1Measuring devices used at the three sites to obtain the data for this study.
2.3 Model description
All simulations were carried out with the multiscale model system COSMO–MUSCAT. It consists of two online coupled components, the regional numerical weather forecasting model COnsortium for Small scale MOdelling (COSMO) (version 5.05, Schättler et al., 2018) in conjunction with the aerosol chemistry transport model MUltiScale Chemistry Aerosol Transport (MUSCAT) (Wolke et al., 2012), developed at TROPOS. The model system is designed for aerosol chemistry process studies and air quality applications at the regional scale (Hinneburg et al., 2008; Heinold et al., 2011; Tõnisson et al., 2021; Wolke et al., 2012) and participated in model intercomparisons such as the Air Quality Model Evaluation International Initiative (AQMEII; Im et al., 2015; Galmarini et al., 2021). COSMO is a nonhydrostatic atmospheric numerical weather forecasting model based on the primitive thermo-hydrodynamic equations describing compressible flow in a moist atmosphere. The atmospheric equations are solved based on a terrain-following grid with rotated coordinates (Schättler et al., 2018). The meteorological model provides all the necessary meteorological fields (e.g. wind, relative humidity, temperature) to MUSCAT, which then simulates the transport and chemical transformations in the atmosphere for different gas- and particle-phase species. Transport processes include advection and turbulent diffusion, while physical loss processes are characterised by dry and wet deposition (Wolke et al., 2012). COSMO and MUSCAT operate largely independently on separate grids and are coupled at each horizontal advection time step (every 15–80 s), allowing highly time-resolved meteorological input for the chemistry transport model.
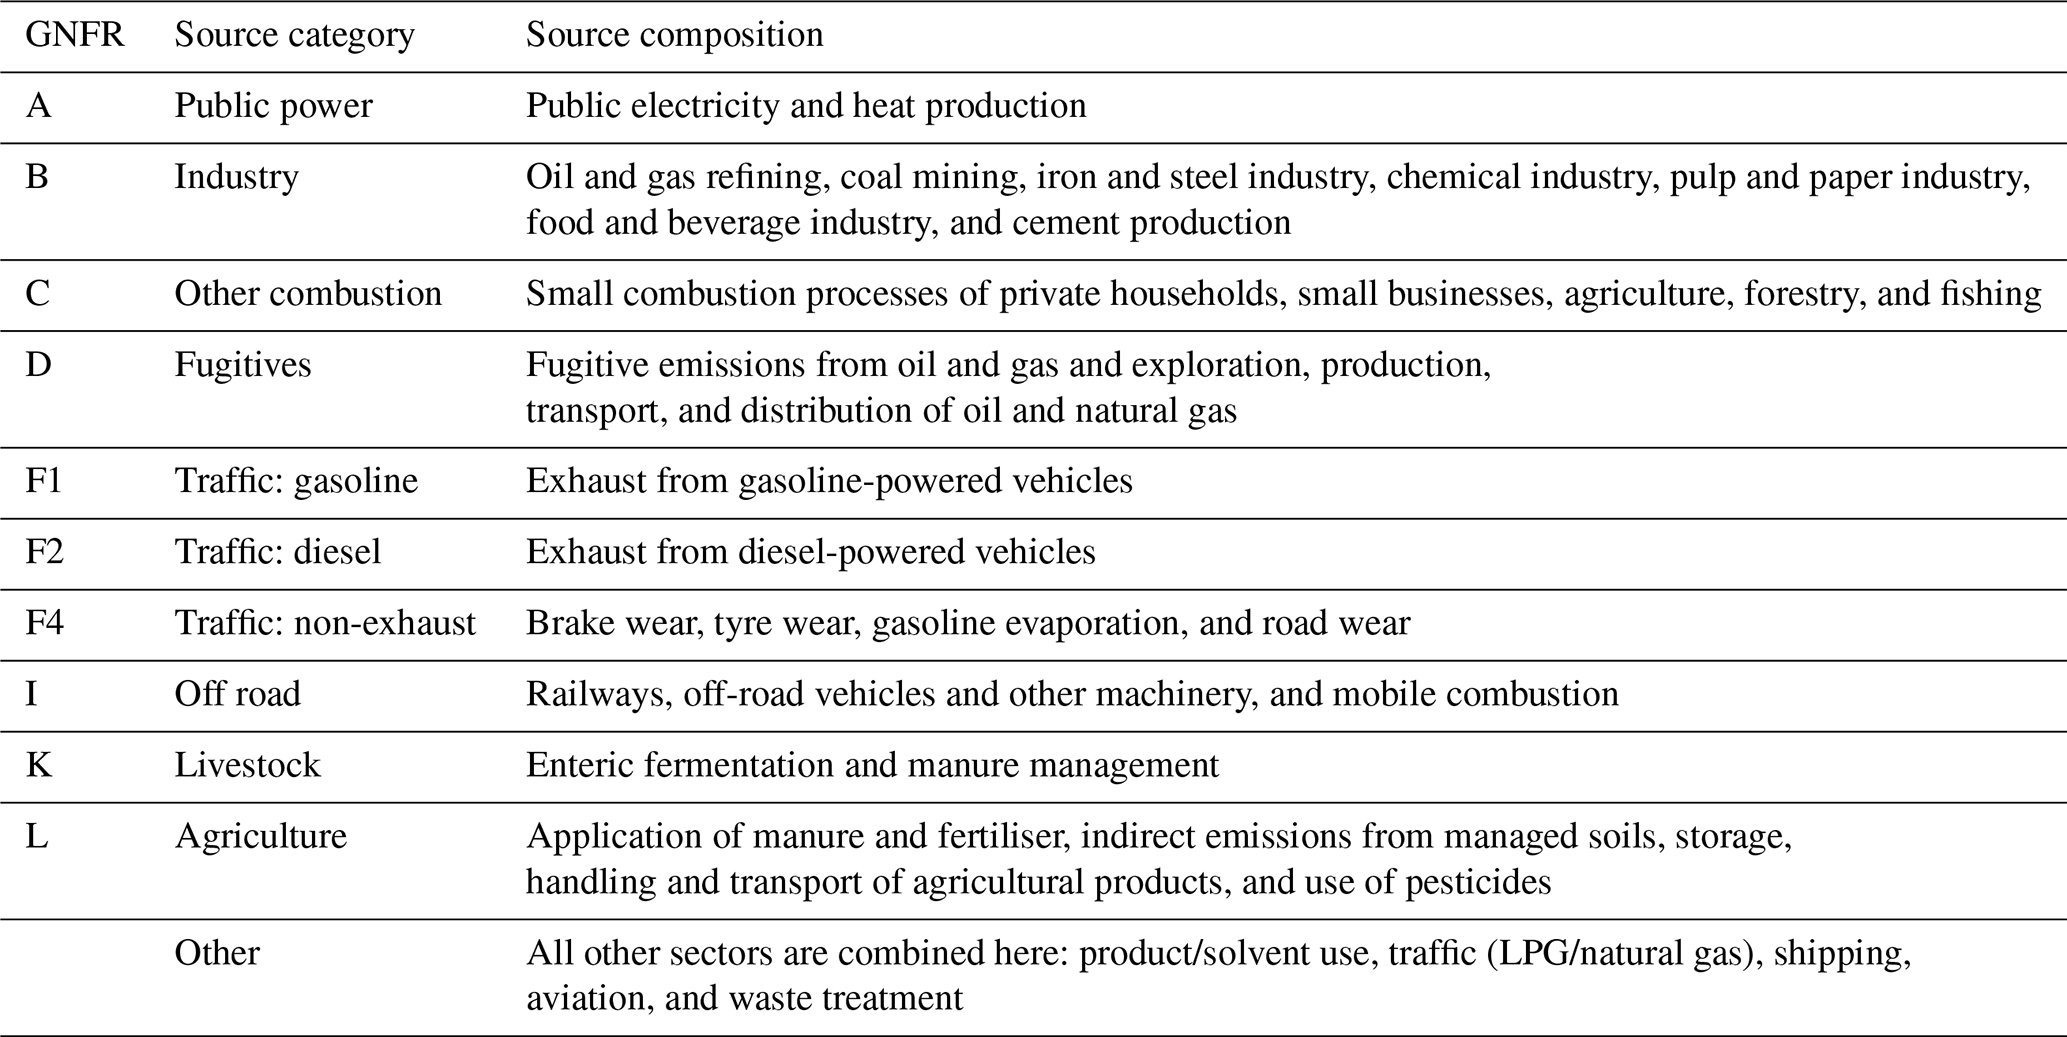
Anthropogenic emissions of atmospheric compounds are treated as prescribed point and gridded area sources. Emissions within Germany are provided by the GRETA database of the German Federal Environment Agency (UBA) (Schneider et al., 2016) for the year 2019 (resolution: 1 km × 1 km). For European emissions outside Germany, the CAMS-REG v5 emission inventory for the year 2018 (resolution: 6 km × 6 km) is used, provided by the Copernicus Atmosphere Monitoring Service (CAMS) (Kuenen et al., 2022). Emissions are treated according to the Gridded Nomenclature For Reporting (GNFR) (NFR-I, 2023); i.e. they are grouped into different emission sectors representing different source types (e.g. public power, traffic; see Table 2). The temporal variation in emissions (daily, weekly, and seasonal cycles) is accounted for by time profiles, which differ according to the emitting sector. These temporal profiles are largely based on those provided with the TNO_MACC-II inventory (Kuenen et al., 2014), with adjustments for livestock and agriculture emissions according to Skjøth et al. (2011). For GNFR sector C (“other combustion”), the temporal profile weight applied to the emission factor ranges from 0.37 to 2.54 over the study period (see Fig. A1 in the Appendix). Emissions are provided as aggregated totals for some pollutant groups, which we then break down into individual components. Primary particulate matter (PM) is split into elemental carbon (EC), primary organic matter (OM), sulfate (), sodium, and other minerals. A further distinction is made between fine (< 2.5 µm) and coarse (2.5–10 µm) aerosol particles. Non-methane volatile organic compound (NMVOC) emissions are divided into 23 different hydrocarbon groups. The splitting profiles for PM and NMVOC are based on different literature sources and are also provided by CAMS (Kuenen et al., 2022). In this study, country-specific splitting profiles (based on the year 2018) are applied to the overall emission input (see Tables A2 and A1 for GNFR C splitting factors).
The emission of biogenic VOCs (BVOCs) is based on Steinbrecher et al. (2009) and improved for extended land use categories according to Luttkus et al. (2022). The primary natural aerosol components are emitted online in COSMO–MUSCAT. The estimation of desert dust mobilisation depends on soil texture and soil size distribution according to Tegen et al. (2002) and preferential source regions (Heinold et al., 2011; Schepanski et al., 2017) using the current wind fields and hydrological conditions provided by COSMO. The emission of sea spray aerosol is based on Barthel et al. (2019).
Natural fire emissions (e.g. EC, OM, and primary PM2.5) are provided as point sources for the year 2021 by the Global Fire Assimilation System (GFAS) (Kaiser et al., 2012). These emissions are resolved into 24 h mean values with a specific injection height for each point source.
Dry deposition is modelled using the resistance approach described by Seinfeld and Pandis (2006). Aerosol particles and trace gases are also removed from the atmosphere through wet deposition, subdivided into in-cloud and below-cloud scavenging. Both processes are parameterised by size-dependent particle capture efficiencies and corresponding gas uptake coefficients (Simpson et al., 2012).
To describe the gas-phase chemistry, an extended version of the Regional Atmospheric Chemistry Mechanism, RACM-MIM2-ext (Karl et al., 2006; Stockwell et al., 1997; Karl et al., 2009), is used. The mass-based aerosol population is described using a hybrid bulk–bin scheme. It comprises 25 prognostic aerosol particle tracers, including primary PM2.5 and PM10, primary OM, EC, sulfate, nitrate, ammonium, and secondary organic aerosol (SOA), as well as six bins for sea salt and primary marine organic particles (diameter range: 0.01–10 µm) and five desert dust bins (0.2–48 µm).
Secondary inorganic aerosol is formed through reactions between ammonia and sulfuric or nitric acid, which are generated from the gaseous precursor species sulfur dioxide (SO2) and nitrogen oxides (NOx) (Hinneburg et al., 2008). The partitioning between the particle and gas phases depends on the ambient atmospheric temperature and humidity. The implementation of this particle–gas partitioning follows the equilibrium approach described by Galperin and Sofiev (1998), utilising the methods proposed by Mozurkewich (1993).
The formation of SOA is described by the module SORGAM (Schell et al., 2001), extended to include additional biogenic volatile organic compound (BVOC) precursors from isoprene, monoterpene, and sesquiterpene oxidation and highly oxygenated molecule (HOM) formation from all considered BVOCs (Luttkus et al., 2022). The module uses the two-product approach described by Odum et al. (1996), which splits each SOA product class – comprising reaction products from aromatic precursors, alkanes, alkenes, α-pinene, and limonene – into two pseudo-products. For each, the formation of low-volatility products and their gas–particle partitioning are simulated.
Low-volatility condensable products are formed through oxidation of organic precursor gases by the OH radical, the nitrate radical NO3, and ozone. The amount produced is determined by a product species (i)-dependent stoichiometric coefficient (αi) in the specific reaction of the chemical mechanism (Schell et al., 2001). The SOA mass resulting from gas–particle partitioning is then calculated using a partitioning coefficient Kom,i for each low-volatility product species following Pankow (1994). The partitioning coefficient depends on temperature and is influenced by the molecular weight and saturation vapour pressure of species i. Each pseudo-product consists of a gas-phase and particle-phase product with different αi and Kom,i. All information regarding the precursor VOCs, SOA class names in both the gas and the particle phases, and the reactions and stoichiometric coefficients can be found in Schell et al. (2001) and in the supplement of Luttkus et al. (2022). The total SOA yield (Y) resulting from the two previous steps can be calculated according to Eq. (1), where Mo is the total available absorbing organic matter (Odum et al., 1996).
Over a range of organic mass concentrations Mo, a precursor gas will have a range of aerosol yields Y. The relationship between yield and organic mass concentration can be determined through chamber measurements. To model this relationship, a curve is fitted by selecting the optimal values of α1, α2, Kom,1, and Kom,2 within the two-product framework. The sum of all particle-phase products considered gives the total SOA concentration.
2.4 Model setup
The domains for the COSMO–MUSCAT simulations were chosen to cover the three measurement sites. To reduce computational costs for the targeted horizontal resolution in the measurement region, the model is nested twice. The innermost domain TraceD1 covers 317 × 204 grid cells with a horizontal resolution of ∼2 km (see Fig. 1). The vertical resolution for COSMO in TraceD1 is 50 layers with a maximum height of 22 km, while MUSCAT uses only the lowermost 27 layers, i.e. up to ∼6 km. A common grid nesting approach is used for the inner domains. The results of the larger domains are used as lateral boundary conditions on the inner domains. The meteorological initial and boundary conditions for the European domain (N0) are provided by reanalysis data of the CAMS global atmospheric composition forecasts (Inness et al., 2019). The simulation covers the period from 1 January to 31 March 2021, including a 1-month spin-up, with an output resolution of 1 h. The model system is re-initialised every 48 h using the aerosol and trace gas concentrations at the end of the previous run and a 24 h COSMO pre-run to spin up the meteorology in order to avoid long-term drifts in the modelled meteorology.
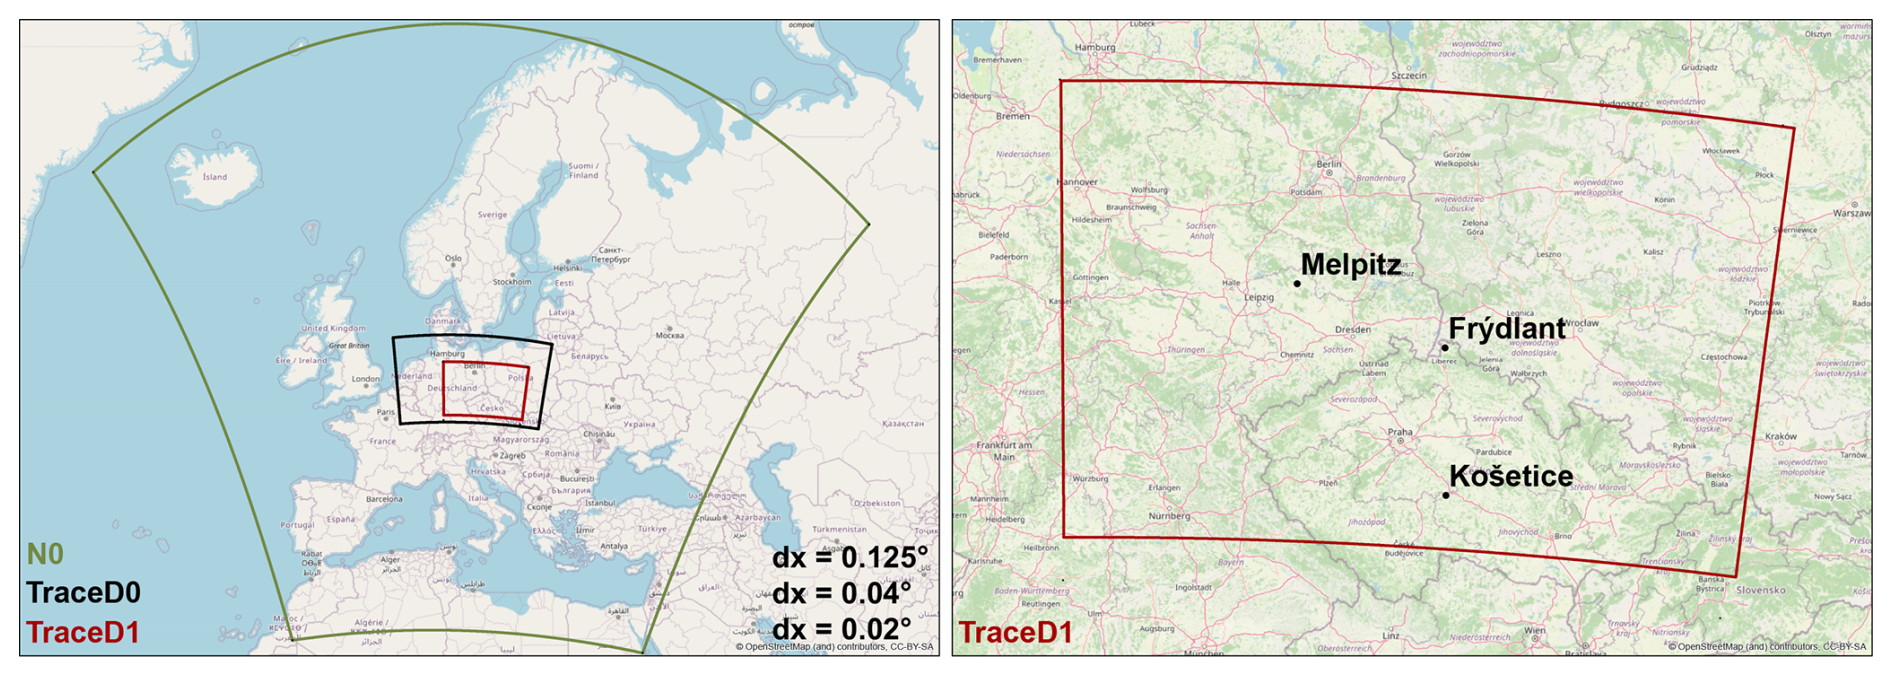
Figure 1Domains for COSMO–MUSCAT runs and localisation of the three rural background sampling sites (© OpenStreetMap contributors 2017, distributed under the Open Data Commons Open Database License (ODbL) v1.0) (OpenStreetMap contributors, 2017).
2.5 Source attribution in COSMO–MUSCAT
A source attribution module has been developed for COSMO–MUSCAT 5.05 to analyse the influence of specific source regions, point sources, and emission sectors on primary particulate matter compounds. This new tagging method allows for the individual tracking of emitted source-specific species during a single model simulation, thus enhancing the analytical capabilities of the model. Unlike the “zero-out” method, which requires multiple simulations for each source sector or region of interest, this new approach eliminates this need. As a result, the analysis is faster and less computationally intensive. To do so, an additional tracer is introduced into the model emissions for each species of interest from each defined source sector or source region and combinations of both (see Table A3 in the Appendix). This additional tracer is labelled with the source information and then processed in parallel. In this way, the concentration of each of the so-called tagged tracers is available in each grid cell of the model and at each time step. This provides detailed spatial and temporal information about the source contribution to local tracer concentrations. In addition to the concentration of each tagged species, the total concentration – representing the cumulative impact of all sources – is also available. This allows the relative contribution of each tagged source to be effectively calculated. An overview of the selected source sectors is given in Table 2. Tags for source regions can be specified via a text-based input file in which each surface grid cell can be assigned a region name. For this study, we have tagged emissions from all countries within the inner domain TraceD1, namely Germany, Poland, and the Czech Republic. Additionally, a source region “boundary” is introduced, referring to the transport from the coarser domains to the inner domain. Input from outside the European domain is not included in the “boundary” tagged sector.
Transport (advection, diffusion, sedimentation) and removal (dry and wet deposition) processes are automatically applied to tagged tracers in the same way as for all other tracers. However, gas-phase chemistry and aerosol chemistry are not considered at present within the tagging algorithm. Therefore, only chemically passive tracers can be tagged, i.e. using the non-reactive tagging approach. This enables a high-spatial- and high-temporal-resolution analysis of the source composition of primary particles. As this study focuses on winter combustion processes, anthropogenic EC and OM emissions are tagged. EC and OM emissions are split into fine and coarse aerosol; therefore the same split is applied for the tagged tracers.
3.1 Meteorology
During the campaign, notable meteorological events and sharp temperature changes occurred in a short period of time. In early February, a low-pressure system with cold air in the north and warm air in the south moved southwards, transporting cold air to the Balkans and Greece. On 7 and 8 February, strong easterly winds and heavy snowfall led to significant snow drifts in some areas of central Europe. This was followed by a week of clear nights with prevailing westerly winds and temperatures dropping to −20 °C. The model successfully captured the period of low temperatures and the snow event at all three stations (see Fig. 2). The snow event was followed by a cold episode, resulting in more stagnant conditions with a change in wind direction and decreased wind speed at all stations.
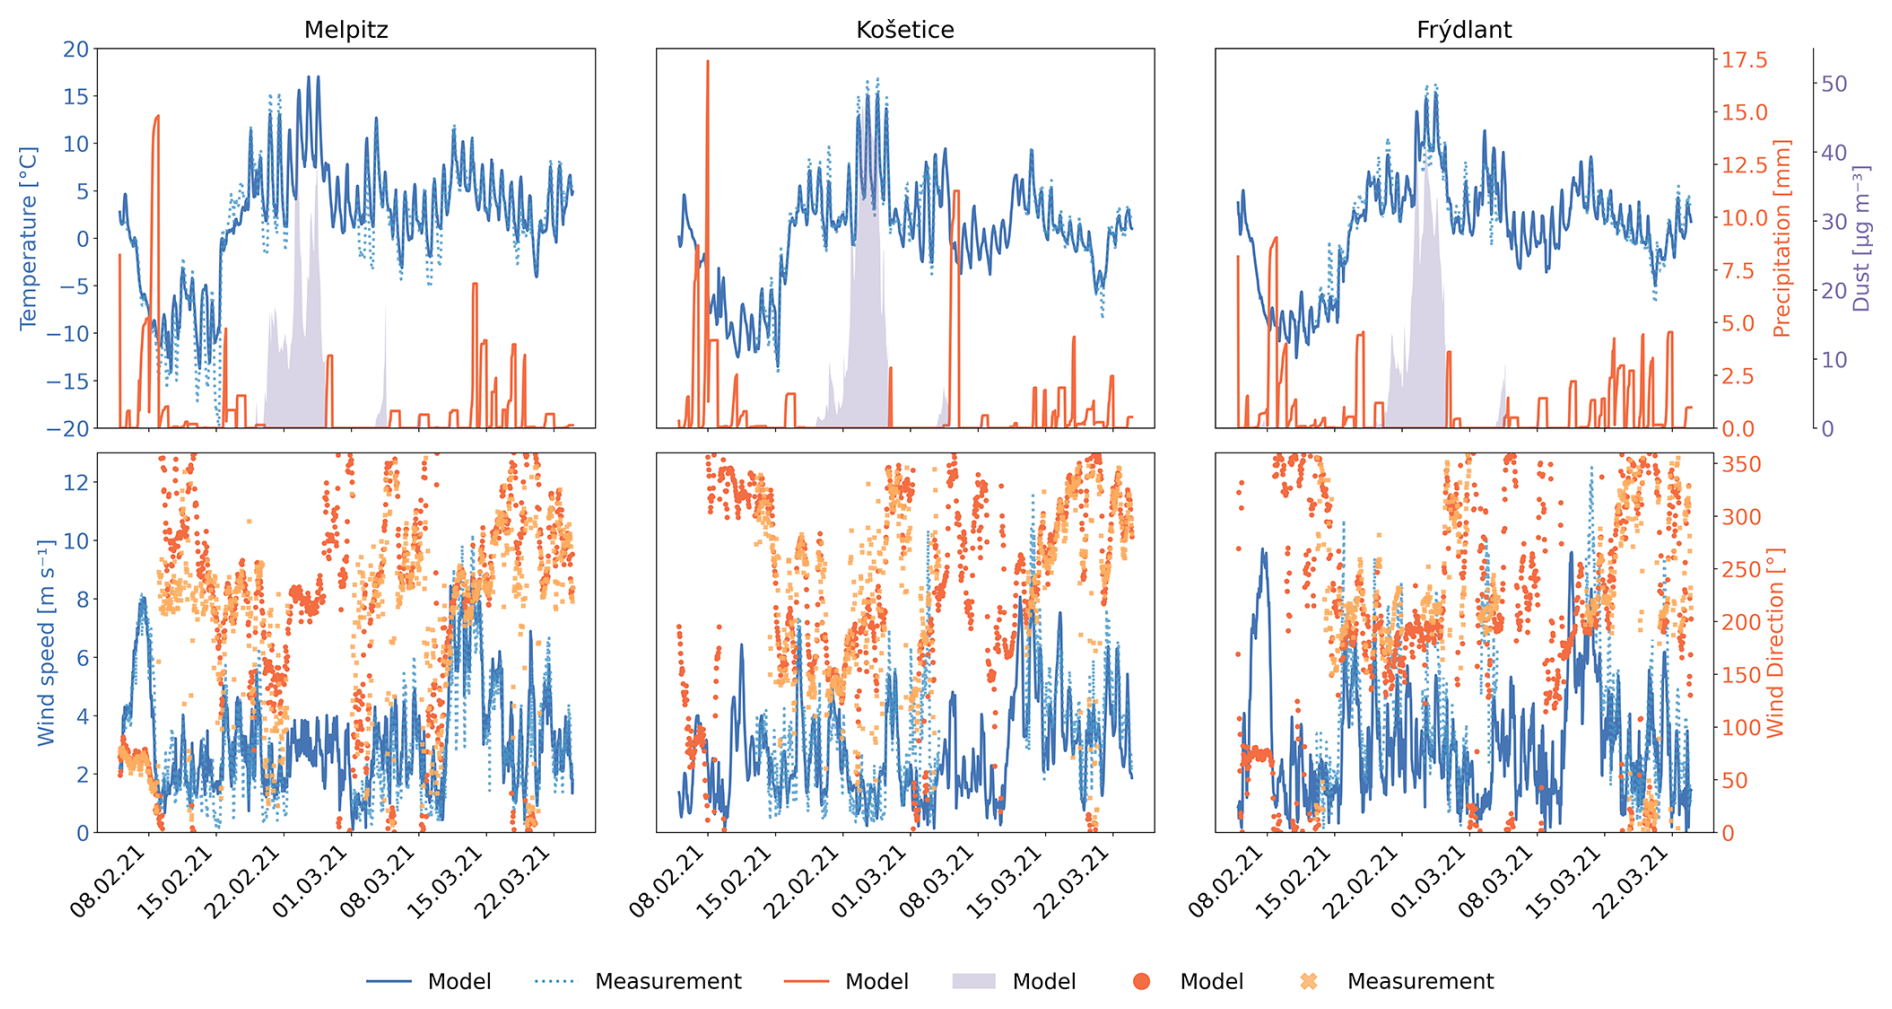
Figure 2Meteorological parameters for the three stations. The top row shows surface temperature and precipitation, with the shaded area representing surface dust concentration in the size class <80 µm. The bottom row displays the modelled surface wind speed and direction.
In mid-February, a nearly stationary high-pressure system transported warm air from the Sahara into central Europe, driving a rapid temperature increase of up to 20 °C within a week. An omega blocking pattern over eastern Europe facilitated the inflow of dust that accompanied the warm air, allowing particles to travel as far north as Scandinavia (Hoshyaripour, 2021; Haarig et al., 2022). This event significantly affected all three stations, resulting in elevated surface dust concentrations of up to 50 µg m−3 (see Fig. 2). The unusually high, spring-like temperatures persisted until the end of February. Another significant dust event occurred on 3 March, originating from the Sahara and affecting central Europe. Although our model successfully simulated dust uptake, surface concentrations during this event remained lower than those observed in mid-February. In mid-March, a shift to westerly winds brought low-pressure systems accompanied by widespread precipitation over Germany. This was followed by an intrusion of cold air from the polar regions, resulting in sleet, snow, and gusty winds (DWD, 2021a, b). By the end of March, atmospheric blocking patterns established stable and dry conditions.
3.2 Measurements and model capability
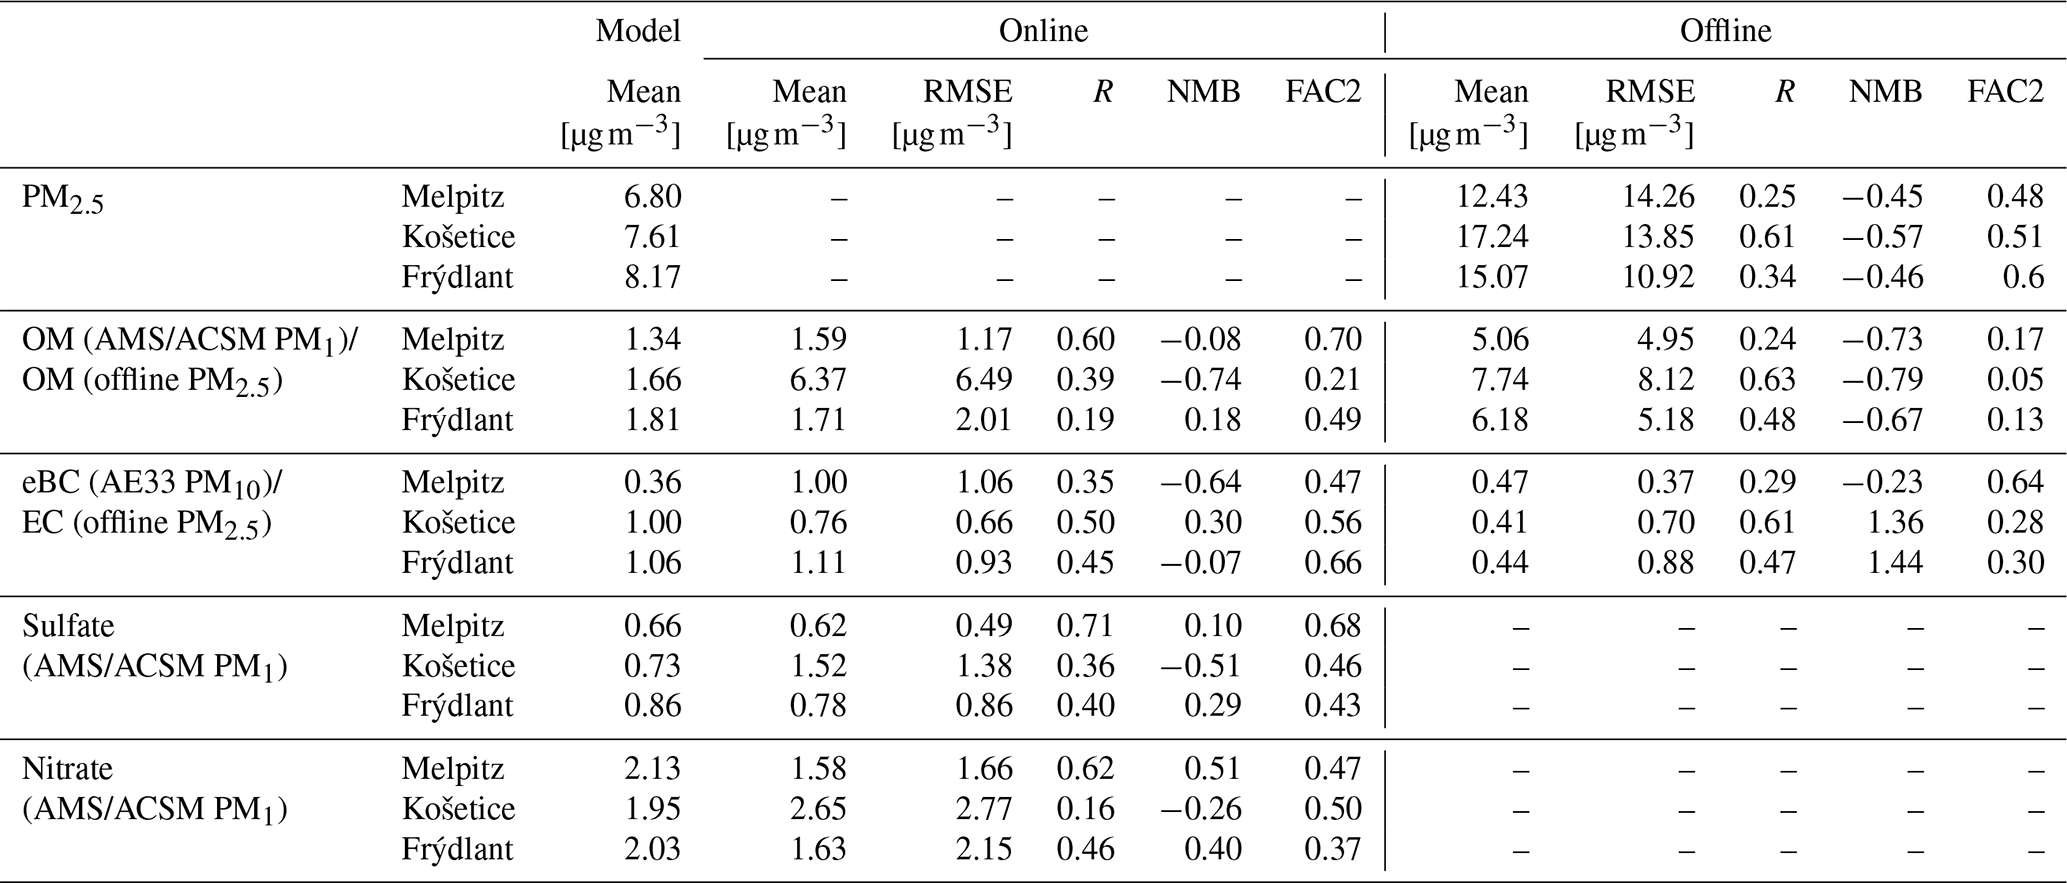
To validate the model's performance, we compared the modelled PM2.5 concentrations and their components with observational data. In our model, PM2.5 comprises mineral dust, sea salt, organic matter (including primary organic carbon and secondary organic aerosol), elemental carbon, ammonium sulfate, and ammonium nitrate. Figure 3 presents the time series of the total PM2.5 concentration. The model does not accurately represent the magnitude of the concentration peaks, especially in Košetice, where the average modelled values are almost 10 µg m−3 below the observed values. The normalised mean bias (NMB) reflects the systematic bias and indicates a strong underestimation of PM2.5 by more than 40 % in Melpitz and Frýdlant and −57 % in Košetice. The Pearson correlation coefficient (R) provides an indication of the overall fit of the trend, ranging from −1 to 1. An absolute value of exactly 1 means that a linear equation perfectly describes the relationship between the model and the measurements. Among the sites, the PM2.5 trend is most accurately captured in Košetice (R=0.61) and least accurately in Melpitz (R=0.25). The root mean squared error (RMSE) quantifies the error between measured and modelled surface-level mass concentrations. Overall, the model RMSE is high, with values of 14.26 µg m−3 for Melpitz, 13.85 µg m−3 for Košetice, and 10.92 µg m−3 for Frýdlant. Together with the NMB, the high RMSE indicates that the model tends to underestimate concentrations during periods of high concentration peaks, as the RMSE is particularly sensitive to outliers. All statistical parameters are presented in Table 3. Im et al. (2015) analysed the performance of multiple models in simulating PM2.5 concentrations as part of the AQMEII model intercomparison project. They found that most models systematically underestimated PM2.5 at rural stations, with biases ranging from −2 % to −60 %. The COSMO–MUSCAT model performed relatively well, showing a bias of −24.82 %. However, all models struggled to capture wintertime levels, underestimating concentrations by more than 50 % across all regions. During the first 2 weeks of February, the TRACE campaign revealed the largest discrepancies between observed and simulated PM2.5 concentrations, with most other tracers also underestimated. Strong easterly winds until 8 February facilitated long-range pollutant transport to Melpitz and Frýdlant. The snow event on 7–8 February led to a decrease in PM2.5 concentrations in Melpitz by approximately 10 µg m−3. In Frýdlant, a slight decrease of around 4 µg m−3 was observed after the event, while in Košetice, concentrations even increased by about 4 µg m−3, indicating limited overall washout effects. Concentrations rose again after the snow event, peaking around 10 February. The snow event was followed by a cold episode with stagnant conditions, reduced wind speeds, and a shift in wind direction, leading to pollutant accumulation. The model may underestimate residential emissions due to missing temperature dependencies and unaccounted-for COVID-19 lockdown effects. Increased heating activity due to unusually cold temperatures and limited mobility combined with stagnant meteorology could lead to the observed underestimation of PM2.5. Considering only data from 15 February onwards improves model performance, reducing the RMSE to 9.64 µg m−3 for Melpitz, 12.44 µg m−3 for Košetice, and 7.63 µg m−3 for Frýdlant. Additionally, the overall trend is captured more effectively, with R increasing to 0.79 in Košetice, 0.65 in Frýdlant, and 0.61 in Melpitz.
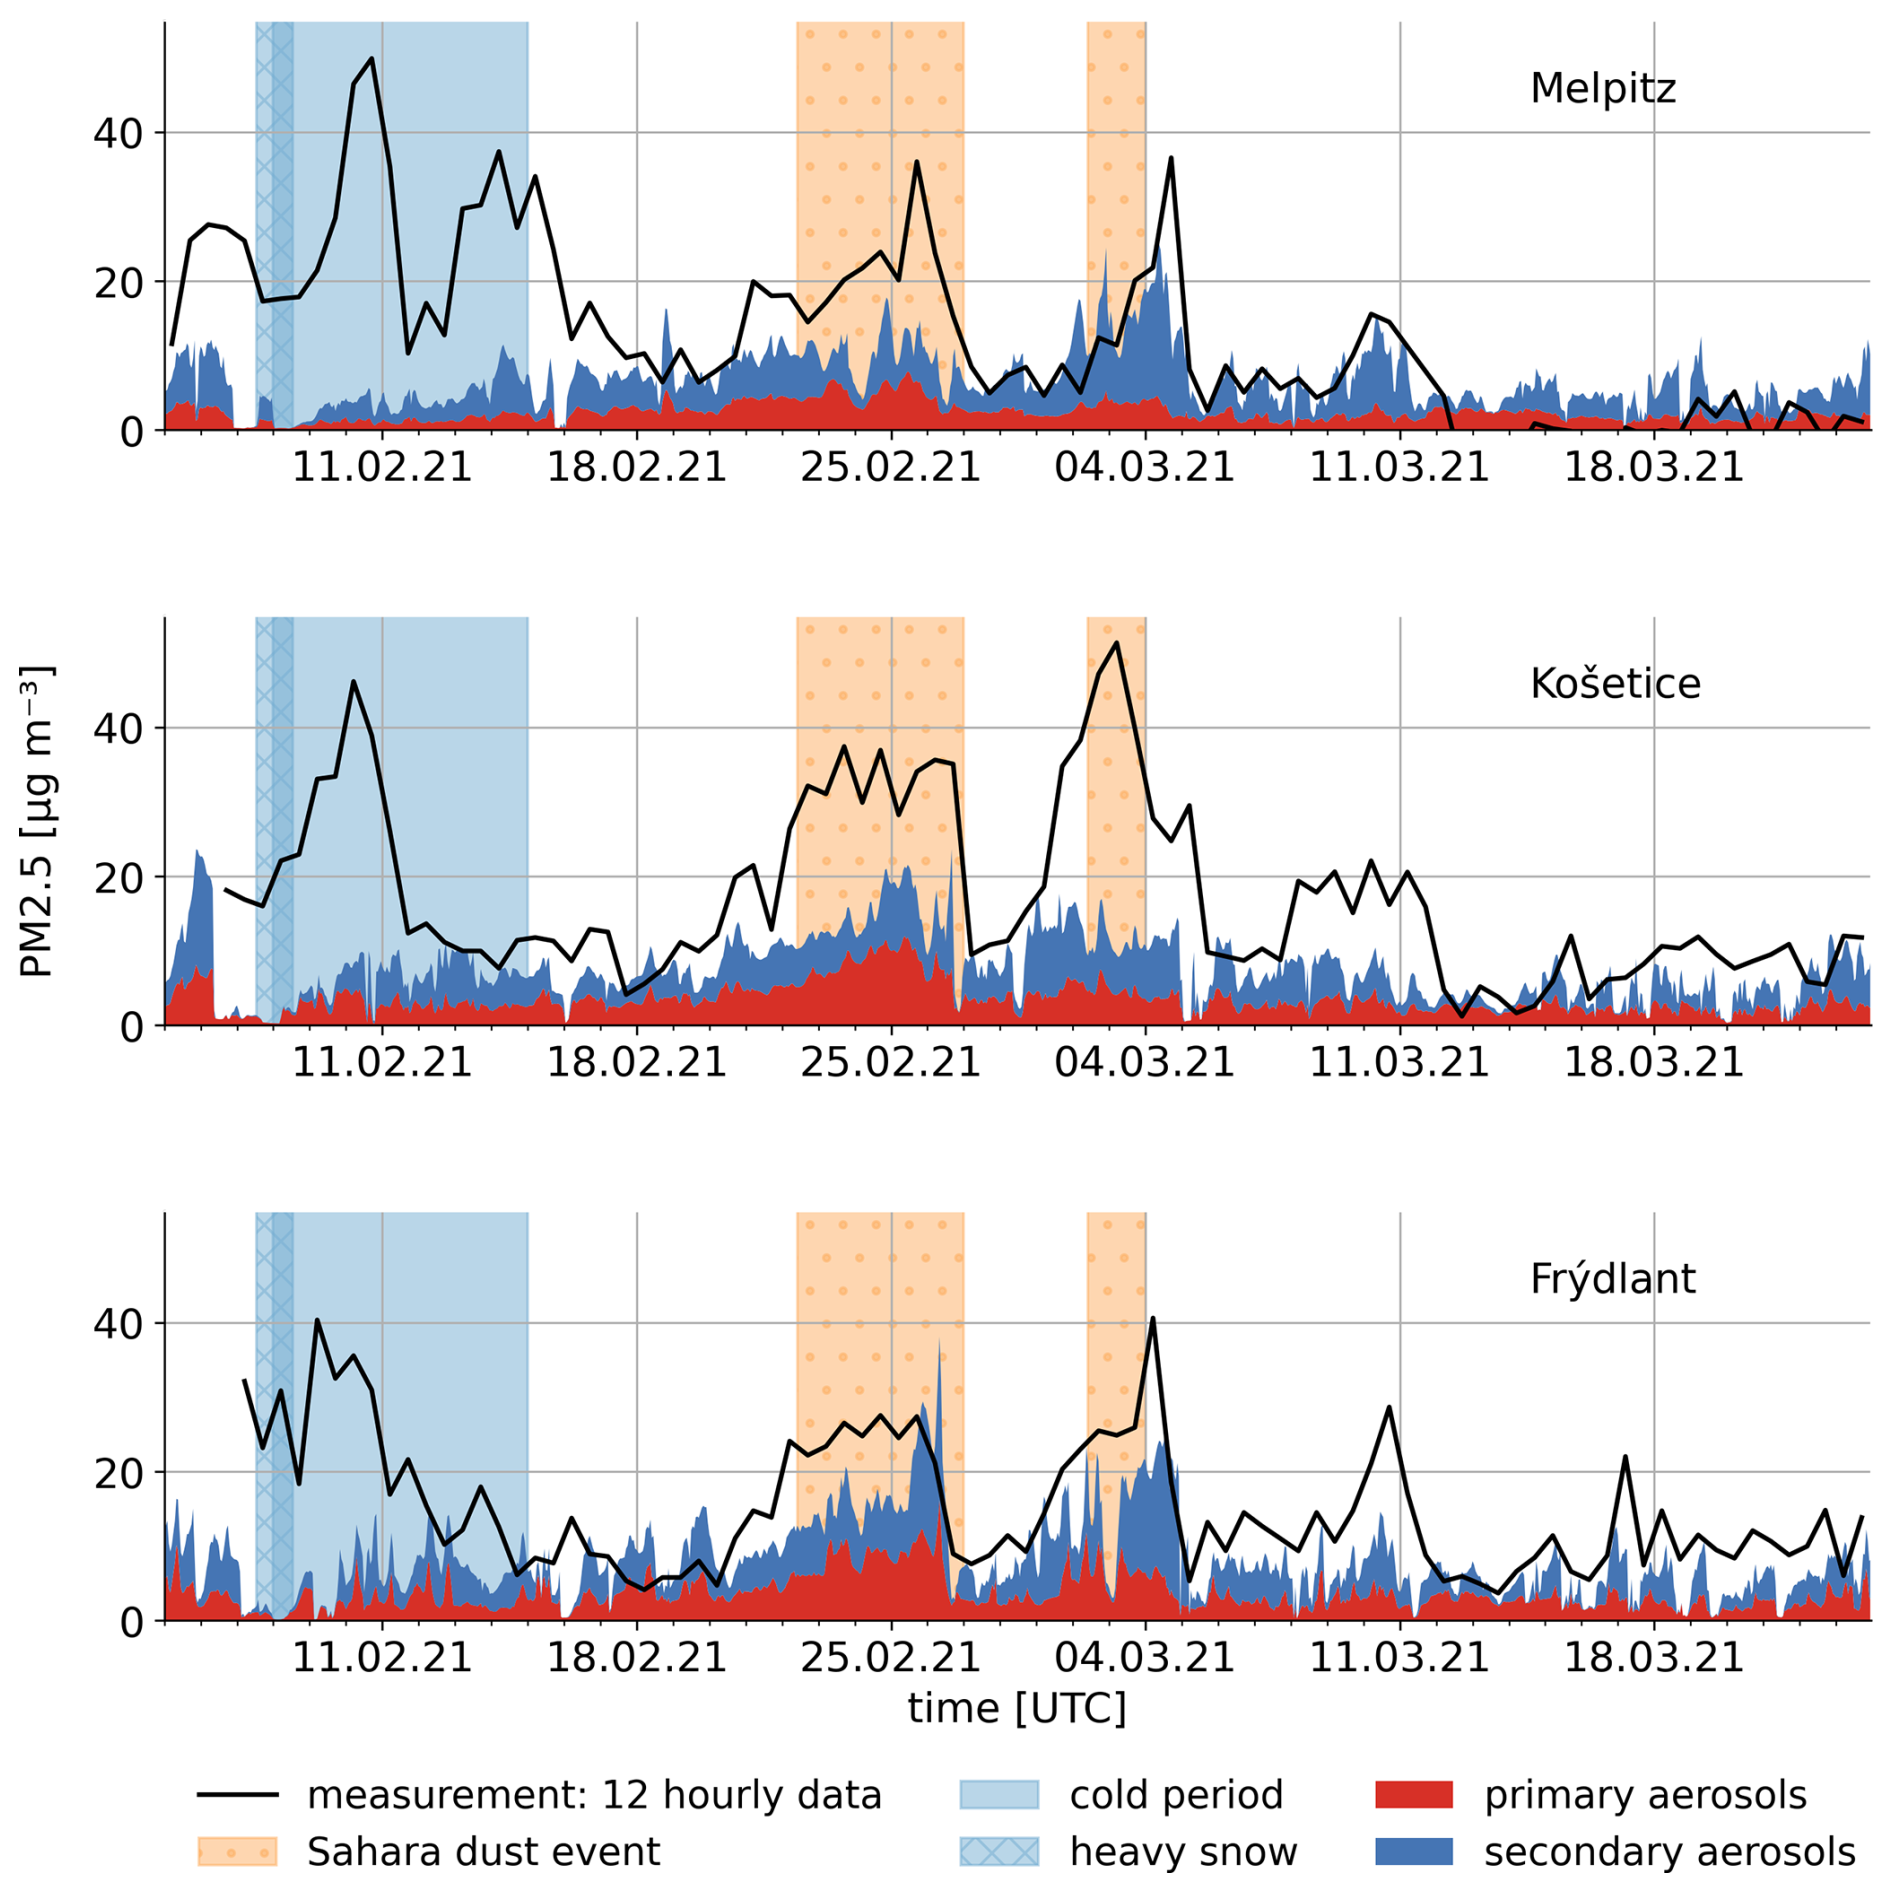
Figure 3Time series for PM2.5 mass concentration for the three stations. Filter data compared with modelled primary and secondary aerosol mass concentration. The timestamp for the filter data corresponds to the time of filter collection.
Table 3Time-averaged measured and modelled mass concentrations and the associated root mean squared error (RMSE), correlation coefficient (R), normalised mean bias (NMB), and fraction within a factor of 2 of the observations (FAC2) for the whole campaign period. The modelled data were adjusted to match the measurement intervals before statistical analysis. Online refers to in situ measurements and offline to filter sampling. A factor of 1.6 was applied to the OC measured by the Sunset Laboratory offline instrument.
To gain a better understanding of the remaining discrepancies between modelled and measured PM2.5, we can evaluate the accuracy for each individual PM2.5 component (see Fig. 4).
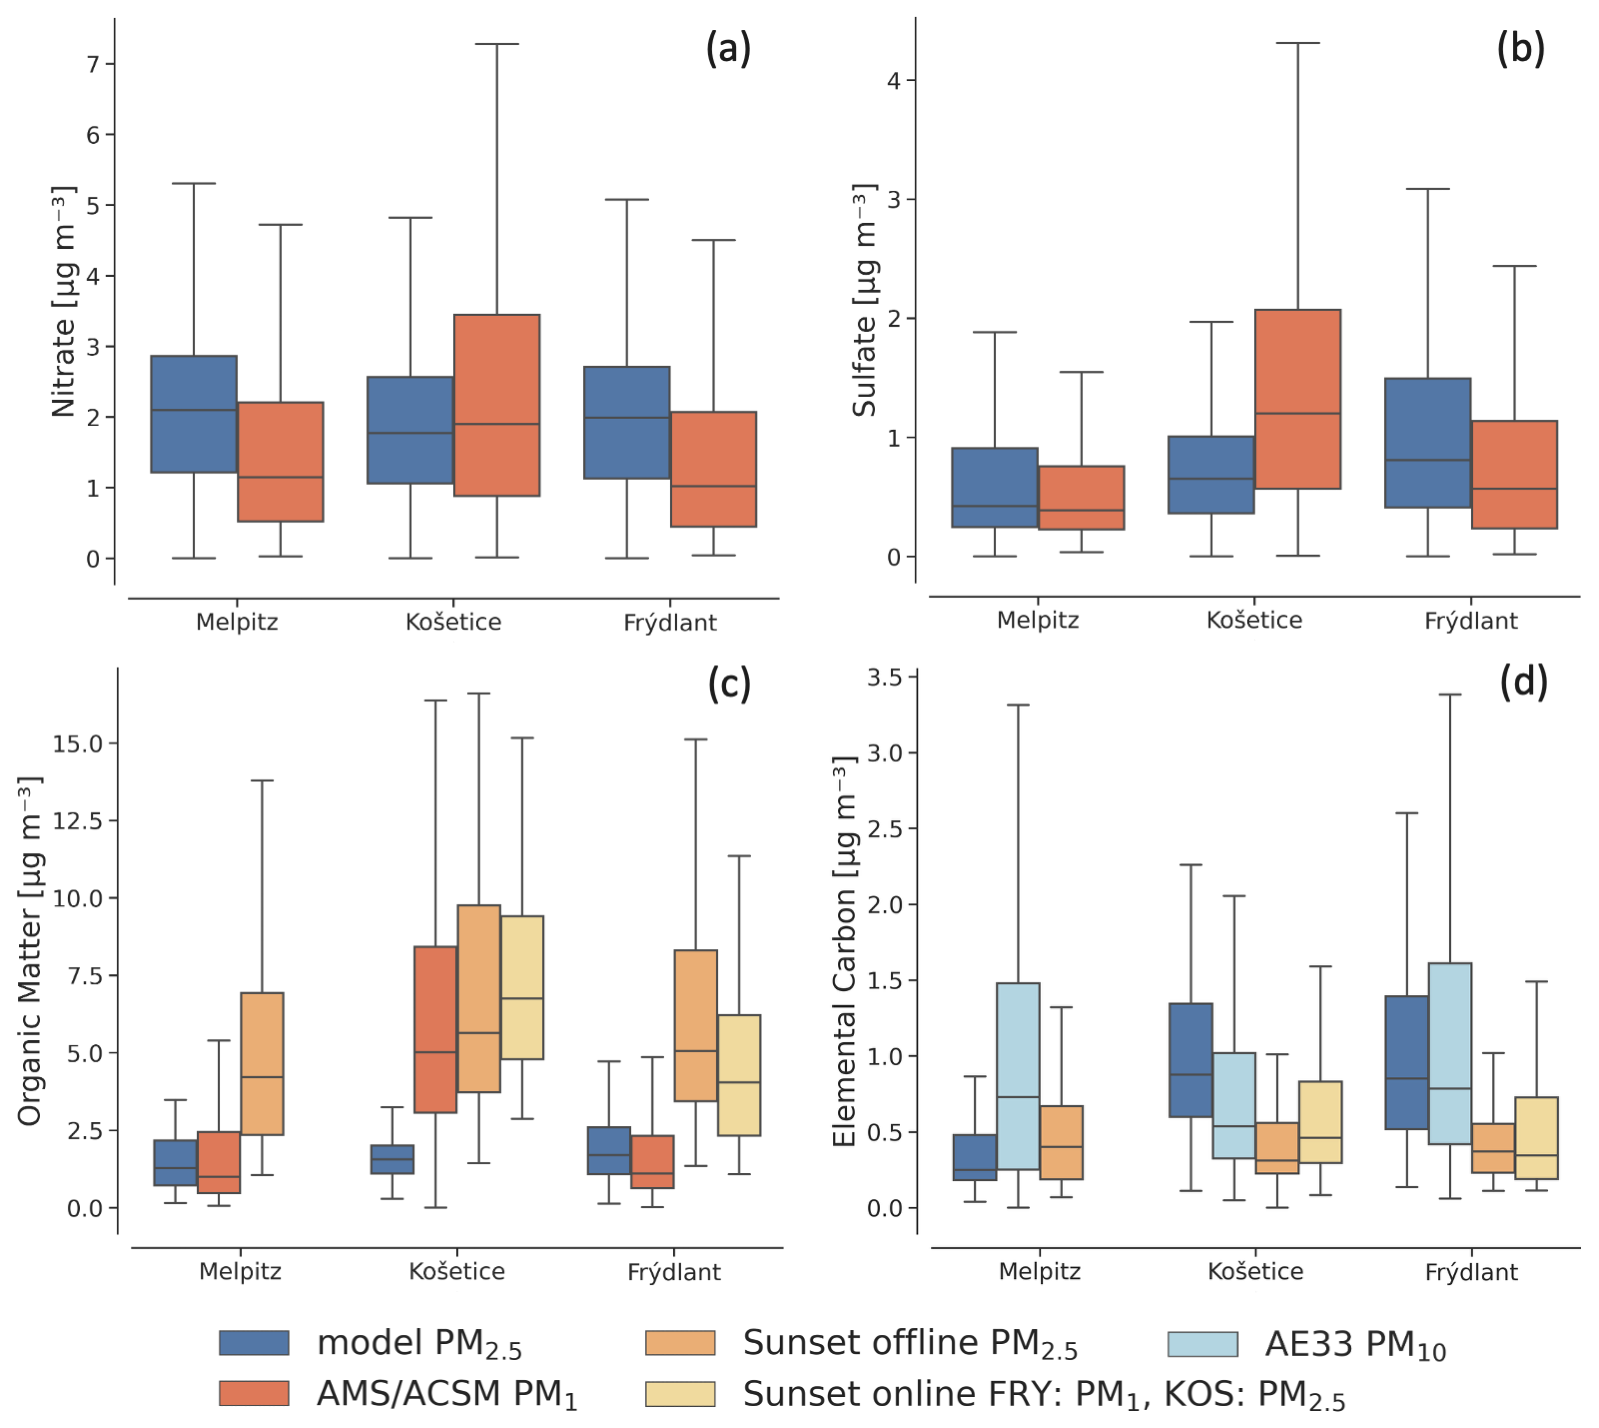
Figure 4Box and whisker plots for observations and modelled data at corresponding times during the campaign period. Rectangular boxes display the first and third quartiles. The line within each box represents the median value. Outliers are excluded. For OM and EC, all data were averaged to 12 h. For comparability with AMS/ACSM measurements, a factor of 1.6 was applied to the OC measured by the Sunset Laboratory instruments.
3.2.1 Mineral dust
The Saharan dust outbreaks likely influenced the total PM2.5 concentrations during the TRACE campaign. In the model, the February event brought high dust loads for several days and led to dust deposition at all three stations (see Fig. 2). Lidar measurements in Leipzig recorded pure dust conditions, but below 3 km height, aerosol from continental Europe was likely mixed into the Saharan dust plumes (Haarig et al., 2022). This event had a rather short travel time (less than 2 d) before reaching Leipzig. For the March event, the model also shows dust reaching the three stations, though the loads were not as high as during the second event. Observations by Haarig et al. (2022) detected mixed pollution–dust conditions after air masses were transported over Spain and France, reaching Leipzig after 3–4 d. It is possible that the model underestimated surface PM2.5 during these events, potentially due to limitations in the model domain or insufficient vertical mixing to the surface.
3.2.2 Nitrate and sulfate
In Melpitz, the model performs well for sulfate, with a correlation coefficient of 0.71 and a small bias (NMB %), while nitrate is overestimated (NMB %), though its temporal variability is captured reasonably well (R=0.62) (see Fig. 4a and b). In Frýdlant, the model shows moderate correlations (R≈0.40–0.46) and biases (NMB % for sulfate and +40 % for nitrate) and low agreement within a factor of 2 (FAC2 < 50 %). Košetice exhibits the weakest agreement, with low correlations (R=0.16 for nitrate, R=0.36 for sulfate) and underestimations of both species (NMB =−26 % for nitrate and −51 % for sulfate). These results are broadly in line with model performance criteria reported in the literature, e.g. NMB within ±45 % for sulfate and ±60 % for nitrate (Huang et al., 2021) or NMB within ±30 % and R>0.40 (Emery et al., 2017). This indicates that the model captures the general magnitude and temporal variability of secondary inorganic aerosol concentrations across the domain reasonably well, despite some site-specific discrepancies (Table 3). The AMS/ACSM may underestimate total sulfate and nitrate concentrations in winter, when particle growth shifts part of the mass beyond the PM1 range (Poulain et al., 2020), though these species are generally predominantly found in PM1 (Zhang et al., 2023). Given their relatively small contribution to total PM2.5 at our sites, it is unlikely that secondary inorganic aerosols are responsible for the discrepancy between the predicted and measured PM2.5 aerosol mass concentrations.
3.2.3 Elemental carbon
EC concentrations show overall good agreement with observations (see Fig. 4d). Our model aligns more closely with the Aethalometer data in Košetice (RMSE: 0.66 µg m−3, NMB: +30 %) and Frýdlant (RMSE: 0.93 µg m−3, NMB: −7 %) than in Melpitz, where it agrees well with the offline Sunset Laboratory measurements (RMSE: 0.37 µg m−3, NMB: −23 %). The discrepancy between Aethalometer and Sunset Laboratory measurements arises from the different carbon fractions they detect: the Aethalometer measures optically absorbing carbon (black carbon) in PM10, while the Sunset Laboratory instruments quantify elemental carbon (see Fig. A3 in the Appendix). Although differences in particle size cut-offs must be considered when comparing observations and model results, Poulain et al. (2011) found that around 90 % of the mass of elemental black carbon (eBC) in PM10 is contained within the PM1 fraction. Comparing across these different size classes should therefore be reasonable. In Košetice and Frýdlant, our model slightly overestimates EC concentrations, with NMB values of +136 % and +144 %, respectively. For winter 2019, Aethalometer measurements reported 0.98 ± 0.76 µg m−3 BC in Košetice (Lhotka et al., 2025), while Pokorná et al. (2022) found 0.92 ± 0.77 µg m−3 for winter 2020. In comparison, our averaged model result for 2021 was 0.76 µg m−3. In Melpitz, literature data show significant variability in BC concentrations. Atabakhsh et al. (2023) reported a value of 1.38 µg m−3 converted to PM1 using a multi-angle absorption photometer (MAAP) during winter 2016/2017. Later, van Pinxteren et al. (2023) observed a marked decrease to 0.5 ± 0.41 µg m−3 in winter 2018/2019, likely reflecting reduced emissions and meteorological influences.
3.2.4 Organic matter
The modelled OM that we refer to hereafter is the sum of the fine primary organic aerosol (OM in PM2.5), the total SOA, and OM from outside the European simulation domain. Primary OM accounts for approximately half of the total OM, with mean contributions of 44 % in Melpitz and 48 % in Frýdlant and a slightly higher share of 57 % in Košetice (see Fig. A2 in the Appendix). Panel c in Fig. 4 compares all available OM values for our campaign period. Across all three stations, the comparison to the Sunset Laboratory data shows a systematic underestimation by the model, with large negative NMB values: −73 % in Melpitz, −79 % in Košetice, and −67 % in Frýdlant. RMSE values are also high for Melpitz and Frýdlant (4.95 and 5.18 µg m−3) but improve notably when considering only data from 15 February onwards, decreasing to 2.87 and 3.85 µg m−3, respectively.
The underestimation of these values by our model seems to have a large contribution to the total PM2.5 underestimation. The discrepancy between Sunset Laboratory and AMS/ACSM observations may partly result from the different particle size ranges each instrument targets: Sunset Laboratory samples PM2.5, while AMS/ACSM captures only PM1. Nevertheless, since organic aerosol is predominantly found in the submicrometer size range throughout the year (Poulain et al., 2020), the comparison between modelled PM2.5 OM and AMS/ACSM PM1 OM remains meaningful. However, other factors contributing to the discrepancy cannot be ruled out. AMS/ACSM instruments are particularly well suited for capturing temporal variability due to their high time resolution and finer size cut-off (PM1). The Sunset Laboratory instruments provide an estimate of the total carbonaceous mass and are useful for assessing the magnitude of concentrations. It uses the same filters as the gravimetric reference method, allowing a more direct comparison to total PM2.5 mass and offering a more complete picture of the aerosol burden.
In Melpitz and Frýdlant, the model aligns reasonably well with AMS/ACSM observations, with RMSE values of 1.17 and 2.01 µg m−3 and NMBs of −8 % and +18 %, respectively. Correlation is also relatively strong in Melpitz (R=0.60) but lower in Frýdlant (R=0.19), where the model fails to capture diurnal variability. The model underestimates the OM concentrations by AMS/ACSM in Košetice (RMSE: 6.48 µg m−3; NMB: −74 %) and also does not fully reproduce the diurnal variations (R=0.39) (see Fig. A2 in the Appendix).
The correlation coefficient is good for Melpitz (0.60), indicating a good simulation of the overall trend as well. In contrast, for the Sunset Laboratory data, the correlation coefficient is only 0.24. The range of concentration of the Sunset Laboratory data is underestimated by the model (NMB %), which indicates that the model might be missing OM at this site. For Frýdlant, the diurnal patterns are not well captured by the model (R in comparison with AMS = 0.19), while the overall range of OM concentrations is also underestimated (Sunset Laboratory offline NMB = −67 %). In Košetice, the AMS/ACSM and both Sunset Laboratory instruments give consistent results, while the modelled data are noticeably lower. The AMS/ACSM detects lower values than our model, and modelled diurnal patterns also do not match the observation (NMB = −74 %, R=0.39). In comparison to the Sunset Laboratory filter measurements, the model shows a similar underestimation (NMB = −79 %). For Košetice, the same concentration levels for PM1 and PM2.5 size class OM indicate a dominance of fine aerosols, while there is few coarse-mode organic aerosols. The correlation coefficient of the model concentrations against the AMS/ACSM measurement is lower (0.39) than that of the filter samples (0.63). If only the SOA components of the modelled OM are taken into account, the correlation coefficient compared to the AMS/ACSM for Košetice decreases further to 0.18. For Frýdlant and Melpitz, calculating the correlation coefficient using only SOA gives similar results to using the total modelled OM concentration. The reduced correlation in Košetice when isolating SOA implies that the model underestimates secondary aerosol at this site, thereby negatively affecting the overall correlation.
Previous Sunset Laboratory filter measurements taken in Melpitz in winter 2018/2019 found an average value of 3.2 ± 3.2 µg m−3 (van Pinxteren et al., 2023). AMS/ACSM data for winter 2019 also give comparable values of 2.08±1.6 µg m−3 (Poulain et al., 2011), while measurements with an ACSM in winter 2016/2017 show higher values of 6.21 µg m−3 (Atabakhsh et al., 2023). For Košetice, a good characterisation of the site is also given by various previous studies. AMS/ACSM measurements provide average values of 3.13 µg m−3 in winter 2019 (Lhotka et al., 2025) and 4.55±4.40 µg m−3 in winter 2020 (Pokorná et al., 2022). Mbengue et al. (2018) found an average OC concentration in PM2.5 of 2.85±1.91 µg m−3 for the period 2013–2016. For our study period, we found Sunset Laboratory average filter values ranging from 5.06 µg m−3 in Melpitz to 7.74 µg m−3 in Košetice, exceeding typical values reported for previous years. This suggests a strong influence of meteorological conditions on the overall concentration levels.
The discrepancy between modelled and measured PM2.5 concentrations does not appear to be primarily driven by deviations in elemental carbon, sulfate, or nitrate concentrations. The overall good agreement between modelled and observed EC values, with correlation coefficients up to 0.61 and low bias, indicates a reliable simulation of primary combustion aerosol emissions. The contribution of secondary inorganic aerosol to total PM2.5 is limited, and the discussed modelling uncertainties are likely not the main reason for the underestimation of total PM2.5. OM is significantly underestimated, especially in Košetice (NMB =−74 %, R=0.39), which explains a large part of the PM2.5 model bias. We hypothesise that the underestimation of secondary organic aerosol is a major source of error in total PM2.5 simulations. A spatial variation in the model's performance is apparent, with similar trends observed in Melpitz and Frýdlant, whereas Košetice exhibits distinct behaviour. The dominance of fine particles in OM, suggested by nearly identical concentrations in the PM1 and PM2.5 size fractions, points to elevated levels of secondary particles. Given the general agreement with previous campaigns, we can also conclude that our campaign, although characterised by unusual meteorological conditions during the first weeks, represents typical aerosol conditions at these sites. Therefore, the underestimation could indicate a general underrepresentation of SOA during winter in this area in COSMO–MUSCAT.
3.3 Source attribution for elemental carbon and primary organic matter
Since the model accurately reproduces EC concentrations, which represent a primary anthropogenic aerosol component, we conclude that anthropogenic sources are well represented in the model, enabling reliable identification of source contributions. Additionally, with approximately half of the total OM comprised of POA, we infer that overall source profiles can be effectively identified by analysing primary OM and EC using the non-reactive tagging approach. The results, shown as relative contributions to primary OM and EC for the cold and warm periods (Fig. 5), underline the importance of long-range transport of particles. The source sector “boundary” represents transported particles from the outer model domains into the innermost domain where tagging is applied. During the warm period, long-range transport accounts for about 38 % of both EC and OM in Melpitz, illustrating the significant influence of particles originating outside the domain. In Košetice, the contribution is 23.8 % for OM and 22.8 % for EC, while Frýdlant has the lowest influence, with 16.6 % for OM and 14.6 % for EC. The prevailing wind regime and the basin-like topography of the Czech Republic reduce the influence of long-range transport in Košetice compared to the other two stations. The “boundary” contribution to fine OM and EC is only slightly higher than for Frýdlant, which is located in the middle of the domain (see Fig. 8). Backward trajectory analyses (HYSPLIT; Stein et al., 2015) indicate that during the high-PM-peak event in early February, stationary meteorological conditions resulted in minimal air mass transport to all sites. This effect is particularly pronounced in Košetice, where strong local stagnation can be observed.
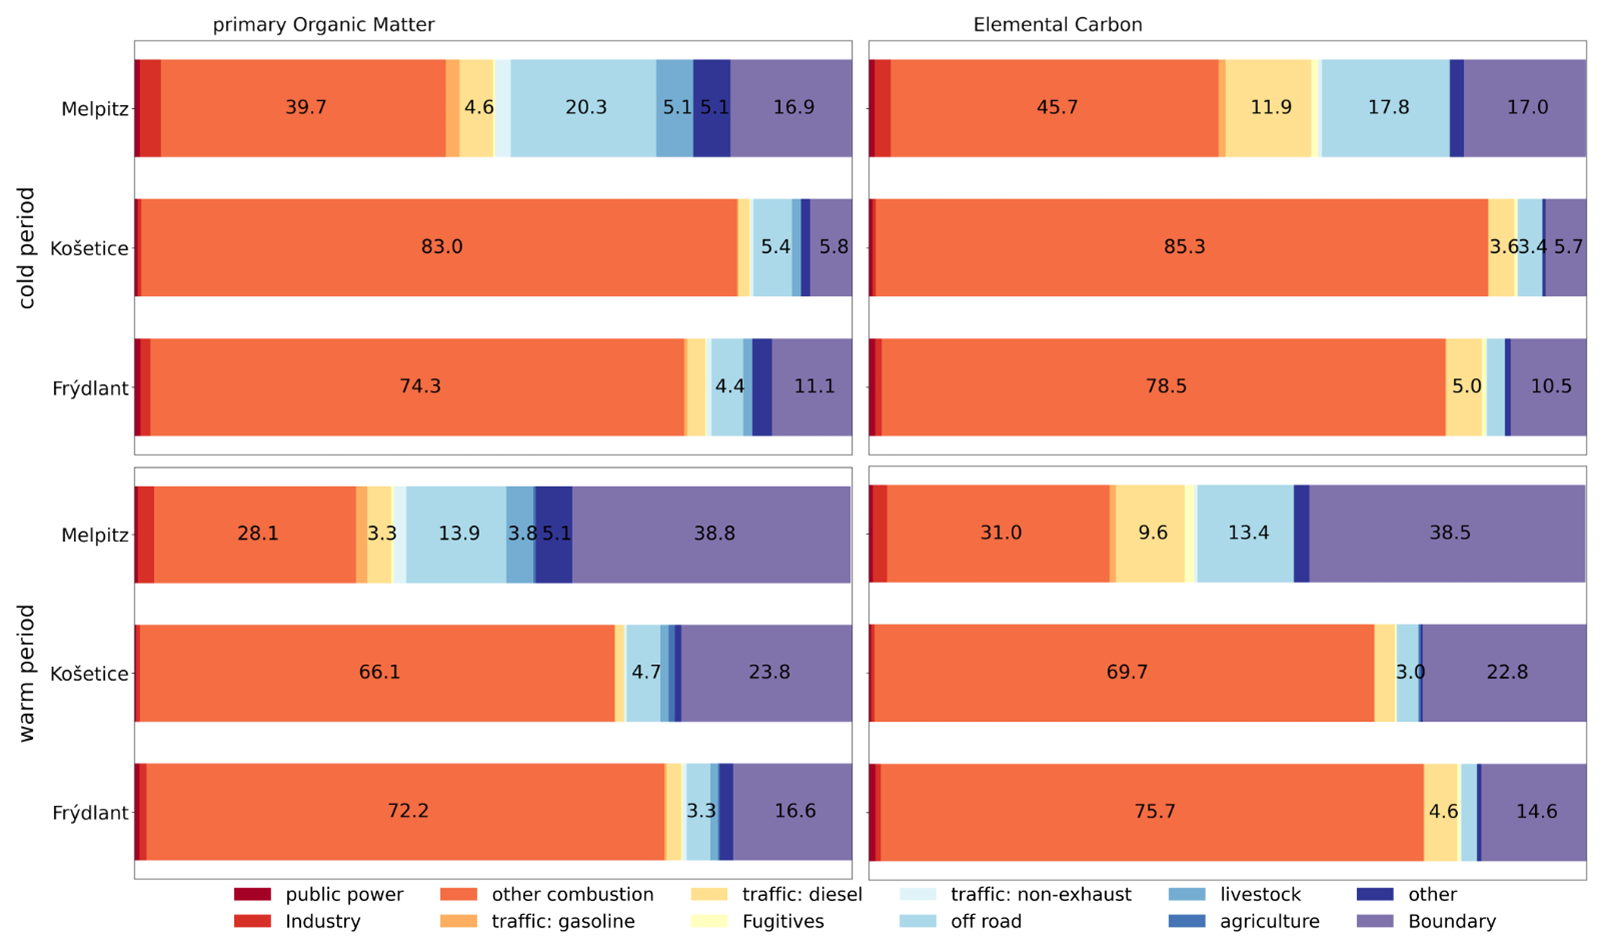
Figure 5Relative source contributions to primary organic matter in PM2.5 and elemental carbon in PM2.5. Top: cold period (5–16 February 2021), bottom: warm period (16 February–23 March 2021)
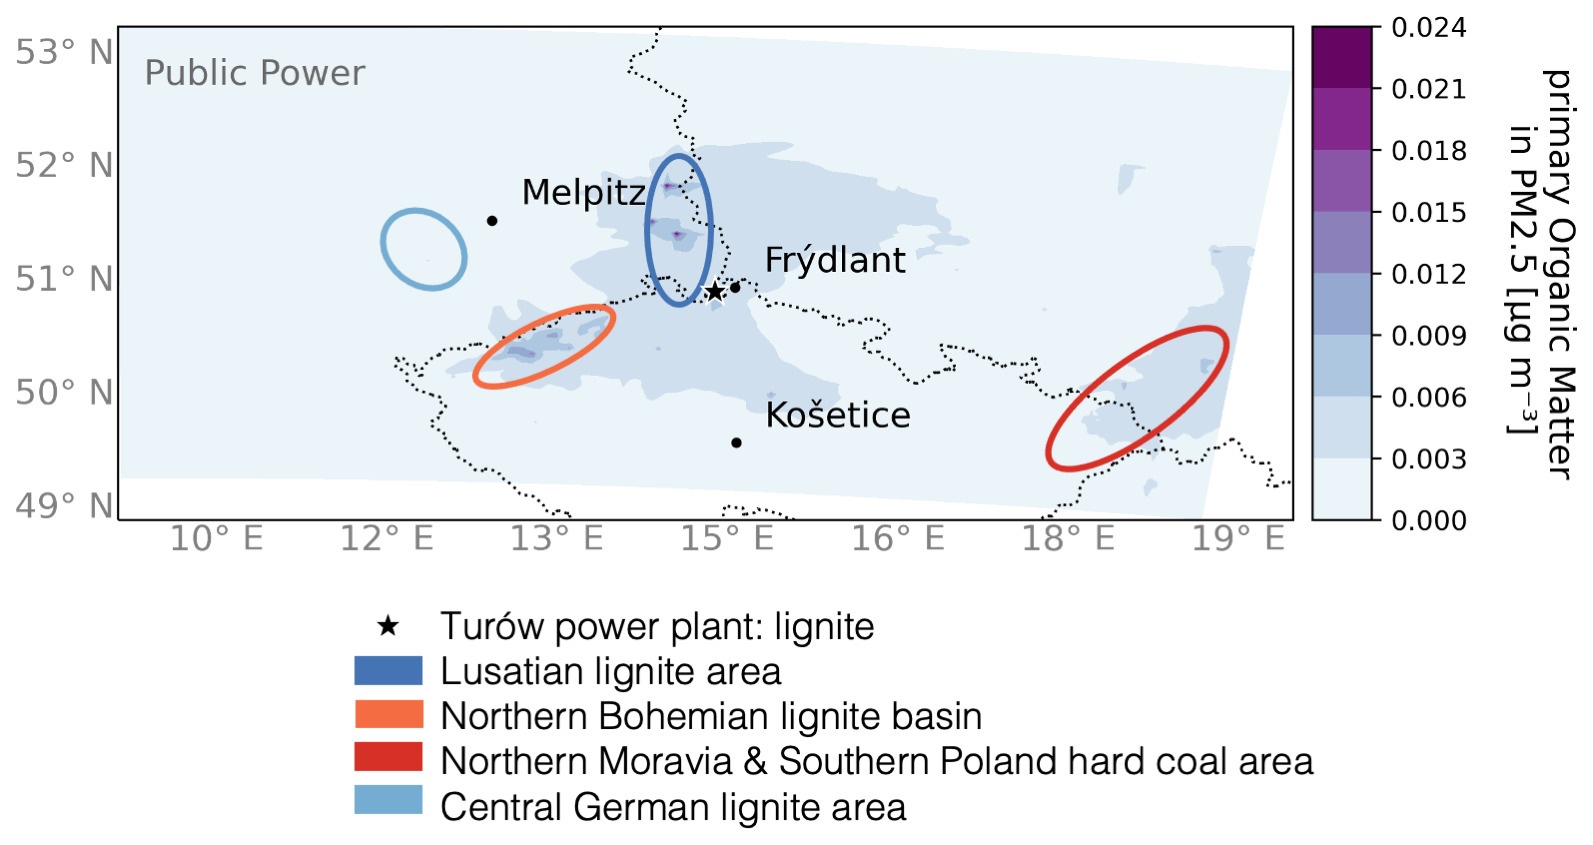
Figure 6Spatial distribution of the average absolute contribution of emissions from the source sector Public Power to the concentrations of primary organic matter in PM2.5. Areas with many coal-fired power plants are highlighted.
The study region, spanning parts of Germany, Poland, and the Czech Republic, is characterised by a high density of active lignite mines (see Fig. 6). Lignite, a particularly emissions-intensive fuel, is the energy source for many large power plants in this area. Germany and Poland host the largest number of coal-fired power plants with the highest total capacities in the EU (Alves Dias et al., 2018). Emissions from power plants used for electricity and heat production are categorised under the source sector “public power”. Despite its proximity to areas with a high number of coal-fired power plants, the “public power” sector contributes only a small share to the overall concentration of primary OM and EC. Tagging results for this sector, split by country of origin, are shown in Fig. 7, indicating that the peaks in Frýdlant are predominantly driven by Polish emissions. The proximity of the Turów lignite power plant largely explains the observed peaks, especially during periods of low wind speeds. During other periods, emissions from German and Czech sources dominate. The influence of coal burning on air quality in Frýdlant is further amplified by its use in domestic heating. In 2017, 47.7 % of Polish households with individual heating relied on coal (Macuk, 2019).
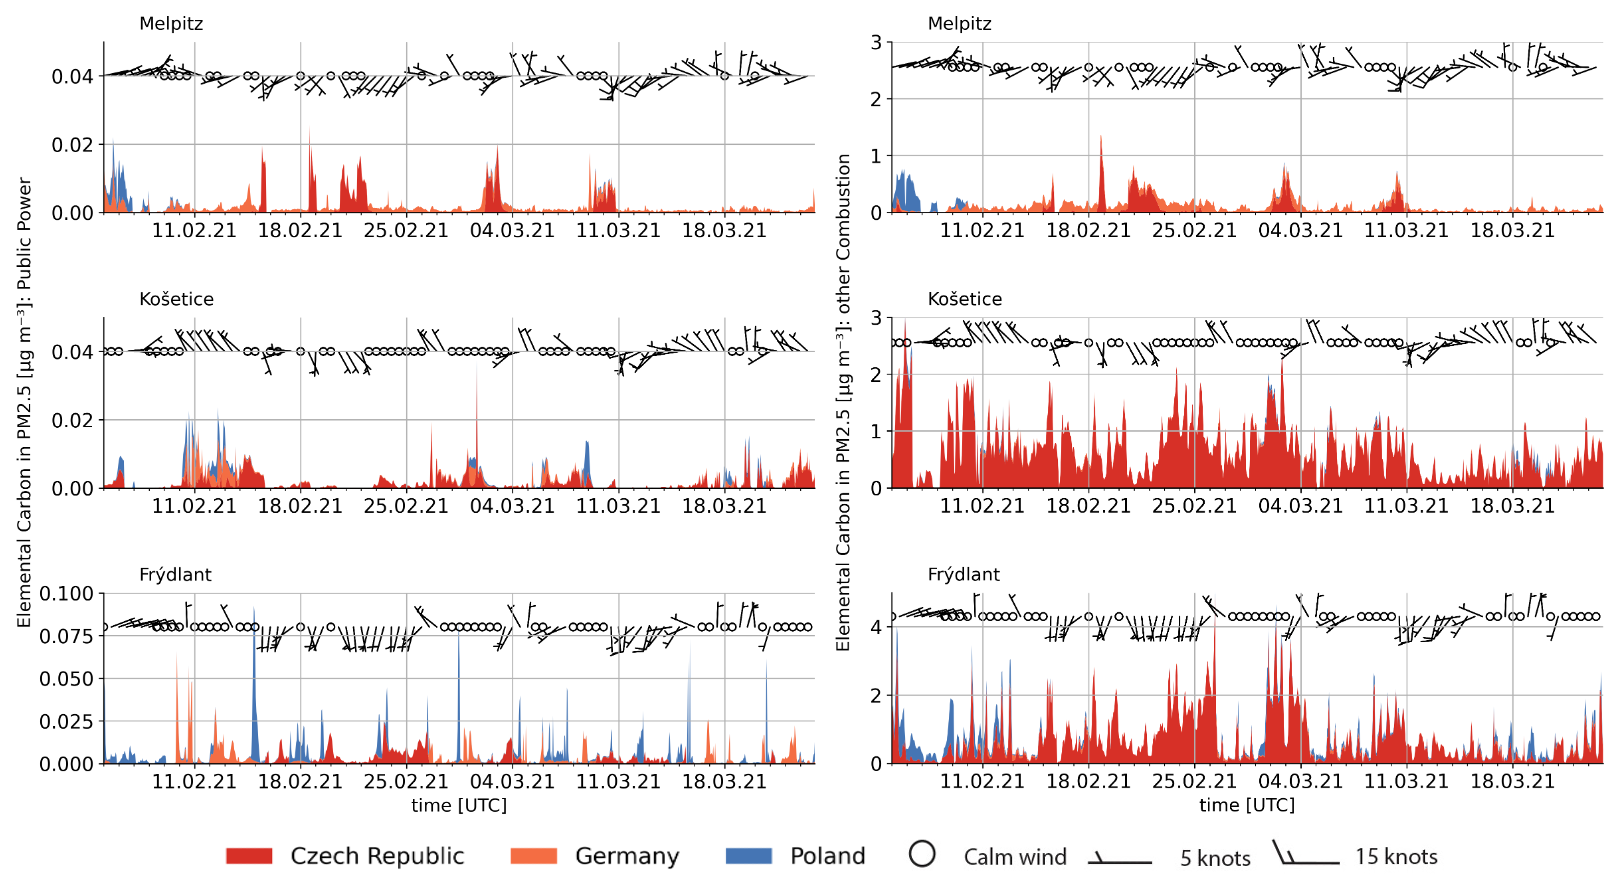
Figure 7Elemental carbon in PM2.5 concentration, broken down by country of origin and source sector. Left: “public power”, right: “other combustion”. The wind barbs represent wind direction and speed, with 12 h averages modelled for each station at surface level.
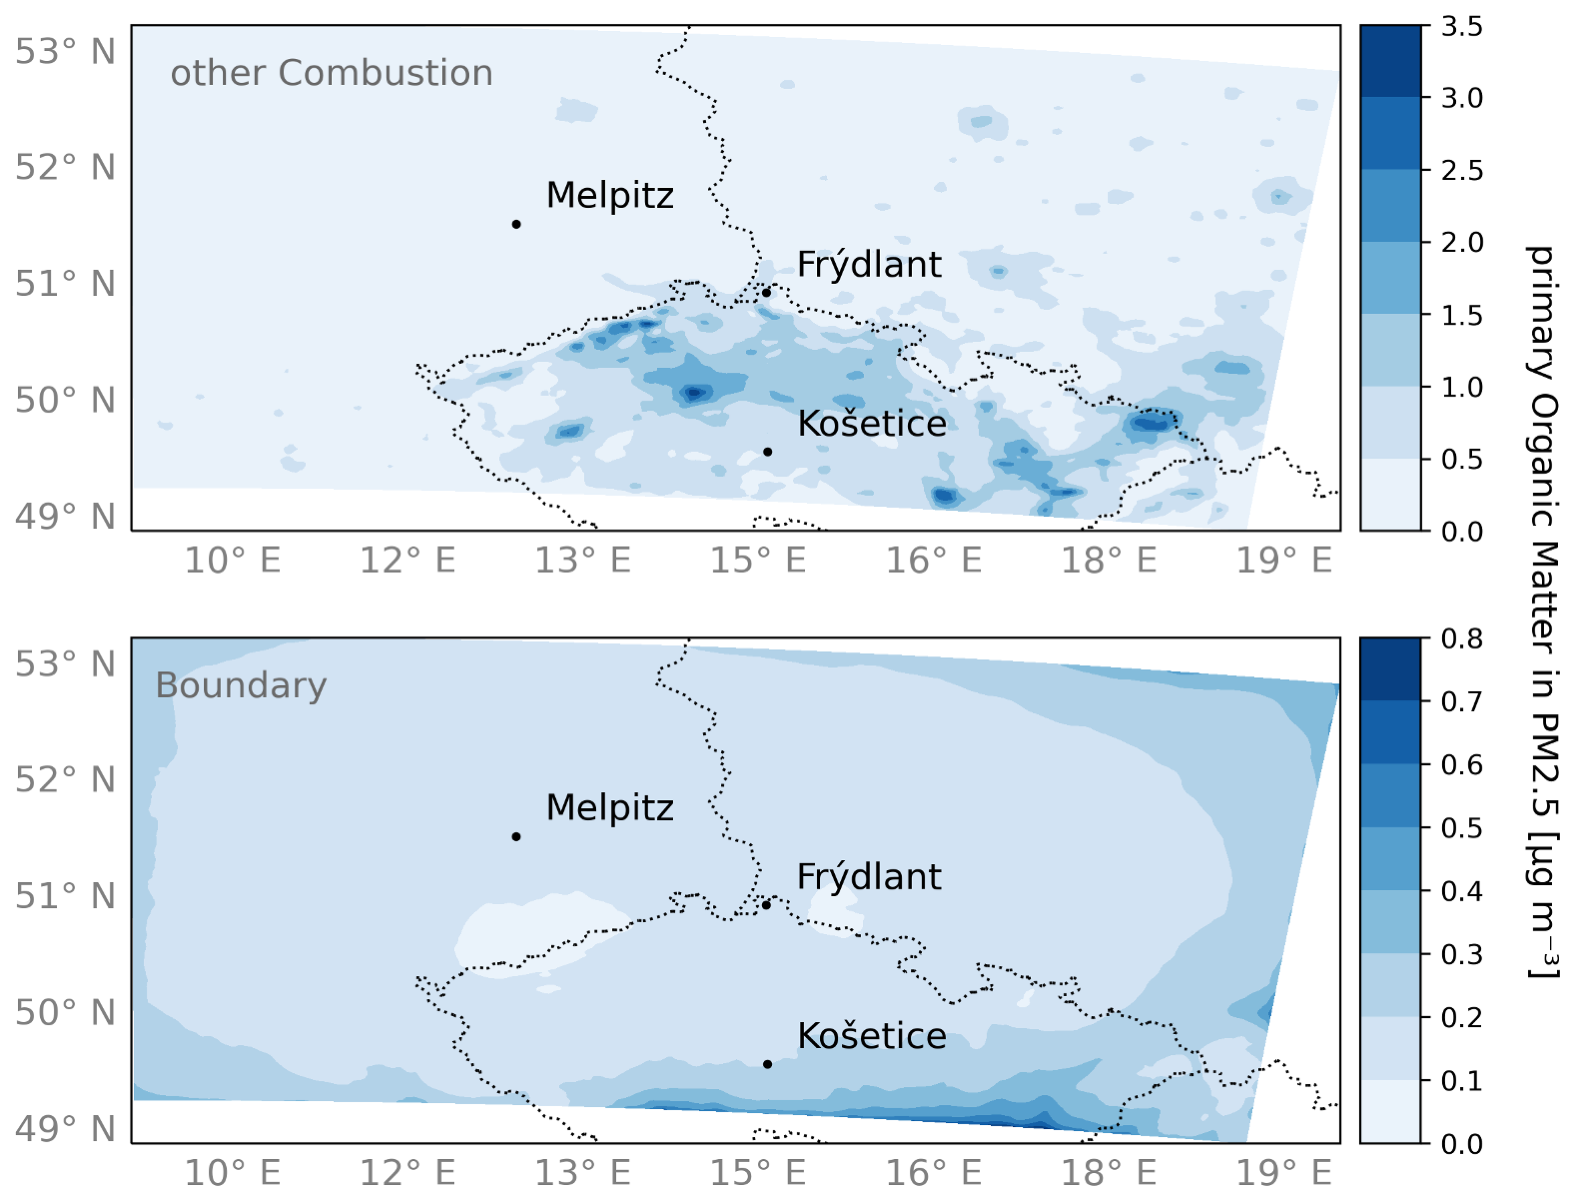
Figure 8Spatial distribution of the average absolute contribution of emissions from source sectors “other combustion” (top) and “boundary” (bottom) to the concentrations of primary organic matter in PM2.5.
The sector “other combustion” includes combustion processes of private households, in particular domestic heating processes with all fuel types. This sector has the biggest contribution, with up to 76.3 % for EC and 72.6 % for primary OM in Frýdlant. Contributions to fine OM from the “other combustion” sector are the highest in the Czech Republic and in urban agglomerations in Poland and around Berlin, Germany (see Fig. 8, right panel). The main contributors to the concentrations observed at the stations are emissions originating within the country where the station is located. However, Melpitz stands out with the highest proportion of contributions from cross-border emissions. Atabakhsh et al. (2023) carried out a positive matrix factorisation (PMF) analysis over a period of 1 year in Melpitz. They found the highest coal combustion contribution to POA under the influence of easterly continental air masses. Furthermore, they found a temperature and RH dependence for the factor consisting of aged SOA and highly oxidised OA in winter, with the highest concentrations observed at temperatures below 0 °C and RH above 80 %. They concluded that increased precursor emissions due to higher heating activities and amplified aqueous-phase chemistry lead to increased SOA formation. This could suggest a potential additional underestimation of the SOA formation rate in early February, as strong easterly winds were observed, followed by a subsequent cold period.
Chen et al. (2022) conducted a multi-year PMF source apportionment study across various locations in Europe. They identified a coal combustion factor of primary OA at only two sites: Melpitz (data collected in 2016/2017) and the urban location Kraków (data collected in 2018). The strong seasonal variations in this factor suggest that it originates from residential heating emissions. The study also examined Košetice, where no coal combustion factor was detected; however, biomass burning accounted for 15.5 % of the total OA in winter 2019. Lhotka et al. (2025) conducted a PMF study with data also collected in 2019 in Košetice. They identified a coal combustion factor with the highest contribution of 5 % to total OA in spring, while biomass combustion contributed the most in winter (12 % of total OA). Both factors showed similar diurnal cycles related to domestic heating, and a strong correlation between levoglucosan and the biomass combustion factor was observed in winter, indicating a high proportion of wood combustion. During a particularly cold period in January 2019, an increased contribution of coal was observed, probably due to its increased use in private households for heating, given its higher calorific value compared to wood. The results are also consistent with those of Horník et al. (2024), who performed a PMF study with samples collected during the TRACE campaign for water-soluble organic compounds using NMR. They found a high residential heating contribution with coal markers, indicating additional coal combustion in early February in Košetice.
Pokorná et al. (2018) analysed changes in PM2.5 composition and sources from the 1990s to 2009/2010 in Košetice. During this period, the dominant sources shifted from lignite combustion by power plants and oil combustion to residential heating, mainly with coal and/or biomass. In the Czech Republic, only 5 % of total coal consumption in 2019 was used in the residential sector, as part of the “other combustion” source sector (IEA, 2021). Hovorka et al. (2015) conducted a receptor modelling study in a residential area 64 km north-east of Prague in winter 2013 and estimated that wood burning contributed 49 % to the mass of fine aerosol. They found high correlations between contributions from wood combustion and levoglucosan and suggested that wood combustion in local boilers is common in suburban areas in the Czech Republic.
The landscape surrounding Košetice is mainly agricultural with scattered woodland, and the only direct sources of pollution are local roads and domestic heating (Zikova and Zdimal, 2016). It is plausible to assume high rates of wood burning, given the proximity of the timber factory. Levoglucosan, an aerosol tracer that is associated with biomass burning, measured during the TRACE campaign, shows the highest mean concentrations in Košetice (0.32 µg m−3) and the lowest in Melpitz (0.15 µg m−3). Polycyclic aromatic hydrocarbons (PAHs) are also good tracers of combustion processes; e.g. retene is a unique marker of wood combustion (Ramdahl, 1983). The average retene concentration in Košetice is 2.13 ng m−3, with an average total PAH concentration of 24.43 ng m−3. In Frýdlant, the average total PAH concentration is comparable (24.73 ng m−3), but retene concentrations are lower (1.01 ng m−3). Melpitz shows similar retene concentrations to Frýdlant (1.16 ng m−3) at lower total PAH levels (14.12 ng m−3). The high relative and absolute levels of retene and levoglucosan in Košetice are a good indicator of a high contribution of wood burning. The results are also consistent with those of Horník et al. (2024), who reported high levels of levoglucosan in Košetice and Frýdlant. Overall, the results indicate a strong influence of wood burning for domestic heating during winter in the Košetice area. During particularly cold periods, residents appear to supplement wood with coal, leading to a greater local impact of coal emissions on air quality. The higher coal contributions observed in Melpitz seem to be mainly driven by long-distance transport, whereas in Frýdlant, additional contributions from the nearby power plant are evident.
4.1 Effects of COVID-19 containment measures
With containment measures still in place during the campaign, the daily lives of many of the region's citizens were disrupted. Different patterns of mobilisation, the closure of businesses, and changes in leisure habits are all factors that can affect air quality. The emission inventories used in this study do not take into account exceptional events affecting emissions, such as the COVID-19 restrictions. Several studies have looked at the impact of these restrictions on air quality. Most of them focus on the year 2020, when the pandemic peaked.
Gkatzelis et al. (2021) reviewed over 200 papers to assess the impact of lockdowns on air quality around the world. They found significant reductions in NO2 and CO levels, small reductions in PM2.5, and increases in O3 concentrations. The effects varied by season and region, and the study highlighted the need for future research to include meteorological corrections for accurate results. Only about a third of the studies reviewed included methods for meteorological correction or normalisation.
Matthias et al. (2021) conducted a modelling study for central Europe, estimating emission reductions from January to June 2020. For secondary pollutants, they found that meteorological effects outweighed the effects of emission reductions from restrictions. Putaud et al. (2023) compared measurements at 28 sites across Europe for spring 2020 with CAMS ensemble forecasts and found a slight decrease in PM2.5 and PM10 during the lockdown and a strong increase after the measures were lifted. The study corrects the bias occurring between modelled and measured values through a time-dependent normalisation of the CAMS forecasts to the observations estimated from 2019 data. They concluded that the increased ozone levels due to reduced NOx led to altered oxidation capacities and therefore more SOA formation. The study also analysed data collected in Melpitz and Košetice before, during, and after the lockdown in March 2020. In Melpitz, slightly higher PM2.5 concentrations than expected by CAMS were detected during the lockdown. In May 2020, after the lockdown, they were even twice as high as the modelled concentrations. In Košetice, the values before and during the lockdown were slightly below the expected values, while the concentrations afterwards were 30 % higher. Forster et al. (2020) calculated emission trends based on Google mobility data for six sectors (land transport, residential, energy, industry, public, and aviation) per country. These data show that in March 2021, BC emissions from the residential sector in Germany and the Czech Republic were increased by approximately 10 %, while BC emissions in all sectors combined were decreased by about 20 % compared to a baseline scenario. Mbengue et al. (2023) conducted an extended study analysing the effects of the COVID-19 lockdowns in Košetice using normalisation techniques to account for meteorological effects. They found that during the winter of the second lockdown (December 2020–February 2021), dispersion normalised concentrations of EC were reduced by 28 %, while OC and SOC concentrations increased by 19 % and 51 %, respectively. They concluded that this was due to a greater influence of emissions from local domestic activities. Considering that our study sites are background stations with a low traffic influence and a high contribution of domestic heating emissions, locally increased emissions due to the COVID-19 mitigation measures seem plausible, leading to higher PM2.5 and probably SOA concentrations than without these measures. These changes are not included in the emissions in the model and may be another source of underestimation in the model.
4.2 Anthropogenic secondary organic aerosol
Bergström et al. (2012) found an underestimation of winter organic aerosol in a modelling study focusing on several years in Europe. Their conclusion was that emissions from wood combustion are underrepresented in current emission inventories. Previous source apportionment studies have shown that residential heating is a significant contributor to SOA formation. Lhotka et al. (2025) identified a relationship between primary organic aerosol (POA) and oxidised organic aerosol (OOA) source factors associated with residential heating. The high contribution of highly oxidised OA in winter can be attributed to the local influence of biomass burning. In contrast, in Melpitz, coal combustion plays a more prominent role in oxidised OA formation, indicating the impact of long-range transport (Atabakhsh et al., 2023). An intensive tagging study by Bartík et al. (2024) utilised the PSAT module in CAMx, supplementing the CAMS emission inventory with more detailed residential emission data for the Czech Republic and additional intermediate-volatility organic compound (IVOC) emissions from wood combustion. Their findings indicate that VOC and IVOC emissions from the “other combustion” sector represent the largest source of SOA in central Europe during winter, contributing up to 0.4 µg m−3. In order to investigate whether a potential underestimation of SOA precursors from domestic heating contributed to the lower-than-expected concentrations of OM in our model, we carried out a sensitivity study.
4.2.1 Sensitivity study
The parameterisation of SOA is influenced by two key variables: the precursor gases emitted and the rate at which SOA is formed from these precursors. Previous studies suggest that phenol is a significant component of emissions from incomplete combustion processes like wood burning. Phenol is one of the key gaseous precursors responsible for the formation of SOA during biomass burning activities (Hatch et al., 2015; Bruns et al., 2016). Liu et al. (2024) highlight the critical role of nighttime NO3 oxidation of anthropogenic VOCs from biomass combustion, a process they find is inadequately represented in current atmospheric models. Their results show that increasing both phenol emissions and the associated SOA yield leads to a 2-fold increase in SOA production via NO3 oxidation across Europe during winter. In our model, phenol is included in the lumped species cresol and other aromatics (CSL) (see Reaction 1). NMVOC emissions are delivered by the UBA and CAMS emission inventories (Schneider et al., 2016; Kuenen et al., 2022). The NMVOC emission flux is split into the different relevant model species based on emission profiles created by Theloke and Friedrich (2007) for 306 individual species, including phenol. These profiles are based on an NMVOC source database from 1990 (Olivier et al., 1996) and do not include phenol emissions from domestic heating. Therefore, it is reasonable to assume that the VOCs emitted from domestic heating are not fully captured by the model. Natural fire emissions provided by GFAS do not include CSL but rather toluene (TOL) and xylene (XYL) emissions. Given the low impact of natural fires in winter in Europe, it can be assumed that they do not contribute much to the formation of secondary particles.
The SORGAM module (see Sect. 2.3) estimates SOA formation from aromatic precursors using data from Odum et al. (1997), who conducted smog chamber experiments to quantify SOA production from gasoline vapour. This method is therefore primarily tailored to traffic emissions. However, for aromatic precursors emitted by domestic heating, an increase in SOA yield aligned with phenol SOA formation rates is more suitable. Due to the limited availability of chamber studies on phenol gas-phase SOA formation, we derived a new yield estimate based on four OH oxidation measurements from Yee et al. (2013). Given the importance of nocturnal oxidation, we also applied these modifications to the NO3 reaction. A non-linear least squares fit for the αi values was performed with fixed-Kom,i coefficients (, ). As α2 yielded negative values, we decided to keep α2 fixed and performed the fit solely for α1 (see Fig. A6 in the Appendix). These adjustments result in an approximately 3-fold increase in SOA yield.
Further, an adjustment was made to the input emission. To obtain a good representation of phenol emissions from domestic heating processes, we decided to scale the emissions to the CO emissions of the emission sector “other combustion”. Following wood combustion chamber studies from Bruns et al. (2016), on average all NMVOC emissions make up 0.22 times the CO emissions. According to Schauer et al. (2001), phenol and substituted organic compounds are approximately 10 % of the overall NMVOC emissions from wood combustion. Accordingly, we set our “other combustion” sector CSL emissions to 0.022 times the sector's CO emissions.
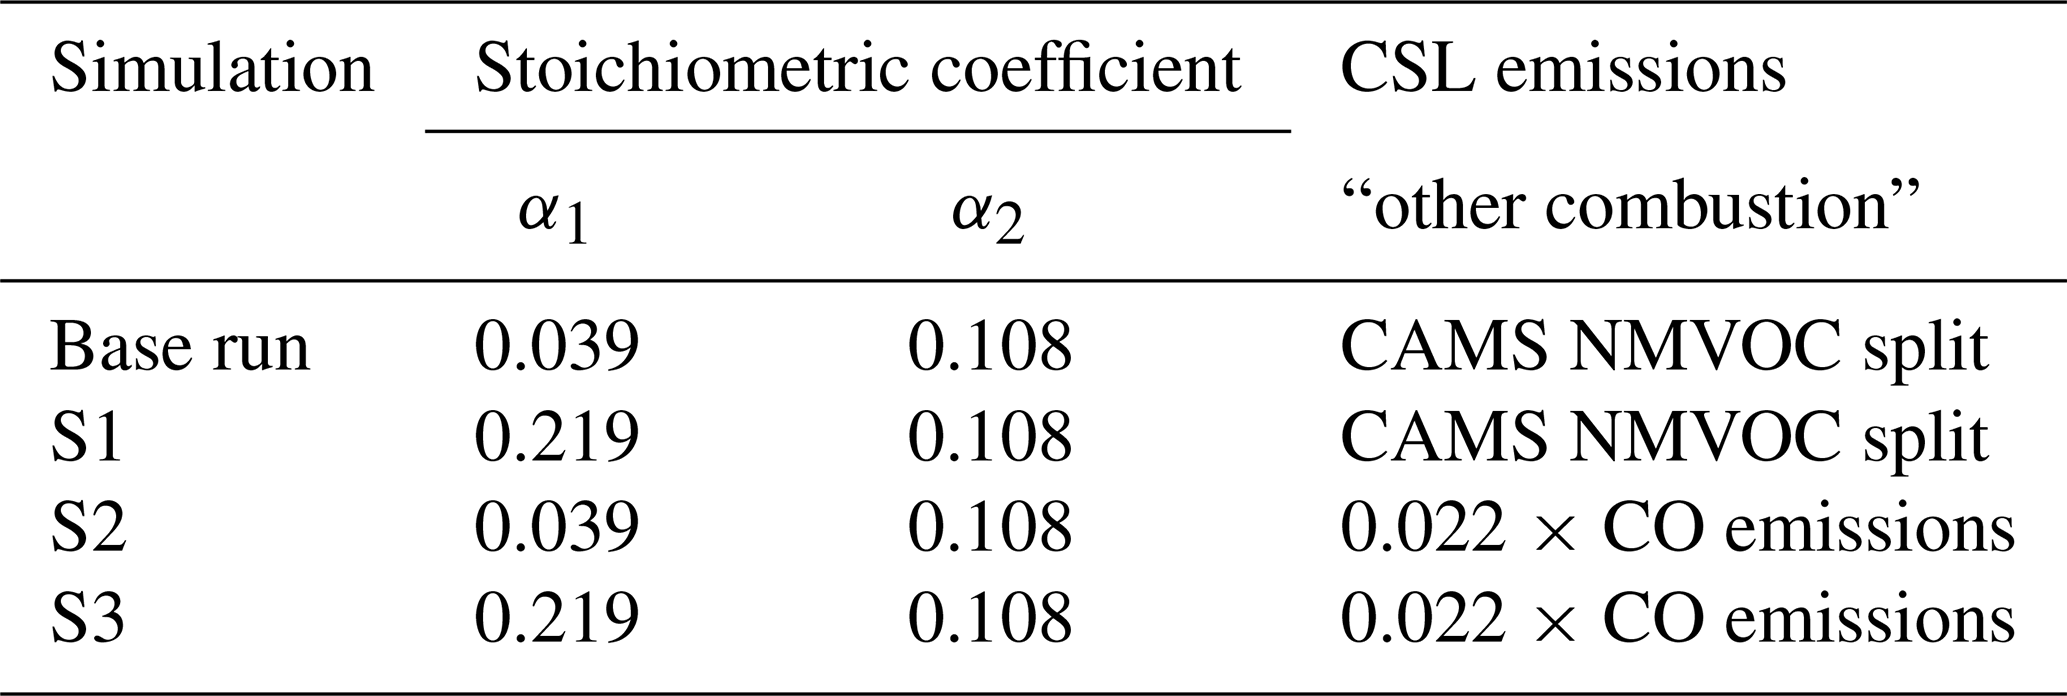
We simulated three sensitivity runs to compare these adjustments: first with the adjusted SOA yield alone (S1), second with the new CSL emissions alone (S2), and third with both combined (S3). Table 4 gives an overview of the coefficients and emissions used in the different sensitivity runs and the original base run. All sensitivity runs were performed for our middle domain, TRACED0 (see Fig. 1), as it provides the best trade-off between spatial resolution and area coverage. The three sensitivity runs were not nested but used the same initial and boundary conditions as the base run.
Table 4Overview of the sensitivity simulations. Shown are changes to α1 to adjust the SOA yield parameter for aromatic precursors and scaling of CSL emissions based on CO emissions from GNFR C to account for phenol contributions.
4.2.2 Sensitivity study results
The changes in CSL emission flux and the corresponding mean OM concentration across the three sensitivity runs are presented in Table 5. The values for each station represent the model result from the 4×4 km grid cell in which the station is located. In S1, the increased SOA yield for aromatic precursors has the most pronounced effect in urban areas, as it influences emissions from all source sectors, including industry and transport. The adjusted SOA yield applies to both daytime OH oxidation and nighttime NO3 oxidation. Among the stations, Melpitz shows the highest relative increase (39 %) in mean OM concentrations, reaching 1.86 µg m−3, due to high aromatic precursor levels.
Table 5Changes in CSL emission flux and mean organic matter in PM2.5 for all sensitivity runs compared to the base run.
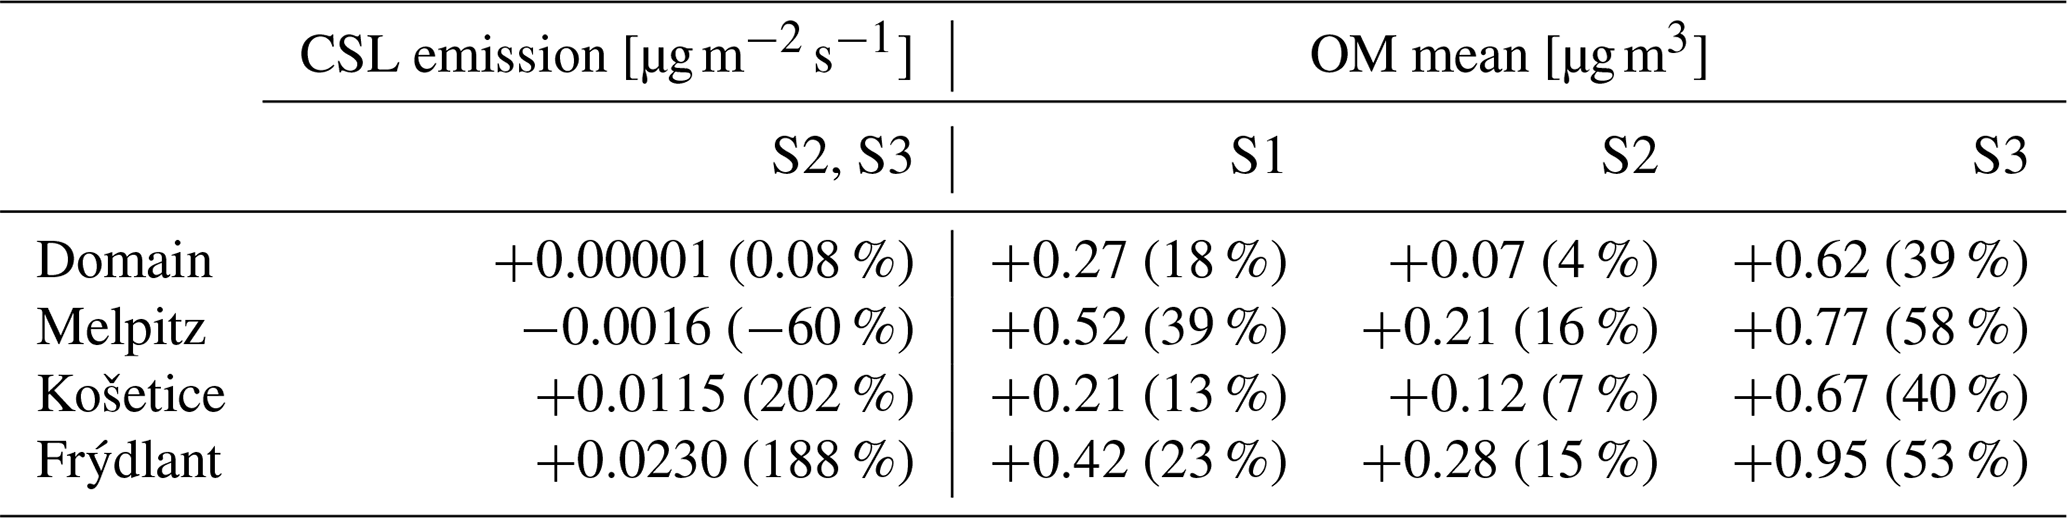
In S2, the emissions of aromatics from domestic heating are introduced as CSL emissions by the sector “other combustion”. Although total CSL emissions across the domain remain constant, their spatial distribution shifts: emissions decrease in Melpitz but increase significantly in Frýdlant and Košetice. The domain-wide mean OM concentration shows an overall modest increase of 4 %, with the largest increases observed in the central Czech Republic and southern Poland, where domestic heating sources are abundant. Interestingly, despite a reduction in CSL emissions in Melpitz compared to the base run, OM concentrations in Melpitz increase similarly to those in Frýdlant (+16 % in Melpitz and +15 % in Frýdlant). This is attributed to increased CSL emissions in the surrounding areas and the transport of SOA and its precursors to the site. These findings align with previous studies: Poulain et al. (2011) linked winter OM in Melpitz to transported particles, while Spindler et al. (2012) reported that SOA concentrations peaked in winter air masses arriving from the east, highlighting the role of anthropogenic-precursor-driven SOA formation during long-range transport. This is also consistent with the conclusions of Atabakhsh et al. (2023).
In the combined S3 run, average OM concentrations in Melpitz increase by 58 % to 2.11 µg m−3, representing the highest relative impact among all stations. This increase can be attributed to enhanced SOA transport and formation from aromatic precursors. Frýdlant shows the largest absolute OM increase, with an average increment of 0.95 µg m−3, reaching 2.76 µg m−3 (see Table 5). Figure 9 compares diurnal OM cycles from the base and sensitivity runs with measurements. In Frýdlant and Košetice, the combined adjustments in S3 produce greater impacts on OM concentrations compared to the individual sensitivity runs. This leads to better agreement with the measurements in Košetice but results in overestimation compared to the AMS/ACSM data in Frýdlant. As discussed previously, the discrepancies between the AMS/ACSM and Sunset Laboratory measurements cannot be fully resolved in this work, and both datasets must therefore be regarded as valid. Taking into account the measurement uncertainties, the fact that the simulated OM concentrations in Frýdlant now lie between the two measurements supports the plausibility of the modelled increase. Evaluating both datasets in combination provides a more comprehensive and balanced assessment of actual OM levels. The AMS/ACSM is better suited to capturing diurnal patterns due to its higher time resolution. In Frýdlant, the model simulates a clear morning peak in OM concentrations that is absent in the AMS/ACSM data. This discrepancy suggests that the model may be overestimating the contribution from local or near-field sources, while underestimating the influence of long-range transport.
In Melpitz, however, the difference between S1 and S3 is less distinct, suggesting that higher baseline precursor concentrations already contribute significantly to SOA formation at this site. The correlation of the modelled SOA with AMS/ACSM data improves in Košetice, with the correlation coefficient increasing from 0.18 to 0.29, while Melpitz and Frýdlant show no significant improvement. Although the model now better reflects SOA contributions in Košetice, overall OM concentrations remain underestimated.
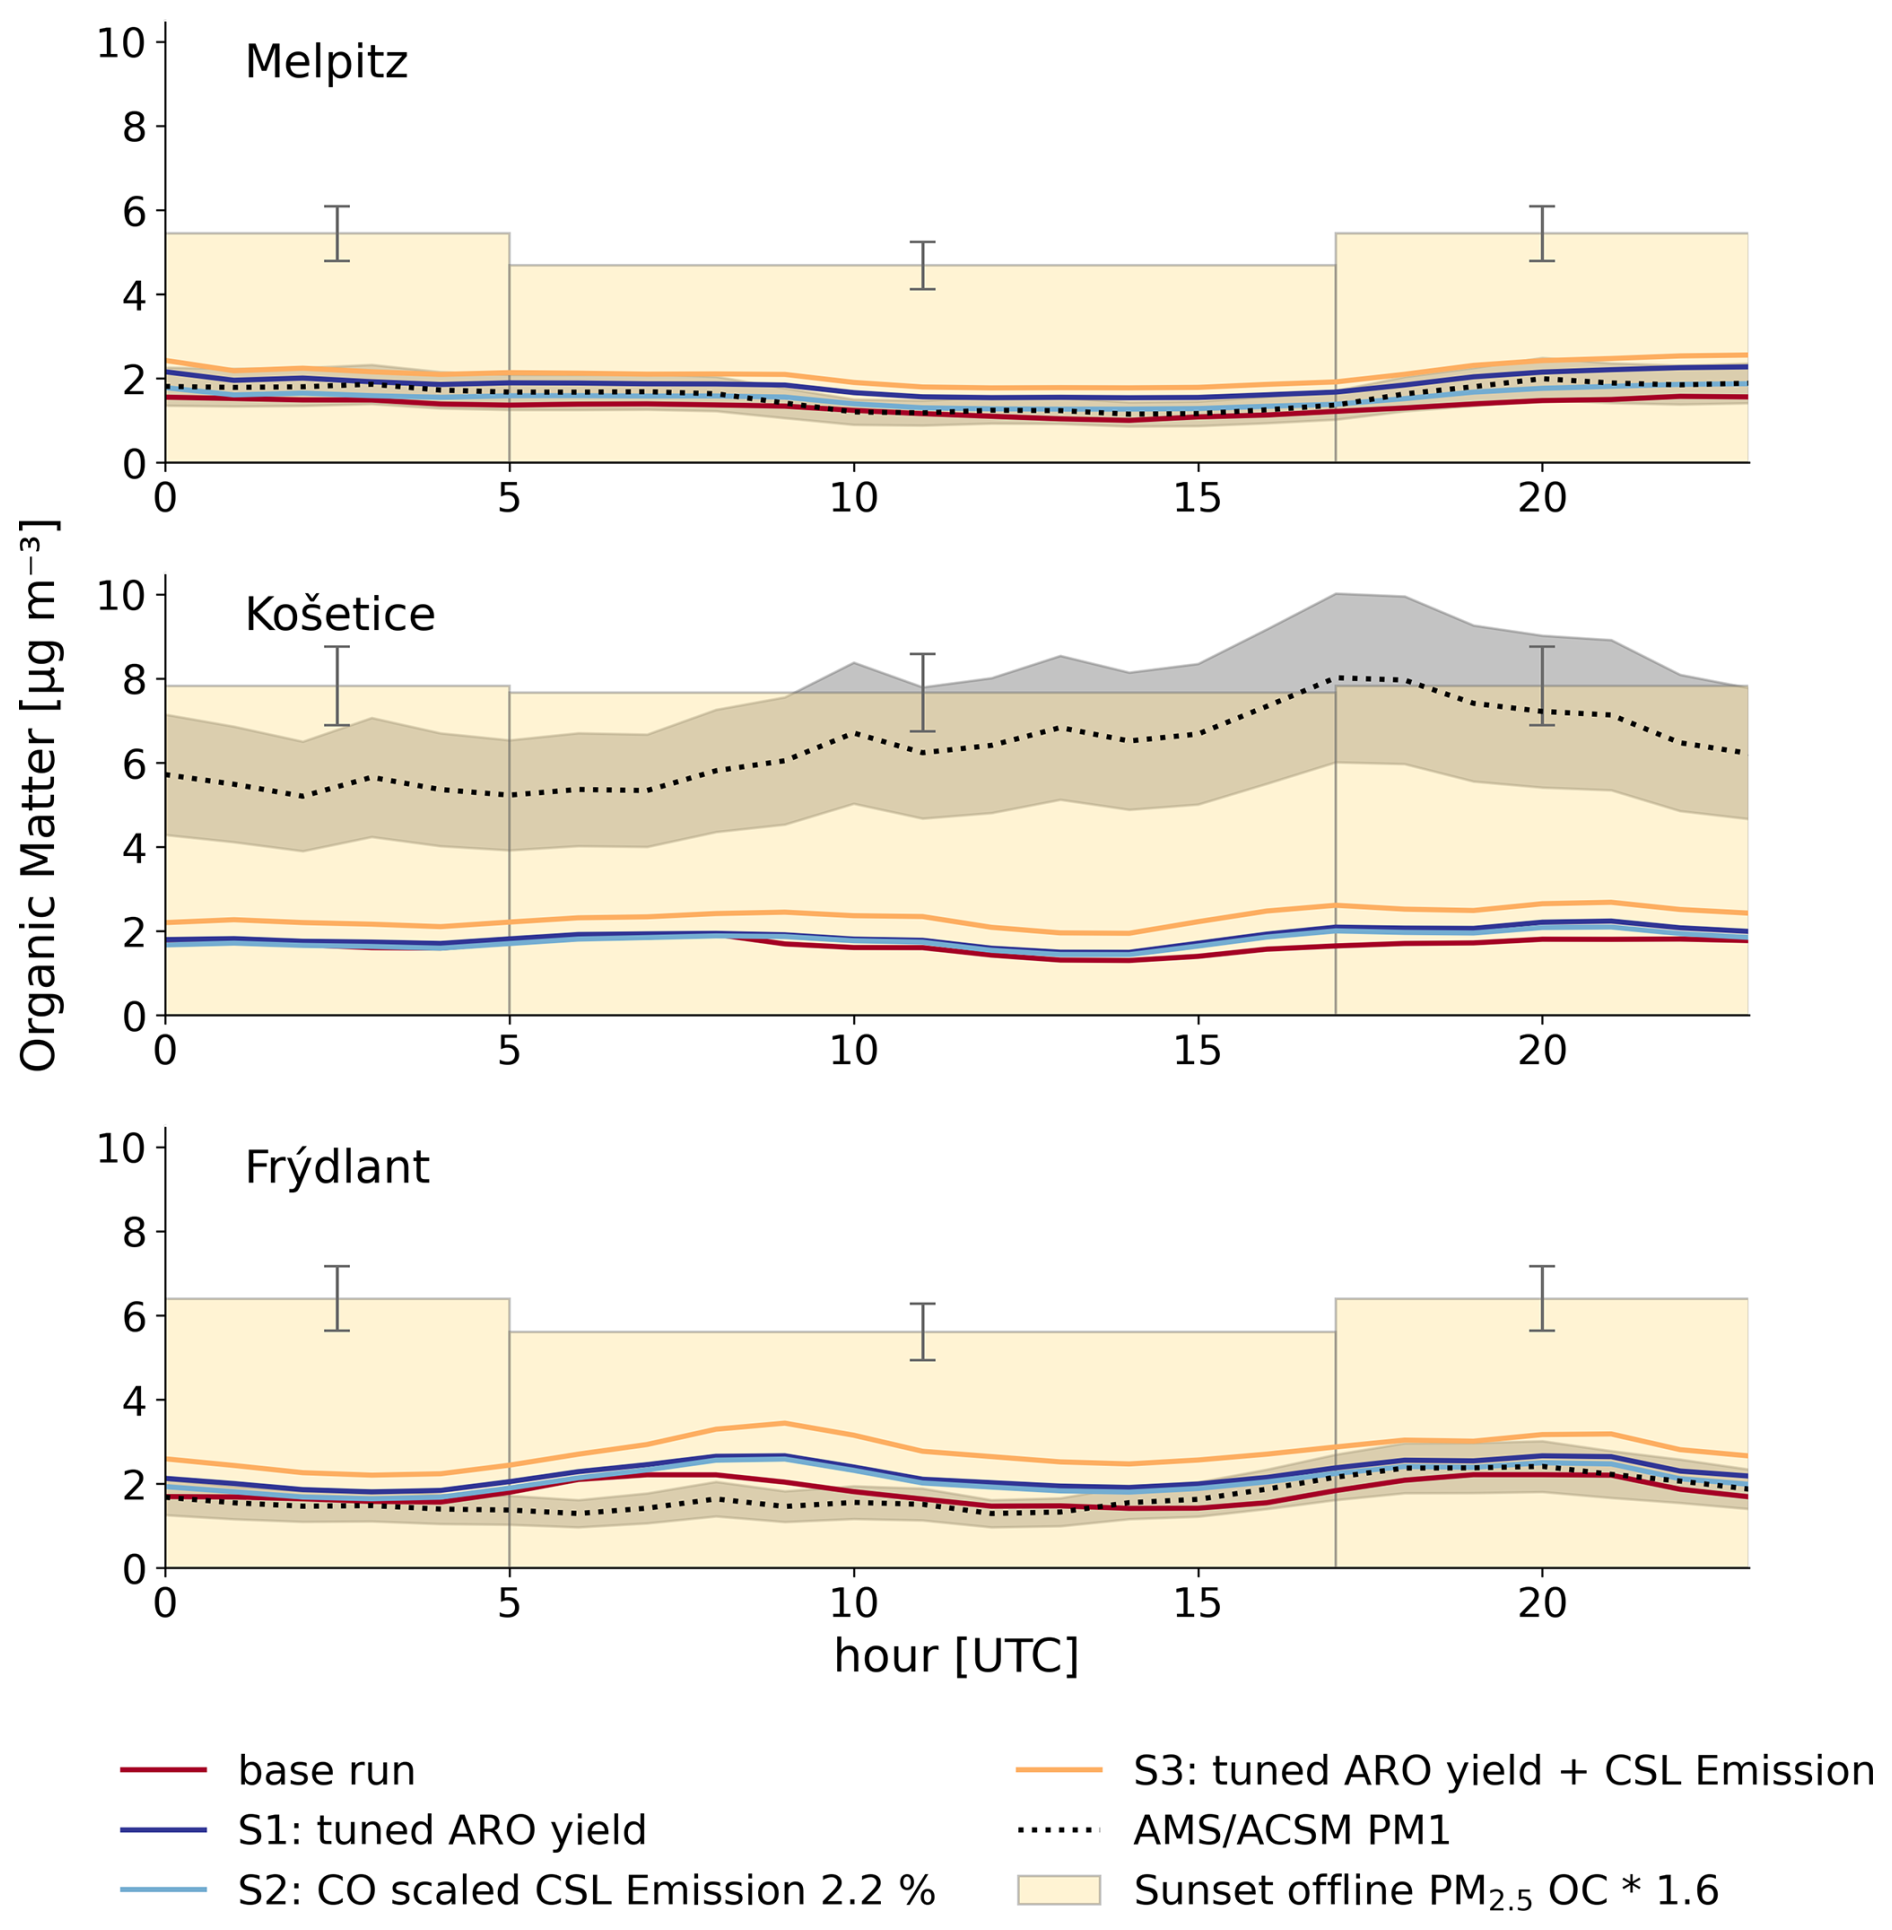
Figure 9Hourly diurnal cycle of organic matter in PM2.5 over the entire measurement period for all sensitivity runs compared to the base run. Bar graphs show averaged filter data based on 12 h sampling intervals, with whiskers representing a measurement uncertainty of ±12 % (Karanasiou et al., 2020). AMS/ACSM data are shown with a measurement uncertainty of ±25 % (Canagaratna et al., 2007).
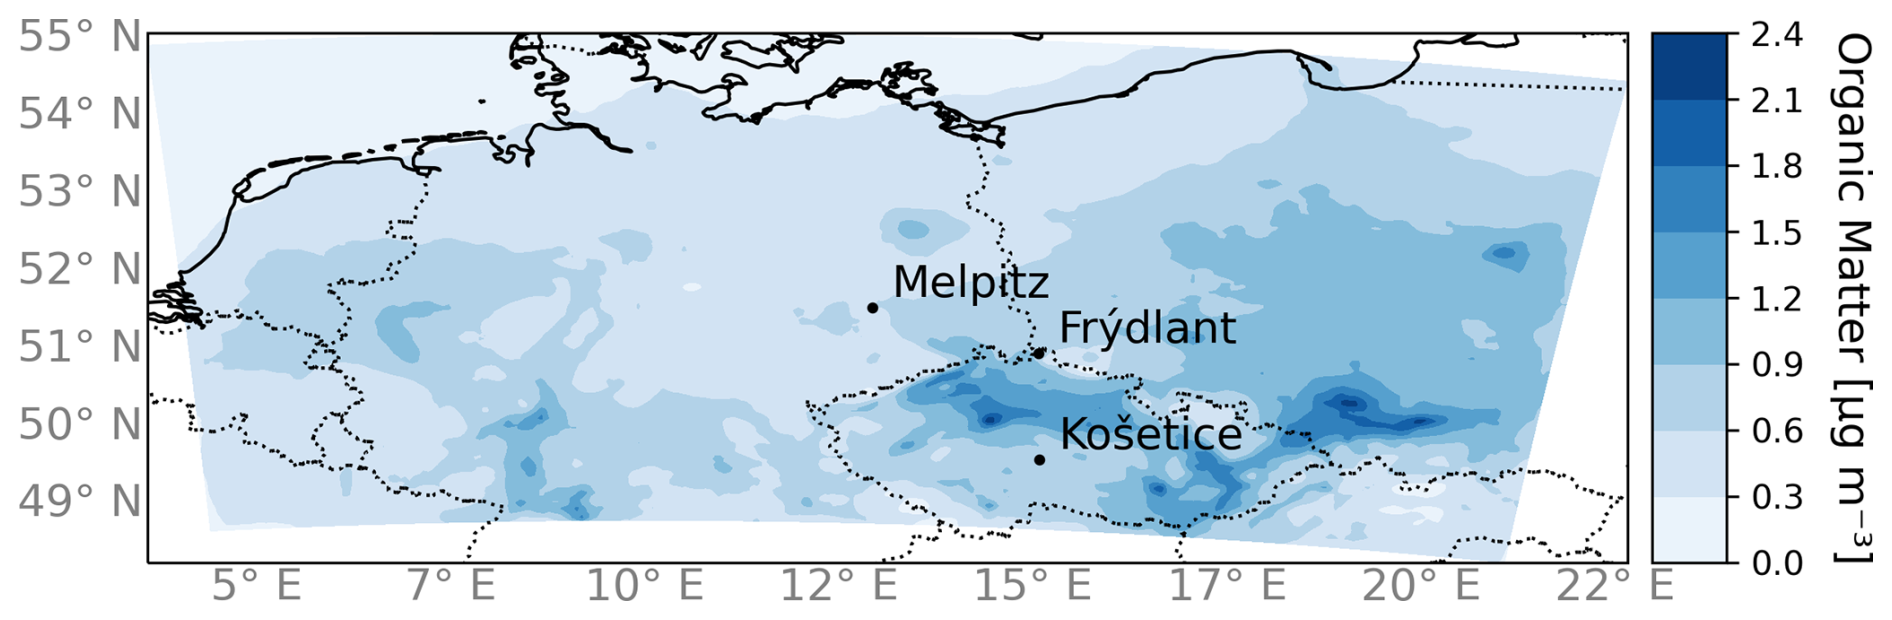
Figure 10Difference between the averaged modelled organic matter in PM2.5 in the S3 and base simulation.
The spatial pattern of the increase in OM concentrations in S3 compared to the base run is shown in Fig. 10. The strongest increases occur in the Czech Republic and southern Poland. In particular, the city of Prague and its outskirts show a high increase, which is consistent with the small residential houses in the suburbs and surrounding areas still using coal and wood combustion for heating (Schwarz et al., 2008; Makeš et al., 2021). Domestic heating emissions likely increased during the COVID-19 measures as more people stayed at home, contributing to higher PM2.5 and possibly SOA concentrations (Mbengue et al., 2023). Additionally, the campaign coincided with an unusually cold period in early February, which likely increased heating activity further. This effect was not fully captured by the model.
The simulation of the OM peak in early February, after the snow event, shows no noticeable improvement with the sensitivity runs, likely linked to the overall underestimation of emissions (see Fig. A8 in the Appendix). Measurements reveal a distinct OM concentration peak on 3 March, particularly in Košetice and Frýdlant. The S3 run captures the peak reasonably well in Frýdlant but still underestimates OM in Košetice. HYSPLIT backward trajectories for Frýdlant on this date indicate a significant influence from air masses passing over the Czech Republic and Košetice (see Fig. A7 in the Appendix). In Košetice, the wind direction shifts from east to west, as simulated by the model, while in Frýdlant, the wind direction remains steady, allowing precursor accumulation and increased SOA formation.
Overall, the sensitivity studies showed that scaling AVOC emissions from wood combustion to residential heating emissions improves the spatial distribution of SOA in the study area. Long-range transport of precursors and SOA is captured as well as the local influence on OM concentrations.
The study investigates the sources of primary and secondary anthropogenic organic aerosol in central Europe during winter. The chemical transport model COSMO–MUSCAT was used to analyse concentrations of particulate matter, in particular particles originating from combustion processes. The model results were compared with measurements made in Germany and the Czech Republic in terms of overall PM2.5 concentration and concentrations of individual species. The model underestimated the total PM2.5, especially during high concentration peaks. A pronounced underestimation occurred in early February, likely due to the prevailing meteorological conditions combined with changed heating behaviour. During this period, all tracers were underestimated, whereas after early February, the model accurately captured the behaviour of most tracers. However, the underestimation of PM2.5 during concentration peaks remained evident. The discrepancies in modelled PM2.5 concentrations do not appear to be due to deviations in EC, sulfate, or nitrate levels but rather the underestimation of OM. Although the present study reproduced diurnal OM profiles well at two monitoring sites, measurements in Košetice are underestimated, partly due to an inadequate representation of SOA formation from residential heating (wood combustion), a major source of anthropogenic VOCs. These AVOCs contribute considerably to the formation of SOA, and it is likely that their insufficient representation in our model contributes to the overall underestimation of OM during winter. The effect is most pronounced in the central Czech Republic, where the basin-like topography allows air masses to linger, promoting the accumulation of emissions and extended SOA formation. We found a higher contribution of domestic heating in the eastern part of our study region, which is accompanied by high concentrations of OM, especially at the station in Košetice. Sensitivity tests with adjustment for SOA yields and AVOC emissions showed an average increase in OM concentrations of over 40 % at the measurement sites. It is likely that the model underestimates SOA precursor emissions from domestic heating sources and additional sources that are missing or unaccounted for in the underlying emission inventory. A more detailed inventory, as used in Bartík et al. (2024) for the Czech Republic, reveals a redistribution of total primary PM2.5 residential combustion emissions from urban to rural areas compared to the inventory used in this study. In addition, the model may underestimate the contribution of SOA precursors other than phenol. Implementing more detailed and up-to-date emission inventories that provide information on the types of fuels used, their spatial distribution, and their temporal profiles offers strong potential to enhance the model's overall performance with respect to OM. Our findings highlight that regional domestic heating emissions contribute significantly to overall air pollution in the study area. Addressing these emissions is complex, as they are hard to quantify, and regulations for private households are more challenging to implement. Consequently, obtaining more detailed information on these sources is vital for developing targeted and feasible measures. Besides updated time profiles representing seasonal, weekly, and daily patterns of emissions, changing heating behaviour due to extreme meteorological conditions could be taken into account by implementing a temperature dependence of emissions. The heating degree day (HDD) approach, introduced by Guevara et al. (2021), considers the influence of outdoor temperature on heating activity and its associated emissions. A recent study by Guion et al. (2024) enhanced this method by incorporating country-specific and species-specific parameters, demonstrating improved temporal correlations and more accurate detection of PM emission threshold exceedances compared to simulations using fixed parameters or monthly temporal factors. Implementing this approach in COSMO–MUSCAT could enhance the accuracy of our model results during winter. In addition, heating emissions may not only be underestimated in quantity, but the contribution of different fuel types to the domestic heating sector may also vary with temperature, as additional coal burning in households may occur during colder periods.
Comparing the non-reactive tagging approach in COSMO–MUSCAT to measurement-based, receptor-oriented source apportionments can further help evaluate its capability and identify areas for improvement. This comparison can provide valuable insights into the performance of the model and guide future refinements. By addressing these gaps and incorporating the necessary updates, such as updated emission inventories, improved SOA yields, and model evaluation through comparison with measurement data, the model could provide a more comprehensive and accurate representation of SOA formation processes, enabling a better understanding for air quality management.
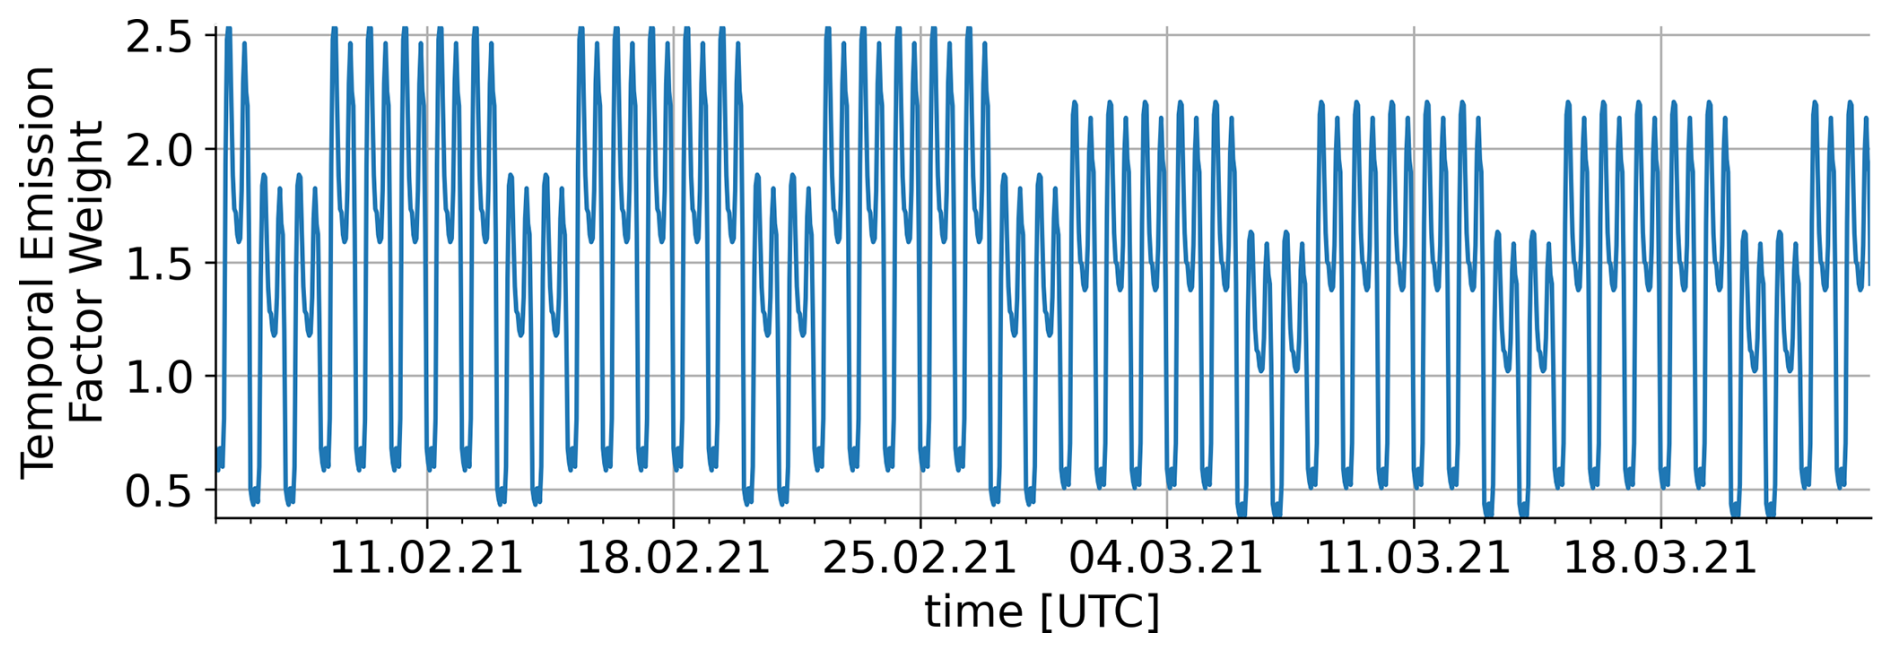
Table A1Splitting factors applied in this study to disaggregate CAMS PM2.5 and PM10 bulk emissions into individual subgroups within the GNFR C emission sector (Kuenen et al., 2022).
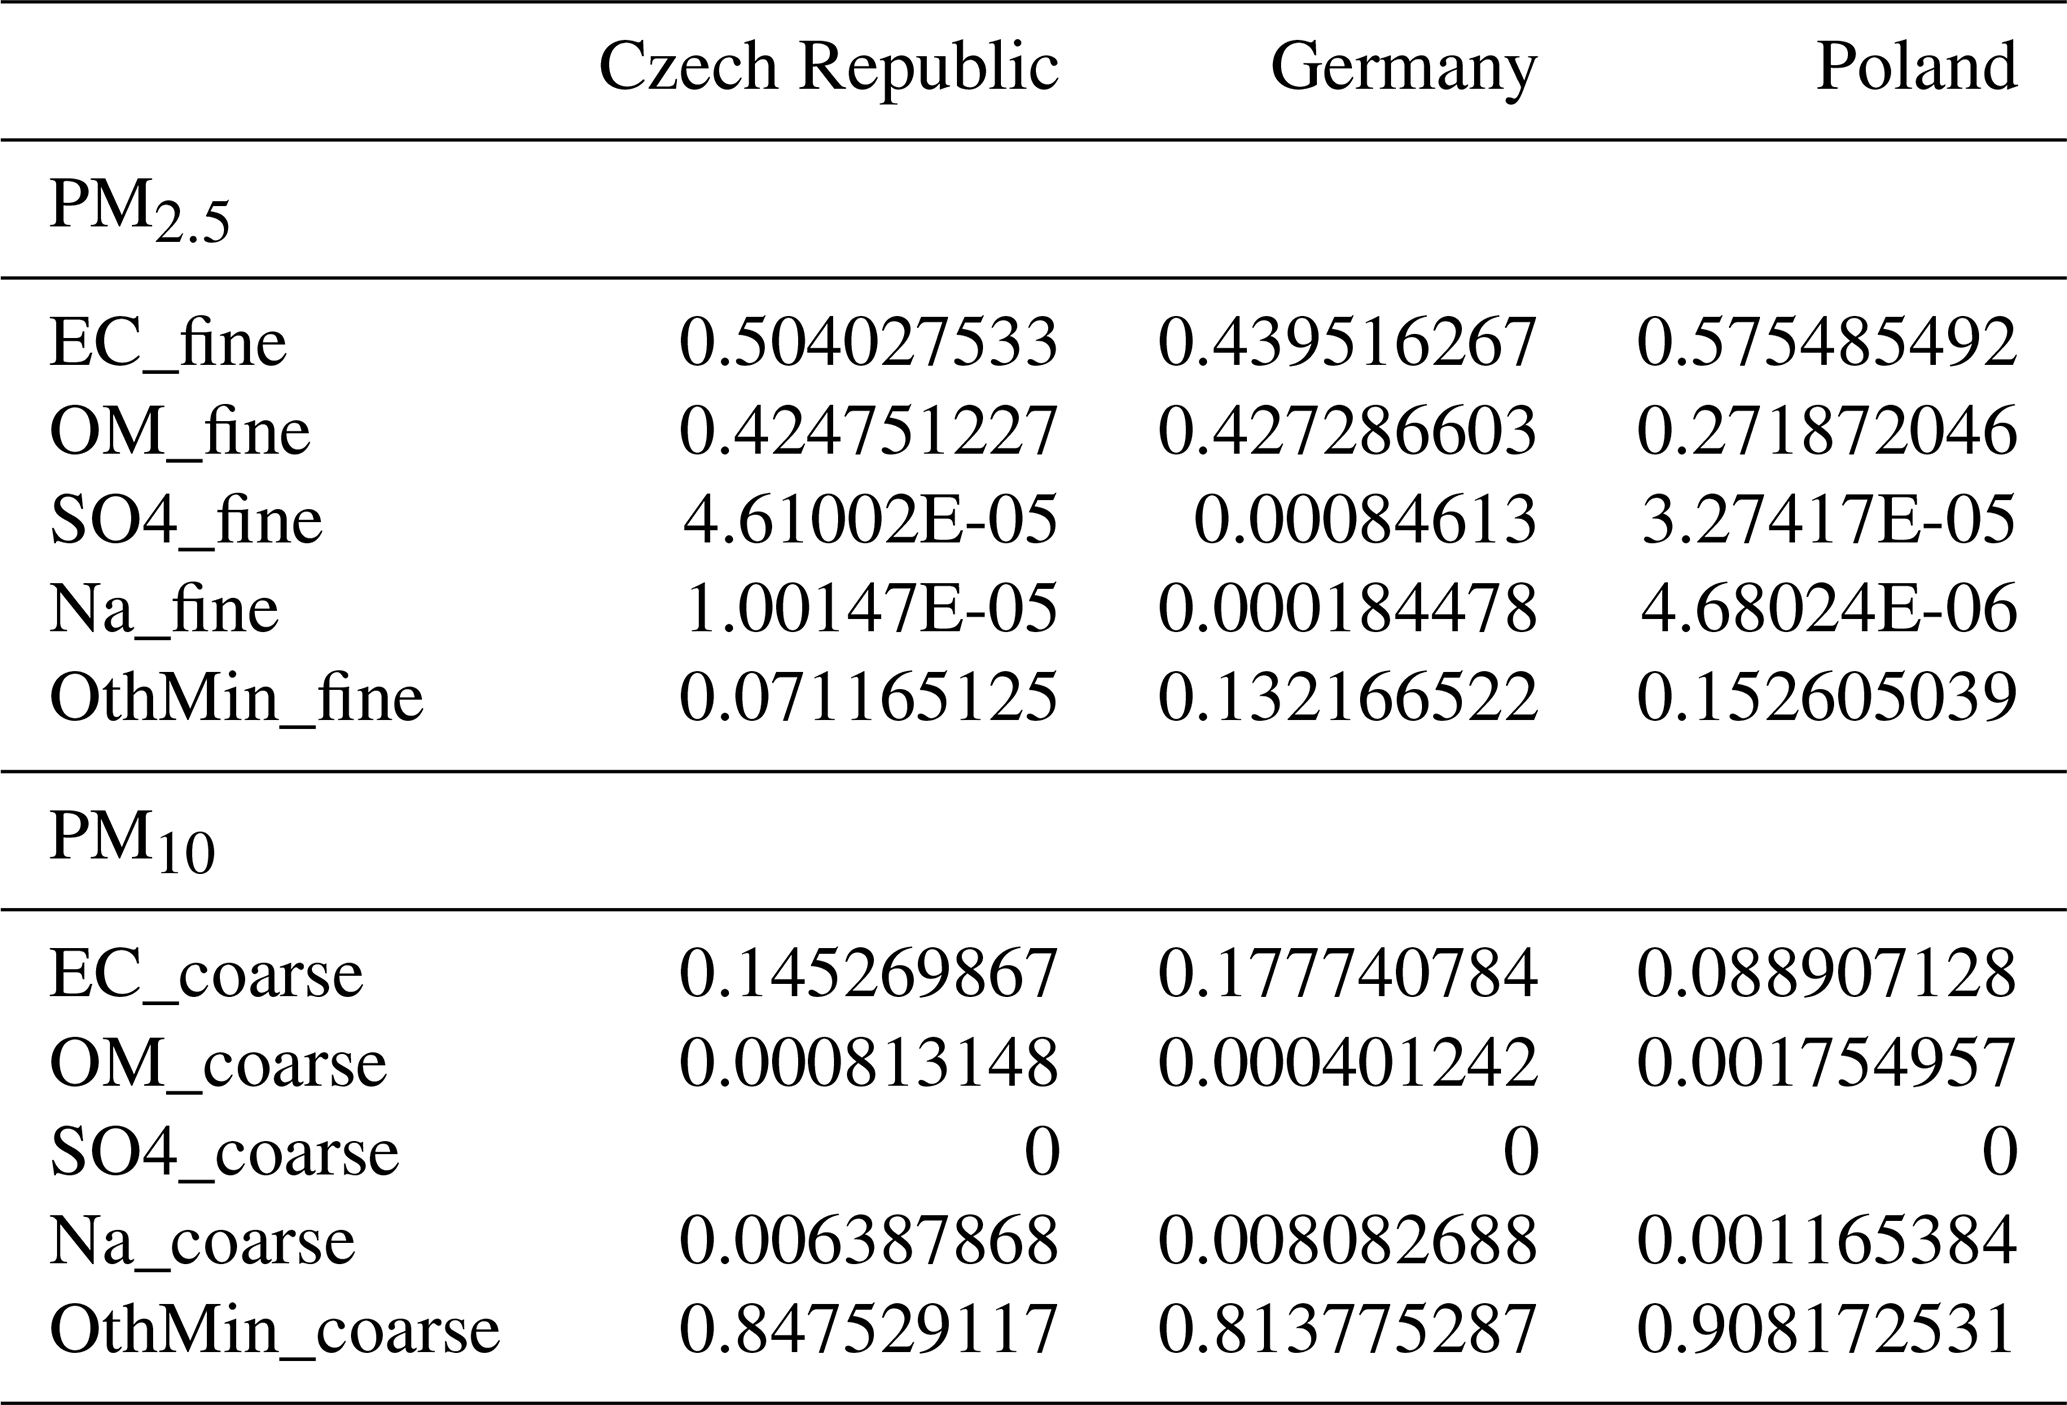
Table A2Splitting factors applied in this study to disaggregate CAMS NMVOC bulk emissions into individual subgroups within the GNFR C emission sector (Kuenen et al., 2022).
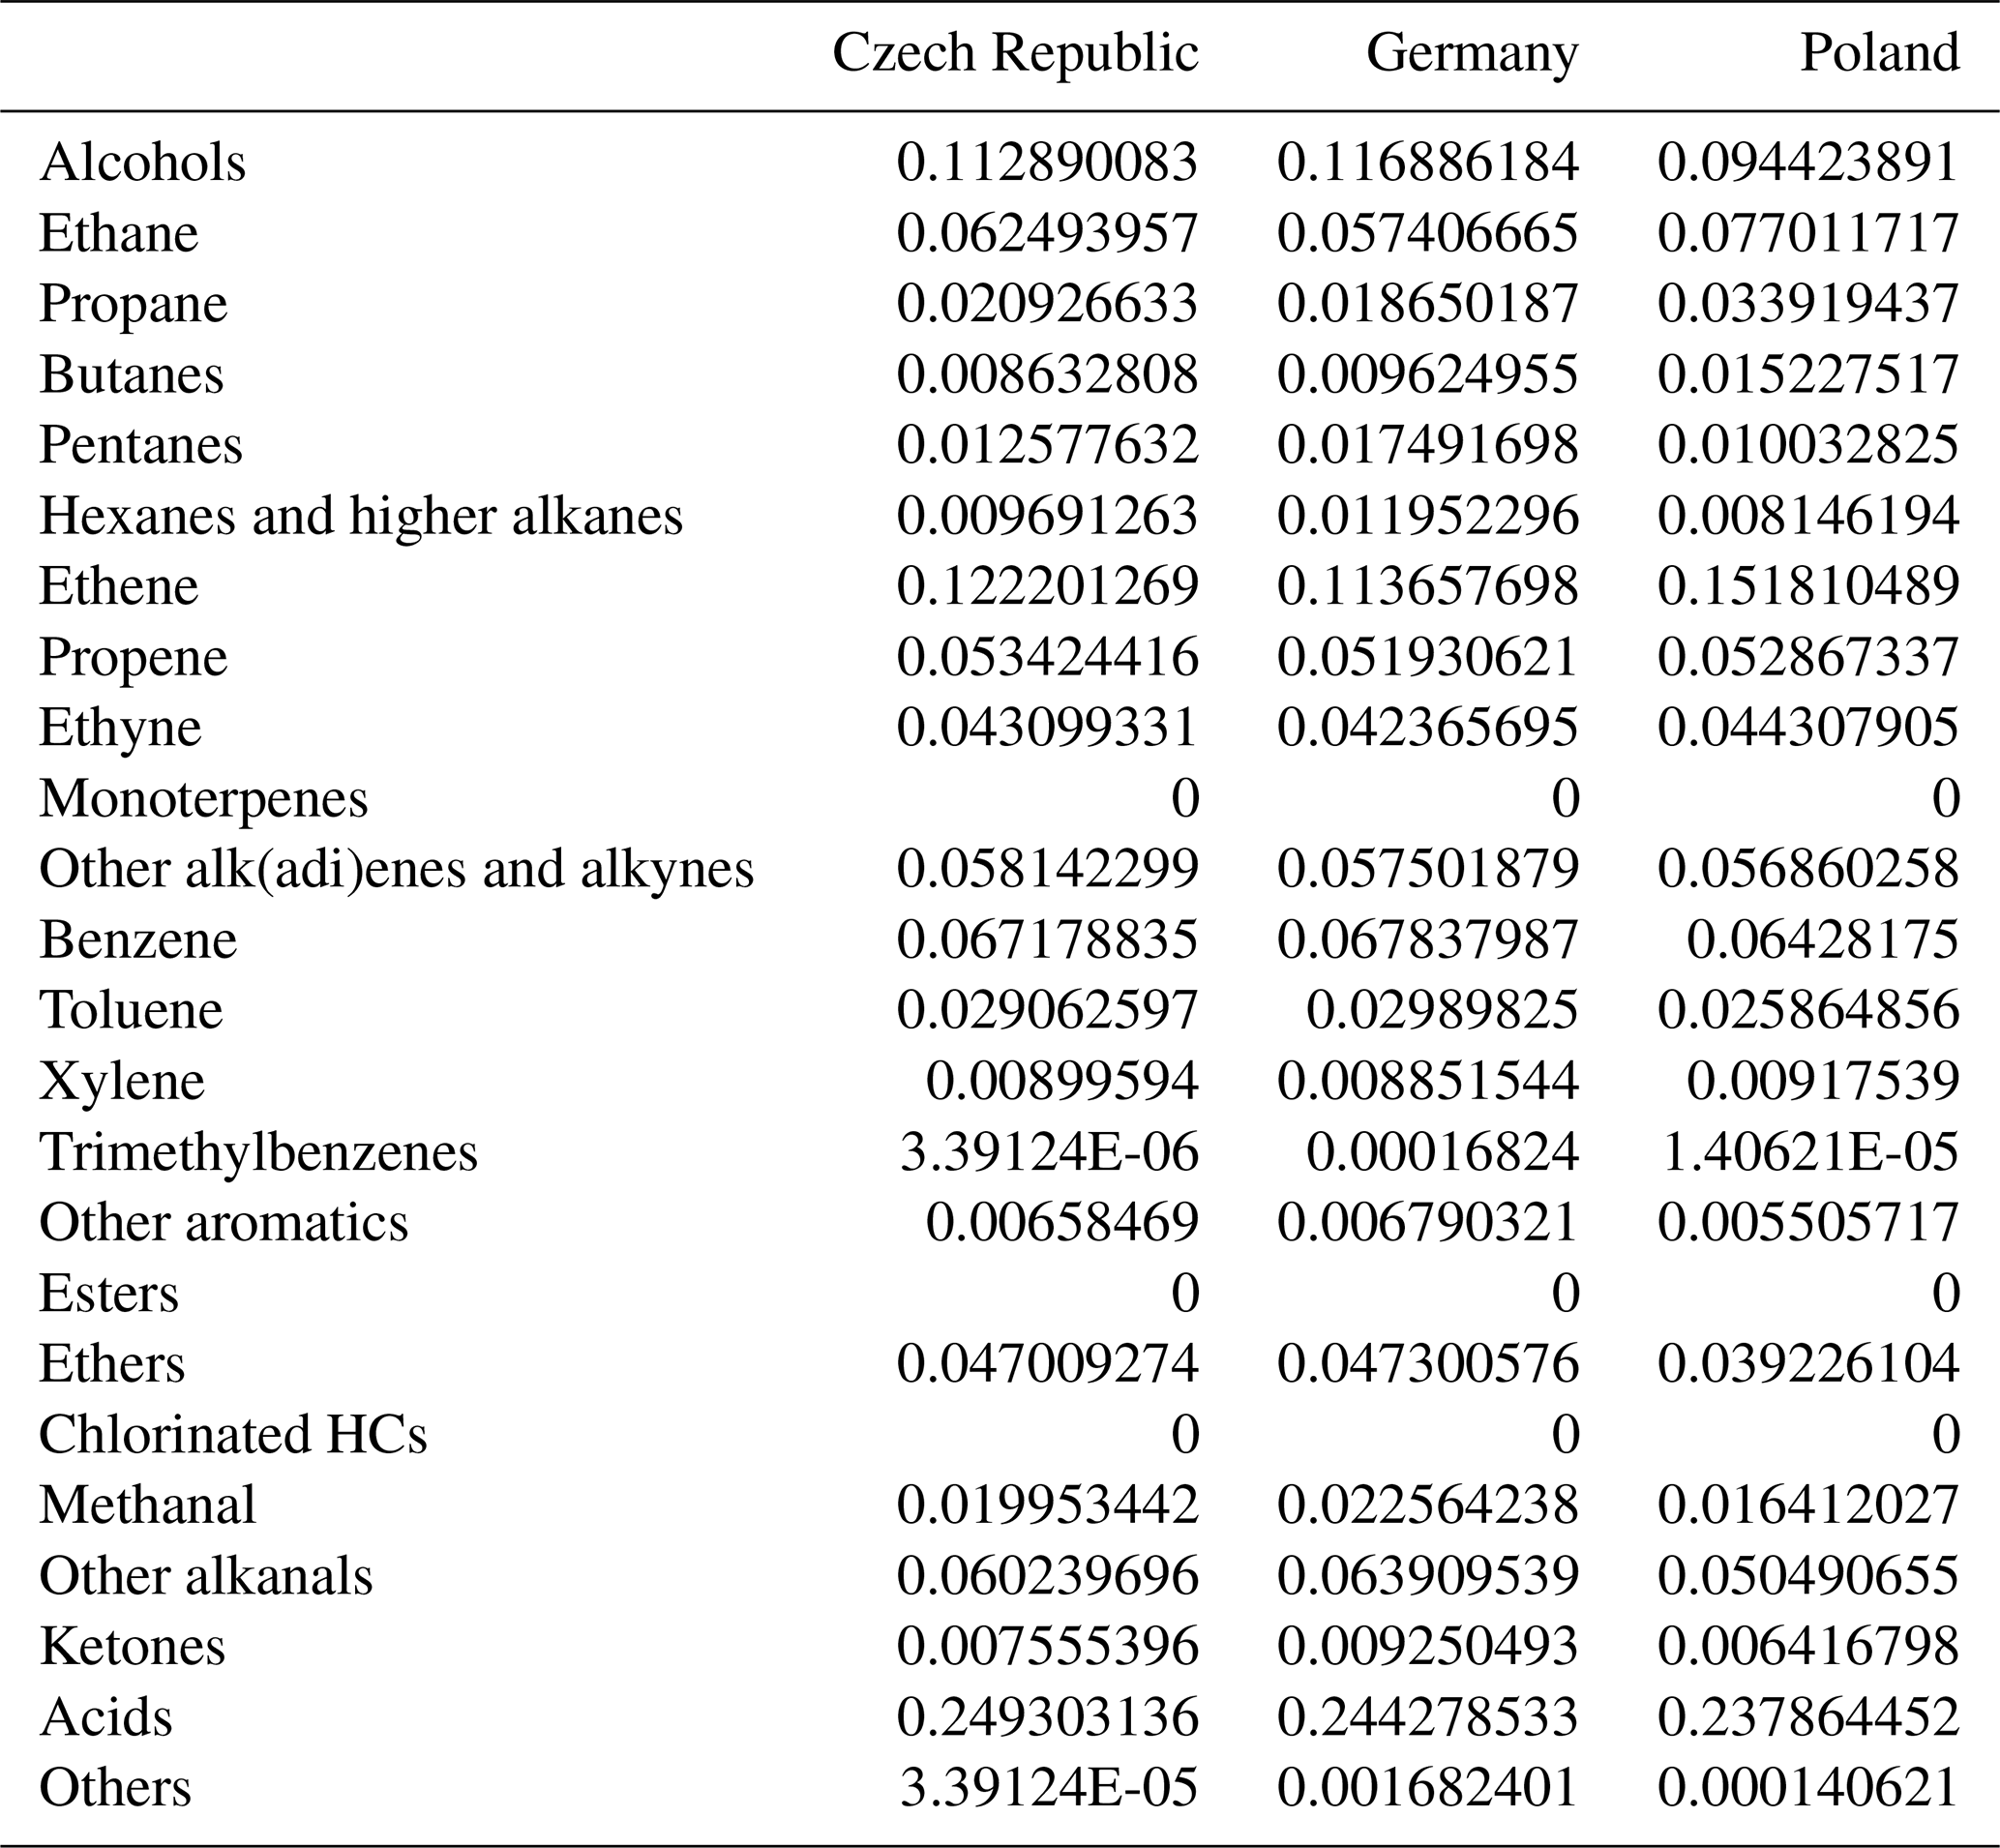
Table A3Overview of all the tagged combinations of variables, source regions, and source sectors.
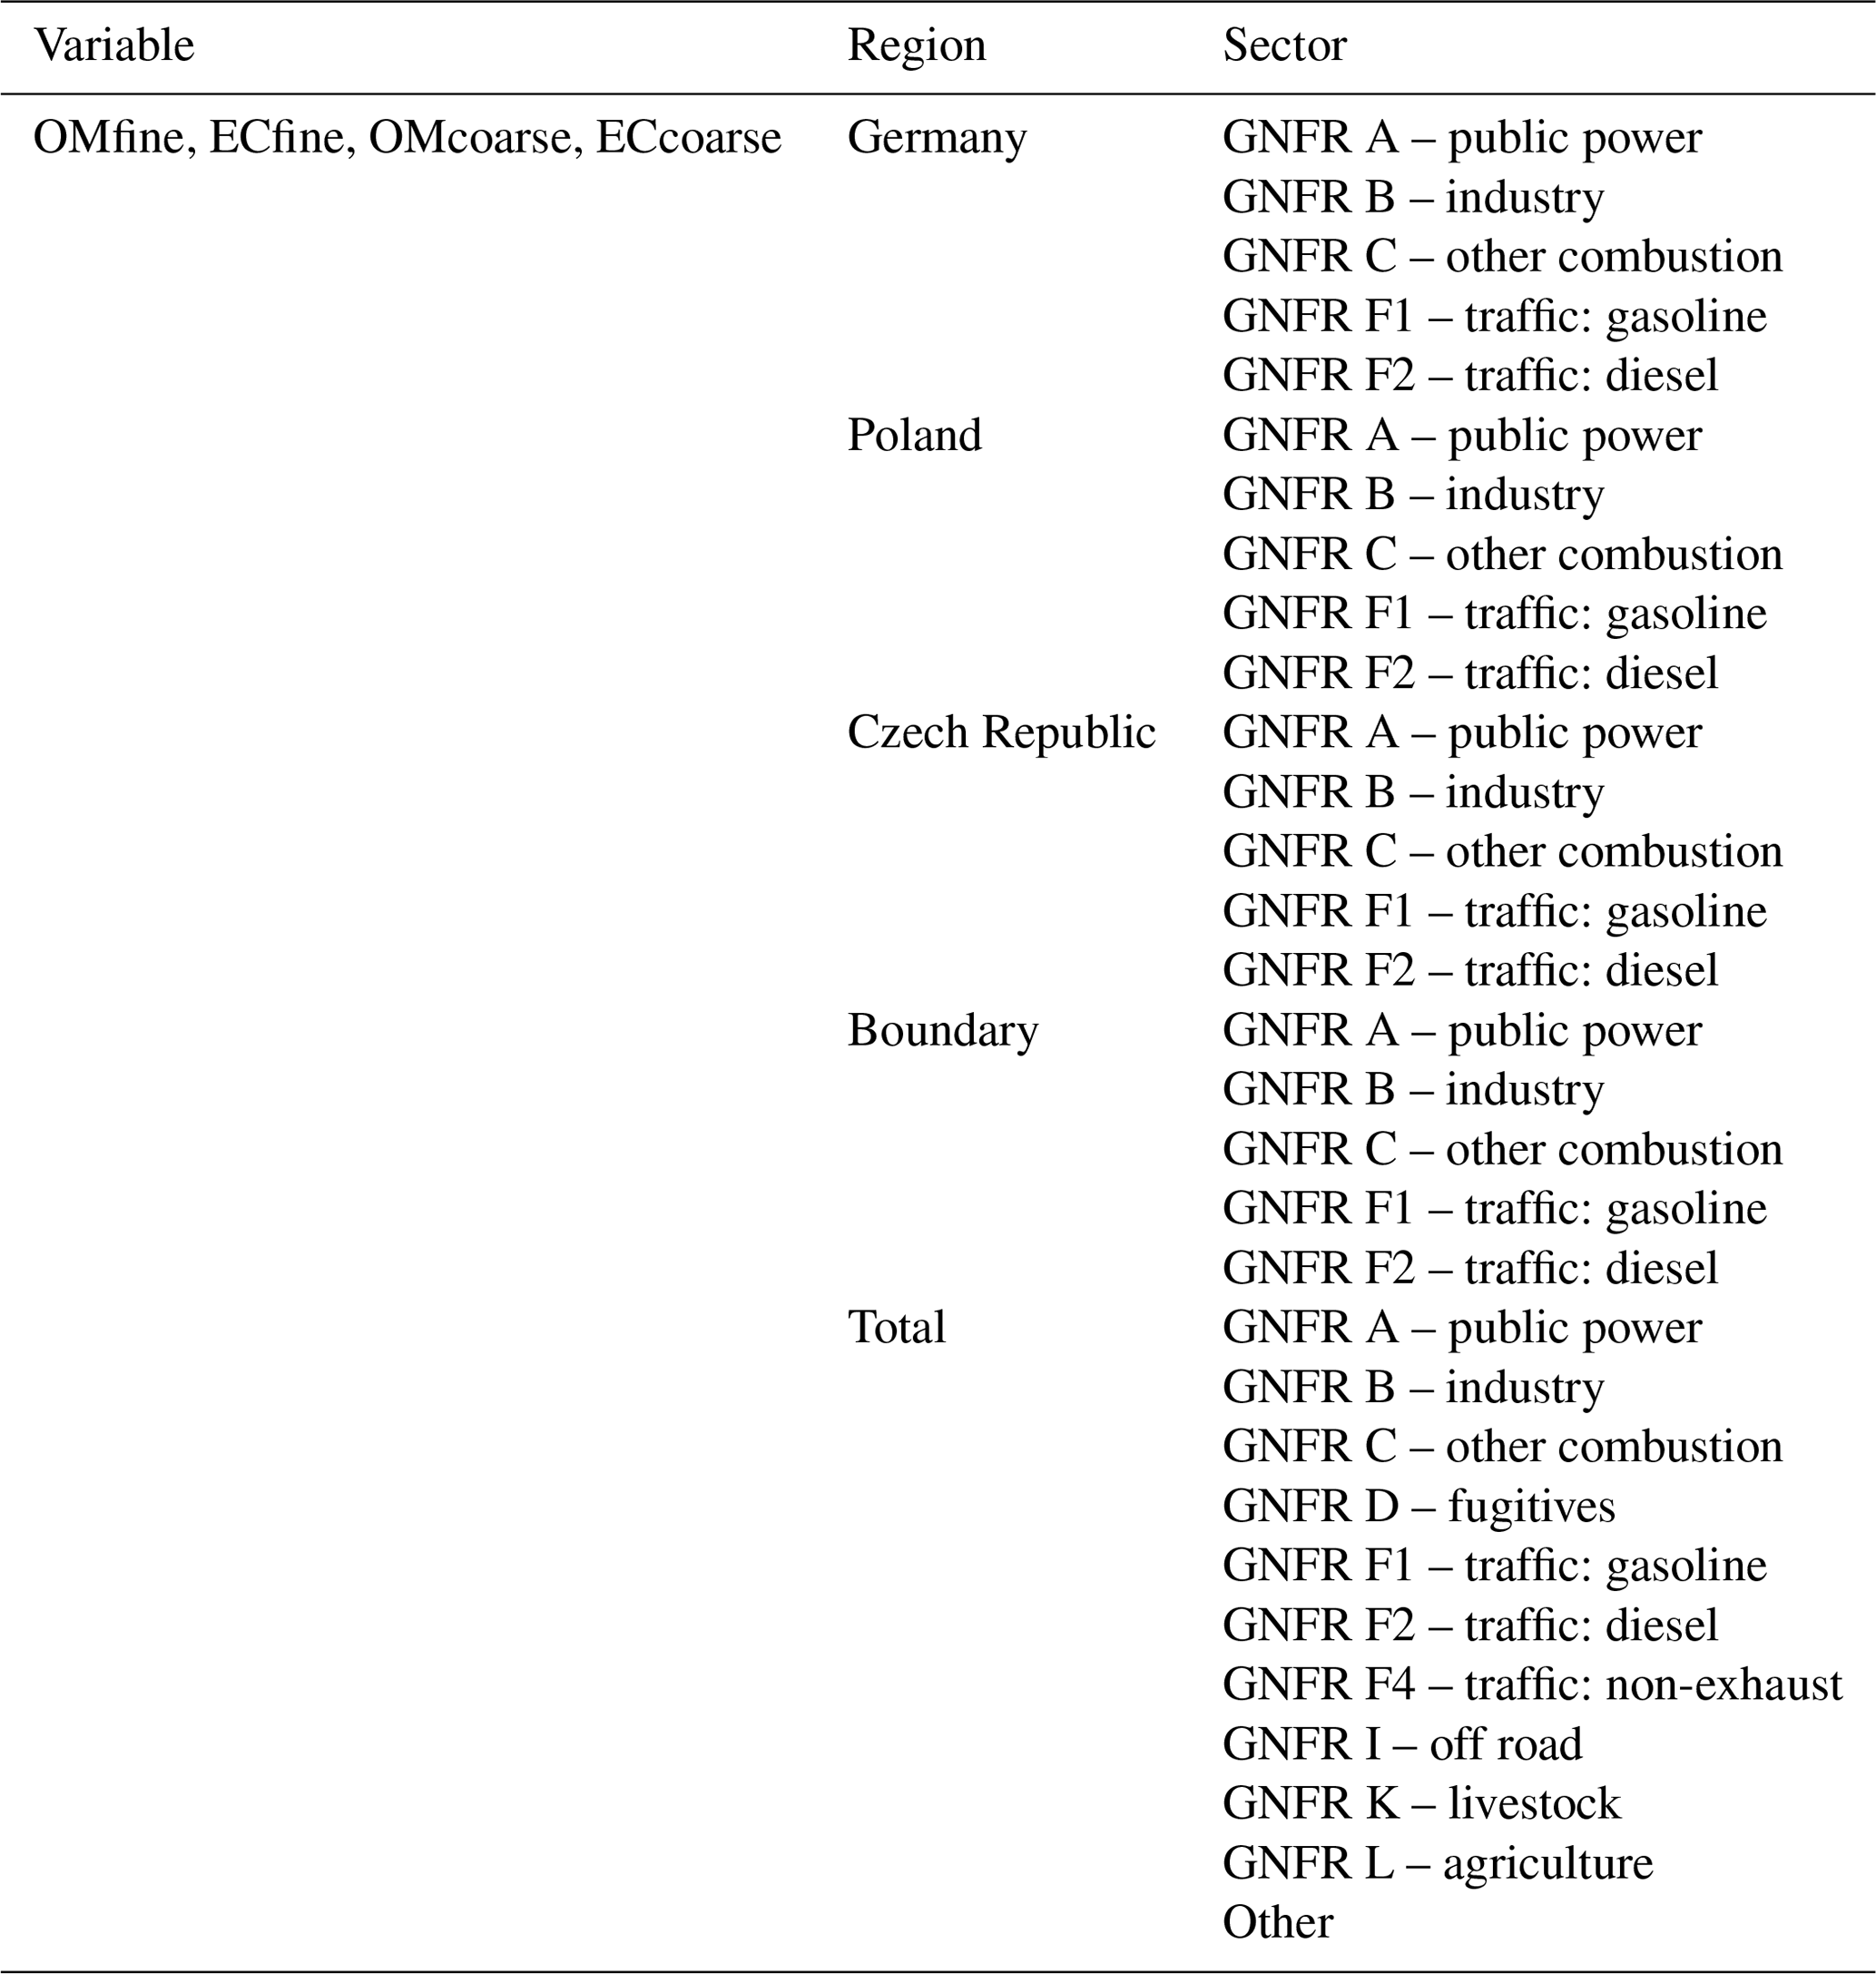
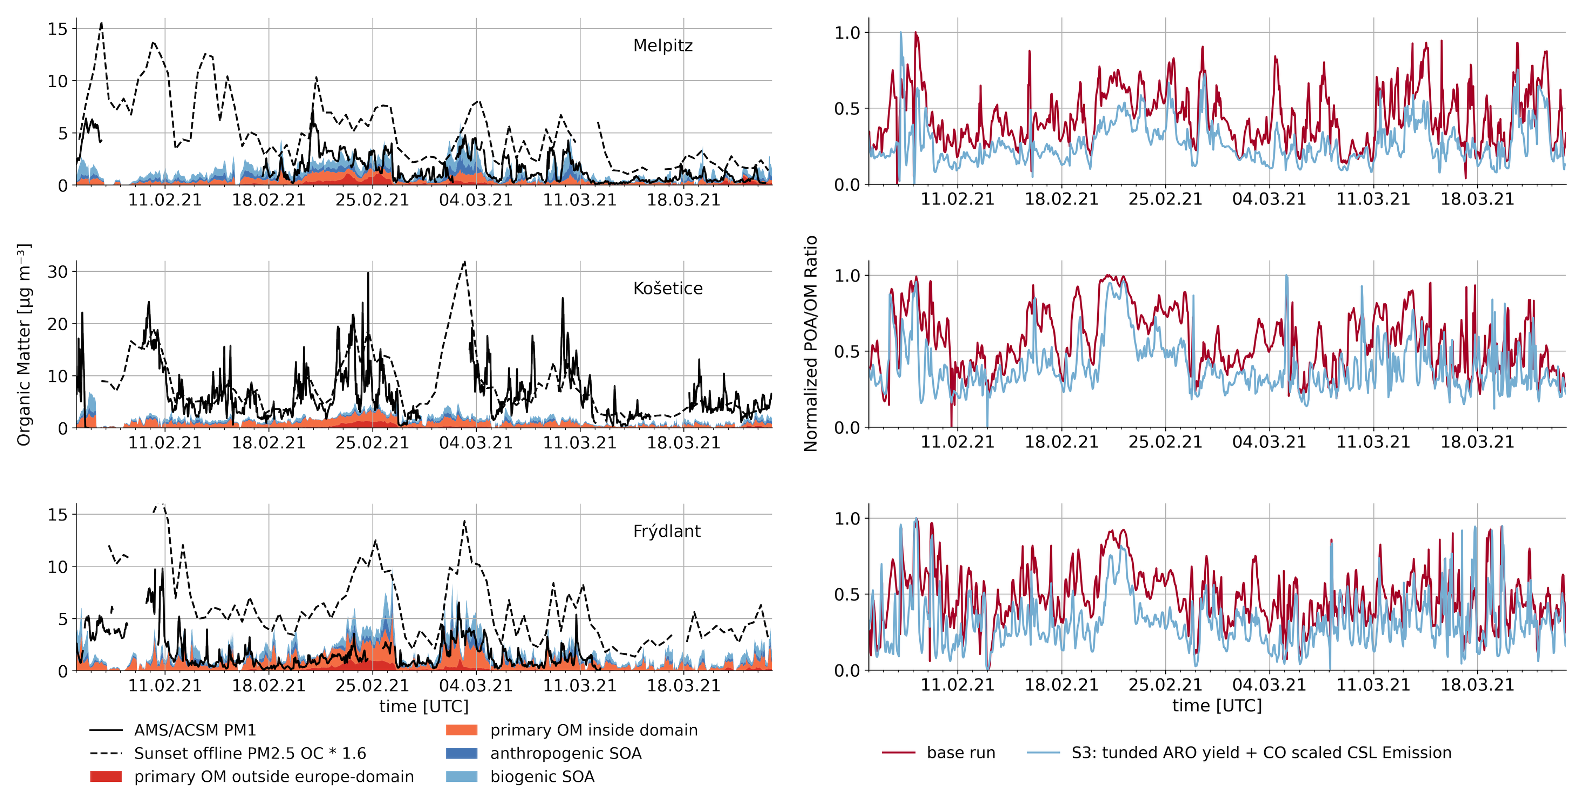
Figure A2Left: time series for organic matter mass concentration for the three sites. Comparison of measured AMS/ACSM data with the modelled primary OM concentration, split into the share with origin outside the N0 domain, origin inside the study domains, and secondary organic aerosol. Right: normalised POA to total OM ratio.
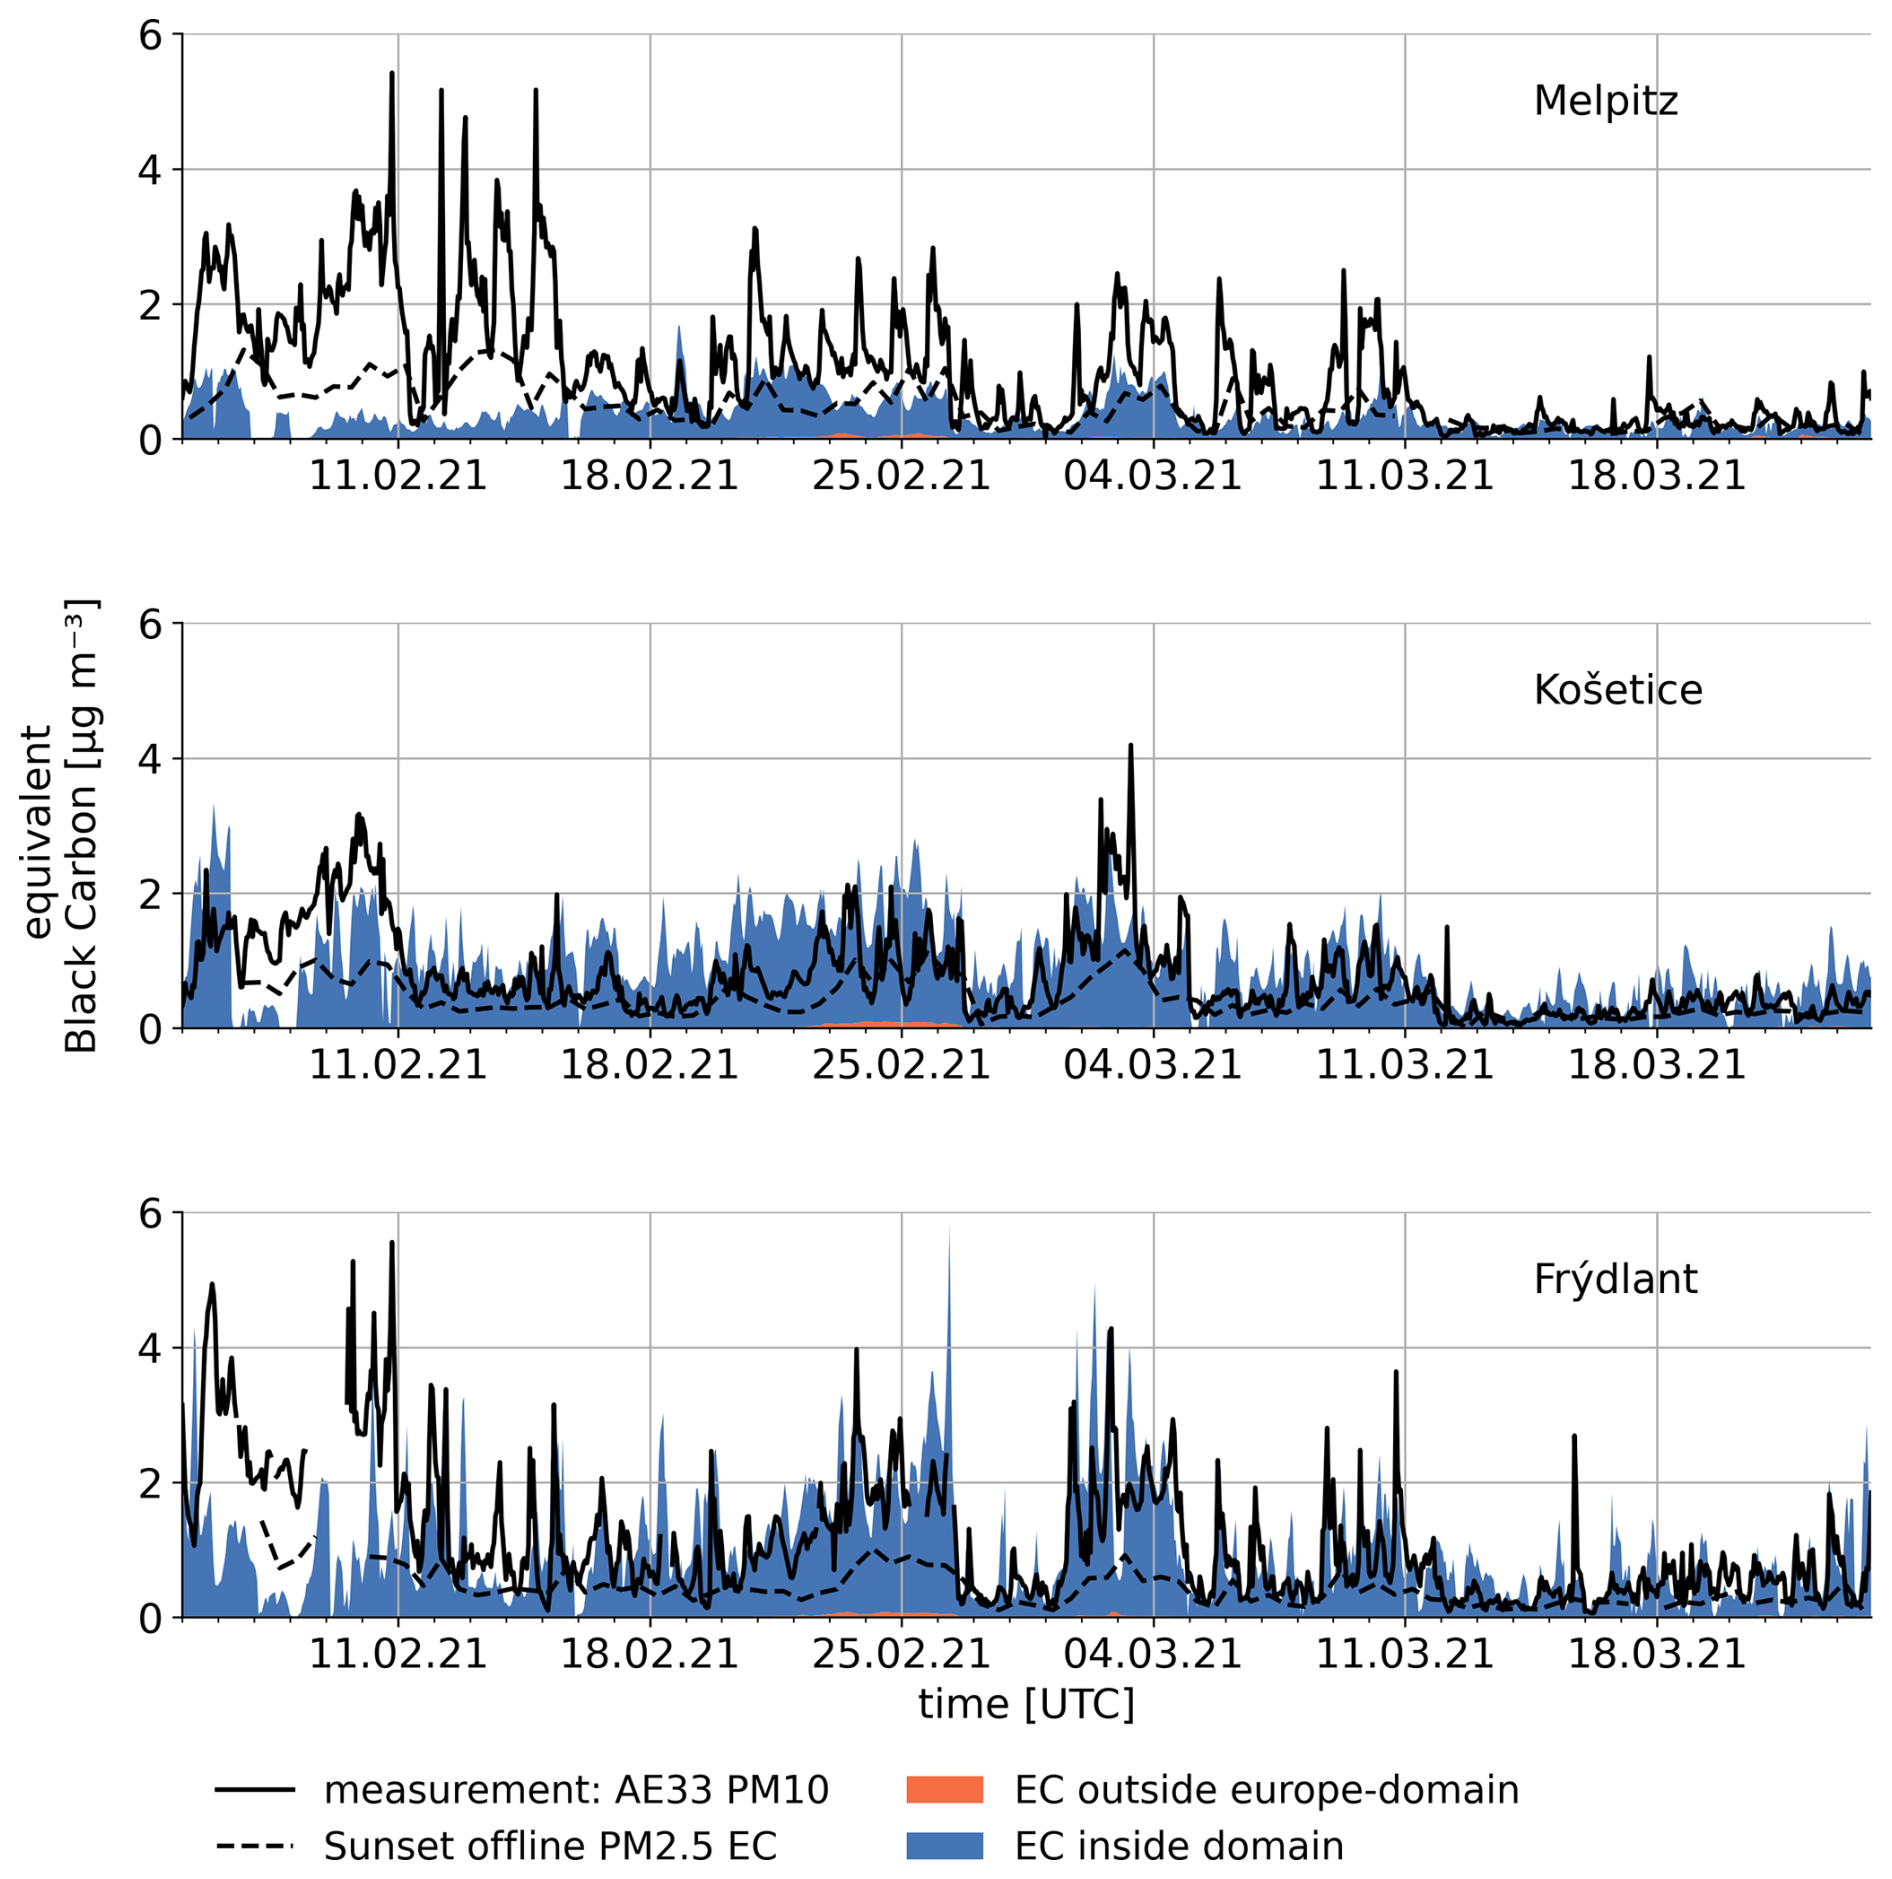
Figure A3Time series for elemental carbon concentration for the three sites. Comparison of Aethalometer and Sunset Laboratory filter data and modelled data.
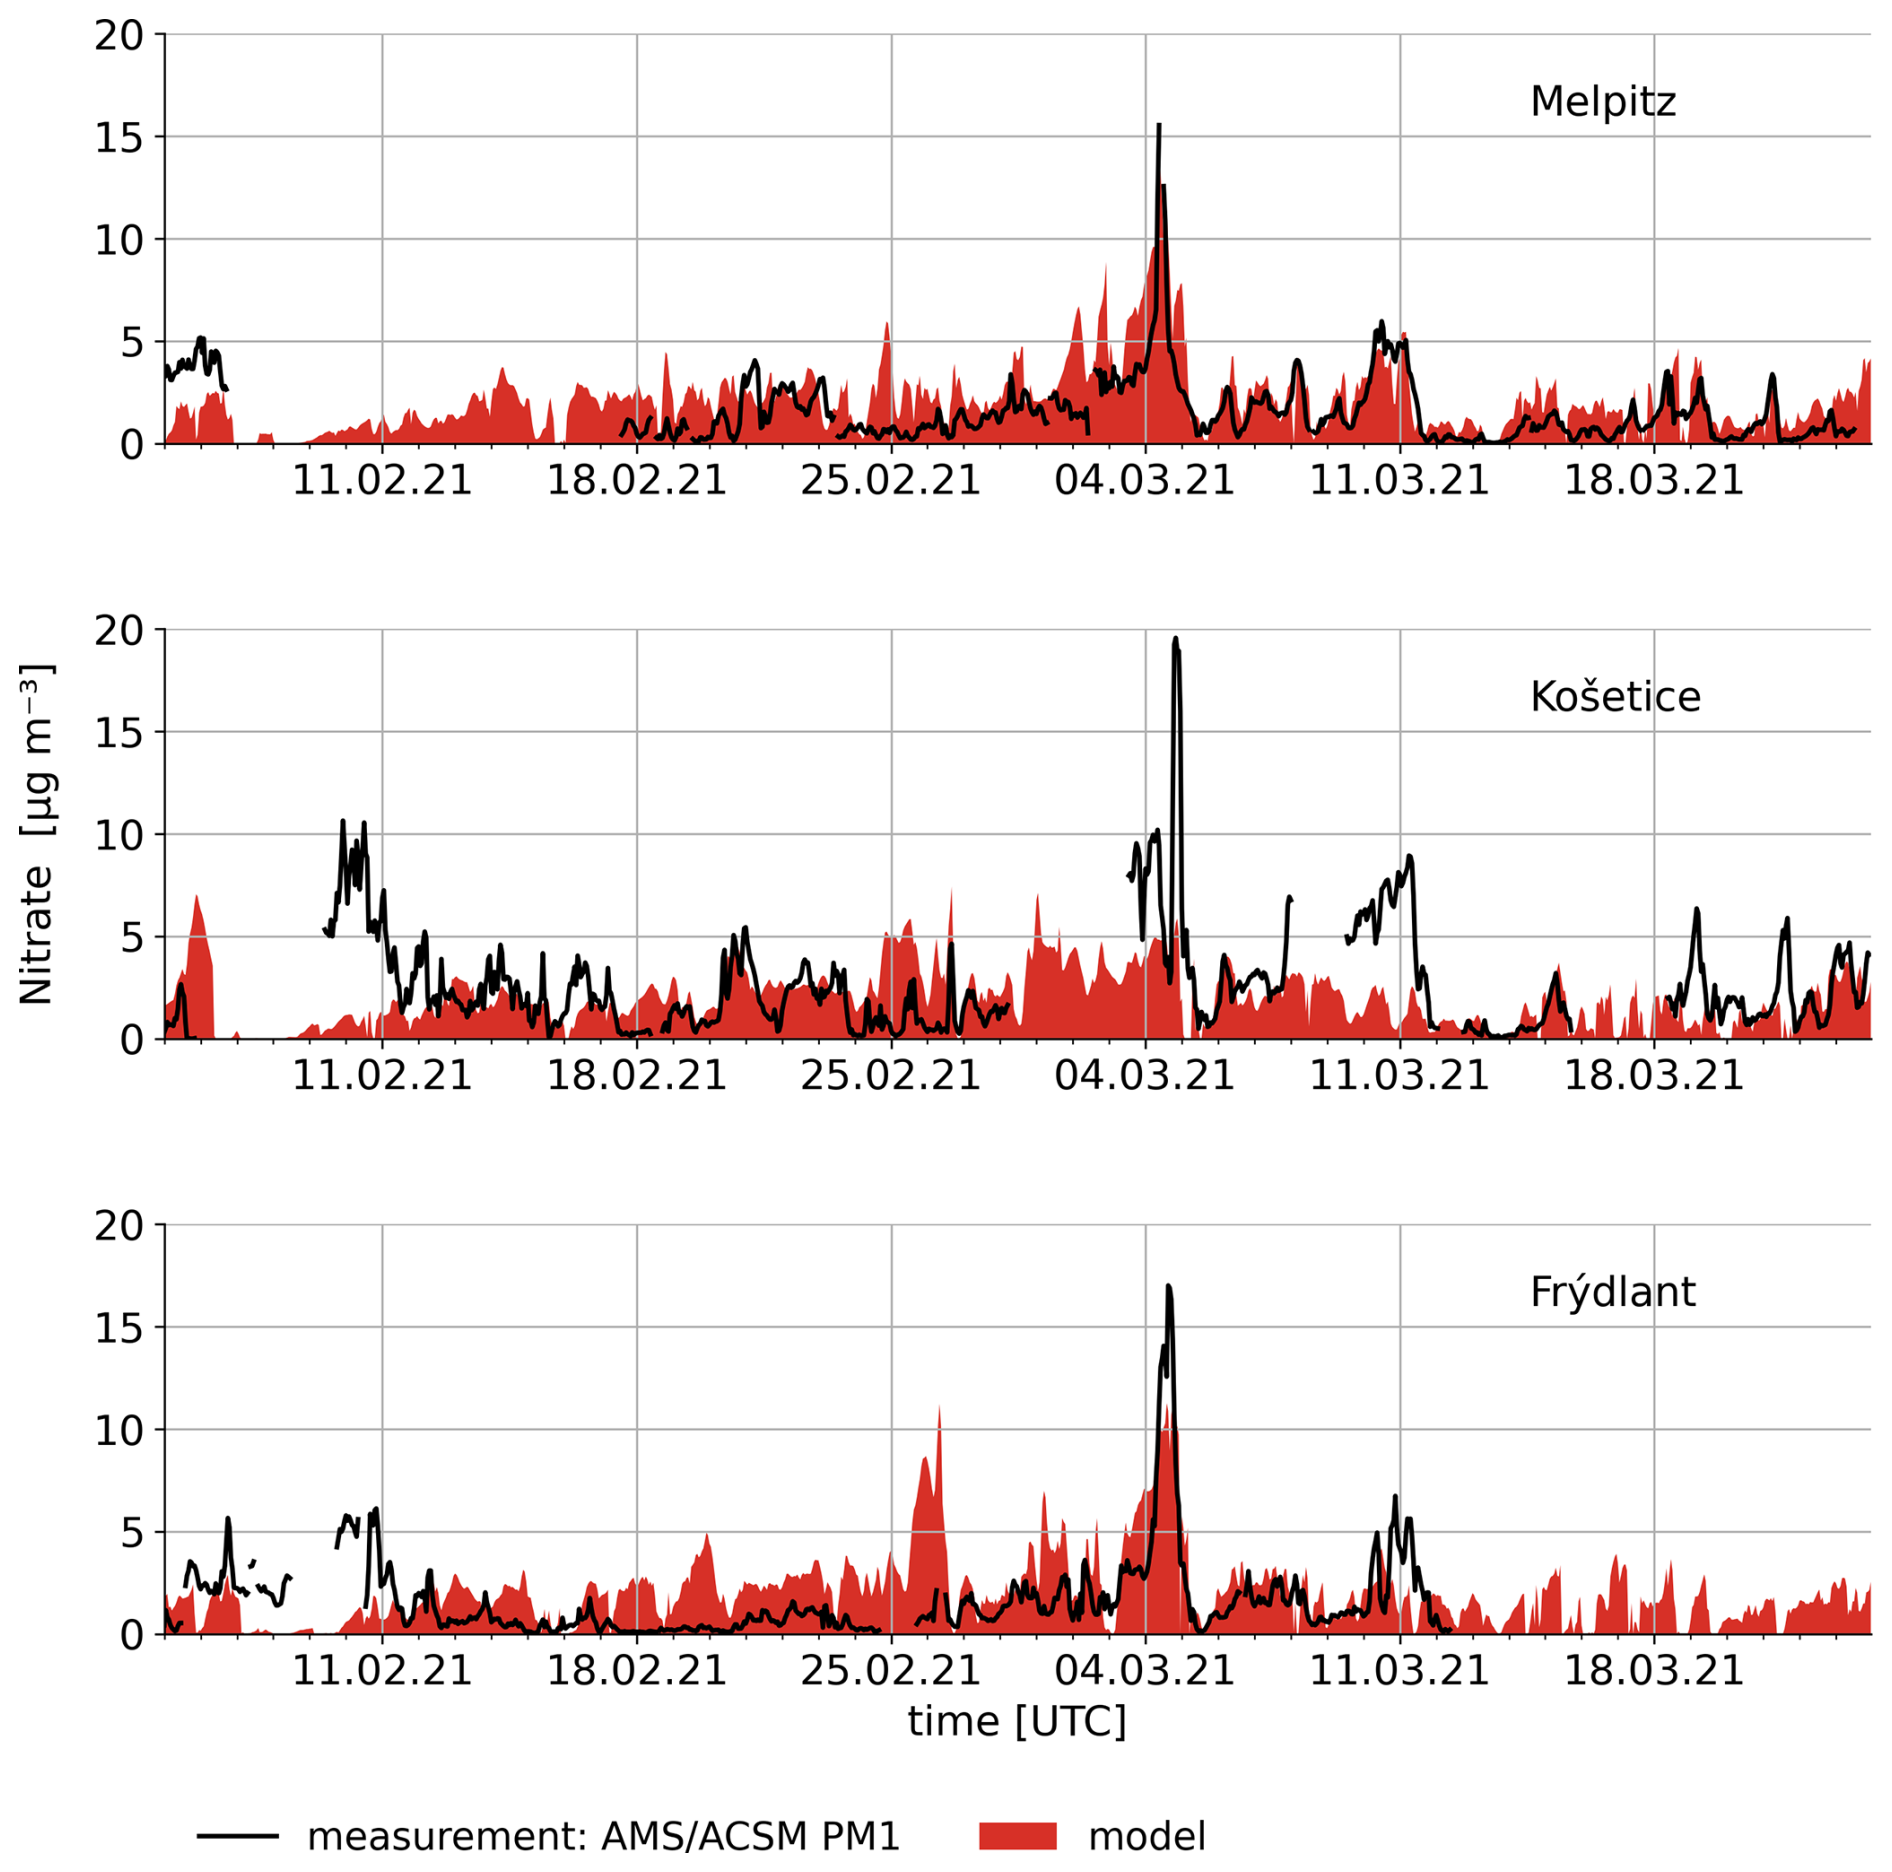
Figure A4Time series for nitrate mass concentration for the three sites. Comparison of measured and modelled data.
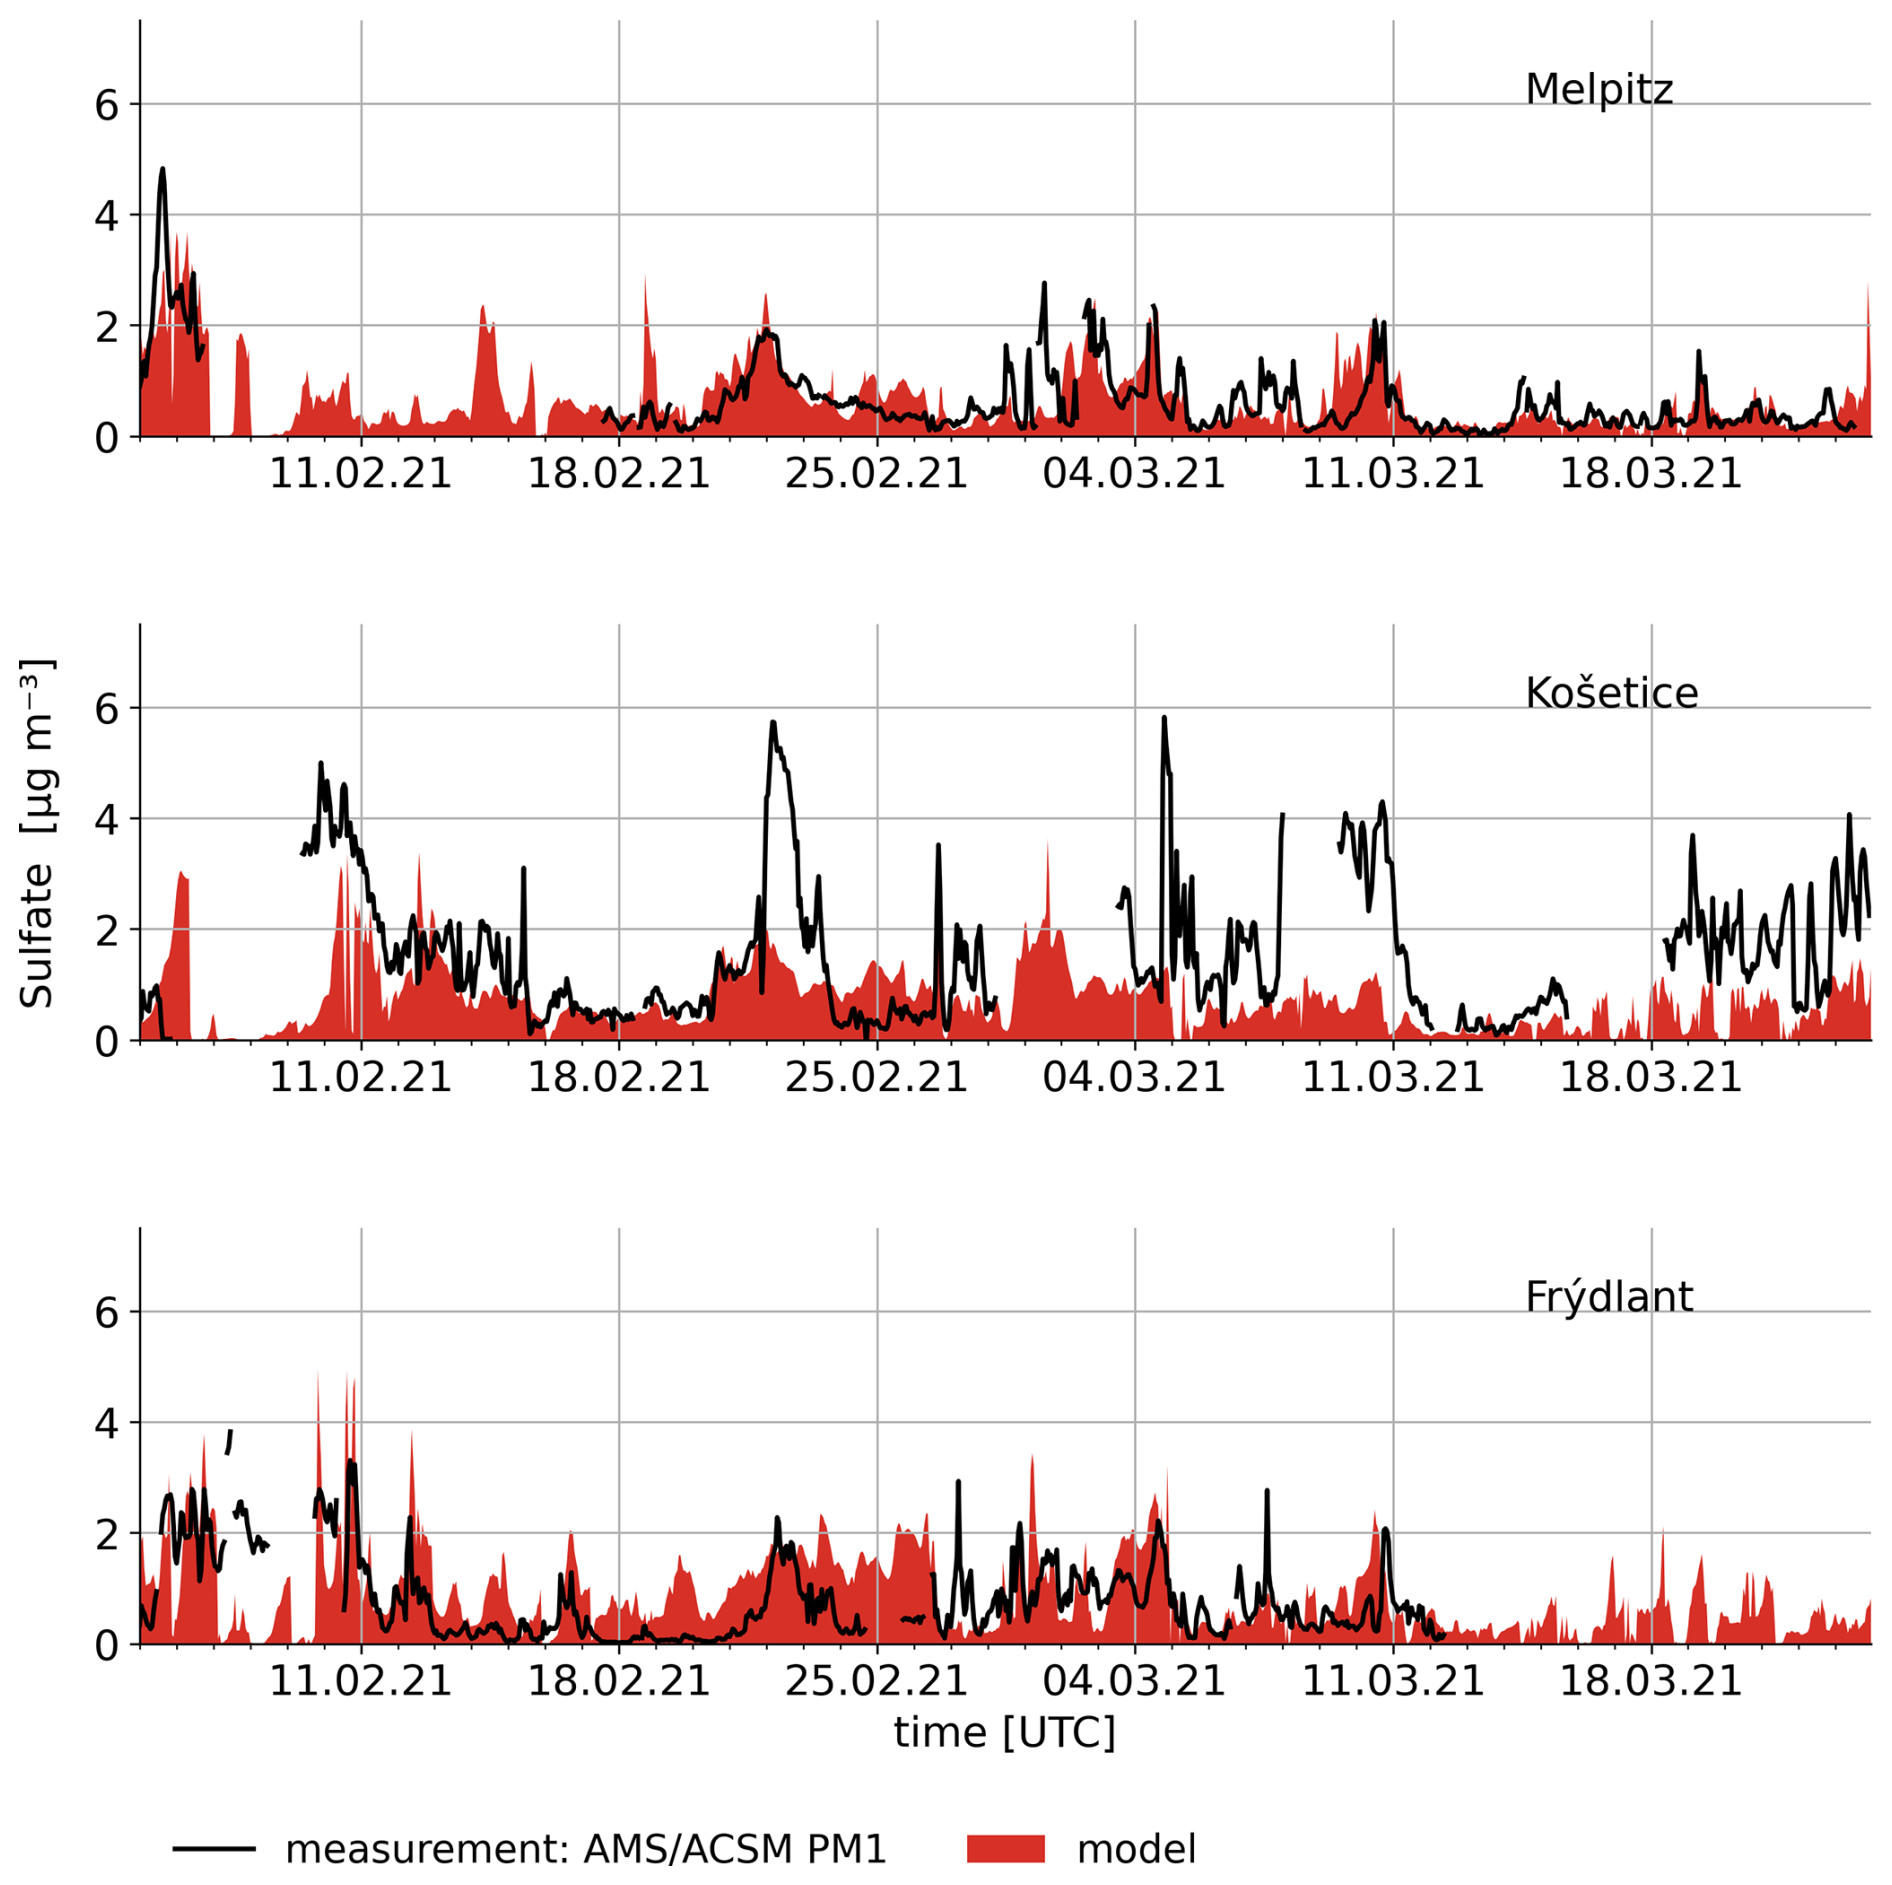
Figure A5Time series for sulfate mass concentration for the three sites. Comparison of measured and modelled data.
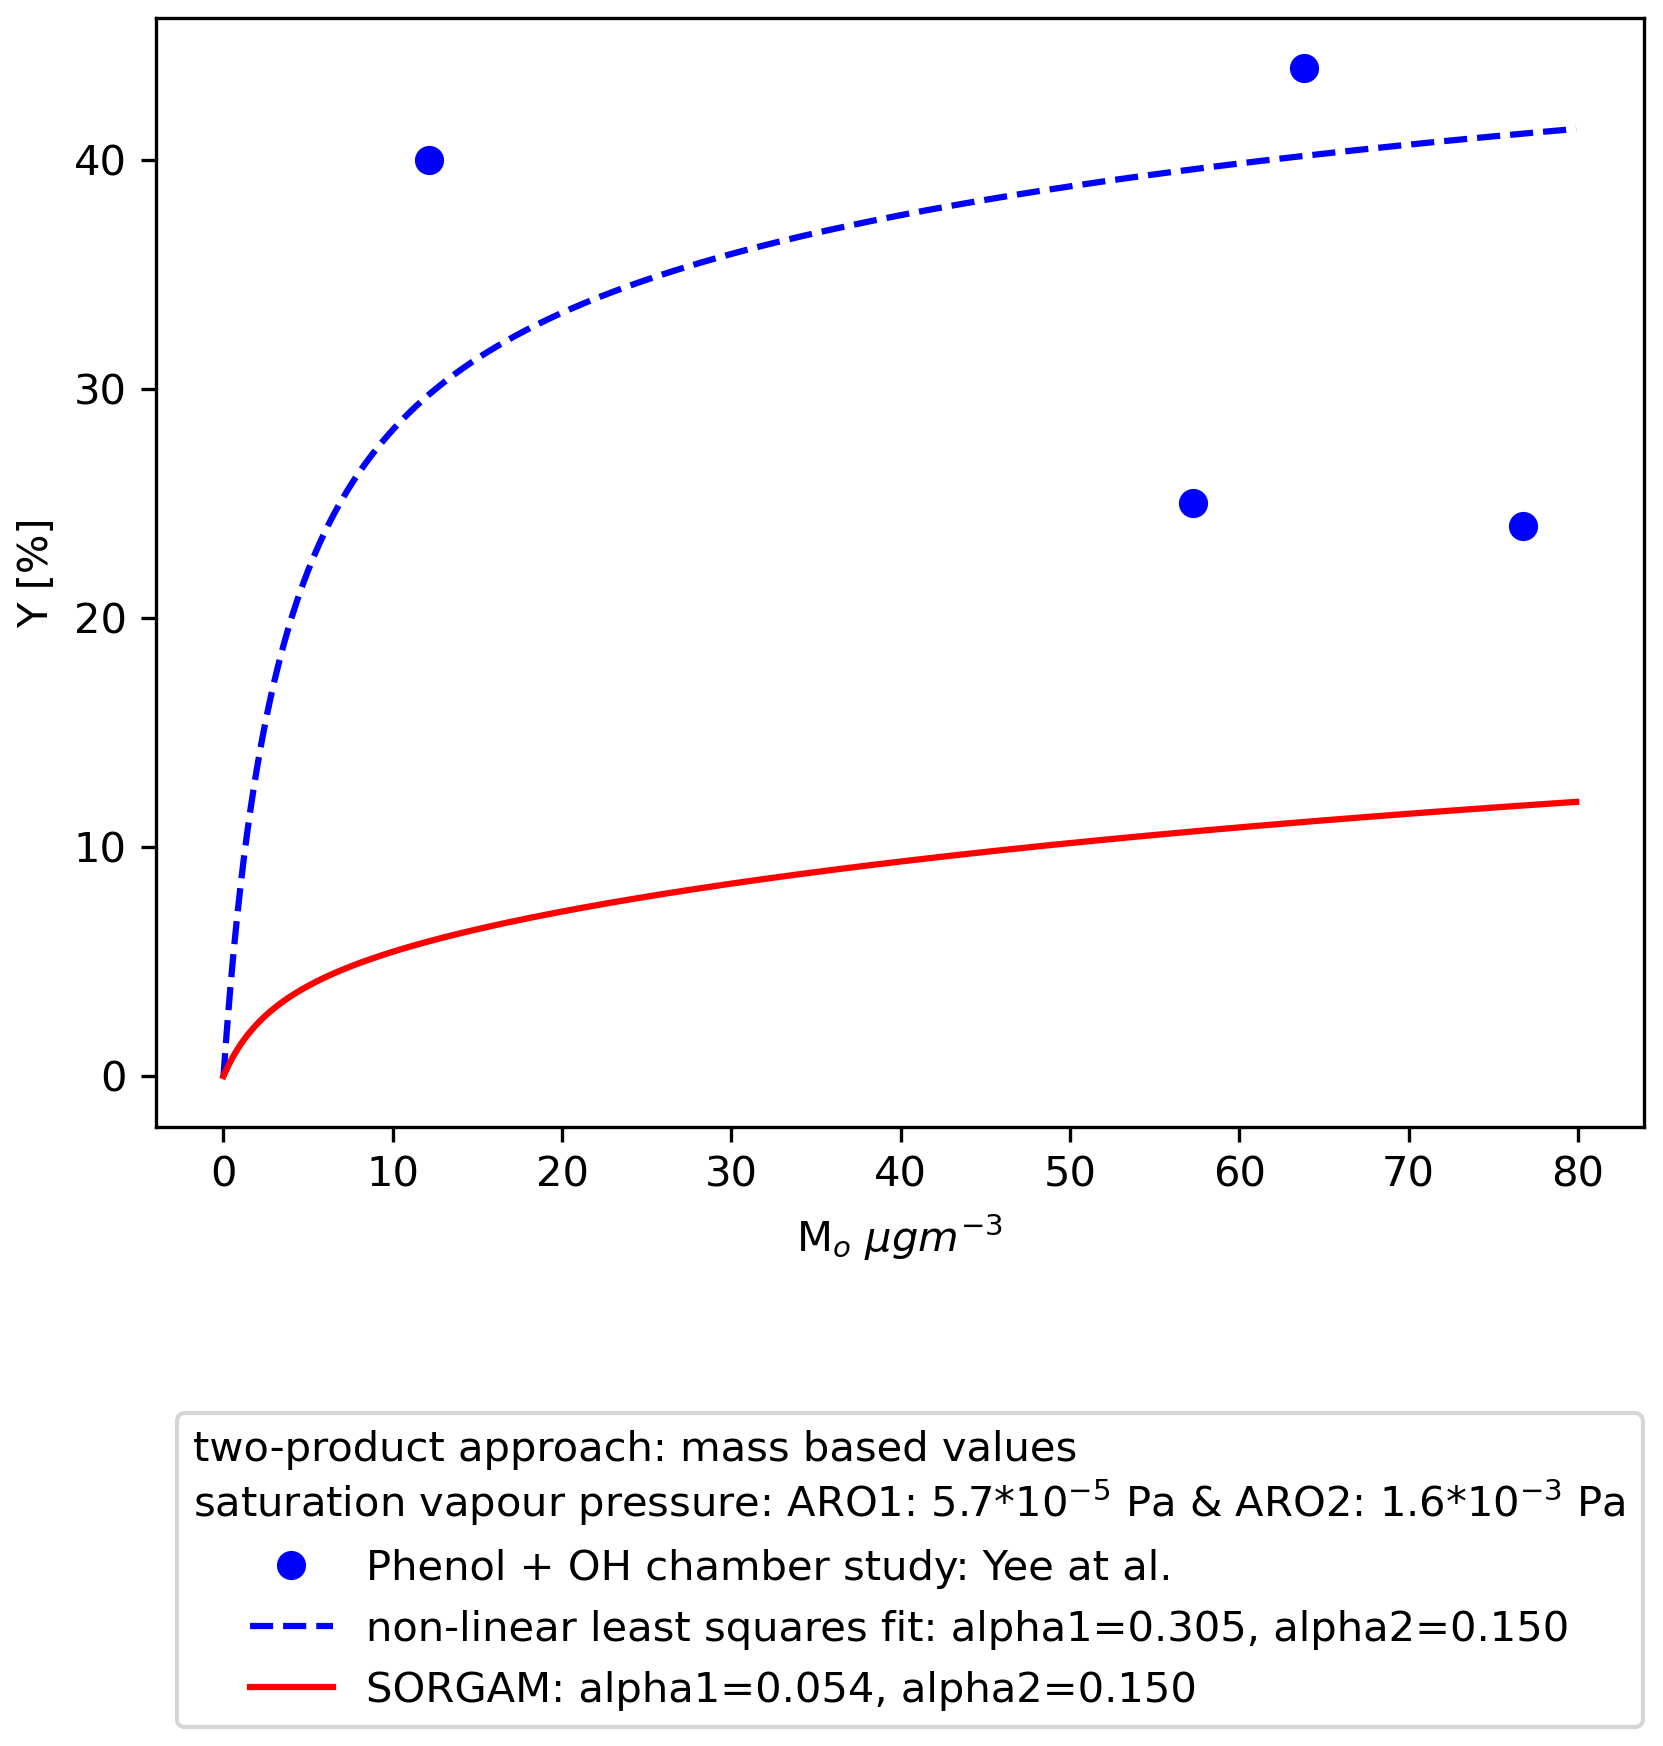
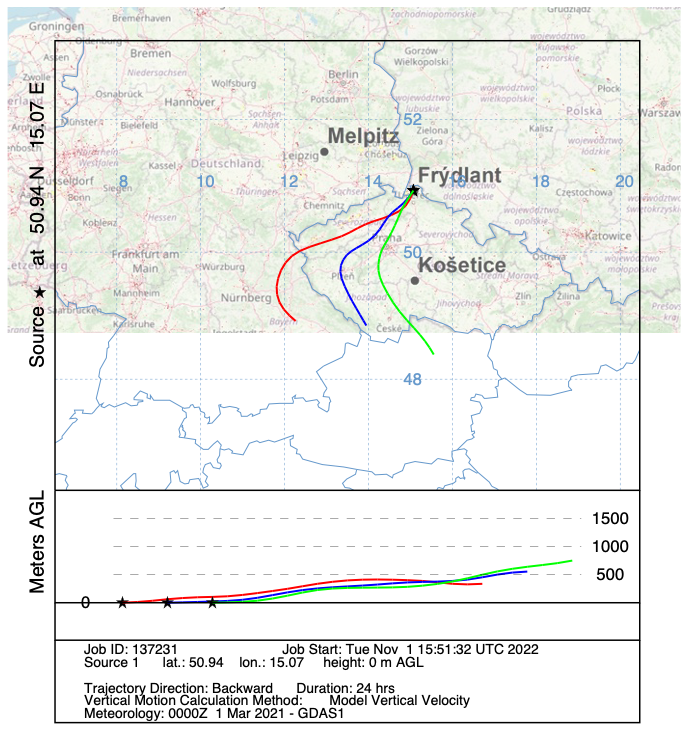
Figure A7Backward trajectory ending on 3 March 2021 at 12:00, 15:00, and 18:00 UTC in Frýdlant, created with the NOAA HYSPLIT trajectory model (Rolph et al., 2017; Stein et al., 2015).
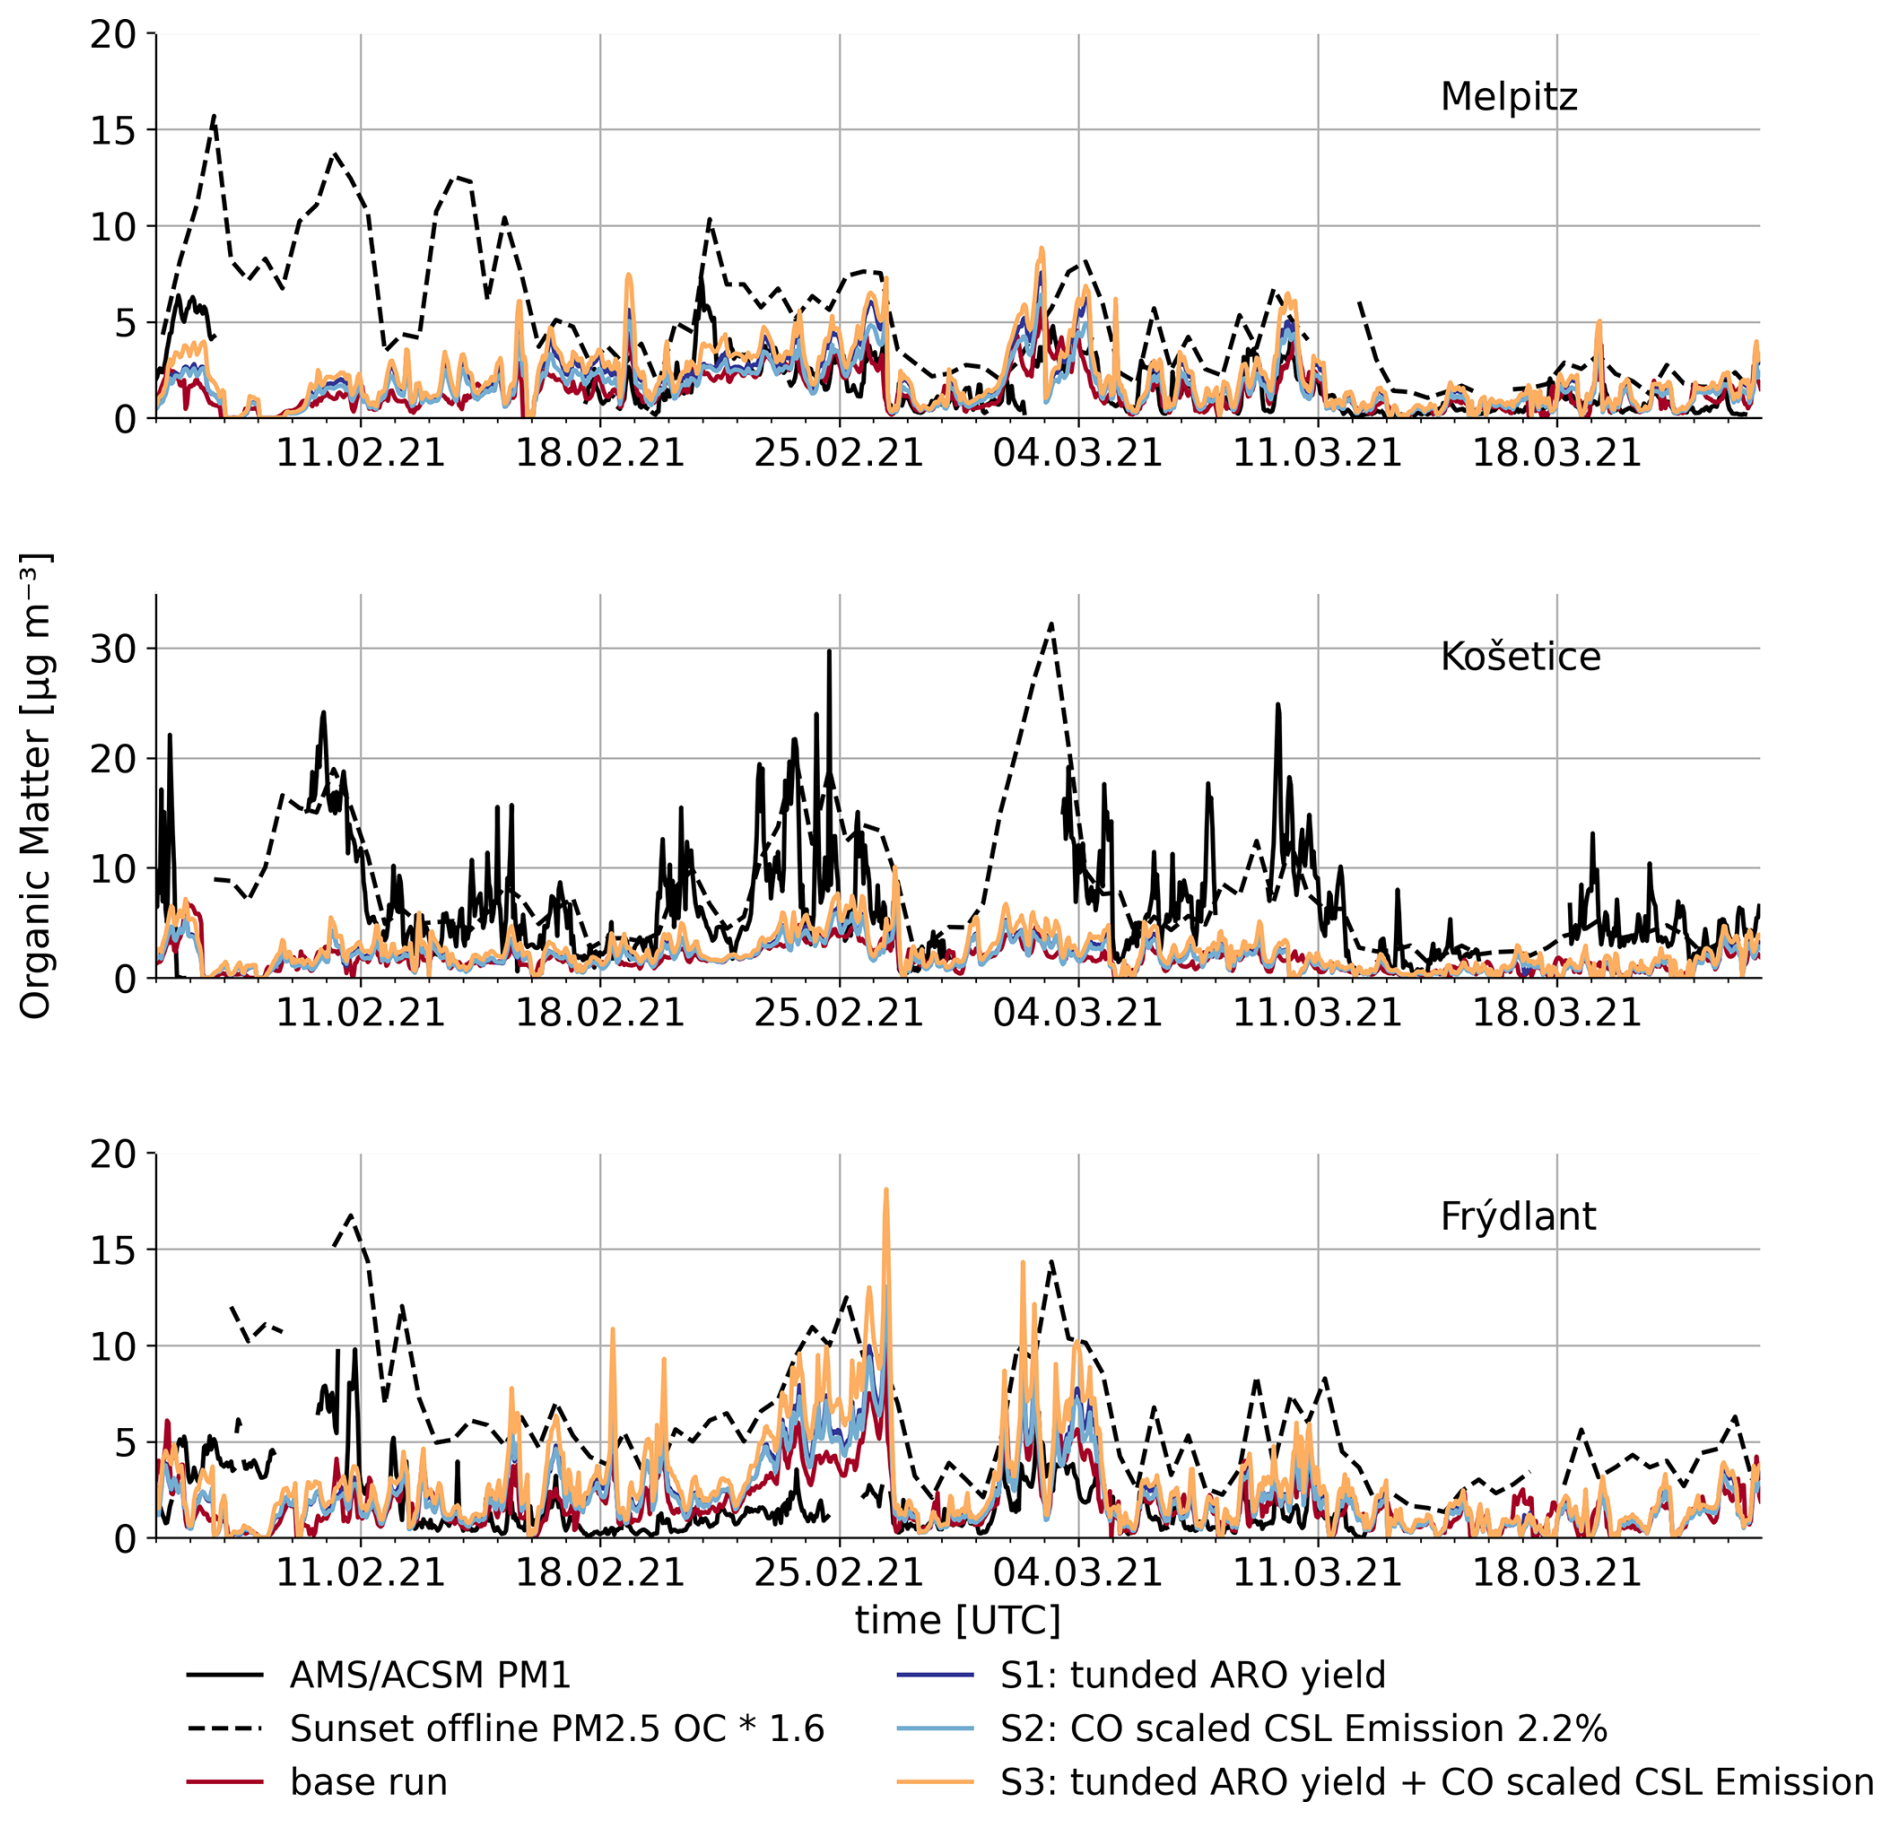
Figure A8Time series for organic matter mass concentration for all sensitivity runs compared to the base run and measurements.
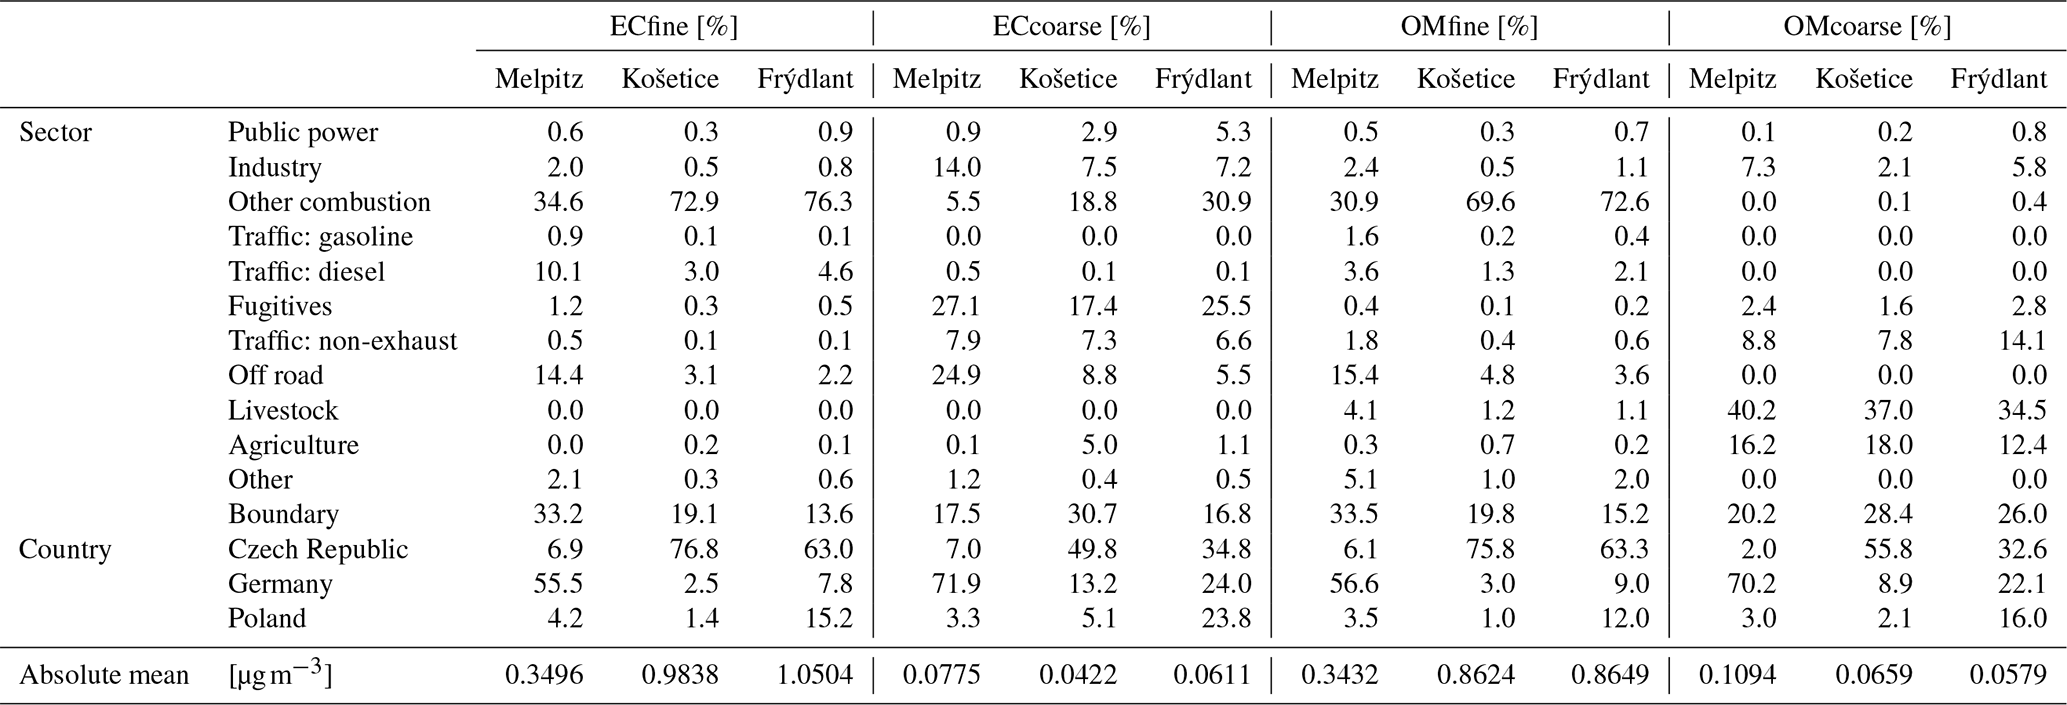
Table A4Relative contributions of different source sectors and source regions to the total of ECfine, ECcoarse, OMfine, and OMcoarse and absolute mean over all sectors. Contributions from outside the N0 domain are not included.
The COSMO model was available under licence for use in non-commercial research practices (see http://www.cosmo-model.org/content/consortium/licencing.htm, last access: 10 March 2025, for more information). The COSMO–MUSCAT version used in this study, including the tagging module, is published with restricted access in order to avoid breaching the COSMO licence agreement (https://doi.org/10.5281/zenodo.16947712, Wolke et al., 2025). All model data employed in this study are publicly accessible at https://doi.org/10.5281/zenodo.16406515 (Wiedenhaus, 2025). Measurement data will be made available upon request.
Conceptualisation: HW; data curation: HW; formal analysis: HW; investigation: HW, SA, LP, RL, PV, JS, PP, JO; methodology: RW, RS, ML, HW; software: RW, HW; supervision: RW, RS, LP; visualisation: HW; writing: original draft preparation: HW; writing: review and editing: HW, RS, RW, LP, RL, PV, VZ, IT; funding acquisition: VZ, HH, IT.
The contact author has declared that none of the authors has any competing interests.
Publisher’s note: Copernicus Publications remains neutral with regard to jurisdictional claims made in the text, published maps, institutional affiliations, or any other geographical representation in this paper. While Copernicus Publications makes every effort to include appropriate place names, the final responsibility lies with the authors. Views expressed in the text are those of the authors and do not necessarily reflect the views of the publisher.
We thank Ondřej Vlček from the Czech Hydrometeorological Institute for providing the Czech emission data that were used in Bartík et al. (2024). The authors acknowledge the use of DeepL Write (https://www.deepl.com/write, last access: 6 August 2025) and ChatGPT (https://chat.openai.com/, last access: 6 August 2025) to identify improvements in the writing style of a previous version of the paper.
This research has been supported by the Grantová Agentura České Republiky (grant no. 20-08304J) and the Deutsche Forschungsgemeinschaft (grant no. 431895563) as part of the German–Czech cooperation within the TRACE project.
This paper was edited by Benjamin A. Nault and reviewed by two anonymous referees.
A3M Global Monitoring GmbH: COVID-19 pandemic – Poland, A3M Global Monitoring GmbH, https://global-monitoring.com/gm/page/events/epidemic-0001979.ebxN7jiczrLh.html?lang=en (last access: 5 July 2024), 2023. a
Alves Dias, P., Kanellopoulos, K., Medarac, H., Kapetaki, Z., Miranda Barbosa, E., Shortall, R., Czako, V., Telsnig, T., Vazquez Hernandez, C., Lacal Arantegui, R., Nijs, W., Gonzalez Aparicio, I., Trombetti, M., Mandras, G., Peteves, E., and Tzimas, E.: EU coal regions: opportunities and challenges ahead., Tech. rep., European Commission, LU, https://doi.org/10.2760/064809, 2018. a
Anderson, J. O., Thundiyil, J. G., and Stolbach, A.: Clearing the Air: A Review of the Effects of Particulate Matter Air Pollution on Human Health, Journal of Medical Toxicology, 8, 166–175, https://doi.org/10.1007/s13181-011-0203-1, 2011. a
Atabakhsh, S., Poulain, L., Chen, G., Canonaco, F., Prévôt, A. S. H., Pöhlker, M., Wiedensohler, A., and Herrmann, H.: A 1-year aerosol chemical speciation monitor (ACSM) source analysis of organic aerosol particle contributions from anthropogenic sources after long-range transport at the TROPOS research station Melpitz, Atmos. Chem. Phys., 23, 6963–6988, https://doi.org/10.5194/acp-23-6963-2023, 2023. a, b, c, d, e
Barthel, S., Tegen, I., and Wolke, R.: Do new sea spray aerosol source functions improve the results of a regional aerosol model?, Atmospheric Environment, 198, 265–278, https://doi.org/10.1016/j.atmosenv.2018.10.016, 2019. a
Bartík, L., Huszár, P., Karlický, J., Vlček, O., and Eben, K.: Modeling the drivers of fine PM pollution over Central Europe: impacts and contributions of emissions from different sources, Atmos. Chem. Phys., 24, 4347–4387, https://doi.org/10.5194/acp-24-4347-2024, 2024. a, b, c
Beloconi, A. and Vounatsou, P.: Revised EU and WHO air quality thresholds: Where does Europe stand?, Atmospheric Environment, 314, 120110, https://doi.org/10.1016/j.atmosenv.2023.120110, 2023. a
Bergström, R., Denier van der Gon, H. A. C., Prévôt, A. S. H., Yttri, K. E., and Simpson, D.: Modelling of organic aerosols over Europe (2002–2007) using a volatility basis set (VBS) framework: application of different assumptions regarding the formation of secondary organic aerosol, Atmos. Chem. Phys., 12, 8499–8527, https://doi.org/10.5194/acp-12-8499-2012, 2012. a
BMG: Coronavirus-Pandemie: Was geschah wann?, Bundesministerium für Gesundheit, https://www.bundesgesundheitsministerium.de/coronavirus/chronik-coronavirus (last access: 13 June 2024), 2023. a
Brandt, J., Silver, J. D., Christensen, J. H., Andersen, M. S., Bønløkke, J. H., Sigsgaard, T., Geels, C., Gross, A., Hansen, A. B., Hansen, K. M., Hedegaard, G. B., Kaas, E., and Frohn, L. M.: Contribution from the ten major emission sectors in Europe and Denmark to the health-cost externalities of air pollution using the EVA model system – an integrated modelling approach, Atmos. Chem. Phys., 13, 7725–7746, https://doi.org/10.5194/acp-13-7725-2013, 2013. a
Bruns, E. A., Haddad, I. E., Slowik, J. G., Kilic, D., Klein, F., Baltensperger, U., and Prévôt, A. S. H.: Identification of significant precursor gases of secondary organic aerosols from residential wood combustion, Scientific Reports, 6, https://doi.org/10.1038/srep27881, 2016. a, b
Canagaratna, M., Jayne, J., Jimenez, J., Allan, J., Alfarra, M., Zhang, Q., Onasch, T., Drewnick, F., Coe, H., Middlebrook, A., Delia, A., Williams, L., Trimborn, A., Northway, M., DeCarlo, P., Kolb, C., Davidovits, P., and Worsnop, D.: Chemical and microphysical characterization of ambient aerosols with the aerodyne aerosol mass spectrometer, Mass Spectrometry Reviews, 26, 185–222, https://doi.org/10.1002/mas.20115, 2007. a
Cavalli, F., Viana, M., Yttri, K. E., Genberg, J., and Putaud, J.-P.: Toward a standardised thermal-optical protocol for measuring atmospheric organic and elemental carbon: the EUSAAR protocol, Atmospheric Measurement Techniques, 3, 79–89, https://doi.org/10.5194/amt-3-79-2010, 2010. a
Chen, G., Canonaco, F., Tobler, A., Aas, W., Alastuey, A., Allan, J., Atabakhsh, S., Aurela, M., Baltensperger, U., Bougiatioti, A., De Brito, J. F., Ceburnis, D., Chazeau, B., Chebaicheb, H., Daellenbach, K. R., Ehn, M., El Haddad, I., Eleftheriadis, K., Favez, O., Flentje, H., Font, A., Fossum, K., Freney, E., Gini, M., Green, D. C., Heikkinen, L., Herrmann, H., Kalogridis, A.-C., Keernik, H., Lhotka, R., Lin, C., Lunder, C., Maasikmets, M., Manousakas, M. I., Marchand, N., Marin, C., Marmureanu, L., Mihalopoulos, N., Močnik, G., Nęcki, J., O’Dowd, C., Ovadnevaite, J., Peter, T., Petit, J.-E., Pikridas, M., Matthew Platt, S., Pokorná, P., Poulain, L., Priestman, M., Riffault, V., Rinaldi, M., Różański, K., Schwarz, J., Sciare, J., Simon, L., Skiba, A., Slowik, J. G., Sosedova, Y., Stavroulas, I., Styszko, K., Teinemaa, E., Timonen, H., Tremper, A., Vasilescu, J., Via, M., Vodička, P., Wiedensohler, A., Zografou, O., Cruz Minguillón, M., and Prévôt, A. S.: European aerosol phenomenology – 8: Harmonised source apportionment of organic aerosol using 22 Year-long ACSM/AMS datasets, Environment International, 166, 107325, https://doi.org/10.1016/j.envint.2022.107325, 2022. a
Clappier, A., Belis, C. A., Pernigotti, D., and Thunis, P.: Source apportionment and sensitivity analysis: two methodologies with two different purposes, Geosci. Model Dev., 10, 4245–4256, https://doi.org/10.5194/gmd-10-4245-2017, 2017. a
DWD: Deutschlandwetter im Februar 2021, online, https://www.dwd.de//DE/presse/pressemitteilungen/DE/2021/20210226_deutschlandwetter_februar2021_news.html (last access: 11 October 2023), 2021a. a
DWD: Deutschlandwetter im Maerz 2021, online, https://www.dwd.de//DE/presse/pressemitteilungen/DE/2021/20210330_deutschlandwetter_maerz2021_news.html (last access: 11 October 2023), 2021b. a
EEA: European city air quality viewer, https://www.eea.europa.eu/themes/air/urban-air-quality/european-city-air-quality-viewer (last access: 15 February 2024), 2019. a
EEA: Europe's air quality status 2021, online, https://doi.org/10.2800/488115 (last access: 7 February 2024), 2022. a, b
Emery, C., Liu, Z., Russell, A. G., Odman, M. T., Yarwood, G., and Kumar, N.: Recommendations on statistics and benchmarks to assess photochemical model performance, Journal of the Air amp, Waste Management Association, 67, 582–598, https://doi.org/10.1080/10962247.2016.1265027, 2017. a
Fagerli, H., Benedictow, A., van Caspel, W., Gauss, M., Ge, Y., Jonson, J. E., Klein, H., Nyí ri, A., Simpson, D., Tsyro, S., Valdebenito, A., Wind, P., Aas, W., Hjellbrekke, A., Solberg, S., Tø rseth, K., Yttri, K. E., Matthews, B., Schindlbacher, S., Ullrich, B., Wankm
babshnbuller, R., Klimont, Z., Scheuschner, T., Kuenen, J. J. P., Hellén, H., Jaffrezo, J.-L., Tusha, D., Mothes, F., Salameh, T., van Drooge, B. L., and Wegener, R.: Transboundary particulate matter, photo-oxidants, acidifying and eutrophying components, Tech. rep., EMEP, https://emep.int/publ/reports/2023/EMEP_Status_Report_1_2023.pdf (last access: 11 October 2025), 2023. a
Forster, P. M., Forster, H. I., Evans, M. J., Gidden, M. J., Jones, C. D., Keller, C. A., Lamboll, R. D., Quéré, C. L., Rogelj, J., Rosen, D., Schleussner, C.-F., Richardson, T. B., Smith, C. J., and Turnock, S. T.: Current and future global climate impacts resulting from COVID-19, Nature Climate Change, 10, 913–919, https://doi.org/10.1038/s41558-020-0883-0, 2020. a
Galmarini, S., Makar, P., Clifton, O. E., Hogrefe, C., Bash, J. O., Bellasio, R., Bianconi, R., Bieser, J., Butler, T., Ducker, J., Flemming, J., Hodzic, A., Holmes, C. D., Kioutsioukis, I., Kranenburg, R., Lupascu, A., Perez-Camanyo, J. L., Pleim, J., Ryu, Y.-H., San Jose, R., Schwede, D., Silva, S., and Wolke, R.: Technical note: AQMEII4 Activity 1: evaluation of wet and dry deposition schemes as an integral part of regional-scale air quality models, Atmos. Chem. Phys., 21, 15663–15697, https://doi.org/10.5194/acp-21-15663-2021, 2021. a, b
Galperin, M. and Sofiev, M.: The long-range transport of ammonia and ammonium in the Northern Hemisphere, Atmospheric Environment, 32, 373–380, https://doi.org/10.1016/S1352-2310(97)00045-9, 1998. a
Gkatzelis, G. I., Gilman, J. B., Brown, S. S., Eskes, H., Gomes, A. R., Lange, A. C., McDonald, B. C., Peischl, J., Petzold, A., Thompson, C. R., and Kiendler-Scharr, A.: The global impacts of COVID-19 lockdowns on urban air pollution, Elementa: Science of the Anthropocene, 9, https://doi.org/10.1525/elementa.2021.00176, 2021. a
Gu, Y., Henze, D. K., Nawaz, M. O., Cao, H., and Wagner, U. J.: Sources of PM2.5‐Associated Health Risks in Europe and Corresponding Emission‐Induced Changes During 2005–2015, GeoHealth, 7, https://doi.org/10.1029/2022GH000767, 2023. a
Guevara, M., Jorba, O., Tena, C., Denier van der Gon, H., Kuenen, J., Elguindi, N., Darras, S., Granier, C., and Pérez García-Pando, C.: Copernicus Atmosphere Monitoring Service TEMPOral profiles (CAMS-TEMPO): global and European emission temporal profile maps for atmospheric chemistry modelling, Earth Syst. Sci. Data, 13, 367–404, https://doi.org/10.5194/essd-13-367-2021, 2021. a
Guion, A., Couvidat, F., Guevara, M., and Colette, A.: Country and species-dependent parameters for the Heating Degree Day method to distribute NOx and PM emissions from residential heating in the EU-27: application to air quality modelling and multi-year emission projections, EGUsphere [preprint], https://doi.org/10.5194/egusphere-2024-2911, 2024. a
Haarig, M., Ansmann, A., Engelmann, R., Baars, H., Toledano, C., Torres, B., Althausen, D., Radenz, M., and Wandinger, U.: First triple-wavelength lidar observations of depolarization and extinction-to-backscatter ratios of Saharan dust, Atmos. Chem. Phys., 22, 355–369, https://doi.org/10.5194/acp-22-355-2022, 2022. a, b, c
Hatch, L. E., Luo, W., Pankow, J. F., Yokelson, R. J., Stockwell, C. E., and Barsanti, K. C.: Identification and quantification of gaseous organic compounds emitted from biomass burning using two-dimensional gas chromatography–time-of-flight mass spectrometry, Atmos. Chem. Phys., 15, 1865–1899, https://doi.org/10.5194/acp-15-1865-2015, 2015. a
Heinold, B., Tegen, I., Schepanski, K., Tesche, M., Esselborn, M., Freudenthaler, V., Gross, S., Kandler, K., Knippertz, P., Müller, D., Schladitz, A., Toledano, C., Weinzierl, B., Ansmann, A., Althausen, D., Müller, T., Petzold, A., and Wiedensohler, A.: Regional modelling of Saharan dust and biomass-burning smoke: Part 1: Model description and evaluation, Tellus B: Chemical and Physical Meteorology, 63, 781, https://doi.org/10.1111/j.1600-0889.2011.00570.x, 2011. a, b
Hinneburg, D., Renner, E., and Wolke, R.: Formation of secondary inorganic aerosols by power plant emissions exhausted through cooling towers in Saxony, Environmental Science and Pollution Research, 16, 25–35, https://doi.org/10.1007/s11356-008-0081-5, 2008. a, b
Horník, Š., Pokorná, P., Vodička, P., Lhotka, R., Sýkora, J., Arora, S., Poulain, L., Herrmann, H., Schwarz, J., and Ždímal, V.: Positive matrix factorization of seasonally resolved organic aerosol at three different central European background sites based on nuclear magnetic resonance Aerosolomics data, Science of The Total Environment, 916, 170303, https://doi.org/10.1016/j.scitotenv.2024.170303, 2024. a, b
Hoshyaripour, A.: February 2021: A dusty month for Europe, The European Geosciences Union (EGU) Blogs, https://blogs.egu.eu/divisions/as/2021/04/03/february-2021-a-dusty-month-for-europe/ (last access: 11 October 2023), 2021. a
Hovorka, J., Pokorná, P., Hopke, P., Křůmal, K., Mikuška, P., and Píšová, M.: Wood combustion, a dominant source of winter aerosol in residential district in proximity to a large automobile factory in Central Europe, Atmospheric Environment, 113, 98–107, https://doi.org/10.1016/j.atmosenv.2015.04.068, 2015. a
Huang, L., Zhu, Y., Zhai, H., Xue, S., Zhu, T., Shao, Y., Liu, Z., Emery, C., Yarwood, G., Wang, Y., Fu, J., Zhang, K., and Li, L.: Recommendations on benchmarks for numerical air quality model applications in China – Part 1: PM2.5 and chemical species, Atmospheric Chemistry and Physics, 21, 2725–2743, https://doi.org/10.5194/acp-21-2725-2021, 2021. a
IEA: Czech Republic 2021 Energy Policy Review, Tech. rep., International Energy Agency, https://www.iea.org/reports/czech-republic-2021 (last access: 11 October 2025), 2021. a
Im, U., Bianconi, R., Solazzo, E., Kioutsioukis, I., Badia, A., Balzarini, A., Baró, R., Bellasio, R., Brunner, D., Chemel, C., Curci, G., Denier van der Gon, H., Flemming, J., Forkel, R., Giordano, L., Jiménez-Guerrero, P., Hirtl, M., Hodzic, A., Honzak, L., Jorba, O., Knote, C., Makar, P. A., Manders-Groot, A., Neal, L., Pérez, J. L., Pirovano, G., Pouliot, G., San Jose, R., Savage, N., Schroder, W., Sokhi, R. S., Syrakov, D., Torian, A., Tuccella, P., Wang, K., Werhahn, J., Wolke, R., Zabkar, R., Zhang, Y., Zhang, J., Hogrefe, C., and Galmarini, S.: Evaluation of operational online-coupled regional air quality models over Europe and North America in the context of AQMEII phase 2. Part II: Particulate matter, Atmospheric Environment, 115, 421–441, https://doi.org/10.1016/j.atmosenv.2014.08.072, 2015. a, b, c
Inness, A., Ades, M., Agustí-Panareda, A., Barré, J., Benedictow, A., Blechschmidt, A.-M., Dominguez, J. J., Engelen, R., Eskes, H., Flemming, J., Huijnen, V., Jones, L., Kipling, Z., Massart, S., Parrington, M., Peuch, V.-H., Razinger, M., Remy, S., Schulz, M., and Suttie, M.: The CAMS reanalysis of atmospheric composition, Atmos. Chem. Phys., 19, 3515–3556, https://doi.org/10.5194/acp-19-3515-2019, 2019. a
Kaiser, J. W., Heil, A., Andreae, M. O., Benedetti, A., Chubarova, N., Jones, L., Morcrette, J.-J., Razinger, M., Schultz, M. G., Suttie, M., and van der Werf, G. R.: Biomass burning emissions estimated with a global fire assimilation system based on observed fire radiative power, Biogeosciences, 9, 527–554, https://doi.org/10.5194/bg-9-527-2012, 2012. a
Karanasiou, A., Panteliadis, P., Perez, N., Minguillón, M., Pandolfi, M., Titos, G., Viana, M., Moreno, T., Querol, X., and Alastuey, A.: Evaluation of the Semi-Continuous OCEC analyzer performance with the EUSAAR2 protocol, Science of The Total Environment, 747, 141266, https://doi.org/10.1016/j.scitotenv.2020.141266, 2020. a
Karl, M., Dorn, H.-P., Holland, F., Koppmann, R., Poppe, D., Rupp, L., Schaub, A., and Wahner, A.: Product study of the reaction of OH radicals with isoprene in the atmosphere simulation chamber SAPHIR, Journal of Atmospheric Chemistry, 55, 167–187, https://doi.org/10.1007/s10874-006-9034-x, 2006. a
Karl, M., Tsigaridis, K., Vignati, E., and Dentener, F.: Formation of secondary organic aerosol from isoprene oxidation over Europe, Atmos. Chem. Phys., 9, 7003–7030, https://doi.org/10.5194/acp-9-7003-2009, 2009. a
Kranenburg, R., Segers, A. J., Hendriks, C., and Schaap, M.: Source apportionment using LOTOS-EUROS: module description and evaluation, Geosci. Model Dev., 6, 721–733, https://doi.org/10.5194/gmd-6-721-2013, 2013. a, b
Kuenen, J., Dellaert, S., Visschedijk, A., Jalkanen, J.-P., Super, I., and Denier van der Gon, H.: CAMS-REG-v4: a state-of-the-art high-resolution European emission inventory for air quality modelling, Earth Syst. Sci. Data, 14, 491–515, https://doi.org/10.5194/essd-14-491-2022, 2022. a, b, c, d, e
Kuenen, J. J. P., Visschedijk, A. J. H., Jozwicka, M., and Denier van der Gon, H. A. C.: TNO-MACC_II emission inventory; a multi-year (2003–2009) consistent high-resolution European emission inventory for air quality modelling, Atmos. Chem. Phys., 14, 10963–10976, https://doi.org/10.5194/acp-14-10963-2014, 2014. a, b
Kwok, R., Napelenok, S., and Baker, K.: Implementation and evaluation of PM2.5 source contribution analysis in a photochemical model, Atmospheric Environment, 80, 398–407, https://doi.org/10.1016/j.atmosenv.2013.08.017, 2013. a
Lhotka, R., Pokorná, P., Vodička, P., Zíková, N., Chen, G. I., Prévôt, A. S., Mbengue, S., Schwarz, J., and Ždímal, V.: Influence of meteorological conditions and seasonality on PM1 and organic aerosol sources at a rural background site, Atmospheric Environment, 121028, https://doi.org/10.1016/j.atmosenv.2025.121028, 2025. a, b, c, d, e
Liu, L., Hohaus, T., Franke, P., Lange, A. C., Tillmann, R., Fuchs, H., Tan, Z., Rohrer, F., Karydis, V., He, Q., Vardhan, V., Andres, S., Bohn, B., Holland, F., Winter, B., Wedel, S., Novelli, A., Hofzumahaus, A., Wahner, A., and Kiendler-Scharr, A.: Observational evidence reveals the significance of nocturnal chemistry in seasonal secondary organic aerosol formation, npj Climate and Atmospheric Science, 7, https://doi.org/10.1038/s41612-024-00747-6, 2024. a
Luttkus, M. L., Hoffmann, E. H., Poulain, L., Tilgner, A., and Wolke, R.: The Effect of Land Use Classification on the Gas‐Phase and Particle Composition of the Troposphere: Tree Species Versus Forest Type Information, Journal of Geophysical Research: Atmospheres, 127, https://doi.org/10.1029/2021JD035305, 2022. a, b, c
Macuk, R.: Heating in Poland – Edition 2019, Forum Energii, https://www.forum-energii.eu/en/heating-in-poland-2019-edition (last access: 11 October 2025), 2019. a
Makeš, O., Schwarz, J., Vodička, P., Engling, G., and Ždímal, V.: Determination of PM1 Sources at a Prague Background Site during the 2012–2013 Period Using PMF Analysis of Combined Aerosol Mass Spectra, Atmosphere, 13, 20, https://doi.org/10.3390/atmos13010020, 2021. a
Matthias, V., Quante, M., Arndt, J. A., Badeke, R., Fink, L., Petrik, R., Feldner, J., Schwarzkopf, D., Link, E.-M., Ramacher, M. O. P., and Wedemann, R.: The role of emission reductions and the meteorological situation for air quality improvements during the COVID-19 lockdown period in central Europe, Atmos. Chem. Phys., 21, 13931–13971, https://doi.org/10.5194/acp-21-13931-2021, 2021. a
Mbengue, S., Fusek, M., Schwarz, J., Vodička, P., Šmejkalová, A. H., and Holoubek, I.: Four years of highly time resolved measurements of elemental and organic carbon at a rural background site in Central Europe, Atmospheric Environment, 182, 335–346, https://doi.org/10.1016/j.atmosenv.2018.03.056, 2018. a
Mbengue, S., Vodička, P., Komínková, K., Zíková, N., Schwarz, J., Prokeš, R., Suchánková, L., Julaha, K., Ondráček, J., Holoubek, I., and Ždímal, V.: Different approaches to explore the impact of COVID-19 lockdowns on carbonaceous aerosols at a European rural background site, Science of The Total Environment, 892, 164527, https://doi.org/10.1016/j.scitotenv.2023.164527, 2023. a, b
Mircea, M., Calori, G., Pirovano, G., and Belis, C.: European guide on air pollution source apportionment for particulate matter with source oriented models and their combined use with receptor models, Publications Office of the European Union, Luxembourg, EUR 30082 EN, https://doi.org/10.2760/470628, 2020. a
Mozurkewich, M.: The dissociation constant of ammonium nitrate and its dependence on temperature, relative humidity and particle size, Atmospheric Environment. Part A. General Topics, 27, 261–270, https://doi.org/10.1016/0960-1686(93)90356-4, 1993. a
NFR-I: Annex I NFR reporting template, https://www.ceip.at/reporting-instructions/annexes-to-the-2023-reporting-guidelines (last access: 11 October 2025), 2023. a
Odum, J. R., Hoffmann, T., Bowman, F., Collins, D., Flagan, R. C., and Seinfeld, J. H.: Gas/Particle Partitioning and Secondary Organic Aerosol Yields, Environmental Science and Technology, 30, 2580–2585, https://doi.org/10.1021/es950943+, 1996. a, b
Odum, J. R., Jungkamp, T. P. W., Griffin, R. J., Flagan, R. C., and Seinfeld, J. H.: The Atmospheric Aerosol-Forming Potential of Whole Gasoline Vapor, Science, 276, 96–99, https://doi.org/10.1126/science.276.5309.96, 1997. a
Olivier, J. G. J., Bouwman, A. F., Van der Maas, C. W. M., Berdowski, J. J. M., Veldt, C., Bloos, J. P. J., H., V. A. J., Zandveld, P. Y. J., and Haverlag, J. L.: Description of EDGAR version 2.02.0: A set of global emission inventories ofgreenhouse gases and ozone-depleting substances for all anthropogenicand most natural sources on a per country basis and on 1x1 grid, National Institute of Public Health and the Environment (RIVM), Report no. 771060002/TNO-MEP report no. R96/119, (last access: 27 February 2024), 1996. a
OpenStreetMap contributors: OpenStreetMap, OpenStreetMap Foundation, https://www.openstreetmap.org (last access: 11 October 2025), available as open data under the Open Data Commons Open Database License (ODbL) at https://www.openstreetmap.org, 2017. a
Pankow, J. F.: An absorption model of gas/particle partitioning of organic compounds in the atmosphere, Atmospheric Environment, 28, 185–188, https://doi.org/10.1016/1352-2310(94)90093-0, 1994. a
Pokorná, P., Schwarz, J., Krejci, R., Swietlicki, E., Havránek, V., and Ždímal, V.: Comparison of PM2.5 chemical composition and sources at a rural background site in Central Europe between 1993/1994/1995 and 2009/2010: Effect of legislative regulations and economic transformation on the air quality, Environmental Pollution, 241, 841–851, https://doi.org/10.1016/j.envpol.2018.06.015, 2018. a
Pokorná, P., Zíková, N., Vodička, P., Lhotka, R., Mbengue, S., Holubová Šmejkalová, A., Riffault, V., Ondráček, J., Schwarz, J., and Ždímal, V.: Chemically speciated mass size distribution, particle density, shape and origin of non-refractory PM1 measured at a rural background site in central Europe, Atmos. Chem. Phys., 22, 5829–5858, https://doi.org/10.5194/acp-22-5829-2022, 2022. a, b, c, d
Poulain, L., Spindler, G., Birmili, W., Plass-Dülmer, C., Wiedensohler, A., and Herrmann, H.: Seasonal and diurnal variations of particulate nitrate and organic matter at the IfT research station Melpitz, Atmos. Chem. Phys., 11, 12579–12599, https://doi.org/10.5194/acp-11-12579-2011, 2011. a, b, c, d, e
Poulain, L., Spindler, G., Grüner, A., Tuch, T., Stieger, B., van Pinxteren, D., Petit, J.-E., Favez, O., Herrmann, H., and Wiedensohler, A.: Multi-year ACSM measurements at the central European research station Melpitz (Germany) – Part 1: Instrument robustness, quality assurance, and impact of upper size cutoff diameter, Atmos. Meas. Tech., 13, 4973–4994, https://doi.org/10.5194/amt-13-4973-2020, 2020. a, b
Putaud, J.-P., Pisoni, E., Mangold, A., Hueglin, C., Sciare, J., Pikridas, M., Savvides, C., Ondracek, J., Mbengue, S., Wiedensohler, A., Weinhold, K., Merkel, M., Poulain, L., van Pinxteren, D., Herrmann, H., Massling, A., Nordstroem, C., Alastuey, A., Reche, C., Pérez, N., Castillo, S., Sorribas, M., Adame, J. A., Petaja, T., Lehtipalo, K., Niemi, J., Riffault, V., de Brito, J. F., Colette, A., Favez, O., Petit, J.-E., Gros, V., Gini, M. I., Vratolis, S., Eleftheriadis, K., Diapouli, E., Denier van der Gon, H., Yttri, K. E., and Aas, W.: Impact of 2020 COVID-19 lockdowns on particulate air pollution across Europe, Atmos. Chem. Phys., 23, 10145–10161, https://doi.org/10.5194/acp-23-10145-2023, 2023. a
Ramdahl, T.: Retene – a molecular marker of wood combustion in ambient air, Nature, 306, 580–582, https://doi.org/10.1038/306580a0, 1983. a
Rolph, G., Stein, A., and Stunder, B.: Real-time Environmental Applications and Display sYstem: READY, Environmental Modelling and Software, 95, 210–228, https://doi.org/10.1016/j.envsoft.2017.06.025, 2017. a
Schättler, U., Doms, G., and Schraff, C.: COSMO-Model Version 5.05: A Description of the Nonhydrostatic Regional COSMO-Model – Part VII: User’s Guide, Deutscher Wetterdienst, https://doi.org/10.5676/DWD_pub/nwv/cosmo-doc_5.05_VII, 2018. a, b, c
Schauer, J. J., Kleeman, M. J., Cass, G. R., and Simoneit, B. R. T.: Measurement of Emissions from Air Pollution Sources. 3. C1−C29 Organic Compounds from Fireplace Combustion of Wood, Environmental Science and Technology, 35, 1716–1728, https://doi.org/10.1021/es001331e, 2001. a
Schell, B., Ackermann, I. J., Hass, H., Binkowski, F. S., and Ebel, A.: Modeling the formation of secondary organic aerosol within a comprehensive air quality model system, Journal of Geophysical Research: Atmospheres, 106, 28275–28293, https://doi.org/10.1029/2001JD000384, 2001. a, b, c
Schepanski, K., Heinold, B., and Tegen, I.: Harmattan, Saharan heat low, and West African monsoon circulation: modulations on the Saharan dust outflow towards the North Atlantic, Atmos. Chem. Phys., 17, 10223–10243, https://doi.org/10.5194/acp-17-10223-2017, 2017. a
Schneider, C., Pelzer, M., Tönges-Schuller, N., Nacken, M., and Niederau, A.: ArcGIS basierte Lösung zur detaillierten, deutschlandweiten Verteilung (Gridding) nationaler Emissionsjahreswerte auf Basis des Inventars zur Emissionsberichterstattung, Umweltbundesamt, ISBN 1862-4804, 2016. a, b
Schwarz, J., Chi, X., Maenhaut, W., Civis̆, M., Hovorka, J., and Smolík, J.: Elemental and organic carbon in atmospheric aerosols at downtown and suburban sites in Prague, Atmospheric Research, 90, 287–302, https://doi.org/10.1016/j.atmosres.2008.05.006, 2008. a
Schwarz, J., Cusack, M., Karban, J., Chalupníčková, E., Havránek, V., Smolík, J., and Ždímal, V.: PM2.5 chemical composition at a rural background site in Central Europe, including correlation and air mass back trajectory analysis, Atmospheric Research, 176–177, 108–120, https://doi.org/10.1016/j.atmosres.2016.02.017, 2016. a
Seinfeld, J. H. and Pandis, S. N.: Atmospheric Chemistry and Physics, Wiley-Interscience, [s.l.], 2. aufl. edn., ISBN 978-0-471-72018-8, description based upon print version of record, 2012.865, 2006 a
Simpson, D., Benedictow, A., Berge, H., Bergström, R., Emberson, L. D., Fagerli, H., Flechard, C. R., Hayman, G. D., Gauss, M., Jonson, J. E., Jenkin, M. E., Nyíri, A., Richter, C., Semeena, V. S., Tsyro, S., Tuovinen, J.-P., Valdebenito, Á., and Wind, P.: The EMEP MSC-W chemical transport model – technical description, Atmos. Chem. Phys., 12, 7825–7865, https://doi.org/10.5194/acp-12-7825-2012, 2012. a
Skjøth, C. A., Geels, C., Berge, H., Gyldenkærne, S., Fagerli, H., Ellermann, T., Frohn, L. M., Christensen, J., Hansen, K. M., Hansen, K., and Hertel, O.: Spatial and temporal variations in ammonia emissions – a freely accessible model code for Europe, Atmos. Chem. Phys., 11, 5221–5236, https://doi.org/10.5194/acp-11-5221-2011, 2011. a
Slabá, J.: Vládní boj proti pandemii: přehled opatření vydaných v souvislosti s pandemií onemocnění covid-19 v Česku v letech 2020 a 2021, Demografie, 64, 175–196, https://doi.org/10.54694/dem.0303, 2022. a
Spindler, G., Teichmann, U., and Sutton, M. A.: Ammonia dry deposition over grassland-micrometeorological flux-gradient measurements and bidirectional flux calculations using an inferential model, Quarterly Journal of the Royal Meteorological Society, 127, 795–814, https://doi.org/10.1002/qj.49712757305, 2001. a, b
Spindler, G., Gnauk, T., Grüner, A., Iinuma, Y., Müller, K., Scheinhardt, S., and Herrmann, H.: Size-segregated characterization of PM10 at the EMEP site Melpitz (Germany) using a five-stage impactor: a six year study, Journal of Atmospheric Chemistry, 69, 127–157, https://doi.org/10.1007/s10874-012-9233-6, 2012. a, b
Spindler, G., Grüner, A., Müller, K., Schlimper, S., and Herrmann, H.: Long-term size-segregated particle (PM10, PM2.5, PM1) characterization study at Melpitz – influence of air mass inflow, weather conditions and season, Journal of Atmospheric Chemistry, 70, 165–195, https://doi.org/10.1007/s10874-013-9263-8, 2013. a
Stein, A. F., Draxler, R. R., Rolph, G. D., Stunder, B. J. B., Cohen, M. D., and Ngan, F.: NOAAs HYSPLIT Atmospheric Transport and Dispersion Modeling System, Bulletin of the American Meteorological Society, 96, 2059–2077, https://doi.org/10.1175/BAMS-D-14-00110.1, 2015. a, b, c
Steinbrecher, R., Smiatek, G., Köble, R., Seufert, G., Theloke, J., Hauff, K., Ciccioli, P., Vautard, R., and Curci, G.: Intra- and inter-annual variability of VOC emissions from natural and semi-natural vegetation in Europe and neighbouring countries, Atmospheric Environment, 43, 1380–1391, https://doi.org/10.1016/j.atmosenv.2008.09.072, 2009. a
Stockwell, W. R., Kirchner, F., Kuhn, M., and Seefeld, S.: A new mechanism for regional atmospheric chemistry modeling, Journal of Geophysical Research: Atmospheres, 102, 25847–25879, https://doi.org/10.1029/97JD00849, 1997. a
Tegen, I., Harrison, S. P., Kohfeld, K., Prentice, I. C., Coe, M., and Heimann, M.: Impact of vegetation and preferential source areas on global dust aerosol: Results from a model study, Journal of Geophysical Research: Atmospheres, 107, https://doi.org/10.1029/2001JD000963, 2002. a
Theloke, J. and Friedrich, R.: Compilation of a database on the composition of anthropogenic VOC emissions for atmospheric modeling in Europe, Atmospheric Environment, 41, 4148–4160, https://doi.org/10.1016/j.atmosenv.2006.12.026, 2007. a
Thunis, P., Clappier, A., Tarrason, L., Cuvelier, C., Monteiro, A., Pisoni, E., Wesseling, J., Belis, C., Pirovano, G., Janssen, S., Guerreiro, C., and Peduzzi, E.: Source apportionment to support air quality planning: Strengths and weaknesses of existing approaches, Environment International, 130, 104825, https://doi.org/10.1016/j.envint.2019.05.019, 2019. a, b, c
Tõnisson, L., Voigtländer, J., Weger, M., Assmann, D., Käthner, R., Heinold, B., and Macke, A.: Knowledge Transfer with Citizen Science: Luft-Leipzig Case Study, Sustainability, 13, 7855, https://doi.org/10.3390/su13147855, 2021. a
Turpin, B. J., Saxena, P., and Andrews, E.: Measuring and simulating particulate organics in the atmosphere: problems and prospects, Atmospheric Environment, 34, 2983–3013, https://doi.org/10.1016/S1352-2310(99)00501-4, 2000. a
US EPA Office of Research and Development: CMAQ (5.5), Zenodo [code], https://doi.org/10.5281/zenodo.13883210, 2024. a
van Pinxteren, D., Fomba, K. W., Spindler, G., Müller, K., Poulain, L., Iinuma, Y., Löschau, G., Hausmann, A., and Herrmann, H.: Regional air quality in Leipzig, Germany: detailed source apportionment of size-resolved aerosol particles and comparison with the year 2000, Faraday Discussions, 189, 291–315, https://doi.org/10.1039/c5fd00228a, 2016. a
van Pinxteren, D., Mothes, F., Spindler, G., Fomba, K. W., and Herrmann, H.: Trans-boundary PM10: Quantifying impact and sources during winter 2016/17 in eastern Germany, Atmospheric Environment, 200, 119–130, https://doi.org/10.1016/j.atmosenv.2018.11.061, 2019. a, b
van Pinxteren, D., Engelhardt, V., Mothes, F., Poulain, L., Fomba, K. W., Spindler, G., Cuesta-Mosquera, A., Tuch, T., Müller, T., Wiedensohler, A., Löschau, G., Bastian, S., and Herrmann, H.: Residential Wood Combustion in Germany: A Twin-Site Study of Local Village Contributions to Particulate Pollutants and Their Potential Health Effects, ACS Environmental Au, 4, 12–30, https://doi.org/10.1021/acsenvironau.3c00035, 2023. a, b
Wang, Z. S., Chien, C., and Tonnesen, G. S.: Development of a tagged species source apportionment algorithm to characterize three‐dimensional transport and transformation of precursors and secondary pollutants, Journal of Geophysical Research: Atmospheres, 114, https://doi.org/10.1029/2008JD010846, 2009. a
Wiedenhaus, H.: Data for paper publication “Modeling Anthropogenic Aerosol Sources and Secondary Organic Aerosol Formation: A Wintertime Study in Central Europe”, in: Atmospheric Chemistry and Physics, Zenodo [data set], https://doi.org/10.5281/zenodo.16406515, 2025. a
Wolke, R., Schröder, W., Schrödner, R., and Renner, E.: Influence of grid resolution and meteorological forcing on simulated European air quality: A sensitivity study with the modeling system COSMO–MUSCAT, Atmospheric Environment, 53, 110–130, https://doi.org/10.1016/j.atmosenv.2012.02.085, 2012. a, b, c, d, e
Wolke, R., Schrödner, R., and Wiedenhaus, H.: COSMO5.05-MUSCAT with non-reactive tagging module, Zenodo [code], https://doi.org/10.5281/zenodo.16947712, 2025. a
World Bank Group: The Global Health Cost of PM2.5 Air Pollution: A Case for Action Beyond 2021, International Development in Focus, https://doi.org/10.1596/978-1-4648-1816-5, 2022. a
Yarwood, G., Morris, R. E., and Wilson, G. M.: Particulate Matter Source Apportionment Technology (PSAT) in the CAMx Photochemical Grid Model, in: Air Pollution Modeling and Its Application XVII, 478–492, Springer US, ISBN 9780387282558, https://doi.org/10.1007/978-0-387-68854-1_52, 2007. a
Yee, L. D., Kautzman, K. E., Loza, C. L., Schilling, K. A., Coggon, M. M., Chhabra, P. S., Chan, M. N., Chan, A. W. H., Hersey, S. P., Crounse, J. D., Wennberg, P. O., Flagan, R. C., and Seinfeld, J. H.: Secondary organic aerosol formation from biomass burning intermediates: phenol and methoxyphenols, Atmos. Chem. Phys., 13, 8019–8043, https://doi.org/10.5194/acp-13-8019-2013, 2013. a
Zhang, Y., Chen, Y., Jiang, N., Wang, S., Zhang, R., Lv, Z., Hao, X., and Wei, Y.: Chemical-composition characteristics of PM1 and PM2.5 and effects on pH and light-extinction coefficients under different pollution levels in Zhengzhou, China, Journal of Cleaner Production, 409, 137274, https://doi.org/10.1016/j.jclepro.2023.137274, 2023. a
Zíková, N. and Ždímal, V.: Long-Term Measurement of Aerosol Number Size Distributions at Rural Background Station Košetice, Aerosol and Air Quality Research, 13, 1464–1474, https://doi.org/10.4209/aaqr.2013.02.0056, 2013. a
Zikova, N. and Zdimal, V.: Precipitation scavenging of aerosol particles at a rural site in the Czech Republic, Tellus B: Chemical and Physical Meteorology, 68, 27343, https://doi.org/10.3402/tellusb.v68.27343, 2016. a