the Creative Commons Attribution 4.0 License.
the Creative Commons Attribution 4.0 License.
 | 15 Oct 2025
Unraveling Arctic submicron organic aerosol sources: a year-long study by H-NMR and AMS in Ny-Ålesund, Svalbard
Marco Paglione
Yufang Hao
Stefano Decesari
Mara Russo
Karam Mansour
Mauro Mazzola
Diego Fellin
Andrea Mazzanti
Emilio Tagliavini
Manousos Ioannis Manousakas
Evangelia Diapouli
Elena Barbaro
Matteo Feltracco
Kaspar R. Daellenbach
Understanding the chemical composition and sources of organic aerosol (OA) in the Arctic is critical given its importance for particle climate-relevant properties. This study presents a year-long analysis (May 2019–June 2020) of PM1 filter samples collected in Ny-Ålesund, Svalbard. A multi-instrumental approach is employed to characterize the comprehensive chemical composition of PM1, with a specific focus on its water-soluble organic fraction depicted combining proton nuclear magnetic resonance spectroscopy (H-NMR) and high-resolution time-of-flight aerosol mass spectrometry (HR-TOF-AMS), which provide complementary insights into the nature and structure of the organic aerosol classes characterizing the bulk OA mixture. Positive matrix factorization (PMF) source apportionment identifies consistent OA sources from the H-NMR and AMS datasets, showing a pronounced seasonality in their relative contributions to total OA mass. Winter–spring aerosol is dominated by long-range transport of Eurasian anthropogenic pollution (up to 70 %), while summer is characterized by biogenic aerosols from marine sources (up to 44 %), including sulfur compounds, amines, and fatty acids. Occasional summertime high OA loadings are associated with wildfire aerosols enriched in levoglucosan and humic-like substances (HULIS; averagely 27 %–28 %). Eventually, about 28 %–40 % of the OA mass is attributed to an unresolved mixture of extremely oxidized compounds of difficult specific source attribution. This integrated approach provides valuable insights into the seasonal dynamics of OA sources in the Arctic.
- Article
(5436 KB) - Full-text XML
-
Supplement
(4906 KB) - BibTeX
- EndNote


Atmospheric aerosol exerts potentially significant yet uncertain effects on the climate system by modulating the radiative balance of the atmosphere and by altering the surface albedo of the cryosphere (IPCC, 2021). Investigating aerosol–climate interactions in the Arctic regions is of paramount importance, given the faster-than-global warming rate of this area, known as Arctic amplification, the multiple atmosphere–ocean–cryosphere feedbacks involved, and the proximity to strong pollution sources in the Northern Hemisphere mid-latitudes (Serreze and Barry, 2011; Schmale et al., 2021).
Organic aerosol (OA) is one of the most abundant fraction of fine aerosol mass globally and also in the Arctic. However, in spite of its fundamental role in modulating climate-relevant properties of airborne particles, OA chemical composition and sources are still poorly understood in the polar regions, mainly due to the measurement difficulties in harsh environments and the consequent scarcity of long-term observational datasets with sufficient chemical detail (Schmale et al., 2021; AMAP Assessment, 2021).
Long-range atmospheric transport (LRT) of air masses from lower latitudes is recognized as an important driver of the Arctic aerosol burden, since local emissions of submicron particles are relatively much smaller (e.g., Quinn et al., 2007). However, monitoring at Arctic observatories spanning 30 years has shown that the contribution of LRT to Arctic aerosol concentrations is consistently decreasing, as a consequence of reduced emissions in the mid-latitudes (Collaud Coen et al., 2020; AMAP Assessment, 2021; Schmale et al., 2022). In turn, local pollution from resource extraction and shipping (e.g., Peters et al., 2011; Pizzolato et al., 2016) as well as, most importantly, natural aerosol sources may become increasingly significant in the future. For instance, wildfires (WFs) increased (McCarty et al., 2021), as well as sea-salt aerosol (SSA) (Heslin-Rees et al., 2020) and eolian mineral dust (MD) linked to glacial retreat (Groot Zwaaftink et al., 2016). Additionally, primary biological aerosol particles (PBAPs) are expected to increase due to permafrost thawing and Arctic greening (Myers-Smith et al., 2020), which may also enhance the emission of biogenic volatile organic compounds, leading to higher levels of biogenic secondary organic aerosol (BSOA) (Hallquist et al., 2009). These shifts in sources could further modify the physicochemical properties of Arctic aerosols and consequently their climate impact.
Gaining insights into changes in Arctic aerosol emissions and formation, as well as variations in LRT, and aerosol chemical composition is essential for assessing their effects on climate and the changing Arctic environment. In this regard, long-term observations are becoming increasingly fundamental.
The lack of systematic observations of OA composition is among the critical knowledge gaps in aerosol monitoring in the Arctic (AMAP Assessment, 2021). The available studies (Nielsen et al., 2019; Frossard et al., 2011; Chang et al., 2011; Leaitch et al., 2018) are single-site, short-term or campaign-based, and too infrequent to reveal seasonal patterns in the main sources of Arctic OAs. Hence, Arctic aerosol source apportionment studies typically do not consider OAs (Polissar et al., 1998; Nguyen et al., 2013) or are limited to a few primary markers (for example, levoglucosan from biomass burning or elemental carbon – EC) or again focus on radiocarbon measurements (Winiger et al., 2019; Rodriguez et al., 2020). Therefore, current efforts have so far been unable to provide an understanding of the sources and formation pathways of the pan-Arctic OAs in different seasons.
While organic carbon (OC) has been continuously monitored in Alert (Canada) since 2006 and in Ny-Ålesund (Svalbard) since 2011 (AMAP Assessment, 2021), information on low-molecular-weight organic acids was first obtained during a nearly 2-year-long study at Sevettjärvi in the lower Arctic (Finland) (Ricard et al., 2002). Later studies in Ny-Ålesund have focused on levoglucosan, sugars, methanesulfonate (MSA), and biogenic secondary organic aerosols (BSOA) tracers (Yttri et al., 2014, 2024; Karl et al., 2019; Becagli et al., 2019; Gramlich et al., 2024), whereas Moschos et al. (2022) presented the most comprehensive study on Arctic OA based on aerosol mass spectrometry (AMS) to date, with up to 3 years of data from eight Arctic sites.
In particular, Moschos et al. (2022) quantified the sources of Arctic organic aerosol (OA) by analyzing its water-soluble fraction using aerosol mass spectrometry (AMS) on samples collected across the Arctic, followed by the application of positive matrix factorization (PMF). Their study identified six aerosol factors, three primarily linked to anthropogenic sources (namely, Arctic haze, primary organic aerosol, and oxygenated organic aerosol) and three associated with natural emissions (primary biological organic aerosol, methanesulfonic-acid-related organic aerosol, and biogenic secondary organic aerosol). These factors displayed distinct seasonal patterns, with the anthropogenic sources prevailing in winter, while those of natural origin are more prominent in summer.
While this offline AMS approach provides chemical fingerprints of water-soluble organic aerosol (WSOA), it only detects fragments of the original molecules because of the hard ionization pathways in the instrument. Proton nuclear magnetic resonance spectroscopy (H-NMR) offers information on the organics functional groups, complementary to the mass spectral fingerprints from the AMS. Compared to AMS, H-NMR spectroscopy exhibits inferior selectivity to organic compounds oxidation state, while it provides a better split between aromatic and aliphatic groups and retains source-specific information in the distribution of aliphatic H-NMR resonances (Decesari et al., 2024). The availability of more complete spectral databases for atmospherically relevant compounds and the employment of factor analysis techniques have greatly improved the potential of this technique for organic source apportionment. Most importantly, modern H-NMR techniques have achieved substantial gain in sensitivity with respect to the first atmospheric studies, enabling application to aerosol characterization in remote environments (Tagliavini et al., 2024). Recent exemplar investigations in Antarctica have focused on primary and secondary natural sources (Decesari et al., 2020; Paglione et al., 2024). Here, we present the first year-long investigation combining AMS, H-NMR, ion chromatography (IC), and organic and elemental carbon (OC and EC, respectively) measurements to characterize OA in the high Arctic. Conducted at the Gruvebadet Laboratory in Ny-Ålesund, Svalbard, this study provides seasonal insights into anthropogenic and biogenic contributions to Arctic OA.
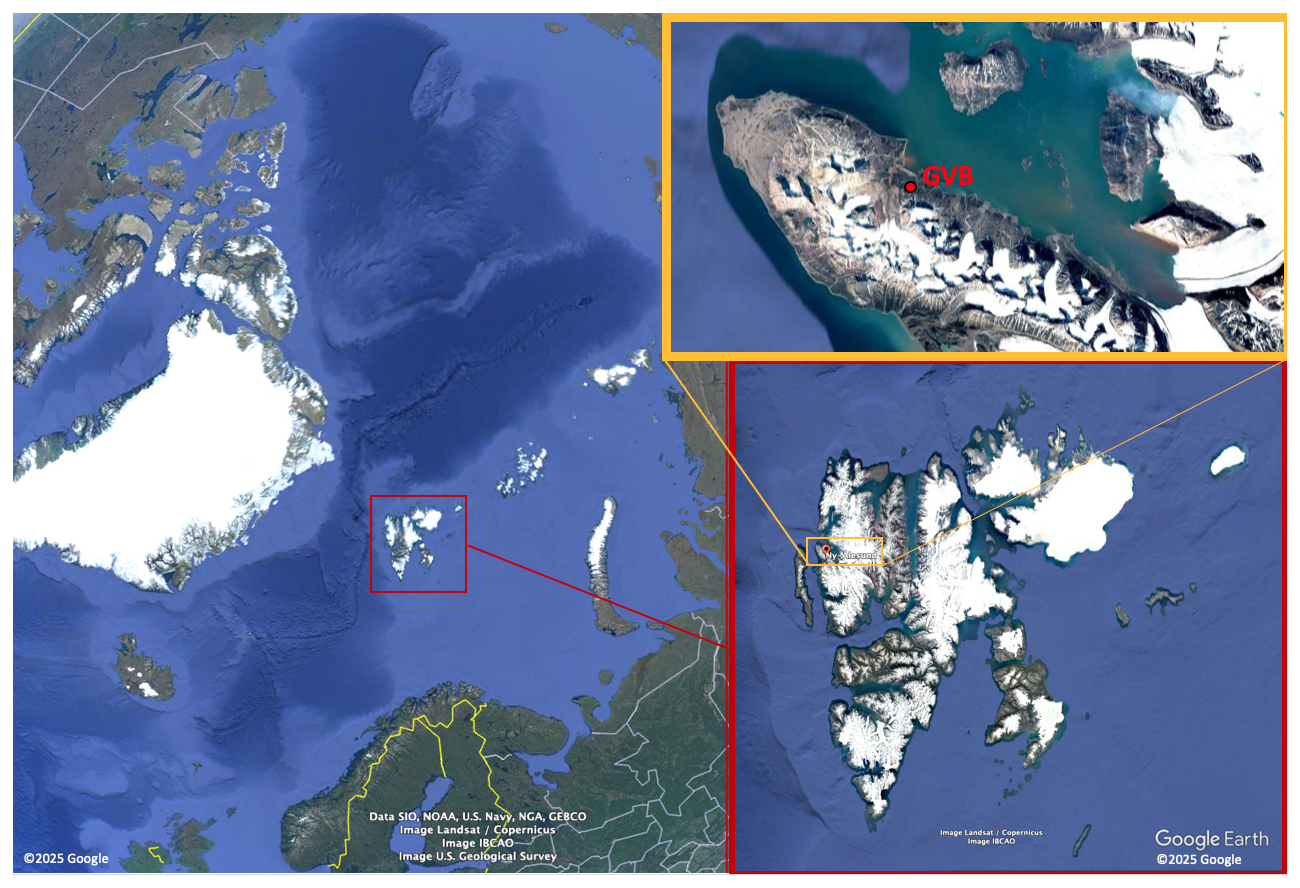
Figure 1Maps of the study area.
2.1 Measurement field campaign
The measurements reported here were done in the framework of the Joint Research Center ENI-CNR–Aldo Pontremoli, within the ENI-CNR Joint Research Agreement (Donateo et al., 2023) and of the NASCENT (Ny-Ålesund Aerosol Cloud Experiment, Pasquier et al., 2022) study in the period May 2019–June 2020 (Fig. S1 in the Supplement), exploiting the facilities of the Ny-Ålesund Research Station in Svalbard (Norway). More specifically, the sampling took place at the Gruvebadet Laboratory (GVB), located southwest of the village of Ny-Ålesund (78°55′ N, 11°56′ E; Fig. 1).
A high-volume sampler (TECORA ECHO HiVol, equipped with Digitel PM1 sampling inlet) collected ambient aerosol particles with aerodynamic diameter (Dp)<1 µm on pre-washed (with 250 mL of ultrapure Milli-Q water) and pre-baked (1 h at 800 °C) quartz fiber filters, at a controlled flow of 500 L min−1. The sampler was located at GVB, and the sampling head was at about 4 m above the ground, easily accessible on the roof of the building. Due to the necessity of collecting sufficient aerosol loading for the detailed chemical analyses on the filters, the sampling time was of the order of about 4 d (84 ± 9 h, on average ± standard deviation) for each sample. A total of 87 PM1 samples and 5 field blanks (same quartz-fiber filters mounted on the sampler but not sampled) were collected through the study period. After sampling, the filters were stored in a freezer and then shipped in thermal insulated boxes to the CNR-ISAC laboratory in Bologna, Italy, where they were kept frozen at about −20 °C until extraction and chemical analyses. About half of each filter was used for the offline characterization of water-soluble organic carbon (WSOC) by total organic carbon (TOC) analyzer, ion chromatography, and H-NMR (as described below) measurements performed in Bologna, while a quarter was shipped to PSI Laboratories in Zurich, Switzerland, for AMS measurements and carbonaceous content quantifications (both WSOC by TOC analyzer and EC/OC on filters by Sunset, as detailed below).
2.2 Aerosol offline chemical characterization
To determine organic carbon (OC) and elemental carbon (EC), the Thermo-Optical Transmittance (TOT) method was employed using a Lab OC-EC Aerosol Analyzer (Model 5L, Sunset Laboratory Inc., USA) following the EUSAAR2 protocol. Quartz filter samples were subjected to controlled heating according to the EUSAAR2 thermal protocol: initially, they were heated up to 650 °C in an inert helium (He) atmosphere to evolve OC. Subsequently, they were heated to 850 °C in a mixture of 2 % oxygen in He, where EC was oxidized. The continuous monitoring of the sample's transmittance during the heating process allowed the application of charring correction, as detailed in Popovicheva et al. (2024). The method's limit of detection (LOD) was 0.02 µg m−3 of carbon. To ensure consistency, field and laboratory blanks were processed using the same procedures. The expanded uncertainties for the analysis were calculated to be 15 % for OC and 23 % for EC.
The aerosol filter samples were extracted with deionized ultrapure (Milli-Q) water using a mechanical shaker for 1 h. In order to remove suspended materials, the water extracts were filtered on PTFE membranes (pore size: 0.45 µm). Extracts were analyzed by means of a TOC thermal combustion analyzer (Shimadzu TOC-5000A) for the quantification of WSOC content.
Ion chromatography was applied to the extracts for the quantification of the main water-soluble inorganic ions (sodium, Na+; chloride, Cl−; nitrate, NO; sulfate, SO; ammonium, NH; potassium, K+; magnesium, Mg2+; calcium, Ca2+), some organic acids (acetate, ace; formate, for; methanesulfonate, MSA; oxalate, oxa) (Sandrini et al., 2016), and low-molecular-weight alkyl amines (methyl-, ethyl-, dimethyl-, diethyl-, and trimethylamine, MA, EA, DMA, DEA, and TMA, respectively) (Facchini et al., 2008a). An IonPac CS16 3 × 250 mm Dionex separation column with gradient MSA elution and an IonPac AS11 2 × 250 mm Dionex separation column with gradient KOH elution were deployed for cations and anions, respectively. Sea-salt and non-sea-salt fractions of the main inorganic ions measured by IC (ss-x and nss-x, respectively) were quantified based on the global average sea-salt composition found in Seinfeld and Pandis (2016) using Na+ as the sea-salt tracer. All the data are available in the IADC data repository (https://doi.org/10.71761/0e110925-1f3d-4013-b048-e5a47ca3be6f, Paglione, 2025). Field blanks were collected and all the sample concentrations were corrected for the blanks. Detection limits (LODs, blanks' average concentrations standard deviation of blanks' filter concentrations) of each species are reported in Table S1 in the Supplement.
2.2.1 H-NMR analysis of the samples
Following well-established procedures (Decesari et al., 2000), aliquots of the aerosol water extracts were dried under vacuum and re-dissolved in deuterium oxide (D2O) for the H-NMR spectroscopy (hereinafter also referred as NMR) characterization of organic functional group. In order to allow the quantification of the spectral signals, sodium 3-trimethylsilyl- (2,2,3,3-d4) propionate (TSP-d4) was used as an internal standard by adding 50 µL of a 0.05 % TSP-d4 (by weight) in D2O to the sample in the tube. To avoid the shifting of pH-sensitive signals, the extracts were buffered to pH ∼3 using a deuterated formate/formic acid (DCOO HCOOH) buffer prior to the analysis. The H-NMR spectra were then acquired at 600 MHz in a 5 mm tube using a Varian Unity INOVA spectrometer, at the NMR facility of the Department of Industrial Chemistry of the Bologna University. H-NMR spectroscopy in protic solvents provides the speciation of hydrogen atoms bound to carbon atoms. On the basis of the range of frequency shifts, the signals were attributed to H–C-containing specific functionalities (Decesari et al., 2000, 2007). A comprehensive list and description of the functional groups, molecular species, and categories of compounds identified by H-NMR spectra analysis in this study is reported in Table S2. Briefly, the main functional groups identified included unfunctionalized alkyls (H–C), i.e., methyls (CH3), methylenes (CH2), and methynes (CH) groups of unsubstituted aliphatic chains (i.e., also later named “aliphatic chains”, chemical shift range 0.5–1.8 ppm); aliphatic protons adjacent to unsaturated/substituted groups (benzyls and acyls: H–C–C=) and/or heteroatoms (amines, sulfonates: H–C–X, with X≠O), like alkenes (allylic protons), carbonyl or imino groups (heteroallylic protons), or aromatic rings (benzylic protons) (i.e., also later named “polysubstituted aliphatic chains”, chemical shift range 1.8–3.2 ppm); aliphatic hydroxyl/alcoxy groups (H–C–O), typical of a variety of possible compounds, like aliphatic alcohols, polyols, saccharides, ethers, and esters (i.e., also abbreviated later as “Sug-Alc-Eth-Est”, chemical shift range 3.2–4.5 ppm); anomeric and vinyl groups (O–CH–O, chemical shift range 5–6.5 ppm), from not completely oxidized isoprene and terpenes derivatives, from products of aromatic-rings opening (e.g., maleic acid), or from sugars/anhydrosugars derivatives (glucose, sucrose, levoglucosan, glucuronic acid, etc.); and finally aromatic functionalities (Ar-H, also abbreviated later as “Arom”, chemical shift range 6.5–9 ppm). Organic hydrogen concentrations directly measured by H-NMR were converted to organic carbon using stoichiometric H/C ratios specifically assigned to functional groups using the same rationale described in previous works (Paglione et al., 2024). Although the sum of NMR functional group concentrations approached total WSOC in many samples, the non-characterized fraction using the typical H/C ratios was significant (on average 30 %, Fig. S2). Possible reasons for the “unresolved carbon” are (1) volatile/semi-volatile losses during the evaporation of the extract prior to the preparation of the NMR tube; (2) the presence of carbon atoms not protonated, thus not detectable to H-NMR, like oxalates or such as compounds containing substituted quaternary carbon atoms or fully substituted aryls (Moretti et al., 2008); and (3) the uncorrected estimations of stoichiometric H : C ratios used for the conversion of directed measured organic hydrogens into organic carbon. Considering reasons (2) and (3) to be the most relevant (meaning that the lower recovery mainly reflected a certain abundance of organic moieties not carrying H–C bonds), we recalculated the H-NMR total WSOC by applying a H/C conversion ratio of 1 to the “polysubstituted aliphatic chains” to account for carbon in aliphatic carbonyl/carboxyl groups under the assumption that every carbon atom in acyls (H-C-C=) is adjacent to a carbonyl/carboxyl carbon (hence H–C–C=O) (as in Decesari et al., 2007). In this way the recovery of H-NMR analysis approaches the closure with the TOC-analyzer-derived concentration of WSOC (slope =1.01; Fig. S2), indicating that carbonyl/carboxylic groups can account for a large fraction of the carbon atoms unbound to hydrogen atoms in these samples.
Some organic tracers were identified in the H-NMR spectra on the basis of their characteristic patterns of resonances and chemical shifts, using for this scope libraries of reference spectra from the literature (of standard single compounds and/or mixtures from laboratory/chamber experiments and/or from ambient field studies at near-source stations). The identification was confirmed by means of NMR chemical shift elaboration software leveraging extensive libraries of biogenic compounds, such as the Chenomx NMR suite (Chenomx inc., evaluation version 9.0), or based on simulated H-NMR spectra of atmospherically relevant molecules, such as ACD/Labs (Advanced Chemistry Developments Inc., version 12.01). Among such tracers, methanesulfonic acid (MSA, singlet at 2.80 ppm) and low-molecular-weight alkyl amines (namely, di- and trimethyl amines, DMA and TMA respectively, at 2.72 and 2.89 ppm) were quantified. Speciation and quantification of these tracers by H-NMR were validated by comparison with the IC measurements, showing excellent agreement between the two techniques for MSA and a reasonable correlation for TMA and total amines (Fig. S3). The quantification of amines was challenging anyway, due to the very low concentrations (especially for IC) and because of possible overlapping signals from other compounds present at similar concentrations in NMR spectra. Other tracers quantified by H-NMR were levoglucosan and hydroxy-methanesulfonate (HMS), with their unequivocal signals at 5.45 and 4.39 ppm, respectively (Suzuki et al., 2001; Paglione et al, 2014b) (Fig. S4). Additional tracers (such as sucrose, glucose, glycerol) were identified but not quantified because of possible overlaps and interference.
2.2.2 AMS measurements and data analysis
The offline AMS technique established by Daellenbach et al. (2016) was used here. Briefly, punches from the quartz fiber filter samples were extracted in ultrapure water (18.2 MΩ cm, total organic carbon <3 ppb by weight) and inserted into an ultrasonic bath for 20 min at 30 °C. Typical organic concentrations of the quartz-fiber-filtered water extracts were 2–3 µg C mL−1. Each sonicated extract was then filtered through a syringe filter made of a nylon membrane (0.45 µm; Infochroma AG) and transferred to a “Greiner” sample tube (50 mL). For a better quantification of the aerosol species, each extract was spiked with a known quantity (6 ppm) of isotopic labeled internal standard of ammonium nitrate (NH415NO3). From the obtained solutions, aerosols were generated in synthetic air (80 % volume N2, 20 % volume O2; Carbagas) via an Apex Q nebulizer (Elemental Scientific, Inc.) operated at 60 °C, dried by a Nafion dryer and directed into a long-time-of-flight AMS. Each sample was recorded for ca. 210 s, with a collection time for each spectrum of ∼33 s. Ultrapure water was measured with the same modality before each sample measurement to assess the instrumental background during the analysis of the corresponding sample.
For the data analysis, we used Squirrel v1.57I for the calibration and baseline subtraction and Pika v1.16I for high-resolution (HR) analysis, in the Igor Pro software package 6.37. The HR peak fitting was performed in the range 12–210. After the peak fitting, the atmospheric concentration of each ion was calculated by normalizing to the known 15N concentration in the sample (from the labeled internal standard) and considering the appropriated relative ionization efficiency (RIE), the extraction volume, and portion of the filter that was extracted for analysis. The average water-blank signal was subtracted from the average signal of the following sample, and, eventually, all the obtained concentrations were corrected by the average concentrations obtained analyzing the field blanks. Elemental ratios were calculated using the Improved Ambient approach (Canagaratna et al., 2015) from the blank-corrected mass spectra (Fig. S5).
2.2.3 Water-soluble and water-insoluble organic matter
Using the WSOC and OC measured by elemental analysis (Sect. 2.2) and the organic matter-to-organic carbon (OM : OC) ratio provided by the HR-ToF-AMS (Sect. 2.2.2), the following aerosol components have been defined:
-
water-soluble organic matter (WSOM) = WSOC × (OM : OC)AMS
-
water-insoluble organic matter (WIOM) = (OC − WSOC) ×1.4 (Rinaldi et al., 2013)
-
organic matter (OM) = WSOM + WIOM.
2.3 Auxiliary measurements
Additional offline analyses and online measurements were carried out and used to corroborate and validate the AMS and H-NMR measurements and source apportionments.
Organic markers were determined in parallel samples collected by an Andersen multi-stage impactor managed by CNR-ISP (Institute of Polar Sciences) every 6–10 d from 16 June 2019 to 2 January 2020. Polyols and sugars (Barbaro et al., 2015a) and inorganic ions and organic acids (methanesulfonic acid and C2-C7 carboxylic acids) (Barbaro et al., 2017; Feltracco et al., 2021) were determined using ion chromatography coupled with mass spectrometry, while free amino acids (FAAs) (Barbaro et al., 2015b), phenolic compounds (PCs) (Zangrando et al., 2016), and photo-oxidation products of α-pinene (Feltracco et al., 2018) were measured by high-performance liquid chromatography (HPLC) coupled with a triple quadrupole mass spectrometer.
Evaluations of equivalent black carbon (eBC) were obtained at Gruvebadet through continuous online measurements carried out by means of a particulate soot absorption photometer (PSAP) (Gilardoni et al., 2020, 2023).
2.4 Source region classification
The concentration-weighted trajectory (CWT) method is used to assess the potential impacts of long-range aerosol transport (Mansour et al., 2022; Rinaldi et al., 2021). It combines the residence time of air masses (trajectory points) over geographic areas with particle concentrations measured at a specific receptor site. In this study, the CWT was applied to identify the most likely source regions contributing to OA components detected using HR-AMS and H-NMR at Ny-Ålesund. Backward air mass trajectories reaching 100 m above ground level were calculated using the NOAA HYSPLIT4 (https://ready.arl.noaa.gov/, last access: 5 August 2022) model (Rolph et al., 2017; Stein et al., 2015). Despite the general uncertainties of the back trajectories in the Arctic due to the lack of meteorological measurements to constrain the model (e.g., Harris et al., 2005; Kahl, 1993), this approach is widely used in supporting identification of the source area of the different aerosol components measured at a receptor site. The trajectory calculations were driven by meteorological data from the archived Global Data Assimilation System (GDAS1; 1°×1°) of the National Centers for Environmental Prediction (NCEP (ftp://arlftp.arlhq.noaa.gov/pub/archives/gdas1, last access: 1 August 2022). The trajectories were traced back over 10 d, with points recorded at 1 h intervals along each track. Air mass arrival frequency was set to every 6 h (four trajectories per day) throughout the sampling period from May 2019 to June 2020. For each filter sample, the tracks spanning the sampling time from start to end represent the pathways of incoming air masses. A detailed description of the applied equation and calculation protocols can be found in Rinaldi et al. (2021).
2.5 Factor analysis of AMS and H-NMR spectra
In order to better investigate the variability of OA composition and to apportion its sources, we exploit non-negative factor analysis applied separately to the series of AMS and NMR spectra of the WSOM, and we then compared the results for better interpretation and chemical characterization of the resulting factors as organic aerosol sources.
In particular we applied positive matrix factorization (PMF; Paatero et al., 1994) to both the collections of NMR and AMS spectra using the ME-2 solver (Paatero et al., 1999) implemented within the Source Finder toolkit (SoFi pro version 8.6, Datalystica Ltd) for Igor Pro (WaveMetrics, Inc) (Canonaco et al., 2013). The aim of PMF is to derive a linear combination of components (factors) that can reproduce the observed chemical composition and variations in time of the samples (Zhang et al., 2011). PMF was applied to NMR and AMS datasets separately, following the method already described in previous publications (Paglione et al., 2014a, b, 2024 for NMR; Daellenbach et al., 2016, 2017; Bozzetti et al., 2017a, b; Casotto et al., 2023; Moschos et al., 2022, for AMS offline). Briefly, about NMR, the original spectra were subjected to several preprocessing steps in order to remove spurious sources of variability before the statistical analysis. Baseline subtraction based on a polynomial fit was applied to each spectrum. Careful horizontal alignment of the spectra was performed using the Tsp-d4 and buffer singlets as reference positions (at 0.00 and 8.45 ppm, respectively). The spectral regions containing only noise or sparse signals of solvent/buffer (H<0.5 ppm; ppm; and ppm) were removed. The five NMR spectra of the blanks were averaged together, and the corresponding mean blank spectrum was subtracted to all the sample spectra. Binning over 0.02 ppm of chemical shift intervals was applied to remove the possible variability of peak position produced by matrix effects. Low-resolution spectra (∼400 points) were finally obtained and processed by PMF. The error input matrix required by PMF was derived from the signal-to-noise ratios of the NMR spectra (as already described in previous publications, Paglione et al., 2014a, b, 2024), calculated for each sample as 7 times the standard deviation of the signal intensity in a portion of the spectrum containing only noise/baseline values (between 6.5 and 7 ppm). Solutions with up to eight factors were explored.
About AMS, the input matrixes for organic aerosol source apportionment were prepared by eliminating all the isotope ions and the inorganic fragments from the quantified ions. The error matrix was prepared following the error propagation approach by Daellenbach et al. (2016). The average signal-to-noise ratio was >2.0 for 278 out of 389 (71 %) fitted organic fragment ions with up to 130 and for 180 out of 315 (57 %) for masses above 130.
A full examination of the PMF application (input preparation, uncertainty estimations, etc.) and outcomes (range of solutions investigated, procedure for choosing best solutions, analysis of the residuals, model error evaluation, interpretation of the results etc.) on both the NMR and AMS datasets is reported in the Supplement (Sect. S2, Figs. S5–S19, Table S3), while in Sect. 3.3 we focus on a four-factor and five-factor solution for AMS and NMR respectively, for which substantial agreement between the two approaches (i.e., AMS- and NMR-based factor analysis) was achieved. Interpretation of factors and their attribution to specific sources was based on an integrated approach including the comparison between spectral profiles and a unique library of reference spectra (recorded during laboratory studies or in the field at near-source stations, Paglione et al., 2014a, b; Decesari et al., 2020; Paglione et al., 2024), the correlation of factors contributions with available chemical tracers (i.e., sea salt and other inorganic ions, levoglucosan, eBC, sugars and polyols, free amino acids and organic acids, MSA and amines, reported in Tables S2 and Fig. S14), and the examination of back trajectories and of the concentration-weighted trajectories (CWT) maps of each factor indicating their potential source areas (further discussed below).
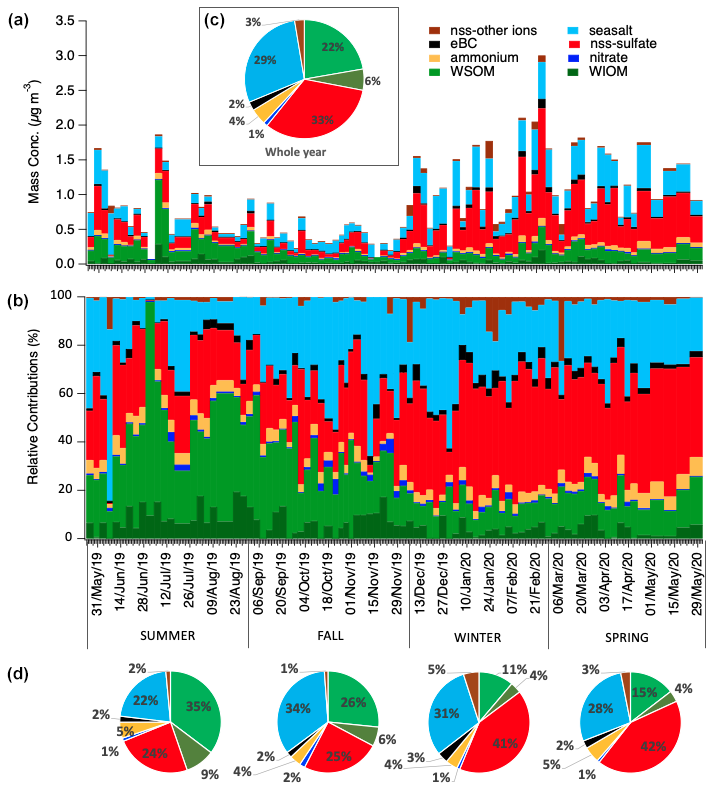
Figure 2PM1 loadings and chemical composition at Ny-Ålesund during the whole study period. Panels (a) and (b) show the respective mass concentrations and relative contribution of the different chemical species measured in each sample. Pie charts in panel (c) and (d) report the average relative contributions for the whole year and for the different seasons of the campaign.
The Results section is divided into three main parts as follows. In Sect. 3.1 we discuss the variability in the bulk aerosol composition at Ny-Ålesund and its possible drivers in 2019–2020. In Sect. 3.2 we focus on the AMS and NMR spectroscopic characterization of the organic fraction of the aerosol. Finally, in Sect. 3.3 we discuss the WSOA source apportionment results based on the PMF applied on the AMS and NMR spectral datasets.
3.1 Main PM1 chemical composition and seasonality
The chemical composition of PM1 aerosol at Ny-Ålesund during the period May 2019–June 2020 and its seasonality are summarized in Fig. 2 (where summer = June + July + August, fall = September + October + November, winter = December + January + February, and spring = March + April + May). Here PM1 total mass is considered the sum of the main water-soluble species measured by ion chromatography (sea salt, nss sulfate, nitrate, ammonium, and the sum of the other nss ions), the water-soluble and insoluble organic matter (namely WSOM and WIOM, calculated as described in Sect. 2.2.1), plus the eBC mass (obtained by averaging online PSAP measurements). On a yearly average, the atmospheric concentration of the PM1 aerosol was quite low (0.89 ± 0.56 µg m−3 average ± standard deviation, n=87) but showed a noticeable variability through the year (min =0.06 µg m−3 for the sample 29 June 2019, max =3.00 µg m−3 for the sample 22 February 2020). On a yearly average, the PM1 was mainly constituted of similar proportions of nss sulfate (representing 33±13 % of the total), sea salt (29 ± 13 %), and OM (28±16 %, of which 22 ± 14 % represented by WSOM), the rest being accounted for by much smaller contributions of ammonium (4 ± 2 %), nitrate (1 ± 1 %), eBC (2 ± 2 %), and other non-sea-salt ions (i.e., nss-K, nss-Mg, and nss-Ca, amounting to 3 ± 4 % in total). Nonetheless, concentrations and relative contributions of the main chemical constituents experienced large variations through the year, highlighting a marked seasonality for PM1 composition, as shown in Fig. 2.
During summer and early fall, OM reached its maximum both in absolute concentrations and in relative contributions to PM1 (0.35 ± 0.25 µg m−3, representing 44 ± 18 % on summer average, of which 35 ± 16 % was accounted by WSOM), while sea salt and nss sulfate touched their minima (22 ± 16 % and 24 ± 11 % of PM1 as summer averages, respectively). Conversely, winter and spring were dominated by nss sulfate (41 ± 10 % and 42 ± 8 % on winter and spring averages, respectively) and sea salt (31 ± 12 % and 28±8 % on winter and spring averages, respectively), while OM showed its minimum at the end of January (min =0.06 µg m−3 for the sample 29 June 2019, representing 6 % of total PM1).
The concentrations of eBC were generally very low at GVB but rose in late winter and early spring reaching a maximum of 0.14 µg m−3 at the end of February 2020 (see also AMAP Assessment, 2021). eBC and nss sulfate share a prevalent anthropogenic origin, and their late-winter/springtime increase is attributable to the Arctic haze phenomenon (Shaw, 1995), which consists of continental pollution transported over long distances (Eurasia) during the months of the year of enhanced atmospheric meridional circulation (Abbatt et al., 2019; Song et al., 2021). By contrast, the summer peak of organics must be influenced by sources active in the Arctic region, including the marine biogenic sources associated by the increased phytoplankton activity in ice-free waters in the absence of light limitation, and already discussed by Becagli et al. (2019). Anyway, it is noticeable that WSOM also represented a substantial fraction of the total submicron aerosol mass during wintertime, suggesting a variety of different sources impacting the site, which are the focus of further investigations reported in the next paragraphs.
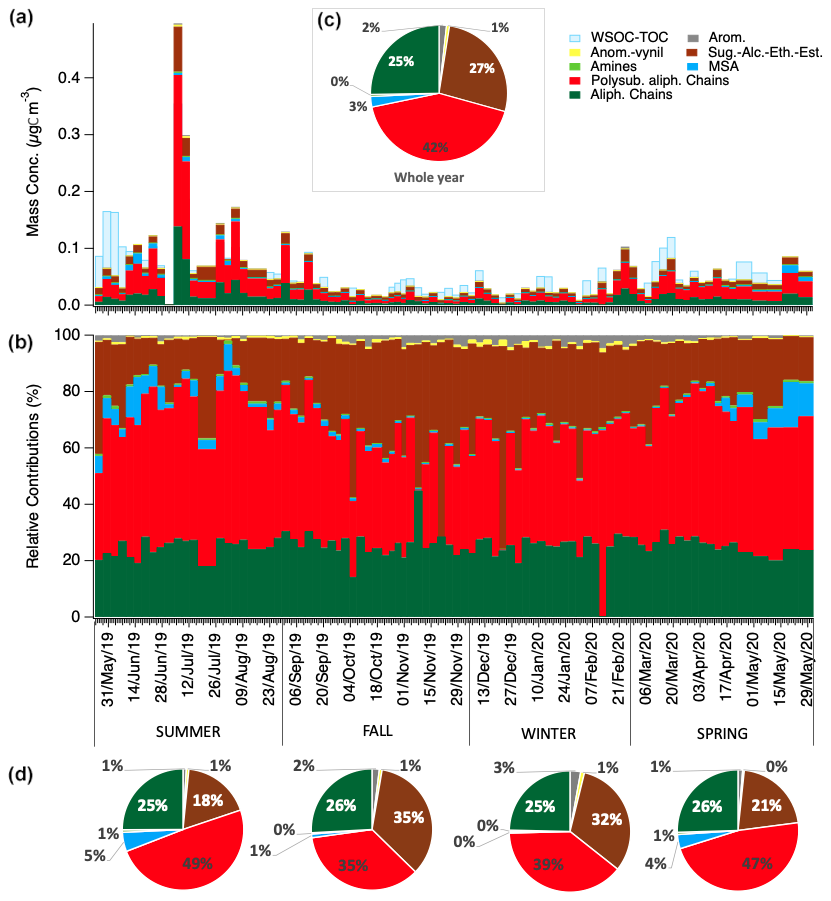
Figure 3Water-soluble OC concentrations and composition in term of H-NMR functional groups. Panel (a) and (b) show respectively the mass concentrations and the relative contributions of the different functional groups identified and quantified by H-NMR in each sample (expressed in µgC m−3). Pie charts in panel (c) and (d) show the average relative contributions for the whole year and for the different seasons of the campaign.
3.2 WSOA chemical characterization and seasonality
The complementary use of the AMS and NMR techniques allows a comprehensive chemical description of the water-soluble organic aerosol (WSOA). The comparison between the AMS/H-NMR reconstructed WSOC and the concentrations of WSOC derived from the TOC analyzer shows that both AMS and H-NMR analyses of WSOA were quantitative (slope of the regression line =0.99 and 1.01, for AMS and H-NMR respectively; Fig. S2).
The AMS offers quantitative chemical fingerprints of WSOA, including elemental ratios, while H-NMR provides detailed insights into functional groups in WSOA and identifies molecular markers. WSOA was highly oxygenated overall, with elemental ratios showing high yearly mean values (O : C of 0.94±0.12 and OM : OC of 2.39 ± 0.16). Furthermore, the bulk elemental composition of WSOA remained relatively constant throughout the year, except during early summer, when a reduced O : C ratio and an increased H : C ratio were observed (Fig. S5). Nevertheless, the composition of WSOA varied substantially over the year, as indicated by NMR analyses. Both the concentrations of molecular markers and the distribution of functional groups in WSOA exhibited substantial seasonal changes (Figs. 3 and S4). MSA and alkyl amines exhibited maximum concentrations during late-spring and summer months and very small concentrations during the rest of the year (Fig. S4). The season of high amines and MSA, approximately between April and August/September, corresponds to the season of high biological activity in the Fram Strait and Norwegian and Barents seas. By contrast, HMS concentrations were more evenly distributed through the year, even though there was a relative increase during spring. HMS, formed by the aqueous-phase reactions between formaldehyde and the sulfur dioxide, is considered a tracer of cloud/aqueous-phase processing of anthropogenic emissions (Moch et al., 2020; Liu et al., 2021), which seems to be a relevant OA source/mechanism of formation during the whole year at the study site (Fig. S4). Finally, levoglucosan showed variable concentrations, with a maximum in February possibly associated with residential heating emissions from the Eurasia and long-range transport in the Arctic haze (Gramlich et al., 2024) and very small concentrations during the rest of the year but with sporadic peak concentrations in the summer (Fig. S4). Such summer peaks can be associated with boreal forest wildfires (Bhattarai et al., 2019), as we will further discuss later.
The H-NMR functional groups distribution also had variable contributions among the different seasons. Specifically, colder seasons were enriched in alcoxy (H–C–O) groups (39 %–42 % in winter and fall respectively, compared to 24 %–28 % during summer and spring). These H-NMR features have been previously associated with the abundance of primary emitted components such as sugars and polyols (e.g., glucose, sucrose, glycerol) (Facchini et al., 2008b; Liu et al., 2018; Decesari et al., 2020) and anhydrosugars, suggesting a higher influence of primary emission processes (with an unclear split between natural and anthropogenic sources) during the cold months. Between winter and the beginning of spring, during the Arctic haze season, the aromatic groups – although remaining a small component of the overall composition – reached a maximum, indicating an anthropogenic input. Conversely, the warm season was characterized by increasing contributions of unsaturated/branched aliphatic chains (H–C–C=), MSA, and alkyl amines, which are considered mostly secondary (Facchini et al., 2008a; Dall'Osto et al., 2019), indicating an increasing contribution of photochemical sources of oxidized organic aerosols.
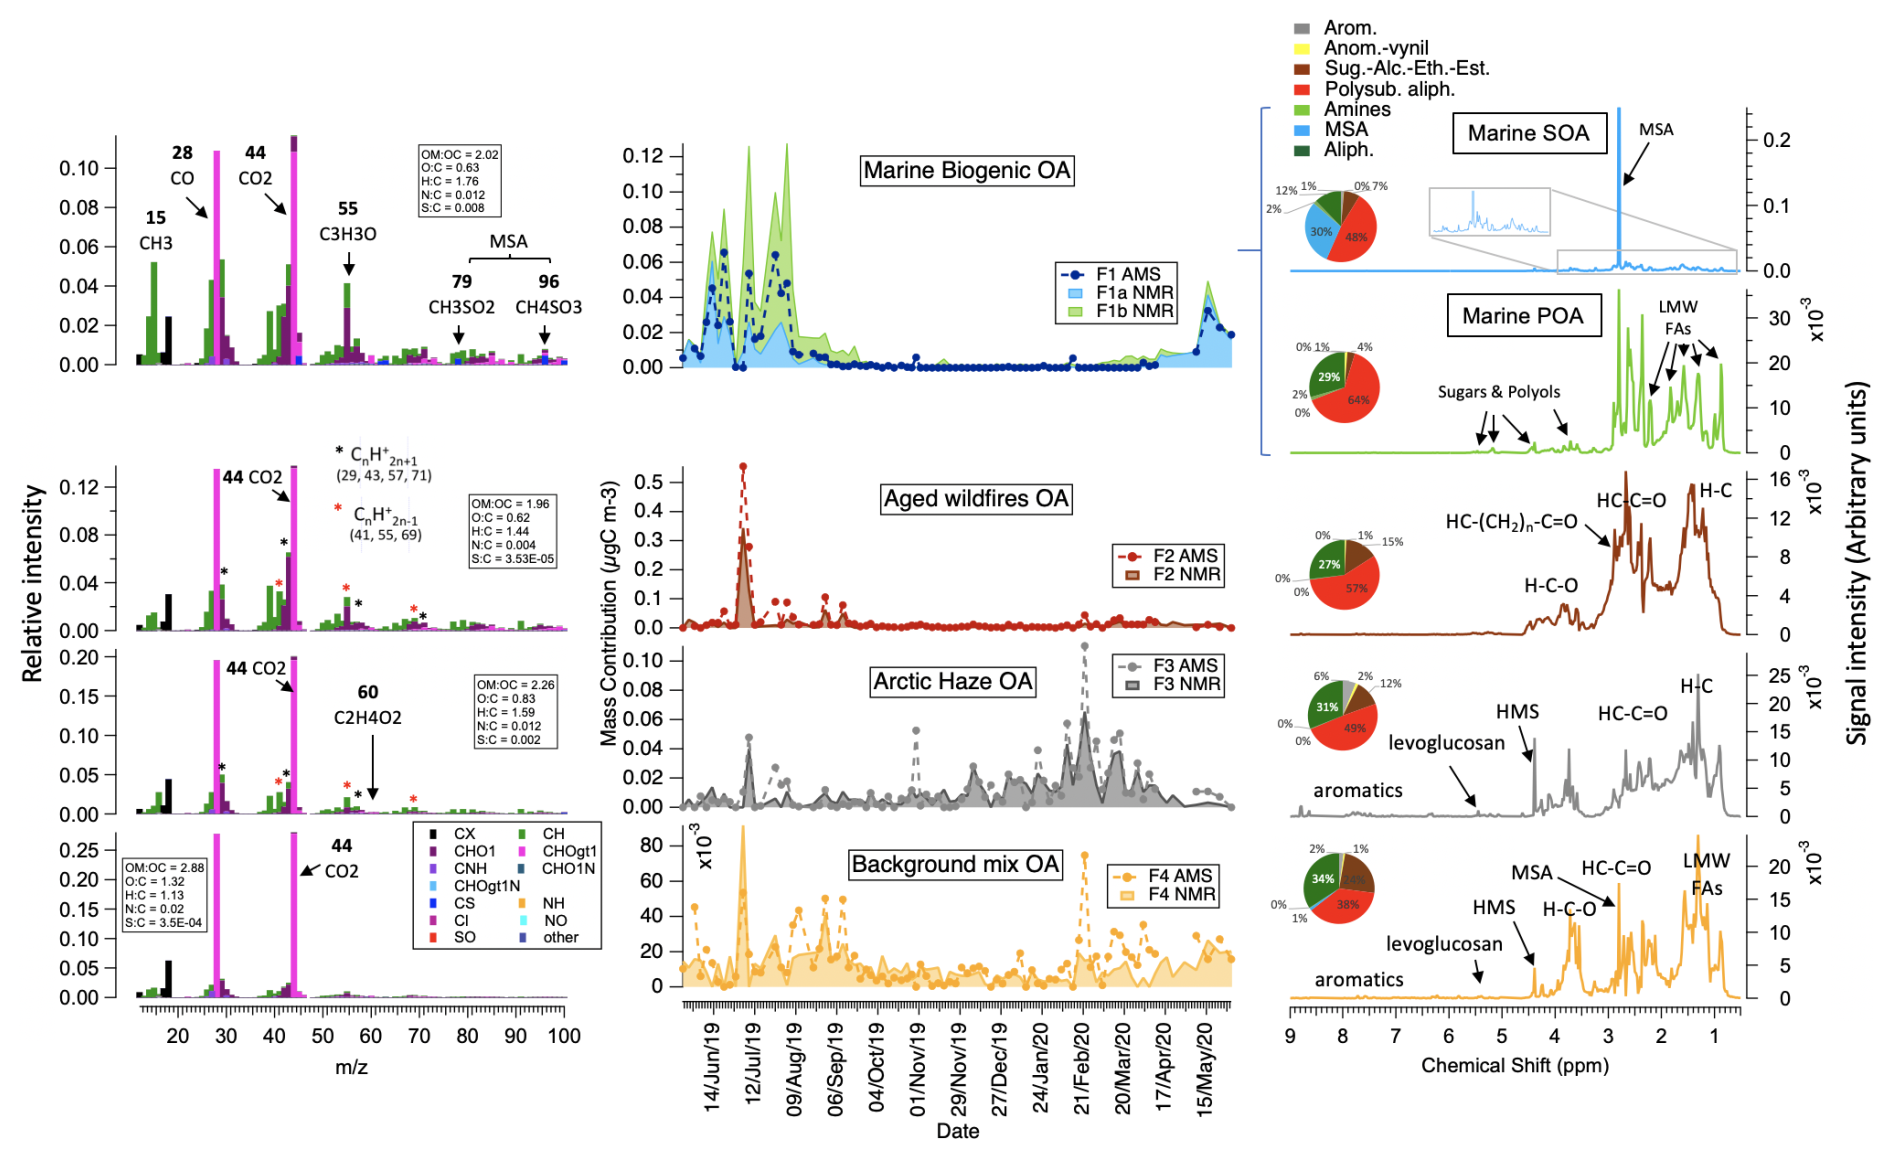
Figure 4HR-AMS (left side) and H-NMR (right side) factors spectral profiles and contributions (center) resulting by PMF analysis of the Ny-Ålesund 2019–2020 dataset. On the left side, AMS HR mass spectral profiles are shown as normalized fragment intensities (with average atomic ratios in the boxes), where the fragments are color-coded with the families (in the legend); some specific fragments are highlighted as representative of individual or groups of tracer compounds (such as CH3SO2 and CH4SO3 for MSA, methane-sulfonate, or C2H4O2 for levoglucosan and anhydrosugars, CnHn+1 and CnHn−1 for hydrocarbons). In the center, contributions time series of NMR F1a and F1b are stacked one on top of the other. On the right side, H-NMR peaks of individual compounds (MSA, methanesulfonate; HMS, hydroxy-methanesulfonate; levoglucosan) are specified in the profiles, along with the band of functionalities and unresolved mixtures: LMW-FAs (low-molecular-weight fatty acids), sugars, and polyols indicating saccharides such as sucrose, glucose, and possibly ribose and C3-C6 polyols (e.g., glycerol, D-threitol, arabitol, galactitol). Pie charts report the H-NMR functional groups distribution of each factor.
3.3 WSOA source apportionment
The large inter-samples' (intra-annual) chemical variability of WSOA in Ny-Ålesund based on the AMS and H-NMR analyses allowed the discrimination of different factors that were interpreted as WSOA sources (4 for AMS, 5 for NMR; for details see Sect. S2, Figs. S6–S18). Figure 4 reports the chemical profiles and contributions of these WSOA sources, showing remarkable agreement between the techniques. The specific AMS and NMR WSOA sources were associated between each other based on the correlations of their contribution time series (also reported in Table S3). Identification of the individual WSOA sources was further supported by the correlation of their contributions with the time series of molecular tracers, as reported in Table S4 and Fig. S14. In Table S3 we also provide specific AMS mass fragments identified in our dataset as characteristic of specific factors (i.e., meaning that more than 60 % of their total measured mass is explained by a specific source factor), which were also identified in previous studies.
Marine biogenic OA (Factor 1 – F1) identified by AMS was moderately oxygenated (OM : OC =2.02, O : C =0.63, H : C =1.76) and was characterized by sulfur-containing fragments (CHxSOy) from methanesulfonic acid (MSA) fragmentation (Zorn et al., 2008; Chen et al., 2019). Specifically, marine OA explained a dominant fraction of the measured mass associated with many sulfur-containing ions such as CHS (44.98), CH2SO (61.98), CH3SO (62.99), CH2SO2 (77.98), CH3SO2 (78.98), and CH4SO3 (95.99). Other important fragment ions in the profile have been related to sea-spray emissions during phytoplankton blooms (CH3) and emissions from phytoplankton as well as kelp under heat stress (CH2O and CH3O) (Van Alstyne and Houser, 2003; Decesari et al., 2011; Faiola et al. 2015; Meador et al., 2017; Aguilera et al., 2022; Koteska et al., 2022; Saha and Fink, 2022). Consistently, marine OA reached maximum concentrations during summer, with peak marine biological productivity and correlated very well with the concentrations of MSA and methyl amines determined by ion chromatography (Pearson correlation coefficient R=0.84 and 0.64, respectively) supporting the marine biogenic origin.
The marine biogenic OA was further separated based on H-NMR data into a SOA and POA contribution (Factor 1a and 1b – F1a and F1b, respectively), the sum of which correlates/compares very well with the AMS marine OA (Fig. 4 and Table S3). Marine biogenic SOA (F1a) was dominated by MSA, with its specific singlet at 2.80 ppm of NMR chemical shift, and by low-molecular-weight methylamines, especially DMA, characterized by a singlet at 2.71 ppm. The predominance of these compounds and the correlation with the ion chromatography MSA (R=0.98) support a clear identification of marine biogenic secondary origin. Marine biogenic POA was characterized by a pattern of bands at 0.9, 1.3, 1.6, 1.8, 2.4, and 2.6 ppm of NMR chemical shift, corresponding to aliphatic methylenic chains with terminal methyl moieties and bound to a carbonyl/carboxyl group. Such chemical compounds share a linear aliphatic structure, with varying degrees of functionalization, and are attributable to degradation products of lipids including low-molecular-weight fatty acids (LMW-FAs) and mixtures of other alkanoic acids (e.g., sebacate, suberate, adipate, caprylate). These features are typical of primarily emitted submicron sea-spray particles, as shown via bubble bursting experiments of biologically productive North Atlantic Ocean and Southern Ocean seawater (Facchini et al., 2008b; Decesari et al., 2020; Paglione et al., 2024). However, with respect to previous studies identifying marine POA in ambient aerosols, the POA factor identified at Ny-Ålesund contained less methylenic long chains (in particular band at 1.3 ppm) and a higher degree of functionalization, pointing to a greater degree of oxidation/fragmentation of the low-molecular-weight fatty acids (Fig. S13). This was further reinforced by the good correlation between the contribution of marine biogenic POA and the concentrations of C3–C7 saturated dicarboxylic acids (Fig. S14). Nevertheless, the primary nature of this component was supported by the detection of saccharides (e.g., sucrose, glucose, and possibly ribose) and C3–C6 polyols (e.g., glycerol, D-threitol, arabitol, galactitol) (Figs. S11 and S12). In addition, marine biogenic POA correlated well with sugars (i.e., glucose, sucrose, xylose, ribose) from HPLC-MS analyses (Fig. S14). The impact of marine biogenic POA was also reflected in the AMS spectral fingerprint of marine OA with contributions of CxHyO1 (i.e., CHO at 29.003) and CxHyO>1 fragments (e.g., C2H4O2 at 60.021, usually associated with levoglucosan but actually common to many other possible sugars (High-Resolution AMS Spectral Database, http://cires.colorado.edu/jimenez-group/HRAMSsd/, last access: 17 January 2025, Ulbrich et al., 2009; Bozzetti et al., 2016; Hu et al., 2018). Marine biogenic POA contributed most during summer, similar to the marine biogenic SOA, but its peak concentrations were shifted toward late summer. This timing likely coincided with the annual sea-ice minimum and the decaying phase of the algal bloom, a period previously linked to enhanced emissions of sea-spray organics (Rinaldi et al., 2013; O'Dowd et al, 2015).
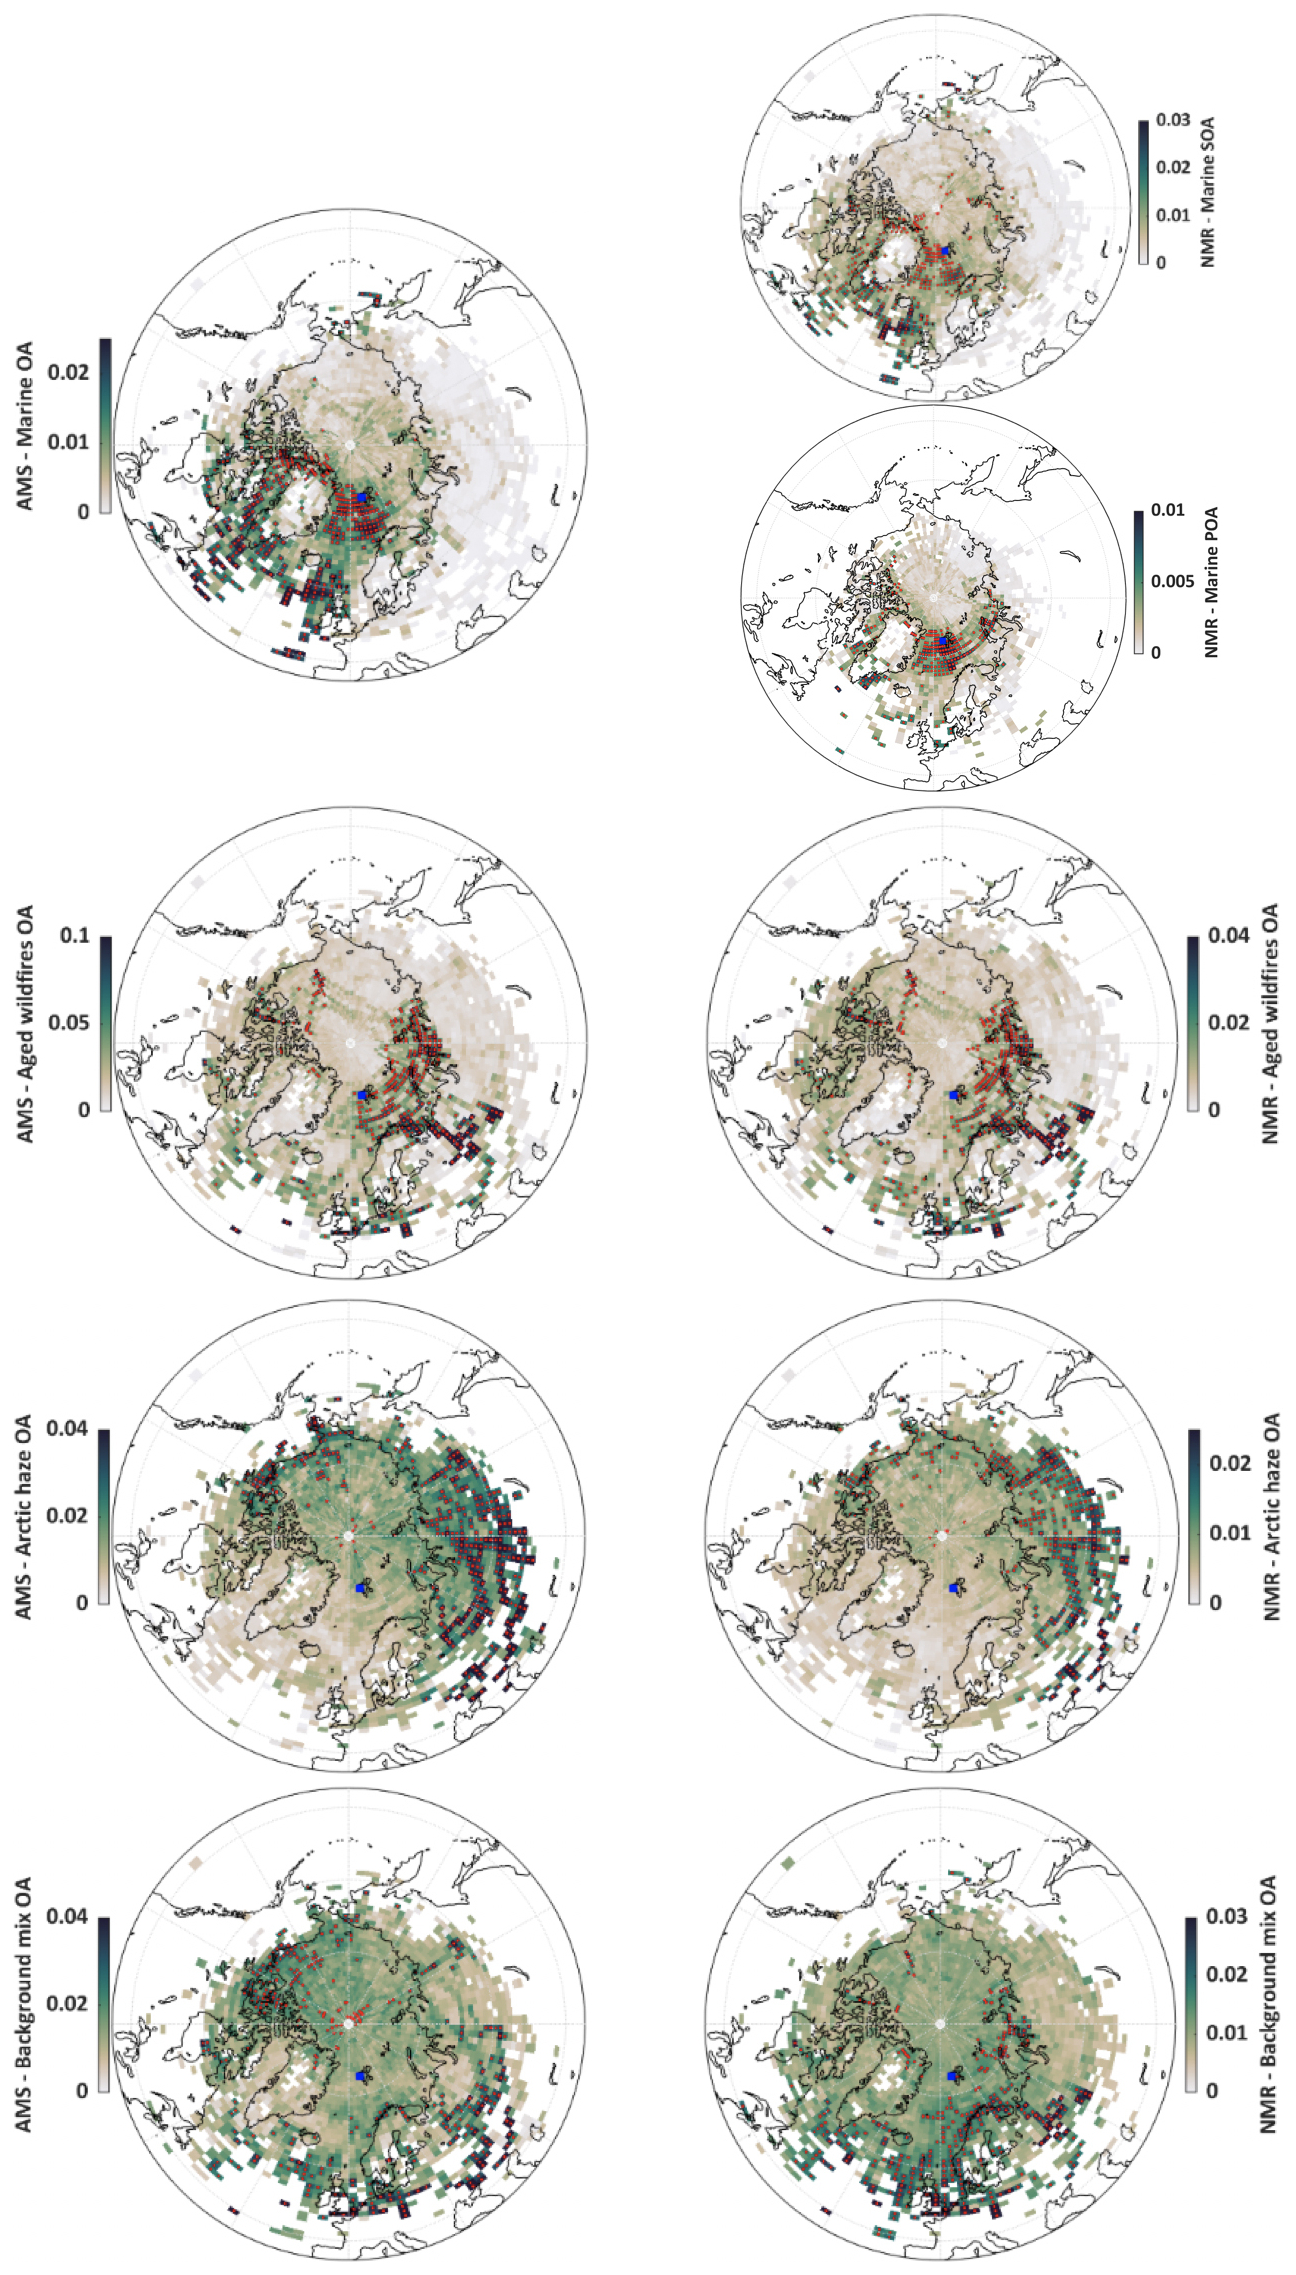
Figure 5CWT maps of the OA components identified by the factor analysis of HR-AMS (left side) and H-NMR (right side) spectra at the Ny-Ålesund sampling site (blue square in the maps). The colors show which air masses along the back trajectories have, on average, higher concentrations (expressed in µgC m−3), evidenced by darker colors. Red dots represent values at or above the 90th percentile, the most probable regions associated with high concentrations at the sampling site.
The CWT maps for marine OA, as well as for its sub-fractions marine biogenic POA and SOA (Fig. 5), support their marine origin. Similar CWT maps were found for marine OA and MSA in previous studies (Moschos et al., 2022; Pernov et al., 2024). H-NMR marine SOA and POA have slightly different source areas: marine SOA exhibits an origin over a broader area but with a hotspot in the North Atlantic region south of 65° N and close to the British Isles, an area already widely studied for its potential of marine SOA formation (O'Dowd et al., 2004). The southern sources in ice-free waters experiencing spring algal blooms explain why marine SOA concentrations already started to rise in Ny-Ålesund in April and reached their first peaks in May. The source fingerprint of marine POA, instead, is well confined in the Arctic basin with hotspots in the Greenland and Barents Sea, the Fram Strait, and Baffin Bay: such sources are therefore linked to sea-ice extension as well as to sea-ice state (e.g., presence of leads), which explains the delayed formation of marine POA with respect to MSA. Arctic sea ice reached its annual summer minimum on 18 September 2019, according to NASA and the National Snow and Ice Data Center (NSIDC), but already in the middle of July it was substantially depleted in many coastal areas of Svalbard, Greenland, and North America (see Fig. S15). Figure S15c shows the ground type over which the back trajectories of each PM1 sample were passing. In particular it highlights the higher fractional influence of seawater vs sea-ice cover on the contributions of F1b (marine POA) as apportioned by NMR analysis, further supporting its interpretation.
Aged wildfire OA (Factor 2 – F2) was also moderately oxygenated (OM : OC =1.96, O : C =0.62, H : C =1.44) and characterized by both hydrocarbon (CxHy) and oxygenated (CxHyO1 and CxHyO>1) fragment ions (see also Fig. S7). In particular, a vast majority of fragments that were almost entirely apportioned to Factor 2 belong to the CxHyO>1 family (e.g., CH5O2, C3H7O2, C3H3O3, C5H5O2 and C5H6O2, at 49.03, 75.04, 87.01, 97.03 and 98.04 respectively). H-NMR shows that this component was characterized by branched/cyclic and poly-substituted aliphatic compounds, similar to atmospheric HULIS (humic-like substances) already associated with aged biomass burning emissions observed in many continental areas (Decesari et al., 2000, 2014; Paglione et al., 2014a, b; Fig. S16). Photochemical aging is known to progressively degrade levoglucosan and other polyols/anhydrosugars and phenolic compounds, leaving behind more refractory aliphatic and aromatic compounds carrying carboxylic groups (Paglione et al., 2014a; Yazdani et al., 2023). F2 only showed considerable concentrations during a few episodes in summer 2019 and later in spring 2020. Based on CWT analyses, we identified plausible source areas of this OA component in eastern Europe but also in northern Siberia, an area which was impacted by multiple huge wildfires during summer 2019 (Fig. S17). So, Factor 2 mainly represents the impact of oxidized/aged biomass burning particles from wildfires transported from boreal forests in Eurasia. Measured full-resolution NMR spectra of samples representative of this factor (i.e., 4 and 8 July) also showed signals of biogenic SOA formed from the oxidation of terpenes and isoprene, including compounds like terebic acid, MBTCA (methyl-butanetricarboxylic acid), and methyl-tetrols (Finessi et al., 2012; Zanca et al., 2017) (Fig. S18). This suggests that the aging of biomass burning emissions was accompanied by terpene-derived SOA, potentially from direct emissions from the fire front or by formation/accumulation of SOA during long-range transport over forested areas.
Arctic haze OA (Factor 3 – F3) was highly oxygenated (OM : OC =2.26, O : C =0.83, H : C =) but also showed features in the AMS spectral profiles related to anthropogenic emissions such as from fossil fuel (i.e., hydrocarbon-like fragments CxH2x+1 and CxH2x−1 like C3H5 and C3H7, C4H7 and C4H9, C5H9 and C5H11, at 41 and 43, 55 and 57, 69 and 71, respectively, etc.) and biomass combustion (i.e., anhydrosugar fragments such as C2H4O2 and C3H5O2 at 60.02 and 73.03, respectively). This was supported by the H-NMR analyses, showing that this factor was characterized by aromatics, levoglucosan, and polysubstituted aliphatics but also by hydroxy-methanesulfonate (HMS), a well-recognized significant anthropogenic contributor to midlatitude wintertime pollution (Moch et al., 2020; Liu et al., 2021), with its specific singlet at 4.39 ppm of NMR chemical shift. Factor 3 showed an increasing contribution during late winter and early spring at the peak of the Arctic haze season. Thus, this OA component also correlated quite well with eBC and nss-SO4 (Table S4) and has quite low concentrations until late winter like other phenolic compounds (i.e., vanillic acid, Fig. S14). All this suggested that Arctic haze OA was related to long-range transport from anthropogenic emissions in the mid-latitudes, including fossil fuel and biomass combustion. For Arctic haze OA, CWT analysis showed a clear continental origin in Eurasia and, to a lesser extent, in North America, which represents the typical source fingerprint of Arctic haze at Svalbard. It is worth noting that Arctic haze OA accounted for the largest contribution to winter–springtime concentrations of levoglucosan in Ny-Ålesund, whereas in summer, aged wildfire OA was the major contributor (as shown also in Fig. S17).
Background mix OA (Factor 4 – F4) in the AMS was dominated only by CO2 and related fragment ions, making it extremely oxygenated (OM : OC =2.88, O : C =1.32, H : C =1.13). Consequently, the source of this OA component remains uncertain based on its AMS chemical fingerprint. Factor 4 correlated strongly with oxalic acid and C1–C2 monocarboxylic acids, indicating an enrichment in highly oxidized organic species consistent with its high oxidation state (Fig. S7). The corresponding NMR factor revealed a mixture of anthropogenic signals (e.g., aromatics, HMS, traces of levoglucosan) and biogenic signals (e.g., aliphatics, polyols, amines), however with unclear attribution. Its seasonality was less pronounced than other OA types, though concentrations were lower during the dark months. The high oxidation state suggests extensive aging and distributed sources across vast geographical regions. The time trend similarities with maleic acid indicate a contribution from the aging of anthropogenic emissions, as maleic acid forms during the oxidation of aromatic volatile organic compounds (VOCs). Likewise possible signals of terpene-derived biogenic SOA from forest VOCs emissions can not be excluded in the NMR spectral profile of F4, even if not univocally identified. Simultaneously, overlaps with amino acids time trends suggest mixing with a primary biogenic component (Fig. S14). Background mix OA likely encompassed emissions from diverse sources fractions that the current chemical database using AMS and H-NMR cannot fully resolve. CWT maps for mixed background OA highlighted influences from extensive regions across the Northern Hemisphere, predominantly terrestrial but also including maritime zones in the North Atlantic. This broad, dispersed geographical impact, combined with spectral profiles and temporal trends, complicates definitive source attribution.
Since OC was to 71±18 % water-soluble, only a relatively small fraction was missing in the source apportionment of WSOC. The missing 29 % was quantified via multilinear regression (MLR), as already proposed in previous studies (Casotto et al., 2023; Cui et al., 2024) and described in Sect. S3. Briefly, total OC mass was fit using a linear combination of the WSOC components (using AMS and NMR PMF factors independently). The multiplicative coefficients attributed by the regression to each factor are considered to be recovery coefficients (RCs), which are inversely related to solubility: higher coefficients mean that the corresponding factor was less water soluble and is associated with a higher fraction of insoluble OC. The resulting coefficients are reported in Table S6.
For both the techniques, Factor 4 (the background mix OA) resulted in being a rather insoluble component. This is quite surprising, given that Factor 4 was also the most oxidized component (according to AMS elemental ratios), which is usually considered a hint of good water affinity. As a matter of fact, however, relatively large amounts of water-insoluble organic carbon can be found in the aerosols, even at the most remote locations (e.g., Miyazaki et al., 2011).
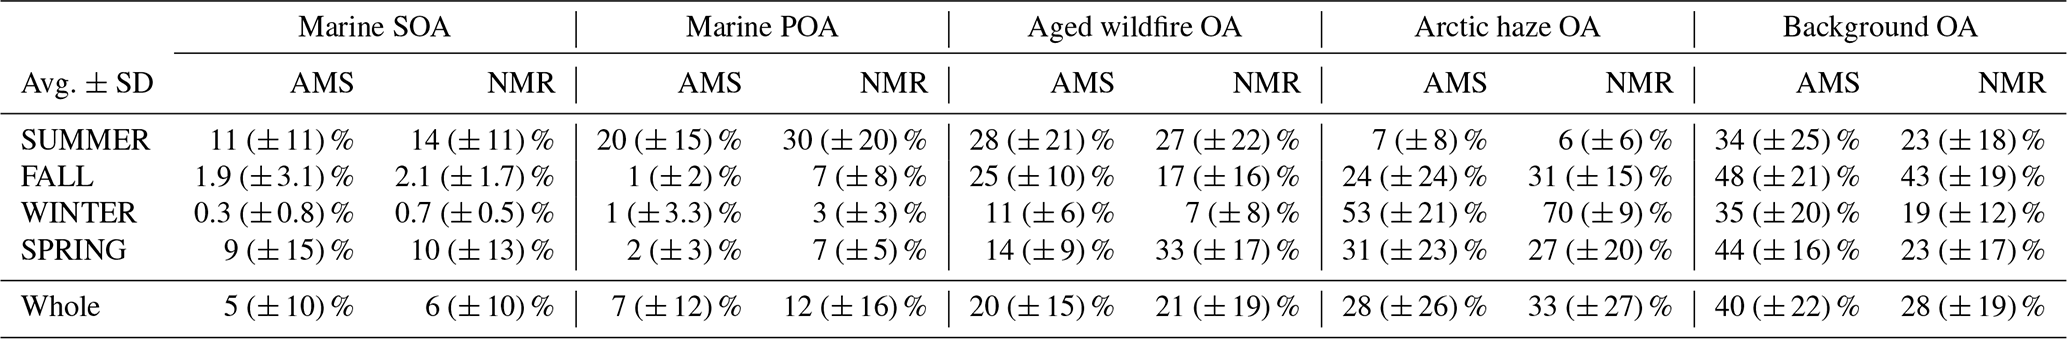
Table 1Annual and seasonal ranges of the average mass contributions to total OA of the sources identified by AMS and H-NMR source apportionment. Average values are followed by standard deviations (in parentheses).
The marine OA by AMS fitting also seemed quite insoluble. However, the fitting based on the NMR factors highlights how the most insoluble part of the marine components was related to the POA fraction, enriched (as already mentioned) of molecules characterized by limited solubility, such as lipids and possibly amino acids and phenolic compounds. This agrees with our knowledge of marine POA production and composition according to which a large fraction is in fact water-insoluble (Facchini et al., 2008b).
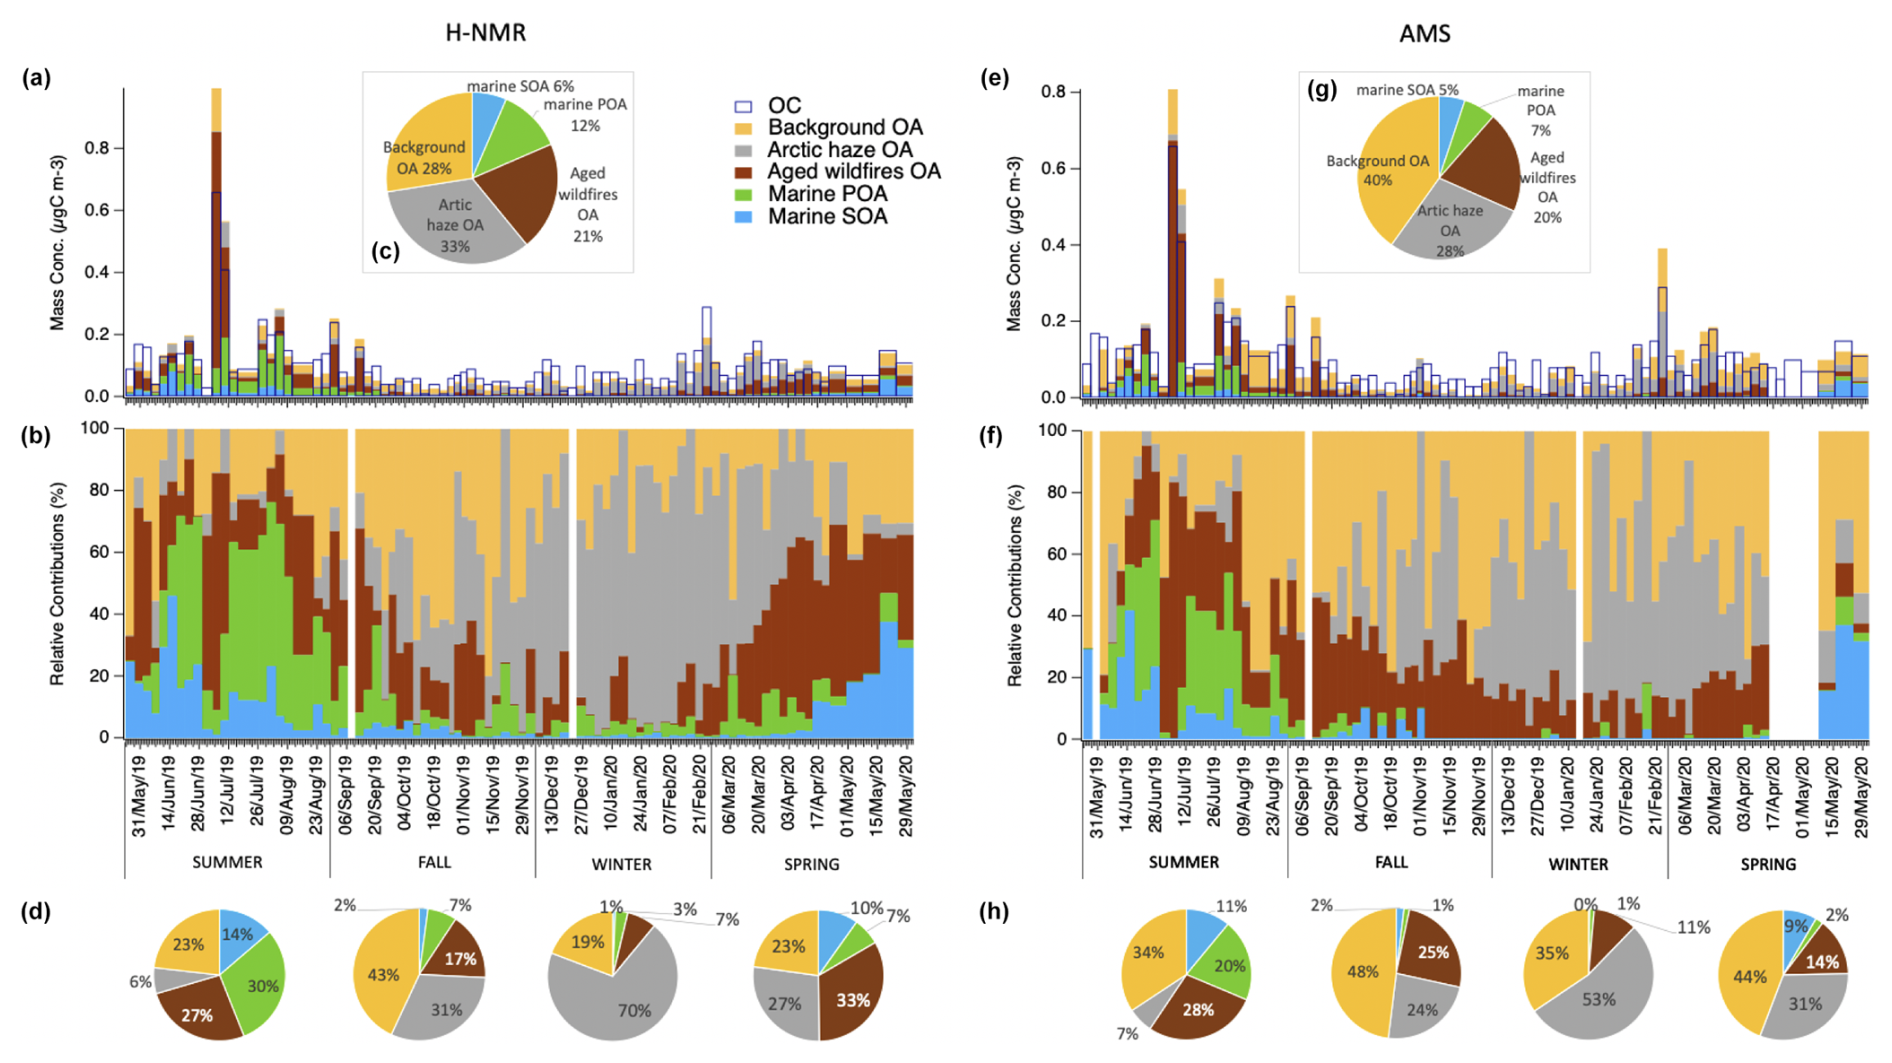
Figure 6Contributions of the H-NMR (left side) and AMS (right side) factors identified by PMF to the total organic carbon (OC) as resulting from multilinear regression analysis. Histograms show the mass concentrations (µgC m−3, a and e) and the relative contributions (%, b and f) of each factor in each sample. Pie charts report the average relative contributions for the whole year (c, g) and the different seasons (d, h).
The aged wildfire OA (characterized by HULIS features) and the Arctic haze OA components instead showed different coefficients for the fitting based on AMS and NMR factors: slightly higher than 1 for AMS (i.e., 1.21 and 1.56, respectively) but the highest values for NMR (i.e., 2.22 and 2.04, respectively). This might result from the presence of molecules in these components characterized by an intermediate solubility and by the abundance of functional groups not bearing detectable protons (such as carbonyls, fully substituted aryls, and also carboxylic acids) which are under-resolved by NMR. These features are also consistent with the presence of anthropogenic products in Arctic haze OA coming from fossil fuel combustion (i.e., hydrocarbon-like fragments in AMS profile and aromatics, alkyls, alkenes, polysubstituted aliphatics in NMR profile).
Given the good agreement between the AMS and NMR reconstructions of the total marine WSOC fraction (see Fig. 4), we further split marine OA by AMS based on the relative NMR contributions of its primary and secondary marine components (as further described in Sect. S3). Figure 6 reports the scaled contributions of the NMR and AMS factors to total OC at Ny-Ålesund through the whole year showing again a marked seasonality, while Table 1 details their yearly and seasonal averages and variability (i.e., standard deviations). Looking at the relative contributions, the marine biogenic components led the submicrometric OA mass during summer (31 % and 44 % as the sum of marine SOA and POA in AMS and NMR, respectively) and spring (10 % and 17 %), as a consequence of the increased biological activity characterizing the warmest seasons. During winter the marine SOA component disappeared almost completely (0.3 % and 0.7 % in AMS and NMR, respectively), following the seasonal reduction of solar light and photo-oxidative conditions, while the marine POA factor still had little but not negligible relative contributions (1 % and 3 %). This finding supports the presence of natural primary sources still operating at the site during winter, as already suggested by the functional groups distribution given above (Fig. 3). However, it remains unclear as to what extent marine POA continued to form over ice-covered oceanic regions. It is possible that the marine POA factor in cold months actually traces other organic components rich in polyols such as fungal spores, whose chemical tracers actually peak in the fall season (Fig. S14).
A relevant contribution during summer (28 % and 27 % in AMS and NMR, respectively) was also represented by the aged aerosols (for NMR enriched of HULIS compounds of continental origin), attributed to the long-range transport of biomass burning and biogenic SOA particles probably from wildfires of Eurasian boreal forests.
Arctic haze contribution, characterized by aged anthropogenic compounds linked with fossil fuel and biomass combustion mainly coming from continental polluted Eurasian mid-latitudes, was identified and quantified contributing to relevant portion of OA during winter/spring (53 % and 70 % in winter, 31 % and 27 % in spring for AMS and NMR, respectively) and becoming significantly less important in the summer months (7 % and 6 %). Factor 4, background mix OA, had lower time variability during the year than other components (40 % and 28 % in AMS and NMR, respectively), even though it showed a reduction in the concentration during winter time (35 % and 19 %).
Moschos et al. (2022) attributed a distinct, albeit minor, contribution of BSOA (biogenic secondary organic aerosol) to organic carbon (OC) during the polar day at Ny-Ålesund – 9 % at Gruvebadet and 19 % at Zeppelin. In contrast to their findings, our PMF analysis was unable to clearly isolate and quantify a specific BSOA contribution within our dataset. This is likely due to strong co-variation between BSOA and other particles that are co-emitted, formed, and transported to Ny-Ålesund from common source regions, primarily the boreal forests of Eurasia. Nevertheless, the overall picture emerging from our study remains broadly consistent with the 9 %–19 % BSOA contribution reported by Moschos et al. (2022). These BSOA components are likely incorporated year-round into varying portions of our F2 (aged wildfire OA) and/or F4 (background mix) factors, which represent up to 28 % and 34 % of summertime organic PM1, respectively.
Although the AMS and NMR showed an overall good agreement in OC source apportionment, some discrepancies could be noticed in the relative contributions of specific components to the aerosol OC (Table 1). While the total marine and the wildfire OA fractions agreed quite well, a greater contribution for Factor 4 (background OA) with respect to Factor 3 (Arctic haze OA) was derived by AMS when comparing to NMR (for background OA 40 versus 28 % and for Arctic haze OA 28 versus 33 % on a yearly average, for AMS and NMR respectively). We believe that such discrepancies, likely related to the different sensitivity of the two instruments to specific organic mixtures (see Sect. 2.2.1 and 2.2.2), provide a measure of the level of bias one may encounter when relying on a single technique to characterize OA, representing a further relevant output of this study. And despite these discrepancies, the overall agreement between NMR and AMS characterizations highlights the robustness of the study's findings and reveals a consistent picture of the main organic submicron aerosol sources in Ny-Ålesund and their seasonality.
A complete yearly set of PM1 samples from Ny-Ålesund (May 2019–June 2020) was analyzed for the first time in parallel by H-NMR spectroscopy and offline HR-ToF-AMS, alongside bulk chemical analyses. About 90 % of PM1 mass was apportioned into organic mass, nss sulfate, and sea salt in similar proportions: 28 %, 33 %, and 29 %, on a yearly basis. Noticeably, organic aerosol was the major PM1 component during summer, accounting for 44 % of the PM1 mass.
The applied organic aerosol characterization techniques provided a picture of the evolution of bulk organic aerosol features through the year. From the AMS perspective, summertime OA was less oxidized, probably reflecting the influence of a higher contribution from local (Arctic) sources, while it tended to be generally more oxidized during fall, with spring and winter representing intermediate conditions, under the variable effect of long-distance terrestrial sources including anthropogenic pollution at the mid-latitudes and boreal forests.
Organic aerosol source apportionment applied in parallel showed exceptionally good agreement between the two techniques, which demonstrates the good agreement between H-NMR and AMS, especially when the latter is run offline. As a corollary, when removing the uncertainties associated with the sampling and the analyses are performed on the same filters, even very different spectroscopic techniques like H-NMR and AMS can lead to substantially consistent results in organic source apportionment, supporting the idea that “factors” approximate real chemical classes. For the same reason, the different selectivity of one technique with respect to given chemical structures can be exploited to achieve a better understanding of the chemical nature of “factors” with respect to when employing a single analytical method. This is especially useful for AMS that, even if well established in the atmospheric chemistry community, can be limited in providing source attribution for the oxidized organic aerosol (OOA) types and would therefore gain high benefit from integration with other methodologies.
In this study, in particular, NMR supported the interpretation of the AMS factor profiles (which showed a lower variability in spectral features than NMR ones) and allowed the separation of the marine source into two different contributions, primary and secondary, enhancing our source apportionment capability in this study. Nevertheless, our results also show the limits of OA source apportionment in remote locations, where aerosols are often transported from long distances, have undergone heavy atmospheric chemical processing (aging), and are well mixed. Indeed, for one of the factors (F4 – background OA), accounting for an important 28 %–40 % of OA, it was not possible to attribute a specific source or formation process, nor possible even to classify it as anthropogenic or natural, and it could comprise several distinct, unresolved contributions.
Both anthropogenic and biogenic sources were shown to contribute to the submicron OA load, with a marked seasonality.
Biogenic aerosols (both primary, 1 %–30 % and secondary, 1 %–14 %, as min–max annual relative contributions to OA respectively), dominating during summer (31 %–44 % in total), were associated with sulfur compounds, amines, and fatty acids, with their degradation products (DCAs) from the marine environment.
Aged anthropogenic aerosol in summer was attributed to the long-range transport of biomass burning particles from Eurasian forests (7 %–28 %, annual min–max respectively); for NMR this component looked to be enriched in HULIS compounds of continental origin.
Arctic haze contribution (6 %–70 %, annual min–max respectively), characterized by aged anthropogenic compounds linked with fossil fuel and biomass combustion, was identified and quantified to contribute to a relevant portion of OA during late winter/early spring (27 %–70 %, winter–springtime min–max respectively).
These findings are consistent with the seasonality of anthropogenic and biogenic OA sources described by Moschos et al. (2022) in a previous pan-Arctic study and also confirm the summertime relevance of biogenic sources for the submicron OA fraction. The present results also evidence that the European Arctic is heavily impacted by anthropogenic submicron OAs, in particular from fall to spring. This shows how atmospheric emissions from lower latitudes are key drivers of Arctic air quality and, ultimately, climate. With respect to the Moschos et al. (2022) study, we could not separate a distinct fraction for primary biogenic organic aerosols (PBOAs), probably because of their small contribution in PM1. At the same time, the employment of the H-NMR factor analysis enabled us to detail the chemical nature of the marine OA, showing a new component associated with the atmospheric life cycle of marine POA beside the already known contribution from MSA. Marine OAs were shown to dominate organic composition in summertime outside outbreaks of wildfire plumes, when concentrations peaked between 0.1 and 0.2 µgC m−3 in PM1, which, in turn, compare with the concentration levels reached at the end of the winter in the full Arctic haze season. These findings once again highlight the importance of research on climatological–ecological feedbacks in the production of aerosols and aerosol precursors from the marine biota in Arctic and sub-Arctic environments. As long as the transport of anthropogenic aerosols rich of organic carbon, black carbon and nss sulfate to the Arctic will continue to decrease, the importance of climate feedbacks on the biogenic sources as well as on fire activity will increasingly shape the landscape of aerosol–climate interactions in the coming decades.
Data are available in the IADC public repository (https://doi.org/10.71761/0e110925-1f3d-4013-b048-e5a47ca3be6f, Paglione, 2025). eBC data were obtained from Mazzola and Gilardoni (2022) (https://doi.org/10.71761/ee3fb49e-c3e2-4572-95b8-1e7ff6361ac5).
The supplement related to this article is available online at https://doi.org/10.5194/acp-25-12853-2025-supplement.
MP and MRi designed the research; MP, MM, and MRi organized the field campaign; MP and MM collected the aerosol samples; MP, YF, MRu, MIM, EB, and DF performed the chemical analyses; MP and MRi performed the factor analysis; SD, AM, ET, KD, and FC contributed to the factor analysis discussion and correction; KM elaborated back trajectories and maps; and MP, KD, MR, and SD wrote the paper. All authors contributed to the scientific discussion and paper revision.
The contact author has declared that none of the authors has any competing interests.
Publisher's note: Copernicus Publications remains neutral with regard to jurisdictional claims made in the text, published maps, institutional affiliations, or any other geographical representation in this paper. While Copernicus Publications makes every effort to include appropriate place names, the final responsibility lies with the authors. Views expressed in the text are those of the authors and do not necessarily reflect the views of the publisher.
Financial support was provided by the European Commission: H2020 Research and innovation program, project FORCeS (grant no. 821205), and by the Italian Joint Research Center ENI-CNR “Aldo Pontremoli” within the ENI-CNR Joint Research Agreement. Support from CleanCloud (Horizon Europe, grant no. 101137639) is also greatly acknowledged. Kaspar R. Daellenbach acknowledges support by SNSF PZPGP2_201992 grant. This research was also supported by the Italian Ministry of University and Research (MIUR) within the framework of the Arctic Research Program of Italy of the project “BETHA-NyÅ” – Boundary layer evolution through harmonization of aerosol measurements at Ny-Ålesund research station (PRA2021-0020). The authors thank CNR and the staff of the Arctic Station Dirigibile Italia for their support: F. Di Bona, F. Bruschi, P. Gravina, R. Nardin, M. Casula, M. Pallottini. We also thank A. Cavaliere and G. Verazzo from CNR-ISP (Bologna) for helpful discussions about data fairness and for uploading and organizing the study dataset into the Italian Arctic Data Center (IADC) database. Kaspar R. Daellenbach acknowledges support by SNSF Ambizione grant PZPGP2_201992.
This research has been supported by the EU Horizon 2020 (grant no. 821205), the Horizon Europe Climate, Energy and Mobility (grant no. 101137639), the Ministero dell'Istruzione, dell'Università e della Ricerca (grant no. PRA2021-0020), and the Swiss National Science Foundation (SNSF projects no. PZPGP2_201992).
This paper was edited by Eleanor Browne and reviewed by two anonymous referees.
Abbatt, J. P. D., Leaitch, W. R., Aliabadi, A. A., Bertram, A. K., Blanchet, J.-P., Boivin-Rioux, A., Bozem, H., Burkart, J., Chang, R. Y. W., Charette, J., Chaubey, J. P., Christensen, R. J., Cirisan, A., Collins, D. B., Croft, B., Dionne, J., Evans, G. J., Fletcher, C. G., Galí, M., Ghahreman, R., Girard, E., Gong, W., Gosselin, M., Gourdal, M., Hanna, S. J., Hayashida, H., Herber, A. B., Hesaraki, S., Hoor, P., Huang, L., Hussherr, R., Irish, V. E., Keita, S. A., Kodros, J. K., Köllner, F., Kolonjari, F., Kunkel, D., Ladino, L. A., Law, K., Levasseur, M., Libois, Q., Liggio, J., Lizotte, M., Macdonald, K. M., Mahmood, R., Martin, R. V., Mason, R. H., Miller, L. A., Moravek, A., Mortenson, E., Mungall, E. L., Murphy, J. G., Namazi, M., Norman, A.-L., O'Neill, N. T., Pierce, J. R., Russell, L. M., Schneider, J., Schulz, H., Sharma, S., Si, M., Staebler, R. M., Steiner, N. S., Thomas, J. L., von Salzen, K., Wentzell, J. J. B., Willis, M. D., Wentworth, G. R., Xu, J.-W., and Yakobi-Hancock, J. D.: Overview paper: New insights into aerosol and climate in the Arctic, Atmos. Chem. Phys., 19, 2527–2560, https://doi.org/10.5194/acp-19-2527-2019, 2019.
Aguilera, A., Distéfano, A., Jauzein, C., Correa-Aragunde, N., Martinez, D., Martin, M. V., and Sueldo, D. J.: Do photosynthetic cells communicate with each other during cell death? From cyanobacteria to vascular plants, Journal of Experimental Botany, 73, 7219–7242, https://doi.org/10.1093/jxb/erac363, 2022.
AMAP Assessment: Impacts of Short-lived Climate Forcers on Arctic Climate, Air Quality, and Human Health, ISBN 978-82-7971-202-2, 2021.
Barbaro, E., Kirchgeorg, T., Zangrando, R., Vecchiato, M., Piazza, R., Barbante, C., and Gambaro, A.: Sugars in Antarctic aerosol, Atmospheric Environment, 118, 135–144, 2015a.
Barbaro, E., Zangrando, R., Vecchiato, M., Piazza, R., Cairns, W. R. L., Capodaglio, G., Barbante, C., and Gambaro, A.: Free amino acids in Antarctic aerosol: potential markers for the evolution and fate of marine aerosol, Atmos. Chem. Phys., 15, 5457–5469, https://doi.org/10.5194/acp-15-5457-2015, 2015b.
Barbaro, E., Padoan, S., Kirchgeorg, T., Zangrando, R., Toscano, G., Barbante, C., and Gambaro, A.: Particle size distribution of inorganic and organic ions in coastal and inland Antarctic aerosol, Environmental Science and Pollution Research, 24, 2724–2733, 2017.
Bhattarai, H., Saikawa, E., Wan, X., Zhu, H., Ram, K., Gao, S., Kang, S., Zhang, Q., Zhang, Y., Wu, G., Wang, X., Kawamura, K., Fu, P., and Cong, Z.: Levoglucosan as a tracer of biomass burning: recent progress and perspectives, Atmos. Res., 220, 20–33, https://doi.org/10.1016/j.atmosres.2019.01.004, 2019.
Becagli, S., Amore, A., Caiazzo, L., Iorio, T. D., Sarra, A. D., Lazzara, L., Marchese, C., Meloni, D., Mori, G., Muscari, G., Nuccio, C., Pace, G., Severi, M., and Traversi, R.: Biogenic Aerosol in the Arctic from Eight Years of MSA Data from Ny-Ålesund (Svalbard Islands) and Thule (Greenland), Atmosphere, 10, 349, https://doi.org/10.3390/atmos10070349, 2019.
Bozzetti, C., Daellenbach, K. R., Hueglin, C., Fermo, P., Sciare, J., Kasper-Giebl, A., Mazar, Y., Abbaszade, G., El Kazzi, M., Gonzalez, R., Shuster-Meiseles, T., Flasch, M., Wolf, R., Křepelová, A., Canonaco, F., Schnelle-Kreis, J., Slowik, J. G., Zimmermann, R., Rudich, Y., Baltensperger, U., El Haddad, I., and Prévôt, A. S. H.: Size-Resolved Identification, Characterization, and Quantification of Primary Biological Organic Aerosol at a European Rural Site, Environmental Science & Technology, 50, 3425–3434, https://doi.org/10.1021/acs.est.5b05960, 2016.
Bozzetti, C., Sosedova, Y., Xiao, M., Daellenbach, K. R., Ulevicius, V., Dudoitis, V., Mordas, G., Byčenkienė, S., Plauškaitė, K., Vlachou, A., Golly, B., Chazeau, B., Besombes, J.-L., Baltensperger, U., Jaffrezo, J.-L., Slowik, J. G., El Haddad, I., and Prévôt, A. S. H.: Argon offline-AMS source apportionment of organic aerosol over yearly cycles for an urban, rural, and marine site in northern Europe, Atmos. Chem. Phys., 17, 117–141, https://doi.org/10.5194/acp-17-117-2017, 2017a.
Bozzetti, C., El Haddad, I., Salameh, D., Daellenbach, K. R., Fermo, P., Gonzalez, R., Minguillón, M. C., Iinuma, Y., Poulain, L., Elser, M., Müller, E., Slowik, J. G., Jaffrezo, J.-L., Baltensperger, U., Marchand, N., and Prévôt, A. S. H.: Organic aerosol source apportionment by offline-AMS over a full year in Marseille, Atmos. Chem. Phys., 17, 8247–8268, https://doi.org/10.5194/acp-17-8247-2017, 2017b.
Canagaratna, M. R., Jimenez, J. L., Kroll, J. H., Chen, Q., Kessler, S. H., Massoli, P., Hildebrandt Ruiz, L., Fortner, E., Williams, L. R., Wilson, K. R., Surratt, J. D., Donahue, N. M., Jayne, J. T., and Worsnop, D. R.: Elemental ratio measurements of organic compounds using aerosol mass spectrometry: characterization, improved calibration, and implications, Atmos. Chem. Phys., 15, 253–272, https://doi.org/10.5194/acp-15-253-2015, 2015.
Canonaco, F., Crippa, M., Slowik, J. G., Baltensperger, U., and Prévôt, A. S. H.: SoFi, an IGOR-based interface for the efficient use of the generalized multilinear engine (ME-2) for the source apportionment: ME-2 application to aerosol mass spectrometer data, Atmos. Meas. Tech., 6, 3649–3661, https://doi.org/10.5194/amt-6-3649-2013, 2013.
Carslaw, D. C. and Ropkins, K.: openair – An R package for air quality data analysis, Environ. Model. Softw., 27–28, 52–61, https://doi.org/10.1016/j.envsoft.2011.09.008, 2012.
Casotto, R., Skiba, A., Rauber, M., Strähl, J., Tobler, A., Bhattu, D., Lamkaddam, H., Manousakas, M. I., Salazar, G., Cui, T., and Canonaco, F.: Organic aerosol sources in Krakow, Poland, before implementation of a solid fuel residential heating ban, Science of the Total Environment, 855, 158655, https://doi.org/10.1016/j.scitotenv.2022.158655, 2023.
Chang, R. Y.-W., Leck, C., Graus, M., Müller, M., Paatero, J., Burkhart, J. F., Stohl, A., Orr, L. H., Hayden, K., Li, S.-M., Hansel, A., Tjernström, M., Leaitch, W. R., and Abbatt, J. P. D.: Aerosol composition and sources in the central Arctic Ocean during ASCOS, Atmos. Chem. Phys., 11, 10619–10636, https://doi.org/10.5194/acp-11-10619-2011, 2011.
Chen, Y., Xu, L., Humphry, T., Hettiyadura, A. P. S., Ovadnevaite, J., Huang, S., Poulain, L., Schroder, J. C., Campuzano-Jost, P., Jimenez, J. L., Herrmann, H., O'Dowd, C., Stone, E. A., and Ng, N. L.: Response of the Aerodyne Aerosol Mass Spectrometer to Inorganic Sulfates and Organosulfur Compounds: Applications in Field and Laboratory Measurements, Environ. Sci. Technol., 53, 5176–5186, https://doi.org/10.1021/acs.est.9b00884, 2019.
Collaud Coen, M., Andrews, E., Alastuey, A., Arsov, T. P., Backman, J., Brem, B. T., Bukowiecki, N., Couret, C., Eleftheriadis, K., Flentje, H., Fiebig, M., Gysel-Beer, M., Hand, J. L., Hoffer, A., Hooda, R., Hueglin, C., Joubert, W., Keywood, M., Kim, J. E., Kim, S.-W., Labuschagne, C., Lin, N.-H., Lin, Y., Lund Myhre, C., Luoma, K., Lyamani, H., Marinoni, A., Mayol-Bracero, O. L., Mihalopoulos, N., Pandolfi, M., Prats, N., Prenni, A. J., Putaud, J.-P., Ries, L., Reisen, F., Sellegri, K., Sharma, S., Sheridan, P., Sherman, J. P., Sun, J., Titos, G., Torres, E., Tuch, T., Weller, R., Wiedensohler, A., Zieger, P., and Laj, P.: Multidecadal trend analysis of in situ aerosol radiative properties around the world, Atmos. Chem. Phys., 20, 8867–8908, https://doi.org/10.5194/acp-20-8867-2020, 2020.
Cui, T., Manousakas, M. I., Wang, Q., Uzu, G., Hao, Y., Khare, P., Qi, L., Chen, Y., Han, Y., Slowik, J. G., and Jaffrezo, J. L.: Composition and Sources of Organic Aerosol in Two Megacities in Western China Using Complementary Mass Spectrometric and Statistical Techniques, ACS Es&t Air, 1, 1053–1065, 2024.
Daellenbach, K. R., Bozzetti, C., Křepelová, A., Canonaco, F., Wolf, R., Zotter, P., Fermo, P., Crippa, M., Slowik, J. G., Sosedova, Y., Zhang, Y., Huang, R.-J., Poulain, L., Szidat, S., Baltensperger, U., El Haddad, I., and Prévôt, A. S. H.: Characterization and source apportionment of organic aerosol using offline aerosol mass spectrometry, Atmos. Meas. Tech., 9, 23–39, https://doi.org/10.5194/amt-9-23-2016, 2016.
Daellenbach, K. R., Stefenelli, G., Bozzetti, C., Vlachou, A., Fermo, P., Gonzalez, R., Piazzalunga, A., Colombi, C., Canonaco, F., Hueglin, C., Kasper-Giebl, A., Jaffrezo, J.-L., Bianchi, F., Slowik, J. G., Baltensperger, U., El-Haddad, I., and Prévôt, A. S. H.: Long-term chemical analysis and organic aerosol source apportionment at nine sites in central Europe: source identification and uncertainty assessment, Atmos. Chem. Phys., 17, 13265–13282, https://doi.org/10.5194/acp-17-13265-2017, 2017.
Dall'Osto, M., Airs, R. L., Beale, R., Cree, C., Fitzsimons, M. F., Beddows, D., Harrison, R. M., Ceburnis, D., O'Dowd, C., Rinaldi, M., Paglione, M., Nenes, A., Decesari, S., and Simó, R.: Simultaneous detection of alkylamines in the surface ocean and atmosphere of the Antarctic sympagic environment, ACS Earth Space Chem., 3, 854–862, 2019.
Decesari, S., Facchini, M. C., Fuzzi, S., and Tagliavini, E.: Characterization of water-soluble organic compounds in atmospheric aerosol: a new approach, J. Geophys. Res., 105, 1481–1489, 2000.
Decesari, S., Mircea, M., Cavalli, F., Fuzzi, S., Moretti, F., Tagliavini, E., and Facchini, M. C.: Source attribution of water-soluble organic aerosol by Nuclear Magnetic Resonance spectroscopy, Environ. Sci. Technol, 41, 2479–2484, 2007.
Decesari, S., Finessi, E., Rinaldi, M., Paglione, M., Fuzzi, S., Stephanou, E. G., Tziaras, T., Spyros, A., Ceburnis, D., O'Dowd, C., Dall'Osto, M., Harrison, R. M., Allan, J., Coe, H., and Facchini, M. C.: Primary and secondary marine organic aerosols over the North Atlantic Ocean during the MAP experiment, J. Geophys. Res., 116, D22210, https://doi.org/10.1029/2011JD016204, 2011.
Decesari, S., Paglione, M., Rinaldi, M., Dall'Osto, M., Simó, R., Zanca, N., Volpi, F., Facchini, M. C., Hoffmann, T., Götz, S., Kampf, C. J., O'Dowd, C., Ceburnis, D., Ovadnevaite, J., and Tagliavini, E.: Shipborne measurements of Antarctic submicron organic aerosols: an NMR perspective linking multiple sources and bioregions, Atmos. Chem. Phys., 20, 4193–4207, https://doi.org/10.5194/acp-20-4193-2020, 2020.
Decesari, S., Paglione, M., Mazzanti, A., and Tagliavini, E.: NMR spectroscopic applications to atmospheric organic aerosol analysis – Part 1: A critical review of data source and analysis, potentialities and limitations, Trends in Analytical Chemistry (TrAC), 171, 117516, https://doi.org/10.1016/j.trac.2023.117516, 2024.
Donateo, A., Pappaccogli, G., Famulari, D., Mazzola, M., Scoto, F., and Decesari, S.: Characterization of size-segregated particles' turbulent flux and deposition velocity by eddy correlation method at an Arctic site, Atmos. Chem. Phys., 23, 7425–7445, https://doi.org/10.5194/acp-23-7425-2023, 2023.
Facchini, M. C., Decesari, S., Rinaldi, M., Carbone, C., Finessi, E., Mircea, M., Fuzzi, S., Moretti, F., Tagliavini, E., Ceburnis, D., and O'Dowd, C. D.: Important Source of Marine Secondary Organic Aerosol from Biogenic Amines, Environmental Science and Technology, 42, 9116–9121, 2008a.
Facchini, M. C., Rinaldi, M., Decesari, S., Carbone, C., Finessi, E.,Mircea, M., Fuzzi, S., Ceburnis, D., Flanagan, R., Nilsson, E. D.,de Leeuw, G., Martino, M., Woeltjen, J., and O'Dowd, C. D.: Primary submicron marine aerosol dominated by insoluble organic colloids and aggregates, Geophys. Res. Lett., 35, L17814, https://doi.org/10.1029/2008GL034210, 2008b.
Faiola, C. L., Wen, M., and VanReken, T. M.: Chemical characterization of biogenic secondary organic aerosol generated from plant emissions under baseline and stressed conditions: inter- and intra-species variability for six coniferous species, Atmos. Chem. Phys., 15, 3629–3646, https://doi.org/10.5194/acp-15-3629-2015, 2015.
Feltracco, M., Barbaro, E., Contini, D., Zangrando, R., Toscano, G., Battistel, D., Barbante, C., and Gambaro, A.: Photo-oxidation products of α-pinene in coarse, fine and ultrafine aerosol: A new high sensitive HPLC-MS/MS method, Atmospheric Environment, 180, 149–155, https://doi.org/10.1016/j.atmosenv.2018.02.052, 2018.
Feltracco, M., Barbaro, E., Spolaor, A., Vecchiato, M., Callegaro, A., Burgay, F., Vardè, M., Maffezzoli, N., Dallo, F., Scoto, F., Zangrando, R., Barbante, C., and Gambaro, A.: Year-round measurements of size-segregated low molecular weight organic acids in Arctic aerosol, Sci. Total Environ., 763, 142954, https://doi.org/10.1016/j.scitotenv.2020.142954, 2021.
Finessi, E., Decesari, S., Paglione, M., Giulianelli, L., Carbone, C., Gilardoni, S., Fuzzi, S., Saarikoski, S., Raatikainen, T., Hillamo, R., Allan, J., Mentel, Th. F., Tiitta, P., Laaksonen, A., Petäjä, T., Kulmala, M., Worsnop, D. R., and Facchini, M. C.: Determination of the biogenic secondary organic aerosol fraction in the boreal forest by NMR spectroscopy, Atmos. Chem. Phys., 12, 941–959, https://doi.org/10.5194/acp-12-941-2012, 2012.
Frossard, A. A., Shaw, P. M., Russell, L. M., Kroll, J. H., Canagaratna, M. R., Worsnop, D. R., Quinn, P. K., and Bates, T. S.: Springtime Arctic haze contributions of submicron organic particles from European and Asian combustion sources, J. Geophys. Res., 116, D05205, https://doi.org/10.1029/2010JD015178, 2011.
Gilardoni, S., Lupi, A., Mazzola, M., Cappelletti David Michele, Moroni, B., Ferrero, L., Markuszewski, P., Rozwadowska, A., Krejci, R., Zieger, P., Tunved, P., Karlsson, L., Vratolis, S., Eleftheriadis, K., and Viola, A.: Atmospheric black carbon in Svalbard. In SESS report 2019 – The State of Environmental Science in Svalbard – an annual report (pagg. 196–211), Svalbard Integrated Arctic Earth Observing System, Zenodo, https://doi.org/10.5281/zenodo.4707201, 2020.
Gilardoni, S., Heslin-Rees, D., Mazzola, M., Vitale, V., Sprenger, M., and Krejci, R.: Drivers controlling black carbon temporal variability in the lower troposphere of the European Arctic, Atmos. Chem. Phys., 23, 15589–15607, https://doi.org/10.5194/acp-23-15589-2023, 2023.
Goetz, J. D., Giordano, M. R., Stockwell, Bhave, P. V., Praveen, P. S., Panday, A. K., Jayarathne, T., Stone, E. A., Yokelson, R. J., and DeCarlo, P. F.: Aerosol Mass Spectral Profiles from NAMaSTE Field Sampled South Asian Combustion Sources, Earth Space Chem., 6, 2619, https://doi.org/10.1021/acsearthspacechem.2c00173, 2022.
Gramlich, Y., Siegel, K., Haslett, S. L., Cremer, R. S., Lunder, C., Kommula, S. M., Buchholz, A., Yttri, K. E., Chen, G., Krejci, R., Zieger, P., Virtanen, A., Riipinen, I., and Mohr, C.: Impact of Biomass Burning on Arctic Aerosol Composition, ACS Earth and Space Chemistry, 8, 920–936, https://doi.org/10.1021/acsearthspacechem.3c00187, 2024.
Groot Zwaaftink, C. D., Grythe, H., Skov, H., and Stohl, A.: Substantial contribution of northern high-latitude sources to mineral dust in the Arctic, J. Geophys. Res.-Atmos., 121, 13678–13697, https://doi.org/10.1002/2016jd025482, 2016.
Hallquist, M., Wenger, J. C., Baltensperger, U., Rudich, Y., Simpson, D., Claeys, M., Dommen, J., Donahue, N. M., George, C., Goldstein, A. H., Hamilton, J. F., Herrmann, H., Hoffmann, T., Iinuma, Y., Jang, M., Jenkin, M. E., Jimenez, J. L., Kiendler-Scharr, A., Maenhaut, W., McFiggans, G., Mentel, Th. F., Monod, A., Prévôt, A. S. H., Seinfeld, J. H., Surratt, J. D., Szmigielski, R., and Wildt, J.: The formation, properties and impact of secondary organic aerosol: current and emerging issues, Atmos. Chem. Phys., 9, 5155–5236, https://doi.org/10.5194/acp-9-5155-2009, 2009.
Harris, J. M., Draxler, R. R., and Oltmans, S. J.: Trajectory model sensitivity to differences in input data and vertical transport method, Journal of Geophysical Research: Atmospheres, 110, https://doi.org/10.1029/2004JD005750, 2005.
Heslin-Rees, D., Burgos, M., Hansson, H.-C., Krejci, R., Ström, J., Tunved, P., and Zieger, P.: From a polar to a marine environment: has the changing Arctic led to a shift in aerosol light scattering properties?, Atmos. Chem. Phys., 20, 13671–13686, https://doi.org/10.5194/acp-20-13671-2020, 2020.
Hu, W., Day, D. A., Campuzano-Jost, P., Nault, B. A., Park, T., Lee, T., Croteau, P., Canagaratna, M. R., Jayne, J. T., Worsnop, D. R., and Jimenez, J. L.: Evaluation of the new capture vaporizer for aerosol mass spectrometers: Characterization of organic aerosol mass spectra, Aerosol Science and Technology, 52, 725–739, https://doi.org/10.1080/02786826.2018.1454584, 2018.
IPCC: Climate Change 2021: The Physical Science Basis. Contribution of Working Group I to the Sixth Assessment Report of the Intergovernmental Panel on Climate Change, edited by: Masson-Delmotte, V., Zhai, P., Pirani, A., Connors, S. L., Péan, C., Berger, S., Caud, N., Chen, Y., Goldfarb, L., Gomis, M. I., Huang, M., Leitzell, K., Lonnoy, E., Matthews, J. B. R., Maycock, T. K., Waterfield, T., Yelekçi, O., Yu, R., and Zhou, B., Cambridge University Press, Cambridge, United Kingdom and New York, NY, USA, https://doi.org/10.1017/9781009157896, 2021.
Kahl, J. D.: A cautionary note on the use of air trajectories in interpreting atmospheric chemistry measurements, Atmospheric Environment Part A. General Topics, 27, 3037–3038, https://doi.org/10.1016/0960-1686(93)90336-W, 1993.
Karl, M., Leck, C., Rad, F. M., Bäcklund, A., Lopez-Aparicio, S., and Heintzenberg, J.: New insights in sources of the sub-micrometre aerosol at Mt. Zeppelin observatory (Spitsbergen) in the year 2015, Tellus B, 71, 1613143, https://doi.org/10.1080/16000889.2019.1613143, 2019.
Koteska, D., Sanchez Garcia, S., Wagner-Döbler, I., and Schulz, S.: Identification of Volatiles of the 820 Dinoflagellate Prorocentrum cordatum, Marine Drugs, 20, 371, https://doi.org/10.3390/md20060371, 2022.
Leaitch, W. R., Russell, L. M., Liu, J., Kolonjari, F., Toom, D., Huang, L., Sharma, S., Chivulescu, A., Veber, D., and Zhang, W.: Organic functional groups in the submicron aerosol at 82.5° N, 62.5° W from 2012 to 2014, Atmos. Chem. Phys., 18, 3269–3287, https://doi.org/10.5194/acp-18-3269-2018, 2018.
Liu, J., Dedrick, J., Russell, L. M., Senum, G. I., Uin, J., Kuang, C., Springston, S. R., Leaitch, W. R., Aiken, A. C., and Lubin, D.: High summertime aerosol organic functional group concentrations from marine and seabird sources at Ross Island, Antarctica, during AWARE, Atmos. Chem. Phys., 18, 8571–8587, https://doi.org/10.5194/acp-18-8571-2018, 2018.
Liu, J., Gunsch, M. J., Moffett, C. E., Xu, L., El Asmar, R., Zhang, Q., Watson, T. B., Allen, H. M., Crounse, J. D., St. Clair, Kim, J. M., Wennberg, P. O., Weber, R. J., Sheesley, R. J., and Pratt, K. A.: Hydroxymethanesulfonate (HMS) Formation during Summertime Fog in an Arctic Oil Field, Environ. Sci. Technol. Let., 8, 511–518, https://doi.org/10.1021/acs.estlett.1c00357, 2021.
Mansour, K., Rinaldi, M., Preissler, J., Decesari, S., Ovadnevaite, J., Ceburnis, D., Paglione, M., Facchini, M. C., and O'Dowd, C.: Phytoplankton Impact on Marine Cloud Microphysical Properties Over the Northeast Atlantic Ocean, Journal of Geophysical Research-Atmospheres, 127, https://doi.org/10.1029/2021jd036355, 2022.
Mazzola, M. and Gilardoni, S.: Equivalent black carbon from aerosol absorption coefficient (Ny-Ålesund, Svalbard), Italian Arctic Data Centre (IADC) public repository [data set], https://doi.org/10.71761/ee3fb49e-c3e2-4572-95b8-1e7ff6361ac5, 2022.
McCarty, J. L., Aalto, J., Paunu, V.-V., Arnold, S. R., Eckhardt, S., Klimont, Z., Fain, J. J., Evangeliou, N., Venäläinen, A., Tchebakova, N. M., Parfenova, E. I., Kupiainen, K., Soja, A. J., Huang, L., and Wilson, S.: Reviews and syntheses: Arctic fire regimes and emissions in the 21st century, Biogeosciences, 18, 5053–5083, https://doi.org/10.5194/bg-18-5053-2021, 2021.
Meador, T. B., Goldenstein, N. I., Gogou, A., Herut, B., Psarra, S., Tsagaraki, T. M., and Hinrichs, K.-U.: Planktonic Lipidome Responses to Aeolian Dust Input in Low-Biomass Oligotrophic Marine 890 Mesocosms, Front. Mar. Sci., 4, 113, https://doi.org/10.3389/fmars.2017.00113, 2017.
Miyazaki, Y., Kawamura, K., Jung, J., Furutani, H., and Uematsu, M.: Latitudinal distributions of organic nitrogen and organic carbon in marine aerosols over the western North Pacific, Atmos. Chem. Phys., 11, 3037–3049, https://doi.org/10.5194/acp-11-3037-2011, 2011.
Moch, J. M., Dovrou, E., Mickley, L. J., Keutsch, F. N., Liu, Z., Wang, Y., Dombek, T. L., Kuwata, M., Budisulistiorini, S. H., Yang, L., Decesari, S., Paglione, M., Alexander, B., Shao, J., Munger, J. W., and Jacob, D. J.: Global Importance of Hydroxymethanesulfonate in Ambient Particulate Matter: Implications for Air Quality, J. Geophys. Res.-Atmos., 125, e2020JD032706, https://doi.org/10.1029/2020JD032706, 2020.
Moretti, F., Tagliavini, E., Decesari, S., Facchini, M. C., Rinaldi, M., and Fuzzi, S.: NMR Determination of Total Carbonyls and Carboxyls: A tool for tracing the evolution of atmospheric oxidized organic aerosols, Environ. Sci. Technol., 42, 4844–4849, https://doi.org/10.1021/es703166v, 2008.
Moschos, V., Dzepina, K., Bhattu, D., Lamkaddam, H., Casotto, R., Daellenbach, K. R.,; Canonaco, F., Rai, P., Aas, W., and Becagli, S.: Equal Abundance of Summertime Natural and Wintertime Anthropogenic Arctic Organic Aerosols, Nat. Geosci., 15, 196– 202, https://doi.org/10.1038/s41561-021-00891-1, 2022.
Myers-Smith, I. H., Kerby, J. T., Phoenix, G. K., Bjerke, J. W., Epstein, H. E., Assmann, J. J., John, C., Andreu-Hayles, L., Angers- Blondin, S., Beck, P. S. A., Berner, L. T., Bhatt, U. S., Bjorkman, A. D., Blok, D., Bryn, A., Christiansen, C. T., Cornelissen, J. H. C., Cunliffe, A. M., Elmendorf, S. C., Forbes, B. C., Goetz, S. J., Hollister, R. D., de Jong, R., Loranty, M. M., Macias-Fauria, M., Maseyk, K., Normand, S., Olofsson, J., Parker, T. C., Parmentier, F. J. W., Post, E., Schaepman-Strub, G., Stordal, F., Sullivan, P. F., Thomas, H. J. D., Tommervik, H., Treharne, R., Tweedie, C. E., Walker, D. A., Wilmking, M., and Wipf, S.: Complexity revealed in the greening of the Arctic, Nat. Clim. Change, 10, 106–117, https://doi.org/10.1038/s41558-019-0688-1, 2020.
Nguyen, Q. T., Skov, H., Sørensen, L. L., Jensen, B. J., Grube, A. G., Massling, A., Glasius, M., and Nøjgaard, J. K.: Source apportionment of particles at Station Nord, North East Greenland during 2008–2010 using COPREM and PMF analysis, Atmos. Chem. Phys., 13, 35–49, https://doi.org/10.5194/acp-13-35-2013, 2013.
Nielsen, I. E., Skov, H., Massling, A., Eriksson, A. C., Dall'Osto, M., Junninen, H., Sarnela, N., Lange, R., Collier, S., Zhang, Q., Cappa, C. D., and Nøjgaard, J. K.: Biogenic and anthropogenic sources of aerosols at the High Arctic site Villum Research Station, Atmos. Chem. Phys., 19, 10239–10256, https://doi.org/10.5194/acp-19-10239-2019, 2019.
O'Dowd, C. D., Facchini, M. C., Cavalli, F., Ceburnis, D., Mircea, M., Decesari, S., Fuzzi, S., Yoon, Y. J., and Putaud, J-P.: Biogenically driven organic contribution to marine aerosol, Nature, 431, 676–680, https://doi.org/10.1038/nature02959, 2004.
O'Dowd, C., Ceburnis, D., Ovadnevaite, J., Bialek, J., Stengel, D. B., Zacharias, M., Nitschke, U., Connan, S., Rinaldi, M., Fuzzi, S., Decesari, S., Cristina Facchini, M., Marullo, S., Santoleri, R., Dell'Anno, A., Corinaldesi, C., Tangherlini, M., and Danovaro, R.: Connecting marine productivity to sea-spray via nanoscale biological processes: Phytoplankton Dance or Death Disco?, Sci. Rep., 5, 14883, https://doi.org/10.1038/srep14883, 2015.
Paglione, M.: Organic Aerosol data (ORCA-2020), Italian Arctic Data Center [data set], https://doi.org/10.71761/0e110925-1f3d-4013-b048-e5a47ca3be6f, 2025.
Paatero, P.: The Multilinear Engine: A Table-Driven, Least Squares Program for Solving Multilinear Problems, including the n-Way Parallel Factor Analysis Model, J. Comp. Graph. Stat., 8, 854–888, 1999.
Paatero, P. and Tapper, U.: Positive matrix factorization: A non-negative factor model with optimal utilization of error estimates of data values, Environmetrics, 5, 111–126, https://doi.org/10.1002/env.3170050203, 1994.
Paglione, M., Saarikoski, S., Carbone, S., Hillamo, R., Facchini, M. C., Finessi, E., Giulianelli, L., Carbone, C., Fuzzi, S., Moretti, F., Tagliavini, E., Swietlicki, E., Eriksson Stenström, K., Prévôt, A. S. H., Massoli, P., Canaragatna, M., Worsnop, D., and Decesari, S.: Primary and secondary biomass burning aerosols determined by proton nuclear magnetic resonance (1H-NMR) spectroscopy during the 2008 EUCAARI campaign in the Po Valley (Italy), Atmos. Chem. Phys., 14, 5089–5110, https://doi.org/10.5194/acp-14-5089-2014, 2014a.
Paglione, M., Kiendler-Scharr, A., Mensah, A. A., Finessi, E., Giulianelli, L., Sandrini, S., Facchini, M. C., Fuzzi, S., Schlag, P., Piazzalunga, A., Tagliavini, E., Henzing, J. S., and Decesari, S.: Identification of humic-like substances (HULIS) in oxygenated organic aerosols using NMR and AMS factor analyses and liquid chromatographic techniques, Atmos. Chem. Phys., 14, 25–45, https://doi.org/10.5194/acp-14-25-2014, 2014b.
Paglione, M., Beddows, D. C. S., Jones, A., Lachlan-Cope, T., Rinaldi, M., Decesari, S., Manarini, F., Russo, M., Mansour, K., Harrison, R. M., Mazzanti, A., Tagliavini, E., and Dall'Osto, M.: Simultaneous organic aerosol source apportionment at two Antarctic sites reveals large-scale and ecoregion-specific components, Atmos. Chem. Phys., 24, 6305–6322, https://doi.org/10.5194/acp-24-6305-2024, 2024.
Pasquier, J. T., David, R. O., Freitas, G., Gierens, R., Gramlich, Y., Haslett, S., Li, G., Schäfer, B., Siegel, K., Wieder, J., Adachi, K., Belosi, F., Carlsen, T., Decesari, S., Ebell, K., Gilardoni, S., Gysel-Beer, M., Henneberger, J., Inoue, J., Kanji, Z. A., Koike, M., Kondo, Y., Krejci, R., Lohmann, U., Maturilli, M., Mazzolla, M., Modini, R., Mohr, C., Motos, G., Nenes, A., Nicosia, A., Ohata, S., Paglione, M., Park, S., Pileci, R. E., Ramelli, F., Rinaldi, M., Ritter, C., Sato, K., Storelvmo, T., Tobo, Y., Traversi, R., Viola, A., and Zieger, P.: The Ny-Ålesund Aerosol Cloud Experiment (NASCENT): Overview and First Results, B. Am. Meteorol. Soc., 103, 11, https://doi.org/10.1175/BAMS-D-21-0034.1, 2022.
Pernov, J.B., Harris, E., Volpi, M., Baumgartner, T., Hohermuth, B., Henne, S., Aeberhard, W. H., Becagli, S., Quinn, P. K., Traversi, R., Upchurch, L. M., and Schmale, J.: Pan-Arctic methanesulfonic acid aerosol: source regions, atmospheric drivers, and future projections, npj Clim. Atmos. Sci., 7, 166, https://doi.org/10.1038/s41612-024-00712-3, 2024.
Peters, G. P., Nilssen, T. B., Lindholt, L., Eide, M. S., Glomsrød, S., Eide, L. I., and Fuglestvedt, J. S.: Future emissions from shipping and petroleum activities in the Arctic, Atmos. Chem. Phys., 11, 5305–5320, https://doi.org/10.5194/acp-11-5305-2011, 2011.
Pizzolato, L., Howell, S. E. L., Dawson, J., Laliberté, F., and Copland, L.: The influence of declining sea ice on shipping activity in the Canadian Arctic, Geophysical Research Letters, 43, 12146–12,54, https://doi.org/10.1002/2016GL071489, 2016.
Polissar, A. V., Hopke, P. K., Paatero, P., Malm, W. C., and Sisler, J. F.: Atmospheric aerosol over Alaska: 2. Elemental composition and sources, J. Geophys. Res. Atmos., 103, 19045–19057, 1998.
Popovicheva, O., Diapouli, E., Chichaeva, M., Kosheleva, N., Kovach, R., Bitukova, V., Eleftheriadis, K., and Kasimov, N.: Aerosol characterization and peculiarities of source apportionment in Moscow, the largest and northernmost European megacity, Sci. Total Environ., 918, 170315, https://doi.org/10.1016/j.scitotenv.2024.170315, 2024.
Quinn, P. K., Shaw, G., Andrews, E., Dutton, E. G., Ruoho-Airola, T., and Gong, S. L.: Arctic haze: current trends and knowledge gaps, Tellus B, 59, 99–114, https://doi.org/10.1111/j.1600-0889.2006.00236.x, 2007.
Ricard, V., Jaffrezo, J. L., Kerminen, V. M., Hillamo, R. E., Sillanpaa, M., Ruellan, S., Liousse, C., and Cachier, H.: Two years of continuous aerosol measurements in northern Finland, J. Geophys. Res.-Atmos., 107, ACH 10-1–ACH 10-17, https://doi.org/10.1029/2001jd000952, 2002.
Rinaldi, M., Fuzzi, S., Decesari, S., Marullo, S., Santoleri, R., Provenzale, A., von Hardenberg, J., Ceburnis, D., Vaishya, A., O'Dowd, C. D. and Facchini, M. C.: Is chlorophyll-a the best surrogate for organic matter enrichment in submicron primary marine aerosol?, J. Geophys. Res. Atmospheres, 118, 4964–4973, https://doi.org/10.1002/jgrd.50417, 2013.
Rinaldi, M., Hiranuma, N., Santachiara, G., Mazzola, M., Mansour, K., Paglione, M., Rodriguez, C. A., Traversi, R., Becagli, S., Cappelletti, D., and Belosi, F.: Ice-nucleating particle concentration measurements from Ny-Ålesund during the Arctic spring–summer in 2018, Atmos. Chem. Phys., 21, 14725–14748, https://doi.org/10.5194/acp-21-14725-2021, 2021.
Rolph, G., Stein, A., and Stunder, B.: Real-time Environmental Applications and Display sYstem: READY, Environmental Modelling & Software, 95, 210–228, https://doi.org/10.1016/j.envsoft.2017.06.025, 2017.
Saha, M. and Fink, P.: Algal volatiles – the overlooked chemical language of aquatic primary producers, Biological Reviews, 97, 2162–2173, https://doi.org/10.1111/brv.12887, 2022.
Schmale, J., Zieger, P., and Ekman, A. M.: Aerosols in current and future Arctic climate, Nat. Clim. Change, 11, 95–105, https://doi.org/10.1038/s41558-020-00969-5, 2021.
Schmale, J., Sharma, S., Decesari, S., Pernov, J., Massling, A., Hansson, H.-C., von Salzen, K., Skov, H., Andrews, E., Quinn, P. K., Upchurch, L. M., Eleftheriadis, K., Traversi, R., Gilardoni, S., Mazzola, M., Laing, J., and Hopke, P.: Pan-Arctic seasonal cycles and long-term trends of aerosol properties from 10 observatories, Atmos. Chem. Phys., 22, 3067–3096, https://doi.org/10.5194/acp-22-3067-2022, 2022.
Shaw, G. E.: The Arctic Haze Phenomenon, B. Am. Meteorol. Soc., 76, 2403–2413, https://doi.org/10.1175/1520-0477(1995)076<2403:TAHP>2.0.CO;2 1995.
Serreze, M. C. and Barry, R. G.: Processes and impacts of Arctic amplification: A research synthesis, Global Planet. Change, 77, 85–96, https://doi.org/10.1016/j.gloplacha.2011.03.004, 2011.
Song, C., Dall'Osto, M., Lupi, A., Mazzola, M., Traversi, R., Becagli, S., Gilardoni, S., Vratolis, S., Yttri, K. E., Beddows, D. C. S., Schmale, J., Brean, J., Kramawijaya, A. G., Harrison, R. M., and Shi, Z.: Differentiation of coarse-mode anthropogenic, marine and dust particles in the High Arctic islands of Svalbard, Atmos. Chem. Phys., 21, 11317–11335, https://doi.org/10.5194/acp-21-11317-2021, 2021.
Stein, A. F., Draxler, R. R., Rolph, G. D., Stunder, B. J. B., Cohen, M. D., and Ngan, F.: NOAA'S HYSPLIT ATMOSPHERIC TRANSPORT AND DISPERSION MODELING SYSTEM, Bulletin of the American Meteorological Society, 96, 2059–2077, https://doi.org/10.1175/bams-d-14-00110.1, 2015.
Suzuki, Y., Kawakami, M., and Akasaka, K.: 1H NMR Application for Characterizing Water-Soluble Organic Compounds in Urban Atmospheric Particles, Environ. Sci. Technol., 35, 2656–2664, https://doi.org/10.1021/es001861a, 2001.
Tauler, R.: Multivariate Curve Resolution applied to second order data, Chem. Int. Laborat. Syst., 30, 133–146, 1995
Tagliavini, E., Moretti, F., Decesari, S., Facchini, M. C., Fuzzi, S., and Maenhaut, W.: Functional group analysis by H NMR/chemical derivatization for the characterization of organic aerosol from the SMOCC field campaign, Atmos. Chem. Phys., 6, 1003–1019, https://doi.org/10.5194/acp-6-1003-2006, 2006.
Tagliavini, E., Decesari, S., Paglione, M., and Mazzanti, M.: NMR spectroscopic applications to atmospheric organic aerosol analysis – Part 2: A review of existing methodologies and perspectives, Trends in Analytical Chemistry (TrAC), 172, 117595, https://doi.org/10.1016/j.trac.2024.117595, 2024.
Ulbrich, I. M., Canagaratna, M. R., Zhang, Q., Worsnop, D. R., and Jimenez, J. L.: Interpretation of organic components from Positive Matrix Factorization of aerosol mass spectrometric data, Atmos. Chem. Phys., 9, 2891–2918, https://doi.org/10.5194/acp-9-2891-2009, 2009.
Van Alstyne, K. and Houser, L.: Dimethylsulfide release during macroinvertebrate grazing and its role as an activated chemical defense, Mar. Ecol. Prog. Ser., 250, 175–181, https://doi.org/10.3354/meps250175, 2003.
Yazdani, A., Takahama, S., Kodros, J. K., Paglione, M., Masiol, M., Squizzato, S., Florou, K., Kaltsonoudis, C., Jorga, S. D., Pandis, S. N., and Nenes, A.: Chemical evolution of primary and secondary biomass burning aerosols during daytime and nighttime, Atmos. Chem. Phys., 23, 7461–7477, https://doi.org/10.5194/acp-23-7461-2023, 2023.
Yttri, K. E., Lund Myhre, C., Eckhardt, S., Fiebig, M., Dye, C., Hirdman, D., Ström, J., Klimont, Z., and Stohl, A.: Quantifying black carbon from biomass burning by means of levoglucosan – a one-year time series at the Arctic observatory Zeppelin, Atmos. Chem. Phys., 14, 6427–6442, https://doi.org/10.5194/acp-14-6427-2014, 2014.
Yttri, K. E., Bäcklund, A., Conen, F., Eckhardt, S., Evangeliou, N., Fiebig, M., Kasper-Giebl, A., Gold, A., Gundersen, H., Myhre, C. L., Platt, S. M., Simpson, D., Surratt, J. D., Szidat, S., Rauber, M., Tørseth, K., Ytre-Eide, M. A., Zhang, Z., and Aas, W.: Composition and sources of carbonaceous aerosol in the European Arctic at Zeppelin Observatory, Svalbard (2017 to 2020), Atmos. Chem. Phys., 24, 2731–2758, https://doi.org/10.5194/acp-24-2731-2024, 2024.
Zanca, N., Lambe, A. T., Massoli, P., Paglione, M., Croasdale, D. R., Parmar, Y., Tagliavini, E., Gilardoni, S., and Decesari, S.: Characterizing source fingerprints and ageing processes in laboratory-generated secondary organic aerosols using proton-nuclear magnetic resonance (1H-NMR) analysis and HPLC HULIS determination, Atmos. Chem. Phys., 17, 10405–10421, https://doi.org/10.5194/acp-17-10405-2017, 2017.
Zangrando, R., Barbaro, E., Vecchiato, M., Kehrwald, N. M., Barbante, C., and Gambaro, A.: Levoglucosan and phenols in Antarctic marine, coastal and plateau aerosols, Science of the Total Environment, 544, 606–616, 2016.
Zhang, Q., Jimenez, J. L., Canagaratna, M. R., Ulbrich, I. M., Ng, N. L., Worsnop, D. R., and Sun, Y.: Understanding atmospheric organic aerosols via factor analysis of aerosol mass spectrometry: a review, Anal. Bioanal. Chem., 401, 3045–3067, 2011.
Zorn, S. R., Drewnick, F., Schott, M., Hoffmann, T., and Borrmann, S.: Characterization of the South Atlantic marine boundary layer aerosol using an aerodyne aerosol mass spectrometer, Atmos. Chem. Phys., 8, 4711–4728, https://doi.org/10.5194/acp-8-4711-2008, 2008.