the Creative Commons Attribution 4.0 License.
the Creative Commons Attribution 4.0 License.
 | 10 Oct 2025
Individual particle compositions and aerosol mixing states at different altitudes over the ocean in East Asia
Atsushi Yoshida
Tatsuhiro Mori
Nobuhiro Moteki
Sho Ohata
Kazuyuki Kita
Yoshimi Kawai
Makoto Koike
Aerosol composition and mixing state influence its ability to form cloud droplets and ice crystals and to scatter and absorb sunlight, all of which affect its impact on climate. In this study, aerosol samples were collected from different altitudes, ranging from the sea surface to ∼ 8000 m, over the ocean in the western North Pacific in the summer of 2022 using an aircraft and a research vessel. The samples were classified into three periods based on the sampled air parcel sources: ocean and desert (period 1), Siberian Forest biomass burning event (period 2), and their mixtures (period 3). Measurements of particle composition using transmission electron microscopy with energy-dispersive X-ray spectrometry revealed that samples from period 1 had high sea salt and mineral dust fractions, whereas samples from period 2 had high fractions of potassium-bearing particles with organics and black carbon. Samples from period 3 showed influences of both sea spray and biomass burning. During periods 1 and 3, the sea salt fractions increased as the samples were collected at lower altitudes. The compositions of biomass burning and sea spray were mixed at individual particles, with higher fractions of Na and K during period 1 and period 2, respectively, than in other periods. Our analysis of individual particles revealed a wide range of compositions and mixing states of particles, which depend on the aerosol source, size, and altitude. These factors need to be considered when evaluating aerosol composition and mixing state, both of which affect aerosol climate effects.
- Article
(8550 KB) - Full-text XML
-
Supplement
(2403 KB) - BibTeX
- EndNote


Atmospheric aerosols have a major impact on climate by scattering and absorbing sunlight and becoming cloud condensation nuclei (CCN) and ice nucleating particles (INPs) (e.g., Pöschl, 2005; Pósfai and Buseck, 2010). They also affect human health and visibility. These impacts depend on their composition, shape, and physical and chemical configurations at the individual scale (mixing states) in addition to their size distribution and concentration in the atmosphere (Li et al., 2024; Reid et al., 2018). These aerosol properties depend on their emission sources, such as anthropogenic, marine, desert, forest, and biomass burning (e.g., Carslaw et al., 2010; Satheesh and Moorthy, 2005), as well as atmospheric processes.
Aerosol particles can transport for days or weeks in the atmosphere from their emission sources and are eventually removed from the atmosphere by precipitation and dry deposition (e.g., Gao et al., 2022; Oshima et al., 2012). As they travel through the atmosphere, they change their original composition, size, and shape by interacting with gases and other aerosol constituents (e.g., Moteki et al., 2007; Riemer et al., 2019). Eventually, they form mixed particles that contain several or more components originating from different sources within individual particles (Adachi and Buseck, 2008; Li et al., 2016; Riemer et al., 2019). Such changes in the physical, chemical, and optical properties of particles due to their mixing states affect the radiative forcing of aerosols, thereby altering their response to climate (Adachi et al., 2010; Cappa et al., 2012; Chung and Seinfeld, 2002; Jacobson, 2001). For example, light-absorbing particles (e.g., black carbon) coated with light-scattering materials (e.g., sulfate and organic matter) enhance their light absorption by focusing incident light on the light-absorbing materials (Bond et al., 2013; Wang et al., 2025). Mixing of hygroscopic materials with hydrophobic particles can alter their hygroscopicity, influencing their CCN and INP activities (Riemer et al., 2019; Lohmann et al., 2020). Mixing aerosols with other materials can alter their size distribution, which influences their optical properties (Moteki et al., 2007). Therefore, the physical and chemical properties of aerosol particles from different sources and transport histories need to be clarified to accurately evaluate their climate impact (Pöschl, 2005).
Asia is a densely populated region, and its anthropogenic aerosol emissions have a significant impact on the global scale (e.g., Hoesly et al., 2018). In addition, Asian dust events from, e.g., the Gobi and Taklamakan deserts cause regional pollution events over East Asia (Uno et al., 2009; Wang et al., 2008). Biomass burning events, including the Siberian Forest fires, can also become significant aerosol sources and affect regional air quality (Agarwal et al., 2010; Johnson et al., 2021; Matsui et al., 2013; Warneke et al., 2010). As a result, East Asia has a complex mixture of aerosols from various sources (Zhou et al., 2018), and these aerosols have a large impact on global climate (e.g., Hoesly et al., 2018; Yang et al., 2024).
In this study, we conducted simultaneous airborne and shipboard observations (Koike et al., 2025). Airborne observations using an aircraft can measure atmospheric gases and aerosols at different altitudes and across a large area in a single day. Information about altitude-dependent aerosol compositions is especially important for evaluating, for example, their influence on health at ground level and on CCN activity at cloud height. On the other hand, shipboard measurements can continuously observe the air for weeks and have a large payload. The airborne observations conduct measurements in both the boundary layer and the free troposphere, whereas the shipboard observations measure the boundary layer, which is strongly influenced by the ocean surface. The simultaneous airborne and shipboard observation has the advantage of collecting samples from the sea surface to high altitudes and can cover a wide range of areas and timescales over the ocean, which is one of the largest natural global aerosol sources, emitting aerosols through sea spray and biological activity (Lewis and Schwartz, 2004; Vignati et al., 2010).
We collected aerosol samples in the western North Pacific over the ocean near Japan using an aircraft and a research vessel. The sampling allows us to evaluate the mixing of sea spray and long-range transported aerosol particles over the ocean. We used transmission electron microscopy (TEM), which is a powerful tool to measure the compositions of small particles and their mixing states at an individual particle scale. This study aims to characterize individual aerosol particles from different altitudes in East Asia and evaluate the implications for their climate impacts.
2.1 Sampling campaign using an aircraft and a research vessel
The airborne observation was conducted as part of the Aerosol Radiative Forcing in East Asia (A-Force 2022) campaign using a Beechcraft King Air, twin-turboprop aircraft (Koike et al., 2025). This aircraft was based at Memanbetsu Airport in Hokkaido between 19 July and 2 August 2022 and conducted eight research flights and two transit flights. This study focused on five research flights on 22, 27, 29, and 30 July and 1 August 2022. Based on Table 3 in Koike et al. (2025), these flights are referred to as flight 4 (abbreviated as F4), F6, F8, F9, and F10, respectively. These selected flights included simultaneous aerosol sampling from both the aircraft and the research vessel during the periods of different atmospheric events (Fig. 1). Each flight lasted about 4 to 5 h, starting at about 10:00 am local time (Japanese standard time; or 01:00 UTC). Filter-based aerosol composition measurements using a complex amplitude sensor (CAS) and a scanning electron microscope during the same flights were presented by Ohata et al. (2025), who showed the number concentrations and size distributions of mineral dust particles.
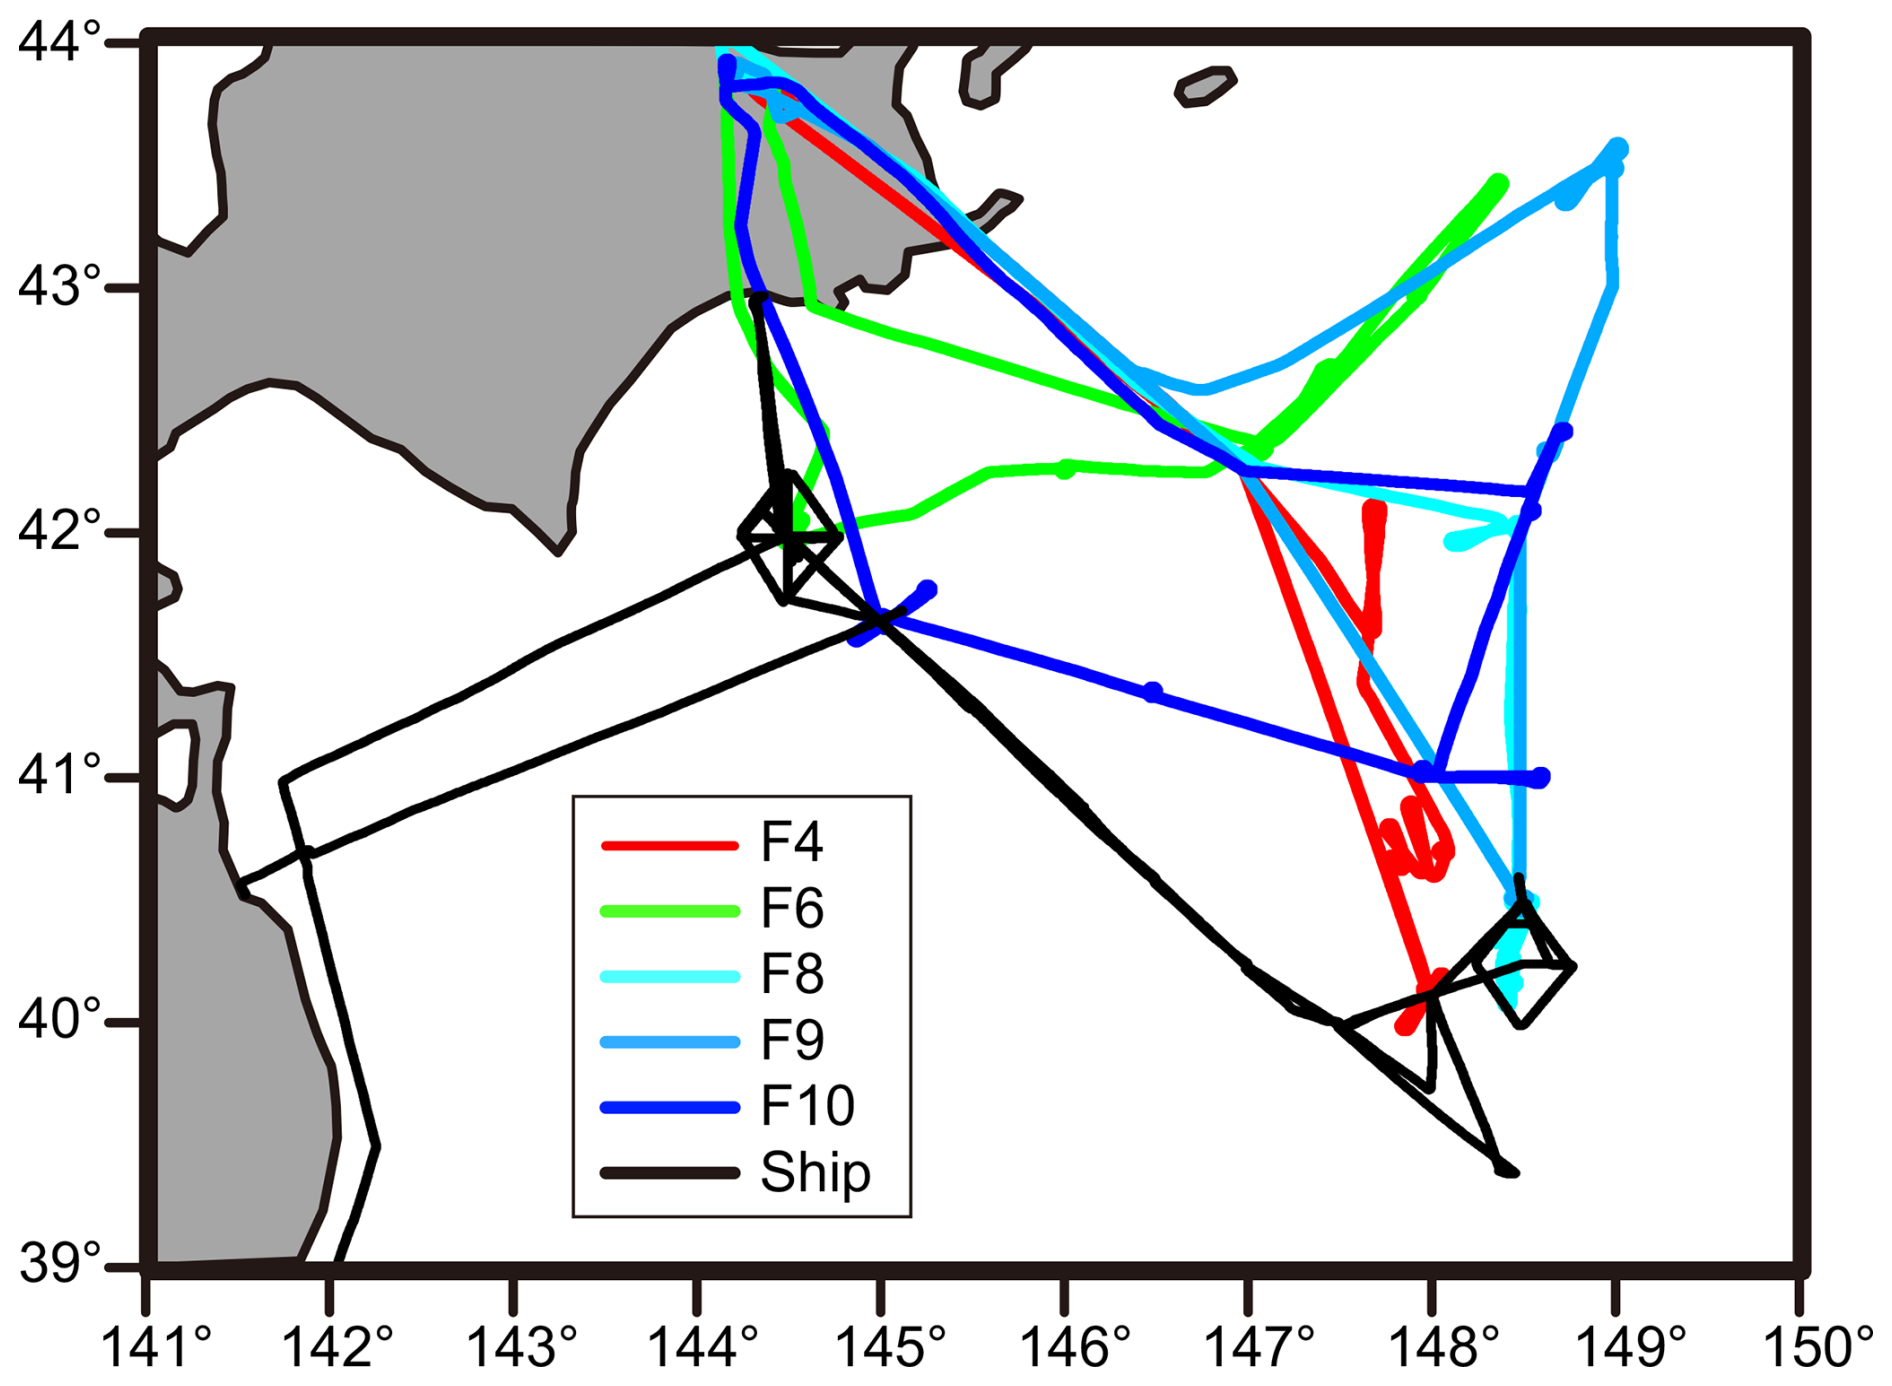
Figure 1Trajectories of airborne and shipboard measurements used in this study.
The research vessel ( Shinsei-maru) departed from Yokosuka on 15 July and had continuous observations from 18 July to 1 August in the western North Pacific in collaboration with the aircraft (JURCAOS and JAMSTEC, 2022; Koike et al., 2025) (Fig. 1). Both the aircraft and research vessel had synchronized observations for ∼ 20 min to 1 h for every research flight day. Details of the airborne and shipboard measurements were also described in a review by Koike et al. (2025). Other results obtained during this campaign have been reported elsewhere (Moteki et al., 2023; Ohata et al., 2025; Yoshida et al., 2024).
2.2 Aerosol samplings during the airborne and shipboard measurements
Aerosol samples were collected on 200 mesh TEM grids with a Formvar substrate using impactor samplers (AS-24W, Arios, Japan) during both airborne and shipboard sampling. The samplers collected fine-mode aerosol samples with 50 % lower/upper cutoff aerodynamic diameters of 300 and 700 nm, respectively, using an airflow of 1 L min−1. The samplers used disks equipped with 24 TEM grids. They collected samples by automatically changing the TEM grids at set sample collection times using a timer. Details of the TEM sampler are described elsewhere (Adachi et al., 2021, 2022).
The airborne sampling used a forward-facing isokinetic inlet (Droplet Measurement Technologies, USA) (McNaughton et al., 2007). During each flight, 24 TEM samples with an 11 min sampling time were collected at 1 min intervals (e.g., 00:00–00:11; 00:12–00:23; 00:24–00:35; …). The sampling time is the same as that of the previous airborne measurements in this area (Adachi et al., 2022) and was sufficient to cover the entire flight time (∼ 4–5 h) with adequate particle loading.
For the shipboard sampling, samples were continuously collected from an inlet at 14 m above sea level using 30 min sampling times with 90 min intervals (e.g., 01:00–01:30; 03:00–03:30; 05:00–05:30; …) (Koike et al., 2025). The sampling time was chosen to collect enough particles under clean conditions (e.g., Adachi et al., 2023). The disks containing 24 TEM grids for the shipboard sampling were replaced every 48 h.
2.3 Transmission electron microscopy measurements
Aerosol particles were measured using a transmission electron microscope (JEM-1400, JEOL, Japan) equipped with an energy-dispersive X-ray spectrometer (EDS; X-Max80, Oxford Instruments, Japan) for both TEM and scanning transmission electron microscopy (STEM) modes. The TEM and STEM modes were used for conducting TEM imaging and for compositional measurements, respectively. First, we took ∼ 30 TEM images from all samples (198 airborne samples and 153 shipboard samples). Second, based on analyses of the TEM images (Figs. S1 and S2 in the Supplement), we selected one representative area per TEM sample with an adequate number of particles (i.e., not overloaded). We measured TEM samples for the five flights (109 TEM samples) and 13 shipboard TEM samples that covered the synchronized measurements with the aircraft (two or three shipboard samples during each flight) (Table 1). Third, we measured all particles (89 particles on average) within the selected area with a magnification of 6000 (∼ 220 µm2) using STEM with EDS measurements (STEM-EDS). For the airborne and shipboard samples, we measured 9058 and 1650 particles from 109 and 13 TEM grids, respectively (Table 1).
Using STEM-EDS measurements, we analyzed particle compositions, sizes, and shapes. Within each area, we selected a threshold to discriminate between particles and substrate in the dark-field STEM image (Adachi et al., 2019). Here, we measured all detected particles with an area-equivalent diameter greater than 0.19 µm, which is equivalent to 100 pixels in the STEM images. An area-equivalent diameter is the diameter of a sphere with the same area as the projected area of the selected particle and typically indicates larger values than that of the aerodynamic diameter of the same particle when a particle spreads over the substrate. The STEM image, area equivalent diameter, and EDS spectrum were obtained for each individual particle. Elemental compositions (weight percentage) within selected elements (C, N, O, Na, Mg, Al, Si, P, S, Cl, K, Ca, Ti, V, Cr, Mn, Fe, Zn, and Pb) were obtained from EDS spectra using 120 kV acceleration voltage and 20 s aquation times. The detection limits of the selected elements were typically 0.02 wt % based on one sigma of the measured peak intensity. TEM images were taken before and after the STEM-EDS measurements to measure the mixing states and detect inclusions within the particles (Figs. S1 and S2). The conditions of the STEM-EDS measurement are the same as those used in our previous studies (e.g., Adachi et al., 2023, 2025).
2.4 Particle classifications
Based on the STEM-EDS measurements and threshold weight percentage values of tracer elements, we classified the measured particles into seven categories (Fig. S3). The particle types and tracer elements are as follows: (1) mineral dust particles (Al and Si), (2) sea salt particles (Na and Mg), (3) K-bearing particles (K), (4) Ca-Mg-bearing particles (Ca and Mg), (5) sulfate (S), (6) carbonaceous particles (C and O), and (7) others. Similar flowcharts have been used in our previous papers (e.g., Adachi et al., 2021, 2022, 2023, 2025), but the tracer elements and threshold values were modified based on the dominant aerosol sources. For example, the current study included Ca-Mg-bearing particles because they were uniquely found in the current samples. The particle images and compositions were checked one by one to verify that the categorized particles reasonably represented the particles in the samples.
Although individual particles are mixtures of several components (e.g., sea salt + sulfate particles), we have simply classified them into these single categories, focusing mainly on primary aerosol particles and prioritizing the smaller particle type numbers (1 to 7) shown in the above paragraph. Such prioritized aerosol species include mineral dust and sea salt particles, which are important INP and CCN contributors to the activation of ice crystals and water droplets, respectively. Meanwhile, it should be noted that the number classification differs from that based on aerosol mass concentrations. That is, secondary aerosol particles (e.g., sulfate and organic aerosol particles) that are condensed onto pre-existing particles and are detected from nearly all particles will be underestimated in the number fractions when compared to their mass fraction values.
2.5 Black carbon measurements
A single particle soot photometer (SP2, Droplet Measurement Technologies, USA) was used to measure the mass concentrations of black carbon (BC) particles from the airborne measurements. The BC mass concentration in this study was based on those with a mass equivalent diameter of 0.071–1.0 µm by assuming a void-free density of 1.8 g cm−3 (Ohata et al., 2025). The conditions of the SP2 measurements were described in previous reports (Koike et al., 2025; Ohata et al., 2025). Details of this instrument are also described in Moteki and Kondo (2010).
2.6 Back-trajectory measurements
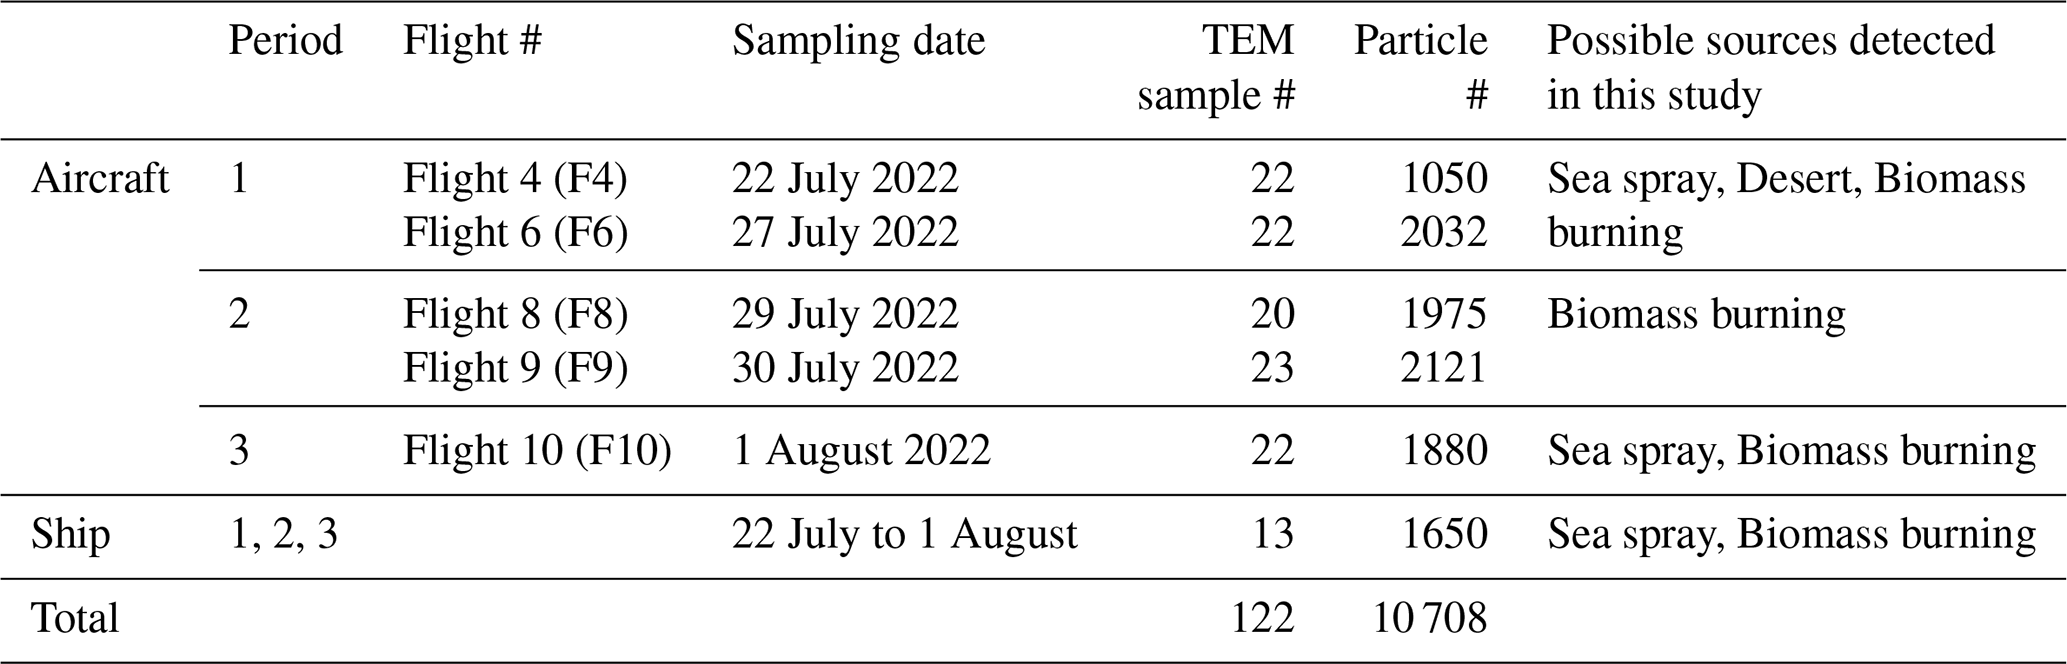
We used a Meteorological Data Explorer (METEX) back-trajectory model provided by the National Institute of Environmental Studies (NIES) (Zeng et al., 2003) to evaluate the possible source of an air parcel sampled by the aircraft (Figs. 2, S4, and S5). The starting points of these back-trajectories were based on the altitude and position of the aircraft every hour from 02:00 to 06:00 UTC (Table S1). We also plotted fire spots that occurred during the campaign using NASA's Fire Information for Resource Management System (NASA FIRMS, 2025).
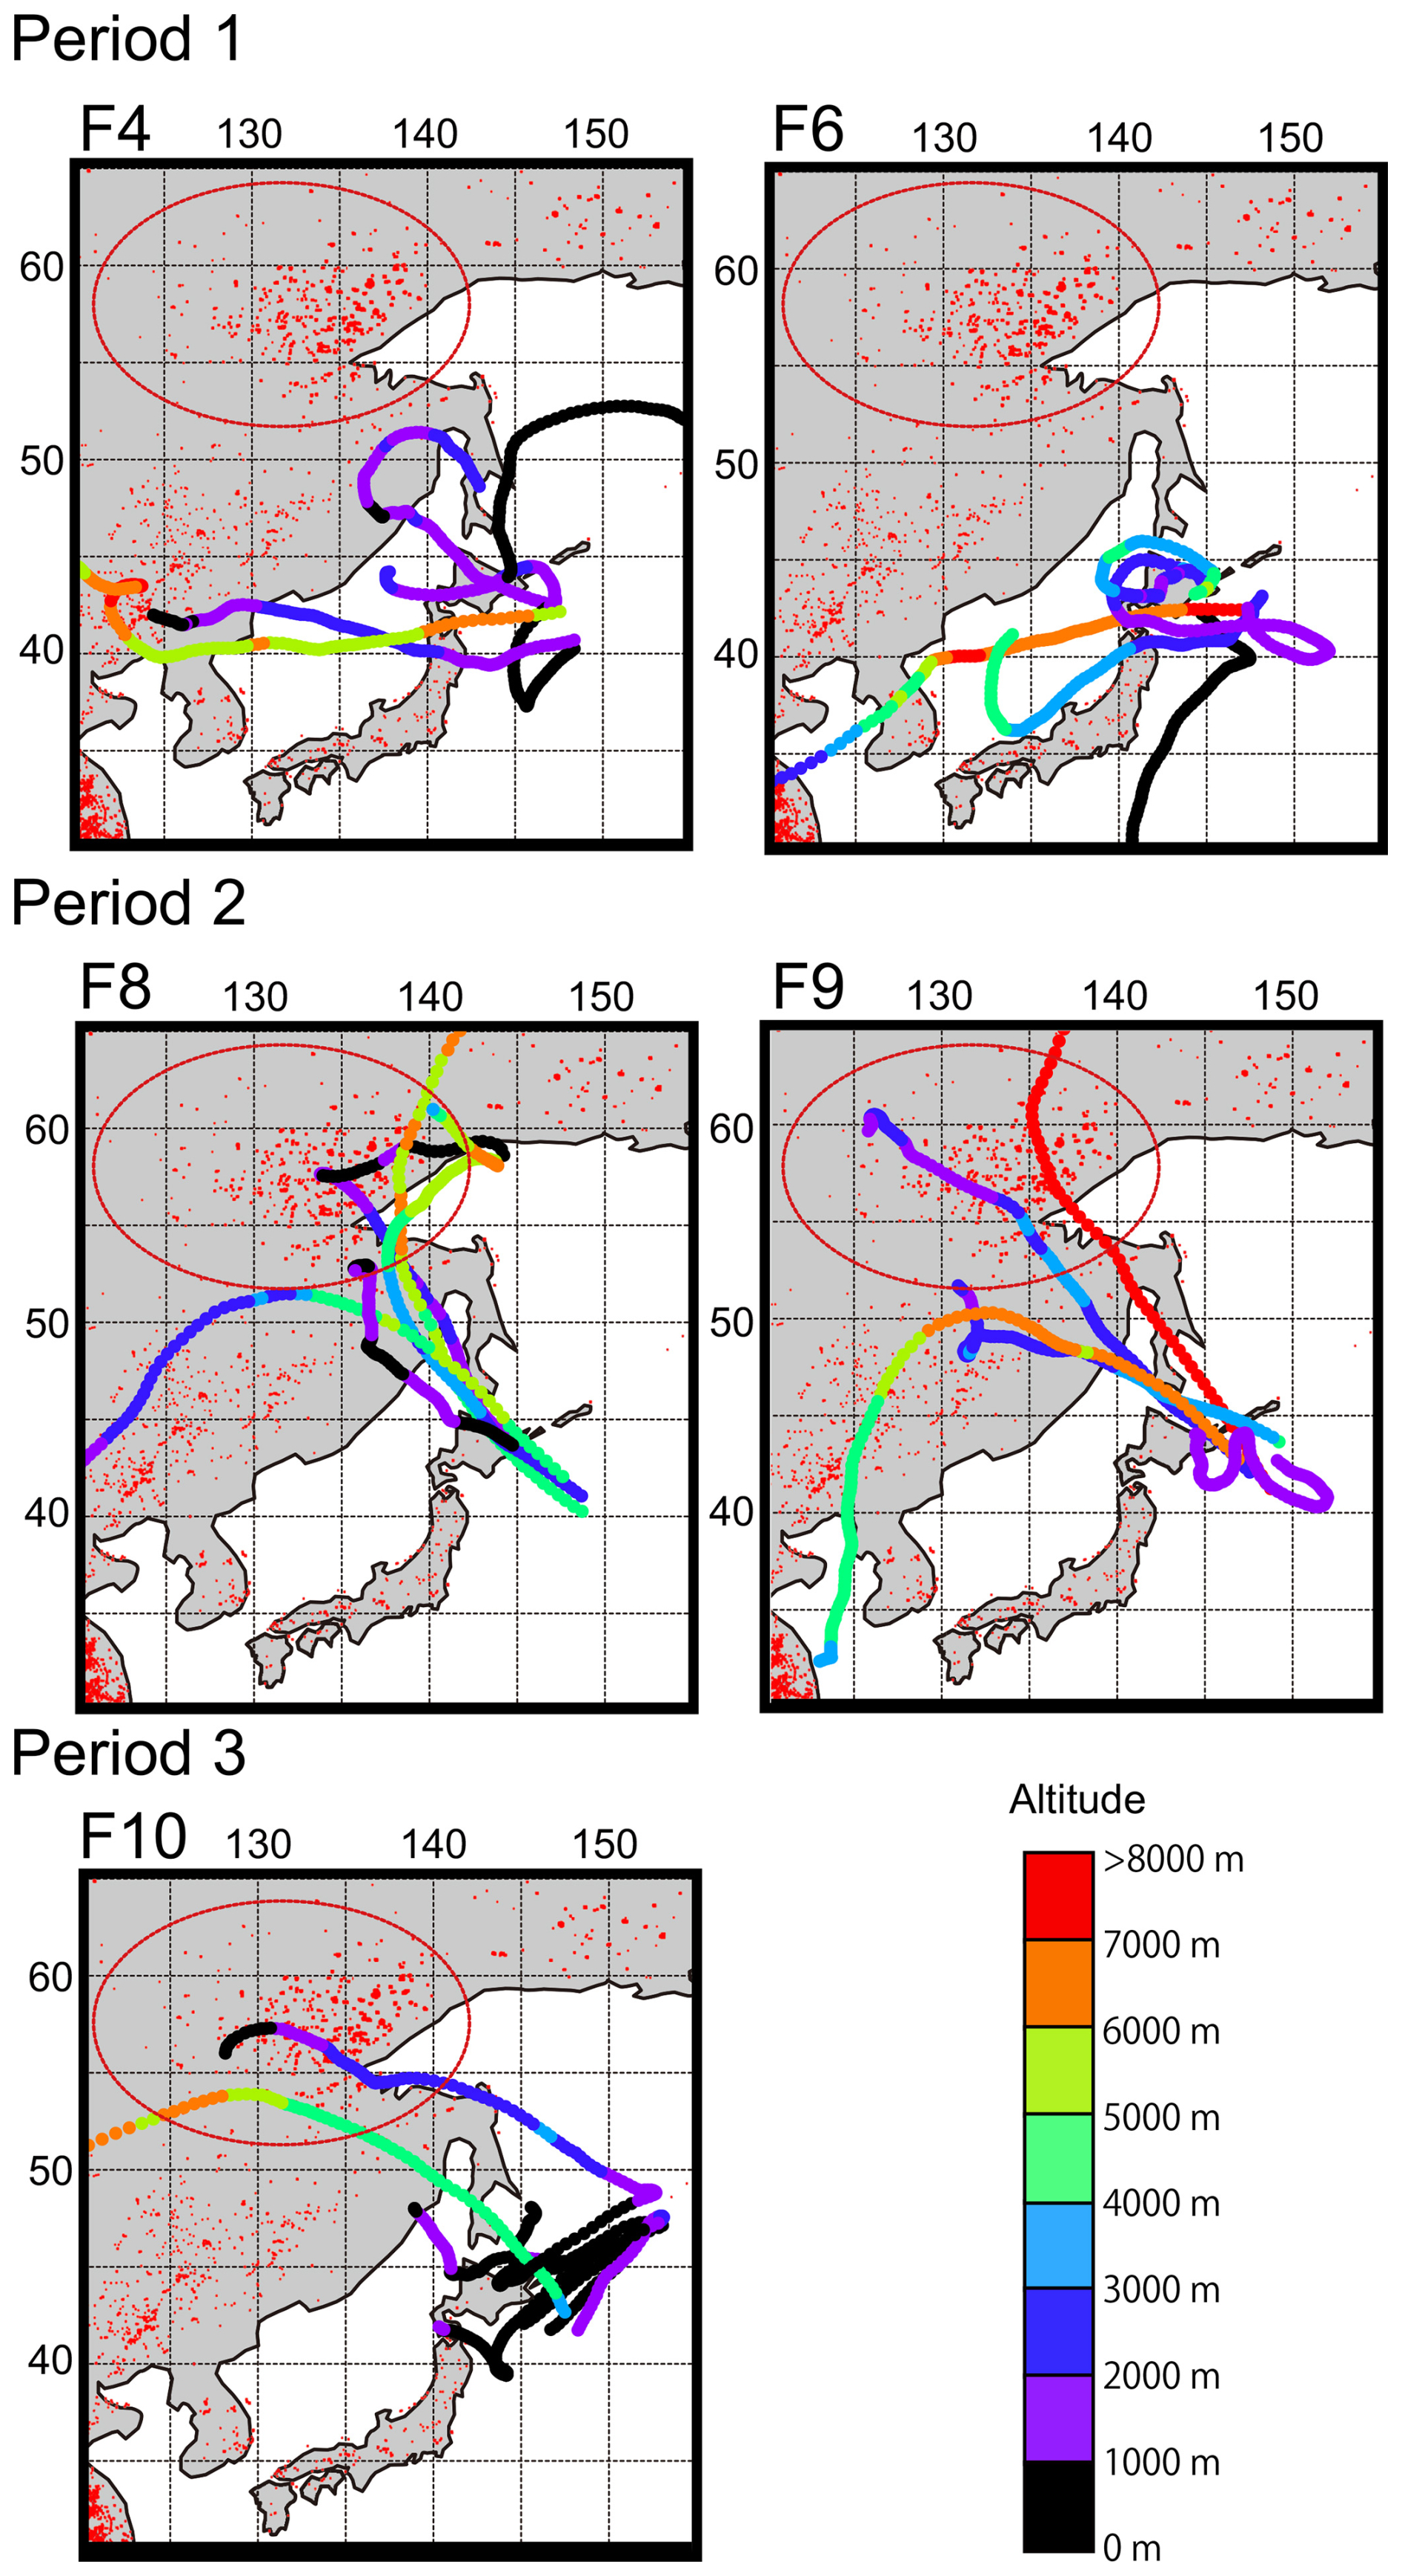
Figure 2Back-trajectories of sampled air parcels during each flight. Trajectories (120 h) started each hour along the flight passes. Colors along the trajectories indicate altitudes. Red dots on the maps indicate active fires during the sampling period (from 22 July to 1 August 2022) from NASA's Fire Information for Resource Management System (NASA FIRMS, 2025). The area of Siberian Forest biomass burning is marked with a red circle. The elevation plots of each trajectory and the plots outside the selected area are shown in Figs. S4 and S5, respectively.
3.1 Possible sources of the sampled air parcel
During the campaign, the sampled aerosol particles originated from or were transported over the ocean, desert, Siberian Forest biomass burning, and other sources (e.g., anthropogenic and small biomass burning sources) (Fig. 2). We characterized each flight based on the aerosol sources using a 5 d back-trajectory model (Figs. 2, S4, and S5). The research flights were grouped into three periods based on their trajectories. On 22 and 27 July (F4 and F6, respectively), the air parcel came from the ocean around Japan and the land over northern East Asia (period 1). On 29 and 30 July (F8 and F9, respectively), the air parcel came mainly from the northwest over large biomass burning events in the eastern Siberian Forest and around northern East Asia (period 2). On 1 August (F10), the air parcels originated from the ocean northeast of Japan and the Siberian Forest biomass burning area (period 3). The back-trajectories of all flights were mostly transported from below ∼ 3000 m, suggesting that they could be influenced by ground-level emissions such as biomass burning and sea spray (Fig. S4).
BC is a tracer of combustion, including biomass burning and anthropogenic sources (Bond et al., 2013). BC mass concentrations were measured at different altitudes for each flight. BC concentrations showed an increase at altitudes between 1000 and 3000 m, peaking at ∼ 2000 m for all flights (Fig. S6). The flights during period 2 (F8 and F9) had the highest BC concentrations, peaking at ∼ 400 and ∼ 1000 ng m−3, respectively. The trajectories of both flights originated from Siberian Forest biomass burning. The BC concentration in period 3 showed some increase (∼ 100 ng m−3) when the air parcel originated from the biomass burning area. In contrast, the BC concentrations during period 1 were relatively low (mainly < 100 ng m−3). The measurements of BC concentrations together with the trajectory analysis suggested a strong influence of Siberian Forest biomass burning during the campaign, especially for period 2. This interpretation is supported by the studies of Koike et al. (2025) and Ohata et al. (2025), who showed the influences of biomass burning based on their observations and modeling. The altitude at which the BC concentration peaked (∼ 2000 m) was just above a cloud layer (1700–1900 m), suggesting that BC below the cloud layer may be removed by the cloud and precipitation (Koike et al., 2025). Although anthropogenic sources and small-scale biomass burning in northern East Asia (< ∼ 50° N) emit BC, as seen in the measurements during period 1 (Fig. 2), their contributions during our measurements could be smaller than that from Siberian Forest biomass burning, as samples from period 2 had much higher BC concentrations than other periods.
3.2 Composition and mixing state of aerosol particles
In Figs. 3 and 4, TEM images and elemental mappings show the mixing states of aerosol particles from simultaneously collected shipboard and airborne (< 1000 m) samples. The original TEM images indicate intact aerosol shapes collected on the substrate (images to the left in Figs. 3 and 4). The TEM images after STEM-EDS analysis reveal inclusions of, for example, soot and mineral dust within sulfate (middle images in Figs. 3 and 4), which are also indicated in Fig. S7. In these images, the electron beam removed beam-sensitive materials such as sulfate by exposing nearly 1 h or ∼ 100 repeated scans (Figs. 3 and 4) (Adachi et al., 2023; Egerton et al., 2004).
Figure 3Mixing states and compositions of representative samples from each flight. Left: original TEM images. Middle: TEM images after elemental mapping analyses. Sulfate and other beam-sensitive materials were removed by the electron beam. Right: elemental mappings of C, Na, S, and K. All samples were collected below 1000 m altitude. Sampling times were (a) 22 July 03:36–03:47 UTC; (b) 27 July 04:12–04:23 UTC; (c) 29 July 04:12–04:23 UTC; (d) 30 July 01:36–01:47 UTC; and (e) 1 August 01:48–01:59 UTC.
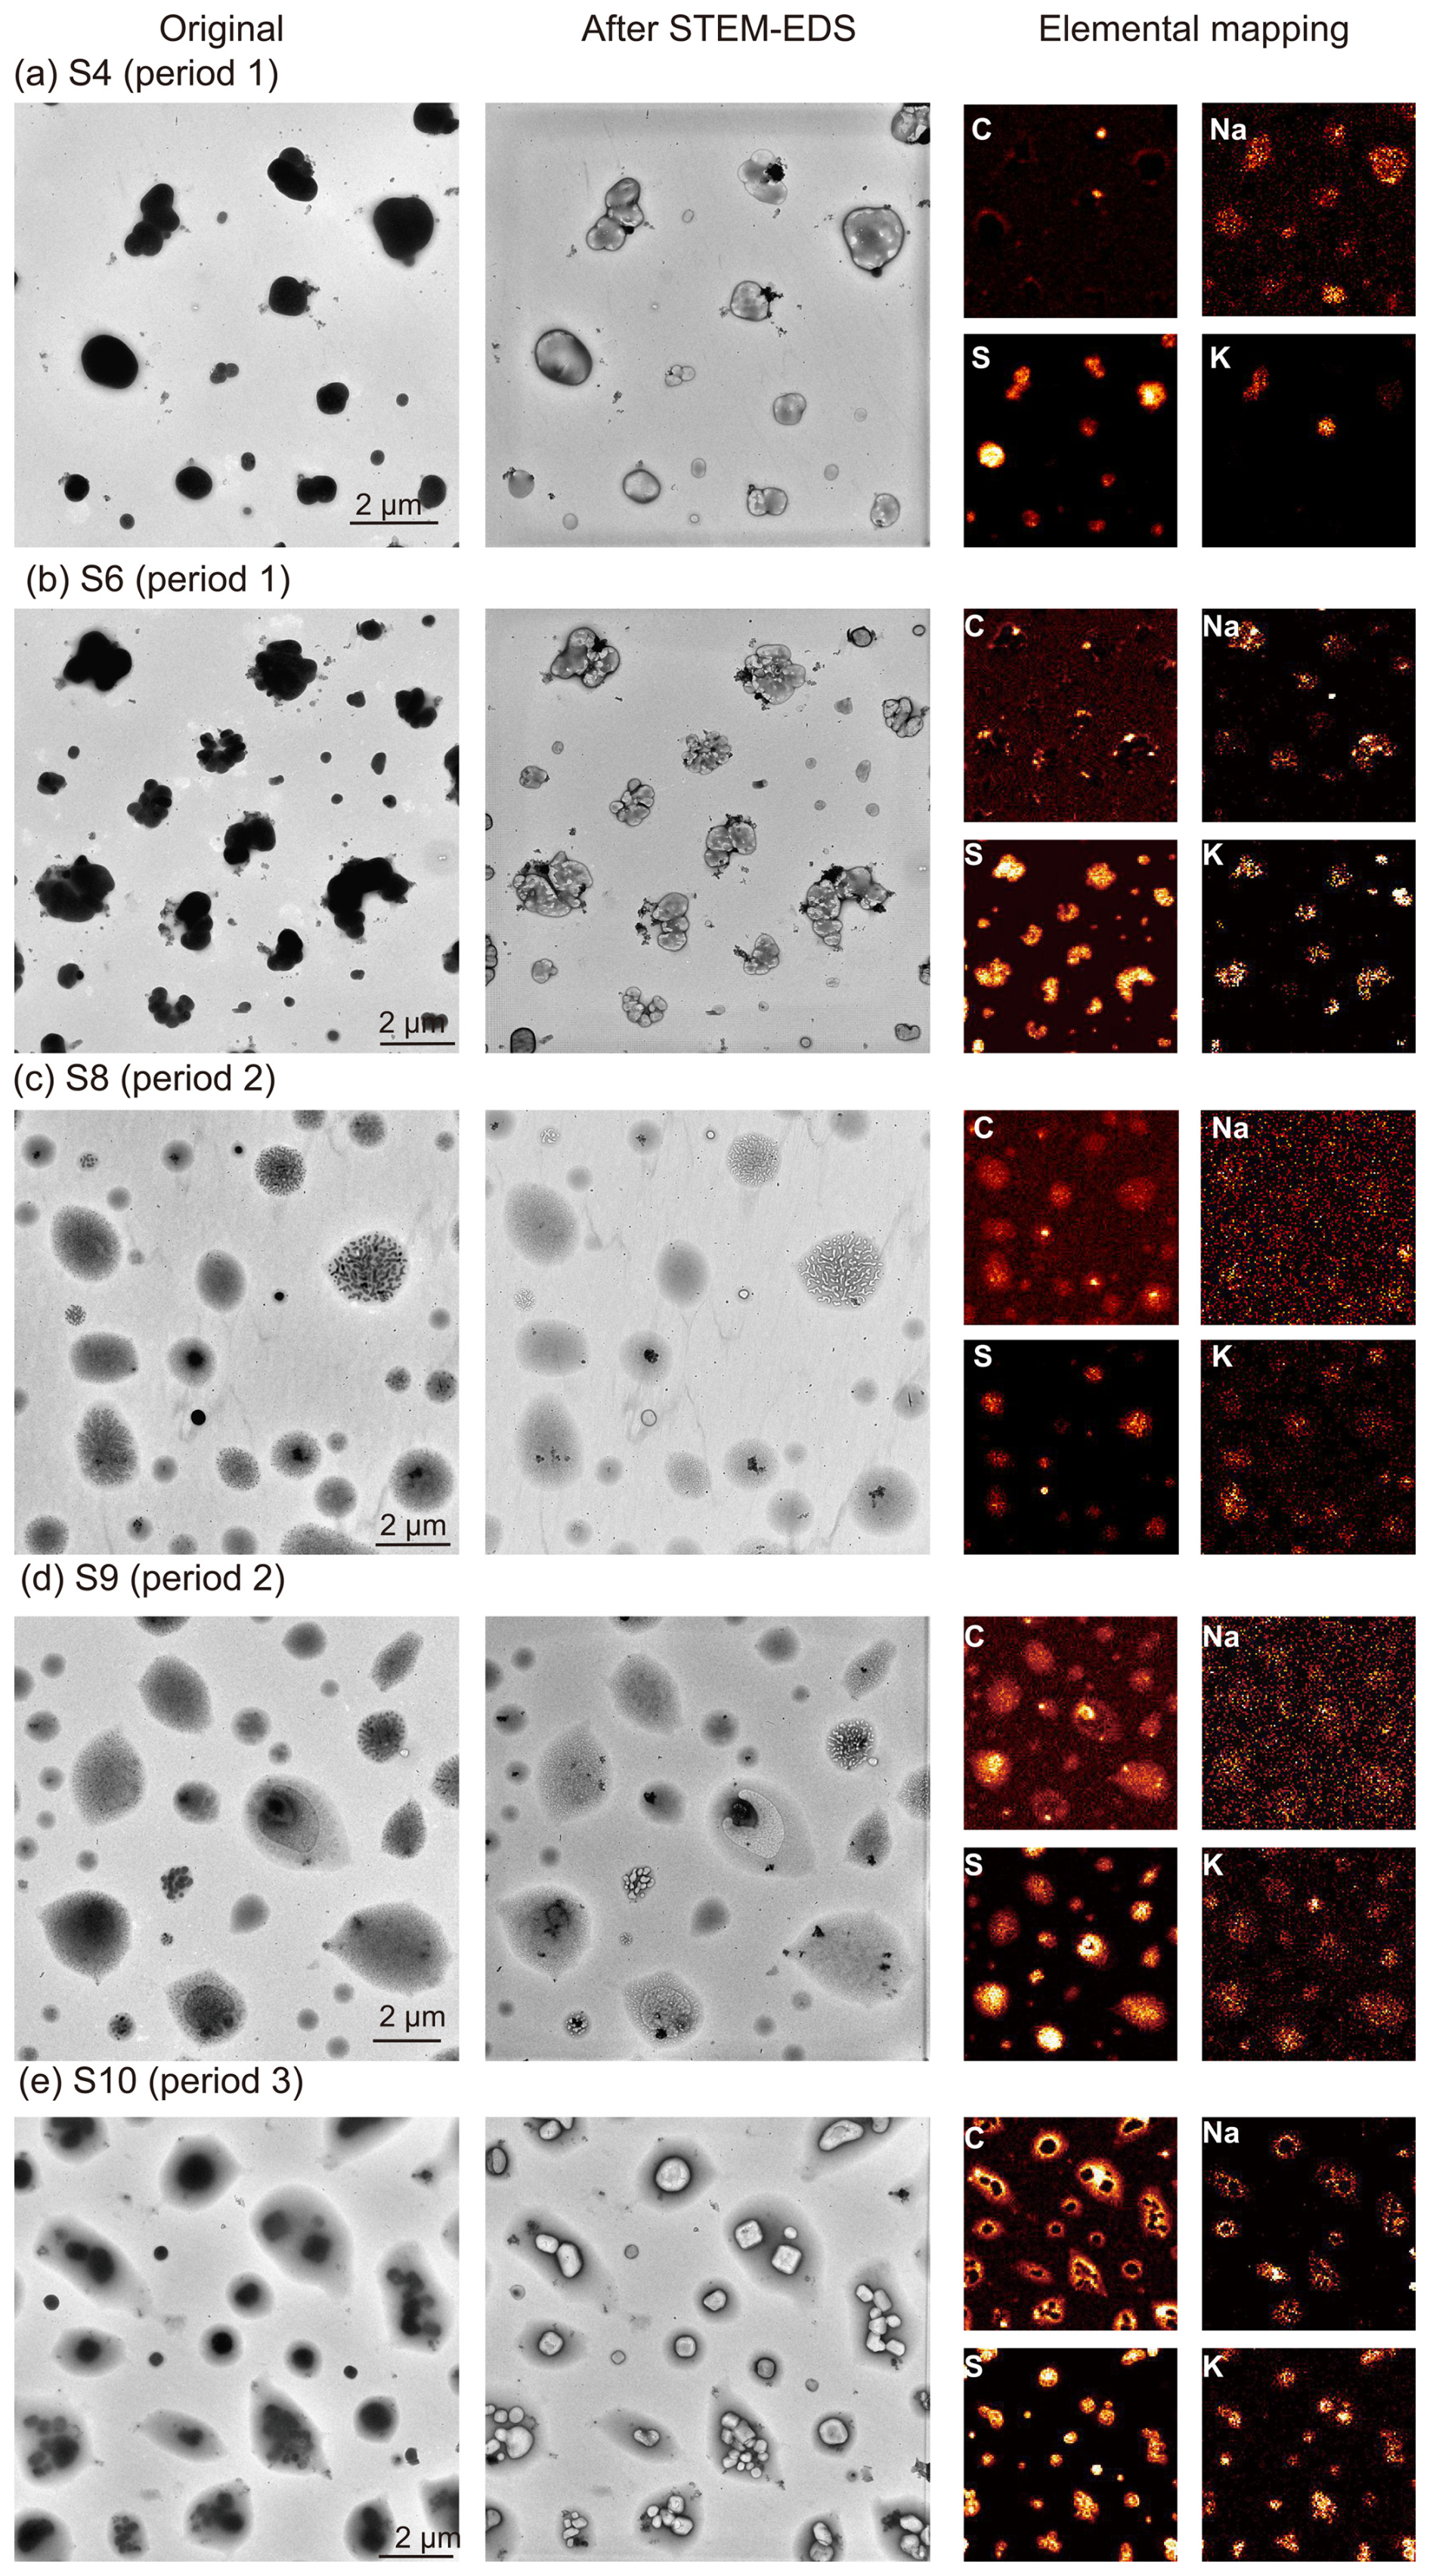
Figure 4Mixing states and compositions of representative samples from shipboard samples (a–e): the numbers of shipboard samples (S) corresponding to those of airborne samples (F) with the same number. Left: original TEM images. Middle: TEM images after elemental mapping analyses. Right: elemental mappings of C, Na, S, and K. These samples were collected at 05:00 UTC (a–d) and 03:00 UTC (e) when the aircraft was over or near the ship.
Organic materials, soot, and sea salts showed resistivity with an electron beam. In the elemental mapping images (images to the right in Figs. 3 and 4), the C distributions primarily represent organic materials and soot particles. Organic materials (secondary organic aerosols) typically coat sulfate and appear in a ring shape, as seen in samples from periods 2 and 3 (Fig. 3c–e). Soot particles have aggregate shapes and are coated or embedded in sulfate or organic matter (e.g., Fig. 4b). They appear as relatively bright spots in the C-mapping images. Na distributions mainly indicate the presence of sea salt and, to a lesser extent, mineral dust (e.g., Fig. 3b). Sea salt particles contain Na as sodium sulfate or possibly sodium chloride, as shown in samples from periods 1 and 3 (Figs. 3 and 4). Samples from period 2 contain much smaller amounts of Na than samples from periods 1 and 3, though trace amounts of Na may still be present, possibly originating from sea spray and biomass burning (Adachi et al., 2025). S distributions indicate the presence of sulfate with counter ions such as sodium, potassium, ammonium, or others. Because these sulfate-salt particles have a crystal structure in the original TEM images, they looked dark and were decomposed after ∼ 10 s of electron beam exposure (e.g., Figs. S1 and S2). K distributions mainly represent potassium sulfate, which consists of S and K. Potassium salts (e.g., potassium sulfate) typically have lower solubility than sodium salts (e.g., sodium sulfate) and may crystallize at the ambient temperatures (∼ 25 °C) before sodium salts do, resulting in the formation of a potassium salt core surrounded by sodium salt (period 3 in Figs. 3e and 4e). K can also originate from mineral dust particles (Zhang et al., 2003). In the case of samples heavily affected by biomass burning (period 2), K and S also coexist with C, indicating that the potassium sulfate occurred with secondary organic matter.
The dominant compositions and mixing states varied depending on the sampling periods. On the other hand, the airborne (< 1000 m) and shipboard samples from the same sampling periods showed similar compositions (Figs. 3 and 4), i.e., both airborne and shipboard samples showed dominant compositions in sea salt (sodium sulfate) (period 1), potassium sulfate with organics (period 2), and sea salt and potassium salt with organics (period 3). One difference, however, is that in period 2, organics coated potassium sulfate in the airborne samples (Fig. 3c–d), whereas organics were homogeneously mixed with K and S in the shipboard samples (Fig. 4c–d).
3.3 Size-dependent particle compositions
We examined the size-dependent number fractions of seven aerosol types based on their compositions and area-equivalent diameters. Although some variations can be found in samples from different altitudes, the size-dependent number fractions are generally consistent within samples at < 3000 m from each period (Fig. S8). Here, we show the averaged size-dependent number fractions of all samples from each flight to describe the particle abundance with size (Fig. 5).
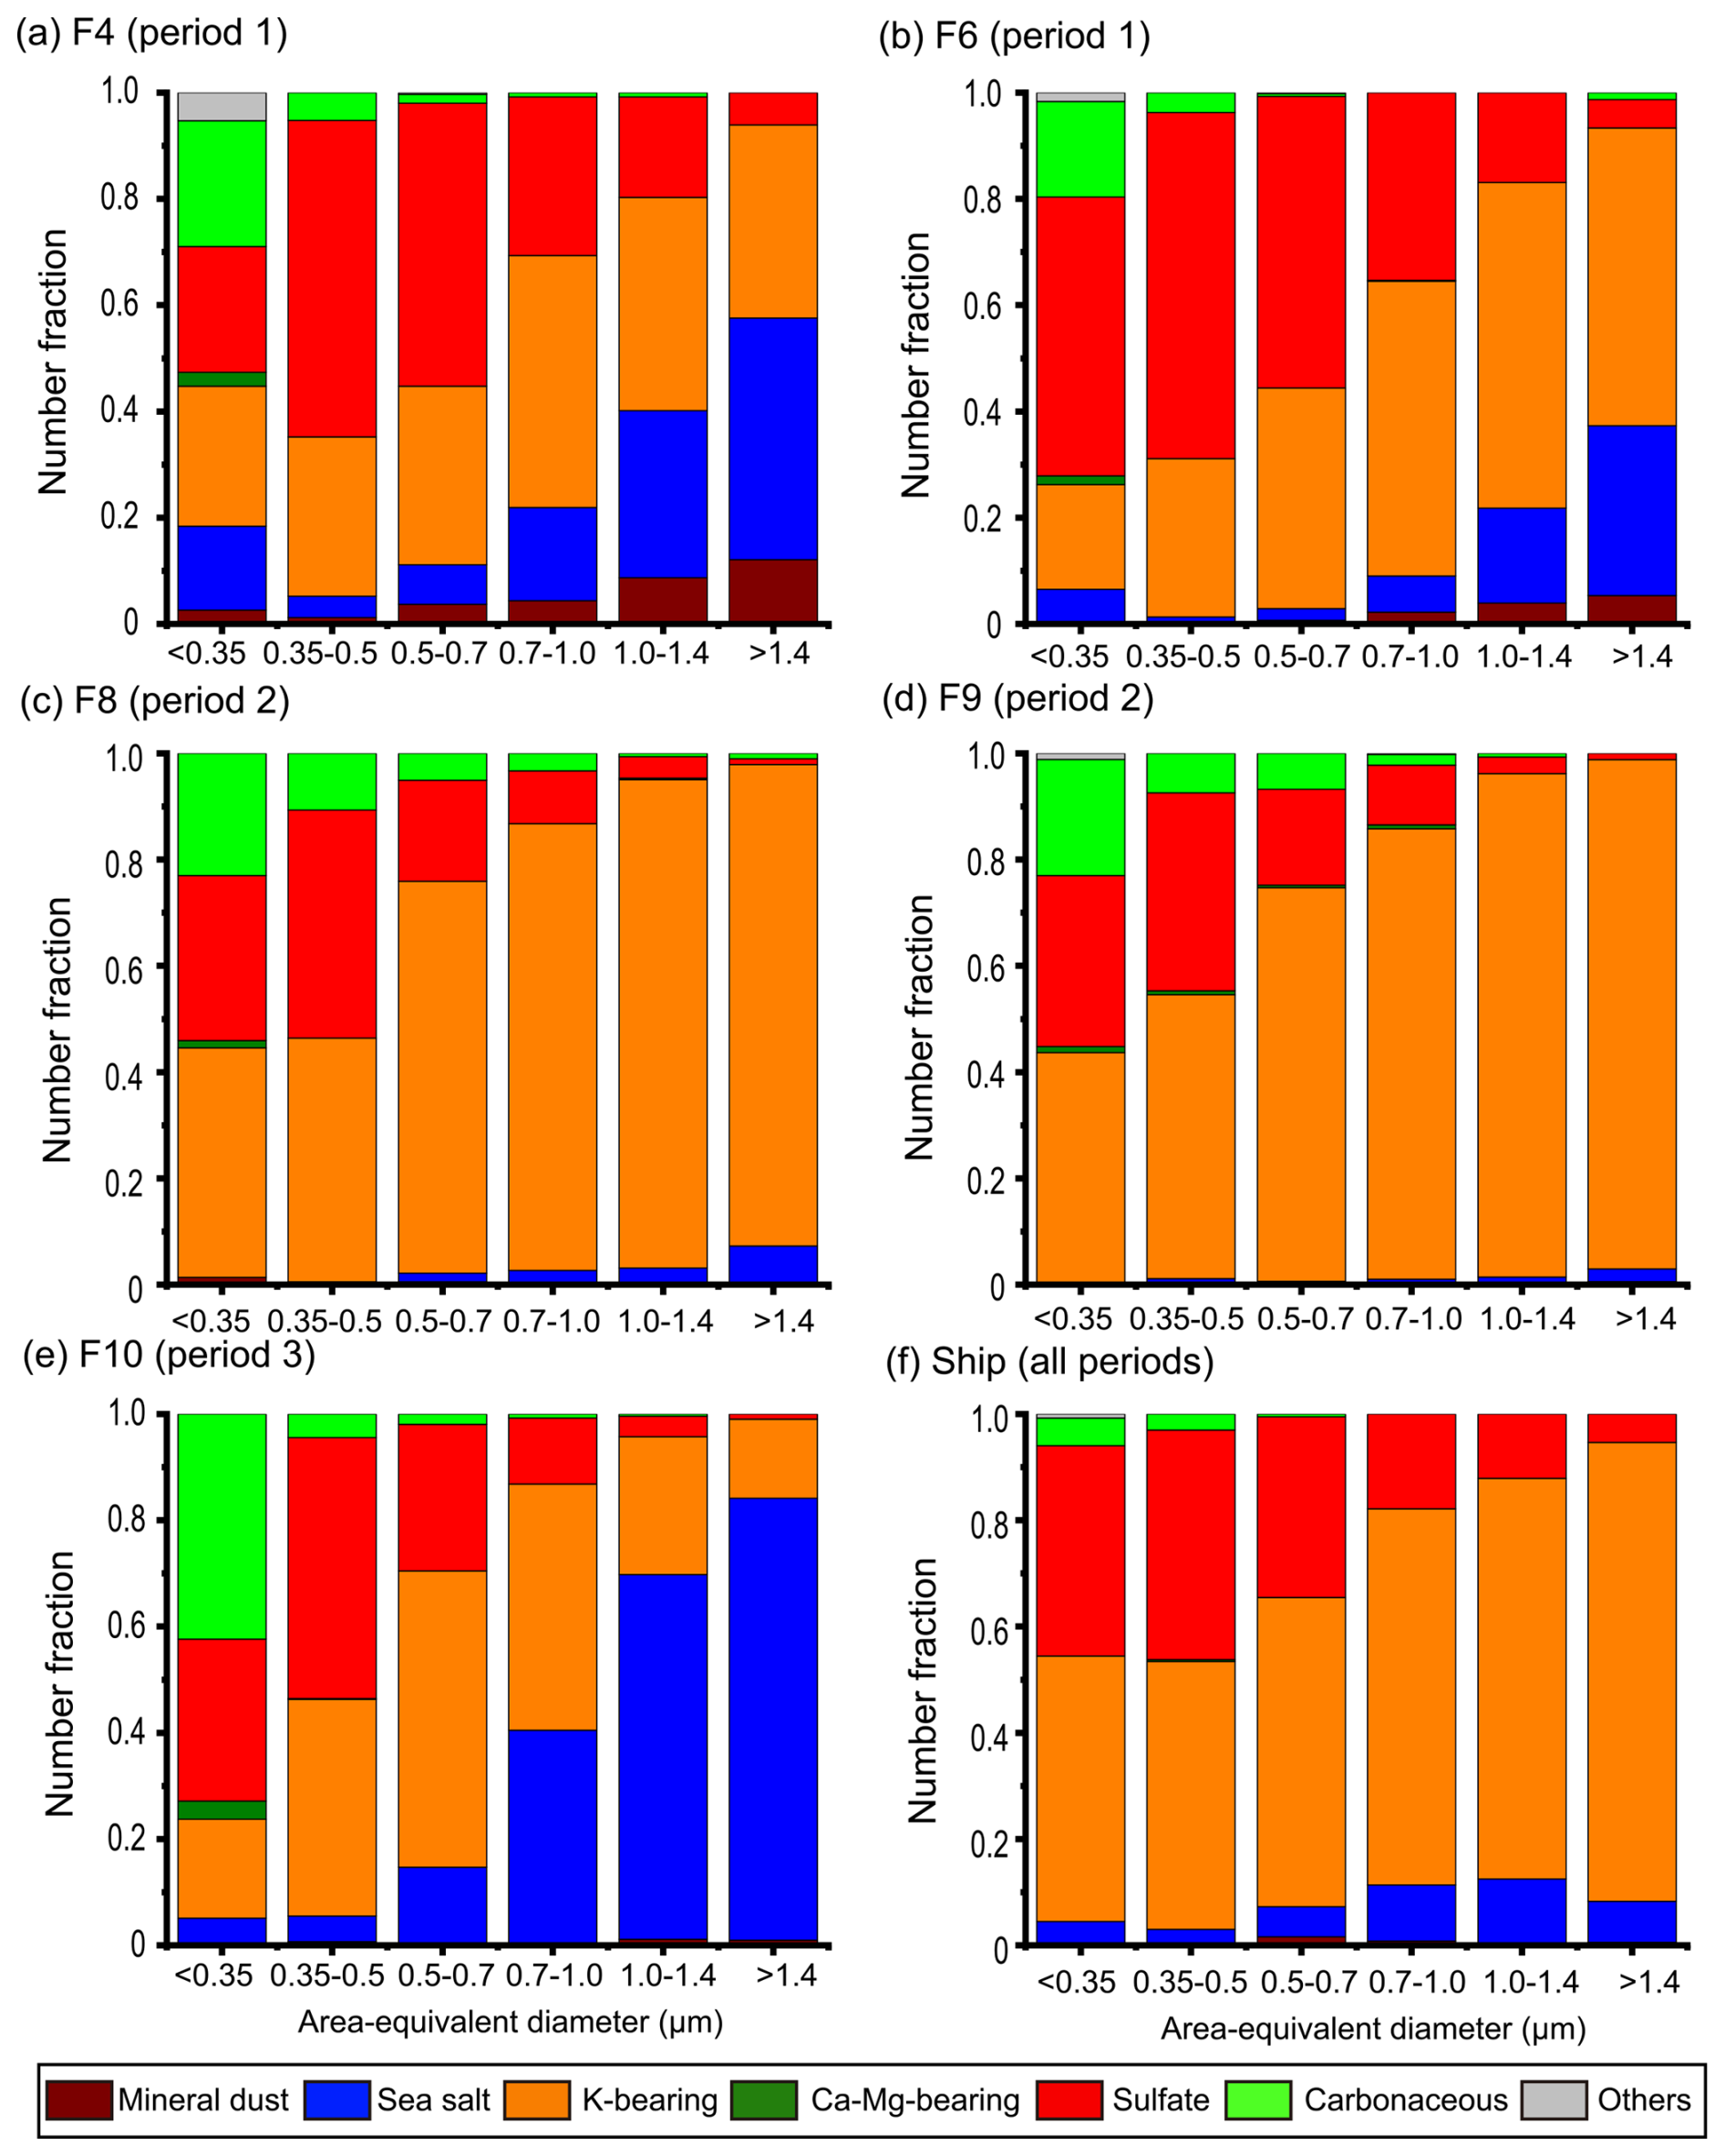
Figure 5Size-dependent number fractions of each flight and shipboard samples. The ranges of lognormal size bins are < 0.35, 0.35–0.50, 0.50–0.71, 0.71–1.0, 1.0–1.4, and > 1.4 µm. (a–e) Airborne samples. (f) Average of all measured shipboard samples.
The samples from period 1 (F4 and F6) showed that carbonaceous particle fractions are relatively higher at the smallest sizes (< 0.35 µm) (Fig. 5a–b). Sulfate fractions increased in the medium size range (0.35–1.0 µm). K-bearing particle fractions of F4 samples were not significantly different for all size ranges, whereas those of F6 slightly increased at larger sizes. Mineral dust particle number fractions increased in larger fractions. Sea salt fractions became higher in larger fractions and showed increases in the smallest fractions (< 0.35 µm). In period 2, K-bearing fractions dominated at all sizes and increased at larger particle sizes (Fig. 5c–d). In contrast, sulfate and carbonaceous particle fractions increased in smaller fractions. There were few sea salt and mineral dust particles during period 2. The fractions of period 3 were similar to those of period 1 but had larger fractions of sea salt and carbonaceous particles and fewer mineral dust particles than those of period 1 (Fig. 5e). The fractions from the shipboard measurements were mixtures of all sampling periods, i.e., K-bearing and sea salt fractions were higher in larger particles, except for the reduction of the sea salt fraction in the largest size bin (Fig. 5f), whereas the carbonaceous and sulfate fractions were higher in smaller particles.
In general, particle composition varies with size due to different formation processes and physical properties. For example, organic aerosols are rich in small particles (e.g., Jimenez et al., 2003; Moffet et al., 2008) when they grow through a new particle formation process. Sea salt particles, on the other hand, tend to be abundant in larger particle fractions due to their physical emission processes, e.g., breaking wave (Lewis and Schwartz, 2004). K-bearing particles commonly attach to other particles across a wide size range, making them ubiquitous within all size bins (Fig. 5a, b, and e). Additionally, K-bearing particles have relatively low viscosity, causing them to spread over the substrate (Adachi et al., 2025) and to be distributed in larger size bins (Fig. 5c, d, and f).
3.4 Altitude-dependent particle compositions
In addition to the sizes, the sampling altitude also influences the fractions of aerosol types (e.g., Liu et al., 2019). Here, we show the particle compositions as a function of sampling altitude (Figs. 6 and S9).
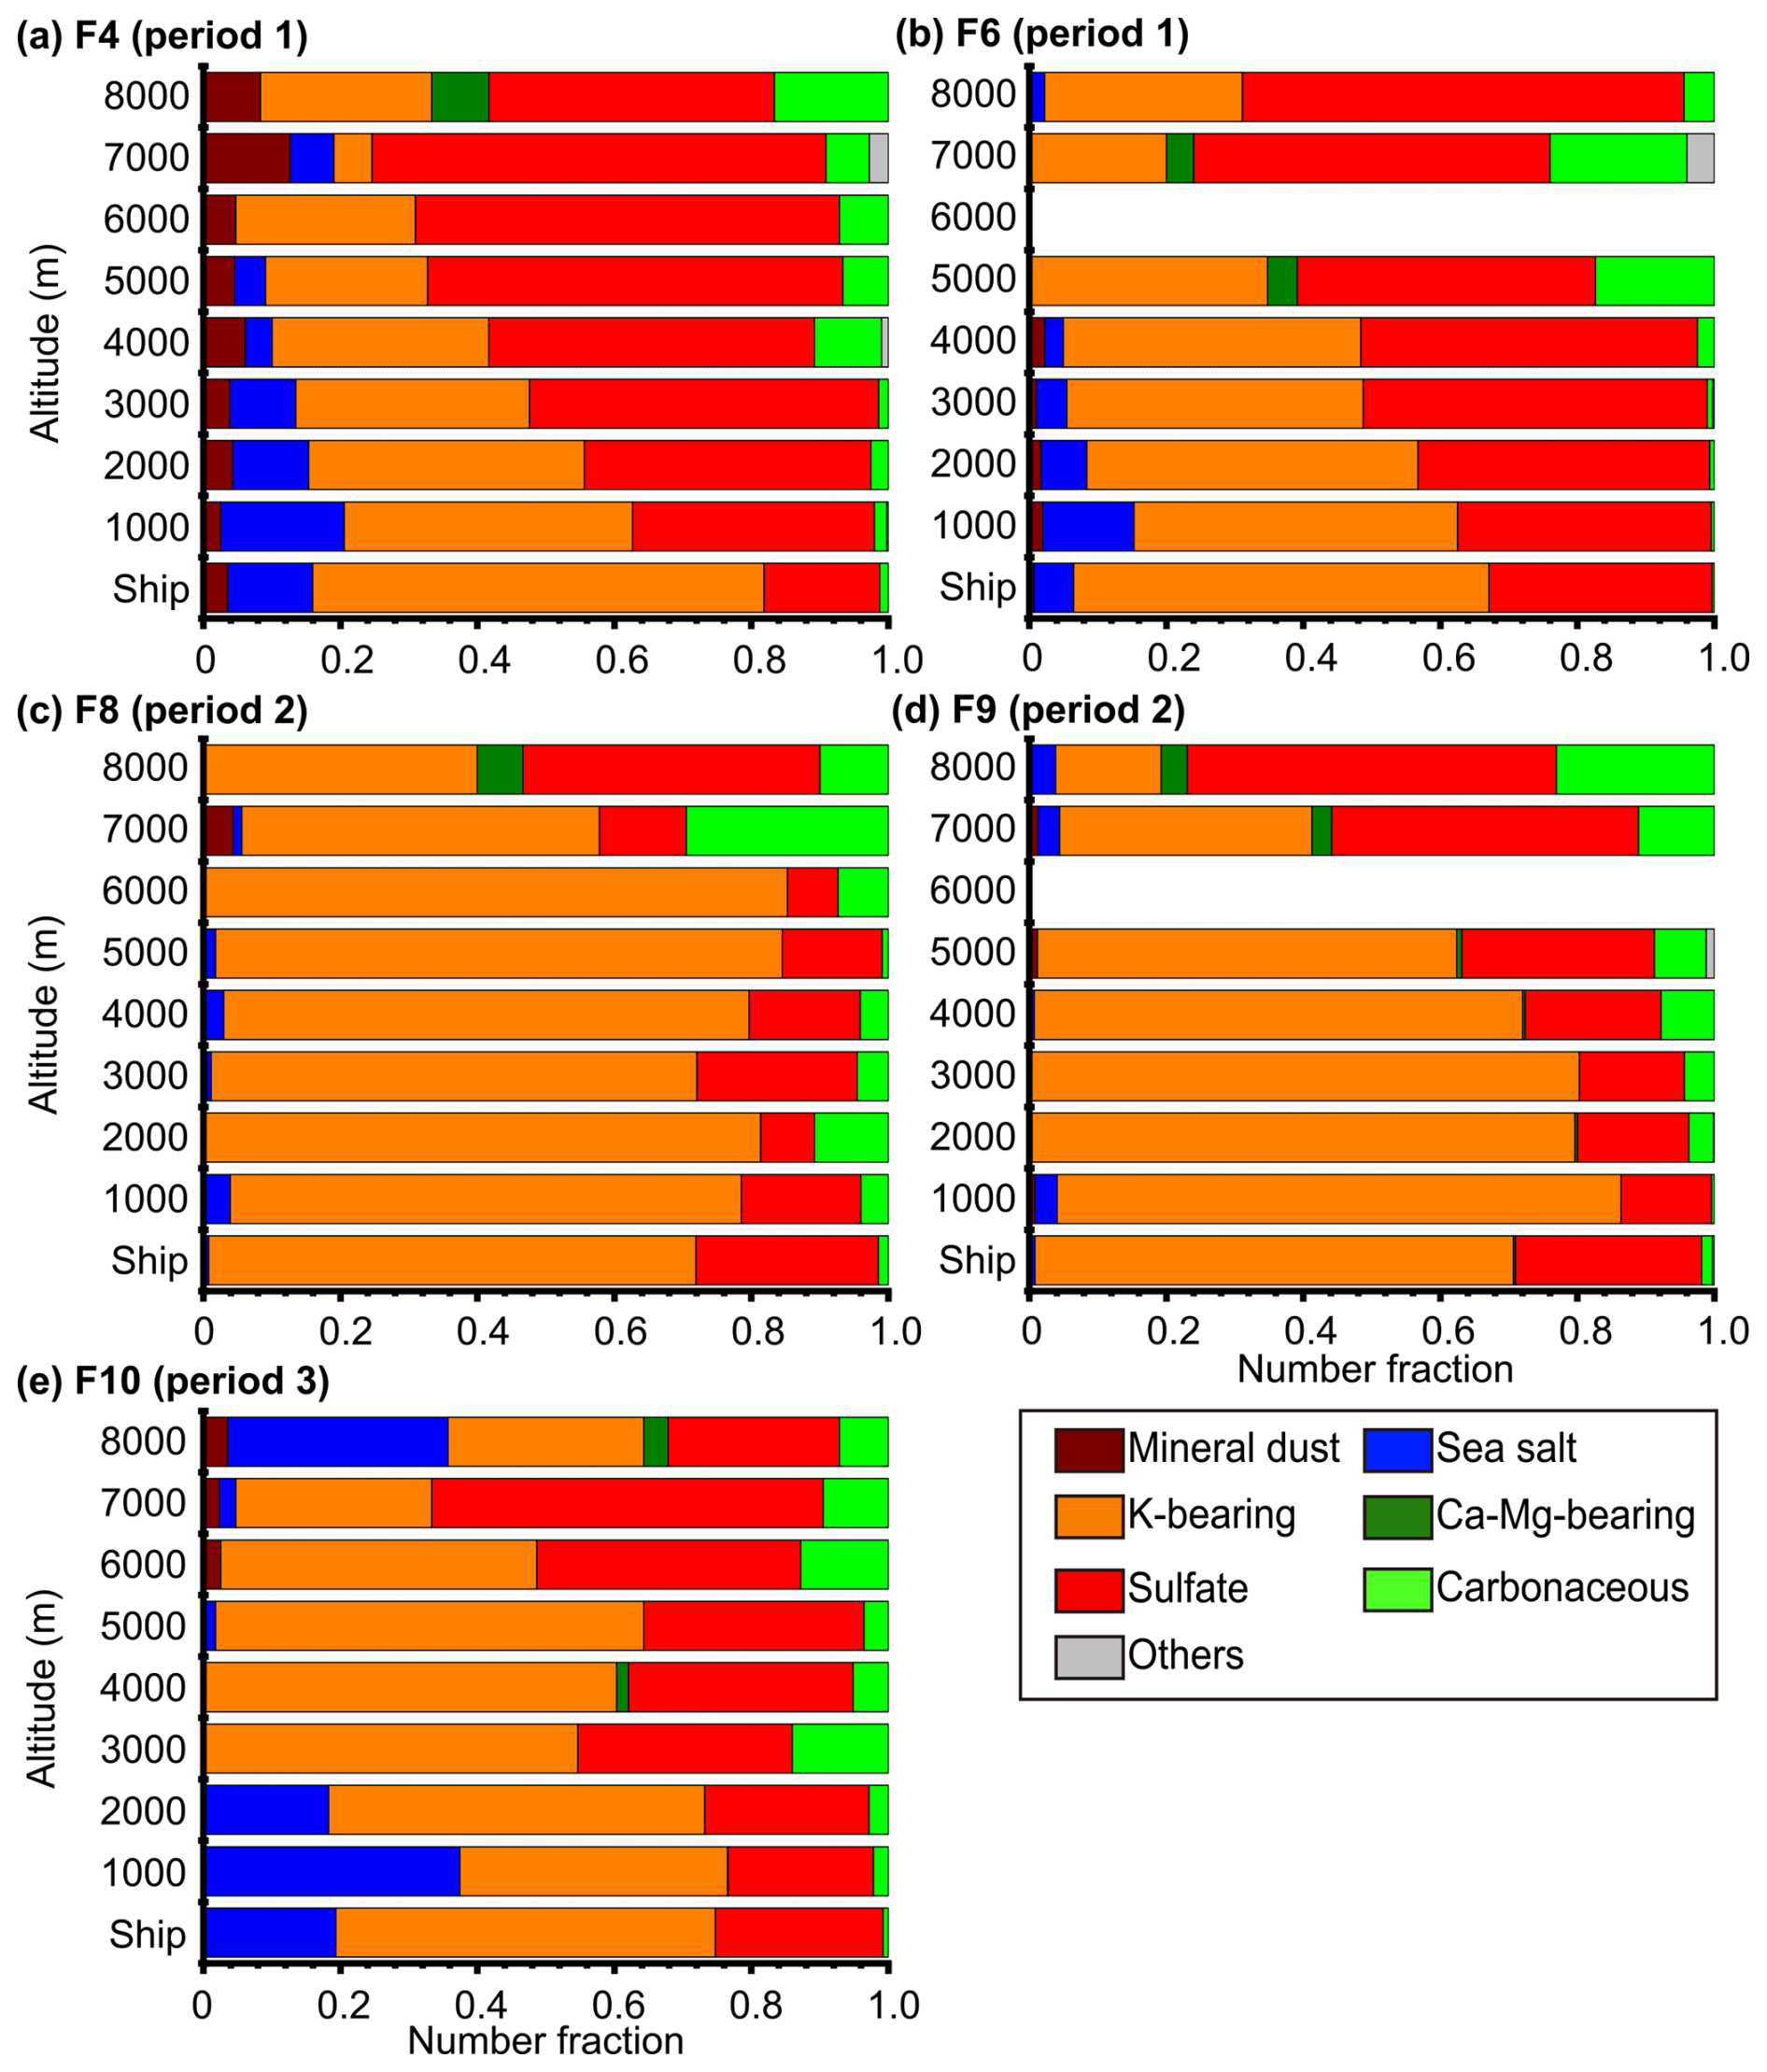
Figure 6Altitude-dependent number fractions of each flight. In (b) F6 and (d) F9, there are no TEM samples for 6000 m.
As the samples were collected at lower altitudes during periods 1 and 3, the sea salt fractions increased (Figs. 6 and S9), which is consistent with the sea salt observations over the global troposphere (Murphy et al., 2019). In addition, some increases in sea salt were observed in samples at altitudes > 7000 m (e.g., the last sample in F10; Figs. S5 and S9). The sea salt particles at high altitudes possibly originated from different regions than those at low altitudes because they had a different air parcel history (Figs. 2 and S4) and size distribution (Fig. S8), although the specific origin and transport path of the sea salt particles at high altitudes remain unclear. On the other hand, during period 2, the sea salt fractions did not largely differ depending on the altitude but remained low.
Sulfate and carbonaceous particle fractions generally increased at higher altitudes for all flights. The fractions of K-bearing particles decreased slightly at higher altitudes for samples from F4, F6, and F9. Small fractions of Ca-Mg-bearing particles were detected at high altitudes (∼ > 4000 m) for all samples. The number fractions of mineral dust particles varied with the flights, increasing slightly at higher altitudes during F4 and F10. Overall, the particle fractions changed gradually with altitude, whereas particle mass concentrations varied widely with altitude (e.g., BC in Fig. S6).
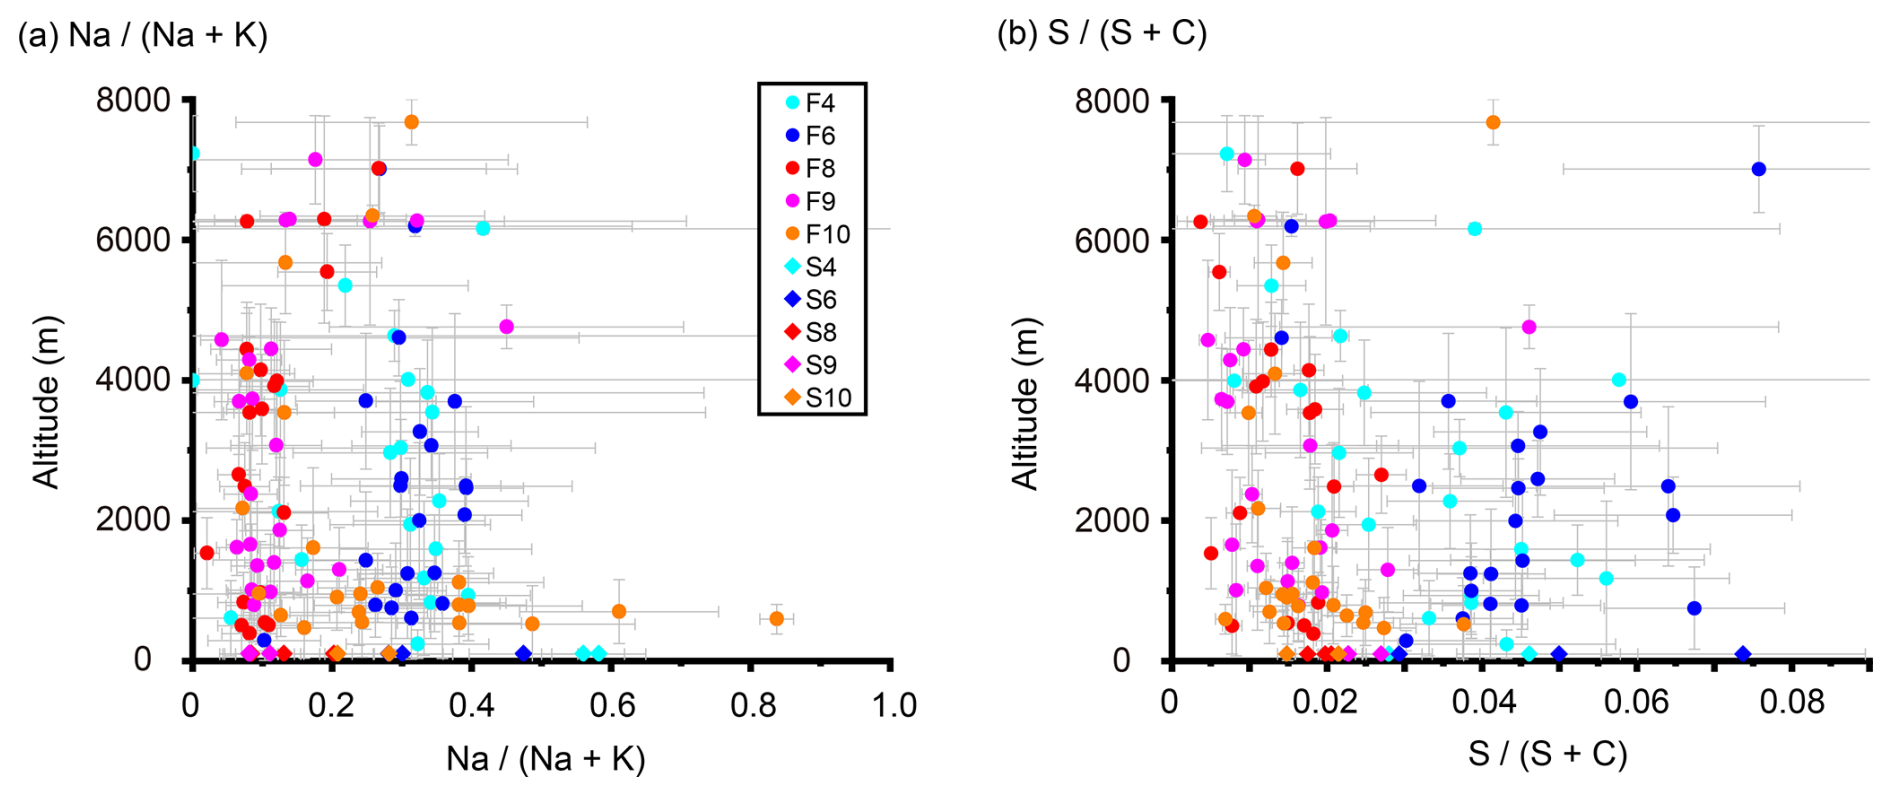
Figure 7Ratios of tracer elements (Na–K and S–C) among K-bearing particles for all samples with different altitudes. (a) Na over Na + K (mole %) and (b) S over S + C (mole %). Circle and diamond symbols indicate airborne and shipboard samples, respectively. The ratios indicate sample averages. Error bars for the x axis and y axis indicate 95 % confidence intervals and ranges between the highest and lowest altitudes, respectively. F: flight. S (in the legend): shipboard samples corresponding to airborne samples.
In Fig. 7, we focus on aerosol compositions from sea spray and biomass burning sources within K-bearing particles. In Fig. 7a, we show the average values of the Na weight percentage fractions over Na + K among K-bearing particles (Na (Na + K)), along with their sampling altitudes. These ratios suggest how much sea salt components are mixed with biomass burning aerosols at the individual particle scale. In general, the ratios depend primarily on the sampling periods and secondarily on the altitudes. That is, during period 1 (F4 and F6), Na had higher fractions than those of period 2 (F8 and F9). For period 3 (F10) samples, the fractions were high at lower altitudes but decreased with increasing altitude up to 2000 m. At altitudes > 5000 m, the Na fraction for samples from periods 2 and 3 increased slightly (∼ 0.2). The Na fractions from shipboard observations were similar to the airborne samples of periods 2 and 3 or were higher than those of period 1 at the lowest altitudes. In addition to sea spray, small fractions of Na may originate from biomass burning. Based on the assumption used in our previous study (Adachi et al., 2025), we evaluated the influence of Na from biomass burning emissions. The results showed that the presence or absence of Na emissions from biomass burning had a negligible effect on the current discussion of Na fractions (Fig. S10).
Biomass burning emits inorganic and organic matters, both of which mix within individual particles, i.e., secondary organic matter condenses on or is mixed with sulfate (e.g., potassium sulfate), resulting in mixtures of sulfate and organic matter as shown in the TEM images (e.g., Fig. 3). Although absolute quantification of C weight percentage from organic matter is difficult due to substrate interference and the varying thickness of organic matter, S weight percentage fractions over S + C within K-bearing particles (S S + C; S fraction) can indicate the degree of sulfate and organic matter mixing (Fig. 7b). Here, the S signals are from sulfate, and the C signals are from both substrate and organics. The C signals from the substrate do not vary much from particle to particle because the electron beam easily penetrates the entire particle and substrate (Geng et al., 2010), while those from the organic matter vary depending on the degree of organic fraction, i.e., those with high organic fractions have lower S fraction values. Particles from periods 2 and 3 had lower S fraction values (higher C fractions) than those from period 1 in samples from lower altitudes (< ∼ 4000 m). The results indicate that those from periods 2 and 3 had less sulfate and more organic matter from biomass burning, consistent with the mapping images.
4.1 Mineral dust and Ca-Mg-bearing particles
This study detected mineral dust particles defined by the presence of aluminosilicate (Al and Si). They were more abundant in larger particles (Fig. 5) and higher altitudes (Fig. 6), especially in the F4 samples. The F4 samples showed high fractions of mineral dust particles when the air parcel (04:00–05:00 UTC) originated from near the Gobi Desert (Fig. S5). Note that although the mineral dust number fractions were elevated in our measurements, a model study did not show a significant increase in mineral dust mass concentrations during F4 (Ohata et al., 2025). This discrepancy may be because the current study measured mineral dust number fractions in the TEM samples from the air parcel with low total aerosol mass concentrations, i.e., the atmospheric number concentration of the mineral dust particles can be lower than those in polluted periods such as period 2.
These mineral dust particles were found in aerosol samples without experiencing an apparent dust storm event (Ohata et al., 2025). Similar occurrences of mineral dust transport at 2–6 km over Japan in the absence of dust events have been reported by Matsuki et al. (2003). These results suggest that the mineral dust particles observed in the current study were occasionally transported at low concentrations regardless of apparent dust events. Mineral dust particles have potential climate impacts in several aspects. First, depending on temperature, mineral dust particles can act as INPs and influence ice cloud formation (Froyd et al., 2022; Kawai et al., 2021). Second, mineral dust can directly absorb and scatter light, affecting radiative forcing (Moteki et al., 2017; Satheesh and Krishnamoorthy, 2005). Lastly, when deposited in the ocean, these particles become a nutrient for Fe, affecting the ocean carbon cycle (Adebiyi et al., 2023; Tagliabue et al., 2017).
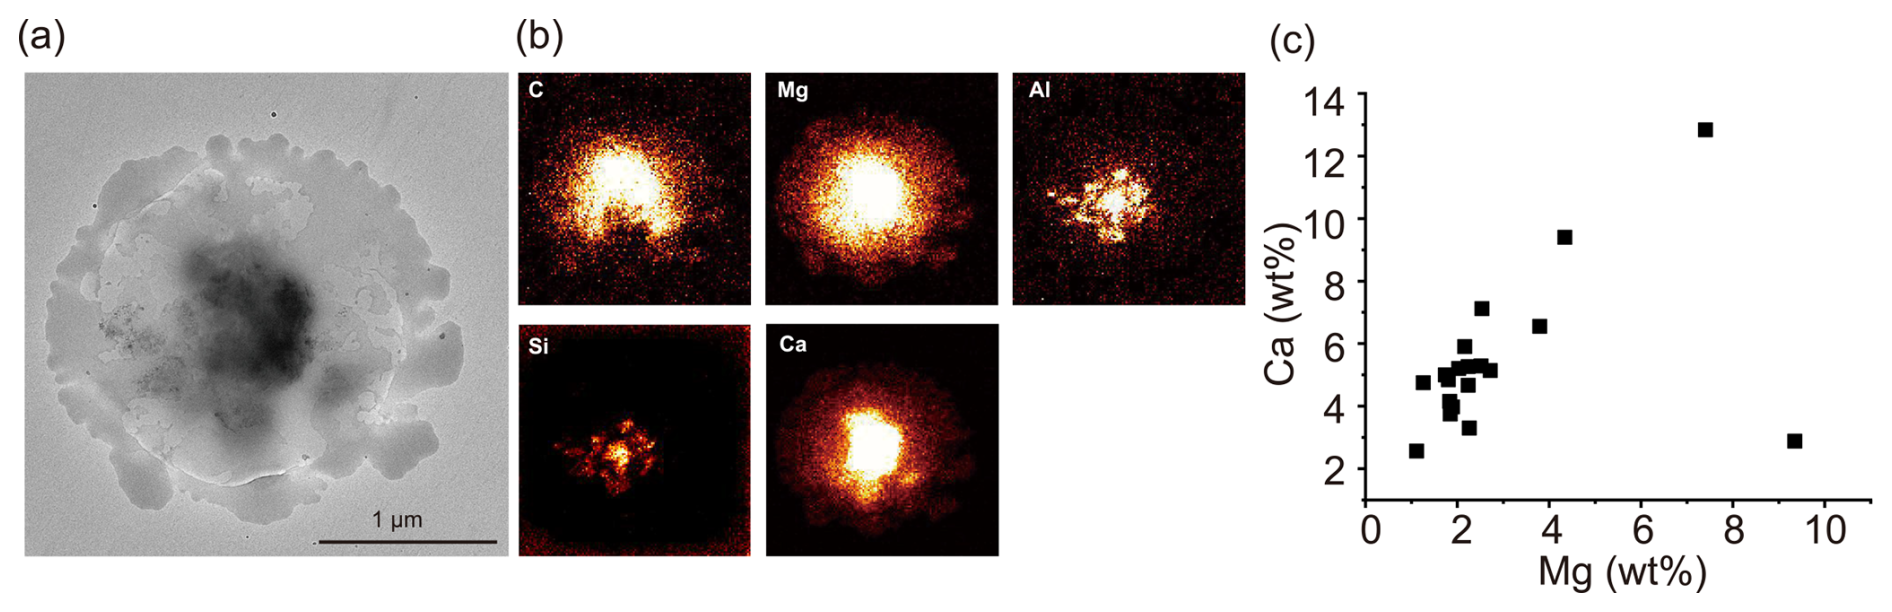
Figure 8Shapes and compositions of Ca-Mg-bearing particles. (a) TEM image. (b) Elemental mapping images for C, Mg, Al, Si, and Ca. (c) Relation between Ca and Mg (wt %) for all Ca-Mg-bearing particles (n = 19).
In the current study, we specifically classified Ca- and Mg-bearing particles into an independent particle type (Ca-Mg-bearing particles) because of their unique occurrence, although their number fraction was small (0.2 % in total). They had the same Ca-to-Mg ratio (Fig. 8c), were rich in the finer fraction, and occurred at high altitudes (> 4000 m). Their representative compositions suggest that they are a type of mineral dust, possibly dolomite (CaMg(CO3)2) mixed with other minerals (e.g., aluminosilicates). This configuration of an insoluble aluminosilicate core with a Ca-Mg-rich coating is similar to that described by Tobo et al. (2010). They proposed that Ca-rich particles transformed into aqueous droplets. Our particles also appear to be in the aqueous phase when collected because they spread over the substrate. Song et al. (2005) found a relationship between Ca + Mg and CO3 during airborne observations in an Asian outflow. Conny et al. (2019) detected dolomite particles in Hawaii from an Asian outflow sample. These studies suggest that these particles are common in Asian outflow aerosol samples. Furthermore, Li et al. (2007) suggested that the source region of such dolomite in Asian dust is the northern edge of the Tibetan Plateau, including the Taklamakan Desert. Our findings are aligned with these previous results, i.e., these particles are abundant in high-altitude samples in the East Asia.
4.2 Sources and compositions of aerosol particles during each period
Period 1 samples had relatively large sea spray influences due to their air parcel sources at low altitudes around the ocean near Japan (Figs. 2 and S4). They contained high proportions of sea salt particles (Fig. 5) and of Na within K-bearing particles (Fig. 7a). The period 1 samples also contained certain amounts of K-bearing particles. Although they did not originate directly from the large Siberian Forest biomass burning area, they could be from cropland biomass burning in northern China (Huang et al., 2024), regional haze from the large Siberian Forest biomass burning, or other sources emitting K-bearing particles (e.g., biofuel burning). Mineral dust particles from deserts were also relatively abundant in this period, as discussed in the previous section. Substantial fractions of sulfate were observed during this period as well as other periods. Sulfate aerosols can originate from a variety of sources, including anthropogenic, marine, and volcanic, making them ubiquitous. We therefore interpret that the number fractions of sulfate increase when other particles are scarce (e.g., high-altitude samples). Overall, aerosol species from period 1 included sulfate, K-bearing, sea salt, and mineral dust. These aerosol species are generally consistent with those detected in the same area during other shipboard observations (Kawana et al., 2024), suggesting that the aerosols during period 1 are commonly observed in this region when there are no notable large pollution events.
Period 2 samples were influenced by the Siberian Forest biomass burning event. A pronounced increase in BC mass concentrations was observed by SP2 at altitudes between 1 and 3 km during this period (Fig. S6). On these occasions, the sampled air parcels were transported over the biomass burning area in the Siberian Forest (Fig. 2). The aerosol particle compositions were rich in organic matter (Fig. 3) and dominated by K-bearing fractions (Fig. 5), both of which are indicators of the influence of biomass burning (Andreae, 2019). Previous shipboard measurements in this region have also observed the influence of Siberian Forest biomass burning but with more organic aerosol particles, including tarballs (Yoshizue et al., 2020), whereas the current study did not detect tarballs. A possible explanation for this discrepancy is different fire conditions, i.e., biomass burning with flaming phases emits more K and BC, whereas biomass burning with smoldering phases emits more organic matter and tarballs (Adachi et al., 2024).
High K-bearing particle fractions (0.4–0.8) were observed not only at altitudes of 1–3 km, where the BC enhancements were detected, but also at all observed altitudes, with the dominant fractions at < 6000 m in F8 or < 5000 m in F9 (Fig. 6). These altitudes included those with no clear increase in BC concentrations measured by SP2 (Fig. S6). These results suggest that, during period 2, the aerosol compositions over the observed area were affected by biomass burning at the individual particle scale, including those from air parcels with no apparent influences on BC mass concentrations. Siberian Forest biomass burning plumes are known to travel long distances, such as to North America (Laing et al., 2016) and the Arctic (Warneke et al., 2009), indicating that they are a significant aerosol source globally. Sea salt particles, on the other hand, were rarely detected even near the sea surface during this period.
Period 3 samples showed a strong influence of sea spray, as F10 mainly flew at low altitudes (∼ 1000 m) (Fig. S9). The samples also showed organic coatings of secondary organic matter (Fig. 3e), possibly from biomass burning. The air parcels originated both from over the ocean (northwest of Japan) and from the biomass burning in the Siberian Forest. Possible sources and compositions of the period 3 samples were mixtures of periods 1 and 2.
4.3 Comparison between airborne and shipboard observations
The comparison of particle number fractions between airborne and shipboard observations in Fig. 6 shows that the shipboard aerosol fractions are generally consistent with those of the low-altitude (< 1000 m) airborne observations. Koike et al. (2025) showed that aerosol number concentrations from shipboard measurements were also consistent with those from airborne measurements. Our results show that they are generally comparable even for individual particle compositions. Differences, however, are that the shipboard measurements had slightly lower sea salt fractions than the corresponding airborne samples (< 1000 m) (Fig. 6) and that the sea salt fraction in the largest size bin (> 1.4 µm) is smaller than that of the second-largest bin (1.0–1.4 µm) in the shipboard samples (Fig. 5f), whereas all airborne samples have the largest sea salt fractions in the largest size bins (Figs. 5a–e). Although the exact reason for the discrepancy is unclear, the shipboard sampling was somewhat different from the airborne sampling in terms of the sampling method, sampling time, and duration, and these differences may cause these discrepancies. Another difference is that the K-bearing particles in the airborne samples from period 2 had a core-shell structure (K-salt core with organic shell; Figs. 3c–d), whereas those in the shipboard samples had homogeneous mixtures of K and organic matter (Fig. 4c–d). One possible explanation is that the aerosol particles collected from the shipboard observation were fully hydrated due to the high relative humidity (RH), ranging from 75 % to 100 % throughout the entire cruise (JURCAOS and JAMSTEC, 2022). The RH values exceeded the deliquescence and efflorescence RH values of potassium salts (e.g., 97 % and 60 % for K2SO4, respectively; Freney et al., 2009), suggesting that they were hydrated when collected, i.e., these homogeneous mixtures can form when both the K salt and the organic matter are in the liquid phase.
4.4 Mixing states within individual particles
The influence of biomass burning has been detected in the western North Pacific during several shipboard observations (Taketani et al., 2025; Yoshizue et al., 2020). The current study further showed their vertical distributions at the individual particle scale. Although we classified the particles separately as sea salt and K-bearing based on the presence of their tracer elements, they consisted of mixed compositions, especially for K-bearing particles (Fig. 7). The mixtures of sea spray and biomass burning aerosols have been observed near the coastal area in Thailand (Adachi et al., 2025) and over the Atlantic Ocean (Dang et al., 2022), where biomass burning and sea spray emissions are abundant. In the current study, we showed their mixtures from the sea surface to ∼ 5000 m (Fig. 7). These results suggest that, although sea spray has a greater influence at lower altitudes, its mixing proceeds vertically at the individual scale.
Riemer et al. (2019) showed two definitions related to particle mixing states: one is particle populations, which is the distribution of properties across the particles in the population, and the other is the single particles. In this study, the results of particle mixing states at the population scale are shown in Fig. 6, and the results at the single particle scale are shown in Fig. 7. This study demonstrated that the vertical aerosol variability occurs at both the particle population scale and the single particle scale and showed their relationship, i.e., more sea salt or biomass burning particles in the particle population result in more sea salt or biomass burning influence in the single particles.
This study analyzed individual aerosol particles collected from just above the sea surface to the atmosphere up to 8000 m by an aircraft and a research vessel over the western North Pacific in East Asia. The contributions from different sources depended on the origin of the air parcel, such as ocean, desert, and biomass burning. Our results also revealed that particle compositions and mixing states varied with aerosol sizes and sampling altitudes. The compositions, mixing states, and sizes of aerosols directly influence their optical properties as well as their CCN and INP activities, depending on the sampling altitude. The current study showed important contributions from natural aerosols such as sea salt, mineral dust, and biomass burning particles, all of which were mixed within individual particles, and the extent of mixing varied with the sampling period and altitude. The results of low-altitude airborne and shipboard samples were in reasonable agreement. This study highlighted a wide range of individual particle compositions and evaluated how they were composed. Such knowledge of individual particle compositions and mixing states will improve model parameterizations, resulting in a more accurate assessment of the aerosol contributions to the climate.
The shipboard measurement data ( Shinsei-maru KS-22-10 cruise) are available at https://doi.org/10.17596/0003381 (JURCAOS and JAMSTEC, 2022). STEM-EDS data for all individual particles and for the TEM sample average used in this study are available at https://doi.org/10.5281/zenodo.15178934 (Adachi, 2025). The METEX back-trajectory model provided by NIES is available at https://db.cger.nies.go.jp/ged/metex/en/index.html (last access: 30 September 2025).
The supplement related to this article is available online at https://doi.org/10.5194/acp-25-12599-2025-supplement.
KA conducted the TEM analysis and data processing. KA, TM, SO, and AY set up and executed the TEM sampling. KK conducted the back-trajectory analysis. TM and NM measured the BC concentrations. MK and YK supervised the aircraft and the research vessel observations, respectively. KA prepared the paper with contributions from all coauthors.
The contact author has declared that none of the authors has any competing interests.
Publisher's note: Copernicus Publications remains neutral with regard to jurisdictional claims made in the text, published maps, institutional affiliations, or any other geographical representation in this paper. While Copernicus Publications makes every effort to include appropriate place names, the final responsibility lies with the authors.
We are indebted to all participants of A-Force 2022 for their cooperation and support, especially to Taikichiro Omi and Temma Saito (U. Tokyo) for collecting TEM samples on the aircraft. The authors also thank the pilots and flight staff of Diamond Air Service, Inc., and the crew of Shinsei-maru for their support. We acknowledge the use of imagery from NASA's Fire Information for Resource Management System (FIRMS) (https://earthdata.nasa.gov/firms, last access: 30 September 2025), part of NASA's Earth Observing System Data and Information System (EOSDIS), and we thank NIES for the back-trajectory model.
This research has been supported by the Environmental Research and Technology Development Fund (JPMEERF20232001) of the Environmental Restoration and Conservation Agency of Japan, the Global Environmental Research Coordination System from the Ministry of the Environment of Japan (grant nos. MLIT1753 and MLIT2253), the Arctic Challenge for Sustainability II (ArCS II) (grant no. JPMXD1420318865) and ArCS III (grant no. JPMXD1720251001), and the Japan Society for the Promotion of Science (JSPS) KAKENHI program (grant nos. JP19K21905, JP19H04259, JP19H05699, JP19H05700, JP23H03531, JP23K28210, JP24H00761, JP23KJ2144, and JP23K28221).
This paper was edited by Alexander Laskin and reviewed by three anonymous referees.
Adachi, K.: STEM-EDS data for all individual particles and the TEM sample average and Data used in figures [data set], Zenodo, https://doi.org/10.5281/zenodo.15178934, 2025.
Adachi, K. and Buseck, P. R.: Internally mixed soot, sulfates, and organic matter in aerosol particles from Mexico City, Atmos. Chem. Phys., 8, 6469–6481, https://doi.org/10.5194/acp-8-6469-2008, 2008.
Adachi, K., Chung, S. H., and Buseck, P. R.: Shapes of soot aerosol particles and implications for their effects on climate, Journal of Geophysical Research: Atmospheres, 115, https://doi.org/10.1029/2009jd012868, 2010.
Adachi, K., Dibb, J. E., Katich, J. M., Schwarz, J. P., Guo, H., Campuzano-Jost, P., Jimenez, J. L., Peischl, J., Holmes, C. D., and Crawford, J.: Occurrence, abundance, and formation of atmospheric tarballs from a wide range of wildfires in the western US, Atmos. Chem. Phys., 24, 10985–11004, https://doi.org/10.5194/acp-24-10985-2024, 2024.
Adachi, K., Sedlacek III, A. J., Kleinman, L., Springston, S. R., Wang, J., Chand, D., Hubbe, J. M., Shilling, J. E., Onasch, T. B., Kinase, T., Sakata, K., Takahashi, Y., and Buseck, P. R.: Spherical tarball particles form through rapid chemical and physical changes of organic matter in biomass-burning smoke, Proceedings of the National Academy of Sciences, 116, 19336–19341, https://doi.org/10.1073/pnas.1900129116, 2019.
Adachi, K., Oshima, N., Ohata, S., Yoshida, A., Moteki, N., and Koike, M.: Compositions and mixing states of aerosol particles by aircraft observations in the Arctic springtime, 2018, Atmos. Chem. Phys., 21, 3607–3626, https://doi.org/10.5194/acp-21-3607-2021, 2021.
Adachi, K., Oshima, N., Takegawa, N., Moteki, N., and Koike, M.: Meteoritic materials within sulfate aerosol particles in the troposphere are detected with transmission electron microscopy, Communications Earth & Environment, 3, https://doi.org/10.1038/s43247-022-00469-8, 2022.
Adachi, K., Tobo, Y., Oshima, N., Yoshida, A., Ohata, S., Krejci, R., Massling, A., Skov, H., and Koike, M.: Composition and mixing state of individual aerosol particles from northeast Greenland and Svalbard in the Arctic during spring 2018, Atmospheric Environment, 314, https://doi.org/10.1016/j.atmosenv.2023.120083, 2023.
Adachi, K., Sun, C., Onchang, R., and Takegawa, N.: Homogeneous Mixing of Sea Spray and Biomass Burning Tracer Elements Within Single Particles Observed Over Southeast Asia, Journal of Geophysical Research: Atmospheres, 130, https://doi.org/10.1029/2024jd042328, 2025.
Adebiyi, A., Kok, J. F., Murray, B. J., Ryder, C. L., Stuut, J.-B. W., Kahn, R. A., Knippertz, P., Formenti, P., Mahowald, N. M., Pérez García-Pando, C., Klose, M., Ansmann, A., Samset, B. H., Ito, A., Balkanski, Y., Di Biagio, C., Romanias, M. N., Huang, Y., and Meng, J.: A review of coarse mineral dust in the Earth system, Aeolian Research, 60, https://doi.org/10.1016/j.aeolia.2022.100849, 2023.
Agarwal, S., Aggarwal, S. G., Okuzawa, K., and Kawamura, K.: Size distributions of dicarboxylic acids, ketoacids, α-dicarbonyls, sugars, WSOC, OC, EC and inorganic ions in atmospheric particles over Northern Japan: implication for long-range transport of Siberian biomass burning and East Asian polluted aerosols, Atmos. Chem. Phys., 10, 5839–5858, https://doi.org/10.5194/acp-10-5839-2010, 2010.
Andreae, M. O.: Emission of trace gases and aerosols from biomass burning – an updated assessment, Atmos. Chem. Phys., 19, 8523–8546, https://doi.org/10.5194/acp-19-8523-2019, 2019.
Bond, T. C., Doherty, S. J., Fahey, D. W., Forster, P. M., Berntsen, T., DeAngelo, B. J., Flanner, M. G., Ghan, S., Kärcher, B., Koch, D., Kinne, S., Kondo, Y., Quinn, P. K., Sarofim, M. C., Schultz, M. G., Schulz, M., Venkataraman, C., Zhang, H., Zhang, S., Bellouin, N., Guttikunda, S. K., Hopke, P. K., Jacobson, M. Z., Kaiser, J. W., Klimont, Z., Lohmann, U., Schwarz, J. P., Shindell, D., Storelvmo, T., Warren, S. G., and Zender, C. S.: Bounding the role of black carbon in the climate system: A scientific assessment, Journal of Geophysical Research: Atmospheres, 118, 5380–5552, https://doi.org/10.1002/jgrd.50171, 2013.
Cappa, C. D., Onasch, T. B., Massoli, P., Worsnop, D. R., Bates, T. S., Cross, E. S., Davidovits, P., Hakala, J., Hayden, K. L., Jobson, B. T., Kolesar, K. R., Lack, D. A., Lerner, B. M., Li, S.-M., Mellon, D., Nuaaman, I., Olfert, J. S., Petäjä, T., Quinn, P. K., Song, C., Subramanian, R., Williams, E. J., and Zaveri, R. A.: Radiative Absorption Enhancements Due to the Mixing State of Atmospheric Black Carbon, Science, 337, 1078–1081, https://doi.org/10.1126/science.1223447, 2012.
Carslaw, K. S., Boucher, O., Spracklen, D. V., Mann, G. W., Rae, J. G. L., Woodward, S., and Kulmala, M.: A review of natural aerosol interactions and feedbacks within the Earth system, Atmos. Chem. Phys., 10, 1701–1737, https://doi.org/10.5194/acp-10-1701-2010, 2010.
Chung, S. H. and Seinfeld, J. H.: Global distribution and climate forcing of carbonaceous aerosols, Journal of Geophysical Research: Atmospheres, 107, https://doi.org/10.1029/2001jd001397, 2002.
Conny, J. M., Willis, R. D., and Ortiz-Montalvo, D. L.: Analysis and Optical Modeling of Individual Heterogeneous Asian Dust Particles Collected at Mauna Loa Observatory, Journal of Geophysical Research: Atmospheres, 124, https://doi.org/10.1029/2018jd029387, 2019.
Dang, C., Segal-Rozenhaimer, M., Che, H., Zhang, L., Formenti, P., Taylor, J., Dobracki, A., Purdue, S., Wong, P.-S., Nenes, A., Sedlacek III, A., Coe, H., Redemann, J., Zuidema, P., Howell, S., and Haywood, J.: Biomass burning and marine aerosol processing over the southeast Atlantic Ocean: a TEM single-particle analysis, Atmos. Chem. Phys., 22, 9389–9412, https://doi.org/10.5194/acp-22-9389-2022, 2022.
Egerton, R. F., Li, P., and Malac, M.: Radiation damage in the TEM and SEM, Micron, 35, 399–409, https://doi.org/10.1016/j.micron.2004.02.003, 2004.
Freney, E. J., T., M. S., and Buseck, P. R.: Deliquescence and Efflorescence of Potassium Salts Relevant to Biomass-Burning Aerosol Particles, Aerosol Science and Technology, 43, 799–807, https://doi.org/10.1080/02786820902946620, 2009.
Froyd, K. D., Yu, P., Schill, G. P., Brock, C. A., Kupc, A., Williamson, C. J., Jensen, E. J., Ray, E., Rosenlof, K. H., Bian, H., Darmenov, A. S., Colarco, P. R., Diskin, G. S., Bui, T., and Murphy, D. M.: Dominant role of mineral dust in cirrus cloud formation revealed by global-scale measurements, Nature Geoscience, 15, 177–183, https://doi.org/10.1038/s41561-022-00901-w, 2022.
Gao, C. Y., Heald, C. L., Katich, J. M., Luo, G., and Yu, F.: Remote Aerosol Simulated During the Atmospheric Tomography (ATom) Campaign and Implications for Aerosol Lifetime, Journal of Geophysical Research: Atmospheres, 127, e2022JD036524, https://doi.org/10.1029/2022JD036524, 2022.
Geng, H., Kang, S., Jung, H.-J., Choël, M., Kim, H., and Ro, C.-U.: Characterization of individual submicrometer aerosol particles collected in Incheon, Korea, by quantitative transmission electron microscopy energy-dispersive X-ray spectrometry, Journal of Geophysical Research: Atmospheres, 115, https://doi.org/10.1029/2009JD013486, 2010.
Hoesly, R. M., Smith, S. J., Feng, L., Klimont, Z., Janssens-Maenhout, G., Pitkanen, T., Seibert, J. J., Vu, L., Andres, R. J., Bolt, R. M., Bond, T. C., Dawidowski, L., Kholod, N., Kurokawa, J.-I., Li, M., Liu, L., Lu, Z., Moura, M. C. P., O'Rourke, P. R., and Zhang, Q.: Historical (1750–2014) anthropogenic emissions of reactive gases and aerosols from the Community Emissions Data System (CEDS), Geosci. Model Dev., 11, 369–408, https://doi.org/10.5194/gmd-11-369-2018, 2018.
Huang, H., Jin, Y., Sun, W., Gao, Y., Sun, P., and Ding, W.: Biomass Burning in Northeast China over Two Decades: Temporal Trends and Geographic Patterns, Remote Sensing, 16, https://doi.org/10.3390/rs16111911, 2024.
Jacobson, M. Z.: Strong radiative heating due to the mixing state of black carbon in atmospheric aerosols, Nature, 409, 695–697, https://doi.org/10.1038/35055518, 2001.
Jimenez, J. L., Jayne, J. T., Shi, Q., Kolb, C. E., Worsnop, D. R., Yourshaw, I., Seinfeld, J. H., Flagan, R. C., Zhang, X., Smith, K. A., Morris, J. W., and Davidovits, P.: Ambient aerosol sampling using the Aerodyne Aerosol Mass Spectrometer, Journal of Geophysical Research: Atmospheres, 108, https://doi.org/10.1029/2001jd001213, 2003.
Johnson, M. S., Strawbridge, K., Knowland, K. E., Keller, C., and Travis, M.: Long-range transport of Siberian biomass burning emissions to North America during FIREX-AQ, Atmospheric Environment, 252, https://doi.org/10.1016/j.atmosenv.2021.118241, 2021.
JURCAOS and JAMSTEC: R/V SHINSEI MARU KS-22-10 Cruise Data, JAMSTEC [data set], https://doi.org/10.17596/0003381, 2022.
Kawai, K., Matsui, H., and Tobo, Y.: High Potential of Asian Dust to Act as Ice Nucleating Particles in Mixed-Phase Clouds Simulated With a Global Aerosol-Climate Model, Journal of Geophysical Research: Atmospheres, 126, https://doi.org/10.1029/2020jd034263, 2021.
Kawana, K., Taketani, F., Matsumoto, K., Tobo, Y., Iwamoto, Y., Miyakawa, T., Ito, A., and Kanaya, Y.: Roles of marine biota in the formation of atmospheric bioaerosols, cloud condensation nuclei, and ice-nucleating particles over the North Pacific Ocean, Bering Sea, and Arctic Ocean, Atmos. Chem. Phys., 24, 1777–1799, https://doi.org/10.5194/acp-24-1777-2024, 2024.
Koike, M., Kawai, Y., Adachi, K., Aiki, H., Kanaya, Y. Kawai, H., Kita, K., Kondo, F., Koshiro, T., Matsui, H., Miyakawa, T., Miyamoto, A., Miyasaka, T., Miyazaki, Y., Mochida, M., Mori, T., Moteki, N., Murayama, T., Nakamura, H., Ohata, S., Oka, E., Okajima, S., Tobo, Y., Sekizawa, Y., and Yoshida, A.: Integrated aircraft and research vessel observational studies of aerosols and clouds in summer over the western North Pacific, Progress in Earth and Planetary Science, 12, 50, https://doi.org/10.1186/s40645-025-00719-1, 2025.
Laing, J. R., Jaffe, D. A., and Hee, J. R.: Physical and optical properties of aged biomass burning aerosol from wildfires in Siberia and the Western USA at the Mt. Bachelor Observatory, Atmos. Chem. Phys., 16, 15185–15197, https://doi.org/10.5194/acp-16-15185-2016, 2016.
Lewis, E. R. and Schwartz, S. E. (Eds.): Sea Salt Aerosol Production: Mechanisms, Methods, Measurements and Models, https://doi.org/10.1029/GM152, 2004.
Li, G., Chen, J., Chen, Y., Yang, J., Ji, J., and Liu, L.: Dolomite as a tracer for the source regions of Asian dust, Journal of Geophysical Research: Atmospheres, 112, https://doi.org/10.1029/2007jd008676, 2007.
Li, W., Shao, L., Zhang, D., Ro, C.-U., Hu, M., Bi, X., Geng, H., Matsuki, A., Niu, H., and Chen, J.: A review of single aerosol particle studies in the atmosphere of East Asia: morphology, mixing state, source, and heterogeneous reactions, Journal of Cleaner Production, 112, 1330–1349, https://doi.org/10.1016/j.jclepro.2015.04.050, 2016.
Li, W., Riemer, N., Xu, L., Wang, Y., Adachi, K., Shi, Z., Zhang, D., Zheng, Z., and Laskin, A.: Microphysical properties of atmospheric soot and organic particles: measurements, modeling, and impacts, npj Climate and Atmospheric Science, 7, https://doi.org/10.1038/s41612-024-00610-8, 2024.
Liu, Q., Quan, J., Jia, X., Sun, Z., Li, X., Gao, Y., and Liu, Y.: Vertical Profiles of Aerosol Composition over Beijing, China: Analysis of In Situ Aircraft Measurements, Journal of the Atmospheric Sciences, 76, 231–245, https://doi.org/10.1175/jas-d-18-0157.1, 2019.
Lohmann, U., Friebel, F., Kanji, Z. A., Mahrt, F., Mensah, A. A., and Neubauer, D.: Future warming exacerbated by aged-soot effect on cloud formation, Nature Geoscience, 13, 674–680, https://doi.org/10.1038/s41561-020-0631-0, 2020.
Matsui, H., Koike, M., Kondo, Y., Oshima, N., Moteki, N., Kanaya, Y., Takami, A., and Irwin, M.: Seasonal variations of Asian black carbon outflow to the Pacific: Contribution from anthropogenic sources in China and biomass burning sources in Siberia and Southeast Asia, Journal of Geophysical Research: Atmospheres, 118, 9948–9967, https://doi.org/10.1002/jgrd.50702, 2013.
Matsuki, A., Iwasaka, Y., Osada, K., Matsunaga, K., Kido, M., Inomata, Y., Trochkine, D., Nishita, C., Nezuka, T., Sakai, T., Zhang, D., and Kwon, S. A.: Seasonal dependence of the long-range transport and vertical distribution of free tropospheric aerosols over east Asia: On the basis of aircraft and lidar measurements and isentropic trajectory analysis, Journal of Geophysical Research: Atmospheres, 108, https://doi.org/10.1029/2002jd003266, 2003.
McNaughton, C. S., Clarke, A. D., Howell, S. G., Pinkerton, M., Anderson, B., Thornhill, L., Hudgins, C., Winstead, E., Dibb, J. E., Scheuer, E., and Maring, H.: Results from the DC-8 Inlet Characterization Experiment (DICE): Airborne Versus Surface Sampling of Mineral Dust and Sea Salt Aerosols, Aerosol Science and Technology, 41, 136–159, https://doi.org/10.1080/02786820601118406, 2007.
Moffet, R. C., de Foy, B., Molina, L. T., Molina, M. J., and Prather, K. A.: Measurement of ambient aerosols in northern Mexico City by single particle mass spectrometry, Atmospheric Chemistry and Physics., 8, 4499–4516, https://doi.org/10.5194/acp-8-4499-2008, 2008.
Moteki, N. and Kondo, Y.: Dependence of Laser-Induced Incandescence on Physical Properties of Black Carbon Aerosols: Measurements and Theoretical Interpretation, Aerosol Science and Technology, 44, 663–675, https://doi.org/10.1080/02786826.2010.484450, 2010.
Moteki, N., Kondo, Y., Miyazaki, Y., Takegawa, N., Komazaki, Y., Kurata, G., Shirai, T., Blake, D. R., Miyakawa, T., and Koike, M.: Evolution of mixing state of black carbon particles: Aircraft measurements over the western Pacific in March 2004, Geophysical Research Letters, 34, https://doi.org/10.1029/2006gl028943, 2007.
Moteki, N., Adachi, K., Ohata, S., Yoshida, A., Harigaya, T., Koike, M., and Kondo, Y.: Anthropogenic iron oxide aerosols enhance atmospheric heating, Nature Communications, 8, 15329, https://doi.org/10.1038/ncomms15329, 2017.
Moteki, N., Ohata, S., Yoshida, A., and Adachi, K.: Constraining the complex refractive index of black carbon particles using the complex forward-scattering amplitude, Aerosol Science and Technology, 57, 678–699, https://doi.org/10.1080/02786826.2023.2202243, 2023.
Murphy, D. M., Froyd, K. D., Bian, H., Brock, C. A., Dibb, J. E., DiGangi, J. P., Diskin, G., Dollner, M., Kupc, A., Scheuer, E. M., Schill, G. P., Weinzierl, B., Williamson, C. J., and Yu, P.: The distribution of sea-salt aerosol in the global troposphere, Atmos. Chem. Phys., 19, 4093–4104, https://doi.org/10.5194/acp-19-4093-2019, 2019.
NASA FIRMS: VIIRS (S-NPP) I Band 375 m Active Fire Product NRT (Vector data), VNP14IMGT distributed from NASA FIRMS, https://doi.org/10.5067/FIRMS/VIIRS/VNP14IMGT_NRT.002, 2025.
Ohata, S., Moteki, N., Adachi, K., Tobo, Y., Matsui, H., Kita, K., Mori, T., and Koike, M.: Aircraft-based observation of mineral dust particles over the western North Pacific in summer using a complex amplitude sensor, Journal of Geophysical Research: Atmospheres, 130, e2024JD043063, 10.1029/2024JD043063, 2025.
Oshima, N., Kondo, Y., Moteki, N., Takegawa, N., Koike, M., Kita, K., Matsui, H., Kajino, M., Nakamura, H., Jung, J. S., and Kim, Y. J.: Wet removal of black carbon in Asian outflow: Aerosol Radiative Forcing in East Asia (A-FORCE) aircraft campaign, Journal of Geophysical Research: Atmospheres, 117, https://doi.org/10.1029/2011jd016552, 2012.
Pöschl, U.: Atmospheric aerosols: composition, transformation, climate and health effects, Angewandte Chemie International Edition, 44, 7520–7540, https://doi.org/10.1002/anie.200501122, 2005.
Pósfai, M. and Buseck, P. R.: Nature and Climate Effects of Individual Tropospheric Aerosol Particles, Annual Review of Earth and Planetary Sciences, 38, 17–43, https://doi.org/10.1146/annurev.earth.031208.100032, 2010.
Reid, J. P., Bertram, A. K., Topping, D. O., Laskin, A., Martin, S. T., Petters, M. D., Pope, F. D., and Rovelli, G.: The viscosity of atmospherically relevant organic particles, Nature Communications, 9, 956, https://doi.org/10.1038/s41467-018-03027-z, 2018.
Riemer, N., Ault, A. P., West, M., Craig, R. L., and Curtis, J. H.: Aerosol Mixing State: Measurements, Modeling, and Impacts, Reviews of Geophysics, 57, 187–249, https://doi.org/10.1029/2018rg000615, 2019.
Satheesh, S. and Moorthy, K. K.: Radiative effects of natural aerosols: A review, Atmospheric Environment, 39, 2089–2110, https://doi.org/10.1016/j.atmosenv.2004.12.029, 2005.
Song, C. H., Maxwell-Meier, K., Weber, R. J., Kapustin, V., and Clarke, A.: Dust composition and mixing state inferred from airborne composition measurements during ACE-Asia C130 Flight #6, Atmospheric Environment, 39, 359–369, https://doi.org/10.1016/j.atmosenv.2004.08.046, 2005.
Tagliabue, A., Bowie, A. R., Boyd, P. W., Buck, K. N., Johnson, K. S., and Saito, M. A.: The integral role of iron in ocean biogeochemistry, Nature, 543, 51–59, https://doi.org/10.1038/nature21058, 2017.
Taketani, F., Tobo, Y., Miyakawa, T., Takigawa, M., Zhu, C., and Kanaya, Y.: Impact of Siberian Wildfires on Ice-Nucleating Particle Concentrations over the Northwestern Pacific, Environmental Science & Technology, 59, 2565–2574, https://doi.org/10.1021/acs.est.4c04889, 2025.
Tobo, Y., Zhang, D., Matsuki, A., and Iwasaka, Y.: Asian dust particles converted into aqueous droplets under remote marine atmospheric conditions, Proceedings of the National Academy of Sciences, 107, 17905–17910, https://doi.org/10.1073/pnas.1008235107, 2010.
Uno, I., Eguchi, K., Yumimoto, K., Takemura, T., Shimizu, A., Uematsu, M., Liu, Z., Wang, Z., Hara, Y., and Sugimoto, N.: Asian dust transported one full circuit around the globe, Nature Geoscience, 2, 557–560, https://doi.org/10.1038/ngeo583, 2009.
Vignati, E., Facchini, M. C., Rinaldi, M., Scannell, C., Ceburnis, D., Sciare, J., Kanakidou, M., Myriokefalitakis, S., Dentener, F., and O'Dowd, C. D.: Global scale emission and distribution of sea-spray aerosol: Sea-salt and organic enrichment, Atmospheric Environment, 44, 670–677, https://doi.org/10.1016/j.atmosenv.2009.11.013, 2010.
Wang, X., Huang, J., Ji, M., and Higuchi, K.: Variability of East Asia dust events and their long-term trend, Atmospheric Environment, 42, 3156–3165, https://doi.org/10.1016/j.atmosenv.2007.07.046, 2008.
Wang, Y., Zheng, Z., Sun, Y., Yao, Y., Ma, P.-L., Zhang, A., Zhu, S., Zhang, Z., Chen, X., Pang, Y., Wang, Q., Che, H., Ching, J., and Li, W.: Improved representation of black carbon mixing structures suggests stronger direct radiative heating, One Earth, 8, 101311, https://doi.org/10.1016/j.oneear.2025.101311, 2025.
Warneke, C., Bahreini, R., Brioude, J., Brock, C. A., de Gouw, J. A., Fahey, D. W., Froyd, K. D., Holloway, J. S., Middlebrook, A., Miller, L., Montzka, S., Murphy, D. M., Peischl, J., Ryerson, T. B., Schwarz, J. P., Spackman, J. R., and Veres, P.: Biomass burning in Siberia and Kazakhstan as an important source for haze over the Alaskan Arctic in April 2008, Geophysical Research Letters, 36, https://doi.org/10.1029/2008gl036194, 2009.
Warneke, C., Froyd, K. D., Brioude, J., Bahreini, R., Brock, C. A., Cozic, J., de Gouw, J. A., Fahey, D. W., Ferrare, R., Holloway, J. S., Middlebrook, A. M., Miller, L., Montzka, S., Schwarz, J. P., Sodemann, H., Spackman, J. R., and Stohl, A.: An important contribution to springtime Arctic aerosol from biomass burning in Russia, Geophysical Research Letters, 37, https://doi.org/10.1029/2009gl041816, 2010.
Yang, Y., Mou, S., Wang, H., Wang, P., Li, B., and Liao, H.: Global source apportionment of aerosols into major emission regions and sectors over 1850–2017, Atmos. Chem. Phys., 24, 6509–6523, https://doi.org/10.5194/acp-24-6509-2024, 2024.
Yoshida, A., Tobo, Y., Adachi, K., Moteki, N., Kawai, Y., Sasaoka, K., and Koike, M.: Analysis of oceanic suspended particulate matter in the western North Pacific using the complex amplitude sensor, Scientific Reports, 14, 20055, https://doi.org/10.1038/s41598-024-70683-1, 2024.
Yoshizue, M., Taketani, F., Adachi, K., Iwamoto, Y., Tohjima, Y., Mori, T., and Miura, K.: Detection of Aerosol Particles from Siberian Biomass Burning over the Western North Pacific, Atmosphere, 11, https://doi.org/10.3390/atmos11111175, 2020.
Zeng, J., Tohjima, Y., Fujinuma, Y., Mukai, H., and Katsumoto, M.: A study of trajectory quality using methane measurements from Hateruma Island, Atmospheric Environment, 37, 1911–1919, https://doi.org/10.1016/s1352-2310(03)00048-7, 2003.
Zhang, X. Y., Gong, S. L., Shen, Z. X., Mei, F. M., Xi, X. X., Liu, L. C., Zhou, Z. J., Wang, D., Wang, Y. Q., and Cheng, Y.: Characterization of soil dust aerosol in China and its transport and distribution during 2001 ACE-Asia: 1. Network observations, Journal of Geophysical Research: Atmospheres, 108, https://doi.org/10.1029/2002jd002632, 2003.
Zhou, D., Ding, K., Huang, X., Liu, L., Liu, Q., Xu, Z., Jiang, F., Fu, C., and Ding, A.: Transport, mixing and feedback of dust, biomass burning and anthropogenic pollutants in eastern Asia: a case study, Atmos. Chem. Phys., 18, 16345–16361, https://doi.org/10.5194/acp-18-16345-2018, 2018.