the Creative Commons Attribution 4.0 License.
the Creative Commons Attribution 4.0 License.
 | 09 Oct 2025
Cloud–radiation interactions amplify ozone pollution in a warming climate
Shuyu Zhao
Xuexi Tie
Biao Tian
Xiao Hu
Bo Hu
Dong Yang
Sinan Gu
Minghu Ding
Ozone (O3) pollution has recently become the most critical air quality issue in China, yet its underlying drivers related to climate change remain poorly understood. Here, we use a regional atmospheric chemistry model, along with 10-year ground-level O3 measurements, and reanalysis data on low cloud cover (LCC) and surface downward shortwave radiation (SSRD) to investigate the impacts of variations in LCC, SSRD, and cloud–radiation interactions (CRIs) on O3 production. We design six numerical experiments and specifically modify parameters related to cloud radiation effects in the chemistry module to find out the underlying cause for O3 increase during the warm season of 2022 in the Yangtze River Delta (YRD), China. Results show that O3 production is strongly modulated by LCC and SSRD. CRI plays a significant role in regulating O3 concentration; i.e., reduced LCC, increased SSRD, and a weakened CRI are primarily responsible for the sharp increase in warm-season O3 concentration observed in 2022 in the YRD, China. Moreover, climate warming is likely to exacerbate future O3 pollution via weakening CRI due to fewer clouds and more SSRD. To mitigate O3 pollution, we thus propose implementing more stringent emission reduction measures on O3 precursors, along with proactive strategies to address climate change.
- Article
(7492 KB) - Full-text XML
-
Supplement
(4368 KB) - BibTeX
- EndNote


Over the past decade, high concentrations of ground-level ozone (O3) have increasingly been a major air pollution issue in China. These O3 pollution events are characterized by extensive spatial coverage and prolonged duration during the warm season; i.e., from 22–29 September 2019, a severe O3 pollution event in eastern China covered an area of approximately 3.2×10⁶ km2 (Zhang and Zheng, 2022). Another notable aspect is that high O3 concentration often coincides with high-temperature weather, and their co-occurrence frequency has increased at a faster rate than either alone in recent years (Xiao et al., 2022), posing serious risks to human health, climate change, and food security.
Ground-level observations show that each 1 °C increase results in an 8–10 µg m−3 rise in O3 concentrations during heatwaves in eastern China, when air temperature varies between 28 and 38 °C (Pu et al., 2017; Wang et al., 2023). This is largely attributed to O3 sensitivity to the precursors. In the volatile organic compound (VOC)-limited regime, an increase in air temperature can enhance biogenic VOC emissions, providing more O3 precursors (Liu and Wang, 2020a). However, the response of O3 concentration to air temperature is nonlinear. As the temperature further increases and exceeds 38.5 °C, chemical and biophysical feedbacks of vegetation are suppressed, and consequently, biogenic emissions and related O3 formation are reduced (Meehl et al., 2018; Pu et al., 2017; Steiner et al., 2010). Thus, extreme high temperature cannot fully explain high O3 concentration. What exactly causes the highest daytime O3 concentration in the hottest summer?
Several recent review studies have identified multiple factors to explain ground-level O3 formation (Fu et al., 2019; Jiang et al., 2022; Lu et al., 2019a; Wang et al., 2022a), including precursor emissions and their proportion (Mousavinezhad et al., 2021; Wang et al., 2019b; Xue et al., 2014; Zeng et al., 2018, 2023); climate patterns (Creilson et al., 2005; Gao et al., 2023; Hong et al., 2019; Shen and Mickley, 2017; Xu et al., 2017); synoptic-scale circulation systems (Dong et al., 2020; Ji et al., 2024; Jiang et al., 2021; Li et al., 2018; Mao et al., 2020; Shu et al., 2016; Yin et al., 2019; Zhao et al., 2010; Zhao and Wang, 2017; Zheng et al., 2023; Zhou et al., 2013); meteorological parameters such as temperature (Lu et al., 2019b; Mousavinezhad et al., 2021; Pu et al., 2017; Wang et al., 2023; Zheng et al., 2023), humidity (Mousavinezhad et al., 2021; Pu et al., 2017; Zhao and Wang, 2017; Zheng et al., 2023), wind (Mao et al., 2020; Pu et al., 2017; Zhao and Wang, 2017), and boundary layer height (Mousavinezhad et al., 2021; Zheng et al., 2023), and stratosphere–troposphere exchange (Lu et al., 2019a, b; Verstraeten et al., 2015).
However, ground-level O3 is inherently a photochemical product, and anthropogenic emissions are source drivers that determine its levels, while incident solar radiation acts as a trigger for photochemical reactions, dominating photolysis rates of O3 production. Currently, there are few studies on the influence of changes in solar radiation on O3 formation. Early studies reported that clouds have important impacts on tropospheric photochemistry, which increases global mean OH concentration by about 20 % (Tie et al., 2003). It was also found that the prediction accuracy of clouds in the model would significantly affect atmospheric chemical composition near the surface layers, leading to an overestimation/underestimation of O3 concentration (Pour-Biazar et al., 2007). During the Texas Air Quality Study II Radical and Aerosol Measurement Project, the influence of clouds on photolysis rate was evidently greater than that of aerosols (Flynn et al., 2010), and the total reduction in the photolysis rate caused by clouds and aerosols was almost linearly correlated with the reduction in the net O3 production. These studies all indicate that changes in clouds and solar radiation significantly influence the photolysis conditions, which is of great importance to O3 formation. In China, the decline in PM2.5 concentration is considered one of the reasons for the increase in O3 levels in recent years due to the weakened aerosol–radiation interactions (Yang et al., 2022). However, there is a lack of field campaign evidence similar to that in the USA (Flynn et al., 2010), and only in recent years have few studies qualitatively described the influence of solar radiation on O3 concentration. For example, enhanced solar radiation during hot and dry weather can increase O3 production (Mousavinezhad et al., 2021; Xia et al., 2022; Yin et al., 2019; Zhao and Wang, 2017). Some of these studies have also mentioned that cloud cover can alter solar radiation, thereby affecting O3 formation (Xia et al., 2022; Zhao and Wang, 2017). Nonetheless, these studies lack quantitative analysis and systematic explanations of mechanisms for the contributions of clouds, solar radiation, and their variability to O3 formation, and none of them further investigate the impact of cloud–radiation interactions (CRIs) on O3 formation. Moreover, with the increasingly persistent impact of climate change, how this factor may affect O3 concentration remains unclear.
In this study, we establish correlations between daytime O3 concentration and downward solar radiation as well as low clouds, based on measurements and reanalysis data during the past decade. Using numerical models, we analyze the causes of high O3 concentration and, in particular, assess the dependence of O3 change on the variabilities of clouds, solar radiation, and CRI. Furthermore, we project the potential impacts of these factors on high O3 concentration under climate change.
2.1 Measurements and reanalysis data
We collect in situ measurements on hourly mass concentrations of gaseous pollutants in the Yangtze River Delta (YRD), China, during the warm season of the past decade (2014–2024). The gaseous pollutants include O3, CO, and NO2, which are measured by the Model 49i UV Photometric Ozone (O3) Analyzer, Model 48i Gas Filter Correlation Carbon Monoxide (CO) Analyzer, and Model 42i Chemiluminescence NO–NO2–NOx Analyzer, respectively. These analyzers are equipped with built-in calibration systems that accurately linearize the instrument outputs. The missing data have been eliminated. The flat YRD region, located in eastern China, is one of the largest urban agglomerations in the world, consisting of three provinces (Jiangsu, Zhejiang, and Anhui) and one municipality (Shanghai) (Fig. 1a). This region is densely populated, with highly developed economies and transportation networks, and concurrently, anthropogenic emissions of O3 precursors, including nitrogen oxides (NOx) and volatile organic compounds (VOCs), are significantly higher than those in other regions of China (Fig. 1b and c). Moreover, the region has abundant vegetation, resulting in a moderate level of biogenic VOC emission in China (Fig. 1d). Thus, this region is one of China's hotspots for O3 pollution. The warm season in mid-latitude regions of Northern Hemisphere often refers to the April–September period. In this period of 6 consecutive months within a single calendar year, the highest mean O3 concentration is observed, defined as the warm-season O3. The YRD belongs to the mid-latitude region (Fig. 1a) and is facing an environment issue of high O3 concentration during the warm season.
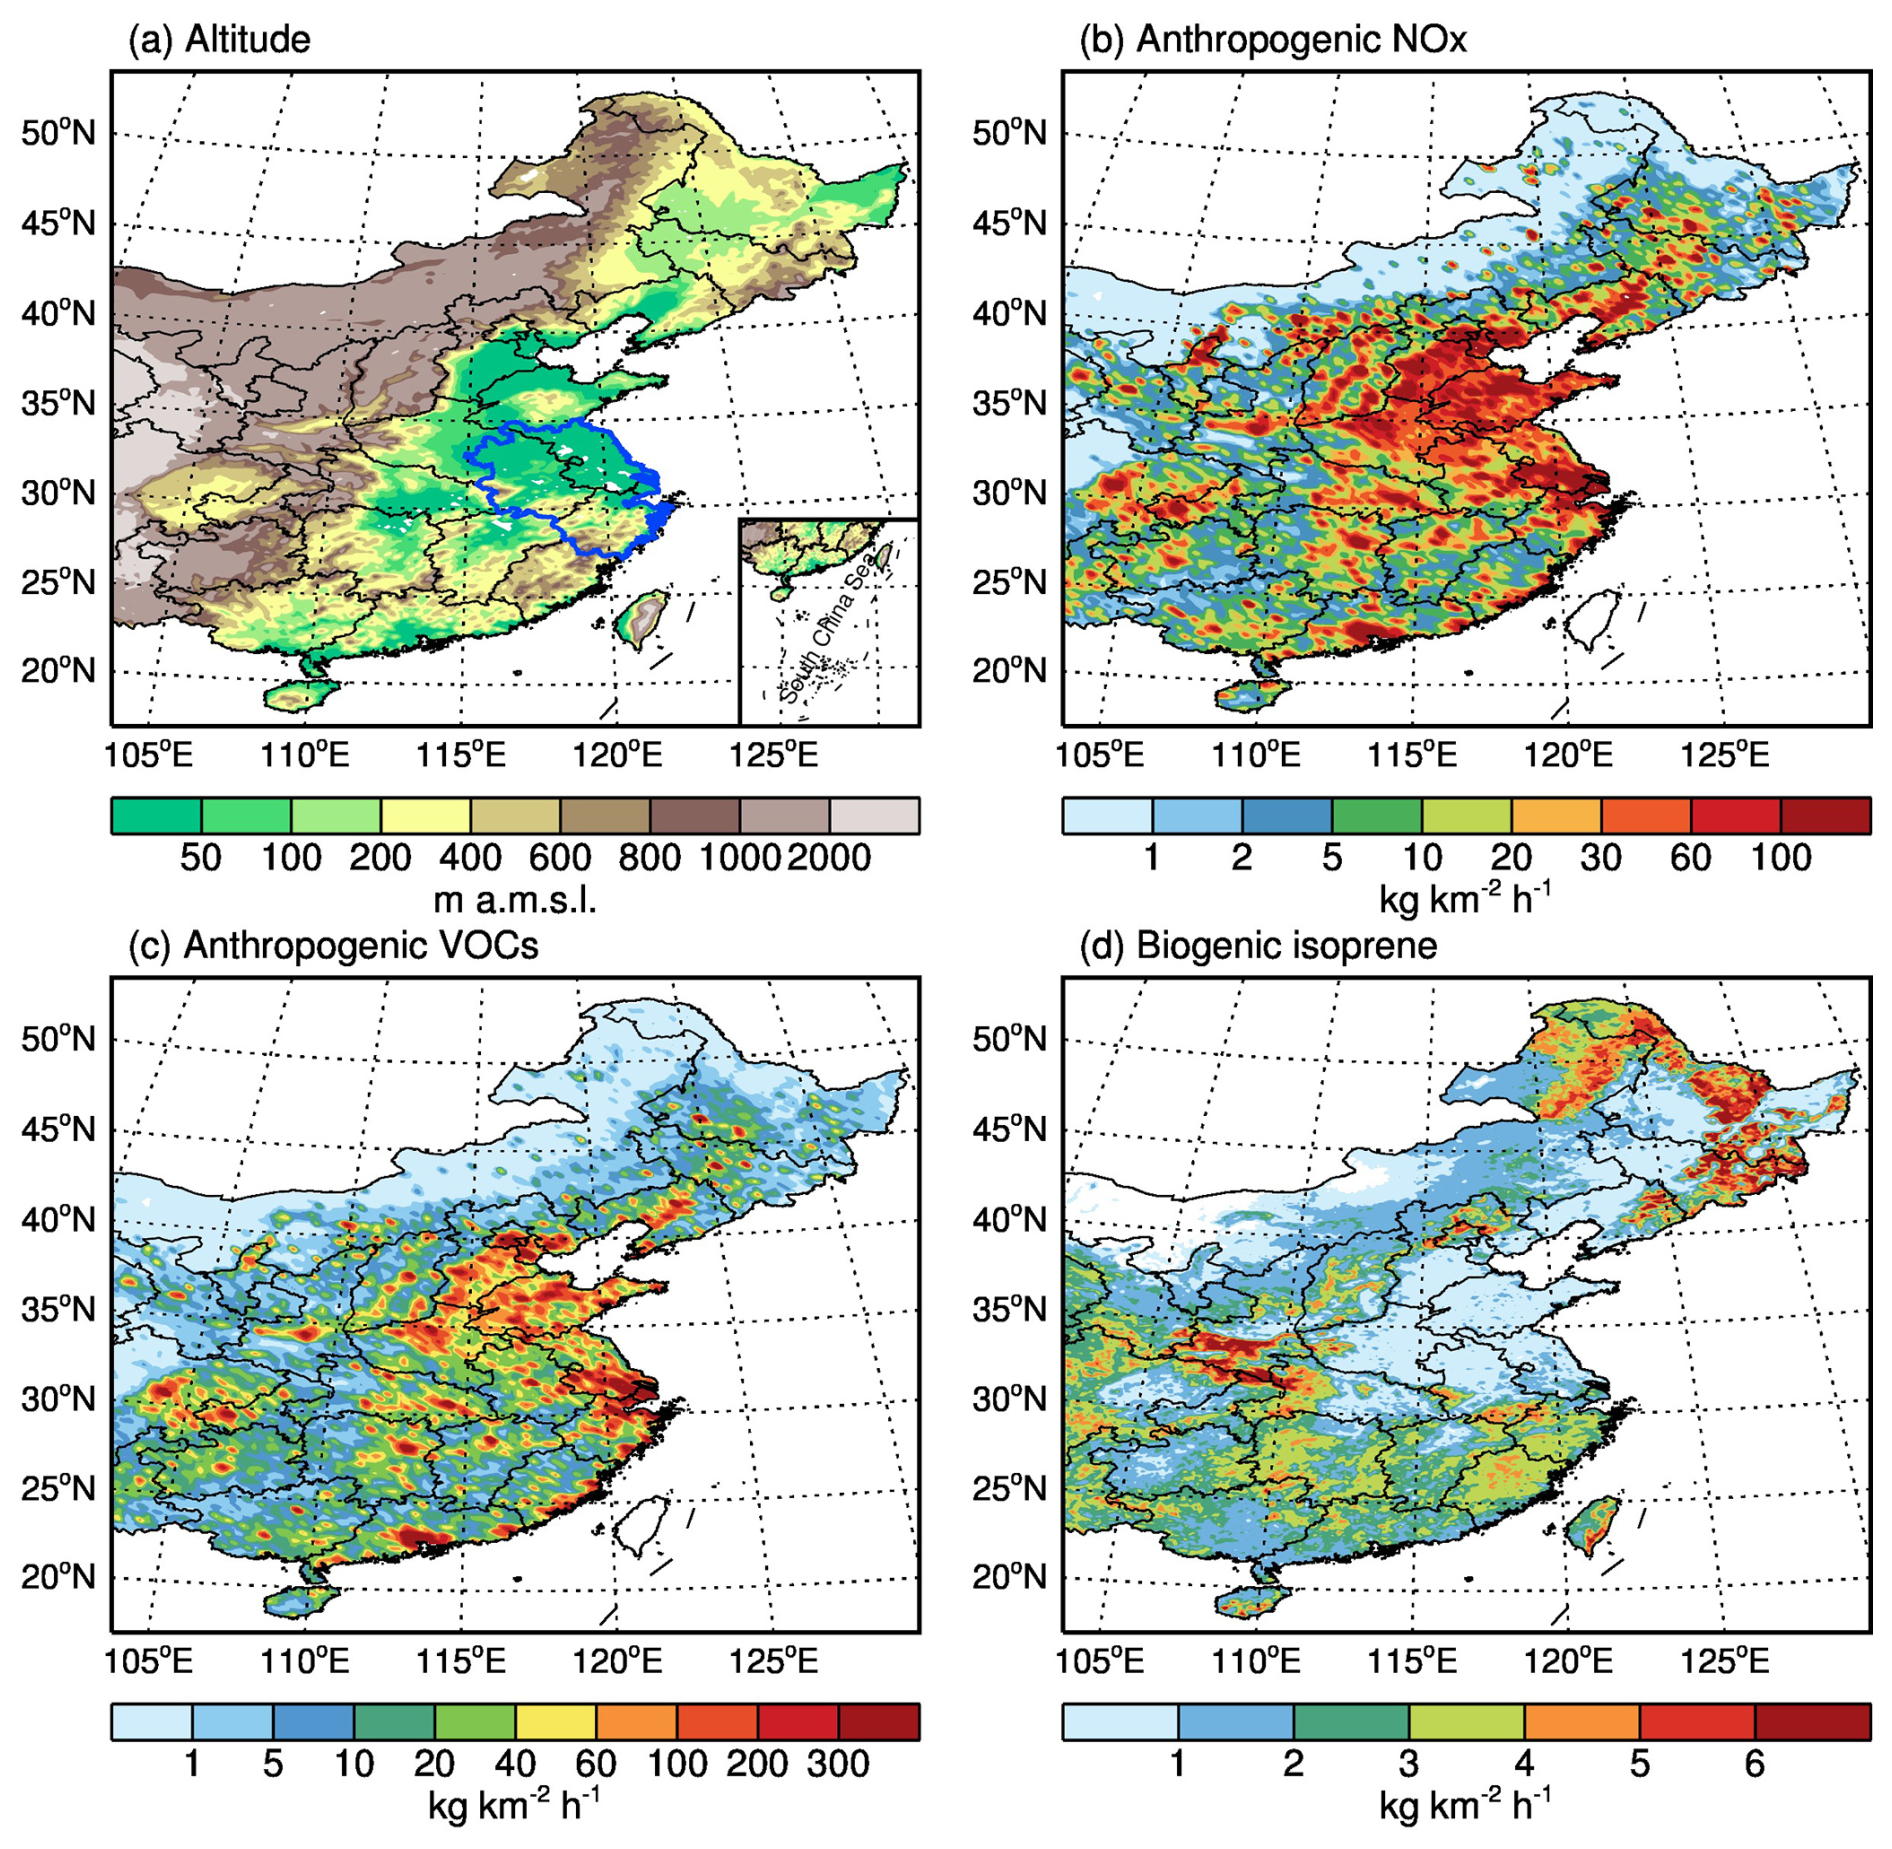
Figure 1Location of the YRD, China and spatial distributions of emissions. (a) The flat YRD is located in eastern China, marked by the blue line. (b) Anthropogenic NOx emission rate in July 2022 based on the MEIC. (c) Same as panel (b) but for anthropogenic non-methane VOCs. Panels (b) and (c) represent human-induced emissions of precursors for O3. (d) Biogenic isoprene emission rate is calculated by MEGAN, representing biogenic VOC emissions.
Meteorological reanalysis data used here consist of surface downward shortwave radiation (SSRD) and low cloud cover (LCC) from the European Centre for Medium-Range Weather Forecasts ERA5, with an hourly resolution and a 0.25° × 0.25° spatial resolution. SSRD and LCC data are selected from 07:00–18:00 Beijing time (BJT) due to O3 photochemical formation occurred during the daytime. Hourly observations on 2 m temperature (T2 m), relative humidity (RH), wind speed (WS), and wind direction (WD) observed at four weather stations are from the National Oceanic and Atmospheric Administration, available at https://www.ncei.noaa.gov/maps/hourly/ (last access: 12 September 2025).
2.2 Model and experiments
We use the state-of-the-art regional Weather Research and Forecasting Model online coupled with chemistry (WRF-Chem model) to investigate the causes of high O3 concentration during the warm season of 2022. The WRF-Chem model is a regional atmospheric chemistry transport model that can assess how the physical and chemical processes including transport, vertical mixing, aerosol–cloud interactions, cloud–radiation interactions, emissions, and gas-to-particle conversion affect air quality. The detailed model information refers to Grell et al. (2005), and model configurations used in this study are as follows. The physical mechanisms include the Goddard longwave and shortwave radiation schemes (Dudhia, 1989), the WSM 6-class graupel microphysics scheme (Hong and Lim, 2006), the Mellor–Yamada–Janjić (MYJ) planetary boundary layer scheme (Janjić, 2002), the unified Noah land-surface model (Chen and Dudhia, 2001), and the Monin–Obukhov surface layer scheme (Janjić, 2002). The chemical mechanisms include a new flexible gas-phase chemical module and the Community Multiscale Air Quality (CMAQ, version 4.6) aerosol module developed by the United States Environmental Protection Agency (U.S. EPA) (Binkowski, 2003), gas-phase reactions of volatile organic compounds (VOCs) and nitrogen oxide (NOx) by the SAPRC-99 (Statewide Air Pollution Research Center, version 1999), and a non-traditional volatility basis set (VBS) approach to calculate secondary organic aerosol (SOA) formation (Li et al., 2011b). In addition, HONO production by NO2 heterogeneous reaction is added to improve HOx (OH+HO2), NOx, O3, and SOA simulations (Li et al., 2010). Inorganic aerosols use the ISORROPIA mechanism (version 1.7) (Nenes et al., 1998), in which a SO2 heterogeneous reaction to sulfate formation on aerosol surfaces is considered (Li et al., 2017a). A fast Tropospheric Ultraviolet and Visible (FTUV) radiation transfer model is used to calculate the photolysis rates (Tie et al., 2003), which can also calculate the impacts of aerosols and clouds on the photochemistry processes (Li et al., 2011a). The wet deposition uses the method in CMAQ (Byun and Ching, 1999), and the dry deposition follows Wesely (1989). The anthropogenic emission inventory used was the Multi-resolution Emission Inventory for China (MEIC), developed by Tsinghua University (Li et al., 2017b), consisting of industrial, power, transportation, agricultural, and residential sources. The biogenic emissions are calculated by the Model of Emissions of Gases and Aerosol from Nature (MEGAN) (Guenther et al., 2006). The model horizontal resolution is 6 km, with 200 grids in the longitude and 200 grids in the latitude. There are 35 vertical sigma levels, with intervals ranging from 50 m near the surface to 500 m at 2.5 km above ground level and more than 1 km above 14 km. Initial and boundary meteorological fields in the model are driven by 6 h 1°×1° Final Analyses data from National Centers for Environmental Prediction (NCEP FNL). Chemical initial and boundary fields are from the Community Atmosphere Model with chemistry (CAM-Chem) 6 h output. The spin-up time of the model is 2 d. A brief introduction on the schemes used in this study is shown in Table S1 in the Supplement.
We perform four groups of model experiments, with a total of six simulations (Table 1). The baseline experiment (BS_Exp.) reflects the real situation of high O3 concentration. BS_Exp. uses real emissions and meteorological conditions in July 2022. The rationality for selecting July as the representative month of the warm season is as follows. Firstly, July is typically the most representative month for the warm season in Northern Hemisphere. Moreover, the observed interannual variation in daytime O3 concentration in July is fully consistent with the interannual variation in warm-season mean O3 concentration in recent years (Figs. S1 in the Supplement and 2a). Most importantly, daytime O3 concentration in July 2022 is the highest in recent years, significantly higher than the lowest in July 2021, and another identical feature is that daytime O3 concentration in July 2024 is the second highest. BS_Exp. is also used to validate the model performance by comparing with the measurements. Another two groups of control experiments (CTRL_Exp.) are used to assess the impacts of interannual variability of meteorology and emission change on O3 formation. The first group of control experiments selects the year of 2021 with the lowest daytime O3 concentration in recent 5 years, using the same emissions as the BS_Exp. but different meteorological conditions (defined as CTRL_Exp.1). Differences between the CTRL_Exp.1 and BS_Exp. can illustrate the impacts of interannual variability of meteorological conditions on O3 concentration. The second group uses the same meteorological conditions as the BS_Exp. but different emissions (CTRL_Exp.2). Emission changes in CTRL_Exp.2 are based on the emissions in 2021, and the difference between CTRL_Exp.2 and the BS_Exp. can explain the impact of emission changes of precursors on O3 formation. In addition, we perform a background experiment (BG_Exp.) with zero anthropogenic emissions to calculate the background O3 concentration.
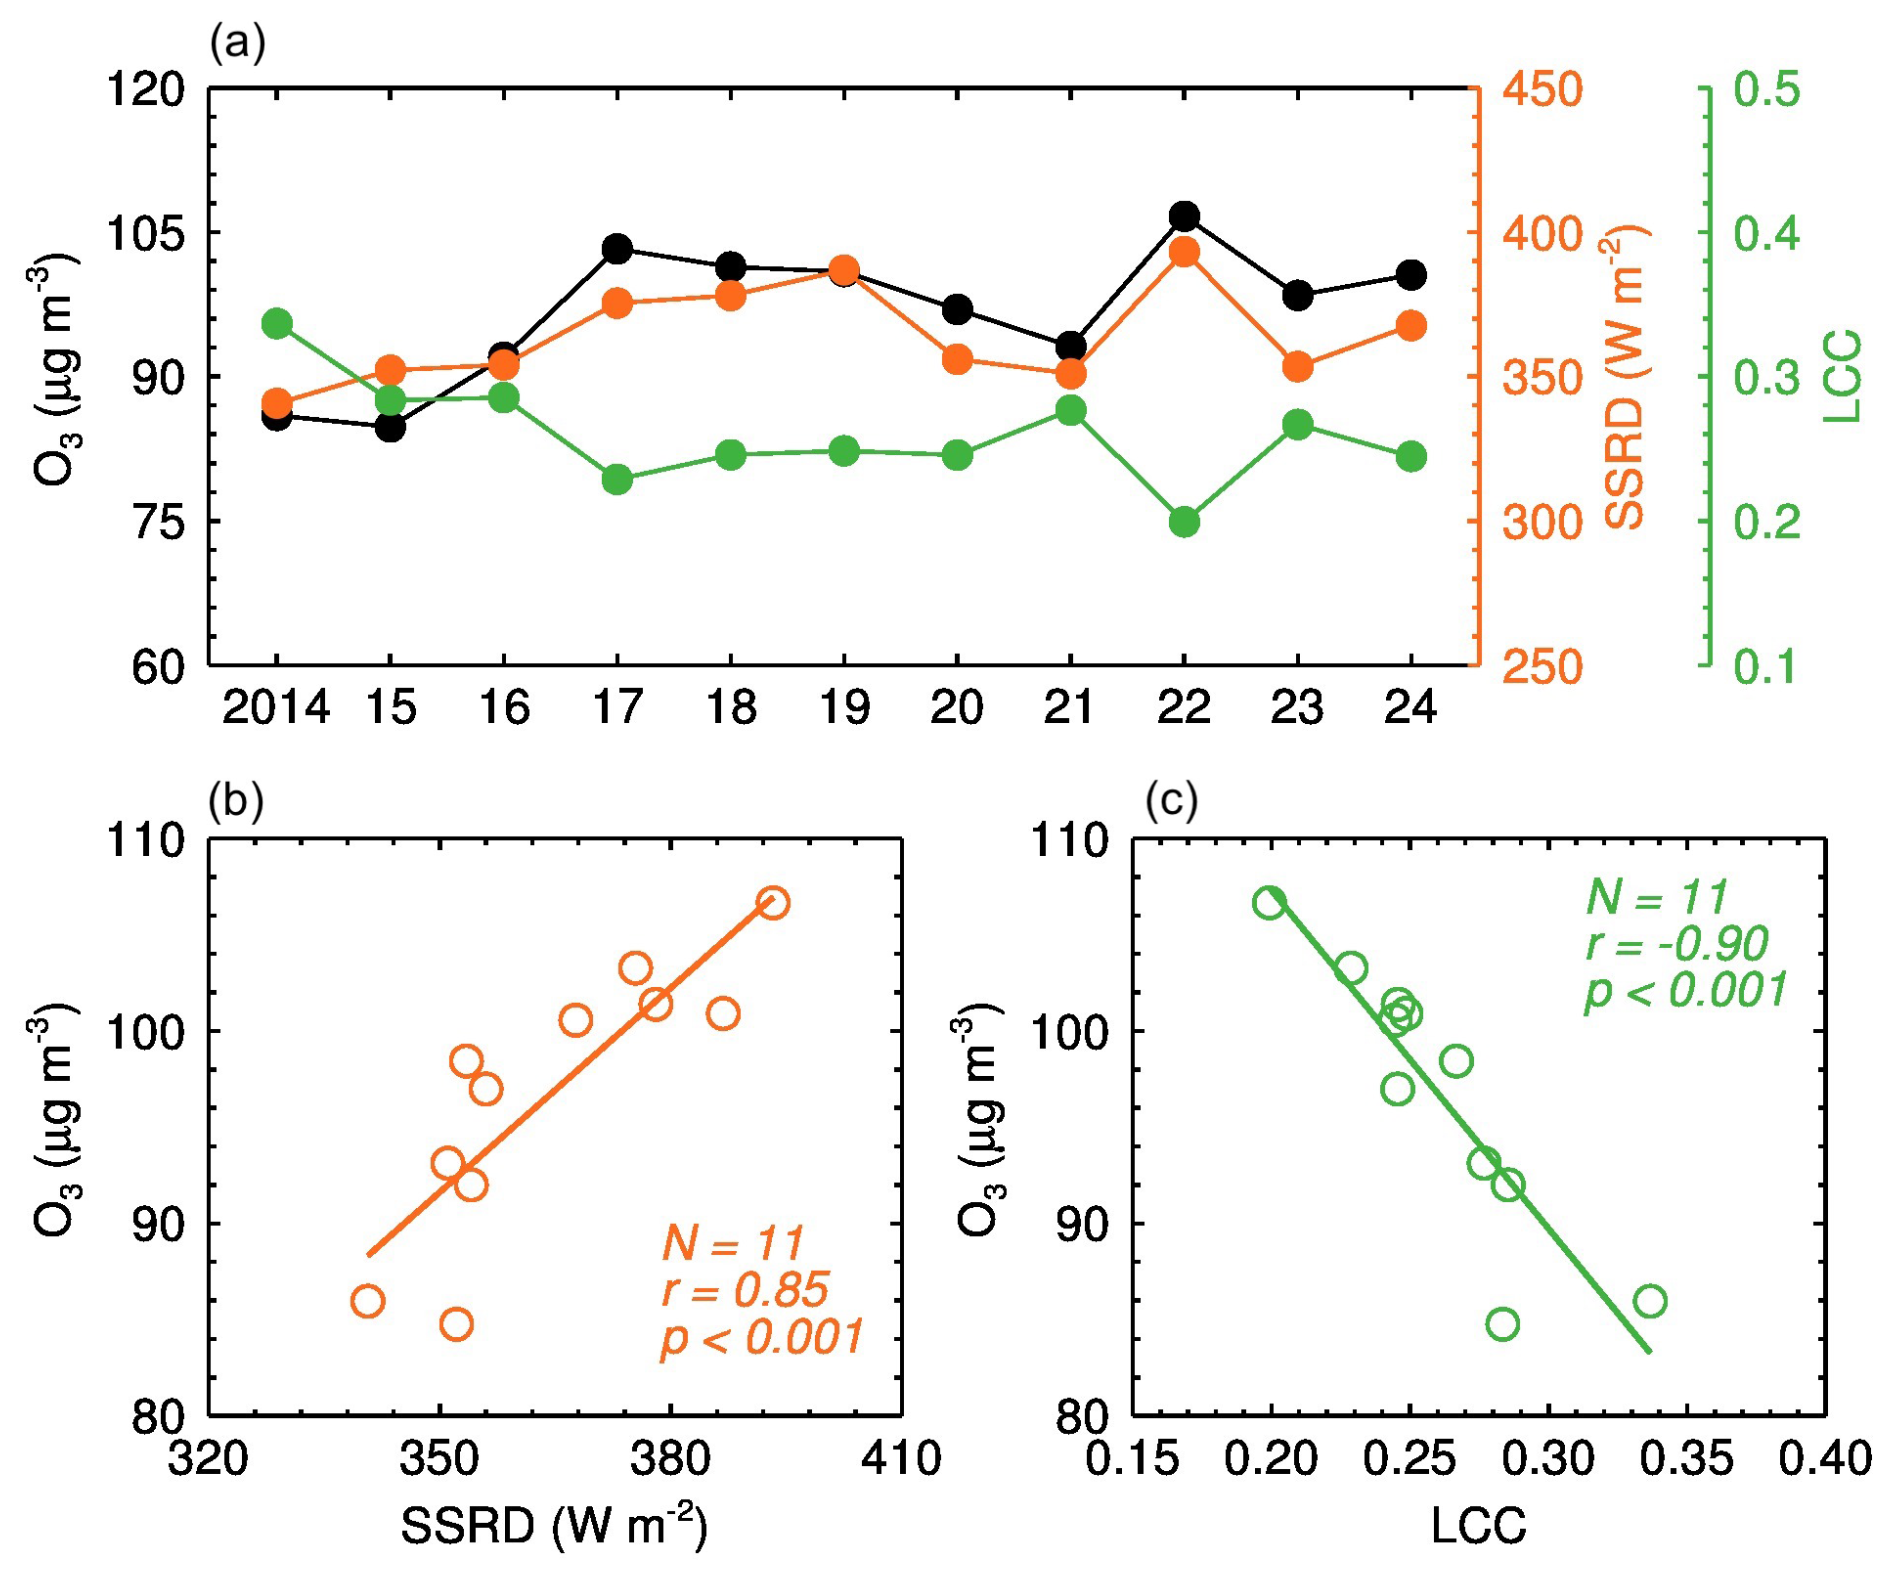
Figure 2Observed relationships between O3, SSRD, and LCC. (a) Annual variation in mean daytime O3 concentration (black), SSRD (orange), and LCC (green) during the warm season of the past decade (2014–2024) in the YRD, China. (b) Correlation between O3 concentration and SSRD. (c) Correlation between O3 concentration and LCC. The colored lines in panels (b) and (c) represent the linear fits through the data in panel (a); i.e., with r=0.85 and with . O3 concentration is significantly positively (negatively) correlated with SSRD (LCC), with confidence levels exceeding 99.9 %. Sample sizes N, correlation coefficients r, and confidence levels p by Student's t test are shown in panels (b) and (c).
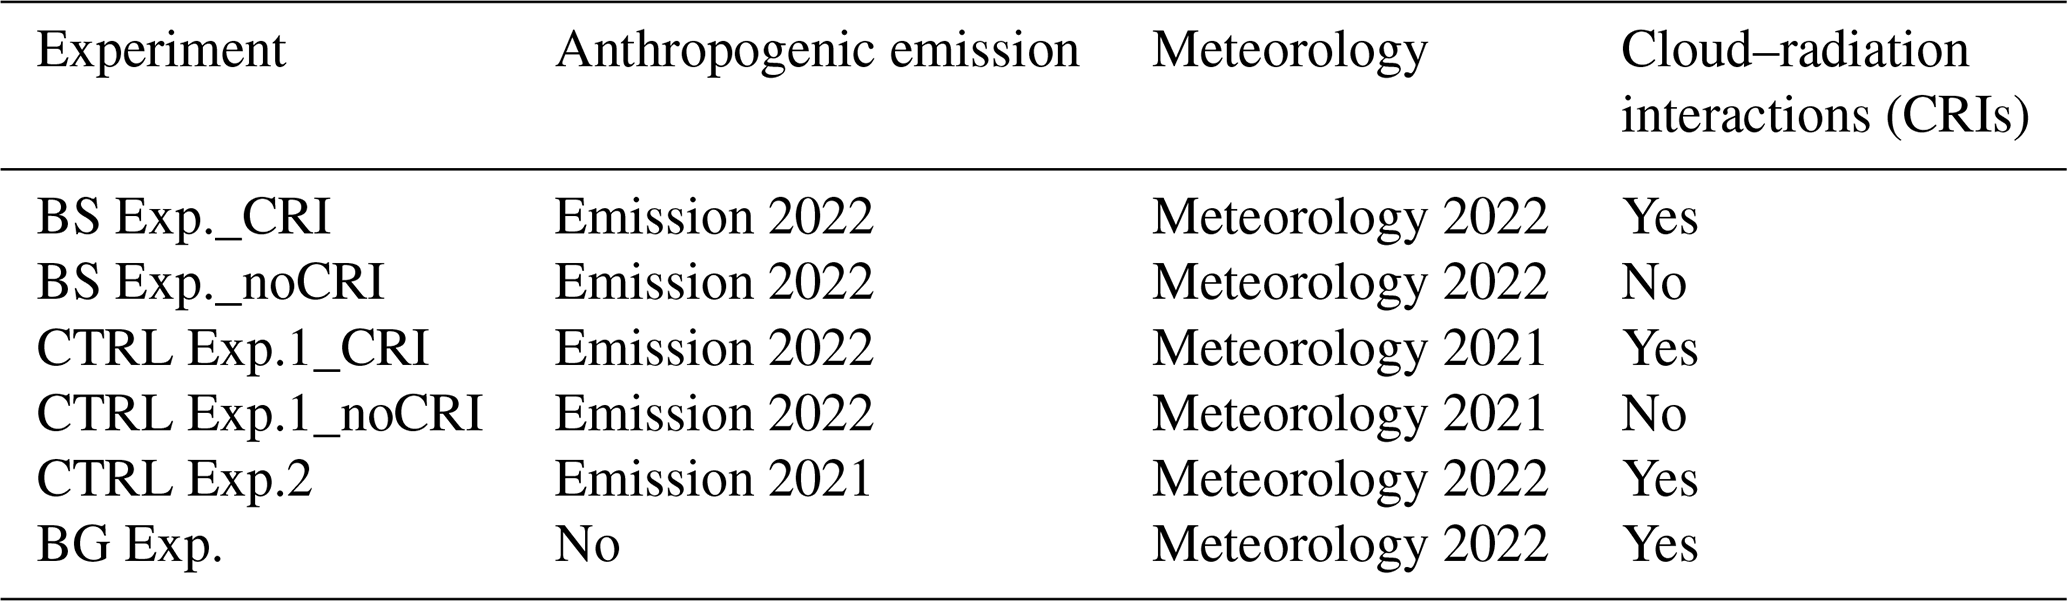
Based upon the BS_Exp. and CTRL_Exp.1, we particularly examine the contribution of CRI intensity to O3 formation via considering and not considering the impact of CRI on atmospheric photochemistry. The BS_Exp. experiments with CRI considered or not are designated as BS_Exp._CRI and BS_Exp._noCRI, respectively, while the CTRL_Exp.1 experiments with and without CRI are designated as CTRL_Exp.1_CRI and CTRL_Exp.1_noCRI. The setup information for all simulation experiments is provided in Table 1. The impacts of clouds on solar radiation are calculated by adjusting three key parameters in the chemical module related to cloud radiative effect: cloud optical depth, single scattering albedo, and asymmetry factor. This approach confines the CRI impact within photochemical reactions, only altering the photolysis rates of photochemical substances directly associated with O3 formation. Additionally, it avoids the original meteorological fields in the physical module being perturbed by the CRI, which would otherwise complicate the study.
To evaluate the model performance, we use three common statistical indices involving mean bias (MB), root mean square error (RMSE), and index of agreement (IOA) (Willmott, 1981). The formulas are as follows:
where Pi and Oi represented the simulated and observed variables, respectively. N is the total sample number of the simulation, and denotes the average of the observation. The IOA ranges from 0–1. The closer it is to 1, the better the simulation.
2.3 Climate scenarios
Using 41-model results from Coupled Model Intercomparison Project Phase 6 (CMIP6) (Table S2), we analyze the long-term trends of monthly surface downwelling shortwave radiation (SSRD), total cloud cover percentage (TCC), and daily maximum air temperature (Tmax) in July during 2025–2099 under three Shared Socioeconomic Pathways (SSPs). These three SSPs narrate the Green Road with a sustainable development paradigm (SSP1-1.9), middle-of-the-road scenario along a historical development pattern (SSP2-4.5), and a highway road with a fossil-fueled development pattern (SSP5-8.5) that represent high, moderate, and low climate mitigation pathways, respectively (Riahi et al., 2017). Finally, we project the potential influence of the solar radiation on the occurrence of high O3 concentration under these climate scenarios.
3.1 Observed linkage between O3, incident solar radiation, and low clouds
Over the past decade, the warm-season mean daytime O3 concentration (hereafter O3 concentration) in the YRD has shown a distinct rising–falling pattern before 2021, with a turning point in 2017 (Fig. 2a). From 2013–2017, O3 concentration increased by 5.9 , while it decreased by 2.5 during 2017–2021. Due to the Action Plan on Prevention and Control of Air Pollution since 2013, China's anthropogenic NOx emissions were substantially reduced (Zhang et al., 2019), whereas VOC emissions increased slightly during 2013–2017 (Zheng et al., 2018). The disproportionate emission reductions largely contributed to the continuous increase in O3 concentration from 2013–2017 (Jiang et al., 2022; Wang et al., 2022a, 2019a; Liu and Wang, 2020b). Since 2017, as VOC emissions have begun to decline (Jiang et al., 2022; Simayi et al., 2022), along with the ongoing reduction in NOx (Li et al., 2024; Zhang et al., 2019), O3 concentration has begun to decline (Lu et al., 2019b). In addition to precursor emissions, O3 trends during this period were also influenced by meteorological conditions and PM2.5 reductions. The meteorological conditions play an important but not dominant role in ozone trends (Liu et al., 2023; Li et al., 2020), and the continued PM2.5 reduction enhances ozone production due to the weakened aerosol uptake of hydroperoxyl (HO2) radicals (Li et al., 2019a). Nevertheless, O3 trends were primarily driven by changes in precursor emissions (Wang et al., 2022a; Liu and Wang, 2020b). Unexpectedly, during the warm season of 2022, O3 concentration suddenly increased to the highest, even surpassing the turning point of 2017 by 3.4 µg m−3. Subsequently, O3 concentrations dropped during the warm seasons of 2023–2024 compared to the same period of 2022 but still remained at relatively high levels. This is seemingly paradoxical to emission reductions in O3 precursors mentioned above.
According to the principle of O3 formation, it is influenced not only by changes in precursor emissions but also by the solar radiation intensity. Observational evidence reveals that interannual variability of warm-season downward solar radiation is highly consistent with the interannual variation of O3 concentration in the YRD during the past decade. A significant positive correlation between them (r=0.85, p<0.001, Fig. 2b) suggests that O3 concentration indeed strongly depends on the SSRD intensity. Low clouds with small and compact liquid droplets can significantly reflect the solar radiation by their considerable optical thickness (Kang et al., 2020), thereby diminishing photolysis rate and the loadings of tropospheric oxidants (Tie et al., 2003, 2019). We examined the relationship between daytime LCC and O3 concentration and found that O3 concentration is more significantly negative with LCC (, p<0.001, Fig. 2c). This suggests that low clouds are of great importance to O3 concentration. Liu and Wang (2020a) suggested that the reduction in cloud cover plays a dominant role in increasing daily maximum 8 h (MDA8) O3 concentration in China during 2014–2017 summer. Similarly, daytime LCC in the warm season of 2022 dropped to the lowest (LCC=0.2) during the past decade, with a 23.6 % reduction relative to the multi-year mean, while SSRD was significantly more than the multi-year mean by 28.9 W m−2 (Fig. S2). Thus, solar radiation is vital to O3 formation, by which an increase (decrease) in LCC intensifies (weakens) the reflection of solar radiation, and decreases (increases) SSRD, unconducive (conducive) to O3 formation. The favorable solar radiation is likely crucial to the sudden increase in O3 concentration during the warm season of 2022, though O3 precursors from anthropogenic emissions have been slashed.
3.2 Model validation
Observations at weather stations in four provinces and municipality are used to validate the model performance on meteorological fields. Results show that the model captures spatiotemporal variability of meteorological parameters well (Fig. S3). For example, the simulated T2 m is in good agreement with the observation, with the IOAs in the range of 0.88–0.92. The MBs are within 0.7 °C, and the RMSEs are around 2.0 °C. Followed by the RH, with IOAs of 0.83–0.89. Most importantly, the model successfully captures the WD shift, with the IOAs of 0.79–0.89, which is crucial for accurately simulating atmospheric transport and re-distribution of the spatiotemporal variations in pollutants. There are also some biases between the simulations and observations. The model generally overestimates the WS, with the IOAs between 0.60 and 0.73, lower than those of the three parameters mentioned above. These discrepancies are partly due to the systematical bias of the WRF-Chem model, which often overestimates the ground-level WS. Additionally, the observation data on WS are recorded only as integers, with no decimal fractions. This lack of precision in observations reduces the temporal variability of the WS, compared to the simulations, thereby resulting in a lower IOA.
For pollutants, the model also reproduces the temporal variation of O3 well, with an MB of 2.4 µg m−3 and an RMSE of 17.7 µg m−3 (Fig. S4a). This means the simulation is approximately 2.8 % higher than the observation, with an accuracy of 79.3 %. The IOA between the simulated O3 hourly variation and the observation exceeds 0.90 (IOA=0.94), implying for a better performance of the model on chemical reactions. The simulated NO2 concentration is also in a good agreement with the observation (IOA=0.83), with an MB of 0.9 µg m−3 and an RMSE of 5.3 µg m−3 (Fig. S4b). Inevitably there are also some discrepancies between the simulation and the observation; i.e, the amplitude of the simulated CO concentration is remarkably greater than the observed (Fig. S4c). This is largely related to the emission inventory that fails to depict an accurate diurnal cycle of CO emission. The IOA between the simulated and observed CO concentrations is thus relatively lower (IOA=0.63). However, the simulated mean CO concentration is extremely close to the observation (), suggesting that the model accurately captures the variability of atmospheric transport. Generally, the model reproduces temporal variations in meteorological fields, O3, and related gaseous pollutants well (Figs. S3 and S4), providing sufficient evidence for the rationality of the model.
3.3 Modeling evidence on O3 increase
To verify this hypothesis, we separately distinguished contributions of background fields, anthropogenic emissions and their changes, as well as changes in meteorological fields to O3 concentration. Meteorological and chemical lateral boundary inputs and biogenic emissions approximately produce 57.7 µg m−3 of O3 concentration in the YRD in the warm season of 2022, accounting for 55.1 % of O3 concentration (Fig. 3). Another study also found that background inputs contribute 39–58 µg m−3 to summertime MDA8 O3 concentration in this region (Li et al., 2019b). These results reveal a relatively high level of background O3 concentration in the YRD, which provides a favorable environmental basis for the occurrence of O3 pollution. When anthropogenic emissions are included, O3 concentration increases by 47.1 µg m−3, suggesting that human emissions remain a key contributor to O3 formation.
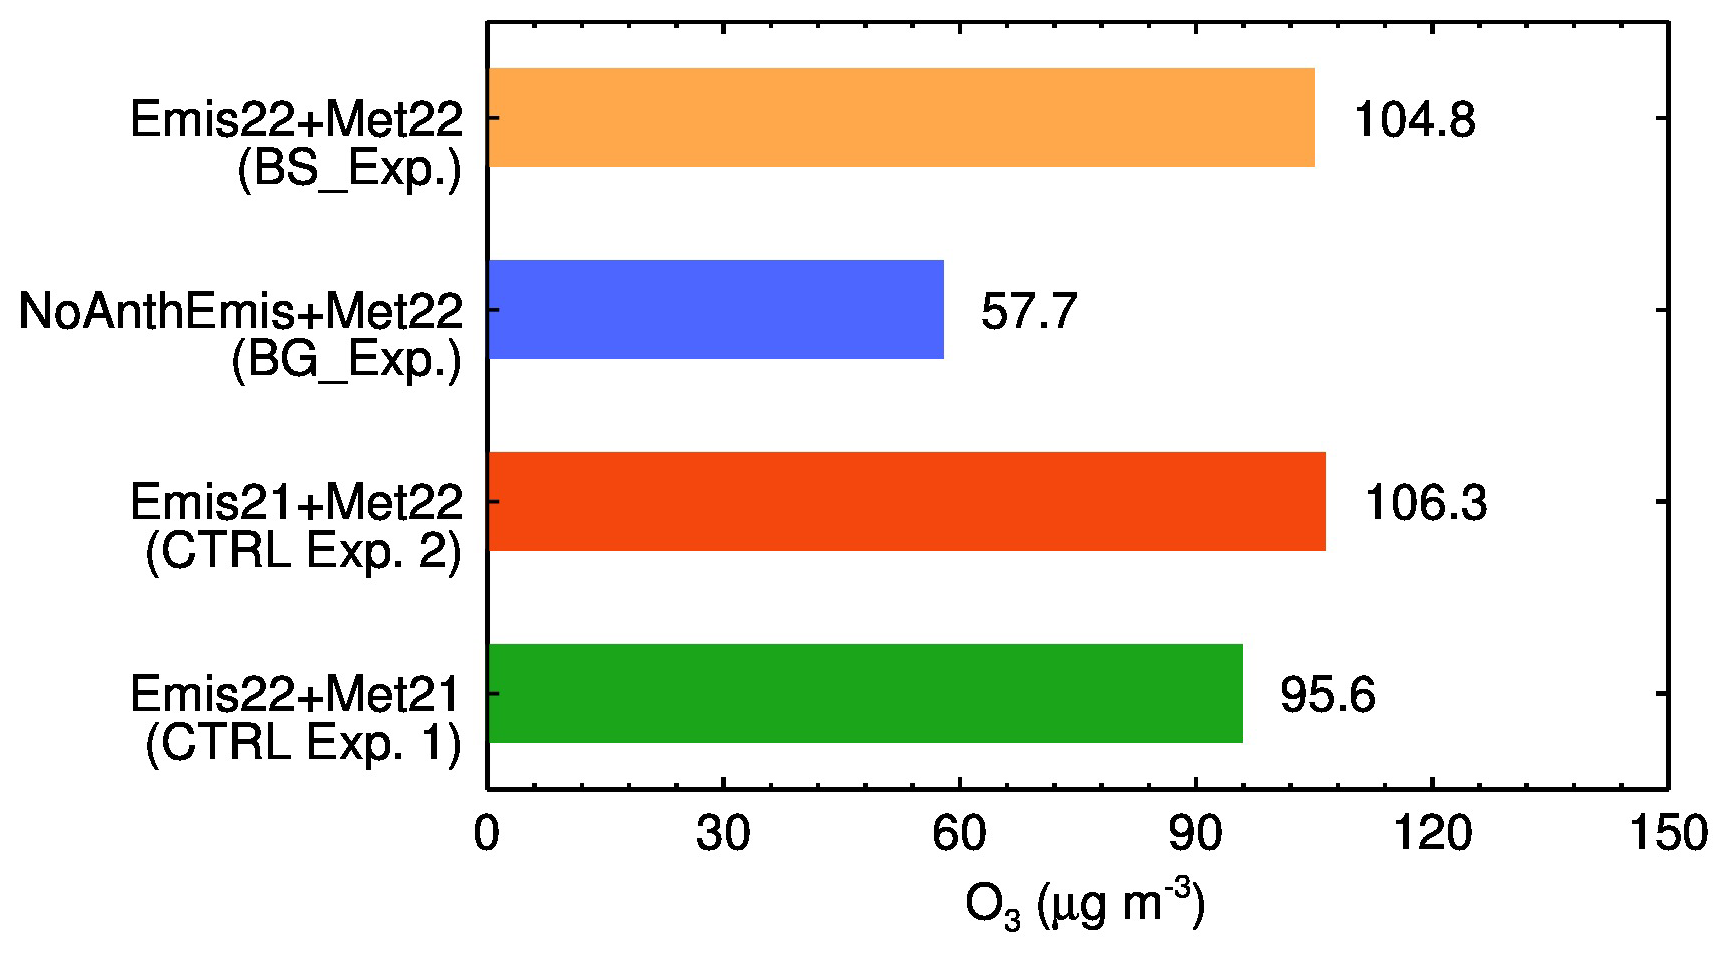
Figure 3Simulated O3 concentrations under different model experiments. Contributions of background input (blue) and anthropogenic emissions (orange minus blue) to summer O3 concentrations in the YRD. Contributions of emission change (orange minus red) and meteorology change (orange minus green) to O3 change.
We further investigated the impact of changes in anthropogenic emissions on O3 concentration. Based upon the interannual variations in anthropogenic emissions, NOx and VOC emissions in the summer of 2022 are approximately reduced by 5 % and 4 %, respectively, compared to the summer of 2021 (Jiang et al., 2022; Li et al., 2024). Consequently, O3 concentration decreased by 1.5 µg m−3 (Fig. 3), meaning that current emission reductions definitely lead to a decline in O3 concentration. As summertime O3 sensitivity changes from a VOC-limited regime to a transitional regime in the YRD (Wang et al., 2019a; 2022b; Yin et al., 2019), simultaneous reductions in VOC and NOx emissions have become an effective way to reduce O3 concentration. Nonetheless, the O3 drop through emission cuts is not as significant as expected. Therefore, the changes in anthropogenic emissions are not responsible for the increase in O3 concentration in the warm season of 2022, and more stringent measures on emission reductions are needed to achieve a desired O3 decline.
Besides the impacts of human emissions, we examined the influence of meteorology change because the change is of great significance to the trend of O3 concentration, even exceeding the impact of changes in anthropogenic emissions (Liu and Wang, 2020a). As a result, differences in meteorological fields alone lead to a 9.2 µg m−3 increase of O3 concentration in July 2022 relative to the same period of 2021 (Fig. 3). This is roughly consistent with Ji et al. (2024), who suggested adjustments of meteorological fields lead to an increase in O3 concentration by 13.0 µg m−3 in coastal cities of the YRD in July 2022 compared to 2015–2021. Thus, meteorological conditions in the warm season of 2022 are more favorable for O3 formation in the YRD. Noticeably, the negative effects of interannual variability of meteorological conditions on O3 concentration have greatly exceeded the positive effects of precursor emission reductions.
Furthermore, we specifically assessed the impacts of shortwave solar radiation, low clouds, and CRI on O3 concentration because the solar radiation is the direct meteorological factor for O3 formation. The model also reproduces the interannual variability of LCC and SSRD well; i.e., the calculated changes in LCC and SSRD are 0.07 and 83.5 W m−2, respectively, close to the observed 0.09 and 82.7 W m−2 (Fig. S5). These comparisons mean that the calculated interannual variability of LCC is approximately 22.2 % lower than the observations, while SSRD variability is overestimated by about 1.0 %. This may lead to a little underestimation of the impact of LCC and SSRD variabilities on O3 formation. Generally, the model evidence confirms the observed linkage that an increase (decrease) in LCC and a decrease (increase) in SSRD can suppress (enhance) O3 production (Fig. S6). As LCC increases, the SSRD reduces significantly at a rate of more than 40 W m−2 per 0.1 increase in LCC (Fig. S6a). In particular, the SSRD decreases more rapidly in the early stage when low clouds appear. As a result, the photolysis rate rapidly drops and O3 production significantly slows down. As LCC further increases, daily mean SSRD falls below 400 W m−2, resulting in a noticeable slowdown in photolysis rates, falling to less than (Fig. S6b). Consequently, the rate of O3 production slows, and O3 concentrations are not as high as what occurred in the early stage (Fig. S6c). Noticeably, the correlation between O3 concentration and SSRD is less significant than the correlations in Fig. S6a and b, with a confidence level exceeding 95 % (whereas the first two panels show confidence levels exceeding 99.9 %). The data are also distributed more dispersedly. This is largely due to solar radiation being one key factor influencing O3 production. Precursor emissions and their proportion are the other key factor. In addition, O3 concentration is also affected by atmospheric transport, deposition, and stratosphere–troposphere exchange, mentioned in Sect. 1.
Unfortunately, current models are unable to fully isolate the individual contribution of variability in LCC and SSRD to O3 production. As a compromise, we managed to examine the response of O3 concentration to the CRI. In July 2022, clear-sky weather dominates in the YRD, with monthly mean daytime LCC noticeably lower than that in 2021 (Fig. 4a and b). The regional average daytime LCC and SSRD are 0.04 and 583.20 W m−2, respectively (Fig. 4a and c). Compared to July 2021 (Fig. 4b and d), LCC decreases by 63.6 %, while SSRD increases by 16.7 %. This clear and cloudless weather favors O3 formation. Consequently, the magnitude and spatial coverage of high O3 concentration are significantly larger (Fig. 4e and f). Less LCC in July 2022 reflects less incident solar radiation, resulting in less attenuation to incident solar radiation and more solar radiation reaching the surface. This minimal impact of clouds on incident solar radiation is defined as a weak CRI. By comparison, more LCC in July 2021 enhances the reflection of incident solar radiation, and consequently, less incident solar radiation reaches the surface, leading to a strong CRI. Whether the CRI is strong or weak, it reduces SSRD and decelerates the photolysis rate, thereby suppressing ground-level O3 production (Figs. 5a, b, and S6). The stronger (weaker) the CRI, the more (less) the O3 reduction. The change in O3 concentration (ΔO3) is highly sensitive to the LCC when low clouds are fewer in number (Fig. S6). A little increase in LCC can cause a sharp decline in O3 production, resulting in a significant reduction in O3 concentration. For example, when LCC is less than 0.3, an increase of 0.1 in LCC approximately leads to a reduction of 3.5 µg m−3 in ΔO3. When LCC is more than 0.3, the photolysis rates decrease to a lower level (Fig. S6a and b), and Δ O3 drops not as rapidly as that in the initial stage of clouds' occurrence, with a decline rate of 2.4 µg m−3 for an additional 0.1 increase in LCC (Fig. S7). Such changes in LCC and SSRD can lead to variations in the CRI, resulting in significantly different impacts on O3 production. Compared with the summer of 2021, the weaker CRI in the summer of 2022 leads to a widespread and substantial increase in O3 change over the YRD, with the maximum increase exceeding 9 µg m−3 on a local scale (Fig. 5c). This implies that a weakened CRI suppresses O3 formation less effectively, thereby indirectly enhancing O3 production, with a regional mean O3 increase of 2.9 µg m−3 (Fig. S8).
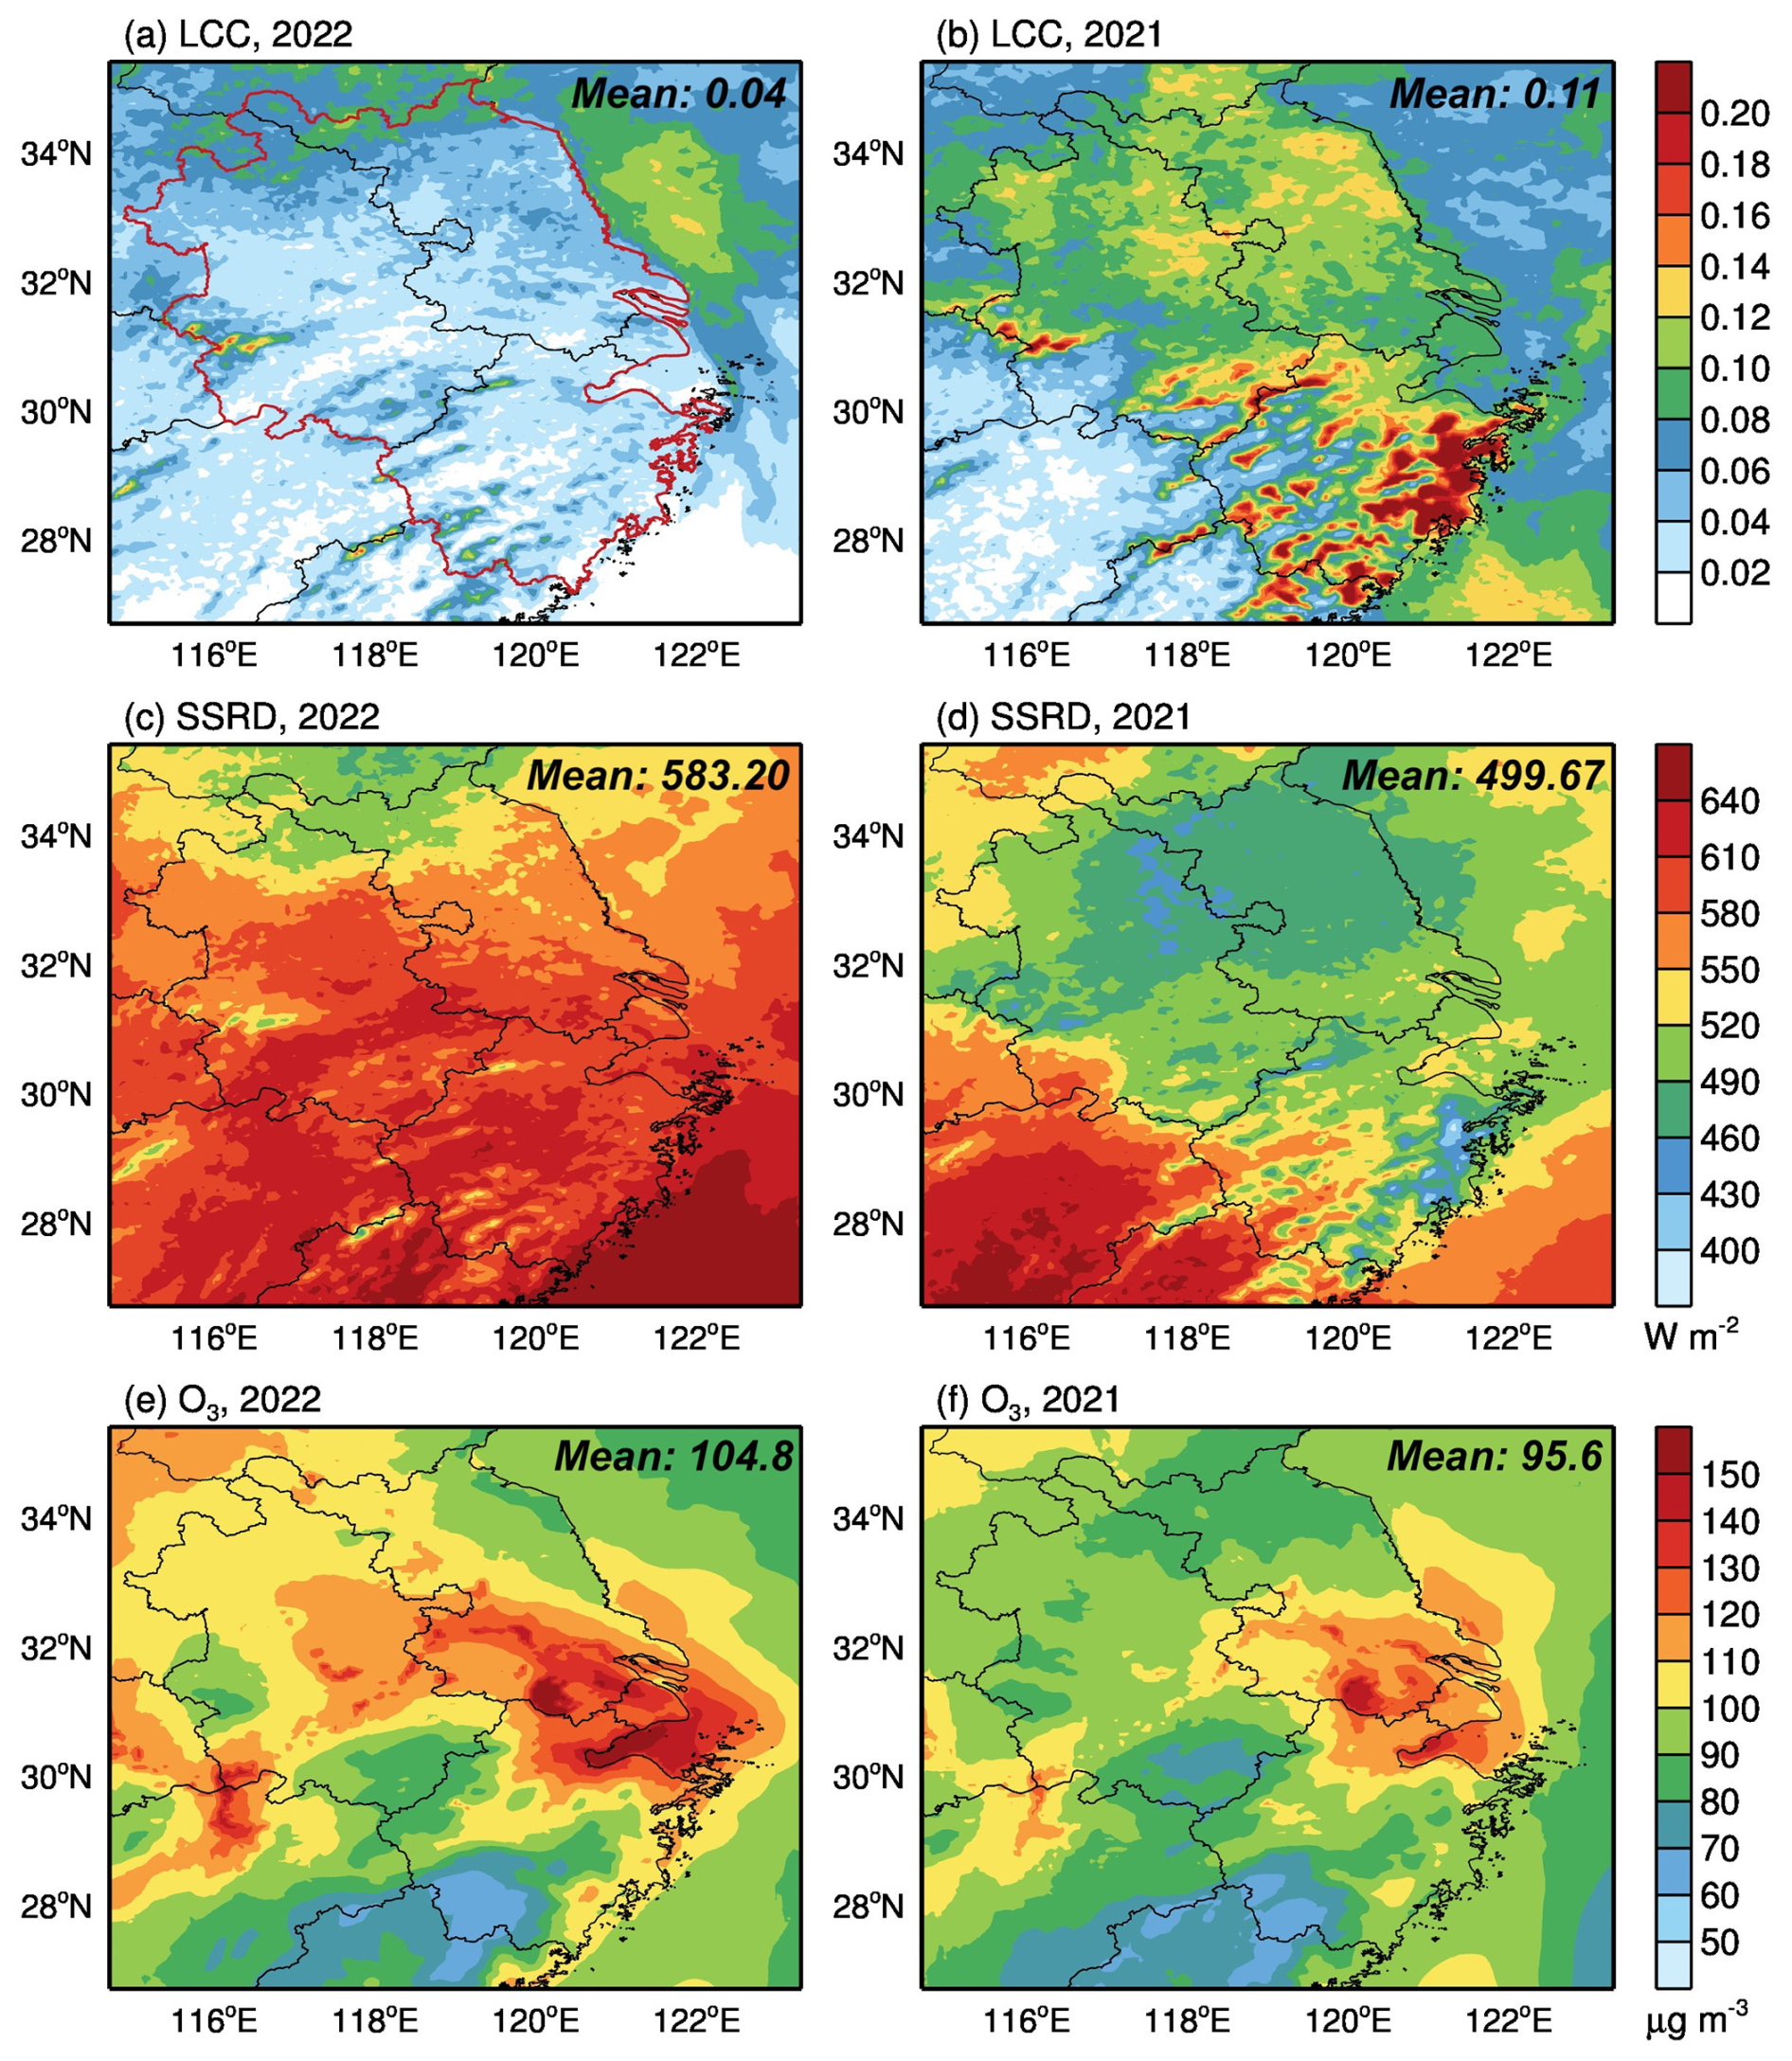
Figure 4Comparison of spatial distribution of monthly mean daytime O3 concentrations under different CRI intensities. (a, b) LCC in July 2022 and July 2021, respectively. (c, d) SSRD. (e, f) Daytime O3 concentrations. Panels (a) and (c) represent a weak CRI mechanism due to less LCC and more SSRD, corresponding to higher O3 concentrations, with a larger spatial coverage. Panels (b) and (d) represent a strong CRI mechanism due to more LCC and less SSRD, corresponding to lower O3 concentrations, with a smaller spatial coverage. The YRD is enclosed by the red line in panel (a). The regional average of each variable is shown at the top-right corner of each panel.
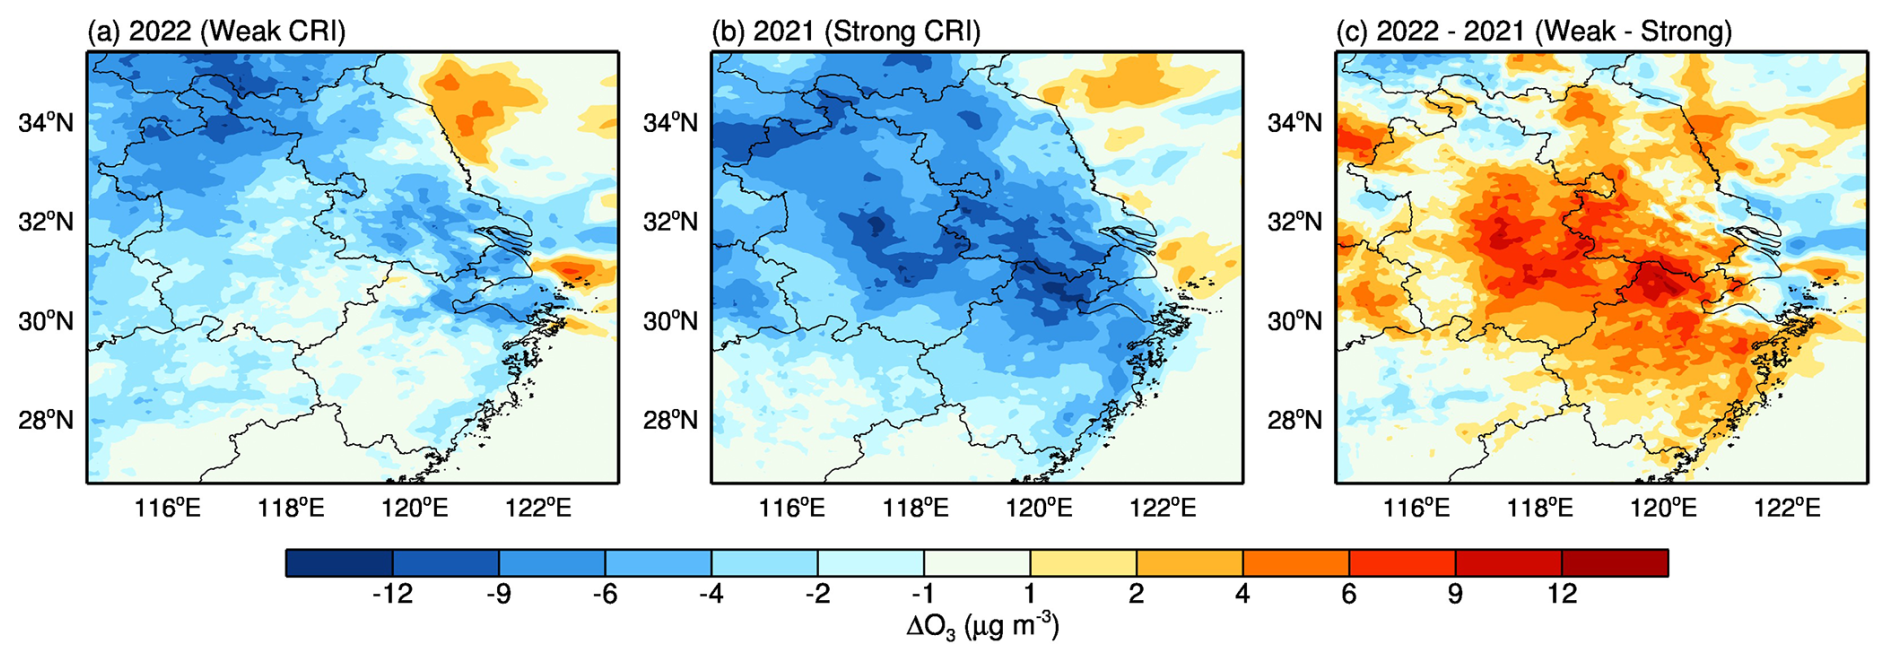
Figure 5Influence of CRI on O3 change. (a) Difference in O3 concentrations including and excluding CRI in July 2022, indicating O3 change caused by a weak CRI. (b) Same as panel (a) but in July 2021, indicating O3 change caused by a strong CRI. (c) A result of panel (a) minus (b), representing ΔO3 change caused by the CRI intensity change.
Based on the above results, contributions of different factors to O3 increase over the YRD in the summer of 2022 are shown in Fig. S8. Changes in meteorological conditions including the reduction in LCC and the increase in SSRD lead to an increase of 9.2 µg m−3 in O3 concentration. Here, the weakened CRI due to the reduced LCC and the increased SSRD contributes 2.9 µg m−3, accounting for 31.5 % of the total O3 increase caused by favorable meteorological conditions. In contrast, anthropogenic VOC and NOx emission reductions lead to a decrease of 1.5 µg m−3 in O3 concentration, which is far less than the impact of the changes in photolysis conditions. This indicates that the reduction in LCC, the increase in SSRD, and the weakened CRI are the major drivers of the sudden increase in O3 concentration over the YRD during the summer of 2022.
3.4 O3 pollution potential under global warming
We used CMIP6 products to analyze the long-term trends of Tmax, SSRD, and TCC under SSP5-8.5, SSP2-4.5, and SSP1-1.9 (Fig. 6). The projected climate change under each SSP deviates significantly from the ERA5 reanalysis data, particularly in terms of the interannual variability, which is remarkably larger in reality. This indicates that climate change is highly uncertain. Nevertheless, the projected trend of Tmax is generally consistent with the ERA5. The TCC pattern also align well with the SSP2-4.5 projection in recent years, and the SSRD pattern also closely matches the SSP2-4.5 projection. This consistency roughly corresponds with the development pathway in China over the past decade. These comparisons suggest that the projections under different SSPs provide valuable information on understanding future climate change and its implications for O3 pollution.
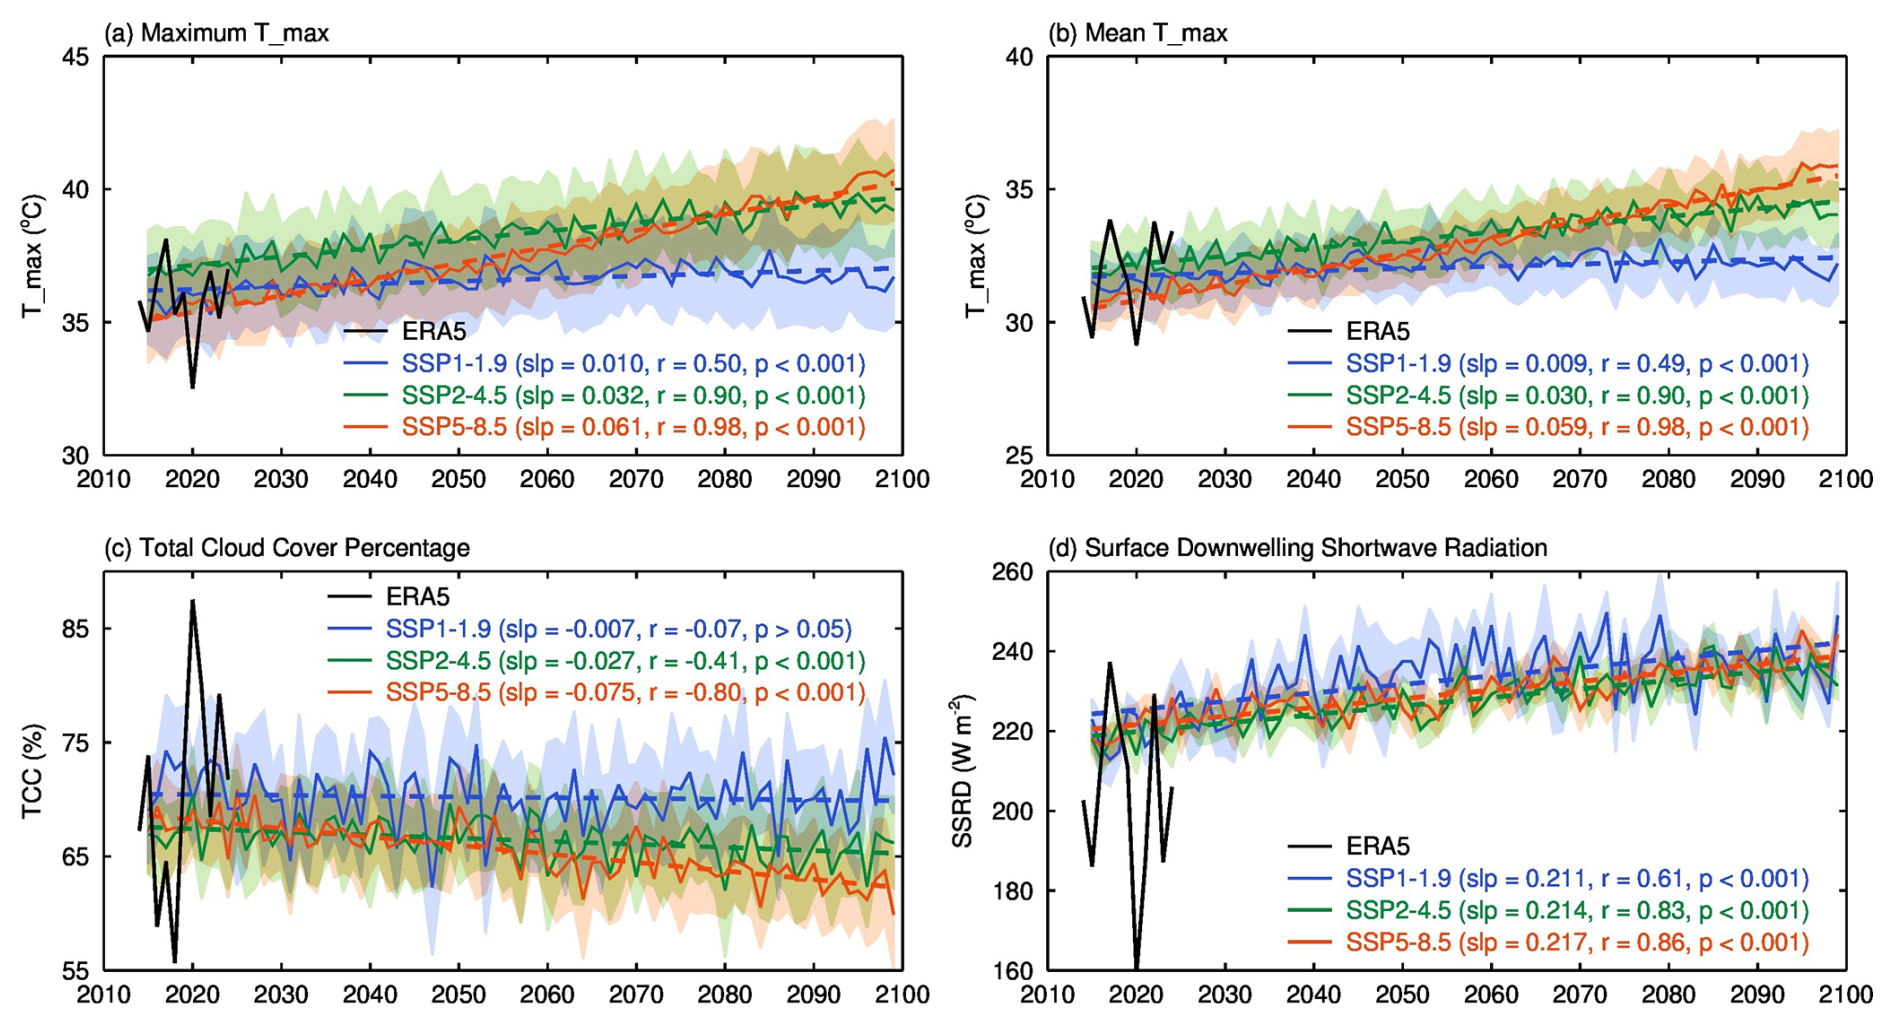
Figure 6Trends of multi-model ensemble mean radiation conditions projected by the CMIP6 under three SSPs during 2015–2099. (a) The maximum daily Tmax and (b) the mean daily Tmax in July represent the extreme and mean status of high temperature, respectively. (c) TCC and (d) SSRD together reflect the solar radiation conditions for O3 formation. The shading shows ±1.0 standard error, and the dashed lines represent the linear trends of each variable under different SSPs. The black curve in each panel shows the real variation of each variable from the ERA5 reanalysis data during 2014–2024.
Ensemble mean Tmax will continue to rise during the 21st century under any SSPs, whether the extreme or mean Tmax values (Fig. 6a and b). Noticeably, until the end of the 21st century, Tmax extreme values no longer increase significantly and exhibit a fluctuation pattern under SSP1-1.9. However, under the two alternative scenarios, Tmax will continuously increase more significantly, with an annual mean rate of 0.3 °C per decade (Fig. 6a and b), while under SSP5-8.5, the temperature will follow a linear increase trend at a faster rate that is more than twice as that under SSP2-4.5. Although there are some differences in the warming rates by models and scenarios, the warming trend is highly consistent.
Observational evidence shows that climate warming has increased the frequency of high temperatures and O3 extremes (Wang et al., 2023). Consequently, the frequency of extreme high-temperature events coinciding with high O3 concentrations, as observed in 2022, may also increase (Hong et al., 2019; Xiao et al., 2022). Heatwaves are often accompanied by adiabatic subsidence, fewer clouds, and stronger solar radiation. Cloud cover shows no significant trend under SSP1-1.9, whereas it decreases significantly under SSP2-4.5 and SSP5-8.5, with a faster decline rate under SSP5-8.5 (Fig. 6c). Concurrently, SSRD exhibits a significantly increasing trend under three SSPs (Fig. 6d). Though in the second half of the 21st century, SSRD fluctuates within a smaller magnitude under SSP1-1.9, it is still higher than that in the first half of the 21st century. Under SSP2-4.5 and SSP5-8.5, SSRD increases more rapidly at almost the same rate (Fig. 6d).
There are some differences in the trends of radiation factors related to O3 formation under different scenarios inevitably. For example, the phases of SSRD and clouds under SSP1-1.9 significantly differ from those under the other two scenarios. However, all scenarios are highly favorable for an increase in SSRD, suggesting that the potential risk of high O3 concentrations may be increasing in the forthcoming decades, even taking the Green Road. Fortunately, based on recent emission inventories, pollutants in China have shown a decreasing trend. In our study, by comparison with emissions in the summer of 2021, VOC and NOx emissions in the summer of 2022 decreased by 4 % and 5 %, respectively (Jiang et al., 2022; Li et al., 2024), leading to a reduction in O3 concentration by 1.5 µg m−3. According to these emission reduction rates, we use a simple linear extrapolation method, also in conjunction with China's carbon neutrality goal, to estimate VOC and NOx emissions in the future. By the 2030 carbon peak, VOC and NOx emissions will have been reduced by approximately 31 % and 37 %, respectively, relative to 2021 levels. By the 2060 carbon neutrality goal, the reductions are projected to reach 80 % and 87 %, respectively. Actually, emission reductions may face challenges and are unlikely to follow such a perfect pathway, and the response of O3 concentration to precursor reductions is also nonlinear. We thus assume that, if such an idealized scenario is followed, O3 concentrations by 2030 and 2060 are estimated to be reduced by 13.5 and 58.5 µg m−3, respectively, relative to the levels in 2021. Therefore, in the long term, on the decadal scale, the continued emission reductions are expected to significantly reduce O3 concentration.
However, on an interannual scale, the projected SSRD variability can reach several tens of W m−2, which is consistent with this study. Our study shows that interannual difference in SSRD between the summers of 2022 and 2021 is more than 80 W m−2. Based on the linear relationship between O3 and SSRD shown in Fig. 2, such differences in SSRD correspond to a change of 28 µg m−3 in daytime O3 concentration. According to the spatial distribution in Fig. 4, the regional mean daytime O3 change due to meteorological changes (including clouds and SSRD) is 9.2 µg m−3. Thus, a sudden increase in SSRD may partially offset the benefits of emission reductions. Given that coordinated VOC and NOx emission reductions are in the early stage, the increasing possibility of highly favorable photochemical conditions under climate change not only could counteract the effects of emission reductions but may even lead to a rebound in O3 concentrations in the short term. Moreover, fewer clouds and more SSRD under SSPs will also weaken CRI and consequently aggravate O3 pollution in the future. Based on SSP projections, the interannual differences of summer SSRD and cloud cover could reach or even exceed those observed between the summers of 2022 and 2021 (the interannual differences in SSRD and LCC are 82.7 W m−2 and 0.09, respectively). It is reasonable to expect that the CRI interannual variability will likely exert an influence on O3 changes that is no less significant than the calculation presented in this study. Though these factors related to climate change are highly variable, based upon the past and present impacts on O3 concentration, their impacts on future O3 pollution control are widely believable. Thus, we suggest that, if anthropogenic emission reductions are insufficient, these changes in clouds and SSRD linked to climate change will increase O3 concentration during the warm season.
High O3 concentration during the warm season has increasingly been becoming a major air pollution issue in China; however, whether it is closely connected to climate change has not yet received sufficient attention. Our findings indicate that the sudden increase in O3 concentration in the YRD during the warm season of 2022 is closely linked to the weak CRI characterized by lower LCC and higher SSRD. Less LCC favors more solar shortwave radiation reaching the surface, which significantly accelerates photochemistry, thereby leading to a pronounced increase in O3 concentration.
The notable increase in O3 concentration caused by weakened CRI has significantly exceeded the O3 reduction caused by the interannual decrease in precursor emissions during the warm season of 2022, attenuating the benefits of precursor emission reductions. We emphasize that the focus on LCC and SSRD has significant implications for operational forecasts on O3 pollution; i.e., more stringent measures on precursor emission reductions are imperative under weaker CRI.
Our results suggest that climate warming will make O3 pollution control more challengeable via altering clouds and SSRD and weakening the CRI. The high-level O3 is not only influenced by changes in clouds and solar radiation related with short-term synoptic-scale circulation adjustments but also modulated by long-term climate change. The occurrence likelihood of heatwaves (Chen et al., 2019; Ma et al., 2023), accompanied by fewer clouds and more SSRD, will increase under climate warming. Furthermore, if anthropogenic emissions are not greatly reduced, human-induced forcing will further amplify the probability (Faranda et al., 2023; King et al., 2016; Lopez et al., 2018; Sun et al., 2017; Zhang et al., 2024). Inevitably, the co-occurrence of extreme high temperature and O3 concentration is likely to occur frequently, posing a greater threat to human health, crops, and vegetation. Therefore, we would like to propose that more proactive human actions are vital to offset the penalty of climate change to these issues.
Hourly observation data on mass concentrations of ambient air pollutants at the surface released by the Ministry of Ecology and Environment, China, are available at https://pan.baidu.com/share/init?surl=gj9rHC6Qe67IGEwx_DRyIw?pwd=nrbe (last access: 10 September 2025).
Monthly mean low cloud cover and downward solar radiation data from the European Centre for Medium-Range Weather Forecasts ERA5 reanalysis are obtained by registration at https://cds.climate.copernicus.eu/datasets/reanalysis-era5-single-levels-monthly-means?tab=download (last access: 12 September 2025).
Hourly observation data on meteorological parameters at weather stations are from the National Oceanic and Atmospheric Administration, available at https://www.ncei.noaa.gov/maps/hourly (last access: 12 September 2025).
National Centers for Environmental Prediction Final Analyses data are from https://gdex.ucar.edu/datasets/d083002 (last access: 12 September 2025).
Initial and boundary chemical fields are available at https://www.acom.ucar.edu/cam-chem/cam-chem.shtml (last access: 12 September 2025).
The MEIC developed by Tsinghua University is from http://meicmodel.org.cn/?page_id=560 (last access: 12 September 2025).
The projected total cloud cover percentage and surface downwelling shortwave radiation are from https://cds.climate.copernicus.eu/datasets/projections-cmip6?tab = download (last access: 12 September 2025).
The supplement related to this article is available online at https://doi.org/10.5194/acp-25-12483-2025-supplement.
SZ and TF designed the research and analyzed the results. TF performed simulations, and SZ wrote the manuscript. XT provided useful comments and suggestions on the structure and highlights of the paper. TF and MD revised the manuscript. BT, XH, BH, DY, and SG participated in data analysis and discussions on the results.
The contact author has declared that none of the authors has any competing interests.
Publisher's note: Copernicus Publications remains neutral with regard to jurisdictional claims made in the text, published maps, institutional affiliations, or any other geographical representation in this paper. While Copernicus Publications makes every effort to include appropriate place names, the final responsibility lies with the authors.
We would like to acknowledge the China National Environmental Monitoring Center, the European Centre for Medium-Range Weather Forecasts, the National Oceanic and Atmospheric Administration, the National Centers for Environmental Prediction, and Tsinghua University for the free data availability. We also thank the anonymous reviewers for their insightful comments and suggestions.
This research has been supported by the National Natural Science Foundation of China (grant nos. 42371093 and 42371080), the Natural Science Foundation of Ningbo Municipality (grant nos. 2023J208 and 2023J235), and the Natural Science Foundation of Shaanxi Province (grant no. 2017JM4023).
This paper was edited by Shaocheng Xie and reviewed by two anonymous referees.
Binkowski, F. S.: Models-3 Community Multiscale Air Quality (CMAQ) model aerosol component 1. Model description, J. Geophys. Res., 108, 2981, https://doi.org/10.1029/2001JD001409, 2003.
Byun, D. W. and Ching, J. K. S.: Science algorithms of the EPA models-3 Community Multiscale Air Quality (CMAQ) modeling system, US Environmental Protection Agency, Washington, DC, EPA/600/R-99/030, 1999.
Chen, F. and Dudhia, J.: Coupling an Advanced Land Surface – Hydrology Model with the Penn State – NCAR MM5 Modeling System. Part I: Model Implementation and Sensitivity, Mon. Weather Rev., 129, 569–585, https://doi.org/10.1175/1520-0493(2001)129<0569:CAALSH>2.0.CO;2, 2001.
Chen, R., Wen, Z., Lu, R., and Wang, C.: Causes of the Extreme Hot Midsummer in Central and South China during 2017: Role of the Western Tropical Pacific Warming, Adv. Atmos. Sci., 36, 465–478, https://doi.org/10.1007/s00376-018-8177-4, 2019.
Creilson, J. K., Fishman, J., and Wozniak, A. E.: Arctic Oscillation-induced variability in satellite-derived tropospheric ozone, Geophys. Res. Lett., 32, L14822, https://doi.org/10.1029/2005GL023016, 2005.
Dong, Y., Li, J., Guo, J., Jiang, Z., Chu, Y., Chang, L., Yang, Y., and Liao, H.: The impact of synoptic patterns on summertime ozone pollution in the North China Plain, Sci. Total Environ., 735, 139559, https://doi.org/10.1016/j.scitotenv.2020.139559, 2020.
Dudhia, J.: Numerical Study of Convection Observed during the Winter Monsoon Experiment Using a Mesoscale Two-Dimensional Model, J. Atmos. Sci., 46, 3077–3107, https://doi.org/10.1175/1520-0469(1989)046<3077:NSOCOD>2.0.CO;2, 1989.
Faranda, D., Messori, G., Jezequel, A., Vrac, M., and Yiou, P.: Atmospheric circulation compounds anthropogenic warming and impacts of climate extremes in Europe, P. Natl. Acad. Sci. USA, 120, e2214525120, https://doi.org/10.1073/pnas.2214525120, 2023.
Flynn, J., Lefer, B., Rappenglück, B., Leuchner, M., Perna, R., Dibb, J., Ziemba, L., Anderson, C., Stutz, J., Brune, W., Ren, X., Mao, J., Luke, W., Olson, J., Chen, G., and Crawford, J.: Impact of clouds and aerosols on ozone production in Southeast Texas, Atmos. Environ., 44, 4126–4133, 2010.
Fu, Y., Liao, H., and Yang, Y.: Interannual and Decadal Changes in Tropospheric Ozone in China and the Associated Chemistry-Climate Interactions: A Review, Adv. Atmos. Sci., 36, 975–993, https://doi.org/10.1007/s00376-019-8216-9, 2019.
Gao, M., Wang, F., Ding, Y., Wu, Z., Xu, Y., Lu, X., Wang, Z., Carmichael, G. R., and McElroy, M. B.: Large-scale climate patterns offer preseasonal hints on the co-occurrence of heat wave and O3 pollution in China, P. Natl. Acad. Sci. USA, 120, e2218274120, https://doi.org/10.1073/pnas.2218274120, 2023.
Grell, G. A., Peckham, S. E., Schmitz, R., McKeen, S. A., Frost, G., Skamarock, W. C., and Eder, B.: Fully coupled “online” chemistry within the WRF model, Atmos. Environ., 39, 6957–6975, https://doi.org/10.1016/j.atmosenv.2005.04.027, 2005.
Guenther, A., Karl, T., Harley, P., Wiedinmyer, C., Palmer, P. I., and Geron, C.: Estimates of global terrestrial isoprene emissions using MEGAN (Model of Emissions of Gases and Aerosols from Nature), Atmos. Chem. Phys., 6, 3181–3210, https://doi.org/10.5194/acp-6-3181-2006, 2006.
Hong, C., Zhang, Q., Zhang, Y., Davis, S. J., Tong, D., Zheng, Y., Liu, Z., Guan, D., He, K., and Schellnhuber, H. J.: Impacts of climate change on future air quality and human health in China, P. Natl. Acad. Sci. USA, 116, 17193–17200, https://doi.org/10.1073/pnas.1812881116, 2019.
Hong, S.-Y. and Lim, J.-O. J.: The WRF Single-Moment 6-Class Microphysical Scheme (WSM6), J. Korean Meteor. Soc., 42, 129–151, 2006.
Janjić, Z. I.: Nonsingular implementation of the Mellor-Yamada level 2.5 scheme in the NCEP meso model, Camp Springs, MD, National Centers for Environmental Prediction, Prince George's County, 437, 1–61, 2002.
Ji, X., Chen, G., Chen, J., Xu, L., Lin, Z., Zhang, K., Fan, X., Li, M., Zhang, F., Wang, H., Huang, Z., and Hong, Y.: Meteorological impacts on the unexpected ozone pollution in coastal cities of China during the unprecedented hot summer of 2022, Sci. Total Environ., 914, 170035, https://doi.org/10.1016/j.scitotenv.2024.170035, 2024.
Jiang, Y., Wang, S., Xing, J., Zhao, B., Li, S., Chang, X., Zhang, S., and Dong, Z.: Ambient fine particulate matter and ozone pollution in China: synergy in anthropogenic emissions and atmospheric processes, Environ. Res. Lett., 17 123001, https://doi.org/10.1088/1748-9326/aca16a, 2022.
Jiang, Z., Li, J., Lu, X., Gong, C., Zhang, L., and Liao, H.: Impact of western Pacific subtropical high on ozone pollution over eastern China, Atmos. Chem. Phys., 21, 2601–2613, https://doi.org/10.5194/acp-21-2601-2021, 2021.
Kang, H., Choi, Y.-S., Hwang, J., and Kim, H.-S.: On the cloud radiative effect for tropical high clouds overlying low clouds, Geoscience Letters, 1–6, https://doi.org/10.1186/s40562-020-00156-6, 2020.
King, A. D., Black, M. T., Min, S.-K., Fischer, E. M., Mitchell, D. M., Harrington, L. J., and Perkins-Kirkpatrick, S. E.: Emergence of heat extremes attributable to anthropogenic influences, Geophys. Res. Lett., 43, 3438–3443, https://doi.org/10.1002/2015GL067448, 2016.
Li, G., Lei, W., Zavala, M., Volkamer, R., Dusanter, S., Stevens, P., and Molina, L. T.: Impacts of HONO sources on the photochemistry in Mexico City during the MCMA-2006/MILAGO Campaign, Atmos. Chem. Phys., 10, 6551–6567, https://doi.org/10.5194/acp-10-6551-2010, 2010.
Li, G., Bei, N., Tie, X., and Molina, L. T.: Aerosol effects on the photochemistry in Mexico City during MCMA-2006/MILAGRO campaign, Atmos. Chem. Phys., 11, 5169–5182, https://doi.org/10.5194/acp-11-5169-2011, 2011a.
Li, G., Zavala, M., Lei, W., Tsimpidi, A. P., Karydis, V. A., Pandis, S. N., Canagaratna, M. R., and Molina, L. T.: Simulations of organic aerosol concentrations in Mexico City using the WRF-CHEM model during the MCMA-2006/MILAGRO campaign, Atmos. Chem. Phys., 11, 3789–3809, https://doi.org/10.5194/acp-11-3789-2011, 2011b.
Li, G., Bei, N., Cao, J., Huang, R., Wu, J., Feng, T., Wang, Y., Liu, S., Zhang, Q., Tie, X., and Molina, L. T.: A possible pathway for rapid growth of sulfate during haze days in China, Atmos. Chem. Phys., 17, 3301–3316, https://doi.org/10.5194/acp-17-3301-2017, 2017a.
Li, H., Zheng, B., Lei, Y., Hauglustaine, D., Chen, C., Lin, X., Zhang, Y., Zhang, Q., and He, K.: Trends and drivers of anthropogenic NOx emissions in China since 2020, Environmental Science and Ecotechnology, 21, 100425, https://doi.org/10.1016/j.ese.2024.100425, 2024.
Li, K., Jacob, D. J., Liao, H., Shen, L., Zhang, Q., and Bates, K. H.: Anthropogenic drivers of 2013–2017 trends in summer surface ozone in China, P. Natl. Acad. Sci. USA, 116, 422–427, 2019a.
Li, K., Jacob, D. J., Shen, L., Lu, X., De Smedt, I., and Liao, H.: Increases in surface ozone pollution in China from 2013 to 2019: anthropogenic and meteorological influences, Atmos. Chem. Phys., 20, 11423–11433, https://doi.org/10.5194/acp-20-11423-2020, 2020.
Li, L., An, J., Huang, L., Yan, R., Huang, C., and Yarwood, G.: Ozone source apportionment over the Yangtze River Delta region, China: Investigation of regional transport, sectoral contributions and seasonal differences, Atmos. Environ., 202, 269–280, https://doi.org/10.1016/j.atmosenv.2019.01.028, 2019b.
Li, M., Zhang, Q., Kurokawa, J.-I., Woo, J.-H., He, K., Lu, Z., Ohara, T., Song, Y., Streets, D. G., Carmichael, G. R., Cheng, Y., Hong, C., Huo, H., Jiang, X., Kang, S., Liu, F., Su, H., and Zheng, B.: MIX: a mosaic Asian anthropogenic emission inventory under the international collaboration framework of the MICS-Asia and HTAP, Atmos. Chem. Phys., 17, 935–963, https://doi.org/10.5194/acp-17-935-2017, 2017b.
Li, S., Wang, T., Huang, X., Pu, X., Li, M., Chen, P., Yang, X.-Q., and Wang, M.: Impact of East Asian Summer Monsoon on Surface Ozone Pattern in China, J. Geophys. Res., 123, 1401–1411, https://doi.org/10.1002/2017JD027190, 2018.
Liu, Y. and Wang, T.: Worsening urban ozone pollution in China from 2013 to 2017 – Part 1: The complex and varying roles of meteorology, Atmos. Chem. Phys., 20, 6305–6321, https://doi.org/10.5194/acp-20-6305-2020, 2020a.
Liu, Y., Geng, G., Cheng, J., Liu, Y., Xiao, Q., Liu, L., Shi, Q., Tong, D., He, K., and Zhang, Q.: Drivers of Increasing Ozone during the Two Phases of Clean Air Actions in China 2013–2020, Environ. Sci. Technol., 57, 8954–8964, https://doi.org/10.1021/acs.est.3c00054, 2023.
Liu, Y. and Wang, T.: Worsening urban ozone pollution in China from 2013 to 2017 – Part 2: The effects of emission changes and implications for multi-pollutant control, Atmos. Chem. Phys., 20, 6323–6337, https://doi.org/10.5194/acp-20-6323-2020, 2020b.
Lopez, H., West, R., Dong, S., Goni, G., Ben Kirtman, Lee, S.-K., and Atlas, R.: Early emergence of anthropogenically forced heat waves in the western United States and Great Lakes, Nat. Clim. Change, 8, 414–420, https://doi.org/10.1038/s41558-018-0116-y, 2018.
Lu, X., Zhang, L., and Shen, L.: Meteorology and Climate Influences on Tropospheric Ozone: a Review of Natural Sources, Chemistry, and Transport Patterns, Curr. Pollution Rep., 5, 238–260, https://doi.org/10.1007/s40726-019-00118-3, 2019a.
Lu, X., Zhang, L., Chen, Y., Zhou, M., Zheng, B., Li, K., Liu, Y., Lin, J., Fu, T.-M., and Zhang, Q.: Exploring 2016–2017 surface ozone pollution over China: source contributions and meteorological influences, Atmos. Chem. Phys., 19, 8339–8361, https://doi.org/10.5194/acp-19-8339-2019, 2019b.
Ma, Y.-Y., Chen, Y.-T., Hu, X.-X., Ma, Q.-R., Feng, T.-C., Feng, G.-L., and Ma, D.: The 2022 record-breaking high temperature in China: Sub-seasonal stepwise enhanced characteristics, possible causes and its predictability, Advances in Climate Change Research, 14, 651–659, https://doi.org/10.1016/j.accre.2023.09.008, 2023.
Mao, J., Wang, L., Lu, C., Liu, J., Li, M., Tang, G., Ji, D., Zhang, N., and Wang, Y.: Meteorological mechanism for a large-scale persistent severe ozone pollution event over eastern China in 2017, J. Environ. Sci., 92, 187–199, https://doi.org/10.1016/j.jes.2020.02.019, 2020.
Meehl, G. A., Tebaldi, C., Tilmes, S., Lamarque, J.-F., Bates, S., Pendergrass, A., and Lombardozzi, D.: Future heat waves and surface ozone, Environ. Res. Lett., 13, 064004, https://doi.org/10.1088/1748-9326/aabcdc, 2018.
Mousavinezhad, S., Choi, Y., Pouyaei, A., Ghahremanloo, M., and Nelson, D. L.: A comprehensive investigation of surface ozone pollution in China, 2015–2019: Separating the contributions from meteorology and precursor emissions, Atmos. Res., 257, 105599, https://doi.org/10.1016/j.atmosres.2021.105599, 2021.
Nenes, A., Pandis, S. N., and Pilinis, C.: ISORROPIA: A new thermodynamic equilibrium model for multiphase multicomponent inorganic aerosols, Aquat. Geochem., 4, 123–152, https://doi.org/10.1023/A:1009604003981, 1998.
Pour-Biazar, A., McNider, R., Roselle, S., Suggs, R., Jedlovec, G., Byun, D., Kim, S., Lin, C., Ho, T., Haines, S., Dornblaser, B., Cameron, R.: Correcting photolysis rates on the basis of satellite observed clouds, J. Geophys. Res., 112, D10302, https://doi.org/10.1029/2006JD007422, 2007.
Pu, X., Wang, T. J., Huang, X., Melas, D., Zanis, P., Papanastasiou, D. K., and Poupkou, A.: Enhanced surface ozone during the heat wave of 2013 in Yangtze River Delta region, China, Sci. Total Environ., 603–604, 807–816, https://doi.org/10.1016/j.scitotenv.2017.03.056, 2017.
Riahi, K., van Vuuren, D. P., Kriegler, E., Edmonds, J., O'Neill, B. C., Fujimori, S., Bauer, N., Calvin, K., Dellink, R., Fricko, O., Lutz, W., Popp, A., Cuaresma, J. C., Samir, K. C., Leimbach, M., Jiang, L., Kram, T., Rao, S., Emmerling, J., Ebi, K., Hasegawa, T., Havlik, P., Humpenöder, F., Da Silva, L. A., Smith, S., Stehfest, E., Bosetti, V., Eom, J., Gernaat, D., Masui, T., Rogelj, J., Strefler, J., Drouet, L., Krey, V., Luderer, G., Harmsen, M., Takahashi, K., Baumstark, L., Doelman, J. C., Kainuma, M., Klimont, Z., Marangoni, G., Lotze-Campen, H., Obersteiner, M., Tabeau, A., and Tavoni, M.: The Shared Socioeconomic Pathways and their energy, land use, and greenhouse gas emissions implications: An overview, Global Environ. Chang., 42, 153–168, https://doi.org/10.1016/j.gloenvcha.2016.05.009, 2017.
Shen, L. and Mickley, L. J.: Effects of El Niño on Summertime Ozone Air Quality in the Eastern United States, Geophys. Res. Lett., 44, https://doi.org/10.1002/2017GL076150, 2017.
Shu, L., Xie, M., Wang, T., Gao, D., Chen, P., Han, Y., Li, S., Zhuang, B., and Li, M.: Integrated studies of a regional ozone pollution synthetically affected by subtropical high and typhoon system in the Yangtze River Delta region, China, Atmos. Chem. Phys., 16, 15801–15819, https://doi.org/10.5194/acp-16-15801-2016, 2016.
Simayi, M., Shi, Y., Xi, Z., Ren, J., Hini, G., and Xie, S.: Emission trends of industrial VOCs in China since the clean air action and future reduction perspectives, Sci. Total Environ., 826, 153994, https://doi.org/10.1016/j.scitotenv.2022.153994, 2022.
Steiner, A. L., Davis, A. J., Sillman, S., Owen, R. C., Michalak, A. M., and Fiore, A. M.: Observed suppression of ozone formation at extremely high temperatures due to chemical and biophysical feedbacks, P. Natl. Acad. Sci. USA, 107, 19685–19690, https://doi.org/10.1073/pnas.1008336107, 2010.
Sun, Q., Miao, C., AghaKouchak, A., and Duan, Q.: Unraveling anthropogenic influence on the changing risk of heat waves in China, Geophys. Res. Lett., 44, 5078–5085, https://doi.org/10.1002/2017GL073531, 2017.
Tie, X., Madronich, S., Walters, S., Zhang, R., Rasch, P., and Collins, W.: Effect of clouds on photolysis and oxidants in the troposphere, J. Geophys. Res., 108, 4642, https://doi.org/10.1029/2003JD003659, 2003.
Tie, X., Long, X., Li, G., Zhao, S., Cao, J., and Xu, J.: Ozone enhancement due to the photodissociation of nitrous acid in eastern China, Atmos. Chem. Phys., 19, 11267–11278, https://doi.org/10.5194/acp-19-11267-2019, 2019.
Verstraeten, W. W., Neu, J. L., Williams, J. E., Bowman, K. W., Worden, J. R., and Boersma, K. F.: Rapid increases in tropospheric ozone production and export from China, Nat. Geosci., 8, 690–695, https://doi.org/10.1038/ngeo2493, 2015.
Wang, L., Yang, X., Dong, J., Yang, Y., Ma, P., and Zhao, W.: Evolution of surface ozone pollution pattern in eastern China and its relationship with different intensity heatwaves, Environ. Pollut., 338, 122725, https://doi.org/10.1016/j.envpol.2023.122725, 2023.
Wang, N., Lyu, X., Deng, X., Huang, X., Jiang, F., and Ding, A.: Aggravating O3 pollution due to NOx emission control in eastern China, Sci. Total Environ., 677, 732–744, https://doi.org/10.1016/j.scitotenv.2019.04.388, 2019a.
Wang, T., Dai, J., Lam, K. S., Nan Poon, C., and Brasseur, G. P.: Twenty-Five Years of Lower Tropospheric Ozone Observations in Tropical East Asia: The Influence of Emissions and Weather Patterns, Geophys. Res. Lett., 46, 11463–11470, https://doi.org/10.1029/2019GL084459, 2019b.
Wang, T., Xue, L., Feng, Z., Dai, J., Zhang, Y., and Tan, Y.: Ground-level ozone pollution in China: a synthesis of recent findings on influencing factors and impacts, Environ. Res. Lett., 17, 063003, https://doi.org/10.1088/1748-9326/ac69fe, 2022a.
Wang, W., Parrish, D. D., Wang, S., Bao, F., Ni, R., Li, X., Yang, S., Wang, H., Cheng, Y., and Su, H.: Long-term trend of ozone pollution in China during 2014–2020: distinct seasonal and spatial characteristics and ozone sensitivity, Atmos. Chem. Phys., 22, 8935–8949, https://doi.org/10.5194/acp-22-8935-2022, 2022b.
Wesely, M. L.: Parameterization of surface resistances to gaseous dry deposition in regional-scale numerical models, Atmos. Environ., 23, 1293–1304, https://doi.org/10.1016/0004-6981(89)90153-4, 1989.
Willmott, C. J.: On the validation of models, Phys. Geogr., 2, 184–194, https://doi.org/10.1080/02723646.1981.10642213, 1981.
Xia, Y., Hu, Y., Huang, Y., Bian, J., Zhao, C., Wei, J., Yan, Y., Xie, F., and Lin, J.: Concurrent hot extremes and high ultraviolet radiation in summer over the Yangtze Plain and their possible impact on surface ozone, Environ. Res. Lett., 17, 064001, https://doi.org/10.1088/1748-9326/ac6c3c, 2022.
Xiao, X., Xu, Y., Zhang, X., Wang, F., Lu, X., Cai, Z., Brasseur, G., and Gao, M.: Amplified Upward Trend of the Joint Occurrences of Heat and Ozone Extremes in China over 2013–20, B. Am. Meteorol. Soc., 103, E1330–E1342, https://doi.org/10.1175/BAMS-D-21-0222.1, 2022.
Xu, L., Yu, J.-Y., Schnell, J. L., and Prather, M. J.: The seasonality and geographic dependence of ENSO impacts on U. S. surface ozone variability, Geophys. Res. Lett., 44, 3420–3428, https://doi.org/10.1002/2017GL073044, 2017.
Xue, L. K., Wang, T., Gao, J., Ding, A. J., Zhou, X. H., Blake, D. R., Wang, X. F., Saunders, S. M., Fan, S. J., Zuo, H. C., Zhang, Q. Z., and Wang, W. X.: Ground-level ozone in four Chinese cities: precursors, regional transport and heterogeneous processes, Atmos. Chem. Phys., 14, 13175–13188, https://doi.org/10.5194/acp-14-13175-2014, 2014.
Yang, H., Chen, L., Liao, H., Zhu, J., Wang, W., and Li, X.: Impacts of aerosol–photolysis interaction and aerosol–radiation feedback on surface-layer ozone in North China during multi-pollutant air pollution episodes, Atmos. Chem. Phys., 22, 4101–4116, https://doi.org/10.5194/acp-22-4101-2022, 2022.
Yin, Z., Cao, B., and Wang, H.: Dominant patterns of summer ozone pollution in eastern China and associated atmospheric circulations, Atmos. Chem. Phys., 19, 13933–13943, https://doi.org/10.5194/acp-19-13933-2019, 2019.
Zeng, P., Lyu, X. P., Guo, H., Cheng, H. R., Jiang, F., Pan, W. Z., Wang, Z. W., Liang, S. W., and Hu, Y. Q.: Causes of ozone pollution in summer in Wuhan, Central China, Environ. Pollut., 241, 852–861, https://doi.org/10.1016/j.envpol.2018.05.042, 2018.
Zhang, L., Zhou, T., Zhang, X., Zhang, W., Li, L., and Li, L.: Attribution of the Extreme 2022 Summer Drought along the Yangtze River Valley in China Based on Detection and Attribution System of Chinese Academy of Sciences, B. Am. Meteorol. Soc., 105, E1062–E1067, https://doi.org/10.1175/BAMS-D-23-0258.1, 2024.
Zhang, Q., Zheng, Y., Tong, D., Shao, M., Wang, S., Zhang, Y., Xu, X., Wang, J., He, H., Liu, W., Ding, Y., Lei, Y., Li, J., Wang, Z., Zhang, X., Wang, Y., Cheng, J., Liu, Y., Shi, Q., Yan, L., Geng, G., Hong, C., Li, M., Liu, F., Zheng, B., Cao, J., Ding, A., Gao, J., Fu, Q., Huo, J., Liu, B., Liu, Z., Yang, F., He, K., and Hao, J.: Drivers of improved PM2.5 air quality in China from 2013 to 2017, P. Natl. Acad. Sci. USA, 116, 24463–24469, https://doi.org/10.1073/pnas.1907956116, 2019.
Zhang, Y. and Zheng, J.: Blue Book on Ozone Pollution Prevention and Control in China (2020) [in Chinese], edited by Li, M., Science Press, Beijing, China, 121 pp., ISBN 9787030716644, 2022.
Zhao, C., Wang, Y., Yang, Q., Fu, R., Cunnold, D., and Choi, Y.: Impact of East Asian summer monsoon on the air quality over China: View from space, J. Geophys. Res., 115, D09301, https://doi.org/10.1029/2009JD012745, 2010.
Zhao, Z. and Wang, Y.: Influence of the West Pacific subtropical high on surface ozone daily variability in summertime over eastern China, Atmos. Environ., 170, 197–204, https://doi.org/10.1016/j.atmosenv.2017.09.024, 2017.
Zheng, B., Tong, D., Li, M., Liu, F., Hong, C., Geng, G., Li, H., Li, X., Peng, L., Qi, J., Yan, L., Zhang, Y., Zhao, H., Zheng, Y., He, K., and Zhang, Q.: Trends in China's anthropogenic emissions since 2010 as the consequence of clean air actions, Atmos. Chem. Phys., 18, 14095–14111, https://doi.org/10.5194/acp-18-14095-2018, 2018.
Zheng, H., Kong, S., He, Y., Song, C., Cheng, Y., Yao, L., Chen, N., and Zhu, B.: Enhanced ozone pollution in the summer of 2022 in China: The roles of meteorology and emission variations, Atmos. Environ., 301, 119701, https://doi.org/10.1016/j.atmosenv.2023.119701, 2023.
Zhou, D., Ding, A., Mao, H., Fu, C., Wang, T., Chan, L. Y., Ding, K., Zhang, Y., Liu, J., Lu, A., and Hao, N.: Impacts of the East Asian monsoon on lower tropospheric ozone over coastal South China, Environ. Res. Lett., 8, 044011, https://doi.org/10.1088/1748-9326/8/4/044011, 2013.