the Creative Commons Attribution 4.0 License.
the Creative Commons Attribution 4.0 License.
 | 08 Oct 2025
Measurement report: Year-long chemical composition, optical properties, and sources of atmospheric aerosols in the northeastern Tibetan Plateau
Kemei Li
Yanqing An
Jianzhong Xu
Miao Zhong
Wenhui Zhao
Xiang Qin
Brown carbon (BrC) aerosols have attracted considerable attention due to their significant climatic effects, yet their sources, optical properties, and seasonal behavior remain poorly understood in remote high-altitude regions. In this study, year-long fine particular-matter (PM2.5) samples were collected at a receptor site in the northeastern Tibetan Plateau (TP) to investigate the optical and chemical properties and sources of water-soluble BrC (WS-BrC). The annual average PM2.5 concentration was 10.3 ± 7.4 µg m−3 with clear seasonal variation (spring > winter > fall > summer). Organic aerosol (OA) was the major component across all seasons with an annual contribution of 37.7 % to the total PM2.5 mass, followed by sulfate (21.3 %), nitrate (12.1 %), and other species. Backward trajectory analysis indicated that aerosols were mainly transported from the northeast and east of the sampling site. The seasonal mass absorption efficiency of WS-BrC at the wavelength of 365nm (MAE365) were 0.92 ± 0.54 m2g−1 in spring, 0.40 ± 0.24 m2 g−1 in summer, 0.81 ± 0.46 m2 g−1 in fall, and 0.97 ± 0.49 m2 g−1 in winter, exhibiting a relatively weak light absorption throughout the year with the strongest photobleaching in summer. Notably, WS-BrC light absorption was positively correlated with the oxidation degree of OA during spring and winter, but negatively correlated in summer and fall, suggesting different chemical aging processes and sources of BrC. These findings enhance our understanding of BrC behavior on the TP and contribute to assessments of its climatic impacts in this high-altitude region.
- Article
(7817 KB) - Full-text XML
-
Supplement
(626 KB) - BibTeX
- EndNote


Aerosols, which are fine particulate matter suspended in the atmosphere, represent a critical component of climate forcing, particularly through their effects on atmospheric radiation balance and the hydrological cycle (Forster et al., 2021). The climatic impacts of aerosols are strongly governed by their physical and chemical properties, such as mass concentration, number concentration, and chemical composition, which exhibit substantially spatial and temporal variabilities. During atmospheric transport, aerosol undergo extensive physicochemical transformations driven by environmental factors such as relative humidity, oxidants, and solar radiation (Lee et al., 2008; Chen and Torres, 2009; Yu et al., 2022; Klodt et al., 2023). These transformation processes are further influenced by complex topography, which can mitigate the formation and evolution of aerosol characteristics (Schnitzler and Abbatt, 2018; Schnitzler et al., 2022; Fan et al., 2024). These complexities make in-situ measurement essential for accurately assessing their impact, especially in remote regions where aerosol loading is extremely low.
Aerosol optical properties are key parameters for evaluating their climatic effect. Among these, brown Carbon (BrC) and Black Carbon (BC) are two key optically sensitive components. BrC is particularly notable for its strong wavelength-dependent light absorption properties, which is distinguished from the more uniform absorption characteristics of BC (Laskin et al., 2015). Recent studies on BrC have primarily concentrated on its sources, secondary formation pathways, optical properties, and radiative forcing effects (Ma et al., 2018; Chelluboyina et al., 2024). BrC originates from a wide range of both anthropogenic and natural sources and contributes significantly to the complexity of aerosol-radiation interactions (Laskin et al., 2015; Yan et al., 2018). Field and laboratory studies have revealed important transformations of BrC during atmospheric processes. For example, BrC can undergo photobleaching and oxidative whitening during long-range transport, leading to significantly reductions in its light absorption capacity (Sumlin et al., 2017). In addition, secondary BrC formed through photochemical reactions exhibit distinct diurnal variability: enhanced light absorption in the morning due to active formation processes, followed by significant photobleaching under stronger oxidative conditions in the afternoon (Wang et al., 2019). Furthermore, recent work by Zhong et al. (2023) suggests that light absorption and fluorescence characteristics of BrC are influenced by environmental acidity, indicating the pH conditions may also modulate its optical behavior.
The Tibetan Plateau (TP), the highest and largest plateau on Earth, serves as a key receptor region for aerosols transported over long distances from surrounding source areas. BrC light absoption in this cold and remote region exhibits a longer half-life compared to low-altitude regions, largely due to their slower decay rate during transport (Choudhary et al., 2022). Elevated aerosol loadings and BrC contributions are mainly observed along the margins of the TP due to the short distance from the source regions (Xu et al., 2024b). In these marginal areas, BrC has been identified as a notable warming agent (Zhu et al., 2024). For example, BrC presented a higher absorption contribution compared to BC in the remote northeastern and southwestern margins of the TP (Zhu et al., 2021). The Qilian Mountains (QLM), situated on the northeastern edge of the TP, represent a background area of inland China. This region is of hydrological importance, serving as a critical water source for the arid northwestern areas and playing an essential role in sustaining downstream ecosystems and human settlements (Chen and Wang, 2009; Liu et al., 2017; Li et al., 2019). Orographic clouds dominate precipitation generation in the mountainous region (Qi et al., 2022) and aerosol-cloud interactions have become an increasing focus in the QLM (Liu et al., 2019; Xu et al., 2024a). However, the physical and chemical properties of aerosol in this background region remain poorly understood.
Research on aerosols in the QLM has aroused increasing attention during the last ten years (Che et al., 2011; Zhao et al., 2012; Zheng et al., 2015; Dai et al., 2021; Xie et al., 2022). Inorganic components, especially for sulfate, were found to account for a substantial proportion of aerosol mass (Xu et al., 2014; Xu et al., 2015; Zhang et al., 2019; Zhang et al., 2020). Moreover, organic aerosol (OA) constitutes a significant fraction of the aerosol mass and exhibits significant aged properties (Zhang et al., 2019, 2020). Aerosol concentrations in the QLM exhibit a notable seasonal variability. In spring, the QLM is predominantly affected by the prevalence of mineral dust, while during summer, the region experiences an influence of polluted air masses originating from the northern and northeastern sectors of the QLM (Xu et al., 2013). However, most previous studies conducted in the QLM have been short-term or spatially and temporally limited, making it difficult to represent the whole picture of aerosol properties in this region.
In this study, a year-long aerosol observation was conducted at Waliguan Baseline Observatory (WLG), located on the southeastern edge of the QLM, to investigate the chemical composition, optical characteristics, seasonal variations, and sources of atmospheric aerosols. The primary objective is to enhance understanding of the optical properties of BrC aerosols at a regional scale, and to gain a deeper insight into the influence of chemical processes and sources on BrC in this region.
2.1 Sampling site
The WLG (36°17′ N, 100°54′ E; 3816 m a.s.l.) is situated at the summit of the Waliguan Mountain on the northeastern TP and is part of the Global Atmosphere Watch (GAW) program operated by the World Meteorological Organization (WMO) (Fig. 1). The Waliguan Mountain, with a relative elevation difference of about 600 m above the surrounding terrain (Fig. 1b), is an ideal location for studying the background characteristics of the atmospheric environment over inner Asia. The WLG is about 90 km west of Xining, the capital of Qinghai Province with an elevation of ∼ 2300 m a.s.l. The regional climate is characterized by distinct seasonal variations, strongly influenced by the Asian summer monsoon and East Asian winter monsoon. Spring and fall serve as transitional seasons between these two climatic systems.
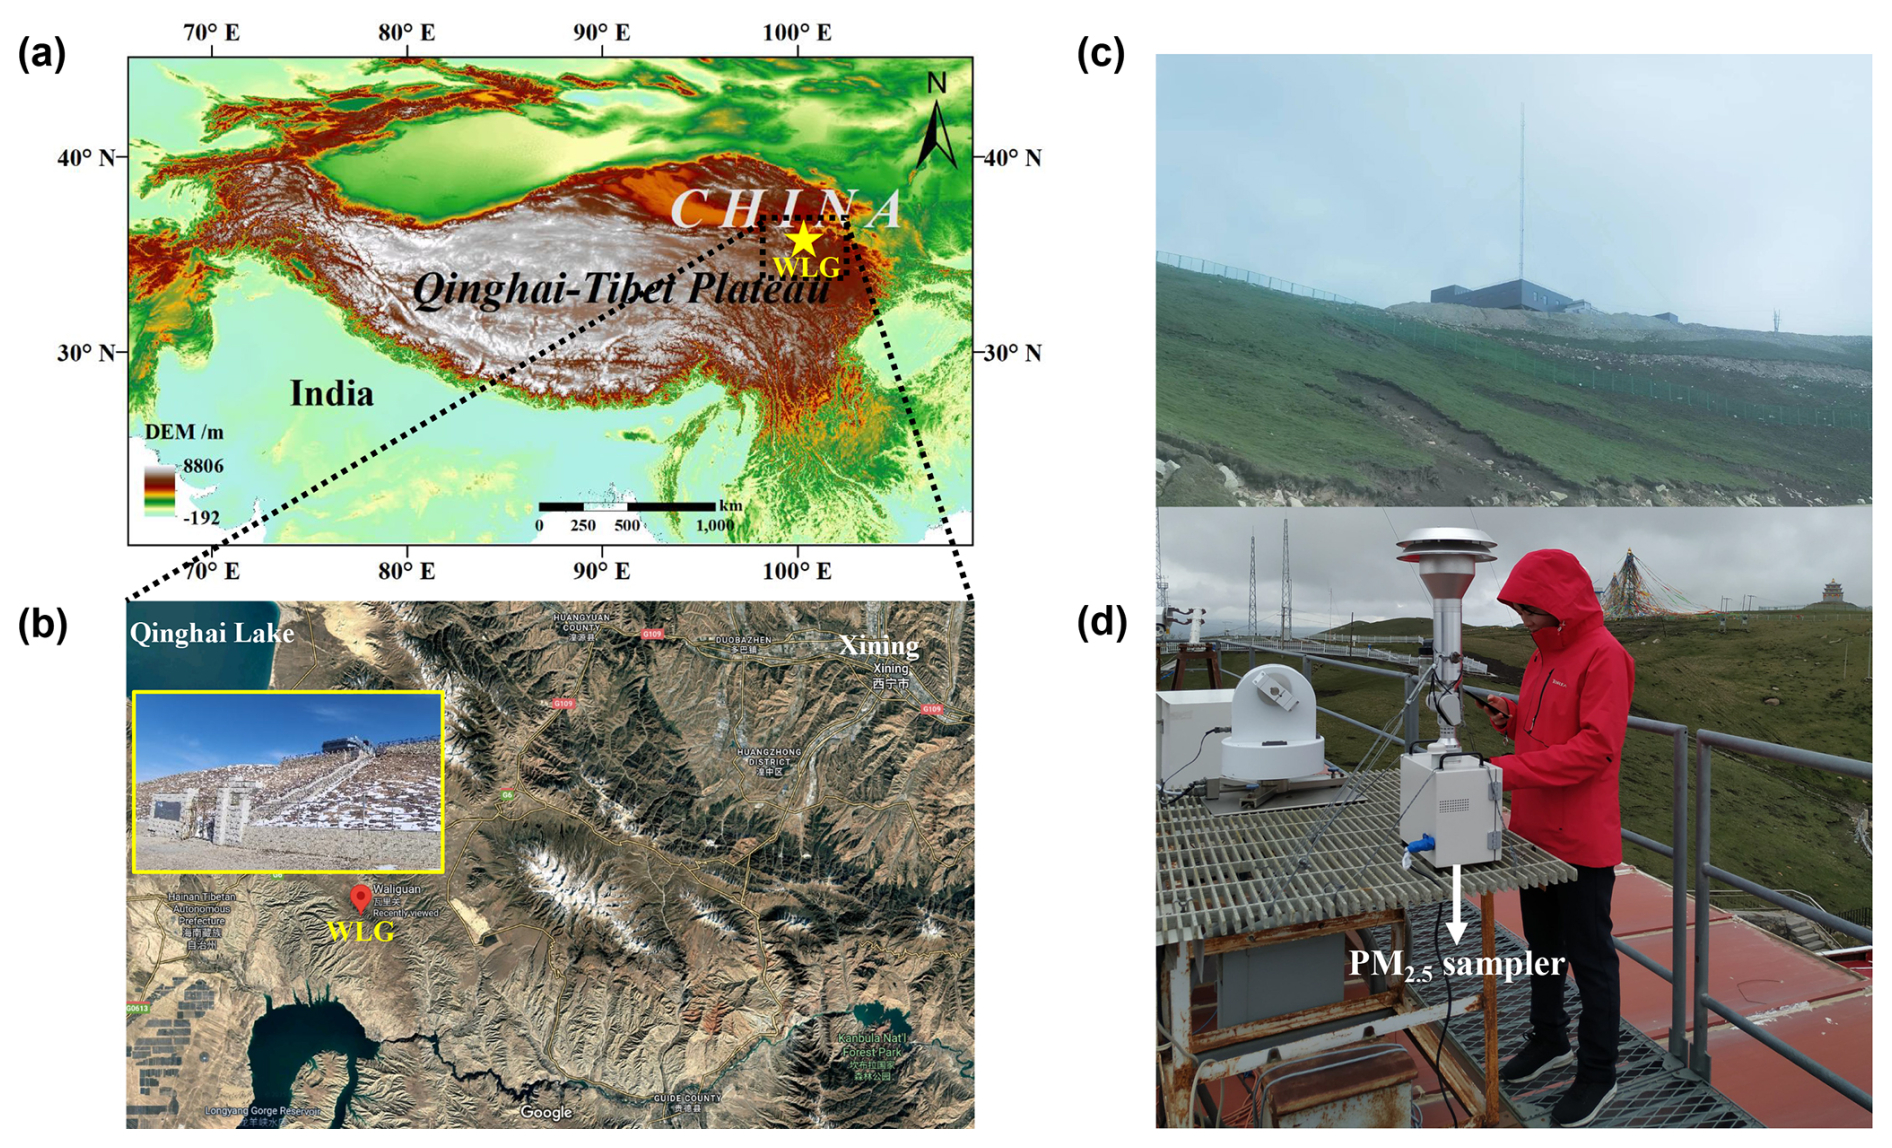
Figure 1(a, b) Location of the Waliguan Baseline Observatory (WLG) on the Tibetan Plateau (TP), adapted from Zhao et al. (2022) (© Google Maps 2025). (c, d) Photographs of the WLG and in-situ PM2.5 sampling.
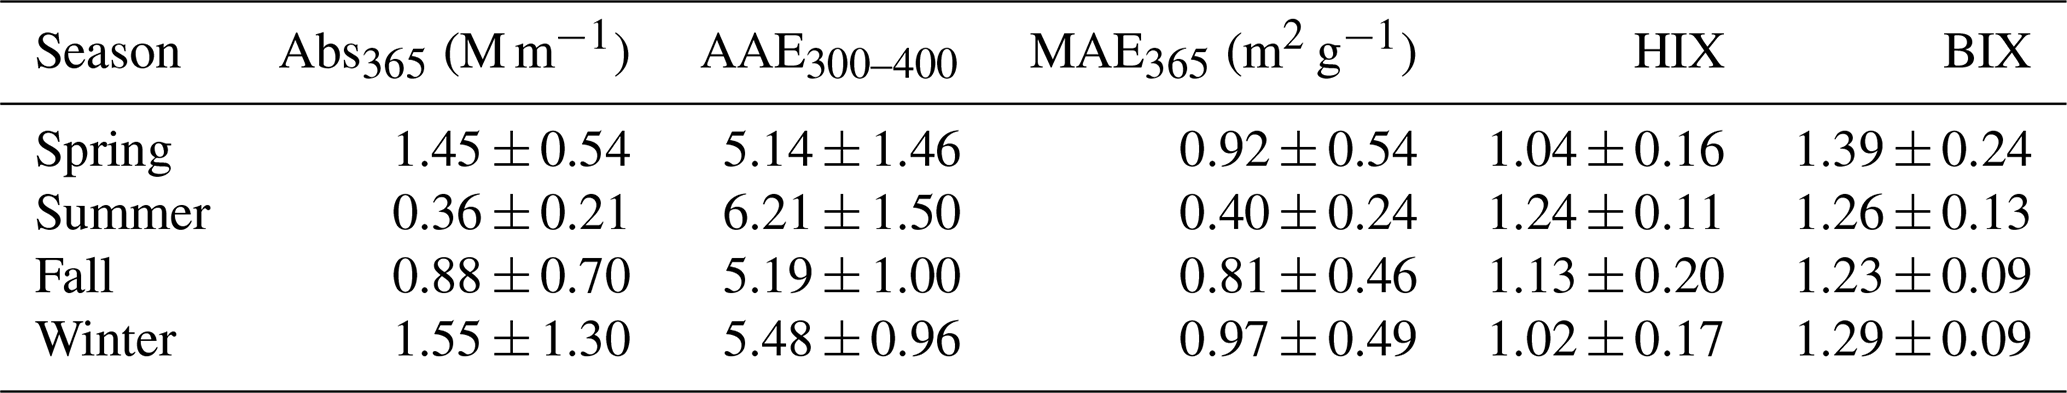
Table 1Light-absorbing properties of BrC and fluorescence indices of WSOA across the four seasons.
2.2 Aerosol sampling
Fine particulate matter (PM2.5) filter samples were collected on 47 mm diameter quartz fiber filters (PALL Life Sciences, USA) using a low flow aerosol sampler (Wuhan Tianhong Instrument Co. LTD, TH-16E) operating at a flow rate of 16.7 L min−1. Before sampling, the filters were baked in a muffle furnace at 550 °C for 4 h to remove residual organic material. After sampling, each filter was stored in a clean filter holder wrapped in aluminum foil and stored at −18 °C. A total of 48 filter samples and three field blanks were collected from 14 June 2019 to 6 May 2020. Each sample was collected for 48 h with a sampling frequency of once every seven days. Field blanks were obtained by placing clean filters into the sampler for 10 min without air flow. For seasonal analysis, the sampling period was divided as follows: summer (6 June to 28 August 2019, n=12), fall (4 September to 27 November 2019, n=13), winter (11 December 2019 to 26 February 2020, n=13), and spring (4 March to 6 May 2020, n=10). Meteorological data monitored by a Vantage Pro2 (Davis Instruments Corp., Hayward, CA, USA) weather station at the sampling site, including ambient temperature (T), relative humidity (RH), wind speed (WS) and wind direction (WD) were also obtained.
2.3 Chemical analysis
A 0.5 cm2 punch from each filter was used to determine the concentration of organic carbon (OC) and elemental carbon (EC) in PM2.5. The remaining portion of each filter was extracted by ultrasonication with 22 mL Milli-Q water (18.2 MΩ cm) for 40 min, followed by filtration through a 0.45 µm PTFE membrane filter (PALL Life Sciences, Ann Arbor, MI, USA). A suite of advanced instruments were employed to analyze the filtrate to characterize its chemical composition and optical properties, including a total organic carbon (TOC) analyzer for quantifying carbonaceous content, ion chromatography (IC) to measure water soluble ions, ultraviolet-visible (UV-Vis) spectroscopy to obtain absorbance spectra of water-soluble organic carbon (WSOC), excitation-emission matrix (EEM) fluorescence spectroscopy to assess the fluorescence characteristics of dissolved organic matter, and offline analysis using a high-resolution time-of-flight aerosol mass spectrometer (HR-ToF-AMS) to investigate the detailed chemical composition of OA. Our measurement strategy aimed to capture the chemical composition of PM2.5 as comprehensively as possible. The chemical species were broadly categorized into inorganic and organic constituents. Inorganic components were quantified using IC, while organic species were determined based on organic carbon measurements. Additionally, the optical properties of organic species were characterized using UV-Vis and EEM spectroscopy. Detailed descriptions of each measurement are provided below.
2.3.1 Measurements of carbonaceous materials
The OC/EC analysis was conducted using a thermal/optical carbon analyzer (DRI Model 2001; Desert Research Institute, Las Vegas, NV, USA) with the IMPROVE-A protocol (Chow et al., 2007). The 0.5 cm2 quartz filter was loaded into the instrument, and then sequentially heated in a non-oxidizing helium atmosphere to 140 °C (OC1), 280 °C (OC2), 480 °C (OC3) and 580 °C (OC4) to volatilize OC fraction. Then the sample was heated in an oxidizing atmosphere (98 % He/2 % O2) to 580 °C (EC1), 740 °C (EC2), 840 °C (EC3) to evolve EC. At each designated temperature step, evolved carbon was oxidized to CO2 and then reduced to CH4 by H2 catalyzed by MnO2. Ultimately, the hydrogen flame ionization detector was utilized to quantify the concentration of the resulting CH4. In some samples, EC concentrations were below the detection limit and thus reported as non-detectable.
WSOC was quantified by a total organic carbon analyzer (Elementar vario TOC cube, Hanau, Germany) with the method of total inorganic carbon (TIC) subtracted from total carbon (TC) (TOC = TC − TIC). In this method, TC was determined by converting the carbonaceous matter into CO2 at 850 °C using platinum as the catalyst and oxygen as the carrier gas. TIC was transformed into CO2 gas by acidification with 4 % phosphoric acid. The resulting CO2 was quantified using a non-dispersive infrared (NDIR) gas analyzer integrated within the instrument. Prior to the measurement, the instrument was calibrated with standard solutions of potassium hydrogen phthalate and sodium carbonate (Zhang et al., 2017b).
2.3.2 Ion chromatography analysis
Eight water-soluble ionic species (WSIs) (Na+, NH, K+, Ca2+, Mg2+, Cl−, NO, SO) were quantified using two 881 IC systems (Metrohm, Herisau, Switzerland). The anion system was facilitated by a Metrosep A Supp 5-250/4.0 column, with an eluent consisting of 3.2 mM Na2CO3 and 1.0 mM NaHCO3, delivered at a flow rate of 0.7 mL min−1. The cation system was facilitated by a Metrosep C4-250/2.0 column with an eluent of 1.7 mM nitric acid and 0.7 mM dipicolinic acid (DPA), operated at a flow rate of 0.3 mL min−1. To ensure optimal separation efficiency, both columns were maintained at 30 °C. Prior to analysis, the instrument was calibrated using a series of standard solutions to generate accurate calibration curves. Sample concentrations were determined by comparing the retention times and integrated peak areas of measured ions with those of the standards (Xu et al., 2015).
2.3.3 UV-vis absorption measurements and analysis
The ultraviolet-visible (UV-Vis) absorption spectra of the samples were measured over the wavelength range of 200–900 nm at a resolution of 1nm using a dual-beam UV spectrometer (UV-2700, Shimadzu, Kyoto, Japan). The water extracts were placed in 1 cm path length quartz cuvettes and scanned at a rate of 5 nm s−1, utilizing a dual light source system comprising deuterium and tungsten lamps. Baseline correction was performed by subtracting the mean absorbance value in the 695–705 nm from the entire spectrum for each sample, assuming negligible light absorption by BrC at this wavelength interval.
The absorption coefficient (Absλ) is calculated by Eq. (1) (Murphy et al., 2010).
where Aλ (M m−1) is the absorption coefficient at a specific wavelength; A700 is the mean absorption value at 695–705 nm; l is the light distance of the samples during the determination; Vl is the volume of water used in extraction; Va is the volume of gas that passes through the quartz filter. In general, the absorption coefficient at wavelength 365 nm is used to refer to the absorption of brown carbon. The wavelength dependence of brown carbon absorption can be expressed by Eq. (2).
where K is a constant related to aerosol mass concentration; AAE is the absorption Ångström exponent of particulate matter, which is obtained by linear fitting the natural logarithm of the wavelength (300–400 nm) to the natural logarithm of the corresponding Absλ. To calculate the light absorption intensity of unit mass WSOC at a certain wavelength, the mass absorption cross section (MAE) is calculated by Eq. (3).
where CWSOC (µgC m−3) is the concentration of water-soluble organic carbon in the atmosphere.
2.3.4 EEM fluorescence spectra analysis
The three-dimensional excitation-emission matrix (3D-EEM) fluorescence spectra of the samples was measured by an F-7100 fluorescence spectrometer (Hitachi High-Technologies, Tokyo, Japan) equipped with 700-V xenon arc lamp as the excitation source. During the scanning process, the excitation (Ex) wavelengths ranged from 200 to 450 nm with a 5 nm interval, while the emission (Em) wavelengths spanned from 250 to 600 nm with a 1 nm interval. In this study, Milli-Q water (18.2 MΩ cm−1) was used as the reference blank. To minimize instrumental interference, the blank reference was subtracted from each sample EEM. The corrected EEMs were then converted to Raman units (R.U.) and subjected to further analysis (Murphy et al., 2013). Parallel factor analysis (PARAFAC), a three-way decomposition method, was applied to identify individual fluorescent components based on their spectral similarity. In addition to knowing the relative contribution of each component to the total fluorescence of organic matter, this method also provides information on the biochemical composition, origin, and transformation processes of organic matter (Fellman et al., 2010). The PARAFAC modeling was performed using DOMfluor and drEEM toolboxes installed on Matlab R2019a in this study. The workflow included data preprocessing and preliminary analysis, model construction and validation, and culminating in the presentation of the final results (Stedmon and Bro, 2008).
To further characterize the fluorescence characteristics, humification index (HIX) and biological index (BIX) were calculated following established methods (Yang et al., 2020; Zhai et al., 2022). Given the differences in origin and transformation processes between atmospheric and aquatic samples, the emission wavelength ranges used for HIX calculation were adjusted from the conventional 300–345 and 435–480 to 325–365 and 410–450 nm, respectively (Wen et al., 2021; Wu et al., 2021). The HIX and BIX were calculated according Eqs. (4) and (5), respectively (Zsolnay et al., 1999).
where λEm is the emission wavelength; λEx is the excitation wavelength.
2.3.5 HR-ToF-AMS off-line measurement and PMF source decomposition
The High-Resolution Time-of-flight Aerosol Mass Spectrometer (HR-ToF-AMS, Aerodyne Inc., Billerica, MA, USA) was employed to obtain the information of chemical composition and elemental ratios of OA (Xu et al., 2015). Using argon as carrier gas, the samples were aerosolized into the instrument concentrated by an aerodynamic lens and vaporized at 600 °C. The resulting vapors were ionized with a 70 eV electron source and analyzed by time-of-flight mass spectrometry. According to the different shapes of ion flight paths in the mass spectrum, HR-ToF-AMS has two operating modes, namely V-mode and W-mode. V-mode data were selected for subsequent analysis due to better performance in this study. The data is processed using standard ToF-AMS data analysis toolkits SQUIRREL (v1.56) and PIKA (v1.15c) within Igor Pro 6.37. The processed matrix data were employed to investigate the sources of WSOA by positive matrix factorization (PMF). PMF source analysis was processed using the standard PMF evaluation tool (PET v2.03) developed based on the PMF2.exe algorithm (Ulbrich et al., 2009). Based on the Improved Ambient (I-A) method, relevant ratios including oxygen-to-carbon (), hydrogen-to-carbon (), nitrogen-to-carbon (), and the organic matter to organic carbon () ratio were obtained. The mass concentration of OM was estimated according to Eq. (6).
where OC is the mass concentration of OC measured by Thermal/optical Carbon Analyzer, is the ratio obtained from the HR-ToF-AMS.
2.3.6 Source identification using backward trajectory model
To investigate the possible sources and transport pathways of air masses during the sampling, the HYbrid Single-Particle Lagrangian Integrated Trajectory (HYSPLIT) model developed by the National Ocean and Atmospheric Administration (NOAA) and the Australian Bureau of Meteorology was used to calculate backward air mass trajectories (Stein et al., 2015). Meteorological data used in this study were Global Data Assimilation System (GDAS) from the National Centers for Environmental Prediction (NECP), with 1° × 1° horizontal resolution. In the calculation, the arrival height was set as 500 m above the ground at the sampling site. Thereafter, hourly backward trajectories were calculated for a duration of 72 h to trace the air mass movements during the whole sampling period. To identify representative transport pathway, cluster analysis was performed based on assessing the spatial similarities across all trajectories.
To further assess potential source regions, the concentration-weighted trajectory (CWT) method was applied. The CWT is a mixed-trajectory receptor model that combines meteorological trajectory nodes (residence time) and pollutant concentrations to trace their contributions to the pollution of a recipient site. The study area was first gridded with a resolution of 0.25° × 0.25°, the CWT value of Grid (i,j) was calculated as follows:
where CWTij is the average weighted concentration in the cell ij; M is the total number of trajectories; Cl is the pollutant concentration when the trajectory l through the grid ij; tijl is the time that the trajectory l stayed in the grid ij; Wij is the weight factor used to reduce the uncertainty of the calculation; nij is the number of trajectory endpoints of grid ij, and nave is the average number of trajectory endpoints. In this way, the CWT model is able to reveal regions that contribute significantly to the concentration of pollutants at the receptor site.
During the sampling period, the meteorological conditions exhibited notable seasonal variations. The average air temperature (±1σ) was −1.8 ± 8.3 °C, with a daily maximum of 13.8 °C recorded on 27 July 2019, and a minimum of −15.8 °C on 26 December 2019. Relative humidity (RH) ranged from 10 % to 99 %, with an average of 54 ± 28.1 %. Seasonally, the average air temperatures were −2.7 ± 5.1 °C in spring, 9.1 ± 3.5 °C in summer, −1.6 ± 6.1 °C in fall, and −10.0 ± 3.9 °C in winter. Similarly, the average RH values were 47.0 ± 29.4 % in spring, 88.3 ± 12.4 % in summer, 68.3 ± 18.5 % in fall, and 32.0 ± 16.1 % in winter (Fig. 2b). Wind patterns were predominantly from the west during winter, with a visible increase from the east during spring. This easterly wind reached the maximum in summer, reflecting a transition from the winter westerlies to summer monsoon systems (Fig. 2a). Precipitation exhibited strong seasonality in both quantity and frequency. Summer contributed 66.9 % of the annual precipitation but accounted for 44.0 % of the precipitation days, indicating concentrated heavy rainfall. In contrast, autumn contributed 17.2 % of the total precipitation but 28.4 % days, characteristic of prolonged light rainfalls.
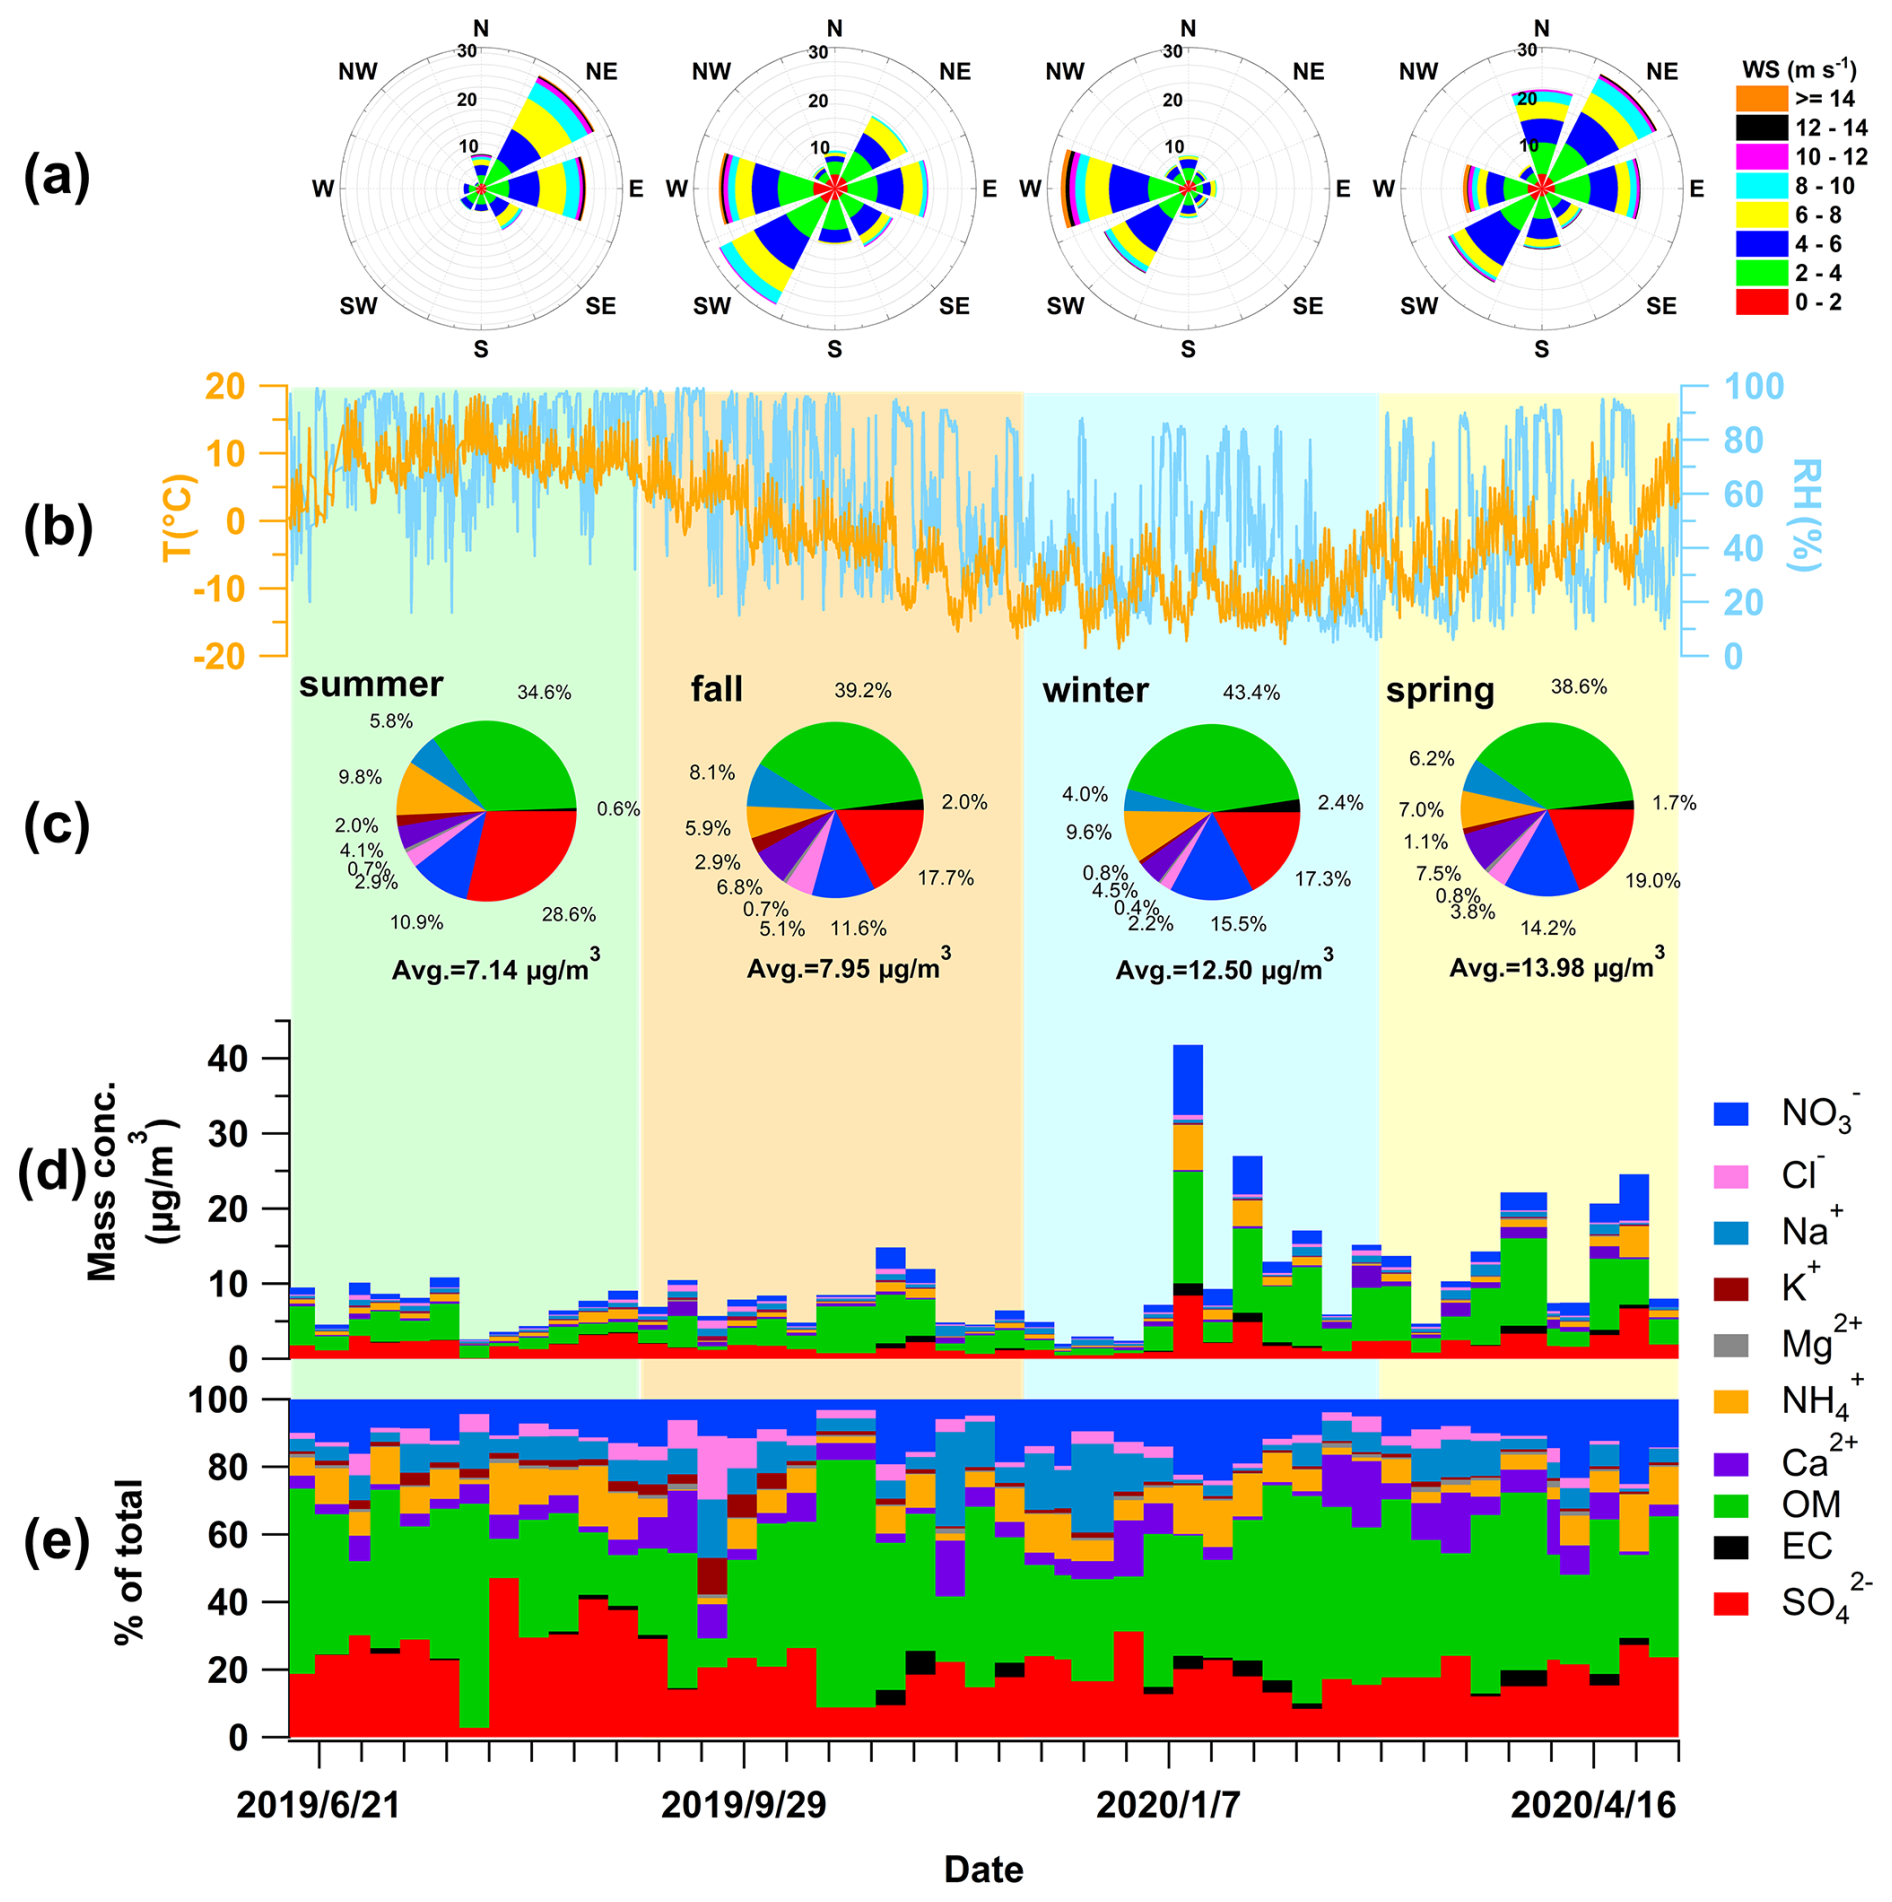
Figure 2Overview of the dataset used in this study. (a) Wind-rose diagrams for each season; (b) time series of air temperature (T) and relative humidity (RH); (c) seasonal average average chemical composition; (d) mass concentration of all measured species, including water-soluble ions (WSIs), organic matter (OM), and elemental carbon (EC); and (e) relative contributions of each species to the total PM2.5 mass.
3.1 Chemical composition of PM2.5
The total mass concentration of all species (WSIs + OM + EC) ranged from 2.0 to 41.8 µg m−3 during the study period, with a mean of 10.3 ± 7.4 µg m−3 (Fig. 2d). OM was the major contributor to aerosol mass concentration during the whole period with an average value of 37.7 %, followed by sulfate (21.3 %), nitrate (12.1 %), EC (1.1 %), and other inorganic ions, which together accounted for 27.8 % (including 7.5 % Na+, 7.6 % NH, 1.7 % K+, 6.6 % Ca2+, 0.8 % Mg2+, and 3.6 % Cl−). Seasonal Student's t-tests revealed that the mass concentrations during spring (14.0 µg m−3) and winter (12.5 µg m−3) were both significant higher than those in summer (7.1 µg m−3) and fall (8.0 µg m−3) (p<0.05) (Fig. 2c). These seasonal patterns were driven by increased transport of polluted air masses from the east in winter and prevalent mineral dust storms in spring. The natural mineral dust reached its peak in spring (1.05 µg m−3 of Ca2+) and its minimum in summer (0.29 µg m−3 of Ca2+) (Fig. 2c). The anthropogenic species (SO + NO) accounted for 33.2 % of the mass in spring and 32.8 % in winter. Among the secondary inorganic ions (sulfate, nitrate, and ammonium), sulfate was the most abundant, especially in summer, when its proportion reached 28.6 %, similar to observations conducted in July 2017 (Zhang et al., 2019). Sulfate formation during summer was mainly attributed to strong solar radiation, high humidity, and the heterogeneous reaction of SO2 (Luo et al., 2022). In contrast, nitrate showed its minimum in summer (10.9 %) and its maximum in winter (15.5 %), which was mainly controlled by temperature-dependent partitioning. The average nitrate concentrations was 1.4 µg m−3 with 2.0 µg m−3 in spring, 0.8 µg m−3 in summer, 0.9 µg m−3 in fall, 1.9 µg m−3 in winter in this study, which are comparable to measurements at WLG in July 2017 (0.7 µg m−3) (Zhang et al., 2019) and at sites around the region, such as Qinghai Lake in the summer of 2010 (0.8 ± 0.5 µg m−3) (Li et al., 2013) and Menyuan in autumn 2013 (1.7 µg m−3) (Han et al., 2020). However, these concentrations are significantly higher than those recorded in the western Qilian Mountains, such as the summer 2012 observation at the Qilian Shan Station of Glaciology and Ecologic Environment (QSS) (0.6 µg m−3) (Xu et al., 2015).
Ion balance, represented by the ratio of cation equivalent concentration (CE, neq m−3) to anion equivalent concentration (AE, neq m−3), was used to assess potential missing ions or the acid-base properties of aerosols (Xu et al., 2014, 2015). The ratio calculated in this study was 1.43 (Fig. 3a), suggesting the potential presence of acidic aerosols, although carbonate and bicarbonate ions were not measured in the IC analysis. Assuming 2 ⋅ [HCO] = [Ca2+], the estimated is still 1.35. In addition, the ratio of [SO + NO] to [NH] was 1.90, indicating that there was an excess of sulfuric and nitric acids. The acidic property in the aerosol of our study can be further supported by a significant number of organic acids, such as oxalic acid (Fig. 3b). Oxalic acid is a product of atmospheric photochemical aging and is closely associated with sulfate and aerosol liquid water (Yang et al., 2009; Huang et al., 2019; Xu et al., 2020b; Boreddy et al., 2023). A significant correlation was found between oxalic acid peak area and sulfate during summer (Pearson's r = 0.61, P<0.05) (Fig. 3c).
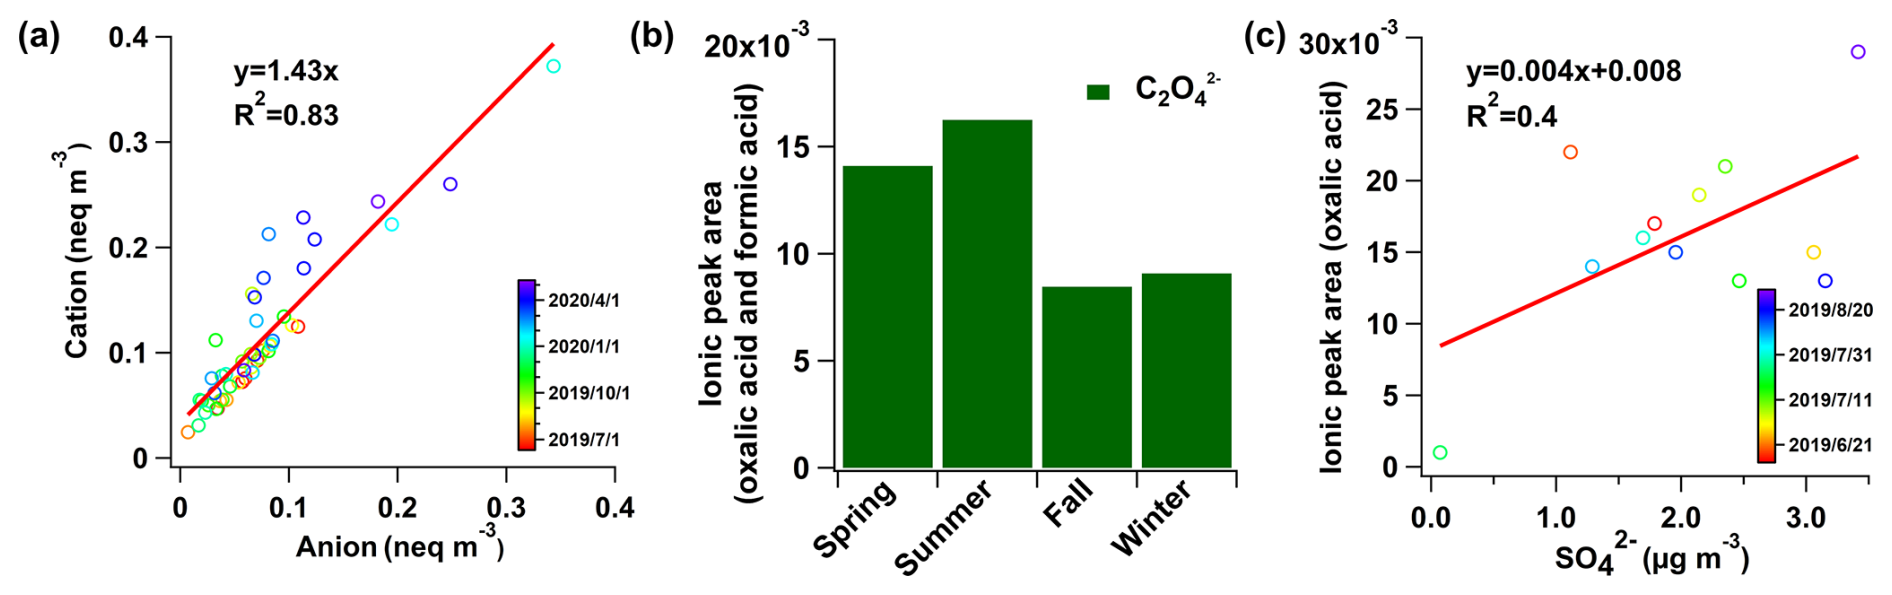
Figure 3(a) Charge balance between major cations (Na+ + NH + K+ + Ca2+ + Mg2+) and anions (Cl− + NO + SO); (b) seasonal variation of oxalic acid ion peak areas; and (c) correlation between oxalate ion peak area and mass concentration of sulfate in summer. Two scatter plots are fitted with linear regression, the fitting equations and coefficients are shown in the figure.
Air mass backward trajectory analysis suggests that air mass origination varied from east to west seasonally, with the east mainly occurred during the summer transported with a shorter distance and the west during winter with a longer distance (Fig. 4). Specifically, the fraction of the air mass from the east was up to 50.5 % in spring and 66.0 % in summer and the mostly potential source areas for pollutants were predominantly associated with these air masses (Fig. 5). The less important source areas are also observed from the north and west, especially during the fall, when the climatic systems of summer monsoon and the westerlies interacted. In these directions, widely distributed mineral dust source areas and sparse urban cities are located. Overall, anthropogenic emissions located in the east of WLG emerge as the most significant source regions to the WLG.
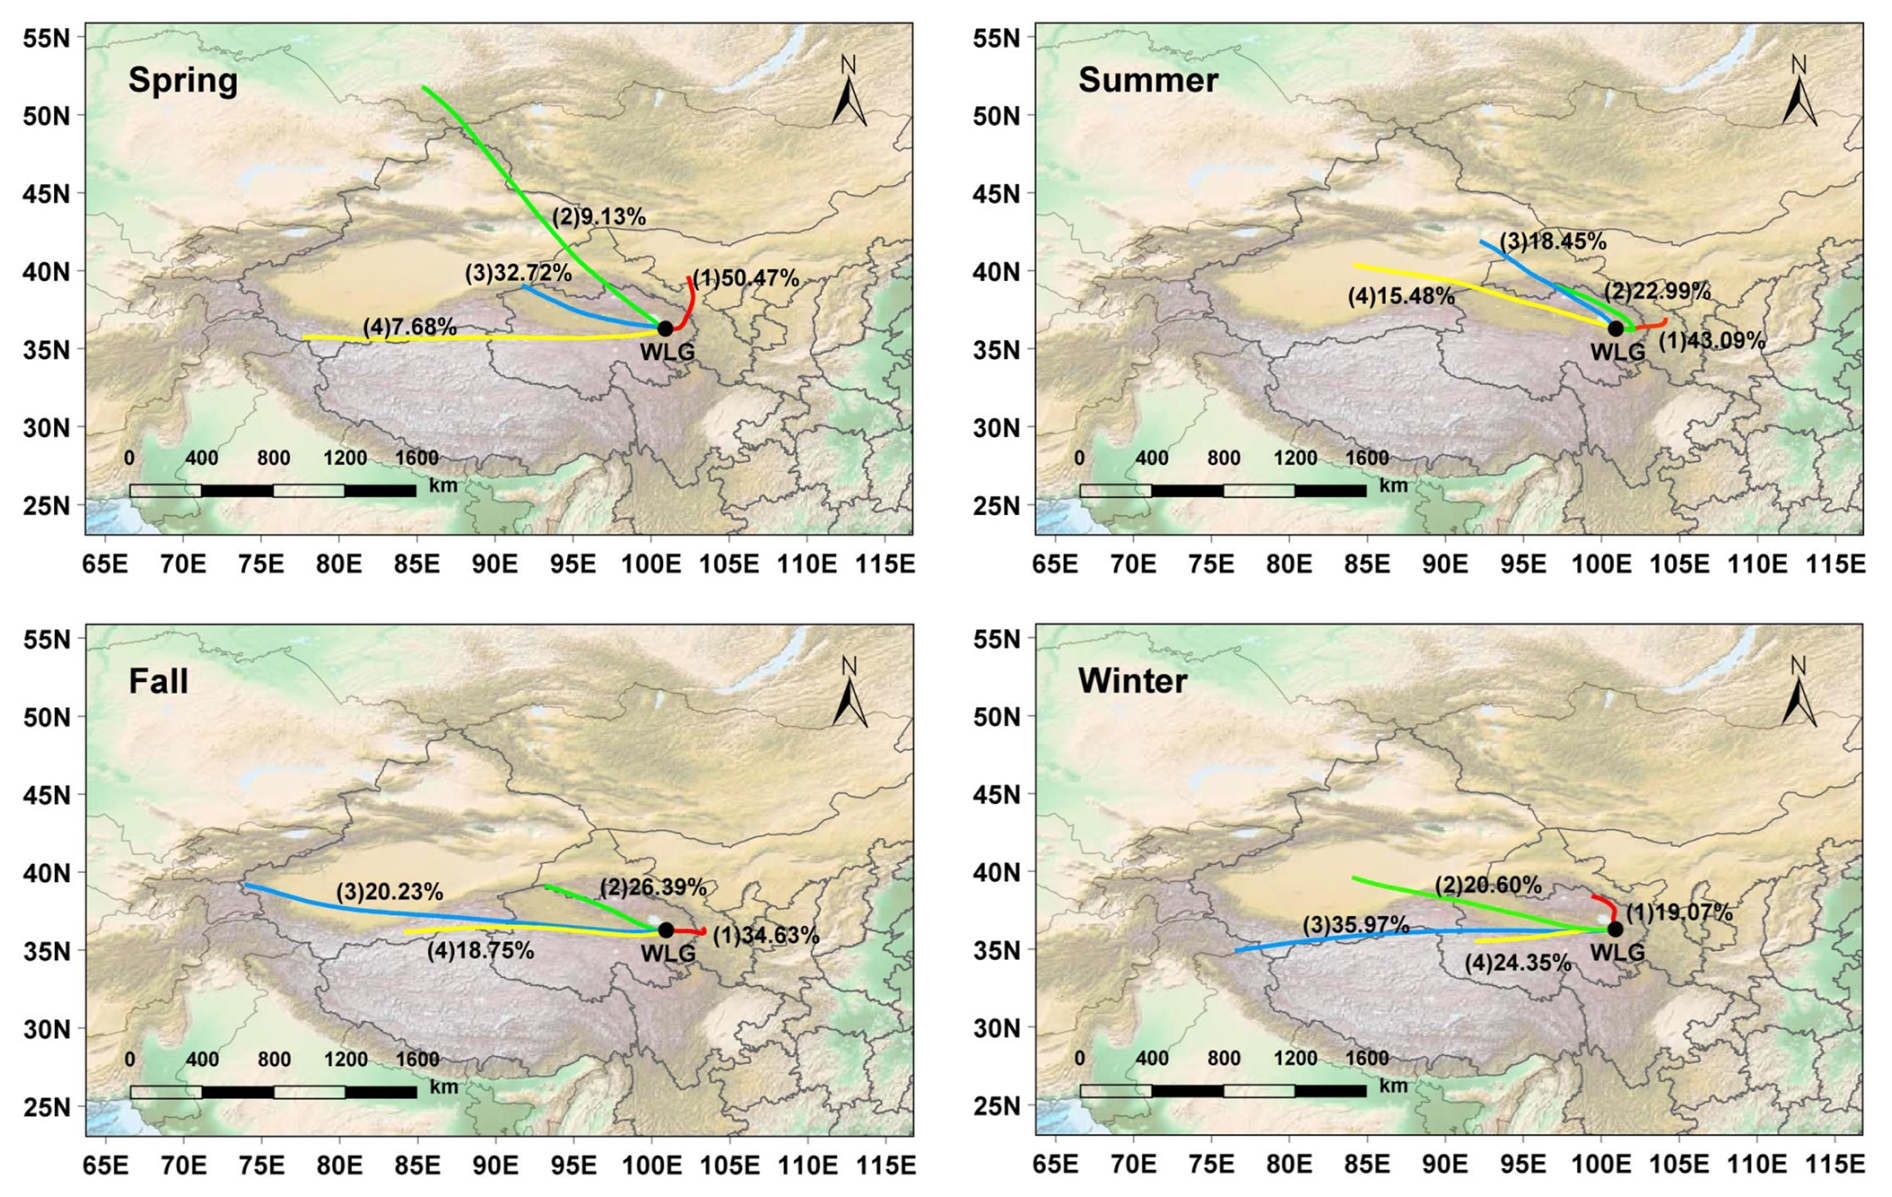
Figure 4Seasonal cluster analysis of 72 h air mass backward trajectories arriving at the WLG at 500 m above the ground based on the GRADS dataset using HYSPLIT mode embedded in MeteoInfo software.
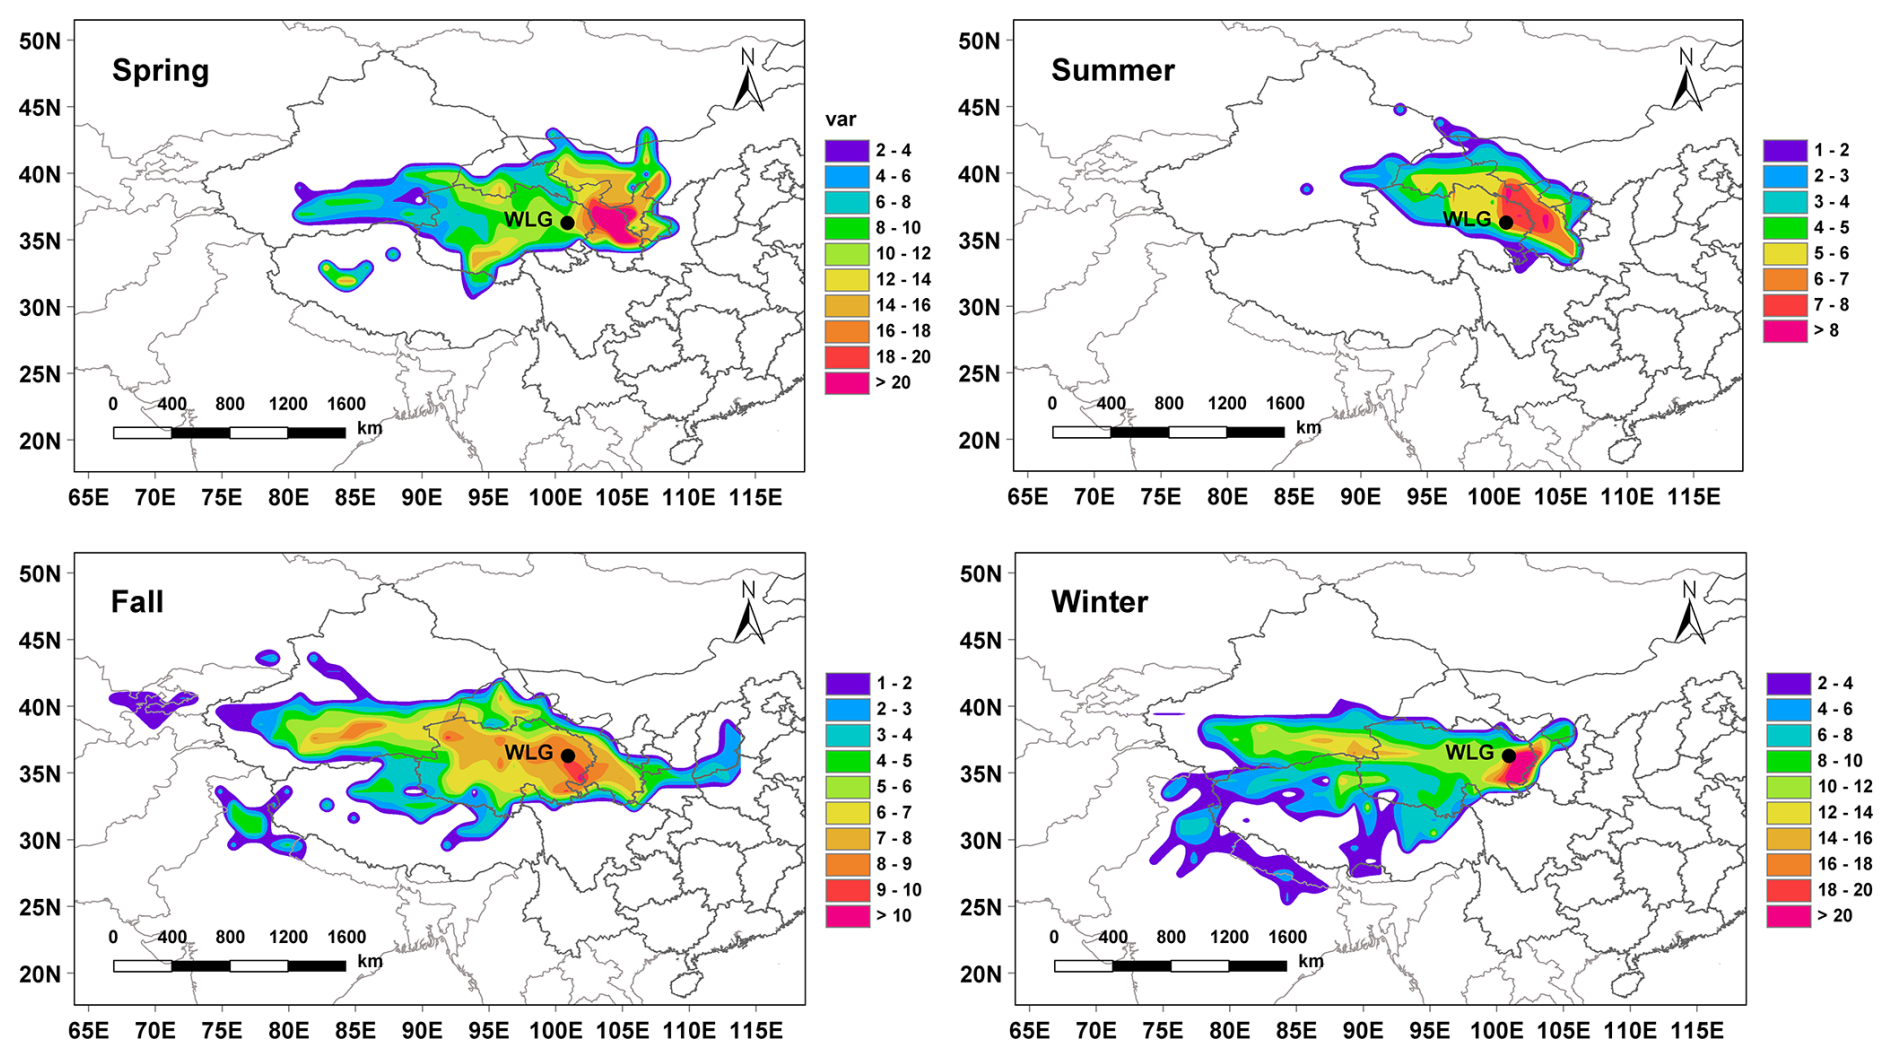
Figure 5Seasonal concentration-weighted trajectory (CWT) analysis of PM2.5 mass concentrations and air mass trajectories shown in Fig. 4 performed using MeteoInfor software.
3.2 Optical properties of WS-BrC
The average absorption coefficient of WS-BrC at 365 nm (Abs365) was 1.15 ± 0.97 M m−1. The mean values for all seasons are shown in Table 1. The Abs365 was much higher in spring and winter than in summer and fall (1.55 ± 1.30 M m−1 in winter and 1.45 ± 0.54 M m−1 in spring vs. 0.88 ± 0.70 M m−1 in fall and 0.36 ± 0.21 M m−1 in summer), which is consistent with the distribution of OM mass concentration. The results of the Student's t-test confirmed that the most pronounced seasonal difference in Abs365 occurred between spring and summer (p < 0.01), followed by the pairs of summer-winter and fall-spring (p < 0.1). Note that the relationship analysis between WSOC and OC indeed exhibited a tight correlation (R2=0.81) and a relatively high ratio (0.63 ± 0.21), suggesting the representativeness of water-soluble fraction on bulk OM. The average absorption efficiency of WS-BrC at unit WSOC content (MAE) during the summer at 365nm (MAE365, 0.40 ± 0.24 m2 g−1) is significantly lower than that of the other three seasons (0.92 ± 0.54 m2 g−1 in spring, 0.81 ± 0.46 m2 g−1 in fall and 0.97 ± 0.49 m2 g−1 in winter) (p<0.1) (Fig. 6a). A low MAE365 value may result from either a reduced abundance of light-absorbing chromophores or photobleaching effects. However, we propose that photobleaching plays a predominant role, based on the observed negative correlation between MAE365 and the oxidation state of OA (see Sect. 3.5). MAE365 in summer is comparable to that at WLG (0.48 m2 g−1) in July 2017 (Xu et al., 2020a), Nam Co (0.38 m2 g−1) from 13 May to 1 July 2015 (Zhang et al., 2017a) and the regional background points of North China Plain (0.38 m2 g−1) in summer of 2017 (Luo et al., 2020). But the MAE365 in spring of this study (0.92 ± 0.54 m2 g−1) is at a high level over the TP and even higher than the Qomolangma Station (QOMS) (0.81 m2 g−1) which is frequently impacted by biomass burning emission (Xu et al., 2020a).
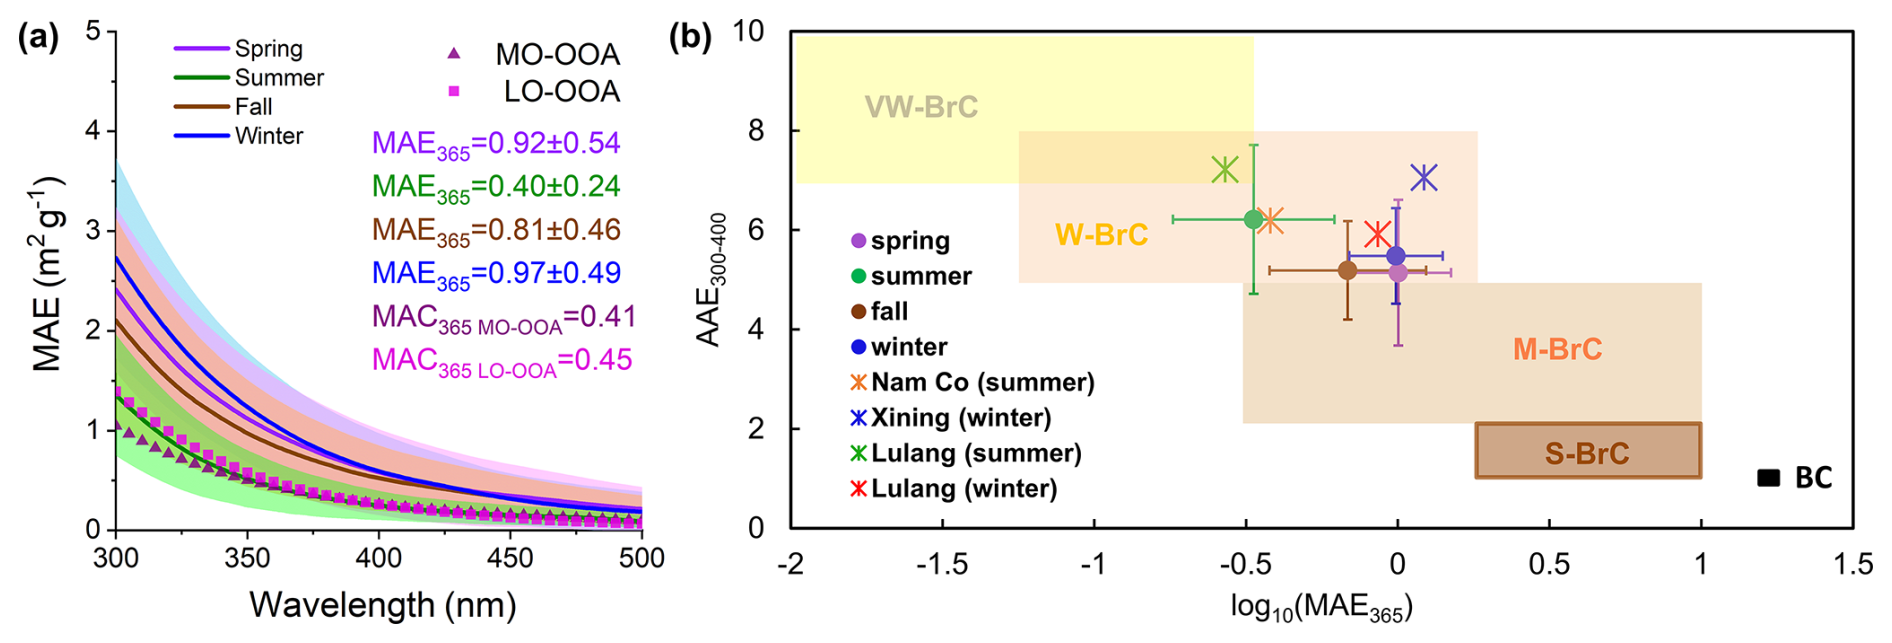
Figure 6Optical properties of water-soluble BrC (WS-BrC) in different seasons. (a) Average mass absorption efficiency (MAE) spectra and standard deviations of WS-BrC for each season, as well as for the two PMF-resolved factors (MO-OOA and LO-OOA). (b) Optical classification of WS-BrC based on the AAE-log10(MAE365) framework proposed by Saleh (2020). The shaded regions from left to right represent “very weakly” (VW), “weakly” (W), “moderately” (M), and “strongly” (S) absorbing BrC classes, and black carbon (BC). The irregular marks indicate data from various TP sites reported in previous studies.
AAE of light absorption spectrum is an important optical parameter to check the containing of BrC in aerosols. In the 300–400 nm range, a high AAE value indicates significant aerosol absorption of shortwave ultraviolet light, with a relatively higher contribution from BrC. This phenomenon is typically observed in cases from biomass burning emission, secondary organic aerosols (SOA), and anthropogenic pollutant emissions (Siemens et al., 2022; Tao et al., 2024). The AAE (300–400 nm) in this study ranges from 3.06 to 8.42, with an annual average of 5.42 ± 1.26 and peaking in summer (6.21 ± 1.50), followed by 5.48 ± 0.96 in winter, 5.19 ± 1.00 in fall, and 5.14 ± 1.46 in spring (Fig. 6a). The average annual AAE is comparable with the observation at Lulang (5.39 ± 1.22, 330–400 nm), in the southeastern part of the TP, during August 2014 to August 2015 (Li et al., 2016b) and Lhasa (5.38, 330–400 nm) during May 2013 to March 2014, a typical urban area on the TP (Li et al., 2016a). The summertime AAE is also similar to those at other stations on the TP, such as Nam Co (5.91 ± 2.14, 300–400 nm) from 13 May to 1 July 2015 (Zhang et al., 2017a) and WLG (5.96, 300–400 nm) from July 2017 (Xu et al., 2020a). The AAE value in winter is closed to that observed in the eastern Himalayas (5.5, 300–450 nm) during the 2019–2020 winter (Arun et al., 2024).
Figure 6b illustrates the comparison of optical properties of WSOA in the map space of AAE (300–400 nm) versus the logarithm of MAE365 proposed by Saleh (2020). This map can be categorized into four classes as MAE365 increase and AAE300–400 decreases, which are associated with increased molecular sizes, decreased volatility, reduced solubility in water/organic solvents, and lower susceptibility to photobleaching. In our dataset, the majority of data points fall within the region corresponding to weakly absorbing brown carbon (W-BrC). This suggests that the OA at WLG were overall aged BrC, which is consistent with observations from other remote sites on the TP (Zhang et al., 2017a; Wu et al., 2020; Xu et al., 2022; Zhong et al., 2023). A limited number of data points, primarily from the spring, deviate from this pattern and fall closer to the region associated with moderately absorbing BrC (M-BrC). These outliers are likely influenced by episodic inputs of anthropogenic aerosols from surrounding populated areas.
3.3 Fluorescent components and fluorescence indices
PARAFAC analysis identified four components (C1–C4) in this study (Fig. 7a). The chemical properties of each component were determined based on the comparison with previous studies (Chen et al., 2016a, b, 2020; Yu et al., 2023; Zhong et al., 2023). C1 was determined as a highly oxidized humic-like component (HULIS-1) with Ex/Em maxima at 240/413 nm (Tang et al., 2024). C2 (Ex/Em = 225/375 nm) was classified as a less oxidized humic-like component (HULIS-2), typically associated with combustion-related source (Li et al., 2022; Afsana et al., 2023). Both C3 (Ex/Em = 280/358 nm) and C4 (Ex/Em = 225(270)/297 nm) were classified as protein-like organic matter (PLOM) (Wang et al., 2024). C3 was probably a fossil fuel-related substance (Wu et al., 2019), while C4 had a main peak and a secondary peak similar to the characteristic of tyrosine-like chromophore (Chen et al., 2016b, 2021b). HULIS compounds (C1 and C2) dominated the annual average contribution by 57.9 %, of which C1 accounted for 22.9 % and C2 accounted for 35.0 %. PLOM contributed an average of 42.1 %, with C4 accounting for 27.0 % and C3 being 15.1 % (Fig. 7b). C1 presented weak seasonal variation peaking in summer (23.54 %) corresponding to the highest intensity of photochemical oxidation. The average relative contribution of C2 was 37.0 %, 35.0 %, 33.6 % and 34.4 % in spring, summer, fall and winter, respectively. In contrast, C3 showed higher relative contributions in spring (17.8 %) and winter (17.0 %) than in summer (12.6 %) and fall (13.1 %), which may be related to frequent coal-burning emissions during heating period. Conversely, the contribution of C4 was significantly more pronounced during summer (28.9 %) and fall (30.5 %) than that in spring (23.4 %) and winter (25.1 %), corresponding to enhanced activities in agriculture emissions and ecological activities (Zheng et al., 2016; Zhang et al., 2020).
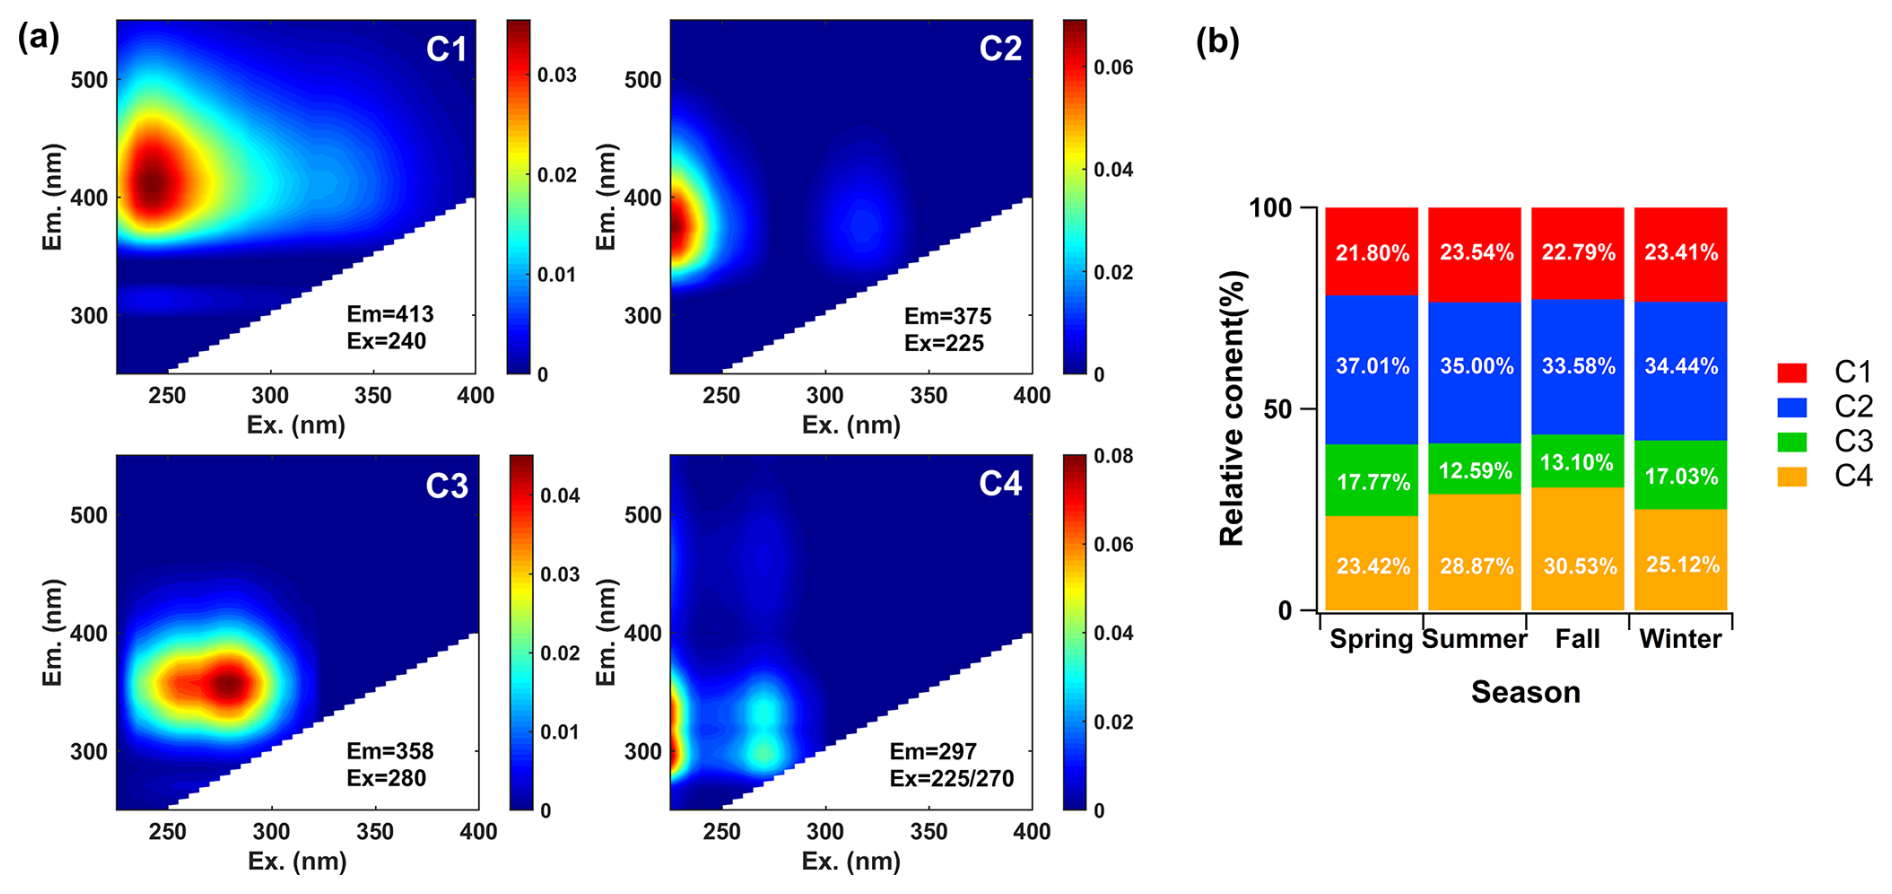
Figure 7Florescence analysis results. (a) Four excitation-emission matrix (EEM) components identified by the PARAFAC model for the water-soluble organic aerosol (WSOA); (b) seasonal variation in the relative contributions of each component.
The fluorescence indices BIX and HIX serve as complementary tools for characterizing fluorescent OM. BIX is particularly used to assess the biological freshness of OM, whereas HIX reflects the degree of humification and chemical aging (Lee et al., 2013). By integrating these two indices, a more comprehensive understanding of the properties of OM can be achieved. An elevated degree of aging is associated with increased HIX values (Fan et al., 2020; Wu et al., 2021; Ma et al., 2022) and decreased BIX values (Wen et al., 2021). In this study, the annual average HIX and BIX values were 1.11 ± 0.18 and 1.29 ± 0.14, respectively, with seasonal variations of 1.04 ± 0.16 and 1.39 ± 0.24 in spring, 1.24 ± 0.11 and 1.26 ± 0.13 in summer, 1.13 ± 0.20 and 1.23 ± 0.09 in fall, and 1.02 ± 0.17 and 1.29 ± 0.09 in winter (Table 1). The spring samples exhibited the greatest variability, indicating their relatively fresh properties (Fig. 8b). In contrast, summer was characterized by the highest HIX, suggesting a high degree of aging and oxidation. The HIX of the autumn samples were at an intermediate level, while winter samples had the lowest HIX and moderate BIX values, indicating the lower degree of oxidation (Fig. 8a). Compared with previous studies, the fluorescence properties of aerosols in this study are more consistent with those in the northwestern China, and were less humified than those in the eastern China (Fig. 8) (Chen et al., 2021a; Zhang et al., 2021a; Zhong et al., 2023).
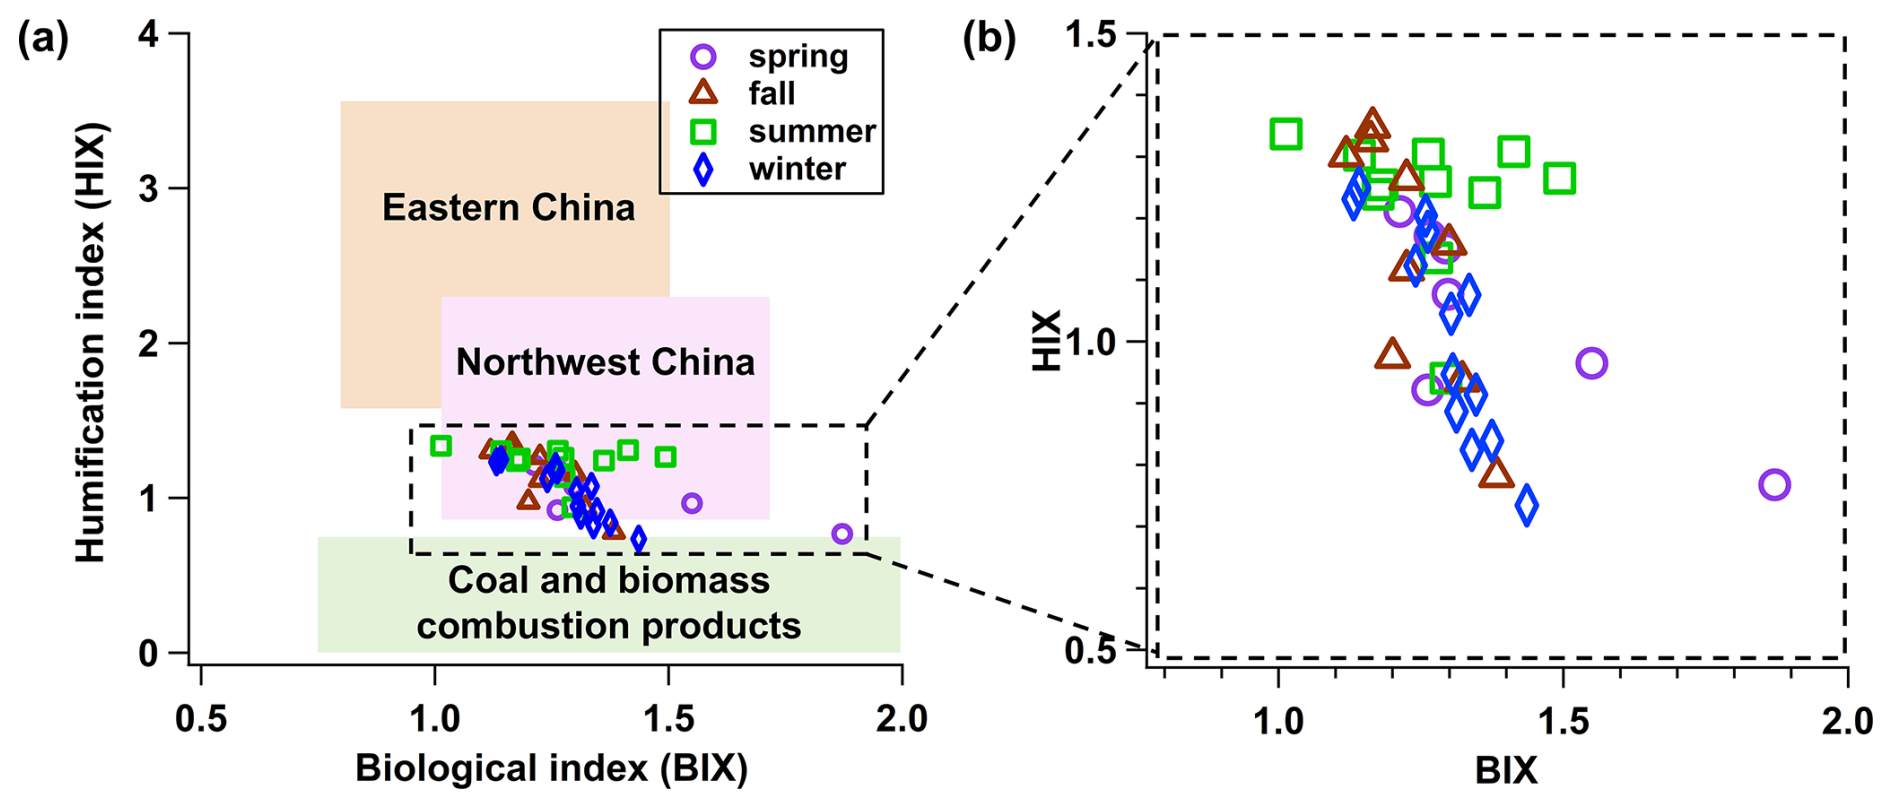
Figure 8Characteristics of fluorescence results represented by the biological index (BIX) and humification index (HIX). (a) Comparison of our dataset with previously reported values from eastern China, western China, and coal and biomass combustion sources, as summarized by Zhong et al. (2023); (b) enlarged view of our dataset highlighting seasonal variations.
3.4 Chemical components of WSOA and their light absorption
PMF decomposed the WSOA into two factors, i.e., a more oxidized oxygenated OA (MO-OOA) and a less oxidized oxygenated OA (LO-OOA) (Fig. 9a). Note that since our PMF analysis was conducted solely on the water-soluble fraction of OA, hydrophobic primary components may not be captured effectively. The mass spectra of these two OOAs in this study were consistent with those of online measurement at Nam Co Station in the TP during the summer (Xu et al., 2018). The average mass contribution of LO-OOA and MO-OOA were 47 % and 53 % (Fig. 9c), respectively. The mass contribution of MO-OOA across the four seasons (spring to winter) was 55.4 %, 54.9 %, 61.7 % and 42.0 %, respectively. The time series of LO-OOA correlated well with nitrate (R2=0.47) during winter and weak correlation with sulfate (R2=0.39), while MO-OOA correlated poorly with both species (Fig. 9b).
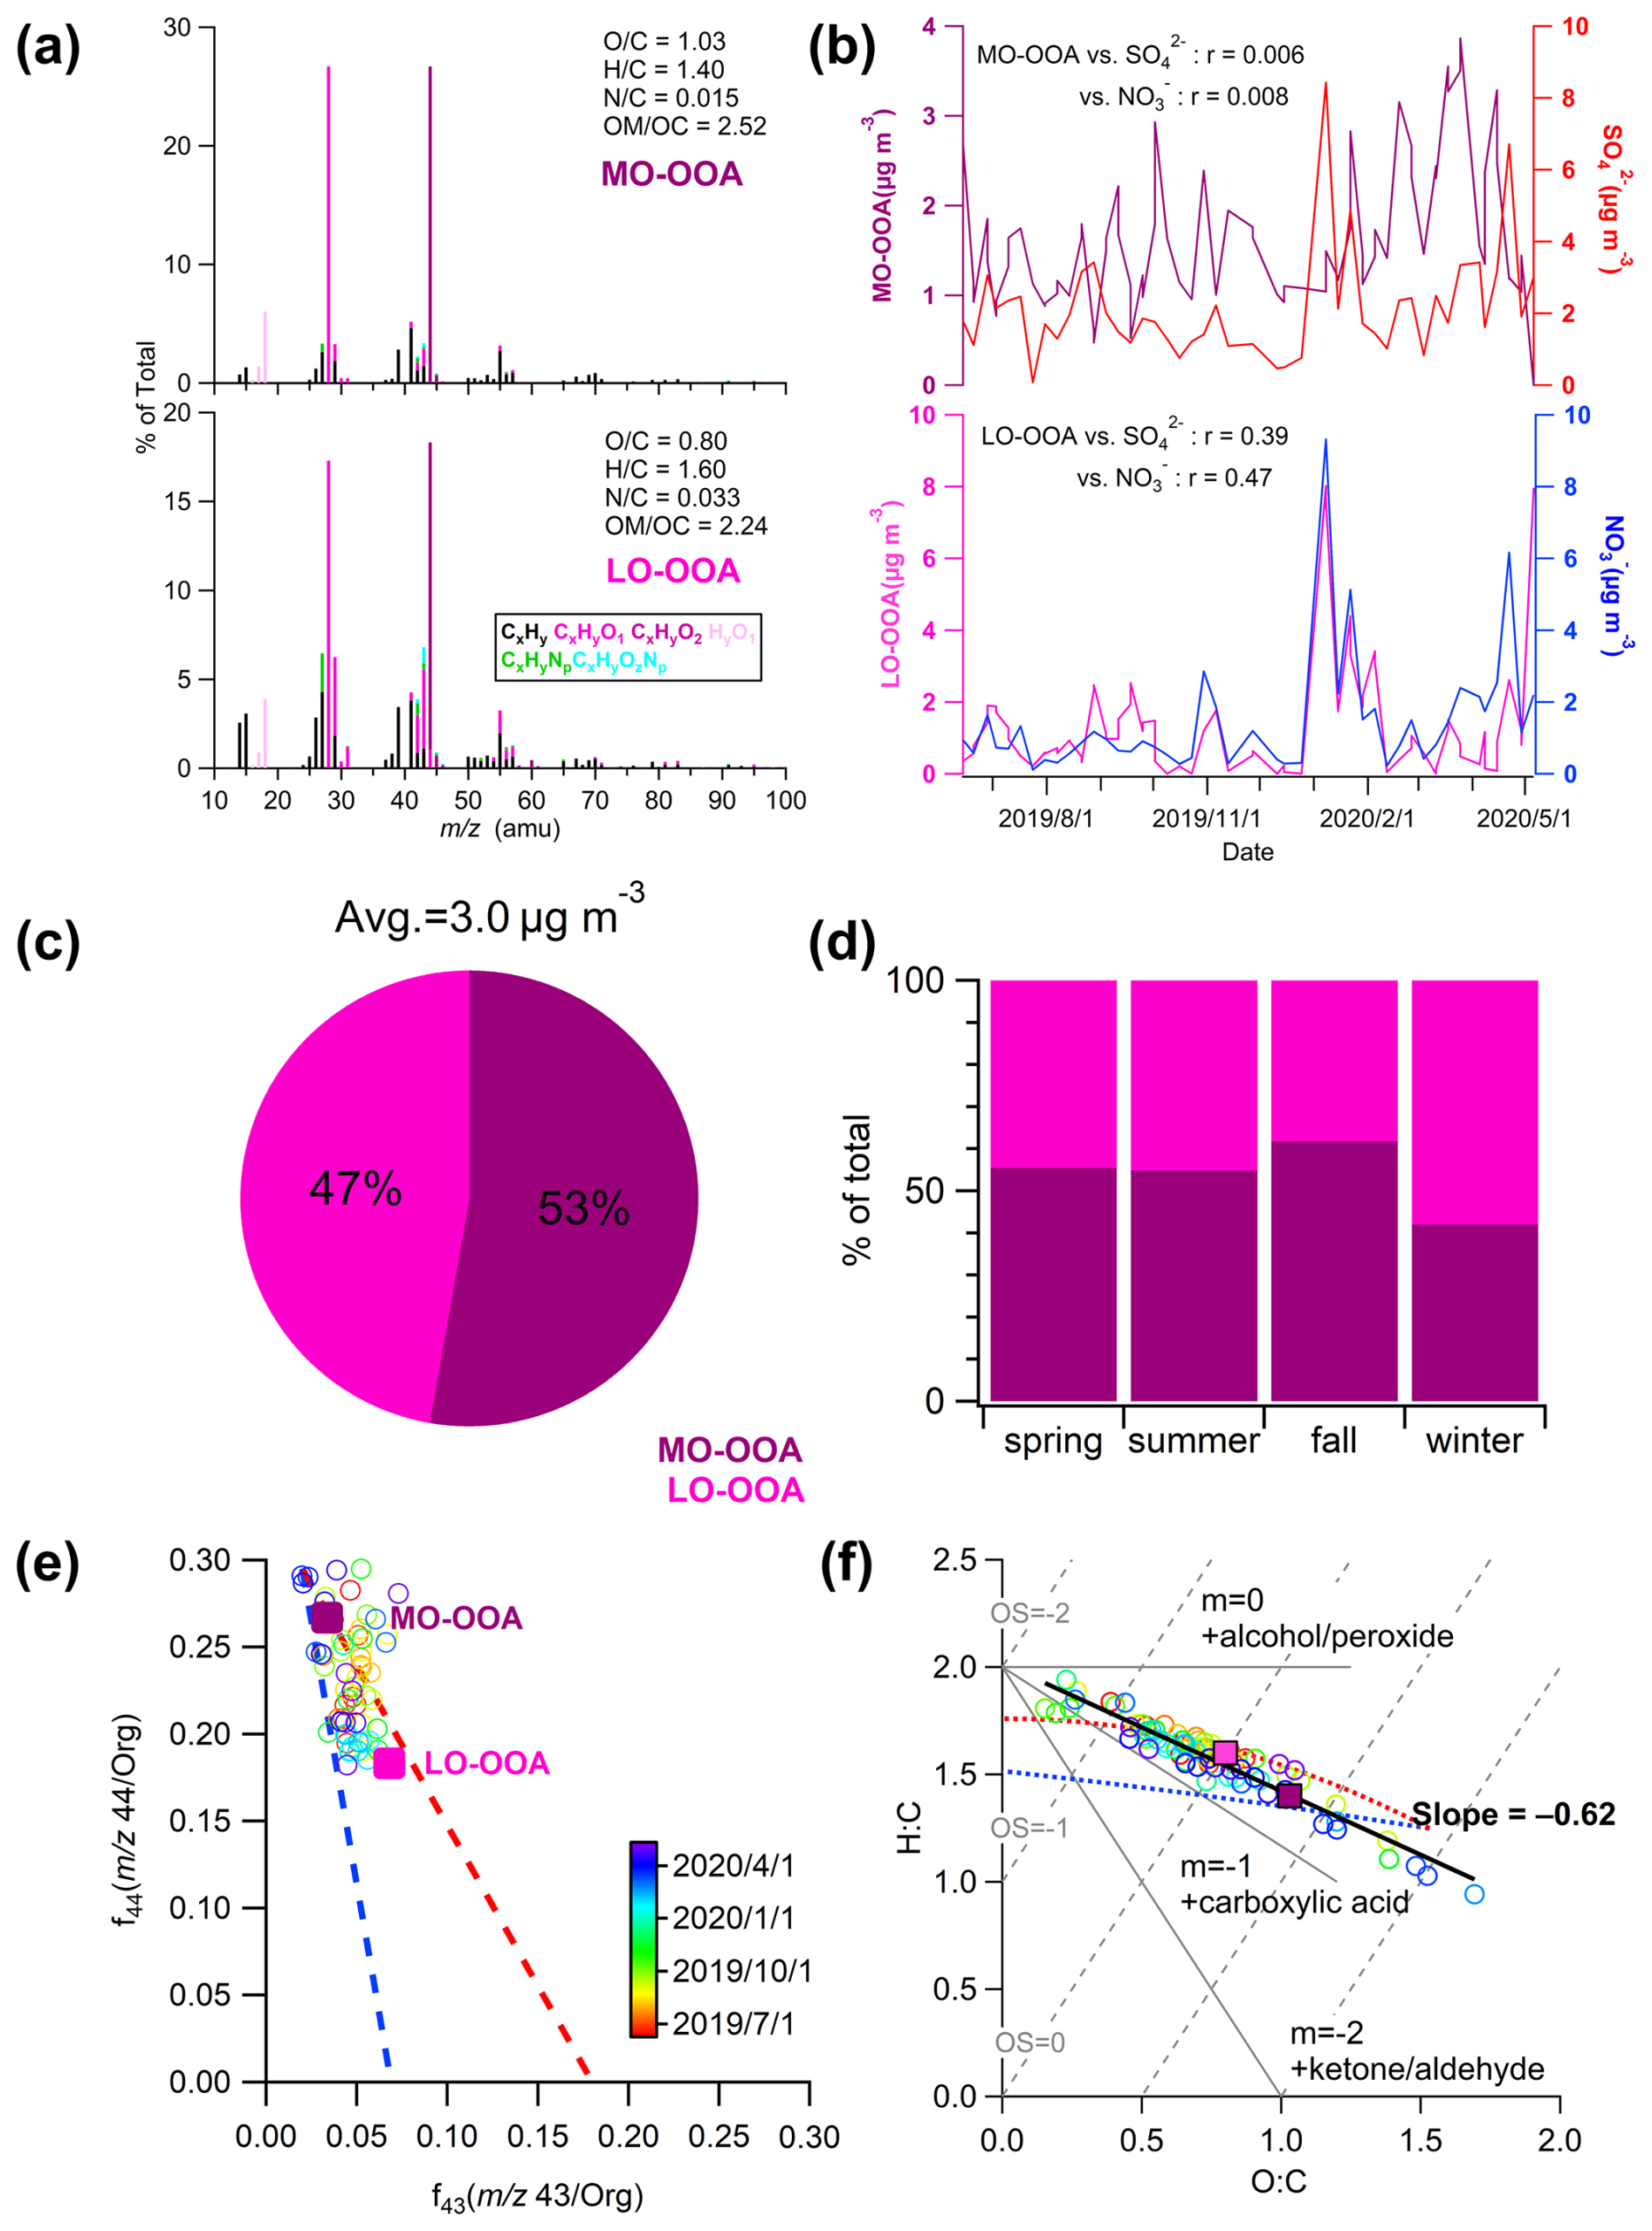
Figure 9Offline HR-ToF-AMS analysis results. (a) PMF results of high-resolution mass spectra colored by six ion categories for the two OA factors at < 120; (b) time series of the mass concentrations of the two factors and their correlation with tracer species; (c) average contribution of each factor to total organic mass concentration; (d) seasonal contributions of the two factors to total OA mass; (e) triangle plot of f44 vs. f43 for all the samples; (f) Van Krevelen diagram (H : C vs. O : C) for all the samples.
The triangle plot of 44 (f44) versus 43 (f43) and Van Krevelen diagram of elemental ratios are valuable tools for examining the ambient evolution of OA (Ng et al., 2010; Zhang et al., 2019; Chazeau et al., 2022). f44 is associated with highly oxidized oxygenated OA, while f43 corresponds to less oxidized OA. During atmospheric oxidation, OA generally evolves from a lower to a higher oxidation state, characterized by an increase in f44 and a decrease in f43, moving from the base to the apex of the triangular plot (Flores et al., 2014). In this study, most data points were located in the upper region of this triangular suggesting an overall high degree of oxidation across the dataset (Fig. 9e). Samples in winter were at the lower position and samples during summer shifted toward the higher position, presenting a distinct oxidation degree at different seasons. The Van Krevelen plot provides further insights into the chemical evolution of OA during atmospheric aging (Heald et al., 2010; Xu et al., 2018). The slope of the linear regression in the diagram reflects the predominant oxidation pathways. A slope between −1 to −0.5 is typically associated with functionalization processes such as the formation of carboxylic acids or alcohol/peroxide groups (Ng et al., 2011). In our dataset, the overall slope was −0.62 (Fig. 9f), indicating mixed contributions from both carboxylic acid and alcohol/peroxide formation pathways. This slope was higher than the value previously reposted for winter in Xining (−0.89) and summer at NamCo (−0.76) (Xu et al., 2018; Zhong et al., 2023). Seasonal slopes varied slightly, with spring and summer both at −0.58, fall at −0.60, and winter at −0.66, indicating the different OA oxidation pathways across seasons.
The light absorption characteristics of different WSOA factors, were evaluated by a multiple linear regression (MLR) model, which was applied to apportion their contributions to the light absorption at 365 nm (Abs365) (Zhang et al., 2021b; Jiang et al., 2023). The MLR method can be expressed as Eq. (9).
where fn is the corresponding fitting coefficients, which can also represent the mass absorption cross section (MAC) values of different organic components; CMO-OOAand CLO-OOA (µg m−3) are the mass concentration of the organic components; f×C is the absorption value of the organic component. The estimated MAC365 were 0.41 m2 g−1 for MO-OOA and 0.45 m2 g−1 for LO-OOA (Fig. 6a). The MAC365 value of LO-OOA was slightly higher than that of MO-OOA, which was related to the relatively weak photobleaching of LO-OOA. Compared to previous studies, MAC365,MO-OOA in this study was lower than MAC370,MO-OOA (0.60 m2 g−1) reported at the QOMS (Zhang et al., 2021b). MAC365,LO-OOA was much lower than that observed at urban sites in northwestern China in winter 2019 (1.33 m2 g−1) (Zhong et al., 2023). The differences across sites could be attributed to variations in their chemical composition, sources, and also oxidation state.
3.5 Relationship between oxidation state and optical properties of BrC
During the atmospheric aging of BrC, changes in its optical properties can reflect concurrent alterations in its chemical characteristics (Alang and Aggarwal, 2024). In this study, we investigated the relationship between the MAE365 and the elemental ratios of and across different seasons (Fig. 10). MAE365 exhibited a positive correlation with in spring (r=0.63; P<0.01) and a weak, statistically insignificant positive correlation in winter. In contrast, negative correlations were observed in summer and fall (r=0.29 and r=0.09). These seasonal relationships for MAE365 and showed an opposite pattern in each season (Fig. 10b). These results suggest that the light absorption capacity of BrC was enhanced during the oxidation process in spring and winter due to functionalization or oligomerization resulting in increased chromophore species, while further oxidation in summer and autumn leads to the fragmentation of large molecular weight compounds, leading to photobleaching and reduction in the light absorption capacity (Jiang et al., 2022).
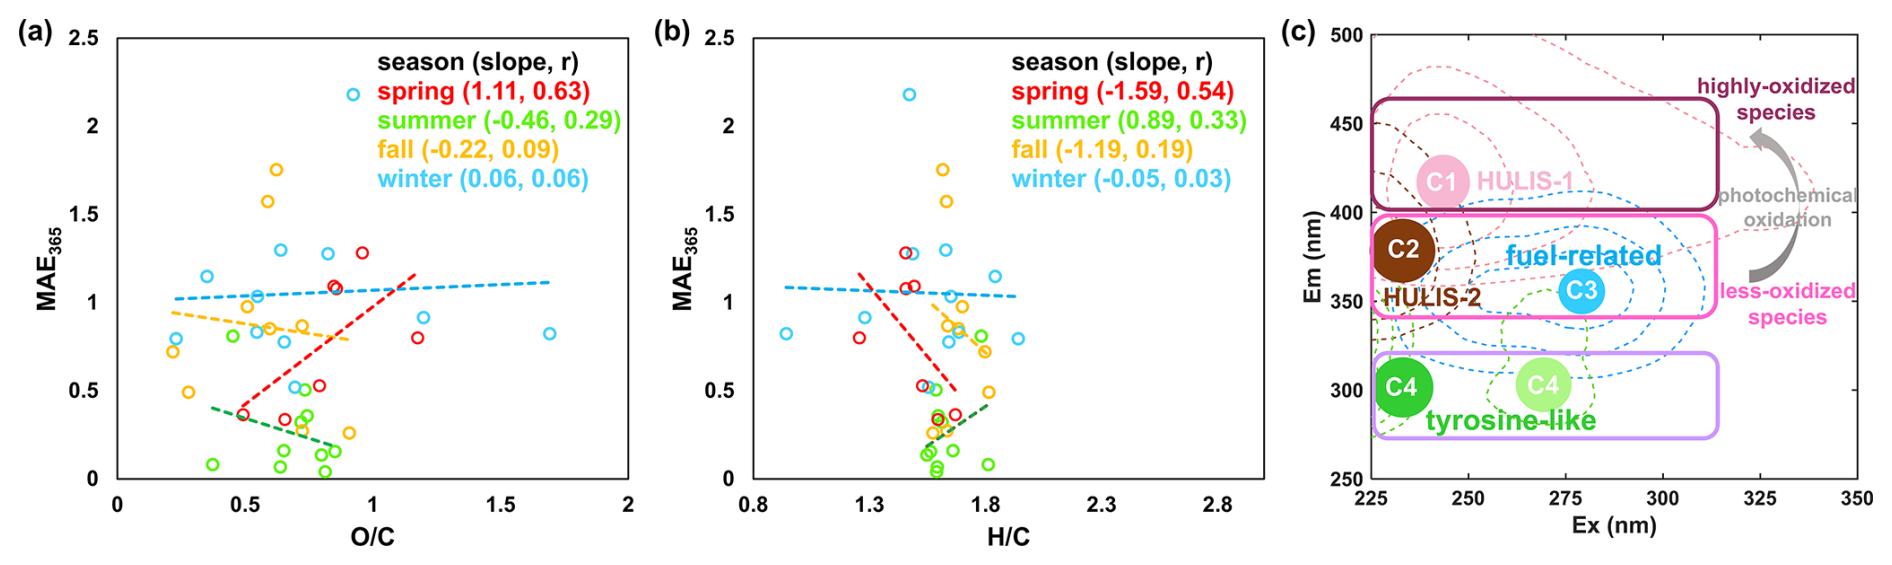
Figure 10Relationships between optical properties and chemical characteristics. (a, b) Scatterplots of MAE365 versus and ratios for the four seasons; (c) fluorescence peak positions of chromophores and their potential oxidation state.
In this study, cross-correlation analysis was performed on the chemical components of PM2.5 (SO, NO, NH, K+, Cl−, LO-OOA, MO-OOA), oxidation degree ( and ), and the four PARAFAC-derived fluorescent components (C1–C4). As illustrated in Fig. S2 in the Supplement, C1, C2, and C3 exhibited positive correlations with the secondary species (SO, NO, NH, Cl−, LO-OOA, and MO-OOA). The strongest correlations were observed between C1 and these species, suggesting a secondary source origin for this chromophore. In contrast, C4 showed weak or no significant correlations with any of the chemical components, implying that C4 was not directly related to the oxidation processes of OA. As discussed in Sect. 3.3, C4 was related to agriculture emissions and ecological activities, rather than secondary atmospheric formation. To further investigate the optical evolution of WS-BrC during the atmospheric oxidation processing, the relationships of PARAFAC components and the WSOA components were integrated in EEM plot (Fig. 10c). C1 was associated with MO-OOA, whereas C2 and C3 were linked to LO-OOA, and C4 exhibited weak correlations with these two factors. This classification enables cross-validation of chemical and optical properties, providing additional insights into the formation pathways of chromophore components (Chen et al., 2016b; Zhong et al., 2023). Overall, the chemical transformation from less oxidized to highly oxidized OA through photochemical reactions can be extended to the process of BrC. Correspondingly, the optical evolution of BrC can serve as evidence of the oxidative state transition.
In this study, year-long atmospheric aerosol samples collected at WLG were analyzed to investigate their chemical composition, optical properties, sources, and seasonal behaviors. OA was the dominant component of PM2.5 throughout the year, accounting for an annual average of 37.7 % of the total mass, followed by sulfate (21.3 %) and nitrate (12.1 %). OA and nitrate concentrations peaked in winter, while sulfate was enhanced in summer, reflecting distinct seasonal chemical processes and sources. In particular, the summertime increase in sulfate was attributed to intensified photochemical reactions under strong solar radiation. The light absorption capacity of WS-BrC was overall weak and exhibited distinct seasonal variation. The highest MAE365 was observed in winter (0.97 ± 0.49 m2 g−1), followed by spring (0.92 ± 0.54 m2 g−1), fall (0.81 ± 0.46 m2 g−1), and summer (0.40 ± 0.24 m2 g−1). The lowest MAE365 in summer suggested strong photobleaching of OA which could also be illustrated by higher values of AAE and HIX. Backward trajectory analysis indicated that aerosol transport to WLG predominantly originated from urbanized regions to the northeast and east. Four chromophores were identified based on PARAFAC analysis, with HULIS being the predominant contributors to fluorescent OA. PMF analysis on OA revealed two factors (MO-OOA and LO-OOA). While MO-OOA was more abundant, LO-OOA exhibited stronger light absorption. Both factors exhibited weaker light absorption compared to those in urban studies, indicating a high level of photochemical aging at this remote site. Integrating the PARAFAC and PMF results, we observed seasonally distinct relationships between ratio and MAE365, highlighting variations in the chemical processing of BrC across seasons. Overall, this study provides valuable insights into the sources, composition, and transformation of BrC in a high-altitude background environment. These findings offer a valuable reference for understanding aerosol-climate interactions and for improving regional climate assessments over the northeastern TP.
The data used in this study can be accessible at National Cryosphere Desert Data Center (https://doi.org/10.12072/ncdc.nieer.db6809.2025, Xu and Li, 2025).
The supplement related to this article is available online at https://doi.org/10.5194/acp-25-12433-2025-supplement.
JX designed the research and KL, MZ, and WZ collected samples. KL and JX processed data, plotted the figures, and wrote the manuscript when JX and MZ gave constructive discussion. YA and XQ had an active role in supporting the experimental work. All authors contributed to the discussions of the results and refinement of the manuscript.
The contact author has declared that none of the authors has any competing interests.
Publisher's note: Copernicus Publications remains neutral with regard to jurisdictional claims made in the text, published maps, institutional affiliations, or any other geographical representation in this paper. While Copernicus Publications makes every effort to include appropriate place names, the final responsibility lies with the authors. Also, please note that this paper has not received English language copy-editing. Views expressed in the text are those of the authors and do not necessarily reflect the views of the publisher.
We are extremely grateful to the editors and the anonymous reviewers for their valuable comments and suggestions. Thanks for the logistic support and assistance from WLG station.
This research has been supported by the National Natural Science Foundation of China (grant nos. 42476249 and 42021001).
This paper was edited by Alex Lee and reviewed by three anonymous referees.
Afsana, S., Zhou, R. C., Miyazaki, Y., Tachibana, E., Deshmukh, D. K., Kawamura, K., and Mochida, M.: Fluorescence of solvent-extractable organics in sub-micrometer forest aerosols in Hokkaido, Japan, Atmos. Environ., 303, https://doi.org/10.1016/j.atmosenv.2023.119710, 2023.
Alang, A. K. and Aggarwal, S. G.: Atmospheric Brown Carbon: Sources, Optical Properties, and Chromophore Composition, Aerosol Air Qual. Res., 24, https://doi.org/10.4209/aaqr.240035, 2024.
Arun, B. S., Gogoi, M. M., Deshmukh, D. K., Hegde, P., Boreddy, S. K. R., Borgohain, A., and Babu, S. S.: Enhanced light absorption by ambient brown carbon aerosols in the eastern Himalayas, Environ. Sci.: Atmos., 4, 782–801, https://doi.org/10.1039/d4ea00021h, 2024.
Boreddy, S. K. R., Kawamura, K., Gowda, D., Deshmukh, D. K., Narasimhulu, K., and Ramagopal, K.: Sulfate-associated liquid water amplifies the formation of oxalic acid at a semi-arid tropical location over peninsular India during winter, Sci. Total. Environ., 874, https://doi.org/10.1016/j.scitotenv.2023.162365, 2023.
Chazeau, B., El Haddad, I., Canonaco, F., Temime-Roussel, B., D'Anna, B., Gille, G., Mesbah, B., Prevot, A. S. H., and Wortham, H.: Organic aerosol source apportionment by using rolling positive matrix factorization: Application to a Mediterranean coastal city, Atmos. Environ.-X, 14, https://doi.org/10.1016/j.aeaoa.2022.100176, 2022.
Che, H. Z., Wang, Y. Q., and Sun, J. Y.: Aerosol optical properties at Mt. Waliguan Observatory, China, Atmos. Environ., 45, 6004–6009, https://doi.org/10.1016/j.atmosenv.2011.07.050, 2011.
Chelluboyina, G. S., Kapoor, T. S., and Chakrabarty, R. K.: Dark brown carbon from wildfires: a potent snow radiative forcing agent?, NPJ Clim. Atmos. Sci., 7, 200, https://doi.org/10.1038/s41612-024-00738-7, 2024.
Chen, J. and Wang, C.: Rising springs along the Silk Road, Geology, 37, 243–246, https://doi.org/10.1130/G25472A.1, 2009.
Chen, Q., Ikemori, F., and Mochida, M.: Light Absorption and Excitation-Emission Fluorescence of Urban Organic Aerosol Components and Their Relationship to Chemical Structure, Environ. Sci. Technol., 50, 10859–10868, https://doi.org/10.1021/acs.est.6b02541, 2016a.
Chen, Q., Miyazaki, Y., Kawamura, K., Matsumoto, K., Coburn, S., Volkamer, R., Iwamoto, Y., Kagami, S., Deng, Y., Ogawa, S., Ramasamy, S., Kato, S., Ida, A., Kajii, Y., and Mochida, M.: Characterization of Chromophoric Water-Soluble Organic Matter in Urban, Forest, and Marine Aerosols by HR-ToF-AMS Analysis and Excitation-Emission Matrix Spectroscopy, Environ. Sci. Technol., 50, 10351–10360, https://doi.org/10.1021/acs.est.6b01643, 2016b.
Chen, Q., Li, J., Hua, X., Jiang, X., Mu, Z., Wang, M., Wang, J., Shan, M., Yang, X., Fan, X., Song, J., Wang, Y., Guan, D., and Du, L.: Identification of species and sources of atmospheric chromophores by fluorescence excitation-emission matrix with parallel factor analysis, Sci. Total. Environ., 718, https://doi.org/10.1016/j.scitotenv.2020.137322, 2020.
Chen, Q., Hua, X., and Dyussenova, A.: Evolution of the chromophore aerosols and its driving factors in summertime Xi'an, Northwest China, Chemosphere, 281, https://doi.org/10.1016/j.chemosphere.2021.130838, 2021a.
Chen, Q., Mu, Z., Xu, L., Wang, M., Wang, J., Shan, M., Fan, X., Song, J., Wang, Y., Lin, P., and Du, L.: Triplet-state organic matter in atmospheric aerosols: Formation characteristics and potential effects on aerosol aging, Atmos. Environ., 252, https://doi.org/10.1016/j.atmosenv.2021.118343, 2021b.
Chen, Z. and Torres, O.: An examination of oxidant amounts on secondary organic aerosol formation and aging, Atmos. Environ., 43, 3579–3585, https://doi.org/10.1016/j.atmosenv.2009.03.058, 2009.
Choudhary, V., Gupta, T., and Zhao, R.: Evolution of Brown Carbon Aerosols during Atmospheric Long-Range Transport in the South Asian Outflow and Himalayan Cryosphere, ACS Earth Space Chem., 6, 2335–2347, https://doi.org/10.1021/acsearthspacechem.2c00047, 2022.
Chow, J. C., Watson, J. G., Chen, L. W. A., Chang, M. C. O., Robinson, N. F., Trimble, D., and Kohl, S.: The IMPROVE-A temperature protocol for thermal/optical carbon analysis: maintaining consistency with a long-term database, J. Air Waste Manage., 57, 1014–1023, https://doi.org/10.3155/1047-3289.57.9.1014, 2007.
Dai, M., Zhu, B., Fang, C., Zhou, S., Lu, W., Zhao, D., Ding, D., Pan, C., and Liao, H.: Long-Term Variation and Source Apportionment of Black Carbon at Mt. Waliguan, China, J. Geophys. Res.-Atmos., 126, https://doi.org/10.1029/2021JD035273, 2021.
Fan, L., Yan, X., Du, Q., Zhang, J., Liu, G., Yang, Y., Miao, Y., and Zhang, G.: On the sources of ambient SOA in PM2.5: An integrated analysis over Jinan city of China, Atmos. Pollut. Res., 15, https://doi.org/10.1016/j.apr.2023.102008, 2024.
Fan, X., Cao, T., Yu, X., Wang, Y., Xiao, X., Li, F., Xie, Y., Ji, W., Song, J., and Peng, P.: The evolutionary behavior of chromophoric brown carbon during ozone aging of fine particles from biomass burning, Atmos. Chem. Phys., 20, 4593–4605, https://doi.org/10.5194/acp-20-4593-2020, 2020.
Fellman, J. B., Hood, E., and Spencer, R. G. M.: Fluorescence spectroscopy opens new windows into dissolved organic matter dynamics in freshwater ecosystems: A review, Limnol. Oceanogr., 55, 2452–2462, https://doi.org/10.4319/lo.2010.55.6.2452, 2010.
Flores, J. M., Zhao, D. F., Segev, L., Schlag, P., Kiendler-Scharr, A., Fuchs, H., Watne, Å. K., Bluvshtein, N., Mentel, Th. F., Hallquist, M., and Rudich, Y.: Evolution of the complex refractive index in the UV spectral region in ageing secondary organic aerosol, Atmos. Chem. Phys., 14, 5793–5806, https://doi.org/10.5194/acp-14-5793-2014, 2014.
Forster, P., Storelvmo, T., Armour, K., Collins, W., Dufresne, J.-L., Frame, D., Lunt, D., Mauritsen, T., Palmer, M., Watanabe, M., Wild, M., and Zhai, P.: “Short-lived Climate Forcers”, in: Climate Change 2021 – The Physical Science Basis: Working Group I Contribution to the Sixth Assessment Report of the Intergovernmental Panel on Climate Change, Cambridge University Press, 817–922, https://doi.org/10.1017/9781009157896.008, 2021.
Han, B., Yang, W., Wang, J., Zhao, X., Yin, B., Wang, X., Geng, C., Dou, X., Xu, X., and Bai, Z.: Characterizations and Potential Formation Pathways of Atmospheric Inorganic Ions at a National Background Site in the Northeastern Qinghai-Tibet Plateau During Autumn Season, J. Geophys. Res.-Atmos., 125, https://doi.org/10.1029/2020JD032819, 2020.
Heald, C. L., Kroll, J. H., Jimenez, J. L., Docherty, K. S., DeCarlo, P. F., Aiken, A. C., Chen, Q., Martin, S. T., Farmer, D. K., and Artaxo, P.: A simplified description of the evolution of organic aerosol composition in the atmosphere, Geophys. Res. Lett., 37, https://doi.org/10.1029/2010GL042737, 2010.
Huang, X., Zhang, J., Luo, B., Luo, J., Zhang, W., and Rao, Z.: Characterization of oxalic acid-containing particles in summer and winter seasons in Chengdu, China, Atmos. Environ., 198, 133–141, https://doi.org/10.1016/j.atmosenv.2018.10.050, 2019.
Jiang, W., Ma, L., Niedek, C., Anastasio, C., and Zhang, Q.: Chemical and Light-Absorption Properties of Water-Soluble Organic Aerosols in Northern California and Photooxidant Production by Brown Carbon Components, ACS Earth Space Chem., 7, 1107–1119, https://doi.org/10.1021/acsearthspacechem.3c00022, 2023.
Jiang, X., Liu, D., Li, Q., Tian, P., Wu, Y., Li, S., Hu, K., Ding, S., Bi, K., Li, R., Huang, M., Ding, D., Chen, Q., Kong, S., Li, W., Pang, Y., and He, D.: Connecting the Light Absorption of Atmospheric Organic Aerosols with Oxidation State and Polarity, Environ. Sci. Technol., 56, 12873–12885, https://doi.org/10.1021/acs.est.2c02202, 2022.
Klodt, A. L., Aiona, P. K., MacMillan, A. C., Ji Lee, H., Zhang, X., Helgestad, T., Novak, G. A., Lin, P., Laskin, J., Laskin, A., Bertram, T. H., Cappa, C. D., and Nizkorodov, S. A.: Effect of relative humidity, NOx, and ammonia on the physical properties of naphthalene secondary organic aerosols, Environ. Sci.: Atmos., 3, 991–1007, https://doi.org/10.1039/d3ea00033h, 2023.
Laskin, A., Laskin, J., and Nizkorodov, S. A.: Chemistry of Atmospheric Brown Carbon, Chem. Rev., 115, 4335–4382, https://doi.org/10.1021/cr5006167, 2015.
Lee, H. J., Laskin, A., Laskin, J., and Nizkorodov, S. A.: Excitation-emission spectra and fluorescence quantum yields for fresh and aged biogenic secondary organic aerosols, Environ. Sci. Technol., 47, 5763–5770, https://doi.org/10.1021/es400644c, 2013.
Lee, W. G., Shin, P., and Wang, C.: The influence of relative humidity on the size of atmospheric aerosol, J. Environ. Sci. Health A, 32, 1085–1097, https://doi.org/10.1080/10934529709376597, 2008.
Li, C., Chen, P., Kang, S., Yan, F., Hu, Z., Qu, B., and Sillanpää, M.: Concentrations and light absorption characteristics of carbonaceous aerosol in PM2.5 and PM10 of Lhasa city, the Tibetan Plateau, Atmos. Environ., 127, 340–346, https://doi.org/10.1016/j.atmosenv.2015.12.059, 2016a.
Li, C., Yan, F., Kang, S., Chen, P., Hu, Z., Gao, S., Qu, B., and Sillanpää, M.: Light absorption characteristics of carbonaceous aerosols in two remote stations of the southern fringe of the Tibetan Plateau, China, Atmos. Environ., 143, 79–85, https://doi.org/10.1016/j.atmosenv.2016.08.042, 2016b.
Li, J., Wang, G., Wang, X., Cao, J., Sun, T., Cheng, C., Meng, J., Hu, T., and Liu, S.: Abundance, composition and source of atmospheric PM2.5 at a remote site in the Tibetan Plateau, China, Tellus B, 65, https://doi.org/10.3402/tellusb.v65i0.20281, 2013.
Li, X., Fu, P., Tripathee, L., Yan, F., Hu, Z., Yu, F., Chen, Q., Li, J., Chen, Q., Cao, J., and Kang, S.: Molecular compositions, optical properties, and implications of dissolved brown carbon in snow/ice on the Tibetan Plateau glaciers, Environ. Int., 164, https://doi.org/10.1016/j.envint.2022.107276, 2022.
Li, Z., Yuan, R., Feng, Q., Zhang, B., Lv, Y., Li, Y., Wei, W., Chen, W., Ning, T., Gui, J., and Shi, Y.: Climate background, relative rate, and runoff effect of multiphase water transformation in Qilian Mountains, the third pole region, Sci. Total. Environ., 663, 315–328, https://doi.org/10.1016/j.scitotenv.2019.01.339, 2019.
Liu, S., Sun, W., Shen, Y., and Li, G.: Glacier changes since the Little Ice Age maximum in the western Qilian Shan, northwest China, and consequences of glacier runoff for water supply, J. Glaciol., 49, 117–124, https://doi.org/10.3189/172756503781830926, 2017.
Liu, Y., Hua, S., Jia, R., and Huang, J.: Effect of Aerosols on the Ice Cloud Properties Over the Tibetan Plateau, J. Geophys. Res.-Atmos., 124, 9594–9608, https://doi.org/10.1029/2019JD030463, 2019.
Luo, L., Bai, X., Liu, S., Wu, B., Liu, W., Lv, Y., Guo, Z., Lin, S., Zhao, S., Hao, Y., Hao, J., Zhang, K., Zheng, A., and Tian, H.: Fine particulate matter (PM2.5/PM10) in Beijing, China: Variations and chemical compositions as well as sources, J. Environ. Sci., 121, 187–198, https://doi.org/10.1016/j.jes.2021.12.014, 2022.
Luo, Y., Zhou, X., Zhang, J., Xue, L., Chen, T., Zheng, P., Sun, J., Yan, X., Han, G., and Wang, W.: Characteristics of airborne water-soluble organic carbon (WSOC) at a background site of the North China Plain, Atmos. Res., 231, https://doi.org/10.1016/j.atmosres.2019.104668, 2020.
Ma, L., Li, B., Yabo, S. D., Li, Z., and Qi, H.: Fluorescence fingerprinting characteristics of water-soluble organic carbon from size-resolved particles during pollution event, Chemosphere, 307, https://doi.org/10.1016/j.chemosphere.2022.135748, 2022.
Ma, Y., Cheng, Y., Qiu, X., Cao, G., Fang, Y., Wang, J., Zhu, T., Yu, J., and Hu, D.: Sources and oxidative potential of water-soluble humic-like substances (HULISWS) in fine particulate matter (PM2.5) in Beijing, Atmos. Chem. Phys., 18, 5607–5617, https://doi.org/10.5194/acp-18-5607-2018, 2018.
Murphy, K. R., Butler, K. D., Spencer, R. G. M., Stedmon, C. A., Boehme, J. R., and Aiken, G. R.: Measurement of Dissolved Organic Matter Fluorescence in Aquatic Environments: An Interlaboratory Comparison, Environ. Sci. Technol., 44, 9405–9412, https://doi.org/10.1021/es102362t, 2010.
Murphy, K. R., Stedmon, C. A., Graeber, D., and Bro, R.: Fluorescence spectroscopy and multi-way techniques. PARAFAC, Anal. Methods, 5, 6557–6566, https://doi.org/10.1039/C3AY41160E, 2013.
Ng, N. L., Canagaratna, M. R., Zhang, Q., Jimenez, J. L., Tian, J., Ulbrich, I. M., Kroll, J. H., Docherty, K. S., Chhabra, P. S., Bahreini, R., Murphy, S. M., Seinfeld, J. H., Hildebrandt, L., Donahue, N. M., DeCarlo, P. F., Lanz, V. A., Prévôt, A. S. H., Dinar, E., Rudich, Y., and Worsnop, D. R.: Organic aerosol components observed in Northern Hemispheric datasets from Aerosol Mass Spectrometry, Atmos. Chem. Phys., 10, 4625–4641, https://doi.org/10.5194/acp-10-4625-2010, 2010.
Ng, N. L., Canagaratna, M. R., Jimenez, J. L., Chhabra, P. S., Seinfeld, J. H., and Worsnop, D. R.: Changes in organic aerosol composition with aging inferred from aerosol mass spectra, Atmos. Chem. Phys., 11, 6465–6474, https://doi.org/10.5194/acp-11-6465-2011, 2011.
Qi, P., Guo, X., Chang, Y., Tang, J., and Li, S.: Cloud water path, precipitation amount, and precipitation efficiency derived from multiple datasets on the Qilian Mountains, Northeastern Tibetan Plateau, Atmos. Res., 274, https://doi.org/10.1016/j.atmosres.2022.106204, 2022.
Saleh, R.: From Measurements to Models: Toward Accurate Representation of Brown Carbon in Climate Calculations, Curr. Pollut. Rep., 6, 90–104, https://doi.org/10.1007/s40726-020-00139-3, 2020.
Schnitzler, E. G. and Abbatt, J. P. D.: Heterogeneous OH oxidation of secondary brown carbon aerosol, Atmos. Chem. Phys., 18, 14539–14553, https://doi.org/10.5194/acp-18-14539-2018, 2018.
Schnitzler, E. G., Gerrebos, N. G. A., Carter, T. S., Huang, Y., Heald, C. L., Bertram, A. K., and Abbatt, J. P. D.: Rate of atmospheric brown carbon whitening governed by environmental conditions, Proc. Natl. Acad. Sci., 119, https://doi.org/10.1073/pnas.2205610119, 2022.
Siemens, K., Morales, A., He, Q., Li, C., Hettiyadura, A. P. S., Rudich, Y., and Laskin, A.: Molecular Analysis of Secondary Brown Carbon Produced from the Photooxidation of Naphthalene, Environ. Sci. Technol., 56, 3340–3353, https://doi.org/10.1021/acs.est.1c03135, 2022.
Stedmon, C. A. and Bro, R.: Characterizing dissolved organic matter fluorescence with parallel factor analysis: a tutorial, Limnol. Oceanogr.-Meth., 6, 572–579, https://doi.org/10.4319/lom.2008.6.572, 2008.
Stein, A. F., Draxler, R. R., Rolph, G. D., Stunder, B. J. B., Cohen, M. D., and Ngan, F.: Noaa's Hysplit Atmospheric Transport and Dispersion Modeling System, B. Am. Meteorol. Soc., 96, 2059–2077, https://doi.org/10.1175/BAMS-D-14-00110.1, 2015.
Sumlin, B. J., Pandey, A., Walker, M. J., Pattison, R. S., Williams, B. J., and Chakrabarty, R. K.: Atmospheric Photooxidation Diminishes Light Absorption by Primary Brown Carbon Aerosol from Biomass Burning, Environ. Sci. Tech. Let., 4, 540–545, https://doi.org/10.1021/acs.estlett.7b00393, 2017.
Tang, T., Huo, T., Tao, H., Tian, M., Yang, H., and Wang, H.: Effects of aerosol water content and acidity on the light absorption of atmospheric humic-like substances in winter, Chemosphere, 349, https://doi.org/10.1016/j.chemosphere.2023.140796, 2024.
Tao, Y., Yang, Z., Tan, X., Cheng, P., Wu, C., Li, M., Sun, Y., Ma, N., Dong, Y., Zhang, J., and Du, T.: Light Absorption Properties of Brown Carbon Aerosol During Winter at a Polluted Rural Site in the North China Plain, Atmosphere-Basel, 15, https://doi.org/10.3390/atmos15111294, 2024.
Ulbrich, I. M., Canagaratna, M. R., Zhang, Q., Worsnop, D. R., and Jimenez, J. L.: Interpretation of organic components from Positive Matrix Factorization of aerosol mass spectrometric data, Atmos. Chem. Phys., 9, 2891–2918, https://doi.org/10.5194/acp-9-2891-2009, 2009.
Wang, H., Su, Y., Liu, Y., Xie, F., Zhou, X., Yu, R., Lü, C., and He, J.: Water-soluble brown carbon in atmospheric aerosols from the resource-dependent cities: Optical properties, chemical compositions and sources, J. Environ. Sci., 138, 74–87, https://doi.org/10.1016/j.jes.2023.02.035, 2024.
Wang, Q., Han, Y., Ye, J., Liu, S., Pongpiachan, S., Zhang, N., Han, Y., Tian, J., Wu, C., Long, X., Zhang, Q., Zhang, W., Zhao, Z., and Cao, J.: High Contribution of Secondary Brown Carbon to Aerosol Light Absorption in the Southeastern Margin of Tibetan Plateau, Geophys. Res. Lett., 46, 4962–4970, https://doi.org/10.1029/2019GL082731, 2019.
Wen, H., Zhou, Y., Xu, X., Wang, T., Chen, Q., Chen, Q., Li, W., Wang, Z., Huang, Z., Zhou, T., Shi, J., Bi, J., Ji, M., and Wang, X.: Water-soluble brown carbon in atmospheric aerosols along the transport pathway of Asian dust: Optical properties, chemical compositions, and potential sources, Sci. Total. Environ., 789, https://doi.org/10.1016/j.scitotenv.2021.147971, 2021.
Wu, G., Ram, K., Fu, P., Wang, W., Zhang, Y., Liu, X., Stone, E. A., Pradhan, B. B., Dangol, P. M., Panday, A. K., Wan, X., Bai, Z., Kang, S., Zhang, Q., and Cong, Z.: Water-Soluble Brown Carbon in Atmospheric Aerosols from Godavari (Nepal), a Regional Representative of South Asia, Environ. Sci. Technol., 53, 3471–3479, https://doi.org/10.1021/acs.est.9b00596, 2019.
Wu, G., Wan, X., Ram, K., Li, P., Liu, B., Yin, Y., Fu, P., Loewen, M., Gao, S., Kang, S., Kawamura, K., Wang, Y., and Cong, Z.: Light absorption, fluorescence properties and sources of brown carbon aerosols in the Southeast Tibetan Plateau, Environ. Pollut., 257, https://doi.org/10.1016/j.envpol.2019.113616, 2020.
Wu, G., Fu, P., Ram, K., Song, J., Chen, Q., Kawamura, K., Wan, X., Kang, S., Wang, X., Laskin, A., and Cong, Z.: Fluorescence characteristics of water-soluble organic carbon in atmospheric aerosol, Environ. Pollut., 268, https://doi.org/10.1016/j.envpol.2020.115906, 2021.
Xie, F., Lin, Y., Ren, L., Gul, C., Wang, J., Cao, F., Zhang, Y., Xie, T., Wu, J., and Zhang, Y.: Decrease of atmospheric black carbon and CO concentrations due to COVID-19 lockdown at the Mt. Waliguan WMO/GAW baseline station in China, Environ. Res., 211, https://doi.org/10.1016/j.envres.2022.112984, 2022.
Xu, J. and Li, K.: Comprehensive dataset of atmospheric aerosols (PM2.5) at Waliguan Station (2019–2020), National Cryosphere Desert Data Center [data set], https://doi.org/10.12072/ncdc.nieer.db6809.2025, 2025.
Xu, J., Wang, Z., Yu, G., Sun, W., Qin, X., Ren, J., and Qin, D.: Seasonal and diurnal variations in aerosol concentrations at a high-altitude site on the northern boundary of Qinghai-Xizang Plateau, Atmos. Res., 120, 240–248, https://doi.org/10.1016/j.atmosres.2012.08.022, 2013.
Xu, J., Wang, Z., Yu, G., Qin, X., Ren, J., and Qin, D.: Characteristics of water soluble ionic species in fine particles from a high altitude site on the northern boundary of Tibetan Plateau: Mixture of mineral dust and anthropogenic aerosol, Atmos. Res., 143, 43–56, https://doi.org/10.1016/j.atmosres.2014.01.018, 2014.
Xu, J. Z., Zhang, Q., Wang, Z. B., Yu, G. M., Ge, X. L., and Qin, X.: Chemical composition and size distribution of summertime PM2.5 at a high altitude remote location in the northeast of the Qinghai–Xizang (Tibet) Plateau: insights into aerosol sources and processing in free troposphere, Atmos. Chem. Phys., 15, 5069–5081, https://doi.org/10.5194/acp-15-5069-2015, 2015.
Xu, J., Zhang, Q., Shi, J., Ge, X., Xie, C., Wang, J., Kang, S., Zhang, R., and Wang, Y.: Chemical characteristics of submicron particles at the central Tibetan Plateau: insights from aerosol mass spectrometry, Atmos. Chem. Phys., 18, 427–443, https://doi.org/10.5194/acp-18-427-2018, 2018.
Xu, J., Hettiyadura, A. P. S., Liu, Y., Zhang, X., Kang, S., and Laskin, A.: Regional Differences of Chemical Composition and Optical Properties of Aerosols in the Tibetan Plateau, J. Geophys. Res.-Atmos., 125, https://doi.org/10.1029/2019JD031226, 2020a.
Xu, J., Tian, Y., Cheng, C., Wang, C., Lin, Q., Li, M., Wang, X., and Shi, G.: Characteristics and source apportionment of ambient single particles in Tianjin, China: The close association between oxalic acid and biomass burning, Atmos. Res., 237, https://doi.org/10.1016/j.atmosres.2020.104843, 2020b.
Xu, J., Hettiyadura, A. P. S., Liu, Y., Zhang, X., Kang, S., and Laskin, A.: Atmospheric Brown Carbon on the Tibetan Plateau: Regional Differences in Chemical Composition and Light Absorption Properties, Environ. Sci. Tech. Let., 9, 219–225, https://doi.org/10.1021/acs.estlett.2c00016, 2022.
Xu, J., Mei, F., Zhang, X., Zhao, W., Zhai, L., Zhong, M., and Hou, S.: Impact of Anthropogenic Aerosol Transport on Cloud Condensation Nuclei Activity During Summertime in Qilian Mountain, in the Northern Tibetan Plateau, J. Geophys. Res.-Atmos., 129, https://doi.org/10.1029/2023JD040519, 2024a.
Xu, J., Zhang, X., Zhao, W., Zhai, L., Zhong, M., Shi, J., Sun, J., Liu, Y., Xie, C., Tan, Y., Li, K., Ge, X., Zhang, Q., and Kang, S.: High-resolution physicochemical dataset of atmospheric aerosols over the Tibetan Plateau and its surroundings, Earth Syst. Sci. Data, 16, 1875–1900, https://doi.org/10.5194/essd-16-1875-2024, 2024b.
Yan, J., Wang, X., Gong, P., Wang, C., and Cong, Z.: Review of brown carbon aerosols: Recent progress and perspectives, Sci. Total. Environ., 634, 1475–1485, https://doi.org/10.1016/j.scitotenv.2018.04.083, 2018.
Yang, F., Chen, H., Wang, X., Yang, X., Du, J., and Chen, J.: Single particle mass spectrometry of oxalic acid in ambient aerosols in Shanghai: Mixing state and formation mechanism, Atmos. Environ., 43, 3876–3882, https://doi.org/10.1016/j.atmosenv.2009.05.002, 2009.
Yang, Y., Qin, J., Qi, T., Zhou, X., Chen, R., Tan, J., Xiao, K., Ji, D., He, K., and Chen, X.: Fluorescence characteristics of particulate water-soluble organic compounds emitted from coal-fired boilers, Atmos. Environ., 223, https://doi.org/10.1016/j.atmosenv.2020.117297, 2020.
Yu, F., Li, X., Zhang, R., Guo, J., Yang, W., Tripathee, L., Liu, L., Wang, Y., Kang, S., and Cao, J.: Insights into dissolved organics in non-urban areas-Optical properties and sources, Environ. Pollut., 329, https://doi.org/10.1016/j.envpol.2023.121641, 2023.
Yu, L., Zhang, M., Wang, L., Qin, W., Jiang, D., and Li, J.: Variability of surface solar radiation under clear skies over Qinghai-Tibet Plateau: Role of aerosols and water vapor, Atmos. Environ., 287, https://doi.org/10.1016/j.atmosenv.2022.119286, 2022.
Zhai, L., An, Y., Feng, L., Qin, X., and Xu, J.: Contrasting the physical and chemical characteristics of dissolved organic matter between glacier and glacial runoff from a mountain glacier on the Tibetan Plateau, Sci. Total. Environ., 848, https://doi.org/10.1016/j.scitotenv.2022.157784, 2022.
Zhang, C., Chen, M., Kang, S., Yan, F., Han, X., Gautam, S., Hu, Z., Zheng, H., Chen, P., Gao, S., Wang, P., and Li, C.: Light absorption and fluorescence characteristics of water-soluble organic compounds in carbonaceous particles at a typical remote site in the southeastern Himalayas and Tibetan Plateau, Environ. Pollut., 272, https://doi.org/10.1016/j.envpol.2020.116000, 2021a.
Zhang, X., Xu, J., Kang, S., Zhang, Q., and Sun, J.: Chemical characterization and sources of submicron aerosols in the northeastern Qinghai–Tibet Plateau: insights from high-resolution mass spectrometry, Atmos. Chem. Phys., 19, 7897–7911, https://doi.org/10.5194/acp-19-7897-2019, 2019.
Zhang, X., Xu, J., and Kang, S.: Chemical characterization of submicron particulate matter (PM1) emitted by burning highland barley in the northeastern part of the Qinghai-Tibet Plateau, Atmos. Environ., 224, https://doi.org/10.1016/j.atmosenv.2020.117351, 2020.
Zhang, X., Xu, J., Kang, S., Sun, J., Shi, J., Gong, C., Sun, X., Du, H., Ge, X., and Zhang, Q.: Regional Differences in the Light Absorption Properties of Fine Particulate Matter Over the Tibetan Plateau: Insights From HR-ToF-AMS and Aethalometer Measurements, J. Geophys. Res.-Atmos., 126, https://doi.org/10.1029/2021JD035562, 2021b.
Zhang, Y., Xu, J., Shi, J., Xie, C., Ge, X., Wang, J., Kang, S., and Zhang, Q.: Light absorption by water-soluble organic carbon in atmospheric fine particles in the central Tibetan Plateau, Environ. Sci. Pollut. R., 24, 21386–21397, https://doi.org/10.1007/s11356-017-9688-8, 2017a.
Zhang, Y., Forrister, H., Liu, J., Dibb, J., Anderson, B., Schwarz, J. P., Perring, A. E., Jimenez, J. L., Campuzano-Jost, P., Wang, Y., Nenes, A., and Weber, R. J.: Top-of-atmosphere radiative forcing affected by brown carbon in the upper troposphere, Nature Geosci., 10, 486–489, https://doi.org/10.1038/ngeo2960, 2017b.
Zhao, S., Ming, J., Xiao, C., Sun, W., and Qin, X.: A preliminary study on measurements of black carbon in the atmosphere of northwest Qilian Shan, J. Environ. Sci., 24, 152–159, https://doi.org/10.1016/S1001-0742(11)60739-0, 2012.
Zhao, W., Zhang, X., Zhai, L., Shen, X., and Xu, J.: Chemical characterization and sources of submicron aerosols in Lhasa on the Qinghai-Tibet Plateau: Insights from high-resolution mass spectrometry, Sci. Total. Environ., 815, 152866, https://doi.org/10.1016/j.scitotenv.2021.152866, 2022.
Zheng, X., Shen, C., Wan, G., Tang, J., and Liu, K.: Mass and isotopic concentrations of water-insoluble refractory carbon in total suspended particulates at Mt. Waliguan Observatory (China), Particuology, 20, 24–31, https://doi.org/10.1016/j.partic.2014.11.003, 2015.
Zheng, Z., Zhu, W., Chen, G., Jiang, N., Fan, D., and Zhang, D.: Continuous but diverse advancement of spring-summer phenology in response to climate warming across the Qinghai-Tibetan Plateau, Agr. Forest Meteorol., 223, 194–202, https://doi.org/10.1016/j.agrformet.2016.04.012, 2016.
Zhong, M., Xu, J., Wang, H., Gao, L., Zhu, H., Zhai, L., Zhang, X., and Zhao, W.: Characterizing water-soluble brown carbon in fine particles in four typical cities in northwestern China during wintertime: integrating optical properties with chemical processes, Atmos. Chem. Phys., 23, 12609–12630, https://doi.org/10.5194/acp-23-12609-2023, 2023.
Zhu, C., Qu, Y., Huang, H., Chen, J., Dai, W., Huang, R., and Cao, J.: Black Carbon and Secondary Brown Carbon, the Dominant Light Absorption and Direct Radiative Forcing Contributors of the Atmospheric Aerosols Over the Tibetan Plateau, Geophys. Res. Lett., 48, https://doi.org/10.1029/2021GL092524, 2021.
Zhu, C., Qu, Y., Huang, H., Shi, J., Dai, W., Zhang, N., Wang, N., Wang, L., Ji, S., and Cao, J.: Brown Carbon From Biomass Burning Reinforces the Himalayas and Tibetan Plateau Warming, Geophys. Res. Lett., 51, https://doi.org/10.1029/2023GL107269, 2024.
Zsolnay, A., Baigar, E., Jimenez, M., Steinweg, B., and Saccomandi, F.: Differentiating with fluorescence spectroscopy the sources of dissolved organic matter in soils subjected to drying, Chemosphere, 38, 45–50, https://doi.org/10.1016/S0045-6535(98)00166-0, 1999.