the Creative Commons Attribution 4.0 License.
the Creative Commons Attribution 4.0 License.
 | 08 Oct 2025
Observed impacts of aerosol concentration on maritime tropical convection within constrained environments using airborne radiometer, radar, lidar, and dropsondes
Timothy J. Lang
Susan C. van den Heever
Richard A. Ferrare
Ousmane O. Sy
Lawrence D. Carey
Sundar A. Christopher
John R. Mecikalski
Sean W. Freeman
George Alexander Sokolowsky
Chris A. Hostetler
Simone Tanelli
Aerosol modulation of atmospheric convection remains an important topic in ongoing research. A key challenge in evaluating aerosol impacts on cumulus convection is isolating their effects from environmental influences. This work investigates aerosol effects on maritime tropical convection using airborne observations from NASA's Cloud, Aerosol and Monsoon Processes Philippines Experiment (CAMP2Ex). Eight environmental parameters with known physical connections to cloud and storm formation were identified from dropsonde data, and 92 dropsondes were matched with corresponding CAMP2Ex flight “scenes.” To constrain environmental conditions, scenes were binned based on their association with “low,” “medium,” or “high” values for each dropsonde-derived parameter. In each scene and environmental bin, eight radar- and radiometer-based parameters with physical implications for convective intensity and/or prevalence were correlated with lidar-derived aerosol concentrations to examine trends in convective characteristics under different aerosol conditions. Threshold values used to stratify the environments were varied across four sensitivity tests to examine how the convective–aerosol correlations within each environmental bin responded. The results were generally inconclusive, with relatively weak correlations observed with limited statistical significance in many cases. Some interesting and potentially impactful comparisons identified in the convective–aerosol analyses support the idea of warm-phase convective invigoration trends and suggest that higher aerosol concentrations were correlated with stronger and/or more-prevalent convection in some cases, while other cases saw a “Goldilocks” zone of medium aerosol concentration favoring enhanced convection. Our results also stress the importance of considering environmental conditions when evaluating aerosol impacts.
- Article
(7003 KB) - Full-text XML
-
Supplement
(6055 KB) - BibTeX
- EndNote


The primary purpose of this study is to explore potential impacts of aerosol concentration on maritime tropical convection during NASA's Cloud, Aerosol and Monsoon Processes Philippines Experiment (CAMP2Ex) from a remote-sensing perspective while considering adjacent environmental conditions. Aerosol influences on convection have been a significant research topic and, as detailed further in Sect. 2, were one of the main science foci of CAMP2Ex. These aerosol effects impact other meteorological phenomena and have broader consequences for society and therefore warrant considerable research attention. However, as we describe throughout this section, isolating aerosol impacts on convection from those of other (e.g., environmental) effects is challenging and requires additional study, despite the wide range of past works that have investigated this topic in detail.
Increased aerosol concentration is generally associated with increased cloud condensation nuclei, with aerosol size distribution influencing cloud particle size distribution (Junge and McLaren, 1971). In shallow clouds, the second indirect effect of aerosols describes a decrease in precipitation formation and an increase in cloud lifetime (Albrecht, 1989) resulting from reduced cloud droplet sizes due to increased competition for water vapor (e.g., Rosenfeld and Lensky, 1998; Sherwood, 2002). However, precipitation-sized hydrometeors that form in higher aerosol concentrations may be larger, owing to ample cloud droplets available for collection and droplet growth (e.g., Stroud et al., 2007; Altaratz et al., 2008; Saleeby et al., 2010). These changes in cloud coverage and precipitation reaching the surface can have a profound impact on the total radiative forcing in the atmosphere (e.g., Sokolowsky et al., 2022) and direct consequences on society (e.g., modulation of local rainfall patterns; Berg et al., 2008).
Many research efforts have explored aerosol invigoration of tropical convection (i.e., increases in updraft velocity), including the studies and formative discussions by Andreae et al. (2004) and Rosenfeld et al. (2008) regarding positive and detrimental impacts of aerosols on convection. A key factor in evaluating these aerosol impacts is considering whether their strongest influences are realized in regions where condensational latent heat release is most profound below the environmental 0 °C level (i.e., warm-phase invigoration) or in regions where latent heat release via freezing occurs above the environmental 0 °C level (i.e., cold-phase invigoration) instantaneously during storm development (e.g., Igel and van den Heever, 2021). Warm-phase invigoration (Andreae et al., 2004) depends on the finite supersaturation within a cloud's updraft; if this supersaturation is in a quasi-equilibrium state, the rate of condensation onto available aerosols will depend only on the updraft's velocity (Grabowski and Morrison, 2020). As a result, if the concentration of cloud droplets increases, the quasi-equilibrium supersaturation decreases, leading to an increase in buoyancy, updraft velocity, and condensation rate within the cloud (Grabowski and Morrison, 2020). Cold-phase invigoration (Rosenfeld et al., 2008) depends on the off-loading of frozen precipitation aloft in the cloud, since latent heat release from freezing will only balance the mass loading of any liquid hydrometeors lofted above the environmental 0 °C level, and any buoyancy increases owing to the formation and fallout of precipitation will probably be negligible (Grabowski and Morrison, 2020).
Potential impacts from hypothesized warm-phase and cold-phase aerosol invigoration of convection have received mixed results in prior observational and numerical modeling studies. Regarding warm-phase invigoration, van den Heever et al. (2006) noted stronger updrafts associated with higher aerosol concentrations within a variety of aerosol profiles in their simulations. Likewise, Sheffield et al. (2015) used modeling data to explain how enhanced aerosol concentrations can increase cloud water content and produce more-vigorous updrafts via latent heat of condensation. Simulations in Marinescu et al. (2021) indicated a 5 %–15 % increase in mean updraft velocity around 4–7 km above ground level (a.g.l.) when cloud condensation nuclei concentrations were relatively high. The observational study by Lin et al. (2006) found enhancements in cloud height and cloud cover associated with increased aerosol concentrations in the Amazon. Likewise, Fan et al. (2018) observed increases in convective strength owing to the activation of additional cloud condensation nuclei in regions with high concentrations of ultrafine aerosols in the Amazon. Using a combination of observations and simulations, Zhang et al. (2023) described how fine aerosols enhance convection, which, in turn, modulates the surrounding environment and feeds back into larger-scale atmospheric circulations. Numerical simulations have also suggested that smaller cloud droplets associated with higher aerosol concentrations may enhance updraft/convective intensity via increased latent heat released during freezing and enhanced depositional growth above the environmental 0 °C level (e.g., van den Heever and Cotton, 2007; Rosenfeld et al., 2008) in association with cold-phase invigoration. However, other modeling results have demonstrated that convective intensity increases are primarily driven by low-level condensational heating, rather than freezing above the environmental 0 °C level (Igel and van den Heever, 2021; Cotton and Walko, 2021), further indicating the importance of evaluating aerosol concentrations within/around warm-phase regions.
In contrast, other studies (e.g., Grabowski and Morrison, 2016, 2020; Varble et al., 2023) have presented evidence that increased aerosol concentrations do not invigorate convection above the environmental freezing level but may do so below the environmental freezing level. As mentioned previously, the former results from increased positive buoyancy, via enhanced latent heat of freezing, being offset by increased negative buoyancy, via mass loading from a greater liquid water content being lofted above the environmental freezing level (Grabowski and Morrison, 2020), while the latter results from higher aerosol concentrations leading to lower supersaturation values within the surrounding environment and increased buoyancy, which in turn lead to higher updraft velocities and enhanced latent heating associated with increased condensation (e.g., Grabowski and Morrison, 2017, 2020). The results of Öktem et al. (2023) appear to contradict the study by Fan et al. (2018) by explaining how they identified no statistically significant relationship between aerosol concentration and convective intensity. Therefore, the role of enhanced aerosol concentrations on updraft velocity can strongly depend on whether they are within regions wherein warm-phase or cold-phase processes dominate.
Many studies have also identified situations where higher aerosol concentrations may be detrimental for convection. For instance, entrainment of relatively dry environmental air may cause rapid evaporation of smaller cloud droplets associated with higher aerosol concentrations, decreasing cloud/storm structure (e.g., Liu et al., 2016). Veals et al. (2022) noted a tendency for weaker convection in the presence of higher aerosol concentrations in central Argentina. This raises several questions about the true impact of increased aerosol concentrations on convection and motivates our study herein. These differing results from past studies also indicate that a “Goldilocks” zone of medium aerosol concentration may favor the strongest convection (e.g., Sokolowsky et al., 2022). Further, other works have discussed considerable difficulty in separating aerosol influences from atmospheric dynamics (e.g., Grabowski, 2018). Limitations in past numerical and observational studies are summarized by Varble et al. (2023), who highlight the continued uncertainty surrounding aerosol impacts on convection; this further motivates our study.
Direct measurements of updraft vertical velocity allow for quantitative assessment of convective intensity. However, numerous remote-sensing metrics serve as indirect indicators of convective intensity; these metrics and the implied microphysical processes related to convective intensity will be the primary focus of this study, as outlined further in the next paragraph. All else being equal, as an updraft fuels vertical development within a warm-phase cloud, continued condensation onto available cloud condensation nuclei will increase cloud liquid water content and lead to the formation and growth of precipitation-size hydrometeors (e.g., via collision-coalescence). These increases in hydrometeor concentration and, especially, mean hydrometeor diameter within a given cloud particle size distribution can be identified by increases in equivalent radar reflectivity factor (ZH) over the same region (Rinehart, 2010). Likewise, increased emission from these warm-phase hydrometeors will lead to increases in radiometer-retrieved brightness temperature (Tb) values (e.g., Spencer et al., 1994). If updraft velocity increases, these cloud and precipitation processes and their appearances within remote-sensing products will likewise be enhanced (again, all else being equal). Additional hydrometeor formation and growth can also occur in the cold-phase region as vertical cloud development continues. As a result, increases in selected radar- and radiometer-derived products like ZH and Tb can serve as indirect indicators of convective intensity.
The primary science question we address herein is as follows: How do radiometer- and radar-based proxies of storm intensity (“intensity” referring to peak updraft velocity) and prevalence vary with lidar-based observations of aerosol concentration when binned into similar environmental groups throughout CAMP2Ex? It should be noted that we evaluate these metrics as indicators of storm intensity but updraft vertical velocity is not specifically calculated in this study. The results of these analyses are important as they provide insight into science questions for a major NASA field campaign, have relevance to upcoming NASA missions (e.g., Atmosphere Observing System; AOS, 2022), and contribute knowledge to long-standing questions of aerosol influences on convection. We hypothesized that integrated cloud liquid water path (CLW), peak ZH, peak Ku-/Ka-band radar dual-frequency ratio (DFR), and abundance of ZH observations ≥30 dBZ in a given scene would all increase under higher aerosol concentrations within an environmental group. These hypotheses were based on expectations that increased aerosol concentrations would favor development of smaller and more-numerous cloud droplets, invigorating convection and enhancing CLW, while the presence of fewer but larger raindrops would increase maximum ZH and overall presence of ZH≥30 dBZ, along with greater Ka-band attenuation compared with Ku band (i.e., increased maximum DFR), further indicating enhanced convection. In addition, we hypothesized that radar- and radiometer-based metrics of storm intensity and prevalence would all increase within more-favorable environments, as revisited at the end of Sect. 2, though this investigation is secondary to our aerosol analyses. That is, given the environmental stratification methods employed as discussed in the next section, our focus was primarily on correlations between convective and aerosol metrics and secondarily on convective patterns associated with environmental variations. However, in each of these analyses, it is essential to note that correlation does not necessarily indicate causality, as a correlation between two variables may exist entirely due to indirect effects (e.g., Lin et al., 2006). In addition, it must be acknowledged that these radar- and radiometer-based metrics of convective intensity may vary due to factors not specifically owing to changes in peak updraft intensity (e.g., cloud microphysics; Varble et al., 2023). Despite these and other inherent difficulties, limitations, and uncertainties associated with separating aerosol and environmental influences on convection (e.g., Grabowski, 2018; Varble, 2018), the results herein provide important insight regarding observations of aerosol influences on radar- and radiometer-based indicators of convective intensity. Additionally, potential trends found in the CAMP2Ex dataset could provide useful information to support future work. Section 2 covers the data and methods used, with Sects. 3 and 4 highlighting environmental stratification and aerosol analyses from the microwave-frequency datasets. Section 5 presents a summary, discussion of limitations, and suggestions for future work.
This section opens with a brief overview of the CAMP2Ex field campaign followed by a description of the employed datasets and their uncertainties. The methods used in our analyses of environmental, convective, and aerosol parameters are discussed thereafter.
2.1 CAMP2Ex
The CAMP2Ex field phase occurred during 25 August–10 October 2019, with NASA's P-3B Orion (P-3) aircraft conducting 19 science flights and the Stratton Park Engineering Company Learjet aircraft conducting 13 science flights out of Clark International Airport in the Philippines (Reid et al., 2023). The primary goal of CAMP2Ex was to evaluate the role of aerosols within Southeast Asia's monsoon systems by simultaneously examining aerosol characteristics alongside cloud and radiation properties (Reid et al., 2023). Twelve P-3 science flights were associated with southwest monsoon conditions and seven were associated with the northeast monsoon within the Maritime Continent (Reid et al., 2023). A broad range of environmental, radiation, and aerosol conditions were observed throughout CAMP2Ex, along with numerous cloud types (i.e., shallow cumulus, congestus, and altostratus clouds) and convective organization (e.g., isolated convection and squall lines). Collected data included in situ and remote-sensing datasets from the two aforementioned aircraft along with ground-based and ship-based observation platforms, in addition to several numerical simulations. As discussed in the next section, our study primarily uses P-3 in situ and remote-sensing data and falls under the CAMP2Ex science question “To what extent are aerosol particles responsible for modulating warm and mixed-phase precipitation in tropical environments?”, while also having direct implications for impacts on deeper convection and cloud meteorology (ESPO, 2020; Reid et al., 2023).
2.2 Datasets and their uncertainties
Key P-3 instruments for this study include the Advanced Microwave Precipitation Radiometer (AMPR; Spencer et al., 1994; Amiot et al., 2021), Airborne Precipitation and cloud Radar 3rd Generation (APR-3; Durden et al., 2020b), High Spectral Resolution Lidar 2 (HSRL2; Burton et al., 2016), and Advanced Vertical Atmospheric Profiling System (AVAPS; Hock and Young, 2017). All AMPR, APR-3, AVAPS, and HSRL2 data were gathered from the CAMP2Ex data repository (Aknan and Chen, 2020). Due to direct correlations between cloud condensation nuclei concentration and lidar extinction (Ext), backscatter (Bsc), and aerosol optical thickness (AOT), all three parameters were analyzed from HSRL2's 355 and 532 nm channels, which employ the HSRL technique (Hair et al., 2008), though 532 nm backscatter was of particular interest, based on discussions in Lenhardt et al. (2022). AMPR, APR-3, and AVAPS data quality control processes outlined in Amiot (2023) were applied for this study, including AMPR's multiple data flags. As detailed in Lang et al. (2021), AMPR data were masked if P-3 pitch or roll magnitude was ≥2°, AMPR was in nadir-stare mode, P-3 GPS altitude was <3 km, the given AMPR scan included at least 1 pixel over land, and/or precipitation was present. Further, as discussed in Amiot (2023), 10 APR-3 files were removed due to high levels of noise, three dropsondes were excluded due to lack of corresponding AMPR data, and seven dropsondes were removed during data quality control (e.g., due to lack of recorded near-surface winds). Additionally, starting with the initial 144 dropsondes examined in Amiot (2023), a test was performed herein to determine whether each dropsonde passed through cloud. Given the 3 % uncertainty in AVAPS relative humidity (Freeman et al., 2020), any dropsonde with relative humidity >97 % during more than 20 % of its profile was removed from the analysis; this totaled five dropsondes. HSRL2 data were screened for clouds (Hostetler, 2020) to avoid potential contamination of the aerosol analyses (e.g., Liu et al., 2016). Uncertainty values associated with each instrument were deemed negligible for this study. More specifically, AMPR's CLW root-mean-square deviation and median absolute deviation are both of the order of (Amiot, 2023) and AMPR's noise-equivalent differential temperature is 0.5–1.0 K (Amiot et al., 2021). APR-3's Ku-band (Ka-band) calibration uncertainty is roughly 1 dB (1.5 dB) (Durden et al., 2020b). Uncertainties in AVAPS's temperature, relative humidity, and pressure measurements are 0.2 °C, 3 %, and 0.5 hPa, respectively (Freeman et al., 2020). Under typical conditions, the total systematic error for HSRL2's 532 nm extinction coefficient is estimated to be , which is within the typical state-of-the-art systematic error at visible wavelengths (Schmid et al., 2006; Rogers et al., 2009). Overall systematic error for HSRL2 backscatter calibration is estimated to be <3 %, and random errors for all aerosol products are typically <10 % for the backscatter and depolarization ratios (Hair et al., 2008; Ferrare et al., 2023).
2.3 Environmental, convective, and aerosol parameters
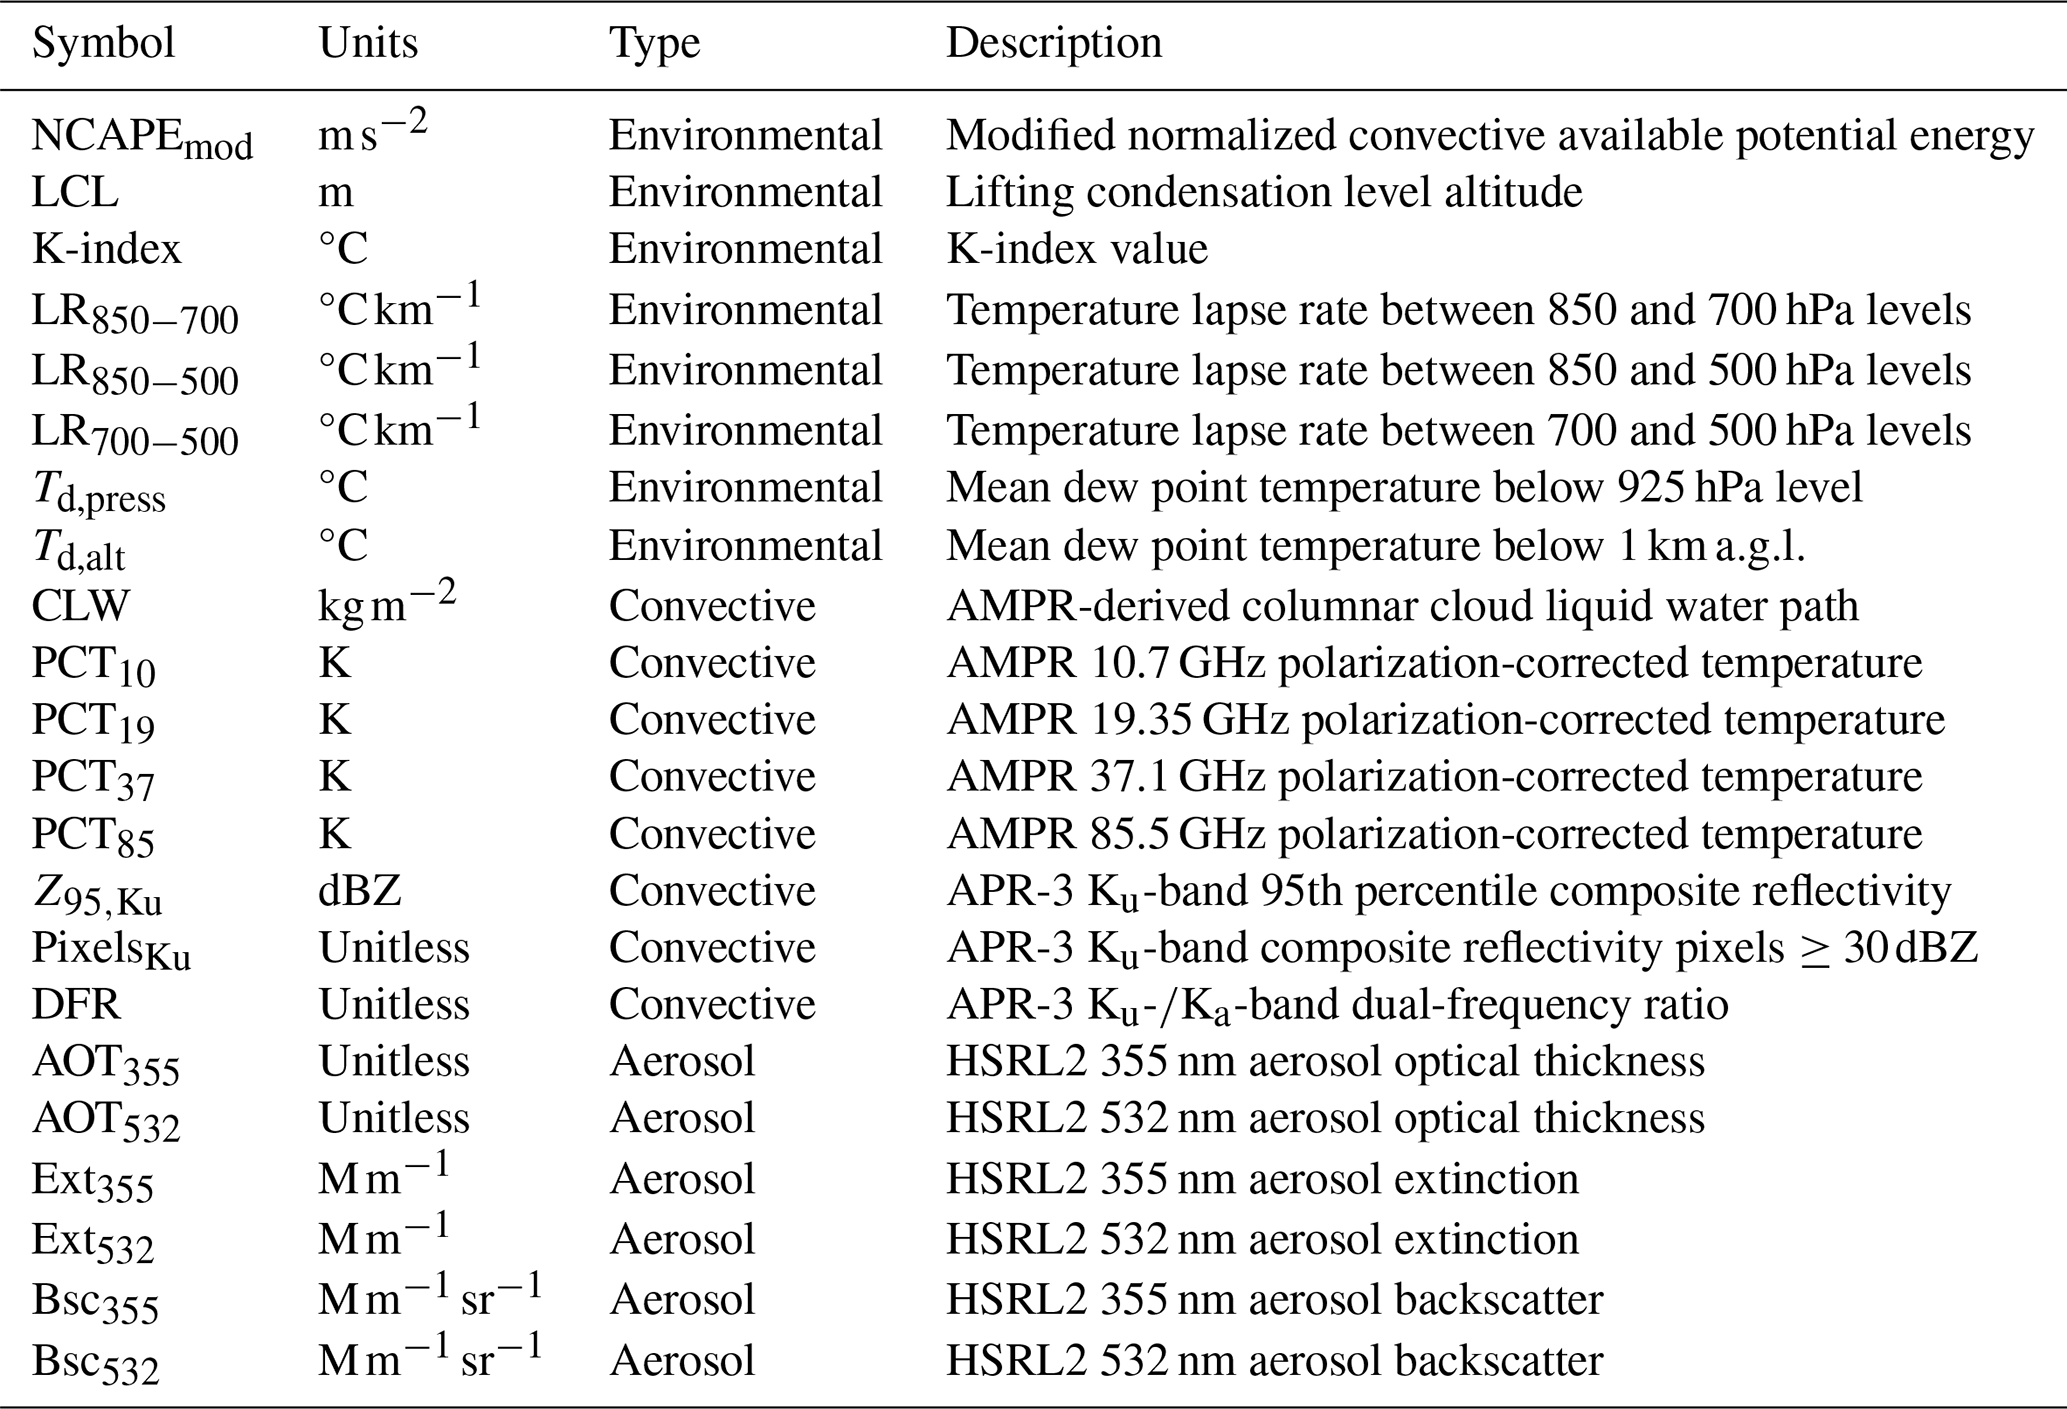
Eight environmental parameters with known physical connections to convective intensity were subjectively chosen for this study, based on their ability to be fully captured by a statistically significant number of CAMP2Ex dropsondes. The eight selected parameters were modified normalized (described next) convective available potential energy (CAPE); lifting condensation level (LCL) altitude; K-index; 850–700, 850–500, and 700–500 hPa temperature lapse rate (hereafter simply “lapse rate”, LR); mean dew point temperature (Td) below the 925 hPa level; and mean Td below 1 km a.g.l. These are hereafter referred to by their symbols in Table 1 and discussed in more detail next.
A significant challenge in evaluating aerosol impacts on convection is isolating aerosol influences from other sources of convection modulation, such as atmospheric dynamics, thermodynamics, and cloud microphysical processes (e.g., Liu et al., 2016; Grabowski, 2018). Since a given convective plume will be affected by synoptic-scale (>2000 km), mesoscale (2–2000 km), and sub-mesoscale (<2 km) dynamics (Orlanski, 1975) and environmental conditions, it is important to understand and constrain environmental conditions associated with any convective element (herein, “storm”) of interest. Studies have demonstrated the utility of radiosonde data, the principles of which can be applied to dropsondes (e.g., AVAPS) to the extent offered by dropsonde launch altitude, in evaluating environmental factors with physical connections to convection. CAPE is a measure of parcel buoyancy that can be used to diagnose potential updraft velocity. However, since CAPE is related to integrated buoyancy between the level of free convection and equilibrium level, an issue arises in computing CAPE from AVAPS during CAMP2Ex; since the P-3 did not fly above the equilibrium level during any science flight, the dropsondes did not capture the full vertical buoyancy profile associated with traditional CAPE. As such, the term “modified CAPE” is used herein and is defined mathematically as
where g is gravitational acceleration; Tv and Tv,0 are parcel and environmental virtual temperatures, respectively; z is altitude; zlfc is level of free convection; and zP3 is P-3 altitude (Markowski and Richardson, 2010). With this definition, modified CAPE would be less than true CAPE within the same environment, which limits evaluation of parcel buoyancy. Since dropsondes were often launched when P-3 altitude was (Vömel et al., 2020), the instability indicated by modified CAPE can be compared across the environments. Despite this, P-3 altitude would have a direct effect on modified CAPE calculated via Eq. (1), with lower altitude (e.g., around 4 km a.g.l.) biased toward lower modified CAPE by virtue of the dropsonde capturing less vertical extent of the parcel buoyancy. To mitigate this effect, we normalized CAPE via dividing by dropsonde launch altitude, which yields (modified) normalized CAPE (Blanchard, 1998) via the relation
where z is dropsonde launch altitude. Units of NCAPEmod are meters per second squared (Eq. 2), allowing for direct evaluation of vertical acceleration over the dropsonde layer (Blanchard, 1998).
Table 1Symbols used to represent the environmental, convective, and aerosol variables examined in this study, along with their units and a brief description of each variable.
LCL altitude indicates cloud-base height and is often used in forecasting convection (Markowski and Richardson, 2010), though LCL altitude influence on convective intensity is debated in the literature (e.g., Mulholland et al., 2021; Grabowski, 2023). All CAPE and LCL values were calculated using functions within the Python programming language (i.e., May et al., 2022), as noted in the data availability statement. The K-index is used to forecast convective potential/prevalence (i.e., not intensity) and is defined as
where T850, T700, and T500 are temperatures at the 850, 700, and 500 hPa levels, respectively, and Td,850 and Td,700 are dew point temperatures at the 850 and 700 hPa levels, respectively (George, 1960). From Eq. (3), K-index considers: (1) low-to-mid-level LR, (2) low-level Td, and (3) mid-level Td depression, with the former two (latter one) being directly (inversely) related to convective potential. The K-index was calculated semi-manually by identifying the pressure array elements nearest the 850, 700, and 500 hPa levels, extracting the associated T and/or Td values from these elements, and utilizing Eq. (3). Similarly, temperature and altitude values from array elements nearest the 850, 700, and 500 hPa levels were used to calculate LR850−700, LR850−500, and LR700−500:
where Tupper and Tlower are temperatures at the higher and lower altitudes, respectively, and zupper and zlower are the higher and lower altitudes, respectively. In addition to 850–500 hPa, 700–500 hPa LR can be an excellent indicator of convective potential (e.g., Sherburn and Parker, 2014). Others (e.g., Wang et al., 2015) have used 850–700 hPa LR in forecasting convective potential due to its association with parcel vertical acceleration in the lower atmosphere. Lastly, low-level Td is important for convective intensity due to entrainment of relatively high-water-vapor air into an updraft's base (e.g., Lucas et al., 2000). Mean low-level Td values were calculated by finding array elements where (1) pressure was >925 hPa or (2) altitude was and calculating mean Td in the associated array elements.
We utilize microwave remote-sensing signatures from radar and radiometry to evaluate convective intensity and prevalence. The 30 dBZ ZH isoline is often used to identify precipitation regions (e.g., Straka et al., 2000) and delineate different “storms” or “cells” (e.g., Johnson et al., 1998; Hastings and Richardson, 2016; Amiot et al., 2019). As precipitation-sized hydrometeors form and grow, ZH increases due to hydrometeor diameter weighting to the sixth power, associated with Rayleigh scattering, with eventual onset of non-Rayleigh resonance effects for larger hydrometeor diameters relative to the radar wavelength (Rinehart, 2010). This is especially important to note at finer wavelengths, such as 2.2 and 0.84 cm, associated with APR-3's Ku and Ka bands, respectively (Durden et al., 2020b), the primary radar dataset used herein. A combination of Ku- and Ka-band radar data can be powerful when evaluated using DFR:
where ZKu and ZKa represent ZH at Ku and Ka band, respectively, on a logarithmic scale (i.e., expressed in dBZ) (e.g., Liao et al., 2008; Liao and Meneghini, 2011). In regions with similar ZKu and ZKa (e.g., near 0 dBZ for hydrometeors in the Rayleigh scattering regime at both frequencies), DFR will be near 0; however, DFR departures from 0 dBZ can indicate differences in attenuation between the two frequencies and can be used to infer hydrometeor size and phase (e.g., Liao and Meneghini, 2011). As Ku-band ZH increases, DFR in rain regions generally becomes slightly negative (i.e., −1 to 0) before increasing to positive values for ZH>30 dBZ; in regions of ice hydrometeors, DFR generally increases with increasing Ku-band ZH (Eq. 5), with a steeper increase occurring for lower-density ice hydrometeors (Liao and Meneghini, 2011). In our study, DFR values or >15 were masked to avoid regions where Ku- or Ka-band data were severely attenuated (e.g., Durden et al., 2020a).
Microwave radiometers generally retrieve higher Tb values at increasingly lower frequencies as precipitation hydrometeors grow in the absence of ice formation aloft (e.g., Spencer et al., 1994). This makes it possible to retrieve cloud and precipitation properties using Tb combinations (e.g., Wilheit and Chang, 1980; Wentz and Spencer, 1998; Hong and Shin, 2013; Amiot et al., 2021). AMPR's CLW retrievals often fail within precipitation regions; thus, as a cloud grows vertically, AMPR-derived CLW is expected to increase until it fails in moderate-to-heavy precipitation (Amiot et al., 2021; Amiot, 2023). Because of this, we focus more on AMPR polarization-corrected temperature (PCT) in Sect. 3 than CLW, though a similar CLW analysis is included in the Supplement. However, CLW increasing around precipitation may yield useful information about the associated convective intensity; for example, precipitation is often associated with cumulus clouds at least 1.5–2 km tall (Smalley and Rapp, 2020) and may indicate precipitation formation within these clouds (e.g., Jiang and Zipser, 2006).
A valuable remote-sensing instrument employed in aerosol analyses is lidar, including HSRL2 for CAMP2Ex (Hostetler, 2020; Reid et al., 2023; Ferrare et al., 2023). HSRL2 measures aerosol backscatter and depolarization ratio at 355, 532, and 1064 nm, with aerosol extinction and AOT also measured using the HSRL2 technique at 355 and 532 nm (Hostetler, 2020). Integration for calculating AOT occurs over a vertical distance starting near the surface and ending at the top of the aerosol extinction profile, which is often around 5–6 km a.g.l. when deployed from the P-3. The top altitude is typically ≈1.5 km below aircraft altitude. Lenhardt et al. (2022) and Redemann and Gao (2024) demonstrated how HSRL2's extinction and backscatter coefficients, especially at 532 nm, have strong direct correlations with cloud condensation nuclei concentrations. Additional studies (e.g., Liu et al., 2016) noted direct correlations between lidar-based AOT and cloud condensation nuclei concentration. Therefore, extinction, backscatter, and AOT may all be considered when examining aerosol concentration. However, the height/location of an aerosol layer, which can be obtained from extinction and/or backscatter, is important to consider when evaluating diabatic heating from radiation absorption (e.g., Chand et al., 2009; Redemann et al., 2021).
2.4 Data matching in CAMP2Ex scenes
Once the environmental parameters were calculated from each dropsonde throughout CAMP2Ex P-3 science flights 05–19, they were matched spatiotemporally with APR-3, AMPR, and HSRL2 data. AMPR was inoperable during science flight 01 and had un-optimized settings for its gain and offset values during science flights 02–04 (Lang et al., 2021). A 10 min “scene” was established for each dropsonde, covering ±5 min from dropsonde launch time. The APR-3 scans nearest the start and end of each scene were identified and, to account for situations where radar data collection began shortly before or after the start and/or end time of a given scene (e.g., P-3 was turning at the calculated start or end time), a grace of ±1 min (i.e., 10 % uncertainty) was allowed for scene duration. Scenes where the time difference between the APR-3 scans nearest the start and end of the scene was <9 or >11 min (e.g., due to significant aircraft maneuvers at the start and/or end of the scene) were masked from the analysis; these amounted to 47 dropsondes. Removing these 47 dropsondes and the 5 dropsondes identified during the relative humidity analysis resulted in 92 dropsondes being retained for our study. Infrequently, applying the data masks discussed in Sect. 2.2 also resulted in all AMPR and/or APR-3 data being masked in a given scene. The AMPR, APR-3, and HSRL2 scans nearest the start and end times of each scene were noted and these datasets were examined over the same approximate period within each scene. An example scene is provided in Fig. 1.
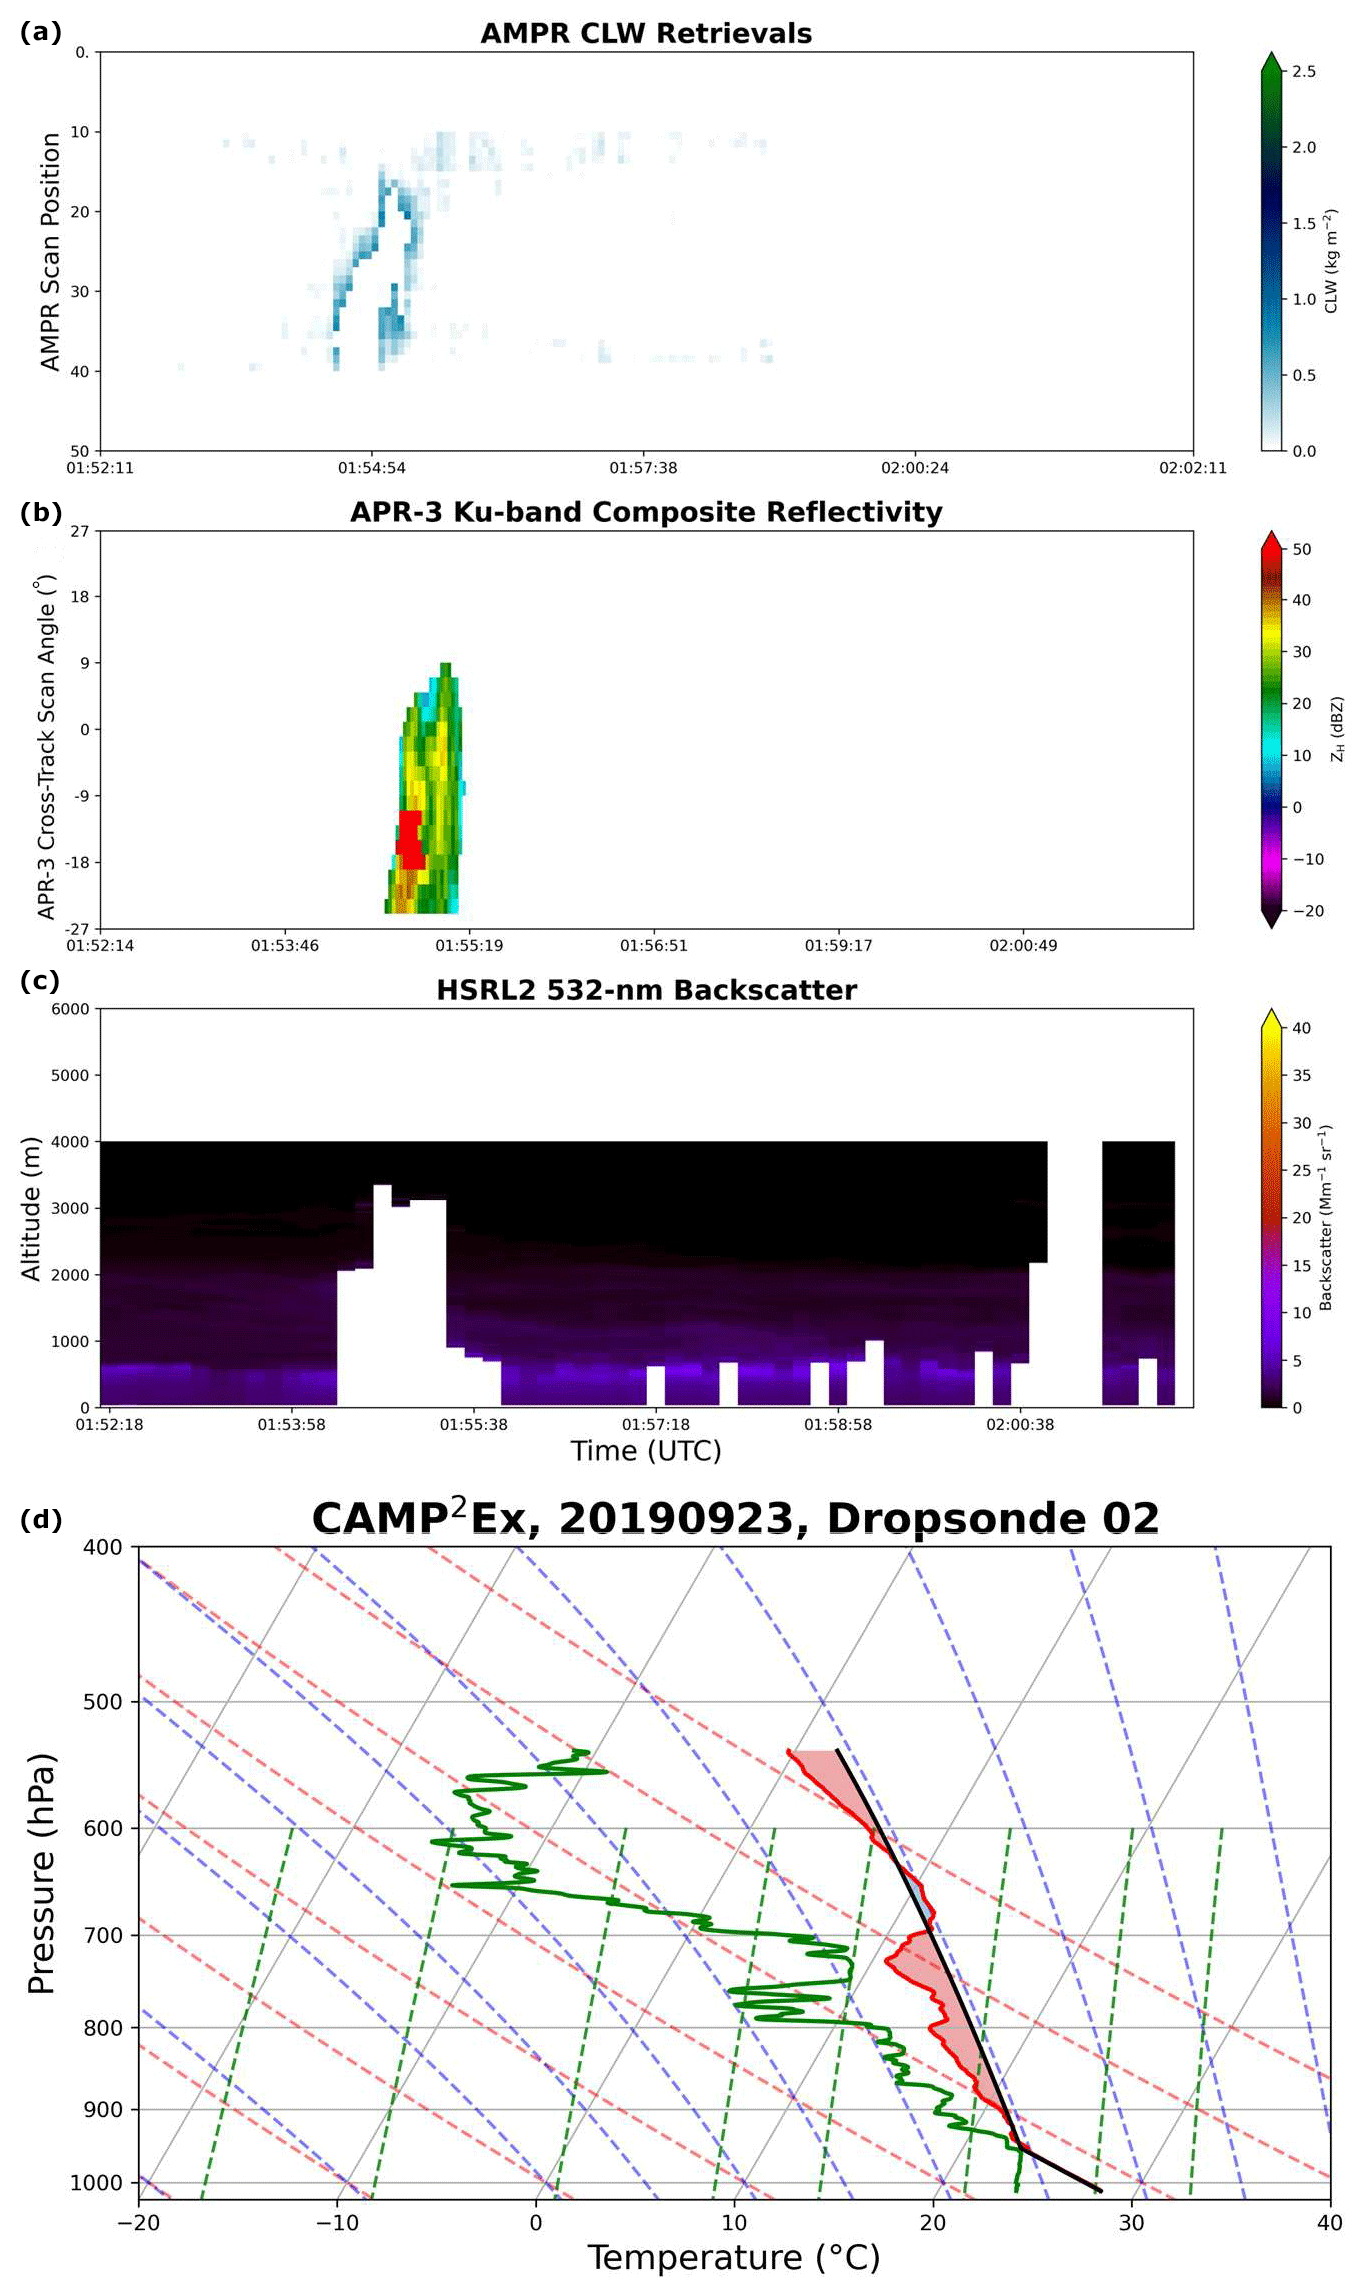
Figure 1Strip charts (i.e., top-view time series) of (a) AMPR CLW and (b) APR-3 Ku-band composite ZH, along with (c) time-height plot of HSRL2 532 nm backscatter during approximately 01:52 to 02:02 UTC on 24 September 2019 (23 September 2019 flight date based on takeoff time), which cover the “scene” associated with the dropsonde launched at 01:57:15 UTC, shown in (d) the skew T–log P diagram. All AMPR data flags have been applied in the top panel. Red shading in the bottom panel indicates CAPE, while solid red, green, and black lines denote temperature, dew point temperature, and parcel temperature, respectively.
Eight remote-sensing parameters related to convective intensity and/or prevalence were calculated in each scene, hereafter referred to by their symbols in Table 1: 95th percentile (p95) of AMPR PCT at 10.7, 19.35, 37.1, and 85.5 GHz; p95 of AMPR CLW; p95 of APR-3 Ku-band composite ZH (Z95,Ku); p95 of DFR; and number of APR-3 Ku-band composite ZH pixels ≥30 dBZ (PixelsKu). The p95 values were used for the former seven parameters due to their direct association with peak convective intensity (e.g., increased raindrop size and radar reflectivity with stronger updraft, all else being equal; e.g., Kollias et al., 2001), with the 95th percentile employed to avoid potential outliers associated with maximum values. The Ku band was used for composite ZH analyses, given its reduced attenuation compared with the Ka band over the same distance (all else being equal). To calculate composite ZH, data quality control described in Amiot (2023) was applied to all APR-3 scan angles in each scene. Within each column of quality-controlled APR-3 data, maximum ZH between the P-3 altitude and the surface was recorded as composite ZH. Occasional residual near-surface range/sidelobe effects at off-nadir scan angles were noted, which often manifested as very high composite ZH (i.e., >70 dBZ). As a basic restriction, all composite ZH pixels >70 dBZ were excluded from our analyses but some erroneous pixels may still reside in the final dataset (e.g., isolated cases with noisy pixels and/or near-surface range-/sidelobe effects with ZH<70 dBZ). Once all composite ZH values were calculated, Z95,Ku, DFR, and PixelsKu were recorded in each scene. AMPR PCT values were calculated following the methods of Cecil and Chronis (2018), with their methods for 89.0 GHz data applied directly to AMPR's 85.5 GHz data. AMPR's precipitation mask (Sect. 2.2) was not applied to PCT data. The p95 PCT in each AMPR channel was recorded along with p95 of AMPR CLW in each scene.
2.5 Environmental stratification and sensitivity testing
To begin isolating potential aerosol influences on tropical convection, two steps were employed: (1) binning environmental scenes into different groups, based on a particular AVAPS parameter and magnitude, and (2) incorporating HSRL2 data in this analysis. The AVAPS parameters, which are the eight “environmental” parameters in Table 1, were utilized. To stratify each environment, a single AVAPS parameter was separated into “low,” “medium,” and “high” values, and each scene was grouped into one of these categories based on the associated dropsonde's values. Within each environmental bin, the eight convective parameters (Table 1) were compared against mean values of the six HSRL2 parameters, which are the “aerosol” parameters in Table 1, from each scene. The main statistics examined were Pearson correlation coefficients, number of data points used in each comparison, and statistical significance, primarily based on whether the p value associated with the Pearson correlation coefficient was <0.01 (e.g., Wilks, 2011). A few subjectively selected correlations were examined in greater detail using scatterplots, wherein the number of data points varied from plot to plot, due to variations in missing data (e.g., dropsonde launched below the 500 hPa level for any parameters that use 500 hPa data).
To further mitigate potential impacts of any outliers, a bootstrapping approach was utilized when examining the Pearson correlation coefficient, number of data points, and p value in each convective–aerosol parameter pairing within each bin for each environmental parameter. To apply the bootstrapping method, 10 % of the convective–aerosol data pairs were withheld randomly before calculating the Pearson correlation coefficient and associated p value for the remaining data points. This process was repeated 1000 times for each convective–aerosol pairing, and mean values of the Pearson correlation coefficients, number of data points, and p values were calculated; these mean values will be reported throughout Sects. 3 and 4. Though 1000 was often much greater than the number of unique combinations possible for a given data pairing, 1000 resamples for a bootstrapping approach are common in the literature and were applied uniformly across all data pairs in this study. Comparisons involving sample sizes <10 were unchanged by this approach of withholding 10 % of the dataset since the remaining sample size was rounded up to the nearest whole integer, which always returned the original number of data points if the sample size was <10.
Table 2The four sensitivity tests that were performed to stratify the eight AVAPS parameters into “low,” “medium,” and “high” bins. The listed values in each bracket represent the inclusive range of the “medium” bin for the respective parameter and test; that is, values less (greater) than the lower (upper) limit were classified into the “low” (“high”) bin.
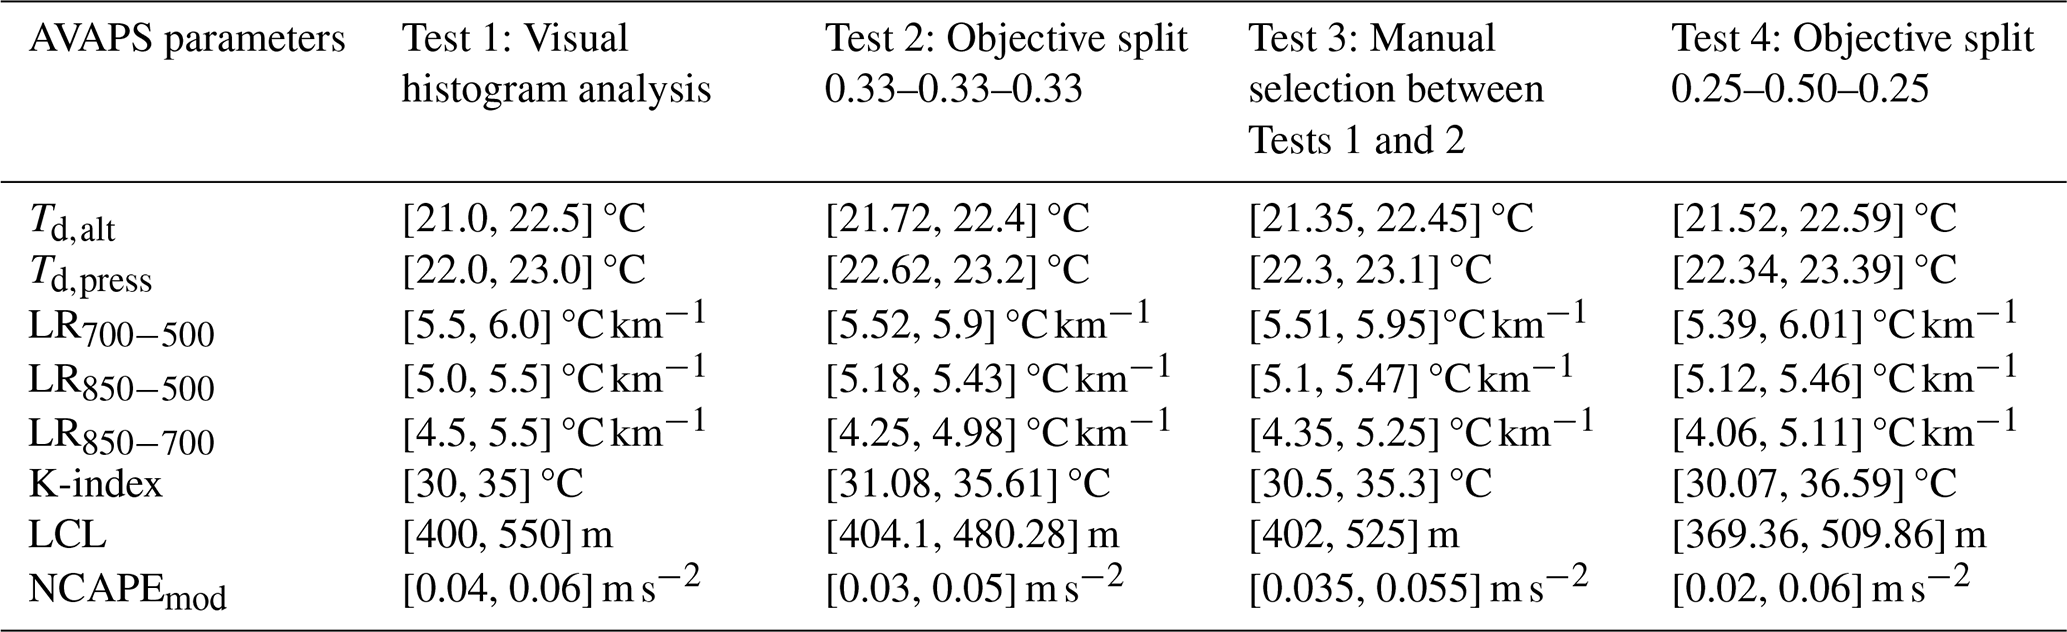
Lastly, the values used to stratify each environmental condition were varied in a sensitivity test consisting of four different sets of thresholds for each parameter (Table 2). The methods used to stratify environmental parameters in Tests 1–4 were, respectively, as follows:
-
Create campaign-wide histograms of the AVAPS parameter and visually identify approximate values that split the dataset into three roughly equal-sized groups.
-
Objectively select thresholds that split each parameter's dataset into three equal-sized groups (see the Data availability statement).
-
Manually select thresholds that fall between the low–medium and medium–high thresholds previously identified in Tests 1 and 2.
-
Objectively select thresholds that split each parameter's dataset into three groups, where the “low” and “high” categories each contain 25 % of the data and the “medium” category contains 50 % of the data (i.e., “medium” datasets were approximately twice as large as the “low” and “high” datasets).
For brevity, only results from Test 2 are shown herein, but results from all four tests can be found in the Supplement. Test 2 is highlighted due to its objective stratification into roughly equal-sized groups. The bootstrapping method described previously was applied in all sensitivity tests.
Relating the parameters discussed in this section back to our hypotheses listed at the end of Sect. 1, we hypothesized that PCT, Z95,Ku, PixelsKu, and DFR would all increase under greater NCAPEmod, K-index, LRs, and low-level Td, though, again, this investigation is secondary to our aerosol analyses, as outlined at the end of Sect. 1. Expectations for LCL altitude were more uncertain, given some differing results and discussions in past works that have explored LCL's relation to convective intensity (e.g., Mulholland et al., 2021; Grabowski, 2023).
This section presents results from comparing the AMPR-based convective parameters with HSRL2 data within environmental bins established using the eight AVAPS parameters. Correlation tables are used to provide complete descriptions of the observed correlations, with more in-depth discussions and analyses performed for some subjectively selected correlations that were statistically significant and/or potentially most impactful. Brief descriptions of sensitivity test results are provided and all correlation tables from these sensitivity tests are provided in the Supplement.
PCTs from AMPR Tb values can be used to investigate AMPR data in and around precipitation. Correlation coefficients between AMPR's 19.35 GHz PCT and HSRL2 parameters are shown in Fig. 2. For brevity, only PCT19 is detailed herein, given its sensitivity to clouds and precipitation, with additional PCT results presented in the Supplement. From Fig. 2, some positive correlations were present and statistically significant, illustrating the benefits of examining PCT in regions of precipitation wherein AMPR CLW retrievals may fail, as discussed next and in the Supplement. However, most correlations throughout Fig. 2 were fairly weak and had limited statistical significance, especially when comparing PCT19 with extinction parameters, indicating a level of inconclusiveness in these results. Despite this, some correlations with greatest positive statistical significance were examined in more detail using scatterplots, in particular PCT19 versus Bsc355 when binned by LCL (Fig. 3a) and PCT19 versus Bsc355 when binned by LR850−500 (Fig. 3b).
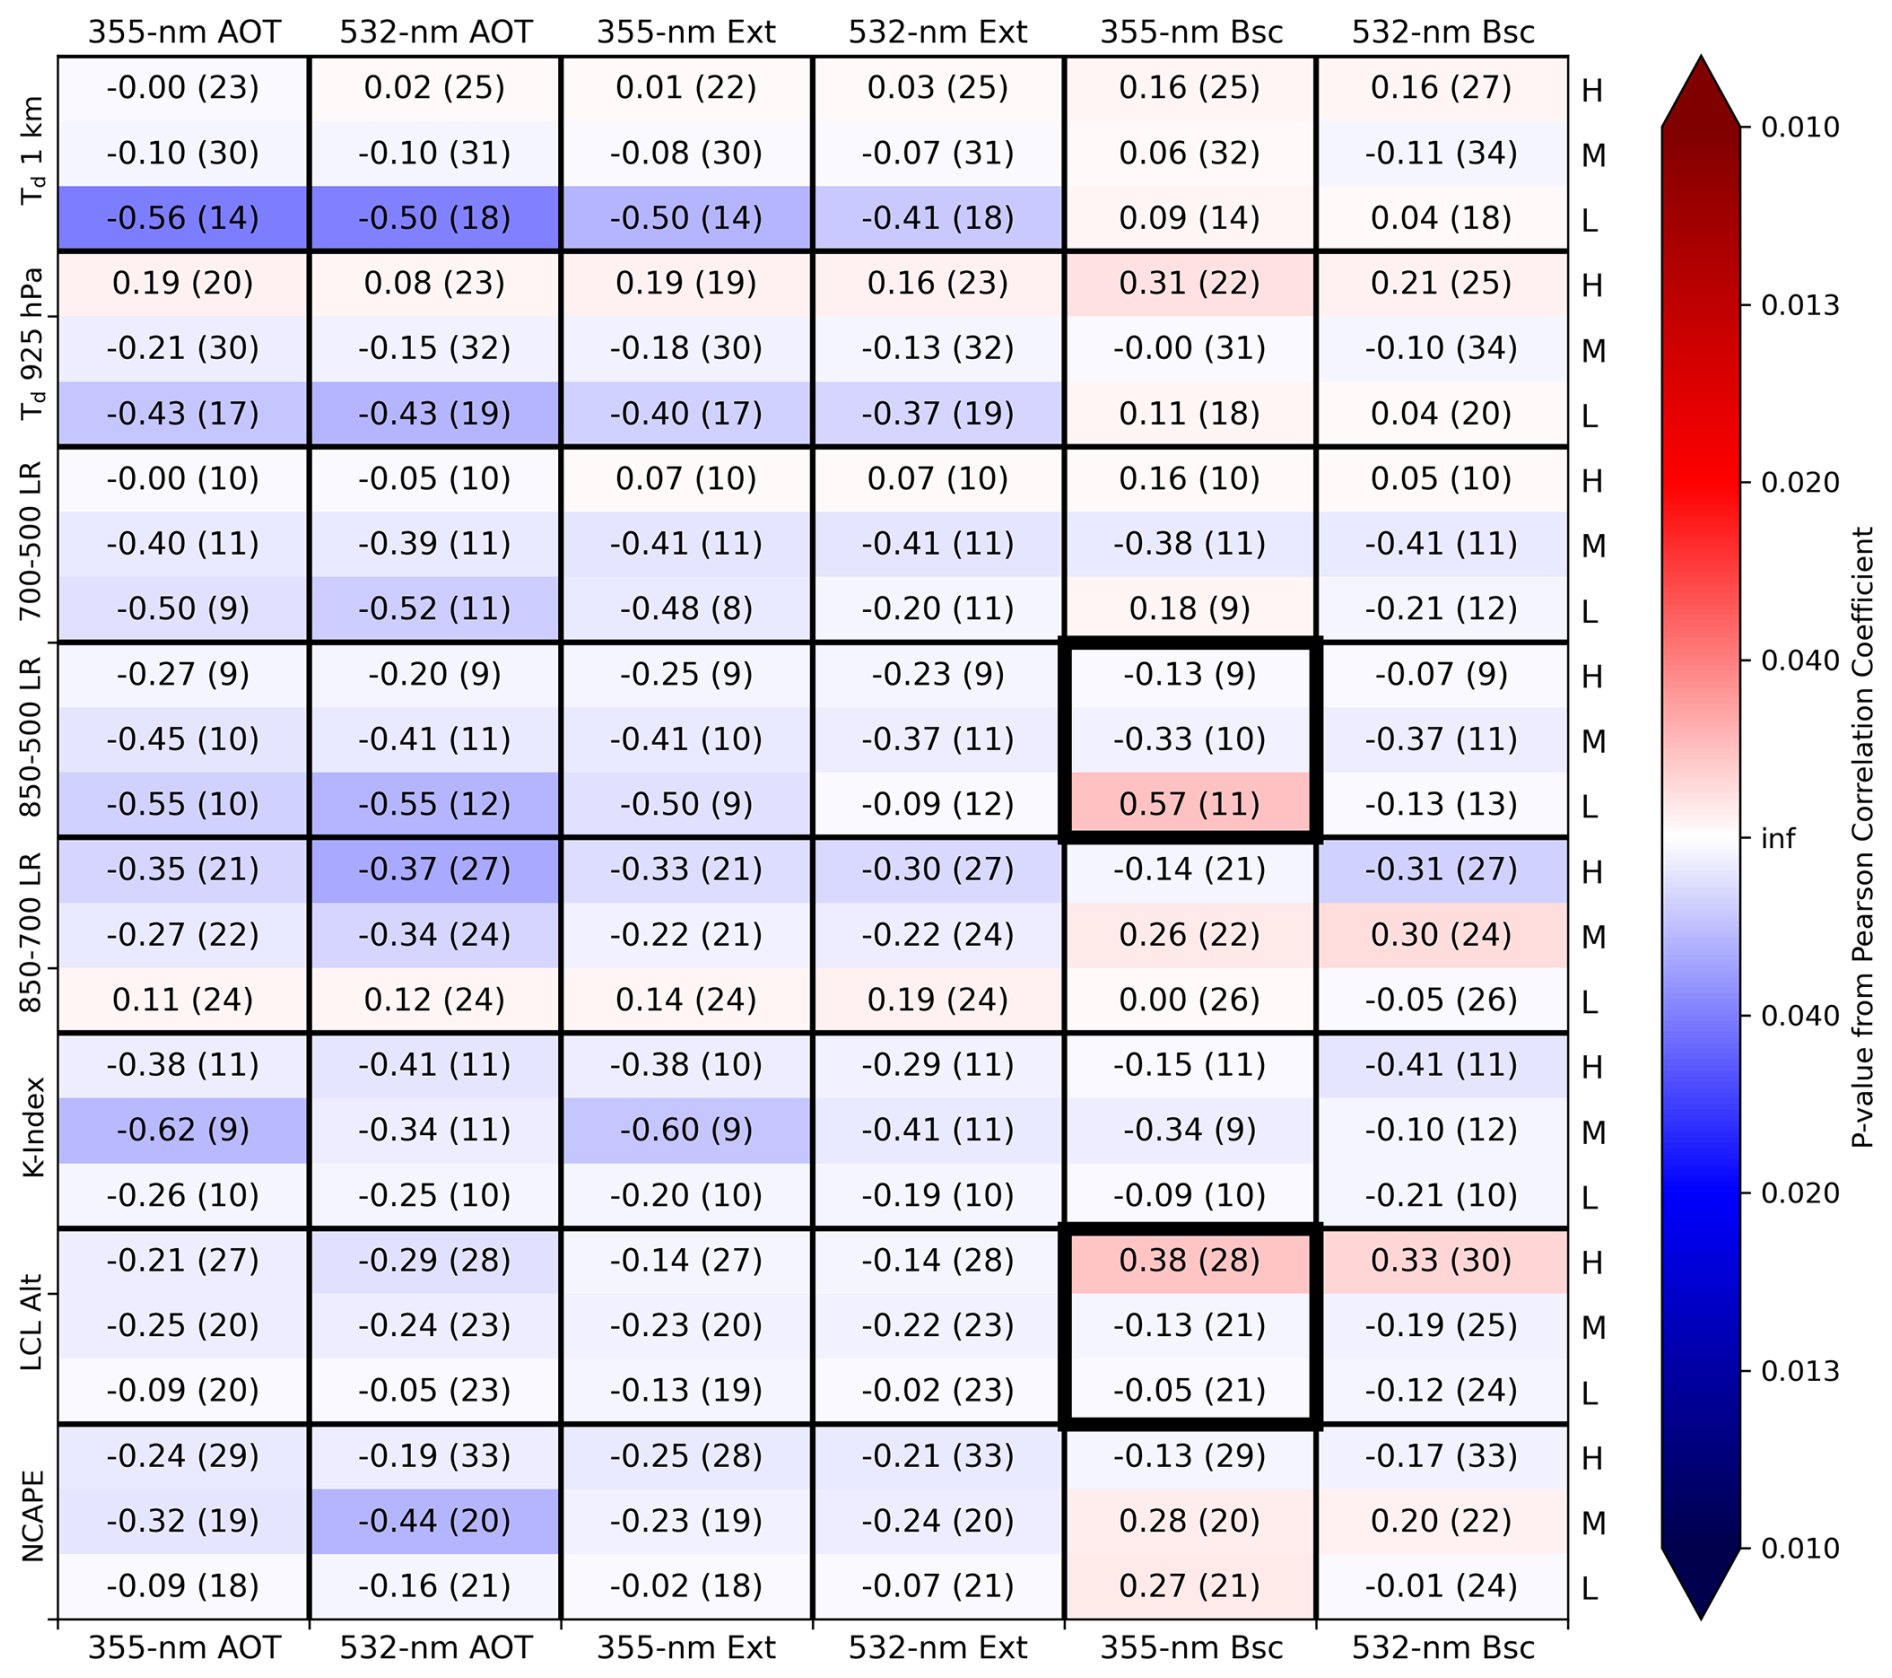
Figure 2Pearson correlation coefficients from comparing p95 AMPR 19.35 GHz PCT with mean HSRL2 AOT, extinction (Ext), and backscatter (Bsc) at 355 and 532 nm (top and bottom borders) within environmental bins stratified by the eight AVAPS parameters (left border) at low (L), medium (M), and high (H) magnitudes (right border) across the CAMP2Ex scenes. AVAPS magnitudes were stratified using the values of Test 2 (Table 2). Within each cell, the listed value is the Pearson correlation coefficient and the parenthesized value indicates the mean number of data points used in the (bootstrapped) comparison. Cells with a Pearson correlation coefficient ≥0.70 contain bold text. Reds (blues) represent positive (negative) Pearson correlation coefficients, and the color shading corresponds to the magnitude of the p value according to the color bar, with darker shades of each color associated with lower p values (i.e., greater statistical significance). Color shading begins to increase substantially around p=0.05 and reaches a maximum for p≈0.01. Thicker boxes outline the two correlation sets illustrated in Fig. 3.
Many PCT19 values in Fig. 3a are <200 K, indicating a relative lack of considerable precipitation in the scenes examined (Amiot et al., 2021; Amiot, 2023); however, several data points with PCT19>200 K are present, including values >260 K, indicating that PCT19 is capturing precipitation. There is considerable data clustering between a PCT19 of 185–200 K and Bsc355 of 0–7.5 , suggesting several instances where the P-3 overflew non-precipitating clouds. The highest PCT19 values being associated with relatively low aerosol concentrations (i.e., in this case) within the low- and medium-LCL groups, combined with the aforementioned data clustering, probably caused the extremely low correlations for these low and medium groups. It appears that the high-LCL correlation was sensitive to the three outliers with PCT19>220 K and , which contributed to its high value; however, that this correlation was found to have statistical significance indicates that it is worthy of further examination. In general, increased aerosol concentration was not strongly associated with enhanced convection in Fig. 3a. However, it is noteworthy that half of the data points with PCT19>240 K were associated with low LCL; this would indicate a relatively high amount of low-level water vapor, wherein warm-phase convective invigoration may occur (e.g., Grabowski and Morrison, 2020). However, there are only eight data points with PCT19>240 K and aerosol concentrations therein were generally low, so this potential connection needs further analysis.
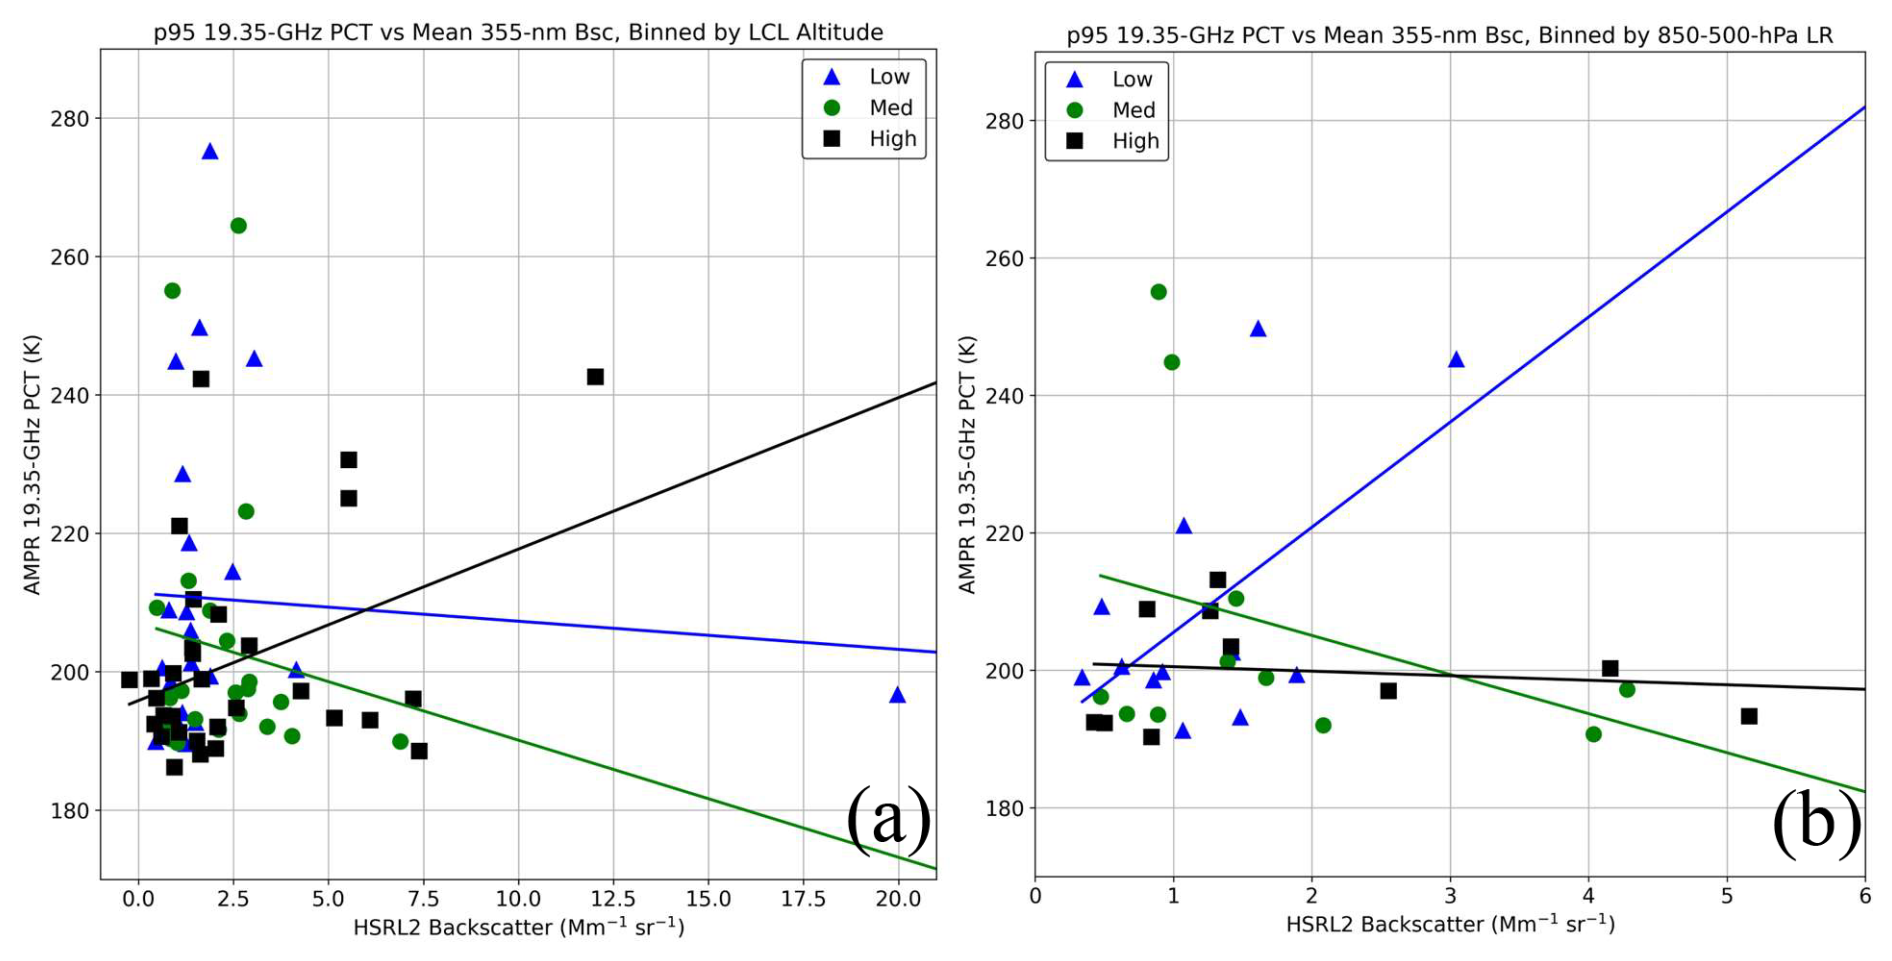
Figure 3Complete (i.e., non-bootstrapped) scatterplots of p95 PCT19 compared with mean values of the HSRL2 parameter listed in the title and x axis of each plot within environmental bins stratified using the AVAPS parameter listed in the title of the corresponding plot. AVAPS threshold values were from Test 2 (Table 2). In all plots, blue triangles, green circles, and black squares correspond to data points associated with low, medium, and high magnitudes, respectively, of the associated AVAPS parameter. Please note that the x axis ranges are not constant among the scatterplots shown.
Impacts of reduced dataset sizes can be seen further in Fig. 3b, which contains far fewer data points compared with Fig. 3a due to LR850−500 requiring 500 hPa data. Despite this, a statistically significant positive correlation was found between the aerosol and convective metrics but it was unexpected that this occurred for the low LR850−500 group and not the medium or high groups. From Table 2, “low” LR850−500 values were still conditionally unstable and thus supportive of convection, so this result is physically plausible and deserves further analysis. However, it seems that the data points with PCT19>240 K greatly influenced correlations for the low and medium groups, which is expected with a relatively limited sample size. Increasing PCT19 with increasing aerosol concentration (within the low group) matches the hypothesized correlations but the highest aerosol concentrations in Fig. 3b (i.e., in this case) were associated with relatively low PCT19 values, <205 K in all but one instance. Thus, overall trends in correlation between aerosol concentration and PCT19 in Fig. 3b are fairly mixed.
Given the presence of statistically significant and potentially impactful results in Figs. 2 and 3, future work should examine these and other AMPR data in greater detail. Several trends were consistent across the sensitivity tests (Supplement). However, it should be acknowledged that many correlations throughout Fig. 2 were fairly weak (i.e., magnitude<0.3) and/or had low statistical significance. Additionally, as will be referenced throughout these discussions, a relatively limited sample size was present for several comparisons/scatterplots, and all cases examined in this study would benefit from a larger sample (e.g., incorporating satellite and/or modeling data to expand the number of data points throughout the study domain, especially in and around deeper convection). Lastly, as is true for all analyses herein, while high correlation between two parameters is interesting and potentially significant, it does not guarantee a cause-and-effect situation. Thus, the most noteworthy trends identified in this study (e.g., Fig. 3) should be examined further to evaluate their significance and potential aerosol influences on convection.
Since we focus on the strongest convection observed during CAMP2Ex, uncertainties in AMPR CLW retrievals in precipitation (Amiot et al., 2021) make them more difficult to assess in relation to our study focus. Thus, we summarize AMPR CLW compared with HSRL2 in the stratified environments via Figs. S1–S3 in the Supplement. From Figs. S1 and S2, low CLW values (i.e., ) yielded negative yet statistically significant correlations when compared with AOT and Ext. These negative correlations may have been compounded by AMPR's precipitation mask, noted in Sect. 2.2. Masking removed much of the statistical significance (Figs. S2 and S3). Many remaining correlations were negative (Figs. S2c and d and S3) but were generally weak. Despite some stronger and more statistically significant correlations in Figs. S1–S3, the abundance of weaker correlations, which persists across the sensitivity tests, further indicates a considerable degree of inconclusiveness in these results. This emphasizes difficulties in separating aerosol influences from environmental effects, in addition to the limitations associated with the observational datasets and relatively small sample sizes employed in our study.
Similar analyses are presented in this section using Z95,Ku, PixelsKu, and DFR as the convective parameters. All figures utilize AVAPS thresholds from Test 2 (Table 2). To begin, Pearson correlation coefficients between Z95,Ku and the HSRL2 variables are presented in Fig. 4. Several statistically significant positive correlations can be seen between Z95,Ku and the HSRL2 variables in Fig. 4, especially for some comparisons binned according to NCAPEmod, LR850−700, and LR700−500. However, most correlations throughout Fig. 4 were relatively weak, with limited statistical significance. Interestingly, many of the strongest correlations with highest statistical significance (albeit still fairly limited) were often associated with the low category of a given environmental group. To examine trends in greater detail, two parameters selected for more in-depth analysis were (1) Bsc355 binned by LR700−500 (Fig. 5a) and (2) Bsc532 binned by NCAPEmod (Fig. 5b), which were chosen due to their relatively high statistical significance in the low category of the environmental groups.
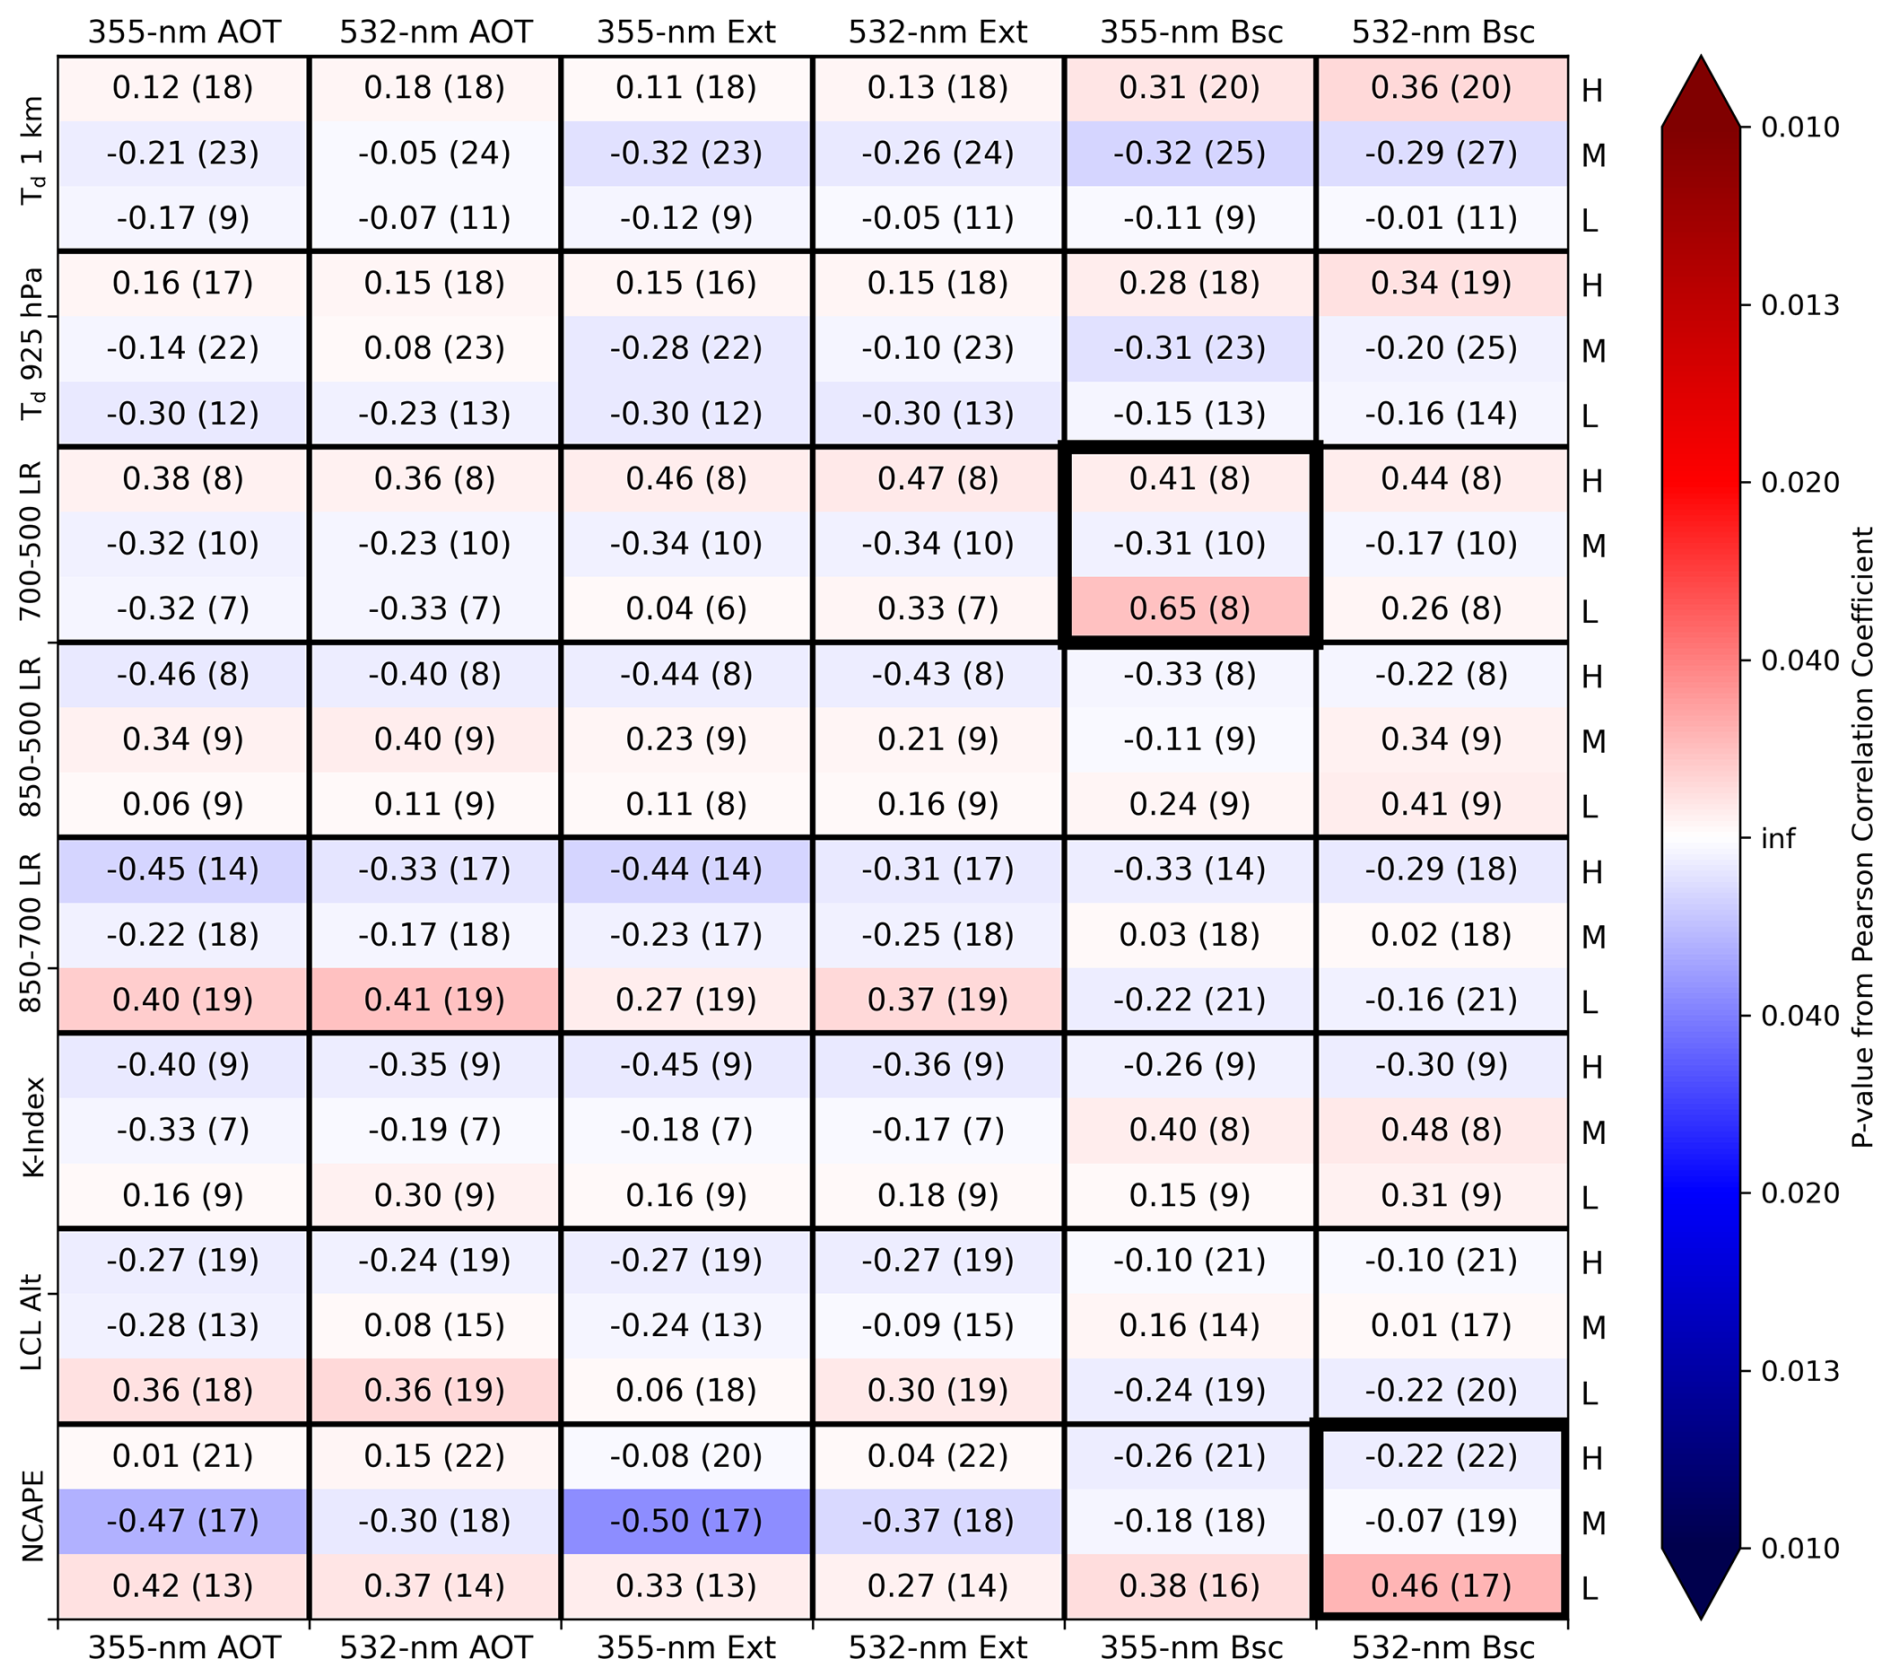
Figure 4As in Fig. 2 but using p95 APR-3 Ku-band composite ZH as the convective parameter. Thicker boxes outline the two correlation sets illustrated in Fig. 5a and b.
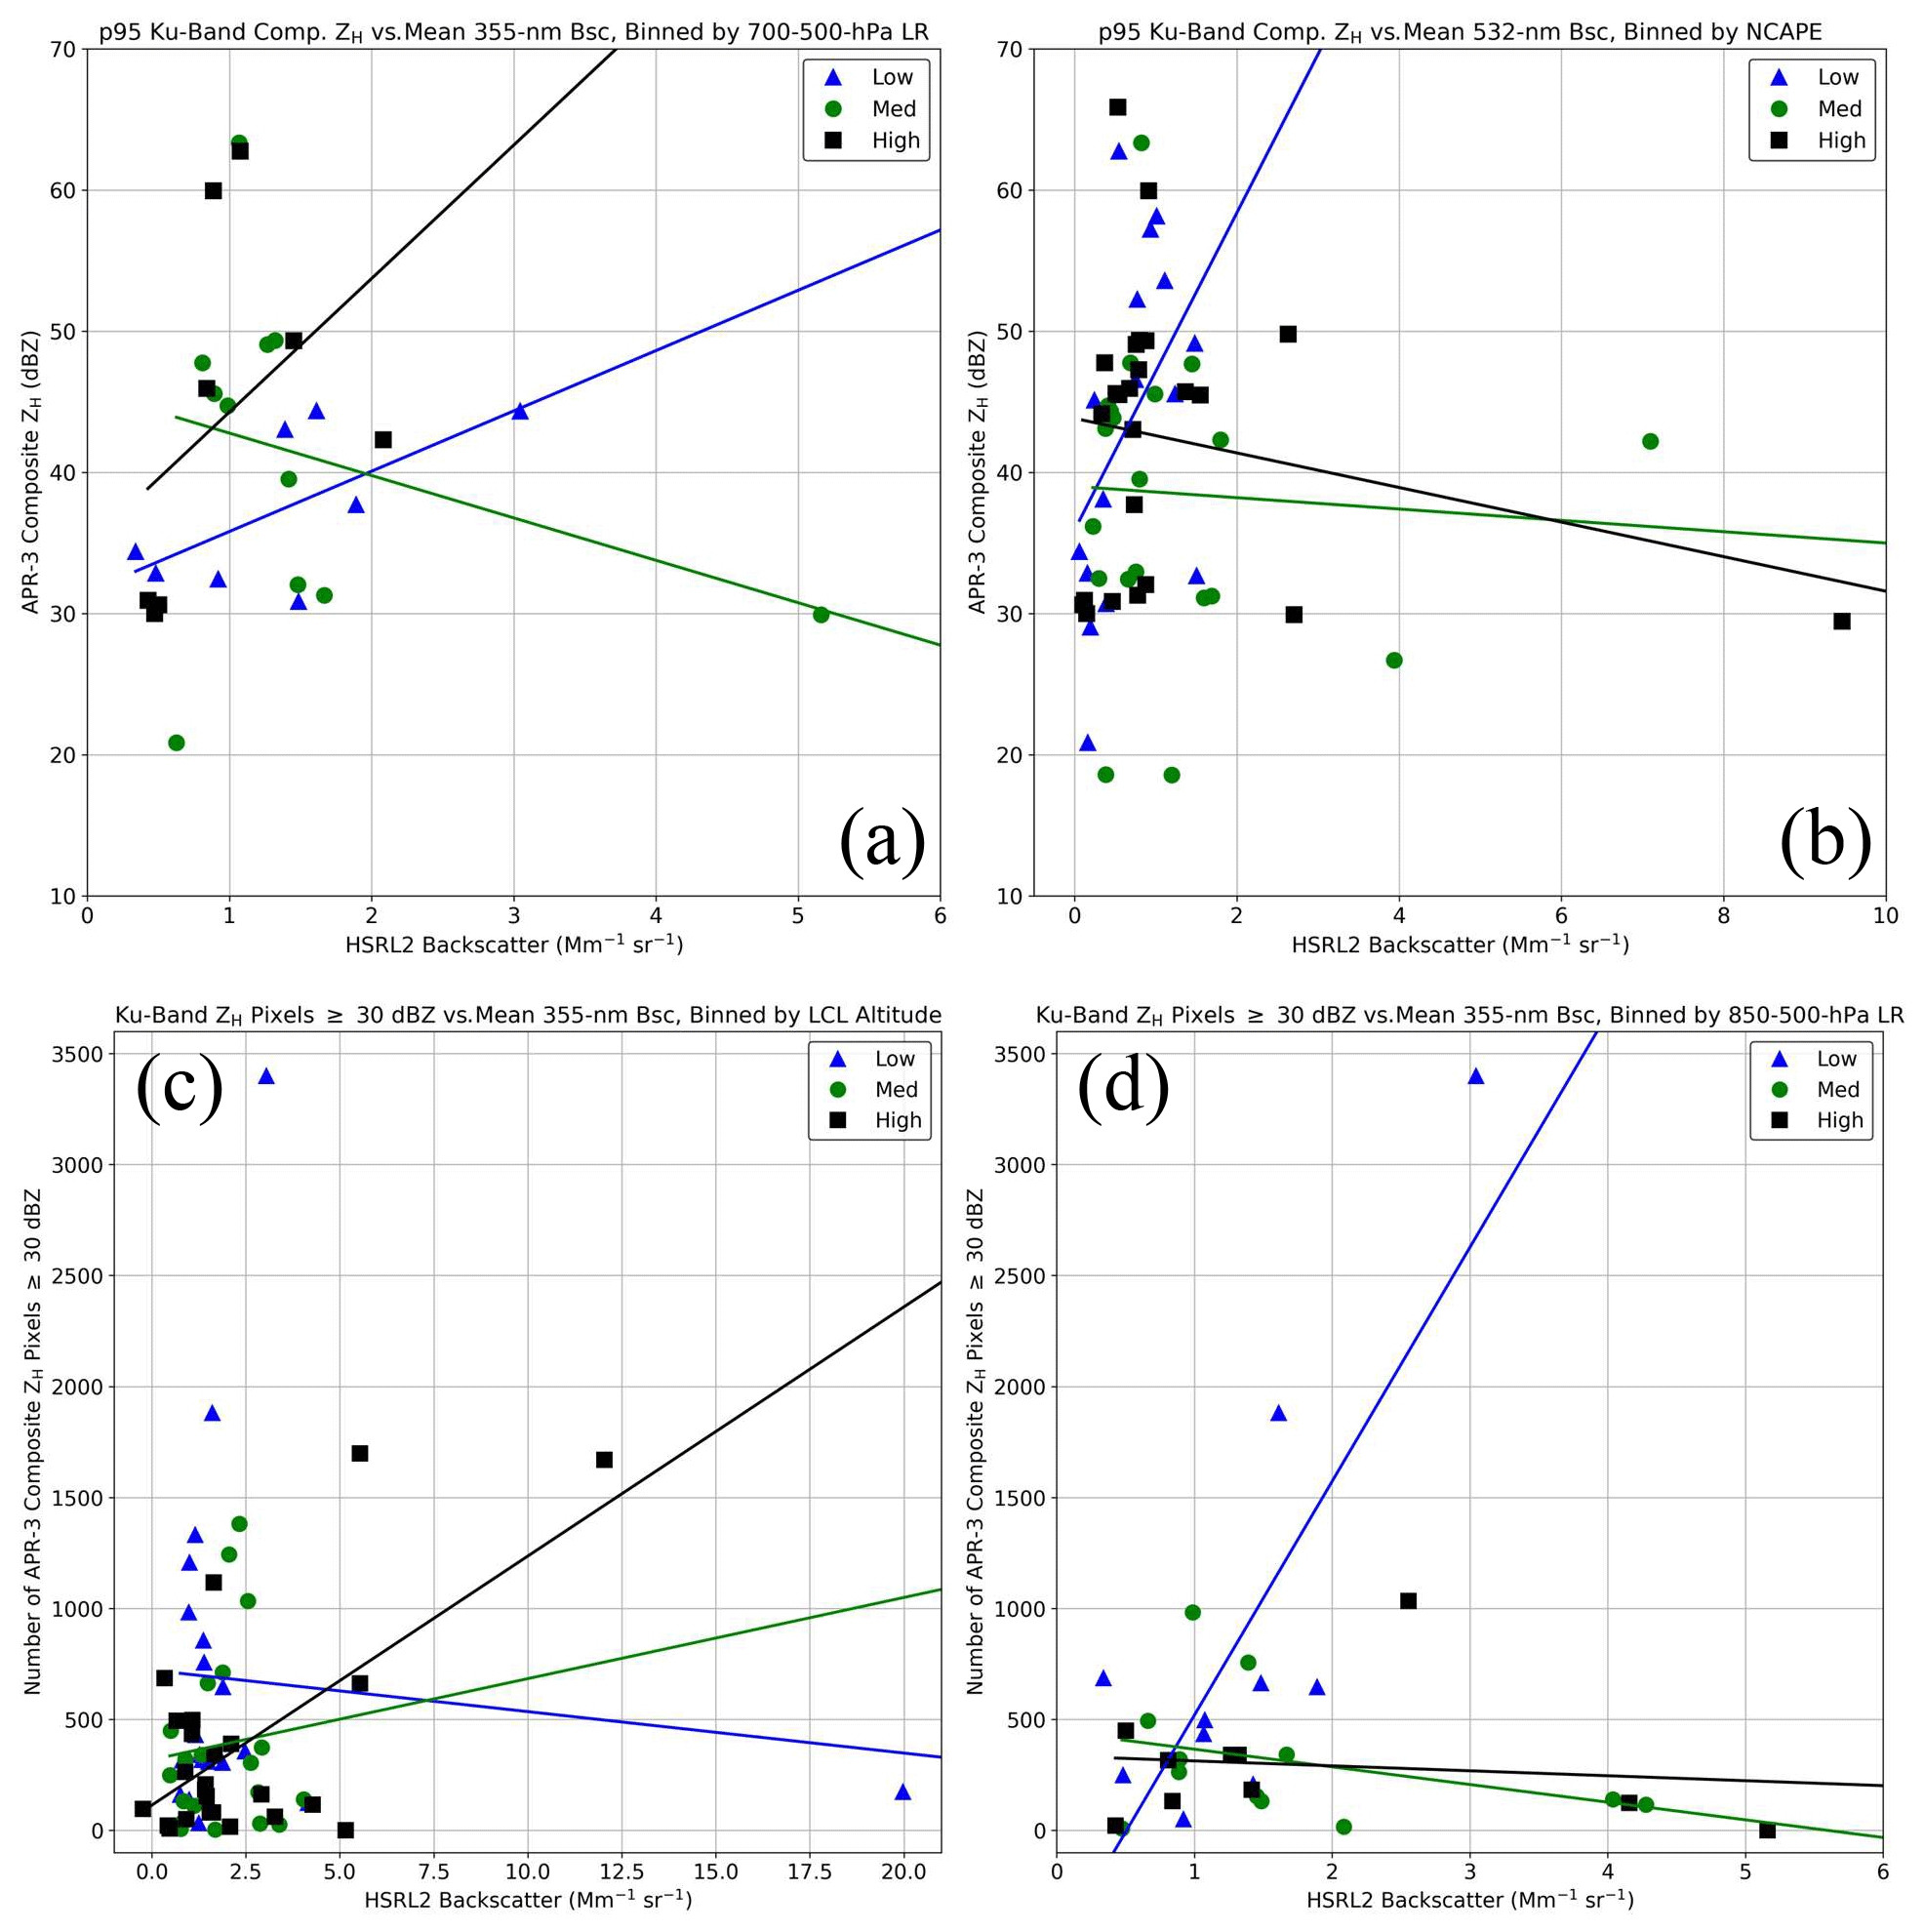
Figure 5As in Fig. 3, but these are scatterplots of (a, b) p95 APR-3 Ku-band composite ZH and (c, d) the number of APR-3 Ku-band composite ZH pixels ≥30 dBZ compared against the mean value of the HSRL2 parameter listed in the title of each plot. The AVAPS parameter used to stratify the environments is also listed in the title of each plot. Please note that the x and y axis ranges are not constant among the scatterplots shown.
In Fig. 5a, many Z95,Ku values ≥30 dBZ were present in CAMP2Ex scenes, indicating that precipitating systems were overflown by the P-3 aircraft, as discussed in Sect. 3. The standout feature of Fig. 5a is the statistically significant positive correlation between Z95,Ku and Bsc355 when binned by low LR700−500 values. That is, as aerosol concentration increased within low-LR700−500 conditions, peak Ku-band ZH within the same scenes increased as well, suggesting development of larger raindrops. These large raindrops would dominate ZH but this analysis also highlights the importance of considering environmental conditions. Further, this comparison is hindered by the limited sample size and a few data points may significantly impact the correlations. While the general trend of LR700−500 comparisons is similar across sensitivity tests (Supplement), magnitudes of the correlations and their statistical significance varied depending on the values used to stratify lapse rates. Further, the highest Z95,Ku values were associated with relatively low , suggesting that the largest raindrops were not necessarily correlated with the highest aerosol concentrations. Despite this, the positive correlations observed in this comparison warrant further exploration in future work.
Comparing Z95,Ku with Bsc532 binned by NCAPEmod (Fig. 5b), a positive correlation between Z95,Ku and Bsc532 was present for the low-NCAPEmod group, matching expectations. However, negative correlations for the medium- and high-NCAPEmod groups were interesting and were probably influenced by the data points with , all of which were associated with . The scattered data points with across the observed range of Z95,Ku indicate some inconclusiveness with these results, as higher Z95,Ku was not necessarily observed with higher Bsc532. As noted previously, these comparisons would benefit from additional analyses using a larger sample size that incorporates satellite and/or modeling data throughout the study domain.
Next, the number of APR-3 Ku-band composite ZH pixels ≥30 dBZ (i.e., PixelsKu) was used as the convective parameter (Fig. 6). Several more strongly positive and statistically significant correlations were present, compared with Figs. 2 and 4, probably due to PixelsKu focusing on abundance of convection rather than a peak value in a given scene. The strongest positive correlations with statistically significant p values were found for PixelsKu correlated with lapse rate and LCL, suggesting some potentially interesting trends that warrant further exploration. However, considerable variability in the results can be seen across Fig. 6, as evidenced by many fairly weak correlations with limited statistical significance. Some correlations varied considerably, depending on which aerosol parameter was examined (e.g., correlations with AOT532 were moderately negative in the low LR850−500 group but correlations with Bsc355 were moderately positive in the same group). Several factors contributed to these differences and, as discussed previously, are difficult to account for entirely. Given their statistical significance, the decision was made to examine the relatively strong correlations between PixelsKu and Bsc355 within environments binned by LCL (Fig. 5c) and LR850−500 (Fig. 5d). From Fig. 5c, most scenes featured at least one Ku-band composite ZH observation ≥30 dBZ, further indicating that the P-3 passed over precipitating clouds during CAMP2Ex. In Fig. 5c, the general trend was an increase in PixelsKu with increasing Bsc355 for a higher LCL, regardless of whether these APR-3 pixels were part of a single convective storm or several individual plumes. However, this trend appears to have been greatly influenced by the two “high” values with PixelsKu>1500 and thus would benefit from expansion in future work. The best-fit line for the low LCL group also appears to have been influenced by the Bsc355 value around 20 . Mixed results from this comparison are further indicated by the highest aerosol concentration, around 20 , being associated with a low value of PixelsKu, <250.
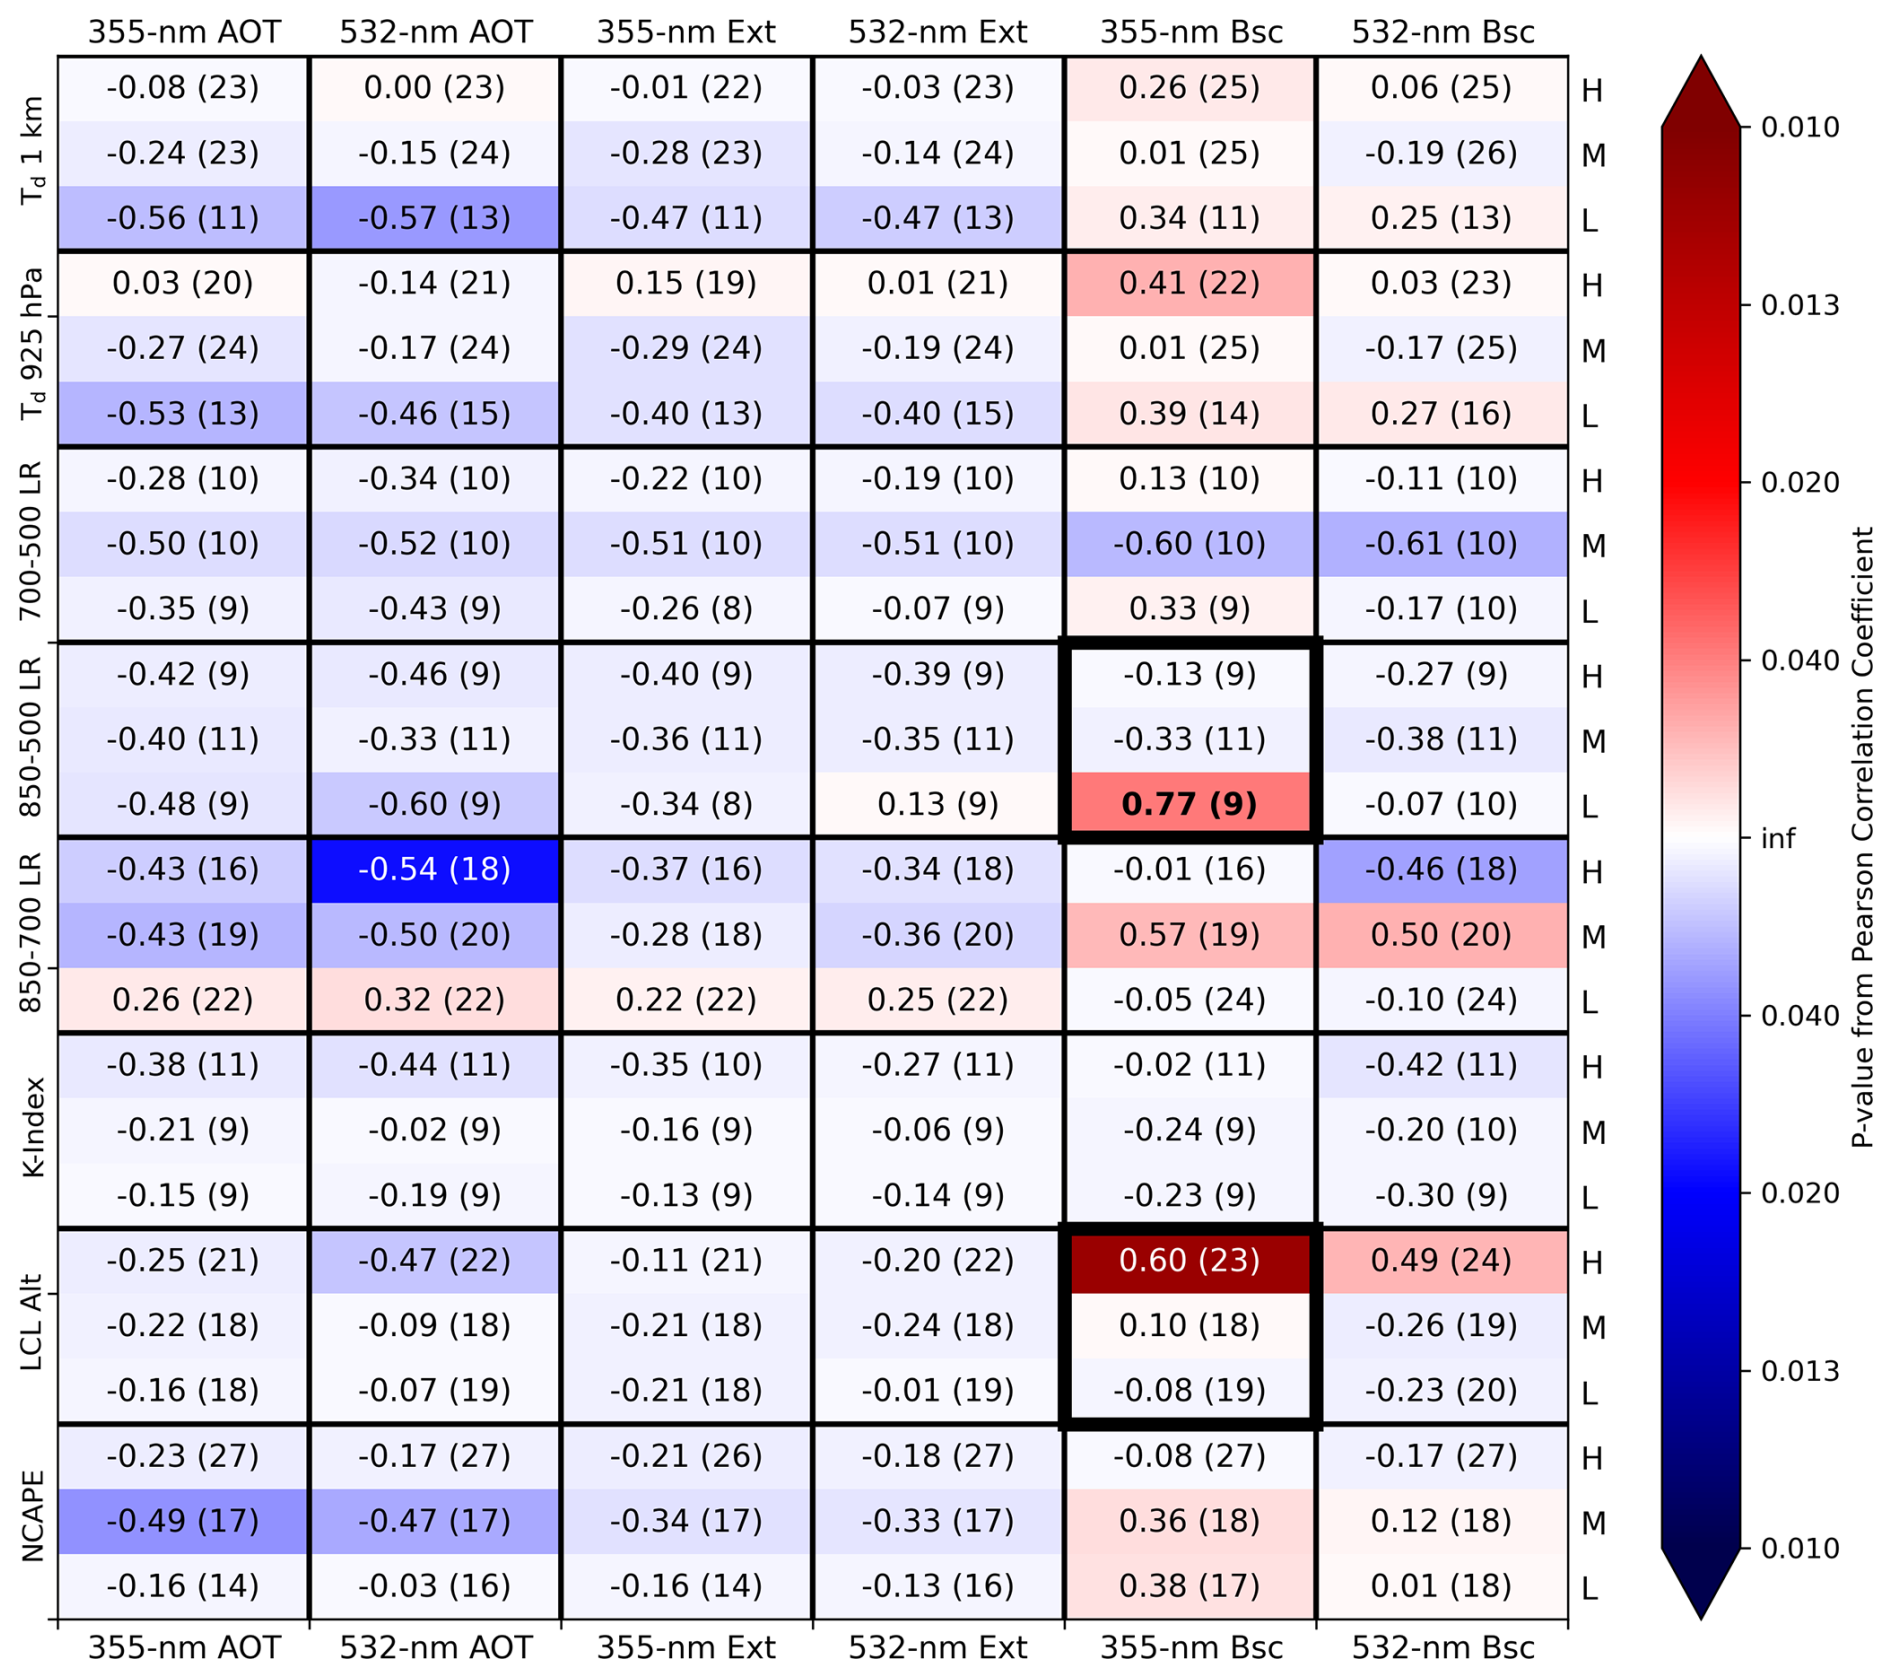
Figure 6As in Fig. 2 but using the number of APR-3 Ku-band composite ZH pixels ≥30 dBZ as the convective parameter. Thicker boxes outline the two correlation sets illustrated in Fig. 5c and d.
When comparing PixelsKu with Bsc355 in environments binned by LR850−500, limitations of reduced sample sizes can be seen further, especially for the low-LR850−500 group (Fig. 5d). Most notably, the correlation of 0.77 within the low group appears to be heavily influenced by the two data points with PixelsKu>1500. Thus, while a strong and statistically significant correlation exists between PixelsKu and Bsc355 within environments of low LR850−500, this relationship should be examined in more detail. This result was also unexpected, as greater conditional instability associated with higher lapse rates would generally indicate greater convective potential. Results from the medium and high groups were scattered with PixelsKu<1100, and the highest aerosol concentrations were associated with some of the lowest PixelsKu values. Despite the limited sample in Fig. 5d, it was interesting to see cases such as this where the convective parameter was maximized for relatively medium aerosol concentrations; this indicates the potential for a “Goldilocks” zone of aerosol concentration enhancing convection.
Lastly, DFR was used as the convective metric (Fig. 7). As with Z95,Ku, and unlike PixelsKu, DFR focuses on convective intensity rather than abundance of convection. From Fig. 7, many statistically significant and strong correlations were associated with several environmental parameters but, unexpectedly, were often found within low values of these environmental conditions. There was greater presence of statistically significant positive correlations in Fig. 7, compared with many other analyses in this study, but several correlations in the DFR analyses were relatively weak and/or statistically insignificant. To provide a detailed example of a convective–aerosol pair wherein correlations were relatively weak for all environmental thresholds, we examined DFR compared with Bsc355 when binned by LR850−700 (Fig. 8a). That is, in Fig. 8a, all three environmental groups were associated with weakly negative or weakly positive correlations between DFR and Bsc355. This resulted from most aerosol backscatter values falling within the range of 0–5 while also covering nearly the full range of (masked) DFR values observed (i.e., −3 to 15). The few data points with were mainly associated with DFR<10, contrasting our hypothesis that greater Ka-band attenuation would be associated with higher aerosol concentrations. The clustering of Bsc355 between 2.5 and 5 with DFR between 12 and 15 is interesting and is more closely in line with the expected increase in attenuation, warranting further investigation with a larger dataset.
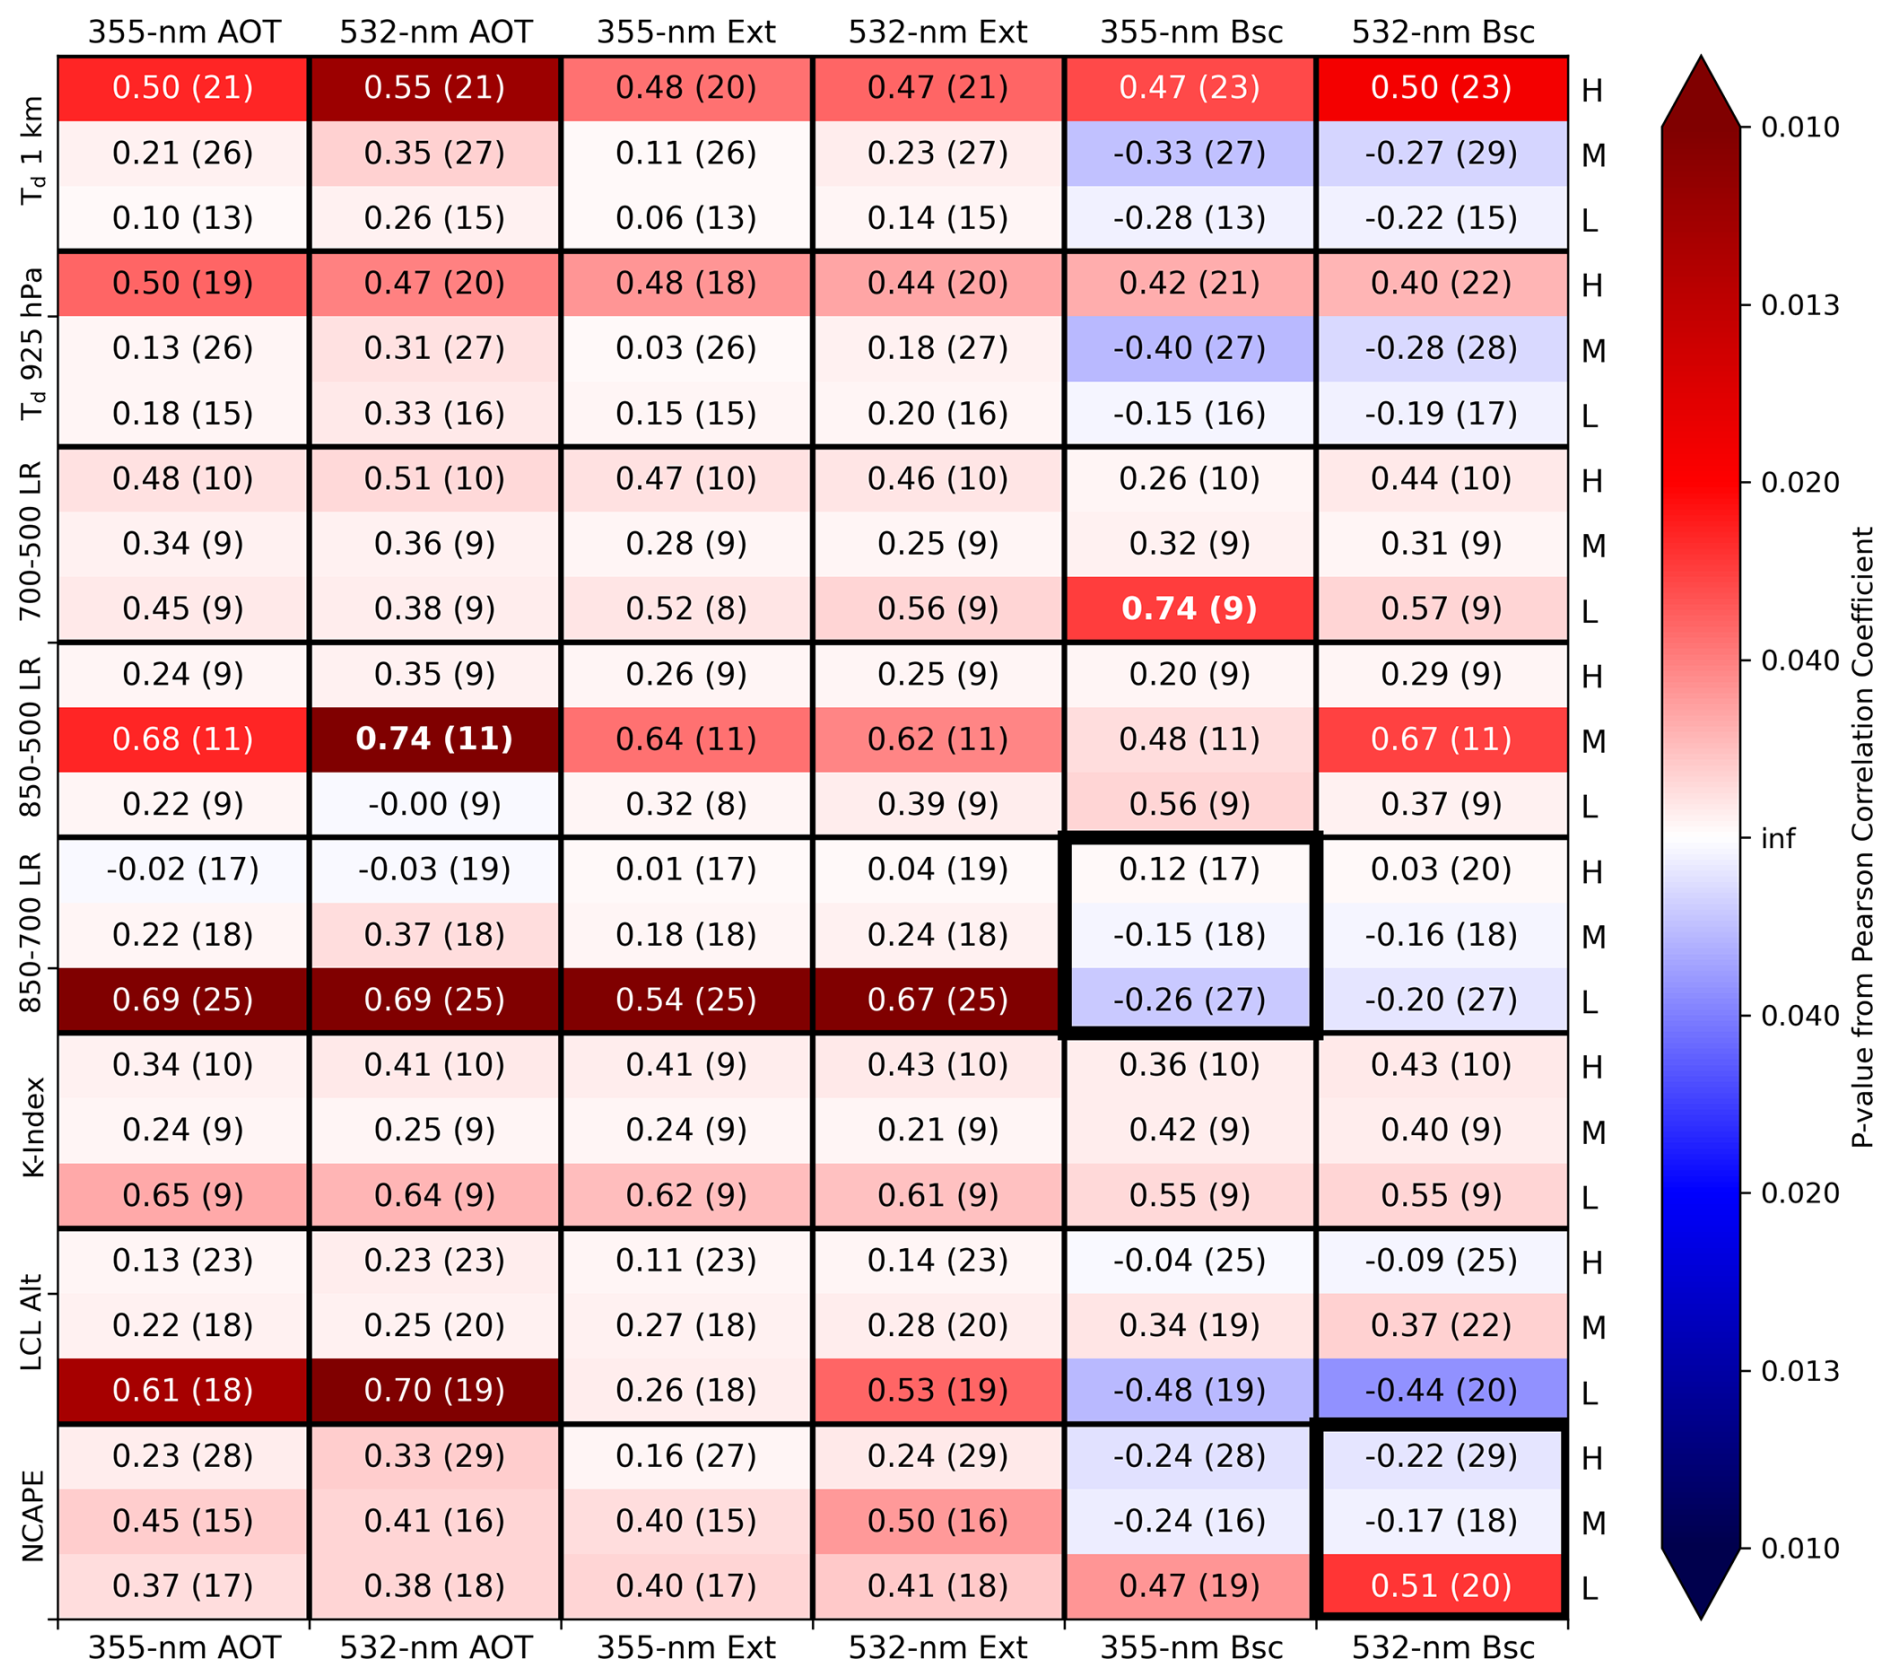
Figure 7As in Fig. 2 but using p95 Ku-/Ka-band DFR as the convective parameter. Thicker boxes outline the two correlation sets illustrated in Fig. 8.
Due to statistically significant correlations associated with Bsc532 when binned by NCAPEmod, we also examined it in greater detail (Fig. 8b). Some similar trends can be seen in Fig. 8b to those in Fig. 8a, such as negative correlations in scenes with medium values of the environmental parameter (i.e., NCAPEmod). This was largely due to the clustering of data points with Bsc532 of 0–2 across the full range of DFR values, while the highest Bsc532 values were associated with DFR<10. The statistically significant positive correlation within the low-NCAPEmod group follows expectations that greater attenuation would occur within stronger convection but this comparison benefits from the relatively limited range of Bsc532 observed within the low-NCAPEmod group (i.e., 0–2 ). The trends in DFR compared with the aerosol parameters were also fairly consistent across the sensitivity tests (Supplement).
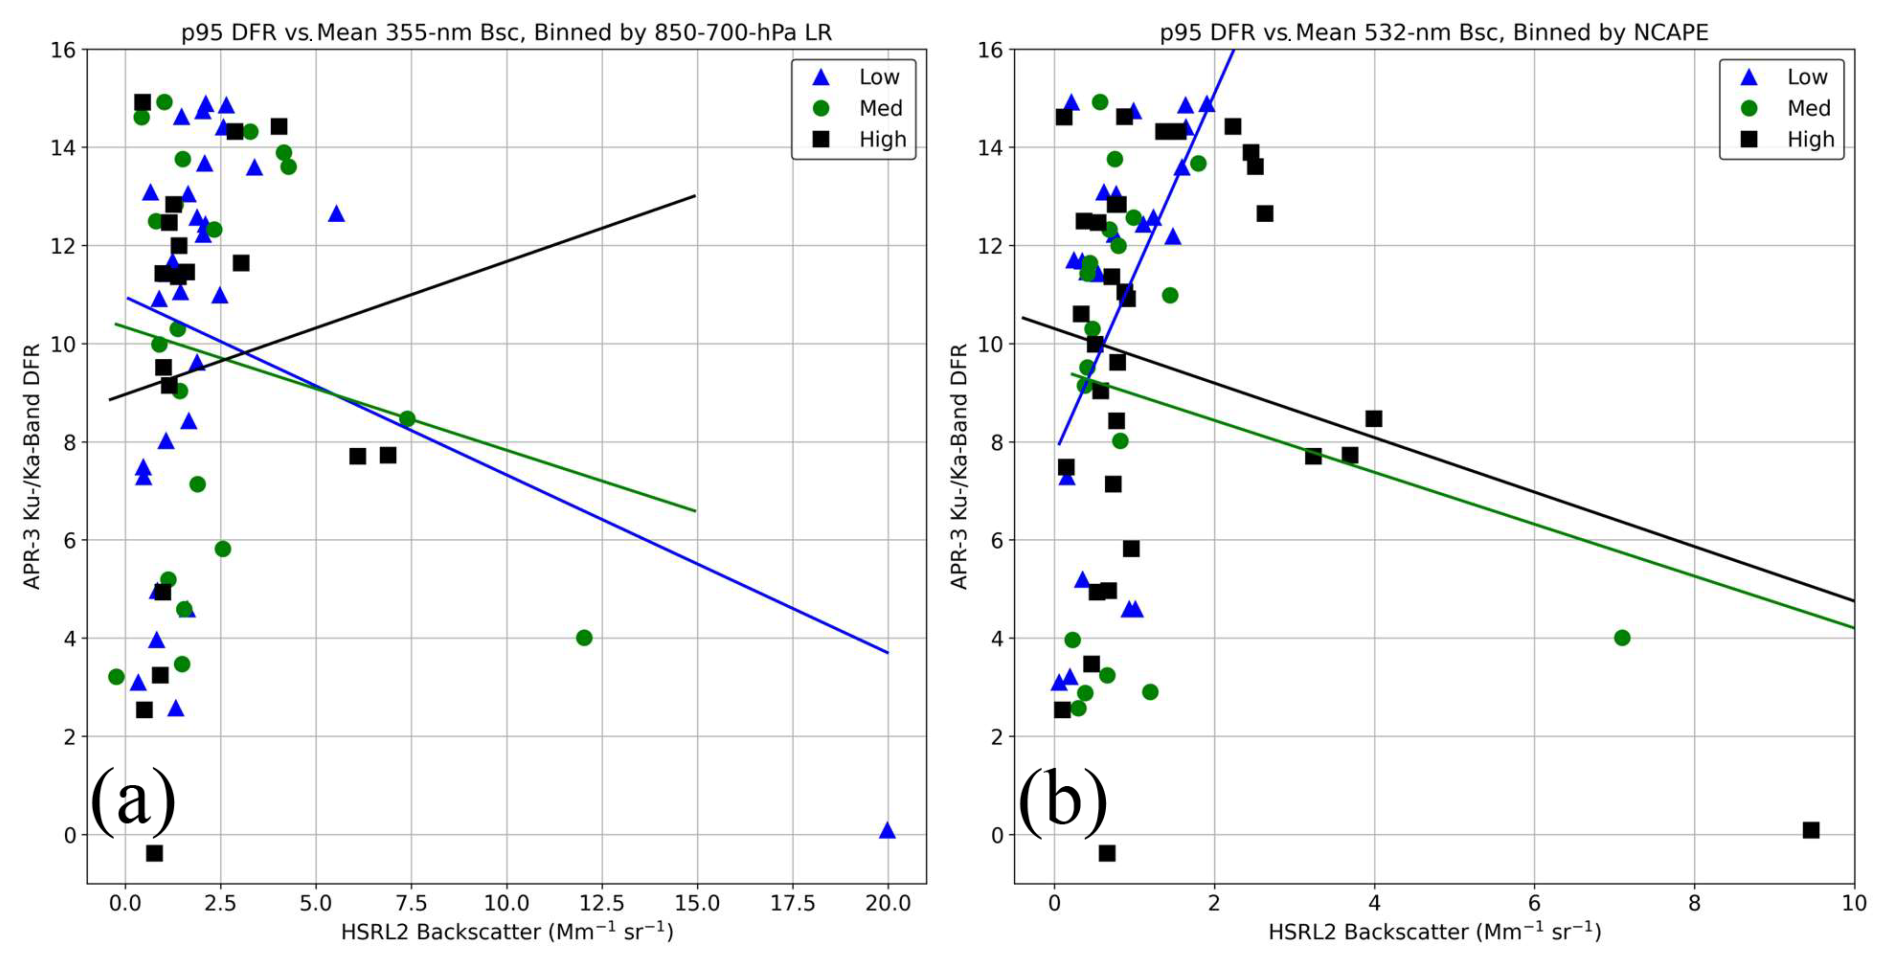
Figure 8As in Fig. 3, but these are scatterplots of p95 APR-3 Ku-/Ka-band DFR compared against the mean value of the HSRL2 parameter listed in the title of each plot. The AVAPS parameter used to stratify the environments is also listed in the title of each plot. Please note that the x axis ranges are not constant among the scatterplots shown.
This study focused on examining potential impacts of aerosol concentration on maritime tropical convection using remote-sensing data in environmental contexts. Eight parameters from 92 AVAPS dropsondes across CAMP2Ex P-3 science flights 05–19 were used to stratify the environments: modified normalized CAPE; LCL altitude; K-index; 850–700, 850–500, and 700–500 hPa temperature lapse rates; mean Td below 1 km a.g.l.; and mean Td below 925 hPa. Each dropsonde was associated with a 10 min “scene,” ±5 min from its launch time, wherein all aerosol–convective comparisons were performed in relation to the given dropsonde-derived environment. Threshold values were selected to divide scenes into “low,” “medium,” and “high” groups, based on each AVAPS parameter, and sensitivity testing examined four different sets of threshold values, used for each stratification. Eight AMPR and APR-3 metrics related to convective intensity and/or prevalence were compared with HSRL2 backscatter, extinction, and AOT at 355 and 532 nm within the binned environments using Pearson correlation coefficients and their associated p values. These convective parameters were p95 of PCT at 10.7, 19.35, 37.1, and 85.5 GHz; p95 of AMPR CLW; p95 of APR-3 Ku-band composite ZH; number of Ku-band composite ZH pixels ≥30 dBZ; and p95 of Ku-/Ka-band DFR.
Correlations between the convective metrics and aerosol parameters varied, depending on which convective metric was examined. During AMPR's CLW analyses, several negative correlations were observed, probably owing at least in part to precipitation masking and very low CLW values , which limited the aerosol–convection conclusions that could be drawn based solely on AMPR CLW. This was mitigated when examining AMPR PCT19, which includes precipitation regions and yielded several positive aerosol–convection correlations, as expected. Likewise, examining APR-3's Z95,Ku, PixelsKu, and DFR yielded many positive correlations with aerosol concentration, including several with statistical significance. Some of these strongest and most statistically significant correlations are potentially impactful and warrant exploration in future work. In particular, several noteworthy trends were observed when stratifying environments based on their temperature lapse rate or NCAPEmod, which, among other environmental factors, suggests their importance, to be considered when examining aerosol–cloud effects. Some cases evaluated in more detail using scatterplots indicated a “Goldilocks” zone of medium aerosol concentration, suggesting that these medium values enhanced convection to a stronger degree than low or high aerosol concentrations in some cases, as observed in prior studies. Higher aerosol concentrations were associated with stronger convection in other cases, matching our hypotheses. Many trends were also consistent across the sensitivity tests employed. However, the results generally remain inconclusive due to widespread cases for each aerosol–convective analysis, where correlations within many environmental bins were weak and/or had limited statistical significance. This results largely from limitations in the sample size and methods used. The inconclusive results also highlight difficulties in separating aerosol effects from environmental influences when solely using observational data.
These results are important as they highlight some potentially impactful correlations between convective parameters and aerosol concentrations in the maritime tropics, including some instances where medium-to-high aerosol concentrations appeared supportive of convective invigoration, while also demonstrating significant difficulties in separating environmental effects from aerosol effects. However, as noted throughout the paper, correlation does not necessarily indicate causation. Because of this, correlations highlighted in this study serve to identify potentially interesting and impactful trends that warrant more in-depth exploration in future work, rather than providing solid definitive conclusions on their own. Further, the correlation tables presented in this paper, including those in the Supplement, provide a wide range of information applicable to broader applications (e.g., a future study that might explore the impacts of low-level Td or mid-level lapse rates on tropical convection).
While many results were encouraging, several limitations must be considered. The number of dropsondes launched when the P-3 was above 500 hPa was relatively limited, reducing the sample size for all associated environmental parameters. Other limitations in the dataset, such as the P-3 avoiding the most intense convection during a given flight and environmental modification from nearby convection, impacted the results. There was some ambiguity regarding whether an increase in PixelsKu was associated with a single updraft or multiple updrafts, which have different implications for convective intensity and prevalence. Lastly, while many correlations were strong and encouraging, they do not necessarily prove a cause-and-effect situation for their respective comparison, as previously discussed. Thus, it is not possible to say with certainty that increased aerosol concentrations enhanced convection in these CAMP2Ex scenes based solely on the correlations presented in this study; rather, the data suggest the possibility for aerosol enhancement of convection and further analyses would increase confidence in these results.
Given the intriguing nature of some comparisons in this study, while also considering the aforementioned limitations, future work would greatly benefit these science questions. Future efforts could look at addressing these limitations, such as using an advanced ZH attenuation-correction method and distinguishing areas where PixelsKu were adjacent or separated. Employing other datasets from the P-3 and Learjet-35 aircraft, in addition to incorporating numerical simulations, may increase the reliability of the strongest correlations observed. While our study sought to emphasize data from the P-3 aircraft, other remote-sensing data (e.g., satellite) may help with assessing nearby convection just outside of the P-3 observation range. Other convective metrics could supplement those selected for this study, such as peak 30 dBZ ZH contour height in a storm given its direct relation to updraft magnitude (e.g., Straka et al., 2000; Amiot et al., 2019). Likewise, additional environmental parameters, such as wet-bulb potential temperature profiles (Williams and Renno, 1993), would be useful to examine. We focused on aerosol concentrations, given their significant influence on cloud particle size distributions (all else being equal), but other aerosol properties (e.g., type, composition, and hygroscopicity) and their vertical location/distribution may also be helpful to consider, as would direct computation of updraft vertical velocity. Lastly, as one of the main takeaways from this paper, examining some of the most-significant convective–aerosol correlations in greater detail would be of significant benefit.
The AMPR, APR-3, AVAPS, and HSRL2 data are available on the NASA Langley Research Center's Airborne Science Data for Atmospheric Composition repository at https://www-air.larc.nasa.gov/cgi-bin/ArcView/camp2ex, cited herein as Aknan and Chen (2020). Objective selections of threshold values for environmental stratification were performed using Python's NumPy nanpercentile function, and the random data sampling during the bootstrapping approach was accomplished using Python's NumPy random.choice function (Harris et al., 2020). Pearson correlation coefficients and p values were calculated using Python's SciPy pearsonr function (Virtanen et al., 2020). Several of the environmental parameters were calculated using Python's MetPy package (May et al., 2022), including the mixed_layer_cape_cin function for CAPEmod, the calc.lcl function for LCL altitude, and SkewT function for producing the dropsonde image in Fig. 1.
The supplement related to this article is available online at https://doi.org/10.5194/acp-25-12335-2025-supplement.
CGA performed all primary analyses and wrote the paper with feedback and contributions from all co-authors. TJL supervised the study, served as AMPR principal investigator (PI), and assisted with refining the methods and interpreting results. CGA and TJL processed the AMPR data. SCvdH served as PI for AVAPS, while RAF and CAH served as co-PIs for HSRL2. OOS processed the APR-3 data. SCvdH, RAF, OOS, LDC, SAC, and JRM assisted with refining the methods and interpreting results. SWF and GAS processed the AVAPS data. ST served as APR-3 PI.
The contact author has declared that none of the authors has any competing interests.
Publisher's note: Copernicus Publications remains neutral with regard to jurisdictional claims made in the text, published maps, institutional affiliations, or any other geographical representation in this paper. While Copernicus Publications makes every effort to include appropriate place names, the final responsibility lies with the authors.
This paper is part of the special issue “Cloud, Aerosol and Monsoon Processes Philippines Experiment (CAMP2Ex) (ACP/AMT inter-journal SI)”. It is not associated with a conference.
We are grateful to Hal Maring, for financial support throughout the CAMP2Ex deployment and data analyses, and to Jeff Reid, for managing the CAMP2Ex mission. We would also like to thank Wojciech W. Grabowski and the three anonymous reviewers for their insightful comments and suggestions that helped improve this paper.
Corey G. Amiot acknowledges funding from the NASA Marshall Space Flight Center through cooperative agreement 80MSFC22M0001 with The University of Alabama in Huntsville. Corey G. Amiot's research was further supported by an appointment to the NASA Postdoctoral Program at the NASA Marshall Space Flight Center, administered by Oak Ridge Associated Universities under contract with NASA, through contract 80HQTR21CA005.
This paper was edited by Raphaela Vogel and reviewed by Wojciech W. Grabowski and three anonymous referees.
Aknan, A. and Chen, G.: Joint data repository – CAMP2Ex, PISTON, NASA Langley Research Center [data set], https://www-air.larc.nasa.gov/missions/camp2ex/index.html, last access: 16 November 2020.
Albrecht, B. A.: Aerosols, cloud microphysics, and fractional cloudiness, Science, 245, 1227–1230, https://doi.org/10.1126/science.245.4923.1227, 1989.
Altaratz, O., Koren, I., Reisin, T., Kostinski, A., Feingold, G., Levin, Z., and Yin, Y.: Aerosols' influence on the interplay between condensation, evaporation and rain in warm cumulus cloud, Atmos. Chem. Phys., 8, 15–24, https://doi.org/10.5194/acp-8-15-2008, 2008.
Amiot, C. G.: Airborne passive microwave geophysical retrievals and applications in assessing environmental and aerosol impacts on maritime convection, PhD dissertation, Dept. of Atmospheric and Earth Science, The University of Alabama in Huntsville, Huntsville, AL, 176 pp., https://louis.uah.edu/uah-dissertations/278/ (last access: 2 August 2023), 2023.
Amiot, C. G., Carey, L. D., Roeder, W. P., McNamara, T. M., and Blakeslee, R. J.: C-band dual-polarization radar signatures of wet downbursts around Cape Canaveral, Florida, Weather Forecast., 34, 103–131, https://doi.org/10.1175/WAF-D-18-0081.1, 2019.
Amiot, C. G., Biswas, S. K., Lang, T. J., and Duncan, D. I.: Dual-polarization deconvolution and geophysical retrievals from the Advanced Microwave Precipitation Radiometer during OLYMPEX/RADEX, J. Atmos. Ocean. Tech., 38, 607–628, https://doi.org/10.1175/JTECH-D-19-0218.1, 2021.
Andreae, M. O., Rosenfeld, D., Artaxo, P., Costa, A. A., Frank, G. P., Longo, K. M., and Silva-Dias, M. A. F.: Smoking rain clouds over the Amazon, Science, 303, 1337–1342, https://doi.org/10.1126/science.1092779, 2004.
Atmosphere Observing System (AOS): Atmosphere Observing System, National Aeronautics and Space Administration, https://aos.gsfc.nasa.gov/, last access: 16 March 2022.
Berg, W., L'Ecuyer, T., and van den Heever, S.: Evidence for the impact of aerosols on the onset and microphysical properties of rainfall from a combination of satellite observations and cloud-resolving model simulations, J. Geophys. Res.-Atmos., 113, D14S23, https://doi.org/10.1029/2007JD009649, 2008.
Blanchard, D. O.: Assessing the vertical distribution of convective available potential energy, Weather Forecast., 13, 870–877, https://doi.org/10.1175/1520-0434(1998)013<0870:ATVDOC>2.0.CO;2, 1998.
Burton, S. P., Chemyakin, E., Liu, X., Knobelspiesse, K., Stamnes, S., Sawamura, P., Moore, R. H., Hostetler, C. A., and Ferrare, R. A.: Information content and sensitivity of the 3β+2α lidar measurement system for aerosol microphysical retrievals, Atmos. Meas. Tech., 9, 5555–5574, https://doi.org/10.5194/amt-9-5555-2016, 2016.
Cecil, D. J. and Chronis, T.: Polarization-corrected temperatures for 10-, 19-, 37-, and 89 GHz passive microwave frequencies, J. Appl. Meteorol. Clim., 57, 2249–2265, https://doi.org/10.1175/JAMC-D-18-0022.1, 2018.
Chand, D., Wood, R., Anderson, T. L., Satheesh, S. K., and Carlson, R. J.: Satellite-derived direct radiative effect of aerosols dependent on cloud cover, Nat. Geosci., 2, 181–184, https://doi.org/10.1038/ngeo437, 2009.
Cotton, W. R. and Walko, R.: Examination of aerosol-induced convective invigoration using idealized simulations, J. Atmos. Sci., 78, 287–298, https://doi.org/10.1175/JAS-D-20-0023.1, 2021.
Durden, S., Tanelli, S., and Sy, O. O.: Product handbook for the Airborne Precipitation Radar Third Generation (APR3, all products): CAMP2Ex version 2, NASA Langley Research Center, 15 pp., https://www-air.larc.nasa.gov/cgi-bin/ArcView/camp2ex (last access: 3 April 2023), 2020b.
Durden, S. L., Tanelli, S., and Sy, O. O.: Comparison of GPM DFR and airborne radar observations in OLYMPEX, IEEE Geosci. Remote S., 17, 1707–1711, https://doi.org/10.1109/LGRS.2019.2952287, 2020a.
Earth Science Project Office (ESPO): CAMP2Ex, NASA Ames Research Center, https://espo.nasa.gov/camp2ex/content/CAMP2Ex, last access: 25 April 2020.
Fan, J., Rosenfeld, D., Zhang, Y., Giangrande, S. E., Li, Z., Machado, L. A. T., Martin, S. T., Yang, Y., Wang, J., Artaxo, P., Barbosa, H. M. J., Braga, R. C., Comstock, J. M., Feng, Z., Gao, W., Gomes, H. B., Mei, F., Pöhlker, C., Pöhlker, M. L., Pöschl, U., and de Souza, R. A. F.: Substantial convection and precipitation enhancements by ultrafine aerosol particles, Science, 359, 411–418, https://doi.org/10.1126/science.aan8461, 2018.
Ferrare, R., Hair, J., Hostetler, C., Shingler, T., Burton, S. P., Fenn, M., Clayton, M., Scarino, A. J., Harper, D., Seaman, S., Cook, A., Crosbie, E., Winstead, E., Ziemba, L., Thornhill, L., Robinson, C., Moore, R., Vaughan, M., Sorooshian, A., Schlosser, J. S., Liu, H., Zhang, B., Diskin, G., DiGangi, J., Nowak, J., Choi, Y., Zuidema, P., and Chellappan, S.: Airborne HSRL-2 measurements of elevated aerosol depolarization associated with non-spherical sea salt, Front. Remote Sens., 4, 1143944, https://doi.org/10.3389/frsen.2023.1143944, 2023.
Freeman, S., Sokolowsky, G. A., and van den Heever, S. C.: CAMP2Ex AVAPS readme/quick start guide, NASA Langley Research Center, 6 pp., https://www-air.larc.nasa.gov/cgi-bin/ArcView/camp2ex (last access: 24 November 2024), 2020.
Grabowski, W. W.: Can the impact of aerosols on deep convection be isolated from meteorological effects in atmospheric observations?, J. Atmos. Sci., 75, 3347–3363, https://doi.org/10.1175/JAS-D-18-0105.1, 2018.
Grabowski, W. W.: Daytime convective development over land: The role of surface forcing, Q. J. Roy. Meteor. Soc., 149, 2800–2819, https://doi.org/10.1002/qj.4532, 2023.
Grabowski, W. W. and Morrison, H.: Untangling microphysical impacts on deep convection applying a novel modeling methodology, Part II: Double-moment microphysics, J. Atmos. Sci., 73, 3749–3770, https://doi.org/10.1175/JAS-D-15-0367.1, 2016.
Grabowski, W. W. and Morrison, H.: Modeling condensation in deep convection, J. Atmos. Sci., 74, 2247–2267, https://doi.org/10.1175/JAS-D-16-0255.1, 2017.
Grabowski, W. W. and Morrison, H.: Do Ultrafine Cloud Condensation Nuclei Invigorate Deep Convection?, J. Atmos. Sci., 77, 2567–2583, https://doi.org/10.1175/JAS-D-20-0012.1, 2020.
George, J. J.: Weather Forecasting for Aeronautics, Academic Press, 673 pp., ISBN 9781483256450, 1960.
Hair, J. W., Hostetler, C. A., Cook, A. L., Harper, D. B., Ferrare, R. A., Mack, T. L., Welch, W., Izquierdo, L. R., and Hovis, F. E.: Airborne High Spectral Resolution Lidar for profiling aerosol optical properties, Appl. Optics, 47, 6734–6752, https://doi.org/10.1364/AO.47.006734, 2008.
Harris, C. R., Millman, K. J., van der Walt, S., J., Gommers, R., Virtanen, P., Cournapeau, D., Wieser, E., Taylor, J., Berg, S., Smith, N. J., Kern, R., Picus, M., Hoyer, S., van Kerkwijk, M. H., Brett, M., Haldane, A., del Río, J. F., Wiebe, M., Peterson, P., Gérard-Marchant, P., Sheppard, K., Reddy, T., Weckesser, W., Abbasi, H., Gohlke, C., and Oliphant, T. E.: Array programming with NumPy, Nature, 585, 357–362, https://doi.org/10.1038/s41586-020-2649-2, 2020.
Hastings, R. and Richardson, R.: Long-term morphological changes in simulated supercells following mergers with nascent supercells in directionally varying shear, Mon. Weather Rev., 144, 471–499, https://doi.org/10.1175/MWR-D-15-0193.1, 2016.
Hock, T. and Young, K.: GPM Ground Validation Advanced Vertical Atmospheric Profiling System (AVAPS) OLYMPEX, NASA Global Hydrology Resource Center DAAC, https://doi.org/10.5067/GPMGV/OLYMPEX/AVAPS/DATA101, 2017.
Hong, S. and Shin, I.: Wind speed retrieval based on sea surface roughness measurements from spaceborne microwave radiometers, J. Appl. Meteorol. Clim., 52, 507–516, https://doi.org/10.1175/JAMC-D-11-0209.1, 2013.
Hostetler, C. A.: CAMP2Ex HSRL-2 ReadMe, NASA Langley Research Center, 1 pp., https://www-air.larc.nasa.gov/cgi-bin/ArcView/camp2ex (last access: 17 January 2023), 2020.
Igel, A. L. and van den Heever, S. C.: Invigoration or enervation of convective clouds by aerosols?, Geophys. Res. Lett., 48, e2021GL093804, https://doi.org/10.1029/2021GL093804, 2021.
Jiang, H. and Zipser, E. J.: Retrieval of hydrometeor profiles in tropical cyclones and convection from combined radar and radiometer observations, J. Appl. Meteorol. Clim., 45, 1096–1115, https://doi.org/10.1175/JAM2386.1, 2006.
Johnson, J. T., MacKeen, P. L., Witt, A., Mitchell, E. D., Stumpf, G. J., Eilts, M. D., and Thomas, K. W.: The Storm Cell Identification and Tracking Algorithm: An enhanced WSR-88D algorithm, Weather Forecast., 13, 263–276, https://doi.org/10.1175/1520-0434(1998)013<0263:TSCIAT>2.0.CO;2, 1998.
Junge, C. and McLaren, E.: Relationship of cloud nuclei spectra to aerosol size distribution and composition, J. Atmos. Sci., 28, 382–390, https://doi.org/10.1175/1520-0469(1971)028<0382:ROCNST>2.0.CO;2, 1971.
Kollias, P., Albrecht, B. A., Lhermitte, R., and Savtchenko, A.: Radar observations of updrafts, downdrafts, and turbulence in fair-weather cumuli, J. Atmos. Sci., 58, 1750–1766, https://doi.org/10.1175/1520-0469(2001)058<1750:ROOUDA>2.0.CO;2, 2001.
Lang, T., Amiot, C., and Biswas, S.: AMPR CAMP2Ex, calibrated and quality-controlled flight dataset, level 2B, revision 1, NASA Langley Research Center, 16 pp., https://www-air.larc.nasa.gov/cgi-bin/ArcView/camp2ex (last access: 14 August 2021), 2021.
Lenhardt, E. D., Gao, L., Redemann, J., Xu, F., Burton, S. P., Cairns, B., Chang, I., Ferrare, R. A., Hostetler, C. A., Saide, P. E., Howes, C., Shinozuka, Y., Stamnes, S., Kacarab, M., Dobracki, A., Wong, J., Freitag, S., and Nenes, A.: Use of lidar aerosol extinction and backscatter coefficients to estimate cloud condensation nuclei (CCN) concentrations in the southeast Atlantic, Atmos. Meas. Tech., 16, 2037–2054, https://doi.org/10.5194/amt-16-2037-2023, 2023.
Liao, L. and Meneghini, R.: A study on the feasibility of dual-wavelength radar for identification of hydrometeor phases, J. Appl. Meteorol. Clim., 50, 449–456, https://doi.org/10.1175/2010JAMC2499.1, 2011.
Liao, L., Meneghini, R., Tian, L., and Heymsfield, G. M.: Retrieval of snow and rain from combined X- and W-band airborne radar measurements, IEEE T. Geosci. Remote, 46, 1514–1524, https://doi.org/10.1109/TGRS.2008.916079, 2008.
Lin, J. C., Matsui, T., Pielke, R. A., and Kummerow, C.: Effects of biomass-burning-derived aerosols on precipitation and clouds in the Amazon Basin: a satellite-based empirical study, J. Geophys. Res.-Atmos., 111, D19204, https://doi.org/10.1029/2005JD006884, 2006.
Liu, J., Li, Z., and Cribb, M.: Response of marine boundary layer cloud properties to aerosol perturbations associated with meteorological conditions from the 19 month AMF-Azores campaign, J. Atmos. Sci., 73, 4253–4268, https://doi.org/10.1175/JAS-D-15-0364.1, 2016.
Lucas, C., Zipser, E. J., and Ferrier, B. S.: Sensitivity of tropical west Pacific oceanic squall lines to tropospheric wind and moisture profiles, J. Atmos. Sci., 57, 2351–2373, https://doi.org/10.1175/1520-0469(2000)057<2351:SOTWPO>2.0.CO;2, 2000.
Marinescu, P. J., van den Heever, S. C., Heikenfeld, M., Barrett, A. I., Barthlott, C., Hoose, C., Fan, J., Fridlind, A. M., Matsui, T., Miltenberger, A. K., Stier, P. Vie, B., White, B. A., and Zhang, Y.: Impacts of varying concentrations of cloud condensation nuclei on deep convective cloud updrafts – A multimodel assessment, J. Atmos. Sci., 78, 1147–1172, https://doi.org/10.1175/JAS-D-20-0200.1, 2021.
Markowski, P. and Richardson, Y.: Mesoscale Meteorology in Midlatitudes, Wiley-Blackwell, 407 pp., ISBN 9781119966678, 2010.
May, R. M., Goebbert, K. H., Thielen, J. E., Leeman, J. R., Camron, M. D., Bruick, Z., Bruning, E. C., Manser, R. P., Arms, S. C., and Marsh, P. T.: MetPy: A meteorological Python library for data analysis and visualization, B. Am. Meteorol. Soc., 103, E2273–E2284, https://doi.org/10.1175/BAMS-D-21-0125.1, 2022.
Mulholland, J. P., Peters, J. M., and Morrison, H.: How does LCL height influence deep convective updraft width?, Geophys. Res. Lett., 48, e2021GL093316, https://doi.org/10.1029/2021GL093316, 2021.
Öktem, R., Romps, D. M., and Varble, A. C.: No warm-phase invigoration of convection detected during GoAmazon, J. Atmos. Sci., 80, 2345–2364, https://doi.org/10.1175/JAS-D-22-0241.1, 2023.
Orlanski, I.: A rational subdivision of scales for atmospheric processes, B. Am. Meteorol. Soc., 56, 527–530, https://doi.org/10.1175/1520-0477-56.5.527, 1975.
Redemann, J. and Gao, L.: A machine learning paradigm for necessary observations to reduce uncertainties in aerosol climate forcing, Nat. Commun., 15, 8343, https://doi.org/10.1038/s41467-024-52747-y, 2024.
Redemann, J., Wood, R., Zuidema, P., Doherty, S. J., Luna, B., LeBlanc, S. E., Diamond, M. S., Shinozuka, Y., Chang, I. Y., Ueyama, R., Pfister, L., Ryoo, J.-M., Dobracki, A. N., da Silva, A. M., Longo, K. M., Kacenelenbogen, M. S., Flynn, C. J., Pistone, K., Knox, N. M., Piketh, S. J., Haywood, J. M., Formenti, P., Mallet, M., Stier, P., Ackerman, A. S., Bauer, S. E., Fridlind, A. M., Carmichael, G. R., Saide, P. E., Ferrada, G. A., Howell, S. G., Freitag, S., Cairns, B., Holben, B. N., Knobelspiesse, K. D., Tanelli, S., L'Ecuyer, T. S., Dzambo, A. M., Sy, O. O., McFarquhar, G. M., Poellot, M. R., Gupta, S., O'Brien, J. R., Nenes, A., Kacarab, M., Wong, J. P. S., Small-Griswold, J. D., Thornhill, K. L., Noone, D., Podolske, J. R., Schmidt, K. S., Pilewskie, P., Chen, H., Cochrane, S. P., Sedlacek, A. J., Lang, T. J., Stith, E., Segal-Rozenhaimer, M., Ferrare, R. A., Burton, S. P., Hostetler, C. A., Diner, D. J., Seidel, F. C., Platnick, S. E., Myers, J. S., Meyer, K. G., Spangenberg, D. A., Maring, H., and Gao, L.: An overview of the ORACLES (ObseRvations of Aerosols above CLouds and their intEractionS) project: aerosol–cloud–radiation interactions in the southeast Atlantic basin, Atmos. Chem. Phys., 21, 1507–1563, https://doi.org/10.5194/acp-21-1507-2021, 2021.
Reid, J. S., Maring, H. B., Narisma, G. T., van den Heever, S., Di Girolamo, L., Ferrare, R., Lawson, P., Mace, G. G., Simpas, J. B., Tanelli, S., Ziemba, L., van Diedenhoven, B., Bruintjes, R., Bucholtz, A., Cairns, B., Cambaliza, M. O., Chen, G., Diskin, G. S., Flynn, J. H., Hostetler, C. A., Holz, R. E., Lang, T. J., Schmidt, K. S., Smith, G., Sorooshian, A., Thompson E. J., Thornhill, K. L., Trepte, C., Wang, J., Woods, S., Yoon, S., Alexandrov, M., Alvarez, S., Amiot, C. G., Bennett, J. R., Brooks, M., Burton, S. P., Cayanan, E., Chen, H., Collow, A., Crosbie, E., DaSilva, A., DiGangi, J. P., Flagg, D. D., Freeman, S. W., Fu, D., Fukada, E., Hilario, M. R. A., Hong, Y., Hristova-Veleva, S. M., Kuehn, R., Kowch, R. S., Leung, G. R., Loveridge, J., Meyer, K., Miller, R. M., Montes, M. J., Moum, J. N., Nenes, A., Nesbitt, S. W., Norgren, M., Nowottnick, E. P., Rauber, R. M., Reid, E. A., Rutledge, S., Schlosser, J. S., Sekiyama, T. T., Shook, M. A., Sokolowsky, G. A., Stamnes, S. A., Tanaka, T. Y., Wasilewski, A., Xian, P., Xiao, Q., Xu, Z., and Zavaleta, J.: The coupling between tropical meteorology, aerosol lifecycle, convection and the energy budget: The Cloud, Aerosol and Monsoon Processes Philippines Experiment (CAMP2Ex), B. Am. Meteorol. Soc., 106, E1179–E1205, https://doi.org/10.1175/BAMS-D-21-0285.1, 2023.
Rinehart, R. E.: Radar for Meteorologists, Rinehart Publications, 482 pp., ISBN 9780965800211, 2010.
Rogers, R. R., Hair, J. W., Hostetler, C. A., Ferrare, R. A., Obland, M. D., Cook, A. L., Harper, D. B., Burton, S. P., Shinozuka, Y., McNaughton, C. S., Clarke, A. D., Redemann, J., Russell, P. B., Livingston, J. M., and Kleinman, L. I.: NASA LaRC airborne high spectral resolution lidar aerosol measurements during MILAGRO: observations and validation, Atmos. Chem. Phys., 9, 4811–4826, https://doi.org/10.5194/acp-9-4811-2009, 2009.
Rosenfeld, D. and Lensky, I. M.: Satellite-based insight into precipitation formation processes in continental and maritime convective clouds, B. Am. Meteorol. Soc., 79, 2457–2476, https://doi.org/10.1175/1520-0477(1998)079<2457:SBIIPF>2.0.CO;2, 1998.
Rosenfeld, D., Lohmann, U., Raga, G. B., O'Dowd, C. D., Kulmala, M., Fuzzi, S., Reissell, A., and Andreae, M. O.: Flood or drought: How do aerosols affect precipitation?, Science, 321, 1309–1313, https://doi.org/10.1126/science.1160606, 2008.
Saleeby, S. M., Berg, W., van den Heever, S., and L'Ecuyer, T.: Impact of cloud-nucleating aerosols in cloud-resolving model simulations of warm-rain precipitation in the East China Sea, J. Atmos. Sci., 67, 3916–3930, https://doi.org/10.1175/2010JAS3528.1, 2010.
Schmid, B., Ferrare, R., Flynn, C., Elleman, R., Covert, D., Strawa, A., Welton, E., Turner, D., Jonsson, H., Redemann, J., Eilers, J., Ricci, K., Hallar, A. G., Clayton, M., Michalsky, J., Smirnov, A., Holben, B., and Barnard, J.: How well do state-of-the-art techniques measuring the vertical profile of tropospheric aerosol extinction compare?, J. Geophys. Res.-Atmos., 111, D05S07, https://doi.org/10.1029/2005JD005837, 2006.
Sheffield, A. M., Saleeby, S. M., and van den Heever, S. C.: Aerosol-induced mechanisms for cumulus congestus growth, J. Geophys. Res.-Atmos., 120, 8941–8952, https://doi.org/10.1002/2015JD023743, 2015.
Sherburn, K. D. and Parker, M. D.: Climatology and ingredients of significant severe convection in high-shear, low-CAPE environments, Weather Forecast., 29, 854–877, https://doi.org/10.1175/WAF-D-13-00041.1, 2014.
Sherwood, S. C.: Aerosols and ice particle size in tropical cumulonimbus, J. Climate, 15, 1051–1063, https://doi.org/10.1175/1520-0442(2002)015<1051:AAIPSI>2.0.CO;2, 2002.
Smalley, K. M. and Rapp, A. D.: The role of cloud size and environmental moisture in shallow cumulus precipitation, J. Appl. Meteorol. Clim., 59, 535–550, https://doi.org/10.1175/JAMC-D-19-0145.1, 2020.
Sokolowsky, G. A., Freeman, S. W., and van den Heever, S. C.: Sensitivities of maritime tropical trimodal convection to aerosols and boundary layer static stability, J. Atmos. Sci., 79, 2549–2570, https://doi.org/10.1175/JAS-D-21-0260.1, 2022.
Spencer, R. W., Hood, R. E., Lafontaine, F. J., Smith, E. A., Platt, R., Galliano, J., Griffin, V. L., and Lobl, E.: High-resolution imaging of rain systems with the Advanced Microwave Precipitation Radiometer, J. Atmos. Ocean. Tech., 11, 849–857, https://doi.org/10.1175/1520-0426(1994)011<0849:HRIORS>2.0.CO;2, 1994.
Straka, J. M., Zrnić, D. S., and Ryzhkov, A. V.: Bulk hydrometeor classification and quantification using polarimetric radar data: Synthesis of relations, J. Appl. Meteorol., 39, 1341–1372, https://doi.org/10.1175/1520-0450(2000)039<1341:BHCAQU>2.0.CO;2, 2000.
Stroud, C. A., Nenes, A., Jimenez, J. L., DeCarlo, P. F., Huffman, J. A., Bruintjes, R., Nemitz, E., Delia, A. E., Toohey, D. W., Guenther, A. B., and Nandi, S.: Cloud activating properties of aerosol observed during CELTIC, J. Atmos. Sci., 64, 441–459, https://doi.org/10.1175/JAS3843.1, 2007.
van den Heever, S. C. and Cotton, W. R.: Urban aerosol impacts on downwind convective storms, J. Appl. Meteorol. Clim., 46, 828–850, https://doi.org/10.1175/JAM2492.1, 2007.
van den Heever, S. C., Carrió, G. G., Cotton, W. R., DeMott, P. J., and Prenni, A. J.: Impacts of nucleating aerosol on Florida storms. Part I: Mesoscale simulations, J. Atmos. Sci., 63, 1752–1775, https://doi.org/10.1175/JAS3713.1, 2006.
Varble, A.: Erroneous attribution of deep convective invigoration to aerosol concentration, J. Atmos. Sci., 75, 1351–1368, https://doi.org/10.1175/JAS-D-17-0217.1, 2018.
Varble, A. C., Igel, A. L., Morrison, H., Grabowski, W. W., and Lebo, Z. J.: Opinion: A critical evaluation of the evidence for aerosol invigoration of deep convection, Atmos. Chem. Phys., 23, 13791–13808, https://doi.org/10.5194/acp-23-13791-2023, 2023.
Veals, P. G., Varble, A. C., Russell, J. O. H., Hardin, J. C., and Zipser, E. J.: Indications of a decrease in the depth of deep convective cores with increasing aerosol concentration during the CACTI campaign, J. Atmos. Sci., 79, 705–722, https://doi.org/10.1175/JAS-D-21-0119.1, 2022.
Virtanen, P., Gommers, R., Oliphant, T. E., Haberland, M., Reddy, T., Cournapeau, D., Burovski, E., Peterson, P., Weckesser, W., Bright, J., van der Walt, S. J., Brett, M., Wilson, J., Millman, K. J., Mayorov, N., Nelson, A. R. J., Jones, E., Kern, R., Larson, E., Carey, C. J., Polat, I., Feng, Y., Moore, E. W., VanderPlas, J., Laxalde, D., Perktold, J., Cimrman, R., Henriksen, I., Quintero, E. A., Harris, C. R., Archibald, A. M., Ribeiro, A. H., Pedregosa, F., van Mulbregt, P., and SciPy 1.0 Contributors: SciPy 1.0: Fundamental algorithms for scientific computing in Python, Nat. Methods, 17, 261–272, https://doi.org/10.1038/s41592-019-0686-2, 2020.
Vömel, H., Goodstein, M., and Aredt, C.: Dropsonde data quality report: Clouds, Aerosol and Monsoon Processes-Philippines Experiment (CAMP2Ex, 2019). Version 1.0, UCAR/NCAR – Earth Observing Laboratory, https://www-air.larc.nasa.gov/cgi-bin/ArcView/camp2ex, last access: 16 November 2020.
Wang, J. K., Ford, T. W., and Quiring, S. M.: Distinguishing between unorganized and organized convection when examining land–atmosphere relationships, J. Appl. Meteorol. Clim., 54, 2229–2243, https://doi.org/10.1175/JAMC-D-15-0086.1, 2015.
Wentz, F. J. and Spencer, R. W.: SSM/I rain retrievals within a unified all-weather ocean algorithm, J. Atmos. Sci., 55, 1613–1627, https://doi.org/10.1175/1520-0469(1998)055<1613:SIRRWA>2.0.CO;2, 1998.
Wilheit, T. T. and Chang, A. T. C.: An algorithm for retrieval of ocean surface and atmospheric parameters from the observations of the scanning multichannel microwave radiometer, Radio Sci., 15, 525–544, https://doi.org/10.1029/RS015i003p00525, 1980.
Wilks, D. S.: Statistical Methods in the Atmospheric Sciences, Academic Press, 676 pp., ISBN 9780123850232, 2011.
Williams, E. and Renno, N.: An analysis of the conditional instability of the tropical atmosphere, Mon. Weather Rev., 121, 21–36, https://doi.org/10.1175/1520-0493(1993)121<0021:AAOTCI>2.0.CO;2, 1993.
Zhang, L., Rosenfeld, D., Pan, Z., Mao, F., Zhu, Y., Lu, X., and Gong, W.: Observing aerosol primary convective invigoration and its meteorological feedback, Geophys. Res. Lett., 50, e2023GL104151, https://doi.org/10.1029/2023GL104151, 2023.