the Creative Commons Attribution 4.0 License.
the Creative Commons Attribution 4.0 License.
 | 02 Oct 2025
Locally emitted fungal spores serve as high-temperature ice nucleating particles in the European sub-Arctic
Jürgen Gratzl
Alexander Böhmländer
Sanna Pätsi
Clara-E. Pogner
Markus Gorfer
David Brus
Konstantinos Matthaios Doulgeris
Florian Wieland
Eija Asmi
Annika Saarto
Ottmar Möhler
Dominik Stolzenburg
Hinrich Grothe
Primary biological aerosol particles (PBAPs) can influence weather and climate by acting as high-temperature ice nucleating particles (INPs), especially in clean, rural regions like the European sub-Arctic. However, the actual contribution to atmospheric ice nucleation and the exact identity of PBAPs serving as INPs remain poorly understood.
Here, we present measurements of INPs and highly fluorescent aerosol particles (HFAPs) over the course of 1 year at the Pallas Atmosphere-Ecosystem Supersite in the Finnish sub-Arctic, aiming to determine whether PBAPs significantly contribute to atmospheric INPs and to identify which types do so. Our findings indicate that certain HFAPs are strongly influenced by meteorological variables, with high concentrations occurring when the station is within the atmospheric mixing layer, suggesting local biological sources. These HFAPs are the main contributors to high-temperature INPs, with an exceptionally strong correlation (r=0.94, p<0.0001) between HFAP concentrations and INPs active at −13.5 °C. For the first time, to the best of our knowledge, we combine INP and HFAP data with direct fungal spore counts and environmental DNA (eDNA) analysis to determine the biological origins of HFAPs and INPs. The results suggest that most high-temperature INPs are likely fungal spores. eDNA analysis further reveals that airborne fungi are dominated by Basidiomycota and that only a small fraction of the detected fungal genera have, to date, been tested for ice nucleation activity (INA) according to the literature. Among those reported in the literature, most exhibit very low or no INA. This underscores the significant knowledge gap in our understanding of biological ice nucleation in the atmosphere.
- Article
(5064 KB) - Full-text XML
-
Supplement
(38143 KB) - BibTeX
- EndNote


Atmospheric aerosols are important and highly variable constituents of the atmosphere. They impact weather and climate by directly scattering or absorbing solar radiation or by changing the radiative properties and lifetime of clouds by acting as cloud condensation nuclei (CCN) or ice nucleating particles (INPs) (IPCC, 2021; Pruppacher and Klett , 2010). The latter constitute only a minor fraction of the total aerosol population (Vogel et al., 2024; Burrows et al., 2022; Ladino et al., 2019; Si et al., 2018; Boose et al., 2016), and measurements of INP concentrations remain scarce. Measuring and modeling INPs is challenging due to their high spatial and temporal variability and the complexity of their sources (Herbert et al., 2025; Burrows et al., 2022; Welti et al., 2018).
Observations of INPs are particularly rare in Arctic and sub-Arctic environments, where the temperature increase due to anthropogenic climate change is 1.5 to 4 times faster than the global average (Serreze and Barry, 2011; Cohen et al., 2014; Rantanen et al., 2022), a phenomenon known as Arctic amplification. Although the ice or snow albedo effect is considered the primary driver of Arctic amplification (Screen and Simmonds, 2010), cloud feedbacks are the major uncertainties in climate projection models (Ceppi et al., 2017; Zelinka et al., 2020). Model studies suggest that the radiative properties of low-level Arctic clouds are sensitive to variations in INP concentrations (Gjelsvik et al., 2025; Xie et al., 2013). This indicates that the abundance of INPs and the temperatures at which they become active may be a crucial factor in understanding Arctic amplification (Murray et al., 2021; Tan et al., 2022). In particular, the imprecise representation of biological INPs can significantly impact the overall accuracy of INP predictions in climate models (Cornwell et al., 2023).
INPs active at temperatures below −15 °C are generally dominated by mineral dust (Irish et al., 2019; Kanji et al., 2017; Murray et al., 2012; DeMott et al., 2003). Although biological ice nucleation was observed earlier, it was in the 1970s that bacterial cells were systematically shown to nucleate ice at relatively high subzero temperatures (Maki et al., 1974; Schnell and Vali, 1976; Maki and Willoughby, 1978). However, atmospheric primary biological aerosol particles (PBAPs), like fungal spores, pollen, and bacteria, have historically received little attention from atmospheric scientists (Kabir et al., 2020; Xie et al., 2020; Fröhlich-Nowoisky et al., 2016). More recently, emerging evidence suggests that the majority of atmospheric INPs active above −15 °C are of biological origin, as indicated by heat sensitivity tests (e.g., Hartmann et al., 2021; Šantl Temkiv et al., 2019; O’Sullivan et al., 2018; Garcia et al., 2012; Christner et al., 2008) and single-particle fluorescence measurements (Taketani et al., 2025; Kawana et al., 2024; Pereira Freitas et al., 2023; Cornwell et al., 2023; Schneider et al., 2021; Twohy et al., 2016; Mason et al., 2015; Wright et al., 2014; Tobo et al., 2013). Both techniques are valuable, but neither alone is sufficient to pinpoint the exact types of bio-INPs. Additionally, heat tests may deactivate non-biological INPs, introducing uncertainties (Daily et al., 2022). Single particle fluorescence spectrometers, such as the Wideband Integrated Bioaerosol Sensor (WIBS) used in this study, currently lack the ability to reliably differentiate PBAPs without additional instrumentation. For example, a wide variety of biological, natural, and anthropogenic aerosols have been associated with overlapping fluorescence channels of the WIBS. An overview of fluorescent particles detected by the WIBS in field and laboratory studies can be found in Gratzl et al. (2025).
To investigate what types of PBAPs exhibit ice nucleation activity (INA), several laboratory studies have been conducted. INA has been identified in pollen from phylogenetically diverse plants (Pummer et al., 2012; Diehl et al., 2001) and pollen constituents (Augustin et al., 2013; Pummer et al., 2015; Burkart et al., 2021; Matthews et al., 2023; Wieland et al., 2025). Additionally, numerous strains of ice nucleation active bacteria have been isolated from clouds or precipitation (Failor et al., 2017; Šantl Temkiv et al., 2015; Joly et al., 2013; Stephanie and Waturangi, 2011).
In contrast, less is known about the abundance and diversity of atmospheric ice nucleation active fungal spores. To date, only a small fraction of fungal species or genera have been tested for INA, and relatively few have been shown to nucleate ice at temperatures above −15 °C (Tarn et al., 2025; Haga et al., 2014, 2013; Morris et al., 2013; Pummer et al., 2013; Huffman et al., 2013; Pouleur et al., 1992; Jayaweera and Flanagan, 1982). Ascomycota (sac fungi) and Basidiomycota (club fungi) are the two major phyla of fungi. Recent mechanistic insights by Schwidetzky et al. (2023) have demonstrated that INPs of the fungus Fusarium (Ascomycota) consist of small (≈ 5.3 kDa) protein subunits that assemble into larger complexes. These findings highlight that fungi can produce highly efficient biological INPs, although their prevalence in the atmosphere remains poorly understood. Among those fungi tested for INA, most belong to the Ascomycota. However, a high abundance and diversity of Basidiomycota are expected in the atmosphere (Niu et al., 2024; Maki et al., 2023; Qu et al., 2021; Huffman et al., 2013). In the boreal forest, which spans large areas of the sub-Arctic, Basidiomycota could dominate over Ascomycota (Qu et al., 2021; Sterkenburg et al., 2015). Nevertheless, Sanchez-Marroquin et al. (2021) found that most spores associated with INPs collected during aircraft campaigns over the southeast UK resembled Ascomycota. Atmospheric fungal composition likely varies by region and ecosystem type, and findings from mid-latitude regions may not directly reflect the atmospheric fungal composition in boreal or sub-Arctic regions. Given the vast diversity of fungal species, many of which remain uncharacterized for INA, fungal spores, particularly from forest ecosystems, may represent a significant and underexplored source of atmospheric INPs. Recent studies have identified terrestrial environments as important, though not exclusive, sources of biological high-temperature INPs (active above −15 °C) in the Arctic (Jensen et al., 2025; Wieber et al., 2025; Tobo et al., 2024; Pereira Freitas et al., 2023). In northern latitudes, high-temperature INPs show a distinct seasonal pattern, with concentrations peaking in summer during snow- and ice-free periods (Barry et al., 2025; Tobo et al., 2024; Pereira Freitas et al., 2023; Schneider et al., 2021; Wex et al., 2019). Fu et al. (2013) and Pereira Freitas et al. (2023) observed similar seasonal cycles in arabitol and mannitol, chemical tracers of fungal spores (Bauer et al., 2008), which they also attributed to terrestrial sources, in contrast to Arctic haze, which dominates the aerosol composition during winter and early spring (Beck et al., 2024; Asmi et al., 2011; Quinn et al., 2007).
These findings imply that high-temperature INPs may become more prevalent in a warming climate due to Arctic greening and prolonged snow-free periods in the northern boreal forest (Barry et al., 2025; Berner et al., 2020; Tobo et al., 2019; Dankers and Christensen, 2005) and that fungal spores might contribute significantly to the highly active INP population. Since INPs influence cloud microphysics, particularly the phase, lifetime, and radiative properties of mixed-phase clouds (Bellouin et al., 2019), changes in their abundance or composition can have broader implications for Arctic cloud feedbacks and climate sensitivity. More data on the concentration and biological origin of high-temperature INPs in northern latitudes could therefore enhance our understanding of cloud feedback mechanisms and potentially improve present and future climate predictions. Given the vast extent of the boreal forest, it should be considered a potentially critical source of biological INPs. In particular, fungal spores, which are abundant in boreal ecosystems, may represent a key fraction of these biologically derived INPs. Building on this, we hypothesize that locally emitted fungal spores from the northern boreal forest are a major source of high-temperature INPs in the European sub-Arctic. We present measurements of INPs and PBAPs from the Pallas Atmosphere-Ecosystem Supersite. We combine single particle fluorescence measurements with direct fungal spore counts and complement these data with eDNA sequencing of airborne fungi to elucidate the biological origin of high-temperature INPs in this region.
2.1 Observation site
Measurements were conducted at the Sammaltunturi station at the Pallas Atmosphere-Ecosystem Supersite in Finnish Lapland within the Pallas-Yllästunturi National Park. Pallas is located 170 km north of the Arctic Circle, at the northern edge of the boreal forest, and experiences a sub-Arctic climate (Köppen, 1931; Beck et al., 2018). The Sammaltunturi station (67.9733° N, 24.1157° E) is situated on top of Sammaltunturi hill at an elevation of 565 m a.s.l., approximately 100 m above the treeline. As a result, vegetation in the immediate vicinity consists primarily of low vascular plants and lichen (Hatakka et al., 2003). The air at Pallas is considered representative of the clean continental background air of northern Europe, as there are minimal local or regional air pollution sources (Doulgeris et al., 2022; Lohila et al., 2015).
2.2 Setup and timeline
The campaign took place in two parts: the first part was integrated into the Pallas Cloud Experiment 2022 (PaCE22) campaign from September to December 2022, and the second part of the campaign was from April to September 2023. The instruments were operated at either one or both parts of the campaign. The times when each instrument was operated are shown in Fig. 1b. In addition to the instruments described in Sect. 2.3 to 2.8, an Aerodynamic Particle Sizer APS 3321 (TSI, USA, aerodynamic diameter 0.5–20 µm) was operated at the station and was used to confirm meaningful data collection by the WIBS (see Sect. S1 in the Supplement). The setup can be seen in Fig. 1a. The numbers beside the instruments refer to the flow rate (L min−1). The main inlet for aerosol instruments at the Sammaltunturi station is a whole air inlet with no cut-off diameter and thus collects aerosols effectively also during fog and in-cloud periods. The inlet is Aerosol, Clouds and Trace Gases Research Infrastructure (ACTRIS) approved and is located 2 m above the station’s roof and approximately 6 m above ground. The inlet is slightly heated (to about 1–2 °C) to avoid snow and ice accumulation outside when the station is inside clouds or when it is snowing. The sampling into the aerosol instruments is conducted at room temperature. The aerosol instruments connected to the inlet have separate Permapure MD-700 Nafion dryers for sample drying. More details about the inlet and sampling can be found in Backman et al. (2025) and Komppula et al. (2005). All concentrations, except for the Burkard trap, are reported for standard conditions (101 325 Pa, 273.15 K). If not explicitly written otherwise, all data are reported in Eastern European Time (UTC+2 h), which is used as station time in Sammaltunturi.
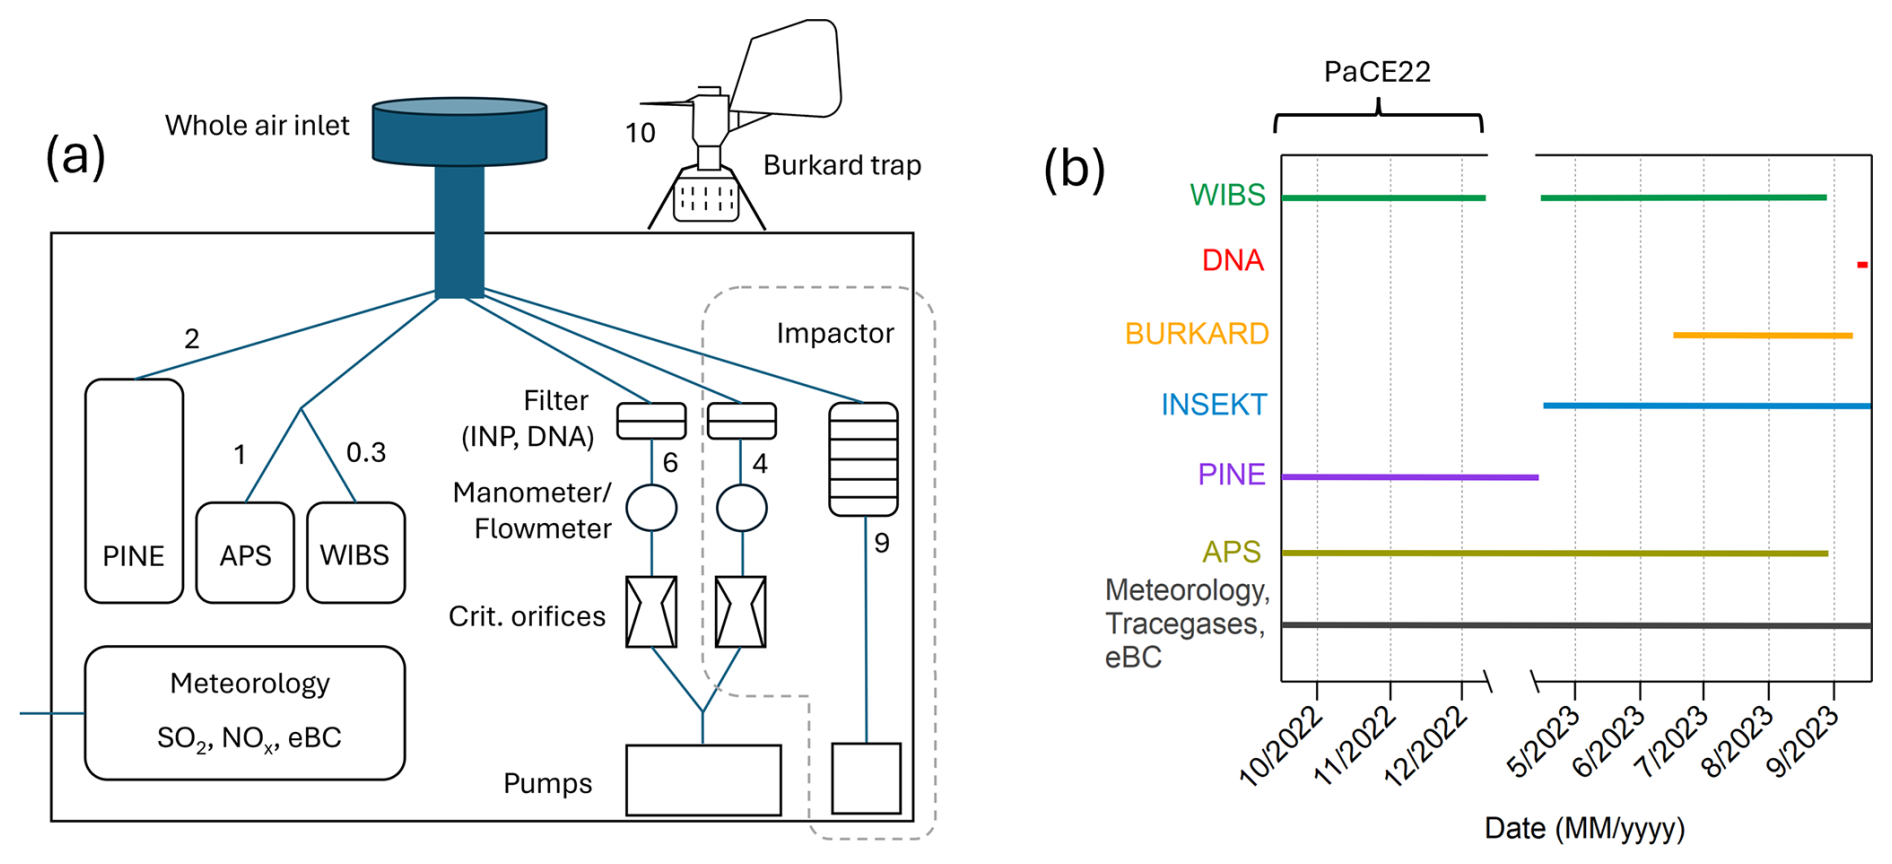
Figure 1(a) Setup of the used instruments at the Sammaltunturi station. On the rooftop: Burkard trap; inside, all other instruments. The numbers beside the instruments indicate the flow rate in L min−1. (b) Timeline of when the specific instruments (or filter loading for subsequent analysis) were operated during the campaign.
2.3 Single particle fluorescence measurement
A Wideband Integrated Bioaerosol Sensor 5/NEO (WIBS, Droplet Measurement Technologies, USA) was used to measure total aerosol particle (TAP) and highly fluorescent aerosol particle (HFAP) concentrations, as well as size distributions from 0.5 to 30 µm. The WIBS is a light-induced fluorescence (LIF) sensor that enables the measurement of autofluorescence in individual aerosol particles. The instrument operates with an inlet flow rate of 0.3 L min−1, directing air through an aerodynamic lens. A 635 nm laser measures particle size and shape and serves as a trigger for two UV-Xenon lamps. These lamps excite particles at wavelengths of 280 and 370 nm, with fluorescence subsequently detected by two detectors at wavelength ranges of 310–400 and 420–650 nm. This results in three fluorescence channels: FL1 (excitation at 280 nm, emission at 310–400 nm), FL2 (excitation at 280 nm, emission at 420–650 nm), and FL3 (excitation at 370 nm, emission at 420–650 nm). A forced trigger measurement is used to identify the fluorescence background, without any particles present in the scattering volume. The forced trigger measurement was done every 6 h for 1 min to account for a possible shift in the background. Here, an aerosol particle is labeled as highly fluorescent (HFAP) if it exceeds the threshold TH, calculated by
in any channel, where is the mean value of the forced trigger intensity and σ is the standard deviation of the same. Using Perring nomenclature (Perring et al., 2015), one can define seven fluorescent particle types, depending on the combination of channels exceeding the threshold: A particles are fluorescent in FL1 only, B particles in FL2 only, and C particles in FL3 only. AB particles are fluorescent in FL1 and FL2 only, AC particles in FL1 and FL3 only, BC in FL2 and FL3 only, and ABC particles are fluorescent in all three channels. The particle types are listed in Table 1, along with representative aerosol classes. The approximated shape of particles is calculated via an analysis of the forward scattered light in four quarters of the quadrant photomultiplier tube and described by the asymmetry factor AS, a dimensionless number between 0 and 100, where a hypothetical perfect sphere should yield the value 0 and a thin fiber should yield a value close to 100 (Gabey et al., 2010). Data acquisition, processing, and quality control are described in detail in Gratzl et al. (2025) for data collected during the PaCE22 campaign and were handled in the same way for the second part of the campaign.
Table 1Description of WIBS particle types and their corresponding fluorescence channels, along with representative particle classes identified using a WIBS-5, WIBS-NEO, or WIBS-5/NEO. Earlier WIBS models operated with different detector gain settings. A comprehensive overview covering all WIBS models is provided in Gratzl et al. (2025).
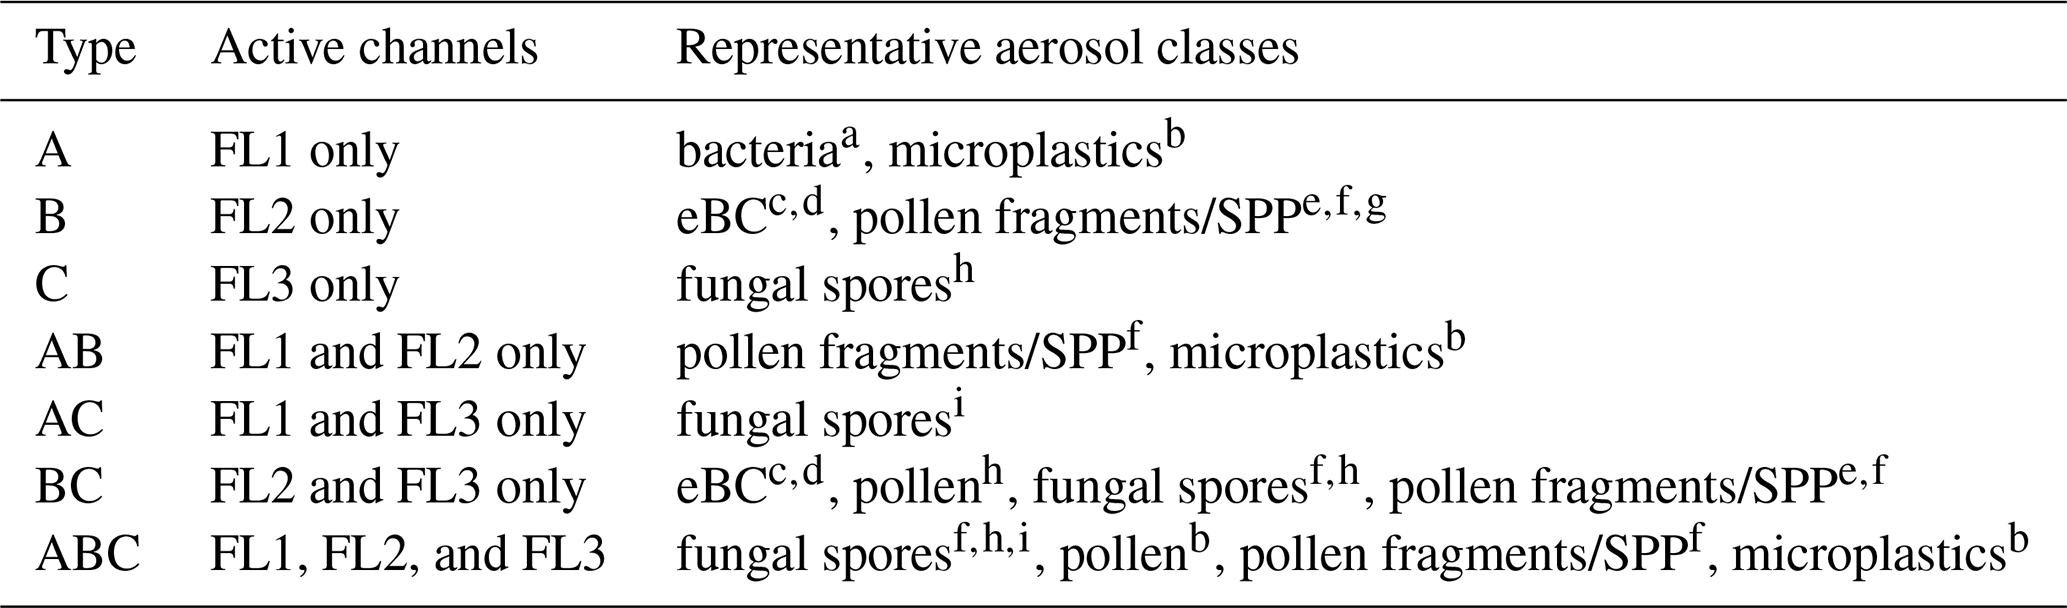
a Katsivela et al. (2025), 9σ threshold; b Gratzl et al. (2025), 3 and 9σ threshold c Beck et al. (2024); 9σ threshold; d Gao et al. (2024), 9σ threshold; e Stone et al. (2021), threshold not reported; f Mampage et al. (2022); 3 threshold; g Hughes et al. (2020), 3 threshold; h Clancy et al. (2025), 6 and 9σ threshold; i Sarangi et al. (2022), threshold after Perring et al. (2015). SPP refers to sub-pollen particles.
2.4 Ice nucleating particle measurements
2.4.1 INSEKT
The Ice Nucleation Spectrometer of the Karlsruhe Institute of Technology (INSEKT) is an offline-based instrument to investigate the freezing ability of aerosol particles down to −25 °C. 47 mm polycarbonate Nuclepore filters (111137, Whatman®) with 0.2 µm pore size were pre-cleaned with 10 % H2O2 and afterwards rinsed with deionized water that was passed through a 0.1 µm syringe filter (6784-2501, Whatman®). The filters were installed in a custom-made stainless steel filter holder. Loaded filters were removed from the filter housing, placed into sterile Petri dishes, and stored in a freezer. The filter handling is described in detail in Böhmländer et al. (2024). The standard flow rate was held constant at 6.0 L min−1 using a critical orifice and a pump (SH-110, Agilent Technologies, Inc.). The critical orifice was fabricated by drilling a small hole through a closed ISO-FK sealing. The flow rate was verified using a flowmeter (Defender 530+, Mesa Labs, Inc.). Sampling times were typically 1 week but ranged from 6 to 17 h for certain filters at the beginning and end of the second part of the campaign. Consequently, the sampled air volume was approximately 60 m3 for most filters. Filters were transported to Germany in a cooled styrofoam box and upon arrival were stored in a freezer at −20 °C until analysis. Aerosol suspensions are created by inserting loaded filters into a polycarbonate tube filled with Nanopure™ water (5 or 8 mL) and subsequently rotating (Schneider et al., 2021). The aerosol suspension and dilutions are split into 50 µL aliquots and filled into PCR trays. Each INSEKT run consists of two 96-well plates (192 wells total), with 32 wells reserved for Nanopure™ water as backgrounds. The remaining wells are divided between one or two samples, depending on the number of dilutions used. The PCR trays are cooled at a rate of 0.33 K min−1, and the grayscale of each aliquot is observed with a camera. A sudden drop in the grayscale value signals the occurrence of a freezing event, leading to a fraction of frozen aliquots as a function of temperature.
The INP concentration in suspension CINP,sus is calculated from the frozen fraction according to Vali (1971):
where d is the dilution scale, Vwell is the volume of one PCR well, and fl is the fraction of liquid droplets. To calculate the INP concentration per sampled air volume CINP,air, we use
where Vsus is the volume of the whole suspension and Vair is the volume of the sampled air. The uncertainties for the INP concentration follow the calculation by Agresti and Coull (1998) for a 95 % confidence interval. The uncertainty for the temperature is 1 standard deviation of the mean. A Nanopure water background is always present in each experiment, limiting the minimal temperature to –25°C. INSEKT is based on the Colorado State University–Ice Spectrometer (Hill et al., 2016), and additional technical details are given in Schneider et al. (2021).
The aerosol suspensions were, in addition to a standard analysis, subjected to a heat treatment to disable the ice nucleating ability of heat-labile INPs at 95 °C for 20 min. These heat-labile INPs are typically of proteinaceous origin, allowing a better understanding of the INP population present during filter sampling (Schneider et al., 2021).
2.4.2 PINE
The Portable Ice Nucleation Experiment (PINE) is an expansion-type cloud chamber with a volume of 10 L (Möhler et al., 2021). Inside an expansion-type cloud chamber, the pressure is decreased rapidly, leading to a near-adiabatic decrease in temperature due to expansion cooling, while the relative humidity (RH) increases. If aerosol particles are present, they are able to act as CCN and/or as INP, leading to the formation of cloud droplets and/or ice crystals. The chamber can be operated between −60 and −10 °C to measure in the mixed-phase regime (> −35 °C) as well as the cirrus regime (< −35 °C). During the PaCE22 campaign, the PINE was either operated in temperature ramp mode or at a constant temperature ranging between −22 and −31 °C. The cloud droplets and ice crystals are detected optically with an optical particle counter (OPC). During analysis, they are divided by their optical size, and the number of ice crystals is counted, representing the number of INPs. An expansion is performed every 6 min, leading to a high temporal resolution of the INP concentration. The PINE is an autonomous instrument that can be controlled remotely via a custom-made LabVIEW program. This dataset is described in more detail in Böhmländer et al. (2025).
2.5 Burkard spore trap
Pollen and fungal spores were monitored with a Burkard 7 d volumetric sampler (short Burkard trap, Burkard Manufacturing Co. Ltd., UK; Hirst, 1952). The sampler was located on an open corridor on the rooftop of the Sammaltunturi station approximately 3 m above ground. The sampling and analyzing methods followed the standard methodology adopted by the Finnish pollen information network following the principles of the European Aeroallergen Network (https://ean.polleninfo.eu/info/en/, last access: 17 September 2025). The air suction volume of the Burkard sampler was, on average, 10 L min−1. Airborne particles were trapped on a Melinex tape coated with an adhesive (Vaseline and paraffin wax mixture). The tape was attached to a clockwork device, which rotated at a rate of 2 mm h−1. After sampling, the tape was cut into pieces, each corresponding to a single day of sampling under normal operation. Due to occasional interruptions, however, data are not available for every day. These pieces were mounted on slides with Gelvatol under a cover glass. Pollen grains and some plant and fungal spores were identified based on morphological features and counted from the samples using optical microscopy. Pollen grains were identified to family or genus level. Spores were counted if the identification to the taxonomic group where the recognition could be done reliably was possible. These are hereinafter referred to as identifiable fungal spores and identifiable plant spores. The sum of both identifiable fungal spores and identifiable plant spores is referred to as identifiable spores. In addition, from 3 separate days, the total number of all fungal spores was counted (even if they could not be assigned to any higher taxonomic level). The spores were divided into two groups: (a) particles that could be reliably identified as fungal spores and (b) a group in which the identification was slightly uncertain, but particles were believed to be fungal spores. Both together are referred to as total fungal spores. The concentrations of the pollen grains, plant spores, and fungal spores of each taxon were determined by random sampling of microscopic fields, with a time accuracy of 2 h (Mäkinen, 1981). In the end, the pollen and spore counts were converted to daily averages per m3 of air.
2.6 eDNA sequencing
For environmental DNA (eDNA) sequencing of airborne fungi, 47 mm polycarbonate filters (Whatman®) with 0.2 µm pore size were installed in a metal filter housing and changed twice a day for 4 d, resulting in eight filters. Loaded filters were removed and stored in a freezer. The filter holder was cleaned carefully with isopropanol before a new filter was installed. The flow rate was recorded at all times and held constant at 4 L min−1 using a critical orifice and a pump. Filters were transported to Austria in a cooling box and, instantly upon arrival, put in a freezer at −20 °C, until brought to the AIT Austrian Institute of Technology GmbH for eDNA analysis.
For DNA extraction, filters were dissolved in 750 µL phenol/chloroform/isoamyl alcohol solution. Subsequently, 750 µL buffer AP1 (proprietary Qiagen sample lysis buffer) from the Plant Mini-Kit (Qiagen) was added to the organic solvents. The mixture was vigorously vortexed and centrifuged at 13 000 rpm for 10 min. The aqueous phase was removed and mixed with 400 µL P3 (proprietary Qiagen precipitation buffer). All further steps followed the manufacturer's protocol. At the end, DNA was eluted with 50 µL AE (proprietary Qiagen DNA elution buffer). Library preparation and high-throughput sequencing were done at LGC Genomics GmbH (Berlin, Germany). The fungal ITS2 region (subregion in ITS between genes for 5.8S and 18S ribosomal RNA; ITS: internal transcribed spacer, region between genes for ribosomal RNA) was amplified with primer pair ITS3Mix/ITS4Mix (adapted from Tedersoo et al., 2014, as outlined in Gorfer et al., 2021) containing Illumina TrueSeq adapters. Reaction mixtures contained 15 pmol of each forward and reverse primer in 20 µL volume of 1 × MyTaq buffer containing 1.5 units of MyTaq DNA polymerase (Bioline GmbH) and 2 µL of BioStabII PCR Enhancer (Sigma-Aldrich). The first amplification of the two-step PCR approach ran for 30 cycles: 1 min at 96 °C pre-denaturation followed by 15 s at 96 °C denaturation, 30 s at 58 °C annealing, 90 s at 70 °C extension, and a final hold at 8 °C. The second amplification was the same as the previous amplification but with standard i7- and i5-sequencing adapters and with a modified annealing temperature, i.e., three cycles at 50 °C followed by seven cycles at 58 °C. DNA concentration of amplicons was assessed by agarose gel electrophoresis. About 20 ng of indexed amplicon DNA of each sample was subsequently pooled. The pooled libraries were purified with one volume of Agencourt AMPure XP beads (Beckman Coulter) to remove primer dimers and other small mispriming products, followed by an additional purification on MinElute columns (Qiagen). The size selection was performed by preparative gel electrophoresis on a low melting point agarose gel. Sequencing was done on an Illumina MiSeq using Illumina MiSeq Reagent Kit v3 (2 × 300 bp (base pairs)). Downstream bioinformatic analyses of raw paired-end reads obtained from MiSeq V3 runs were done as previously described (Gorfer et al., 2021). Initial quality filtering was done with Trimmomatic v. 0.39 (Bolger et al., 2014). The USEARCH program suite (Edgar, 2010) was used for merging the forward and reverse reads with a minimal overlap of 30 bp with fastq_mergepairs. Sequences < 280 bp were all of non-fungal origin and thus filtered out. FASTX toolkit script fastx_barcode_splitter.pl was used to sort out project-specific fungal sequences; USEARCH scripts were used for chimera detection and filtering of underrepresented sequences (<10). VSEARCH (Rognes et al., 2016) was used for clustering and counting sequences per cluster, using a 97 % sequence similarity, which is a widely used threshold for the ITS region and lies between generally accepted limits for discrimination of species and genera (Vu et al., 2019). Operational taxonomic unit (OTU) clustering, instead of using 100 % identical amplicon sequence variants (ASVs), was recommended for fungal ITS datasets (Tedersoo et al., 2022). Taxonomic affiliation of OTUs was done with the UTAX script against the UNITE database (Abarenkov et al., 2024). Non-fungal sequences were removed from further analysis. All sequence affiliations were manually evaluated and edited, increasing the phylogenetic accuracy (Hofstetter et al., 2019). Given the set sequence similarity threshold, species names provided for OTUs must be considered sensu lato. Further bioinformatics and statistical analyses were done in R version 4.3.1 (https://cran.r-project.org, last access: 17 September 2025) with the following packages: vegan (Oksanen et al., 2018), phyloseq (McMurdie and Holmes, 2013), metagMisc (Mikryukov and Mahé, 2025), and microViz (Barnet, 2024).
Most samples had read numbers for fungi clearly above 3000, but the two samples from the last sampling day had only 815 and 685 reads, respectively. To allow inclusion of these two samples for further analyses, all samples were rarefied to 685 reads with the function rarefy_even_depth in phyloseq. Retrieval of relative abundances of specific taxa was done by converting the read numbers to relative abundances, agglomerating taxa at the appropriate level (tax_glom in phyloseq), and selecting desired taxa (subset_taxa in phyloseq) or selecting the most abundant taxa (phyloseq_filter_top_axa in metagMisc).
2.7 Impactor measurements and fluorescence microscope
An impactor (Sioutas Five-stage Cascade Impactor, SKC, US) was installed down the whole air inlet in parallel to filters for eDNA analysis (see Fig. 1) and was operated at 9 L min−1 using a Leland Legacy Personal Sampling Pump (LKC, USA). Sampling time was between 6 and 20 h, with a mean collected volume of 6.5 m3. The flow was checked every day and, if necessary, calibrated. Aluminum foil (cleaned with acetone and baked at 300 °C for at least 5 h) was installed in four stages (cut-off diameters: 2.5, 1, 0.5, and 0.25 µm aerodynamic diameter (Da)). After each sampling period, the aluminum foils were removed and stored in a freezer. The impactor was cleaned before a new set of foils was installed. The foils were qualitatively analyzed with a Nikon Eclipse Ci-L microscope (Nikon, Japan) under bright field and fluorescence settings (λex= 465–495 nm, λem= 515–555 nm) to confirm the presence of fluorescent particles exhibiting morphological properties typical of fungal spores. Quantitative analysis of fluorescent particles (particle concentration) is discussed in Sect. S8.
2.8 Meteorological variables and air pollutants
The Sammaltunturi station is equipped with a Vaisala Milos 500 automatic weather station. The wind speed was measured with a heated cup anemometer, and the wind direction was measured with a heated wind vane. Temperature was measured with Pt100 sensors, and RH was measured with a Vaisala sensor (HUMICAP). Visibility was measured by a Vaisala FD12P present weather sensor. Data are saved as 1 min means (Hatakka et al., 2003).
The equivalent Black Carbon (eBC) concentration in Sammaltunturi is measured optically with an AE-33 Aethalometer (Magee Scientific) instrument connected to the whole air inlet. The instrument measures how light is attenuated as it passes through a filter loaded with particles, which converts to aerosol absorption. The aerosol absorption is used to estimate the eBC mass, assuming a default, constant mass absorption cross section (MAC) of 7.77 m2 g−1 at 880 nm and a filter-tape correction of 1.39 (Drinovec et al., 2015). AE33 features a dual-spot configuration, analyzing two filter spots with differing airflow rates at the same time. Additionally, a reference spot, unaffected by the sample flow, is used to monitor any fluctuations in the light source's intensity. To ensure measurement reliability, the instrument performs regular zero-flow and optical calibrations. Once the attenuation value reaches 120, it automatically advances to a filter spot.
The gas compositions in Sammaltunturi are measured through a common sampling inlet line with a flow of about 90 m3 h−1 and a residence time of 2 s (Hatakka et al., 2003). A chemiluminescence analyzer with a molybdenum converter, Thermo Environmental Instruments 42 CTL (TEI42CTL), is used to measure NO2 concentrations. At the Sammaltunturi station, the NO2 concentration measured by TEI42CTL is a sum of all oxidized nitrogen species. However, NOx concentration levels at Pallas are low, especially during summer. Thus, the results are most of the time below the instrument detection limit (50 ppt). Analysis of SO2 is based on measuring UV fluorescence. The instrument used is Thermo Environmental Instruments 43S. Details on air pollutant monitoring can be found in Hatakka et al. (2003).
2.9 Air mass back trajectories
Air mass back trajectories were carried out using the NOAA HYSPLIT Trajectory Model v5.3.0 (Stein et al., 2015; Rolph et al., 2017), using meteorological data from the Global Data Assimilation System (GDAS) archive (1° resolution). 72 h back trajectories were calculated for air masses arriving at either 100 or 500 m a.g.l. at the Sammaltunturi station.
3.1 The contributions of different HFAPs change seasonally
Figure 2 provides an overview of the monthly fractions of HFAPs within TAPs, the ambient temperature (measured at Sammaltunturi), and the relative contributions of different fluorescent particle types to HFAPs. The fractions of HFAPs exhibit a clear seasonal trend. At the start of the PaCE22 campaign in September 2022, the median fraction was and steadily decreased until the end of the PaCE22 campaign in December 2022, when the minimum monthly median value of was reached. From April to August 2023, the HFAP fraction increased continuously, peaking in August at . The logarithm of the fraction roughly follows ambient temperature trends (depicted in red), with minima and maxima occurring in December 2022 and August 2023, respectively. Figure 2b illustrates the monthly contributions of different fluorescent particle types to HFAPs. The fractions of AB and ABC particles follow the seasonal trend of temperature and total HFAP fraction. During warmer months, AB and ABC particles dominate, accounting for 60 % of HFAPs in September, 67 % in July, and 75 % in August. In contrast, their contribution drops to 12 % in December. Conversely, B particles (and to a lesser extent BC particles) show an inverse pattern, dominating during colder months. The contribution of A particles does not exhibit a clear seasonal trend. In the following, we will focus on AB and ABC particles, since their high contribution during warmer months suggests a possible biological source. The contributions of C and AC particles are negligibly small and will not be discussed further (details on A, B, and BC particles are provided in Sect. S2).
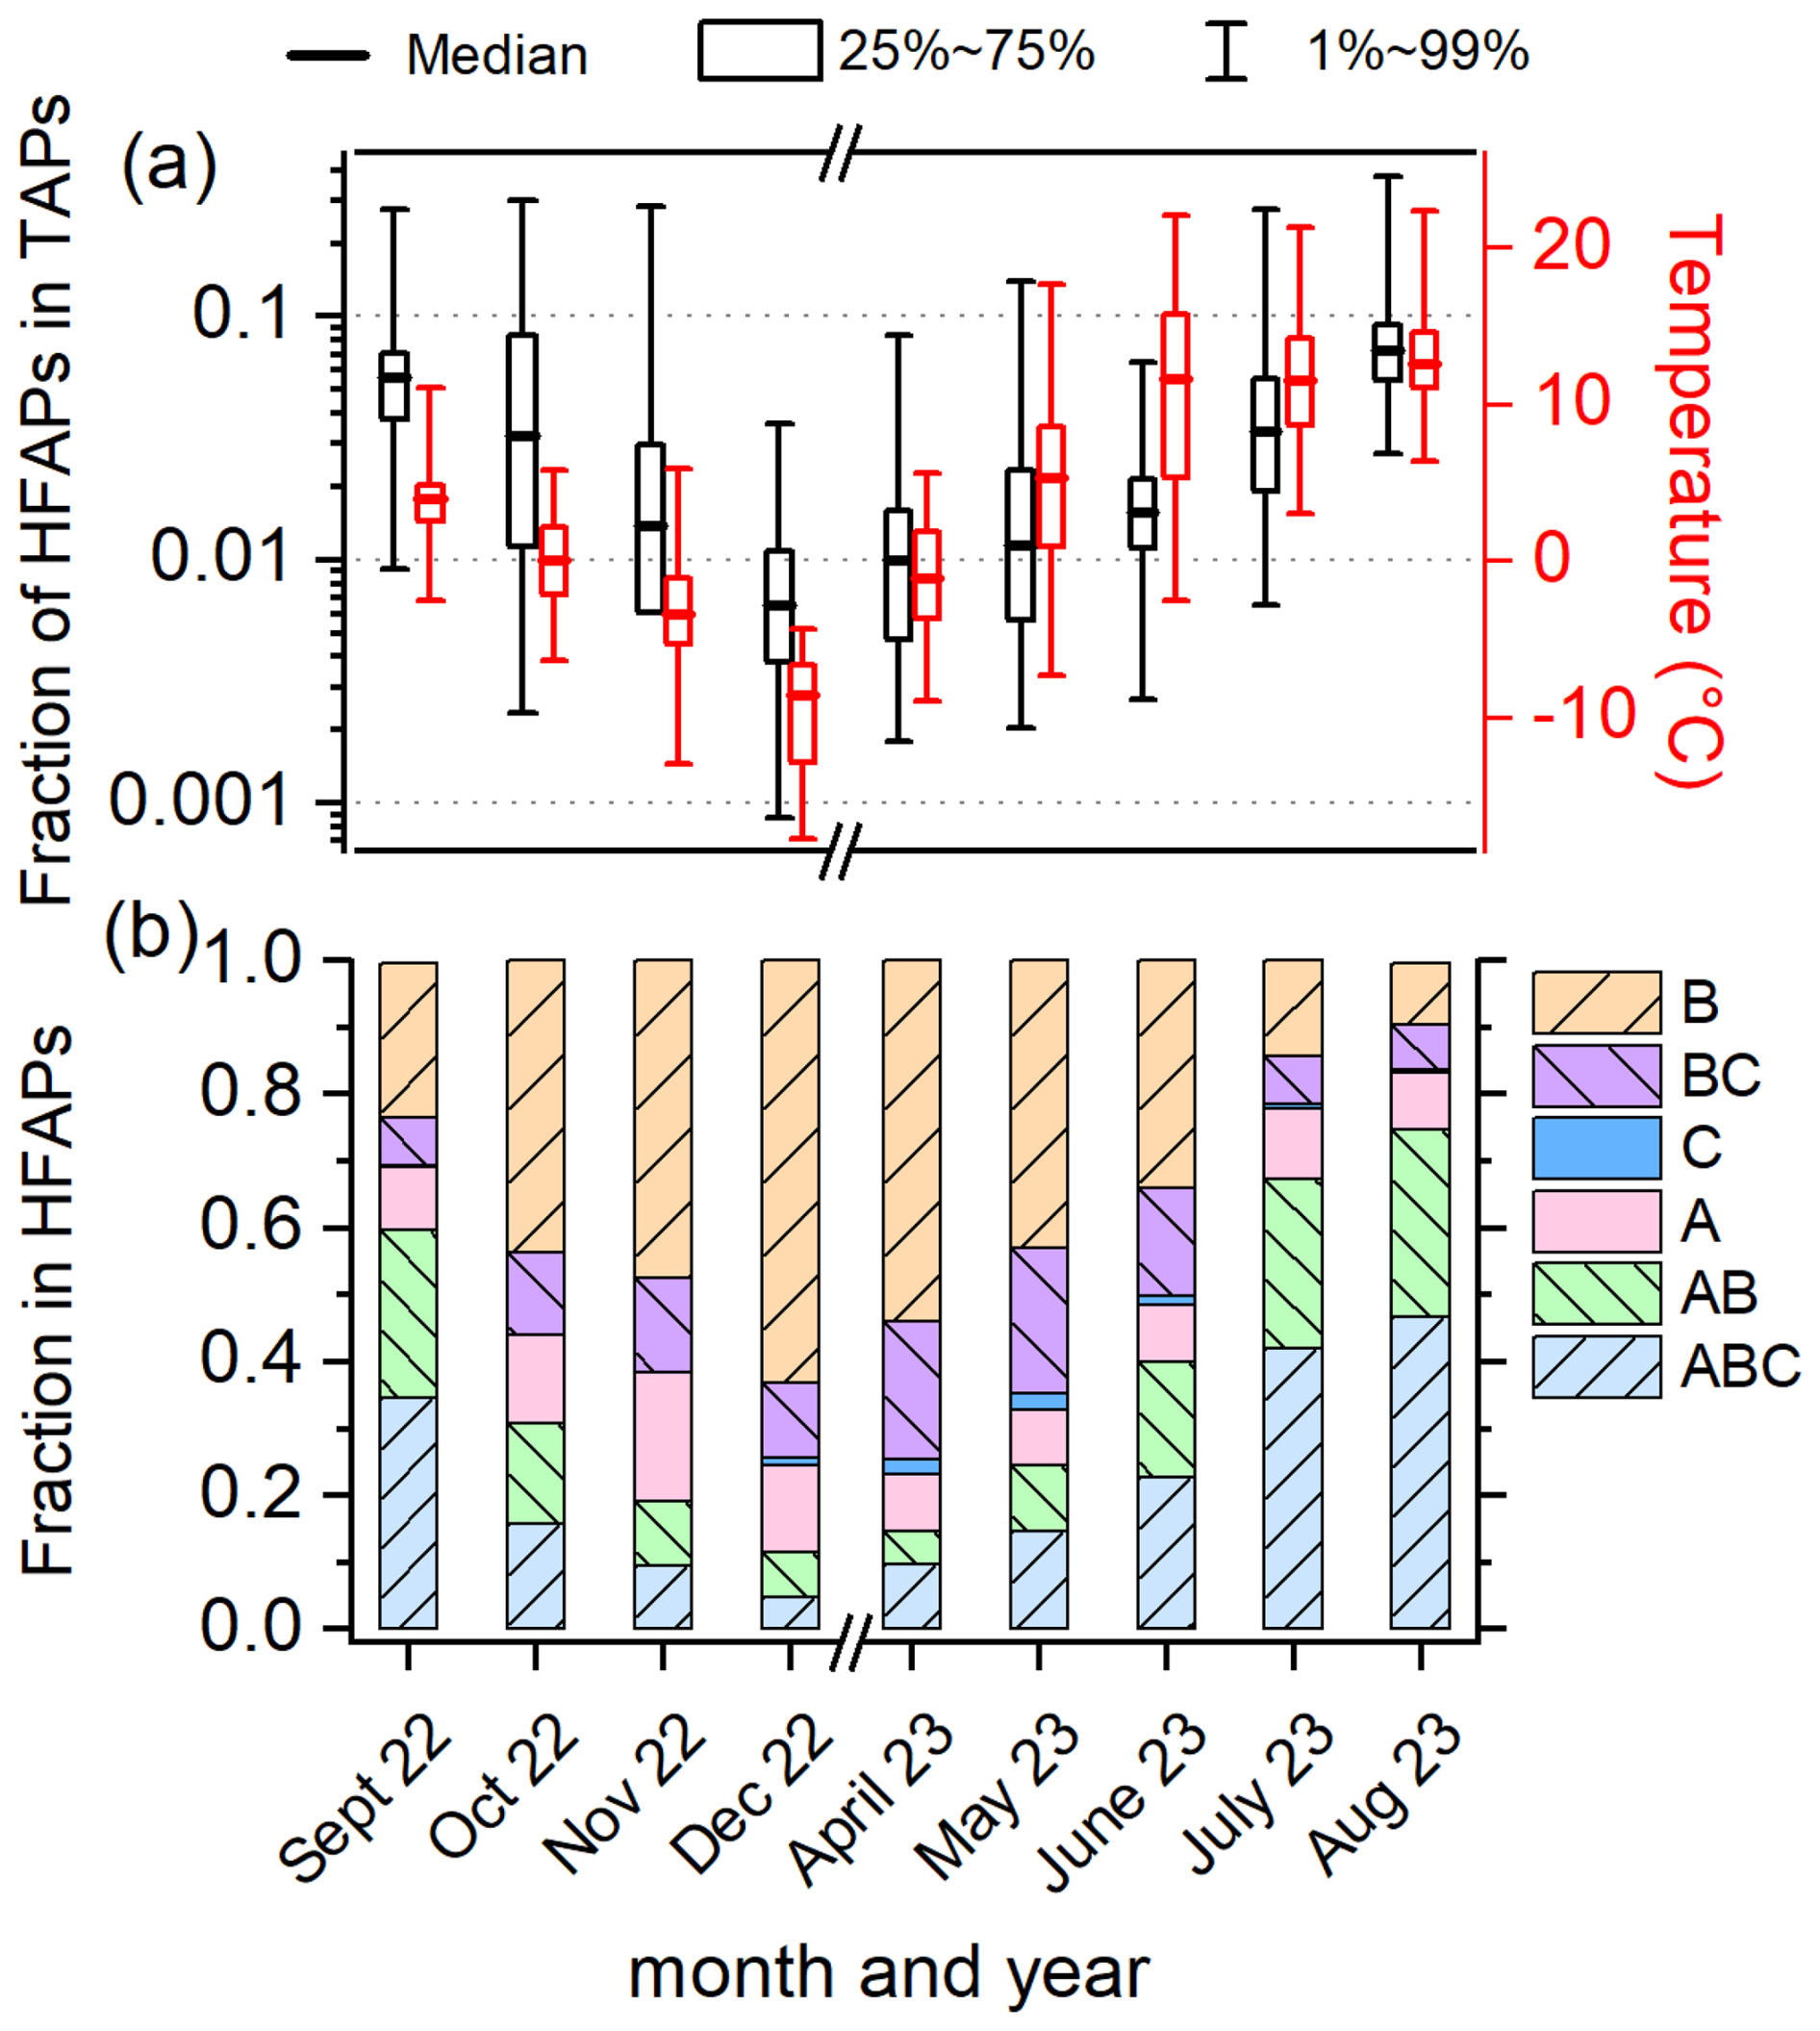
Figure 2Overview of the fraction of highly fluorescent aerosol particles (HFAPs) and ambient temperature. (a) Monthly box diagrams (median, 25th to 75th percentile and 1st to 99th percentile) of the fraction of total HFAPs in total aerosol particles (TAPs) and temperature. Boxplots are based on hourly mean values. (b) Monthly contributions of HFAP types to total HFAP concentration (fraction of median values). AB and ABC particles dominate in the warmer months, while B and BC particles dominate in the colder months. The fraction of AC particles is not shown, as they contributed only 0.01 % or less to HFAP concentrations.
3.2 Local snow cover influences the concentration of biological HFAPs
Figure 3 shows the daily mean concentrations of TAPs, HFAPs, AB, and ABC particles. Snow depth and ambient temperature, measured at the Kenttärova research station (approximately 5.5 km east of Sammaltunturi), are also depicted in Fig. 3a. The temperature is used to define meteorological seasons (see Sect. S2 for seasonal definitions, particle concentrations, and size distributions of all fluorescent particle types).
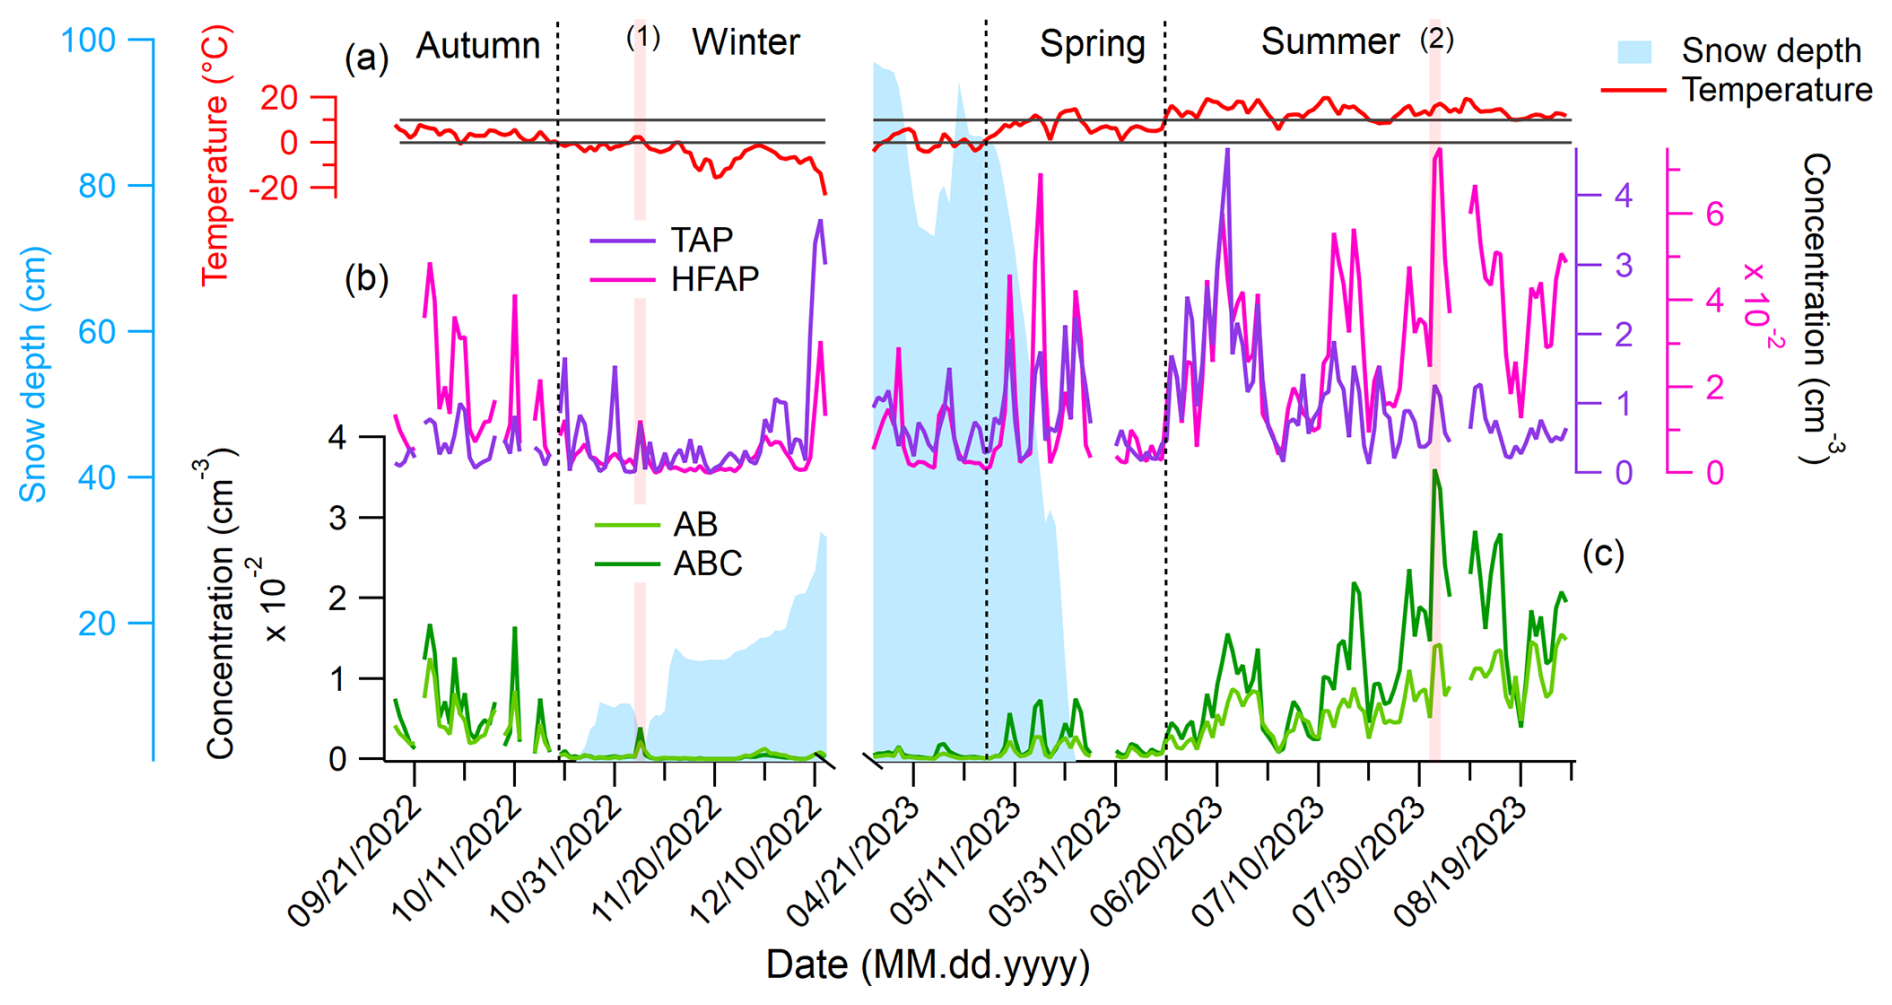
Figure 3Daily mean concentrations of TAPs, HFAPs, and AB and ABC particle types, mean snow depth, and ambient temperature inside a nearby spruce forest. (a) Temperature measured at the Kenttärova station is used to define the meteorological seasons. Gray lines are at 0 and 10 °C. (b) TAPs and HFAPs, (c) AB and ABC particles. Vertical transparent red lines are labeled with a number and mark the 2 d discussed in the text. Snow cover reduces the concentration of AB and ABC particles drastically.
TAPs show no clear seasonal trend (Fig. 3b). The lowest median TAP concentration occurs in autumn (0.28 cm−3), while the highest is in summer (0.75 cm−3). In contrast, HFAP concentrations exhibit a strong seasonal cycle, peaking in summer with a median of cm−3, approximately 10 times higher than in winter. Winter and spring peaks of HFAPs are primarily due to B and BC particles, with A particles playing a minor role (details in Sect. S2). AB and ABC particle concentrations follow a similar pattern, suggesting a common biological origin. These particle types show the strongest seasonal cycle, with minimum median concentrations in winter ( cm−3) and maxima in summer ( and cm−3 for AB and ABC, respectively).
Snow cover significantly affects AB and ABC particle concentrations. Once the ground is covered in snow (from 23 October to 22 May), concentrations decrease rapidly and remain low. For instance, the median ABC concentration in autumn ( cm−3) drops 22-fold in winter. This strongly suggests that snow cover suppresses the emission of AB and ABC particles from the local biosphere. Once the snow begins to melt, concentrations gradually increase. Peaks in AB and ABC concentrations during the melting period correspond to air masses passing over snow-free land north of the Gulf of Bothnia, such as Ylitornio Meltosjärvi (66.5333, 24.65° E). This suggests that regional biosphere emissions south of Sammaltunturi contribute to increased concentrations (details in Sect. S3.3). A notable example occurred on 5 November 2022 (labeled (1) in Fig. 3). On this day – the third in a 3 d melting period – snow depth (measured at 08:00 a.m. local time) decreased from 9.0±2.0 cm to 3.3±2.0 cm. Air masses on this day arrived from the south and spent most of the time close to the ground, following similar trajectories to the days before and after. However, in areas slightly south of Pallas, such as Kolari Kattilamaa (70 km south), snow had completely melted. This led to a sudden 10-fold increase in ABC concentrations compared to the previous 2 d, indicating that local emissions of AB and ABC particles resumed immediately after snowmelt (details in Sect. S3.1). Days of maximum AB and ABC concentrations always correspond to local air masses near the ground (e.g., 2 August, which recorded the highest daily mean value, labeled (2) in Fig. 3, see Sect. S3.4 for details). This further supports the hypothesis that AB and ABC particles originate mostly from the local biosphere. Potential local sources, even under snow-covered conditions, include cellulolytic fungi such as certain Polyporales species, which grow on trees and can produce fruit bodies that persist year-round. They have been shown to sporulate under cold and harsh conditions (Gonthier et al., 2005). Aerosolized soredia from tree-dwelling lichens (Armstrong, 1991) and spores from mosses (Ščevková et al., 2024) growing on tree trunks or rocks may also contribute. The fact that these organisms grow on trees, above the snowpack, may facilitate PBAP emissions even when the ground is snow-covered.
Similar relationships between fluorescent particles and snow cover have been reported in the boreal forest. Schumacher et al. (2013) observed this phenomenon in Hyytiälä, southern Finland, using a UV-APS (TSI, USA) instrument with a fluorescence channel similar to FL3 in WIBS. At the same site, Schneider et al. (2021) found that AB and ABC particles exhibited the strongest seasonal trends, strongly influenced by snow cover. Petersson Sjögren et al. (2023) reported a comparable seasonal trend in a managed coniferous forest at the Hyltemossa research site in southern Sweden using a Biotrak sampler (TSI, USA). This instrument, which operates with similar excitation and emission wavelengths (λex=405 nm, λem= 405–600 nm, D> 1 µm) as the FL3 channel in WIBS, recorded concentrations similar to those measured in this study. Since C and AC concentrations are negligibly small, FL3 is primarily composed of BC and ABC particles. In autumn, the concentrations in Hyltemossa and Pallas (FL3) are and cm−3, respectively. In winter, they are and cm−3; in spring, they are and cm−3; and in summer, they are and cm−3.
3.3 Diurnal patterns reveal the coupling to the local surface
Summer-time diurnal median values were calculated only for periods when the station was outside of clouds (defined as visibility >1000 m), as in-cloud measurements result in a considerable reduction of TAPs and HFAPs (with the former declining much more sharply; see Sect. S4). The frequency of the station being inside clouds follows a distinct diurnal cycle (Fig. 4a, blue line), peaking at 05:00 a.m. and reaching a minimum between 02:00 p.m. and 07:00 p.m. This diurnal pattern of in-cloud frequency provides insights into whether the station is inside or outside the mixing layer at different times of the day. When cloud frequency is high at the Sammaltunturi station (565 m), it is more likely that the station is inside or above the boundary layer and therefore decoupled from the local biosphere. This aligns with findings by Aalto et al. (2002), who reported temperature inversions between the Pallasjärvi station (303 m) and the Sammaltunturi station from 09:00 p.m. to 06:00 a.m., whereas daytime typically lacked inversions. Data from the Sodankylä observatory, 125 km southeast of Pallas, show that the mixing layer in summer afternoons usually extends to 1000–1500 m (Aalto et al., 2002).
The diurnal cycle of non-HFAPs (TAPS–HFAPs) (Fig. 4b) roughly follows the in-cloud frequency trend, suggesting that the highest concentrations occur when the station is in the free troposphere. In contrast, HFAP concentrations (Fig. 4b) increase steadily from 07:00 a.m., peaking at 09:00 p.m., indicating that HFAPs are most abundant when the station is within the mixing layer. A similar diurnal pattern was observed by Petersson Sjögren et al. (2023) in a coniferous forest in the south of Sweden. AB and ABC particle concentrations (Fig. 4c) show a delayed increase with temperature, peaking between 03:00 p.m. and 09:00 p.m., following the general trend of HFAPs. This further supports the assumption that PBAPs originate from the local surface, with long-range transport playing a minor role in PBAP distribution. Similarly, Gao et al. (2024) found significantly higher HFAP concentrations within the planetary boundary layer than in the free troposphere at Mount Helmos in the eastern Mediterranean.
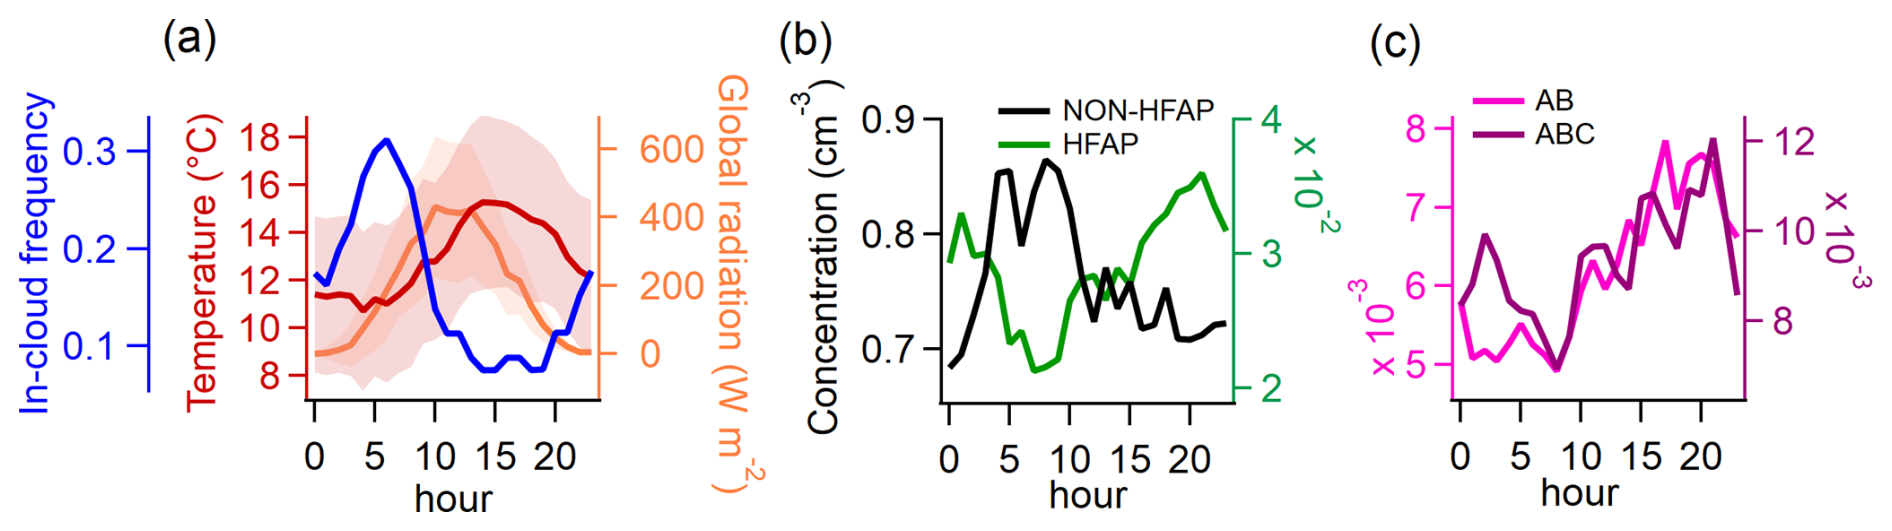
Figure 4Diurnal patterns of meteorological parameters and particle concentrations in summer for times in which the station was not exposed to clouds. (a) Temperature, global radiation, and frequency (or probability) of the station being inside a cloud (used as a proxy for the probability of the station being in the free troposphere). (b) Concentration of non-HFAPs and HFAPs. Non-HFAPs can also contain FAPs that did not classify as HFAPs. (c) Concentration of AB and ABC particles. Similarities between in-cloud frequency and non-HFAP concentration suggest a higher contribution of far-range transport to non-HFAP concentration. The opposite behavior of HFAP concentrations suggests that locally sourced bioaerosols are the major contributors to HFAP concentrations.
3.4 HFAPs are influenced by meteorology and air pollution
To determine whether HFAP concentrations are primarily controlled by natural meteorological variables or anthropogenic influences, Pearson correlation analysis was conducted on hourly mean WIBS data, meteorological parameters (temperature, RH), eBC, and NOx. Results are shown in Fig. 5a, with only Pearson r-values (from now on r) corresponding to p-values < 0.05 presented.
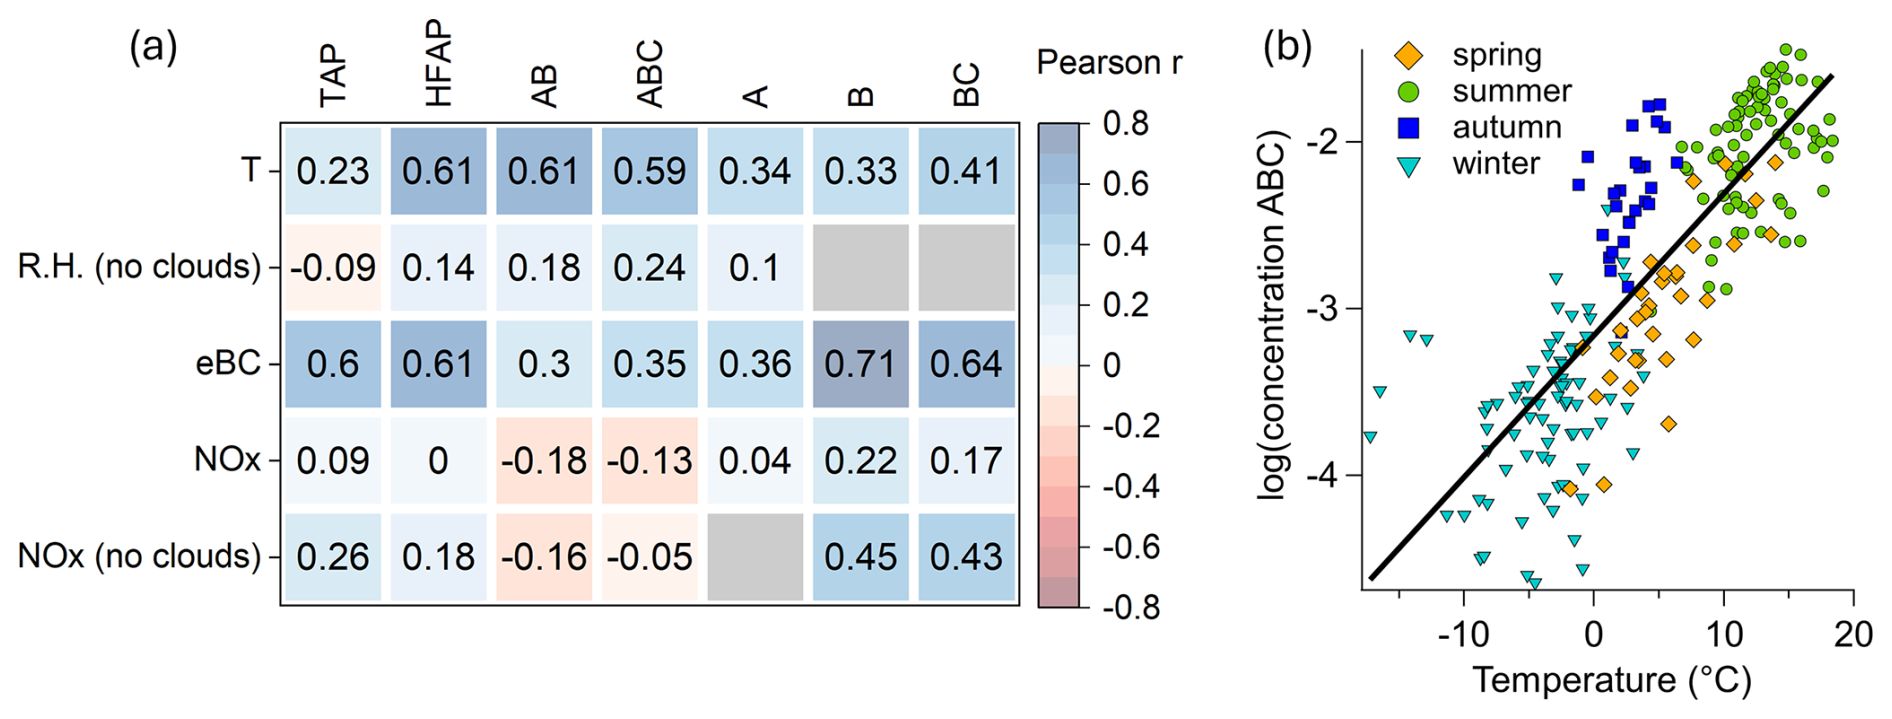
Figure 5Relationship between concentrations of particles types to meteorological parameters and air pollution. (a) Pearson correlation coefficient matrix of 1 h mean values. Gray (empty) relations do not reach the 95 % confidence level. (b) Scatter plot of the common logarithm of daily mean ABC particles against ambient temperature (r=0.82). The transition between snow-free and snow-covered periods (e.g., from autumn to winter) is less apparent than in Fig. 3b, as the temporal context is lost and ABC particles remain present to varying extents throughout the winter.
TAP concentrations show no strong correlation with temperature, RH, or NOx but exhibit a correlation with eBC mass concentration (r=0.6). Similarly, HFAP concentrations correlate with eBC concentrations (r=0.61) but also show a weak positive correlation with RH and a moderate correlation with NOx (r=0.42) for out-of-cloud periods. HFAP concentrations also correlate with temperature (r=0.61).
AB and ABC concentrations show correlations of 0.60 and 0.59, respectively, with temperature. This correlation strengthens when considering the common logarithm of ABC particle concentration, yielding an r-value of 0.82 (p<0.0001) (Fig. 5b). A similar logarithmic relationship is observed for AB particles, with an r-value of 0.78 (p<0.0001). This relationship aligns with previous findings that biological activity in the atmosphere increases with temperature over seasonal time scales (e.g., Pereira Freitas et al., 2023; Petersson Sjögren et al., 2023; Schumacher et al., 2013). A weak positive correlation between RH and ABC (r=0.35) and AB concentrations (r=0.27) is observed for out-of-cloud periods. Several studies have reported increases in bioaerosol concentrations during and after rain events (Rathnayake et al., 2017; Yue et al., 2016; Gosselin et al., 2016; Heo et al., 2014; Schumacher et al., 2013; Huffman et al., 2013; Prenni et al., 2013; Allitt, 2000; Hirst and Stedman, 1963; Gregory and Hirst, 1957). In contrast, no such relationship was observed in our study between rainfall and increased concentrations of HFAPs. A likely explanation is that, during most rain events recorded at our station, the site was simultaneously within a cloud. These in-cloud conditions led to a marked decrease in the concentrations of both TAPs and HFAPs due to cloud and rain scavenging (Flossmann and Wobrock, 2010; Sellegri et al., 2003). However, HFAPs, particularly the AB and ABC subtypes, showed a much smaller decline compared to TAPs, resulting in a substantial relative increase in the AB and ABC fractions during in-cloud events. Further details on the effect of rain and cloud immersion on the concentrations and fractions of HFAPs and TAPs are discussed in Sect. S4.
Only weak correlations were found between AB and ABC concentrations with eBC and NOx concentrations, suggesting that air pollution has minimal influence on the concentrations of these particle types compared to temperature. However, B and BC concentrations show the strongest correlation with eBC mass concentration (0.71 and 0.65, respectively). The correlation increases when using daily means (r=0.82). Additionally, B and BC concentrations have stronger correlations with NOx than AB and ABC particles, indicating a greater influence from anthropogenic pollution. This strong correlation between either B or BC concentrations with eBC has been reported a few times in the literature (Beck et al., 2024; Markey et al., 2024; Gao et al., 2024; Yue et al., 2022). Therefore, B and BC particles are considered to be mostly of anthropogenic origin. See Sect. S2 for more details of B and BC particles.
To further analyze the relationship between ABC particles and meteorological parameters, data were divided by season, considering only out-of-cloud periods. RH, temperature, and wind speed were binned to channels with widths of 5 %, 2 °C, and 2 m s−1, respectively. Median values of hourly mean concentrations within each bin were calculated if more than 10 values existed for that bin.
In spring and winter, RH has little effect on ABC particle concentration, whereas in summer, a positive relationship appears, with maximum median concentrations occurring at 80 %–100 % RH (Fig. 6a). A similar but weaker trend is observed in autumn. In spring, summer, and autumn, ABC concentrations increase with temperature up to 15 °C but decline at higher temperatures in summer (Fig. 6b). Wind speed has an effect in summer, with peak median concentrations on calm days (<4 m s−1), while in winter, there is a slight positive correlation between ABC concentration and increasing wind speed (Fig. 6c). The maximum concentrations at high RH and the increase with temperature up to approximately 15 °C, with a decline at higher temperatures, may reflect a fungal spore release mechanism (e.g., surface tension catapult; Pringle et al., 2005), which favors high humidity and moderate temperatures. The high fungal activity in autumn could also be responsible for the higher ABC concentrations observed already at lower temperatures compared to summer. In the same sense, in spring, fungal activity is lower, resulting in almost no RH dependence. Notably, the highest concentrations in spring are observed when the surrounding ground is still snow-covered (see Fig. 3) and when air masses originate from the south (see Sect. S3.3), where snowmelt has already occurred. This suggests that PBAPs may be transported to Pallas with these warmer air masses (and often lower RH). In winter, most local sources are buried under snow, and no trend with RH and temperature was observed at the overall low concentrations of ABC particles. However, the slight positive trend between ABC concentrations and wind speed suggests that the few potential local sources, such as cellulolytic fungi, lichens, or mosses (see Sect. 3.2), may be more efficiently aerosolized under stronger winds (Ščevková et al., 2024; Armstrong, 1991; Kallio, 1970), transported to the site, or result from biological residues in blowing snow (Boetius et al., 2015).
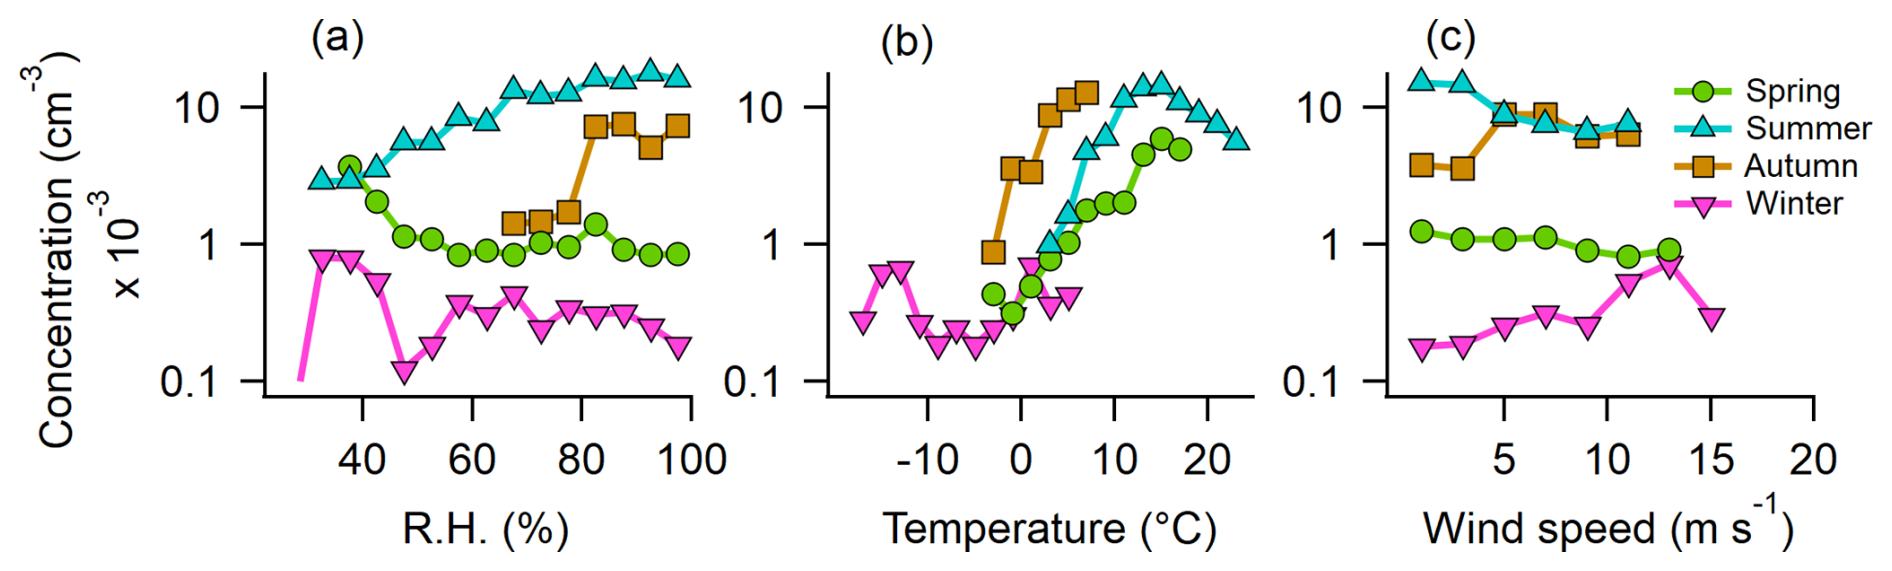
Figure 6The median concentration of ABC particles dependent on meteorological parameters for each season. Depicted are median concentration values for 1 h mean values. (a) RH, (b) ambient temperature, and (c) wind speed.
In summary, ABC concentrations peak under high RH, moderate temperatures (10–15 °C), and low wind speeds in summer. In autumn, both temperature and RH positively influence concentrations, although wind speed plays a lesser role. In spring, temperature (up to 15 °C) is the dominant factor, while in winter, wind speed is the only meteorological variable with a clear impact. Similar seasonal patterns are observed for AB particles (see Sect. S9), whereas B and BC particles show no clear relationship with RH but tend to increase with temperature in both summer and spring.
3.5 ABC particles are dominated by fungal spores
From 14 June 2023, a Burkard trap was installed on the rooftop of the Sammaltunturi station to collect airborne pollen grains and fungal spores for microscopic identification. To further differentiate WIBS data and to compare them with Burkard trap measurements, we analyzed the absolute fluorescence intensity in the FL1 channel of each detected ABC particle during the second part of the campaign. We found a multimodal intensity distribution and identified three distinct fluorescence intensity regions (compare with Clancy et al. (2025), who observed a bimodal distribution). We defined a new FL1 threshold at 1.0×10⁹ intensity units, based on a local minimum of the trimodal intensity distribution (see Sect. S5, Fig. S10). ABC particles exceeding this new threshold were labeled ABC_3, while all other ABC particles were labeled ABC*. It should be stressed that the fluorescence threshold used to discriminate ABC* and ABC_3 in this study is not universal and could differ strongly from one individual instrument to another. More details on the trimodal intensity distribution are provided in Sect. S5.
The majority of pollen grains identified in the Burkard trap were pine (Pinus, 67 %) and from the cypress family (Cupressaceae, 12 %), of which most were detected before July. Figure 7a (top) shows the total pollen, pine pollen, and ABC_3 concentrations, revealing a highly similar temporal evolution. A scatter plot of ABC_3 versus pine pollen concentration (Fig. 7b, left) shows a strong correlation (), although it is acknowledged that the number of data points above 400 m−3 is limited. Similarly, ABC_3 and total pollen concentrations have an r-value of 0.90. The absolute concentrations of both ABC_3 and pine pollen are comparable (≈ 45° linear fit).
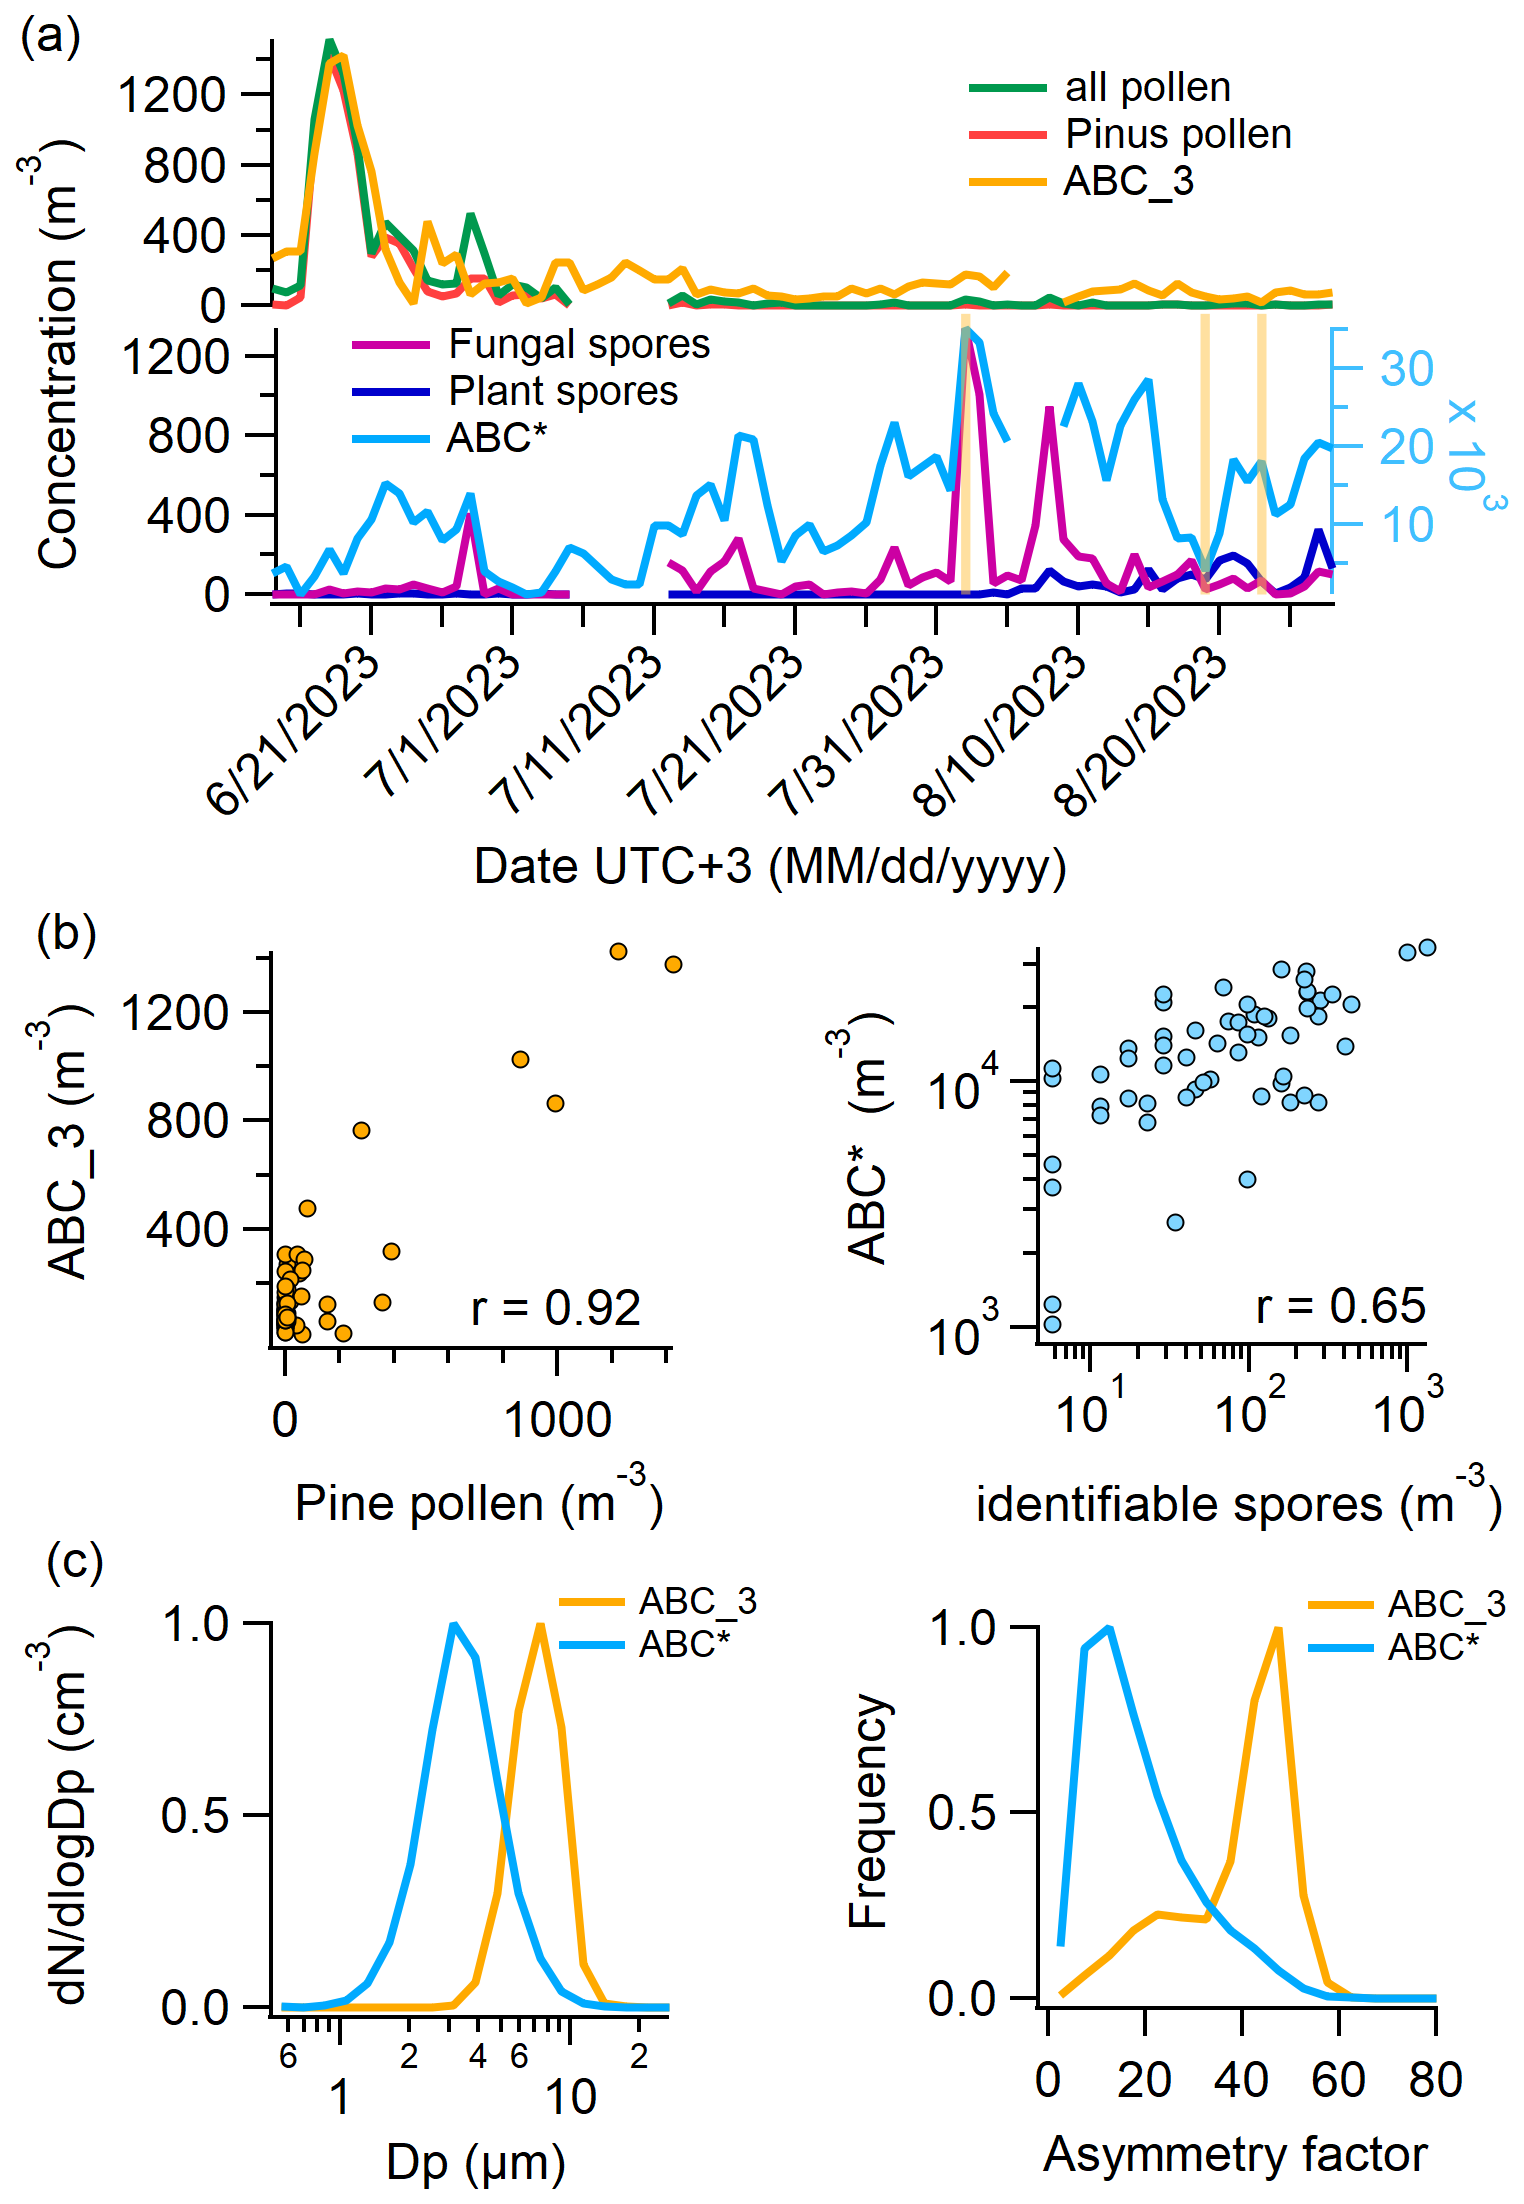
Figure 7Comparison of Burkard and WIBS data. (a) Top: daily number concentrations of all pollen, pine pollen (which makes up 77 % of all pollen), and ABC_3 particles (ABC particles with FL1 fluorescence intensity in arbitrary units). (a) Bottom: daily number concentrations of identifiable fungal spores, identifiable plant spores, and ABC* particles (all ABC particles without ABC_3 particles). (b) Left: scatter plot of ABC_3 vs. pine pollen concentrations. (b) Right: scatter plot of ABC* vs. identifiable spore concentrations (fungal and plant). (c) Left: normalized size distribution of ABC_3 and ABC* particles. (c) Right: normalized asymmetry factor distribution of ABC_3 and ABC* particles.
Figure 7a (bottom) shows identifiable fungal spores and identifiable plant spores from the Burkard trap and ABC* particle concentrations. Of all identifiable fungal spores, 90 % are Cladosporium; the remaining 10 % are shared by Alternaria, Pucciniales (rust fungi), and smut fungi. Identifiable plant spores were 87 % trilete spores, while the rest consisted of Equisetum, fern, and Lycopodium. A microscopy picture of a Burkard slide with two impacted trilete spores is shown in Sect. S6. The correlation between fungal spores and ABC* particles is not as pronounced as with pine pollen and ABC_3 particles, but most of the peaks align. The scatter plot of ABC* and spores (fungal spores and plant spores) (Fig. 7b, right) reveals an r-value of 0.65 (p<0.0001). Both the correlation between ABC* and pine pollen concentrations and the correlation between ABC_3 and identifiable spore concentrations are negative; however, only the former is statistically significant (r= −0.23, p<0.05).
Importantly, r-values only change minimally when using all ABC particles instead of ABC* particles, since the concentration of ABC_3 particles is very low compared to ABC*. The sum of ABC* and AB (as well as ABC and AB) leads to similar r-values as ABC* or ABC alone, namely 0.66. This again is an argument for the similar nature (of most) of both ABC and AB particles.
Interestingly, ABC_3 and ABC* particles not only differ significantly in the intensity of their fluorescence but also in size (Fig. 7c, left) and in the asymmetry factor (Fig. 7c, right). The ABC* size distribution peaks at around 3 µm, whereas ABC_3 particles are exclusively found above 2 µm, with a sharp decline after 8 µm, likely due to losses in the inlet system. The asymmetry factor of ABC* particles is low, with a maximum of the distribution at 10. Hence, they are relatively sphere-like. The asymmetry factor of ABC_3 particles, on the other hand, is higher, with a maximum of the distribution at 50. The differences in fluorescence, size, shape, and relation to pollen grains and fungal spores suggest two distinct particle natures.
Despite the strong correlation between ABC_3 and pollen concentrations, it is unlikely that ABC_3 particles primarily represent pollen grains. Pine pollen, which accounts for 67 % of all counted grains, ranges from 51 to over 100 µm (Halbritter et al., 2021), well above the upper size limit reliably detected by WIBS. Moreover, the WIBS inlet system exhibits substantial losses for particles > 10 µm (Gratzl et al., 2025), making the detection of pine pollen highly improbable. Even if a small subset of pine pollen were at or below 10 µm, WIBS would only capture a minor fraction, insufficient to explain the close match in concentrations. Other pollen types also show significant positive correlations (p<0.05) with ABC_3 concentrations, including Betula (10–25 µm, r=0.50), Cyperaceae (10–50 µm, r=0.57), Picea (> 100 µm, r=0.31), and unidentified pollen types (r=0.41; size data from https://www.paldat.org/, last access: 19 June 2025). While a small number of these smaller pollen grains, particularly Betula, may fall within the WIBS detection range and contribute to ABC_3 counts, their concentrations are too low to account for the total ABC_3 particle abundance observed. In recent years, the presence of sub-pollen particles in the atmosphere has been studied. By the definition of Burkart et al. (2021), these are starch granules that can be expelled from pollen grains during humid conditions and thunderstorms and have been found to fluoresce (partly) in the ABC channel (Hughes et al., 2020; Stone et al., 2021; Mampage et al., 2022). However, they are usually smaller than 2.5 µm in diameter (Burkart et al., 2021; Hughes et al., 2020; Mampage et al., 2022; Suphioglu et al., 1992; Schleh et al., 2010), while ABC_3 particles are larger than 2 µm. A possible explanation could be pollen fragments, as observed by Hughes et al. (2020), or other plant material that is emitted at the same time as pollen.
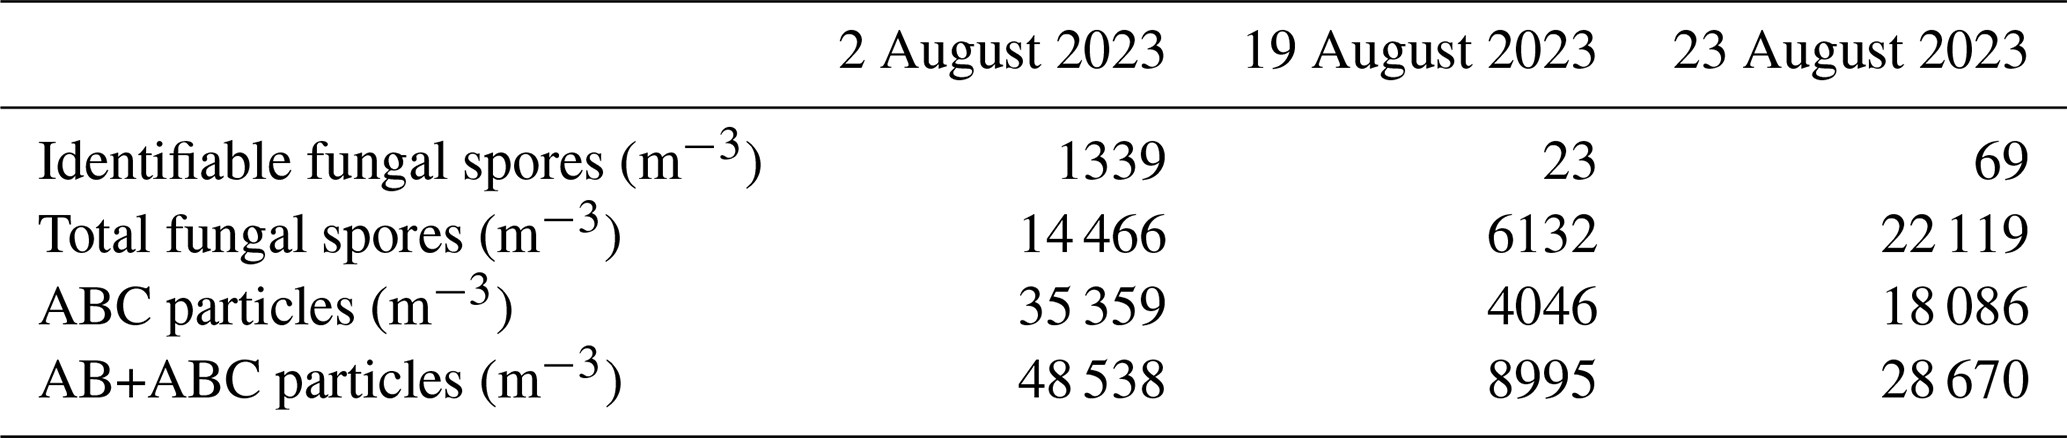
Noticeably, the concentration of ABC* particles (and all ABC particles) is much higher than that of identifiable fungal spores, with daily averages exceeding spore counts by factors of 20 to 2000. To explain this difference, three dates were selected on which the Burkard data were investigated more closely: one of high ABC* concentration (2 August 2023), one of medium ABC* concentration (23 August 2023), and one of low ABC* concentration (19 August 2023) (marked as orange vertical lines in the lower subplots of Fig. 7a). For these days, every single particle impacted on the Burkard trap that is definitely or probably a fungal spore (the latter contributed between 7 % and 13 %), even if it could not be assigned taxonomically, was counted (more than 7000 spores). The resulting daily mean concentration of identifiable fungal spores, total fungal spores (in the Burkard trap), and ABC particles, as well as AB + ABC, for the three dates is given in Table 2. The concentration of total fungal spores is in the same order of magnitude as the ABC particle concentration, compared to a 1, 2, and 3 orders of magnitude difference between identifiable fungal spores and ABC particles for 2, 19, and 23 August 2023, respectively. As a result, only a minor fraction of the whole fungal spore population is recorded when only those fungal spores that can be taxonomically assigned are considered, consistent with Pashley et al. (2012), who found that over 87 % of genera were not identified microscopically. A microscopy picture of the Burkard tape on 2 August 2023 can be seen in Sect. S6. The sum of AB and ABC particles is still considerably higher than that of total fungal spores, especially on 2 August. The Burkard trap likely underestimates smaller spores due to strongly increasing difficulties in correctly identifying particles as fungal spores, especially colorless (hyaline) ones, with decreasing size. Furthermore, despite being used in aerobiological studies for more than 70 years, to the best knowledge of the authors, a characterization of the detection efficiency of a Hirst-type spore trap has never been done for particles < 10 µm. On the other hand, the WIBS (at least in the present study) fails to correctly count the bigger fungal spores due to inlet losses. Surprisingly, both methods give comparable concentrations, at least on days with medium and low ABC concentrations. In a similar boreal forest environment, Helin et al. (2017) found that airborne fungal DNA was predominantly found in the particle size range < 10 µm, and Abrego et al. (2024) found that the community-weighted mean spore size of continental polar fungal spores is below 5 µm. This highlights the importance of fungal spore measurements in the smaller size range.
Table 2Concentrations of identifiable fungal spores, total fungal spores (counted on the Burkard tape), ABC particles, and the sum of AB and ABC particles on three selected days. On 2, 19, and 23 August, ABC concentrations exceed identifiable fungal spore concentrations by approximately 1, 2, and 3 orders of magnitude, respectively. Total spores are in the same order of magnitude as ABC and AB + ABC concentrations.
Most field studies also found that the highest correlation with fungal spores was achieved with ABC particles (Sarangi et al., 2022; Fernández-Rodríguez et al., 2018). Similar results were found when comparing WIBS data with fungal spore tracers (Yue et al., 2019, 2022; Gosselin et al., 2016). In chamber studies, however, fungal spores have been characterized almost exclusively as A particles (Hernandez et al., 2016; Savage et al., 2017). In our study, A particles showed no significant correlation to identifiable fungal spore counts (differing from Markey et al., 2022). This discrepancy could have two main reasons. (a) Atmospheric aging (e.g., UV radiation, water uptake, other atmospheric components (Pan et al., 2021)) may alter fluorescence properties. For instance, fluorescence of Aspergillus niger, a common mold fungus, was strongly enhanced after UV-light exposure (Raimondi et al., 2009). This could lead to stronger fluorescence in the FL3 channel for air-exposed fungal spores compared to laboratory-grown cultures and therefore to an enhanced ABC signal. (b) There could be significant instrument variability in the obtained fluorescence signals (Hernandez et al., 2016), which might even be enhanced when comparing different model versions of the WIBS.
Some studies report poor correlation between WIBS data and Cladosporium counts (Healy et al., 2014; O’Connor et al., 2015), possibly due to the fact that Cladosporium spores can get released in larger clusters, which either get counted as one single particle by the WIBS or are lost in the inlet (Markey et al., 2022). However, in this study, Cladosporium spores dominate identifiable fungal spores and drive peak ABC* concentrations (Fig. 7a, bottom). Subtracting Cladosporium counts reduces the correlation (), suggesting clustering issues may be less significant at our high-altitude site with sparse vegetation. In summary, WIBS data suggest that most ABC particles correspond to fungal spores, although pollen fragments or other plant material may also contribute.
3.6 DNA analysis reveals dominance of Basidiomycota in air samples
To gain a deeper understanding of fungal spore diversity beyond the identifiable (mostly) Ascomycota observed in Burkard slides, we collected eight bi-daily air filters from 16 to 19 September 2023, extracted DNA, and performed fungal barcode sequencing and taxonomic assignment. Unfortunately, due to simultaneous instrument malfunctions, no WIBS or Burkard measurements were available during the sequencing period. However, parallel impactor measurements and microscopic analysis indicate that the majority of particles with an aerodynamic diameter > 1 µm during this time are likely fungal spores (see Fig. 8 for a representative example). Figure 9 displays boxplots showing the contributions of Basidiomycota and Ascomycota to the total fungal reads, revealing that the vast majority of fungal DNA originated from Basidiomycota (median value: 90.1 %). In contrast, the identifiable fungal counts from the Burkard data showed approximately 90 % Ascomycota, suggesting that the majority of unidentifiable spore counts in the Burkard data are Basidiomycota. The median contribution of Ascomycota from the sequencing data is 8.8 %. Noticeably, two data points stand out: there was a snowstorm during loading of the last two filters (red dots in Fig. 9). For these data points, fluorescent particle concentrations (see Sect. S8) and read numbers from high-throughput sequencing were much lower. The latter is indicative of low DNA concentrations in the starting material due to low spore numbers on filters. Consequently, the absolute abundance of Ascomycota is still much lower than that on the other sampling days. Within the Basidiomycota phylum, a majority of spores belong to the Agaricomycete class (median value: 99.6 %), including the 14 most abundant fungi. This finding aligns with previous studies by Maki et al. (2023); Fröhlich-Nowoisky et al. (2012); Yamamoto et al. (2012); and Fröhlich-Nowoisky et al. (2009), which reported that Agaricomycetes dominate airborne Basidiomycota and are among the most abundant atmospheric fungi. Notably, none of the Agaricomycetes identified through DNA analysis could be visually identified. Within the Agaricomycetes, the most abundant fungi belong to the order Agaricales (median: 48.7 %), Atheliales (8.0 %), Russulales (4.4 %), and Polyporales (4.1 %).
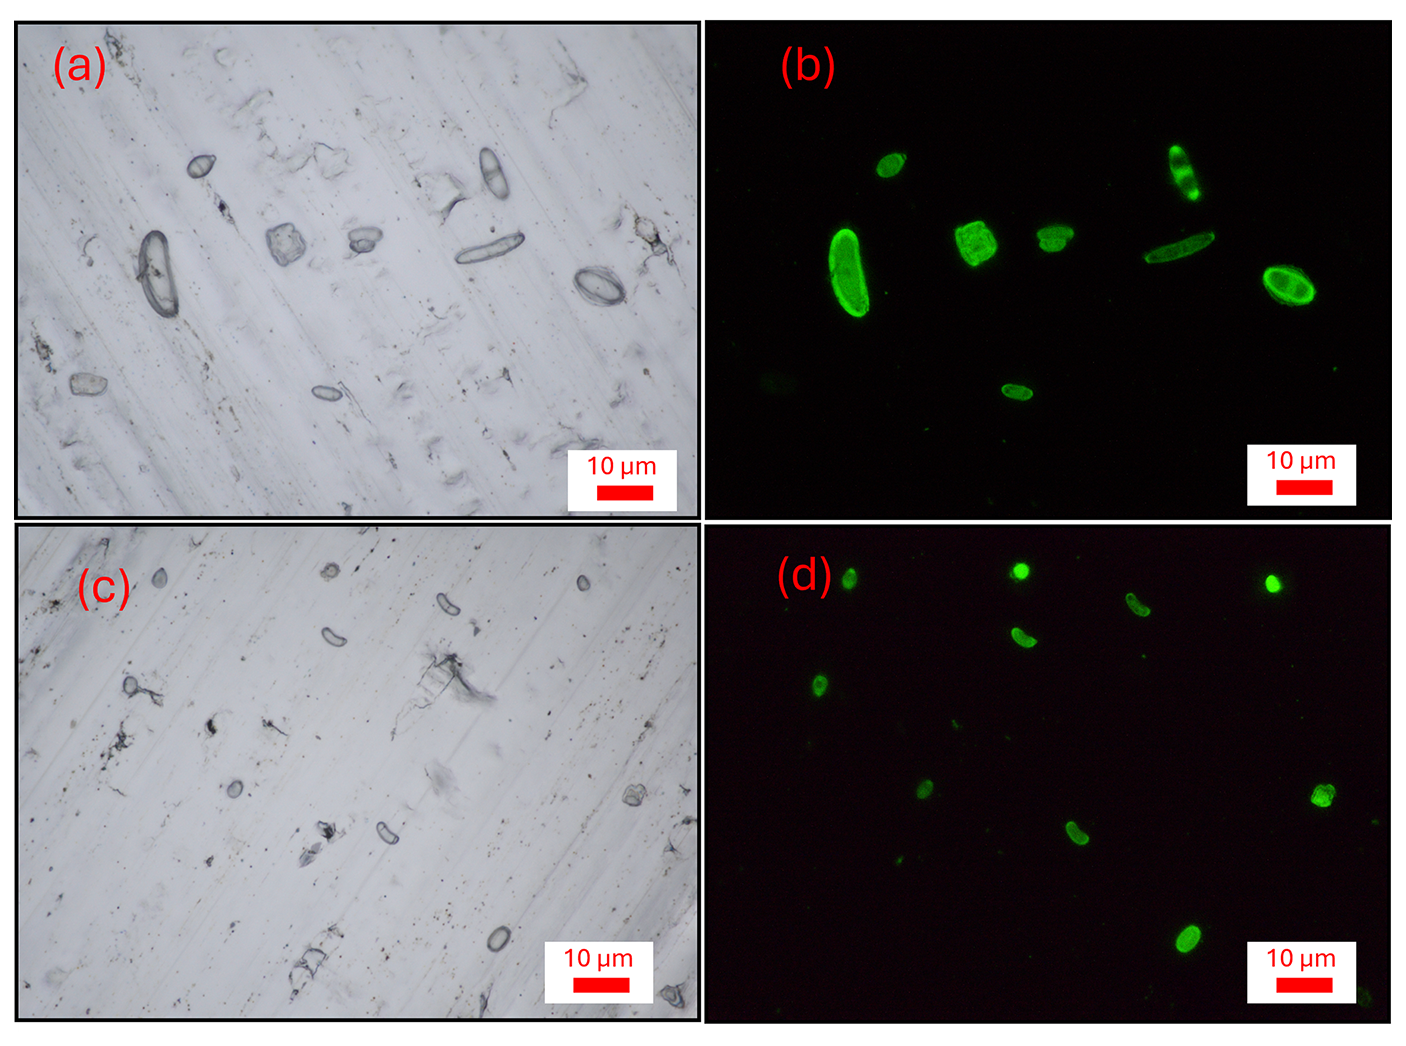
Figure 8Representative examples of fluorescence and light microscopy pictures of impactor samples from 19 September 2023, 09:00 a.m.–04:00 p.m. (a) Particles from stage A (Da > 2.5 µm), (b) same as (a) but only fluorescent particles. (c) Particles from stage B (1.0 < Da < 2.5 µm), (d) same as (c) but only fluorescent particles. Most particles show strong fluorescence and have a characteristic shape.
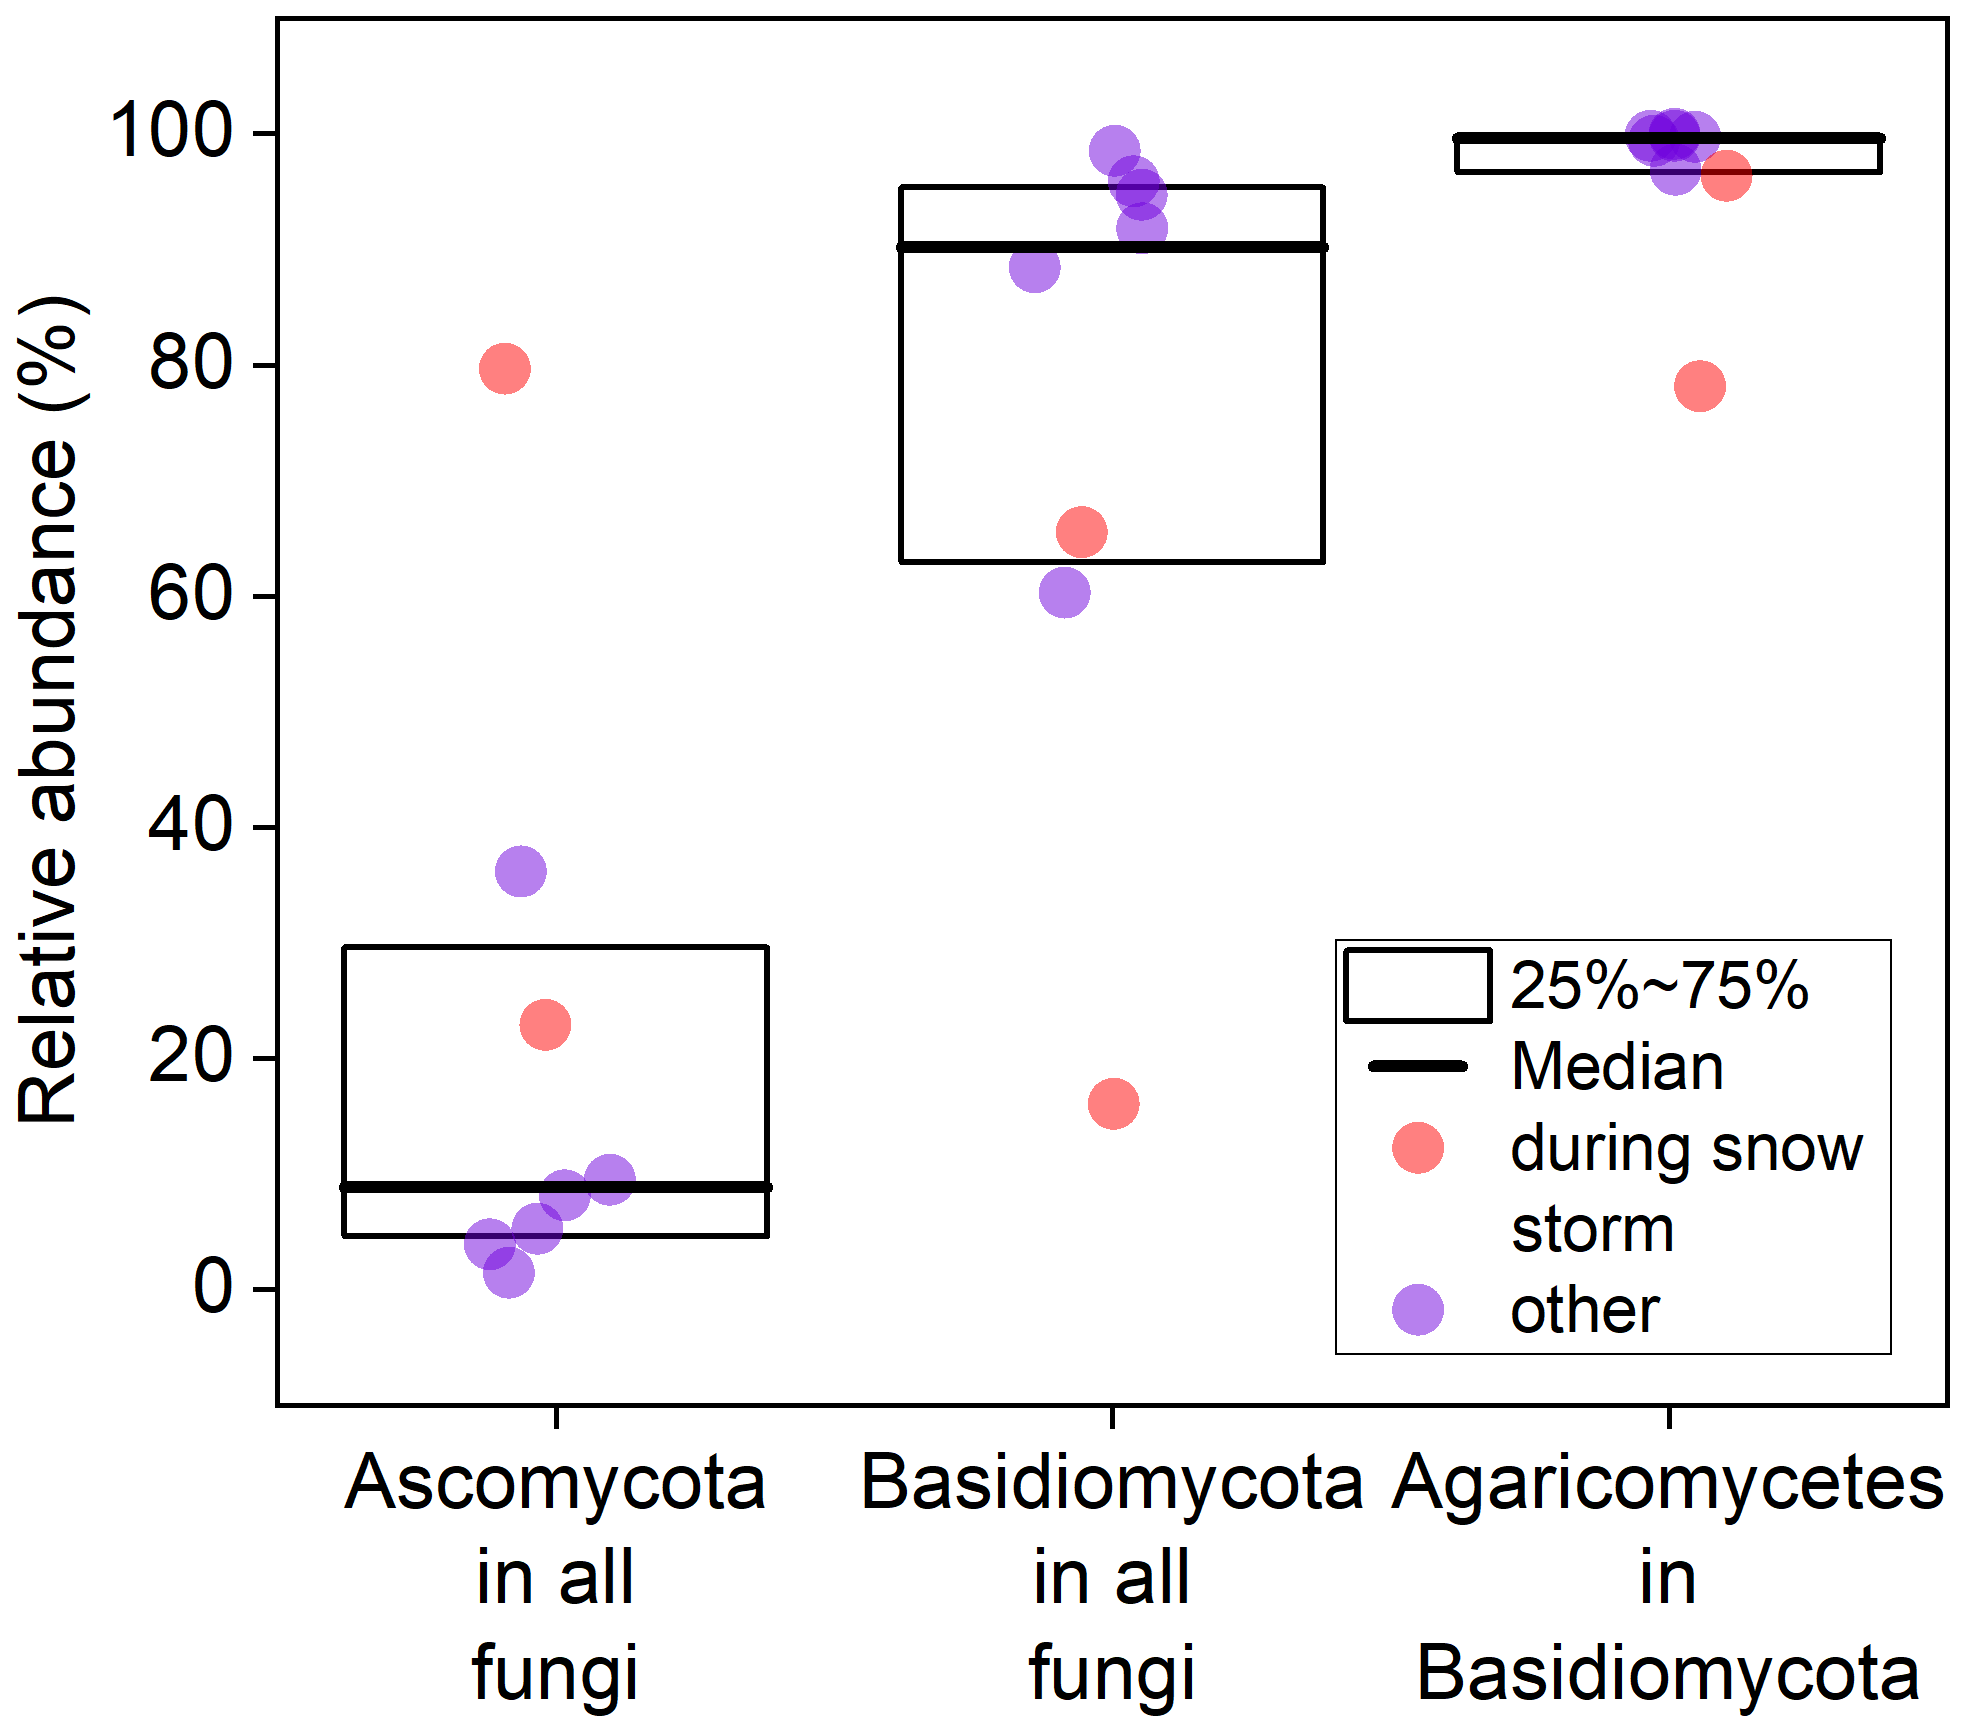
Figure 9Relative abundance of Ascomycota, Basidiomycota, and Agaricomycetes in Basidiomycota based on fungal reads. Data were collected from eight individual filters.
Although the two methods were not simultaneously used (with a 2 d gap), we compare Burkard data from shortly before the DNA sampling period (11 to 13 September 2023) with the 3 d of DNA sampling under similar, although colder, weather conditions (16 to 18 September 2023). During the relevant days, 100 % of identifiable fungal spores from the Burkard data were Cladosporium (Ascomycota), with a mean concentration of 30.5 m−3. However, the Burkard method cannot identify all fungal spores to a taxonomic group, and it is unlikely that Cladosporium represents the entire fungal community. In contrast, eDNA analysis shows that Cladosporium accounts for only 0.44 % of all fungal reads. Assuming that the eDNA data reflect the true relative abundance of fungal taxa, the measured concentration of 30.5 m−3 of Cladosporium spores corresponds to 0.44 % of the total fungal spore concentration. By scaling this proportion up to 100 %, we estimate the total fungal spore concentration to be approximately 6932 spores m−3. This estimate is consistent, within 1 order of magnitude, with the concentration of fluorescent particles > 1 µm aerodynamic diameter (3010 m−3) measured with the impactor and fluorescence microscope (see Sect. S8 for details).
A large fraction of Basidiomycota uses a passive spore discharge mechanism (surface tension catapult) (Elbert et al., 2007; Pringle et al., 2005), where a drop and a film of water have to condense on the spores in order to be expelled into the air (called ballistospores) (Zoberi, 1964). Consequently, most Basidiomycota prefer high RH and moderate temperatures for spore release (Fröhlich-Nowoisky et al., 2016; Gilbert and Reynolds, 2005; De Groot, 1968). Ballistospores from Basidiomycota typically range from 2 to 10 µm in diameter (Elbert et al. (2007) and references therein). As we have mostly detected reads from Basidiomycota (Fig. 9) and most of the particles we analyzed under the microscope are likely fungal spores (Fig. 8), this indicates that most fungal spores detected were basidiospores. As shown in Fig. 6a, the concentration of ABC particles in summer (and to a lesser extent in autumn) is strongly influenced by ambient RH and moderate temperatures (approximately 15 °C being most favorable). Additionally, ABC particles predominantly range between 1 and 10 µm in diameter (Fig. 10c), further supporting our argument that ABC particles are primarily fungal spores of Basidiomycota.
3.7 Fungal spores are highly active INPs
We compared the concentration of ABC particles (and all other HFAP types) to INP concentrations over a wide range of temperatures, incorporating data from PINE during the PaCE22 campaign as well as filters for INSEKT, both collected in parallel to WIBS data. We focus on ABC concentrations rather than ABC* or ABC_3, since ABC particles consist predominantly of ABC* particles and the distinction between ABC* and ABC_3 is uncommon in the existing literature, making comparisons with other studies more straightforward. For correlation analysis, PINE data were averaged to 1 h. Filters for INSEKT analysis were changed weekly, with the exception of six bi-daily filters at the beginning and eight bi-daily filters at the end of the second part of the campaign. The bi-daily filters were averaged for consistency with the weekly filters. Figure 10a shows the time series of INPs active at −13.5 °C (NINP(−13.5)) alongside ABC concentrations scaled by 0.0022 for comparison. The lowest detectable INP concentration L−1 was recorded in early May, while the highest concentration (0.085 L−1) occurred in the second week of August. Despite data points of INPs and ABC particles spanning over 2 orders of magnitude, all peaks and valleys compare very well. In fact, the INP-to-ABC ratio (multiplied by 0.0022) mostly remains near 1. Therefore, approximately 0.22 % of ABC particles are responsible for the INP concentration at this temperature, and the contribution of ABC particles to INPs is relatively constant over the whole period. Thus, it is likely that the majority of INPs active at −13.5 °C in the immersion freezing mode are ABC particles and therefore probably fungal spores.
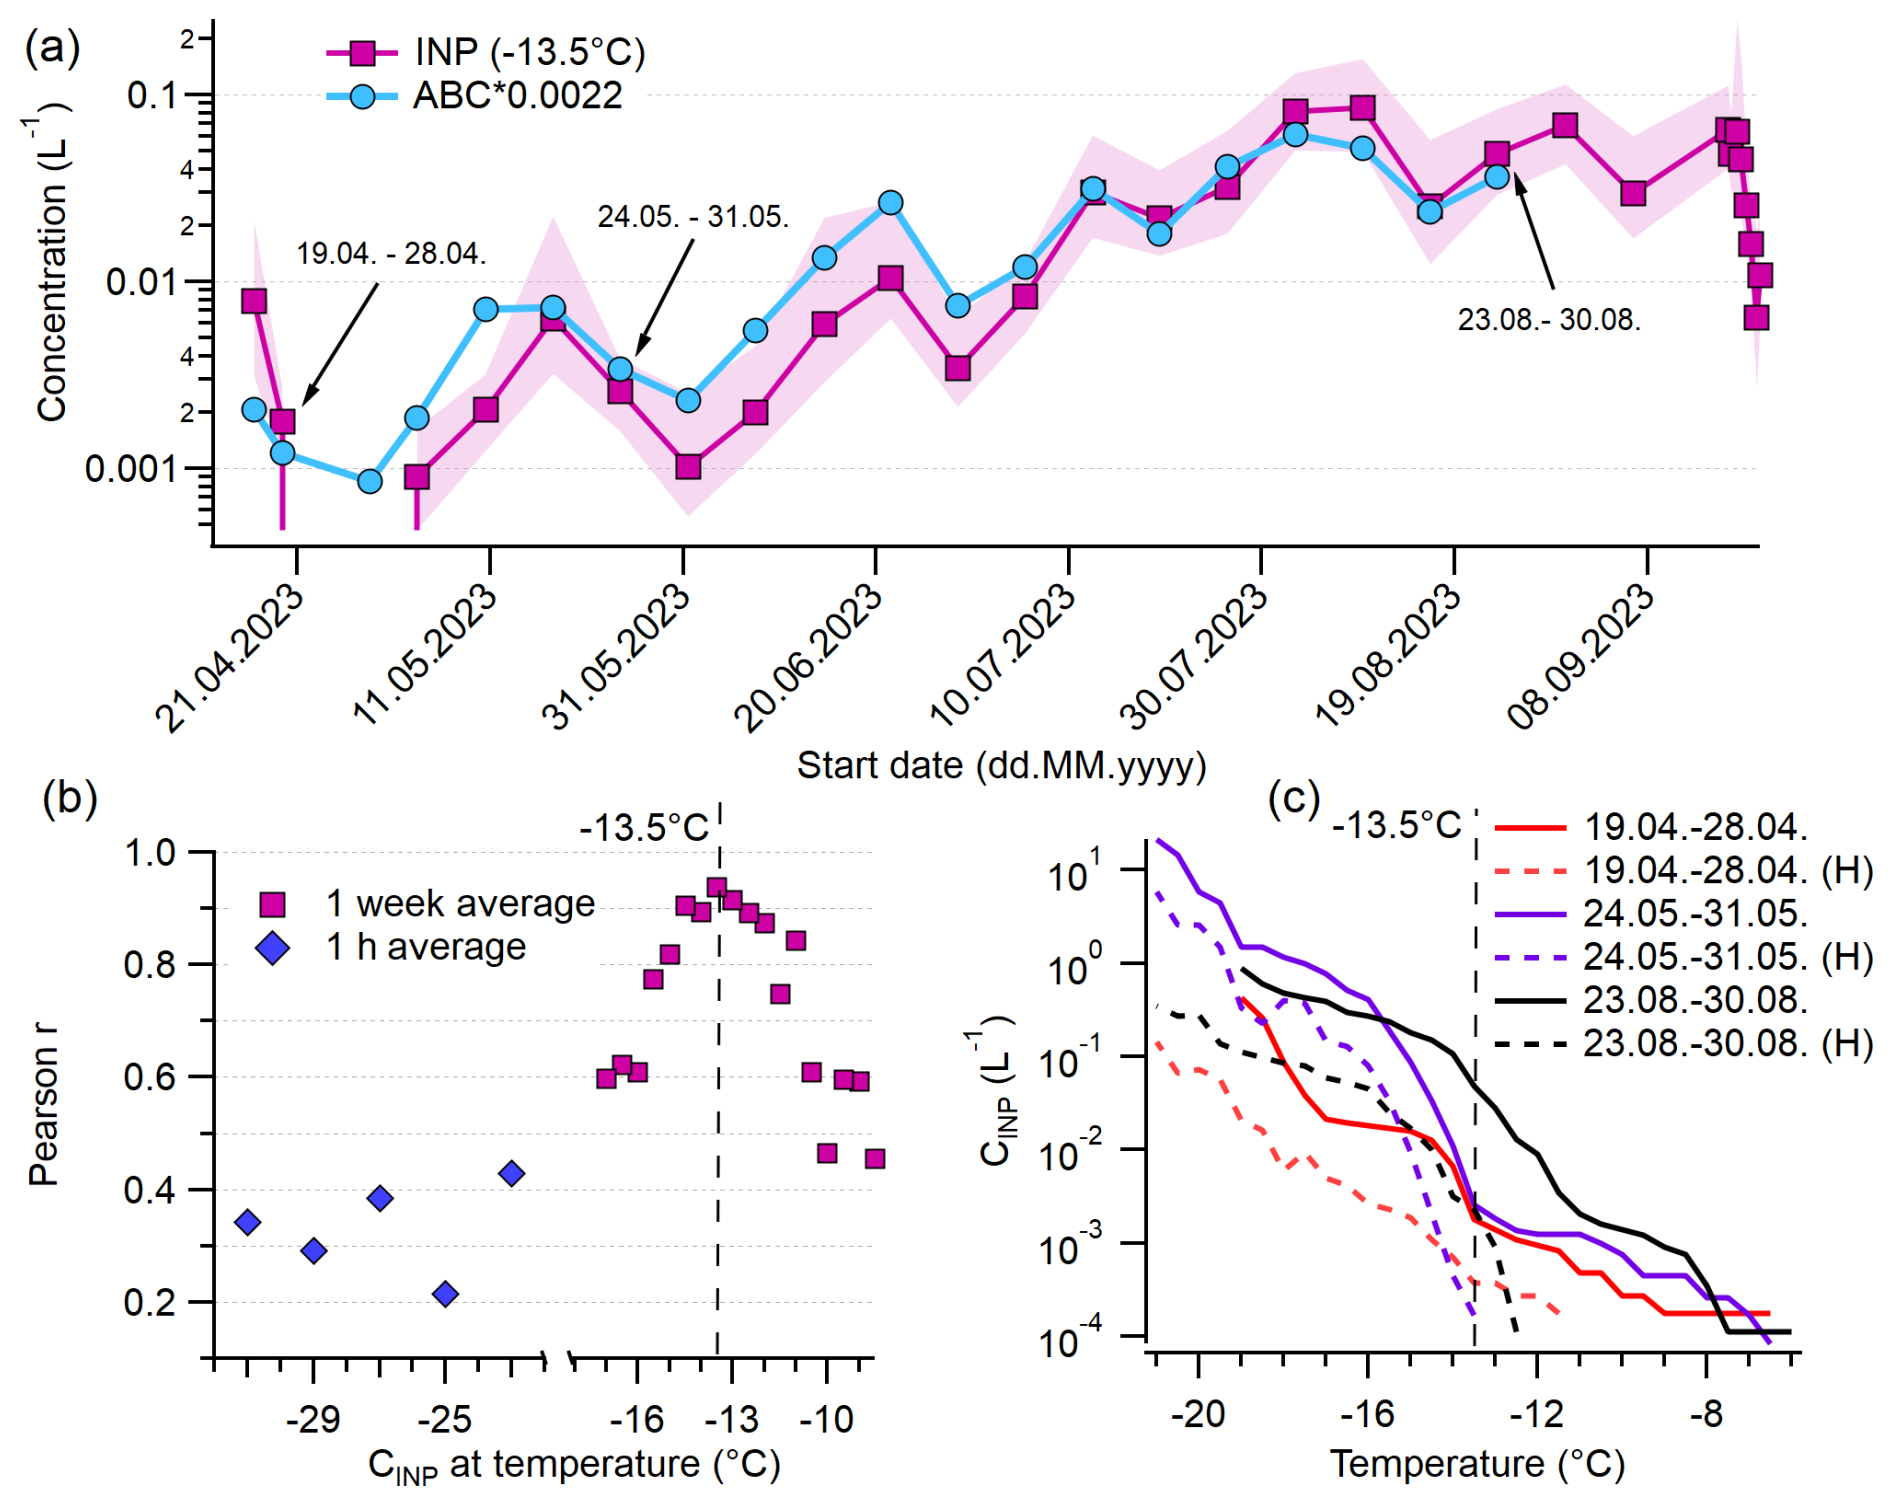
Figure 10Relationship of ABC particles to INPs. (a) Concentrations of weakly active INPs at −13.5 °C and ABC concentration multiplied by 0.0022. (b) Pearson correlation coefficient of correlation of ABC particles with INPs active at certain temperature. (c) Cumulative INP spectra of three selected dates (also marked in a) and spectra of the same day with prior heat treatment (H). The red and black solid lines are absent in the lowest temperature range because all droplets in the original samples had frozen by −19 °C, even after a 1:100 dilution, which prevented us from measuring higher INP concentrations at lower temperatures. In contrast, heat treatment reduced the INA, allowing data to extend to lower temperatures.
The relation between NINP(−13.5) and ABC data shows the highest correlation of any WIBS–INP comparison, namely r=0.94 (p<0.0001) (Fig. 10b, marked with a dashed line). In general, ABC particles gave the highest correlation coefficient for almost all temperatures. In Fig. 10b, the Pearson correlation coefficients for the INP–ABC correlation at all temperatures that reach a confidence level of 95 % are plotted. Between −12 and −15 °C, all Pearson values are above 0.8 (with the highest p-value of ). Hence, they are very likely to be composed of ABC particles and are therefore of fungal origin. Since AB and ABC likely share a biological source, their combined correlation was tested but showed little difference from ABC alone. Likewise, r-values for ABC* concentrations differ from those for ABC concentrations by a maximum of 0.01. At both warmer and colder temperatures, INP–ABC correlations weaken. Bacteria might play an important role in heterogeneous ice nucleation, particularly at higher temperatures (Kanji et al., 2017; Šantl Temkiv et al., 2015; Morris et al., 2004; Jayaweera and Flanagan, 1982). However, chamber studies suggest that bacteria are primarily classified as A particles in the WIBS rather than ABC particles (Hernandez et al., 2016; Savage et al., 2017). A recent field study by Katsivela et al. (2025) at Mount Helmos supports this, reporting a high positive correlation between total airborne bacteria concentrations and WIBS A and C concentrations (WIBS-5/NEO, 9σ threshold), with Spearman's correlation coefficients of 0.82 (p<0.05) for both. In contrast, no significant correlation was found between bacteria concentrations and the ABC concentrations. In our study, we observed positive correlations between WIBS A concentrations and INPs active at temperatures between −9 and −15 °C, with r-values ranging from 0.70 to 0.50 (p<0.05) (see Sect. S7, Table S3). This suggests that bacteria may contribute to high-temperature INPs, consistent with findings from various environments (e.g., Maki et al., 2023; Failor et al., 2017; Stopelli et al., 2017; Šantl Temkiv et al., 2015). However, we were unable to directly quantify bacterial contributions in this study. Since particles in the A channel likely include both bacterial and non-biological components (see Sects. S2 and S3.2), the specific contribution of bacteria in high-temperature INP activity during our study remains unresolved.
High-temperature INPs are present even during snow-covered periods. In Sect. 2.3, we discuss potential local sources of ABC particles under such conditions. These include organisms that grow on trees or rocks, including lichens, mosses, and wood-decaying fungi. These organisms may also serve as sources of INPs. Recent studies by Proske et al. (2025) and Eufemio et al. (2025) demonstrate that lichens collected from diverse environments, including the Arctic and the European boreal forest, contain highly active ice nuclei that could become aerosolized. Additionally, mosses such as Hypnum and Orthotrichum, which grow preferably on tree trunks and rocks, have been shown to contain efficient ice nuclei active at temperatures above −15 °C (Moffett, 2015), suggesting they could serve as INPs. However, only their leaf material has been characterized in regard to its INA so far, not the spores. Furthermore, spores from wood-decaying fungi, particularly some species within the Polyporales order, may also act as INPs. To our knowledge, however, no species or genus within this group has yet been tested for INA.
Below −15 °C, biological particles might not be the dominating source of INPs, as mineral dust, inorganic particles, and combustion aerosols also nucleate ice (DeMott and Prenni, 2010; Murray et al., 2012; Kanji et al., 2017). Pearson r-values for 1 h mean ABC and PINE data (Fig. 10b) range between 0.43 (−22 °C) and 0.22 (−25 °C). AB+ABC particles had slightly higher correlations than ABC alone. The r-values for HFAPs range from 0.32 to 0.47. As HFAPs most likely consist of both biological and other particles (see Sect. S2), possibly also including soil dust and mineral dust (Gao et al., 2024), the significance of biological aerosols for INPs active at colder temperatures cannot be clarified. The lowest Pearson r-values for the temperatures −23, −25, and −27 °C all belong to TAPs and are below 0.28.
For selected samples, a heat treatment with a subsequent INP analysis was performed. INP concentrations before and after heat treatment are shown for three representative filters (April, during snow cover; May, shortly after snowmelt; August), marked with arrows in Fig. 10a. After heat treatment, the vast majority of INPs active at −13.5 °C (marked with a vertical dashed line) vanish. This is typically associated with the presence of biological proteinaceous INPs whose ice nucleation ability is sensitive to heat (Daily et al., 2022; Huang et al., 2021; Šantl Temkiv et al., 2019). The concentrations of heat-labile INPs active above −13.5 °C are several orders of magnitude lower than those of ABC and total HFAP particles.
Direct comparisons between INPs and bioaerosols in field studies have grown with the adoption of LIF sensors in atmospheric science. Similar findings have been reported in a range of natural environments. For instance, Schneider et al. (2021) found that among all HFAPs, ABC particles (WIBS-NEO, 9σ threshold) correlated best with INPs active at −16 °C in a boreal forest (Hyytiälä). Tobo et al. (2013) reported a significant correlation () between INPs at −15 °C and fluorescent aerosol particles (FAPs) in a Colorado pine forest using a UV-APS in summer. Similar results were obtained by Prenni et al. (2013), Wright et al. (2014), Mason et al. (2015), Twohy et al. (2016), Cornwell et al. (2023), Kawana et al. (2024), and Taketani et al. (2025). However, these studies were not able to pinpoint the nature of the fluorescent particles. Pereira Freitas et al. (2023) combined FAP data using the multiparameter bioaerosol spectrometer (MBS, University of Hertfordshire, UK) with offline measurements of fungal spore tracers in Ny-Ålesund, Svalbard. The authors also found a high correlation between NINP(−15) and FAPs. Additionally, the fungal spore tracers imply that the terrestrial biosphere and potentially fungal spores are important contributors to the INP population during the Arctic summer after snowmelt. Size-resolved measurements of INPs confirm that most INPs active at −15 °C exceed 1 µm (Da), with 70 % > 2.5 µm in the Arctic (Mason et al., 2016). This aligns with earlier studies (Mason et al., 2015; Huffman et al., 2013), which additionally found PBAPs in a similar size range, the majority of which showed typical features of fungal spores. This is in agreement with the size distribution of ABC particles measured here (Fig. 7c, left): the majority of ABC particles are bigger than 2.5 µm, and almost no particles < 1 µm were detected. Furthermore, Mignani et al. (2021) found that at Weissfluhjoch, Switzerland, INPs active at −15 °C were better predicted by considering only aerosol particles larger than 2 µm rather than those larger than 0.5 µm.
The relationship between PBAPs and low-temperature INPs (< −22 °C) remains unclear. Gao et al. (2024) reported that HFAPs, measured using a WIBS-5/NEO with a 9σ threshold, contributed substantially to INP concentrations over a broad temperature range, including temperatures below −20 °C, at Mount Helmos in the eastern Mediterranean. Similar correlation coefficients to those obtained here were reported by Vogel et al. (2024) with a WIBS-NEO in Hyytiälä between mid-March and mid-May. However, their analysis focused on the FL3 channel (using a 9σ threshold), which encompasses ABC, BC, and C particles rather than ABC particles specifically. In contrast, Paramonov et al. (2020) found no significant correlation of fluorescent particles with low-temperature INPs during March and April at the same location, and Lacher et al. (2021) reported that while FAPs correlated positively with INPs at Jungfraujoch (3571 m a.s.l.), TAPs showed an even higher correlation. In both cases, snow-covered ground likely suppressed local biogenic aerosol emissions. However, it is important to note that Paramonov et al. (2020) did not specify the fluorescence threshold used, and Lacher et al. (2021) applied a 3σ threshold. These methodological differences limit the comparability of results across studies.
3.8 The ice nucleation ability of detected fungal spores
In this study, we presented a comprehensive dataset of HFAPs and demonstrated through comparisons with fungal spore counts and eDNA analysis that the vast majority of INPs active above −15 °C are most likely fungal spores. However, as previously discussed, fungal INA has been studied much less than, for example, pollen INA. This is mainly due to the immense diversity of fungi (estimated at 2.2 to 5.1 million species), of which only a fraction have been discovered or described (Hawksworth and Lücking, 2017; Blackwell, 2011).
Among the fungi identified at least to the genus level via eDNA analysis (154 unique genera), species from six genera have previously been tested for ice nucleation. Table 3 lists these detected genera alongside the activation temperatures of specific species tested, the species identified in this study, and their mean relative abundance across the 4 measurement days (eight filter samples).
(Pummer et al., 2013)(Jayaweera and Flanagan, 1982)(Iannone et al., 2011)(Jayaweera and Flanagan, 1982)(Pummer et al., 2013)(Haga et al., 2014)(Pummer et al., 2013)(Kunert et al., 2019)(Pummer et al., 2013)(Kunert et al., 2019)(Pouleur et al., 1992)(Pummer et al., 2013)(Kunert et al., 2019)(Haga et al., 2014)(Pummer et al., 2013)(Jayaweera and Flanagan, 1982)Table 3Ice nucleation temperatures (immersion freezing) of species whose genus was detected via eDNA analysis on filter samples and the detected species and its mean relative abundance. The number in brackets refers to the number of filters the species was detected on (out of eight filters). T50 and T96 are the temperatures at which 50 % and 96 % of the samples containing droplets froze, respectively, and Tonset is the temperature at which the first droplet froze. Species in bold letters are the only species detected that have been tested for INA before, and sp. means that different species of the genus are grouped together because they cannot be resolved more precisely.
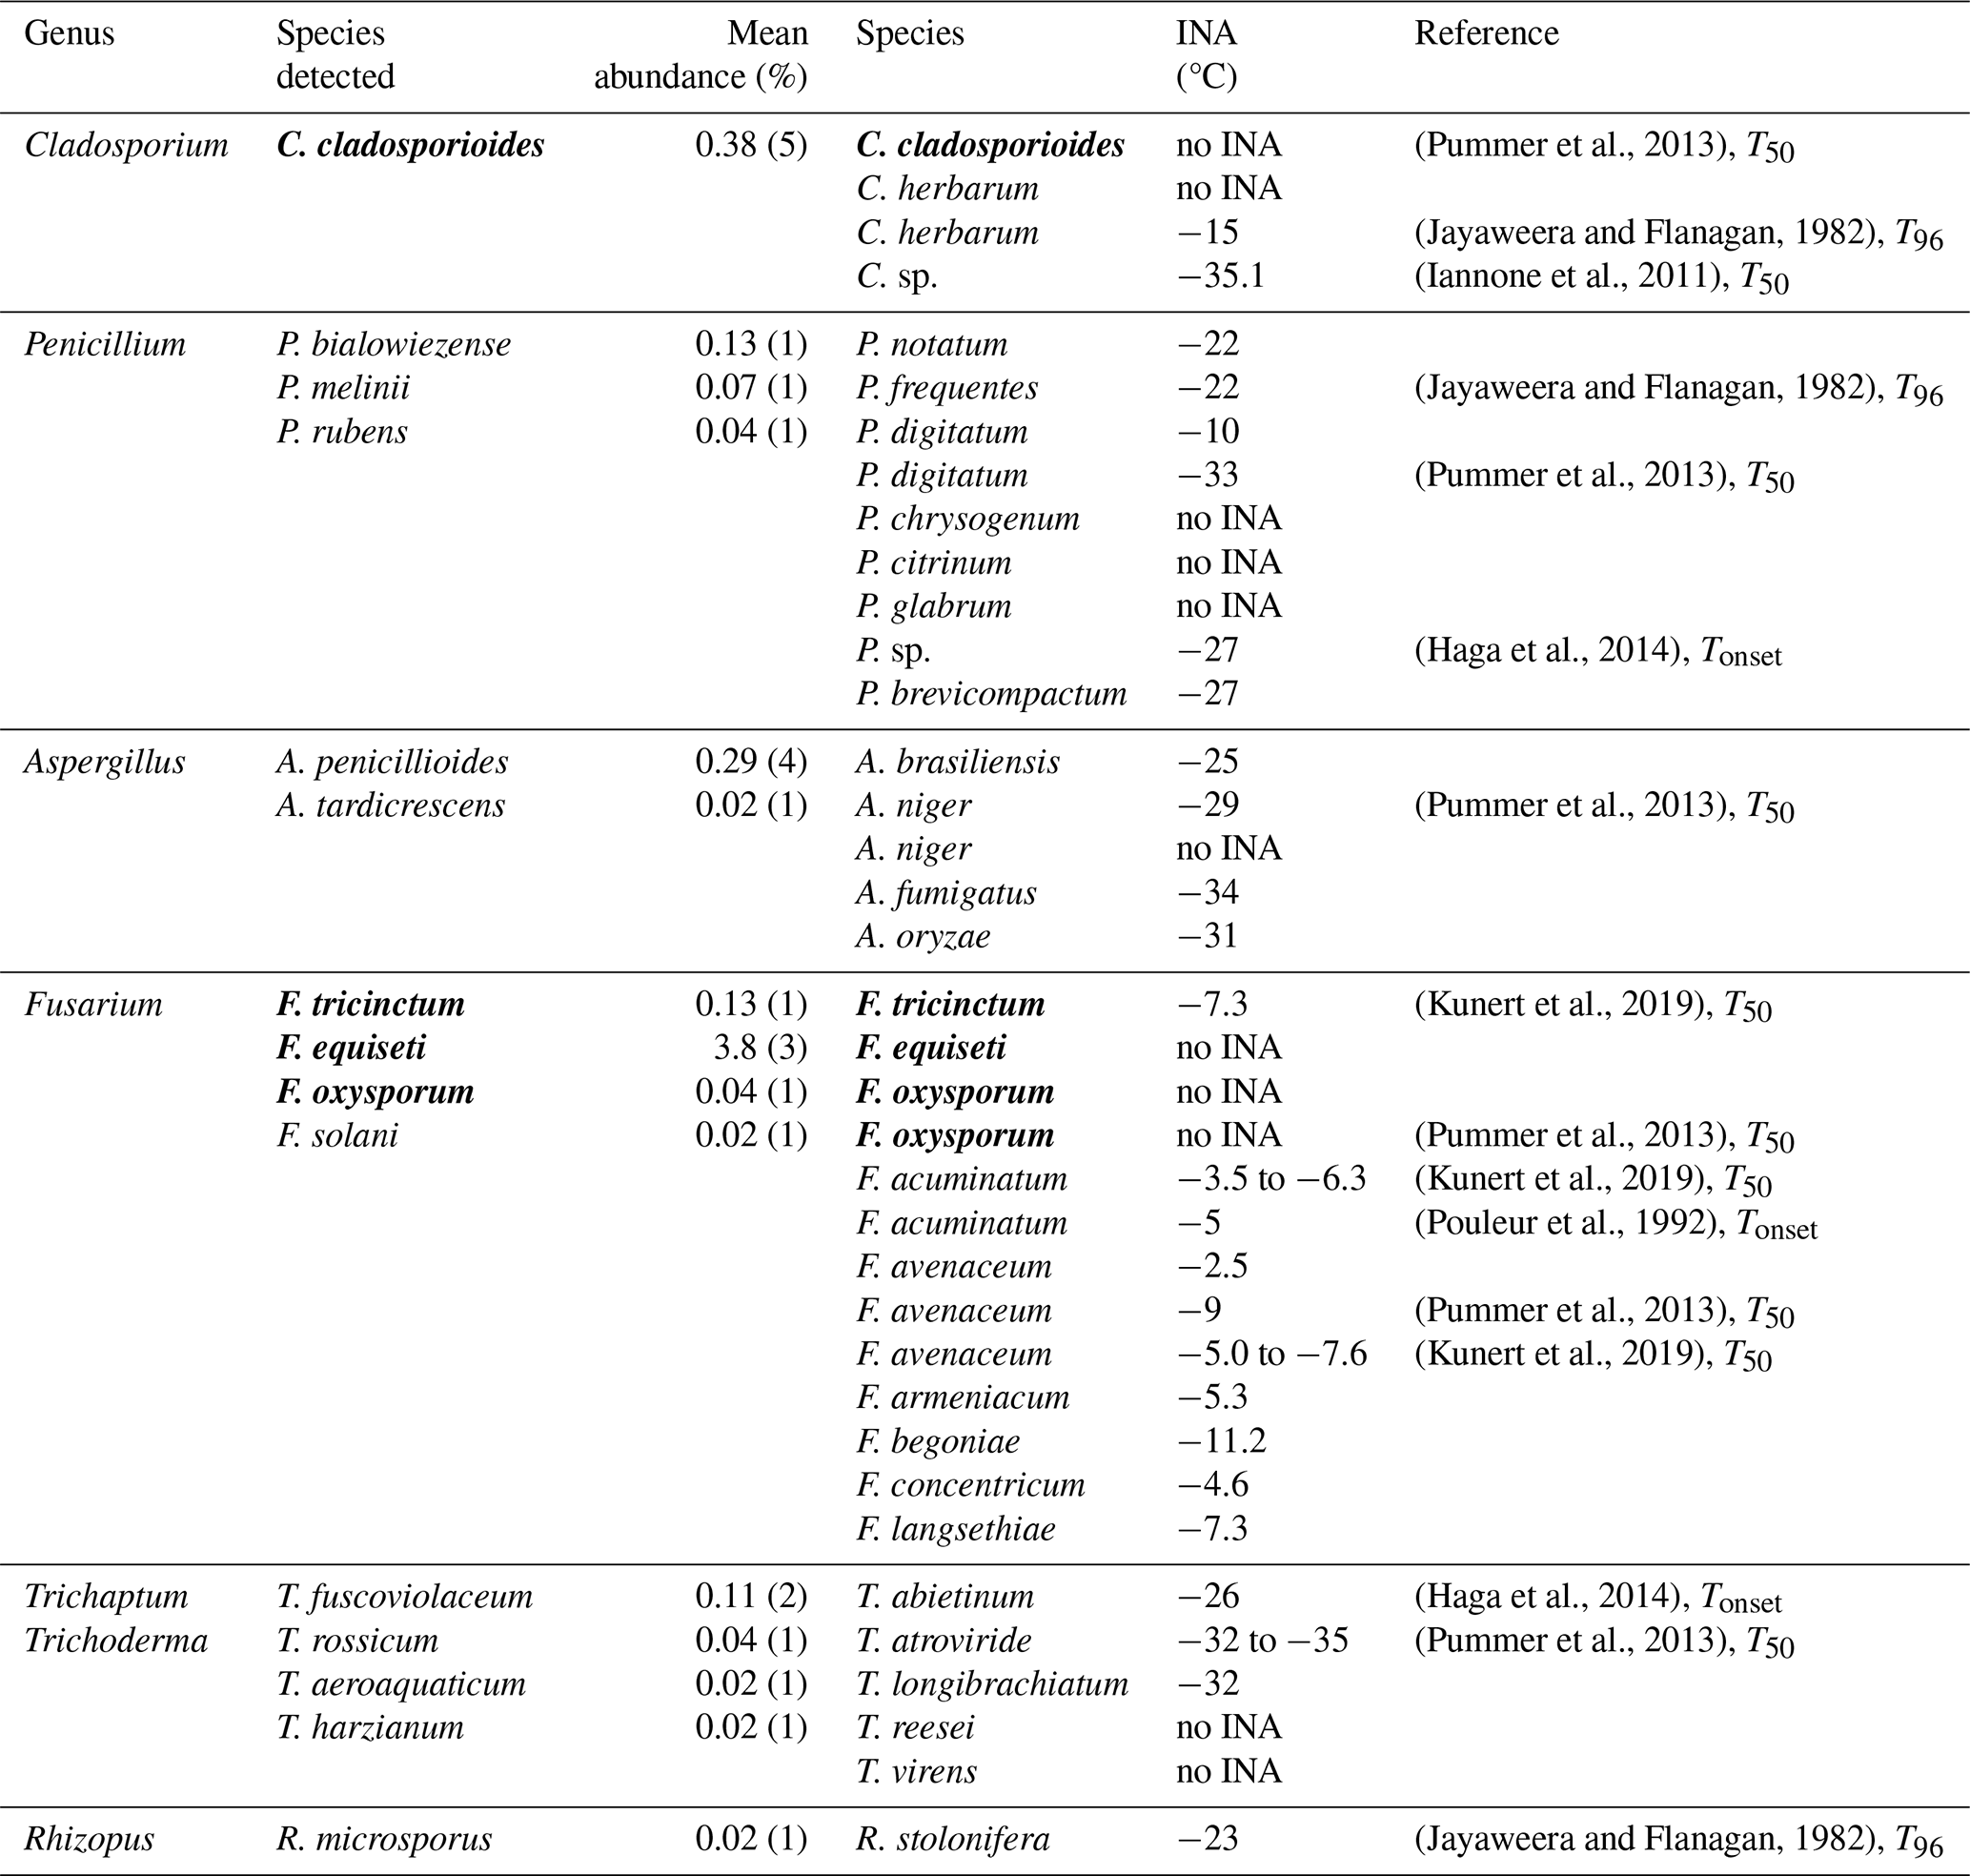
Not all species within a genus exhibit ice nucleation. Most tested species show very low or no ice nucleation temperature in immersion mode freezing (including all tested species of Aspergillus, Trichaptum, and Trichoderma). It should be noted, however, that many species have only been tested at relatively warm subzero temperatures due to methodological limitations and may still exhibit ice nucleation at colder temperatures. Within the Cladosporium genus, only C. herbarum showed ice nucleation at −15 °C (Jayaweera and Flanagan, 1982), though this result was not confirmed by Pummer et al. (2013), likely due to differences in freezing volume (Wieland et al., 2025) or cultivation conditions (Pummer et al., 2013; Tsumuki et al., 1995). The species detected here (C. cladosporioides) was found not to nucleate ice (Pummer et al., 2013). Given that Cladosporium counts from the Burkard trap alone should be sufficient to explain INP concentrations, it is unlikely that Cladosporium is responsible for the high-temperature INPs observed here. Conflicting results also exist for Penicillium digitatum, which has been reported to nucleate ice at both −10 °C (Jayaweera and Flanagan, 1982) and −33 °C (Pummer et al., 2013). All other tested Penicillium species have activation temperatures of −22 °C or lower. In this study, we detected four species of Penicillium (each on one filter only), of which none has been tested for INA. The most ice active fungus known today is Fusarium, with a nucleation temperature around −5 °C (Kunert et al., 2019; Pummer et al., 2013; Pouleur et al., 1992). One of the four species detected here (F. tricinctum) nucleates ice at −7.3 °C (Kunert et al., 2019). However, it was only detected on one out of the eight filters. Two other detected species (F. equiseti and F. oxysporum) show no INA (Kunert et al., 2019; Pummer et al., 2013), and the third (F. solani) has not yet been tested. Fusarium was never detected with the Burkard trap. Thus, it remains unclear whether Fusarium and Penicillium contribute significantly to high-temperature ice nucleation. The most abundant class of fungi here is the Agaricomycetes. Some species of this class that were not detected here have been tested for INA in laboratory studies by Haga et al. (2014) and Pummer et al. (2013), and these studies revealed very low or no ice nucleation. However, none of the 84 unique genera of Agaricomycetes detected in this study has been tested for INA. Recent field studies suggest that Agaricomycetes may contribute to atmospheric high-temperature ice nucleation (Tang et al., 2022). Specifically, Hypholoma, one of the most abundant fungi here (median relative abundance of 3.4 % (mean: 4.3 %)), and Sistotrema (median: 1.1 % (mean: 5.3 %)) have been proposed as high-temperature ice nuclei, based on comparison of relative atmospheric abundance and INP concentrations (Niu et al., 2024).
This study presents size-resolved measurements of HFAPs over four seasons in the Finnish sub-Arctic, demonstrating that AB and ABC particles dominate the HFAP fraction during warmer periods. Meteorological conditions, particularly snow cover, significantly influence AB and ABC particle concentrations. Snow cover led to an immediate reduction in these particle types, suggesting that as soon as the local biosphere is (partially) buried under a thick layer of snow, the emission of PBAPs is reduced strongly. Diurnal patterns confirmed the local origin of the PBAPs, as concentrations were highest when the station was inside the mixing layer and therefore coupled to the local surface. A comparison with direct fungal spore and pollen counts confirmed that ABC particles predominantly consist of fungal spores, and a newly applied fluorescence threshold strategy revealed that a minor fraction of ABC particles correlated with pollen grains. Visual identification of fungal spores using the Burkard trap is limited to a taxonomic group where reliable recognition is possible and accounts for only a fraction (3 %–10 %) of total fungal spores. This finding was supported by eDNA analysis, which showed that most fungal genera detected belong to Basidiomycota, particularly Agaricomycetes, of which none could be visually identified as such. A strong correlation between ABC particle concentrations and high-temperature INPs suggests that fungal spores are the dominant INPs active at temperatures around −13.5 °C. However, eDNA analysis did not pinpoint specific ice nucleating fungal species, as only a small subset of fungal genera have been tested for ice nucleation activity, and activation temperatures above −15 °C are rare among tested genera. This leaves an open question regarding the exact biological particles responsible for high-temperature ice nucleation. Despite this uncertainty, our study marks a significant step in demonstrating that fungal spores, likely originating from the local biosphere, dominate the INP population active above −15 °C. Further testing of Agaricomycetes for INA is needed to determine which specific species or genera contribute to atmospheric ice nucleation. However, Basidiomycota (which include Agaricomycetes) are generally more difficult to cultivate than Ascomycota (Rungjindamai and Jones, 2024; Krupodorova et al., 2021). Additionally, cultivation conditions and strain selection can influence INA (Pummer et al., 2013; Tsumuki et al., 1995), posing a significant challenge for future research.
The fungal fruiting season is expected to lengthen due to climate change (Boddy et al., 2014), and the fungal spore season is advancing (Wu et al., 2025). Simultaneously, the snow-covered period in the sub-Arctic is projected to shorten (Dankers and Christensen, 2005). These changes suggest that fungal ice nucleation in Arctic and sub-Arctic regions may become increasingly significant, as ice active fungal spores could remain available over a longer portion of the year. Future climate models should account for these shifts to better understand the impact of fungal high-temperature INPs on low-level cloud feedback at high latitudes.
WIBS data from the PaCE22 campaign are available at the open data repository Zenodo under https://doi.org/10.5281/zenodo.13885888 (Gratzl, 2024). A data description paper is provided by Gratzl et al. (2025).
WIBS data from the second part of the campaign and relative contributions of fungal species via eDNA analysis are available at the open data repository TU Wien Research Data under https://doi.org/10.48436/0xmsb-eps20 (Gratzl and Grothe, 2025).
PINE data from the PaCE22 campaign are available at the open data repository Zenodo under https://doi.org/10.5281/zenodo.13889647 (Böhmländer et al., 2024). A data description paper is provided by Böhmländer et al. (2025).
INSEKT data are available at the open data repository radar4KIT under https://doi.org/10.35097/bb9t8cv9gfaghcdc (Böhmländer, 2025).
Burkard data will be available in the context of the SYLVA (A SYstem for ReaL-Time ObserVation of Aeroallergens) project in the near future or upon request.
Meteorological data, eBC, and SO2 and NOx concentrations are available at https://en.ilmatieteenlaitos.fi/download-observations (last access: 26 February 2025) for the observation station “Muonio Sammaltunturi”.
The supplement related to this article is available online at https://doi.org/10.5194/acp-25-12007-2025-supplement.
JG, AB, DB, KD, EA, OM, and HG conceived and planned the experiments. DB and KD prepared and organized the PaCE 2022 campaign. JG performed WIBS measurements and data analysis, analyzed impactor foils with fluorescence microscopy, combined and interpreted all data with contributions from all authors, and visualized data. JG, FW, and OM collected filter samples. AB performed PINE and INSEKT measurements and analyzed data. SP and CP performed pollen and spore counts and analyzed data. CP and MG performed the eDNA measurements and analyzed data. JG wrote the manuscript with support from AB, SP, CP, MG, KD, and EA. All authors discussed the results and reviewed and edited the manuscript.
At least one of the (co-)authors is a member of the editorial board of Atmospheric Chemistry and Physics. The peer-review process was guided by an independent editor, and the authors also have no other competing interests to declare.
Publisher’s note: Copernicus Publications remains neutral with regard to jurisdictional claims made in the text, published maps, institutional affiliations, or any other geographical representation in this paper. While Copernicus Publications makes every effort to include appropriate place names, the final responsibility lies with the authors.
The authors gratefully acknowledge the NOAA Air Resources Laboratory (ARL) for the provision of the HYSPLIT transport and dispersion model and/or READY website (https://www.ready.noaa.gov, last access: 17 September 2025) used in this publication. We thank TU Wien and BMBWF for the purchase of the WIBS 5/NEO. The authors would like to thank the team from Metsähallitus and Sammaltunturi stations for their help with logistics, filter changing, and watching over our instrumentation. The authors acknowledge the TU Wien Bibliothek for financial support through its Open Access Funding Program. We are also grateful to Anne Kasper-Giebl from TU Wien and Paul Winkler from the University of Vienna for lending us the equipment. We thank Tobias Könemann from Droplet Measurement Technologies for technical support. We thank Harald Berger (Symbiocyte, Vienna, Austria) for carrying out the initial bioinformatics. We also thank Evgeny Kadantsev from Finnish Meteorological Institute (FMI) for the fruitful discussions.
This research has been supported by the Österreichische Forschungsförderungsgesellschaft (grant no. 888109), the Research Council of Finland (grant no. 359342), and ATMO access under the ID ATMO-TNA-4-0000000069.
This paper was edited by Luis A. Ladino and reviewed by four anonymous referees.
Aalto, T., Hatakka, J., Paatero, J., Tuovinen, J.-P., Aurela, M., Laurila, T., Holmén, K., Trivett, N., and Viisanen, Y.: Tropospheric carbon dioxide concentrations at a northern boreal site in Finland: basic variations and source areas, Tellus B, 54, 110–126, https://doi.org/10.3402/tellusb.v54i2.16652, 2002. a, b
Abarenkov, K., Zirk, A., Piirmann, T., Pöhönen, R., Ivanov, F., Nilsson, R. H., and Kõljalg, U.: Full UNITE+INSD dataset for eukaryotes, Plutof [data set], https://doi.org/10.15156/BIO/2959331, 2024. a
Abrego, N., Furneaux, B., Hardwick, B., Somervuo, P., Palorinne, I., Aguilar-Trigueros, C. A., Andrew, N. R., Babiy, U. V., Bao, T., Bazzano, G., Bondarchuk, S. N., Bonebrake, T. C., Brennan, G. L., Bret-Harte, S., Bässler, C., Cagnolo, L., Cameron, E. K., Chapurlat, E., Creer, S., D’Acqui, L. P., de Vere, N., Desprez-Loustau, M.-L., Dongmo, M. A. K., Jacobsen, I. B. D., Fisher, B. L., Flores de Jesus, M., Gilbert, G. S., Griffith, G. W., Gritsuk, A. A., Gross, A., Grudd, H., Halme, P., Hanna, R., Hansen, J., Hansen, L. H., Hegbe, A. D. M. T., Hill, S., Hogg, I. D., Hultman, J., Hyde, K. D., Hynson, N. A., Ivanova, N., Karisto, P., Kerdraon, D., Knorre, A., Krisai-Greilhuber, I., Kurhinen, J., Kuzmina, M., Lecomte, N., Lecomte, E., Loaiza, V., Lundin, E., Meire, A., Mešić, A., Miettinen, O., Monkhouse, N., Mortimer, P., Müller, J., Nilsson, R. H., Nonti, P. Y. C., Nordén, J., Nordén, B., Norros, V., Paz, C., Pellikka, P., Pereira, D., Petch, G., Pitkänen, J.-M., Popa, F., Potter, C., Purhonen, J., Pätsi, S., Rafiq, A., Raharinjanahary, D., Rakos, N., Rathnayaka, A. R., Raundrup, K., Rebriev, Y. A., Rikkinen, J., Rogers, H. M. K., Rogovsky, A., Rozhkov, Y., Runnel, K., Saarto, A., Savchenko, A., Schlegel, M., Schmidt, N. M., Seibold, S., Skjøth, C., Stengel, E., Sutyrina, S. V., Syvänperä, I., Tedersoo, L., Timm, J., Tipton, L., Toju, H., Uscka-Perzanowska, M., van der Bank, M., van der Bank, F. H., Vandenbrink, B., Ventura, S., Vignisson, S. R., Wang, X., Weisser, W. W., Wijesinghe, S. N., Wright, S. J., Yang, C., Yorou, N. S., Young, A., Yu, D. W., Zakharov, E. V., Hebert, P. D. N., Roslin, T., and Ovaskainen, O.: Airborne DNA reveals predictable spatial and seasonal dynamics of fungi, Nature, 631, 835–842, https://doi.org/10.1038/s41586-024-07658-9, 2024. a
Agresti, A. and Coull, B. A.: Approximate is Better than “Exact” for Interval Estimation of Binomial Proportions, Am. Stat., 52, 119–126, https://doi.org/10.1080/00031305.1998.10480550, 1998. a
Allitt, U.: Airborne fungal spores and the thunderstorm of 24 June 1994, Aerobiologia, 16, 397–406, https://doi.org/10.1023/A:1026503500730, 2000. a
Armstrong, R.: The influence of climate on the dispersal of lichen soredia, Environ. Exp. Bot., 31, 239–245, https://doi.org/10.1016/0098-8472(91)90076-Z, 1991. a, b
Asmi, A., Wiedensohler, A., Laj, P., Fjaeraa, A.-M., Sellegri, K., Birmili, W., Weingartner, E., Baltensperger, U., Zdimal, V., Zikova, N., Putaud, J.-P., Marinoni, A., Tunved, P., Hansson, H.-C., Fiebig, M., Kivekäs, N., Lihavainen, H., Asmi, E., Ulevicius, V., Aalto, P. P., Swietlicki, E., Kristensson, A., Mihalopoulos, N., Kalivitis, N., Kalapov, I., Kiss, G., de Leeuw, G., Henzing, B., Harrison, R. M., Beddows, D., O'Dowd, C., Jennings, S. G., Flentje, H., Weinhold, K., Meinhardt, F., Ries, L., and Kulmala, M.: Number size distributions and seasonality of submicron particles in Europe 2008–2009, Atmos. Chem. Phys., 11, 5505–5538, https://doi.org/10.5194/acp-11-5505-2011, 2011. a
Augustin, S., Wex, H., Niedermeier, D., Pummer, B., Grothe, H., Hartmann, S., Tomsche, L., Clauss, T., Voigtländer, J., Ignatius, K., and Stratmann, F.: Immersion freezing of birch pollen washing water, Atmos. Chem. Phys., 13, 10989–11003, https://doi.org/10.5194/acp-13-10989-2013, 2013. a
Backman, J., Luoma, K., Servomaa, H., Vakkari, V., and Brus, D.: In-situ aerosol measurements at the Arctic Sammaltunturi measurement station during the Pallas Cloud Experiment 2022, Earth Syst. Sci. Data Discuss. [preprint], https://doi.org/10.5194/essd-2025-284, in review, 2025. a
Barnet, D.: david-barnett/microViz: microViz 0.12.6, GitHub [code], https://github.com/david-barnett/microViz (last access: 18 September 2025), 2024. a
Barry, K. R., Hill, T. C. J., Kreidenweis, S. M., DeMott, P. J., Tobo, Y., and Creamean, J. M.: Bioaerosols as indicators of central Arctic ice nucleating particle sources, EGUsphere [preprint], https://doi.org/10.5194/egusphere-2025-128, 2025. a, b
Bauer, H., Claeys, M., Vermeylen, R., Schueller, E., Weinke, G., Berger, A., and Puxbaum, H.: Arabitol and mannitol as tracers for the quantification of airborne fungal spores, Atmos. Environ., 42, 588–593, https://doi.org/10.1016/j.atmosenv.2007.10.013, 2008. a
Beck, H. E., Zimmermann, N. E., McVicar, T. R., Vergopolan, N., Berg, A., and Wood, E. F.: Present and future Köppen-Geiger climate classification maps at 1-km resolution, Scientific Data, 5, 180214, https://doi.org/10.1038/sdata.2018.214, 2018. a
Beck, I., Moallemi, A., Heutte, B., Pernov, J. B., Bergner, N., Rolo, M., Quéléver, L. L. J., Laurila, T., Boyer, M., Jokinen, T., Angot, H., Hoppe, C. J. M., Müller, O., Creamean, J., Frey, M. M., Freitas, G., Zinke, J., Salter, M., Zieger, P., Mirrielees, J. A., Kempf, H. E., Ault, A. P., Pratt, K. A., Gysel-Beer, M., Henning, S., Tatzelt, C., and Schmale, J.: Characteristics and sources of fluorescent aerosols in the central Arctic Ocean, Elementa-Sci. Antrop., 12, 00125, https://doi.org/10.1525/elementa.2023.00125, 2024. a, b, c
Bellouin, N., Quaas, J., Gryspeerdt, E., Kinne, S., Stier, P., Watson-Parris, D., Boucher, O., Carslaw, K. S., Christensen, M., Daniau, A.-L., Dufresne, J.-L., Feingold, G., Fiedler, S., Forster, P., Gettelman, A., Haywood, J. M., Lohmann, U., Malavelle, F., Mauritsen, T., McCoy, D. T., Myhre, G., Mülmenstädt, J., Neubauer, D., Possner, A., Rugenstein, M., Sato, Y., Schulz, M., Schwartz, S. E., Sourdeval, O., Storelvmo, T., Toll, V., Winker, D., and Stevens, B.: Bounding Global Aerosol Radiative Forcing of Climate Change, Rev. Geophys., 58, e2019RG000660, https://doi.org/10.1029/2019RG000660, 2019. a
Berner, L. T., Massey, R., Jantz, P., Forbes, B. C., Macias-Fauria, M., Myers-Smith, I., Kumpula, T., Gauthier, G., Andreu-Hayles, L., Gaglioti, B. V., Burns, P., Zetterberg, P., D’Arrigo, R., and Goetz, S. J.: Summer warming explains widespread but not uniform greening in the Arctic tundra biome, Nat. Commun., 11, 4621, https://doi.org/10.1038/s41467-020-18479-5, 2020. a
Blackwell, M.: The Fungi: 1, 2, 3 … 5.1 million species?, Am. J. Bot., 98, 426–438, https://doi.org/10.3732/ajb.1000298, 2011. a
Boddy, L., Büntgen, U., Egli, S., Gange, A. C., Heegaard, E., Kirk, P. M., Mohammad, A., and Kauserud, H.: Climate variation effects on fungal fruiting, Fungal Ecol., 10, 20–33, https://doi.org/10.1016/j.funeco.2013.10.006, 2014. a
Boetius, A., Anesio, A. M., Deming, J. W., Mikucki, J. A., and Rapp, J. Z.: Microbial ecology of the cryosphere: sea ice and glacial habitats, Nat. Rev. Microbiol., 13, 677–690, https://doi.org/10.1038/nrmicro3522, 2015. a
Böhmländer, A., Lacher, L., Fösig, R., Büttner, N., Nadolny, J., Brus, D., Doulgeris, K.-M., and Möhler, O.: Measurement of the ice-nucleating particle concentration with the Portable Ice Nucleation Experiment during the Pallas Cloud Experiment 2022, Earth Syst. Sci. Data Discuss. [preprint], https://doi.org/10.5194/essd-2025-89, in review, 2025. a, b
Böhmländer, A. J., Lacher, L., Brus, D., Doulgeris, K.-M., Brasseur, Z., Boyer, M., Kuula, J., Leisner, T., and Möhler, O.: A novel aerosol filter sampler for measuring the vertical distribution of ice-nucleating particles via fixed-wing uncrewed aerial vehicles, Atmos. Meas. Tech. Discuss. [preprint], https://doi.org/10.5194/amt-2024-120, in review, 2024. a
Bolger, A. M., Lohse, M., and Usadel, B.: Trimmomatic: a flexible trimmer for Illumina sequence data, Bioinformatics, 30, 2114–2120, https://doi.org/10.1093/bioinformatics/btu170, 2014. a
Boose, Y., Sierau, B., García, M. I., Rodríguez, S., Alastuey, A., Linke, C., Schnaiter, M., Kupiszewski, P., Kanji, Z. A., and Lohmann, U.: Ice nucleating particles in the Saharan Air Layer, Atmos. Chem. Phys., 16, 9067–9087, https://doi.org/10.5194/acp-16-9067-2016, 2016. a
Burkart, J., Gratzl, J., Seifried, T. M., Bieber, P., and Grothe, H.: Isolation of subpollen particles (SPPs) of birch: SPPs are potential carriers of ice nucleating macromolecules, Biogeosciences, 18, 5751–5765, https://doi.org/10.5194/bg-18-5751-2021, 2021. a, b, c
Burrows, S. M., McCluskey, C. S., Cornwell, G., Steinke, I., Zhang, K., Zhao, B., Zawadowicz, M., Raman, A., Kulkarni, G., China, S., Zelenyuk, A., and DeMott, P. J.: Ice-Nucleating Particles That Impact Clouds and Climate: Observational and Modeling Research Needs, Rev. Geophys. 60, e2021RG000745, https://doi.org/10.1029/2021RG000745, 2022. a, b
Böhmländer, A.: Data for “Locally emitted fungal spores serve as high temperature ice nucleating particles in the European sub-Arctic” by Gratzl et al. 2025, radar4KIT [data set], https://doi.org/10.35097/bb9t8cv9gfaghcdc, 2025. a
Böhmländer, A., Lacher, L., and Möhler, O.: Data from Portable Ice Nucleation Experiment during the Pallas Cloud Experiment 2022, Zenodo [data set], https://doi.org/10.5281/zenodo.13889647, 2024. a
Ceppi, P., Brient, F., Zelinka, M., and Hartmann, D.: Cloud feedback mechanisms and their representation in global climate models, WIRES Clim. Change, 8, https://doi.org/10.1002/wcc.465, 2017. a
Christner, B. C., Cai, R., Morris, C. E., McCarter, K. S., Foreman, C. M., Skidmore, M. L., Montross, S. N., and Sands, D. C.: Geographic, seasonal, and precipitation chemistry influence on the abundance and activity of biological ice nucleators in rain and snow, P. Natl. Acad. Sci. USA, 105, 18854–18859, https://doi.org/10.1073/pnas.0809816105, 2008. a
Clancy, J. H., Markey, E., Martínez-Bracero, M., Maya-Manzano, J. M., McGillicuddy, E. J., Sewell, G., Sarda-Estève, R., Baisnée, D., Vélez-Pereira, A. M., Davis, G., and O’Connor, D. J.: Comparative Analysis of Real-Time Fluorescence-Based Spectroscopic Instruments: Bioaerosol Detection in the Urban Environment of Dublin City, Ireland, Atmosphere, 16, https://doi.org/10.3390/atmos16030275, 2025. a, b
Cohen, J., Screen, J. A., Furtado, J. C., Barlow, M., Whittleston, D., Coumou, D., Francis, J., Dethloff, K., Entekhabi, D., Overland, J., and Jones, J.: Recent Arctic amplification and extreme mid-latitude weather, Nat. Geosci., 7, 627–637, https://doi.org/10.1038/ngeo2234, 2014. a
Conen, F., Stopelli, E., and Zimmermann, L.: Clues that decaying leaves enrich Arctic air with ice nucleating particles, Environ. Exp. Bot., 129, 91–94, https://doi.org/10.1016/j.atmosenv.2016.01.027. a
Cornwell, G. C., McCluskey, C. S., Hill, T. C. J., Levin, E. T., Rothfuss, N. E., Tai, S.-L., Petters, M. D., DeMott, P. J., Kreidenweis, S., Prather, K. A., and Burrows, S. M.: Bioaerosols are the dominant source of warm-temperature immersion-mode INPs and drive uncertainties in INP predictability, Science Advances, 9, eadg3715, https://doi.org/10.1126/sciadv.adg3715, 2023. a, b, c
Daily, M. I., Tarn, M. D., Whale, T. F., and Murray, B. J.: An evaluation of the heat test for the ice-nucleating ability of minerals and biological material, Atmos. Meas. Tech., 15, 2635–2665, https://doi.org/10.5194/amt-15-2635-2022, 2022. a, b
Dankers, R. and Christensen, O. B.: Climate Change Impact on Snow Coverage, Evaporation and River Discharge in the Sub-Arctic Tana Basin, Northern Fennoscandia, Climatic Change, 69, 367–392, https://doi.org/10.1007/s10584-005-2533-y, 2005. a, b
De Groot, R. C.: Diurnal cycles of airborne spores produced by forest fungi, Phytopathology, 58, 1223–1229, 1968. a
DeMott, P. J. and Prenni, A. J.: New Directions: Need for defining the numbers and sources of biological aerosols acting as ice nuclei, Atmos. Environ., 44, 1944–1945, https://doi.org/10.1016/j.atmosenv.2010.02.032, 2010. a
DeMott, P. J., Sassen, K., Poellot, M. R., Baumgardner, D., Rogers, D. C., Brooks, S. D., Prenni, A. J., and Kreidenweis, S. M.: African dust aerosols as atmospheric ice nuclei, Geophys. Res. Lett., 30, https://doi.org/10.1029/2003GL017410, 2003. a
Diehl, K., Quick, C., Matthias-Maser, S., Mitra, S., and Jaenicke, R.: The ice nucleating ability of pollen: Part I: Laboratory studies in deposition and condensation freezing modes, Atmos. Res., 58, 75–87, https://doi.org/10.1016/S0169-8095(01)00091-6, 2001. a
Doulgeris, K. M., Lihavainen, H., Hyvärinen, A.-P., Kerminen, V.-M., and Brus, D.: An extensive data set for in situ microphysical characterization of low-level clouds in a Finnish sub-Arctic site, Earth Syst. Sci. Data, 14, 637–649, https://doi.org/10.5194/essd-14-637-2022, 2022. a
Drinovec, L., Močnik, G., Zotter, P., Prévôt, A. S. H., Ruckstuhl, C., Coz, E., Rupakheti, M., Sciare, J., Müller, T., Wiedensohler, A., and Hansen, A. D. A.: The “dual-spot” Aethalometer: an improved measurement of aerosol black carbon with real-time loading compensation, Atmos. Meas. Tech., 8, 1965–1979, https://doi.org/10.5194/amt-8-1965-2015, 2015. a
Edgar, R. C.: Search and clustering orders of magnitude faster than BLAST, Bioinformatics, 26, 2460–2461, https://doi.org/10.1093/bioinformatics/btq461, 2010. a
Elbert, W., Taylor, P. E., Andreae, M. O., and Pöschl, U.: Contribution of fungi to primary biogenic aerosols in the atmosphere: wet and dry discharged spores, carbohydrates, and inorganic ions, Atmos. Chem. Phys., 7, 4569–4588, https://doi.org/10.5194/acp-7-4569-2007, 2007. a, b
Eufemio, R. J., Renzer, G., Rojas, M., Miadlikowska, J., Sformo, T. L., Lutzoni, F., Vinatzer, B. A., and Meister, K.: Peltigera lichen thalli produce highly potent ice-nucleating agents, Biogeosciences, 22, 2087–2096, https://doi.org/10.5194/bg-22-2087-2025, 2025. a
Failor, K. C., Schmale, D G, I., Vinatzer, B. A., and Monteil, C. L.: Ice nucleation active bacteria in precipitation are genetically diverse and nucleate ice by employing different mechanisms, ISME J., 11, 2740–2753, https://doi.org/10.1038/ismej.2017.124, 2017. a, b
Fernández-Rodríguez, S., Tormo-Molina, R., Lemonis, N., Clot, B., O'Connor, D., and Sodeau, J. R.: Comparison of fungal spores concentrations measured with wideband integrated bioaerosol sensor and Hirst methodology, Atmos. Environ., 175, 1–14, https://doi.org/10.1016/j.atmosenv.2017.11.038, 2018. a
Flossmann, A. I. and Wobrock, W.: A review of our understanding of the aerosol–cloud interaction from the perspective of a bin resolved cloud scale modelling, Atmos. Res., 97, 478–497, https://doi.org/10.1016/j.atmosres.2010.05.008, 2010. a
Fröhlich-Nowoisky, J., Burrows, S. M., Xie, Z., Engling, G., Solomon, P. A., Fraser, M. P., Mayol-Bracero, O. L., Artaxo, P., Begerow, D., Conrad, R., Andreae, M. O., Després, V. R., and Pöschl, U.: Biogeography in the air: fungal diversity over land and oceans, Biogeosciences, 9, 1125–1136, https://doi.org/10.5194/bg-9-1125-2012, 2012. a
Fröhlich-Nowoisky, J., Pickersgill, D. A., Després, V. R., and Pöschl, U.: High diversity of fungi in air particulate matter, P. Natl. Acad. Sci. USA, 106, 12814–12819, https://doi.org/10.1073/pnas.0811003106, 2009. a
Fröhlich-Nowoisky, J., Kampf, C. J., Weber, B., Huffman, J. A., Pöhlker, C., Andreae, M. O., Lang-Yona, N., Burrows, S. M., Gunthe, S. S., Elbert, W., Su, H., Hoor, P., Thines, E., Hoffmann, T., Després, V. R., and Pöschl, U.: Bioaerosols in the Earth system: Climate, health, and ecosystem interactions, Atmos. Res., 182, 346–376, https://doi.org/10.1016/j.atmosres.2016.07.018, 2016. a, b
Fu, P. Q., Kawamura, K., Chen, J., Charrière, B., and Sempéré, R.: Organic molecular composition of marine aerosols over the Arctic Ocean in summer: contributions of primary emission and secondary aerosol formation, Biogeosciences, 10, 653–667, https://doi.org/10.5194/bg-10-653-2013, 2013. a
Gabey, A. M., Gallagher, M. W., Whitehead, J., Dorsey, J. R., Kaye, P. H., and Stanley, W. R.: Measurements and comparison of primary biological aerosol above and below a tropical forest canopy using a dual channel fluorescence spectrometer, Atmos. Chem. Phys., 10, 4453–4466, https://doi.org/10.5194/acp-10-4453-2010, 2010. a
Gao, K., Vogel, F., Foskinis, R., Vratolis, S., Gini, M. I., Granakis, K., Billault-Roux, A.-C., Georgakaki, P., Zografou, O., Fetfatzis, P., Berne, A., Papayannis, A., Eleftheridadis, K., Möhler, O., and Nenes, A.: Biological and dust aerosols as sources of ice-nucleating particles in the eastern Mediterranean: source apportionment, atmospheric processing and parameterization, Atmos. Chem. Phys., 24, 9939–9974, https://doi.org/10.5194/acp-24-9939-2024, 2024. a, b, c, d, e
Garcia, E., Hill, T. C. J., Prenni, A. J., DeMott, P. J., Franc, G. D., and Kreidenweis, S. M.: Biogenic ice nuclei in boundary layer air over two U.S. High Plains agricultural regions, J. Geophys. Res., 117, https://doi.org/10.1029/2012JD018343, 2012. a
Gilbert, G. S. and Reynolds, D. R.: Nocturnal Fungi: Airborne Spores in the Canopy and Understory of a Tropical Rain Forest, Biotropica, 37, 462–464, https://doi.org/10.1111/j.1744-7429.2005.00061.x, 2005. a
Gjelsvik, A. B., David, R. O., Carlsen, T., Hellmuth, F., Hofer, S., McGraw, Z., Sodemann, H., and Storelvmo, T.: Using a region-specific ice-nucleating particle parameterization improves the representation of Arctic clouds in a global climate model, Atmos. Chem. Phys., 25, 1617–1637, https://doi.org/10.5194/acp-25-1617-2025, 2025. a
Gonthier, P., Garbelotto, M. M., and Nicolotti, G.: Seasonal Patterns of Spore Deposition of Heterobasidion Species in Four Forests of the Western Alps, Ecology and Epidemiology, 95, 759–767, https://doi.org/10.1094/PHYTO-95-0759, 2005. a
Gorfer, M., Mayer, M., Berger, H., Rewald, B., Tallian, C., Matthews, B., Sandén, H., Katzensteiner, K., and Godbold, D. L.: High Fungal Diversity but Low Seasonal Dynamics and Ectomycorrhizal Abundance in a Mountain Beech Forest, Microb. Ecol., 82, 243–256, https://doi.org/10.1007/s00248-021-01736-5, 2021. a, b
Gosselin, M. I., Rathnayake, C. M., Crawford, I., Pöhlker, C., Fröhlich-Nowoisky, J., Schmer, B., Després, V. R., Engling, G., Gallagher, M., Stone, E., Pöschl, U., and Huffman, J. A.: Fluorescent bioaerosol particle, molecular tracer, and fungal spore concentrations during dry and rainy periods in a semi-arid forest, Atmos. Chem. Phys., 16, 15165–15184, https://doi.org/10.5194/acp-16-15165-2016, 2016. a, b
Gratzl, J.: Data of Fluorescent Aerosol Particles during the Pallas Cloud Experiment 2022, Zenodo [data set], https://doi.org/10.5281/zenodo.13885888, 2024. a
Gratzl, J. and Grothe, H.: Highly fluorescent aerosol particle and fungal DNA data collected in Pallas from April to September 2023, TU Wien [data set], https://doi.org/10.48436/0xmsb-eps20, 2025. a
Gratzl, J., Brus, D., Doulgeris, K., Böhmländer, A., Möhler, O., and Grothe, H.: Fluorescent aerosol particles in the Finnish sub-Arctic during the Pallas Cloud Experiment 2022 campaign, Earth Syst. Sci. Data, 17, 3975–3985, https://doi.org/10.5194/essd-17-3975-2025, 2025. a, b, c, d, e, f
Gregory, P. H. and Hirst, J. M.: The Summer Air-Spora at Rothamsted in 1952, Microbiology, 17, 135–152, https://doi.org/10.1099/00221287-17-1-135, 1957. a
Haga, D. I., Iannone, R., Wheeler, M. J., Mason, R., Polishchuk, E. A., Fetch Jr., T., van der Kamp, B. J., McKendry, I. G., and Bertram, A. K.: Ice nucleation properties of rust and bunt fungal spores and their transport to high altitudes, where they can cause heterogeneous freezing, J. Geophys. Res., 118, 7260–7272, https://doi.org/10.1002/jgrd.50556, 2013. a
Haga, D. I., Burrows, S. M., Iannone, R., Wheeler, M. J., Mason, R. H., Chen, J., Polishchuk, E. A., Pöschl, U., and Bertram, A. K.: Ice nucleation by fungal spores from the classes Agaricomycetes, Ustilaginomycetes, and Eurotiomycetes, and the effect on the atmospheric transport of these spores, Atmos. Chem. Phys., 14, 8611–8630, https://doi.org/10.5194/acp-14-8611-2014, 2014. a, b, c, d
Halbritter, H., Heigl, H., and W., A.: Pinus Sylvestris, PalDat – A palynological database, PalDat – Palynological Database [data set], https://www.paldat.org/pub/Pinus_sylvestris/306147 (last access: 14 February 2025), 2021. a
Hartmann, M., Gong, X., Kecorius, S., van Pinxteren, M., Vogl, T., Welti, A., Wex, H., Zeppenfeld, S., Herrmann, H., Wiedensohler, A., and Stratmann, F.: Terrestrial or marine – indications towards the origin of ice-nucleating particles during melt season in the European Arctic up to 83.7° N, Atmos. Chem. Phys., 21, 11613–11636, https://doi.org/10.5194/acp-21-11613-2021, 2021. a
Hatakka, J., Aalto, T., Aaltonen, V., Aurela, M., Hakola, H., Komppula, M., Laurila, T., Lihavainen, H., Paatero, J., Salminen, K., et al.: Overview of the atmospheric research activities and results at Pallas GAW station, Boreal Environ. Res., 8, 365, https://www.borenv.net/BER/archive/pdfs/ber8/ber8-365.pdf (last access: 18 September 2025), 2003. a, b, c, d
Hawksworth, D. L. and Lücking, R.: Fungal Diversity Revisited: 2.2 to 3.8 Million Species, Microbiol. Spectr., 5, https://doi.org/10.1128/microbiolspec.funk-0052-2016, 2017. a
Healy, D. A., Huffman, J. A., O'Connor, D. J., Pöhlker, C., Pöschl, U., and Sodeau, J. R.: Ambient measurements of biological aerosol particles near Killarney, Ireland: a comparison between real-time fluorescence and microscopy techniques, Atmos. Chem. Phys., 14, 8055–8069, https://doi.org/10.5194/acp-14-8055-2014, 2014. a
Helin, A., Sietiö, O.-M., Heinonsalo, J., Bäck, J., Riekkola, M.-L., and Parshintsev, J.: Characterization of free amino acids, bacteria and fungi in size-segregated atmospheric aerosols in boreal forest: seasonal patterns, abundances and size distributions, Atmos. Chem. Phys., 17, 13089–13101, https://doi.org/10.5194/acp-17-13089-2017, 2017. a
Heo, K. J., Kim, H. B., and Lee, B. U.: Concentration of environmental fungal and bacterial bioaerosols during the monsoon season, J. Aersosol Sci., 77, 31–37, https://doi.org/10.1016/j.jaerosci.2014.07.001, 2014. a
Herbert, R. J., Sanchez-Marroquin, A., Grosvenor, D. P., Pringle, K. J., Arnold, S. R., Murray, B. J., and Carslaw, K. S.: Gaps in our understanding of ice-nucleating particle sources exposed by global simulation of the UK Earth System Model, Atmos. Chem. Phys., 25, 291–325, https://doi.org/10.5194/acp-25-291-2025, 2025. a
Hernandez, M., Perring, A. E., McCabe, K., Kok, G., Granger, G., and Baumgardner, D.: Chamber catalogues of optical and fluorescent signatures distinguish bioaerosol classes, Atmos. Meas. Tech., 9, 3283–3292, https://doi.org/10.5194/amt-9-3283-2016, 2016. a, b, c
Hill, T. C. J., DeMott, P. J., Tobo, Y., Fröhlich-Nowoisky, J., Moffett, B. F., Franc, G. D., and Kreidenweis, S. M.: Sources of organic ice nucleating particles in soils, Atmos. Chem. Phys., 16, 7195–7211, https://doi.org/10.5194/acp-16-7195-2016, 2016. a
Hirst, J. M.: An automatic volumetric spore trap, Ann. Appl. Biol., 39, 257–265, https://doi.org/10.1111/j.1744-7348.1952.tb00904.x, 1952. a
Hirst, J. M. and Stedman, O. J.: Dry Liberation of Fungus Spores by Raindrops, Microbiology, 33, 335–344, https://doi.org/10.1099/00221287-33-2-335, 1963. a
Hofstetter, V., Buyck, B., Eyssartier, G., Schnee, S., and Gindro, K.: The unbearable lightness of sequenced-based identification, Fungal Divers., 96, 243–284, https://doi.org/10.1007/s13225-019-00428-3, 2019. a
Huang, S., Hu, W., Chen, J., Wu, Z., Zhang, D., and Fu, P.: Overview of biological ice nucleating particles in the atmosphere, Environ. Int., 146, 106197, https://doi.org/10.1016/j.envint.2020.106197, 2021. a
Huffman, J. A., Prenni, A. J., DeMott, P. J., Pöhlker, C., Mason, R. H., Robinson, N. H., Fröhlich-Nowoisky, J., Tobo, Y., Després, V. R., Garcia, E., Gochis, D. J., Harris, E., Müller-Germann, I., Ruzene, C., Schmer, B., Sinha, B., Day, D. A., Andreae, M. O., Jimenez, J. L., Gallagher, M., Kreidenweis, S. M., Bertram, A. K., and Pöschl, U.: High concentrations of biological aerosol particles and ice nuclei during and after rain, Atmos. Chem. Phys., 13, 6151–6164, https://doi.org/10.5194/acp-13-6151-2013, 2013. a, b, c, d
Hughes, D. D., Mampage, C. B., Jones, L. M., Liu, Z., and Stone, E. A.: Characterization of atmospheric pollen fragments during springtime thunderstorms, Environ. Sci. Tech. Let., 7, 409–414, https://doi.org/10.1021/acs.estlett.0c00213, 2020. a, b, c, d
Iannone, R., Chernoff, D. I., Pringle, A., Martin, S. T., and Bertram, A. K.: The ice nucleation ability of one of the most abundant types of fungal spores found in the atmosphere, Atmos. Chem. Phys., 11, 1191–1201, https://doi.org/10.5194/acp-11-1191-2011, 2011. a
Irish, V. E., Hanna, S. J., Willis, M. D., China, S., Thomas, J. L., Wentzell, J. J. B., Cirisan, A., Si, M., Leaitch, W. R., Murphy, J. G., Abbatt, J. P. D., Laskin, A., Girard, E., and Bertram, A. K.: Ice nucleating particles in the marine boundary layer in the Canadian Arctic during summer 2014, Atmos. Chem. Phys., 19, 1027–1039, https://doi.org/10.5194/acp-19-1027-2019, 2019. a
IPCC: Climate Change 2021: The Physical Science Basis. Contribution of Working Group I to the Sixth Assessment Report of the Intergovernmental Panel on Climate Change, edited by: Masson-Delmotte, V., Zhai, P., Pirani, A., Connors, S. L., Péan, C., Berger, S., Caud, N., Chen, Y., Goldfarb, L., Gomis, M. I., Huang, M., Leitzell, K., Lonnoy, E., Matthews, J. B. R., Maycock, T. K., Waterfield, T., Yelekçi, O., Yu, R., and Zhou, B., Cambridge University Press, Cambridge, United Kingdom and New York, NY, USA, 2391 pp., https://doi.org/10.1017/9781009157896, 2021. a
Jayaweera, K. and Flanagan, P.: Investigations on biogenic ice nuclei in the Arctic atmosphere, Geophys. Res. Lett., 9, 94–97, https://doi.org/10.1029/GL009i001p00094, 1982. a, b, c, d, e, f, g
Jensen, L. Z., Simonsen, J. K., Pastor, A., Pearce, C., Nørnberg, P., Lund-Hansen, L. C., Finster, K., and Šantl-Temkiv, T.: Linking biogenic high-temperature ice nucleating particles in Arctic soils and streams to their microbial producers, Aerosol Research, 3, 81–100, https://doi.org/10.5194/ar-3-81-2025, 2025. a
Joly, M., Attard, E., Sancelme, M., Deguillaume, L., Guilbaud, C., Morris, C. E., Amato, P., and Delort, A.-M.: Ice nucleation activity of bacteria isolated from cloud water, Atmos. Environ., 70, 392–400, https://doi.org/10.1016/j.atmosenv.2013.01.027, 2013. a
Kabir, E., Azzouz, A., Raza, N., Bhardwaj, S., Kim, K., Tabatabaei, M., and Kukkar, D.: Recent advances in monitoring, sampling, and sensing techniques for bioaerosols in the atmosphere, ACS Sensors, https://doi.org/10.1021/acssensors.9b02585, 2020. a
Kallio, T.: Aerial distribution of the root-rot fungus Fomes annosus (Fr.) Cooke in Finland, Acta Forestalia Fennica, 107, 7541, https://doi.org/10.14214/aff.7541, 1970. a
Kanji, Z. A., Ladino, L. A., Wex, H., Boose, Y., Burkert-Kohn, M., Cziczo, D. J., and Krämer, M.: Overview of Ice Nucleating Particles, Meteor. Mon., 58, 1.1–1.33, https://doi.org/10.1175/AMSMONOGRAPHS-D-16-0006.1, 2017. a, b, c
Katsivela, E., Chatoutsidou, S. E., Saridaki, A., Raisi, L., Stathopoulou, P., Tsiamis, G., Kunfeng, G., Fetfatzis, P., Romanos, F., Gidarakou, M., Gini, M. I., Granakis, K., Mylonaki, M., Papanikolaou, C., Vratolis, S., Vogel, F., Zografou, O., Möhler, O., Papayannis, A., Eleftheriadis, K., Nenes, A., and Lazaridis, M.: Airborne Microorganisms at Hellenic Atmospheric Aerosol and Climate Change Station in Helmos Mountain (Greece), ACS Earth and Space Chemistry, https://doi.org/10.1021/acsearthspacechem.5c00064, 2025. a, b
Kawana, K., Taketani, F., Matsumoto, K., Tobo, Y., Iwamoto, Y., Miyakawa, T., Ito, A., and Kanaya, Y.: Roles of marine biota in the formation of atmospheric bioaerosols, cloud condensation nuclei, and ice-nucleating particles over the North Pacific Ocean, Bering Sea, and Arctic Ocean, Atmos. Chem. Phys., 24, 1777–1799, https://doi.org/10.5194/acp-24-1777-2024, 2024. a, b
Komppula, M., Lihavainen, H., Kerminen, V.-M., Kulmala, M., and Viisanen, Y.: Measurements of cloud droplet activation of aerosol particles at a clean subarctic background site, J. Geophys. Res.-Atmos, 110, https://doi.org/10.1029/2004JD005200, 2005. a
Köppen, W. P.: Grundriss der klimakunde, W. de Gruyter, ISBN 9783111283043, 1931. a
Krupodorova, T., Barshteyn, V., and Sekan, A.: Review of the basic cultivation conditions influence on the growth of basidiomycetes, Current Research in Environmental & Applied Mycology, https://doi.org/10.5943/cream/11/1/34, 2021. a
Kunert, A. T., Pöhlker, M. L., Tang, K., Krevert, C. S., Wieder, C., Speth, K. R., Hanson, L. E., Morris, C. E., Schmale III, D. G., Pöschl, U., and Fröhlich-Nowoisky, J.: Macromolecular fungal ice nuclei in Fusarium: effects of physical and chemical processing, Biogeosciences, 16, 4647–4659, https://doi.org/10.5194/bg-16-4647-2019, 2019. a, b, c, d, e, f
Lacher, L., Clemen, H.-C., Shen, X., Mertes, S., Gysel-Beer, M., Moallemi, A., Steinbacher, M., Henne, S., Saathoff, H., Möhler, O., Höhler, K., Schiebel, T., Weber, D., Schrod, J., Schneider, J., and Kanji, Z. A.: Sources and nature of ice-nucleating particles in the free troposphere at Jungfraujoch in winter 2017, Atmos. Chem. Phys., 21, 16925–16953, https://doi.org/10.5194/acp-21-16925-2021, 2021. a, b
Ladino, L. A., Raga, G. B., Alvarez-Ospina, H., Andino-Enríquez, M. A., Rosas, I., Martínez, L., Salinas, E., Miranda, J., Ramírez-Díaz, Z., Figueroa, B., Chou, C., Bertram, A. K., Quintana, E. T., Maldonado, L. A., García-Reynoso, A., Si, M., and Irish, V. E.: Ice-nucleating particles in a coastal tropical site, Atmos. Chem. Phys., 19, 6147–6165, https://doi.org/10.5194/acp-19-6147-2019, 2019. a
Lohila, A., Penttilä, T., Jortikka, S., Aalto, T., Anttila, P., Asmi, E., Aurela, M., Hatakka, J., Hellén, H., Henttonen, H., Hänninen, P., Kilkki, J., Kyllönen, K., Laurila, T., Lepistö, A., Lihavainen, H., Makkonen, U., Paatero, J., Rask, M., and Viisanen, Y.: Preface to the special issue on integrated research of atmosphere, ecosystems and environment at Pallas, Boreal Environ. Res., 20, 431–454, 2015. a
Maki, L., Galyan, E., Chang-Chien, M., and Caldwell, D.: Ice nucleation induced by pseudomonas syringae, Appl. Microbiol., 28, 456—459, https://doi.org/10.1128/am.28.3.456-459.1974, 1974. a
Maki, L. R. and Willoughby, K. J.: Bacteria as Biogenic Sources of Freezing Nuclei, J. Appl. Meteorol. Clim., 17, 1049–1053, https://doi.org/10.1175/1520-0450(1978)017<1049:BABSOF>2.0.CO;2, 1978. a
Maki, T., Hosaka, K., Lee, K. C., Kawabata, Y., Kajino, M., Uto, M., Kita, K., and Igarashi, Y.: Vertical distribution of airborne microorganisms over forest environments: A potential source of ice-nucleating bioaerosols, Atmos. Environ., 302, 119726, https://doi.org/10.1016/j.atmosenv.2023.119726, 2023. a, b, c
Mäkinen, Y.: Random sampling in the study of microscopic slides, Rep. Aerobiol. Lab. Univ. Turku, 5, 27–43, 1981. a
Mampage, C. B., Hughes, D. D., Jones, L. M., Metwali, N., Thorne, P. S., and Stone, E. A.: Characterization of sub-pollen particles in size-resolved atmospheric aerosol using chemical tracers, Atmos Environ X, 15, 100177, https://doi.org/10.1016/j.aeaoa.2022.100177, 2022. a, b, c
Markey, E., Hourihane Clancy, J., Martínez-Bracero, M., Neeson, F., Sarda-Estève, R., Baisnée, D., McGillicuddy, E. J., Sewell, G., and O’Connor, D. J.: A Modified Spectroscopic Approach for the Real-Time Detection of Pollen and Fungal Spores at a Semi-Urban Site Using the WIBS-4+, Part I, Sensors, 22, 8747, https://doi.org/10.3390/s22228747, 2022. a, b
Markey, E., Hourihane Clancy, J., Martínez-Bracero, M., Sarda-Estève, R., Baisnée, D., McGillicuddy, E. J., Sewell, G., Skjøth, C. A., and O'Connor, D. J.: Spectroscopic detection of bioaerosols with the wibs-4+: Anthropogenic and meteorological impacts, Sci Total Environ., 943, 173649, https://doi.org/10.1016/j.scitotenv.2024.173649, 2024. a
Mason, R. H., Si, M., Li, J., Chou, C., Dickie, R., Toom-Sauntry, D., Pöhlker, C., Yakobi-Hancock, J. D., Ladino, L. A., Jones, K., Leaitch, W. R., Schiller, C. L., Abbatt, J. P. D., Huffman, J. A., and Bertram, A. K.: Ice nucleating particles at a coastal marine boundary layer site: correlations with aerosol type and meteorological conditions, Atmos. Chem. Phys., 15, 12547–12566, https://doi.org/10.5194/acp-15-12547-2015, 2015. a, b, c
Mason, R. H., Si, M., Chou, C., Irish, V. E., Dickie, R., Elizondo, P., Wong, R., Brintnell, M., Elsasser, M., Lassar, W. M., Pierce, K. M., Leaitch, W. R., MacDonald, A. M., Platt, A., Toom-Sauntry, D., Sarda-Estève, R., Schiller, C. L., Suski, K. J., Hill, T. C. J., Abbatt, J. P. D., Huffman, J. A., DeMott, P. J., and Bertram, A. K.: Size-resolved measurements of ice-nucleating particles at six locations in North America and one in Europe, Atmos. Chem. Phys., 16, 1637–1651, https://doi.org/10.5194/acp-16-1637-2016, 2016. a
Matthews, B. H., Alsante, A. N., and Brooks, S. D.: Pollen Emissions of Subpollen Particles and Ice Nucleating Particles, ACS Earth Space Chem., 7, 1207–1218, https://doi.org/10.1021/acsearthspacechem.3c00014, 2023. a
McMurdie, P. J. and Holmes, S.: phyloseq: An R Package for Reproducible Interactive Analysis and Graphics of Microbiome Census Data, PLoS ONE, 8, e61217, https://doi.org/10.1371/journal.pone.0061217, 2013. a
Mignani, C., Wieder, J., Sprenger, M. A., Kanji, Z. A., Henneberger, J., Alewell, C., and Conen, F.: Towards parameterising atmospheric concentrations of ice-nucleating particles active at moderate supercooling, Atmos. Chem. Phys., 21, 657–664, https://doi.org/10.5194/acp-21-657-2021, 2021. a
Mikryukov, V. and Mahé, F.: vmikk/metagMisc: 0.5.0, Zenodo [code], https://doi.org/10.5281/zenodo.15060881, 2025. a
Moffett, B. F.: Ice nucleation in mosses and liverworts, Lindbergia, 38, 14–16, https://doi.org/10.25227/linbg.01035, 2015. a
Möhler, O., Adams, M., Lacher, L., Vogel, F., Nadolny, J., Ullrich, R., Boffo, C., Pfeuffer, T., Hobl, A., Weiß, M., Vepuri, H. S. K., Hiranuma, N., and Murray, B. J.: The Portable Ice Nucleation Experiment (PINE): a new online instrument for laboratory studies and automated long-term field observations of ice-nucleating particles, Atmos. Meas. Tech., 14, 1143–1166, https://doi.org/10.5194/amt-14-1143-2021, 2021. a
Morris, C. E., Georgakopoulos, D. G., and Sands, D. C.: Ice nucleation active bacteria and their potential role in precipitation, in: Journal de Physique IV (Proceedings), EDP sciences, vol. 121, 87–103, https://doi.org/10.1051/jp4:2004121004, 2004. a
Morris, C. E., Sands, D. C., Glaux, C., Samsatly, J., Asaad, S., Moukahel, A. R., Gonçalves, F. L. T., and Bigg, E. K.: Urediospores of rust fungi are ice nucleation active at > −10 °C and harbor ice nucleation active bacteria, Atmos. Chem. Phys., 13, 4223–4233, https://doi.org/10.5194/acp-13-4223-2013, 2013. a
Murray, B. J., O'Sullivan, D., Atkinson, J. D., and Webb, M. E.: Ice nucleation by particles immersed in supercooled cloud droplets, Chem. Soc. Rev., 41, 6519–6554, https://doi.org/10.1039/C2CS35200A, 2012. a, b
Murray, B. J., Carslaw, K. S., and Field, P. R.: Opinion: Cloud-phase climate feedback and the importance of ice-nucleating particles, Atmos. Chem. Phys., 21, 665–679, https://doi.org/10.5194/acp-21-665-2021, 2021. a
Niu, M., Hu, W., Huang, S., Chen, J., Zhong, S., Huang, Z., Duan, P., Pei, X., Duan, J., Bi, K., Chen, S., Jin, R., Sheng, M., Yang, N., Wu, L., Deng, J., Zhu, J., Shen, F., Wu, Z., Zhang, D., and Fu, P.: Deciphering the Significant Role of Biological Ice Nucleators in Precipitation at the Organic Molecular Level, J. Geophys. Res.-Atmos., 129, https://doi.org/10.1029/2024JD041278, 2024. a, b
Oksanen, J., Blanchet, F. G., Friendly, M., Kindt, R., Legendre, P., McGlinn, D., Minchin, P. R., O'Hara, R. B., Simpson, G. L., Solymos, P., Stevens, M. H. H., Szoecs, E., and Wagner, H.: Package “vegan”, r Package version 2.0-8, https://cran.r-project.org/web/packages/vegan/vegan.pdf (last access: 18 September 2025), 2018. a
O’Connor, D. J., Healy, D. A., and Sodeau, J. R.: A 1-month online monitoring campaign of ambient fungal spore concentrations in the harbour region of Cork, Ireland, Aerobiologia, 31, 295–314, https://doi.org/10.1007/s10453-015-9365-7, 2015. a
O’Sullivan, D., Adams, M. P., Tarn, M. D., Harrison, A. D., Vergara-Temprado, J., Porter, G. C. E., Holden, M. A., Sanchez-Marroquin, A., Carotenuto, F., Whale, T. F., McQuaid, J. B., Walshaw, R., Hedges, D. H. P., Burke, I. T., Cui, Z., and Murray, B. J.: Contributions of biogenic material to the atmospheric ice-nucleating particle population in North Western Europe, Sci. Rep., 8, 13821, https://doi.org/10.1038/s41598-018-31981-7, 2018. a
Pan, Y.-L., Kalume, A., Wang, C., and Santarpia, J.: Atmospheric aging processes of bioaerosols under laboratory-controlled conditions: A review, J. Aerosol Sci., 155, 105767, https://doi.org/10.1016/j.jaerosci.2021.105767, 2021. a
Paramonov, M., Drossaart van Dusseldorp, S., Gute, E., Abbatt, J. P. D., Heikkilä, P., Keskinen, J., Chen, X., Luoma, K., Heikkinen, L., Hao, L., Petäjä, T., and Kanji, Z. A.: Condensation/immersion mode ice-nucleating particles in a boreal environment, Atmos. Chem. Phys., 20, 6687–6706, https://doi.org/10.5194/acp-20-6687-2020, 2020. a, b
Pashley, C. H., Fairs, A., Free, R. C., and Wardlaw, A. J.: DNA analysis of outdoor air reveals a high degree of fungal diversity, temporal variability, and genera not seen by spore morphology, Fungal Biol.-UK, 116, 214–224, https://doi.org/10.1016/j.funbio.2011.11.004, 2012. a
Pereira Freitas, G., Adachi, K., Conen, F., Heslin-Rees, D., Krejci, R., Tobo, Y., Yttri, K. E., and Zieger, P.: Regionally sourced bioaerosols drive high-temperature ice nucleating particles in the Arctic, Nat. Commun., 14, 5997, https://doi.org/10.1038/s41467-023-41696-7, 2023. a, b, c, d, e, f
Perring, A., Schwarz, J., Baumgardner, D., Hernandez, M., Spracklen, D., Heald, C., Gao, R., Kok, G., McMeeking, G., McQuaid, J., et al.: Airborne observations of regional variation in fluorescent aerosol across the United States, J. Geophys. Res.-Atmos., 120, 1153–1170, https://doi.org/10.1002/2014JD022495, 2015. a, b
Petersson Sjögren, M., Alsved, M., Šantl-Temkiv, T., Bjerring Kristensen, T., and Löndahl, J.: Measurement report: Atmospheric fluorescent bioaerosol concentrations measured during 18 months in a coniferous forest in the south of Sweden, Atmos. Chem. Phys., 23, 4977–4992, https://doi.org/10.5194/acp-23-4977-2023, 2023. a, b, c
Pouleur, S., Richard, C., Martin, J.-G., and Antoun, H.: Ice Nucleation Activity in Fusarium acuminatum and Fusarium avenaceum, Appl. Environ. Microbiol., 58, 2960–2964, https://doi.org/10.1128/aem.58.9.2960-2964.1992, 1992. a, b, c
Prenni, A., Tobo, Y., Garcia, E., DeMott, P., Huffman, J., McCluskey, C., Kreidenweis, S., Prenni, J., Pöhlker, C., and Pöschl, U.: The impact of rain on ice nuclei populations at a forested site in Colorado, Geophys. Res. Lett., 40, 227–231, https://doi.org/10.1029/2012GL053953, 2013. a, b
Pringle, A., Patek, S. N., Fischer, M., Stolze, J., and Money, N. P.: The Captured Launch of a Ballistospore, Mycologia, 97, 866–871, http://www.jstor.org/stable/3762235 (last access: 18 September 2025), 2005. a, b
Proske, U., Adams, M. P., Porter, G. C. E., Holden, M. A., Bäck, J., and Murray, B. J.: Measurement report: The ice-nucleating activity of lichen sampled in a northern European boreal forest, Atmos. Chem. Phys., 25, 979–995, https://doi.org/10.5194/acp-25-979-2025, 2025. a
Pruppacher, H. R. and Klett, J. D.: Microphysics of clouds and precipitation, Springer Dordrecht, 2, https://doi.org/10.1007/978-0-306-48100-0, 2010. a
Pummer, B. G., Bauer, H., Bernardi, J., Bleicher, S., and Grothe, H.: Suspendable macromolecules are responsible for ice nucleation activity of birch and conifer pollen, Atmos. Chem. Phys., 12, 2541–2550, https://doi.org/10.5194/acp-12-2541-2012, 2012. a
Pummer, B. G., Atanasova, L., Bauer, H., Bernardi, J., Druzhinina, I. S., Fröhlich-Nowoisky, J., and Grothe, H.: Spores of many common airborne fungi reveal no ice nucleation activity in oil immersion freezing experiments, Biogeosciences, 10, 8083–8091, https://doi.org/10.5194/bg-10-8083-2013, 2013. a, b, c, d, e, f, g, h, i, j, k, l, m, n, o
Pummer, B. G., Budke, C., Augustin-Bauditz, S., Niedermeier, D., Felgitsch, L., Kampf, C. J., Huber, R. G., Liedl, K. R., Loerting, T., Moschen, T., Schauperl, M., Tollinger, M., Morris, C. E., Wex, H., Grothe, H., Pöschl, U., Koop, T., and Fröhlich-Nowoisky, J.: Ice nucleation by water-soluble macromolecules, Atmos. Chem. Phys., 15, 4077–4091, https://doi.org/10.5194/acp-15-4077-2015, 2015. a
Qu, Z.-L., Santalahti, M., Köster, K., Berninger, F., Pumpanen, J., Heinonsalo, J., and Sun, H.: Soil Fungal Community Structure in Boreal Pine Forests: From Southern to Subarctic Areas of Finland, Front. Microbiol., 12, https://doi.org/10.3389/fmicb.2021.653896, 2021. a, b
Quinn, P. K., Shaw, G., Andrews, E., Dutton, E. G., Ruoho-Airola, T., and Gong, S. L.: Arctic haze: current trends and knowledge gaps, Tellus B, 59, 99–114, https://doi.org/10.1111/j.1600-0889.2006.00236.x, 2007. a
Raimondi, V., Agati, G., Cecchi, G., Gomoiu, I., Lognoli, D., and Palombi, L.: In vivo real-time recording of UV-induced changes in the autofluorescence of a melanin-containing fungus using a micro-spectrofluorimeter and a low-cost webcam, Opt. Express, 17, 22735–22746, https://doi.org/10.1364/OE.17.022735, 2009. a
Rantanen, M., Karpechko, A. Y., Lipponen, A., Nordling, K., Hyvärinen, O., Ruosteenoja, K., Vihma, T., and Laaksonen, A.: The Arctic has warmed nearly four times faster than the globe since 1979, Commun. Earth Environ., 3, 168, https://doi.org/10.1038/s43247-022-00498-3, 2022. a
Rathnayake, C. M., Metwali, N., Jayarathne, T., Kettler, J., Huang, Y., Thorne, P. S., O'Shaughnessy, P. T., and Stone, E. A.: Influence of rain on the abundance of bioaerosols in fine and coarse particles, Atmos. Chem. Phys., 17, 2459–2475, https://doi.org/10.5194/acp-17-2459-2017, 2017. a
Rognes, T., Flouri, T., Nichols, B., Quince, C., and Mahé, F.: VSEARCH: a versatile open source tool for metagenomics, PeerJ, 4, e2584, https://doi.org/10.7717/peerj.2584, 2016. a
Rolph, G., Stein, A., and Stunder, B.: Real-time Environmental Applications and Display sYstem: READY, Environ. Modell. Softw., 95, 210–228, https://doi.org/10.1016/j.envsoft.2017.06.025, 2017. a
Rungjindamai, N. and Jones, E. B. G.: Why Are There So Few Basidiomycota and Basal Fungi as Endophytes? A Review, Journal of Fungi, 10, https://doi.org/10.3390/jof10010067, 2024. a
Sanchez-Marroquin, A., West, J. S., Burke, I. T., McQuaid, J. B., and Murray, B. J.: Mineral and biological ice-nucleating particles above the South East of the British Isles, Environ. Sci. Atmos., 1, 176–191, https://doi.org/10.1039/D1EA00003A, 2021. a
Šantl Temkiv, T., Sahyoun, M., Finster, K., Hartmann, S., Augustin-Bauditz, S., Stratmann, F., Wex, H., Clauss, T., Nielsen, N. W., Sørensen, J. H., Korsholm, U. S., Wick, L. Y., and Karlson, U. G.: Characterization of airborne ice-nucleation-active bacteria and bacterial fragments, Atmos. Environ., 109, 105–117, https://doi.org/10.1016/j.atmosenv.2015.02.060, 2015. a, b, c
Šantl Temkiv, T., Lange, R., Beddows, D., Rauter, U., Pilgaard, S., Dall’Osto, M., Gunde-Cimerman, N., Massling, A., and Wex, H.: Biogenic Sources of Ice Nucleating Particles at the High Arctic Site Villum Research Station, Environ. Sci. Technol., 53, 10580–10590, https://doi.org/10.1021/acs.est.9b00991, 2019. a, b
Sarangi, B., Baumgardner, D., Bolaños-Rosero, B., and Mayol-Bracero, O. L.: Measurement report: An exploratory study of fluorescence and cloud condensation nuclei activity of urban aerosols in San Juan, Puerto Rico, Atmos. Chem. Phys., 22, 9647–9661, https://doi.org/10.5194/acp-22-9647-2022, 2022. a, b
Savage, N. J., Krentz, C. E., Könemann, T., Han, T. T., Mainelis, G., Pöhlker, C., and Huffman, J. A.: Systematic characterization and fluorescence threshold strategies for the wideband integrated bioaerosol sensor (WIBS) using size-resolved biological and interfering particles, Atmos. Meas. Tech., 10, 4279–4302, https://doi.org/10.5194/amt-10-4279-2017, 2017. a, b
Ščevková, J., Tropeková, M., Dušička, J., Štefániková, N., Žilka, M., Zahradníková, E., Kováč, J., and Mišíková, K.: Moss spores: overlooked airborne bioparticles in an urban environment, Environ. Sci. Pollut. R., 31, 58010–58020, https://doi.org/10.1007/s11356-024-35028-5, 2024. a, b
Schleh, C., Erpenbeck, V. J., Winkler, C., Lauenstein, H. D., Nassimi, M., Braun, A., Krug, N., and Hohlfeld, J. M.: Allergen particle binding by human primary bronchial epithelial cells is modulated by surfactant protein D, Resp. Res., 11, 83, https://doi.org/10.1186/1465-9921-11-83, 2010. a
Schneider, J., Höhler, K., Heikkilä, P., Keskinen, J., Bertozzi, B., Bogert, P., Schorr, T., Umo, N. S., Vogel, F., Brasseur, Z., Wu, Y., Hakala, S., Duplissy, J., Moisseev, D., Kulmala, M., Adams, M. P., Murray, B. J., Korhonen, K., Hao, L., Thomson, E. S., Castarède, D., Leisner, T., Petäjä, T., and Möhler, O.: The seasonal cycle of ice-nucleating particles linked to the abundance of biogenic aerosol in boreal forests, Atmos. Chem. Phys., 21, 3899–3918, https://doi.org/10.5194/acp-21-3899-2021, 2021. a, b, c, d, e, f, g
Schnell, R. C. and Vali, G.: Biogenic Ice Nuclei: Part I. Terrestrial and Marine Sources, J. Atmos. Sci., 33, 1554–1564, https://doi.org/10.1175/1520-0469(1976)033<1554:BINPIT>2.0.CO;2, 1976. a
Schumacher, C. J., Pöhlker, C., Aalto, P., Hiltunen, V., Petäjä, T., Kulmala, M., Pöschl, U., and Huffman, J. A.: Seasonal cycles of fluorescent biological aerosol particles in boreal and semi-arid forests of Finland and Colorado, Atmos. Chem. Phys., 13, 11987–12001, https://doi.org/10.5194/acp-13-11987-2013, 2013. a, b, c
Schwidetzky, R., de Almeida Ribeiro, I., Bothen, N., Backes, A. T., DeVries, A. L., Bonn, M., Fröhlich-Nowoisky, J., Molinero, V., and Meister, K.: Functional aggregation of cell-free proteins enables fungal ice nucleation, P. Natl. Acad. Sci. USA, 120, e2303243120, https://doi.org/10.1073/pnas.2303243120, 2023. a
Screen, J. A. and Simmonds, I.: The central role of diminishing sea ice in recent Arctic temperature amplification, Nature, 464, 1334–1337, https://doi.org/10.1038/nature09051, 2010. a
Sellegri, K., Laj, P., Dupuy, R., Legrand, M., Preunkert, S., and Putaud, J.-P.: Size-dependent scavenging efficiencies of multicomponent atmospheric aerosols in clouds, J. Geophys. Res.-Atmos., 108, https://doi.org/10.1029/2002JD002749, 2003. a
Serreze, M. C. and Barry, R. G.: Processes and impacts of Arctic amplification: A research synthesis, Global Planet. Change, 77, 85–96, https://doi.org/10.1016/j.gloplacha.2011.03.004, 2011. a
Si, M., Irish, V. E., Mason, R. H., Vergara-Temprado, J., Hanna, S. J., Ladino, L. A., Yakobi-Hancock, J. D., Schiller, C. L., Wentzell, J. J. B., Abbatt, J. P. D., Carslaw, K. S., Murray, B. J., and Bertram, A. K.: Ice-nucleating ability of aerosol particles and possible sources at three coastal marine sites, Atmos. Chem. Phys., 18, 15669–15685, https://doi.org/10.5194/acp-18-15669-2018, 2018. a
Stein, A. F., Draxler, R. R., Rolph, G. D., Stunder, B. J. B., Cohen, M. D., and Ngan, F.: NOAA’s HYSPLIT Atmospheric Transport and Dispersion Modeling System, B. Am. Meteorol. Soc., 96, 2059–2077, https://doi.org/10.1175/BAMS-D-14-00110.1, 2015. a
Stephanie and Waturangi, D. E.: Distribution of Ice Nucleation-Active (INA) Bacteria from Rain-water and Air, HAYATI J. Biosci., 18, 108–112, https://doi.org/10.4308/hjb.18.3.108, 2011. a
Sterkenburg, E., Bahr, A., Durling, M. B., Clemmensen, K. E., and Lindahl, B. D.: Changes in fungal communities along a boreal forest soil fertility gradient, New Phytol., 207, 1145–58, https://doi.org/10.1111/nph.13426, 2015. a
Stone, E. A., Mampage, C. B., Hughes, D. D., and Jones, L. M.: Airborne sub-pollen particles from rupturing giant ragweed pollen, Aerobiologia, 1–8, https://doi.org/10.1007/s10453-021-09702-x, 2021. a, b
Stopelli, E., Conen, F., Guilbaud, C., Zopfi, J., Alewell, C., and Morris, C. E.: Ice nucleators, bacterial cells and Pseudomonas syringae in precipitation at Jungfraujoch, Biogeosciences, 14, 1189–1196, https://doi.org/10.5194/bg-14-1189-2017, 2017. a
Suphioglu, C., Singh, M. B., Taylor, P., Bellomo, R., Holmes, P., Puy, R., and Knox, R. B.: Mechanism of grass-pollen-induced asthma, Lancet (London, England), 339, 569–72, https://doi.org/10.1016/0140-6736(92)90864-y, 1992. a
Taketani, F., Tobo, Y., Miyakawa, T., Takigawa, M., Zhu, C., and Kanaya, Y.: Impact of Siberian Wildfires on Ice-Nucleating Particle Concentrations over the Northwestern Pacific, Environ. Sci. Technol., https://doi.org/10.1021/acs.est.4c04889, 2025. a, b
Tan, I., Barahona, D., and Coopman, Q.: Potential Link Between Ice Nucleation and Climate Model Spread in Arctic Amplification, Geophys. Res. Lett., 49, https://doi.org/10.1029/2021GL097373, 2022. a
Tang, K., Sánchez-Parra, B., Yordanova, P., Wehking, J., Backes, A. T., Pickersgill, D. A., Maier, S., Sciare, J., Pöschl, U., Weber, B., and Fröhlich-Nowoisky, J.: Bioaerosols and atmospheric ice nuclei in a Mediterranean dryland: community changes related to rainfall, Biogeosciences, 19, 71–91, https://doi.org/10.5194/bg-19-71-2022, 2022. a
Tarn, M. D., Shaw, K. J., Foster, P. B., West, J. S., Johnston, I. D., McCluskey, D. K., Peyman, S. A., and Murray, B. J.: Microfluidics for the biological analysis of atmospheric ice-nucleating particles: Perspectives and challenges, Biomicrofluidics, 19, 011502, https://doi.org/10.1063/5.0236911, 2025. a
Tedersoo, L., Bahram, M., Põlme, S., Kõljalg, U., Yorou, N. S., Wijesundera, R., Ruiz, L. V., Vasco-Palacios, A. M., Thu, P. Q., Suija, A., Smith, M. E., Sharp, C., Saluveer, E., Saitta, A., Rosas, M., Riit, T., Ratkowsky, D., Pritsch, K., Põldmaa, K., Piepenbring, M., Phosri, C., Peterson, M., Parts, K., Pärtel, K., Otsing, E., Nouhra, E., Njouonkou, A. L., Nilsson, R. H., Morgado, L. N., Mayor, J., May, T. W., Majuakim, L., Lodge, D. J., Lee, S. S., Larsson, K.-H., Kohout, P., Hosaka, K., Hiiesalu, I., Henkel, T. W., Harend, H., dong Guo, L., Greslebin, A., Grelet, G., Geml, J., Gates, G., Dunstan, W., Dunk, C., Drenkhan, R., Dearnaley, J., Kesel, A. D., Dang, T., Chen, X., Buegger, F., Brearley, F. Q., Bonito, G., Anslan, S., Abell, S., and Abarenkov, K.: Global diversity and geography of soil fungi, Science, 346, 1256688, https://doi.org/10.1126/science.1256688, 2014. a
Tedersoo, L., Bahram, M., Zinger, L., Nilsson, R. H., Kennedy, P. G., Yang, T., Anslan, S., and Mikryukov, V.: Best practices in metabarcoding of fungi: From experimental design to results, Mol. Ecol., 31, 2769–2795, https://doi.org/10.1111/mec.16460, 2022. a
Tobo, Y., Adachi, K., DeMott, P. J., Hill, T. C. J., Hamilton, D. S., Mahowald, N. M., Nagatsuka, N., Ohata, S., Uetake, J., Kondo, Y., and Koike, M.: Glacially sourced dust as a potentially significant source of ice nucleating particles, Nat. Geosci., 12, 253–258, https://doi.org/10.1038/s41561-019-0314-x, 2019. a
Tobo, Y., Prenni, A. J., DeMott, P. J., Huffman, J. A., McCluskey, C. S., Tian, G., Pöhlker, C., Pöschl, U., and Kreidenweis, S. M.: Biological aerosol particles as a key determinant of ice nuclei populations in a forest ecosystem, J. Geophys. Res.-Atmos., 118, 10100–10110, https://doi.org/10.1002/jgrd.50801, 2013. a, b
Tobo, Y., Adachi, K., Kawai, K., Matsui, H., Ohata, S., Oshima, N., Kondo, Y., Hermansen, O., Uchida, M., Inoue, J., and Koike, M.: Surface warming in Svalbard may have led to increases in highly active ice-nucleating particles, Commun. Earth Environ., 5, 516, https://doi.org/10.1038/s43247-024-01677-0, 2024. a, b
Tsumuki, H., Yanai, H., and Aoki, T.: Identification of ice-nucleating active fungus isolated from the gut of the rice stem borer, Chilo suppressalis Walker (Lepidoptera: Pyralidae) and a search for ice-nucleating active Fusarium species, Japanese Journal of Phytopathology, 61, 334–339, 1995. a, b
Twohy, C. H., McMeeking, G. R., DeMott, P. J., McCluskey, C. S., Hill, T. C. J., Burrows, S. M., Kulkarni, G. R., Tanarhte, M., Kafle, D. N., and Toohey, D. W.: Abundance of fluorescent biological aerosol particles at temperatures conducive to the formation of mixed-phase and cirrus clouds, Atmos. Chem. Phys., 16, 8205–8225, https://doi.org/10.5194/acp-16-8205-2016, 2016. a, b
Vali, G.: Quantitative Evaluation of Experimental Results an the Heterogeneous Freezing Nucleation of Supercooled Liquids, J. Atmos. Sci., 28, 402–409, https://doi.org/10.1175/1520-0469(1971)028<0402:qeoera>2.0.co;2, 1971. a
Vogel, F., Adams, M. P., Lacher, L., Foster, P. B., Porter, G. C. E., Bertozzi, B., Höhler, K., Schneider, J., Schorr, T., Umo, N. S., Nadolny, J., Brasseur, Z., Heikkilä, P., Thomson, E. S., Büttner, N., Daily, M. I., Fösig, R., Harrison, A. D., Keskinen, J., Proske, U., Duplissy, J., Kulmala, M., Petäjä, T., Möhler, O., and Murray, B. J.: Ice-nucleating particles active below −24 °C in a Finnish boreal forest and their relationship to bioaerosols, Atmos. Chem. Phys., 24, 11737–11757, https://doi.org/10.5194/acp-24-11737-2024, 2024. a, b
Vu, D., Groenewald, M., de Vries, M., Gehrmann, T., Stielow, B., Eberhardt, U., Al-Hatmi, A., Groenewald, J., Cardinali, G., Houbraken, J., Boekhout, T., Crous, P., Robert, V., and Verkley, G.: Large-scale generation and analysis of filamentous fungal DNA barcodes boosts coverage for kingdom fungi and reveals thresholds for fungal species and higher taxon delimitation, Stud. Mycol., 92, 135–154, https://doi.org/10.1016/j.simyco.2018.05.001, 2019. a
Welti, A., Müller, K., Fleming, Z. L., and Stratmann, F.: Concentration and variability of ice nuclei in the subtropical maritime boundary layer, Atmos. Chem. Phys., 18, 5307–5320, https://doi.org/10.5194/acp-18-5307-2018, 2018. a
Wex, H., Huang, L., Zhang, W., Hung, H., Traversi, R., Becagli, S., Sheesley, R. J., Moffett, C. E., Barrett, T. E., Bossi, R., Skov, H., Hünerbein, A., Lubitz, J., Löffler, M., Linke, O., Hartmann, M., Herenz, P., and Stratmann, F.: Annual variability of ice-nucleating particle concentrations at different Arctic locations, Atmos. Chem. Phys., 19, 5293–5311, https://doi.org/10.5194/acp-19-5293-2019, 2019. a
Wieber, C., Jensen, L. Z., Vergeynst, L., Meire, L., Juul-Pedersen, T., Finster, K., and Šantl-Temkiv, T.: Terrestrial runoff is an important source of biological ice-nucleating particles in Arctic marine systems, Atmos. Chem. Phys., 25, 3327–3346, https://doi.org/10.5194/acp-25-3327-2025, 2025. a
Wieland, F., Bothen, N., Schwidetzky, R., Seifried, T. M., Bieber, P., Pöschl, U., Meister, K., Bonn, M., Fröhlich-Nowoisky, J., and Grothe, H.: Aggregation of ice-nucleating macromolecules from Betula pendula pollen determines ice nucleation efficiency, Biogeosciences, 22, 103–115, https://doi.org/10.5194/bg-22-103-2025, 2025. a, b
Wright, T. P., Hader, J. D. and. McMeeking, G. R., and Petters, M. D.: High Relative Humidity as a Trigger for Widespread Release of Ice Nuclei, Aerosol Sci. Tech., 48, https://doi.org/10.1080/02786826.2014.968244, 2014. a, b
Wu, R., Song, Y., Head, J. R., Katz, D. S. W., Peay, K. G., Shedden, K., and Zhu, K.: Fungal spore seasons advanced across the US over two decades of climate change, GeoHealth, 9, e2024GH001323, https://doi.org/10.1029/2024GH001323, 2025. a
Xie, S., Liu, X., Zhao, C., and Zhang, Y.: Impact of ice nucleation parameterizations on CAM5 simulated arctic clouds and radiation: A sensitivity study, AIP Conf. Proc., 1527, 747–750, https://doi.org/10.1063/1.4803378, 2013. a
Xie, W., Li, Y., Bai, W., Hou, J., Ma, T., Zeng, X., Zhang, L., and An, T.: The source and transport of bioaerosols in the air: A review, Front. Environ. Sci. Eng., 15, https://doi.org/10.1007/s11783-020-1336-8, 2020. a
Yamamoto, N., Bibby, K., Qian, J., Hospodsky, D., Rismani-Yazdi, H., Nazaroff, W. W., and Peccia, J.: Particle-size distributions and seasonal diversity of allergenic and pathogenic fungi in outdoor air, ISME J., 6, 1801–1811, https://doi.org/10.1038/ismej.2012.30, 2012. a
Yue, S., Ren, H., Fan, S., Sun, Y., Wang, Z., and Fu, P.: Springtime precipitation effects on the abundance of fluorescent biological aerosol particles and HULIS in Beijing, Sci. Rep., 6, 29618, https://doi.org/10.1038/srep29618, 2016. a
Yue, S., Ren, L., Song, T., Li, L., Xie, Q., Li, W., Kang, M., Zhao, W., Wei, L., Ren, H., Sun, Y., Wang, Z., Ellam, R. M., Liu, C.-Q., Kawamura, K., and Fu, P.: Abundance and Diurnal Trends of Fluorescent Bioaerosols in the Troposphere over Mt. Tai, China, in Spring, J. Geophys. Res.-Atmos., 124, 4158–4173, https://doi.org/10.1029/2018JD029486, 2019. a
Yue, S., Li, L., Xu, W., Zhao, J., Ren, H., Ji, D., Li, P., Zhang, Q., Wei, L., Xie, Q., Pan, X., Wang, Z., Sun, Y., and Fu, P.: Biological and Nonbiological Sources of Fluorescent Aerosol Particles in the Urban Atmosphere, Environ. Sci. Technol., 56, 7588–7597, https://doi.org/10.1021/acs.est.1c07966, 2022. a, b
Zelinka, M. D., Myers, T. A., McCoy, D. T., Po-Chedley, S., Caldwell, P. M., Ceppi, P., Klein, S. A., and Taylor, K. E.: Causes of Higher Climate Sensitivity in CMIP6 Models, Geophys. Res. Lett., 47, e2019GL085782, https://doi.org/10.1029/2019GL085782, 2020. a
Zoberi, M.: Effect of temperature and humidity on ballistospore discharge, Trans. Br. Mycol. Soc., 47, 109–114, https://doi.org/10.1016/S0007-1536(64)80085-1, 1964. a