the Creative Commons Attribution 4.0 License.
the Creative Commons Attribution 4.0 License.
 | 02 Oct 2025
Tracing ammonia emission sources in California's Salton Sea region: insights from airborne longwave-infrared hyperspectral imaging and ground monitoring
Sina Hasheminassab
David M. Tratt
Olga V. Kalashnikova
Clement S. Chang
Morad Alvarez
Kerry N. Buckland
Michael J. Garay
Francesca M. Hopkins
Eric R. Keim
Yaning Miao
Payam Pakbin
William C. Porter
Mohammad H. Sowlat
Ammonia (NH3) plays an important role in atmospheric chemistry and air quality, but its emissions remain poorly constrained due to its short atmospheric lifetime, high spatial heterogeneity, and limited coverage of existing monitoring resources. This study integrates airborne longwave-infrared (LWIR) hyperspectral imaging at ∼2 m spatial resolution with ground-based stationary and mobile in situ measurements to map and characterize NH3 emissions in two regions near the Salton Sea in southern California: Mecca in the northwest and Imperial in the southeast. Airborne surveys conducted in March and September 2023 with a wide-swath LWIR spectral imager revealed pronounced spatial and seasonal variability. Average NH3 levels in Imperial were 2.5–8 times higher than those in Mecca, linked primarily to large, concentrated animal feeding operations (CAFOs), geothermal power plants, fumaroles, and intensive agricultural activities. Ground-based mobile monitoring corroborated these findings, showing elevated NH3 levels near these sources and especially high NH3 concentrations downwind of CAFOs with large cattle populations. The results underscore the utility of airborne LWIR hyperspectral imaging in detecting and mapping NH3 at hyperlocal scales, including sources absent from existing inventories. They further highlight the need for routine airborne campaigns and the development of next-generation satellite missions with higher spatial resolution to achieve comprehensive, large-area monitoring. These findings inform air quality management strategies and emphasize the importance of improving emission inventories for effective mitigation of NH3-driven air pollution.
- Article
(8823 KB) - Full-text XML
-
Supplement
(3961 KB) - BibTeX
- EndNote


Ammonia (NH3) is a critical component of the atmospheric nitrogen cycle and an important precursor for the formation of fine particulate matter (PM2.5) (Tang et al., 2025; Wyer et al., 2022). It is primarily emitted from agricultural activities, particularly livestock waste and the application of fertilizers, but also from combustion sources such as vehicles and biomass burning (Beaudor et al., 2025; Vira et al., 2022; Zeng et al., 2018). As the primary form of reactive nitrogen in the environment, it plays an important role in nitrogen deposition, eutrophication, and acidification processes (Li et al., 2025; Zhang et al., 2012). Additionally, atmospheric NH3 reacts with acidic compounds like nitric and sulfuric acids to form ammonium salts, contributing significantly to secondary PM2.5, leading to various adverse health outcomes (Wyer et al., 2022).
Recent studies have reported increasing trends in atmospheric NH3 levels at global and regional scales, driven largely by agricultural activities, industrial processes, and changing climatic conditions (Kuttippurath et al., 2024; Ma et al., 2025; Van Damme et al., 2021; Wang et al., 2023; Yu et al., 2018). For example, Van Damme et al. (2021) reported a 12.8 % global increase between 2008 and 2021 based on the Infrared Atmospheric Sounding Interferometer (IASI) satellite measurements. During the same period, also using IASI data, Wang et al. (2023) observed a 6.8 % annual increase in NH3 concentrations across the contiguous US, with hotspots concentrated in agricultural regions. Also, during the 2020 COVID-19 lockdown, Kuttippurath et al. (2024) found that unlike most pollutants which declined, NH3 levels rose, largely due to sustained or increased agricultural activity. Consequently, regulatory bodies such as the European Parliament and air quality agencies in California are recognizing NH3 as an emerging pollutant of concern (Monforti-Ferrario et al., 2022; South Coast AQMD, 2024). Furthermore, the recent tightening of the US Environmental Protection Agency's (EPA) National Ambient Air Quality Standards (NAAQS) for annual average PM2.5 to 9 µg m−3 has drawn increasing attention to NH3, particularly in nonattainment areas, to better characterize its sources and contribution to secondary PM2.5 (EPA, 2025). However, unlike other key gas-phase precursors of PM2.5 such as NO2 and SO2, which are regulated as criteria pollutants in the US and are widely monitored, the scarce monitoring of NH3 and uncertainties in emissions inventory hinder accurate assessments of its contribution to secondary PM2.5 formation.
Despite its importance, measuring and characterizing NH3 emissions are challenging due in part to its short atmospheric lifetime, high spatial heterogeneity, reactivity, and solubility (Nair and Yu, 2020). Established ground-based monitoring networks, such as the Ammonia Monitoring Network (AMoN) in the US, provide high-quality data but are spatially sparse and temporally limited to biweekly measurements (Felix et al., 2017). Existing satellite instruments capable of detecting NH3 (e.g., CrIS, IASI, AIRS) offer broader spatial coverage but generally at coarse spatial resolutions (15–50 km) inadequate for the identification of local-scale emission sources (Dammers et al., 2019; Shephard et al., 2020; Warner et al., 2016). Due to these challenges, current chemical transport model emission inventories often fail to adequately represent major NH3 sources, leading to significant underestimation of their contributions (Burns et al., 2023).
The longwave-infrared (LWIR) hyperspectral imaging technique is highly effective at identifying diagnostic spectral features of various environmentally important gases, with a particularly strong sensitivity to NH3 (Kuai et al., 2019; Leifer et al., 2017). Airborne deployment of this technique enables wide-area, high-resolution mapping of NH3 emissions. Airborne instruments such as the Aerospace Corporation's Mako imager and JPL's Hyperspectral Thermal Emission Spectrometer (HyTES) have demonstrated the capability to detect and quantify NH3 with spatial resolutions ranging from 1–30 m, depending on flight altitude (Hall et al., 2011; Hulley et al., 2016; Kuai et al., 2019; Tratt et al., 2013). This high-resolution capability is particularly important in complex regions where multiple emission sources coexist.
The Salton Sea region in southern California represents an important NH3 hotspot with unique air quality challenges and opportunities for study. Intensive agricultural activities, including large-scale concentrated animal feeding operations (CAFOs) and extensive fertilizer application, as well as industrial and natural geothermal emissions, contribute to its high NH3 levels. The Imperial Valley, located in the southern part of the Salton Sea, has one of the highest densities of CAFOs in California and ranks among the top 10 NH3 hotspots in the US (Wang et al., 2023). Despite its significance, NH3 sources in this region have not been extensively monitored or thoroughly characterized.
This study aims to address these gaps by integrating airborne LWIR hyperspectral imaging with ground-based stationary and mobile in situ monitoring to map and characterize NH3 emissions in the Salton Sea region. Using this multi-platform approach, we identify major NH3 sources, including previously undocumented or underrepresented ones, and assess their spatial and temporal variability in these complex environments. The findings provide a foundation for improving NH3 inventories and underscore the necessity of routine airborne measurements and development of satellite missions with higher spatial resolution to resolve persistent data gaps in understanding NH3's contribution to atmospheric chemistry and air quality. This demonstration is timely, given the growing global demand for better NH3 monitoring at scale.
2.1 Overview
The study focused on the Salton Sea region in southern California, selected for its diverse and significant NH3 emission sources and unique environmental characteristics. Measurements included airborne remote sensing and ground-based in situ monitoring, both mobile and stationary. Figure 1 illustrates the study areas, the footprints of airborne remote sensing measurements, the routes covered by the mobile platform, and the location of the air monitoring site utilized in this research. The following sections detail each component of the study.
Figure 1Map of study areas around the Salton Sea. The northwestern area is denoted as “Mecca” and the southeastern area as “Imperial”, and they are referred to as such throughout the paper. Base imagery © Google Earth 2025.
2.2 Study areas
The study areas encompass the northwest and southeast regions of the Salton Sea, hereafter referred to as Mecca and Imperial, respectively (Fig. 1). Both areas are predominantly rural and surrounded by extensive agricultural lands. Mecca is known for cultivating high-value crops such as dates, citrus fruits, and vegetables, while Imperial is characterized by large-scale agricultural production, with a focus on crops including alfalfa, grains, and vegetables. Additionally, Imperial has a high concentration of CAFOs and several geothermal power plants (GPPs). Both regions face severe air pollution challenges, including agricultural emissions and windblown dust from surrounding desert regions as well as from the increasingly exposed dried lake bed surfaces (Bi et al., 2020; Frie et al., 2019; Johnston et al., 2019; Lieb et al., 2024). Previous studies have reported a high prevalence of health issues related to air pollution in this area, particularly impacting cardiovascular and respiratory systems (Farzan et al., 2019; Johnston et al., 2024; Jones and Fleck, 2020; Miao et al., 2025). Both regions are designated as nonattainment for 8 h ozone and 24 h PM10 standards, and Imperial is additionally nonattainment for annual PM2.5 (Current Nonattainment Counties for All Criteria Pollutants, 2025). Moreover, according to the California Office of Environmental Health Hazard Assessment (OEHHA), these regions rank among the communities with the highest pollution burdens and socioeconomic disadvantages in California and are therefore classified as environmental justice communities.
2.3 Airborne measurements
The airborne component of the study utilized the Aerospace Corporation's Mako imager, mounted on a Twin Otter aircraft. Mako is a three-axis stabilized whisk-broom imager spanning the LWIR spectral region (specifically 7.6–13.2 µm) in 128 contiguous channels capable of detecting and quantifying multiple gas species. The performance and operating specifications of Mako have been detailed elsewhere (Buckland et al., 2017; Hall et al., 2016). For this study, flights were conducted at an altitude of approximately 3750 m above ground level (a.g.l.), with a 7.5 km swath and a nominal ground sample distance (GSD) of 2.1 m. Flight measurements were conducted on 2 different days in 2023 during distinct seasons: 28 March and 25 September. Figure 2 presents the airborne data acquisition times for each day and region. On 28 March, measurements began over Mecca at approximately 10:37 PDT (Pacific Daylight Time) and continued until 11:08 PDT, followed by acquisitions in the Imperial region from 11:24 to 12:12 PDT. On the return to base, another measurement was conducted over the SE-to-NW flight line over Mecca (see Fig. 4) between 12:40 and 12:46 PDT. Drawing from the experience gained during the March campaign, the September flights aimed to further differentiate morning and afternoon measurements. Thus, on 25 September, flight measurements commenced earlier, starting over Mecca at 09:35 PDT and continuing until 10:10 PDT. Data acquisition in the Imperial region was then conducted from 10:27 to 11:12 PDT. A second round of measurements, over the same flight lines, was performed in the afternoon, with acquisitions over Mecca between 15:06 and 15:39 PDT and over Imperial from 15:53 to 16:37 PDT. The flight paths were identical on both days, with the exception of a northwestern extension of one flight line over Mecca and slightly shorter flight lines over Imperial on 25 September, as shown in Fig. 1. The extension over Mecca was intended to capture the source of a plume attributable to a waste recycling facility that had been partially detected during the March flights. More details about the emissions from this facility are provided in the Results section. The shortened flight lines in September were to avoid approaching restricted airspace that was encountered during the March flights.
Figure 2Timing of airborne measurements over the Mecca and Imperial study areas on 28 March and 25 September 2023. The time periods defined in the legend are used throughout the paper to distinguish measurement sessions.
During the September campaign, an additional series of airborne measurements in multi-scan (movie) mode was conducted over nine pre-determined sources, including GPPs, fumaroles, CAFOs, and a waste recycling facility. These measurements, collected at a nominal frame rate of 0.6 Hz during both morning and afternoon flight sessions, captured short-term temporal variations in NH3 emissions from these sources. The data will be used to estimate emission fluxes from these sources, which will be the subject of a separate publication from this study.
2.4 NH3 retrieval
Details of the NH3 retrieval methodology from Mako are described in Hall et al. (2025) and Tratt et al. (2025). Briefly, NH3 column densities were retrieved using a custom Scene-based Algorithm for Gas Estimation (SAGE), which employs a nonlinear radiative transfer model and auxiliary data to estimate gas concentrations along the atmospheric path, reported in units of ppm m (parts per million meter). To evaluate the confidence of each retrieval, SAGE calculates a t statistic that constitutes a measure of the retrieval signal-to-noise ratio. The algorithm also outputs fit residuals and the thermal contrast (ΔT), defined as the temperature difference between the near-surface air parcel and the underlying surface, for each pixel. In this study, pixels were thresholded using a t statistic of ≥3.0 and to eliminate high-uncertainty NH3 abundance estimates. It should be noted that in all NH3 column density maps in this paper, null pixels that did not meet the t statistic and ΔT thresholds are rendered transparent to expose the underlying imagery.
The retrievals in this study were also validated against ground-based in situ NH3 measurements by incorporating air temperature and planetary boundary layer height (PBLH) fields from NOAA's High-Resolution Rapid Refresh (HRRR) model and Gaussian plume modeling to characterize atmospheric conditions and plume dynamics. The minimum detectable concentration (MDC) of ground-level NH3 depends on thermal contrast and boundary layer height and ranged from 3–33 ppbv over Mecca in September under varying atmospheric conditions. Validation against ground-based in situ measurements showed good agreement, with differences ranging from 16 %–37 % under stable and well-mixed conditions. Detailed descriptions of the retrieval process, detection sensitivity, and validation results for the airborne component of this study are provided in Tratt et al. (2025).
2.5 Ground-based in situ stationary monitoring
Continuous 1 min NH3 monitoring was conducted using a Picarro G2301 analyzer at the South Coast Air Quality Management District (South Coast AQMD) Mecca air monitoring site (AMS) (Fig. 1). Routine quality assurance procedures, including monthly zero and span checks, were conducted by South Coast AQMD. Unfortunately, the instrument was non-operational for the entire month of March 2023, concurrent with the first day of airborne measurements. However, it was operational before and after March 2023, allowing the assessment of NH3 levels on the second airborne measurement day in September and evaluation of its temporal trends throughout 2023.
2.6 Ground-based in situ mobile monitoring
The mobile monitoring was conducted using a mobile platform developed and operated by the University of California, Riverside. This mobile platform was equipped with advanced instrumentation to continuously measure geolocated atmospheric NH3 levels along roadways. The primary sensor was a Picarro G2123 cavity ring-down spectrometer, measuring NH3 concentrations every ∼3 s with a precision of 500 ppt, sampling ambient air through a Teflon line at a rate of 1.7 dm3 min−1 from an inlet positioned 3 m a.g.l. GPS data, recorded every second by a roof-mounted Garmin GPS 16× receiver, provided precise geographical coordinates.
Mobile monitoring was conducted concurrently with the airborne measurements, with the routes shown in Fig. 1. On 28 March, during the first airborne campaign and in the absence of stationary monitoring at the Mecca AMS, the mobile platform focused on the Mecca region. On 25 September, during the second airborne campaign, mobile monitoring covered the Imperial region.
2.7 Meteorology
Meteorological data, including temperature, wind speed, and direction at 10 m a.g.l., and PBLH, corresponding to the study areas and flight measurement periods, were retrieved from NOAA's HRRR model output using the Herbie Python package (https://zenodo.org/records/13329302; last access: 4 January 2025). Figures S1 and S2 provide a summary of these meteorological parameters across the study regions during each flight measurement session.
Temperatures were generally comparable between Mecca and Imperial, ranging from approximately 20 °C in March to 31 °C during the September morning flights and rising further to 37 °C in September afternoon. During the March campaign, PBLH values ranged from 730–937 m across both regions. During the September morning flights, which began earlier in the day, PBLH values were lower, around 340 m in Mecca and 554 m in Imperial. However, by the afternoon, PBLH significantly increased to 1821 m in Mecca and 1592 m in Imperial.
The wind direction/speed varied largely across the study area and over time. During the March morning flights, both Mecca and Imperial experienced light winds ranging from 0–2 m s−1, with Mecca dominated by southerly winds and Imperial by northwesterly winds. By the afternoon, wind speeds in Mecca increased substantially, exceeding 4 m s−1. In September morning, winds were predominantly northwesterly in both regions, with Mecca exhibiting stronger winds averaging 1.6 m s−1 compared to 0.95 m s−1 in Imperial. By the afternoon, wind speeds increased in both areas; while Imperial's winds remained primarily northwesterly with an average speed of 1.5 m s−1, Mecca experienced a notable shift in wind direction to southeasterly, with an average speed of 3.1 m s−1.
2.8 Spatial data of potential NH3 emitters
The study area around the Salton Sea is home to several notable NH3 emission sources, including fumaroles, CAFOs, GPPs, and waste recycling facilities. To attribute the observed NH3 hotspots to these known emitters – and potentially identify any previously unknown or unreported sources – geospatial data on their locations and attributes were compiled from various sources. Data on GPPs, including their locations and generating capacities, were obtained from the California State Geoportal (https://gis.data.ca.gov, last access: 4 January 2025). Information on CAFOs, such as facility locations and cattle populations, was sourced from the California Air Resources Board's (CARB) California Dairy & Livestock Database (CADD) (https://ww2.arb.ca.gov/resources/documents/california-dairy-livestock-database-cadd, last access: 4 January 2025). Information about waste recycling facilities was obtained from EPA's Toxic Release Inventory (TRI) (https://www.epa.gov/toxics-release-inventory-tri-program/tri-toolbox, last access: 4 January 2025). Additionally, the locations of known fumaroles along the southern shore of the Salton Sea were gathered from previous studies conducted in the region (Adams et al., 2017; Tratt et al., 2011, 2016). Nearly all of the abovementioned sources were located in the Imperial study area, with the exception of a waste recycling facility located in the Mecca region.
Figure S3 shows the total cattle population at CAFO facilities within the Imperial study area in 2022. Among these, CAFO 1 stands out with the largest cattle population, approximately 150 000, far exceeding the numbers at other CAFOs in the study area. In fact, according to CADD, CAFO 1 has the largest cattle population of any CAFO in California (data not shown). Additionally, CAFOs 2 and 9 rank seventh and eighth statewide, respectively. Figure S4 shows the generating capacities of GPPs in the Imperial region, with GPPs 9, 3, 4, 5, and 11 having the highest capacities, ranging from 50–55 MW.
2.9 Data analysis
Data analyses, visualizations, and mapping were performed using R, QGIS, and SAS JMP. To investigate the source directionality of NH3 at the Mecca AMS, bivariate directional analyses were conducted using the openair package in R.
3.1 Airborne measurements
Figure 3 shows the average NH3 column density across both study areas during each airborne measurement session. As shown, average NH3 levels were significantly higher in Imperial compared to Mecca, with respective factors of approximately 8 and 2.5 during the March and September campaigns. Seasonally, Mecca NH3 levels were about 3.5 times higher in September than in March, while no significant seasonal variation was observed over Imperial. Additionally, during the September campaign, afternoon NH3 levels were 20 %–50 % higher than those measured in the morning across both study areas.
Figure 3Average NH3 column density (ppm m) for each study area and airborne measurement session. Error bars represent 1 standard deviation across measurements from different flight lines in each study area.
Figures 4 and 5 illustrate NH3 column density maps over Mecca and Imperial, respectively, from each airborne measurement session. Over Mecca in March, a distinct, strong plume was observed in the northwest part of the study area during the morning but dissipated by the afternoon. A closer examination of this plume in Fig. S5 suggests it likely originated from a waste recycling facility located upwind, which was not fully captured during the March flight acquisition. As previously noted, in September, the flight measurements were extended northwestward to encompass this facility. The results showed detectable but relatively weaker plumes during both the morning and afternoon measurements. According to EPA TRI, this facility emitted over 27 500 pounds (12 470 kg) of NH3 in 2023. Another notable observation over Mecca is the significant increase in NH3 column density during the September afternoon measurements compared to the morning. The majority of hotspots were diffuse emissions concentrated over agricultural fields. This increase is likely due to higher afternoon temperatures, which enhance NH3 volatilization from soil and plant surfaces, particularly in areas where fertilizers have been recently applied. Another possible explanation is the higher thermal contrast during the afternoon flights, which enhances the Mako sensor's detection sensitivity and enables the identification of NH3 signals even at relatively low concentrations. Additional information about retrieval sensitivity can be found in the Discussion section.
Figure 4Retrieved NH3 column density (ppm m) maps over the Mecca study area during each airborne measurement session. Null pixels that did not meet the t statistic and ΔT thresholds are rendered transparent. Map sources: Esri, HERE, Garmin, INCREMENT P, © OpenStreetMap contributors 2025, and the GIS User Community.
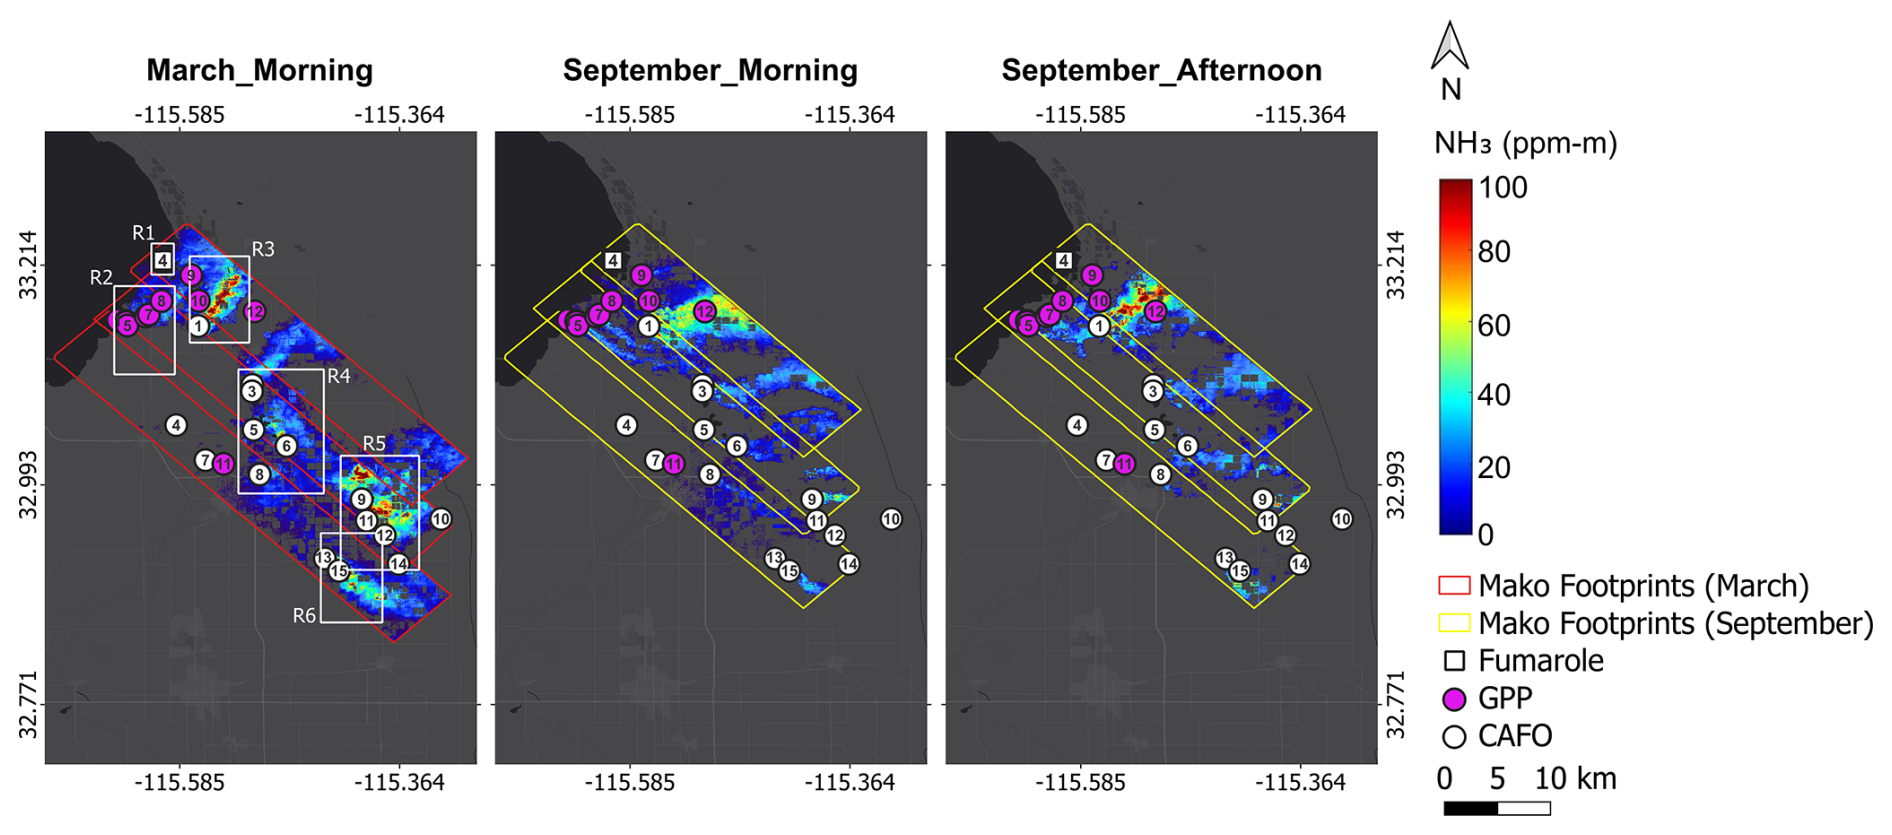
Figure 5Retrieved NH3 column density (ppm m) maps over the Imperial study area during each airborne measurement session. Null pixels that did not meet the t statistic and ΔT thresholds are rendered transparent. The markers in each panel denote known NH3 emission sources. Six hotspot regions, shown with white boxes, are defined for further investigation. Map sources: Esri, HERE, Garmin, INCREMENT P, © OpenStreetMap contributors 2025, and the GIS User Community.
Significantly higher NH3 levels were measured in the Imperial region. To properly illustrate the spatial gradient, the column density scale was adjusted from 0–20 ppm m (used for the Mecca area) to 0–100 ppm m. Multiple hotspots were detected in Imperial, and to identify the emitters, the locations of known point sources, including fumaroles, CAFO facilities, and GPPs, were overlaid on the maps (Fig. 5). A version of these maps without the markers is included in Fig. S6 to provide a clearer depiction of the detected plume patterns. Due to the complexity of this region, with several localized hotspots and sources in close proximity, six regions were identified for further investigation (Fig. 5). Moreover, Fig. 6 depicts the pixel-level NH3 column density distributions in each region and flight measurement session.
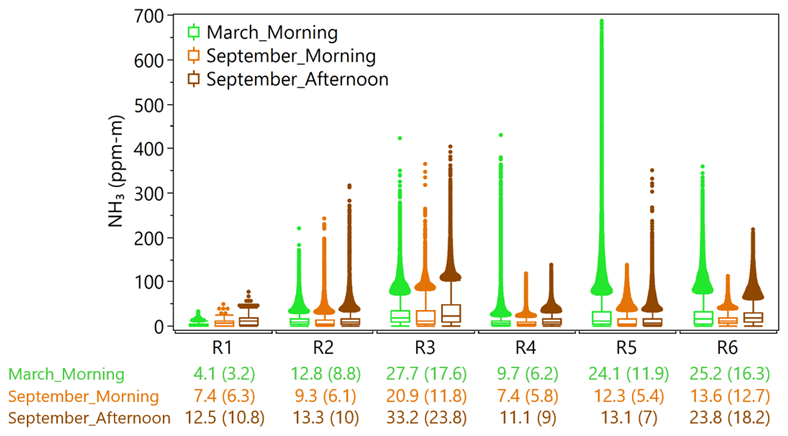
Figure 6Box plots of pixel-level retrieved NH3 column density (ppm m) for each predefined region and measurement session over the Imperial study area. Boxes represent the interquartile range (IQR), with the horizontal line inside each box indicating the median value. Whiskers extend to 1.5 times the IQR, and outliers are values exceeding 1.5 times the IQR. Arithmetic mean (median) values are reported below the plot.
Region 1 (Fig. 7a) encompasses a number of known fumaroles along the southeastern shoreline of the Salton Sea that appear to be associated with the Calipatria Fault (Lynch and Hudnut, 2008). Measurements over this area revealed fluctuating NH3 emissions from these natural geothermal vents, though the levels were not as substantial as other sources detected in the region. Across the three airborne acquisitions over this region, average NH3 column density ranged between 4.1 and 12.5 ppm m. Fumaroles, associated with geothermal activity, emit NH3 as superheated water and gases interact with nitrogen-bearing, organic-rich sediments. This process triggers chemical reactions and the thermal decomposition of organic matter, releasing NH3 and other gases into the atmosphere (Tratt et al., 2011). These emissions are inherently variable, influenced by factors such as the intensity of geothermal activity, sediment composition, and local geological conditions (Tratt et al., 2016). The detection and quantification of these emissions were made possible by the high spatial resolution (∼2 m) of LWIR imaging, which allowed for the identification of emissions at a fine scale that would otherwise be undetectable.
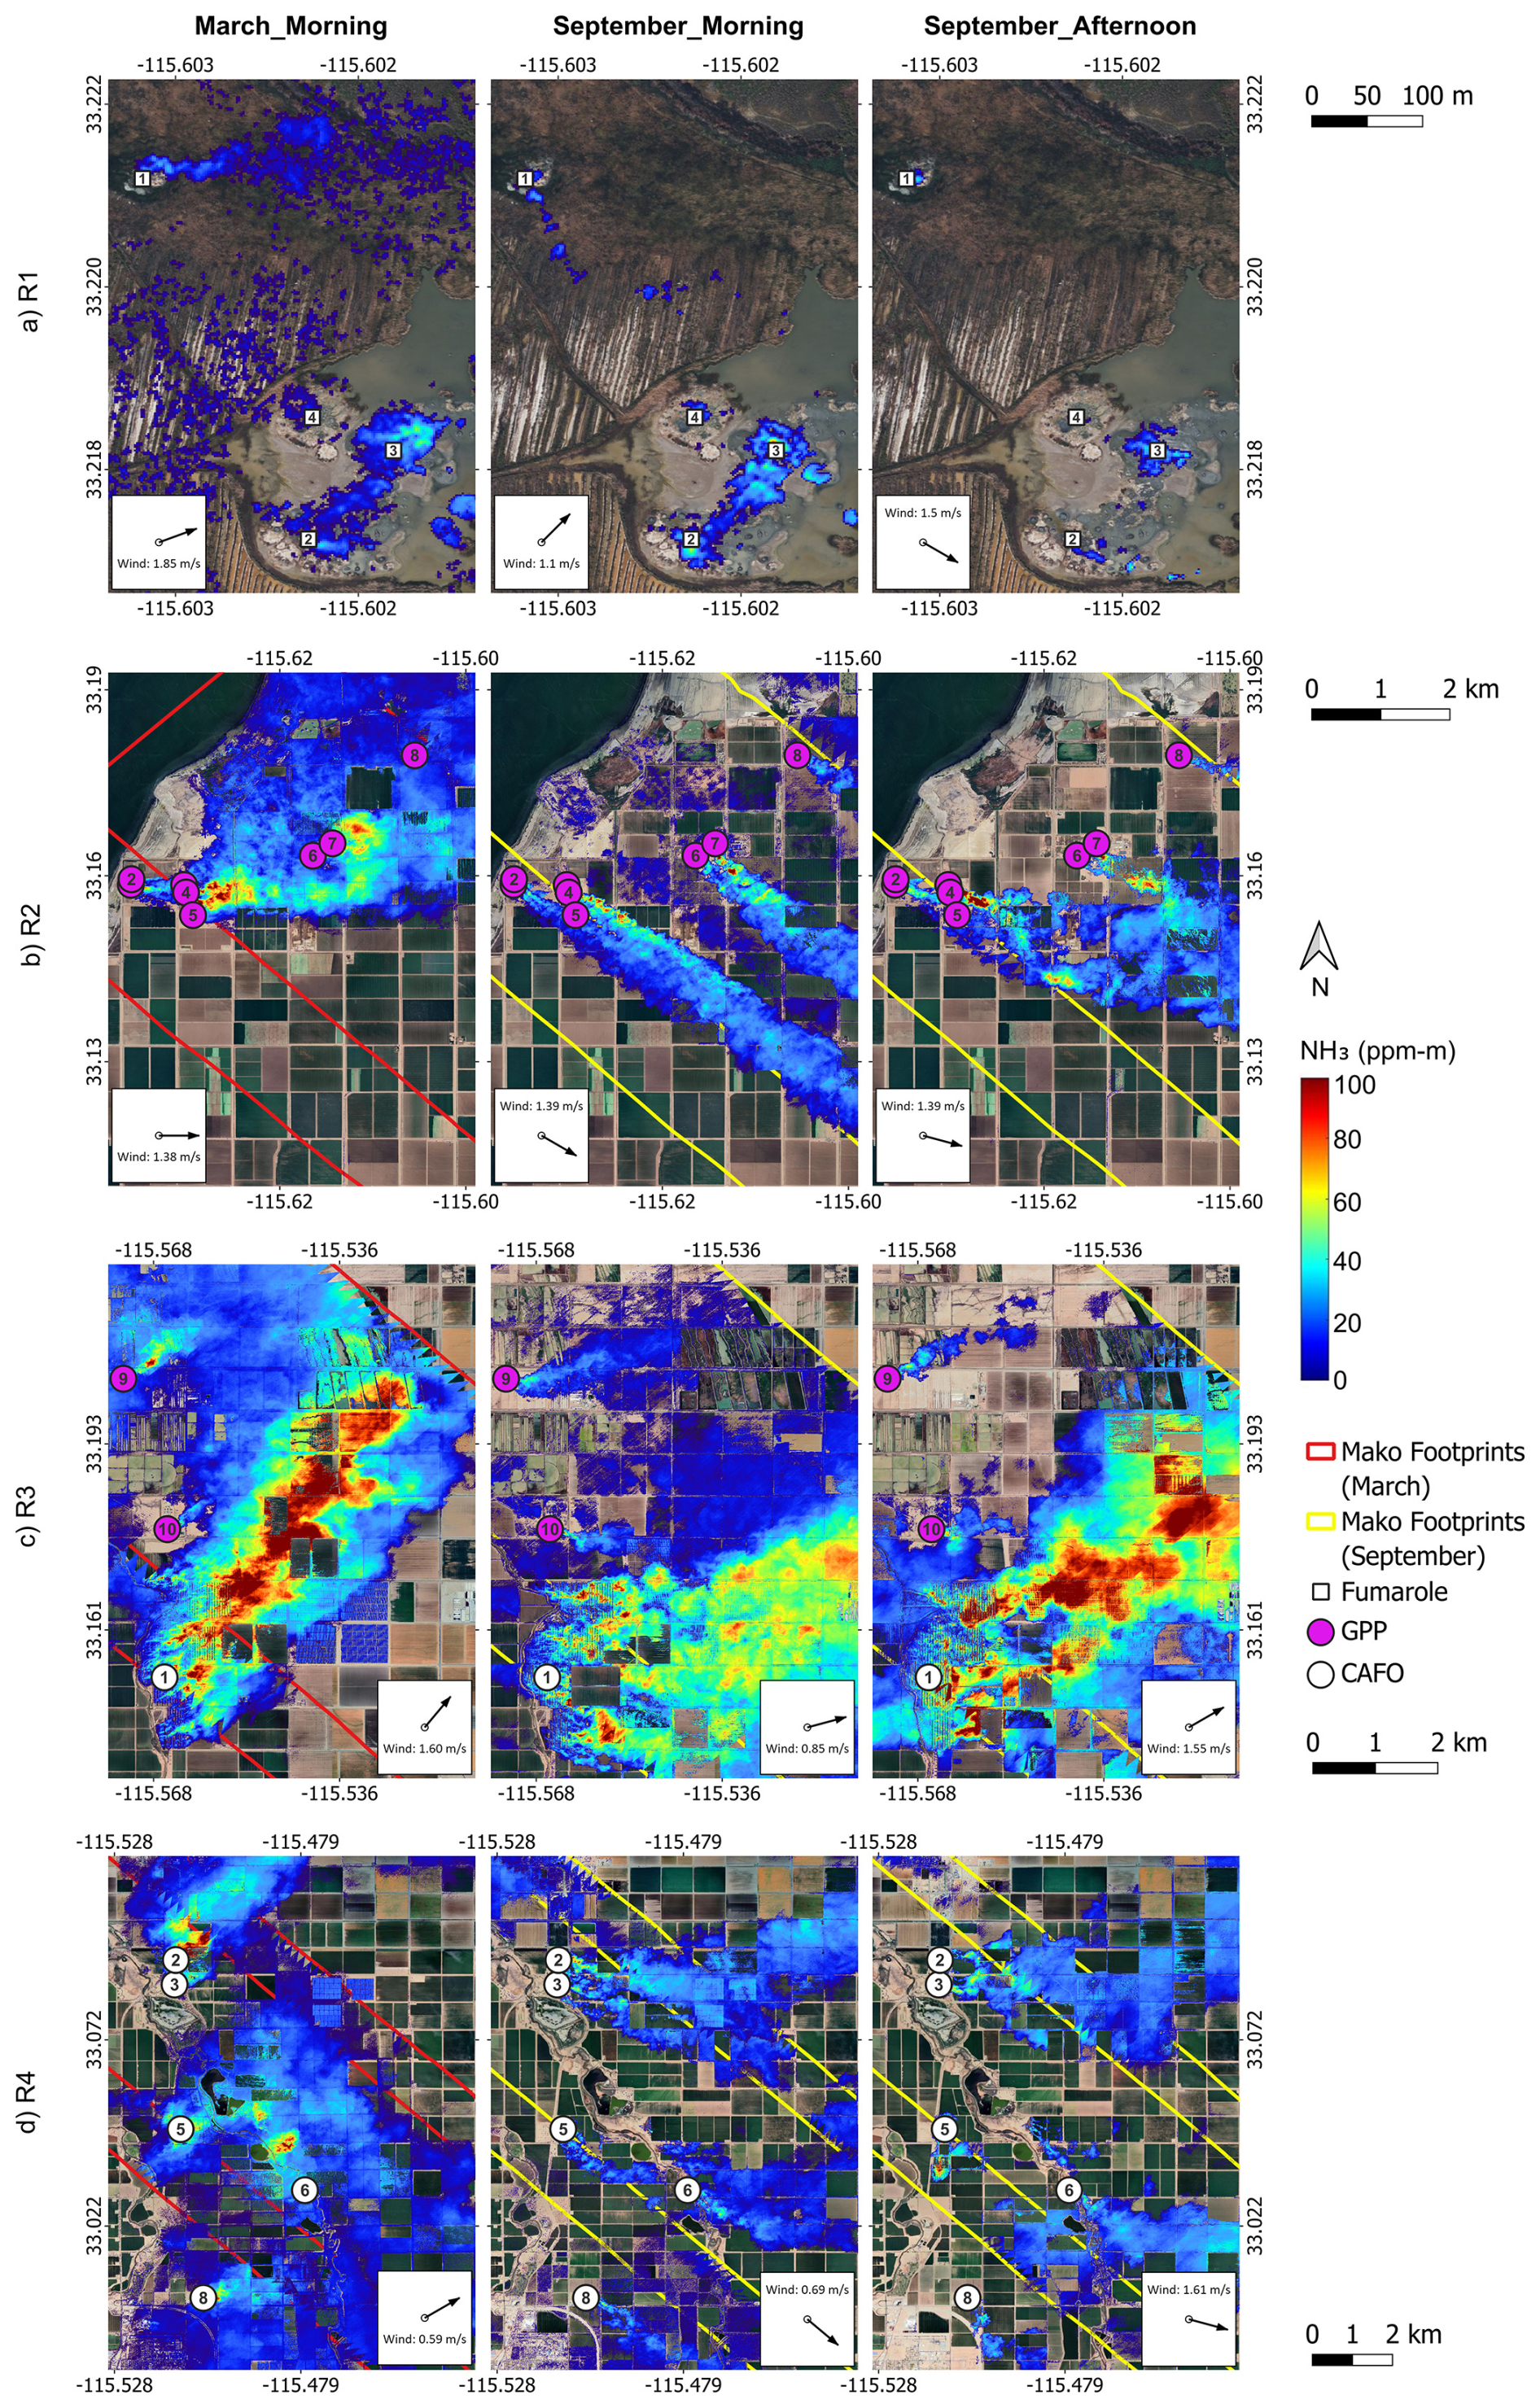
Figure 7(a–d) Retrieved NH3 column density (ppm m) maps over predefined Regions 1–4 in the Imperial study area during each airborne measurement session. Null pixels that did not meet the t statistic and ΔT thresholds are rendered transparent. The markers in each panel denote known NH3 emission sources. Wind directions were inferred from plume patterns, and average wind speeds were calculated from the nearest HRRR grid cells. Base imagery © Google Earth 2025.
Region 2 (Fig. 7b) comprises eight known GPPs, with generating capacities ranging from 10–54 MW. Airborne measurements detected NH3 emissions from all of these facilities consistently across both seasons and at different times of the day. In the September morning measurements, the dispersion and overlap of NH3 emissions from this cluster of GPPs tracked to a distance of approximately 7.5 km downwind. Moreover, the use of high-spatial-resolution measurements allowed for precise localization of emission points within each facility. In nearly all plants, NH3 emissions were primarily concentrated around the cooling towers. Figure S7 shows zoomed-in views of emissions over GPPs 6, 7, and 9, illustrating the highest NH3 emissions from their cooling towers. This pattern is consistent with standard operational procedures in geothermal plants, where NH3 is separated from the geothermal brine and vented through the cooling tower exhaust. This method of disposal is common in such facilities as it enhances the overall efficiency of the power plant while preventing NH3 from causing operational issues, such as corrosion (Frick et al., 2019; Nogara and Zarrouk, 2018).
Region 3 (Fig. 7c), which contains the largest CAFO and the highest-capacity GPP in the study area, consistently recorded the highest average NH3 column density among all regions during each flight session, ranging from 20.9–33.2 ppm m, with maximum pixel-level values exceeding 350 ppm m. The emissions from CAFO 1 were remarkably large, with plumes that far outsized those of any other sources in the entire study area. Across the three flight acquisitions over Region 3, the width of the plumes from CAFO 1 ranged from 2.2–2.8 km and extended 7.1–7.7 km downwind of the source. In comparison, plume widths and lengths from the two nearby GPPs in this region ranged from 0.1–0.3 and 1–2.7 km, respectively. CAFOs emit NH3 primarily due to the breakdown of nitrogen-rich compounds in livestock manure, particularly urea in urine. Urea undergoes enzymatic hydrolysis when it comes into contact with fecal matter, producing NH3 gas. Factors such as manure management, ambient temperature, pH, and wind speed influence this process (Hiranuma et al., 2010; Hristov et al., 2011). As previously noted, CAFO 1 has the largest cattle population in the state, which explains the substantial NH3 emissions from this facility.
Regions 4–6 (Figs. 7d, S8a and b) each contain multiple CAFOs, with detectable emissions from every facility during each flight measurement, though the magnitudes varied among facilities. Region 6, encompassing CAFOs 13 and 15, exhibited the second-highest average NH3 column densities during each flight measurement, with levels ranging from 13.6–25.2 ppm m. CAFOs 2 and 9, which have the second and third largest cattle populations (Fig. S3), displayed particularly high NH3 emissions during the March morning measurements, with maximum pixel-level column densities reaching 400 and 700 ppm m, respectively.
Closer examination of the NH3 column density maps for Regions 4 and 5 revealed emissions from a few facilities not included in the known emission sources overlaid on the maps. Specifically, in Region 4, two detectable emission sources were identified north of CAFO 6. Similarly, in Region 5, a notable emission source was detected north of CAFO 9. Figure S9 provides a zoomed-in view of these sources, which appear to be CAFOs based on satellite imagery but were not listed in the CADD database. Notably, the emissions from the non-inventoried source north of CAFO 9 were particularly significant during the March morning measurements, with pixel-level NH3 column densities far exceeding 100 ppm m.
Overall, the airborne measurements demonstrated a strong capability to identify NH3 emission sources. Quantitatively, the surveys detected NH3 emissions from all four known fumarole geothermal vents, all 12 GPPs, and all 13 known CAFOs within the study area. Additionally, the high spatial resolution enabled the identification of at least three previously uninventoried point emission sources, appearing as CAFOs based on satellite imagery but not listed in existing databases, highlighting the method's ability to discover undocumented emitters.
3.2 Ground-based in situ mobile monitoring
Mobile NH3 monitoring was conducted primarily between 08:00 and 18:00 PDT, concurrent with airborne measurements over Mecca (28 March) and Imperial (25 September). Figures 8 and 1 illustrate the time series of ground-level NH3 concentrations on each monitoring day and map of the areas covered by the mobile platform, respectively. Gaps in the time series plots (Fig. 8) correspond to periods when the instrument operated outside its nominal temperature and flow rate ranges, resulting in unrecorded concentration measurements. NH3 concentrations were significantly higher in Imperial compared to Mecca, with average levels of 23.8 ppb in Mecca on 28 March and 250.1 ppb in Imperial on 25 September. The time series plots reveal multiple distinct plumes in the Imperial study area, detected as the mobile platform passed various sources, while the Mecca measurements indicated only a single notable increase above the background levels. To pinpoint the locations and potential emission sources, individual plumes were first identified based on distinct peaks in the time series plot (Fig. 8), and their corresponding spatial locations were then mapped in Fig. 9. Additionally, Fig. 10 compares NH3 concentration distributions across the identified plumes and highlights nearby known sources as potential emission contributors. In interpreting the mobile monitoring data, it is important to consider that the recorded NH3 levels reflect concentrations at the sampling height () and, thus, any plumes passing above this height may not have been fully captured by the mobile platform.
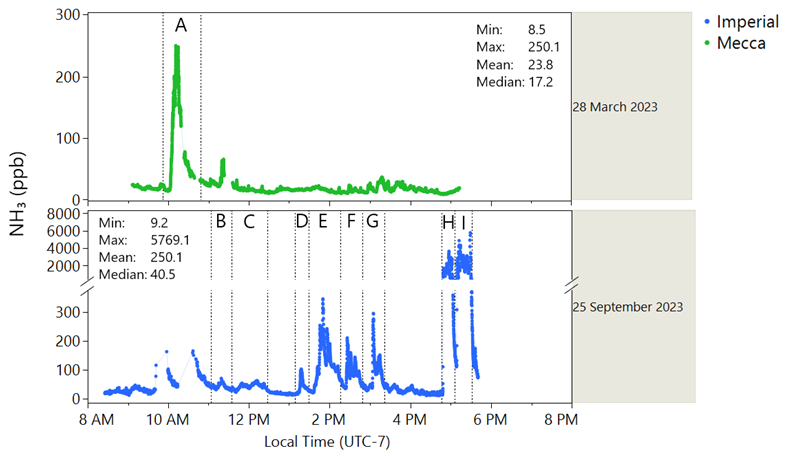
Figure 8Time series of instantaneous ground-level NH3 concentrations (ppb) measured by the mobile platform on each measurement day, with individual plumes labeled A to I for further investigation.
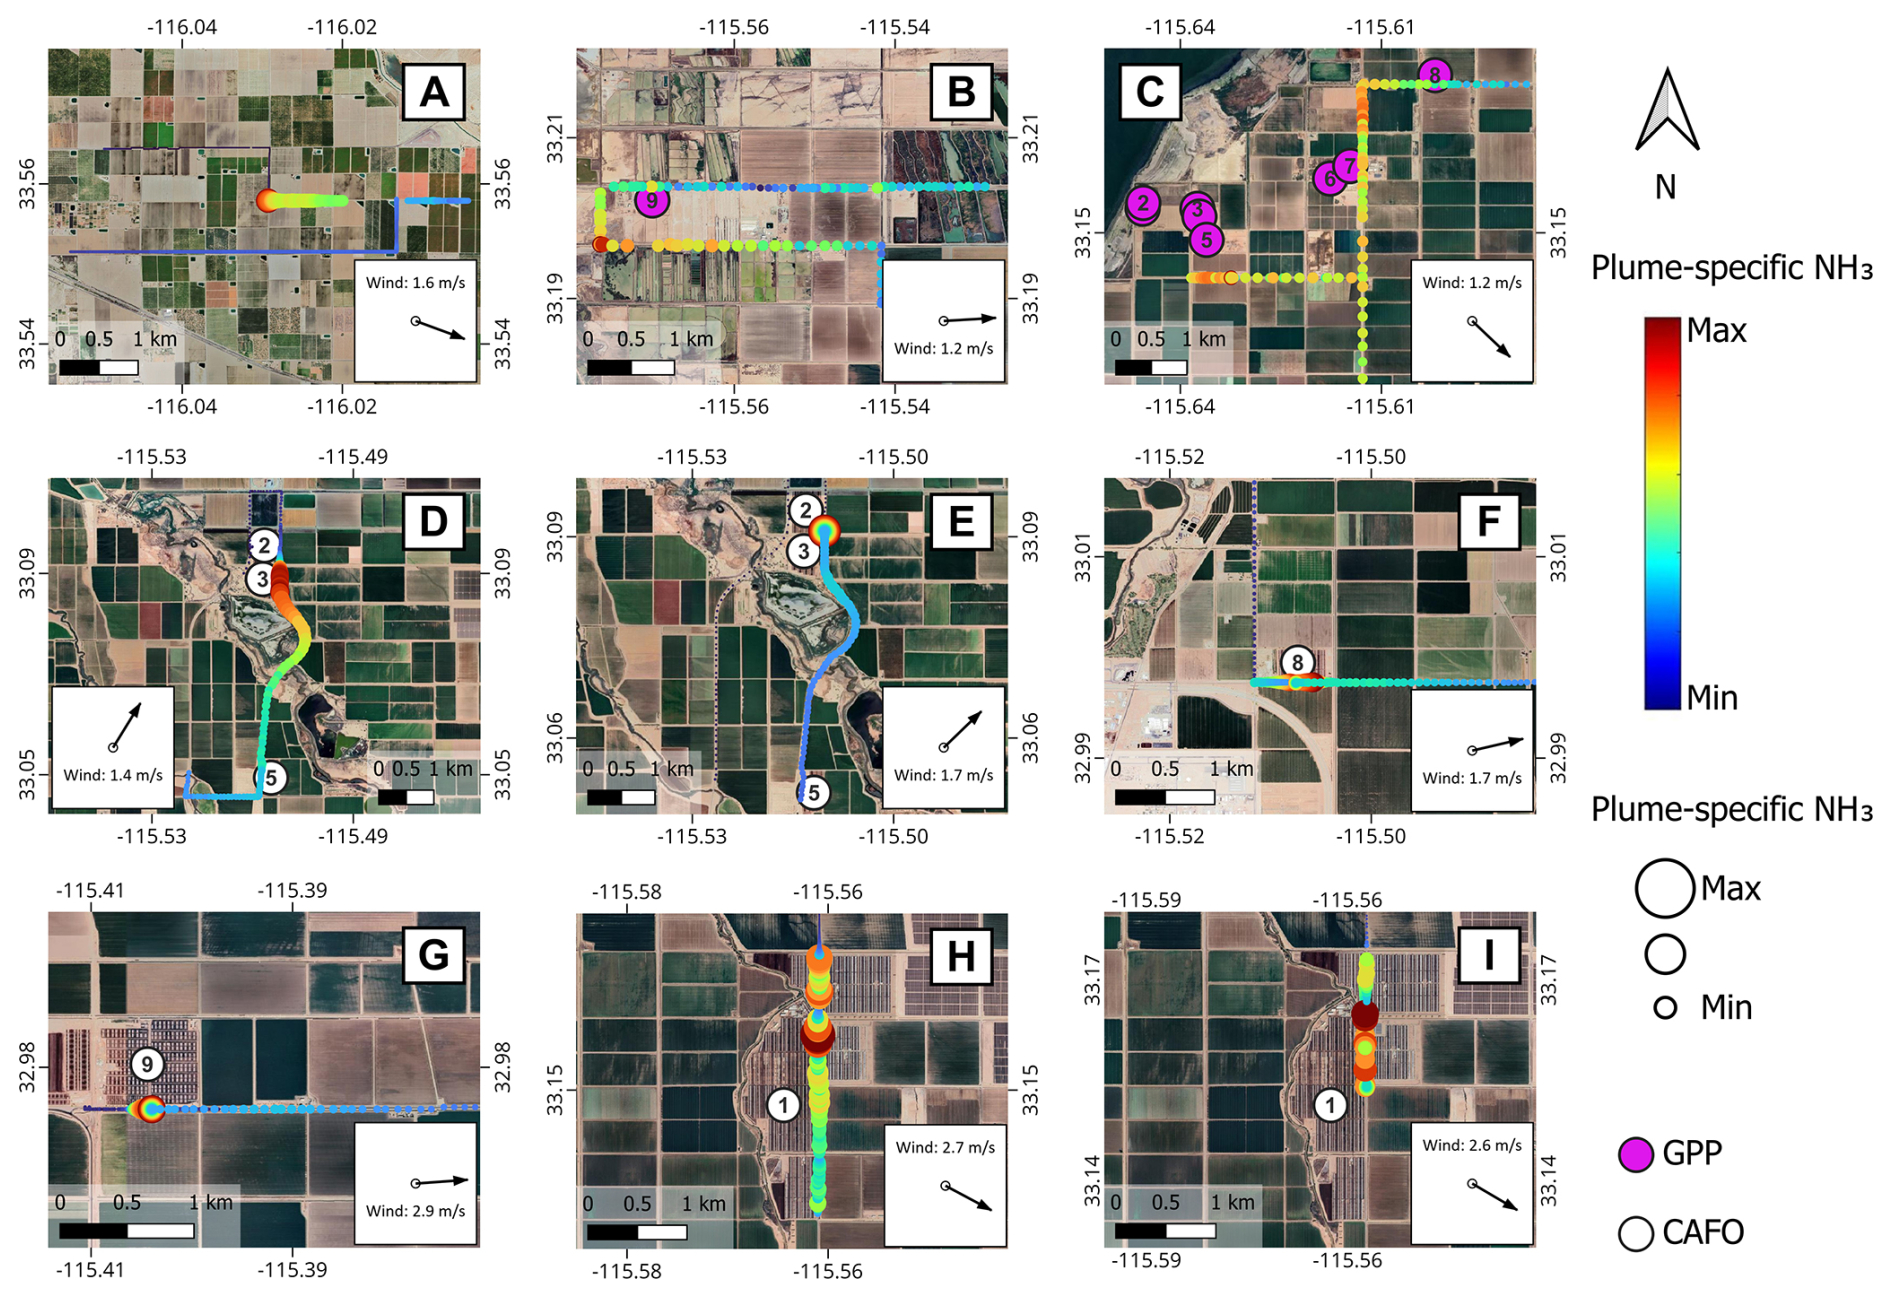
Figure 9Maps of individual ground-level NH3 plumes (A–I), as defined in Fig. 8, measured by the mobile platform. The color bar and marker sizes represent the plume-specific NH3 range, where blue and red correspond to the minimum and maximum NH3 values within each panel, respectively. Because scaling is performed separately for each plume, colors and marker sizes highlight spatial patterns within plumes but are not comparable across panels. Absolute concentrations and cross-plume comparisons are provided in Figs. 8 and 10. Average wind speed and direction were calculated from the nearest HRRR grid cells. Base imagery © Google Earth 2025.
As shown in Fig. 9, nearly all identified plumes, except for plume A, were detected near known NH3 emission sources. Plume A, the only notable plume detected by the mobile platform in the Mecca study area in March, was observed around some agricultural fields, suggesting NH3 emissions from fertilizer volatilization. Concurrent airborne NH3 imagery confirmed that Plume A originated from a diffuse area source linked to the surrounding agricultural fields. Ground observations by the field team also verified that the fields had been freshly fertilized. Ground-level NH3 concentrations measured near CAFOs were generally higher compared to those recorded downwind of GPPs (Fig. 10). The highest NH3 concentrations were consistently observed near CAFO 1, where the mobile platform recorded substantially elevated NH3 levels – up to 5700 ppb – each time it passed downwind of this source.
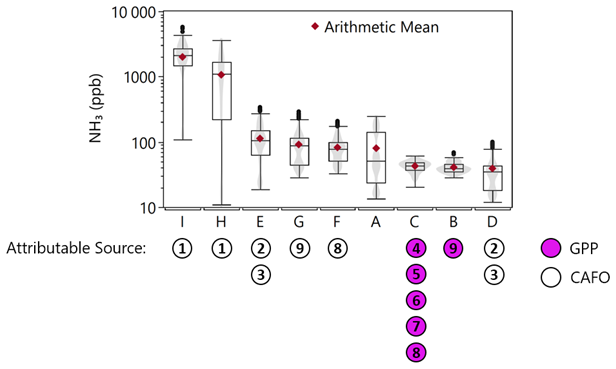
Figure 10Box plots of ground-level NH3 concentrations (ppb) for individual plumes (A to I), as defined in Fig. 8, measured by the mobile platform, along with the potential attributable sources. Boxes represent the interquartile range (IQR), with the horizontal line inside each box indicating the median value. Whiskers extend to 1.5 times the IQR, and outliers are values exceeding 1.5 times the IQR. Arithmetic mean values are shown as red diamonds.
3.3 Ground-based in situ stationary monitoring
As previously noted, the NH3 monitor at the Mecca AMS was non-operational in March. Consequently, only the NH3 data from 25 September were used to validate airborne NH3 measurements on that day, as described in detail by Tratt et al. (2025). This section presents the longer-term temporal trends and directional patterns of NH3 at this site, providing insights into its characteristics in the Mecca region. Figure 11 illustrates the monthly averaged NH3 concentrations, showing two notable maxima in winter and late summer, with minima in spring and late fall. Using April concentrations as a proxy for March, NH3 levels in September, when the second airborne campaign was conducted, were found to be more than twice those recorded in April. Additionally, a comparison of average NH3 levels across weekdays and weekends (Fig. S10) shows no significant differences, suggesting minimal contributions from sources such as traffic to NH3 emissions in this region.
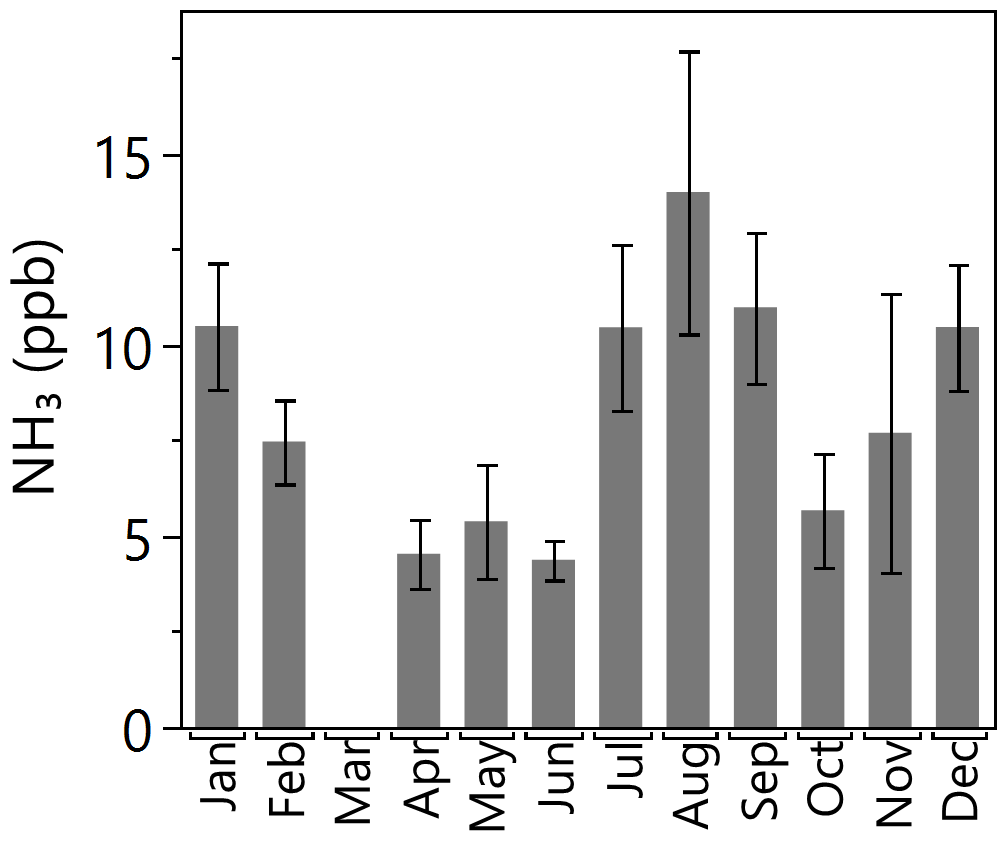
Figure 11Monthly averaged ground-level NH3 concentrations (ppb) measured at the Mecca air monitoring site in 2023. Error bars represent confidence intervals. March data are missing due to the NH3 monitor being non-operational during that period.
The monthly bivariate polar plots in Fig. S11 indicate that wind patterns at Mecca are generally balanced between the northwest and southeast directions. Notably, elevated NH3 levels are most strongly associated with southeasterly winds, with peak concentrations observed in January, July, August, September, and December. This pattern points to the likely presence of an NH3 source – or multiple sources – southeast of the Mecca AMS. Given that the Imperial region, located southeast of Mecca, is known for significantly high NH3 emissions, these emissions are likely the main contributors to the elevated NH3 concentrations measured at the Mecca AMS.
Pronounced variations in NH3 levels were observed over space and time within the study areas, and the tri-platform approach provided complementary perspectives in capturing these spatiotemporal trends. Average NH3 levels measured by the airborne platform were found to be over 8 times higher in Imperial compared to Mecca during the March campaign and approximately 2.5 times higher during the September campaign. Similarly, mobile monitoring revealed nearly 10 times higher average NH3 levels in Imperial compared to Mecca. Directional analysis at the Mecca AMS indicated that emissions from Imperial likely contribute to elevated NH3 levels in Mecca. Seasonally, the average NH3 column densities over Mecca were approximately 3.5 times higher in September than in March, while average levels in Imperial remained comparable across both seasons. The seasonal trend observed by the airborne imaging instrument in Mecca aligns closely with stationary measurements from the Mecca AMS, which recorded NH3 levels over 2.5 times higher in September compared to April (used as a proxy for March, as the NH3 monitor was non-operational).
The emission dynamics between the two study areas were notably distinct. Mecca exhibited considerably lower NH3 emissions, with the most prominent point source identified being a waste recycling facility. In contrast, Imperial presented a densely packed array of discrete sources, including several fumaroles, GPPs, and CAFOs. Among them, CAFO facilities proved to be significant contributors, with larger cattle populations correlating with higher NH3 emissions. Due to the dispersed layout of CAFO facilities, their plumes were found to be more expansive compared to those of GPPs, which were narrower and more isolated, predominantly concentrated around cooling towers. However, more accurate and quantitative assessment of emissions from different sources requires emission flux calculations, which, as mentioned above, is the focus of another publication from this field campaign.
The measurements presented here reinforce and expand understanding from previous research on atmospheric ammonia using airborne, satellite, and modeling approaches. For example, Kuai et al. (2019) utilized airborne HyTES measurements with 2 m spatial resolution in the California San Joaquin Valley to detect NH3 enhancements from cattle feedlots, power plants, and smoldering fires, reporting concentrations up to 5 times higher over feedlots compared to power plants – findings that closely align with the plume magnitudes and spatial variability observed in this study. Wang et al. (2021) oversampled IASI satellite data over the contiguous US (CONUS) from 2008–2017 to produce ∼2 km resolution monthly NH3 maps, consistently identifying the Imperial Valley as a hotspot with higher levels in September compared to March, consistent with our findings. Similarly, Pleim et al. (2019) employed the CMAQ model coupled with the EPIC agricultural model over CONUS to simulate bidirectional ammonia fluxes, highlighting the significant influence of agricultural fertilizer and livestock emissions in California's Central and Imperial Valleys.
NH3 emissions from CAFOs are an emerging concern, particularly with the growing number of these facilities across the US and the limited understanding of their emissions (Burns et al., 2023; Epps et al., 2025). This gap is primarily due to the lack of reliable data on the number, size, and precise locations of CAFOs. Consequently, a significant portion of CAFOs is missing from emission inventories. In fact, a review of the EPA's 2021 National Emissions Inventory (https://www.epa.gov/air-emissions-inventories/national-emissions-inventory-nei, last access: 4 January 2025) revealed no records of any CAFOs in our study areas, including CAFO 1, which, according to CARB's CADD, is the largest CAFO in California, and our measurements revealed substantial emissions from this facility.
High-spatial-resolution, wide-area airborne LWIR imaging provided unprecedented insights into the identification and quantification of NH3 sources. The wide-area coverage enabled the survey of relatively large regions within a short time, capturing all known sources and identifying previously unknown/unreported ones. Simultaneously, the high-spatial-resolution mapping at 2.1 m facilitated the detection of hotspots and the tracing of emission plumes back to their release points, including isolated and relatively weak NH3 sources such as fumaroles. In contrast, existing satellite instruments capable of measuring atmospheric NH3 (e.g., CrIS, IASI, AIRS) offer spatial resolutions of 15–50 km, which are too coarse to resolve localized features. To illustrate this, a hypothetical 15 km × 15 km grid, representative of the finest satellite resolution currently available, was overlaid on an NH3 column density map from this study (Fig. S12). As shown, nearly the entire cluster of geothermal power plants, all fumaroles, and CAFO 1, the largest in the study area, can fall within a single satellite pixel, masking the spatial variability captured by the airborne measurements. Additionally, airborne measurement allowed for monitoring areas that are difficult to access with traditional ground-based or in situ airborne methods. Another important advantage of airborne remote sensing, which provides column data, is its ability to capture entire plumes. Surface or airborne in situ measurements, by contrast, may miss these plumes due to underflying, overflying, or underdriving the plumes. Therefore, airborne remote sensing is an ideal tool for air quality managers and regulators for surveying a wide target area to identify hotspots and guide their subsequent longer-term in situ monitoring.
While LWIR hyperspectral imaging is highly effective in detecting, identifying, and tracking NH3 emissions, its sensitivity relies heavily on thermal contrast (Buckland et al., 2017; Hulley et al., 2016; Kuai et al., 2019). When this contrast is small, as is often the case during early morning hours before the ground has warmed, the sensor's ability to detect low-level NH3 diminishes. This effect was particularly evident in Mecca, where background NH3 levels were already significantly lower than those in Imperial. Conversely, afternoon flights benefited from increased solar heating, which raised ΔT and improved detection sensitivity, allowing the instrument to capture NH3 signals more effectively, even at relatively low ambient concentrations. For example, on 25 September, the stationary ground monitor at the Mecca AMS recorded similar NH3 ambient concentrations during both morning and afternoon flight times (around 4 ppb). However, as shown in Fig. 4, the airborne measurements detected much more widespread NH3 signals in the afternoon. This difference was due to the higher average ΔT in the afternoon (8.5 °C) compared to the morning (4 °C), which enabled the LWIR instrument to resolve NH3 signatures more effectively. More in-depth discussion about the sensitivity of the Mako retrievals in this study is provided in Tratt et al. (2025).
Airborne remote sensing measurements inherently provide only “snapshots” of advected emissions within the specific times and locations where data are collected. However, repeated measurements can offer insights into typical conditions. Both JPL's HyTES and the Aerospace Corporation's Mako instruments have flown extensively across California and selected regions worldwide, consistently detecting ubiquitous NH3 emissions in urban and rural areas (Buckland et al., 2017; Hulley et al., 2016; Kuai et al., 2019). Yet, no systematic effort has been made to quantify these emissions. Extensive, long-term historical datasets from these instruments, combined with available NH3 retrieval algorithms with a good understanding of their uncertainties, present a unique opportunity to identify and characterize NH3 sources on a much broader scale.
A more cost-effective alternative for achieving broader area coverage and routine observations is satellite-borne remote sensing. However, existing satellite LWIR instruments capable of measuring NH3 lack the spatial resolution needed to discern emissions at the local scale, especially in areas with dense sources, such as the Imperial region studied here. Advances in hyperspectral infrared imaging spectrometers and high-resolution detector technologies now enable NH3 mapping from space-based instruments with higher spatial resolution. For instance, the European Space Agency recently proposed Nitrosat, a satellite mission concept for high-resolution NH3 monitoring, with swaths over 80 km and a spatial resolution of 500 m (Noppen et al., 2023). Although not yet selected for further development, Nitrosat represents significant progress in this area. Additionally, emerging High Operating Temperature (HOT) Barrier Infrared Detector (HOT BIRD) technology (Wright et al., 2020) offers the potential for lightweight, multi-band infrared detectors with minimal cooling requirements. These detectors can provide space-based LWIR imaging at the spatial resolutions needed to monitor localized NH3 sources, making them promising for future advancements in NH3 monitoring.
NH3 is increasingly recognized as an emerging pollutant of concern due to its role in secondary PM2.5 formation and nitrogen deposition, both of which have significant environmental and public health impacts. Accurate characterization of NH3 emissions is essential for improving emission inventories and developing more effective air quality management strategies. This study demonstrates the integration of airborne LWIR hyperspectral imaging with ground-based stationary and mobile monitoring for mapping and characterizing NH3 emissions at hyperlocal scales across two distinct seasons in the Salton Sea region. Seasonal differences were notable over Mecca, with NH3 column densities approximately 3.5 times higher in September than in March, while levels in Imperial remained relatively comparable across seasons. The high spatial resolution of the LWIR imager revealed pronounced spatial variability in NH3 levels, with Imperial exhibiting average NH3 column densities 2.5–8 times higher than Mecca – a disparity primarily driven by sources such as CAFOs, geothermal power plants, fumaroles, and intensive agricultural activities. Notably, the ability to detect previously unreported emission sources, especially in densely populated agricultural areas, underscores the potential of this approach to improve the identification and characterization of NH3 emission sources. These findings provide key insights into local-scale emission patterns that are often missed by traditional ground-based or satellite measurements, highlighting the need for more routine, wide-scale airborne campaigns and the development of new satellite missions with enhanced resolution to fill critical data gaps.
Data from this study can be made available upon request.
The supplement related to this article is available online at https://doi.org/10.5194/acp-25-11935-2025-supplement.
Conceptualization: SH, DMT, and OVK; methodology: DMT, CSC, SH, and OVK; flight planning and airborne data acquisition: ERK; airborne data processing: CSC and KNB; data visualization and plume dispersion analysis: CSC; ground mobile data acquisition and processing: YM; meteorological model data: MA; stationary measurements: PP and MHS; writing – original draft: SH; writing – review and editing: all authors. All authors have read and approved the final version of the paper.
The contact author has declared that none of the authors has any competing interests.
The views and conclusions expressed in this paper are those of the authors and do not necessarily reflect the official policies or positions of their affiliated institutions.
Publisher's note: Copernicus Publications remains neutral with regard to jurisdictional claims made in the text, published maps, institutional affiliations, or any other geographical representation in this paper. While Copernicus Publications makes every effort to include appropriate place names, the final responsibility lies with the authors.
This research was conducted at the Jet Propulsion Laboratory, California Institute of Technology, under a contract with NASA, with support from the Aerospace Corporation's Independent Research and Development program and Research and Technology Collaborations Office, as well as the University of California, Riverside. We would like to thank Toshihiro Kuwayama and Morteza Amini for their valuable input and thoughtful perspectives, which significantly enriched this work.
This paper was edited by Kelvin Bates and reviewed by two anonymous referees.
Adams, P. M., Lynch, D. K., Buckland, K. N., Johnson, P. D., and Tratt, D. M.: Sulfate mineralogy of fumaroles in the Salton Sea Geothermal Field, Imperial County, California, J. Volcanol. Geoth. Res., 347, 15–43, https://doi.org/10.1016/j.jvolgeores.2017.08.010, 2017.
Beaudor, M., Hauglustaine, D., Lathière, J., Van Damme, M., Clarisse, L., and Vuichard, N.: Evaluating present-day and future impacts of agricultural ammonia emissions on atmospheric chemistry and climate, Atmos. Chem. Phys., 25, 2017–2046, https://doi.org/10.5194/acp-25-2017-2025, 2025.
Bi, J., Stowell, J., Seto, E. Y. W., English, P. B., Al-Hamdan, M. Z., Kinney, P. L., Freedman, F. R., and Liu, Y.: Contribution of low-cost sensor measurements to the prediction of PM2.5 levels: A case study in Imperial County, California, USA, Environ. Res., 180, 108810, https://doi.org/10.1016/j.envres.2019.108810, 2020.
Buckland, K. N., Young, S. J., Keim, E. R., Johnson, B. R., Johnson, P. D., and Tratt, D. M.: Tracking and quantification of gaseous chemical plumes from anthropogenic emission sources within the Los Angeles Basin, Remote Sens. Environ., 201, 275–296, https://doi.org/10.1016/j.rse.2017.09.012, 2017.
Burns, A. M., Chandler, G., Dunham, K. J., and Carlton, A. G.: Data Gap: Air Quality Networks Miss Air Pollution from Concentrated Animal Feeding Operations, Environ. Sci. Technol., 57, 20718–20725, https://doi.org/10.1021/acs.est.3c06947, 2023.
Current Nonattainment Counties for All Criteria Pollutants: https://www3.epa.gov/airquality/greenbook/ancl.html?utm_source=chatgpt.com, last access: 4 January 2025.
Dammers, E., McLinden, C. A., Griffin, D., Shephard, M. W., Van Der Graaf, S., Lutsch, E., Schaap, M., Gainairu-Matz, Y., Fioletov, V., Van Damme, M., Whitburn, S., Clarisse, L., Cady-Pereira, K., Clerbaux, C., Coheur, P. F., and Erisman, J. W.: NH3 emissions from large point sources derived from CrIS and IASI satellite observations, Atmos. Chem. Phys., 19, 12261–12293, https://doi.org/10.5194/acp-19-12261-2019, 2019.
EPA (Environmental Protection Agency): Reconsideration of the National Ambient Air Quality Standards for Particulate Matter, 88 Fed. Reg. 5558 | Casetext, https://www.federalregister.gov/documents/2024/12/19/2024- 29223/reconsideration-of-the-national-ambient-air-quality-standards-for-particulate-matter-correction, last access: 22 September 2025.
Epps, A., Dressel, I. M., Guo, X., Odanibe, M., Fields, K. P., Carlton, A. M. G., Sun, K., and Pusede, S. E.: Satellite Observations of Atmospheric Ammonia Inequalities Associated with Industrialized Swine Facilities in Eastern North Carolina, Environ. Sci. Technol., 59, 2651–2664, https://doi.org/10.1021/acs.est.4c11922, 2025.
Farzan, S. F., Razafy, M., Eckel, S. P., Olmedo, L., Bejarano, E., and Johnston, J. E.: Assessment of Respiratory Health Symptoms and Asthma in Children near a Drying Saline Lake, Int. J. Env. Res. Pub. He., 16, 3828, https://doi.org/10.3390/ijerph16203828, 2019.
Felix, J. D., Elliott, E. M., and Gay, D. A.: Spatial and temporal patterns of nitrogen isotopic composition of ammonia at US ammonia monitoring network sites, Atmos. Environ., 150, 434–442, https://doi.org/10.1016/j.atmosenv.2016.11.039, 2017.
Frick, S., Kranz, S., Kupfermann, G., Saadat, A., and Huenges, E.: Making use of geothermal brine in Indonesia: binary demonstration power plant Lahendong/Pangolombian, Geothermal Energy, 7, 30, https://doi.org/10.1186/s40517-019-0147-2, 2019.
Frie, A. L., Garrison, A. C., Schaefer, M. V., Bates, S. M., Botthoff, J., Maltz, M., Ying, S. C., Lyons, T., Allen, M. F., Aronson, E., and Bahreini, R.: Dust Sources in the Salton Sea Basin: A Clear Case of an Anthropogenically Impacted Dust Budget, Environ. Sci. Technol., 53, 9378–9388, https://doi.org/10.1021/acs.est.9b02137, 2019.
Hall, J. L., Boucher, R. H., Gutierrez, D. J., Hansel, S. J., Kasper, B. P., Keim, E. R., Moreno, N. M., Polak, M. L., Sivjee, M. G., Tratt, D. M., and Warren, D. W.: First flights of a new airborne thermal infrared imaging spectrometer with high area coverage, in: Infrared Technology and Applications XXXVII, 47–53, https://doi.org/10.1117/12.884865, 2011.
Hall, J. L., Boucher, R. H., Buckland, K. N., Gutierrez, D. J., Keim, E. R., Tratt, D. M., and Warren, D. W.: Mako airborne thermal infrared imaging spectrometer: performance update, in: Imaging Spectrometry XXI, 997604, https://doi.org/10.1117/12.2239245, 2016.
Hall, J. L., Chang, C. S., Westberg, K., and Tratt, D. M.: Scene Analysis for Gas Estimation (SAGE): A tool for quantification of diffuse and point-source atmospheric trace gas abundance, Remote Sens. Environ., 330, 1 December 2025, 114956, https://doi.org/10.1016/j.rse.2025.114956, 2025.
Hiranuma, N., Brooks, S. D., Thornton, D. C. O., and Auvermann, B. W.: Atmospheric Ammonia Mixing Ratios at an Open-Air Cattle Feeding Facility, JAPCA J. Air Waste Ma., 60, 210–218, https://doi.org/10.3155/1047-3289.60.2.210, 2010.
Hristov, A. N., Hanigan, M., Cole, A., Todd, R., McAllister, T. A., Ndegwa, P. M., and Rotz, A.: Review: Ammonia emissions from dairy farms and beef feedlots, Can. J. Anim. Sci., 91, 1–35, https://doi.org/10.4141/CJAS10034, 2011.
Hulley, G. C., Duren, R. M., Hopkins, F. M., Hook, S. J., Vance, N., Guillevic, P., Johnson, W. R., Eng, B. T., Mihaly, J. M., Jovanovic, V. M., Chazanoff, S. L., Staniszewski, Z. K., Kuai, L., Worden, J., Frankenberg, C., Rivera, G., Aubrey, A. D., Miller, C. E., Malakar, N. K., Sánchez Tomás, J. M., and Holmes, K. T.: High spatial resolution imaging of methane and other trace gases with the airborne Hyperspectral Thermal Emission Spectrometer (HyTES), Atmos. Meas. Tech., 9, 2393–2408, https://doi.org/10.5194/amt-9-2393-2016, 2016.
Johnston, J. E., Razafy, M., Lugo, H., Olmedo, L., and Farzan, S. F.: The disappearing Salton Sea: A critical reflection on the emerging environmental threat of disappearing saline lakes and potential impacts on children's health, Sci. Total Environ., 663, 804–817, https://doi.org/10.1016/j.scitotenv.2019.01.365, 2019.
Johnston, J. E., Kamai, E., Duenas Barahona, D., Olmedo, L., Bejarano, E., Torres, C., Zuidema, C., Seto, E., Eckel, S. P., and Farzan, S. F.: Air quality and wheeze symptoms in a rural children's cohort near a drying saline lake, Environ. Res., 263, 120070, https://doi.org/10.1016/j.envres.2024.120070, 2024.
Jones, B. A. and Fleck, J.: Shrinking lakes, air pollution, and human health: Evidence from California's Salton Sea, Sci. Total Environ., 712, 136490, https://doi.org/10.1016/j.scitotenv.2019.136490, 2020.
Kuai, L., Kalashnikova, O. V., Hopkins, F. M., Hulley, G. C., Lee, H., Garay, M. J., Duren, R. M., Worden, J. R., and Hook, S. J.: Quantification of Ammonia Emissions With High Spatial Resolution Thermal Infrared Observations From the Hyperspectral Thermal Emission Spectrometer (HyTES) Airborne Instrument, IEEE J. Sel. Top. Appl., 12, 4798–4812, https://doi.org/10.1109/JSTARS.2019.2918093, 2019.
Kuttippurath, J., Patel, V. K., Kashyap, R., Singh, A., and Clerbaux, C.: Anomalous increase in global atmospheric ammonia during COVID-19 lockdown: Need policies to curb agricultural emissions, J. Clean. Prod., 434, 140424, https://doi.org/10.1016/j.jclepro.2023.140424, 2024.
Leifer, I., Melton, C., Tratt, D. M., Buckland, K. N., Clarisse, L., Coheur, P., Frash, J., Gupta, M., Johnson, P. D., Leen, J. B., Van Damme, M., Whitburn, S., and Yurganov, L.: Remote sensing and in situ measurements of methane and ammonia emissions from a megacity dairy complex: Chino, CA, Environ. Pollut., 221, 37–51, https://doi.org/10.1016/j.envpol.2016.09.083, 2017.
Li, W., Wang, X., Song, W., Zhang, Z., Wang, X., Liu, X., Ma, T., Wang, Q., Zhang, Y., Wang, X., and Geng, L.: On the contribution of atmospheric reactive nitrogen deposition to nitrogen burden in a eutrophic Lake in eastern China, Water Res., 268, 122597, https://doi.org/10.1016/j.watres.2024.122597, 2025.
Lieb, H. C., Maldonado, M., Ruiz, E., Torres, C., Olmedo, L., Walters, W. W., and Faloona, I. C.: Nitrogen isotopes reveal high NOx emissions from arid agricultural soils in the Salton Sea Air Basin, Sci. Rep.-UK, 14, 28725, https://doi.org/10.1038/s41598-024-78361-y, 2024.
Lynch, D. K. and Hudnut, K. W.: The Wister Mud Pot Lineament: Southeastward Extension or Abandoned Strand of the San Andreas Fault?, B. Seismol. Soc. Am., 98, 1720–1729, https://doi.org/10.1785/0120070252, 2008.
Ma, J., Shi, H., Zhu, Y., Li, R., Wang, S., Lu, N., Yao, Y., Bian, Z., and Huang, K.: The Evolution of Global Surface Ammonia Concentrations during 2001–2019: Magnitudes, Patterns, and Drivers, Environ. Sci. Technol., 59, 5066–5079, https://doi.org/10.1021/acs.est.4c14020, 2025.
Miao, Y., Porter, W. C., Benmarhnia, T., Lowe, C., Lyons, T. W., Hung, C., and Diamond, C.: Source-specific acute cardio-respiratory effects of ambient coarse particulate matter exposure in California's Salton Sea region, Environ. Res.: Health, 3, 015006, https://doi.org/10.1088/2752-5309/ad934a, 2025.
Monforti-Ferrario, F., Borowiak, A., Putaud, J. P., and Perez Ballesta, P., Cavalli, F., and Manca, G.: Air pollutants of emerging concern, EUR 31014 EN, Publications Office of the European Union, Luxembourg, JRC128188, https://doi.org/10.2760/284694, ISBN 978-92-76-49331-0, 2022.
Nair, A. A. and Yu, F.: Quantification of Atmospheric Ammonia Concentrations: A Review of Its Measurement and Modeling, Atmosphere, 11, 1092, https://doi.org/10.3390/atmos11101092, 2020.
Nogara, J. and Zarrouk, S. J.: Corrosion in geothermal environment: Part 1: Fluids and their impact, Renew. Sust. Energ. Rev., 82, 1333–1346, https://doi.org/10.1016/j.rser.2017.06.098, 2018.
Noppen, L., Clarisse, L., Tack, F., Ruhtz, T., Merlaud, A., Van Damme, M., Van Roozendael, M., Schuettemeyer, D., and Coheur, P.: Constraining industrial ammonia emissions using hyperspectral infrared imaging, Remote Sens. Environ., 291, 113559, https://doi.org/10.1016/j.rse.2023.113559, 2023.
Pleim, J. E., Ran, L., Appel, W., Shephard, M. W., and Cady-Pereira, K.: New Bidirectional Ammonia Flux Model in an Air Quality Model Coupled With an Agricultural Model, J. Adv. Model. Earth Sy., 11, 2934–2957, https://doi.org/10.1029/2019MS001728, 2019.
Shephard, M. W., Dammers, E., Cady-Pereira, K. E., Kharol, S. K., Thompson, J., Gainariu-Matz, Y., Zhang, J., McLinden, C. A., Kovachik, A., Moran, M., Bittman, S., Sioris, C. E., Griffin, D., Alvarado, M. J., Lonsdale, C., Savic-Jovcic, V., and Zheng, Q.: Ammonia measurements from space with the Cross-track Infrared Sounder: characteristics and applications, Atmos. Chem. Phys., 20, 2277–2302, https://doi.org/10.5194/acp-20-2277-2020, 2020.
South Coast AQMD: South Coast Air Basin Attainment Plan for the 2012 Annual PM2.5 Standard, https://www.aqmd.gov/docs/default-source/clean-air-plans/pm2.5-plans/final-pm2.5-plan/2012-annual-pm2-5-plan.pdf?sfvrsn=eb518a61_16 (last access: 22 September 2025), 2024.
Tang, K., Zhang, H., Xu, G., Chang, F., Xu, Y., Miao, J., Cui, X., Jin, J., Li, B., Li, K., Liao, H., and Li, N.: Optimizing Ammonia Emissions for PM2.5 Mitigation: Environmental and Health Co-Benefits in Eastern China, EGUsphere [preprint], https://doi.org/10.5194/egusphere-2025-1407, 2025.
Tratt, D. M., Young, S. J., Lynch, D. K., Buckland, K. N., Johnson, P. D., Hall, J. L., Westberg, K. R., Polak, M. L., Kasper, B. P., and Qian, J.: Remotely sensed ammonia emission from fumarolic vents associated with a hydrothermally active fault in the Salton Sea Geothermal Field, California, J. Geophys. Res.-Atmos., D21308, 116, https://doi.org/10.1029/2011JD016282, 2011.
Tratt, D. M., Buckland, K. N., Young, S. J., Johnson, P. D., Riesz, K. A., and Molina, K. C.: Remote sensing visualization and quantification of ammonia emission from an inland seabird colony, JARS, 7, 073475, https://doi.org/10.1117/1.JRS.7.073475, 2013.
Tratt, D. M., Young, S. J., Johnson, P. D., Buckland, K. N., and Lynch, D. K.: Multi-year study of remotely-sensed ammonia emission from fumaroles in the Salton Sea Geothermal Field, in: 8th Workshop on Hyperspectral Image and Signal Processing: Evolution in Remote Sensing (WHISPERS), Los Angeles, CA, USA, 21–24 August 2016, IEEE, 1–5, https://doi.org/10.1109/WHISPERS.2016.8071692, 2016.
Tratt, D. M., Chang, C. S., Keim, E. R., Buckland, K. N., Alvarez, M., Kalashnikova, O., Hasheminassab, S., Garay, M. J., Miao, Y., Porter, W. C., Hopkins, F. M., Pakbin, P., and Sowlat, M.: Airborne Mapping of Atmospheric Ammonia in a Mixed Discrete and Diffuse Emission Environment, Remote Sensing, 17, 95, https://doi.org/10.3390/rs17010095, 2025.
Van Damme, M., Clarisse, L., Franco, B., Sutton, M. A., Erisman, J. W., Kruit, R. W., Zanten, M. van, Whitburn, S., Hadji-Lazaro, J., Hurtmans, D., Clerbaux, C., and Coheur, P.-F.: Global, regional and national trends of atmospheric ammonia derived from a decadal (2008–2018) satellite record, Environ. Res. Lett., 16, 055017, https://doi.org/10.1088/1748-9326/abd5e0, 2021.
Vira, J., Hess, P., Ossohou, M., and Galy-Lacaux, C.: Evaluation of interactive and prescribed agricultural ammonia emissions for simulating atmospheric composition in CAM-chem, Atmos. Chem. Phys., 22, 1883–1904, https://doi.org/10.5194/acp-22-1883-2022, 2022.
Wang, R., Guo, X., Pan, D., Kelly, J. T., Bash, J. O., Sun, K., Paulot, F., Clarisse, L., Van Damme, M., Whitburn, S., Coheur, P.-F., Clerbaux, C., and Zondlo, M. A.: Monthly Patterns of Ammonia Over the Contiguous United States at 2 km Resolution, Geophys. Res. Lett., 48, e2020GL090579, https://doi.org/10.1029/2020GL090579, 2021.
Wang, R., Pan, D., Guo, X., Sun, K., Clarisse, L., Van Damme, M., Coheur, P.-F., Clerbaux, C., Puchalski, M., and Zondlo, M. A.: Bridging the spatial gaps of the Ammonia Monitoring Network using satellite ammonia measurements, Atmos. Chem. Phys., 23, 13217–13234, https://doi.org/10.5194/acp-23-13217-2023, 2023.
Warner, J. X., Wei, Z., Strow, L. L., Dickerson, R. R., and Nowak, J. B.: The global tropospheric ammonia distribution as seen in the 13 year AIRS measurement record, Atmos. Chem. Phys., 16, 5467–5479, https://doi.org/10.5194/acp-16-5467-2016, 2016.
Wright, R., Lucey, P., Flynn, L., Ferrari-Wong, C., Gabrieli, A., Nunes, M., Gunapala, S., Ting, D., Rafol, S., Soibel, A., and George, T.: HYTI: High Spectral and Spatial Resolution Thermal Imaging from a 6U CubeSat, 34th Annual AIAA/USU Conference on Small Satellites, https://digitalcommons.usu.edu/cgi/viewcontent.cgi?article=4618&context=smallsat (last access: 22 September 2025), 2020.
Wyer, K. E., Kelleghan, D. B., Blanes-Vidal, V., Schauberger, G., and Curran, T. P.: Ammonia emissions from agriculture and their contribution to fine particulate matter: A review of implications for human health, J. Environ. Manage., 323, 116285, https://doi.org/10.1016/j.jenvman.2022.116285, 2022.
Yu, F., Nair, A. A., and Luo, G.: Long-Term Trend of Gaseous Ammonia Over the United States: Modeling and Comparison With Observations, J. Geophys. Res.-Atmos., 123, 8315–8325, https://doi.org/10.1029/2018JD028412, 2018.
Zeng, Y., Tian, S., and Pan, Y.: Revealing the Sources of Atmospheric Ammonia: a Review, Curr. Pollution Rep., 4, 189–197, https://doi.org/10.1007/s40726-018-0096-6, 2018.
Zhang, L., Jacob, D. J., Knipping, E. M., Kumar, N., Munger, J. W., Carouge, C. C., van Donkelaar, A., Wang, Y. X., and Chen, D.: Nitrogen deposition to the United States: distribution, sources, and processes, Atmos. Chem. Phys., 12, 4539–4554, https://doi.org/10.5194/acp-12-4539-2012, 2012.