the Creative Commons Attribution 4.0 License.
the Creative Commons Attribution 4.0 License.
 | 30 Sep 2025
An uncertain future for the climate and health impacts of anthropogenic aerosols in Africa
Joe Adabouk Amooli
Marianne T. Lund
Sourangsu Chowdhury
Gunnar Myhre
Ane N. Johansen
Bjørn H. Samset
Daniel M. Westervelt
Limited data availability and distinct regional characteristics of sources lead to a wide range of future aerosol emission projections for Africa. Here, we quantify and explore the implications of this spread for climate and health impact assessments. Using the Evaluating the Climate and Air Quality Impacts of Short-Lived Pollutants (ECLIPSE), the Shared Socioeconomic Pathways (SSPs), and the United Nations Environment Programme (UNEP) emission projections, we find high scenario diversity and regional heterogeneity in projected air pollution emissions across Africa. Baseline emissions also vary in their sectoral split. Using 10 different emission pathways as input to the Oslo chemical transport model version 3 (OsloCTM3), we find that regionally averaged annual mean population-weighted fine particulate matter (PM2.5) concentrations exhibit divergent trends depending on scenario stringency, with the eastern Africa PM2.5 concentrations increasing by up to 6 µg m−3 (37 %, SD ± 2.7 µg m−3) by 2050 under the UNEP Baseline, SSP370, and ECLIPSE current legislation scenarios. In almost all cases, excess deaths increase substantially, with increases of up to more than 2.5 times compared to the baseline. We also find a net positive aerosol-induced radiative forcing across Africa in all scenarios by 2050, except two high-sulfur emission UNEP scenarios, with values ranging from 0.03 W m−2 in SSP119 to 0.27 W m−2 in SSP585. The wide spread in projected emissions and differences in sectoral distributions across scenarios highlight the critical need for accurate activity data and harmonization efforts in preparation for upcoming assessments such as the 7th Assessment Report of the Intergovernmental Panel on Climate Change.
- Article
(8178 KB) - Full-text XML
-
Supplement
(6644 KB) - BibTeX
- EndNote


Emissions of anthropogenic aerosols, their precursors, and reactive gases are projected to undergo substantial changes in the coming decades, which will have a major impact on climate and air quality (Lund et al., 2019; Westervelt et al., 2020). In the US and Europe, sulfur dioxide (SO2), black carbon (BC), and organic aerosol (OA) emissions have been declining in recent decades (Leibensperger et al., 2012; Westervelt et al., 2015). In contrast, emissions have significantly increased in Africa and other countries in the Global South in recent decades (Fontes et al., 2017; Samset et al., 2019; Wang et al., 2023). In major emitting regions, aerosol-induced cooling has offset up to 1 °C of surface warming since the pre-industrial era (Samset et al., 2019), and the sensitivity of regional climates to local reductions in aerosol emissions is high (Samset et al., 2018; Westervelt et al., 2020). Aerosols impact surface temperature not only by directly scattering or absorbing incoming solar radiation but also indirectly by altering cloud properties, including their brightness, lifespan, and, in the case of absorbing aerosols, by reducing cloud cover through the semi-direct burn-off effect (Albrecht, 1989; Twomey, 1977). Changes in regional emissions of scattering and absorbing aerosols also significantly affect both local and distant precipitation patterns (Westervelt et al., 2017, 2018). Considering the ambitious goals of the Paris Agreement, it is becoming increasingly essential to understand the impact of aerosols and other short-lived climate forcers on total anthropogenic radiative forcing (Forster et al., 2024; IPCC, 2023; Lund et al., 2019).
Alongside their climate impacts, aerosols, particularly fine particulate matter (PM2.5), are associated with various negative health effects. Prolonged exposure to ambient PM2.5 has been linked to increased mortality from cardiovascular and cerebrovascular diseases, acute lower respiratory infections, lung cancer, and adverse birth outcomes (Burnett et al., 2018; Chowdhury et al., 2020, 2022; Cohen et al., 2017). Ischemic heart disease (IHD) and stroke have been identified as major contributors to the health burden linked to air pollution (Fang et al., 2025). The current human health effects of PM2.5 are substantial, with a recent estimate of 8.1 million deaths per year globally (GBD, 2024). The future impacts of air pollutants will be influenced by both changes in emissions and shifts in demographics (Lund et al., 2019; Wells et al., 2024).
The health impacts of air pollution become more severe with age because aging reduces physiological resilience and increases susceptibility to chronic non-communicable diseases (Pope, 2007; Shumake et al., 2013). Older adults, particularly those aged 60 and above, are especially vulnerable to air pollution (Yin et al., 2021). This age group is growing rapidly, especially in low- and middle-income countries (LMICs), where pollution levels are typically higher than in wealthier nations (UN, 2017). In addition to older adults, young children, particularly those under 5, are also highly vulnerable (Murray et al., 2020). Africa is projected to account for at least 40 % of the global population of children under the age of 5 by 2050 (KC and Lutz, 2017). At present, about 30 % of PM2.5-related deaths in Africa occur among children under 5, and this rate has been increasing over the past decade (Murray et al., 2020).
Africa exhibits distinct regional characteristics in aerosol emission sources, resulting in a wide range of potential future pollutant emission pathways, with some scenarios predicting significant increases in pollutants in key regions (Abera et al., 2020; Shindell et al., 2022; Turnock et al., 2020; Wells et al., 2024). Ongoing and anticipated future changes in Africa, including rapid economic development, rising urbanization, continued dependence on traditional biomass fuels, agricultural practices, limited access to advanced pollution control technologies, infrastructure expansion, and population growth, are expected to increase exposure to air pollutants, although the magnitude and direction of these changes remain highly uncertain across future scenarios (Abera et al., 2020; Bauer et al., 2019; Chowdhury et al., 2020; Wells et al., 2024). Despite this, research on air-pollution-related health impacts in Africa, particularly outdoor air pollution, is limited (Abera et al., 2020; UNEP, 2022; Wells et al., 2024) due to the scarcity of observational data (Katoto et al., 2019).
Global emission inventories, including the Community Emissions Data System (CEDS; Hoesly et al., 2018), the Evaluating the Climate and Air Quality Impacts of Short-Lived Pollutants (ECLIPSE) inventory from the Greenhouse Gas and Air Pollution Interactions and Synergies (GAINS) model (Amann et al., 2011), and the Emissions Database for Global Atmospheric Research (EDGAR; Crippa et al., 2018; Janssens-Maenhout et al., 2019), have improved our understanding of historical emission trends, while global emission scenarios such as the Shared Socioeconomic Pathways (SSPs) (Riahi et al., 2017) have improved our understanding of plausible future trends. However, Africa remains critically understudied due to limited data. Previous studies focusing on the region, such as Shindell et al. (2022) and Wells et al. (2024), have primarily relied on the SSP scenarios, limiting their scope in capturing a broader range of plausible future emission trajectories. This knowledge gap is particularly pressing given Africa's accelerating development, substantial spatial variation in economic growth and industrialization, and the wide range of emission sources across the region. Addressing this gap, our study focuses on African aerosol and precursor emissions, examining their climate and health impacts under a broader set of scenarios that extend beyond the SSP scenarios. This work provides critical insights into Africa's unique emissions landscape and lays the groundwork for future research and policy interventions.
We explore the range in projections of mid-century anthropogenic air pollution levels in Africa and the associated region-specific health impacts, resulting from 10 different pathways using the Oslo chemical transport model version 3 (OsloCTM3). We present estimates of the projected future regional radiative forcing of anthropogenic aerosols across these scenarios. We also evaluate the model's performance against surface and satellite observations. We build upon and expand on previous studies by incorporating simulations of PM2.5, its associated radiative forcing, and health impacts across a comprehensive range of scenarios, including SSPs, ECLIPSE, and the United Nations Environment Programme (UNEP) Integrated Assessment of Air Pollution and Climate Change in Africa pathways, to explore a broad spectrum of future possibilities under plausible conditions. To achieve this, we use a chemical transport model with a more detailed representation of the chemistry involved in the formation of PM2.5 compared to the earth system models, which must sacrifice detailed online chemical mechanisms for computational efficiency.
In Sect. 2, we provide an overview of the study domain and the OsloCTM3 model. We describe the emissions, simulations, surface and satellite observations, and methodologies for assessing health impacts and calculating radiative forcing. Section 3 discusses the results, highlighting the significant variability and regional heterogeneity in projected air pollution emissions across Africa. We examine the sectoral contributions to BC and SO2 emissions under increasing scenarios for 2020 and 2050 and the differences between these years. The section also discusses subregional and continental annual mean PM2.5 changes between 2015–2018 and 2050 across all scenarios. Furthermore, we discuss the excess number of deaths attributable to PM2.5 for 2015–2018 and 2050 under each scenario. In Sect. 4, we discuss the implications of our results, while Sect. 5 presents the conclusions, the key findings from the study, and their broader implications.
2.1 Study domain
In this study, we divided the African continent into five subregions: western, central, eastern, southern, and northern Africa, as illustrated in Fig. 1. These divisions are commonly used in regional analyses for ease of interpretation and to reflect the continent's diverse environmental, health, economic, and demographic characteristics (Djeufack Dongmo et al., 2023; Fenta et al., 2020; Safo-Adu et al., 2023). Each region differs in population density and industrialization, which in turn influence air pollution levels and public health outcomes (Djeufack Dongmo et al., 2023; Safo-Adu et al., 2023). The regional boundaries were adapted from the World Health Organization (WHO) administrative regions for Africa (WHO, 2024), with minor adjustments to include all continental countries and to ensure complete geographic coverage of the African continent. For example, several northern and eastern African countries that are geographically part of Africa but are classified in the WHO Eastern Mediterranean region were reassigned to their respective continental subregions to better reflect geographic boundaries (see the Supplement for details).
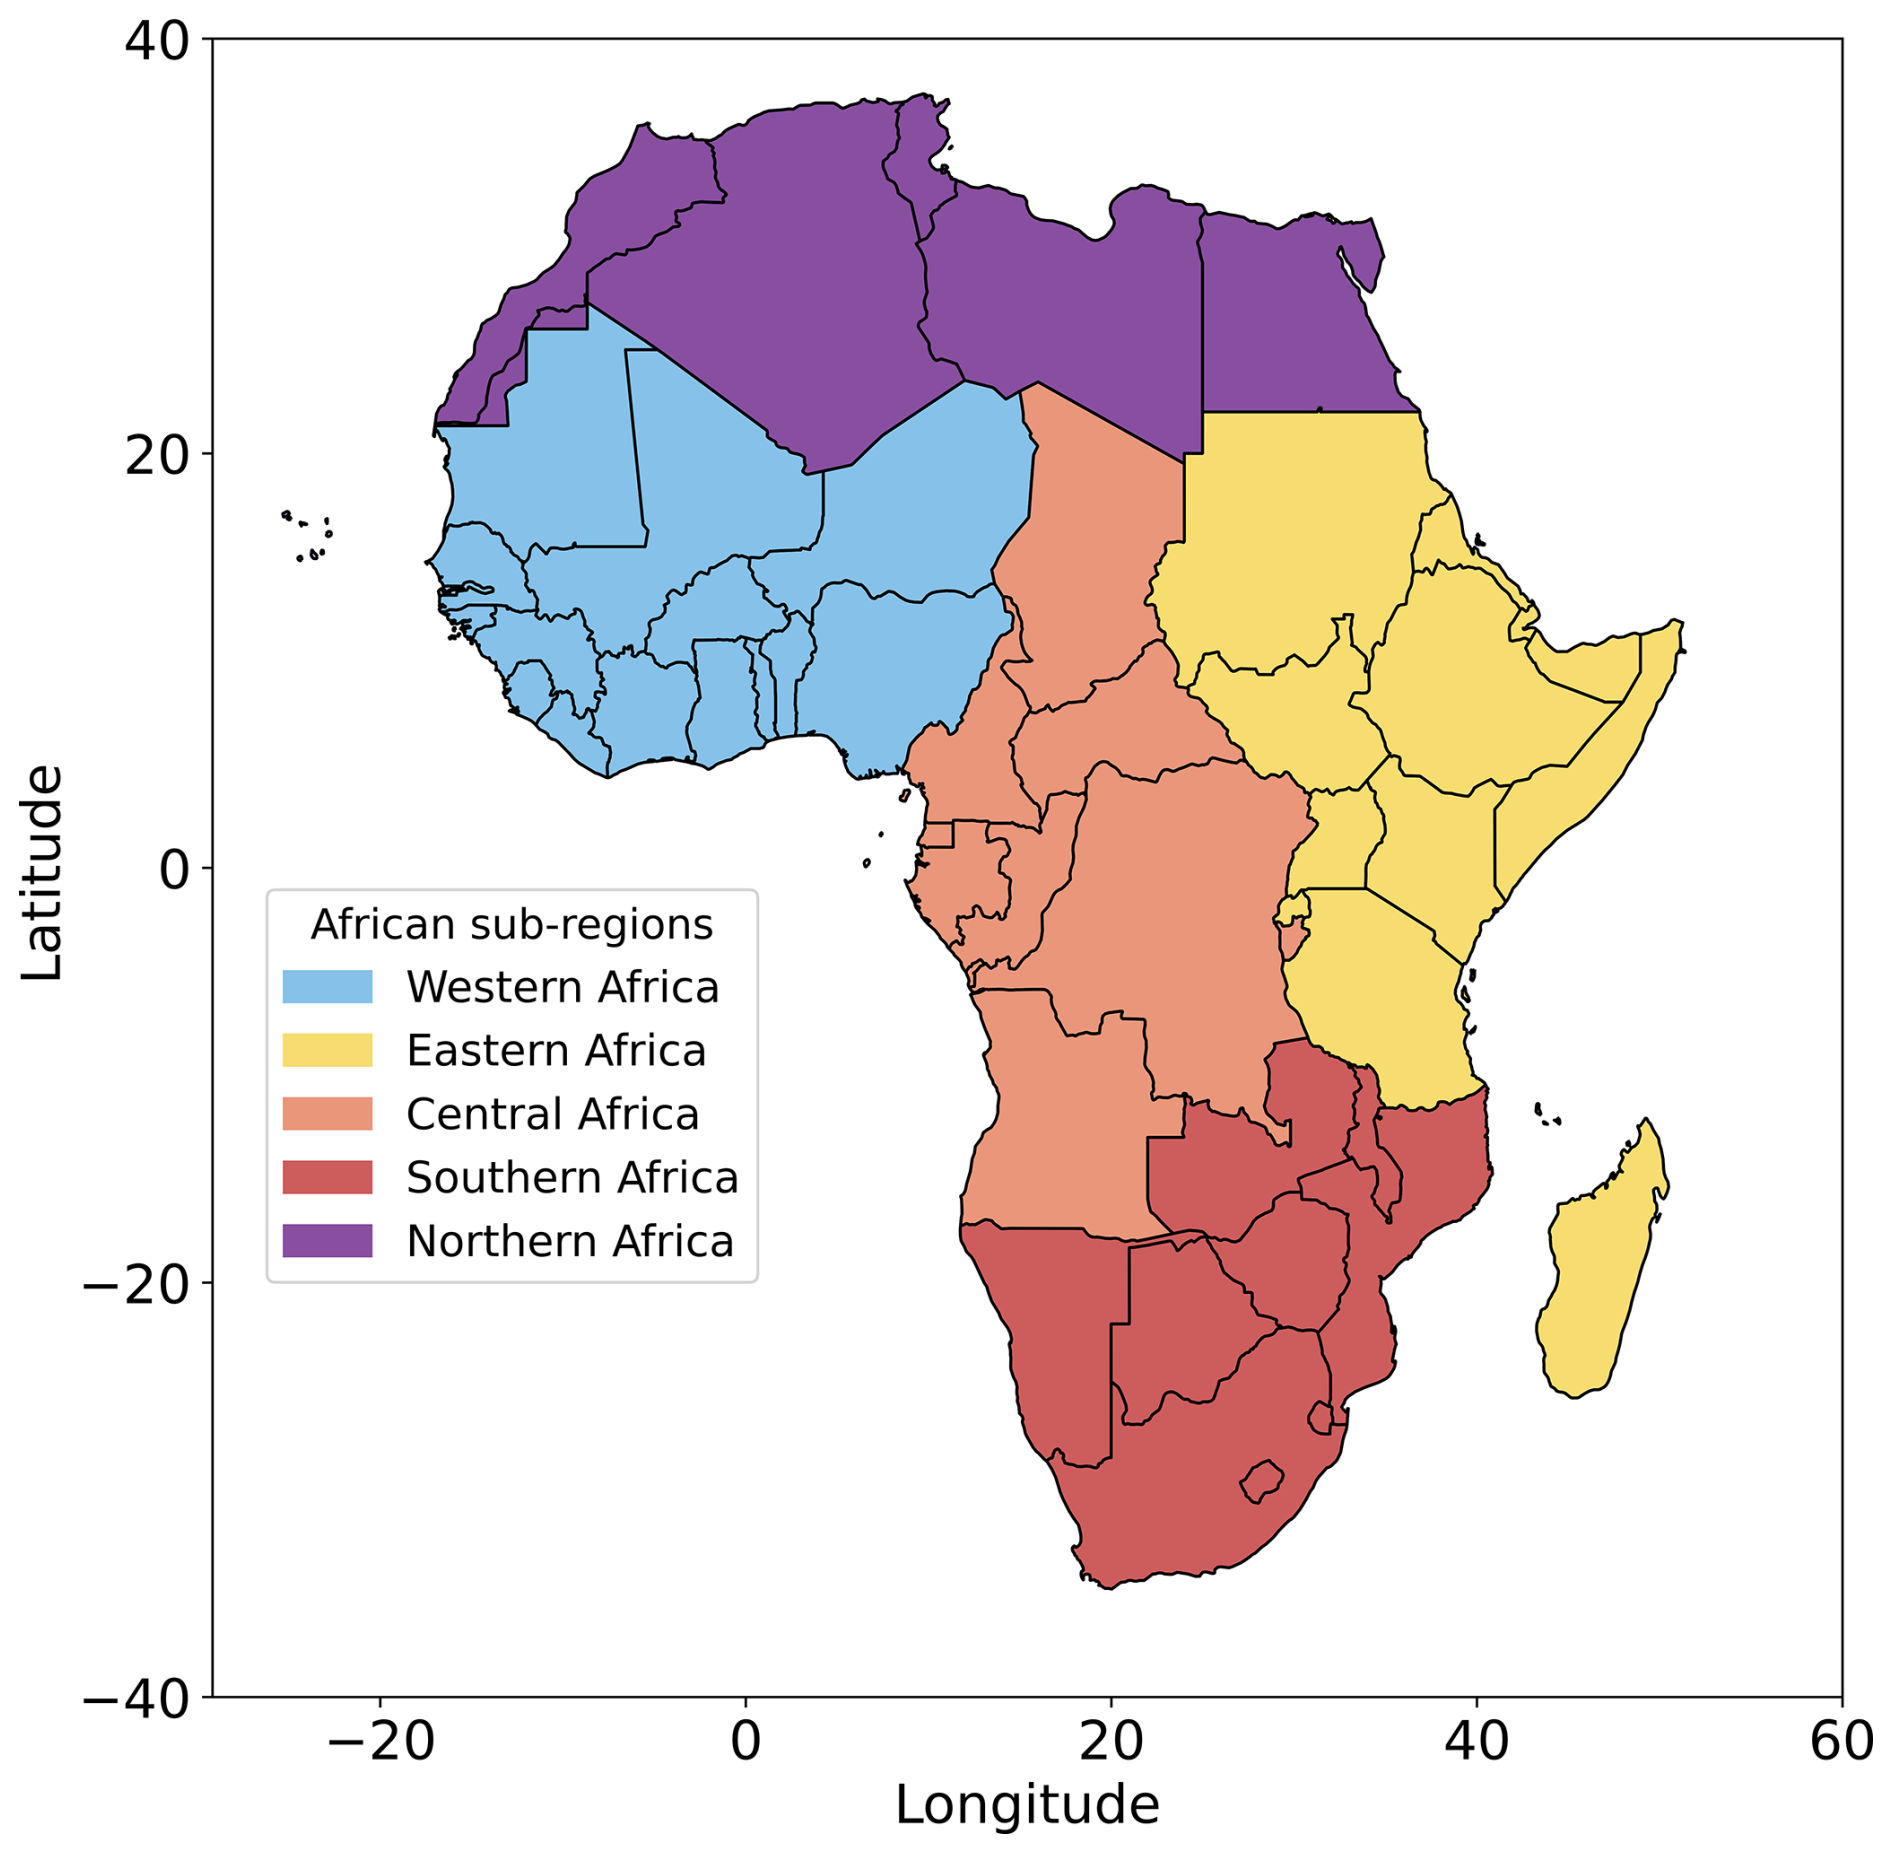
Figure 1The study domain with regional definitions.
2.2 Emissions
We use both baseline (2015–2018) emissions and projected emissions for the year 2050 from 10 available pathways:
-
SSP1-1.9, SSP2-4.5, SSP3-7.0, and SSP5-8.5 (hereafter referred to as SSP119, SSP245, SSP370, and SSP585, respectively) (Riahi et al., 2017);
-
ECLIPSE version 6b (ECL6) Current Legislation (ECL6 CLE), ECL6 Maximum Feasible Reduction (ECL6 MFR), and ECL6 Sustainable Development Scenario (ECL6 SDS) (IIASA, 2024);
-
UNEP Baseline (UNEP BASE), UNEP Short-Lived Climate Pollutants (UNEP SLCP), and UNEP Agenda 2063 (UNEP 2063) scenarios (UNEP, 2022).
Gidden et al. (2019) provide gridded SSP air pollution emissions from 2015 to 2100 across sectors, including residential, industrial, energy, transportation, waste, agriculture, solvents, and international shipping, at a spatial resolution of 0.5° latitude by 0.5° longitude. The SSP emissions include the following species: carbon dioxide (CO2), methane (CH4), carbon monoxide (CO), nitrogen oxides (NOx), SO2, non-methane volatile organic compounds (NMVOCs), organic carbon (OC), and ammonia (NH3). SSP119 represents a scenario with rigorous air pollution control, low climate forcing, and minimal challenges in mitigation and adaptation, while SSP370 is marked by weak air pollution control, high climate forcing, and significant challenges in both mitigation and adaptation (Riahi et al., 2017). SSP245 serves as an intermediate pathway, while SSP585 is characterized by very high climate forcing and strong air pollution control, along with high socio-economic challenges for mitigation and low socioeconomic challenges for adaptation (O'Neill et al., 2017).
ECLIPSE version 6b covers the years 1990–2050 and includes gridded aerosol and reactive gas emissions at 5- and 10-year intervals, provided at a spatial resolution of 0.5° latitude by 0.5° longitude. It also includes several other updates over earlier ECLIPSE versions, such as improved regional resolution, particularly for Africa; updates to legislation and historical data; and revised gridding patterns for various sectors, including power plants, flaring, transportation, and industry (IIASA, 2024). ECL6 includes emissions for a wide range of species: SO2, NOx, NH3, NMVOC, BC, OC, organic matter (OM), PM2.5, PM10, CO, and CH4. The ECL6 CLE scenario projects future air pollution and climate change impacts based on the continuation of current legislation and existing regulatory frameworks, while the ECL6 SDS scenario integrates ambitious air pollution controls with broader Sustainable Development Goals (SDGs), aiming to achieve significant co-benefits for health and climate. The ECL6 MFR scenario estimates the potential reductions in air pollution, achievable through the implementation of all available advanced technologies and practices. We used the 2016 ECL6 emissions as the baseline for calculating future changes in ECLIPSE.
A recent UNEP report provides a comprehensive assessment of the interactions between air pollution and climate change in Africa (UNEP, 2022), bringing a unique focus to emission scenarios specifically for Africa for the first time. This assessment utilizes the Low Emissions Analysis Platform (LEAP) system, a prominent software tool for integrated energy policy planning, emissions reduction, and climate change mitigation evaluations (LEAP, 2021). The UNEP scenarios are provided at a spatial resolution of 0.5° latitude by 0.5° longitude and include emissions of BC, CH4, and hydrofluorocarbons (HFCs). We used the three UNEP scenarios: baseline, SLCP, and Agenda 2063 to provide emissions for 2018 and 2050. The baseline scenario assumes that the energy, agricultural, and waste sectors will continue their current paths and that no new policies will be developed. In contrast, the SLCP scenario calls for the implementation of mitigation measures that specifically target warming SLCPs, such as BC (UNEP, 2022). Importantly, this scenario does not address SO2 emissions, which have a cooling effect (UNEP, 2022). Most of the actions in this scenario are of a technological nature, such as advances in technology and fuels. The Agenda 2063 scenario is a more ambitious scenario, which concentrates on mitigating measures that more widely accomplish the objectives of the SDGs and the African Union Commission (AUC) Agenda 2063 (UNEP, 2022). This scenario begins with the SLCP measures from the previous scenario and then adds both technical and behavioral mitigating mechanisms that lead to greater transformative change.
These 10 scenarios were selected to span a broad range of plausible futures, capturing variation in socioeconomic development trajectories (SSPs), explicit assumptions about air pollution policy ambition and implementation (ECLIPSE), and Africa-specific development priorities (UNEP). This diverse set enables a comprehensive assessment of the potential climate and health impacts of anthropogenic aerosol emissions across Africa. All emission datasets used share a common horizontal resolution of 0.5° latitude by 0.5° longitude, facilitating direct comparison and integration across scenarios. See Table S1 in the Supplement for a summary of the emission scenarios and their characteristics.
Since the UNEP emissions are provided only for the African domain, we used SSP245 emissions for the rest of the world. As part of this, we also merged UNEP sector categories to align with those in the SSPs. Specifically, this means that the UNEP residential, services, and agricultural energy sectors and unspecified categories were merged into one residential category; industry and industrial processes were merged into industry; electricity, oil, gas, and charcoal were merged into energy; and livestock and crop production were merged into agriculture. Transport and waste are provided as individual categories in both the SSP and UNEP scenarios. International shipping is not provided by UNEP, and we therefore used SSP245 emissions.
2.3 OsloCTM3
OsloCTM3 is a global three-dimensional chemical transport model (CTM), driven by three-hourly meteorological forecast data from the European Centre for Medium-Range Weather Forecasts (ECMWF) Open Integrated Forecast System (OpenIFS) (Lund et al., 2018, 2019; Søvde et al., 2012). These forecasts are generated daily, starting with a 12 h spin-up period beginning from a noon analysis of the previous day, which are then combined to create a uniform dataset for an entire year (Søvde et al., 2012). The model is run in a 2.25° latitude by 2.25° longitude horizontal resolution and includes 60 vertical levels, with the highest level centered at 0.1 hPa. Although this horizontal resolution is relatively coarse, the OsloCTM3 model is well suited for long-term, large-scale simulations of atmospheric composition. It includes detailed aerosol chemistry and has been extensively applied in both global and regional studies (Aamaas et al., 2017; Lund et al., 2017, 2019; Søvde et al., 2012). OsloCTM3 simulates atmospheric concentrations of trace gases and all the main climate-relevant aerosol species (black carbon, primary and secondary organic aerosol, secondary inorganic aerosol, sea salt, and dust). The model description and evaluation of simulated aerosol distributions have been documented in Lund et al. (2018, 2019).
2.4 Experiments
For each case, the model is run for 18 months, discarding the first 6 months as spin-up. Meteorological data from the year 2010 OpenIFS were used for all simulations of the baseline and future, with no feedback from climate change or variations in natural aerosols. This allows us to isolate the impact of anthropogenic emissions on air quality from the impacts of future climate changes on aerosols and trace gases. The model is initialized with fields including temperature, precipitation, relative humidity, pressure, cloud water, boundary layer turbulence, and advective and convective mass fluxes. We performed simulations using the ECLIPSE and UNEP emissions. We use data from experiments with SSP119, SSP245, and SSP370 emissions performed by Lund et al. (2019) and perform an additional simulation using SSP585 emissions for this study.
Results from simulations with future (2050) emissions are compared to simulations with the corresponding baseline emissions. The available emission scenarios have somewhat different baseline years: 2015 for the SSPs, 2016 for the ECL6 emissions, and 2018 for the UNEP emissions. The difference in simulated PM2.5 concentrations between these three base years is 2 % on a continent-wide annual average (Fig. S3 in the Supplement), suggesting limited influence on our analysis from the differing time period and inventories considered. For this we use additional data from simulations with the CEDS21 emissions as input, to capture the most recent global emission inventory. These simulations were performed by and documented in Lund et al. (2023); however, neither model validation nor a dedicated Africa focus was part of that study. PM2.5 was calculated as the sum of individual fine-mode aerosol species, namely BC, primary and secondary organic aerosol (POA, SOA), sulfate (SO4), dust, sea salt, nitrate (NO3), and ammonium (NH4). The fine mode is defined with an upper cut-off at 2.5 µm, which corresponds directly to PM2.5.
We analyzed the differences in population-weighted PM2.5 between the 2050 emissions and their respective baselines depending on the scenario as described above. Annual global population data at a 0.5° latitude by 0.5° longitude resolution, which is an input in the Inter-Sectoral Impact Model Intercomparison Project (ISIMIP2b) simulations (Jones and O'Neill, 2016), was used in our analysis. Both the OsloCTM3 PM2.5 data and the population data were regridded to a 1° latitude by 1° longitude resolution using bilinear interpolation prior to calculating population-weighted values. The downscaling provides sufficient spatial resolution to capture major spatial variations in both PM2.5 concentrations and population distributions. A comparison of modeled and observed surface PM2.5 shows that the downscaled 1° latitude by 1° longitude resolution performs slightly better than the native 2.25° latitude by 2.25° longitude model resolution, when averaged over Africa. However, city-level performance varies by location (Fig. S1). The population-weighted values were computed on a country-by-country basis by summing the products of population and PM2.5 concentration at the grid level within each country and then dividing by the total population of that country (Chowdhury et al., 2019; Southerland et al., 2022). Grid cells were assigned to countries based on whether their center point lies within national boundaries, using a shapefile of administrative boundaries from the Natural Earth dataset (Natural Earth, 2025). SSP2 population data were used for the UNEP and ECLIPSE cases, as SSP2 aligns closely with the UN population projections (UNEP, 2022), while the respective SSP population projections were matched for the other SSP scenarios. To assess sensitivity to the population dataset, we repeated the calculations using SSP2 population data for all scenarios. The resulting population-weighted PM2.5 values differed by less than 0.1 µg m−3 on average, with no change to the relative scenario rankings or spatial patterns. This indicates that the population-weighted PM2.5 estimates are not sensitive to the choice of SSP population dataset.
Using offline radiative transfer calculations with a multi-stream model and using the discrete ordinate method (Myhre et al., 2013; Stamnes et al., 1988), we derived the aerosol optical depth (AOD) and the instantaneous top-of-the-atmosphere radiative forcing due to aerosol–radiation interactions resulting from changes in anthropogenic emissions. We also include an estimate of the radiative forcing of aerosol–cloud interactions using a parameterization based on Quaas et al. (2006) to account for the change in cloud droplet concentration resulting from anthropogenic aerosols, which alter the cloud effective radius and thus the optical properties of the clouds. The method has been used in several previous studies (e.g., Lund et al., 2019, 2023; Myhre et al., 2013, 2017). Note that this method excludes any contributions from cloud lifetime changes, which are typically estimated to be smaller than cloud albedo effects but not negligible (Stjern et al., 2016).
2.5 Observations
We evaluated OsloCTM3, driven by CEDS21 anthropogenic emissions, against PM2.5 surface observations from various US embassy locations in Africa for the year 2019, as a first-order sanity check. The observed data were obtained from the AirNow database (U.S. Environmental Protection Agency (EPA), 2024). The US embassy monitors are high-quality reference instruments that provide publicly available, quality-assured PM2.5 data. Located in major African cities, they offer reasonable spatial coverage of the most populated and emission-relevant regions in Africa and are often used as a benchmark for calibrating local monitoring networks. Additionally, we compared the model's PM2.5 estimates with high-resolution satellite-derived PM2.5 estimates, which were obtained from combined AOD retrievals from the National Aeronautics and Space Administration (NASA) MODIS, Multi-angle Imaging SpectroRadiometer (MISR), and Sea-viewing Wide Field-of-view Sensor (SeaWiFS) instruments, integrated with the Goddard Earth Observing System Chemistry (GEOS-Chem) transport model. These data are available in the satellite-derived PM2.5 archive (Van Donkelaar et al., 2021). The model's performance was assessed using the coefficient of determination (R2), root mean squared error (RMSE), and mean absolute error (MAE).
We evaluated the modeled AOD from CEDS21 against data retrieved from the MODIS instrument aboard the Aqua satellite, specifically the MYD08_D3_V6.1 release, which was accessed via the NASA Giovanni interface for the year 2019. The MYD08_D3 product is a gridded daily global dataset from MODIS (Platnick et al., 2015). It provides daily averaged values for atmospheric parameters on a 1° latitude by 1° longitude resolution, including aerosol properties, total ozone, atmospheric water vapor, cloud characteristics, and atmospheric stability indices (Platnick et al., 2015). For our analysis, we used the combined dark target and deep blue AOD at 550 nm from this release.
2.6 Health impact assessment
In combination with the generated data on ambient PM2.5 exposure, we applied the MR-BRT (meta-regression-Bayesian, regularized, trimmed) exposure-response function (Murray et al., 2020; Pozzer et al., 2023), which was also used in previous studies (Chowdhury et al., 2022, 2024) and the most recent iteration of the Global Burden of Disease (GBD) study (GBD, 2021). To account for uncertainty, we drew multiple samples from the posterior distribution of the exposure-response function. We assumed a theoretical minimum risk exposure level (TMREL) of 2.4 µg m−3, held constant across all locations and scenarios (Murray et al., 2020). Below this threshold, no further reduction in mortality is assumed. The MR-BRT function was developed using global cohort data, including studies from high-exposure settings, such as Li et al. (2018), Yang et al. (2018), Yin et al. (2017), and Yusuf et al. (2020), enhancing its relevance for regions with high PM2.5 levels, such as Africa (Chowdhury et al., 2022). Additionally, we incorporated uncertainty in baseline mortality rates reported by the respective countries. Full methodological details can be found in Chowdhury et al. (2020) and are not repeated here.
Using the cause-specific exposure-response function, we estimated excess deaths from ischemic heart disease (IHD), stroke (both ischemic and hemorrhagic), chronic obstructive pulmonary disease (COPD), lung cancer (LC), and type II diabetes (T2DM) among adults (aged 25 and above), as well as acute lower respiratory tract infections (ALRTIs) among children (under 5 years old). The excess death burden was calculated at a 25 km by 25 km spatial resolution by interpolating the modeled ambient concentration data, and the estimates were stratified by age and disease category, following the approach of previous studies (Chowdhury et al., 2020, 2024):
RR is the relative risk, where c, a, and d denote the concentration of PM2.5, population age, and disease, respectively. BMa,d is the baseline mortality rate per 100 000 population, and Pa is the exposed population in a grid by age. Each variable is a function of specific dimensions: RR varies with concentration of PM2.5, age group, and disease; BM varies with age group and disease; and population varies by age group and location.
Excess deaths were estimated separately for adults and children at each 5-year interval. RR were derived using MR-BRT functions for all diseases. Age-specific RRs for IHD and stroke are obtained using MR-BRT. For LC, T2-DM, and COPD, uniform RRc,d were used across all age groups among adults. BMa,d was obtained from the GBD (GBD, 2024) for all countries in Africa for the years 2015, 2016, and 2018. For 2050, we use the projected baseline under the SSP scenario mortality rates generated in a previous study by combining information from GBD and International Futures (Yang et al., 2023). We considered BM to remain uniform within a country at 25 km by 25 km resolution by age and disease. Age distributions at 5-year intervals (adults >25 years) and <5 years for children were obtained from the SSP database (Riahi et al., 2017), which are then merged with the gridded population data at 25 km by 25 km horizontal resolution under the respective SSP scenarios to obtain the age-specific population (Pa) at each 25 km by 25 km grid. For the concentration data generated using SSP emissions, we applied the respective SSP projections for baseline mortality and population. For other emission scenarios (UNEP and ECL6), we utilize the SSP2 projections.
3.1 Projected air pollution emission trends
There is a large spread and regional heterogeneity in projected air pollution emissions across Africa and its subregions, as shown in Fig. 2 for BC and SO2. Similar variability is seen for OC and NOx in Fig. S4. This variability suggests that the differences in local regulations, technological advancements, and economic development trajectories can substantially influence emission trends. As a result, regional policy differences may play a crucial role in reducing uncertainties in emission projections. While we focus on the year 2050, we here show the full UNEP and SSP time series to illustrate that the spread in emissions continues through the century. We note that there are other scenarios in the ECL6 and SSP databases, but the ones considered in the present study span the large range shown in Fig. 2.
BC emissions in Africa are projected to increase under the SSP370, SSP585, SSP245, UNEP Baseline, and ECL6 CLE scenarios by 2050; and to decrease under the SSP119, UNEP SLCP, UNEP 2063, ECL6 MFR, and ECL6 SDS scenarios. After mid-century, BC emissions in Africa are projected to decline under the SSP245 and SSP585 scenarios, driven by a reduction in residential fossil fuel use (Turnock et al., 2020). The largest increases in BC emissions are projected under the UNEP Baseline and SSP370 scenarios, with increases of 2116 kt yr−1 (109 %) and 1143 kt yr−1 (47 %), respectively. In contrast, the largest declines in BC emissions are projected under the ECL6 SDS and SSP119 scenarios, with reductions of 2 146 kt yr−1 (93 %) and 1992 kt yr−1 (82 %), respectively (Table S3). OC and NOx exhibit similar trends (Fig. S4); however, OC decreases under the SSP585 scenario.
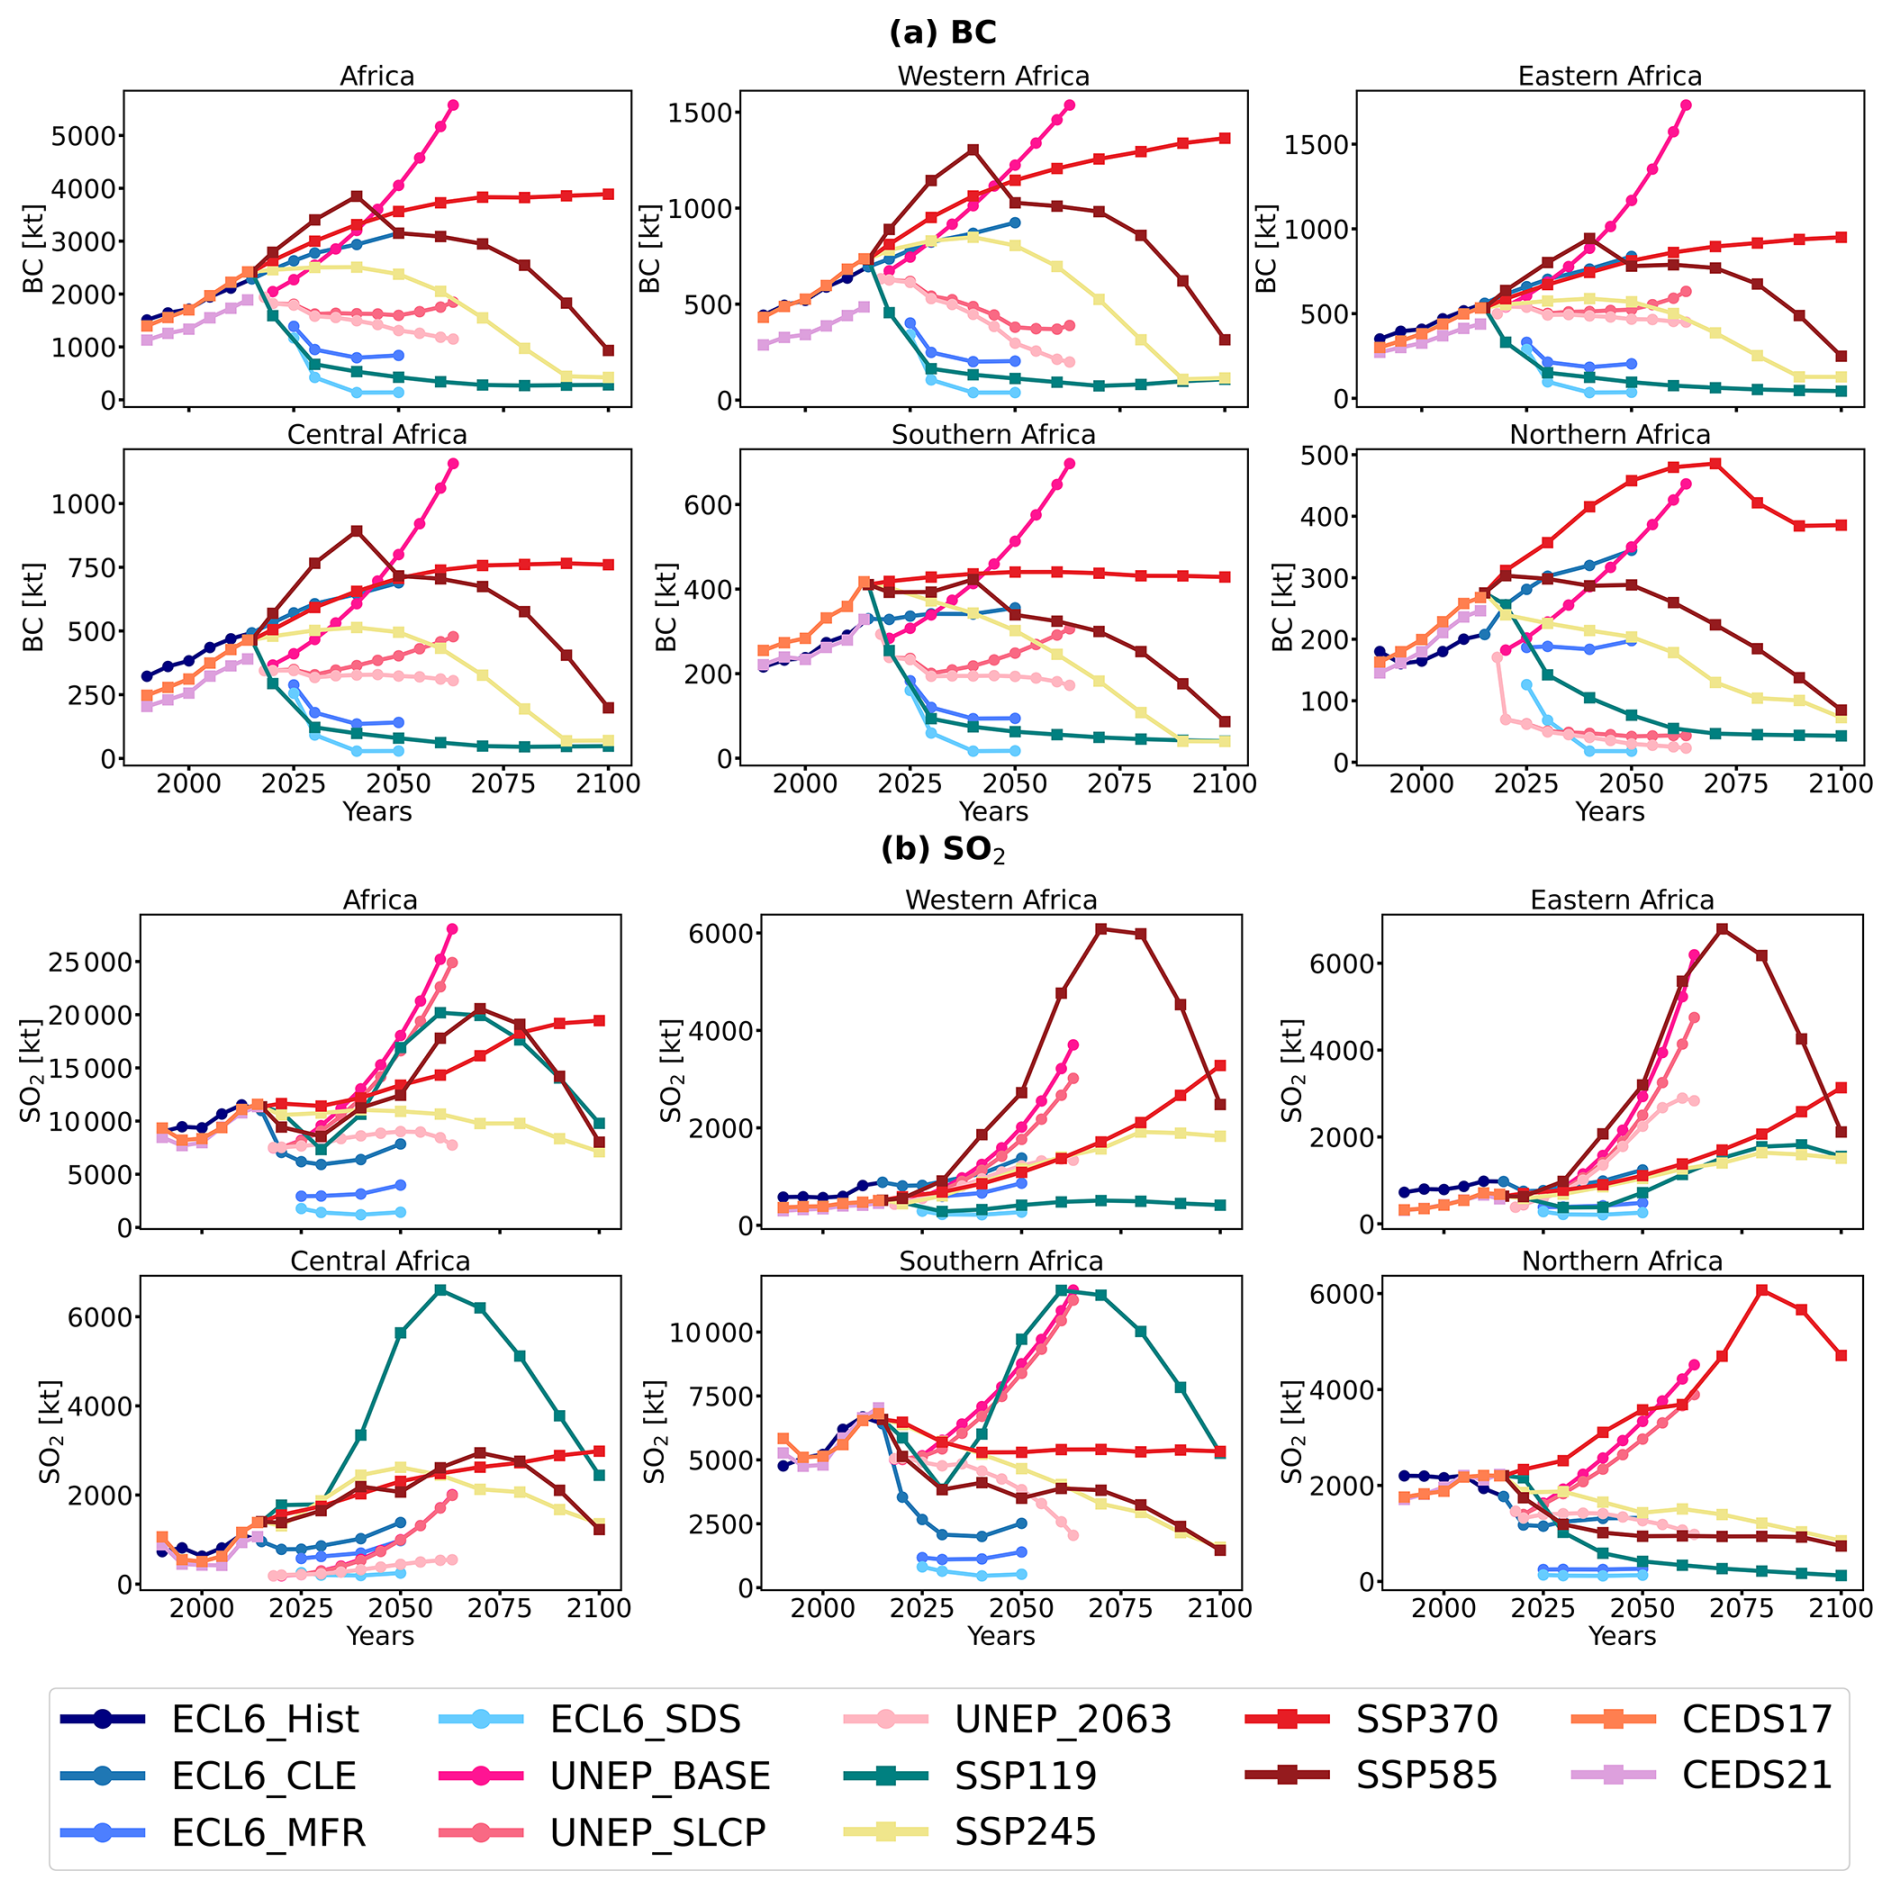
Figure 2Large spread and regional heterogeneity in projected air pollution emissions in Africa, here shown for (a) BC and (b) SO2. Note: the y-axis scales vary between regions. ECL6_Hist represents historical emissions from the ECLIPSE version 6b inventory. CEDS17 and CEDS21 represent historical emissions from the CEDS versions 2017 and 2021, respectively.
For SO2 emissions, the overall pattern in Africa shows projected increases under all scenarios by 2050 except for the ECLIPSE scenarios, with declines after mid-century under SSP119, SSP245, and SSP585. The largest increases in SO2 emissions are projected under the UNEP baseline and UNEP SLCP scenarios, with increases of 10 550 kt yr−1 (142 %) and 9095 kt yr−1 (121 %), respectively. The largest decreases, meanwhile, are projected under the ECL6 SDS and ECL6 MFR scenarios, with reductions of 9561 kt yr−1 (87 %) and 7011 kt yr−1 (64 %), respectively, by 2050. SO2 emissions increase dramatically under UNEP SLCP by 2050 as this is a scenario focusing on reducing short-lived climate pollutants with an overall climate warming effect, such as BC – without addressing SO2 emissions (UNEP, 2022). The UNEP SLCP scenario envisions a transition where 90 % of wood and charcoal use switches to efficient stoves by 2063 in urban areas, with similar shifts in rural areas. It also assumes a gradual transition from gas and liquefied petroleum gas (LPG) to efficient electricity, starting in 2030 (UNEP, 2022). The UNEP Agenda 2063 scenario shows a decline in both BC and SO2 emissions by 2050. This scenario assumes a 1.4 % annual decrease in energy intensity for household energy use (compared to constant levels in the baseline), a 93 % improvement in refrigerator efficiency by 2063, and a doubling of air conditioner efficiency (UNEP, 2022). Additionally, it assumes that 30 % of passenger kilometers will shift from cars to buses, and 25 % will switch to cycling.
Certain regions are projected to maintain high SO2 emissions even under some stringent scenarios. For instance, in central Africa and southern Africa, SO2 emissions are projected to increase by 303 % and 47 % by 2050 under the SSP119 scenario, driven by reliance on coal during the transition period (Wells et al., 2024). Under the SSP585 scenario, SO2 emissions are projected to increase by 429 % and 402 % in western Africa and eastern Africa by 2050, driven by energy and industrial emissions (Shindell et al., 2022). By 2050, BC and SO2 emissions in northern Africa are projected to increase substantially under SSP370. The increases in subregional BC, SO2, OC, and NOx emissions are projected to decline after mid-century under most SSP scenarios, with the exception of SSP370, where emissions increase in western Africa but continue to decrease in southern Africa. Under the UNEP Baseline scenario, BC, OC, and NOx emissions are projected to be largest in western Africa and eastern Africa, followed by central Africa, southern Africa, and northern Africa, by 2050, while SO2 emissions are projected to be largest in southern Africa, followed by eastern Africa, northern Africa, western Africa, and central Africa (Table S3).
3.2 Sectoral contributions to air pollution emissions
In many cases, the emission source distributions are distinct, with notable discrepancies in sectoral shares across regions, as exemplified in Figs. 3 and 4 for the increasing scenarios SSP370, ECL6 CLE, and UNEP Baseline emissions in 2020 and 2050. For instance, in eastern Africa, the UNEP Baseline scenario attributes 58 % of 2020 BC emissions to the residential sector, while the ECL6 CLE scenario attributes 75 % and SSP370 attributes 84 %. Different socioeconomic projections, technological advancements, and policies influence the regional emission sources and sectoral contributions. Consequently, the discrepancies in sectoral emission distributions among UNEP, SSPs, and ECL6 highlight the need for accurate activity data, emissions factors, and harmonization, particularly in the upcoming 7th Assessment Report of the Intergovernmental Panel on Climate Change (IPCC AR7). This is essential for ensuring consistency across integrated assessment models (IAMs) and for better constraining scenario baselines by grounding models in the most current and reliable emissions data and sectoral activity patterns.
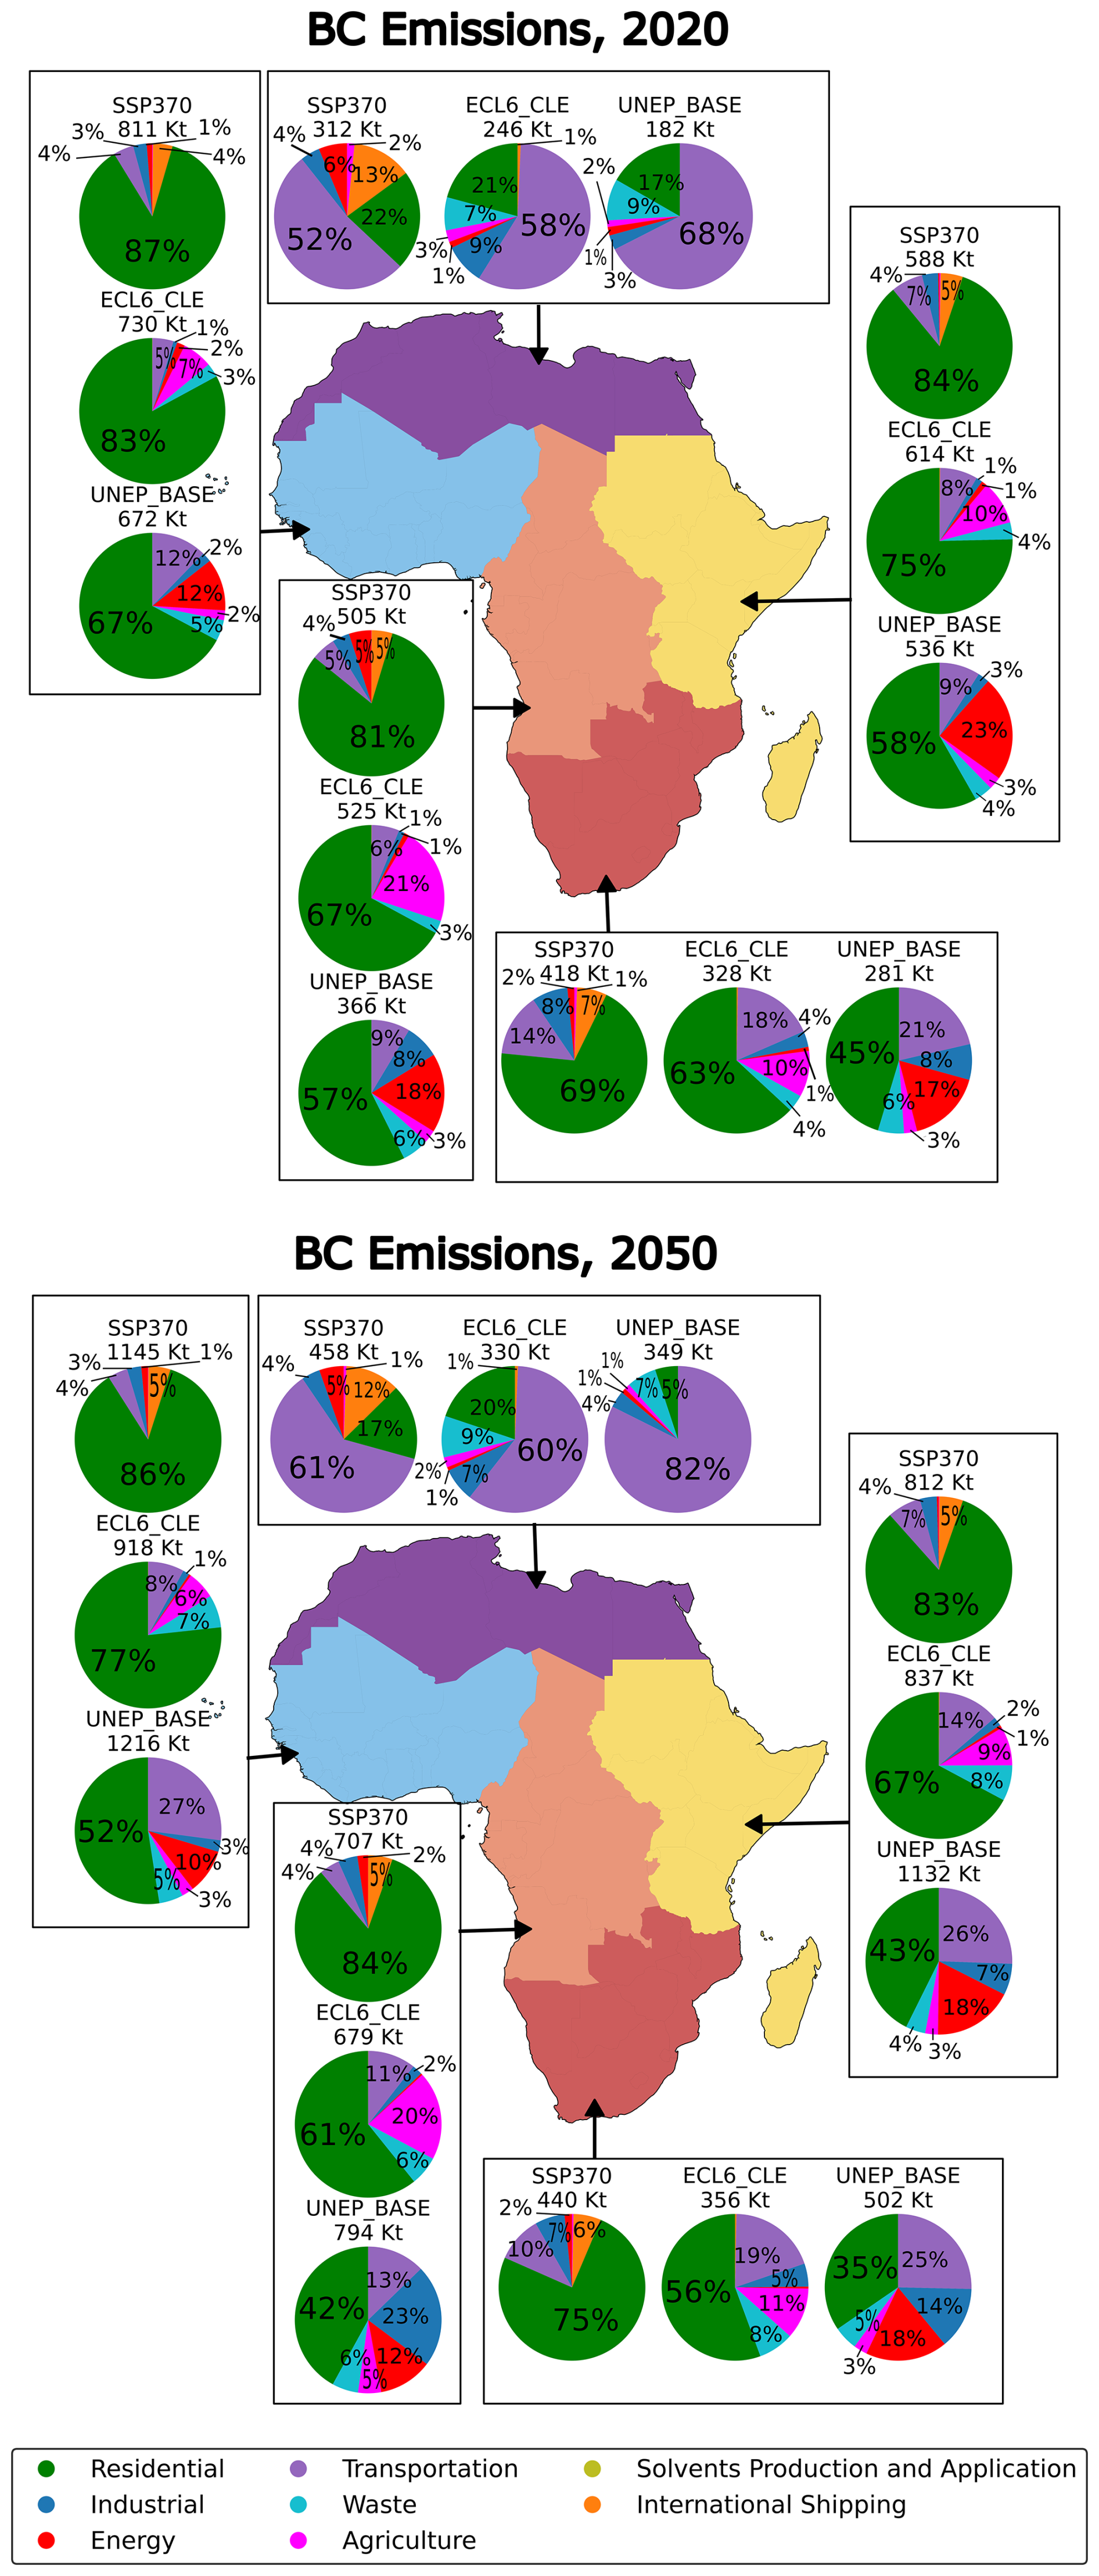
Figure 3Subregional sectoral contributions to BC emissions (kilotons per year) in 2020 and 2050 under the increasing scenarios SSP370, ECL6 CLE, and UNEP Baseline.
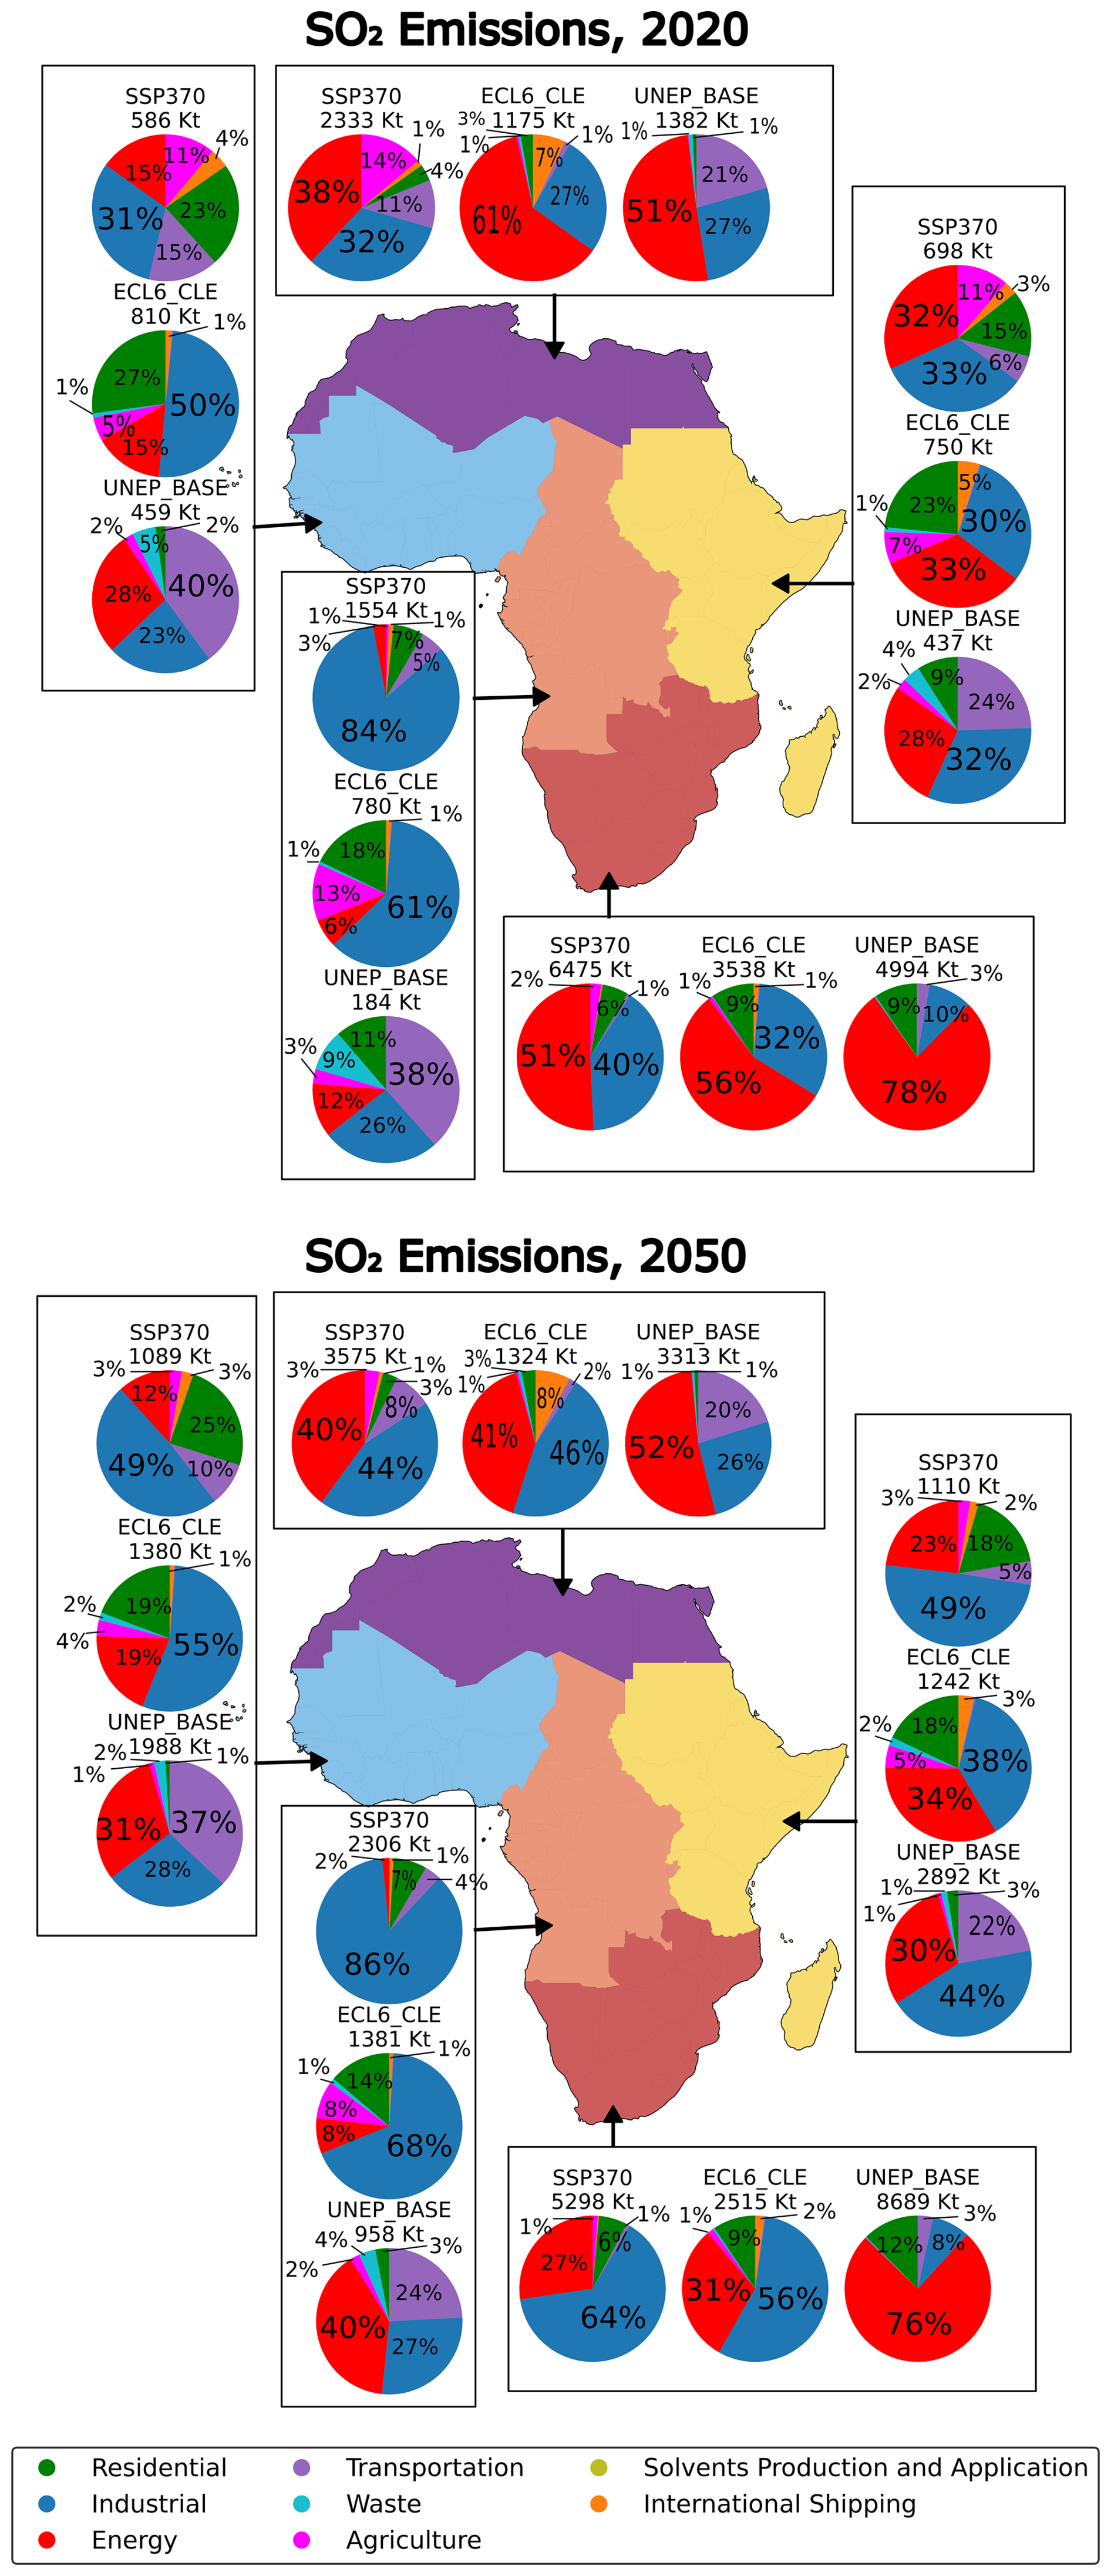
Figure 4Subregional sectoral contributions to SO2 emissions (kilotons per year) in 2020 and 2050 under the increasing scenarios SSP370, ECL6 CLE, and UNEP Baseline.
The residential sector is the largest contributor to BC emissions across sub-Saharan Africa in all increasing scenarios in 2020 and 2050. In northern Africa, BC emissions are dominated by the transportation sector across all increasing scenarios. The widespread use of clean cooking fuels, such as natural gas and liquefied petroleum gas (LPG), by the majority of the population in northern Africa (IEA, 2020) explains the comparatively lower residential emissions in this subregion. Under SSP370, the residential sector will contribute 86 % in western Africa, 84 % in central Africa, 83 % in eastern Africa, and 75 % in southern Africa, by 2050. The second-largest contributor to BC emissions change, unique to SSP370, is international shipping (5 %–12 %), which cannot be wholly attributed to African nations but may be linked to increasing trade associated with economic development. In northern Africa, the transportation sector will contribute 61 % of the total BC increase under this scenario, followed by international shipping at 12 %.
By 2050, under the ECL6 CLE scenario, the transportation and waste sectors will be the second- and third-largest contributors to BC emissions in sub-Saharan Africa, following the residential sector. In western Africa, 77 % and 8 % of BC emissions are projected to come from the residential and transportation sectors by 2050, compared to 83 % and 5 % respectively, in 2020. The sectoral contributions to emission changes (increases or decreases) in the UNEP Baseline stand in sharp contrast with SSP370, which is mainly dominated by changes in household biomass cooking. For instance, in western Africa, the transportation and residential sectors will account for 52 % and 27 % of the increase, respectively, in contrast with SSP370, which was mostly dominated by residential emission changes alone. Figures S5 and S6, presented in the Supplement, illustrate sectoral contributions to BC emissions in 2020 and 2050, respectively, across the other scenarios. In sub-Saharan Africa, the residential sector remains the dominant source of BC emissions, while in northern Africa, the transport sector contributes the most. Notably, under SSP119, SSP585, and the UNEP scenarios, sub-Saharan Africa shows an increasing share of BC emissions from the energy sector, indicating a growing influence of power generation as electrification expands across the region.
Similarly, the major sectoral contributors to SO2 emissions in each subregion of Africa are the industrial, energy, and transportation sectors, depending on the scenario (Fig. 4). By 2050, under SSP370, industrial sector SO2 emissions contribute 49 % in western Africa, 86 % in central Africa, 49 % in eastern Africa, and 44 % in northern Africa to total SO2 emissions, which hints at a rapid northward shift in Africa's industrial center. To that end, southern Africa's SO2 emissions are projected to decrease under SSP370, with the industrial sector contributing 64 % and the energy sector contributing 27 % to this reduction. A similar shift in industrial and energy sector SO2 emissions occurs in ECL6. Figures S7 and S8 show sectoral contributions to SO2 emissions in 2020 and 2050, respectively, across the other scenarios. The distribution of emissions is similar to that observed in the increasing scenarios, with Africa undergoing industrialization, except in southern Africa.
Unlike SSP370, the UNEP Baseline scenario suggests a more distributed emissions profile across the African subregions in 2050, similar to ECL6, particularly regarding transportation emissions, which are more muted in SSP370. Under the UNEP Baseline scenario, the largest sectoral contributors to emissions are projected to be the transport, energy, and industrial sectors in western Africa, central Africa, eastern Africa, and northern Africa, while in southern Africa, the energy and residential sectors are projected to be the largest contributors. Additionally, reductions in agricultural waste burning in fields in Africa by 2050 are projected under the UNEP Baseline scenario, as well as SSP370 and ECL6 CLE, due to the adoption of alternative agricultural practices, improved waste management, and emissions-reducing technologies.
In sub-Saharan Africa, across the increasing scenarios, OC emissions are predominantly from the residential sector, while NOx emissions are driven primarily by the transportation sector under SSP370 and the UNEP Baseline scenarios and by the residential sector under ECL6 CLE (see Supplement, Figs. S9 and S10).
3.3 Annual mean population-weighted PM2.5 concentrations
We validated the OsloCTM3 model against PM2.5 surface observations for 2019 and MODIS Aqua AOD data across Africa (see Sect. 2.5), finding a broad range of performance across regions. There is some disagreement between the observational datasets themselves, which should be considered when interpreting model performance. For PM2.5 surface observations, R2 values range from 0.48 to 0.76, and MAE values range from 5.7 to 23.8 µg m−3 in western and central Africa. For MODIS Aqua AOD, the validation yields an R2 of 0.36, with RMSE and MAE of 0.11 and 0.08, respectively (see Figs. S1, S2, and Table S2 for details). Overall, these validation results indicate that OsloCTM3 captures key spatial and temporal variations in PM2.5 and AOD across Africa, although with varying performance across regions.
Given the model's reasonable performance for the present day, we now examine projected changes in future PM2.5 levels. Figure 5 shows annual mean population-weighted PM2.5 concentrations across Africa in 2050 under the highest-emission scenario (UNEP Baseline) and the lowest-emission scenario (SSP119), as well as their difference. Surface PM2.5 concentrations differ by up to a factor of 2 between the highest and lowest scenario when averaged across the African continent in 2050, with markedly higher local spread. Notably, the most substantial differences between the UNEP Baseline and SSP119 are observed in Nigeria, Benin, Niger, Uganda, Ethiopia, Kenya, Democratic Republic of the Congo, and Egypt, where PM2.5 concentrations differ by as much as 20 µg m−3 (75 %) in 2050 projected populations. Most of these regions, which are characterized by high population density and industrial activity, experience elevated pollution in the UNEP scenario, highlighting the need for aggressive emission-reduction measures.
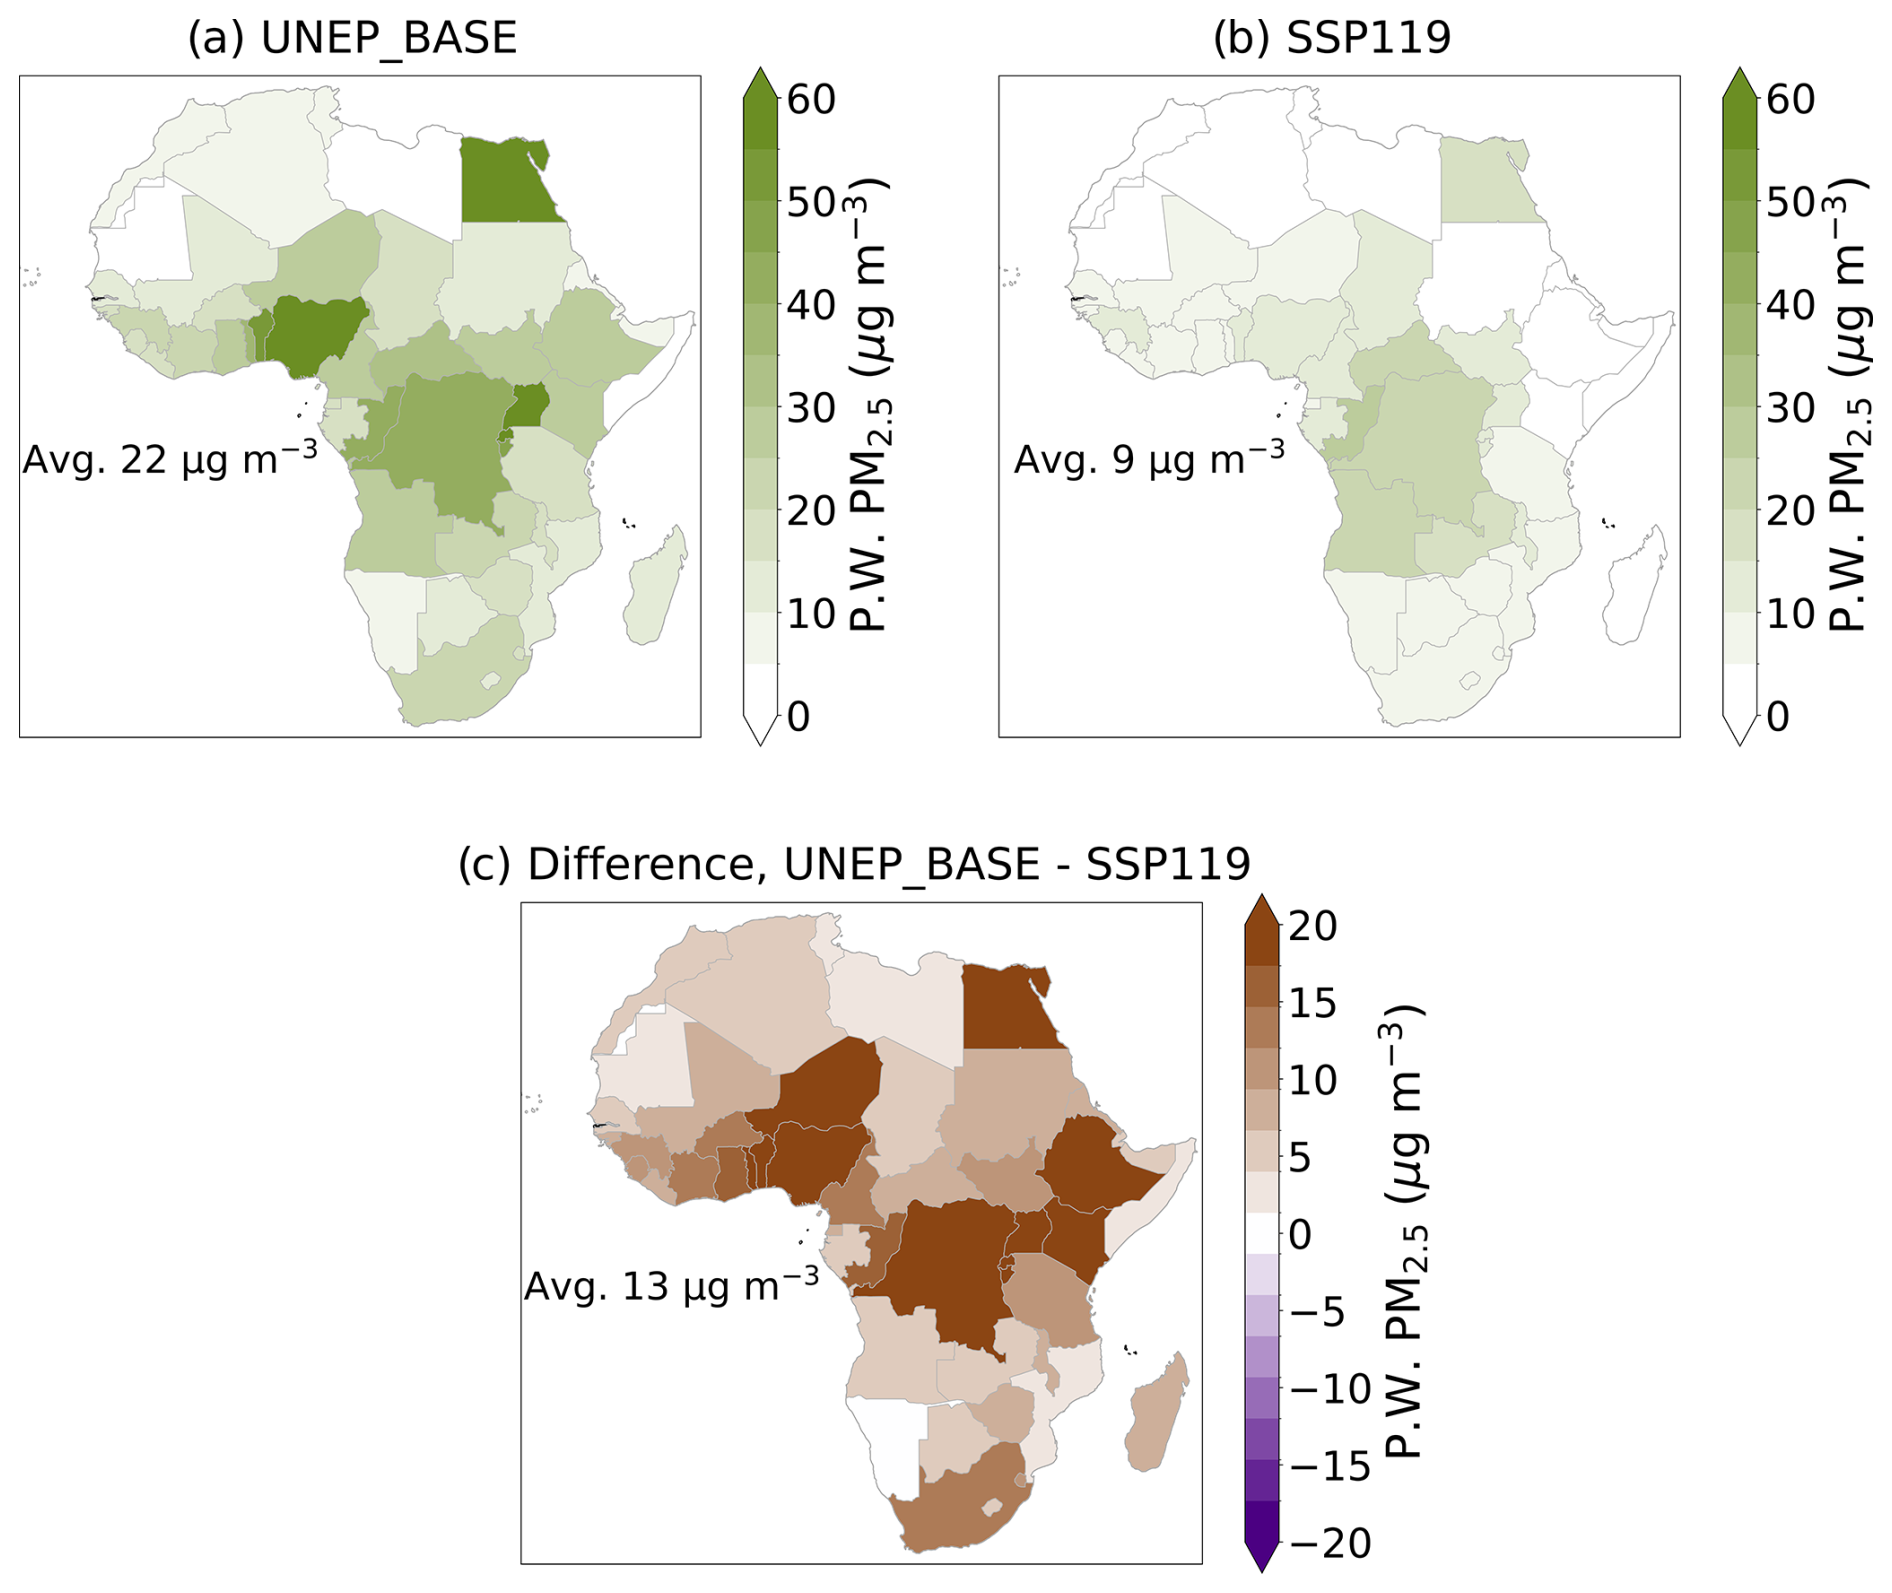
Figure 5Annual mean population-weighted PM2.5 concentrations across Africa in 2050 under (a) the highest emission scenario (UNEP Baseline), (b) the lowest emission scenario (SSP119), and (c) their difference.
Figure 6 presents regionally averaged annual mean population-weighted PM2.5 concentrations in 2050 relative to the baseline. PM2.5 concentrations are projected to increase under the UNEP Baseline, SSP370, and ECL6 CLE scenarios and decrease under the other scenarios by 2050 when averaged across the African continent. The largest increase is projected under the UNEP Baseline scenario, with an increase of up to 6 µg m−3 (37 %) in eastern Africa, while the largest decrease is projected under the ECL6 SDS scenario, with a reduction of up to 5 µg m−3 (8 %) in western Africa and 3 µg m−3 (39 %) in southern Africa. Projected annual PM2.5 concentrations in Africa follow a similar trend, with an increase of 4 µg m−3 (15 %) under the UNEP Baseline scenario and a decrease of 5 µg m−3 (20 %) under the ECL6 SDS scenario. Western, eastern, and northern Africa are projected to experience the most substantial PM2.5 exposure increase under the UNEP Baseline, SSP370, and ECL6 CLE scenarios due to increased emissions from the residential, industrial, transportation, and energy sectors. Conversely, the most substantial decreases are projected under the ECL6 SDS, ECL6 MFR, and SSP119 scenarios (Fig. 6 and Table S3).
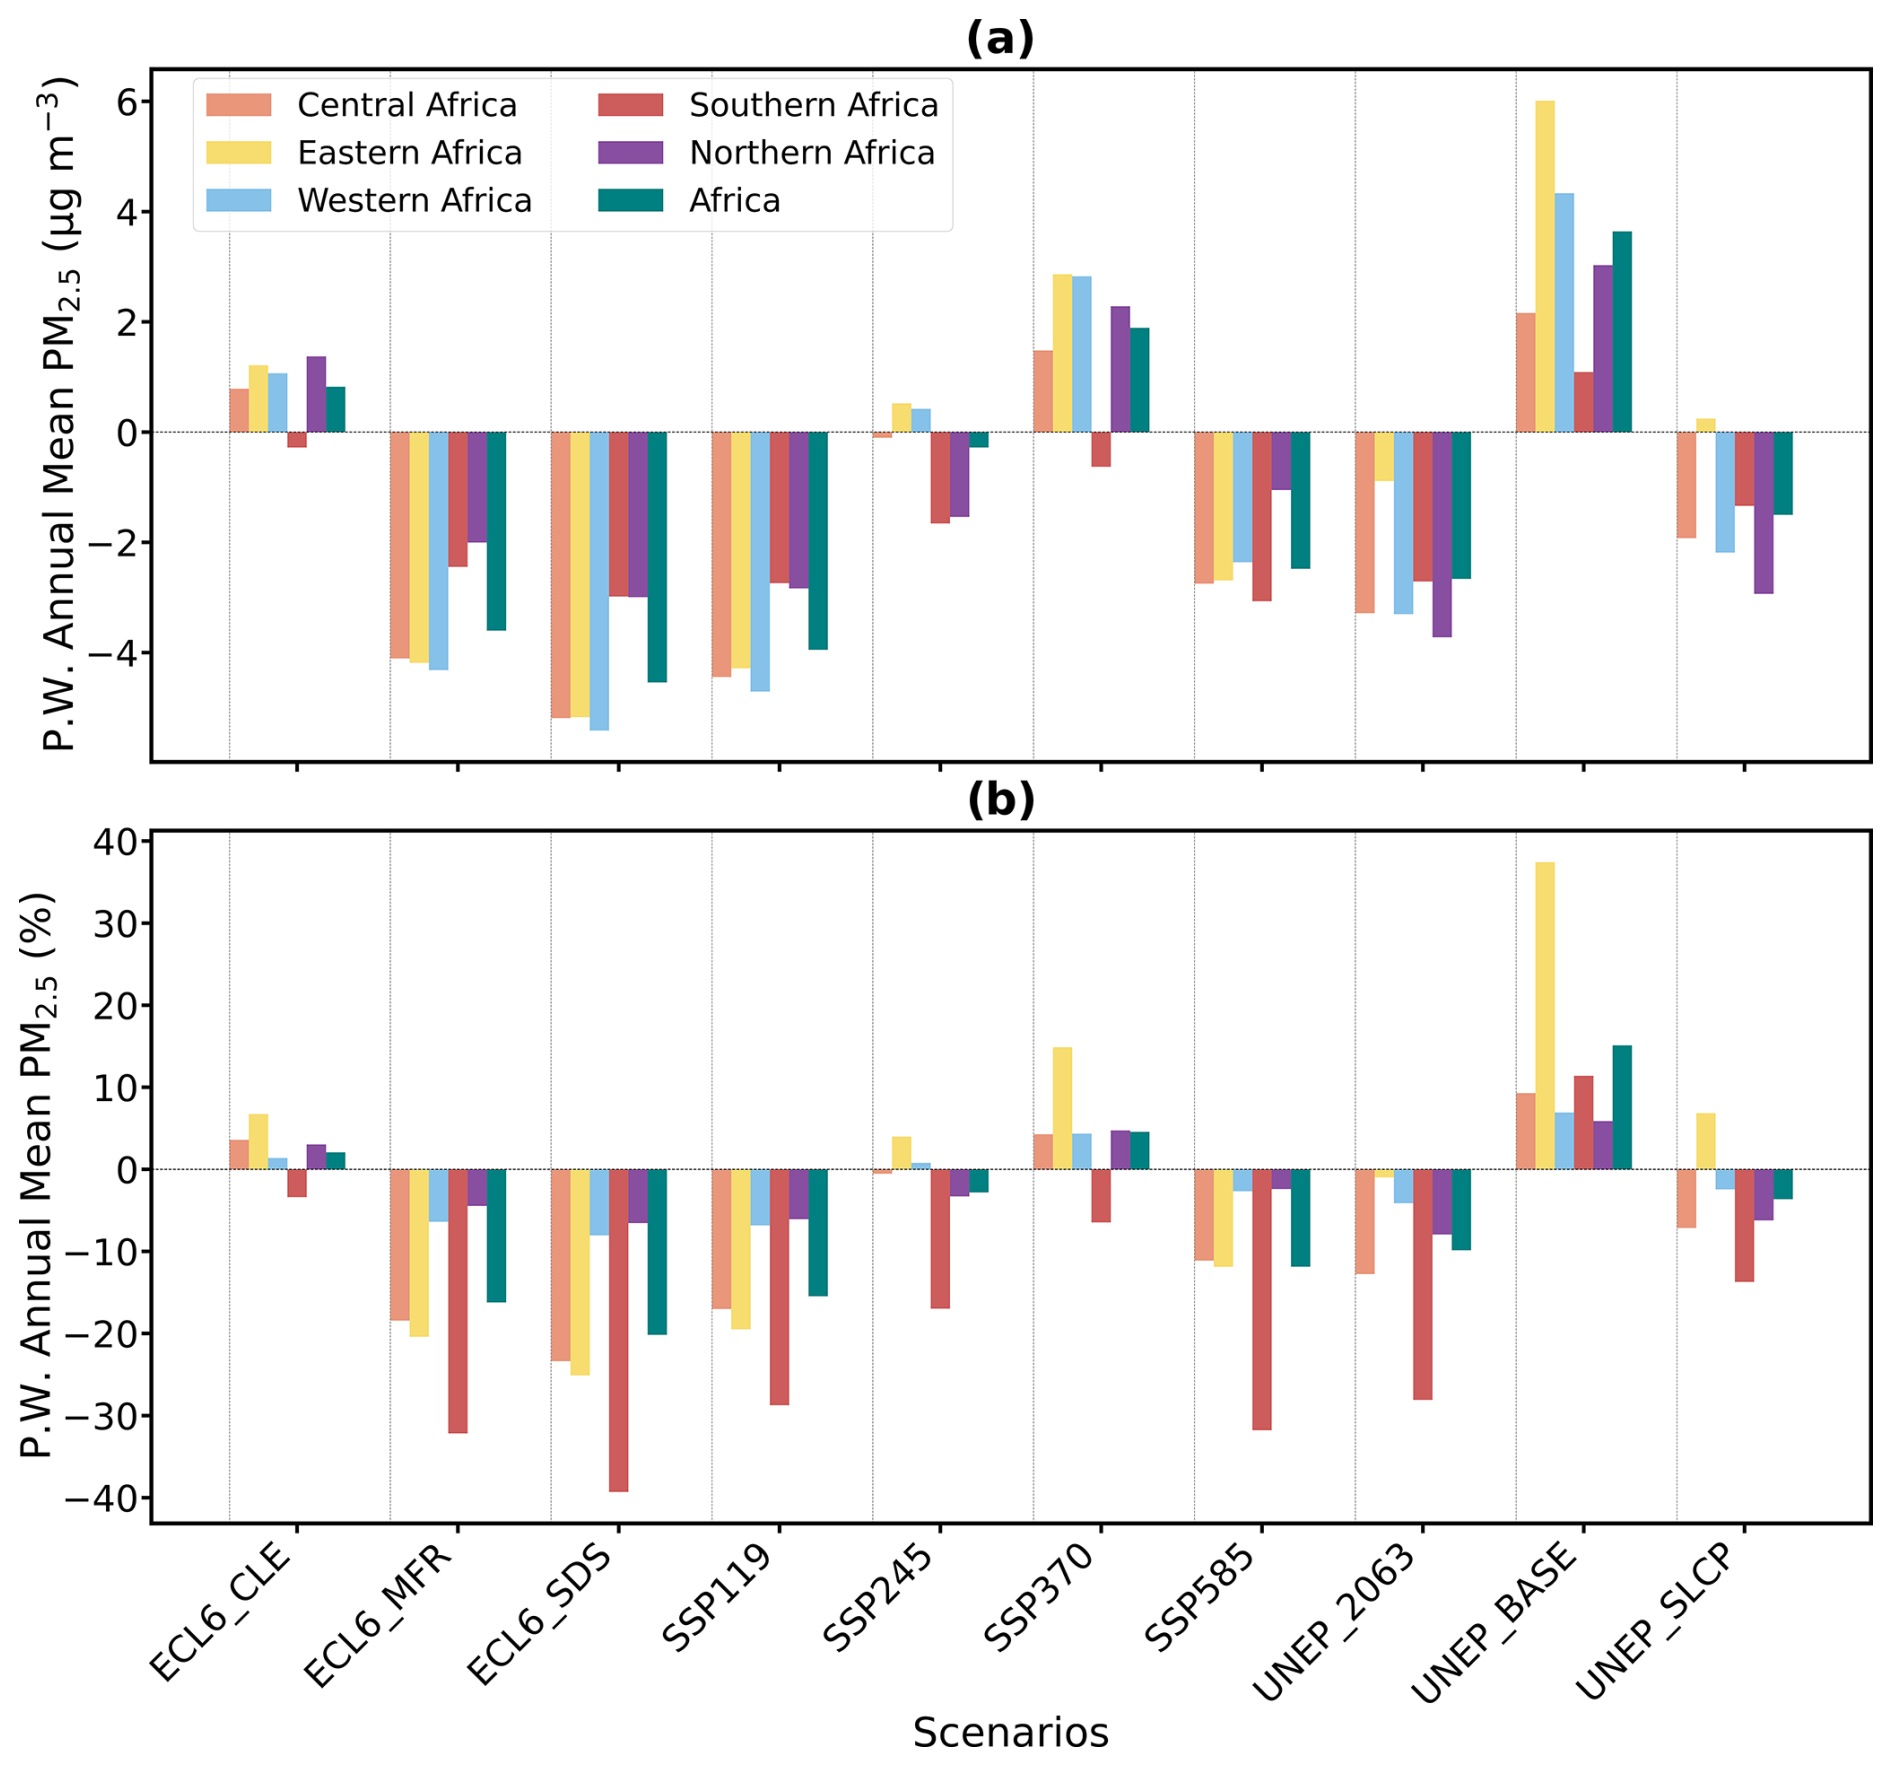
Figure 6Regionally averaged annual mean population-weighted PM2.5 concentrations in 2050 compared to the baseline. (a) Absolute PM2.5 changes and (b) relative PM2.5 changes.
In southern Africa, annual PM2.5 levels are projected to decrease under the SSP370 and ECL6 CLE scenarios by 0.6 µg m−3 (6 %) and 0.3 µg m−3 (3 %), respectively, primarily due to reductions in energy and industrial emissions. However, western and eastern Africa show slight increases under the SSP245 scenario (1 %) and UNEP SLCP scenario (7 %), respectively. The most substantial increases in PM2.5 exposure are projected in Nigeria, Egypt, Uganda, Rwanda, Burundi, and Benin under the UNEP Baseline and SSP370 scenarios, with concentration increases ranging from 10 to 20 µg m−3 (11 % to 33 %), as shown in Fig. S12. Conversely, the largest decreases are observed in Nigeria under the ECL6 SDS, SSP119, and UNEP 2063 scenarios, followed by significant reductions in Uganda, Rwanda, Burundi, and Egypt. These observed differences largely reflect variations in PM2.5 concentrations as well as shifts in population distribution.
In some areas, the relative changes in PM2.5 concentrations are small, despite notable absolute changes (Fig. 6), which are attributed to naturally high baseline concentrations from sources like dust, which cause air quality limits to already be exceeded (Pai et al., 2022). The varying outcomes across scenarios emphasize the critical role of policy choices in determining future air quality in Africa. The benefits in Nigeria, Uganda, Rwanda, Burundi, and Benin will primarily result from improvements in the residential sector, which plays a dominant role in reducing BC emissions. In countries such as South Africa, the benefits will largely stem from reductions in industrial and energy sector emissions of SO2. In northern Africa, the benefits will be driven primarily by reductions in emissions from the transportation sector.
Generally, the results are consistent with the emission changes (Figs. 2–4), in that stringent energy and air quality policy scenarios such as ECL6 SDS, SSP119, ECL6 MFR, and UNEP 2063 result in PM2.5 decreases across the board, and more extractive and fossil-fuel-dominated scenarios (UNEP BASE, SSP370, and ECL6 CLE) result in worse future PM2.5 air quality. These results highlight the potential for effective policy interventions to mitigate air pollution and improve public health across the continent.
3.4 Excess deaths attributable to PM2.5
Building on the exposure results, we estimated the projected excess deaths per year due to PM2.5 for the baseline and 2050 emissions for each scenario. Figure 7 shows the excess deaths due to PM2.5 for the baseline and 2050 emissions for each region and scenario. There are large increases in almost all cases, primarily due to the projected population increase (Fig. 8). Africa's population is expected to double by 2050 under SSP370, growing from 1.1 billion to 2.3 billion, with western Africa's population reaching 0.9 billion, followed by eastern Africa with 0.7 billion, southern Africa with 0.26 billion, central Africa with 0.24 billion, and northern Africa with 0.22 billion, as illustrated in Fig. S11. Western Africa is projected to have the largest excess deaths per year from ambient PM2.5 across all scenarios, followed by eastern Africa, northern Africa, central Africa, and southern Africa. By 2050, excess deaths in western Africa are projected to increase by more than 2.5 times under the highest-emission SSP370 and UNEP Baseline scenarios, compared to 0.18 (95 CI: 0.12–0.24) million in the baseline period. Even under the lower-emission SSP119 scenario, excess deaths are projected to increase by more than 1.5 times, driven by significant population growth combined with aging (Fig. S11). Southern Africa consistently has the lowest projected excess deaths per year across all scenarios, with estimates remaining under 0.05 million by 2050, although this represents up to a twofold increase compared to the baseline.
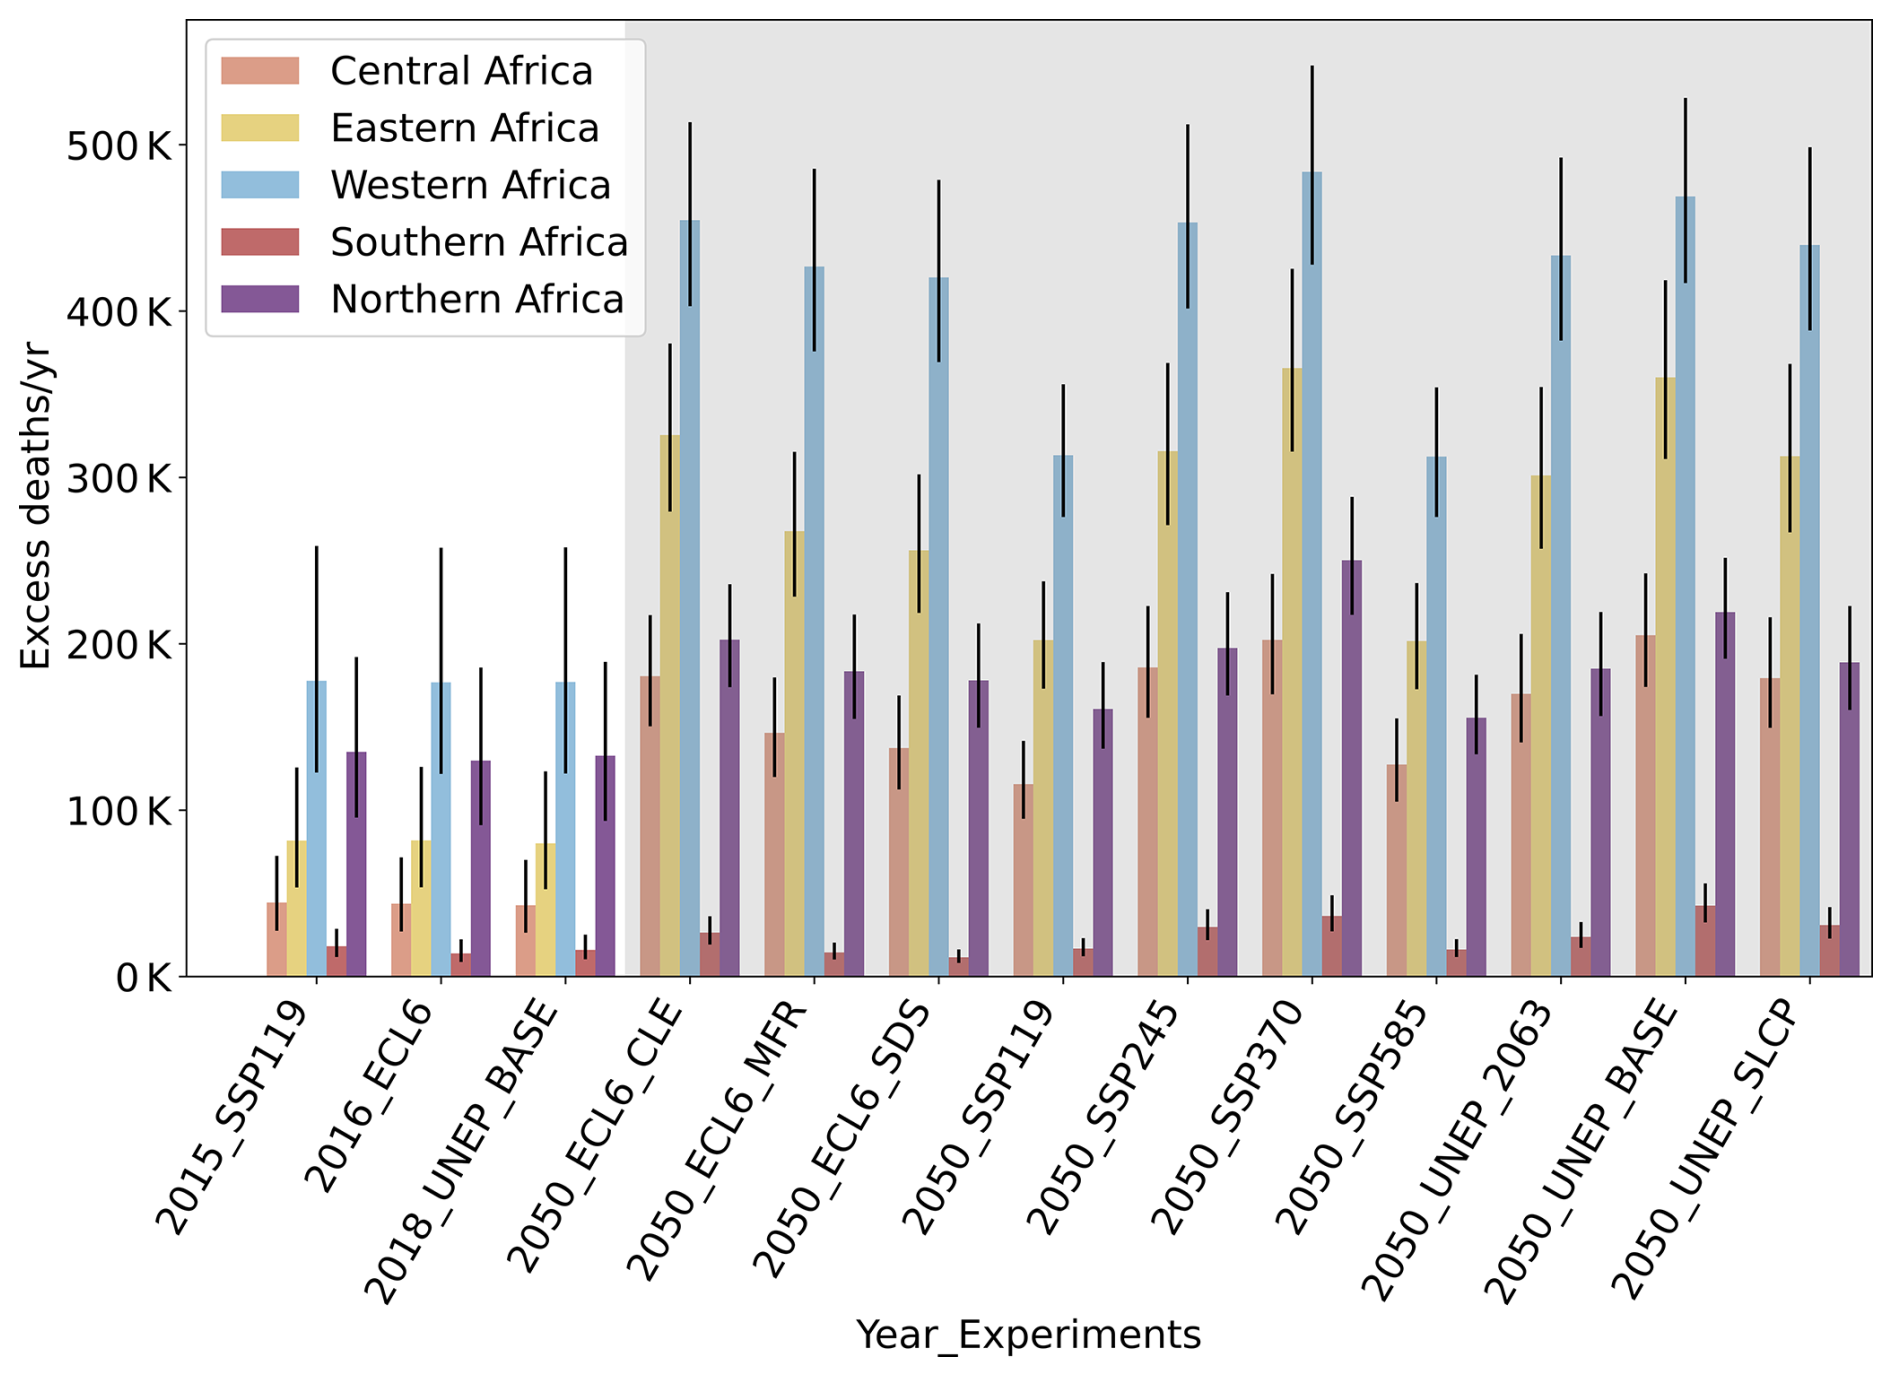
Figure 7Excess deaths due to PM2.5 calculated for baseline and 2050 emissions for each region and scenario. The black bars represent error bars, showing the 95 % confidence interval in the excess death estimates for each region and scenario, reflecting uncertainty propagated from the exposure-response function (MR-BRT).
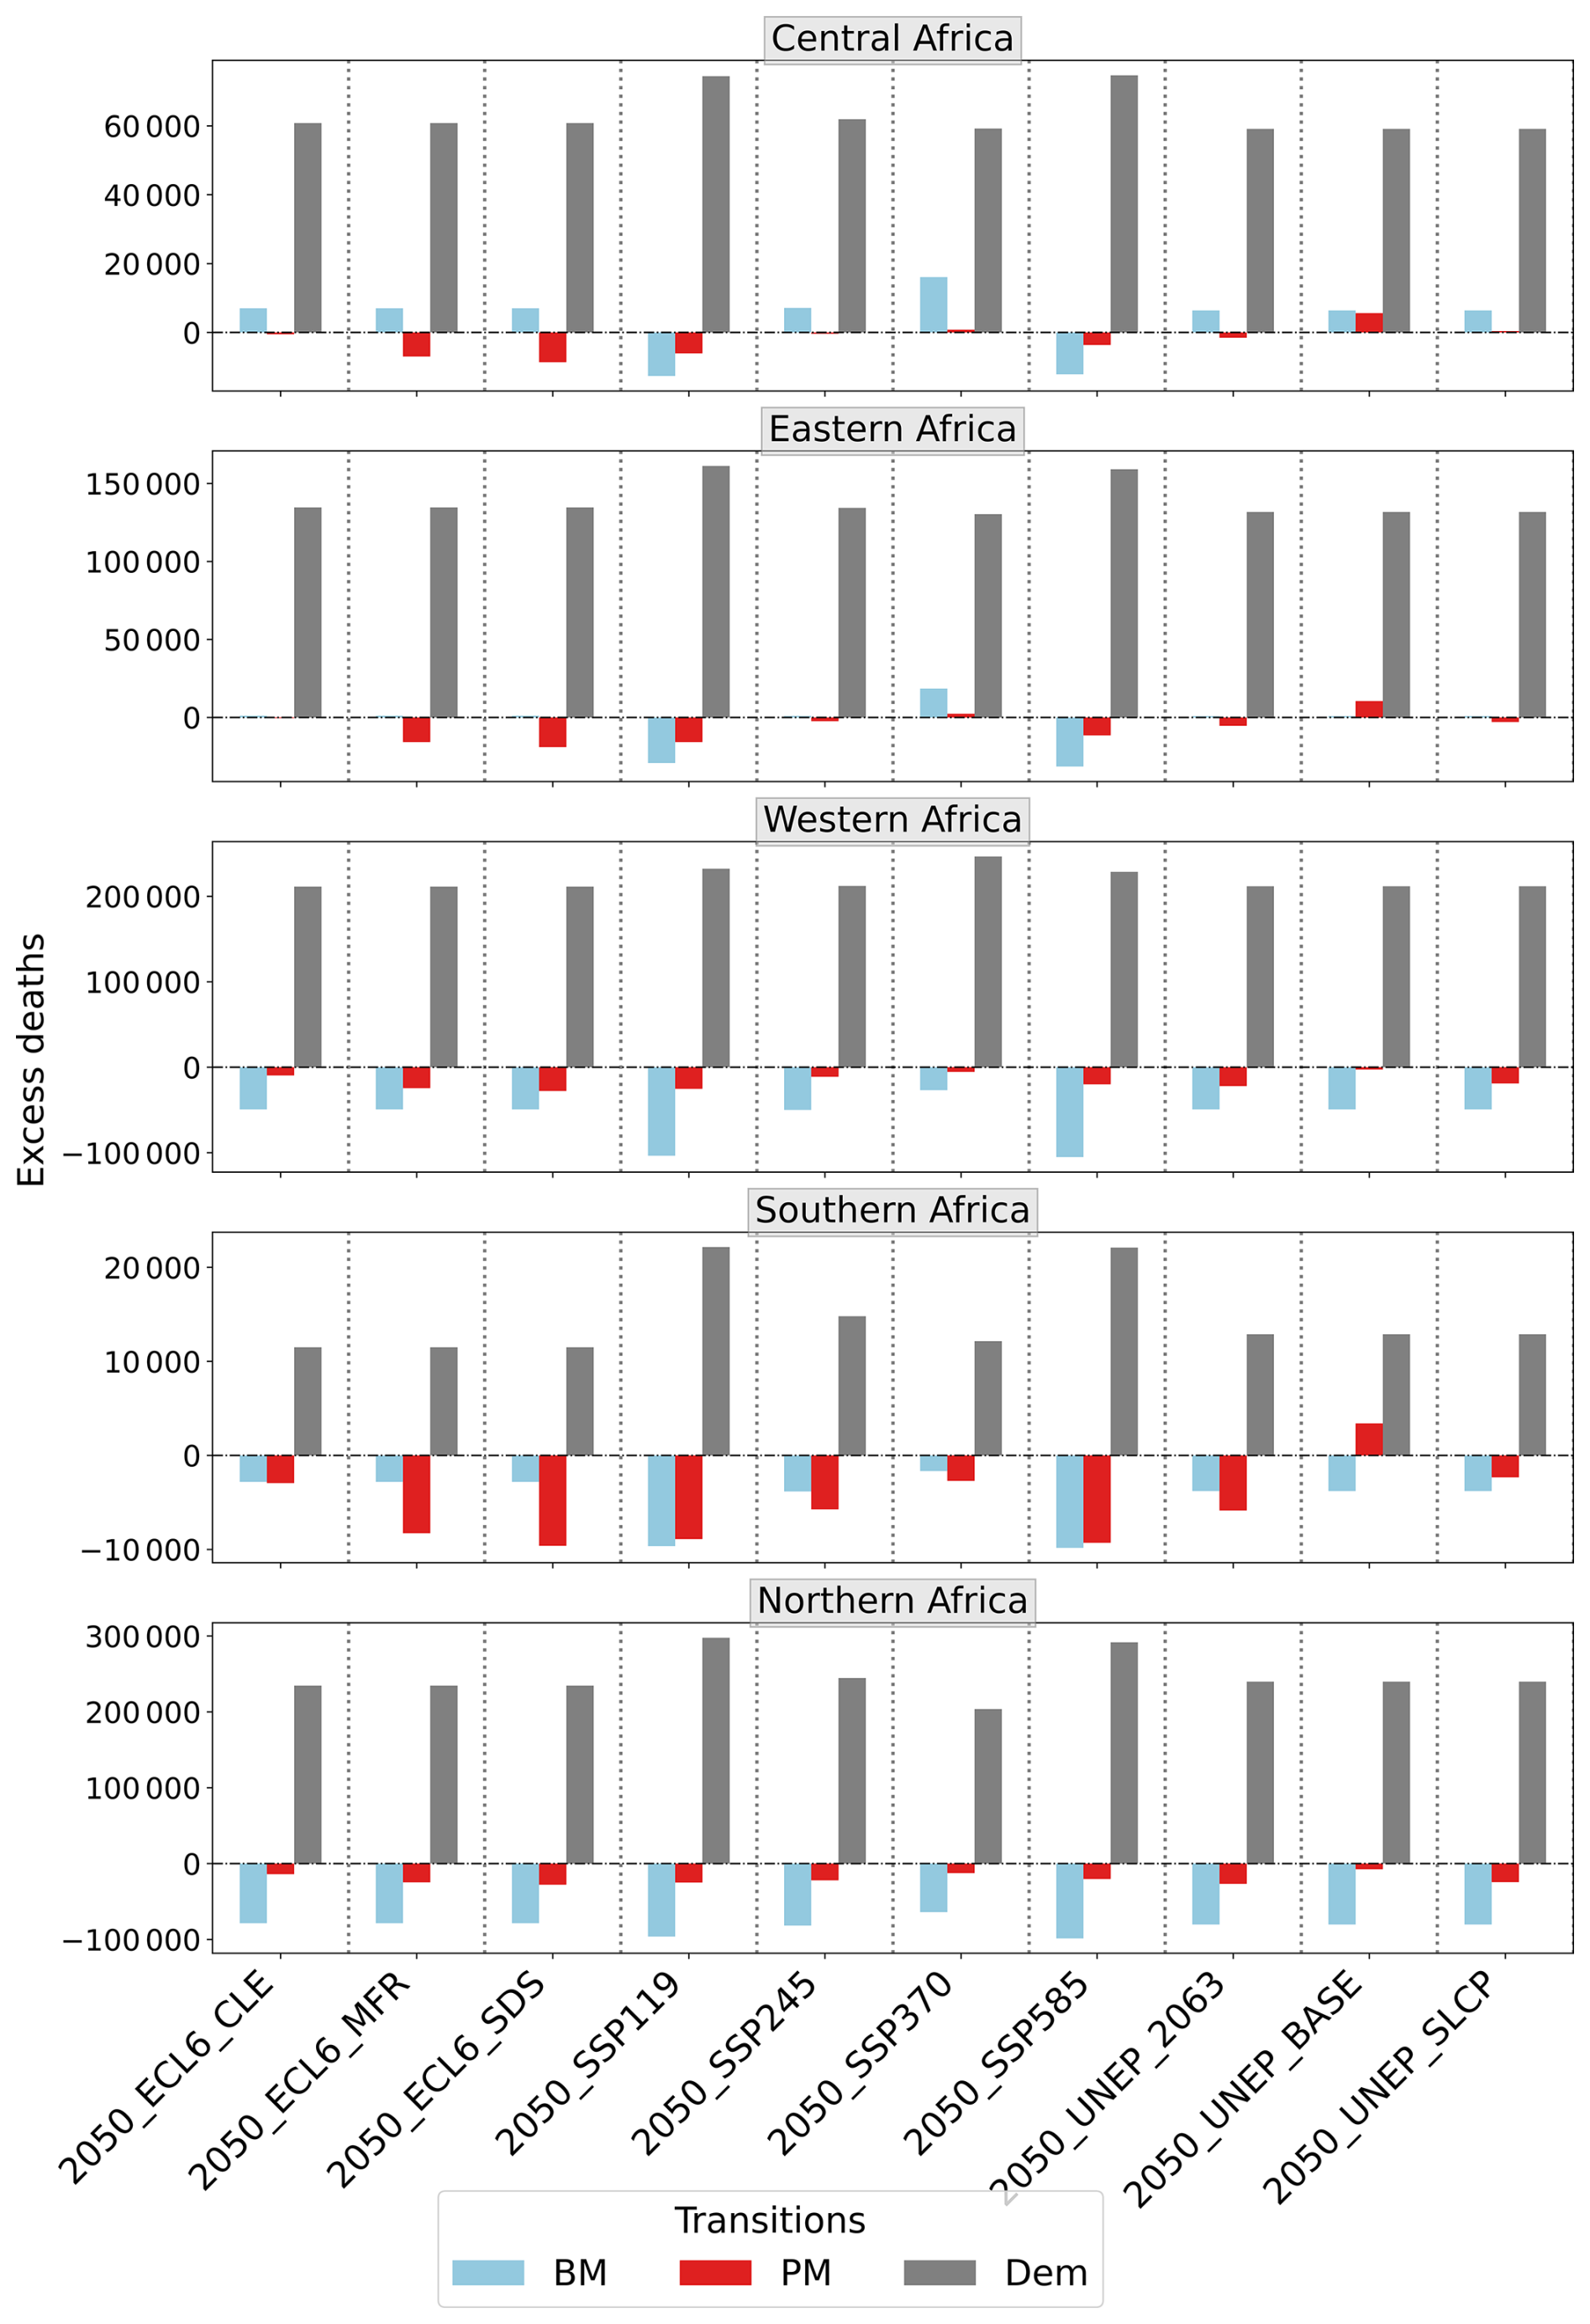
Figure 8Expected change in deaths in 2050 relative to the baseline, due to epidemiological transitions (BM), pollution transitions (PM), and demographic transitions (Dem).
Aging and population growth are both key aspects of the demographic transition, each contributing to increased excess deaths. Aging increases excess deaths from age-related diseases, even in scenarios with modest population growth. In parallel, overall population growth amplifies excess deaths, particularly in regions with high fertility rates and younger populations, such as western Africa and eastern Africa. In northern Africa, while population growth is projected to be slower, the aging population resulting from demographic shifts is projected to lead to a substantial number of excess deaths, reaching 300 000 under SSP119 and SSP585 and exceeding 200 000 in other scenarios (Fig. 8). Southern Africa is projected to experience the lowest number of excess deaths attributable to aging and population growth, except under SSP119 and SSP585, where demographic transition-related excess deaths increase to about 20 000.
As illustrated in Fig. 8, southern Africa is projected to benefit significantly from the pollution transition, with reductions in pollution-related deaths approaching 10 000 under scenarios such as SSP119, SSP585, ECL6 SDS, and ECL6 MFR, driven primarily by improvements in industrial emission controls. In other regions, the reductions are more modest, reflecting varying levels of emission control and air quality improvements. Most regions are projected to benefit from the epidemiological transition, characterized by a shift from infectious diseases to non-communicable diseases (NCDs). Excess deaths associated with this transition are projected to decline across most regions and scenarios, except central Africa under SSP119 and SSP585, where increases are projected. The most substantial reductions are projected under SSP119 and SSP585, with western Africa, southern Africa, and northern Africa each expected to experience declines of up to about 100 000 excess deaths.
The wide range across emission scenarios for the future is evident in the projected excess death estimates for all African regions, with projected excess deaths varying by a factor of 1.8 times in eastern and central Africa, 1.5 times in western Africa, and up to 2.6 times in southern Africa. Due to large increases in population size in all African regions, PM2.5-attributed mortality is projected to increase in all scenarios between the baseline and near future, even in scenarios projecting modest PM2.5 decreases (ECL6 SDS, ECL6 MFR, SSP119, SSP585, and UNEP 2063) and strong decreases in baseline disease rates (depicted in Fig. 8 by prevalent negative blue bars for epidemiological transitions).
3.5 Anthropogenic aerosol-induced radiative forcing
In Fig. 9, we show the net radiative forcing due to changes in anthropogenic aerosol emissions between the baseline and 2050, depending on the emission scenario. This includes the radiative forcing due to aerosol–radiation interactions (RFari, shown in Fig. S14), estimated using offline radiative transfer calculations with a multi-stream model based on the discrete ordinate method (Myhre et al., 2013; Stamnes et al., 1988); and from aerosol–cloud interactions (RFaci, shown in Fig. S15), estimated using a parameterization based on Quaas et al. (2006). The aerosol–cloud interaction estimate includes only the first indirect effect (cloud albedo effect), not the second (cloud lifetime effect). Averaged over the entire continent, the RFari in 2050 relative to the baseline is negative in the SSP119, ECL6 SDS, and UNEP scenarios and is positive in the remaining scenarios, reflecting a small cooling or warming effect depending on the scenario. The RFaci is negative in the UNEP Baseline and UNEP SLCP and is positive in the SSPs, UNEP Agenda 2063, and ECL6 scenarios.
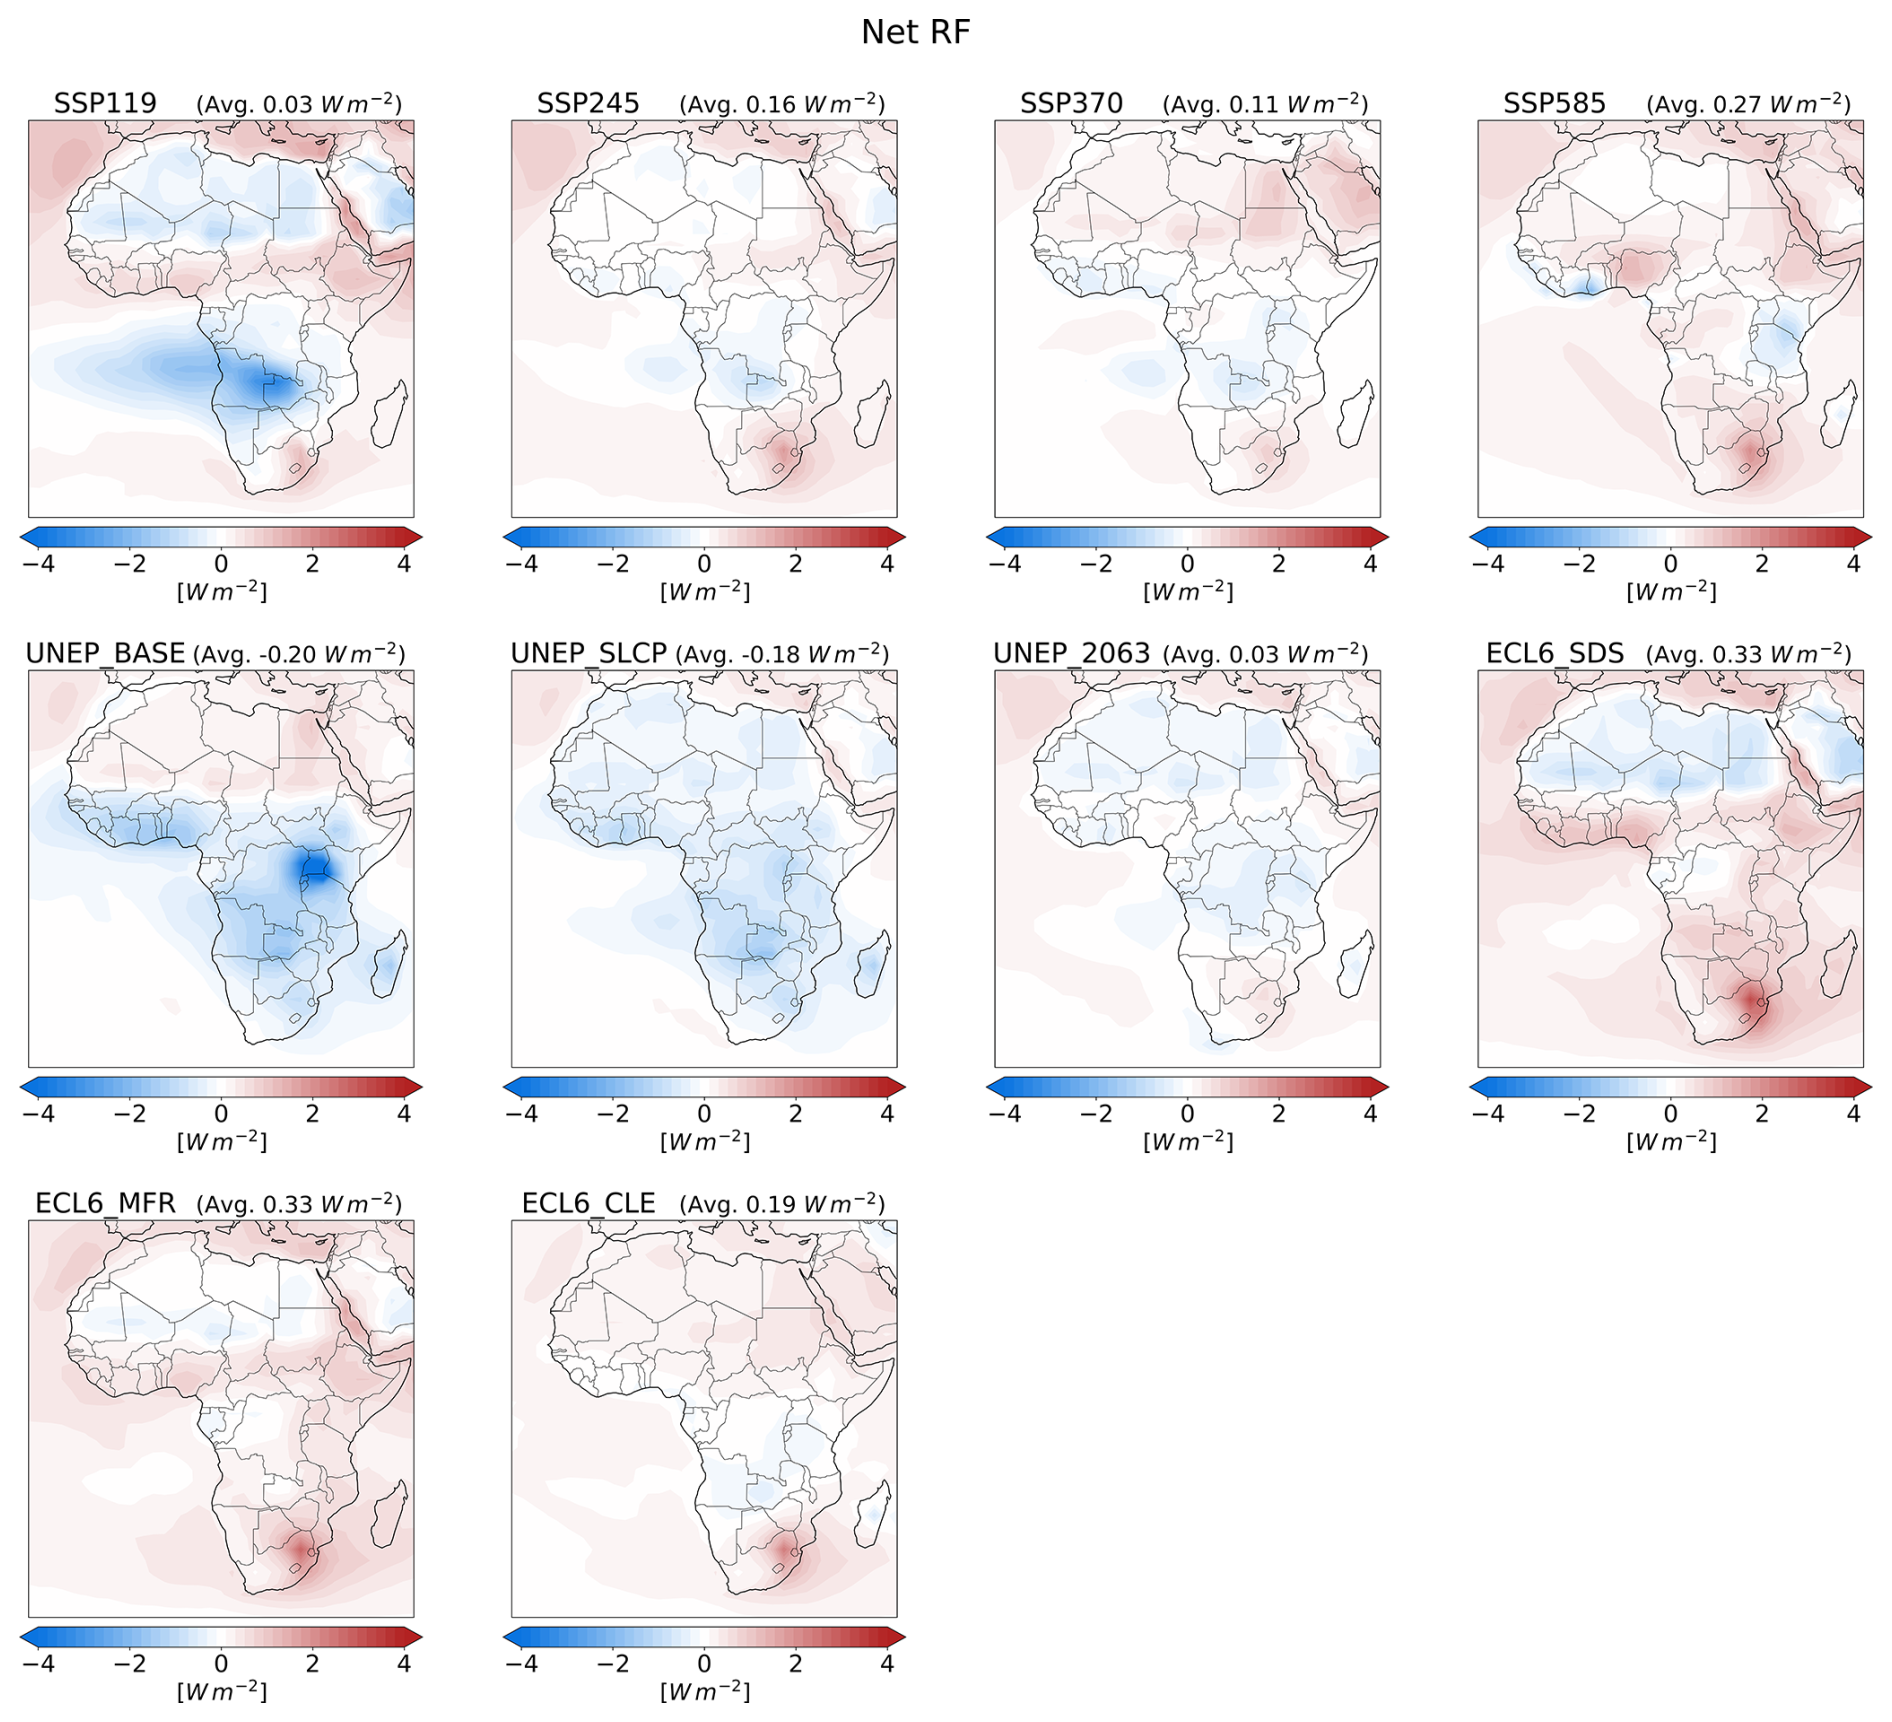
Figure 9Net aerosol-induced radiative forcing estimated due to changes in emissions between the baseline and 2050.
A net positive aerosol forcing in 2050 relative to the baseline is projected in all but two scenarios, with continent-wide mean values ranging from 0.03 W m−2 in SSP119 to 0.27 W m−2 in SSP585. Overall, we find a small warming effect due to reduced aerosol concentrations, with cooling in the two scenarios where emissions increase. Regional patterns of aerosol forcing reveal negative and positive values in certain areas, depending on the scenario, and align closely with AOD changes (Fig. S13). This shows the dominant influence of changes in scattering aerosols in the scenarios. Although local emission changes play the most important role, there could be influences from emission changes in surrounding regions via long-range transport. Southern Africa experiences anthropogenic aerosol-induced warming in all scenarios except UNEP BASE and UNEP SLCP. This warming reflects stricter policies and subsequent stronger emissions reductions (Fig. 2). Since changes in scattering aerosol emissions dominate, the result is a positive radiative forcing.
The regional pattern of radiative forcing reflects not only the overall stringency of air pollution control in the scenarios but also subsequent changes in the relative importance of different aerosol emissions. The less stringent scenarios (UNEP BASE and UNEP SLCP) result in negative aerosol radiative forcing across Africa due to higher concentrations of particularly scattering aerosol. In particular, the UNEP SLCP scenario targets BC, resulting in flat or decreasing BC emission profiles, depending on subregion, from the baseline to near future, but it has nearly the same SO2 increase as in UNEP BASE. Hence, the negative radiative forcing is nearly as strong in UNEP SLCP as in UNEP BASE. Although the cooling by SO2 offsets a portion of the warming caused by greenhouse gases, the adverse health effects in the UNEP BASE and UNEP SLCP scenarios due to poor air quality cannot be ignored. As expected, the more stringent scenarios (ECL6 SDS and ECL6 MFR) result in stronger positive aerosol-induced radiative forcing, thus contributing to warming but with reduced health risks due to improved air quality (Chalmers et al., 2012; Lund et al., 2019; Westervelt et al., 2017; Zhang et al., 2025).
Emissions of aerosol species across Africa show substantial variability in existing inventories and over time, influenced by both regional factors and scenario-specific dynamics. The scenarios are designed to have a large spread, reflecting uncertainties in how African nations will develop, and a lack of detailed assumptions in some cases. But there is also significant spread between the scenarios that assume weak or strong air pollution mitigation. The recent emission inventories differ and often lack harmonization with scenario data; although CEDS has now been extended to 2022, there is generally a delay in updating inventories and aligning baselines, highlighting a need for improved data to enhance inventory construction and reduce uncertainties. For instance, BC emissions show variability throughout the historical period, but SO2 emissions exhibit more consistency between inventories, particularly in recent years, where “real-world” emissions track the high projections. These uncertainties in emissions can propagate through climate and health impact assessments, influencing both the magnitude and spatial distribution of projected outcomes. While the general patterns identified in our study, such as the dominant role of population growth and the regional distribution of excess mortality, remain consistent across scenarios, the wide range of possible emission trajectories introduces uncertainty in the quantitative estimates of future impacts. Therefore, conclusions regarding absolute outcomes should be interpreted with caution, whereas relative differences across scenarios and regions are more robust. The large spread and regional heterogeneity in projected air pollution emissions are consistent with findings from previous studies (Keita et al., 2021; Shindell et al., 2022). For example, Shindell et al. (2022) highlight the fact that southern Africa is projected to have the highest SO2 emissions from power plants in the industrial sector, while western and eastern Africa are expected to see the largest BC emissions, primarily from the residential sector, under the high-emission SSP370 scenario by mid-century. Additionally, Bonjour et al. (2013) and Chowdhury et al. (2023) noted that over 90 % of households in sub-Saharan Africa rely on solid fuels for cooking and domestic activities, further emphasizing the dominant role of the residential sector in BC emissions across all scenarios for the region.
Sub-Saharan Africa is undergoing two major simultaneous transformations: a shift from traditional to modern sources of environmental pollution and a significant change in the disease burden, moving from communicable to non-communicable diseases (Bigna and Noubiap, 2019). Despite these shifts, household air pollution (HAP) continues to contribute to over 70 % of anthropogenic PM2.5 emissions in the region (McDuffie et al., 2020). Although HAP is gradually decreasing in certain areas as households transition to cleaner alternatives (Bescond et al., 2019), the pace is inconsistent across the continent. Notably, northern Africa stands out as the subregion with the least emissions from the residential sector, attributed to a greater adoption of LPG for household activities.
Our findings on population-weighted PM2.5 exposure align with those of Shindell et al. (2022), who observed that increases in PM2.5 exposure under the SSP370 scenario are notably large for eastern, northern, and western Africa, while being relatively modest in central and southern Africa. The variation in national-level PM2.5 exposure across the African region is also evident, with significant increases observed in countries such as Nigeria, Egypt, Ethiopia, Uganda, Rwanda, and Burundi under the SSP370 scenario. The Shindell et al. (2022) study was conducted using only the SSPs, with emphasis on the SSP119 and SSP370 scenarios, whereas our study expanded upon this by including a broader set of scenarios, including the SSPs, ECLIPSE, and UNEP scenarios, to explore a diverse set of future possibilities under plausible conditions. Similarly, the Wells et al. (2024) study, using only the SSPs, identified elevated PM2.5 exposure levels across tropical regions of Africa. Furthermore, Chowdhury et al. (2020, 2022) found that Nigeria exhibits the highest PM2.5 exposure levels in western Africa.
Shindell et al. (2022) found that, under the SSP119 scenario, annual premature deaths due to PM2.5 are projected to decrease by approximately 515 000 by 2050, compared to the SSP370 scenario, with reductions of 100 000, 175 000, 55 000, 140 000, and 45 000 in northern, western, central, eastern, and southern Africa, respectively. Wells et al. (2024) estimate that if Africa follows the high-emission SSP370 pathway instead of the low-emission SSP119 pathway, there could be approximately 150 000 additional deaths per year from PM2.5 exposure. The implementation of the strictest emission reductions could have a substantial positive impact on public health outcomes but would still result in several hundred thousand excess deaths in the most populated regions. Pai et al. (2022) found that, even under an extreme abatement scenario with no anthropogenic emissions, more than half of the world's population would still experience annual PM2.5 exposures above the 5 µg m−3 guideline, including over 70 % of the African population and more than 60 % of the Asian population. This is largely due to natural sources such as fires and dust, which aligns with our findings.
Several global studies have explored future aerosol-induced radiative forcing and climate impacts using SSPs (Lund et al., 2019) and Representative Concentration Pathway (RCP) projections (Chalmers et al., 2012; Gillett and Von Salzen, 2013; Westervelt et al., 2015). While present-day and future radiative forcing estimates vary across studies, a consistent global finding is the significant weakening of aerosol radiative forcing by 2100 across all scenarios (Lund et al., 2019). However, Lund et al. (2019) also highlighted substantial regional differences, particularly in southern Asia and Africa, where the magnitude and even the direction of forcing vary depending on the scenario. Chalmers et al. (2012) and Gillett and Von Salzen (2013) also investigated whether the rapid decline in aerosol emissions could lead to near-term warming. For instance, Chalmers et al. (2012) observed higher near-term warming in RCP2.6 compared to RCP4.5, despite lower greenhouse gas forcing in the former, highlighting the role of decreasing aerosol emissions. In contrast, Gillett and Von Salzen (2013) found no evidence of accelerated near-term warming linked to reduced aerosol emissions, underscoring the variability in model responses to aerosol changes. This inter-model variability is further highlighted by results from the Coupled Model Intercomparison Project Phase 6 (CMIP6), where Thornhill et al. (2021) show large differences in aerosol effective radiative forcing across models, reflecting substantial uncertainty in how aerosol–climate interactions are represented. While these previous studies primarily focused on global trends and the dynamics of aerosol-induced radiative forcing may vary regionally, particularly in Africa, they provide crucial insights into how aerosol radiative forcing evolves over time, particularly in response to changes in aerosol emissions.
Although our study does not consider the impacts of aerosols on atmospheric circulation and precipitation, prior research highlights their significant influence. For instance, Myhre et al. (2017) examined the implications of BC-absorbing short-wave radiation, highlighting its potential to warm the atmosphere and cause contrasting effects on circulation patterns and regional precipitation. Shindell et al. (2023) highlighted the fact that Africa could significantly mitigate rainfall declines by implementing the ECL6 SDS scenario, which focuses on transitioning away from fossil fuels and minimizing food waste. Even though these changes may lead to modest near-term warming due to reduced aerosols, they offer long-term climate benefits.
Shindell et al. (2023) also noted that under the high-emission UNEP Baseline scenario, significant drought is projected in the Sahel, whereas implementing the Agenda 2063 scenario could prevent this drying and potentially lead to a slight increase in precipitation. Previous studies have shown that local reductions in African anthropogenic aerosol emissions significantly influence the West African Monsoon (WAM) and Sahel summer precipitation (Hirasawa et al., 2022; Shindell et al., 2023; Wells et al., 2023; Westervelt et al., 2018). However, the considerable uncertainty in aerosol emissions over northern Africa continues to contribute to the challenges in projecting Sahel precipitation changes in the near future (Monerie et al., 2023; Shindell et al., 2023; Toolan et al., 2024).
Our approach does not capture climate-driven changes in PM2.5, which are expected to be smaller than emission-driven changes (Westervelt et al., 2016). Additionally, while we assess uncertainty from emissions, using a single model means we do not explore uncertainties in model response, such as differences in simulated concentrations and forcing.
In this paper, we examined the wide range and regional heterogeneity in projected air pollution emissions in Africa. We explored subregional and sectoral contributions to air pollution emissions in the ECLIPSE, SSPs, and UNEP scenarios, identifying sectoral changes that influence air quality across Africa's regions. We estimated the difference in simulated population-weighted PM2.5 exposure as well as continental and regional annual mean changes in PM2.5 concentrations in 2050 relative to the baseline. Furthermore, we estimated the excess mortality associated with PM2.5 exposure based on the baseline and projected 2050 emissions for each scenario. Lastly, we calculated radiative forcing due to changes in emissions between 2050 and the baseline.
Using the ECLIPSE, SSPs, and UNEP emission projections, we find substantial subregional differences in BC, SO2, OC, and NOx emissions across Africa. Emissions vary substantially depending on the scenario and region, with high emissions of BC, OC, and NOx in western Africa, eastern Africa, and central Africa, and high emissions of SO2 in southern Africa. Key sectoral contributors to air pollution vary by region, with the residential, industrial, transportation, and energy sectors playing dominant roles depending on the region and scenario. In the baseline and by 2050, the residential sector will remain the largest source of BC emissions in sub-Saharan Africa, while in northern Africa, the transportation sector leads. Sectoral emission distributions differ across the SSP, ECL6, and UNEP scenarios due to varying assumptions about regulations, technology, and economic development. Better and more spatially resolved assumptions about policy, technology, and economic development are needed for projections on the continent, especially for the upcoming IPCC AR7.
Regionally averaged annual mean PM2.5 concentrations exhibit distinct trends across different African regions, with variations driven by the stringency of emission scenarios. We find that regionally averaged annual mean population-weighted PM2.5 concentrations are projected to increase by up to 6 µg m−3 (37 %, SD ± 2.7 µg m−3) under the UNEP Baseline, SSP370, and ECL6 CLE scenarios by 2050, when averaged across the African continent. Conversely, decreases of up to 5 µg m−3 (8 %, SD ± 2.5 µg m−3) in western Africa and 3 µg m−3 (39 %, SD ± 1.4 µg m−3) in southern Africa are projected under the ECL6 SDS and MFR scenarios. Western, eastern, and northern Africa are projected to experience the highest exposure levels under the UNEP Baseline, SSP370, and ECL6 CLE scenarios, driven by increased emissions from the residential, industrial, transportation, and energy sectors. In contrast, southern Africa is projected to see declines in annual PM2.5 levels under the SSP370 and ECL6 CLE scenarios, with reductions of 0.6 µg m−3 (6 %) and 0.3 µg m−3 (3 %), respectively, primarily due to decreased emissions from the energy and industrial sectors. By 2050, annual mean PM2.5 concentrations for Africa differ by up to a factor of 2 between the highest emission scenario (UNEP Baseline) and the lowest emission scenario (SSP119) when averaged across the continent, further highlighting a substantial spread in future emission projections.
Substantial increases in excess deaths due to PM2.5 are projected in almost all scenarios, largely driven by significant population growth. We find that by 2050, western Africa is projected to experience the highest increase in excess deaths across all scenarios, with an increase of over 2.5 times compared to the baseline under the SSP370 and UNEP Baseline scenarios, driven primarily by population growth and aging. Eastern, northern, central, and southern Africa follow in terms of projected excess deaths, but southern Africa is projected to have the smallest increase, remaining below 0.05 million. While PM2.5 reductions may slightly decrease mortality in some areas, population growth will still lead to hundreds of thousands of excess deaths, underscoring the need for significant PM2.5 reductions. Epidemiological and pollution transitions are projected to reduce excess deaths in all regions, particularly in western, southern, and northern Africa, with notable reductions in southern Africa under certain scenarios. However, the overall effect is driven primarily by population growth.
We find a net positive aerosol-induced forcing across Africa in all scenarios by 2050, except the UNEP BASE and UNEP SLCP scenarios, with values ranging from 0.03 W m−2 in SSP119 to 0.27 W m−2 in SSP585, driven mainly by changes in scattering aerosols. Regional patterns show both positive and negative aerosol forcing depending on the scenario, with southern Africa experiencing warming in all but two scenarios (UNEP BASE and UNEP SLCP) due to reductions in industrial emissions. The less stringent scenarios (UNEP BASE and UNEP SLCP) lead to negative aerosol radiative forcing across Africa, primarily due to higher scattering aerosol concentrations, with UNEP SLCP focusing on eliminating BC emissions but with no changes to SO2 emissions. Further work is needed to quantify the associated climate implications and risks.
This work provides profound insights into Africa's complex and diverse emissions landscape and lays the groundwork for future research and policy interventions. Understanding the drivers of change and the spread in scenarios is critical for addressing future emissions and their impacts. Differences in emission projections highlight the need for the robust analysis of socioeconomic, regulatory, and technological pathways. Additionally, improving present-day data is essential to better constrain the baseline for scenarios, ensuring that models accurately reflect current emissions and activity levels. Accurate activity data and harmonization are especially essential for upcoming assessments aimed at informing policymakers, such as the various elements of the 7th Assessment Report of the Intergovernmental Panel on Climate Change, which will rely on these baselines to effectively consider the implications of future climate and air quality policies.
The OsloCTM3 model is available from GitHub at https://github.com/NordicESMhub/OsloCTM3 (NordicESMhub, 2019) (details about the version used in the present study will be provided upon request to the corresponding author). The data analysis was conducted using Bash scripting and Python programming languages.
The OsloCTM3 model outputs are available at https://doi.org/10.6084/m9.figshare.28030610 (Amooli et al., 2025). NASA data are accessible through Giovanni (https://giovanni.gsfc.nasa.gov/giovanni/, last access: 5 November 2024), and US embassy data can be found on AirNow (https://www.arcgis.com/home/item.html?id=db1a45b351164464ac0459a52890e5a0, US EPA, 2024). Satellite-derived PM2.5 data are available via the satellite-derived PM2.5 archive, Atmospheric Composition Analysis Group, Washington University in St. Louis (https://sites.wustl.edu/acag/datasets/surface-pm2-5-archive/, last access: 5 November 2024). The SSP scenarios are provided by IIASA (https://tntcat.iiasa.ac.at/SspDb/dsd?Action=htmlpage&page=about, last access: 25 July 2024) and baseline mortality data can be accessed through the Global Burden of Disease Results Tool (https://vizhub.healthdata.org/gbd-results/, GBD, 2024).
The supplement related to this article is available online at https://doi.org/10.5194/acp-25-11611-2025-supplement.
MTL, BHS, DMW, SC, GM, ANJ, and JAA conceptualized and designed the study. MTL performed the OsloCTM3 simulations. ANJ processed and prepared the emissions. GM performed the radiative forcing calculations. SC performed the health impact assessment calculations. JAA performed the data analysis and led the writing. All authors reviewed and edited the paper.
At least one of the (co-)authors is a member of the editorial board of Atmospheric Chemistry and Physics. The peer-review process was guided by an independent editor, and the authors also have no other competing interests to declare.
Publisher's note: Copernicus Publications remains neutral with regard to jurisdictional claims made in the text, published maps, institutional affiliations, or any other geographical representation in this paper. While Copernicus Publications makes every effort to include appropriate place names, the final responsibility lies with the authors.
The authors acknowledge support from the Center for Advanced Study in Oslo, Norway, which hosted the HETCLIF center during the academic year 2023/2024, and computational resources provided by UNINETT Sigma2, the National Infrastructure for High-Performance Computing and Data Storage in Norway.
This work was supported by the Research Council of Norway (grant no. NN9188K) and the National Science Foundation Office of International Science and Engineering (OISE, award no. 2020677).
This paper was edited by Yuan Wang and reviewed by Chris Wells and one anonymous referee.
Aamaas, B., Berntsen, T. K., Fuglestvedt, J. S., Shine, K. P., and Collins, W. J.: Regional temperature change potentials for short-lived climate forcers based on radiative forcing from multiple models, Atmos. Chem. Phys., 17, 10795–10809, https://doi.org/10.5194/acp-17-10795-2017, 2017.
Abera, A., Friberg, J., Isaxon, C., Jerrett, M., Malmqvist, E., Sjöström, C., Taj, T., and Vargas, A. M.: Air Quality in Africa: Public Health Implications, Annu. Rev. Public Heal., 42, 193–210, https://doi.org/10.1146/ANNUREV-PUBLHEALTH-100119-113802, 2020.
Albrecht, B. A.: Aerosols, Cloud Microphysics, and Fractional Cloudiness, Science, 245, 1227–1230, https://doi.org/10.1126/SCIENCE.245.4923.1227, 1989.
Amann, M., Bertok, I., Borken-Kleefeld, J., Cofala, J., Heyes, C., Höglund-Isaksson, L., Klimont, Z., Nguyen, B., Posch, M., Rafaj, P., Sandler, R., Schöpp, W., Wagner, F., and Winiwarter, W.: Cost-effective control of air quality and greenhouse gases in Europe: Modeling and policy applications, Environ. Modell. Softw., 26, 1489–1501, https://doi.org/10.1016/J.ENVSOFT.2011.07.012, 2011.
Amooli, J. A., Lund, M. T., Chowdhury, S., Myhre, G., Johansen, A. N., Samset, B. H., and Westervelt, D. M.: OsloCTM3 outputs, figshare [data set], https://doi.org/10.6084/m9.figshare.28030610, 2025.
Bauer, S. E., Im, U., Mezuman, K., and Gao, C. Y.: Desert Dust, Industrialization, and Agricultural Fires: Health Impacts of Outdoor Air Pollution in Africa, J. Geophys. Res.-Atmos., 124, 4104–4120, https://doi.org/10.1029/2018JD029336, 2019.
Bescond, D., Cole, W., Diez De Medina, R., Lame, R. G., Kucera, D., Kühn, S., Lee, S., Maitre, N., Mathys, Q., Morgan, M., Perardel, Y., Sodergren, M.-C., Vazquez-Alvarez, R., and Fuentes, M. V.: THE GLOBAL LABOUR INCOME SHARE AND DISTRIBUTION Data Production and Analysis Unit, ILO Department of Statistics Methodological description, International Labour Organization, https://webapps.ilo.org/ilostat-files/Documents/Labour%20income%20share%20and%20distribution.pdf (last access: 9 December 2024), 2019.
Bigna, J. J. and Noubiap, J. J.: The rising burden of non-communicable diseases in sub-Saharan Africa, Lancet Glob. Health, 7, e1295–e1296, https://doi.org/10.1016/S2214-109X(19)30370-5, 2019.
Bonjour, S., Adair-Rohani, H., Wolf, J., Bruce, N. G., Mehta, S., Prüss-Ustün, A., Lahiff, M., Rehfuess, E. A., Mishra, V., and Smith, K. R.: Solid fuel use for household cooking: Country and regional estimates for 1980–2010, Environ. Health Persp., 121, 784–790, https://doi.org/10.1289/EHP.1205987, 2013.
Burnett, R., Chen, H., Szyszkowicz, M., Fann, N., Hubbell, B., Pope, C. A., Apte, J. S., Brauer, M., Cohen, A., Weichenthal, S., Coggins, J., Di, Q., Brunekreef, B., Frostad, J., Lim, S. S., Kan, H., Walker, K. D., Thurston, G. D., Hayes, R. B., Lim, C. C., Turner, M. C., Jerrett, M., Krewski, D., Gapstur, S. M., Diver, W. R., Ostro, B., Goldberg, D., Crouse, D. L., Martin, R. V., Peters, P., Pinault, L., Tjepkema, M., Van Donkelaar, A., Villeneuve, P. J., Miller, A. B., Yin, P., Zhou, M., Wang, L., Janssen, N. A. H., Marra, M., Atkinson, R. W., Tsang, H., Thach, T. Q., Cannon, J. B., Allen, R. T., Hart, J. E., Laden, F., Cesaroni, G., Forastiere, F., Weinmayr, G., Jaensch, A., Nagel, G., Concin, H., and Spadaro, J. V.: Global estimates of mortality associated with longterm exposure to outdoor fine particulate matter, P. Natl. Acad. Sci. USA, 115, 9592–9597, https://doi.org/10.1073/PNAS.1803222115, 2018.
Chalmers, N., Highwood, E. J., Hawkins, E., Sutton, R., and Wilcox, L. J.: Aerosol contribution to the rapid warming of near-term climate under RCP 2.6, Geophys. Res. Lett., 39, L18709, https://doi.org/10.1029/2012GL052848, 2012.
Chowdhury, S., Dey, S., Guttikunda, S., Pillarisetti, A., Smith, K. R., and Di Girolamo, L.: Indian annual ambient air quality standard is achievable by completely mitigating emissions from household sources, P. Natl. Acad. Sci. USA, 166, 10711–10716, https://doi.org/10.1073/PNAS.1900888116, 2019.
Chowdhury, S., Pozzer, A., Dey, S., Klingmueller, K., and Lelieveld, J.: Changing risk factors that contribute to premature mortality from ambient air pollution between 2000 and 2015, Environ. Res. Lett., 15, 074010, https://doi.org/10.1088/1748-9326/AB8334, 2020.
Chowdhury, S., Pozzer, A., Haines, A., Klingmüller, K., Münzel, T., Paasonen, P., Sharma, A., Venkataraman, C., and Lelieveld, J.: Global health burden of ambient PM2.5 and the contribution of anthropogenic black carbon and organic aerosols, Environ. Int., 159, 107020, https://doi.org/10.1016/J.ENVINT.2021.107020, 2022.
Chowdhury, S., Pillarisetti, A., Oberholzer, A., Jetter, J., Mitchell, J., Cappuccilli, E., Aamaas, B., Aunan, K., Pozzer, A., and Alexander, D.: A global review of the state of the evidence of household air pollution's contribution to ambient fine particulate matter and their related health impacts, Environ. Int., 173, 107835, https://doi.org/10.1016/J.ENVINT.2023.107835, 2023.
Chowdhury, S., Hänninen, R., Sofiev, M., and Aunan, K.: Fires as a source of annual ambient PM2.5 exposure and chronic health impacts in Europe, Sci. Total Environ., 922, 171314, https://doi.org/10.1016/J.SCITOTENV.2024.171314, 2024.
Cohen, A. J., Brauer, M., Burnett, R., Anderson, H. R., Frostad, J., Estep, K., Balakrishnan, K., Brunekreef, B., Dandona, L., Dandona, R., Feigin, V., Freedman, G., Hubbell, B., Jobling, A., Kan, H., Knibbs, L., Liu, Y., Martin, R., Morawska, L., Pope, C. A., Shin, H., Straif, K., Shaddick, G., Thomas, M., van Dingenen, R., van Donkelaar, A., Vos, T., Murray, C. J. L., and Forouzanfar, M. H.: Estimates and 25-year trends of the global burden of disease attributable to ambient air pollution: an analysis of data from the Global Burden of Diseases Study 2015, Lancet, 389, 1907–1918, https://doi.org/10.1016/S0140-6736(17)30505-6, 2017.
Crippa, M., Guizzardi, D., Muntean, M., Schaaf, E., Dentener, F., van Aardenne, J. A., Monni, S., Doering, U., Olivier, J. G. J., Pagliari, V., and Janssens-Maenhout, G.: Gridded emissions of air pollutants for the period 1970–2012 within EDGAR v4.3.2, Earth Syst. Sci. Data, 10, 1987–2013, https://doi.org/10.5194/essd-10-1987-2018, 2018.
Djeufack Dongmo, A., Mbengono Coralie, P., Chetue Komguep, M., and Kembeng Tchinda, U.: Urbanization, informal economy, economic growth and CO2 emissions in African countries: a panel vector autoregression (PVAR) model approach, Journal of Bioeconomics, 25, 35–63, https://doi.org/10.1007/S10818-022-09331-5, 2023.
Fang, T., Di, Y., Xu, Y., Shen, N., Fan, H., Hou, S., and Li, X.: Temporal trends of particulate matter pollution and its health burden, 1990–2021, with projections to 2036: a systematic analysis for the global burden of disease study 2021, Front Public Health, 13, 1579716, https://doi.org/10.3389/FPUBH.2025.1579716, 2025.
Fenta, A. A., Tsunekawa, A., Haregeweyn, N., Tsubo, M., Yasuda, H., Shimizu, K., Kawai, T., Ebabu, K., Berihun, M. L., Sultan, D., Belay, A. S., and Sun, J.: Cropland expansion outweighs the monetary effect of declining natural vegetation on ecosystem services in sub-Saharan Africa, Ecosyst. Serv., 45, 101154, https://doi.org/10.1016/J.ECOSER.2020.101154, 2020.
Fontes, T., Li, P., Barros, N., and Zhao, P.: Trends of PM2.5 concentrations in China: A long term approach, J. Environ. Manage., 196, 719–732, https://doi.org/10.1016/J.JENVMAN.2017.03.074, 2017.
Forster, P. M., Smith, C., Walsh, T., Lamb, W. F., Lamboll, R., Hall, B., Hauser, M., Ribes, A., Rosen, D., Gillett, N. P., Palmer, M. D., Rogelj, J., von Schuckmann, K., Trewin, B., Allen, M., Andrew, R., Betts, R. A., Borger, A., Boyer, T., Broersma, J. A., Buontempo, C., Burgess, S., Cagnazzo, C., Cheng, L., Friedlingstein, P., Gettelman, A., Gütschow, J., Ishii, M., Jenkins, S., Lan, X., Morice, C., Mühle, J., Kadow, C., Kennedy, J., Killick, R. E., Krummel, P. B., Minx, J. C., Myhre, G., Naik, V., Peters, G. P., Pirani, A., Pongratz, J., Schleussner, C.-F., Seneviratne, S. I., Szopa, S., Thorne, P., Kovilakam, M. V. M., Majamäki, E., Jalkanen, J.-P., van Marle, M., Hoesly, R. M., Rohde, R., Schumacher, D., van der Werf, G., Vose, R., Zickfeld, K., Zhang, X., Masson-Delmotte, V., and Zhai, P.: Indicators of Global Climate Change 2023: annual update of key indicators of the state of the climate system and human influence, Earth Syst. Sci. Data, 16, 2625–2658, https://doi.org/10.5194/essd-16-2625-2024, 2024.
GBD: Global Burden of Disease Collaborative Network, Global Burden of Disease Study 2021, Seattle, United States, https://doi.org/10.1016/S0140-6736(24)00769-4, 2021.
GBD 2021 Results: GBD 2021 Results, https://vizhub.healthdata.org/gbd-results/, last access: 21 December 2024.
Gidden, M. J., Riahi, K., Smith, S. J., Fujimori, S., Luderer, G., Kriegler, E., van Vuuren, D. P., van den Berg, M., Feng, L., Klein, D., Calvin, K., Doelman, J. C., Frank, S., Fricko, O., Harmsen, M., Hasegawa, T., Havlik, P., Hilaire, J., Hoesly, R., Horing, J., Popp, A., Stehfest, E., and Takahashi, K.: Global emissions pathways under different socioeconomic scenarios for use in CMIP6: a dataset of harmonized emissions trajectories through the end of the century, Geosci. Model Dev., 12, 1443–1475, https://doi.org/10.5194/gmd-12-1443-2019, 2019.
Gillett, N. P. and Von Salzen, K.: The role of reduced aerosol precursor emissions in driving near-term warming, Environ. Res. Lett., 8, 034008, https://doi.org/10.1088/1748-9326/8/3/034008, 2013.
Hirasawa, H., Kushner, P. J., Sigmond, M., Fyfe, J., and Deser, C.: Evolving Sahel Rainfall Response to Anthropogenic Aerosols Driven by Shifting Regional Oceanic and Emission Influences, J. Climate, 35, 3181–3193, https://doi.org/10.1175/JCLI-D-21-0795.1, 2022.
Hoesly, R. M., Smith, S. J., Feng, L., Klimont, Z., Janssens-Maenhout, G., Pitkanen, T., Seibert, J. J., Vu, L., Andres, R. J., Bolt, R. M., Bond, T. C., Dawidowski, L., Kholod, N., Kurokawa, J.-I., Li, M., Liu, L., Lu, Z., Moura, M. C. P., O'Rourke, P. R., and Zhang, Q.: Historical (1750–2014) anthropogenic emissions of reactive gases and aerosols from the Community Emissions Data System (CEDS), Geosci. Model Dev., 11, 369–408, https://doi.org/10.5194/gmd-11-369-2018, 2018.
IEA: Clean Energy Transitions in North Africa – Analysis – IEA, https://iea.blob.core.windows.net/assets/b9c395df-97f1-4982-8839-79f0fdc8c1c3/Clean_Energy_Transitions_in_North_Africa.pdf (last access: 9 December 2024), 2020.
IIASA: Models, tools, and data, https://iiasa.ac.at/models-tools-data, last access: 2 August 2024.
IPCC: Climate Change 2023: Synthesis Report. Contribution of Working Groups I, II and III to the Sixth Assessment Report of the Intergovernmental Panel on Climate Change, edited by: Core Writing Team, Lee, H., and Romero, J., IPCC, Geneva, Switzerland, Intergovernmental Panel on Climate Change (IPCC), The Intergovernmental Panel on Climate Change, https://doi.org/10.59327/IPCC/AR6-9789291691647, 2023.
Janssens-Maenhout, G., Crippa, M., Guizzardi, D., Muntean, M., Schaaf, E., Dentener, F., Bergamaschi, P., Pagliari, V., Olivier, J. G. J., Peters, J. A. H. W., van Aardenne, J. A., Monni, S., Doering, U., Petrescu, A. M. R., Solazzo, E., and Oreggioni, G. D.: EDGAR v4.3.2 Global Atlas of the three major greenhouse gas emissions for the period 1970–2012, Earth Syst. Sci. Data, 11, 959–1002, https://doi.org/10.5194/essd-11-959-2019, 2019.
Jones, B. and O'Neill, B. C.: Spatially explicit global population scenarios consistent with the Shared Socioeconomic Pathways, Environ. Res. Lett., 11, 084003, https://doi.org/10.1088/1748-9326/11/8/084003, 2016.
Katoto, P. D. M. C., Byamungu, L., Brand, A. S., Mokaya, J., Strijdom, H., Goswami, N., De Boever, P., Nawrot, T. S., and Nemery, B.: Ambient air pollution and health in Sub-Saharan Africa: Current evidence, perspectives and a call to action, Environ. Res., 173, 174–188, https://doi.org/10.1016/J.ENVRES.2019.03.029, 2019.
KC, S. and Lutz, W.: The human core of the shared socioeconomic pathways: Population scenarios by age, sex and level of education for all countries to 2100, Global Environ. Chang., 42, 181–192, https://doi.org/10.1016/J.GLOENVCHA.2014.06.004, 2017.
Keita, S., Liousse, C., Assamoi, E.-M., Doumbia, T., N'Datchoh, E. T., Gnamien, S., Elguindi, N., Granier, C., and Yoboué, V.: African anthropogenic emissions inventory for gases and particles from 1990 to 2015, Earth Syst. Sci. Data, 13, 3691–3705, https://doi.org/10.5194/essd-13-3691-2021, 2021.
LEAP: LEAP: The Low Emissions Analysis Platform, Stockholm Environment Institute, https://www.sei.org/tools/leap-low-emissions-analysis-platform/ (last access: 15 October 2024), 2021.
Leibensperger, E. M., Mickley, L. J., Jacob, D. J., Chen, W.-T., Seinfeld, J. H., Nenes, A., Adams, P. J., Streets, D. G., Kumar, N., and Rind, D.: Climatic effects of 1950–2050 changes in US anthropogenic aerosols – Part 1: Aerosol trends and radiative forcing, Atmos. Chem. Phys., 12, 3333–3348, https://doi.org/10.5194/acp-12-3333-2012, 2012.
Li, T., Zhang, Y., Wang, J., Xu, D., Yin, Z., Chen, H., Lv, Y., Luo, J., Zeng, Y., Liu, Y., Kinney, P. L., and Shi, X.: All-cause mortality risk associated with long-term exposure to ambient PM2.5 in China: a cohort study, Lancet Public Health, 3, e470–e477, https://doi.org/10.1016/S2468-2667(18)30144-0, 2018.
Lund, M. T., Aamaas, B., Berntsen, T., Bock, L., Burkhardt, U., Fuglestvedt, J. S., and Shine, K. P.: Emission metrics for quantifying regional climate impacts of aviation, Earth Syst. Dynam., 8, 547–563, https://doi.org/10.5194/esd-8-547-2017, 2017.
Lund, M. T., Myhre, G., Haslerud, A. S., Skeie, R. B., Griesfeller, J., Platt, S. M., Kumar, R., Myhre, C. L., and Schulz, M.: Concentrations and radiative forcing of anthropogenic aerosols from 1750 to 2014 simulated with the Oslo CTM3 and CEDS emission inventory, Geosci. Model Dev., 11, 4909–4931, https://doi.org/10.5194/gmd-11-4909-2018, 2018.
Lund, M. T., Myhre, G., and Samset, B. H.: Anthropogenic aerosol forcing under the Shared Socioeconomic Pathways, Atmos. Chem. Phys., 19, 13827–13839, https://doi.org/10.5194/acp-19-13827-2019, 2019.
Lund, M. T., Myhre, G., Skeie, R. B., Samset, B. H., and Klimont, Z.: Implications of differences between recent anthropogenic aerosol emission inventories for diagnosed AOD and radiative forcing from 1990 to 2019, Atmos. Chem. Phys., 23, 6647–6662, https://doi.org/10.5194/acp-23-6647-2023, 2023.
McDuffie, E. E., Smith, S. J., O'Rourke, P., Tibrewal, K., Venkataraman, C., Marais, E. A., Zheng, B., Crippa, M., Brauer, M., and Martin, R. V.: A global anthropogenic emission inventory of atmospheric pollutants from sector- and fuel-specific sources (1970–2017): an application of the Community Emissions Data System (CEDS), Earth Syst. Sci. Data, 12, 3413–3442, https://doi.org/10.5194/essd-12-3413-2020, 2020.
Monerie, P. A., Dittus, A. J., Wilcox, L. J., and Turner, A. G.: Uncertainty in Simulating Twentieth Century West African Precipitation Trends: The Role of Anthropogenic Aerosol Emissions, Earths Future, 11, e2022EF002995, https://doi.org/10.1029/2022EF002995, 2023.
Murray, C. J. L., Abbafati, C., Abbas, K. M., et al.: Global burden of 87 risk factors in 204 countries and territories, 1990–2019: a systematic analysis for the Global Burden of Disease Study 2019, Lancet, 396, 1223–1249, https://doi.org/10.1016/S0140-6736(20)30752-2, 2020.
Myhre, G., Samset, B. H., Schulz, M., Balkanski, Y., Bauer, S., Berntsen, T. K., Bian, H., Bellouin, N., Chin, M., Diehl, T., Easter, R. C., Feichter, J., Ghan, S. J., Hauglustaine, D., Iversen, T., Kinne, S., Kirkevåg, A., Lamarque, J.-F., Lin, G., Liu, X., Lund, M. T., Luo, G., Ma, X., van Noije, T., Penner, J. E., Rasch, P. J., Ruiz, A., Seland, Ø., Skeie, R. B., Stier, P., Takemura, T., Tsigaridis, K., Wang, P., Wang, Z., Xu, L., Yu, H., Yu, F., Yoon, J.-H., Zhang, K., Zhang, H., and Zhou, C.: Radiative forcing of the direct aerosol effect from AeroCom Phase II simulations, Atmos. Chem. Phys., 13, 1853–1877, https://doi.org/10.5194/acp-13-1853-2013, 2013.
Myhre, G., Aas, W., Cherian, R., Collins, W., Faluvegi, G., Flanner, M., Forster, P., Hodnebrog, Ø., Klimont, Z., Lund, M. T., Mülmenstädt, J., Lund Myhre, C., Olivié, D., Prather, M., Quaas, J., Samset, B. H., Schnell, J. L., Schulz, M., Shindell, D., Skeie, R. B., Takemura, T., and Tsyro, S.: Multi-model simulations of aerosol and ozone radiative forcing due to anthropogenic emission changes during the period 1990–2015, Atmos. Chem. Phys., 17, 2709–2720, https://doi.org/10.5194/acp-17-2709-2017, 2017.
Natural Earth: Free vector and raster map data, https://www.naturalearthdata.com, last access: 6 July 2025.
NordicESMhub: OsloCTM3, GibHub [code], https://github.com/NordicESMhub/OsloCTM3 (last access: 26 January 2025), 2019.
O'Neill, B. C., Kriegler, E., Ebi, K. L., Kemp-Benedict, E., Riahi, K., Rothman, D. S., van Ruijven, B. J., van Vuuren, D. P., Birkmann, J., Kok, K., Levy, M., and Solecki, W.: The roads ahead: Narratives for shared socioeconomic pathways describing world futures in the 21st century, Global Environ. Chang., 42, 169–180, https://doi.org/10.1016/J.GLOENVCHA.2015.01.004, 2017.
Pai, S. J., Carter, T. S., Heald, C. L., and Kroll, J. H.: Updated World Health Organization Air Quality Guidelines Highlight the Importance of Non-anthropogenic PM2.5, Environ. Sci. Tech. Let., 9, 501–506, https://doi.org/10.1021/ACS.ESTLETT.2C00203, 2022.
Platnick, S., Hubanks, P. A., King M. D., and Pincus, R.: MODIS Atmosphere L3 Daily Product, NASA MODIS Adaptive Processing System, Goddard Space Flight Center, USA, https://doi.org/10.5067/MODIS/MOD08_D3.061, 2015.
Pope, C. A.: Mortality effects of longer term exposures to fine particulate air pollution: Review of recent epidemiological evidence, Inhal. Toxicol., 19, 33–38, https://doi.org/10.1080/08958370701492961, 2007.
Pozzer, A., Anenberg, S. C., Dey, S., Haines, A., Lelieveld, J., and Chowdhury, S.: Mortality Attributable to Ambient Air Pollution: A Review of Global Estimates, Geohealth, 7, e2022GH000711, https://doi.org/10.1029/2022GH000711, 2023.
Quaas, J., Boucher, O., and Lohmann, U.: Constraining the total aerosol indirect effect in the LMDZ and ECHAM4 GCMs using MODIS satellite data, Atmos. Chem. Phys., 6, 947–955, https://doi.org/10.5194/acp-6-947-2006, 2006.
Riahi, K., van Vuuren, D. P., Kriegler, E., Edmonds, J., O'Neill, B. C., Fujimori, S., Bauer, N., Calvin, K., Dellink, R., Fricko, O., Lutz, W., Popp, A., Cuaresma, J. C., KC, S., Leimbach, M., Jiang, L., Kram, T., Rao, S., Emmerling, J., Ebi, K., Hasegawa, T., Havlik, P., Humpenöder, F., Da Silva, L. A., Smith, S., Stehfest, E., Bosetti, V., Eom, J., Gernaat, D., Masui, T., Rogelj, J., Strefler, J., Drouet, L., Krey, V., Luderer, G., Harmsen, M., Takahashi, K., Baumstark, L., Doelman, J. C., Kainuma, M., Klimont, Z., Marangoni, G., Lotze-Campen, H., Obersteiner, M., Tabeau, A., and Tavoni, M.: The Shared Socioeconomic Pathways and their energy, land use, and greenhouse gas emissions implications: An overview, Global Environ. Chang., 42, 153–168, https://doi.org/10.1016/J.GLOENVCHA.2016.05.009, 2017.
Safo-Adu, G., Attiogbe, F., Emahi, I., and Ofosu, F. G.: Outdoor and indoor particle air pollution and its health consequences in African cities: New evidence and an exhortation, Sustainable Environment, 9, 2265729, https://doi.org/10.1080/27658511.2023.2265729, 2023.
Samset, B. H., Sand, M., Smith, C. J., Bauer, S. E., Forster, P. M., Fuglestvedt, J. S., Osprey, S., and Schleussner, C. F.: Climate Impacts From a Removal of Anthropogenic Aerosol Emissions, Geophys. Res. Lett., 45, 1020–1029, https://doi.org/10.1002/2017GL076079, 2018.
Samset, B. H., Lund, M. T., Bollasina, M., Myhre, G., and Wilcox, L.: Emerging Asian aerosol patterns, Nat. Geosci., 12, 582–584, https://doi.org/10.1038/s41561-019-0424-5, 2019.
Shindell, D., Faluvegi, G., Parsons, L., Nagamoto, E., and Chang, J.: Premature Deaths in Africa Due To Particulate Matter Under High and Low Warming Scenarios, Geohealth, 6, e2022GH000601, https://doi.org/10.1029/2022GH000601, 2022.
Shindell, D., Parsons, L., Faluvegi, G., Hicks, K., Kuylenstierna, J., and Heaps, C.: The important role of African emissions reductions in projected local rainfall changes, NPJ Clim. Atmos. Sci., 6, https://doi.org/10.1038/s41612-023-00382-7, 2023.
Shumake, K. L., Sacks, J. D., Lee, J. S., and Johns, D. O.: Susceptibility of older adults to health effects induced by ambient air pollutants regulated by the European Union and the United States, Aging Clin. Exp. Res., 25, 3–8, https://doi.org/10.1007/S40520-013-0001-5, 2013.
Southerland, V. A., Brauer, M., Mohegh, A., Hammer, M. S., van Donkelaar, A., Martin, R. V., Apte, J. S., and Anenberg, S. C.: Global urban temporal trends in fine particulate matter (PM2.5) and attributable health burdens: estimates from global datasets, Lancet Planet Health, 6, e139–e146, https://doi.org/10.1016/S2542-5196(21)00350-8, 2022.
Søvde, O. A., Prather, M. J., Isaksen, I. S. A., Berntsen, T. K., Stordal, F., Zhu, X., Holmes, C. D., and Hsu, J.: The chemical transport model Oslo CTM3, Geosci. Model Dev., 5, 1441–1469, https://doi.org/10.5194/gmd-5-1441-2012, 2012.
Stamnes, K., Jayaweera, K., Tsay, S.-C., and Wiscombe, W.: Numerically stable algorithm for discrete-ordinate-method radiative transfer in multiple scattering and emitting layered media, Appl. Optics, 27, 2502–2509, https://doi.org/10.1364/AO.27.002502, 1988.
Stjern, C. W., Samset, B. H., Myhre, G., Bian, H., Chin, M., Davila, Y., Dentener, F., Emmons, L., Flemming, J., Haslerud, A. S., Henze, D., Jonson, J. E., Kucsera, T., Lund, M. T., Schulz, M., Sudo, K., Takemura, T., and Tilmes, S.: Global and regional radiative forcing from 20 % reductions in BC, OC and SO4 – an HTAP2 multi-model study, Atmos. Chem. Phys., 16, 13579–13599, https://doi.org/10.5194/acp-16-13579-2016, 2016.
Thornhill, G. D., Collins, W. J., Kramer, R. J., Olivié, D., Skeie, R. B., O'Connor, F. M., Abraham, N. L., Checa-Garcia, R., Bauer, S. E., Deushi, M., Emmons, L. K., Forster, P. M., Horowitz, L. W., Johnson, B., Keeble, J., Lamarque, J.-F., Michou, M., Mills, M. J., Mulcahy, J. P., Myhre, G., Nabat, P., Naik, V., Oshima, N., Schulz, M., Smith, C. J., Takemura, T., Tilmes, S., Wu, T., Zeng, G., and Zhang, J.: Effective radiative forcing from emissions of reactive gases and aerosols – a multi-model comparison, Atmos. Chem. Phys., 21, 853–874, https://doi.org/10.5194/acp-21-853-2021, 2021.
Toolan, C. A., Amooli, J. A., Wilcox, L. J., Samset, B. H., Turner, A. G., and Westervelt, D. M.: Strong inter-model differences and biases in CMIP6 simulations of PM2.5, aerosol optical depth, and precipitation over Africa, EGUsphere [preprint], https://doi.org/10.5194/egusphere-2024-3057, 2024.
Turnock, S. T., Allen, R. J., Andrews, M., Bauer, S. E., Deushi, M., Emmons, L., Good, P., Horowitz, L., John, J. G., Michou, M., Nabat, P., Naik, V., Neubauer, D., O'Connor, F. M., Olivié, D., Oshima, N., Schulz, M., Sellar, A., Shim, S., Takemura, T., Tilmes, S., Tsigaridis, K., Wu, T., and Zhang, J.: Historical and future changes in air pollutants from CMIP6 models, Atmos. Chem. Phys., 20, 14547–14579, https://doi.org/10.5194/acp-20-14547-2020, 2020.
Twomey, S.: The Influence of Pollution on the Shortwave Albedo of Clouds, J. Atmos. Sci., 34, 1149–1154, https://doi.org/10.1175/1520-0469(1977)034<1149:TIOPOT>2.0.CO;2, 1977.
UN: Department of Economic and Social Affairs Population Division World Population Ageing 2017 United Nations, New York, NY, https://www.un.org/development/desa/pd/content/world-population-ageing-2017-highlights (last access: 12 January 2025), 2017.
UNEP: Integrated Assessment of Air Pollution and Climate Change for Sustainable Development in Africa – Summary for Decision Makers, https://www.ccacoalition.org/sites/default/files/resources/files/Summary%20for%20Decision%20Makers_Integrated%20Assessment%20of%20Air%20Pollution%20and%20Climate%20Change%20for%20Sustainable%20Development%20in%20Africa.pdf (last access: 17 February 2024), 2022.
U.S. EPA: Overview, https://www.arcgis.com/home/item.html?id=db1a45b351164464ac0459a52890e5a0, last access: 5 February 2024.
Van Donkelaar, A., Hammer, M. S., Bindle, L., Brauer, M., Brook, J. R., Garay, M. J., Hsu, N. C., Kalashnikova, O. V., Kahn, R. A., Lee, C., Levy, R. C., Lyapustin, A., Sayer, A. M., and Martin, R. V.: Monthly Global Estimates of Fine Particulate Matter and Their Uncertainty, Environ. Sci. Technol., 55, 15287–15300, https://doi.org/10.1021/ACS.EST.1C05309, 2021.
Wang, P., Yang, Y., Xue, D., Ren, L., Tang, J., Leung, L. R., and Liao, H.: Aerosols overtake greenhouse gases causing a warmer climate and more weather extremes toward carbon neutrality, Nat. Commun., 14, 1–11, https://doi.org/10.1038/s41467-023-42891-2, 2023.
Wells, C. D., Kasoar, M., Bellouin, N., and Voulgarakis, A.: Local and remote climate impacts of future African aerosol emissions, Atmos. Chem. Phys., 23, 3575–3593, https://doi.org/10.5194/acp-23-3575-2023, 2023.
Wells, C. D., Kasoar, M., Ezzati, M., and Voulgarakis, A.: Significant human health co-benefits of mitigating African emissions, Atmos. Chem. Phys., 24, 1025–1039, https://doi.org/10.5194/acp-24-1025-2024, 2024.
Westervelt, D. M., Horowitz, L. W., Naik, V., Golaz, J.-C., and Mauzerall, D. L.: Radiative forcing and climate response to projected 21st century aerosol decreases, Atmos. Chem. Phys., 15, 12681–12703, https://doi.org/10.5194/acp-15-12681-2015, 2015.
Westervelt, D. M., Horowitz, L. W., Naik, V., Tai, A. P. K., Fiore, A. M., and Mauzerall, D. L.: Quantifying PM2.5-meteorology sensitivities in a global climate model, Atmos. Environ., 142, 43–56, https://doi.org/10.1016/J.ATMOSENV.2016.07.040, 2016.
Westervelt, D. M., Conley, A. J., Fiore, A. M., Lamarque, J. F., Shindell, D., Previdi, M., Faluvegi, G., Correa, G., and Horowitz, L. W.: Multimodel precipitation responses to removal of U.S. sulfur dioxide emissions, J. Geophys. Res.-Atmos., 122, 5024–5038, https://doi.org/10.1002/2017JD026756, 2017.
Westervelt, D. M., Conley, A. J., Fiore, A. M., Lamarque, J.-F., Shindell, D. T., Previdi, M., Mascioli, N. R., Faluvegi, G., Correa, G., and Horowitz, L. W.: Connecting regional aerosol emissions reductions to local and remote precipitation responses, Atmos. Chem. Phys., 18, 12461–12475, https://doi.org/10.5194/acp-18-12461-2018, 2018.
Westervelt, D. M., Mascioli, N. R., Fiore, A. M., Conley, A. J., Lamarque, J.-F., Shindell, D. T., Faluvegi, G., Previdi, M., Correa, G., and Horowitz, L. W.: Local and remote mean and extreme temperature response to regional aerosol emissions reductions, Atmos. Chem. Phys., 20, 3009–3027, https://doi.org/10.5194/acp-20-3009-2020, 2020.
WHO: WHO Countries, https://www.who.int/countries/, last access: 21 December 2024.
Yang, F., Lodder, P., Huang, N., Liu, X., Fu, M., and Guo, J.: Thirty-year trends of depressive disorders in 204 countries and territories from 1990 to 2019: An age-period-cohort analysis, Psychiat. Res., 328, 115433, https://doi.org/10.1016/J.PSYCHRES.2023.115433, 2023.
Yang, Y., Tang, R., Qiu, H., Lai, P. C., Wong, P., Thach, T. Q., Allen, R., Brauer, M., Tian, L., and Barratt, B.: Long term exposure to air pollution and mortality in an elderly cohort in Hong Kong, Environ. Int., 117, 99–106, https://doi.org/10.1016/J.ENVINT.2018.04.034, 2018.
Yin, H., Brauer, M., Zhang, J. (Jim), Cai, W., Navrud, S., Burnett, R., Howard, C., Deng, Z., Kammen, D. M., Schellnhuber, H. J., Chen, K., Kan, H., Chen, Z. M., Chen, B., Zhang, N., Mi, Z., Coffman, D. M., Cohen, A. J., Guan, D., Zhang, Q., Gong, P., and Liu, Z.: Population ageing and deaths attributable to ambient PM2.5 pollution: a global analysis of economic cost, Lancet Planet Health, 5, e356–e367, https://doi.org/10.1016/S2542-5196(21)00131-5, 2021.
Yin, P., Brauer, M., Cohen, A., Burnett, R. T., Liu, J., Liu, Y., Liang, R., Wang, W., Qi, J., Wang, L., and Zhou, M.: Long-term fine particulate matter exposure and nonaccidental and cause-specific mortality in a large national cohort of Chinese men, Environ. Health Persp., 125, 117002-1–117002–11, https://doi.org/10.1289/EHP1673, 2017.
Yusuf, S., Joseph, P., Rangarajan, S., Islam, S., Mente, A., Hystad, P., Brauer, M., Kutty, V. R., Gupta, R., Wielgosz, A., AlHabib, K. F., Dans, A., Lopez-Jaramillo, P., Avezum, A., Lanas, F., Oguz, A., Kruger, I. M., Diaz, R., Yusoff, K., Mony, P., Chifamba, J., Yeates, K., Kelishadi, R., Yusufali, A., Khatib, R., Rahman, O., Zatonska, K., Iqbal, R., Wei, L., Bo, H., Rosengren, A., Kaur, M., Mohan, V., Lear, S. A., Teo, K. K., Leong, D., O'Donnell, M., McKee, M., and Dagenais, G.: Modifiable risk factors, cardiovascular disease, and mortality in 155 722 individuals from 21 high-income, middle-income, and low-income countries (PURE): a prospective cohort study, Lancet, 395, 795–808, https://doi.org/10.1016/S0140-6736(19)32008-2, 2020.
Zhang, J., Chen, Y.-S., Gryspeerdt, E., Yamaguchi, T., and Feingold, G.: Radiative forcing from the 2020 shipping fuel regulation is large but hard to detect, Commun. Earth Environ., 6, 1–11, https://doi.org/10.1038/s43247-024-01911-9, 2025.